UNITED STATES
SECURITIES AND EXCHANGE COMMISSION
Washington, D.C. 20549
FORM N-CSR
CERTIFIED SHAREHOLDER REPORT OF REGISTERED
MANAGEMENT INVESTMENT COMPANIES
Investment Company Act file number 811-4118
Fidelity Securities Fund
(Exact name of registrant as specified in charter)
245 Summer St., Boston, Massachusetts 02210
(Address of principal executive offices) (Zip code)
Scott C. Goebel, Secretary
245 Summer St.
Boston, Massachusetts 02210
(Name and address of agent for service)
Registrant's telephone number, including area code: 617-563-7000
Date of fiscal year end: | July 31 |
| |
Date of reporting period: | July 31, 2013 |
Item 1. Reports to Stockholders
(Fidelity Investment logo)(registered trademark)
Fidelity Advisor®
Small Cap Growth
Fund - Class A, Class T,
Class B and Class C
Annual Report
July 31, 2013
(Fidelity Cover Art)
Class A, Class T, Class B,
and Class C are classes
of Fidelity® Small Cap
Growth Fund
Contents
Performance | (Click Here) | How the fund has done over time. |
Management's Discussion of Fund Performance | (Click Here) | The Portfolio Manager's review of fund performance and strategy. |
Shareholder Expense Example | (Click Here) | An example of shareholder expenses. |
Investment Changes | (Click Here) | A summary of major shifts in the fund's investments over the past six months. |
Investments | (Click Here) | A complete list of the fund's investments with their market values. |
Financial Statements | (Click Here) | Statements of assets and liabilities, operations, and changes in net assets, as well as financial highlights. |
Notes | (Click Here) | Notes to the financial statements. |
Report of Independent Registered Public Accounting Firm | (Click Here) | |
Trustees and Officers | (Click Here) | |
Distributions | (Click Here) | |
Board Approval of Investment Advisory Contracts and Management Fees | (Click Here) | |
To view a fund's proxy voting guidelines and proxy voting record for the 12-month period ended June 30, visit http://www.fidelity.com/proxyvotingresults or visit the Securities and Exchange Commission's (SEC) web site at http://www.sec.gov. You may also call 1-877-208-0098 to request a free copy of the proxy voting guidelines.
Standard & Poor's, S&P and S&P 500 are registered service marks of The McGraw-Hill Companies, Inc. and have been licensed for use by Fidelity Distributors Corporation.
Other third-party marks appearing herein are the property of their respective owners.
All other marks appearing herein are registered or unregistered trademarks or service marks of FMR LLC or an affiliated company. © 2013 FMR LLC. All rights reserved.
Annual Report
This report and the financial statements contained herein are submitted for the general information of the shareholders of the fund. This report is not authorized for distribution to prospective investors in the fund unless preceded or accompanied by an effective prospectus.
A fund files its complete schedule of portfolio holdings with the SEC for the first and third quarters of each fiscal year on Form N-Q. Forms N-Q are available on the SEC's web site at http://www.sec.gov. A fund's Forms N-Q may be reviewed and copied at the SEC's Public Reference Room in Washington, DC. Information regarding the operation of the SEC's Public Reference Room may be obtained by calling 1-800-SEC-0330. For a complete list of a fund's portfolio holdings, view the most recent holdings listing, semiannual report, or annual report on Fidelity's web site at http://www.fidelity.com, http://www.advisor.fidelity.com, or http://www.401k.com, as applicable.
NOT FDIC INSURED • MAY LOSE VALUE • NO BANK GUARANTEE
Neither the fund nor Fidelity Distributors Corporation is a bank.
Annual Report
Average annual total return reflects the change in the value of an investment, assuming reinvestment of the class' distributions from dividend income and capital gains (the profits earned upon the sale of securities that have grown in value, if any) and assuming a constant rate of performance each year. The $10,000 table and the fund's returns do not reflect the deduction of taxes that a shareholder would pay on fund distributions or the redemption of fund shares. During periods of reimbursement by Fidelity, a fund's total return will be greater than it would be had the reimbursement not occurred. How a fund did yesterday is no guarantee of how it will do tomorrow. Returns reflect the conversion of Class B shares to Class A shares after a maximum of seven years.
Average Annual Total Returns
Periods ended July 31, 2013 | Past 1
year | Past 5
years | Life of
fundA |
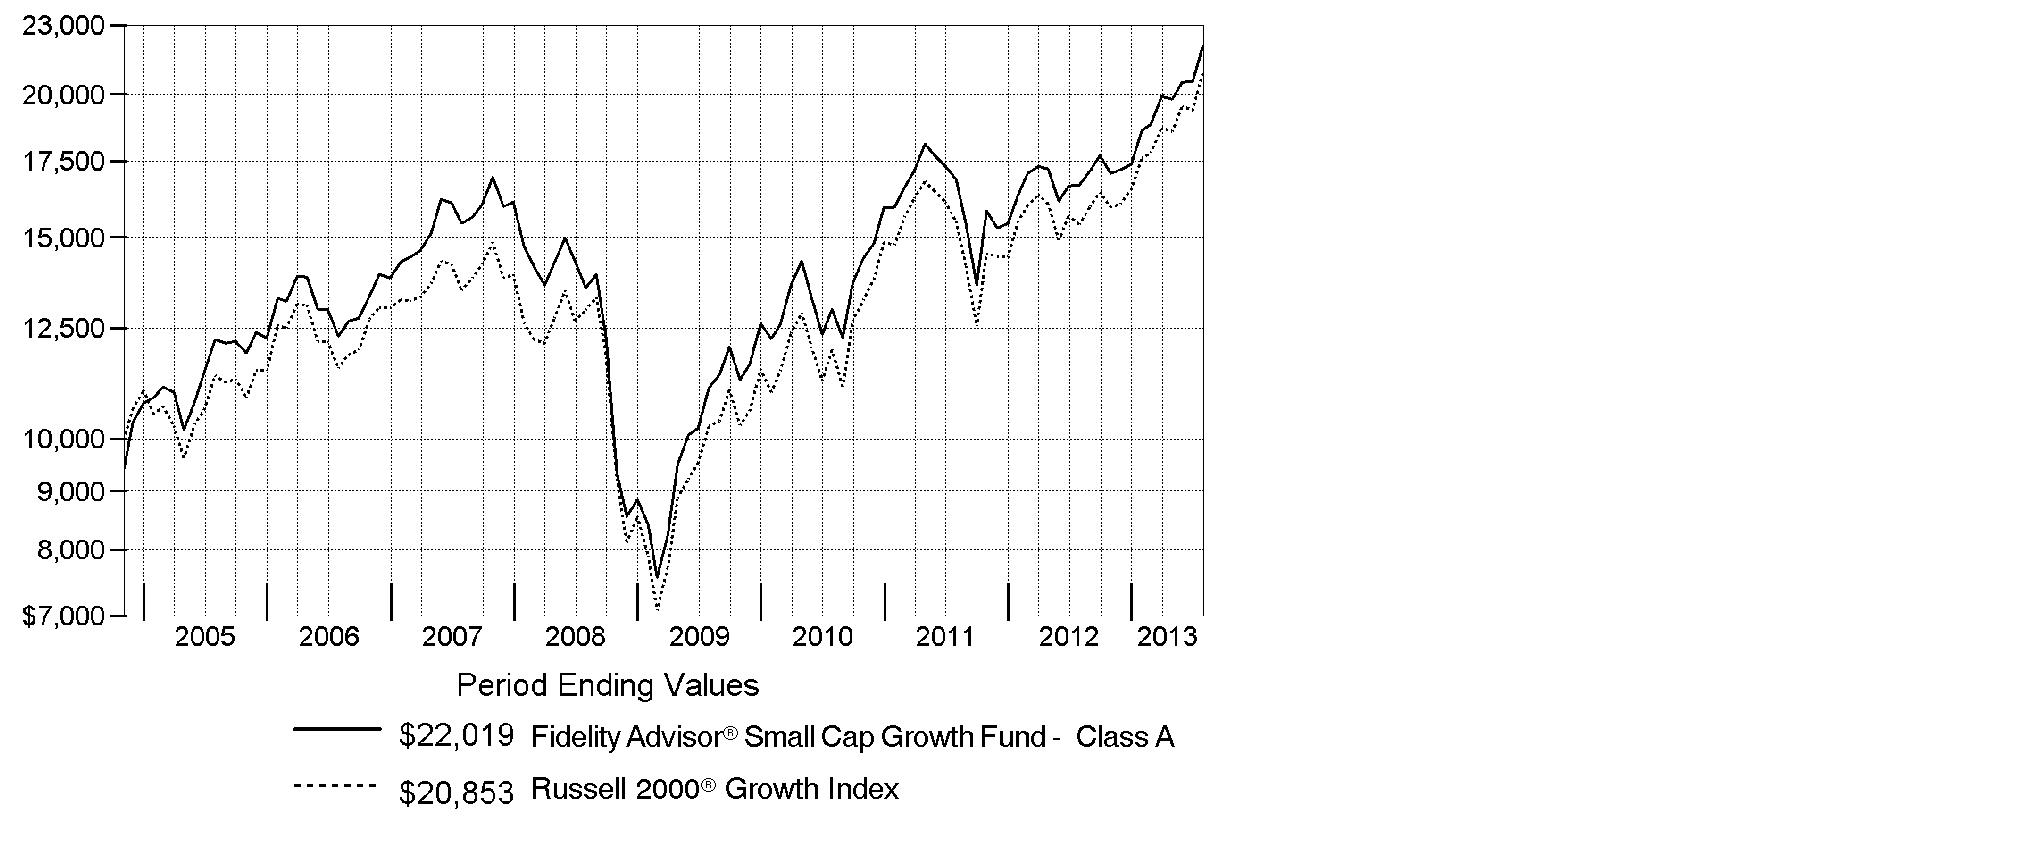
Class A (incl. 5.75% sales charge) | 24.59% | 8.92% | 9.45% |
Class T (incl. 3.50% sales charge) | 27.25% | 9.16% | 9.47% |
Class B (incl. contingent deferred sales charge) B | 26.25% | 9.11% | 9.52% |
Class C (incl. contingent deferred sales charge) C | 30.32% | 9.41% | 9.37% |
A From November 3, 2004.
B Class B shares' contingent deferred sales charges included in the past one year, past five years, and life of fund total return figures are 5%, 2%, and 0%, respectively.
C Class C shares' contingent deferred sales charges included in the past one year, past five years, and life of fund total return figures are 1%, 0%, and 0%, respectively.
Annual Report
$10,000 Over Life of Fund
Let's say hypothetically that $10,000 was invested in Fidelity Advisor® Small Cap Growth Fund - Class A on November 3, 2004, when the fund started, and the current 5.75% sales charge was paid. The chart shows how the value of your investment would have changed, and also shows how the Russell 2000® Growth Index performed over the same period.
Annual Report
Market Recap: The bull run in U.S. stocks comfortably settled into a fifth year, as major equity benchmarks ripped through records during the 12 months ending July 31, 2013. Gains were fueled by a generally improving global economy and accommodative monetary policies worldwide. The tone was positive for most of the year, based largely on stronger U.S. economic data, including employment, housing and consumer sentiment. Setting a series of new highs along the way, the broad-based S&P 500® Index rose an impressive 25.00% for the 12 months, while the blue-chip-laden Dow Jones Industrial AverageSM also moved into record territory en route to a 22.36% gain. The growth-oriented Nasdaq Composite Index® had a similarly strong run, advancing 25.15%. During the year, markets were resilient amid intermittent volatility over debt woes in Europe, the 2012 U.S. presidential election and year-end Congressional gridlock over the federal budget. In mid-to-late June, concern arose about the U.S. Federal Reserve possibly tapering its sustaining bond-buying strategy - which prompted a brief, but steep, market sell-off. However, investors' continued quest for yield and the Fed's pledge to keep buying bonds until the economy showed significant improvement overpowered the uncertainty and helped equities climb notably higher in July to close the period on a strong note.
Comments from Patrick Venanzi, Portfolio Manager of Fidelity Advisor® Small Cap Growth Fund: For the year, the fund's Class A, Class T, Class B and Class C shares rose 32.20%, 31.87%, 31.25% and 31.32%, respectively (excluding sales charges), lagging the 35.39% gain of the Russell 2000® Growth Index. I aim to buy small-cap stocks with above-average growth opportunities at reasonable prices. Along with the market, the fund did very well in absolute terms, but lagged its benchmark. Given the longer-term focus and the quality bias of my investments, the fund sometimes trails the index during the market's strongest short-term periods. The fund's cash stake of roughly 4%, on average, during the past year weighed on relative performance, and a non-index position in Mellanox Technologies, a maker of data transfer and storage products, was the biggest individual detractor. Online health insurance provider eHealth was another miss for the fund, due to untimely ownership, and I sold both Mellanox and eHealth by period end. On the plus side, specialty furniture and electronics retailer Conn's was our top relative contributor, with its stock benefiting as a proactive management team effectively revamped stores, offering higher-quality products and customer-friendly financing options.
The views expressed above reflect those of the portfolio manager(s) only through the end of the period as stated on the cover of this report and do not necessarily represent the views of Fidelity or any other person in the Fidelity organization. Any such views are subject to change at any time based upon market or other conditions and Fidelity disclaims any responsibility to update such views. These views may not be relied on as investment advice and, because investment decisions for a Fidelity fund are based on numerous factors, may not be relied on as an indication of trading intent on behalf of any Fidelity fund.
Annual Report
Shareholder Expense Example
As a shareholder of the Fund, you incur two types of costs: (1) transaction costs, including sales charges (loads) on purchase payments or redemption proceeds, redemption fees and (2) ongoing costs, including management fees, distribution and/or service (12b-1) fees and other Fund expenses. This Example is intended to help you understand your ongoing costs (in dollars) of investing in the Fund and to compare these costs with the ongoing costs of investing in other mutual funds.
The Example is based on an investment of $1,000 invested at the beginning of the period and held for the entire period (February 1, 2013 to July 31, 2013).
Actual Expenses
The first line of the accompanying table for each class of the Fund provides information about actual account values and actual expenses. You may use the information in this line, together with the amount you invested, to estimate the expenses that you paid over the period. Simply divide your account value by $1,000.00 (for example, an $8,600 account value divided by $1,000.00 = 8.6), then multiply the result by the number in the first line for a class of the Fund under the heading entitled "Expenses Paid During Period" to estimate the expenses you paid on your account during this period. A small balance maintenance fee of $12.00 that is charged once a year may apply for certain accounts with a value of less than $2,000. This fee is not included in the table below. If it was, the estimate of expenses you paid during the period would be higher, and your ending account value lower, by this amount. In addition, the Fund, as a shareholder in the underlying Fidelity Central Funds, will indirectly bear its pro-rata share of the fees and expenses incurred by the underlying Fidelity Central Funds. These fees and expenses are not included in the Fund's annualized expense ratio used to calculate the expense estimate in the table below.
Hypothetical Example for Comparison Purposes
The second line of the accompanying table for each class of the Fund provides information about hypothetical account values and hypothetical expenses based on a Class' actual expense ratio and an assumed rate of return of 5% per year before expenses, which is not the Class' actual return. The hypothetical account values and expenses may not be used to estimate the actual ending account balance or expenses you paid for the period. You may use this information to compare the ongoing costs of investing in the Fund and other funds. To do so, compare this 5% hypothetical example with the 5% hypothetical examples that appear in the shareholder reports of the other funds. A small balance maintenance fee of $12.00 that is charged once a year may apply for certain accounts with a value of less than $2,000. This fee is not included in the table below. If it was, the estimate of expenses you paid during the period would be higher, and your ending account value lower, by this amount. In addition, the Fund, as a shareholder in the underlying Fidelity Central Funds, will indirectly bear its pro-rata share of the fees and expenses incurred by the underlying Fidelity Central Funds. These fees and expenses are not included in the Fund's annualized expense ratio used to calculate the expense estimate in the table below.
Please note that the expenses shown in the table are meant to highlight your ongoing costs only and do not reflect any transaction costs. Therefore, the second line of the table is useful in comparing ongoing costs only, and will not help you determine the relative total costs of owning different funds. In addition, if these transactional costs were included, your costs would have been higher.
Annual Report
| Annualized
Expense Ratio B | Beginning
Account Value
February 1, 2013 | Ending
Account Value
July 31, 2013 | Expenses Paid
During Period*
February 1, 2013
to July 31, 2013 |
Class A | 1.22% | | | |
Actual | | $ 1,000.00 | $ 1,183.60 | $ 6.61 |
HypotheticalA | | $ 1,000.00 | $ 1,018.74 | $ 6.11 |
Class T | 1.48% | | | |
Actual | | $ 1,000.00 | $ 1,181.70 | $ 8.01 |
HypotheticalA | | $ 1,000.00 | $ 1,017.46 | $ 7.40 |
Class B | 1.97% | | | |
Actual | | $ 1,000.00 | $ 1,178.90 | $ 10.64 |
HypotheticalA | | $ 1,000.00 | $ 1,015.03 | $ 9.84 |
Class C | 1.97% | | | |
Actual | | $ 1,000.00 | $ 1,179.20 | $ 10.64 |
HypotheticalA | | $ 1,000.00 | $ 1,015.03 | $ 9.84 |
Small Cap Growth | .88% | | | |
Actual | | $ 1,000.00 | $ 1,186.20 | $ 4.77 |
HypotheticalA | | $ 1,000.00 | $ 1,020.43 | $ 4.41 |
Class F | .67% | | | |
Actual | | $ 1,000.00 | $ 1,187.00 | $ 3.63 |
HypotheticalA | | $ 1,000.00 | $ 1,021.47 | $ 3.36 |
Institutional Class | .90% | | | |
Actual | | $ 1,000.00 | $ 1,185.80 | $ 4.88 |
HypotheticalA | | $ 1,000.00 | $ 1,020.33 | $ 4.51 |
A 5% return per year before expenses
B Annualized expense ratio reflects expenses net of applicable fee waivers.
* Expenses are equal to each Class' annualized expense ratio, multiplied by the average account value over the period, multiplied by 181/365 (to reflect the one-half year period).
Annual Report
Investment Changes (Unaudited)
Top Ten Stocks as of July 31, 2013 |
| % of fund's
net assets | % of fund's net assets
6 months ago |
NIC, Inc. | 1.6 | 0.0 |
Grand Canyon Education, Inc. | 1.5 | 0.9 |
Aspen Technology, Inc. | 1.4 | 1.7 |
InvenSense, Inc. | 1.3 | 1.0 |
KAR Auction Services, Inc. | 1.3 | 0.0 |
CommVault Systems, Inc. | 1.3 | 1.5 |
FEI Co. | 1.3 | 0.9 |
Service Corp. International | 1.3 | 0.0 |
HSN, Inc. | 1.3 | 1.7 |
athenahealth, Inc. | 1.2 | 0.0 |
| 13.5 | |
Top Five Market Sectors as of July 31, 2013 |
| % of fund's
net assets | % of fund's net assets
6 months ago |
Information Technology | 25.8 | 19.2 |
Health Care | 20.9 | 18.8 |
Industrials | 17.0 | 15.5 |
Consumer Discretionary | 16.0 | 17.2 |
Financials | 8.4 | 7.3 |
Asset Allocation (% of fund's net assets) |
As of July 31, 2013* | As of January 31, 2013** |
 | Stocks 97.9% | | | Stocks 95.5% | |
 | Short-Term
Investments and
Net Other Assets
(Liabilities) 2.1% | | | Short-Term
Investments and
Net Other Assets
(Liabilities) 4.5% | |
* Foreign investments | 4.0% | | ** Foreign investments | 6.6% | |

Annual Report
Investments July 31, 2013
Showing Percentage of Net Assets
Common Stocks - 97.9% |
| Shares | | Value |
CONSUMER DISCRETIONARY - 16.0% |
Auto Components - 0.5% |
Tenneco, Inc. (a) | 250,000 | | $ 12,082,500 |
Diversified Consumer Services - 2.8% |
Grand Canyon Education, Inc. (a) | 987,953 | | 33,412,570 |
Service Corp. International | 1,510,000 | | 28,644,700 |
| | 62,057,270 |
Hotels, Restaurants & Leisure - 4.4% |
AFC Enterprises, Inc. (a) | 400,231 | | 14,728,501 |
Bloomin' Brands, Inc. | 500,000 | | 11,800,000 |
Jack in the Box, Inc. (a) | 550,000 | | 22,049,500 |
Papa John's International, Inc. (a) | 300,000 | | 20,058,000 |
Sonic Corp. (a) | 912,000 | | 14,017,440 |
Texas Roadhouse, Inc. Class A | 700,000 | | 17,108,000 |
| | 99,761,441 |
Household Durables - 1.0% |
Jarden Corp. (a) | 375,000 | | 17,051,250 |
Universal Electronics, Inc. (a) | 199,089 | | 6,137,914 |
| | 23,189,164 |
Internet & Catalog Retail - 1.3% |
HSN, Inc. | 475,000 | | 28,528,500 |
Leisure Equipment & Products - 1.0% |
Brunswick Corp. | 570,000 | | 21,517,500 |
Media - 0.9% |
Cinemark Holdings, Inc. | 700,000 | | 20,384,000 |
Specialty Retail - 1.3% |
Conn's, Inc. (a) | 194,947 | | 12,597,475 |
Tile Shop Holdings, Inc. (a) | 601,100 | | 17,089,273 |
| | 29,686,748 |
Textiles, Apparel & Luxury Goods - 2.8% |
G-III Apparel Group Ltd. (a) | 470,000 | | 24,186,200 |
Steven Madden Ltd. (a) | 451,400 | | 23,210,988 |
Wolverine World Wide, Inc. | 250,000 | | 14,377,500 |
| | 61,774,688 |
TOTAL CONSUMER DISCRETIONARY | | 358,981,811 |
Common Stocks - continued |
| Shares | | Value |
CONSUMER STAPLES - 2.4% |
Food Products - 1.8% |
J&J Snack Foods Corp. | 200,000 | | $ 15,936,000 |
WhiteWave Foods Co. (d) | 1,347,200 | | 25,179,168 |
| | 41,115,168 |
Personal Products - 0.6% |
Inter Parfums, Inc. | 392,925 | | 12,958,667 |
TOTAL CONSUMER STAPLES | | 54,073,835 |
ENERGY - 4.9% |
Energy Equipment & Services - 2.7% |
Atwood Oceanics, Inc. (a) | 185,000 | | 10,422,900 |
Dril-Quip, Inc. (a) | 170,000 | | 15,454,700 |
Essential Energy Services Ltd. | 2,232,100 | | 5,650,336 |
Western Energy Services Corp. | 1,330,000 | | 10,825,431 |
Xtreme Drilling & Coil Services Corp. (a)(e) | 4,100,000 | | 14,769,740 |
Zedi, Inc. (a)(e) | 7,178,500 | | 4,053,675 |
| | 61,176,782 |
Oil, Gas & Consumable Fuels - 2.2% |
EPL Oil & Gas, Inc. (a) | 300,000 | | 9,648,000 |
Rosetta Resources, Inc. (a) | 380,000 | | 17,331,800 |
Tesoro Logistics LP | 150,000 | | 8,023,500 |
Whitecap Resources, Inc. (d) | 1,100,000 | | 11,823,581 |
Whitecap Resources, Inc. rights 8/30/13 (a) | 100,000 | | 1,077,792 |
| | 47,904,673 |
TOTAL ENERGY | | 109,081,455 |
FINANCIALS - 8.4% |
Capital Markets - 0.6% |
Virtus Investment Partners, Inc. (a) | 73,084 | | 13,630,166 |
Commercial Banks - 2.1% |
BBCN Bancorp, Inc. | 1,340,000 | | 19,577,400 |
City National Corp. | 320,000 | | 22,249,600 |
Pacific Premier Bancorp, Inc. (a) | 385,000 | | 5,016,550 |
| | 46,843,550 |
Insurance - 3.7% |
Amerisafe, Inc. | 492,900 | | 17,611,317 |
FBL Financial Group, Inc. Class A | 148,825 | | 6,582,530 |
Primerica, Inc. | 480,000 | | 19,699,200 |
Common Stocks - continued |
| Shares | | Value |
FINANCIALS - continued |
Insurance - continued |
ProAssurance Corp. | 430,000 | | $ 23,017,900 |
StanCorp Financial Group, Inc. | 300,000 | | 15,927,000 |
| | 82,837,947 |
Real Estate Investment Trusts - 1.3% |
Cousins Properties, Inc. | 1,500,000 | | 15,375,000 |
Piedmont Office Realty Trust, Inc. Class A | 800,000 | | 14,472,000 |
| | 29,847,000 |
Real Estate Management & Development - 0.7% |
Howard Hughes Corp. (a) | 145,000 | | 15,835,450 |
TOTAL FINANCIALS | | 188,994,113 |
HEALTH CARE - 20.9% |
Biotechnology - 8.1% |
Alkermes PLC (a) | 175,500 | | 5,893,290 |
ARIAD Pharmaceuticals, Inc. (a) | 260,000 | | 4,830,800 |
Array BioPharma, Inc. (a) | 1,120,000 | | 7,459,200 |
Astex Pharmaceuticals, Inc. (a) | 1,250,000 | | 6,537,500 |
BioMarin Pharmaceutical, Inc. (a) | 120,000 | | 7,758,000 |
Celldex Therapeutics, Inc. (a) | 600,000 | | 12,288,000 |
ChemoCentryx, Inc. (a) | 250,000 | | 3,495,000 |
Chimerix, Inc. | 250,000 | | 5,685,000 |
Cubist Pharmaceuticals, Inc. (a) | 194,762 | | 12,139,515 |
Hyperion Therapeutics, Inc. | 200,000 | | 5,010,000 |
Infinity Pharmaceuticals, Inc. (a) | 228,236 | | 4,834,038 |
Insmed, Inc. (a)(d) | 666,400 | | 7,403,704 |
Isis Pharmaceuticals, Inc. (a) | 447,257 | | 12,903,364 |
Medivation, Inc. (a) | 160,000 | | 9,259,200 |
Novavax, Inc. (a) | 2,100,000 | | 5,649,000 |
OncoGenex Pharmaceuticals, Inc. (a) | 116,487 | | 1,138,078 |
Stemline Therapeutics, Inc. | 154,000 | | 4,333,560 |
Sunesis Pharmaceuticals, Inc. (a)(d) | 1,097,300 | | 5,574,284 |
Synageva BioPharma Corp. (a) | 170,000 | | 8,177,000 |
Synergy Pharmaceuticals, Inc. (a)(d) | 800,000 | | 3,600,000 |
TESARO, Inc. (a) | 148,800 | | 5,077,056 |
Theravance, Inc. (a)(d) | 469,000 | | 18,084,640 |
Threshold Pharmaceuticals, Inc. (a) | 1,072,634 | | 5,813,676 |
Vanda Pharmaceuticals, Inc. (a) | 500,000 | | 5,830,000 |
XOMA Corp. (a)(d) | 2,500,000 | | 13,575,000 |
| | 182,348,905 |
Common Stocks - continued |
| Shares | | Value |
HEALTH CARE - continued |
Health Care Equipment & Supplies - 4.7% |
Align Technology, Inc. (a) | 595,798 | | $ 25,643,146 |
ICU Medical, Inc. (a) | 191,000 | | 13,692,790 |
NxStage Medical, Inc. (a) | 272,400 | | 3,530,304 |
Sirona Dental Systems, Inc. (a) | 125,000 | | 8,825,000 |
Steris Corp. | 581,000 | | 26,156,620 |
Teleflex, Inc. | 189,300 | | 15,036,099 |
The Spectranetics Corp. (a) | 650,000 | | 11,713,000 |
| | 104,596,959 |
Health Care Providers & Services - 4.1% |
BioScrip, Inc. (a) | 1,100,000 | | 17,875,000 |
Centene Corp. (a) | 330,000 | | 18,305,100 |
MEDNAX, Inc. (a) | 122,900 | | 11,972,918 |
Molina Healthcare, Inc. (a)(d) | 600,000 | | 22,272,000 |
MWI Veterinary Supply, Inc. (a) | 143,400 | | 20,387,178 |
| | 90,812,196 |
Health Care Technology - 2.2% |
athenahealth, Inc. (a)(d) | 250,000 | | 27,987,500 |
Medidata Solutions, Inc. (a) | 233,948 | | 21,647,208 |
| | 49,634,708 |
Life Sciences Tools & Services - 0.8% |
Bruker BioSciences Corp. (a) | 1,010,000 | | 18,099,200 |
Pharmaceuticals - 1.0% |
Biodelivery Sciences International, Inc. (a)(d) | 1,257,084 | | 5,430,603 |
Pacira Pharmaceuticals, Inc. (a) | 220,000 | | 7,464,600 |
ViroPharma, Inc. (a) | 270,000 | | 9,266,400 |
| | 22,161,603 |
TOTAL HEALTH CARE | | 467,653,571 |
INDUSTRIALS - 17.0% |
Aerospace & Defense - 2.8% |
Esterline Technologies Corp. (a) | 150,000 | | 12,216,000 |
Teledyne Technologies, Inc. (a) | 305,700 | | 24,507,969 |
Triumph Group, Inc. | 330,000 | | 25,891,800 |
| | 62,615,769 |
Airlines - 0.7% |
Spirit Airlines, Inc. (a) | 500,000 | | 16,525,000 |
Building Products - 0.9% |
A.O. Smith Corp. | 480,688 | | 19,862,028 |
Common Stocks - continued |
| Shares | | Value |
INDUSTRIALS - continued |
Commercial Services & Supplies - 1.3% |
KAR Auction Services, Inc. | 1,140,000 | | $ 29,001,600 |
Construction & Engineering - 1.6% |
AECOM Technology Corp. (a) | 300,000 | | 10,170,000 |
EMCOR Group, Inc. | 350,000 | | 14,448,000 |
Tutor Perini Corp. (a) | 554,285 | | 10,963,757 |
| | 35,581,757 |
Electrical Equipment - 2.1% |
EnerSys | 480,000 | | 25,401,600 |
Generac Holdings, Inc. | 409,200 | | 17,738,820 |
Preformed Line Products Co. | 60,306 | | 4,399,323 |
| | 47,539,743 |
Machinery - 5.4% |
Actuant Corp. Class A | 473,100 | | 16,705,161 |
Harsco Corp. | 445,000 | | 11,463,200 |
Manitowoc Co., Inc. | 900,000 | | 18,477,000 |
Oshkosh Truck Corp. (a) | 250,000 | | 11,205,000 |
Standex International Corp. | 301,838 | | 17,817,497 |
TriMas Corp. (a) | 605,298 | | 22,414,185 |
Wabtec Corp. | 384,600 | | 22,329,876 |
| | 120,411,919 |
Professional Services - 0.0% |
Nihon M&A Center, Inc. | 612 | | 40,942 |
Trading Companies & Distributors - 2.2% |
Applied Industrial Technologies, Inc. | 316,818 | | 16,525,227 |
Watsco, Inc. | 229,000 | | 21,377,150 |
WESCO International, Inc. (a) | 150,000 | | 11,367,000 |
| | 49,269,377 |
TOTAL INDUSTRIALS | | 380,848,135 |
INFORMATION TECHNOLOGY - 25.8% |
Communications Equipment - 0.8% |
Plantronics, Inc. | 380,000 | | 17,666,200 |
Computers & Peripherals - 1.9% |
Cray, Inc. (a) | 1,032,200 | | 23,916,074 |
Electronics for Imaging, Inc. (a) | 670,000 | | 20,120,100 |
| | 44,036,174 |
Electronic Equipment & Components - 4.6% |
FEI Co. | 370,000 | | 28,656,500 |
Common Stocks - continued |
| Shares | | Value |
INFORMATION TECHNOLOGY - continued |
Electronic Equipment & Components - continued |
FLIR Systems, Inc. | 600,000 | | $ 19,482,000 |
InvenSense, Inc. (a)(d) | 1,720,000 | | 30,409,600 |
Neonode, Inc. (a)(d) | 1,617,122 | | 12,597,380 |
Parametric Sound Corp. (a)(d)(e) | 666,810 | | 11,382,447 |
| | 102,527,927 |
Internet Software & Services - 7.8% |
Angie's List, Inc. (a)(d) | 1,055,703 | | 23,246,580 |
Blucora, Inc. (a) | 621,143 | | 12,422,860 |
Cornerstone OnDemand, Inc. (a) | 530,000 | | 23,341,200 |
Demandware, Inc. (a)(d) | 353,439 | | 15,699,760 |
E2open, Inc. (d) | 1,176,594 | | 23,390,689 |
Move, Inc. (a) | 820,000 | | 11,389,800 |
NIC, Inc. | 1,893,704 | | 34,882,028 |
SciQuest, Inc. (a) | 294,372 | | 7,259,214 |
Stamps.com, Inc. (a) | 570,281 | | 22,731,401 |
| | 174,363,532 |
IT Services - 2.7% |
Euronet Worldwide, Inc. (a) | 300,000 | | 11,043,000 |
EVERTEC, Inc. | 600,000 | | 14,340,000 |
Genpact Ltd. | 1,050,000 | | 21,409,500 |
Sapient Corp. (a) | 1,000,000 | | 13,710,000 |
| | 60,502,500 |
Semiconductors & Semiconductor Equipment - 0.8% |
PDF Solutions, Inc. (a) | 886,056 | | 18,181,869 |
Software - 7.2% |
Aspen Technology, Inc. (a) | 962,200 | | 31,309,988 |
CommVault Systems, Inc. (a) | 340,000 | | 28,706,200 |
Destiny Media Technologies, Inc. (a) | 1,620,269 | | 3,596,997 |
Guidewire Software, Inc. (a) | 434,816 | | 19,027,548 |
Interactive Intelligence Group, Inc. (a) | 200,000 | | 11,360,000 |
Synopsys, Inc. (a) | 540,000 | | 20,001,600 |
Tyler Technologies, Inc. (a) | 308,725 | | 23,037,060 |
Ultimate Software Group, Inc. (a) | 175,000 | | 23,677,500 |
| | 160,716,893 |
TOTAL INFORMATION TECHNOLOGY | | 577,995,095 |
Common Stocks - continued |
| Shares | | Value |
MATERIALS - 2.0% |
Chemicals - 0.7% |
Cytec Industries, Inc. | 210,000 | | $ 16,359,000 |
Containers & Packaging - 0.7% |
Graphic Packaging Holding Co. (a) | 1,700,000 | | 14,620,000 |
Paper & Forest Products - 0.6% |
P.H. Glatfelter Co. | 550,000 | | 14,558,500 |
TOTAL MATERIALS | | 45,537,500 |
TELECOMMUNICATION SERVICES - 0.5% |
Diversified Telecommunication Services - 0.5% |
inContact, Inc. (a) | 1,200,000 | | 10,176,000 |
TOTAL COMMON STOCKS (Cost $1,768,172,071) |
2,193,341,515
|
Money Market Funds - 8.8% |
| | | |
Fidelity Cash Central Fund, 0.11% (b) | 75,334,289 | | 75,334,289 |
Fidelity Securities Lending Cash Central Fund, 0.12% (b)(c) | 121,749,605 | | 121,749,605 |
TOTAL MONEY MARKET FUNDS (Cost $197,083,894) |
197,083,894
|
TOTAL INVESTMENT PORTFOLIO - 106.7% (Cost $1,965,255,965) | | 2,390,425,409 |
NET OTHER ASSETS (LIABILITIES) - (6.7)% | | (150,019,314) |
NET ASSETS - 100% | $ 2,240,406,095 |
Legend |
(a) Non-income producing |
(b) Affiliated fund that is generally available only to investment companies and other accounts managed by Fidelity Investments. The rate quoted is the annualized seven-day yield of the fund at period end. A complete unaudited listing of the fund's holdings as of its most recent quarter end is available upon request. In addition, each Fidelity Central Fund's financial statements, which are not covered by the Fund's Report of Independent Registered Public Accounting Firm, are available on the SEC's website or upon request. |
(c) Investment made with cash collateral received from securities on loan. |
(d) Security or a portion of the security is on loan at period end. |
(e) Affiliated company |
Affiliated Central Funds |
Information regarding fiscal year to date income earned by the Fund from investments in Fidelity Central Funds is as follows: |
Fund | Income earned |
Fidelity Cash Central Fund | $ 109,835 |
Fidelity Securities Lending Cash Central Fund | 2,002,990 |
Total | $ 2,112,825 |
Other Affiliated Issuers |
An affiliated company is a company in which the Fund has ownership of at least 5% of the voting securities. Fiscal year to date transactions with companies which are or were affiliates are as follows: |
Affiliate | Value,
beginning of
period | Purchases | Sales
Proceeds | Dividend
Income | Value,
end of
period |
Neonode, Inc. | $ 6,969,000 | $ 5,854,520 | $ 5,076,631 | $ - | $ - |
Parametric Sound Corp. | 2,428,413 | 5,644,334 | 1,370,378 | - | 11,382,447 |
Telular Corp. | 4,715,000 | 3,371,313 | 10,661,344 | 259,000 | - |
US Home Systems, Inc. | 6,604,750 | - | 8,975,299 | - | - |
Xtreme Drilling & Coil Services Corp. (144A) | - | 178,443 | 201,743 | - | - |
Xtreme Drilling & Coil Services Corp. | 6,786,658 | - | - | - | 14,769,740 |
Zedi, Inc. | 3,905,172 | 2,997,316 | 1,070,631 | - | 4,053,675 |
Total | $ 31,408,993 | $ 18,045,926 | $ 27,356,026 | $ 259,000 | $ 30,205,862 |
Other Information |
All investments are categorized as Level 1 under the Fair Value Hierarchy. The inputs or methodology used for valuing securities may not be an indication of the risk associated with investing in those securities. For more information on valuation inputs, please refer to the Investment Valuation section in the accompanying Notes to Financial Statements. |
See accompanying notes which are an integral part of the financial statements.
Annual Report
Statement of Assets and Liabilities
| July 31, 2013 |
| | |
Assets | | |
Investment in securities, at value (including securities loaned of $120,973,392) - See accompanying schedule: Unaffiliated issuers (cost $1,744,211,544) | $ 2,163,135,653 | |
Fidelity Central Funds (cost $197,083,894) | 197,083,894 | |
Other affiliated issuers (cost $23,960,527) | 30,205,862 | |
Total Investments (cost $1,965,255,965) | | $ 2,390,425,409 |
Receivable for investments sold | | 35,301,694 |
Receivable for fund shares sold | | 2,852,120 |
Dividends receivable | | 415,342 |
Distributions receivable from Fidelity Central Funds | | 231,543 |
Other receivables | | 35,774 |
Total assets | | 2,429,261,882 |
| | |
Liabilities | | |
Payable for investments purchased | $ 62,714,735 | |
Payable for fund shares redeemed | 2,747,629 | |
Accrued management fee | 1,207,297 | |
Distribution and service plan fees payable | 58,359 | |
Other affiliated payables | 312,392 | |
Other payables and accrued expenses | 65,770 | |
Collateral on securities loaned, at value | 121,749,605 | |
Total liabilities | | 188,855,787 |
| | |
Net Assets | | $ 2,240,406,095 |
Net Assets consist of: | | |
Paid in capital | | $ 1,568,067,724 |
Accumulated undistributed net realized gain (loss) on investments and foreign currency transactions | | 247,173,320 |
Net unrealized appreciation (depreciation) on investments and assets and liabilities in foreign currencies | | 425,165,051 |
Net Assets | | $ 2,240,406,095 |
See accompanying notes which are an integral part of the financial statements.
Annual Report
Financial Statements - continued
Statement of Assets and Liabilities - continued
| July 31, 2013 |
| | |
Calculation of Maximum Offering Price Class A:
Net Asset Value and redemption price per share ($74,977,899 ÷ 3,812,892 shares) | | $ 19.66 |
| | |
Maximum offering price per share (100/94.25 of $19.66) | | $ 20.86 |
Class T:
Net Asset Value and redemption price per share ($34,686,382 ÷ 1,789,472 shares) | | $ 19.38 |
| | |
Maximum offering price per share (100/96.50 of $19.38) | | $ 20.08 |
Class B:
Net Asset Value and offering price per share ($3,485,507 ÷ 186,863 shares)A | | $ 18.65 |
| | |
Class C:
Net Asset Value and offering price per share ($32,755,709 ÷ 1,759,550 shares)A | | $ 18.62 |
| | |
Small Cap Growth:
Net Asset Value, offering price and redemption price per share ($1,315,659,224 ÷ 65,562,467 shares) | | $ 20.07 |
| | |
Class F:
Net Asset Value, offering price and redemption price per share ($727,683,474 ÷ 35,934,773 shares) | | $ 20.25 |
| | |
Institutional Class:
Net Asset Value, offering price and redemption price per share ($51,157,900 ÷ 2,545,203 shares) | | $ 20.10 |
A Redemption price per share is equal to net asset value less any applicable contingent deferred sales charge.
See accompanying notes which are an integral part of the financial statements.
Annual Report
Statement of Operations
| Year ended July 31, 2013 |
| | |
Investment Income | | |
Dividends (including $259,000 earned from other affiliated issuers) | | $ 17,072,216 |
Interest | | 880 |
Income from Fidelity Central Funds (including $2,002,990 from security lending) | | 2,112,825 |
Total income | | 19,185,921 |
| | |
Expenses | | |
Management fee
Basic fee | $ 14,065,171 | |
Performance adjustment | (1,254,701) | |
Transfer agent fees | 3,015,628 | |
Distribution and service plan fees | 609,395 | |
Accounting and security lending fees | 622,239 | |
Custodian fees and expenses | 73,226 | |
Independent trustees' compensation | 12,359 | |
Registration fees | 95,429 | |
Audit | 58,673 | |
Legal | 6,422 | |
Interest | 674 | |
Miscellaneous | 18,337 | |
Total expenses before reductions | 17,322,852 | |
Expense reductions | (322,128) | 17,000,724 |
Net investment income (loss) | | 2,185,197 |
Realized and Unrealized Gain (Loss) Net realized gain (loss) on: | | |
Investment securities: | | |
Unaffiliated issuers | 326,344,850 | |
Other affiliated issuers | 925,631 | |
Foreign currency transactions | 20,901 | |
Total net realized gain (loss) | | 327,291,382 |
Change in net unrealized appreciation (depreciation) on: Investment securities | 244,672,948 | |
Assets and liabilities in foreign currencies | 6,602 | |
Total change in net unrealized appreciation (depreciation) | | 244,679,550 |
Net gain (loss) | | 571,970,932 |
Net increase (decrease) in net assets resulting from operations | | $ 574,156,129 |
See accompanying notes which are an integral part of the financial statements.
Annual Report
Financial Statements - continued
Statement of Changes in Net Assets
| Year ended
July 31,
2013 | Year ended
July 31,
2012 |
Increase (Decrease) in Net Assets | | |
Operations | | |
Net investment income (loss) | $ 2,185,197 | $ (2,581,285) |
Net realized gain (loss) | 327,291,382 | 84,159,524 |
Change in net unrealized appreciation (depreciation) | 244,679,550 | (104,802,589) |
Net increase (decrease) in net assets resulting
from operations | 574,156,129 | (23,224,350) |
Distributions to shareholders from net realized gain | (122,560,447) | (34,799,429) |
Share transactions - net increase (decrease) | (58,479,174) | 61,802,637 |
Redemption fees | 117,383 | 255,125 |
Total increase (decrease) in net assets | 393,233,891 | 4,033,983 |
| | |
Net Assets | | |
Beginning of period | 1,847,172,204 | 1,843,138,221 |
End of period (including accumulated net investment loss of $0 and accumulated net investment loss of $1,442,758, respectively) | $ 2,240,406,095 | $ 1,847,172,204 |
See accompanying notes which are an integral part of the financial statements.
Annual Report
Financial Highlights - Class A
Years ended July 31, | 2013 | 2012 | 2011 | 2010 | 2009 |
Selected Per-Share Data | | | | | |
Net asset value, beginning of period | $ 15.87 | $ 16.42 | $ 12.66 | $ 10.79 | $ 13.20 |
Income from Investment Operations | | | | | |
Net investment income (loss) C | (.04) | (.07) F | (.07) G | (.07) H | (.06) |
Net realized and unrealized gain (loss) | 4.87 | (.16) | 3.84 | 1.94 | (2.35) |
Total from investment operations | 4.83 | (.23) | 3.77 | 1.87 | (2.41) |
Distributions from net realized gain | (1.04) | (.32) | (.01) I | - | - |
Redemption fees added to paid in capital C, K | - | - | - | - | - |
Net asset value, end of period | $ 19.66 | $ 15.87 | $ 16.42 | $ 12.66 | $ 10.79 |
Total Return A, B | 32.20% | (1.14)% | 29.78% | 17.33% | (18.26)% |
Ratios to Average Net Assets D, J | | | | | |
Expenses before reductions | 1.24% | 1.35% | 1.25% | 1.35% | 1.33% |
Expenses net of fee waivers, if any | 1.24% | 1.35% | 1.25% | 1.35% | 1.33% |
Expenses net of all reductions | 1.22% | 1.34% | 1.23% | 1.34% | 1.33% |
Net investment income (loss) | (.26)% | (.49)% F | (.47)% G | (.56)% H | (.64)% |
Supplemental Data | | | | | |
Net assets, end of period (000 omitted) | $ 74,978 | $ 59,684 | $ 67,272 | $ 50,620 | $ 40,211 |
Portfolio turnover rate E | 142% | 150% | 106% | 105% | 150% |
A Total returns would have been lower if certain expenses had not been reduced during the applicable periods shown.
B Total returns do not include the effect of the sales charges.
C Calculated based on average shares outstanding during the period.
D Fees and expenses of any underlying Fidelity Central Funds are not included in the Fund's expense ratio. The Fund indirectly bears its proportionate share of the expenses of any underlying Fidelity Central Funds.
E Amount does not include the portfolio activity of any underlying Fidelity Central Funds.
F Investment income per share reflects a large, non-recurring dividend which amounted to $.01 per share. Excluding this non-recurring dividend, the ratio of net investment income (loss) to average net assets would have been (.57)%.
G Investment income per share reflects a large, non-recurring dividend which amounted to $.02 per share. Excluding this non-recurring dividend, the ratio of net investment income (loss) to average net assets would have been (.61)%.
H Investment income per share reflects a large, non-recurring dividend which amounted to $.01 per share. Excluding this non-recurring dividend, the ratio of net investment income (loss) to average net assets would have been (.67)%.
I The amounts shown reflect certain reclassifications related to book to tax differences that were made in the year shown.
J Expense ratios reflect operating expenses of the class. Expenses before reductions do not reflect amounts reimbursed by the investment adviser or reductions from brokerage service arrangements or reductions from other expense offset arrangements and do not represent the amount paid by the class during periods when reimbursements or reductions occur. Expenses net of fee waivers reflect expenses after reimbursement by the investment adviser but prior to reductions from brokerage service arrangements or other expense offset arrangements. Expenses net of all reductions represent the net expenses paid by the class.
K Amount represents less than $.01 per share.
See accompanying notes which are an integral part of the financial statements.
Annual Report
Financial Highlights - Class T
Years ended July 31, | 2013 | 2012 | 2011 | 2010 | 2009 |
Selected Per-Share Data | | | | | |
Net asset value, beginning of period | $ 15.68 | $ 16.27 | $ 12.57 | $ 10.74 | $ 13.17 |
Income from Investment Operations | | | | | |
Net investment income (loss) C | (.09) | (.11) F | (.11) G | (.10) H | (.09) |
Net realized and unrealized gain (loss) | 4.82 | (.16) | 3.81 | 1.93 | (2.34) |
Total from investment operations | 4.73 | (.27) | 3.70 | 1.83 | (2.43) |
Distributions from net realized gain | (1.03) | (.32) | - | - | - |
Redemption fees added to paid in capital C, J | - | - | - | - | - |
Net asset value, end of period | $ 19.38 | $ 15.68 | $ 16.27 | $ 12.57 | $ 10.74 |
Total Return A, B | 31.87% | (1.41)% | 29.44% | 17.04% | (18.45)% |
Ratios to Average Net Assets D, I | | | | | |
Expenses before reductions | 1.49% | 1.61% | 1.50% | 1.61% | 1.60% |
Expenses net of fee waivers, if any | 1.49% | 1.61% | 1.50% | 1.61% | 1.60% |
Expenses net of all reductions | 1.48% | 1.60% | 1.49% | 1.60% | 1.59% |
Net investment income (loss) | (.52)% | (.74)% F | (.73)% G | (.82)% H | (.91)% |
Supplemental Data | | | | | |
Net assets, end of period (000 omitted) | $ 34,686 | $ 27,658 | $ 30,764 | $ 23,930 | $ 21,533 |
Portfolio turnover rate E | 142% | 150% | 106% | 105% | 150% |
A Total returns would have been lower if certain expenses had not been reduced during the applicable periods shown.
B Total returns do not include the effect of the sales charges.
C Calculated based on average shares outstanding during the period.
D Fees and expenses of any underlying Fidelity Central Funds are not included in the Fund's expense ratio. The Fund indirectly bears its proportionate share of the expenses of any underlying Fidelity Central Funds.
E Amount does not include the portfolio activity of any underlying Fidelity Central Funds.
F Investment income per share reflects a large, non-recurring dividend which amounted to $.01 per share. Excluding this non-recurring dividend, the ratio of net investment income (loss) to average net assets would have been (.83)%.
G Investment income per share reflects a large, non-recurring dividend which amounted to $.02 per share. Excluding this non-recurring dividend, the ratio of net investment income (loss) to average net assets would have been (.86)%.
H Investment income per share reflects a large, non-recurring dividend which amounted to $.01 per share. Excluding this non-recurring dividend, the ratio of net investment income (loss) to average net assets would have been (.93)%.
I Expense ratios reflect operating expenses of the class. Expenses before reductions do not reflect amounts reimbursed by the investment adviser or reductions from brokerage service arrangements or reductions from other expense offset arrangements and do not represent the amount paid by the class during periods when reimbursements or reductions occur. Expenses net of fee waivers reflect expenses after reimbursement by the investment adviser but prior to reductions from brokerage service arrangements or other expense offset arrangements. Expenses net of all reductions represent the net expenses paid by the class.
J Amount represents less than $.01 per share.
See accompanying notes which are an integral part of the financial statements.
Annual Report
Financial Highlights - Class B
Years ended July 31, | 2013 | 2012 | 2011 | 2010 | 2009 |
Selected Per-Share Data | | | | | |
Net asset value, beginning of period | $ 15.19 | $ 15.86 | $ 12.30 | $ 10.57 | $ 13.03 |
Income from Investment Operations | | | | | |
Net investment income (loss) C | (.16) | (.18) F | (.18) G | (.16) H | (.13) |
Net realized and unrealized gain (loss) | 4.64 | (.17) | 3.74 | 1.89 | (2.33) |
Total from investment operations | 4.48 | (.35) | 3.56 | 1.73 | (2.46) |
Distributions from net realized gain | (1.02) | (.32) | - | - | - |
Redemption fees added to paid in capital C, J | - | - | - | - | - |
Net asset value, end of period | $ 18.65 | $ 15.19 | $ 15.86 | $ 12.30 | $ 10.57 |
Total Return A, B | 31.25% | (1.96)% | 28.94% | 16.37% | (18.88)% |
Ratios to Average Net Assets D, I | | | | | |
Expenses before reductions | 1.99% | 2.10% | 2.00% | 2.11% | 2.08% |
Expenses net of fee waivers, if any | 1.99% | 2.10% | 2.00% | 2.11% | 2.08% |
Expenses net of all reductions | 1.97% | 2.09% | 1.98% | 2.09% | 2.08% |
Net investment income (loss) | (1.01)% | (1.23)% F | (1.22)% G | (1.32)% H | (1.39)% |
Supplemental Data | | | | | |
Net assets, end of period (000 omitted) | $ 3,486 | $ 4,123 | $ 5,295 | $ 5,142 | $ 4,171 |
Portfolio turnover rate E | 142% | 150% | 106% | 105% | 150% |
A Total returns would have been lower if certain expenses had not been reduced during the applicable periods shown.
B Total returns do not include the effect of the contingent deferred sales charge.
C Calculated based on average shares outstanding during the period.
D Fees and expenses of any underlying Fidelity Central Funds are not included in the Fund's expense ratio. The Fund indirectly bears its proportionate share of the expenses of any underlying Fidelity Central Funds.
E Amount does not include the portfolio activity of any underlying Fidelity Central Funds.
F Investment income per share reflects a large, non-recurring dividend which amounted to $.01 per share. Excluding this non-recurring dividend, the ratio of net investment income (loss) to average net assets would have been (1.32)%.
G Investment income per share reflects a large, non-recurring dividend which amounted to $.02 per share. Excluding this non-recurring dividend, the ratio of net investment income (loss) to average net assets would have been (1.36)%.
H Investment income per share reflects a large, non-recurring dividend which amounted to $.01 per share. Excluding this non-recurring dividend, the ratio of net investment income (loss) to average net assets would have been (1.42)%.
I Expense ratios reflect operating expenses of the class. Expenses before reductions do not reflect amounts reimbursed by the investment adviser or reductions from brokerage service arrangements or reductions from other expense offset arrangements and do not represent the amount paid by the class during periods when reimbursements or reductions occur. Expenses net of fee waivers reflect expenses after reimbursement by the investment adviser but prior to reductions from brokerage service arrangements or other expense offset arrangements. Expenses net of all reductions represent the net expenses paid by the class.
J Amount represents less than $.01 per share.
See accompanying notes which are an integral part of the financial statements.
Annual Report
Financial Highlights - Class C
Years ended July 31, | 2013 | 2012 | 2011 | 2010 | 2009 |
Selected Per-Share Data | | | | | |
Net asset value, beginning of period | $ 15.16 | $ 15.83 | $ 12.28 | $ 10.55 | $ 13.00 |
Income from Investment Operations | | | | | |
Net investment income (loss) C | (.16) | (.18) F | (.18) G | (.16) H | (.13) |
Net realized and unrealized gain (loss) | 4.64 | (.17) | 3.73 | 1.89 | (2.32) |
Total from investment operations | 4.48 | (.35) | 3.55 | 1.73 | (2.45) |
Distributions from net realized gain | (1.02) | (.32) | - | - | - |
Redemption fees added to paid in capital C, J | - | - | - | - | - |
Net asset value, end of period | $ 18.62 | $ 15.16 | $ 15.83 | $ 12.28 | $ 10.55 |
Total Return A, B | 31.32% | (1.96)% | 28.91% | 16.40% | (18.85)% |
Ratios to Average Net Assets D, I | | | | | |
Expenses before reductions | 1.99% | 2.10% | 2.00% | 2.11% | 2.08% |
Expenses net of fee waivers, if any | 1.99% | 2.10% | 2.00% | 2.11% | 2.08% |
Expenses net of all reductions | 1.97% | 2.09% | 1.98% | 2.09% | 2.07% |
Net investment income (loss) | (1.01)% | (1.24)% F | (1.22)% G | (1.32)% H | (1.39)% |
Supplemental Data | | | | | |
Net assets, end of period (000 omitted) | $ 32,756 | $ 24,683 | $ 24,914 | $ 18,091 | $ 14,267 |
Portfolio turnover rate E | 142% | 150% | 106% | 105% | 150% |
A Total returns would have been lower if certain expenses had not been reduced during the applicable periods shown.
B Total returns do not include the effect of the contingent deferred sales charge.
C Calculated based on average shares outstanding during the period.
D Fees and expenses of any underlying Fidelity Central Funds are not included in the Fund's expense ratio. The Fund indirectly bears its proportionate share of the expenses of any underlying Fidelity Central Funds.
E Amount does not include the portfolio activity of any underlying Fidelity Central Funds.
F Investment income per share reflects a large, non-recurring dividend which amounted to $.01 per share. Excluding this non-recurring dividend, the ratio of net investment income (loss) to average net assets would have been (1.32)%.
G Investment income per share reflects a large, non-recurring dividend which amounted to $.02 per share. Excluding this non-recurring dividend, the ratio of net investment income (loss) to average net assets would have been (1.36)%.
H Investment income per share reflects a large, non-recurring dividend which amounted to $.01 per share. Excluding this non-recurring dividend, the ratio of net investment income (loss) to average net assets would have been (1.42)%.
I Expense ratios reflect operating expenses of the class. Expenses before reductions do not reflect amounts reimbursed by the investment adviser or reductions from brokerage service arrangements or reductions from other expense offset arrangements and do not represent the amount paid by the class during periods when reimbursements or reductions occur. Expenses net of fee waivers reflect expenses after reimbursement by the investment adviser but prior to reductions from brokerage service arrangements or other expense offset arrangements. Expenses net of all reductions represent the net expenses paid by the class.
J Amount represents less than $.01 per share.
See accompanying notes which are an integral part of the financial statements.
Annual Report
Financial Highlights - Small Cap Growth
Years ended July 31, | 2013 | 2012 | 2011 | 2010 | 2009 |
Selected Per-Share Data | | | | | |
Net asset value, beginning of period | $ 16.14 | $ 16.65 | $ 12.81 | $ 10.89 | $ 13.29 |
Income from Investment Operations | | | | | |
Net investment income (loss) B | .01 | (.03) E | (.03) F | (.04) G | (.04) |
Net realized and unrealized gain (loss) | 4.98 | (.16) | 3.90 | 1.96 | (2.36) |
Total from investment operations | 4.99 | (.19) | 3.87 | 1.92 | (2.40) |
Distributions from net realized gain | (1.06) | (.32) | (.03) H | - | - |
Redemption fees added to paid in capital B, J | - | - | - | - | - |
Net asset value, end of period | $ 20.07 | $ 16.14 | $ 16.65 | $ 12.81 | $ 10.89 |
Total Return A | 32.74% | (.88)% | 30.20% | 17.63% | (18.06)% |
Ratios to Average Net Assets C, I | | | | |
Expenses before reductions | .90% | 1.03% | .95% | 1.08% | 1.08% |
Expenses net of fee waivers, if any | .90% | 1.03% | .95% | 1.08% | 1.08% |
Expenses net of all reductions | .88% | 1.02% | .93% | 1.07% | 1.08% |
Net investment income (loss) | .08% | (.16)% E | (.17)% F | (.29)% G | (.39)% |
Supplemental Data | | | | | |
Net assets, end of period (000 omitted) | $ 1,315,659 | $ 1,166,101 | $ 1,382,688 | $ 1,204,818 | $ 1,085,184 |
Portfolio turnover rate D | 142% | 150% | 106% | 105% | 150% |
A Total returns would have been lower if certain expenses had not been reduced during the applicable periods shown.
B Calculated based on average shares outstanding during the period.
C Fees and expenses of any underlying Fidelity Central Funds are not included in the Fund's expense ratio. The Fund indirectly bears its proportionate share of the expenses of any underlying Fidelity Central Funds.
D Amount does not include the portfolio activity of any underlying Fidelity Central Funds.
E Investment income per share reflects a large, non-recurring dividend which amounted to $.01 per share. Excluding this non-recurring dividend, the ratio of net investment income (loss) to average net assets would have been (.25)%.
F Investment income per share reflects a large, non-recurring dividend which amounted to $.02 per share. Excluding this non-recurring dividend, the ratio of net investment income (loss) to average net assets would have been (.31)%.
G Investment income per share reflects a large, non-recurring dividend which amounted to $.01 per share. Excluding this non-recurring dividend, the ratio of net investment income (loss) to average net assets would have been (.39)%.
H The amounts shown reflect certain reclassifications related to book to tax differences that were made in the year shown.
I Expense ratios reflect operating expenses of the class. Expenses before reductions do not reflect amounts reimbursed by the investment adviser or reductions from brokerage service arrangements or reductions from other expense offset arrangements and do not represent the amount paid by the class during periods when reimbursements or reductions occur. Expenses net of fee waivers reflect expenses after reimbursement by the investment adviser but prior to reductions from brokerage service arrangements or other expense offset arrangements. Expenses net of all reductions represent the net expenses paid by the class.
J Amount represents less than $.01 per share.
See accompanying notes which are an integral part of the financial statements.
Annual Report
Financial Highlights - Class F
Years ended July 31, | 2013 | 2012 | 2011 | 2010 | 2009 K |
Selected Per-Share Data | | | | | |
Net asset value, beginning of period | $ 16.26 | $ 16.73 | $ 12.85 | $ 10.90 | $ 10.03 |
Income from Investment Operations | | | | | |
Net investment income (loss) D | .05 | .01 H | .01 I | - J, N | (.01) |
Net realized and unrealized gain (loss) | 5.02 | (.16) | 3.91 | 1.95 | .88 |
Total from investment operations | 5.07 | (.15) | 3.92 | 1.95 | .87 |
Distributions from net realized gain | (1.08) | (.32) | (.04) L | - | - |
Redemption fees added to paid in capital D, N | - | - | - | - | - |
Net asset value, end of period | $ 20.25 | $ 16.26 | $ 16.73 | $ 12.85 | $ 10.90 |
Total Return B, C | 33.00% | (.64)% | 30.56% | 17.89% | 8.67% |
Ratios to Average Net Assets E, M | | | | | |
Expenses before reductions | .69% | .80% | .70% | .78% | .74% A |
Expenses net of fee waivers, if any | .69% | .80% | .70% | .78% | .74% A |
Expenses net of all reductions | .67% | .79% | .68% | .77% | .73% A |
Net investment income (loss) | .29% | .07% H | .08% I | -% G, J | (.54)% A |
Supplemental Data | | | | | |
Net assets, end of period (000 omitted) | $ 727,683 | $ 528,229 | $ 290,765 | $ 106,941 | $ 159 |
Portfolio turnover rate F | 142% | 150% | 106% | 105% | 150% |
A Annualized
B Total returns for periods of less than one year are not annualized.
C Total returns would have been lower if certain expenses had not been reduced during the applicable periods shown.
D Calculated based on average shares outstanding during the period.
E Fees and expenses of any underlying Fidelity Central Funds are not included in the Fund's expense ratio. The Fund indirectly bears its proportionate share of the expenses of any underlying Fidelity Central Funds.
F Amount does not include the portfolio activity of any underlying Fidelity Central Funds.
G Amount represents less than .01%.
H Investment income per share reflects a large, non-recurring dividend which amounted to $.01 per share. Excluding this non-recurring dividend, the ratio of net investment income (loss) to average net assets would have been (.02)%.
I Investment income per share reflects a large, non-recurring dividend which amounted to $.02 per share. Excluding this non-recurring dividend, the ratio of net investment income (loss) to average net assets would have been (.06)%.
J Investment income per share reflects a large, non-recurring dividend which amounted to $.01 per share. Excluding this non-recurring dividend, the ratio of net investment income (loss) to average net assets would have been (.10)%.
K For the period June 26, 2009 (commencement of sale of shares) to July 31, 2009.
L The amounts shown reflect certain reclassifications related to book to tax differences that were made in the year shown.
M Expense ratios reflect operating expenses of the class. Expenses before reductions do not reflect amounts reimbursed by the investment adviser or reductions from brokerage service arrangements or reductions from other expense offset arrangements and do not represent the amount paid by the class during periods when reimbursements or reductions occur. Expense ratios before reductions for start-up periods may not be representative of longer-term operating periods. Expenses net of fee waivers reflect expenses after reimbursement by the investment adviser but prior to reductions from brokerage service arrangements or other expense offset arrangements. Expenses net of all reductions represent the net expenses paid by the class.
N Amount represents less than $.01 per share.
See accompanying notes which are an integral part of the financial statements.
Annual Report
Financial Highlights - Institutional Class
Years ended July 31, | 2013 | 2012 | 2011 | 2010 | 2009 |
Selected Per-Share Data | | | | | |
Net asset value, beginning of period | $ 16.17 | $ 16.68 | $ 12.83 | $ 10.91 | $ 13.30 |
Income from Investment Operations | | | | | |
Net investment income (loss) B | .01 | (.03) E | (.03) F | (.03) G | (.03) |
Net realized and unrealized gain (loss) | 4.98 | (.16) | 3.91 | 1.95 | (2.36) |
Total from investment operations | 4.99 | (.19) | 3.88 | 1.92 | (2.39) |
Distributions from net realized gain | (1.06) | (.32) | (.03) H | - | - |
Redemption fees added to paid in capital B, J | - | - | - | - | - |
Net asset value, end of period | $ 20.10 | $ 16.17 | $ 16.68 | $ 12.83 | $ 10.91 |
Total Return A | 32.65% | (.88)% | 30.24% | 17.60% | (17.97)% |
Ratios to Average Net Assets C, I | | | | | |
Expenses before reductions | .92% | 1.06% | .94% | 1.03% | 1.05% |
Expenses net of fee waivers, if any | .92% | 1.06% | .94% | 1.03% | 1.05% |
Expenses net of all reductions | .91% | 1.05% | .93% | 1.02% | 1.04% |
Net investment income (loss) | .06% | (.19)% E | (.17)% F | (.24)% G | (.36)% |
Supplemental Data | | | | | |
Net assets, end of period (000 omitted) | $ 51,158 | $ 36,694 | $ 41,440 | $ 25,650 | $ 19,204 |
Portfolio turnover rate D | 142% | 150% | 106% | 105% | 150% |
A Total returns would have been lower if certain expenses had not been reduced during the applicable periods shown.
B Calculated based on average shares outstanding during the period.
C Fees and expenses of any underlying Fidelity Central Funds are not included in the Fund's expense ratio. The Fund indirectly bears its proportionate share of the expenses of any underlying Fidelity Central Funds.
D Amount does not include the portfolio activity of any underlying Fidelity Central Funds.
E Investment income per share reflects a large, non-recurring dividend which amounted to $.01 per share. Excluding this non-recurring dividend, the ratio of net investment income (loss) to average net assets would have been (.28)%.
F Investment income per share reflects a large, non-recurring dividend which amounted to $.02 per share. Excluding this non-recurring dividend, the ratio of net investment income (loss) to average net assets would have been (.30)%.
G Investment income per share reflects a large, non-recurring dividend which amounted to $.01 per share. Excluding this non-recurring dividend, the ratio of net investment income (loss) to average net assets would have been (.34)%.
H The amounts shown reflect certain reclassifications related to book to tax differences that were made in the year shown.
I Expense ratios reflect operating expenses of the class. Expenses before reductions do not reflect amounts reimbursed by the investment adviser or reductions from brokerage service arrangements or reductions from other expense offset arrangements and do not represent the amount paid by the class during periods when reimbursements or reductions occur. Expenses net of fee waivers reflect expenses after reimbursement by the investment adviser but prior to reductions from brokerage service arrangements or other expense offset arrangements. Expenses net of all reductions represent the net expenses paid by the class.
J Amount represents less than $.01 per share.
See accompanying notes which are an integral part of the financial statements.
Annual Report
Notes to Financial Statements
For the period ended July 31, 2013
1. Organization.
Fidelity Small Cap Growth Fund (the Fund) is a fund of Fidelity Securities Fund (the Trust) and is authorized to issue an unlimited number of shares. The Trust is registered under the Investment Company Act of 1940, as amended (the 1940 Act), as an open-end management investment company organized as a Massachusetts business trust. The Fund offers Class A, Class T, Class C, Small Cap Growth, Class F and Institutional Class shares, each of which, along with Class B shares, has equal rights as to assets and voting privileges. Class B shares are closed to new accounts and additional purchases, except for exchanges and reinvestments. Each class has exclusive voting rights with respect to matters that affect that class. Class F shares of the Fund are only available for purchase by mutual funds for which Fidelity Management & Research Company (FMR) or an affiliate serves as investment manager. Class B shares will automatically convert to Class A shares after a holding period of seven years from the initial date of purchase.
2. Investments in Fidelity Central Funds.
The Fund invests in Fidelity Central Funds, which are open-end investment companies generally available only to other investment companies and accounts managed by FMR and its affiliates. The Fund's Schedule of Investments lists each of the Fidelity Central Funds held as of period end, if any, as an investment of the Fund, but does not include the underlying holdings of each Fidelity Central Fund. As an Investing Fund, the Fund indirectly bears its proportionate share of the expenses of the underlying Fidelity Central Funds.
The Money Market Central Funds seek preservation of capital and current income and are managed by Fidelity Investments Money Management, Inc. (FIMM), an affiliate of FMR.
A complete unaudited list of holdings for each Fidelity Central Fund is available upon request or at the Securities and Exchange Commission (the SEC) website at www.sec.gov. In addition, the financial statements of the Fidelity Central Funds, which are not covered by the Fund's Report of Independent Registered Public Accounting Firm, are available on the SEC website or upon request.
3. Significant Accounting Policies.
The financial statements have been prepared in conformity with accounting principles generally accepted in the United States of America (GAAP), which require management to make certain estimates and assumptions at the date of the financial statements. Actual results could differ from those estimates. Subsequent events, if any, through the date that the financial statements were issued have been evaluated in the preparation of the financial statements. The following summarizes the significant accounting policies of the Fund:
Annual Report
Notes to Financial Statements - continued
3. Significant Accounting Policies - continued
Investment Valuation. Investments are valued as of 4:00 p.m. Eastern time on the last calendar day of the period. In accordance with valuation policies and procedures approved by the Board of Trustees (the Board), the Fund attempts to obtain prices from one or more third party pricing vendors or brokers to value its investments. When current market prices, quotations or currency exchange rates are not readily available or reliable, investments will be fair valued in good faith by the FMR Fair Value Committee (the Committee), in accordance with procedures adopted by the Board. Factors used in determining fair value vary by investment type and may include market or investment specific events. The frequency with which these procedures are used cannot be predicted and they may be utilized to a significant extent. The Committee oversees the Fund's valuation policies and procedures and is responsible for approving and reporting to the Board all fair value determinations.
The Fund categorizes the inputs to valuation techniques used to value its investments into a disclosure hierarchy consisting of three levels as shown below:
Level 1 - quoted prices in active markets for identical investments
Level 2 - other significant observable inputs (including quoted prices for similar investments, interest rates, prepayment speeds, etc.)
Level 3 - unobservable inputs (including the Fund's own assumptions based on the best information available)
Valuation techniques used to value the Fund's investments by major category are as follows:
Equity securities, including restricted securities, for which market quotations are readily available, are valued at the last reported sale price or official closing price as reported by a third party pricing vendor on the primary market or exchange on which they are traded and are categorized as Level 1 in the hierarchy. In the event there were no sales during the day or closing prices are not available, securities are valued at the last quoted bid price or may be valued using the last available price and are generally categorized as Level 2 in the hierarchy. For foreign equity securities, when market or security specific events arise, comparisons to the valuation of American Depositary Receipts (ADRs), futures contracts, Exchange-Traded Funds (ETFs) and certain indexes as well as quoted prices for similar securities may be used and would be categorized as Level 2 in the hierarchy. Utilizing these techniques may result in transfers between Level 1 and Level 2.
Investments in open-end mutual funds, including the Fidelity Central Funds, are valued at their closing net asset value (NAV) each business day and are categorized as Level 1 in the hierarchy.
Annual Report
3. Significant Accounting Policies - continued
Investment Valuation - continued
Changes in valuation techniques may result in transfers in or out of an assigned level within the disclosure hierarchy.
Foreign Currency. The Fund may use foreign currency contracts to facilitate transactions in foreign-denominated securities. Gains and losses from these transactions may arise from changes in the value of the foreign currency or if the counterparties do not perform under the contracts' terms.
Foreign-denominated assets, including investment securities, and liabilities are translated into U.S. dollars at the exchange rates at period end. Purchases and sales of investment securities, income and dividends received and expenses denominated in foreign currencies are translated into U.S. dollars at the exchange rate in effect on the transaction date.
The effects of exchange rate fluctuations on investments are included with the net realized and unrealized gain (loss) on investment securities. Other foreign currency transactions resulting in realized and unrealized gain (loss) are disclosed separately.
Investment Transactions and Income. For financial reporting purposes, the Fund's investment holdings and NAV include trades executed through the end of the last business day of the period. The NAV per share for processing shareholder transactions is calculated as of the close of business of the New York Stock Exchange (NYSE), normally 4:00 p.m. Eastern time and includes trades executed through the end of the prior business day. Gains and losses on securities sold are determined on the basis of identified cost and may include proceeds received from litigation. Dividend income is recorded on the ex-dividend date, except for certain dividends from foreign securities where the ex-dividend date may have passed, which are recorded as soon as the Fund is informed of the ex-dividend date. Non-cash dividends included in dividend income, if any, are recorded at the fair market value of the securities received. Distributions received on securities that represent a return of capital or capital gain are recorded as a reduction of cost of investments and/or as a realized gain. Subsequent to ex-dividend date the Fund determines the components of these distributions, based upon receipt of tax filings or other correspondence relating to the underlying investment. Interest income and distributions from the Fidelity Central Funds are accrued as earned. Interest income includes coupon interest and amortization of premium and accretion of discount on debt securities. Investment income is recorded net of foreign taxes withheld where recovery of such taxes is uncertain.
Class Allocations and Expenses. Investment income, realized and unrealized capital gains and losses, common expenses of the Fund, and certain fund-level expense reductions, if any, are allocated on a pro-rata basis to each class based on the relative net
Annual Report
Notes to Financial Statements - continued
3. Significant Accounting Policies - continued
Class Allocations and Expenses - continued
assets of each class to the total net assets of the Fund. Each class differs with respect to transfer agent and distribution and service plan fees incurred. Certain expense reductions may also differ by class. Expenses directly attributable to a fund are charged to that fund. Expenses attributable to more than one fund are allocated among the respective funds on the basis of relative net assets or other appropriate methods. Expense estimates are accrued in the period to which they relate and adjustments are made when actual amounts are known.
Income Tax Information and Distributions to Shareholders. Each year, the Fund intends to qualify as a regulated investment company under Subchapter M of the Internal Revenue Code, including distributing substantially all of its taxable income and realized gains. As a result, no provision for income taxes is required. As of July 31, 2013, the Fund did not have any unrecognized tax benefits in the financial statements; nor is the Fund aware of any tax positions for which it is reasonably possible that the total amounts of unrecognized tax benefits will significantly change in the next twelve months. The Fund files a U.S. federal tax return, in addition to state and local tax returns as required. A fund's federal income tax returns are subject to examination by the Internal Revenue Service (IRS) for a period of three fiscal years after they are filed. State and local tax returns may be subject to examination for an additional fiscal year depending on the jurisdiction. Foreign taxes are provided for based on the Fund's understanding of the tax rules and rates that exist in the foreign markets in which it invests.
Distributions are declared and recorded on the ex-dividend date. Income dividends and capital gain distributions are declared separately for each class. Income and capital gain distributions are determined in accordance with income tax regulations, which may differ from GAAP. In addition, the Fund claimed a portion of the payment made to redeeming shareholders as a distribution for income tax purposes.
Capital accounts within the financial statements are adjusted for permanent book-tax differences. These adjustments have no impact on net assets or the results of operations. Temporary book-tax differences will reverse in a subsequent period.
Book-tax differences are primarily due to foreign currency transactions, partnerships and losses deferred due to wash sales and excise tax regulations.
Annual Report
3. Significant Accounting Policies - continued
Income Tax Information and Distributions to Shareholders - continued
The federal tax cost of investment securities and unrealized appreciation (depreciation) as of period end were as follows:
Gross unrealized appreciation | $ 440,572,794 |
Gross unrealized depreciation | (17,106,671) |
Net unrealized appreciation (depreciation) on securities and other investments | $ 423,466,123 |
| |
Tax Cost | $ 1,966,959,286 |
The tax-based components of distributable earnings as of period end were as follows:
Undistributed ordinary income | $ 106,393,413 |
Undistributed long-term capital gain | $ 142,483,227 |
Net unrealized appreciation (depreciation) | $ 423,461,730 |
The tax character of distributions paid was as follows:
| July 31, 2013 | July 31, 2012 |
Ordinary Income | $ 5,191,398 | $ - |
Long-term Capital Gains | 117,369,049 | 34,799,429 |
Total | $ 122,560,447 | $ 34,799,429 |
Short-Term Trading (Redemption) Fees. Shares held by investors in the Fund less than 90 days may have been subject to a redemption fee equal to 1.50% of the net asset value of shares redeemed. All redemption fees, which reduce the proceeds of the shareholder redemption, are retained by the Fund and accounted for as an addition to paid in capital.
4. Purchases and Sales of Investments.
Purchases and sales of securities, other than short-term securities, aggregated $2,731,095,699 and $2,897,640,503, respectively.
5. Fees and Other Transactions with Affiliates.
Management Fee. FMR and its affiliates provide the Fund with investment management related services for which the Fund pays a monthly management fee. The management fee is the sum of an individual fund fee rate that is based on an annual rate of .45% of the Fund's average net assets and an annualized group fee rate that averaged .26% during the period. The group fee rate is based upon the average net assets of all the mutual funds advised by FMR. The group fee rate decreases as assets under management increase and increases as assets under management decrease. In addition, the
Annual Report
Notes to Financial Statements - continued
5. Fees and Other Transactions with Affiliates - continued
Management Fee - continued
management fee is subject to a performance adjustment (up to a maximum of ± .20% of the Fund's average net assets over a 36 month performance period). The upward or downward adjustment to the management fee is based on the relative investment performance of Small Cap Growth as compared to an appropriate benchmark index. For the period, the total annual management fee rate, including the performance adjustment, was .64% of the Fund's average net assets.
Distribution and Service Plan Fees. In accordance with Rule 12b-1 of the 1940 Act, the Fund has adopted separate Distribution and Service Plans for each class of shares. Certain classes pay Fidelity Distributors Corporation (FDC), an affiliate of FMR, separate Distribution and Service Fees, each of which is based on an annual percentage of each class' average net assets. In addition, FDC may pay financial intermediaries for selling shares of the Fund and providing shareholder support services. For the period, the Distribution and Service Fee rates, total fees and amounts retained by FDC were as follows:
| Distribution
Fee | Service
Fee | Total Fees | Retained
by FDC |
Class A | -% | .25% | $ 158,162 | $ 3,570 |
Class T | .25% | .25% | 145,172 | 1,664 |
Class B | .75% | .25% | 37,548 | 28,458 |
Class C | .75% | .25% | 268,513 | 44,877 |
| | | $ 609,395 | $ 78,569 |
Sales Load. FDC may receive a front-end sales charge of up to 5.75% for selling Class A shares and 3.50% for selling Class T shares, some of which is paid to financial intermediaries for selling shares of the Fund. Depending on the holding period, FDC may receive contingent deferred sales charges levied on Class A, Class T, Class B, and Class C redemptions. The deferred sales charges range from 5.00% to 1.00% for Class B shares, 1.00% for Class C shares, 1.00% for certain purchases of Class A shares and .25% for certain purchases of Class T shares.
For the period, sales charge amounts retained by FDC were as follows:
| Retained
by FDC |
Class A | $ 26,925 |
Class T | 7,772 |
Class B* | 4,960 |
Class C* | 2,503 |
| $ 42,160 |
* When Class B and Class C shares are initially sold, FDC pays commissions from its own resources to financial intermediaries through which the sales
are made.
Annual Report
5. Fees and Other Transactions with Affiliates - continued
Transfer Agent Fees. Fidelity Investments Institutional Operations Company, Inc., (FIIOC), an affiliate of FMR, is the transfer, dividend disbursing and shareholder servicing agent for each class of the Fund. FIIOC receives account fees and asset-based fees that vary according to the account size and type of account of the shareholders of the respective classes of the Fund, except for Class F. FIIOC receives no fees for providing transfer agency services to Class F. FIIOC pays for typesetting, printing and mailing of shareholder reports, except proxy statements. For the period, transfer agent fees for each applicable class were as follows:
| Amount | % of
Average
Net Assets |
Class A | $ 189,665 | .30 |
Class T | 89,260 | .31 |
Class B | 11,279 | .30 |
Class C | 80,491 | .30 |
Small Cap Growth | 2,548,777 | .21 |
Institutional Class | 96,156 | .23 |
| $ 3,015,628 | |
Accounting and Security Lending Fees. Fidelity Service Company, Inc. (FSC), an affiliate of FMR, maintains the Fund's accounting records. The accounting fee is based on the level of average net assets for each month. Under a separate contract, FSC administers the security lending program. The security lending fee is based on the number and duration of lending transactions.
Brokerage Commissions. The Fund placed a portion of its portfolio transactions with brokerage firms which are affiliates of the investment adviser. Brokerage commissions are included in net realized gain (loss) and change in net unrealized appreciation (depreciation) in the Statement of Operations. The commissions paid to these affiliated firms were $81,093 for the period.
Interfund Lending Program. Pursuant to an Exemptive Order issued by the SEC, the Fund, along with other registered investment companies having management contracts with FMR, may participate in an interfund lending program. This program provides an alternative credit facility allowing the funds to borrow from, or lend money to, other participating affiliated funds. At period end, there were no interfund loans outstanding. The Fund's activity in this program during the period for which loans were outstanding was as follows:
Borrower or Lender | Average Loan
Balance | Weighted Average
Interest Rate | Interest
Expense |
Borrower | $ 10,856,167 | .37% | $ 674 |
Annual Report
Notes to Financial Statements - continued
6. Committed Line of Credit.
The Fund participates with other funds managed by FMR or an affiliate in a $4.25 billion credit facility (the "line of credit") to be utilized for temporary or emergency purposes to fund shareholder redemptions or for other short-term liquidity purposes. The Fund has agreed to pay commitment fees on its pro-rata portion of the line of credit, which amounted to $4,620 and is reflected in Miscellaneous expenses on the Statement of Operations. During the period, there were no borrowings on this line of credit.
7. Security Lending.
The Fund lends portfolio securities through a lending agent from time to time in order to earn additional income. For equity securities, a lending agent is used and may loan securities to certain qualified borrowers, including Fidelity Capital Markets (FCM), a broker-dealer affiliated with the Fund. On the settlement date of the loan, the Fund receives collateral (in the form of U.S. Treasury obligations, letters of credit and/or cash) against the loaned securities and maintains collateral in an amount not less than 100% of the market value of the loaned securities during the period of the loan. The market value of the loaned securities is determined at the close of business of the Fund and any additional required collateral is delivered to the Fund on the next business day. If the borrower defaults on its obligation to return the securities loaned because of insolvency or other reasons, the Fund may apply collateral received from the borrower against the obligation. The Fund may experience delays and costs in recovering the securities loaned. Any cash collateral received is invested in the Fidelity Securities Lending Cash Central Fund. The value of loaned securities and cash collateral at period end are disclosed on the Fund's Statement of Assets and Liabilities. The value of securities loaned to FCM at period end was $2,735,765. Security lending income represents the income earned on investing cash collateral, less rebates paid to borrowers and any lending agent fees associated with the loan, plus any premium payments received for lending certain types of securities. Security lending income is presented in the Statement of Operations as a component of income from Fidelity Central Funds, and includes $310,189 from securities loaned to FCM.
8. Expense Reductions.
Commissions paid to certain brokers with whom FMR places trades on behalf of the Fund include an amount in addition to trade execution, which is rebated back to the Fund to offset certain expenses. This amount totaled $317,619 for the period. In addition, through arrangements with the Fund's custodian, credits realized as a result of uninvested cash balances were used to reduce the Fund's expenses. During the period, these credits reduced the Fund's custody expenses by $50.
Annual Report
8. Expense Reductions - continued
In addition, FMR reimbursed a portion of the Fund's operating expenses during the period in the amount of $4,459.
9. Distributions to Shareholders.
Distributions to shareholders of each class were as follows:
Years ended July 31, | 2013 | 2012 |
From net realized gain | | |
Class A | $ 3,855,020 | $ 1,262,924 |
Class T | 1,778,904 | 573,407 |
Class B | 260,524 | 101,910 |
Class C | 1,656,727 | 481,854 |
Small Cap Growth | 74,940,038 | 25,434,274 |
Class F | 37,680,389 | 6,152,820 |
Institutional Class | 2,388,845 | 792,240 |
Total | $ 122,560,447 | $ 34,799,429 |
10. Share Transactions.
Transactions for each class of shares were as follows:
| Shares | Dollars |
Years ended July 31, | 2013 | 2012 | 2013 | 2012 |
Class A | | | | |
Shares sold | 969,311 | 986,718 | $ 16,711,827 | $ 14,926,996 |
Reinvestment of distributions | 231,282 | 85,896 | 3,646,231 | 1,194,285 |
Shares redeemed | (1,149,326) | (1,407,222) | (19,219,034) | (21,375,353) |
Net increase (decrease) | 51,267 | (334,608) | $ 1,139,024 | $ (5,254,072) |
Class T | | | | |
Shares sold | 457,321 | 358,193 | $ 7,743,595 | $ 5,456,756 |
Reinvestment of distributions | 106,640 | 38,774 | 1,660,117 | 533,890 |
Shares redeemed | (538,707) | (523,310) | (8,802,237) | (7,812,853) |
Net increase (decrease) | 25,254 | (126,343) | $ 601,475 | $ (1,822,207) |
Class B | | | | |
Shares sold | 6,696 | 11,810 | $ 106,485 | $ 172,624 |
Reinvestment of distributions | 16,337 | 7,173 | 246,159 | 96,091 |
Shares redeemed | (107,598) | (81,516) | (1,730,845) | (1,196,288) |
Net increase (decrease) | (84,565) | (62,533) | $ (1,378,201) | $ (927,573) |
Annual Report
Notes to Financial Statements - continued
10. Share Transactions - continued
| Shares | Dollars |
Years ended July 31, | 2013 | 2012 | 2013 | 2012 |
Class C | | | | |
Shares sold | 456,788 | 405,451 | $ 7,531,447 | $ 5,976,693 |
Reinvestment of distributions | 103,215 | 33,110 | 1,550,542 | 443,092 |
Shares redeemed | (428,305) | (384,855) | (6,821,754) | (5,527,477) |
Net increase (decrease) | 131,698 | 53,706 | $ 2,260,235 | $ 892,308 |
Small Cap Growth | | | | |
Shares sold | 10,379,088 | 14,552,522 | $ 182,249,151 | $ 226,496,807 |
Reinvestment of distributions | 4,595,875 | 1,774,167 | 73,721,316 | 25,022,882 |
Shares redeemed | (21,652,202) | (27,135,724) | (371,997,767) | (414,348,619) |
Net increase (decrease) | (6,677,239) | (10,809,035) | $ (116,027,300) | $ (162,828,930) |
Class F | | | | |
Shares sold | 7,670,010 | 16,430,240 | $ 131,231,307 | $ 255,874,632 |
Reinvestment of distributions | 2,336,095 | 432,802 | 37,680,389 | 6,152,820 |
Shares redeemed | (6,554,937) | (1,757,546) | (118,928,973) | (26,811,905) |
Net increase (decrease) | 3,451,168 | 15,105,496 | $ 49,982,723 | $ 235,215,547 |
Institutional Class | | | | |
Shares sold | 727,207 | 819,623 | $ 12,757,998 | $ 12,520,738 |
Reinvestment of distributions | 128,780 | 44,186 | 2,069,290 | 624,723 |
Shares redeemed | (580,321) | (1,078,752) | (9,884,418) | (16,617,897) |
Net increase (decrease) | 275,666 | (214,943) | $ 4,942,870 | $ (3,472,436) |
11. Other.
The Fund's organizational documents provide former and current trustees and officers with a limited indemnification against liabilities arising in connection with the performance of their duties to the Fund. In the normal course of business, the Fund may also enter into contracts that provide general indemnifications. The Fund's maximum exposure under these arrangements is unknown as this would be dependent on future claims that may be made against the Fund. The risk of material loss from such claims is considered remote.
At the end of the period, the Fidelity Freedom Funds and the Fidelity Freedom K Funds were the owners of record, in the aggregate, of approximately 59% of the total outstanding shares of the Fund.
Annual Report
To the Trustees of Fidelity Securities Fund and the Shareholders of Fidelity Small Cap Growth Fund:
In our opinion, the accompanying statement of assets and liabilities, including the schedule of investments, and the related statements of operations and of changes in net assets and the financial highlights present fairly, in all material respects, the financial position of Fidelity Small Cap Growth Fund (a fund of Fidelity Securities Fund) at July 31, 2013, the results of its operations for the year then ended, the changes in its net assets for each of the two years in the period then ended and the financial highlights for each of the periods indicated, in conformity with accounting principles generally accepted in the United States of America. These financial statements and financial highlights (hereafter referred to as "financial statements") are the responsibility of the Fidelity Small Cap Growth Fund's management. Our responsibility is to express an opinion on these financial statements based on our audits. We conducted our audits of these financial statements in accordance with the standards of the Public Company Accounting Oversight Board (United States). Those standards require that we plan and perform the audit to obtain reasonable assurance about whether the financial statements are free of material misstatement. An audit includes examining, on a test basis, evidence supporting the amounts and disclosures in the financial statements, assessing the accounting principles used and significant estimates made by management, and evaluating the overall financial statement presentation. We believe that our audits, which included confirmation of securities at July 31, 2013 by correspondence with the custodian and brokers, provide a reasonable basis for our opinion.
PricewaterhouseCoopers LLP
Boston, Massachusetts
September 16, 2013
Annual Report
The Trustees, Member of the Advisory Board, and executive officers of the trust and fund, as applicable, are listed below. The Board of Trustees governs the fund and is responsible for protecting the interests of shareholders. The Trustees are experienced executives who meet periodically throughout the year to oversee the fund's activities, review contractual arrangements with companies that provide services to the fund, oversee management of the risks associated with such activities and contractual arrangements, and review the fund's performance. Except for James C. Curvey, Ned C. Lautenbach, Ronald P. O'Hanley, and William S. Stavropoulos, each of the Trustees oversees 166 Fidelity funds. Mr. Curvey oversees 387 Fidelity funds. Mr. Lautenbach, Mr. O'Hanley, and Mr. Stavropoulos oversee 230 Fidelity funds.
The Trustees hold office without limit in time except that (a) any Trustee may resign; (b) any Trustee may be removed by written instrument, signed by at least two-thirds of the number of Trustees prior to such removal; (c) any Trustee who requests to be retired or who has become incapacitated by illness or injury may be retired by written instrument signed by a majority of the other Trustees; and (d) any Trustee may be removed at any special meeting of shareholders by a two-thirds vote of the outstanding voting securities of the trust. Each Trustee who is not an interested person of the trust and the fund (as defined in the 1940 Act) (Independent Trustee), shall retire not later than the last day of the calendar year in which his or her 75th birthday occurs. The Independent Trustees may waive this mandatory retirement age policy with respect to individual Trustees. The executive officers and Advisory Board Member hold office without limit in time, except that any officer and Advisory Board Member may resign or may be removed by a vote of a majority of the Trustees at any regular meeting or any special meeting of the Trustees. Except as indicated, each individual has held the office shown or other offices in the same company for the past five years.
Experience, Skills, Attributes, and Qualifications of the Fund's Trustees. The Governance and Nominating Committee has adopted a statement of policy that describes the experience, qualifications, attributes, and skills that are necessary and desirable for potential Independent Trustee candidates (Statement of Policy). The Board believes that each Trustee satisfied at the time he or she was initially elected or appointed a Trustee, and continues to satisfy, the standards contemplated by the Statement of Policy. The Governance and Nominating Committee also engages professional search firms to help identify potential Independent Trustee candidates who have the experience, qualifications, attributes, and skills consistent with the Statement of Policy. From time to time, additional criteria based on the composition and skills of the current Independent Trustees, as well as experience or skills that may be appropriate in light of future changes to board composition, business conditions, and regulatory or other developments, have also been considered by the professional search firms and the Governance and Nominating Committee. In addition, the Board takes into account the Trustees' commitment and participation in Board and committee meetings, as well as their leadership of standing and ad hoc committees throughout their tenure.
Annual Report
Trustees and Officers - continued
In determining that a particular Trustee was and continues to be qualified to serve as a Trustee, the Board has considered a variety of criteria, none of which, in isolation, was controlling. The Board believes that, collectively, the Trustees have balanced and diverse experience, qualifications, attributes, and skills, which allow the Board to operate effectively in governing the fund and protecting the interests of shareholders. Information about the specific experience, skills, attributes, and qualifications of each Trustee, which in each case led to the Board's conclusion that the Trustee should serve (or continue to serve) as a trustee of the fund, is provided below.
Board Structure and Oversight Function. James C. Curvey is an interested person (as defined in the 1940 Act) and currently serves as Chairman. The Trustees have determined that an interested Chairman is appropriate and benefits shareholders because an interested Chairman has a personal and professional stake in the quality and continuity of services provided to the fund. Independent Trustees exercise their informed business judgment to appoint an individual of their choosing to serve as Chairman, regardless of whether the Trustee happens to be independent or a member of management. The Independent Trustees have determined that they can act independently and effectively without having an Independent Trustee serve as Chairman and that a key structural component for assuring that they are in a position to do so is for the Independent Trustees to constitute a substantial majority for the Board. The Independent Trustees also regularly meet in executive session. Ned C. Lautenbach serves as Chairman of the Independent Trustees and as such (i) acts as a liaison between the Independent Trustees and management with respect to matters important to the Independent Trustees and (ii) with management prepares agendas for Board meetings.
Fidelity funds are overseen by different Boards of Trustees. The fund's Board oversees Fidelity's equity and high income funds and another Board oversees Fidelity's investment-grade bond, money market, and asset allocation funds. The asset allocation funds may invest in Fidelity funds overseen by the fund's Board. The use of separate Boards, each with its own committee structure, allows the Trustees of each group of Fidelity funds to focus on the unique issues of the funds they oversee, including common research, investment, and operational issues. On occasion, the separate Boards establish joint committees to address issues of overlapping consequences for the Fidelity funds overseen by each Board.
The Trustees operate using a system of committees to facilitate the timely and efficient consideration of all matters of importance to the Trustees, the fund, and fund shareholders and to facilitate compliance with legal and regulatory requirements and oversight of the fund's activities and associated risks. The Board, acting through its committees, has charged FMR and its affiliates with (i) identifying events or circumstances the occurrence of which could have demonstrably adverse effects on the fund's business and/or reputation; (ii) implementing processes and controls to lessen the possibility that such events or circumstances occur or to mitigate the effects of such events or circumstances if they do occur; and (iii) creating and maintaining a system designed to evaluate continuously business and market conditions in order to facilitate the identification and implementation processes described in (i) and (ii) above. Because the day-to-day operations and activities of the fund are carried out by or through FMR, its affiliates and other service providers, the fund's exposure to risks is mitigated but not eliminated by the processes overseen by the Trustees. While each of the Board's committees has responsibility for overseeing different aspects of the fund's activities, oversight is exercised primarily through the Operations, Audit, and Compliance Committees. In addition, the Independent Trustees have worked with FMR to enhance the Board's oversight of investment and financial risks, legal and regulatory risks, technology risks, and operational risks, including the development of additional risk reporting to the Board. For example, a working group comprised of Independent Trustees and FMR has worked and continues to work to review the Fidelity funds' valuation-related activities, reporting and risk management. Appropriate personnel, including but not limited to the fund's Chief Compliance Officer (CCO), FMR's internal auditor, the independent accountants, the fund's Treasurer and portfolio management personnel, make periodic reports to the Board's committees, as appropriate, including an annual review of FMR's risk management program for the Fidelity funds. The responsibilities of each standing committee, including their oversight responsibilities, are described further under "Standing Committees of the Fund's Trustees."
Annual Report
The fund's Statement of Additional Information (SAI) includes more information about the Trustees. To request a free copy, call Fidelity at 1-877-208-0098.
Interested Trustees*:
Correspondence intended for each Trustee who is an interested person may be sent to Fidelity Investments, 245 Summer Street, Boston, Massachusetts 02210.
Name, Year of Birth; Principal Occupations and Other Relevant Experience+ |
James C. Curvey (1935) |
| Year of Election or Appointment: 2007 Mr. Curvey is Trustee and Chairman of the Board of Trustees of certain Trusts. Mr. Curvey also serves as Trustee (2007-present) of other investment companies advised by FMR. Mr. Curvey is a Director of Fidelity Investments Money Management, Inc. (2009-present), Director of Fidelity Research & Analysis Co. (2009-present) and Director of FMR and FMR Co., Inc. (2007-present). Mr. Curvey is also Vice Chairman (2007-present) and Director of FMR LLC. In addition, Mr. Curvey serves as an Overseer for the Boston Symphony Orchestra and a member of the Trustees of Villanova University. Previously, Mr. Curvey was the Vice Chairman (2006-2007) and Director (2000-2007) of FMR Corp. |
Ronald P. O'Hanley (1957) |
| Year of Election or Appointment: 2011 Mr. O'Hanley serves as a Trustee and Chairman of the Board of Trustees of other Fidelity funds (2013-present), and is Director of FMR Co., Inc. (2010-present), Director of Fidelity Investments Money Management, Inc. (2010-present), Director of Fidelity Research & Analysis Company (2010-present), President of Fidelity Asset Management and Corporate Services and a Member of Fidelity's Executive Committee (2010-present). Previously, Mr. O'Hanley served as President and Chief Executive Officer of BNY Mellon Asset Management (2007-2010). Mr. O'Hanley also served as Vice Chairman of Bank New York Mellon Corp. and a member of that firm's Executive Committee. Prior to the 2007 merger of The Bank of New York and Mellon Financial Corporation, he was Vice Chairman of Mellon Financial Corporation and President and Chief Executive Officer of Mellon Asset Management. He joined Mellon in February 1997. Mr. O'Hanley currently serves as Chairman of the Boston Public Library Foundation Board of Directors and sits on the Board of Directors of Beth Israel Deaconess Medical Center, the Board of Trustees of the Marine Biological Laboratory and the Advisory Board of the Maxwell School of Citizenship and Public Administration at Syracuse University. Mr. O'Hanley also chairs the Council on Asset Management for the Financial Services Roundtable and is a member of the Board of Directors of Institutional Investor's U.S. Institute. |
* Trustees have been determined to be "Interested Trustees" by virtue of, among other things, their affiliation with the trust or various entities under common control with FMR.
+ The information above includes each Trustee's principal occupation during the last five years and other information relating to the experience, attributes, and skills relevant to each Trustee's qualifications to serve as a Trustee, which led to the conclusion that each Trustee should serve as a Trustee for the fund.
Annual Report
Independent Trustees:
Correspondence intended for each Independent Trustee (that is, the Trustees other than the Interested Trustees) may be sent to Fidelity Investments, P.O. Box 55235, Boston, Massachusetts 02205-5235.
Name, Year of Birth; Principal Occupations and Other Relevant Experience+ |
Dennis J. Dirks (1948) |
| Year of Election or Appointment: 2005 Prior to his retirement in May 2003, Mr. Dirks was Chief Operating Officer and a member of the Board of The Depository Trust & Clearing Corporation (DTCC). He also served as President, Chief Operating Officer, and Board member of The Depository Trust Company (DTC) and President and Board member of the National Securities Clearing Corporation (NSCC). In addition, Mr. Dirks served as Chief Executive Officer and Board member of the Government Securities Clearing Corporation, Chief Executive Officer and Board member of the Mortgage-Backed Securities Clearing Corporation, as a Trustee and a member of the Finance Committee of Manhattan College (2005-2008), and as a Trustee and a member of the Finance Committee of AHRC of Nassau County (2006-2008). Mr. Dirks is a member of the Independent Directors Council (IDC) Governing Council (2010-present) and Board of Directors for The Brookville Center for Children's Services, Inc. (2009-present). |
Alan J. Lacy (1953) |
| Year of Election or Appointment: 2008 Mr. Lacy serves as Senior Adviser (2007-present) of Oak Hill Capital Partners, L.P. (private equity). Mr. Lacy also served as Chief Executive Officer (2000-2005) and Vice Chairman (2005-2006) of Sears Holdings Corporation and Sears, Roebuck and Co. (retail). In addition, Mr. Lacy serves as a member of the Board of Directors of Dave & Buster's Entertainment, Inc. (restaurant and entertainment complexes, 2010-present), Earth Fare, Inc. (retail grocery, 2012-present), The Hillman Companies, Inc. (hardware wholesalers, 2010-present), and Bristol-Myers Squibb Company (global pharmaceuticals, 2008-present). Mr. Lacy is a member of the Board of Trustees of The National Parks Conservation Association (2006-present). Previously, Mr. Lacy served as Chairman of the Board of Trustees of the National Parks Conservation Association (2008-2011) and as a member of the Board of Directors for the Western Union Company (global money transfer, 2006-2011). |
Ned C. Lautenbach (1944) |
| Year of Election or Appointment: 2000 Mr. Lautenbach is Chairman of the Independent Trustees of the Equity and High Income Funds (2006-present) and serves as a Trustee of other Fidelity funds (2013-present). Mr. Lautenbach currently serves as the Lead Director of the Eaton Corporation Board of Directors (diversified industrial, 1997-present). Mr. Lautenbach is Chairman of the Board of Directors of the Philharmonic Center for the Arts in Naples, Florida (2012-present) and a member of the Council on Foreign Relations (1994-present). Previously, Mr. Lautenbach was a Partner/Advisory Partner at Clayton, Dubilier & Rice, LLC (private equity investment, 1998-2010), as well as a Director of Sony Corporation (2006-2007). |
Joseph Mauriello (1944) |
| Year of Election or Appointment: 2008 Prior to his retirement in January 2006, Mr. Mauriello served in numerous senior management positions including Deputy Chairman and Chief Operating Officer (2004-2005), and Vice Chairman of Financial Services (2002-2004) of KPMG LLP US (professional services, 1965-2005). Mr. Mauriello currently serves as a member of the Board of Directors of XL Group plc. (global insurance and re-insurance, 2006-present). Previously, Mr. Mauriello served as a Director of the Hamilton Funds of the Bank of New York (2006-2007) and of Arcadia Resources Inc. (health care services and products, 2007-2012). |
Robert W. Selander (1950) |
| Year of Election or Appointment: 2011 Previously, Mr. Selander served as a Member of the Advisory Board of Fidelity's Equity and High Income Funds (2011), Executive Vice Chairman (2010), Chief Executive Officer (2009-2010), and President and Chief Executive Officer (1997-2009) of Mastercard, Inc. |
Cornelia M. Small (1944) |
| Year of Election or Appointment: 2005 Ms. Small is a member of the Board of Directors (2009-present) and Chair of the Investment Committee (2010-present) of the Teagle Foundation. Ms. Small also serves on the Investment Committee of the Berkshire Taconic Community Foundation (2008-present). Previously, Ms. Small served as Chairperson (2002-2008) and a member of the Investment Committee and Chairperson (2008-2012) and a member of the Board of Trustees of Smith College. In addition, Ms. Small served as Chief Investment Officer, Director of Global Equity Investments, and a member of the Board of Directors of Scudder, Stevens & Clark and Scudder Kemper Investments. |
William S. Stavropoulos (1939) |
| Year of Election or Appointment: 2002 Mr. Stavropoulos is Vice Chairman of the Independent Trustees of the Equity and High Income Funds (2006-present) and serves as a Trustee of other Fidelity funds (2013-present). Mr. Stavropoulos serves as President and Founder of the Michigan Baseball Foundation, the Great Lakes Loons (2007-present). Mr. Stavropoulos is Chairman Emeritus of the Board of Directors of The Dow Chemical Company, where he previously served in numerous senior management positions, including President, CEO (1995-2000; 2002-2004), Chairman of the Executive Committee (2000-2006), and as a member of the Board of Directors (1990-2006). Currently, Mr. Stavropoulos is Chairman of the Board of Directors of Univar Inc. (global distributor of commodity and specialty chemicals), a Director of Teradata Corporation (data warehousing and technology solutions), and Maersk Inc. (industrial conglomerate), and a member of the Advisory Board for Metalmark Capital LLC (private equity investment, 2005-present). Mr. Stavropoulos is an operating advisor to Clayton, Dubilier & Rice, LLC (private equity investment). In addition, Mr. Stavropoulos is a member of the University of Notre Dame Advisory Council for the College of Science, a Trustee of the Rollin L. Gerstacker Foundation, and a Director of the Naples Philharmonic Center for the Arts. Previously, Mr. Stavropoulos served as a Director of Chemical Financial Corporation (bank holding company, 1993-2012) and Tyco International, Ltd. (multinational manufacturing and services, 2007-2012). |
David M. Thomas (1949) |
| Year of Election or Appointment: 2008 Previously, Mr. Thomas served as Executive Chairman (2005-2006) and Chairman and Chief Executive Officer (2000-2005) of IMS Health, Inc. (pharmaceutical and healthcare information solutions), and a Director of Fortune Brands, Inc. (consumer products, 2000-2011). In addition, Mr. Thomas serves as Non-Executive Chairman of the Board of Directors of Fortune Brands Home and Security (home and security products, 2011-present), and as a member of the Board of Directors of Interpublic Group of Companies, Inc. (marketing communication, 2004-present). |
+ The information above includes each Trustee's principal occupation during the last five years and other information relating to the experience, attributes, and skills relevant to each Trustee's qualifications to serve as a Trustee, which led to the conclusion that each Trustee should serve as a Trustee for the fund.
Annual Report
Trustees and Officers - continued
Advisory Board Member and Executive Officers:
Correspondence intended for each executive officer and Peter S. Lynch may be sent to Fidelity Investments, 245 Summer Street, Boston, Massachusetts 02210.
Name, Year of Birth; Principal Occupation |
Peter S. Lynch (1944) |
| Year of Election or Appointment: 2003 Member of the Advisory Board of Fidelity's Equity and High Income Funds. Mr. Lynch is Vice Chairman and a Director of FMR and FMR Co., Inc. In addition, Mr. Lynch serves as a Trustee of Boston College and as the Chairman of the Inner-City Scholarship Fund. Previously, Mr. Lynch served on the Special Olympics International Board of Directors (1997-2006). |
Kenneth B. Robins (1969) |
| Year of Election or Appointment: 2008 President and Treasurer of Fidelity's Equity and High Income Funds. Mr. Robins also serves as President and Treasurer (2008-present) and Assistant Treasurer (2009-present) of other Fidelity funds and is an employee of Fidelity Investments (2004-present). Mr. Robins serves as Executive Vice President of Fidelity Investments Money Management, Inc. (FIMM) (2013-present). Previously, Mr. Robins served as Deputy Treasurer of the Fidelity funds (2005-2008) and Treasurer and Chief Financial Officer of The North Carolina Capital Management Trust: Cash and Term Portfolios (2006-2008). |
Brian B. Hogan (1964) |
| Year of Election or Appointment: 2009 Vice President of Equity and High Income Funds. Mr. Hogan also serves as Vice President of other Fidelity funds (2009-present) and President of FMR's Equity Division (2009-present). Previously, Mr. Hogan served as Senior Vice President, Equity Research of FMR (2006-2009) and as a portfolio manager. |
Thomas C. Hense (1964) |
| Year of Election or Appointment: 2008 or 2010 Vice President of Fidelity's High Income (2008), Small Cap (2008), and Value (2010) Funds. Previously, Mr. Hense served as a portfolio manager for Fidelity's Institutional Money Management Group (Pyramis) (2003-2008). |
Scott C. Goebel (1968) |
| Year of Election or Appointment: 2008 Secretary and Chief Legal Officer (CLO) of the Fidelity funds. Mr. Goebel also serves as Secretary of Fidelity Investments Money Management, Inc. (FIMM) (2010-present) and Fidelity Research and Analysis Company (FRAC) (2010-present); Secretary and CLO of The North Carolina Capital Management Trust: Cash and Term Portfolios (2008-present); General Counsel, Secretary, and Senior Vice President of FMR (2008-present) and FMR Co., Inc. (2008-present); employed by FMR LLC or an affiliate (2001-present); Chief Legal Officer of Fidelity Management & Research (Hong Kong) Limited (2008-present) and Assistant Secretary of Fidelity Management & Research (Japan) Inc. (2008-present), and Fidelity Management & Research (U.K.) Inc. (2008-present). Previously, Mr. Goebel served as Assistant Secretary of FIMM (2008-2010), FRAC (2008-2010), and the Funds (2007-2008) and as Vice President and Secretary of Fidelity Distributors Corporation (FDC) (2005-2007). |
William C. Coffey (1969) |
| Year of Election or Appointment: 2009 Assistant Secretary of Fidelity's Equity and High Income Funds. Mr. Coffey also serves as Assistant Secretary of other Fidelity funds (2009-present), Senior Vice President and Deputy General Counsel of FMR LLC (2010-present), and is an employee of Fidelity Investments. Previously, Mr. Coffey served as Vice President and Associate General Counsel of FMR LLC (2005-2009). |
Elizabeth Paige Baumann (1968) |
| Year of Election or Appointment: 2012 Anti-Money Laundering (AML) Officer of the Fidelity funds. Ms. Baumann also serves as AML Officer of The North Carolina Capital Management Trust: Cash and Term Portfolios (2012-present), Chief AML Officer of FMR LLC (2012-present), and is an employee of Fidelity Investments. Previously, Ms. Baumann served as Vice President and Deputy Anti-Money Laundering Officer (2007-2012). |
Christine Reynolds (1958) |
| Year of Election or Appointment: 2008 Chief Financial Officer of the Fidelity funds. Ms. Reynolds became President of Fidelity Pricing and Cash Management Services (FPCMS) in August 2008. Ms. Reynolds served as Chief Operating Officer of FPCMS (2007-2008). Previously, Ms. Reynolds served as President, Treasurer, and Anti-Money Laundering officer of the Fidelity funds (2004-2007). |
Joseph A. Hanlon (1968) |
| Year of Election or Appointment: 2012 Chief Compliance Officer of Fidelity's Equity and High Income Funds. Mr. Hanlon also serves as Chief Compliance Officer of other Fidelity funds (2012-present). Mr. Hanlon serves as Compliance Officer of FMR, FMR Co., Inc., Fidelity Investments Money Management, Inc. (FIMM), Fidelity Research and Analysis Company (FRAC), and Fidelity Management & Research (Hong Kong) (2009-present), as Senior Vice President of the Fidelity Asset Management Division (2009-present), and is an employee of Fidelity Investments. Previously, Mr. Hanlon served as Compliance Officer of Fidelity Management & Research (Japan) Inc. (2009-2013), Strategic Advisers, Inc. (2009-2013), and Fidelity Management & Research (U.K.) Inc. (2009-2013). |
Joseph F. Zambello (1957) |
| Year of Election or Appointment: 2011 Deputy Treasurer of the Fidelity funds. Mr. Zambello is an employee of Fidelity Investments. Previously, Mr. Zambello served as Vice President of FMR's Program Management Group (2009-2011) and Vice President of the Transfer Agent Oversight Group (2005-2009). |
Adrien E. Deberghes (1967) |
| Year of Election or Appointment: 2008 Deputy Treasurer of Fidelity's Equity and High Income Funds. Mr. Deberghes also serves as Vice President (2011-present), Deputy Treasurer (2008-present), and Assistant Treasurer (2010-present) of other Fidelity funds, and is an employee of Fidelity Investments (2008-present). Previously, Mr. Deberghes served as Senior Vice President of Mutual Fund Administration at State Street Corporation (2007-2008), Senior Director of Mutual Fund Administration at Investors Bank & Trust (2005-2007), and Director of Finance for Dunkin' Brands (2000-2005). |
Stephen Sadoski (1971) |
| Year of Election or Appointment: 2012 Deputy Treasurer of Fidelity's Equity and High Income Funds. Mr. Sadoski also serves as Deputy Treasurer of other Fidelity funds (2012-present) and is an employee of Fidelity Investments (2012-present). Previously, Mr. Sadoski served as Assistant Treasurer of Fidelity's Fixed Income and Asset Allocation Funds (2012-2013), an assistant chief accountant in the Division of Investment Management of the Securities and Exchange Commission (SEC) (2009-2012) and as a senior manager at Deloitte & Touche LLP (1997-2009). |
Stacie M. Smith (1974) |
| Year of Election or Appointment: 2013 Deputy Treasurer of Fidelity's Equity and High Income Funds. Ms. Smith also serves as Deputy Treasurer of other Fidelity funds (2013-present) and is an employee of Fidelity Investments (2009-present). Previously, Ms. Smith served as Senior Audit Manager of Ernst & Young LLP (1996-2009). |
Stephanie J. Dorsey (1969) |
| Year of Election or Appointment: 2010 Assistant Treasurer of Fidelity's Equity and High Income Funds. Ms. Dorsey also serves as President and Treasurer (2013-present) and Assistant Treasurer (2010-present) of other Fidelity funds, Treasurer and Chief Financial Officer of The North Carolina Capital Management Trust: Cash and Term Portfolios (2013-present), and is an employee of Fidelity Investments (2008-present). Previously, Ms. Dorsey served as Deputy Treasurer of Fidelity's Fixed Income and Asset Allocation Funds (2008-2013), Treasurer (2004-2008) of the JPMorgan Mutual Funds and Vice President (2004-2008) of JPMorgan Chase Bank. |
Gary W. Ryan (1958) |
| Year of Election or Appointment: 2005 Assistant Treasurer of the Fidelity funds. Mr. Ryan is an employee of Fidelity Investments. Previously, Mr. Ryan served as Vice President of Fund Reporting in Fidelity Pricing and Cash Management Services (FPCMS) (1999-2005). |
Jonathan Davis (1968) |
| Year of Election or Appointment: 2010 Assistant Treasurer of the Fidelity funds. Mr. Davis is also Assistant Treasurer of Fidelity Rutland Square Trust II and Fidelity Commonwealth Trust II. Mr. Davis is an employee of Fidelity Investments. Previously, Mr. Davis served as Vice President and Associate General Counsel of FMR LLC (2003-2010). |
Annual Report
The Board of Trustees of Fidelity Small Cap Growth Fund voted to pay to shareholders of record at the opening of business, the following distributions per share derived from capital gains realized from sales of portfolio securities:
| Pay Date | Record Date | Capital Gains |
Class A | 09/16/13 | 09/13/13 | $2.204 |
Class T | 09/16/13 | 09/13/13 | $2.183 |
Class B | 09/16/13 | 09/13/13 | $2.105 |
Class C | 09/16/13 | 09/13/13 | $2.143 |
Class A and Class T designates 100% of the dividends distributed during the fiscal year as qualifying for the dividends-received deduction for corporate shareholders.
Class A and Class T designates 100% of the dividends distributed during the fiscal year as amounts which may be taken into account as a dividend for the purposes of the maximum rate under section 1(h)(11) of the Internal Revenue Code.
The fund hereby designates as a capital gain dividend with respect to the taxable year ended July 31, 2013, $193,398,519, or, if subsequently determined to be different, the net capital gain of such year.
The fund will notify shareholders in January 2014 of amounts for use in preparing 2013 income tax returns.
Annual Report
Board Approval of Investment Advisory Contracts and Management Fees
Fidelity Small Cap Growth Fund
Each year, the Board of Trustees, including the Independent Trustees (together, the Board), votes on the renewal of the management contract and sub-advisory agreements (together, the Advisory Contracts) for the fund. The Board, assisted by the advice of fund counsel and Independent Trustees' counsel, requests and considers a broad range of information relevant to the renewal of the Advisory Contracts throughout the year.
The Board meets regularly and, at each of its meetings, covers an extensive agenda of topics and materials and considers factors that are relevant to its annual consideration of the renewal of the fund's Advisory Contracts, including the services and support provided to the fund and its shareholders. The Board has established various standing committees, each composed of and chaired by Independent Trustees with varying backgrounds, to which the Board has assigned specific subject matter responsibilities in order to enhance effective decision-making by the Board. The Board, acting directly and through its Committees, requests and receives information concerning the annual consideration of the renewal of the fund's Advisory Contracts. The Board also meets as needed to consider matters specifically related to the Board's annual consideration of the renewal of Advisory Contracts. Members of the Board may also meet with trustees of other Fidelity funds through ad hoc joint committees to discuss certain matters relevant to the Fidelity funds.
At its July 2013 meeting, the Board, including the Independent Trustees, unanimously determined to renew the fund's Advisory Contracts. In reaching its determination, the Board considered all factors it believed relevant, including (i) the nature, extent, and quality of the services to be provided to the fund and its shareholders (including the investment performance of the fund); (ii) the competitiveness of the fund's management fee and total expense ratio relative to peer funds; (iii) the total costs of the services to be provided by and the profits to be realized by Fidelity from its relationship with the fund; (iv) the extent to which economies of scale exist and would be realized as the fund grows; and (v) whether fee levels reflect these economies of scale, if any, for the benefit of fund shareholders.
In considering whether to renew the Advisory Contracts for the fund, the Board reached a determination, with the assistance of fund counsel and Independent Trustees' counsel and through the exercise of its business judgment, that the renewal of the Advisory Contracts was in the best interests of the fund and its shareholders and that the compensation payable under the Advisory Contracts was fair and reasonable. The Board's decision to renew the Advisory Contracts was not based on any single factor, but rather was based on a comprehensive consideration of all the information provided to the Board at its meetings throughout the year. The Board, in reaching its determination to renew the Advisory Contracts, was aware that shareholders in the fund have a broad range of investment choices available to them, including a wide choice among mutual funds offered by Fidelity's competitors, and that the fund's shareholders, who have the opportunity to review and weigh the disclosure provided by the fund in its prospectus and other public disclosures, have chosen to invest in this fund, which is a part of the Fidelity family of funds.
Annual Report
Board Approval of Investment Advisory Contracts and
Management Fees - continued
Nature, Extent, and Quality of Services Provided. The Board considered the staffing within the investment adviser, Fidelity Management & Research Company (FMR), and the sub-advisers (together, the Investment Advisers) as it relates to the fund, including the backgrounds of the fund's investment personnel, and also considered the fund's investment objective, strategies, and related investment philosophy. The Independent Trustees also had discussions with senior management of Fidelity's investment operations and investment groups. The Board considered the structure of the portfolio manager compensation program and whether this structure provides appropriate incentives to act in the best interests of the fund.
Resources Dedicated to Investment Management and Support Services. The Board and the Fund Oversight and Research Committees reviewed the general qualifications and capabilities of the Investment Advisers' investment staff, including its size, education, experience, and resources, as well as the Investment Advisers' approach to recruiting, training, managing, and compensating investment personnel. The Board noted that FMR has continued to increase the resources devoted to non-U.S. offices, including expansion of Fidelity's global investment organization. The Board also noted that Fidelity's analysts have extensive resources, tools and capabilities that allow them to conduct sophisticated quantitative and fundamental analysis, as well as credit analysis of issuers, counterparties and guarantors. Further, the Board believes that Fidelity's investment professionals have sufficient access to global information and data so as to provide competitive investment results over time, and that those professionals also have access to sophisticated tools that permit them to assess portfolio construction and risk and performance attribution characteristics continuously, as well as to transmit new information and research conclusions rapidly around the world. Additionally, in its deliberations, the Board considered the Investment Advisers' trading and risk management capabilities and resources, which are an integral part of the investment management process.
Shareholder and Administrative Services. The Board considered (i) the nature, extent, quality, and cost of advisory, administrative, and shareholder services performed by the Investment Advisers and their affiliates under the Advisory Contracts and under separate agreements covering transfer agency, pricing and bookkeeping, and securities lending services for the fund; (ii) the nature and extent of the supervision of third party service providers, principally custodians and subcustodians; and (iii) the resources devoted to, and the record of compliance with, the fund's compliance policies and procedures. The Board also reviewed the allocation of fund brokerage, including allocations to brokers affiliated with the Investment Advisers, the use of brokerage commissions to pay fund expenses, and the use of "soft" commission dollars to pay for research services.
Annual Report
The Board noted that the growth of fund assets over time across the complex allows Fidelity to reinvest in the development of services designed to enhance the value or convenience of the Fidelity funds as investment vehicles. These services include 24-hour access to account information and market information through telephone representatives and over the Internet, investor education materials and asset allocation tools, and the expanded availability of Fidelity Investor Centers.
Investment in a Large Fund Family. The Board considered the benefits to shareholders of investing in a Fidelity fund, including the benefits of investing in a fund that is part of a large family of funds offering a variety of investment disciplines and providing a large variety of mutual fund investor services. The Board noted that Fidelity had taken, or had made recommendations that resulted in the Fidelity funds taking, a number of actions over the previous year that benefited particular funds, including (i) continuing to dedicate additional resources to investment research and to the support of the senior management team that oversees asset management; (ii) persisting in efforts to enhance Fidelity's global research capabilities; (iii) launching new funds and making other enhancements to meet client needs for global and income-oriented solutions; (iv) continuing to launch dedicated lower cost underlying funds to meet portfolio construction needs related to expanding underlying fund options for Fidelity funds of funds, specifically for the Freedom Fund product lines; (v) rationalizing product lines and gaining increased efficiencies through the mergers of several funds into other funds; (vi) strengthening Fidelity's index fund offerings by reducing investment minimums and adopting or lowering existing expense caps for certain funds and classes; (vii) enhancing Global Asset Allocation product offerings by launching new funds and strategies, including "open architecture" target date funds that utilize affiliated and unaffiliated sub-advisers; (viii) modifying the eligibility criteria for Institutional Class shares of Advisor funds to increase their marketability to a portion of the defined contribution plan market; (ix) creating a new low-cost retirement share class for certain Advisor funds to appeal to large retirement plans; (x) transitioning the management of certain Fidelity commodity funds to Geode Capital Management LLC, a registered commodity pool operator, while retaining administrative responsibilities for the funds; (xi) reorganizing a number of funds; and (xii) taking steps toward establishing a new Fidelity adviser to manage sector-based funds and products.
Investment Performance. The Board considered whether the fund has operated in accordance with its investment objective, as well as its record of compliance with its investment restrictions and its performance history. The Board noted that there was a portfolio management change for the fund in November 2011.
Annual Report
Board Approval of Investment Advisory Contracts and
Management Fees - continued
The Board took into account discussions with the Investment Advisers about fund investment performance that occur at Board meetings throughout the year. In this regard the Board noted that as part of regularly scheduled fund reviews and other reports to the Board on fund performance, the Board periodically considers annualized return information for the fund, for different time periods, measured against a securities market index ("benchmark index") and a peer group of mutual funds with similar objectives ("peer group"). In its evaluation of fund investment performance, the Board gave particular attention to information indicating changes in performance of certain Fidelity funds for specific time periods and the Investment Advisers' explanations for any overperformance or underperformance.
In addition to reviewing absolute and relative fund performance, the Independent Trustees periodically consider the appropriateness of fund performance metrics in evaluating the results achieved. In general, the Independent Trustees believe that fund performance should be evaluated based on net performance (after fees and expenses) of both the highest performing and lowest performing classes, where applicable, compared to appropriate benchmark indices, over appropriate time periods which may include full market cycles, and compared to peer groups, as applicable, over the same periods, taking into account relevant factors including the following: general market conditions; issuer-specific information; tactical opportunities for investment; and fund cash flows and other factors.
The Independent Trustees recognize that shareholders evaluate performance on a net basis over their own holding periods, for which one-, three-, and five-year periods are used as a proxy. For this reason, the performance information reviewed by the Board also included net cumulative calendar year total return information for the fund and an appropriate benchmark index and peer group for the most recent one-, three-, and five-year periods, as shown below. Returns are shown compared to the 25th percentile (top of box) and 75th percentile (bottom of box) of the peer universe.
Annual Report
Fidelity Small Cap Growth Fund
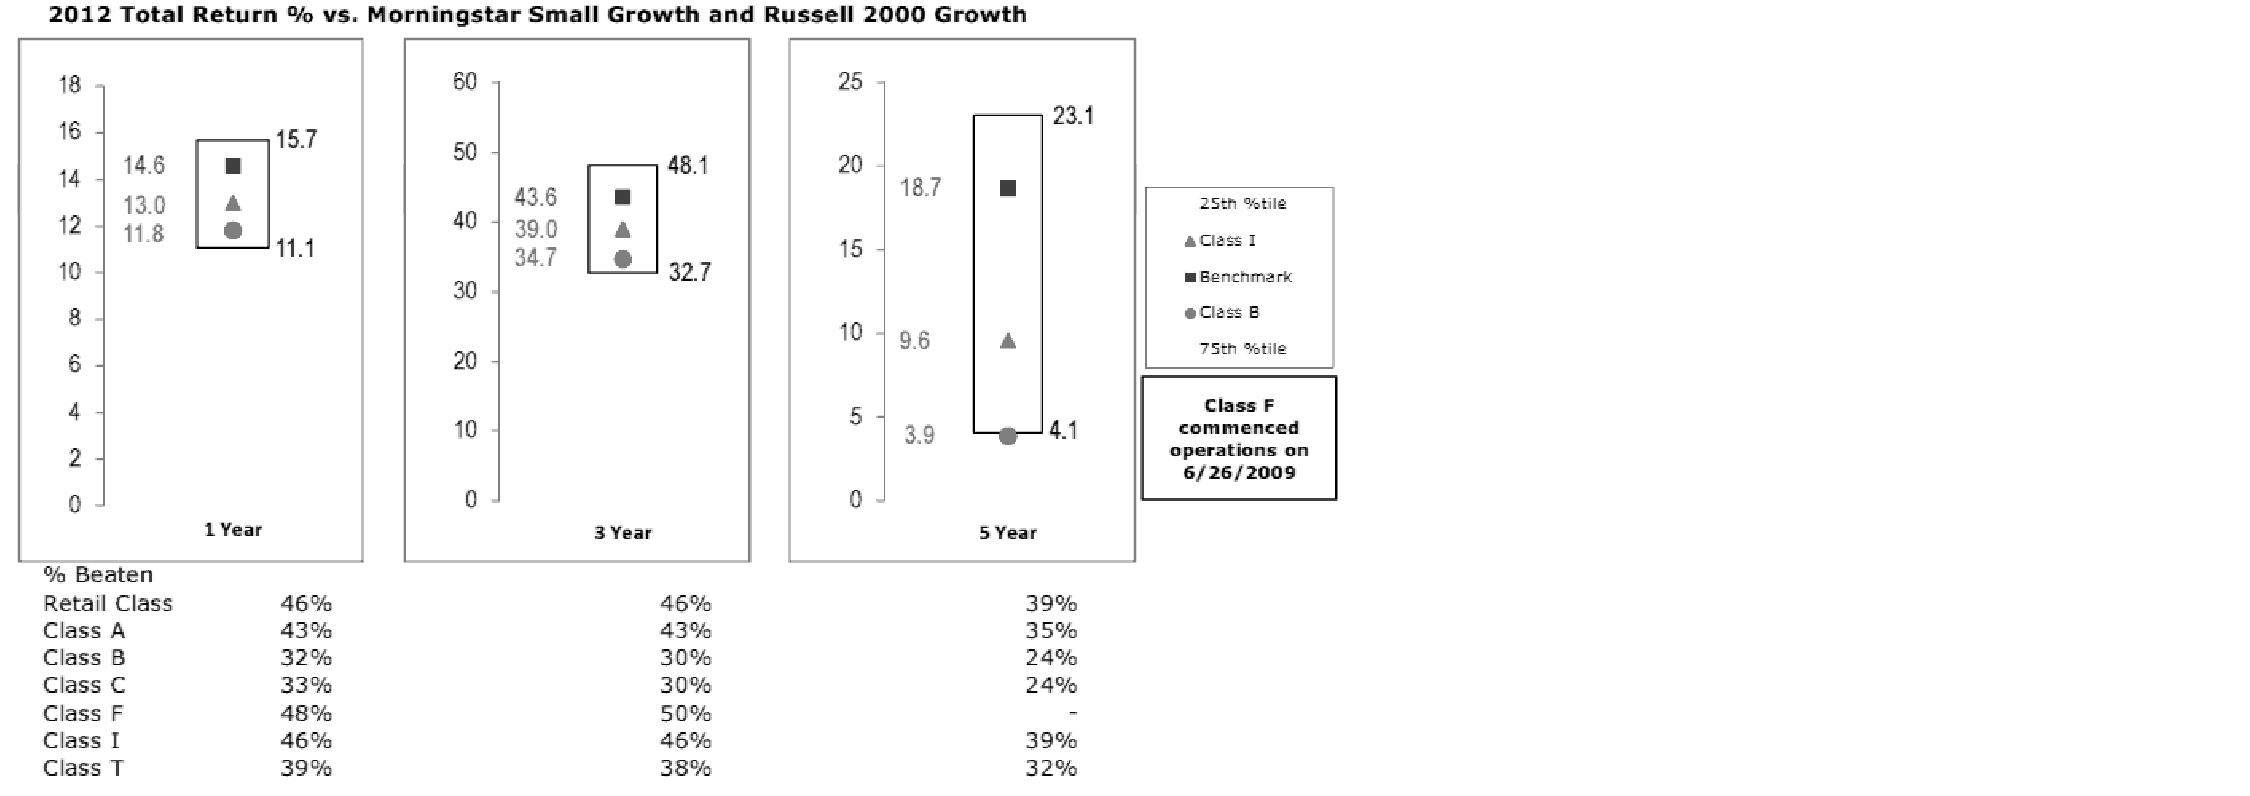
The Board has discussed with FMR the fund's underperformance (based on the December 31, 2012 data presented herein) and has engaged with FMR to consider what steps might be taken to remediate the fund's underperformance. The Board noted that the fund's performance has improved for more recent periods.
The Board also considered that the fund's management fee is subject to upward or downward adjustment depending upon whether, and to what extent, the fund's investment performance for the performance period exceeds, or is exceeded by, a securities index, thus leading to a performance adjustment for the same period. The Board noted that the performance adjustment provides FMR with a strong economic incentive to seek to achieve superior performance for the fund's shareholders and helps to more closely align the interests of FMR and the fund's shareholders.
Based on its review, the Board concluded that the nature, extent, and quality of services provided to the fund under the Advisory Contracts should benefit the fund's shareholders.
Competitiveness of Management Fee and Total Expense Ratio. The Board considered the fund's management fee and total expense ratio compared to "mapped groups" of competitive funds and classes. Fidelity creates "mapped groups" by combining similar Lipper investment objective categories that have comparable management fee characteristics. Combining Lipper investment objective categories aids the Board's management fee and total expense ratio comparisons by broadening the competitive group used for comparison and by reducing the number of universes to which various Fidelity funds are compared.
Annual Report
Board Approval of Investment Advisory Contracts and
Management Fees - continued
Management Fee. The Board considered two proprietary management fee comparisons for the 12-month periods shown in the chart below. The group of Lipper funds used by the Board for management fee comparisons is referred to below as the "Total Mapped Group." The Total Mapped Group comparison focuses on a fund's standing in terms of gross management fees before expense reimbursements or caps, and without giving effect to the fund's performance adjustment, relative to the total universe of funds with comparable investment mandates, regardless of whether their management fee structures also are comparable. Funds with comparable investment mandates offer exposure to similar types of securities. Funds with comparable management fee structures have similar management fee contractual arrangements (e.g., flat rate charged for advisory services, all-inclusive fee rate, etc.). "TMG %" represents the percentage of funds in the Total Mapped Group that had management fees that were lower than the fund's. For example, a TMG % of 14% means that 86% of the funds in the Total Mapped Group had higher management fees than the fund. The "Asset-Size Peer Group" (ASPG) comparison focuses on a fund's standing relative to a subset of non-Fidelity funds within the Total Mapped Group that are similar in size and management fee structure. The ASPG represents at least 15% of the funds in the Total Mapped Group with comparable asset size and management fee structures, subject to a minimum of 50 funds (or all funds in the Total Mapped Group if fewer than 50). Additional information, such as the ASPG quartile in which the fund's management fee ranked and the impact of the fund's performance adjustment, is also included in the chart and considered by the Board.
Fidelity Small Cap Growth Fund

The Board noted that the fund's management fee ranked below the median of its Total Mapped Group and below the median of its ASPG for 2012. The Board also noted the effect of the fund's negative performance adjustment on the fund's management fee ranking.
Annual Report
Based on its review, the Board concluded that the fund's management fee is fair and reasonable in light of the services that the fund receives and the other factors considered.
Total Expense Ratio. In its review of each class's total expense ratio, the Board considered the fund's management fee as well as other fund or class expenses, as applicable, such as transfer agent fees, pricing and bookkeeping fees, fund-paid 12b-1 fees, and custodial, legal, and audit fees. The Board also noted the effects of any waivers and reimbursements on fees and expenses, as well as the impact of the fund's performance adjustment. As part of its review, the Board also considered the current and historical total expense ratios of each class of the fund compared to competitive fund median expenses. Each class of the fund is compared to those funds and classes in the Total Mapped Group (used by the Board for management fee comparisons) that have a similar sales load structure.
The Board noted that the total expense ratio of each of Class A, Class B, Class C, Institutional Class, the retail class, and Class F ranked below its competitive median for 2012 and the total expense ratio of Class T ranked above its competitive median for 2012. The Board considered that, in general, various factors can affect total expense ratios. The Board noted that the total expense ratio of Class T was above the competitive median primarily because of higher 12b-1 fees on Class T. Class T has a higher 12b-1 fee, but a lower front-end sales charge, than traditionally priced front-end sales charge classes. The Board considered that Class T is primarily sold load-waived in the retirement plan market where its 0.50% 12b-1 fee is comparable to competing no-load, higher 12b-1 fee classes designed specifically for retirement plans. The Board noted that the fund offers multiple classes, each of which has a different sales load and 12b-1 fee structure, and that the multiple structures are intended to offer a range of pricing options for the intermediary market. The Board also noted that the total expense ratios of the classes vary primarily by the level of their 12b-1 fees, although differences in transfer agent fees may also cause expenses to vary from class to class.
Fees Charged to Other Fidelity Clients. The Board also considered Fidelity fee structures and other information with respect to clients of FMR and its affiliates, such as other mutual funds advised or subadvised by FMR or its affiliates, pension plan clients, and other institutional clients. The Board noted the findings of the 2013 ad hoc joint committee (created with the board of other Fidelity funds), which reviewed and compared Fidelity's institutional investment advisory business with its business of providing services to the Fidelity funds, including the differences in services provided, fees charged, and costs incurred, as well as competition in their respective marketplaces.
Annual Report
Board Approval of Investment Advisory Contracts and
Management Fees - continued
Based on its review of total expense ratios and fees charged to other Fidelity clients, the Board concluded that the total expense ratio of each class of the fund was reasonable, although Class T was above the median of the universe presented for comparison, in light of the services that the fund and its shareholders receive and the other factors considered.
Costs of the Services and Profitability. The Board considered the revenues earned and the expenses incurred by Fidelity in conducting the business of developing, marketing, distributing, managing, administering and servicing the fund and servicing the fund's shareholders. The Board also considered the level of Fidelity's profits in respect of all the Fidelity funds.
On an annual basis, FMR presents to the Board Fidelity's profitability for the fund. Fidelity calculates the profitability for each fund, as well as aggregate profitability for groups of Fidelity funds and all Fidelity funds, using a series of detailed revenue and cost allocation methodologies which originate with the books and records of Fidelity on which Fidelity's audited financial statements are based. The Audit Committee of the Board reviews any significant changes from the prior year's methodologies.
PricewaterhouseCoopers LLP (PwC), independent registered public accounting firm and auditor to Fidelity and certain Fidelity funds, has been engaged annually by the Board as part of the Board's assessment of Fidelity's profitability analysis. PwC's engagement includes the review and assessment of the methodologies used by Fidelity in determining the revenues and expenses attributable to Fidelity's mutual fund business, and completion of agreed-upon procedures surrounding the mathematical accuracy of fund profitability and its conformity to allocation methodologies. After considering PwC's reports issued under the engagement and information provided by Fidelity, the Board concluded that while other allocation methods may also be reasonable, Fidelity's profitability methodologies are reasonable in all material respects.
The Board also reviewed Fidelity's non-fund businesses and fall-out benefits related to the mutual fund business as well as cases where Fidelity's affiliates may benefit from or be related to the fund's business.
The Board considered the costs of the services provided by and the profits realized by Fidelity in connection with the operation of the fund and was satisfied that the profitability was not excessive in the circumstances.
Economies of Scale. The Board considered whether there have been economies of scale in respect of the management of the Fidelity funds, whether the Fidelity funds (including the fund) have appropriately benefited from any such economies of scale, and whether there is potential for realization of any further economies of scale. The Board considered the extent to which the fund will benefit from economies of scale through increased services to the fund, through waivers or reimbursements, or through fee or expense reductions. The Board also noted that in 2009, it and the board of other Fidelity funds created an ad hoc committee (the Economies of Scale Committee) to analyze whether FMR attains economies of scale in respect of the management and servicing of the Fidelity funds, whether the Fidelity funds have appropriately benefited from such economies of scale, and whether there is potential for realization of any further economies of scale.
Annual Report
The Board recognized that the fund's management contract incorporates a "group fee" structure, which provides for lower group fee rates as total fund assets under FMR's management increase, and for higher group fee rates as total fund assets under FMR's management decrease. FMR calculates the group fee rates based on a tiered asset "breakpoint" schedule that varies based on asset class. The Board considered that the group fee is designed to deliver the benefits of economies of scale to fund shareholders when total Fidelity fund assets increase, even if assets of any particular fund are unchanged or have declined, because some portion of Fidelity's costs are attributable to services provided to all Fidelity funds, and all funds benefit if those costs can be allocated among more assets. The Board concluded that, given the group fee structure, fund shareholders will benefit from lower management fees as assets under FMR's management increase at the fund complex level, regardless of whether Fidelity achieves any such economies of scale.
The Board concluded, taking into account the analysis of the Economies of Scale Committee, that economies of scale, if any, are being appropriately shared between fund shareholders and Fidelity.
Amendment to Description of Group Fee Rate. At its July 2013 meeting, the Board voted to approve an amendment to the fund's management contract to modify the description of the "group fee rate" effective August 1, 2013. The Board noted that under the prior description in the contract, the group fee rate was based on the average net assets of all registered investment companies with which FMR has management contracts. Under the contract's tiered asset breakpoint schedule, the group fee rate is lower as total fund assets under FMR's management increase, and higher as total fund assets under FMR's management decrease. The Board considered that the prior description would have excluded the assets of 64 Fidelity sector funds from the group fee rate calculation once Fidelity SelectCo, LLC, an affiliate of FMR, assumed management responsibilities for those funds. The Board noted that modifying the description of the group fee rate to continue to include the assets of those 64 funds for purposes of determining group fee rate breakpoints would avoid an immediate adverse impact on the group fee rate for any fund.
Additional Information Requested by the Board. In order to develop fully the factual basis for consideration of the Fidelity funds' Advisory Contracts, the Board requested and received additional information on certain topics, including: (i) fund performance trends and Fidelity's long-term strategies for certain funds; (ii) the potential to further rationalize the Fidelity fund lineup with the possibility of achieving savings for the funds and Fidelity; (iii) the methodology with respect to competitive fund data and peer group classifications; (iv) the arrangements with, and performance of, certain sub-advisers on behalf of the Fidelity funds, as well as certain proposed participating affiliate arrangements; (v) the realization of fall-out benefits in certain Fidelity business units; (vi) Fidelity's group fee structures, including the rationale for the individual fee rates of certain categories of funds and the definition of group assets; (vii) trends regarding industry use of performance fee structures and the performance adjustment methodologies applicable to the Fidelity funds; (viii) additional competitive analysis regarding the total expenses for certain classes; and (ix) fund profitability methodology, including Fidelity's cost allocation methodology, and the impact of certain factors on fund profitability results.
Annual Report
Board Approval of Investment Advisory Contracts and
Management Fees - continued
Based on its evaluation of all of the conclusions noted above, and after considering all factors it believed relevant, the Board ultimately concluded that the advisory fee structures are fair and reasonable, and that the fund's Advisory Contracts should be renewed.
Annual Report
Investment Adviser
Fidelity Management & Research Company
Boston, MA
Investment Sub-Advisers
FMR Co., Inc.
Fidelity Management & Research
(U.K.) Inc.
Fidelity Management & Research
(Hong Kong) Limited
Fidelity Management & Research
(Japan) Inc.
General Distributor
Fidelity Distributors Corporation
Smithfield, RI
Transfer and Service Agents
Fidelity Investments Institutional
Operations Company, Inc.
Boston, MA
Fidelity Service Company, Inc.
Boston, MA
Custodian
Citibank, N.A.
New York, NY
(Fidelity Investment logo)(registered trademark)
ASCP-UANN-0913
1.803713.108
(Fidelity Investment logo)(registered trademark)
Fidelity Advisor®
Small Cap Growth
Fund - Institutional Class
Annual Report
July 31, 2013
(Fidelity Cover Art)
Institutional Class
is a class of Fidelity®
Small Cap Growth
Fund
Contents
Performance | (Click Here) | How the fund has done over time. |
Management's Discussion of Fund Performance | (Click Here) | The Portfolio Manager's review of fund performance and strategy. |
Shareholder Expense Example | (Click Here) | An example of shareholder expenses. |
Investment Changes | (Click Here) | A summary of major shifts in the fund's investments over the past six months. |
Investments | (Click Here) | A complete list of the fund's investments with their market values. |
Financial Statements | (Click Here) | Statements of assets and liabilities, operations, and changes in net assets, as well as financial highlights. |
Notes | (Click Here) | Notes to the financial statements. |
Report of Independent Registered Public Accounting Firm | (Click Here) | |
Trustees and Officers | (Click Here) | |
Distributions | (Click Here) | |
Board Approval of Investment Advisory Contracts and Management Fees | (Click Here) | |
To view a fund's proxy voting guidelines and proxy voting record for the 12-month period ended June 30, visit http://www.fidelity.com/proxyvotingresults or visit the Securities and Exchange Commission's (SEC) web site at http://www.sec.gov. You may also call 1-877-208-0098 to request a free copy of the proxy voting guidelines.
Standard & Poor's, S&P and S&P 500 are registered service marks of The McGraw-Hill Companies, Inc. and have been licensed for use by Fidelity Distributors Corporation.
Other third-party marks appearing herein are the property of their respective owners.
All other marks appearing herein are registered or unregistered trademarks or service marks of FMR LLC or an affiliated company. © 2013 FMR LLC. All rights reserved.
Annual Report
This report and the financial statements contained herein are submitted for the general information of the shareholders of the fund. This report is not authorized for distribution to prospective investors in the fund unless preceded or accompanied by an effective prospectus.
A fund files its complete schedule of portfolio holdings with the SEC for the first and third quarters of each fiscal year on Form N-Q. Forms N-Q are available on the SEC's web site at http://www.sec.gov. A fund's Forms N-Q may be reviewed and copied at the SEC's Public Reference Room in Washington, DC. Information regarding the operation of the SEC's Public Reference Room may be obtained by calling 1-800-SEC-0330. For a complete list of a fund's portfolio holdings, view the most recent holdings listing, semiannual report, or annual report on Fidelity's web site at http://www.fidelity.com, http://www.advisor.fidelity.com, or http://www.401k.com, as applicable.
NOT FDIC INSURED • MAY LOSE VALUE • NO BANK GUARANTEE
Neither the fund nor Fidelity Distributors Corporation is a bank.
Annual Report
Average annual total return reflects the change in the value of an investment, assuming reinvestment of the class' distributions from dividend income and capital gains (the profits earned upon the sale of securities that have grown in value, if any) and assuming a constant rate of performance each year. The $10,000 table and the fund's returns do not reflect the deduction of taxes that a shareholder would pay on fund distributions or the redemption of fund shares. During periods of reimbursement by Fidelity, a fund's total return will be greater than it would be had the reimbursement not occurred. How a fund did yesterday is no guarantee of how it will do tomorrow.
Average Annual Total Returns
Periods ended July 31, 2013 | Past 1
year | Past 5
years | Life of
fund A |
Institutional Class | 32.65% | 10.56% | 10.53% |
A From November 3, 2004.
$10,000 Over Life of Fund
Let's say hypothetically that $10,000 was invested in Fidelity Advisor® Small Cap Growth Fund - Institutional Class on November 3, 2004, when the fund started. The chart shows how the value of your investment would have changed, and also shows how the Russell 2000® Growth Index performed over the same period.
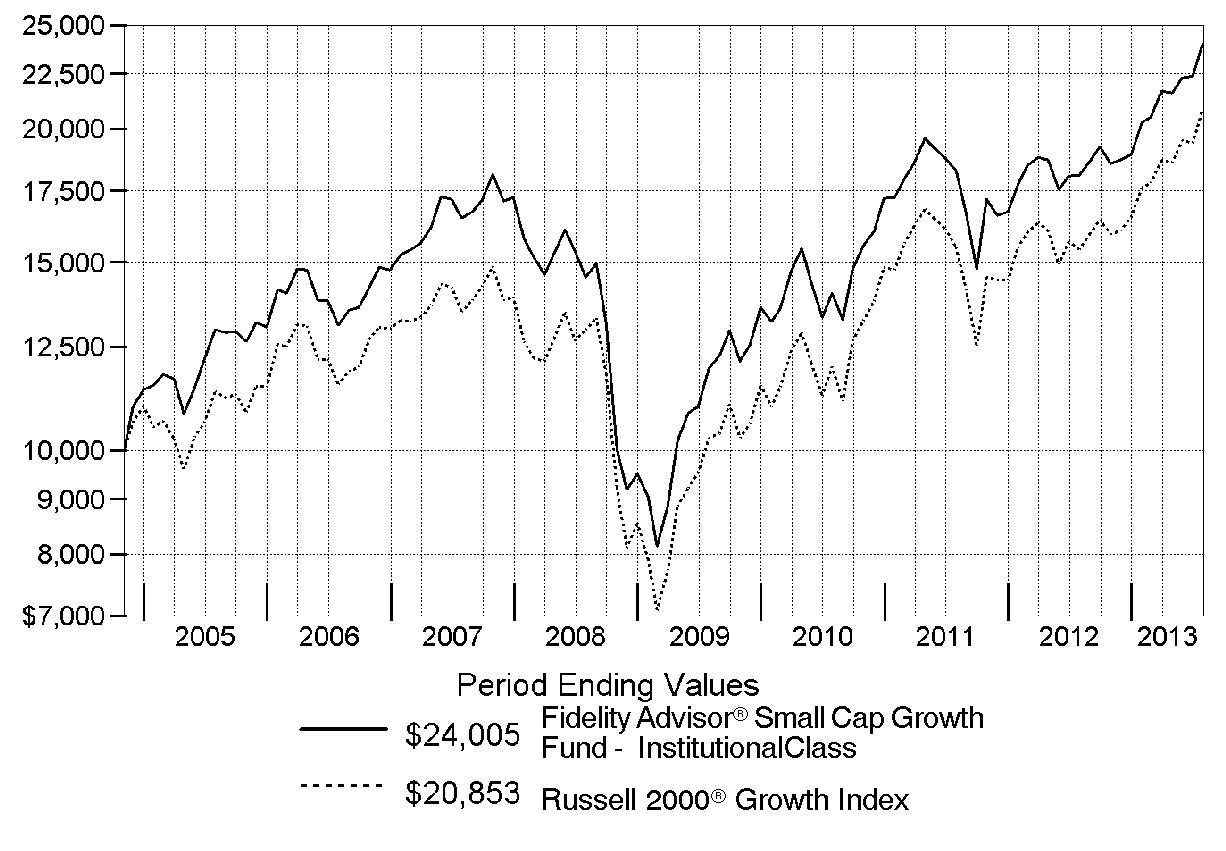
Annual Report
Market Recap: The bull run in U.S. stocks comfortably settled into a fifth year, as major equity benchmarks ripped through records during the 12 months ending July 31, 2013. Gains were fueled by a generally improving global economy and accommodative monetary policies worldwide. The tone was positive for most of the year, based largely on stronger U.S. economic data, including employment, housing and consumer sentiment. Setting a series of new highs along the way, the broad-based S&P 500® Index rose an impressive 25.00% for the 12 months, while the blue-chip-laden Dow Jones Industrial AverageSM also moved into record territory en route to a 22.36% gain. The growth-oriented Nasdaq Composite Index® had a similarly strong run, advancing 25.15%. During the year, markets were resilient amid intermittent volatility over debt woes in Europe, the 2012 U.S. presidential election and year-end Congressional gridlock over the federal budget. In mid-to-late June, concern arose about the U.S. Federal Reserve possibly tapering its sustaining bond-buying strategy - which prompted a brief, but steep, market sell-off. However, investors' continued quest for yield and the Fed's pledge to keep buying bonds until the economy showed significant improvement overpowered the uncertainty and helped equities climb notably higher in July to close the period on a strong note.
Comments from Patrick Venanzi, Portfolio Manager of Fidelity Advisor® Small Cap Growth Fund: For the year, the fund's Institutional Class shares rose 32.65%, lagging the 35.39% gain of the Russell 2000® Growth Index. I aim to buy small-cap stocks with above-average growth opportunities at reasonable prices. Along with the market, the fund did very well in absolute terms, but lagged its benchmark. Given the longer-term focus and the quality bias of my investments, the fund sometimes trails the index during the market's strongest short-term periods. The fund's cash stake of roughly 4%, on average, during the past year weighed on relative performance, and a non-index position in Mellanox Technologies, a maker of data transfer and storage products, was the biggest individual detractor. Online health insurance provider eHealth was another miss for the fund, due to untimely ownership, and I sold both Mellanox and eHealth by period end. On the plus side, specialty furniture and electronics retailer Conn's was our top relative contributor, with its stock benefiting as a proactive management team effectively revamped stores, offering higher-quality products and customer-friendly financing options.
The views expressed above reflect those of the portfolio manager(s) only through the end of the period as stated on the cover of this report and do not necessarily represent the views of Fidelity or any other person in the Fidelity organization. Any such views are subject to change at any time based upon market or other conditions and Fidelity disclaims any responsibility to update such views. These views may not be relied on as investment advice and, because investment decisions for a Fidelity fund are based on numerous factors, may not be relied on as an indication of trading intent on behalf of any Fidelity fund.
Annual Report
Shareholder Expense Example
As a shareholder of the Fund, you incur two types of costs: (1) transaction costs, including sales charges (loads) on purchase payments or redemption proceeds, redemption fees and (2) ongoing costs, including management fees, distribution and/or service (12b-1) fees and other Fund expenses. This Example is intended to help you understand your ongoing costs (in dollars) of investing in the Fund and to compare these costs with the ongoing costs of investing in other mutual funds.
The Example is based on an investment of $1,000 invested at the beginning of the period and held for the entire period (February 1, 2013 to July 31, 2013).
Actual Expenses
The first line of the accompanying table for each class of the Fund provides information about actual account values and actual expenses. You may use the information in this line, together with the amount you invested, to estimate the expenses that you paid over the period. Simply divide your account value by $1,000.00 (for example, an $8,600 account value divided by $1,000.00 = 8.6), then multiply the result by the number in the first line for a class of the Fund under the heading entitled "Expenses Paid During Period" to estimate the expenses you paid on your account during this period. A small balance maintenance fee of $12.00 that is charged once a year may apply for certain accounts with a value of less than $2,000. This fee is not included in the table below. If it was, the estimate of expenses you paid during the period would be higher, and your ending account value lower, by this amount. In addition, the Fund, as a shareholder in the underlying Fidelity Central Funds, will indirectly bear its pro-rata share of the fees and expenses incurred by the underlying Fidelity Central Funds. These fees and expenses are not included in the Fund's annualized expense ratio used to calculate the expense estimate in the table below.
Hypothetical Example for Comparison Purposes
The second line of the accompanying table for each class of the Fund provides information about hypothetical account values and hypothetical expenses based on a Class' actual expense ratio and an assumed rate of return of 5% per year before expenses, which is not the Class' actual return. The hypothetical account values and expenses may not be used to estimate the actual ending account balance or expenses you paid for the period. You may use this information to compare the ongoing costs of investing in the Fund and other funds. To do so, compare this 5% hypothetical example with the 5% hypothetical examples that appear in the shareholder reports of the other funds. A small balance maintenance fee of $12.00 that is charged once a year may apply for certain accounts with a value of less than $2,000. This fee is not included in the table below. If it was, the estimate of expenses you paid during the period would be higher, and your ending account value lower, by this amount. In addition, the Fund, as a shareholder in the underlying Fidelity Central Funds, will indirectly bear its pro-rata share of the fees and expenses incurred by the underlying Fidelity Central Funds. These fees and expenses are not included in the Fund's annualized expense ratio used to calculate the expense estimate in the table below.
Please note that the expenses shown in the table are meant to highlight your ongoing costs only and do not reflect any transaction costs. Therefore, the second line of the table is useful in comparing ongoing costs only, and will not help you determine the relative total costs of owning different funds. In addition, if these transactional costs were included, your costs would have been higher.
Annual Report
| Annualized
Expense Ratio B | Beginning
Account Value
February 1, 2013 | Ending
Account Value
July 31, 2013 | Expenses Paid
During Period*
February 1, 2013
to July 31, 2013 |
Class A | 1.22% | | | |
Actual | | $ 1,000.00 | $ 1,183.60 | $ 6.61 |
HypotheticalA | | $ 1,000.00 | $ 1,018.74 | $ 6.11 |
Class T | 1.48% | | | |
Actual | | $ 1,000.00 | $ 1,181.70 | $ 8.01 |
HypotheticalA | | $ 1,000.00 | $ 1,017.46 | $ 7.40 |
Class B | 1.97% | | | |
Actual | | $ 1,000.00 | $ 1,178.90 | $ 10.64 |
HypotheticalA | | $ 1,000.00 | $ 1,015.03 | $ 9.84 |
Class C | 1.97% | | | |
Actual | | $ 1,000.00 | $ 1,179.20 | $ 10.64 |
HypotheticalA | | $ 1,000.00 | $ 1,015.03 | $ 9.84 |
Small Cap Growth | .88% | | | |
Actual | | $ 1,000.00 | $ 1,186.20 | $ 4.77 |
HypotheticalA | | $ 1,000.00 | $ 1,020.43 | $ 4.41 |
Class F | .67% | | | |
Actual | | $ 1,000.00 | $ 1,187.00 | $ 3.63 |
HypotheticalA | | $ 1,000.00 | $ 1,021.47 | $ 3.36 |
Institutional Class | .90% | | | |
Actual | | $ 1,000.00 | $ 1,185.80 | $ 4.88 |
HypotheticalA | | $ 1,000.00 | $ 1,020.33 | $ 4.51 |
A 5% return per year before expenses
B Annualized expense ratio reflects expenses net of applicable fee waivers.
* Expenses are equal to each Class' annualized expense ratio, multiplied by the average account value over the period, multiplied by 181/365 (to reflect the one-half year period).
Annual Report
Investment Changes (Unaudited)
Top Ten Stocks as of July 31, 2013 |
| % of fund's
net assets | % of fund's net assets
6 months ago |
NIC, Inc. | 1.6 | 0.0 |
Grand Canyon Education, Inc. | 1.5 | 0.9 |
Aspen Technology, Inc. | 1.4 | 1.7 |
InvenSense, Inc. | 1.3 | 1.0 |
KAR Auction Services, Inc. | 1.3 | 0.0 |
CommVault Systems, Inc. | 1.3 | 1.5 |
FEI Co. | 1.3 | 0.9 |
Service Corp. International | 1.3 | 0.0 |
HSN, Inc. | 1.3 | 1.7 |
athenahealth, Inc. | 1.2 | 0.0 |
| 13.5 | |
Top Five Market Sectors as of July 31, 2013 |
| % of fund's
net assets | % of fund's net assets
6 months ago |
Information Technology | 25.8 | 19.2 |
Health Care | 20.9 | 18.8 |
Industrials | 17.0 | 15.5 |
Consumer Discretionary | 16.0 | 17.2 |
Financials | 8.4 | 7.3 |
Asset Allocation (% of fund's net assets) |
As of July 31, 2013* | As of January 31, 2013** |
| Stocks 97.9% | | | Stocks 95.5% | |
| Short-Term
Investments and
Net Other Assets
(Liabilities) 2.1% | | | Short-Term
Investments and
Net Other Assets
(Liabilities) 4.5% | |
* Foreign investments | 4.0% | | ** Foreign investments | 6.6% | |

Annual Report
Investments July 31, 2013
Showing Percentage of Net Assets
Common Stocks - 97.9% |
| Shares | | Value |
CONSUMER DISCRETIONARY - 16.0% |
Auto Components - 0.5% |
Tenneco, Inc. (a) | 250,000 | | $ 12,082,500 |
Diversified Consumer Services - 2.8% |
Grand Canyon Education, Inc. (a) | 987,953 | | 33,412,570 |
Service Corp. International | 1,510,000 | | 28,644,700 |
| | 62,057,270 |
Hotels, Restaurants & Leisure - 4.4% |
AFC Enterprises, Inc. (a) | 400,231 | | 14,728,501 |
Bloomin' Brands, Inc. | 500,000 | | 11,800,000 |
Jack in the Box, Inc. (a) | 550,000 | | 22,049,500 |
Papa John's International, Inc. (a) | 300,000 | | 20,058,000 |
Sonic Corp. (a) | 912,000 | | 14,017,440 |
Texas Roadhouse, Inc. Class A | 700,000 | | 17,108,000 |
| | 99,761,441 |
Household Durables - 1.0% |
Jarden Corp. (a) | 375,000 | | 17,051,250 |
Universal Electronics, Inc. (a) | 199,089 | | 6,137,914 |
| | 23,189,164 |
Internet & Catalog Retail - 1.3% |
HSN, Inc. | 475,000 | | 28,528,500 |
Leisure Equipment & Products - 1.0% |
Brunswick Corp. | 570,000 | | 21,517,500 |
Media - 0.9% |
Cinemark Holdings, Inc. | 700,000 | | 20,384,000 |
Specialty Retail - 1.3% |
Conn's, Inc. (a) | 194,947 | | 12,597,475 |
Tile Shop Holdings, Inc. (a) | 601,100 | | 17,089,273 |
| | 29,686,748 |
Textiles, Apparel & Luxury Goods - 2.8% |
G-III Apparel Group Ltd. (a) | 470,000 | | 24,186,200 |
Steven Madden Ltd. (a) | 451,400 | | 23,210,988 |
Wolverine World Wide, Inc. | 250,000 | | 14,377,500 |
| | 61,774,688 |
TOTAL CONSUMER DISCRETIONARY | | 358,981,811 |
Common Stocks - continued |
| Shares | | Value |
CONSUMER STAPLES - 2.4% |
Food Products - 1.8% |
J&J Snack Foods Corp. | 200,000 | | $ 15,936,000 |
WhiteWave Foods Co. (d) | 1,347,200 | | 25,179,168 |
| | 41,115,168 |
Personal Products - 0.6% |
Inter Parfums, Inc. | 392,925 | | 12,958,667 |
TOTAL CONSUMER STAPLES | | 54,073,835 |
ENERGY - 4.9% |
Energy Equipment & Services - 2.7% |
Atwood Oceanics, Inc. (a) | 185,000 | | 10,422,900 |
Dril-Quip, Inc. (a) | 170,000 | | 15,454,700 |
Essential Energy Services Ltd. | 2,232,100 | | 5,650,336 |
Western Energy Services Corp. | 1,330,000 | | 10,825,431 |
Xtreme Drilling & Coil Services Corp. (a)(e) | 4,100,000 | | 14,769,740 |
Zedi, Inc. (a)(e) | 7,178,500 | | 4,053,675 |
| | 61,176,782 |
Oil, Gas & Consumable Fuels - 2.2% |
EPL Oil & Gas, Inc. (a) | 300,000 | | 9,648,000 |
Rosetta Resources, Inc. (a) | 380,000 | | 17,331,800 |
Tesoro Logistics LP | 150,000 | | 8,023,500 |
Whitecap Resources, Inc. (d) | 1,100,000 | | 11,823,581 |
Whitecap Resources, Inc. rights 8/30/13 (a) | 100,000 | | 1,077,792 |
| | 47,904,673 |
TOTAL ENERGY | | 109,081,455 |
FINANCIALS - 8.4% |
Capital Markets - 0.6% |
Virtus Investment Partners, Inc. (a) | 73,084 | | 13,630,166 |
Commercial Banks - 2.1% |
BBCN Bancorp, Inc. | 1,340,000 | | 19,577,400 |
City National Corp. | 320,000 | | 22,249,600 |
Pacific Premier Bancorp, Inc. (a) | 385,000 | | 5,016,550 |
| | 46,843,550 |
Insurance - 3.7% |
Amerisafe, Inc. | 492,900 | | 17,611,317 |
FBL Financial Group, Inc. Class A | 148,825 | | 6,582,530 |
Primerica, Inc. | 480,000 | | 19,699,200 |
Common Stocks - continued |
| Shares | | Value |
FINANCIALS - continued |
Insurance - continued |
ProAssurance Corp. | 430,000 | | $ 23,017,900 |
StanCorp Financial Group, Inc. | 300,000 | | 15,927,000 |
| | 82,837,947 |
Real Estate Investment Trusts - 1.3% |
Cousins Properties, Inc. | 1,500,000 | | 15,375,000 |
Piedmont Office Realty Trust, Inc. Class A | 800,000 | | 14,472,000 |
| | 29,847,000 |
Real Estate Management & Development - 0.7% |
Howard Hughes Corp. (a) | 145,000 | | 15,835,450 |
TOTAL FINANCIALS | | 188,994,113 |
HEALTH CARE - 20.9% |
Biotechnology - 8.1% |
Alkermes PLC (a) | 175,500 | | 5,893,290 |
ARIAD Pharmaceuticals, Inc. (a) | 260,000 | | 4,830,800 |
Array BioPharma, Inc. (a) | 1,120,000 | | 7,459,200 |
Astex Pharmaceuticals, Inc. (a) | 1,250,000 | | 6,537,500 |
BioMarin Pharmaceutical, Inc. (a) | 120,000 | | 7,758,000 |
Celldex Therapeutics, Inc. (a) | 600,000 | | 12,288,000 |
ChemoCentryx, Inc. (a) | 250,000 | | 3,495,000 |
Chimerix, Inc. | 250,000 | | 5,685,000 |
Cubist Pharmaceuticals, Inc. (a) | 194,762 | | 12,139,515 |
Hyperion Therapeutics, Inc. | 200,000 | | 5,010,000 |
Infinity Pharmaceuticals, Inc. (a) | 228,236 | | 4,834,038 |
Insmed, Inc. (a)(d) | 666,400 | | 7,403,704 |
Isis Pharmaceuticals, Inc. (a) | 447,257 | | 12,903,364 |
Medivation, Inc. (a) | 160,000 | | 9,259,200 |
Novavax, Inc. (a) | 2,100,000 | | 5,649,000 |
OncoGenex Pharmaceuticals, Inc. (a) | 116,487 | | 1,138,078 |
Stemline Therapeutics, Inc. | 154,000 | | 4,333,560 |
Sunesis Pharmaceuticals, Inc. (a)(d) | 1,097,300 | | 5,574,284 |
Synageva BioPharma Corp. (a) | 170,000 | | 8,177,000 |
Synergy Pharmaceuticals, Inc. (a)(d) | 800,000 | | 3,600,000 |
TESARO, Inc. (a) | 148,800 | | 5,077,056 |
Theravance, Inc. (a)(d) | 469,000 | | 18,084,640 |
Threshold Pharmaceuticals, Inc. (a) | 1,072,634 | | 5,813,676 |
Vanda Pharmaceuticals, Inc. (a) | 500,000 | | 5,830,000 |
XOMA Corp. (a)(d) | 2,500,000 | | 13,575,000 |
| | 182,348,905 |
Common Stocks - continued |
| Shares | | Value |
HEALTH CARE - continued |
Health Care Equipment & Supplies - 4.7% |
Align Technology, Inc. (a) | 595,798 | | $ 25,643,146 |
ICU Medical, Inc. (a) | 191,000 | | 13,692,790 |
NxStage Medical, Inc. (a) | 272,400 | | 3,530,304 |
Sirona Dental Systems, Inc. (a) | 125,000 | | 8,825,000 |
Steris Corp. | 581,000 | | 26,156,620 |
Teleflex, Inc. | 189,300 | | 15,036,099 |
The Spectranetics Corp. (a) | 650,000 | | 11,713,000 |
| | 104,596,959 |
Health Care Providers & Services - 4.1% |
BioScrip, Inc. (a) | 1,100,000 | | 17,875,000 |
Centene Corp. (a) | 330,000 | | 18,305,100 |
MEDNAX, Inc. (a) | 122,900 | | 11,972,918 |
Molina Healthcare, Inc. (a)(d) | 600,000 | | 22,272,000 |
MWI Veterinary Supply, Inc. (a) | 143,400 | | 20,387,178 |
| | 90,812,196 |
Health Care Technology - 2.2% |
athenahealth, Inc. (a)(d) | 250,000 | | 27,987,500 |
Medidata Solutions, Inc. (a) | 233,948 | | 21,647,208 |
| | 49,634,708 |
Life Sciences Tools & Services - 0.8% |
Bruker BioSciences Corp. (a) | 1,010,000 | | 18,099,200 |
Pharmaceuticals - 1.0% |
Biodelivery Sciences International, Inc. (a)(d) | 1,257,084 | | 5,430,603 |
Pacira Pharmaceuticals, Inc. (a) | 220,000 | | 7,464,600 |
ViroPharma, Inc. (a) | 270,000 | | 9,266,400 |
| | 22,161,603 |
TOTAL HEALTH CARE | | 467,653,571 |
INDUSTRIALS - 17.0% |
Aerospace & Defense - 2.8% |
Esterline Technologies Corp. (a) | 150,000 | | 12,216,000 |
Teledyne Technologies, Inc. (a) | 305,700 | | 24,507,969 |
Triumph Group, Inc. | 330,000 | | 25,891,800 |
| | 62,615,769 |
Airlines - 0.7% |
Spirit Airlines, Inc. (a) | 500,000 | | 16,525,000 |
Building Products - 0.9% |
A.O. Smith Corp. | 480,688 | | 19,862,028 |
Common Stocks - continued |
| Shares | | Value |
INDUSTRIALS - continued |
Commercial Services & Supplies - 1.3% |
KAR Auction Services, Inc. | 1,140,000 | | $ 29,001,600 |
Construction & Engineering - 1.6% |
AECOM Technology Corp. (a) | 300,000 | | 10,170,000 |
EMCOR Group, Inc. | 350,000 | | 14,448,000 |
Tutor Perini Corp. (a) | 554,285 | | 10,963,757 |
| | 35,581,757 |
Electrical Equipment - 2.1% |
EnerSys | 480,000 | | 25,401,600 |
Generac Holdings, Inc. | 409,200 | | 17,738,820 |
Preformed Line Products Co. | 60,306 | | 4,399,323 |
| | 47,539,743 |
Machinery - 5.4% |
Actuant Corp. Class A | 473,100 | | 16,705,161 |
Harsco Corp. | 445,000 | | 11,463,200 |
Manitowoc Co., Inc. | 900,000 | | 18,477,000 |
Oshkosh Truck Corp. (a) | 250,000 | | 11,205,000 |
Standex International Corp. | 301,838 | | 17,817,497 |
TriMas Corp. (a) | 605,298 | | 22,414,185 |
Wabtec Corp. | 384,600 | | 22,329,876 |
| | 120,411,919 |
Professional Services - 0.0% |
Nihon M&A Center, Inc. | 612 | | 40,942 |
Trading Companies & Distributors - 2.2% |
Applied Industrial Technologies, Inc. | 316,818 | | 16,525,227 |
Watsco, Inc. | 229,000 | | 21,377,150 |
WESCO International, Inc. (a) | 150,000 | | 11,367,000 |
| | 49,269,377 |
TOTAL INDUSTRIALS | | 380,848,135 |
INFORMATION TECHNOLOGY - 25.8% |
Communications Equipment - 0.8% |
Plantronics, Inc. | 380,000 | | 17,666,200 |
Computers & Peripherals - 1.9% |
Cray, Inc. (a) | 1,032,200 | | 23,916,074 |
Electronics for Imaging, Inc. (a) | 670,000 | | 20,120,100 |
| | 44,036,174 |
Electronic Equipment & Components - 4.6% |
FEI Co. | 370,000 | | 28,656,500 |
Common Stocks - continued |
| Shares | | Value |
INFORMATION TECHNOLOGY - continued |
Electronic Equipment & Components - continued |
FLIR Systems, Inc. | 600,000 | | $ 19,482,000 |
InvenSense, Inc. (a)(d) | 1,720,000 | | 30,409,600 |
Neonode, Inc. (a)(d) | 1,617,122 | | 12,597,380 |
Parametric Sound Corp. (a)(d)(e) | 666,810 | | 11,382,447 |
| | 102,527,927 |
Internet Software & Services - 7.8% |
Angie's List, Inc. (a)(d) | 1,055,703 | | 23,246,580 |
Blucora, Inc. (a) | 621,143 | | 12,422,860 |
Cornerstone OnDemand, Inc. (a) | 530,000 | | 23,341,200 |
Demandware, Inc. (a)(d) | 353,439 | | 15,699,760 |
E2open, Inc. (d) | 1,176,594 | | 23,390,689 |
Move, Inc. (a) | 820,000 | | 11,389,800 |
NIC, Inc. | 1,893,704 | | 34,882,028 |
SciQuest, Inc. (a) | 294,372 | | 7,259,214 |
Stamps.com, Inc. (a) | 570,281 | | 22,731,401 |
| | 174,363,532 |
IT Services - 2.7% |
Euronet Worldwide, Inc. (a) | 300,000 | | 11,043,000 |
EVERTEC, Inc. | 600,000 | | 14,340,000 |
Genpact Ltd. | 1,050,000 | | 21,409,500 |
Sapient Corp. (a) | 1,000,000 | | 13,710,000 |
| | 60,502,500 |
Semiconductors & Semiconductor Equipment - 0.8% |
PDF Solutions, Inc. (a) | 886,056 | | 18,181,869 |
Software - 7.2% |
Aspen Technology, Inc. (a) | 962,200 | | 31,309,988 |
CommVault Systems, Inc. (a) | 340,000 | | 28,706,200 |
Destiny Media Technologies, Inc. (a) | 1,620,269 | | 3,596,997 |
Guidewire Software, Inc. (a) | 434,816 | | 19,027,548 |
Interactive Intelligence Group, Inc. (a) | 200,000 | | 11,360,000 |
Synopsys, Inc. (a) | 540,000 | | 20,001,600 |
Tyler Technologies, Inc. (a) | 308,725 | | 23,037,060 |
Ultimate Software Group, Inc. (a) | 175,000 | | 23,677,500 |
| | 160,716,893 |
TOTAL INFORMATION TECHNOLOGY | | 577,995,095 |
Common Stocks - continued |
| Shares | | Value |
MATERIALS - 2.0% |
Chemicals - 0.7% |
Cytec Industries, Inc. | 210,000 | | $ 16,359,000 |
Containers & Packaging - 0.7% |
Graphic Packaging Holding Co. (a) | 1,700,000 | | 14,620,000 |
Paper & Forest Products - 0.6% |
P.H. Glatfelter Co. | 550,000 | | 14,558,500 |
TOTAL MATERIALS | | 45,537,500 |
TELECOMMUNICATION SERVICES - 0.5% |
Diversified Telecommunication Services - 0.5% |
inContact, Inc. (a) | 1,200,000 | | 10,176,000 |
TOTAL COMMON STOCKS (Cost $1,768,172,071) |
2,193,341,515
|
Money Market Funds - 8.8% |
| | | |
Fidelity Cash Central Fund, 0.11% (b) | 75,334,289 | | 75,334,289 |
Fidelity Securities Lending Cash Central Fund, 0.12% (b)(c) | 121,749,605 | | 121,749,605 |
TOTAL MONEY MARKET FUNDS (Cost $197,083,894) |
197,083,894
|
TOTAL INVESTMENT PORTFOLIO - 106.7% (Cost $1,965,255,965) | | 2,390,425,409 |
NET OTHER ASSETS (LIABILITIES) - (6.7)% | | (150,019,314) |
NET ASSETS - 100% | $ 2,240,406,095 |
Legend |
(a) Non-income producing |
(b) Affiliated fund that is generally available only to investment companies and other accounts managed by Fidelity Investments. The rate quoted is the annualized seven-day yield of the fund at period end. A complete unaudited listing of the fund's holdings as of its most recent quarter end is available upon request. In addition, each Fidelity Central Fund's financial statements, which are not covered by the Fund's Report of Independent Registered Public Accounting Firm, are available on the SEC's website or upon request. |
(c) Investment made with cash collateral received from securities on loan. |
(d) Security or a portion of the security is on loan at period end. |
(e) Affiliated company |
Affiliated Central Funds |
Information regarding fiscal year to date income earned by the Fund from investments in Fidelity Central Funds is as follows: |
Fund | Income earned |
Fidelity Cash Central Fund | $ 109,835 |
Fidelity Securities Lending Cash Central Fund | 2,002,990 |
Total | $ 2,112,825 |
Other Affiliated Issuers |
An affiliated company is a company in which the Fund has ownership of at least 5% of the voting securities. Fiscal year to date transactions with companies which are or were affiliates are as follows: |
Affiliate | Value,
beginning of
period | Purchases | Sales
Proceeds | Dividend
Income | Value,
end of
period |
Neonode, Inc. | $ 6,969,000 | $ 5,854,520 | $ 5,076,631 | $ - | $ - |
Parametric Sound Corp. | 2,428,413 | 5,644,334 | 1,370,378 | - | 11,382,447 |
Telular Corp. | 4,715,000 | 3,371,313 | 10,661,344 | 259,000 | - |
US Home Systems, Inc. | 6,604,750 | - | 8,975,299 | - | - |
Xtreme Drilling & Coil Services Corp. (144A) | - | 178,443 | 201,743 | - | - |
Xtreme Drilling & Coil Services Corp. | 6,786,658 | - | - | - | 14,769,740 |
Zedi, Inc. | 3,905,172 | 2,997,316 | 1,070,631 | - | 4,053,675 |
Total | $ 31,408,993 | $ 18,045,926 | $ 27,356,026 | $ 259,000 | $ 30,205,862 |
Other Information |
All investments are categorized as Level 1 under the Fair Value Hierarchy. The inputs or methodology used for valuing securities may not be an indication of the risk associated with investing in those securities. For more information on valuation inputs, please refer to the Investment Valuation section in the accompanying Notes to Financial Statements. |
See accompanying notes which are an integral part of the financial statements.
Annual Report
Statement of Assets and Liabilities
| July 31, 2013 |
| | |
Assets | | |
Investment in securities, at value (including securities loaned of $120,973,392) - See accompanying schedule: Unaffiliated issuers (cost $1,744,211,544) | $ 2,163,135,653 | |
Fidelity Central Funds (cost $197,083,894) | 197,083,894 | |
Other affiliated issuers (cost $23,960,527) | 30,205,862 | |
Total Investments (cost $1,965,255,965) | | $ 2,390,425,409 |
Receivable for investments sold | | 35,301,694 |
Receivable for fund shares sold | | 2,852,120 |
Dividends receivable | | 415,342 |
Distributions receivable from Fidelity Central Funds | | 231,543 |
Other receivables | | 35,774 |
Total assets | | 2,429,261,882 |
| | |
Liabilities | | |
Payable for investments purchased | $ 62,714,735 | |
Payable for fund shares redeemed | 2,747,629 | |
Accrued management fee | 1,207,297 | |
Distribution and service plan fees payable | 58,359 | |
Other affiliated payables | 312,392 | |
Other payables and accrued expenses | 65,770 | |
Collateral on securities loaned, at value | 121,749,605 | |
Total liabilities | | 188,855,787 |
| | |
Net Assets | | $ 2,240,406,095 |
Net Assets consist of: | | |
Paid in capital | | $ 1,568,067,724 |
Accumulated undistributed net realized gain (loss) on investments and foreign currency transactions | | 247,173,320 |
Net unrealized appreciation (depreciation) on investments and assets and liabilities in foreign currencies | | 425,165,051 |
Net Assets | | $ 2,240,406,095 |
See accompanying notes which are an integral part of the financial statements.
Annual Report
Financial Statements - continued
Statement of Assets and Liabilities - continued
| July 31, 2013 |
| | |
Calculation of Maximum Offering Price Class A:
Net Asset Value and redemption price per share ($74,977,899 ÷ 3,812,892 shares) | | $ 19.66 |
| | |
Maximum offering price per share (100/94.25 of $19.66) | | $ 20.86 |
Class T:
Net Asset Value and redemption price per share ($34,686,382 ÷ 1,789,472 shares) | | $ 19.38 |
| | |
Maximum offering price per share (100/96.50 of $19.38) | | $ 20.08 |
Class B:
Net Asset Value and offering price per share ($3,485,507 ÷ 186,863 shares)A | | $ 18.65 |
| | |
Class C:
Net Asset Value and offering price per share ($32,755,709 ÷ 1,759,550 shares)A | | $ 18.62 |
| | |
Small Cap Growth:
Net Asset Value, offering price and redemption price per share ($1,315,659,224 ÷ 65,562,467 shares) | | $ 20.07 |
| | |
Class F:
Net Asset Value, offering price and redemption price per share ($727,683,474 ÷ 35,934,773 shares) | | $ 20.25 |
| | |
Institutional Class:
Net Asset Value, offering price and redemption price per share ($51,157,900 ÷ 2,545,203 shares) | | $ 20.10 |
A Redemption price per share is equal to net asset value less any applicable contingent deferred sales charge.
See accompanying notes which are an integral part of the financial statements.
Annual Report
Statement of Operations
| Year ended July 31, 2013 |
| | |
Investment Income | | |
Dividends (including $259,000 earned from other affiliated issuers) | | $ 17,072,216 |
Interest | | 880 |
Income from Fidelity Central Funds (including $2,002,990 from security lending) | | 2,112,825 |
Total income | | 19,185,921 |
| | |
Expenses | | |
Management fee
Basic fee | $ 14,065,171 | |
Performance adjustment | (1,254,701) | |
Transfer agent fees | 3,015,628 | |
Distribution and service plan fees | 609,395 | |
Accounting and security lending fees | 622,239 | |
Custodian fees and expenses | 73,226 | |
Independent trustees' compensation | 12,359 | |
Registration fees | 95,429 | |
Audit | 58,673 | |
Legal | 6,422 | |
Interest | 674 | |
Miscellaneous | 18,337 | |
Total expenses before reductions | 17,322,852 | |
Expense reductions | (322,128) | 17,000,724 |
Net investment income (loss) | | 2,185,197 |
Realized and Unrealized Gain (Loss) Net realized gain (loss) on: | | |
Investment securities: | | |
Unaffiliated issuers | 326,344,850 | |
Other affiliated issuers | 925,631 | |
Foreign currency transactions | 20,901 | |
Total net realized gain (loss) | | 327,291,382 |
Change in net unrealized appreciation (depreciation) on: Investment securities | 244,672,948 | |
Assets and liabilities in foreign currencies | 6,602 | |
Total change in net unrealized appreciation (depreciation) | | 244,679,550 |
Net gain (loss) | | 571,970,932 |
Net increase (decrease) in net assets resulting from operations | | $ 574,156,129 |
See accompanying notes which are an integral part of the financial statements.
Annual Report
Financial Statements - continued
Statement of Changes in Net Assets
| Year ended
July 31,
2013 | Year ended
July 31,
2012 |
Increase (Decrease) in Net Assets | | |
Operations | | |
Net investment income (loss) | $ 2,185,197 | $ (2,581,285) |
Net realized gain (loss) | 327,291,382 | 84,159,524 |
Change in net unrealized appreciation (depreciation) | 244,679,550 | (104,802,589) |
Net increase (decrease) in net assets resulting
from operations | 574,156,129 | (23,224,350) |
Distributions to shareholders from net realized gain | (122,560,447) | (34,799,429) |
Share transactions - net increase (decrease) | (58,479,174) | 61,802,637 |
Redemption fees | 117,383 | 255,125 |
Total increase (decrease) in net assets | 393,233,891 | 4,033,983 |
| | |
Net Assets | | |
Beginning of period | 1,847,172,204 | 1,843,138,221 |
End of period (including accumulated net investment loss of $0 and accumulated net investment loss of $1,442,758, respectively) | $ 2,240,406,095 | $ 1,847,172,204 |
See accompanying notes which are an integral part of the financial statements.
Annual Report
Financial Highlights - Class A
Years ended July 31, | 2013 | 2012 | 2011 | 2010 | 2009 |
Selected Per-Share Data | | | | | |
Net asset value, beginning of period | $ 15.87 | $ 16.42 | $ 12.66 | $ 10.79 | $ 13.20 |
Income from Investment Operations | | | | | |
Net investment income (loss) C | (.04) | (.07) F | (.07) G | (.07) H | (.06) |
Net realized and unrealized gain (loss) | 4.87 | (.16) | 3.84 | 1.94 | (2.35) |
Total from investment operations | 4.83 | (.23) | 3.77 | 1.87 | (2.41) |
Distributions from net realized gain | (1.04) | (.32) | (.01) I | - | - |
Redemption fees added to paid in capital C, K | - | - | - | - | - |
Net asset value, end of period | $ 19.66 | $ 15.87 | $ 16.42 | $ 12.66 | $ 10.79 |
Total Return A, B | 32.20% | (1.14)% | 29.78% | 17.33% | (18.26)% |
Ratios to Average Net Assets D, J | | | | | |
Expenses before reductions | 1.24% | 1.35% | 1.25% | 1.35% | 1.33% |
Expenses net of fee waivers, if any | 1.24% | 1.35% | 1.25% | 1.35% | 1.33% |
Expenses net of all reductions | �� 1.22% | 1.34% | 1.23% | 1.34% | 1.33% |
Net investment income (loss) | (.26)% | (.49)% F | (.47)% G | (.56)% H | (.64)% |
Supplemental Data | | | | | |
Net assets, end of period (000 omitted) | $ 74,978 | $ 59,684 | $ 67,272 | $ 50,620 | $ 40,211 |
Portfolio turnover rate E | 142% | 150% | 106% | 105% | 150% |
A Total returns would have been lower if certain expenses had not been reduced during the applicable periods shown.
B Total returns do not include the effect of the sales charges.
C Calculated based on average shares outstanding during the period.
D Fees and expenses of any underlying Fidelity Central Funds are not included in the Fund's expense ratio. The Fund indirectly bears its proportionate share of the expenses of any underlying Fidelity Central Funds.
E Amount does not include the portfolio activity of any underlying Fidelity Central Funds.
F Investment income per share reflects a large, non-recurring dividend which amounted to $.01 per share. Excluding this non-recurring dividend, the ratio of net investment income (loss) to average net assets would have been (.57)%.
G Investment income per share reflects a large, non-recurring dividend which amounted to $.02 per share. Excluding this non-recurring dividend, the ratio of net investment income (loss) to average net assets would have been (.61)%.
H Investment income per share reflects a large, non-recurring dividend which amounted to $.01 per share. Excluding this non-recurring dividend, the ratio of net investment income (loss) to average net assets would have been (.67)%.
I The amounts shown reflect certain reclassifications related to book to tax differences that were made in the year shown.
J Expense ratios reflect operating expenses of the class. Expenses before reductions do not reflect amounts reimbursed by the investment adviser or reductions from brokerage service arrangements or reductions from other expense offset arrangements and do not represent the amount paid by the class during periods when reimbursements or reductions occur. Expenses net of fee waivers reflect expenses after reimbursement by the investment adviser but prior to reductions from brokerage service arrangements or other expense offset arrangements. Expenses net of all reductions represent the net expenses paid by the class.
K Amount represents less than $.01 per share.
See accompanying notes which are an integral part of the financial statements.
Annual Report
Financial Highlights - Class T
Years ended July 31, | 2013 | 2012 | 2011 | 2010 | 2009 |
Selected Per-Share Data | | | | | |
Net asset value, beginning of period | $ 15.68 | $ 16.27 | $ 12.57 | $ 10.74 | $ 13.17 |
Income from Investment Operations | | | | | |
Net investment income (loss) C | (.09) | (.11) F | (.11) G | (.10) H | (.09) |
Net realized and unrealized gain (loss) | 4.82 | (.16) | 3.81 | 1.93 | (2.34) |
Total from investment operations | 4.73 | (.27) | 3.70 | 1.83 | (2.43) |
Distributions from net realized gain | (1.03) | (.32) | - | - | - |
Redemption fees added to paid in capital C, J | - | - | - | - | - |
Net asset value, end of period | $ 19.38 | $ 15.68 | $ 16.27 | $ 12.57 | $ 10.74 |
Total Return A, B | 31.87% | (1.41)% | 29.44% | 17.04% | (18.45)% |
Ratios to Average Net Assets D, I | | | | | |
Expenses before reductions | 1.49% | 1.61% | 1.50% | 1.61% | 1.60% |
Expenses net of fee waivers, if any | 1.49% | 1.61% | 1.50% | 1.61% | 1.60% |
Expenses net of all reductions | 1.48% | 1.60% | 1.49% | 1.60% | 1.59% |
Net investment income (loss) | (.52)% | (.74)% F | (.73)% G | (.82)% H | (.91)% |
Supplemental Data | | | | | |
Net assets, end of period (000 omitted) | $ 34,686 | $ 27,658 | $ 30,764 | $ 23,930 | $ 21,533 |
Portfolio turnover rate E | 142% | 150% | 106% | 105% | 150% |
A Total returns would have been lower if certain expenses had not been reduced during the applicable periods shown.
B Total returns do not include the effect of the sales charges.
C Calculated based on average shares outstanding during the period.
D Fees and expenses of any underlying Fidelity Central Funds are not included in the Fund's expense ratio. The Fund indirectly bears its proportionate share of the expenses of any underlying Fidelity Central Funds.
E Amount does not include the portfolio activity of any underlying Fidelity Central Funds.
F Investment income per share reflects a large, non-recurring dividend which amounted to $.01 per share. Excluding this non-recurring dividend, the ratio of net investment income (loss) to average net assets would have been (.83)%.
G Investment income per share reflects a large, non-recurring dividend which amounted to $.02 per share. Excluding this non-recurring dividend, the ratio of net investment income (loss) to average net assets would have been (.86)%.
H Investment income per share reflects a large, non-recurring dividend which amounted to $.01 per share. Excluding this non-recurring dividend, the ratio of net investment income (loss) to average net assets would have been (.93)%.
I Expense ratios reflect operating expenses of the class. Expenses before reductions do not reflect amounts reimbursed by the investment adviser or reductions from brokerage service arrangements or reductions from other expense offset arrangements and do not represent the amount paid by the class during periods when reimbursements or reductions occur. Expenses net of fee waivers reflect expenses after reimbursement by the investment adviser but prior to reductions from brokerage service arrangements or other expense offset arrangements. Expenses net of all reductions represent the net expenses paid by the class.
J Amount represents less than $.01 per share.
See accompanying notes which are an integral part of the financial statements.
Annual Report
Financial Highlights - Class B
Years ended July 31, | 2013 | 2012 | 2011 | 2010 | 2009 |
Selected Per-Share Data | | | | | |
Net asset value, beginning of period | $ 15.19 | $ 15.86 | $ 12.30 | $ 10.57 | $ 13.03 |
Income from Investment Operations | | | | | |
Net investment income (loss) C | (.16) | (.18) F | (.18) G | (.16) H | (.13) |
Net realized and unrealized gain (loss) | 4.64 | (.17) | 3.74 | 1.89 | (2.33) |
Total from investment operations | 4.48 | (.35) | 3.56 | 1.73 | (2.46) |
Distributions from net realized gain | (1.02) | (.32) | - | - | - |
Redemption fees added to paid in capital C, J | - | - | - | - | - |
Net asset value, end of period | $ 18.65 | $ 15.19 | $ 15.86 | $ 12.30 | $ 10.57 |
Total Return A, B | 31.25% | (1.96)% | 28.94% | 16.37% | (18.88)% |
Ratios to Average Net Assets D, I | | | | | |
Expenses before reductions | 1.99% | 2.10% | 2.00% | 2.11% | 2.08% |
Expenses net of fee waivers, if any | 1.99% | 2.10% | 2.00% | 2.11% | 2.08% |
Expenses net of all reductions | 1.97% | 2.09% | 1.98% | 2.09% | 2.08% |
Net investment income (loss) | (1.01)% | (1.23)% F | (1.22)% G | (1.32)% H | (1.39)% |
Supplemental Data | | | | | |
Net assets, end of period (000 omitted) | $ 3,486 | $ 4,123 | $ 5,295 | $ 5,142 | $ 4,171 |
Portfolio turnover rate E | 142% | 150% | 106% | 105% | 150% |
A Total returns would have been lower if certain expenses had not been reduced during the applicable periods shown.
B Total returns do not include the effect of the contingent deferred sales charge.
C Calculated based on average shares outstanding during the period.
D Fees and expenses of any underlying Fidelity Central Funds are not included in the Fund's expense ratio. The Fund indirectly bears its proportionate share of the expenses of any underlying Fidelity Central Funds.
E Amount does not include the portfolio activity of any underlying Fidelity Central Funds.
F Investment income per share reflects a large, non-recurring dividend which amounted to $.01 per share. Excluding this non-recurring dividend, the ratio of net investment income (loss) to average net assets would have been (1.32)%.
G Investment income per share reflects a large, non-recurring dividend which amounted to $.02 per share. Excluding this non-recurring dividend, the ratio of net investment income (loss) to average net assets would have been (1.36)%.
H Investment income per share reflects a large, non-recurring dividend which amounted to $.01 per share. Excluding this non-recurring dividend, the ratio of net investment income (loss) to average net assets would have been (1.42)%.
I Expense ratios reflect operating expenses of the class. Expenses before reductions do not reflect amounts reimbursed by the investment adviser or reductions from brokerage service arrangements or reductions from other expense offset arrangements and do not represent the amount paid by the class during periods when reimbursements or reductions occur. Expenses net of fee waivers reflect expenses after reimbursement by the investment adviser but prior to reductions from brokerage service arrangements or other expense offset arrangements. Expenses net of all reductions represent the net expenses paid by the class.
J Amount represents less than $.01 per share.
See accompanying notes which are an integral part of the financial statements.
Annual Report
Financial Highlights - Class C
Years ended July 31, | 2013 | 2012 | 2011 | 2010 | 2009 |
Selected Per-Share Data | | | | | |
Net asset value, beginning of period | $ 15.16 | $ 15.83 | $ 12.28 | $ 10.55 | $ 13.00 |
Income from Investment Operations | | | | | |
Net investment income (loss) C | (.16) | (.18) F | (.18) G | (.16) H | (.13) |
Net realized and unrealized gain (loss) | 4.64 | (.17) | 3.73 | 1.89 | (2.32) |
Total from investment operations | 4.48 | (.35) | 3.55 | 1.73 | (2.45) |
Distributions from net realized gain | (1.02) | (.32) | - | - | - |
Redemption fees added to paid in capital C, J | - | - | - | - | - |
Net asset value, end of period | $ 18.62 | $ 15.16 | $ 15.83 | $ 12.28 | $ 10.55 |
Total Return A, B | 31.32% | (1.96)% | 28.91% | 16.40% | (18.85)% |
Ratios to Average Net Assets D, I | | | | | |
Expenses before reductions | 1.99% | 2.10% | 2.00% | 2.11% | 2.08% |
Expenses net of fee waivers, if any | 1.99% | 2.10% | 2.00% | 2.11% | 2.08% |
Expenses net of all reductions | 1.97% | 2.09% | 1.98% | 2.09% | 2.07% |
Net investment income (loss) | (1.01)% | (1.24)% F | (1.22)% G | (1.32)% H | (1.39)% |
Supplemental Data | | | | | |
Net assets, end of period (000 omitted) | $ 32,756 | $ 24,683 | $ 24,914 | $ 18,091 | $ 14,267 |
Portfolio turnover rate E | 142% | 150% | 106% | 105% | 150% |
A Total returns would have been lower if certain expenses had not been reduced during the applicable periods shown.
B Total returns do not include the effect of the contingent deferred sales charge.
C Calculated based on average shares outstanding during the period.
D Fees and expenses of any underlying Fidelity Central Funds are not included in the Fund's expense ratio. The Fund indirectly bears its proportionate share of the expenses of any underlying Fidelity Central Funds.
E Amount does not include the portfolio activity of any underlying Fidelity Central Funds.
F Investment income per share reflects a large, non-recurring dividend which amounted to $.01 per share. Excluding this non-recurring dividend, the ratio of net investment income (loss) to average net assets would have been (1.32)%.
G Investment income per share reflects a large, non-recurring dividend which amounted to $.02 per share. Excluding this non-recurring dividend, the ratio of net investment income (loss) to average net assets would have been (1.36)%.
H Investment income per share reflects a large, non-recurring dividend which amounted to $.01 per share. Excluding this non-recurring dividend, the ratio of net investment income (loss) to average net assets would have been (1.42)%.
I Expense ratios reflect operating expenses of the class. Expenses before reductions do not reflect amounts reimbursed by the investment adviser or reductions from brokerage service arrangements or reductions from other expense offset arrangements and do not represent the amount paid by the class during periods when reimbursements or reductions occur. Expenses net of fee waivers reflect expenses after reimbursement by the investment adviser but prior to reductions from brokerage service arrangements or other expense offset arrangements. Expenses net of all reductions represent the net expenses paid by the class.
J Amount represents less than $.01 per share.
See accompanying notes which are an integral part of the financial statements.
Annual Report
Financial Highlights - Small Cap Growth
Years ended July 31, | 2013 | 2012 | 2011 | 2010 | 2009 |
Selected Per-Share Data | | | | | |
Net asset value, beginning of period | $ 16.14 | $ 16.65 | $ 12.81 | $ 10.89 | $ 13.29 |
Income from Investment Operations | | | | | |
Net investment income (loss) B | .01 | (.03) E | (.03) F | (.04) G | (.04) |
Net realized and unrealized gain (loss) | 4.98 | (.16) | 3.90 | 1.96 | (2.36) |
Total from investment operations | 4.99 | (.19) | 3.87 | 1.92 | (2.40) |
Distributions from net realized gain | (1.06) | (.32) | (.03) H | - | - |
Redemption fees added to paid in capital B, J | - | - | - | - | - |
Net asset value, end of period | $ 20.07 | $ 16.14 | $ 16.65 | $ 12.81 | $ 10.89 |
Total Return A | 32.74% | (.88)% | 30.20% | 17.63% | (18.06)% |
Ratios to Average Net Assets C, I | | | | |
Expenses before reductions | .90% | 1.03% | .95% | 1.08% | 1.08% |
Expenses net of fee waivers, if any | .90% | 1.03% | .95% | 1.08% | 1.08% |
Expenses net of all reductions | .88% | 1.02% | .93% | 1.07% | 1.08% |
Net investment income (loss) | .08% | (.16)% E | (.17)% F | (.29)% G | (.39)% |
Supplemental Data | | | | | |
Net assets, end of period (000 omitted) | $ 1,315,659 | $ 1,166,101 | $ 1,382,688 | $ 1,204,818 | $ 1,085,184 |
Portfolio turnover rate D | 142% | 150% | 106% | 105% | 150% |
A Total returns would have been lower if certain expenses had not been reduced during the applicable periods shown.
B Calculated based on average shares outstanding during the period.
C Fees and expenses of any underlying Fidelity Central Funds are not included in the Fund's expense ratio. The Fund indirectly bears its proportionate share of the expenses of any underlying Fidelity Central Funds.
D Amount does not include the portfolio activity of any underlying Fidelity Central Funds.
E Investment income per share reflects a large, non-recurring dividend which amounted to $.01 per share. Excluding this non-recurring dividend, the ratio of net investment income (loss) to average net assets would have been (.25)%.
F Investment income per share reflects a large, non-recurring dividend which amounted to $.02 per share. Excluding this non-recurring dividend, the ratio of net investment income (loss) to average net assets would have been (.31)%.
G Investment income per share reflects a large, non-recurring dividend which amounted to $.01 per share. Excluding this non-recurring dividend, the ratio of net investment income (loss) to average net assets would have been (.39)%.
H The amounts shown reflect certain reclassifications related to book to tax differences that were made in the year shown.
I Expense ratios reflect operating expenses of the class. Expenses before reductions do not reflect amounts reimbursed by the investment adviser or reductions from brokerage service arrangements or reductions from other expense offset arrangements and do not represent the amount paid by the class during periods when reimbursements or reductions occur. Expenses net of fee waivers reflect expenses after reimbursement by the investment adviser but prior to reductions from brokerage service arrangements or other expense offset arrangements. Expenses net of all reductions represent the net expenses paid by the class.
J Amount represents less than $.01 per share.
See accompanying notes which are an integral part of the financial statements.
Annual Report
Financial Highlights - Class F
Years ended July 31, | 2013 | 2012 | 2011 | 2010 | 2009 K |
Selected Per-Share Data | | | | | |
Net asset value, beginning of period | $ 16.26 | $ 16.73 | $ 12.85 | $ 10.90 | $ 10.03 |
Income from Investment Operations | | | | | |
Net investment income (loss) D | .05 | .01 H | .01 I | - J, N | (.01) |
Net realized and unrealized gain (loss) | 5.02 | (.16) | 3.91 | 1.95 | .88 |
Total from investment operations | 5.07 | (.15) | 3.92 | 1.95 | .87 |
Distributions from net realized gain | (1.08) | (.32) | (.04) L | - | - |
Redemption fees added to paid in capital D, N | - | - | - | - | - |
Net asset value, end of period | $ 20.25 | $ 16.26 | $ 16.73 | $ 12.85 | $ 10.90 |
Total Return B, C | 33.00% | (.64)% | 30.56% | 17.89% | 8.67% |
Ratios to Average Net Assets E, M | | | | | |
Expenses before reductions | .69% | .80% | .70% | .78% | .74% A |
Expenses net of fee waivers, if any | .69% | .80% | .70% | .78% | .74% A |
Expenses net of all reductions | .67% | .79% | .68% | .77% | .73% A |
Net investment income (loss) | .29% | .07% H | .08% I | -% G, J | (.54)% A |
Supplemental Data | | | | | |
Net assets, end of period (000 omitted) | $ 727,683 | $ 528,229 | $ 290,765 | $ 106,941 | $ 159 |
Portfolio turnover rate F | 142% | 150% | 106% | 105% | 150% |
A Annualized
B Total returns for periods of less than one year are not annualized.
C Total returns would have been lower if certain expenses had not been reduced during the applicable periods shown.
D Calculated based on average shares outstanding during the period.
E Fees and expenses of any underlying Fidelity Central Funds are not included in the Fund's expense ratio. The Fund indirectly bears its proportionate share of the expenses of any underlying Fidelity Central Funds.
F Amount does not include the portfolio activity of any underlying Fidelity Central Funds.
G Amount represents less than .01%.
H Investment income per share reflects a large, non-recurring dividend which amounted to $.01 per share. Excluding this non-recurring dividend, the ratio of net investment income (loss) to average net assets would have been (.02)%.
I Investment income per share reflects a large, non-recurring dividend which amounted to $.02 per share. Excluding this non-recurring dividend, the ratio of net investment income (loss) to average net assets would have been (.06)%.
J Investment income per share reflects a large, non-recurring dividend which amounted to $.01 per share. Excluding this non-recurring dividend, the ratio of net investment income (loss) to average net assets would have been (.10)%.
K For the period June 26, 2009 (commencement of sale of shares) to July 31, 2009.
L The amounts shown reflect certain reclassifications related to book to tax differences that were made in the year shown.
M Expense ratios reflect operating expenses of the class. Expenses before reductions do not reflect amounts reimbursed by the investment adviser or reductions from brokerage service arrangements or reductions from other expense offset arrangements and do not represent the amount paid by the class during periods when reimbursements or reductions occur. Expense ratios before reductions for start-up periods may not be representative of longer-term operating periods. Expenses net of fee waivers reflect expenses after reimbursement by the investment adviser but prior to reductions from brokerage service arrangements or other expense offset arrangements. Expenses net of all reductions represent the net expenses paid by the class.
N Amount represents less than $.01 per share.
See accompanying notes which are an integral part of the financial statements.
Annual Report
Financial Highlights - Institutional Class
Years ended July 31, | 2013 | 2012 | 2011 | 2010 | 2009 |
Selected Per-Share Data | | | | | |
Net asset value, beginning of period | $ 16.17 | $ 16.68 | $ 12.83 | $ 10.91 | $ 13.30 |
Income from Investment Operations | | | | | |
Net investment income (loss) B | .01 | (.03) E | (.03) F | (.03) G | (.03) |
Net realized and unrealized gain (loss) | 4.98 | (.16) | 3.91 | 1.95 | (2.36) |
Total from investment operations | 4.99 | (.19) | 3.88 | 1.92 | (2.39) |
Distributions from net realized gain | (1.06) | (.32) | (.03) H | - | - |
Redemption fees added to paid in capital B, J | - | - | - | - | - |
Net asset value, end of period | $ 20.10 | $ 16.17 | $ 16.68 | $ 12.83 | $ 10.91 |
Total Return A | 32.65% | (.88)% | 30.24% | 17.60% | (17.97)% |
Ratios to Average Net Assets C, I | | | | | |
Expenses before reductions | .92% | 1.06% | .94% | 1.03% | 1.05% |
Expenses net of fee waivers, if any | .92% | 1.06% | .94% | 1.03% | 1.05% |
Expenses net of all reductions | .91% | 1.05% | .93% | 1.02% | 1.04% |
Net investment income (loss) | .06% | (.19)% E | (.17)% F | (.24)% G | (.36)% |
Supplemental Data | | | | | |
Net assets, end of period (000 omitted) | $ 51,158 | $ 36,694 | $ 41,440 | $ 25,650 | $ 19,204 |
Portfolio turnover rate D | 142% | 150% | 106% | 105% | 150% |
A Total returns would have been lower if certain expenses had not been reduced during the applicable periods shown.
B Calculated based on average shares outstanding during the period.
C Fees and expenses of any underlying Fidelity Central Funds are not included in the Fund's expense ratio. The Fund indirectly bears its proportionate share of the expenses of any underlying Fidelity Central Funds.
D Amount does not include the portfolio activity of any underlying Fidelity Central Funds.
E Investment income per share reflects a large, non-recurring dividend which amounted to $.01 per share. Excluding this non-recurring dividend, the ratio of net investment income (loss) to average net assets would have been (.28)%.
F Investment income per share reflects a large, non-recurring dividend which amounted to $.02 per share. Excluding this non-recurring dividend, the ratio of net investment income (loss) to average net assets would have been (.30)%.
G Investment income per share reflects a large, non-recurring dividend which amounted to $.01 per share. Excluding this non-recurring dividend, the ratio of net investment income (loss) to average net assets would have been (.34)%.
H The amounts shown reflect certain reclassifications related to book to tax differences that were made in the year shown.
I Expense ratios reflect operating expenses of the class. Expenses before reductions do not reflect amounts reimbursed by the investment adviser or reductions from brokerage service arrangements or reductions from other expense offset arrangements and do not represent the amount paid by the class during periods when reimbursements or reductions occur. Expenses net of fee waivers reflect expenses after reimbursement by the investment adviser but prior to reductions from brokerage service arrangements or other expense offset arrangements. Expenses net of all reductions represent the net expenses paid by the class.
J Amount represents less than $.01 per share.
See accompanying notes which are an integral part of the financial statements.
Annual Report
Notes to Financial Statements
For the period ended July 31, 2013
1. Organization.
Fidelity Small Cap Growth Fund (the Fund) is a fund of Fidelity Securities Fund (the Trust) and is authorized to issue an unlimited number of shares. The Trust is registered under the Investment Company Act of 1940, as amended (the 1940 Act), as an open-end management investment company organized as a Massachusetts business trust. The Fund offers Class A, Class T, Class C, Small Cap Growth, Class F and Institutional Class shares, each of which, along with Class B shares, has equal rights as to assets and voting privileges. Class B shares are closed to new accounts and additional purchases, except for exchanges and reinvestments. Each class has exclusive voting rights with respect to matters that affect that class. Class F shares of the Fund are only available for purchase by mutual funds for which Fidelity Management & Research Company (FMR) or an affiliate serves as investment manager. Class B shares will automatically convert to Class A shares after a holding period of seven years from the initial date of purchase.
2. Investments in Fidelity Central Funds.
The Fund invests in Fidelity Central Funds, which are open-end investment companies generally available only to other investment companies and accounts managed by FMR and its affiliates. The Fund's Schedule of Investments lists each of the Fidelity Central Funds held as of period end, if any, as an investment of the Fund, but does not include the underlying holdings of each Fidelity Central Fund. As an Investing Fund, the Fund indirectly bears its proportionate share of the expenses of the underlying Fidelity Central Funds.
The Money Market Central Funds seek preservation of capital and current income and are managed by Fidelity Investments Money Management, Inc. (FIMM), an affiliate of FMR.
A complete unaudited list of holdings for each Fidelity Central Fund is available upon request or at the Securities and Exchange Commission (the SEC) website at www.sec.gov. In addition, the financial statements of the Fidelity Central Funds, which are not covered by the Fund's Report of Independent Registered Public Accounting Firm, are available on the SEC website or upon request.
3. Significant Accounting Policies.
The financial statements have been prepared in conformity with accounting principles generally accepted in the United States of America (GAAP), which require management to make certain estimates and assumptions at the date of the financial statements. Actual results could differ from those estimates. Subsequent events, if any, through the date that the financial statements were issued have been evaluated in the preparation of the financial statements. The following summarizes the significant accounting policies of the Fund:
Annual Report
Notes to Financial Statements - continued
3. Significant Accounting Policies - continued
Investment Valuation. Investments are valued as of 4:00 p.m. Eastern time on the last calendar day of the period. In accordance with valuation policies and procedures approved by the Board of Trustees (the Board), the Fund attempts to obtain prices from one or more third party pricing vendors or brokers to value its investments. When current market prices, quotations or currency exchange rates are not readily available or reliable, investments will be fair valued in good faith by the FMR Fair Value Committee (the Committee), in accordance with procedures adopted by the Board. Factors used in determining fair value vary by investment type and may include market or investment specific events. The frequency with which these procedures are used cannot be predicted and they may be utilized to a significant extent. The Committee oversees the Fund's valuation policies and procedures and is responsible for approving and reporting to the Board all fair value determinations.
The Fund categorizes the inputs to valuation techniques used to value its investments into a disclosure hierarchy consisting of three levels as shown below:
Level 1 - quoted prices in active markets for identical investments
Level 2 - other significant observable inputs (including quoted prices for similar investments, interest rates, prepayment speeds, etc.)
Level 3 - unobservable inputs (including the Fund's own assumptions based on the best information available)
Valuation techniques used to value the Fund's investments by major category are as follows:
Equity securities, including restricted securities, for which market quotations are readily available, are valued at the last reported sale price or official closing price as reported by a third party pricing vendor on the primary market or exchange on which they are traded and are categorized as Level 1 in the hierarchy. In the event there were no sales during the day or closing prices are not available, securities are valued at the last quoted bid price or may be valued using the last available price and are generally categorized as Level 2 in the hierarchy. For foreign equity securities, when market or security specific events arise, comparisons to the valuation of American Depositary Receipts (ADRs), futures contracts, Exchange-Traded Funds (ETFs) and certain indexes as well as quoted prices for similar securities may be used and would be categorized as Level 2 in the hierarchy. Utilizing these techniques may result in transfers between Level 1 and Level 2.
Investments in open-end mutual funds, including the Fidelity Central Funds, are valued at their closing net asset value (NAV) each business day and are categorized as Level 1 in the hierarchy.
Annual Report
3. Significant Accounting Policies - continued
Investment Valuation - continued
Changes in valuation techniques may result in transfers in or out of an assigned level within the disclosure hierarchy.
Foreign Currency. The Fund may use foreign currency contracts to facilitate transactions in foreign-denominated securities. Gains and losses from these transactions may arise from changes in the value of the foreign currency or if the counterparties do not perform under the contracts' terms.
Foreign-denominated assets, including investment securities, and liabilities are translated into U.S. dollars at the exchange rates at period end. Purchases and sales of investment securities, income and dividends received and expenses denominated in foreign currencies are translated into U.S. dollars at the exchange rate in effect on the transaction date.
The effects of exchange rate fluctuations on investments are included with the net realized and unrealized gain (loss) on investment securities. Other foreign currency transactions resulting in realized and unrealized gain (loss) are disclosed separately.
Investment Transactions and Income. For financial reporting purposes, the Fund's investment holdings and NAV include trades executed through the end of the last business day of the period. The NAV per share for processing shareholder transactions is calculated as of the close of business of the New York Stock Exchange (NYSE), normally 4:00 p.m. Eastern time and includes trades executed through the end of the prior business day. Gains and losses on securities sold are determined on the basis of identified cost and may include proceeds received from litigation. Dividend income is recorded on the ex-dividend date, except for certain dividends from foreign securities where the ex-dividend date may have passed, which are recorded as soon as the Fund is informed of the ex-dividend date. Non-cash dividends included in dividend income, if any, are recorded at the fair market value of the securities received. Distributions received on securities that represent a return of capital or capital gain are recorded as a reduction of cost of investments and/or as a realized gain. Subsequent to ex-dividend date the Fund determines the components of these distributions, based upon receipt of tax filings or other correspondence relating to the underlying investment. Interest income and distributions from the Fidelity Central Funds are accrued as earned. Interest income includes coupon interest and amortization of premium and accretion of discount on debt securities. Investment income is recorded net of foreign taxes withheld where recovery of such taxes is uncertain.
Class Allocations and Expenses. Investment income, realized and unrealized capital gains and losses, common expenses of the Fund, and certain fund-level expense reductions, if any, are allocated on a pro-rata basis to each class based on the relative net
Annual Report
Notes to Financial Statements - continued
3. Significant Accounting Policies - continued
Class Allocations and Expenses - continued
assets of each class to the total net assets of the Fund. Each class differs with respect to transfer agent and distribution and service plan fees incurred. Certain expense reductions may also differ by class. Expenses directly attributable to a fund are charged to that fund. Expenses attributable to more than one fund are allocated among the respective funds on the basis of relative net assets or other appropriate methods. Expense estimates are accrued in the period to which they relate and adjustments are made when actual amounts are known.
Income Tax Information and Distributions to Shareholders. Each year, the Fund intends to qualify as a regulated investment company under Subchapter M of the Internal Revenue Code, including distributing substantially all of its taxable income and realized gains. As a result, no provision for income taxes is required. As of July 31, 2013, the Fund did not have any unrecognized tax benefits in the financial statements; nor is the Fund aware of any tax positions for which it is reasonably possible that the total amounts of unrecognized tax benefits will significantly change in the next twelve months. The Fund files a U.S. federal tax return, in addition to state and local tax returns as required. A fund's federal income tax returns are subject to examination by the Internal Revenue Service (IRS) for a period of three fiscal years after they are filed. State and local tax returns may be subject to examination for an additional fiscal year depending on the jurisdiction. Foreign taxes are provided for based on the Fund's understanding of the tax rules and rates that exist in the foreign markets in which it invests.
Distributions are declared and recorded on the ex-dividend date. Income dividends and capital gain distributions are declared separately for each class. Income and capital gain distributions are determined in accordance with income tax regulations, which may differ from GAAP. In addition, the Fund claimed a portion of the payment made to redeeming shareholders as a distribution for income tax purposes.
Capital accounts within the financial statements are adjusted for permanent book-tax differences. These adjustments have no impact on net assets or the results of operations. Temporary book-tax differences will reverse in a subsequent period.
Book-tax differences are primarily due to foreign currency transactions, partnerships and losses deferred due to wash sales and excise tax regulations.
Annual Report
3. Significant Accounting Policies - continued
Income Tax Information and Distributions to Shareholders - continued
The federal tax cost of investment securities and unrealized appreciation (depreciation) as of period end were as follows:
Gross unrealized appreciation | $ 440,572,794 |
Gross unrealized depreciation | (17,106,671) |
Net unrealized appreciation (depreciation) on securities and other investments | $ 423,466,123 |
| |
Tax Cost | $ 1,966,959,286 |
The tax-based components of distributable earnings as of period end were as follows:
Undistributed ordinary income | $ 106,393,413 |
Undistributed long-term capital gain | $ 142,483,227 |
Net unrealized appreciation (depreciation) | $ 423,461,730 |
The tax character of distributions paid was as follows:
| July 31, 2013 | July 31, 2012 |
Ordinary Income | $ 5,191,398 | $ - |
Long-term Capital Gains | 117,369,049 | 34,799,429 |
Total | $ 122,560,447 | $ 34,799,429 |
Short-Term Trading (Redemption) Fees. Shares held by investors in the Fund less than 90 days may have been subject to a redemption fee equal to 1.50% of the net asset value of shares redeemed. All redemption fees, which reduce the proceeds of the shareholder redemption, are retained by the Fund and accounted for as an addition to paid in capital.
4. Purchases and Sales of Investments.
Purchases and sales of securities, other than short-term securities, aggregated $2,731,095,699 and $2,897,640,503, respectively.
5. Fees and Other Transactions with Affiliates.
Management Fee. FMR and its affiliates provide the Fund with investment management related services for which the Fund pays a monthly management fee. The management fee is the sum of an individual fund fee rate that is based on an annual rate of .45% of the Fund's average net assets and an annualized group fee rate that averaged .26% during the period. The group fee rate is based upon the average net assets of all the mutual funds advised by FMR. The group fee rate decreases as assets under management increase and increases as assets under management decrease. In addition, the
Annual Report
Notes to Financial Statements - continued
5. Fees and Other Transactions with Affiliates - continued
Management Fee - continued
management fee is subject to a performance adjustment (up to a maximum of ± .20% of the Fund's average net assets over a 36 month performance period). The upward or downward adjustment to the management fee is based on the relative investment performance of Small Cap Growth as compared to an appropriate benchmark index. For the period, the total annual management fee rate, including the performance adjustment, was .64% of the Fund's average net assets.
Distribution and Service Plan Fees. In accordance with Rule 12b-1 of the 1940 Act, the Fund has adopted separate Distribution and Service Plans for each class of shares. Certain classes pay Fidelity Distributors Corporation (FDC), an affiliate of FMR, separate Distribution and Service Fees, each of which is based on an annual percentage of each class' average net assets. In addition, FDC may pay financial intermediaries for selling shares of the Fund and providing shareholder support services. For the period, the Distribution and Service Fee rates, total fees and amounts retained by FDC were as follows:
| Distribution
Fee | Service
Fee | Total Fees | Retained
by FDC |
Class A | -% | .25% | $ 158,162 | $ 3,570 |
Class T | .25% | .25% | 145,172 | 1,664 |
Class B | .75% | .25% | 37,548 | 28,458 |
Class C | .75% | .25% | 268,513 | 44,877 |
| | | $ 609,395 | $ 78,569 |
Sales Load. FDC may receive a front-end sales charge of up to 5.75% for selling Class A shares and 3.50% for selling Class T shares, some of which is paid to financial intermediaries for selling shares of the Fund. Depending on the holding period, FDC may receive contingent deferred sales charges levied on Class A, Class T, Class B, and Class C redemptions. The deferred sales charges range from 5.00% to 1.00% for Class B shares, 1.00% for Class C shares, 1.00% for certain purchases of Class A shares and .25% for certain purchases of Class T shares.
For the period, sales charge amounts retained by FDC were as follows:
| Retained
by FDC |
Class A | $ 26,925 |
Class T | 7,772 |
Class B* | 4,960 |
Class C* | 2,503 |
| $ 42,160 |
* When Class B and Class C shares are initially sold, FDC pays commissions from its own resources to financial intermediaries through which the sales
are made.
Annual Report
5. Fees and Other Transactions with Affiliates - continued
Transfer Agent Fees. Fidelity Investments Institutional Operations Company, Inc., (FIIOC), an affiliate of FMR, is the transfer, dividend disbursing and shareholder servicing agent for each class of the Fund. FIIOC receives account fees and asset-based fees that vary according to the account size and type of account of the shareholders of the respective classes of the Fund, except for Class F. FIIOC receives no fees for providing transfer agency services to Class F. FIIOC pays for typesetting, printing and mailing of shareholder reports, except proxy statements. For the period, transfer agent fees for each applicable class were as follows:
| Amount | % of
Average
Net Assets |
Class A | $ 189,665 | .30 |
Class T | 89,260 | .31 |
Class B | 11,279 | .30 |
Class C | 80,491 | .30 |
Small Cap Growth | 2,548,777 | .21 |
Institutional Class | 96,156 | .23 |
| $ 3,015,628 | |
Accounting and Security Lending Fees. Fidelity Service Company, Inc. (FSC), an affiliate of FMR, maintains the Fund's accounting records. The accounting fee is based on the level of average net assets for each month. Under a separate contract, FSC administers the security lending program. The security lending fee is based on the number and duration of lending transactions.
Brokerage Commissions. The Fund placed a portion of its portfolio transactions with brokerage firms which are affiliates of the investment adviser. Brokerage commissions are included in net realized gain (loss) and change in net unrealized appreciation (depreciation) in the Statement of Operations. The commissions paid to these affiliated firms were $81,093 for the period.
Interfund Lending Program. Pursuant to an Exemptive Order issued by the SEC, the Fund, along with other registered investment companies having management contracts with FMR, may participate in an interfund lending program. This program provides an alternative credit facility allowing the funds to borrow from, or lend money to, other participating affiliated funds. At period end, there were no interfund loans outstanding. The Fund's activity in this program during the period for which loans were outstanding was as follows:
Borrower or Lender | Average Loan
Balance | Weighted Average
Interest Rate | Interest
Expense |
Borrower | $ 10,856,167 | .37% | $ 674 |
Annual Report
Notes to Financial Statements - continued
6. Committed Line of Credit.
The Fund participates with other funds managed by FMR or an affiliate in a $4.25 billion credit facility (the "line of credit") to be utilized for temporary or emergency purposes to fund shareholder redemptions or for other short-term liquidity purposes. The Fund has agreed to pay commitment fees on its pro-rata portion of the line of credit, which amounted to $4,620 and is reflected in Miscellaneous expenses on the Statement of Operations. During the period, there were no borrowings on this line of credit.
7. Security Lending.
The Fund lends portfolio securities through a lending agent from time to time in order to earn additional income. For equity securities, a lending agent is used and may loan securities to certain qualified borrowers, including Fidelity Capital Markets (FCM), a broker-dealer affiliated with the Fund. On the settlement date of the loan, the Fund receives collateral (in the form of U.S. Treasury obligations, letters of credit and/or cash) against the loaned securities and maintains collateral in an amount not less than 100% of the market value of the loaned securities during the period of the loan. The market value of the loaned securities is determined at the close of business of the Fund and any additional required collateral is delivered to the Fund on the next business day. If the borrower defaults on its obligation to return the securities loaned because of insolvency or other reasons, the Fund may apply collateral received from the borrower against the obligation. The Fund may experience delays and costs in recovering the securities loaned. Any cash collateral received is invested in the Fidelity Securities Lending Cash Central Fund. The value of loaned securities and cash collateral at period end are disclosed on the Fund's Statement of Assets and Liabilities. The value of securities loaned to FCM at period end was $2,735,765. Security lending income represents the income earned on investing cash collateral, less rebates paid to borrowers and any lending agent fees associated with the loan, plus any premium payments received for lending certain types of securities. Security lending income is presented in the Statement of Operations as a component of income from Fidelity Central Funds, and includes $310,189 from securities loaned to FCM.
8. Expense Reductions.
Commissions paid to certain brokers with whom FMR places trades on behalf of the Fund include an amount in addition to trade execution, which is rebated back to the Fund to offset certain expenses. This amount totaled $317,619 for the period. In addition, through arrangements with the Fund's custodian, credits realized as a result of uninvested cash balances were used to reduce the Fund's expenses. During the period, these credits reduced the Fund's custody expenses by $50.
Annual Report
8. Expense Reductions - continued
In addition, FMR reimbursed a portion of the Fund's operating expenses during the period in the amount of $4,459.
9. Distributions to Shareholders.
Distributions to shareholders of each class were as follows:
Years ended July 31, | 2013 | 2012 |
From net realized gain | | |
Class A | $ 3,855,020 | $ 1,262,924 |
Class T | 1,778,904 | 573,407 |
Class B | 260,524 | 101,910 |
Class C | 1,656,727 | 481,854 |
Small Cap Growth | 74,940,038 | 25,434,274 |
Class F | 37,680,389 | 6,152,820 |
Institutional Class | 2,388,845 | 792,240 |
Total | $ 122,560,447 | $ 34,799,429 |
10. Share Transactions.
Transactions for each class of shares were as follows:
| Shares | Dollars |
Years ended July 31, | 2013 | 2012 | 2013 | 2012 |
Class A | | | | |
Shares sold | 969,311 | 986,718 | $ 16,711,827 | $ 14,926,996 |
Reinvestment of distributions | 231,282 | 85,896 | 3,646,231 | 1,194,285 |
Shares redeemed | (1,149,326) | (1,407,222) | (19,219,034) | (21,375,353) |
Net increase (decrease) | 51,267 | (334,608) | $ 1,139,024 | $ (5,254,072) |
Class T | | | | |
Shares sold | 457,321 | 358,193 | $ 7,743,595 | $ 5,456,756 |
Reinvestment of distributions | 106,640 | 38,774 | 1,660,117 | 533,890 |
Shares redeemed | (538,707) | (523,310) | (8,802,237) | (7,812,853) |
Net increase (decrease) | 25,254 | (126,343) | $ 601,475 | $ (1,822,207) |
Class B | | | | |
Shares sold | 6,696 | 11,810 | $ 106,485 | $ 172,624 |
Reinvestment of distributions | 16,337 | 7,173 | 246,159 | 96,091 |
Shares redeemed | (107,598) | (81,516) | (1,730,845) | (1,196,288) |
Net increase (decrease) | (84,565) | (62,533) | $ (1,378,201) | $ (927,573) |
Annual Report
Notes to Financial Statements - continued
10. Share Transactions - continued
| Shares | Dollars |
Years ended July 31, | 2013 | 2012 | 2013 | 2012 |
Class C | | | | |
Shares sold | 456,788 | 405,451 | $ 7,531,447 | $ 5,976,693 |
Reinvestment of distributions | 103,215 | 33,110 | 1,550,542 | 443,092 |
Shares redeemed | (428,305) | (384,855) | (6,821,754) | (5,527,477) |
Net increase (decrease) | 131,698 | 53,706 | $ 2,260,235 | $ 892,308 |
Small Cap Growth | | | | |
Shares sold | 10,379,088 | 14,552,522 | $ 182,249,151 | $ 226,496,807 |
Reinvestment of distributions | 4,595,875 | 1,774,167 | 73,721,316 | 25,022,882 |
Shares redeemed | (21,652,202) | (27,135,724) | (371,997,767) | (414,348,619) |
Net increase (decrease) | (6,677,239) | (10,809,035) | $ (116,027,300) | $ (162,828,930) |
Class F | | | | |
Shares sold | 7,670,010 | 16,430,240 | $ 131,231,307 | $ 255,874,632 |
Reinvestment of distributions | 2,336,095 | 432,802 | 37,680,389 | 6,152,820 |
Shares redeemed | (6,554,937) | (1,757,546) | (118,928,973) | (26,811,905) |
Net increase (decrease) | 3,451,168 | 15,105,496 | $ 49,982,723 | $ 235,215,547 |
Institutional Class | | | | |
Shares sold | 727,207 | 819,623 | $ 12,757,998 | $ 12,520,738 |
Reinvestment of distributions | 128,780 | 44,186 | 2,069,290 | 624,723 |
Shares redeemed | (580,321) | (1,078,752) | (9,884,418) | (16,617,897) |
Net increase (decrease) | 275,666 | (214,943) | $ 4,942,870 | $ (3,472,436) |
11. Other.
The Fund's organizational documents provide former and current trustees and officers with a limited indemnification against liabilities arising in connection with the performance of their duties to the Fund. In the normal course of business, the Fund may also enter into contracts that provide general indemnifications. The Fund's maximum exposure under these arrangements is unknown as this would be dependent on future claims that may be made against the Fund. The risk of material loss from such claims is considered remote.
At the end of the period, the Fidelity Freedom Funds and the Fidelity Freedom K Funds were the owners of record, in the aggregate, of approximately 59% of the total outstanding shares of the Fund.
Annual Report
To the Trustees of Fidelity Securities Fund and the Shareholders of Fidelity Small Cap Growth Fund:
In our opinion, the accompanying statement of assets and liabilities, including the schedule of investments, and the related statements of operations and of changes in net assets and the financial highlights present fairly, in all material respects, the financial position of Fidelity Small Cap Growth Fund (a fund of Fidelity Securities Fund) at July 31, 2013, the results of its operations for the year then ended, the changes in its net assets for each of the two years in the period then ended and the financial highlights for each of the periods indicated, in conformity with accounting principles generally accepted in the United States of America. These financial statements and financial highlights (hereafter referred to as "financial statements") are the responsibility of the Fidelity Small Cap Growth Fund's management. Our responsibility is to express an opinion on these financial statements based on our audits. We conducted our audits of these financial statements in accordance with the standards of the Public Company Accounting Oversight Board (United States). Those standards require that we plan and perform the audit to obtain reasonable assurance about whether the financial statements are free of material misstatement. An audit includes examining, on a test basis, evidence supporting the amounts and disclosures in the financial statements, assessing the accounting principles used and significant estimates made by management, and evaluating the overall financial statement presentation. We believe that our audits, which included confirmation of securities at July 31, 2013 by correspondence with the custodian and brokers, provide a reasonable basis for our opinion.
PricewaterhouseCoopers LLP
Boston, Massachusetts
September 16, 2013
Annual Report
The Trustees, Member of the Advisory Board, and executive officers of the trust and fund, as applicable, are listed below. The Board of Trustees governs the fund and is responsible for protecting the interests of shareholders. The Trustees are experienced executives who meet periodically throughout the year to oversee the fund's activities, review contractual arrangements with companies that provide services to the fund, oversee management of the risks associated with such activities and contractual arrangements, and review the fund's performance. Except for James C. Curvey, Ned C. Lautenbach, Ronald P. O'Hanley, and William S. Stavropoulos, each of the Trustees oversees 166 Fidelity funds. Mr. Curvey oversees 387 Fidelity funds. Mr. Lautenbach, Mr. O'Hanley, and Mr. Stavropoulos oversee 230 Fidelity funds.
The Trustees hold office without limit in time except that (a) any Trustee may resign; (b) any Trustee may be removed by written instrument, signed by at least two-thirds of the number of Trustees prior to such removal; (c) any Trustee who requests to be retired or who has become incapacitated by illness or injury may be retired by written instrument signed by a majority of the other Trustees; and (d) any Trustee may be removed at any special meeting of shareholders by a two-thirds vote of the outstanding voting securities of the trust. Each Trustee who is not an interested person of the trust and the fund (as defined in the 1940 Act) (Independent Trustee), shall retire not later than the last day of the calendar year in which his or her 75th birthday occurs. The Independent Trustees may waive this mandatory retirement age policy with respect to individual Trustees. The executive officers and Advisory Board Member hold office without limit in time, except that any officer and Advisory Board Member may resign or may be removed by a vote of a majority of the Trustees at any regular meeting or any special meeting of the Trustees. Except as indicated, each individual has held the office shown or other offices in the same company for the past five years.
Experience, Skills, Attributes, and Qualifications of the Fund's Trustees. The Governance and Nominating Committee has adopted a statement of policy that describes the experience, qualifications, attributes, and skills that are necessary and desirable for potential Independent Trustee candidates (Statement of Policy). The Board believes that each Trustee satisfied at the time he or she was initially elected or appointed a Trustee, and continues to satisfy, the standards contemplated by the Statement of Policy. The Governance and Nominating Committee also engages professional search firms to help identify potential Independent Trustee candidates who have the experience, qualifications, attributes, and skills consistent with the Statement of Policy. From time to time, additional criteria based on the composition and skills of the current Independent Trustees, as well as experience or skills that may be appropriate in light of future changes to board composition, business conditions, and regulatory or other developments, have also been considered by the professional search firms and the Governance and Nominating Committee. In addition, the Board takes into account the Trustees' commitment and participation in Board and committee meetings, as well as their leadership of standing and ad hoc committees throughout their tenure.
Annual Report
Trustees and Officers - continued
In determining that a particular Trustee was and continues to be qualified to serve as a Trustee, the Board has considered a variety of criteria, none of which, in isolation, was controlling. The Board believes that, collectively, the Trustees have balanced and diverse experience, qualifications, attributes, and skills, which allow the Board to operate effectively in governing the fund and protecting the interests of shareholders. Information about the specific experience, skills, attributes, and qualifications of each Trustee, which in each case led to the Board's conclusion that the Trustee should serve (or continue to serve) as a trustee of the fund, is provided below.
Board Structure and Oversight Function. James C. Curvey is an interested person (as defined in the 1940 Act) and currently serves as Chairman. The Trustees have determined that an interested Chairman is appropriate and benefits shareholders because an interested Chairman has a personal and professional stake in the quality and continuity of services provided to the fund. Independent Trustees exercise their informed business judgment to appoint an individual of their choosing to serve as Chairman, regardless of whether the Trustee happens to be independent or a member of management. The Independent Trustees have determined that they can act independently and effectively without having an Independent Trustee serve as Chairman and that a key structural component for assuring that they are in a position to do so is for the Independent Trustees to constitute a substantial majority for the Board. The Independent Trustees also regularly meet in executive session. Ned C. Lautenbach serves as Chairman of the Independent Trustees and as such (i) acts as a liaison between the Independent Trustees and management with respect to matters important to the Independent Trustees and (ii) with management prepares agendas for Board meetings.
Fidelity funds are overseen by different Boards of Trustees. The fund's Board oversees Fidelity's equity and high income funds and another Board oversees Fidelity's investment-grade bond, money market, and asset allocation funds. The asset allocation funds may invest in Fidelity funds overseen by the fund's Board. The use of separate Boards, each with its own committee structure, allows the Trustees of each group of Fidelity funds to focus on the unique issues of the funds they oversee, including common research, investment, and operational issues. On occasion, the separate Boards establish joint committees to address issues of overlapping consequences for the Fidelity funds overseen by each Board.
The Trustees operate using a system of committees to facilitate the timely and efficient consideration of all matters of importance to the Trustees, the fund, and fund shareholders and to facilitate compliance with legal and regulatory requirements and oversight of the fund's activities and associated risks. The Board, acting through its committees, has charged FMR and its affiliates with (i) identifying events or circumstances the occurrence of which could have demonstrably adverse effects on the fund's business and/or reputation; (ii) implementing processes and controls to lessen the possibility that such events or circumstances occur or to mitigate the effects of such events or circumstances if they do occur; and (iii) creating and maintaining a system designed to evaluate continuously business and market conditions in order to facilitate the identification and implementation processes described in (i) and (ii) above. Because the day-to-day operations and activities of the fund are carried out by or through FMR, its affiliates and other service providers, the fund's exposure to risks is mitigated but not eliminated by the processes overseen by the Trustees. While each of the Board's committees has responsibility for overseeing different aspects of the fund's activities, oversight is exercised primarily through the Operations, Audit, and Compliance Committees. In addition, the Independent Trustees have worked with FMR to enhance the Board's oversight of investment and financial risks, legal and regulatory risks, technology risks, and operational risks, including the development of additional risk reporting to the Board. For example, a working group comprised of Independent Trustees and FMR has worked and continues to work to review the Fidelity funds' valuation-related activities, reporting and risk management. Appropriate personnel, including but not limited to the fund's Chief Compliance Officer (CCO), FMR's internal auditor, the independent accountants, the fund's Treasurer and portfolio management personnel, make periodic reports to the Board's committees, as appropriate, including an annual review of FMR's risk management program for the Fidelity funds. The responsibilities of each standing committee, including their oversight responsibilities, are described further under "Standing Committees of the Fund's Trustees."
Annual Report
The fund's Statement of Additional Information (SAI) includes more information about the Trustees. To request a free copy, call Fidelity at 1-877-208-0098.
Interested Trustees*:
Correspondence intended for each Trustee who is an interested person may be sent to Fidelity Investments, 245 Summer Street, Boston, Massachusetts 02210.
Name, Year of Birth; Principal Occupations and Other Relevant Experience+ |
James C. Curvey (1935) |
| Year of Election or Appointment: 2007 Mr. Curvey is Trustee and Chairman of the Board of Trustees of certain Trusts. Mr. Curvey also serves as Trustee (2007-present) of other investment companies advised by FMR. Mr. Curvey is a Director of Fidelity Investments Money Management, Inc. (2009-present), Director of Fidelity Research & Analysis Co. (2009-present) and Director of FMR and FMR Co., Inc. (2007-present). Mr. Curvey is also Vice Chairman (2007-present) and Director of FMR LLC. In addition, Mr. Curvey serves as an Overseer for the Boston Symphony Orchestra and a member of the Trustees of Villanova University. Previously, Mr. Curvey was the Vice Chairman (2006-2007) and Director (2000-2007) of FMR Corp. |
Ronald P. O'Hanley (1957) |
| Year of Election or Appointment: 2011 Mr. O'Hanley serves as a Trustee and Chairman of the Board of Trustees of other Fidelity funds (2013-present), and is Director of FMR Co., Inc. (2010-present), Director of Fidelity Investments Money Management, Inc. (2010-present), Director of Fidelity Research & Analysis Company (2010-present), President of Fidelity Asset Management and Corporate Services and a Member of Fidelity's Executive Committee (2010-present). Previously, Mr. O'Hanley served as President and Chief Executive Officer of BNY Mellon Asset Management (2007-2010). Mr. O'Hanley also served as Vice Chairman of Bank New York Mellon Corp. and a member of that firm's Executive Committee. Prior to the 2007 merger of The Bank of New York and Mellon Financial Corporation, he was Vice Chairman of Mellon Financial Corporation and President and Chief Executive Officer of Mellon Asset Management. He joined Mellon in February 1997. Mr. O'Hanley currently serves as Chairman of the Boston Public Library Foundation Board of Directors and sits on the Board of Directors of Beth Israel Deaconess Medical Center, the Board of Trustees of the Marine Biological Laboratory and the Advisory Board of the Maxwell School of Citizenship and Public Administration at Syracuse University. Mr. O'Hanley also chairs the Council on Asset Management for the Financial Services Roundtable and is a member of the Board of Directors of Institutional Investor's U.S. Institute. |
* Trustees have been determined to be "Interested Trustees" by virtue of, among other things, their affiliation with the trust or various entities under common control with FMR.
+ The information above includes each Trustee's principal occupation during the last five years and other information relating to the experience, attributes, and skills relevant to each Trustee's qualifications to serve as a Trustee, which led to the conclusion that each Trustee should serve as a Trustee for the fund.
Annual Report
Independent Trustees:
Correspondence intended for each Independent Trustee (that is, the Trustees other than the Interested Trustees) may be sent to Fidelity Investments, P.O. Box 55235, Boston, Massachusetts 02205-5235.
Name, Year of Birth; Principal Occupations and Other Relevant Experience+ |
Dennis J. Dirks (1948) |
| Year of Election or Appointment: 2005 Prior to his retirement in May 2003, Mr. Dirks was Chief Operating Officer and a member of the Board of The Depository Trust & Clearing Corporation (DTCC). He also served as President, Chief Operating Officer, and Board member of The Depository Trust Company (DTC) and President and Board member of the National Securities Clearing Corporation (NSCC). In addition, Mr. Dirks served as Chief Executive Officer and Board member of the Government Securities Clearing Corporation, Chief Executive Officer and Board member of the Mortgage-Backed Securities Clearing Corporation, as a Trustee and a member of the Finance Committee of Manhattan College (2005-2008), and as a Trustee and a member of the Finance Committee of AHRC of Nassau County (2006-2008). Mr. Dirks is a member of the Independent Directors Council (IDC) Governing Council (2010-present) and Board of Directors for The Brookville Center for Children's Services, Inc. (2009-present). |
Alan J. Lacy (1953) |
| Year of Election or Appointment: 2008 Mr. Lacy serves as Senior Adviser (2007-present) of Oak Hill Capital Partners, L.P. (private equity). Mr. Lacy also served as Chief Executive Officer (2000-2005) and Vice Chairman (2005-2006) of Sears Holdings Corporation and Sears, Roebuck and Co. (retail). In addition, Mr. Lacy serves as a member of the Board of Directors of Dave & Buster's Entertainment, Inc. (restaurant and entertainment complexes, 2010-present), Earth Fare, Inc. (retail grocery, 2012-present), The Hillman Companies, Inc. (hardware wholesalers, 2010-present), and Bristol-Myers Squibb Company (global pharmaceuticals, 2008-present). Mr. Lacy is a member of the Board of Trustees of The National Parks Conservation Association (2006-present). Previously, Mr. Lacy served as Chairman of the Board of Trustees of the National Parks Conservation Association (2008-2011) and as a member of the Board of Directors for the Western Union Company (global money transfer, 2006-2011). |
Ned C. Lautenbach (1944) |
| Year of Election or Appointment: 2000 Mr. Lautenbach is Chairman of the Independent Trustees of the Equity and High Income Funds (2006-present) and serves as a Trustee of other Fidelity funds (2013-present). Mr. Lautenbach currently serves as the Lead Director of the Eaton Corporation Board of Directors (diversified industrial, 1997-present). Mr. Lautenbach is Chairman of the Board of Directors of the Philharmonic Center for the Arts in Naples, Florida (2012-present) and a member of the Council on Foreign Relations (1994-present). Previously, Mr. Lautenbach was a Partner/Advisory Partner at Clayton, Dubilier & Rice, LLC (private equity investment, 1998-2010), as well as a Director of Sony Corporation (2006-2007). |
Joseph Mauriello (1944) |
| Year of Election or Appointment: 2008 Prior to his retirement in January 2006, Mr. Mauriello served in numerous senior management positions including Deputy Chairman and Chief Operating Officer (2004-2005), and Vice Chairman of Financial Services (2002-2004) of KPMG LLP US (professional services, 1965-2005). Mr. Mauriello currently serves as a member of the Board of Directors of XL Group plc. (global insurance and re-insurance, 2006-present). Previously, Mr. Mauriello served as a Director of the Hamilton Funds of the Bank of New York (2006-2007) and of Arcadia Resources Inc. (health care services and products, 2007-2012). |
Robert W. Selander (1950) |
| Year of Election or Appointment: 2011 Previously, Mr. Selander served as a Member of the Advisory Board of Fidelity's Equity and High Income Funds (2011), Executive Vice Chairman (2010), Chief Executive Officer (2009-2010), and President and Chief Executive Officer (1997-2009) of Mastercard, Inc. |
Cornelia M. Small (1944) |
| Year of Election or Appointment: 2005 Ms. Small is a member of the Board of Directors (2009-present) and Chair of the Investment Committee (2010-present) of the Teagle Foundation. Ms. Small also serves on the Investment Committee of the Berkshire Taconic Community Foundation (2008-present). Previously, Ms. Small served as Chairperson (2002-2008) and a member of the Investment Committee and Chairperson (2008-2012) and a member of the Board of Trustees of Smith College. In addition, Ms. Small served as Chief Investment Officer, Director of Global Equity Investments, and a member of the Board of Directors of Scudder, Stevens & Clark and Scudder Kemper Investments. |
William S. Stavropoulos (1939) |
| Year of Election or Appointment: 2002 Mr. Stavropoulos is Vice Chairman of the Independent Trustees of the Equity and High Income Funds (2006-present) and serves as a Trustee of other Fidelity funds (2013-present). Mr. Stavropoulos serves as President and Founder of the Michigan Baseball Foundation, the Great Lakes Loons (2007-present). Mr. Stavropoulos is Chairman Emeritus of the Board of Directors of The Dow Chemical Company, where he previously served in numerous senior management positions, including President, CEO (1995-2000; 2002-2004), Chairman of the Executive Committee (2000-2006), and as a member of the Board of Directors (1990-2006). Currently, Mr. Stavropoulos is Chairman of the Board of Directors of Univar Inc. (global distributor of commodity and specialty chemicals), a Director of Teradata Corporation (data warehousing and technology solutions), and Maersk Inc. (industrial conglomerate), and a member of the Advisory Board for Metalmark Capital LLC (private equity investment, 2005-present). Mr. Stavropoulos is an operating advisor to Clayton, Dubilier & Rice, LLC (private equity investment). In addition, Mr. Stavropoulos is a member of the University of Notre Dame Advisory Council for the College of Science, a Trustee of the Rollin L. Gerstacker Foundation, and a Director of the Naples Philharmonic Center for the Arts. Previously, Mr. Stavropoulos served as a Director of Chemical Financial Corporation (bank holding company, 1993-2012) and Tyco International, Ltd. (multinational manufacturing and services, 2007-2012). |
David M. Thomas (1949) |
| Year of Election or Appointment: 2008 Previously, Mr. Thomas served as Executive Chairman (2005-2006) and Chairman and Chief Executive Officer (2000-2005) of IMS Health, Inc. (pharmaceutical and healthcare information solutions), and a Director of Fortune Brands, Inc. (consumer products, 2000-2011). In addition, Mr. Thomas serves as Non-Executive Chairman of the Board of Directors of Fortune Brands Home and Security (home and security products, 2011-present), and as a member of the Board of Directors of Interpublic Group of Companies, Inc. (marketing communication, 2004-present). |
+ The information above includes each Trustee's principal occupation during the last five years and other information relating to the experience, attributes, and skills relevant to each Trustee's qualifications to serve as a Trustee, which led to the conclusion that each Trustee should serve as a Trustee for the fund.
Annual Report
Trustees and Officers - continued
Advisory Board Member and Executive Officers:
Correspondence intended for each executive officer and Peter S. Lynch may be sent to Fidelity Investments, 245 Summer Street, Boston, Massachusetts 02210.
Name, Year of Birth; Principal Occupation |
Peter S. Lynch (1944) |
| Year of Election or Appointment: 2003 Member of the Advisory Board of Fidelity's Equity and High Income Funds. Mr. Lynch is Vice Chairman and a Director of FMR and FMR Co., Inc. In addition, Mr. Lynch serves as a Trustee of Boston College and as the Chairman of the Inner-City Scholarship Fund. Previously, Mr. Lynch served on the Special Olympics International Board of Directors (1997-2006). |
Kenneth B. Robins (1969) |
| Year of Election or Appointment: 2008 President and Treasurer of Fidelity's Equity and High Income Funds. Mr. Robins also serves as President and Treasurer (2008-present) and Assistant Treasurer (2009-present) of other Fidelity funds and is an employee of Fidelity Investments (2004-present). Mr. Robins serves as Executive Vice President of Fidelity Investments Money Management, Inc. (FIMM) (2013-present). Previously, Mr. Robins served as Deputy Treasurer of the Fidelity funds (2005-2008) and Treasurer and Chief Financial Officer of The North Carolina Capital Management Trust: Cash and Term Portfolios (2006-2008). |
Brian B. Hogan (1964) |
| Year of Election or Appointment: 2009 Vice President of Equity and High Income Funds. Mr. Hogan also serves as Vice President of other Fidelity funds (2009-present) and President of FMR's Equity Division (2009-present). Previously, Mr. Hogan served as Senior Vice President, Equity Research of FMR (2006-2009) and as a portfolio manager. |
Thomas C. Hense (1964) |
| Year of Election or Appointment: 2008 or 2010 Vice President of Fidelity's High Income (2008), Small Cap (2008), and Value (2010) Funds. Previously, Mr. Hense served as a portfolio manager for Fidelity's Institutional Money Management Group (Pyramis) (2003-2008). |
Scott C. Goebel (1968) |
| Year of Election or Appointment: 2008 Secretary and Chief Legal Officer (CLO) of the Fidelity funds. Mr. Goebel also serves as Secretary of Fidelity Investments Money Management, Inc. (FIMM) (2010-present) and Fidelity Research and Analysis Company (FRAC) (2010-present); Secretary and CLO of The North Carolina Capital Management Trust: Cash and Term Portfolios (2008-present); General Counsel, Secretary, and Senior Vice President of FMR (2008-present) and FMR Co., Inc. (2008-present); employed by FMR LLC or an affiliate (2001-present); Chief Legal Officer of Fidelity Management & Research (Hong Kong) Limited (2008-present) and Assistant Secretary of Fidelity Management & Research (Japan) Inc. (2008-present), and Fidelity Management & Research (U.K.) Inc. (2008-present). Previously, Mr. Goebel served as Assistant Secretary of FIMM (2008-2010), FRAC (2008-2010), and the Funds (2007-2008) and as Vice President and Secretary of Fidelity Distributors Corporation (FDC) (2005-2007). |
William C. Coffey (1969) |
| Year of Election or Appointment: 2009 Assistant Secretary of Fidelity's Equity and High Income Funds. Mr. Coffey also serves as Assistant Secretary of other Fidelity funds (2009-present), Senior Vice President and Deputy General Counsel of FMR LLC (2010-present), and is an employee of Fidelity Investments. Previously, Mr. Coffey served as Vice President and Associate General Counsel of FMR LLC (2005-2009). |
Elizabeth Paige Baumann (1968) |
| Year of Election or Appointment: 2012 Anti-Money Laundering (AML) Officer of the Fidelity funds. Ms. Baumann also serves as AML Officer of The North Carolina Capital Management Trust: Cash and Term Portfolios (2012-present), Chief AML Officer of FMR LLC (2012-present), and is an employee of Fidelity Investments. Previously, Ms. Baumann served as Vice President and Deputy Anti-Money Laundering Officer (2007-2012). |
Christine Reynolds (1958) |
| Year of Election or Appointment: 2008 Chief Financial Officer of the Fidelity funds. Ms. Reynolds became President of Fidelity Pricing and Cash Management Services (FPCMS) in August 2008. Ms. Reynolds served as Chief Operating Officer of FPCMS (2007-2008). Previously, Ms. Reynolds served as President, Treasurer, and Anti-Money Laundering officer of the Fidelity funds (2004-2007). |
Joseph A. Hanlon (1968) |
| Year of Election or Appointment: 2012 Chief Compliance Officer of Fidelity's Equity and High Income Funds. Mr. Hanlon also serves as Chief Compliance Officer of other Fidelity funds (2012-present). Mr. Hanlon serves as Compliance Officer of FMR, FMR Co., Inc., Fidelity Investments Money Management, Inc. (FIMM), Fidelity Research and Analysis Company (FRAC), and Fidelity Management & Research (Hong Kong) (2009-present), as Senior Vice President of the Fidelity Asset Management Division (2009-present), and is an employee of Fidelity Investments. Previously, Mr. Hanlon served as Compliance Officer of Fidelity Management & Research (Japan) Inc. (2009-2013), Strategic Advisers, Inc. (2009-2013), and Fidelity Management & Research (U.K.) Inc. (2009-2013). |
Joseph F. Zambello (1957) |
| Year of Election or Appointment: 2011 Deputy Treasurer of the Fidelity funds. Mr. Zambello is an employee of Fidelity Investments. Previously, Mr. Zambello served as Vice President of FMR's Program Management Group (2009-2011) and Vice President of the Transfer Agent Oversight Group (2005-2009). |
Adrien E. Deberghes (1967) |
| Year of Election or Appointment: 2008 Deputy Treasurer of Fidelity's Equity and High Income Funds. Mr. Deberghes also serves as Vice President (2011-present), Deputy Treasurer (2008-present), and Assistant Treasurer (2010-present) of other Fidelity funds, and is an employee of Fidelity Investments (2008-present). Previously, Mr. Deberghes served as Senior Vice President of Mutual Fund Administration at State Street Corporation (2007-2008), Senior Director of Mutual Fund Administration at Investors Bank & Trust (2005-2007), and Director of Finance for Dunkin' Brands (2000-2005). |
Stephen Sadoski (1971) |
| Year of Election or Appointment: 2012 Deputy Treasurer of Fidelity's Equity and High Income Funds. Mr. Sadoski also serves as Deputy Treasurer of other Fidelity funds (2012-present) and is an employee of Fidelity Investments (2012-present). Previously, Mr. Sadoski served as Assistant Treasurer of Fidelity's Fixed Income and Asset Allocation Funds (2012-2013), an assistant chief accountant in the Division of Investment Management of the Securities and Exchange Commission (SEC) (2009-2012) and as a senior manager at Deloitte & Touche LLP (1997-2009). |
Stacie M. Smith (1974) |
| Year of Election or Appointment: 2013 Deputy Treasurer of Fidelity's Equity and High Income Funds. Ms. Smith also serves as Deputy Treasurer of other Fidelity funds (2013-present) and is an employee of Fidelity Investments (2009-present). Previously, Ms. Smith served as Senior Audit Manager of Ernst & Young LLP (1996-2009). |
Stephanie J. Dorsey (1969) |
| Year of Election or Appointment: 2010 Assistant Treasurer of Fidelity's Equity and High Income Funds. Ms. Dorsey also serves as President and Treasurer (2013-present) and Assistant Treasurer (2010-present) of other Fidelity funds, Treasurer and Chief Financial Officer of The North Carolina Capital Management Trust: Cash and Term Portfolios (2013-present), and is an employee of Fidelity Investments (2008-present). Previously, Ms. Dorsey served as Deputy Treasurer of Fidelity's Fixed Income and Asset Allocation Funds (2008-2013), Treasurer (2004-2008) of the JPMorgan Mutual Funds and Vice President (2004-2008) of JPMorgan Chase Bank. |
Gary W. Ryan (1958) |
| Year of Election or Appointment: 2005 Assistant Treasurer of the Fidelity funds. Mr. Ryan is an employee of Fidelity Investments. Previously, Mr. Ryan served as Vice President of Fund Reporting in Fidelity Pricing and Cash Management Services (FPCMS) (1999-2005). |
Jonathan Davis (1968) |
| Year of Election or Appointment: 2010 Assistant Treasurer of the Fidelity funds. Mr. Davis is also Assistant Treasurer of Fidelity Rutland Square Trust II and Fidelity Commonwealth Trust II. Mr. Davis is an employee of Fidelity Investments. Previously, Mr. Davis served as Vice President and Associate General Counsel of FMR LLC (2003-2010). |
Annual Report
The Board of Trustees of Fidelity Small Cap Growth Fund voted to pay to shareholders of record at the opening of business, the following distributions per share derived from capital gains realized from sales of portfolio securities:
| Pay Date | Record Date | Capital Gains |
Institutional Class | 09/16/13 | 09/13/13 | $2.234 |
The Institutional Class designates 100% of the dividends distributed during the fiscal year as qualifying for the dividends-received deduction for corporate shareholders.
The Institutional Class designates 100% of the dividends distributed during the fiscal year as amounts which may be taken into account as a dividend for the purposes of the maximum rate under section 1(h)(11) of the Internal Revenue Code.
The fund hereby designates as a capital gain dividend with respect to the taxable year ended July 31, 2013, $193,398,519, or, if subsequently determined to be different, the net capital gain of such year.
The fund will notify shareholders in January 2014 of amounts for use in preparing 2013 income tax returns.
Annual Report
Board Approval of Investment Advisory Contracts and Management Fees
Fidelity Small Cap Growth Fund
Each year, the Board of Trustees, including the Independent Trustees (together, the Board), votes on the renewal of the management contract and sub-advisory agreements (together, the Advisory Contracts) for the fund. The Board, assisted by the advice of fund counsel and Independent Trustees' counsel, requests and considers a broad range of information relevant to the renewal of the Advisory Contracts throughout the year.
The Board meets regularly and, at each of its meetings, covers an extensive agenda of topics and materials and considers factors that are relevant to its annual consideration of the renewal of the fund's Advisory Contracts, including the services and support provided to the fund and its shareholders. The Board has established various standing committees, each composed of and chaired by Independent Trustees with varying backgrounds, to which the Board has assigned specific subject matter responsibilities in order to enhance effective decision-making by the Board. The Board, acting directly and through its Committees, requests and receives information concerning the annual consideration of the renewal of the fund's Advisory Contracts. The Board also meets as needed to consider matters specifically related to the Board's annual consideration of the renewal of Advisory Contracts. Members of the Board may also meet with trustees of other Fidelity funds through ad hoc joint committees to discuss certain matters relevant to the Fidelity funds.
At its July 2013 meeting, the Board, including the Independent Trustees, unanimously determined to renew the fund's Advisory Contracts. In reaching its determination, the Board considered all factors it believed relevant, including (i) the nature, extent, and quality of the services to be provided to the fund and its shareholders (including the investment performance of the fund); (ii) the competitiveness of the fund's management fee and total expense ratio relative to peer funds; (iii) the total costs of the services to be provided by and the profits to be realized by Fidelity from its relationship with the fund; (iv) the extent to which economies of scale exist and would be realized as the fund grows; and (v) whether fee levels reflect these economies of scale, if any, for the benefit of fund shareholders.
In considering whether to renew the Advisory Contracts for the fund, the Board reached a determination, with the assistance of fund counsel and Independent Trustees' counsel and through the exercise of its business judgment, that the renewal of the Advisory Contracts was in the best interests of the fund and its shareholders and that the compensation payable under the Advisory Contracts was fair and reasonable. The Board's decision to renew the Advisory Contracts was not based on any single factor, but rather was based on a comprehensive consideration of all the information provided to the Board at its meetings throughout the year. The Board, in reaching its determination to renew the Advisory Contracts, was aware that shareholders in the fund have a broad range of investment choices available to them, including a wide choice among mutual funds offered by Fidelity's competitors, and that the fund's shareholders, who have the opportunity to review and weigh the disclosure provided by the fund in its prospectus and other public disclosures, have chosen to invest in this fund, which is a part of the Fidelity family of funds.
Annual Report
Board Approval of Investment Advisory Contracts and
Management Fees - continued
Nature, Extent, and Quality of Services Provided. The Board considered the staffing within the investment adviser, Fidelity Management & Research Company (FMR), and the sub-advisers (together, the Investment Advisers) as it relates to the fund, including the backgrounds of the fund's investment personnel, and also considered the fund's investment objective, strategies, and related investment philosophy. The Independent Trustees also had discussions with senior management of Fidelity's investment operations and investment groups. The Board considered the structure of the portfolio manager compensation program and whether this structure provides appropriate incentives to act in the best interests of the fund.
Resources Dedicated to Investment Management and Support Services. The Board and the Fund Oversight and Research Committees reviewed the general qualifications and capabilities of the Investment Advisers' investment staff, including its size, education, experience, and resources, as well as the Investment Advisers' approach to recruiting, training, managing, and compensating investment personnel. The Board noted that FMR has continued to increase the resources devoted to non-U.S. offices, including expansion of Fidelity's global investment organization. The Board also noted that Fidelity's analysts have extensive resources, tools and capabilities that allow them to conduct sophisticated quantitative and fundamental analysis, as well as credit analysis of issuers, counterparties and guarantors. Further, the Board believes that Fidelity's investment professionals have sufficient access to global information and data so as to provide competitive investment results over time, and that those professionals also have access to sophisticated tools that permit them to assess portfolio construction and risk and performance attribution characteristics continuously, as well as to transmit new information and research conclusions rapidly around the world. Additionally, in its deliberations, the Board considered the Investment Advisers' trading and risk management capabilities and resources, which are an integral part of the investment management process.
Shareholder and Administrative Services. The Board considered (i) the nature, extent, quality, and cost of advisory, administrative, and shareholder services performed by the Investment Advisers and their affiliates under the Advisory Contracts and under separate agreements covering transfer agency, pricing and bookkeeping, and securities lending services for the fund; (ii) the nature and extent of the supervision of third party service providers, principally custodians and subcustodians; and (iii) the resources devoted to, and the record of compliance with, the fund's compliance policies and procedures. The Board also reviewed the allocation of fund brokerage, including allocations to brokers affiliated with the Investment Advisers, the use of brokerage commissions to pay fund expenses, and the use of "soft" commission dollars to pay for research services.
Annual Report
The Board noted that the growth of fund assets over time across the complex allows Fidelity to reinvest in the development of services designed to enhance the value or convenience of the Fidelity funds as investment vehicles. These services include 24-hour access to account information and market information through telephone representatives and over the Internet, investor education materials and asset allocation tools, and the expanded availability of Fidelity Investor Centers.
Investment in a Large Fund Family. The Board considered the benefits to shareholders of investing in a Fidelity fund, including the benefits of investing in a fund that is part of a large family of funds offering a variety of investment disciplines and providing a large variety of mutual fund investor services. The Board noted that Fidelity had taken, or had made recommendations that resulted in the Fidelity funds taking, a number of actions over the previous year that benefited particular funds, including (i) continuing to dedicate additional resources to investment research and to the support of the senior management team that oversees asset management; (ii) persisting in efforts to enhance Fidelity's global research capabilities; (iii) launching new funds and making other enhancements to meet client needs for global and income-oriented solutions; (iv) continuing to launch dedicated lower cost underlying funds to meet portfolio construction needs related to expanding underlying fund options for Fidelity funds of funds, specifically for the Freedom Fund product lines; (v) rationalizing product lines and gaining increased efficiencies through the mergers of several funds into other funds; (vi) strengthening Fidelity's index fund offerings by reducing investment minimums and adopting or lowering existing expense caps for certain funds and classes; (vii) enhancing Global Asset Allocation product offerings by launching new funds and strategies, including "open architecture" target date funds that utilize affiliated and unaffiliated sub-advisers; (viii) modifying the eligibility criteria for Institutional Class shares of Advisor funds to increase their marketability to a portion of the defined contribution plan market; (ix) creating a new low-cost retirement share class for certain Advisor funds to appeal to large retirement plans; (x) transitioning the management of certain Fidelity commodity funds to Geode Capital Management LLC, a registered commodity pool operator, while retaining administrative responsibilities for the funds; (xi) reorganizing a number of funds; and (xii) taking steps toward establishing a new Fidelity adviser to manage sector-based funds and products.
Investment Performance. The Board considered whether the fund has operated in accordance with its investment objective, as well as its record of compliance with its investment restrictions and its performance history. The Board noted that there was a portfolio management change for the fund in November 2011.
Annual Report
Board Approval of Investment Advisory Contracts and
Management Fees - continued
The Board took into account discussions with the Investment Advisers about fund investment performance that occur at Board meetings throughout the year. In this regard the Board noted that as part of regularly scheduled fund reviews and other reports to the Board on fund performance, the Board periodically considers annualized return information for the fund, for different time periods, measured against a securities market index ("benchmark index") and a peer group of mutual funds with similar objectives ("peer group"). In its evaluation of fund investment performance, the Board gave particular attention to information indicating changes in performance of certain Fidelity funds for specific time periods and the Investment Advisers' explanations for any overperformance or underperformance.
In addition to reviewing absolute and relative fund performance, the Independent Trustees periodically consider the appropriateness of fund performance metrics in evaluating the results achieved. In general, the Independent Trustees believe that fund performance should be evaluated based on net performance (after fees and expenses) of both the highest performing and lowest performing classes, where applicable, compared to appropriate benchmark indices, over appropriate time periods which may include full market cycles, and compared to peer groups, as applicable, over the same periods, taking into account relevant factors including the following: general market conditions; issuer-specific information; tactical opportunities for investment; and fund cash flows and other factors.
The Independent Trustees recognize that shareholders evaluate performance on a net basis over their own holding periods, for which one-, three-, and five-year periods are used as a proxy. For this reason, the performance information reviewed by the Board also included net cumulative calendar year total return information for the fund and an appropriate benchmark index and peer group for the most recent one-, three-, and five-year periods, as shown below. Returns are shown compared to the 25th percentile (top of box) and 75th percentile (bottom of box) of the peer universe.
Annual Report
Fidelity Small Cap Growth Fund

The Board has discussed with FMR the fund's underperformance (based on the December 31, 2012 data presented herein) and has engaged with FMR to consider what steps might be taken to remediate the fund's underperformance. The Board noted that the fund's performance has improved for more recent periods.
The Board also considered that the fund's management fee is subject to upward or downward adjustment depending upon whether, and to what extent, the fund's investment performance for the performance period exceeds, or is exceeded by, a securities index, thus leading to a performance adjustment for the same period. The Board noted that the performance adjustment provides FMR with a strong economic incentive to seek to achieve superior performance for the fund's shareholders and helps to more closely align the interests of FMR and the fund's shareholders.
Based on its review, the Board concluded that the nature, extent, and quality of services provided to the fund under the Advisory Contracts should benefit the fund's shareholders.
Competitiveness of Management Fee and Total Expense Ratio. The Board considered the fund's management fee and total expense ratio compared to "mapped groups" of competitive funds and classes. Fidelity creates "mapped groups" by combining similar Lipper investment objective categories that have comparable management fee characteristics. Combining Lipper investment objective categories aids the Board's management fee and total expense ratio comparisons by broadening the competitive group used for comparison and by reducing the number of universes to which various Fidelity funds are compared.
Annual Report
Board Approval of Investment Advisory Contracts and
Management Fees - continued
Management Fee. The Board considered two proprietary management fee comparisons for the 12-month periods shown in the chart below. The group of Lipper funds used by the Board for management fee comparisons is referred to below as the "Total Mapped Group." The Total Mapped Group comparison focuses on a fund's standing in terms of gross management fees before expense reimbursements or caps, and without giving effect to the fund's performance adjustment, relative to the total universe of funds with comparable investment mandates, regardless of whether their management fee structures also are comparable. Funds with comparable investment mandates offer exposure to similar types of securities. Funds with comparable management fee structures have similar management fee contractual arrangements (e.g., flat rate charged for advisory services, all-inclusive fee rate, etc.). "TMG %" represents the percentage of funds in the Total Mapped Group that had management fees that were lower than the fund's. For example, a TMG % of 14% means that 86% of the funds in the Total Mapped Group had higher management fees than the fund. The "Asset-Size Peer Group" (ASPG) comparison focuses on a fund's standing relative to a subset of non-Fidelity funds within the Total Mapped Group that are similar in size and management fee structure. The ASPG represents at least 15% of the funds in the Total Mapped Group with comparable asset size and management fee structures, subject to a minimum of 50 funds (or all funds in the Total Mapped Group if fewer than 50). Additional information, such as the ASPG quartile in which the fund's management fee ranked and the impact of the fund's performance adjustment, is also included in the chart and considered by the Board.
Fidelity Small Cap Growth Fund
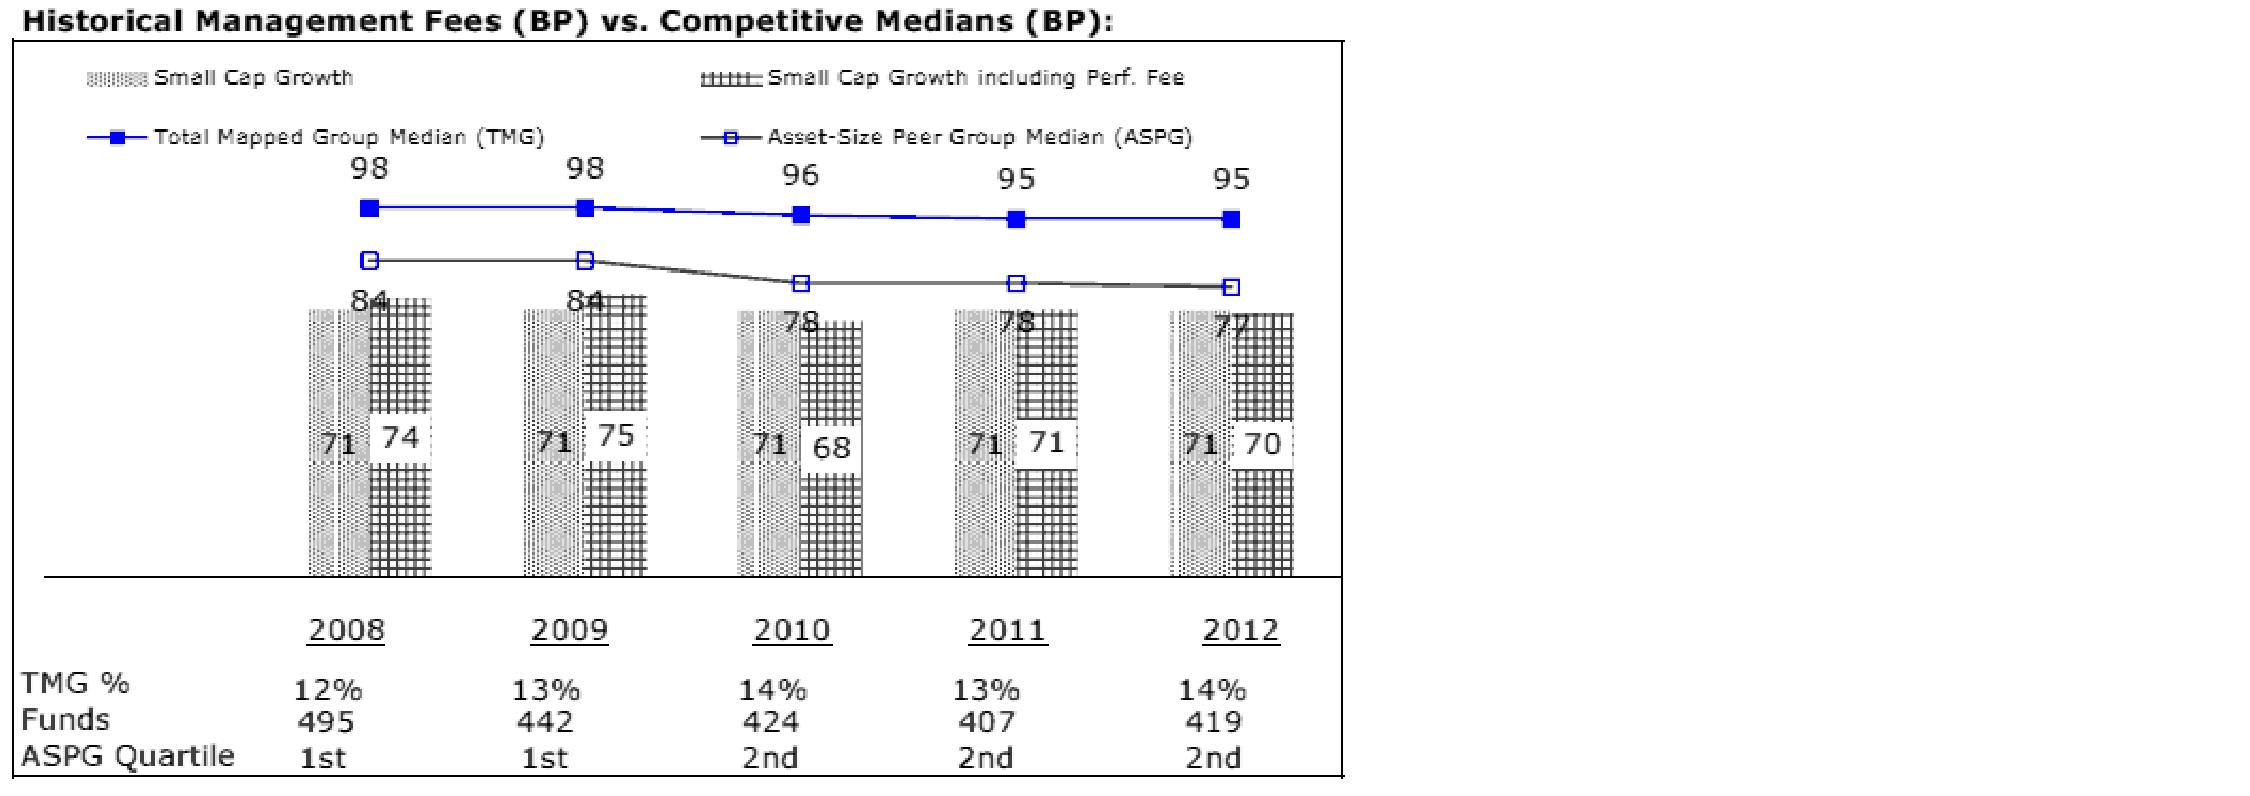
The Board noted that the fund's management fee ranked below the median of its Total Mapped Group and below the median of its ASPG for 2012. The Board also noted the effect of the fund's negative performance adjustment on the fund's management fee ranking.
Annual Report
Based on its review, the Board concluded that the fund's management fee is fair and reasonable in light of the services that the fund receives and the other factors considered.
Total Expense Ratio. In its review of each class's total expense ratio, the Board considered the fund's management fee as well as other fund or class expenses, as applicable, such as transfer agent fees, pricing and bookkeeping fees, fund-paid 12b-1 fees, and custodial, legal, and audit fees. The Board also noted the effects of any waivers and reimbursements on fees and expenses, as well as the impact of the fund's performance adjustment. As part of its review, the Board also considered the current and historical total expense ratios of each class of the fund compared to competitive fund median expenses. Each class of the fund is compared to those funds and classes in the Total Mapped Group (used by the Board for management fee comparisons) that have a similar sales load structure.
The Board noted that the total expense ratio of each of Class A, Class B, Class C, Institutional Class, the retail class, and Class F ranked below its competitive median for 2012 and the total expense ratio of Class T ranked above its competitive median for 2012. The Board considered that, in general, various factors can affect total expense ratios. The Board noted that the total expense ratio of Class T was above the competitive median primarily because of higher 12b-1 fees on Class T. Class T has a higher 12b-1 fee, but a lower front-end sales charge, than traditionally priced front-end sales charge classes. The Board considered that Class T is primarily sold load-waived in the retirement plan market where its 0.50% 12b-1 fee is comparable to competing no-load, higher 12b-1 fee classes designed specifically for retirement plans. The Board noted that the fund offers multiple classes, each of which has a different sales load and 12b-1 fee structure, and that the multiple structures are intended to offer a range of pricing options for the intermediary market. The Board also noted that the total expense ratios of the classes vary primarily by the level of their 12b-1 fees, although differences in transfer agent fees may also cause expenses to vary from class to class.
Fees Charged to Other Fidelity Clients. The Board also considered Fidelity fee structures and other information with respect to clients of FMR and its affiliates, such as other mutual funds advised or subadvised by FMR or its affiliates, pension plan clients, and other institutional clients. The Board noted the findings of the 2013 ad hoc joint committee (created with the board of other Fidelity funds), which reviewed and compared Fidelity's institutional investment advisory business with its business of providing services to the Fidelity funds, including the differences in services provided, fees charged, and costs incurred, as well as competition in their respective marketplaces.
Annual Report
Board Approval of Investment Advisory Contracts and
Management Fees - continued
Based on its review of total expense ratios and fees charged to other Fidelity clients, the Board concluded that the total expense ratio of each class of the fund was reasonable, although Class T was above the median of the universe presented for comparison, in light of the services that the fund and its shareholders receive and the other factors considered.
Costs of the Services and Profitability. The Board considered the revenues earned and the expenses incurred by Fidelity in conducting the business of developing, marketing, distributing, managing, administering and servicing the fund and servicing the fund's shareholders. The Board also considered the level of Fidelity's profits in respect of all the Fidelity funds.
On an annual basis, FMR presents to the Board Fidelity's profitability for the fund. Fidelity calculates the profitability for each fund, as well as aggregate profitability for groups of Fidelity funds and all Fidelity funds, using a series of detailed revenue and cost allocation methodologies which originate with the books and records of Fidelity on which Fidelity's audited financial statements are based. The Audit Committee of the Board reviews any significant changes from the prior year's methodologies.
PricewaterhouseCoopers LLP (PwC), independent registered public accounting firm and auditor to Fidelity and certain Fidelity funds, has been engaged annually by the Board as part of the Board's assessment of Fidelity's profitability analysis. PwC's engagement includes the review and assessment of the methodologies used by Fidelity in determining the revenues and expenses attributable to Fidelity's mutual fund business, and completion of agreed-upon procedures surrounding the mathematical accuracy of fund profitability and its conformity to allocation methodologies. After considering PwC's reports issued under the engagement and information provided by Fidelity, the Board concluded that while other allocation methods may also be reasonable, Fidelity's profitability methodologies are reasonable in all material respects.
The Board also reviewed Fidelity's non-fund businesses and fall-out benefits related to the mutual fund business as well as cases where Fidelity's affiliates may benefit from or be related to the fund's business.
The Board considered the costs of the services provided by and the profits realized by Fidelity in connection with the operation of the fund and was satisfied that the profitability was not excessive in the circumstances.
Economies of Scale. The Board considered whether there have been economies of scale in respect of the management of the Fidelity funds, whether the Fidelity funds (including the fund) have appropriately benefited from any such economies of scale, and whether there is potential for realization of any further economies of scale. The Board considered the extent to which the fund will benefit from economies of scale through increased services to the fund, through waivers or reimbursements, or through fee or expense reductions. The Board also noted that in 2009, it and the board of other Fidelity funds created an ad hoc committee (the Economies of Scale Committee) to analyze whether FMR attains economies of scale in respect of the management and servicing of the Fidelity funds, whether the Fidelity funds have appropriately benefited from such economies of scale, and whether there is potential for realization of any further economies of scale.
Annual Report
The Board recognized that the fund's management contract incorporates a "group fee" structure, which provides for lower group fee rates as total fund assets under FMR's management increase, and for higher group fee rates as total fund assets under FMR's management decrease. FMR calculates the group fee rates based on a tiered asset "breakpoint" schedule that varies based on asset class. The Board considered that the group fee is designed to deliver the benefits of economies of scale to fund shareholders when total Fidelity fund assets increase, even if assets of any particular fund are unchanged or have declined, because some portion of Fidelity's costs are attributable to services provided to all Fidelity funds, and all funds benefit if those costs can be allocated among more assets. The Board concluded that, given the group fee structure, fund shareholders will benefit from lower management fees as assets under FMR's management increase at the fund complex level, regardless of whether Fidelity achieves any such economies of scale.
The Board concluded, taking into account the analysis of the Economies of Scale Committee, that economies of scale, if any, are being appropriately shared between fund shareholders and Fidelity.
Amendment to Description of Group Fee Rate. At its July 2013 meeting, the Board voted to approve an amendment to the fund's management contract to modify the description of the "group fee rate" effective August 1, 2013. The Board noted that under the prior description in the contract, the group fee rate was based on the average net assets of all registered investment companies with which FMR has management contracts. Under the contract's tiered asset breakpoint schedule, the group fee rate is lower as total fund assets under FMR's management increase, and higher as total fund assets under FMR's management decrease. The Board considered that the prior description would have excluded the assets of 64 Fidelity sector funds from the group fee rate calculation once Fidelity SelectCo, LLC, an affiliate of FMR, assumed management responsibilities for those funds. The Board noted that modifying the description of the group fee rate to continue to include the assets of those 64 funds for purposes of determining group fee rate breakpoints would avoid an immediate adverse impact on the group fee rate for any fund.
Additional Information Requested by the Board. In order to develop fully the factual basis for consideration of the Fidelity funds' Advisory Contracts, the Board requested and received additional information on certain topics, including: (i) fund performance trends and Fidelity's long-term strategies for certain funds; (ii) the potential to further rationalize the Fidelity fund lineup with the possibility of achieving savings for the funds and Fidelity; (iii) the methodology with respect to competitive fund data and peer group classifications; (iv) the arrangements with, and performance of, certain sub-advisers on behalf of the Fidelity funds, as well as certain proposed participating affiliate arrangements; (v) the realization of fall-out benefits in certain Fidelity business units; (vi) Fidelity's group fee structures, including the rationale for the individual fee rates of certain categories of funds and the definition of group assets; (vii) trends regarding industry use of performance fee structures and the performance adjustment methodologies applicable to the Fidelity funds; (viii) additional competitive analysis regarding the total expenses for certain classes; and (ix) fund profitability methodology, including Fidelity's cost allocation methodology, and the impact of certain factors on fund profitability results.
Annual Report
Board Approval of Investment Advisory Contracts and
Management Fees - continued
Based on its evaluation of all of the conclusions noted above, and after considering all factors it believed relevant, the Board ultimately concluded that the advisory fee structures are fair and reasonable, and that the fund's Advisory Contracts should be renewed.
Annual Report
Investment Adviser
Fidelity Management & Research Company
Boston, MA
Investment Sub-Advisers
FMR Co., Inc.
Fidelity Management & Research
(U.K.) Inc.
Fidelity Management & Research
(Hong Kong) Limited
Fidelity Management & Research
(Japan) Inc.
General Distributor
Fidelity Distributors Corporation
Smithfield, RI
Transfer and Service Agents
Fidelity Investments Institutional
Operations Company, Inc.
Boston, MA
Fidelity Service Company, Inc.
Boston, MA
Custodian
Citibank, N.A.
New York, NY
(Fidelity Investment logo)(registered trademark)
ASCPI-UANN-0913
1.803721.108
(Fidelity Investment logo)(registered trademark)
Fidelity Advisor®
Small Cap Value
Fund - Class A, Class T,
Class B and Class C
Annual Report
July 31, 2013
(Fidelity Cover Art)
Class A, Class T, Class B
and Class C are classes of
Fidelity® Small Cap Value Fund
Contents
Performance | (Click Here) | How the fund has done over time. |
Management's Discussion of Fund Performance | (Click Here) | The Portfolio Manager's review of fund performance and strategy. |
Shareholder Expense Example | (Click Here) | An example of shareholder expenses. |
Investment Changes | (Click Here) | A summary of major shifts in the fund's investments over the past six months. |
Investments | (Click Here) | A complete list of the fund's investments with their market values. |
Financial Statements | (Click Here) | Statements of assets and liabilities, operations, and changes in net assets, as well as financial highlights. |
Notes | (Click Here) | Notes to the financial statements. |
Report of Independent Registered Public Accounting Firm | (Click Here) | |
Trustees and Officers | (Click Here) | |
Distributions | (Click Here) | |
Board Approval of Investment Advisory Contracts and Management Fees | (Click Here) | |
To view a fund's proxy voting guidelines and proxy voting record for the 12-month period ended June 30, visit http://www.fidelity.com/proxyvotingresults or visit the Securities and Exchange Commission's (SEC) web site at http://www.sec.gov. You may also call 1-877-208-0098 to request a free copy of the proxy voting guidelines.
Standard & Poor's, S&P and S&P 500 are registered service marks of The McGraw-Hill Companies, Inc. and have been licensed for use by Fidelity Distributors Corporation.
Other third-party marks appearing herein are the property of their respective owners.
All other marks appearing herein are registered or unregistered trademarks or service marks of FMR LLC or an affiliated company. © 2013 FMR LLC. All rights reserved.
Annual Report
This report and the financial statements contained herein are submitted for the general information of the shareholders of the fund. This report is not authorized for distribution to prospective investors in the fund unless preceded or accompanied by an effective prospectus.
A fund files its complete schedule of portfolio holdings with the SEC for the first and third quarters of each fiscal year on Form N-Q. Forms N-Q are available on the SEC's web site at http://www.sec.gov. A fund's Forms N-Q may be reviewed and copied at the SEC's Public Reference Room in Washington, DC. Information regarding the operation of the SEC's Public Reference Room may be obtained by calling 1-800-SEC-0330. For a complete list of a fund's portfolio holdings, view the most recent holdings listing, semiannual report, or annual report on Fidelity's web site at http://www.fidelity.com, http://www.advisor.fidelity.com, or http://www.401k.com, as applicable.
NOT FDIC INSURED • MAY LOSE VALUE • NO BANK GUARANTEE
Neither the fund nor Fidelity Distributors Corporation is a bank.
Annual Report
Average annual total return reflects the change in the value of an investment, assuming reinvestment of the class' distributions from dividend income and capital gains (the profits earned upon the sale of securities that have grown in value, if any) and assuming a constant rate of performance each year. The $10,000 table and the fund's returns do not reflect the deduction of taxes that a shareholder would pay on fund distributions or the redemption of fund shares. During periods of reimbursement by Fidelity, a fund's total return will be greater than it would be had the reimbursement not occurred. How a fund did yesterday is no guarantee of how it will do tomorrow. Returns reflect the conversion of Class B shares to Class A shares after a maximum of seven years.
Average Annual Total Returns
Periods ended July 31, 2013 | Past 1
year | Past 5
years | Life of
fundA |
Class A (incl. 5.75% sales charge) | 31.09% | 12.85% | 10.70% |
Class T (incl. 3.50% sales charge) | 33.85% | 13.11% | 10.73% |
Class B (incl. contingent deferred sales charge) B | 33.07% | 13.10% | 10.78% |
Class C (incl. contingent deferred sales charge) C | 37.00% | 13.35% | 10.62% |
A From November 3, 2004.
B Class B shares' contingent deferred sales charges included in the past one year, past five years, and life of fund total return figures are 5%, 2%, and 0%, respectively.
C Class C shares' contingent deferred sales charges included in the past one year, past five years, and life of fund total return figures are 1%, 0%, and 0%, respectively.
Annual Report
$10,000 Over Life of Fund
Let's say hypothetically that $10,000 was invested in Fidelity Advisor® Small Cap Value Fund - Class A on November 3, 2004, when the fund started, and the current 5.75% sales charge was paid. The chart shows how the value of your investment would have changed, and also shows how the Russell 2000® Value Index performed over the same period.
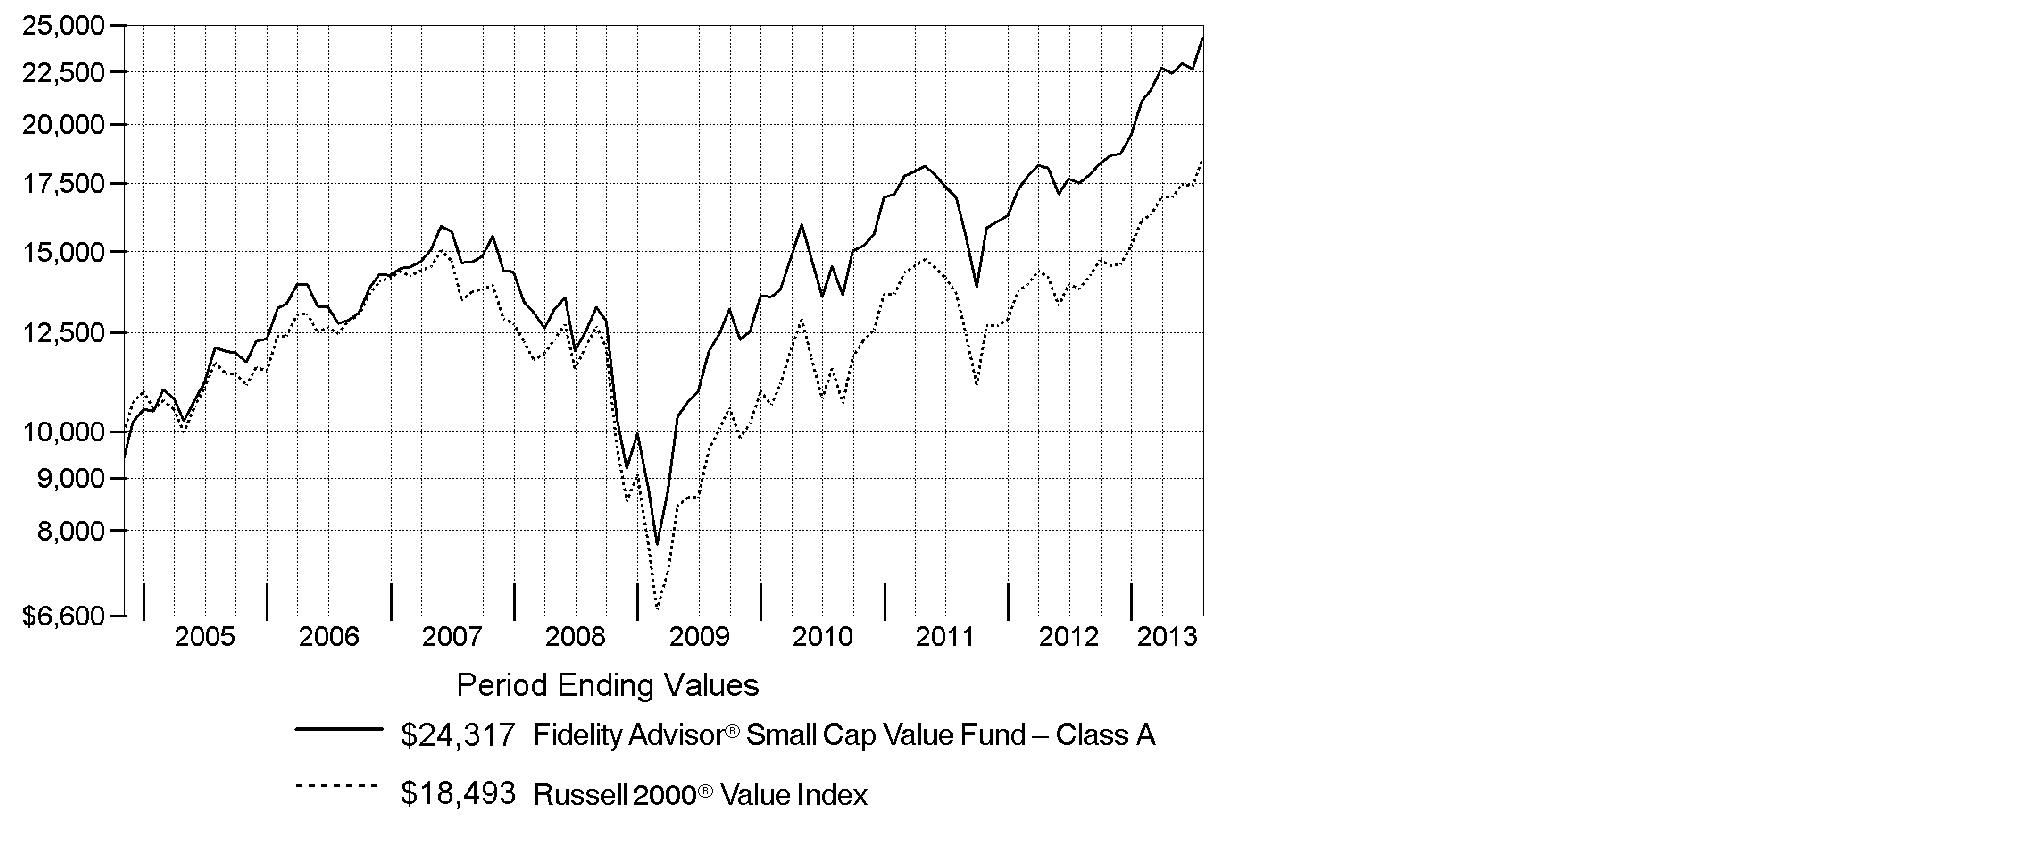
Annual Report
Market Recap: The bull run in U.S. stocks comfortably settled into a fifth year, as major equity benchmarks ripped through records during the 12 months ending July 31, 2013. Gains were fueled by a generally improving global economy and accommodative monetary policies worldwide. The tone was positive for most of the year, based largely on stronger U.S. economic data, including employment, housing and consumer sentiment. Setting a series of new highs along the way, the broad-based S&P 500® Index rose an impressive 25.00% for the 12 months, while the blue-chip-laden Dow Jones Industrial AverageSM also moved into record territory en route to a 22.36% gain. The growth-oriented Nasdaq Composite Index® had a similarly strong run, advancing 25.15%. During the year, markets were resilient amid intermittent volatility over debt woes in Europe, the 2012 U.S. presidential election and year-end Congressional gridlock over the federal budget. In mid-to-late June, concern arose about the U.S. Federal Reserve possibly tapering its sustaining bond-buying strategy - which prompted a brief, but steep, market sell-off. However, investors' continued quest for yield and the Fed's pledge to keep buying bonds until the economy showed significant improvement overpowered the uncertainty and helped equities climb notably higher in July to close the period on a strong note.
Comments from Charles Myers, who became Lead Portfolio Manager of Fidelity Advisor® Small Cap Value Fund on January 1, 2013: For the year, the fund's Class A, Class T, Class B and Class C shares returned 39.09%, 38.70%, 38.07% and 38.00%, respectively (excluding sales charges), versus 34.15% for the Russell 2000® Value Index. The biggest contribution, by far, came from the financials sector. Stock picking in consumer staples also added significant value, while industrials hurt. Our strategy emphasizes individual stock picking while striving to minimize the performance impact of other factors, including sector over- and underweightings. The fund's top individual contributor was apparel manufacturer Hanesbrands, whose business fundamentals continued to improve. Also helping was Japanese broker Monex Group - benefiting in part from investors' renewed interest in Japan - and CapitalSource, a small-business lender that, in late July, agreed to be acquired at a premium price. None of these contributors was in the benchmark, and Monex was sold from the fund in May. In contrast, the biggest detractor was market maker Knight Capital Group, whose shares plummeted last August after a software glitch cost the firm hundreds of millions of dollars. We sold the fund's stake soon after. GrafTech International, a maker of high-end graphite electrodes, also hurt results.
Note to shareholders: Derek Janssen became Co-Portfolio Manager on January 1, 2013.
The views expressed above reflect those of the portfolio manager(s) only through the end of the period as stated on the cover of this report and do not necessarily represent the views of Fidelity or any other person in the Fidelity organization. Any such views are subject to change at any time based upon market or other conditions and Fidelity disclaims any responsibility to update such views. These views may not be relied on as investment advice and, because investment decisions for a Fidelity fund are based on numerous factors, may not be relied on as an indication of trading intent on behalf of any Fidelity fund.
Annual Report
Shareholder Expense Example
As a shareholder of the Fund, you incur two types of costs: (1) transaction costs, including sales charges (loads) on purchase payments or redemption proceeds, redemption fees and (2) ongoing costs, including management fees, distribution and/or service (12b-1) fees and other Fund expenses. This Example is intended to help you understand your ongoing costs (in dollars) of investing in the Fund and to compare these costs with the ongoing costs of investing in other mutual funds.
The Example is based on an investment of $1,000 invested at the beginning of the period and held for the entire period (February 1, 2013 to July 31, 2013).
Actual Expenses
The first line of the accompanying table for each class of the Fund provides information about actual account values and actual expenses. You may use the information in this line, together with the amount you invested, to estimate the expenses that you paid over the period. Simply divide your account value by $1,000.00 (for example, an $8,600 account value divided by $1,000.00 = 8.6), then multiply the result by the number in the first line for a class of the Fund under the heading entitled "Expenses Paid During Period" to estimate the expenses you paid on your account during this period. A small balance maintenance fee of $12.00 that is charged once a year may apply for certain accounts with a value of less than $2,000. This fee is not included in the table below. If it was, the estimate of expenses you paid during the period would be higher, and your ending account value lower, by this amount. In addition, the Fund, as a shareholder in the underlying Fidelity Central Funds, will indirectly bear its pro-rata share of the fees and expenses incurred by the underlying Fidelity Central Funds. These fees and expenses are not included in the Fund's annualized expense ratio used to calculate the expense estimate in the table below.
Hypothetical Example for Comparison Purposes
The second line of the accompanying table for each class of the Fund provides information about hypothetical account values and hypothetical expenses based on a Class' actual expense ratio and an assumed rate of return of 5% per year before expenses, which is not the Class' actual return. The hypothetical account values and expenses may not be used to estimate the actual ending account balance or expenses you paid for the period. You may use this information to compare the ongoing costs of investing in the Fund and other funds. To do so, compare this 5% hypothetical example with the 5% hypothetical examples that appear in the shareholder reports of the other funds. A small balance maintenance fee of $12.00 that is charged once a year may apply for certain accounts with a value of less than $2,000. This fee is not included in the table below. If it was, the estimate of expenses you paid during the period would be higher, and your ending account value lower, by this amount. In addition, the Fund, as a shareholder in the underlying Fidelity Central Funds, will indirectly bear its pro-rata share of the fees and expenses incurred by the underlying Fidelity Central Funds. These fees and expenses are not included in the Fund's annualized expense ratio used to calculate the expense estimate in the table below.
Please note that the expenses shown in the table are meant to highlight your ongoing costs only and do not reflect any transaction costs. Therefore, the second line of the table is useful in comparing ongoing costs only, and will not help you determine the relative total costs of owning different funds. In addition, if these transactional costs were included, your costs would have been higher.
Annual Report
| Annualized
Expense Ratio B | Beginning
Account Value
February 1, 2013 | Ending
Account Value
July 31, 2013 | Expenses Paid
During Period*
February 1, 2013
to July 31, 2013 |
Class A | 1.37% | | | |
Actual | | $ 1,000.00 | $ 1,155.80 | $ 7.32 |
Hypothetical A | | $ 1,000.00 | $ 1,018.00 | $ 6.85 |
Class T | 1.61% | | | |
Actual | | $ 1,000.00 | $ 1,154.10 | $ 8.60 |
Hypothetical A | | $ 1,000.00 | $ 1,016.81 | $ 8.05 |
Class B | 2.17% | | | |
Actual | | $ 1,000.00 | $ 1,151.70 | $ 11.58 |
Hypothetical A | | $ 1,000.00 | $ 1,014.03 | $ 10.84 |
Class C | 2.13% | | | |
Actual | | $ 1,000.00 | $ 1,151.70 | $ 11.36 |
Hypothetical A | | $ 1,000.00 | $ 1,014.23 | $ 10.64 |
Small Cap Value | 1.08% | | | |
Actual | | $ 1,000.00 | $ 1,157.40 | $ 5.78 |
Hypothetical A | | $ 1,000.00 | $ 1,019.44 | $ 5.41 |
Class F | .86% | | | |
Actual | | $ 1,000.00 | $ 1,158.90 | $ 4.60 |
Hypothetical A | | $ 1,000.00 | $ 1,020.53 | $ 4.31 |
Institutional Class | 1.08% | | | |
Actual | | $ 1,000.00 | $ 1,157.30 | $ 5.78 |
Hypothetical A | | $ 1,000.00 | $ 1,019.44 | $ 5.41 |
A 5% return per year before expenses
B Annualized expense ratio reflects expenses net of applicable fee waivers.
* Expenses are equal to each Class' annualized expense ratio, multiplied by the average account value over the period, multiplied by 181/365 (to reflect the one-half year period).
Annual Report
Investment Changes (Unaudited)
Top Ten Stocks as of July 31, 2013 |
| % of fund's
net assets | % of fund's net assets
6 months ago |
Federated Investors, Inc. Class B (non-vtg.) | 3.2 | 0.6 |
Hanesbrands, Inc. | 3.2 | 2.5 |
TCF Financial Corp. | 2.8 | 2.9 |
Superior Energy Services, Inc. | 2.6 | 3.1 |
Tech Data Corp. | 2.3 | 2.2 |
CapitalSource, Inc. | 2.3 | 2.0 |
HNI Corp. | 2.3 | 2.5 |
j2 Global, Inc. | 2.2 | 1.3 |
DCT Industrial Trust, Inc. | 2.1 | 2.5 |
Berry Petroleum Co. Class A | 2.1 | 2.7 |
| 25.1 | |
Top Five Market Sectors as of July 31, 2013 |
| % of fund's
net assets | % of fund's net assets
6 months ago |
Financials | 37.7 | 36.2 |
Industrials | 14.7 | 14.6 |
Consumer Discretionary | 13.8 | 13.1 |
Information Technology | 13.6 | 11.7 |
Health Care | 5.2 | 6.0 |
Asset Allocation (% of fund's net assets) |
As of July 31, 2013* | As of January 31, 2013** |
 | Stocks 99.8% | | | Stocks 98.8% | |
 | Short-Term
Investments and
Net Other Assets (Liabilities) 0.2% | | | Short-Term
Investments and
Net Other Assets (Liabilities) 1.2% | |
* Foreign investments | 6.6% | | ** Foreign investments | 8.9% | |

Annual Report
Investments July 31, 2013
Showing Percentage of Net Assets
Common Stocks - 99.8% |
| Shares | | Value |
CONSUMER DISCRETIONARY - 13.8% |
Diversified Consumer Services - 1.3% |
Regis Corp. (e) | 3,316,000 | | $ 57,598,920 |
Household Durables - 1.7% |
Tempur-Pedic International, Inc. (a) | 1,800,000 | | 71,370,000 |
Media - 1.4% |
Valassis Communications, Inc. (d)(e) | 2,103,041 | | 60,210,064 |
Multiline Retail - 1.1% |
Big Lots, Inc. (a) | 1,250,000 | | 45,162,500 |
Specialty Retail - 5.0% |
Asbury Automotive Group, Inc. (a) | 1,070,000 | | 52,258,800 |
Genesco, Inc. (a) | 856,128 | | 60,254,289 |
Rent-A-Center, Inc. | 2,021,167 | | 80,826,468 |
Tsutsumi Jewelry Co. Ltd. | 795,800 | | 18,368,991 |
| | 211,708,548 |
Textiles, Apparel & Luxury Goods - 3.3% |
Hanesbrands, Inc. | 2,100,000 | | 133,266,000 |
Vera Bradley, Inc. (a)(d) | 231,000 | | 5,599,440 |
| | 138,865,440 |
TOTAL CONSUMER DISCRETIONARY | | 584,915,472 |
CONSUMER STAPLES - 1.6% |
Food Products - 1.6% |
Chiquita Brands International, Inc. (a) | 1,783,600 | | 21,545,888 |
Post Holdings, Inc. (a) | 984,700 | | 45,680,233 |
| | 67,226,121 |
Household Products - 0.0% |
Spectrum Brands Holdings, Inc. | 25,100 | | 1,416,142 |
TOTAL CONSUMER STAPLES | | 68,642,263 |
ENERGY - 4.8% |
Energy Equipment & Services - 2.7% |
ShawCor Ltd. | 100,900 | | 4,533,672 |
Superior Energy Services, Inc. (a) | 4,211,000 | | 107,885,820 |
| | 112,419,492 |
Common Stocks - continued |
| Shares | | Value |
ENERGY - continued |
Oil, Gas & Consumable Fuels - 2.1% |
Berry Petroleum Co. Class A | 2,156,970 | | $ 87,465,134 |
World Fuel Services Corp. | 56,000 | | 2,169,440 |
| | 89,634,574 |
TOTAL ENERGY | | 202,054,066 |
FINANCIALS - 37.7% |
Capital Markets - 4.7% |
Federated Investors, Inc. Class B (non-vtg.) (d) | 4,644,763 | | 134,837,471 |
Waddell & Reed Financial, Inc. Class A | 1,300,000 | | 66,378,000 |
| | 201,215,471 |
Commercial Banks - 12.8% |
Associated Banc-Corp. | 4,500,000 | | 76,230,000 |
CapitalSource, Inc. | 8,128,000 | | 98,348,800 |
City National Corp. | 1,200,000 | | 83,436,000 |
CVB Financial Corp. | 450,000 | | 5,890,500 |
First Citizen Bancshares, Inc. | 222,700 | | 46,655,650 |
National Penn Bancshares, Inc. | 4,400,000 | | 47,476,000 |
PacWest Bancorp | 1,900,000 | | 67,298,000 |
TCF Financial Corp. | 7,700,000 | | 117,348,000 |
| | 542,682,950 |
Consumer Finance - 2.5% |
Cash America International, Inc. (d) | 816,900 | | 34,309,800 |
EZCORP, Inc. (non-vtg.) Class A (a) | 1,779,788 | | 32,178,567 |
World Acceptance Corp. (a)(d) | 475,000 | | 39,558,000 |
| | 106,046,367 |
Insurance - 8.4% |
Aspen Insurance Holdings Ltd. | 2,300,000 | | 86,227,000 |
Endurance Specialty Holdings Ltd. | 1,486,000 | | 78,208,180 |
Platinum Underwriters Holdings Ltd. (e) | 1,466,099 | | 85,165,691 |
ProAssurance Corp. | 1,100,000 | | 58,883,000 |
StanCorp Financial Group, Inc. | 850,000 | | 45,126,500 |
| | 353,610,371 |
Real Estate Investment Trusts - 5.9% |
DCT Industrial Trust, Inc. | 11,980,586 | | 89,974,201 |
Franklin Street Properties Corp. | 4,800,000 | | 63,888,000 |
Common Stocks - continued |
| Shares | | Value |
FINANCIALS - continued |
Real Estate Investment Trusts - continued |
Highwoods Properties, Inc. (SBI) | 1,720,330 | | $ 62,413,572 |
National Retail Properties, Inc. | 900,000 | | 31,491,000 |
| | 247,766,773 |
Thrifts & Mortgage Finance - 3.4% |
Astoria Financial Corp. (e) | 5,199,999 | | 63,439,988 |
Washington Federal, Inc. | 3,652,100 | | 79,433,175 |
| | 142,873,163 |
TOTAL FINANCIALS | | 1,594,195,095 |
HEALTH CARE - 5.2% |
Health Care Equipment & Supplies - 1.9% |
Hill-Rom Holdings, Inc. | 1,060,000 | | 39,294,200 |
Integra LifeSciences Holdings Corp. (a) | 1,050,000 | | 41,359,500 |
| | 80,653,700 |
Health Care Providers & Services - 3.3% |
AmSurg Corp. (a) | 1,220,000 | | 47,714,200 |
Chemed Corp. | 490,700 | | 34,638,513 |
MEDNAX, Inc. (a) | 600,000 | | 58,452,000 |
| | 140,804,713 |
TOTAL HEALTH CARE | | 221,458,413 |
INDUSTRIALS - 14.7% |
Commercial Services & Supplies - 8.4% |
ACCO Brands Corp. (a)(e) | 10,630,885 | | 70,270,150 |
HNI Corp. (e) | 2,552,800 | | 97,287,208 |
Knoll, Inc. | 1,940,000 | | 32,048,800 |
Quad/Graphics, Inc. (d)(e) | 2,675,000 | | 75,007,000 |
United Stationers, Inc. | 1,980,800 | | 81,985,312 |
| | 356,598,470 |
Electrical Equipment - 2.7% |
EnerSys | 1,065,000 | | 56,359,800 |
GrafTech International Ltd. (a)(e) | 7,709,000 | | 57,971,680 |
| | 114,331,480 |
Common Stocks - continued |
| Shares | | Value |
INDUSTRIALS - continued |
Machinery - 1.5% |
Blount International, Inc. (a)(e) | 2,975,000 | | $ 39,210,500 |
Columbus McKinnon Corp. (NY Shares) (a)(e) | 1,050,000 | | 23,226,000 |
| | 62,436,500 |
Trading Companies & Distributors - 2.1% |
WESCO International, Inc. (a)(d) | 1,138,633 | | 86,285,609 |
TOTAL INDUSTRIALS | | 619,652,059 |
INFORMATION TECHNOLOGY - 13.6% |
Communications Equipment - 1.0% |
Polycom, Inc. (a) | 3,805,145 | | 36,377,186 |
ViaSat, Inc. (a) | 95,000 | | 6,345,050 |
| | 42,722,236 |
Electronic Equipment & Components - 5.3% |
Ingram Micro, Inc. Class A (a) | 3,435,000 | | 78,421,050 |
Ryoyo Electro Corp. | 1,110,600 | | 8,961,025 |
SYNNEX Corp. (a) | 790,000 | | 39,120,800 |
Tech Data Corp. (a)(e) | 1,923,707 | | 98,763,117 |
| | 225,265,992 |
Internet Software & Services - 2.2% |
j2 Global, Inc. (d) | 2,000,000 | | 91,540,000 |
IT Services - 2.0% |
CACI International, Inc. Class A (a)(d)(e) | 1,265,534 | | 84,031,458 |
Software - 3.1% |
Monotype Imaging Holdings, Inc. (e) | 2,499,731 | | 61,318,401 |
SS&C Technologies Holdings, Inc. (a) | 2,000,000 | | 71,560,000 |
| | 132,878,401 |
TOTAL INFORMATION TECHNOLOGY | | 576,438,087 |
MATERIALS - 4.5% |
Chemicals - 1.9% |
PolyOne Corp. | 2,800,000 | | 80,948,000 |
Metals & Mining - 2.6% |
Carpenter Technology Corp. | 438,880 | | 22,944,646 |
Common Stocks - continued |
| Shares | | Value |
MATERIALS - continued |
Metals & Mining - continued |
Haynes International, Inc. | 582,903 | | $ 28,037,634 |
RTI International Metals, Inc. (a)(e) | 1,880,000 | | 57,622,000 |
| | 108,604,280 |
TOTAL MATERIALS | | 189,552,280 |
UTILITIES - 3.9% |
Electric Utilities - 2.9% |
UIL Holdings Corp. | 1,550,000 | | 63,302,000 |
UNS Energy Corp. | 1,150,000 | | 58,477,500 |
| | 121,779,500 |
Gas Utilities - 1.0% |
Southwest Gas Corp. | 836,756 | | 41,536,568 |
TOTAL UTILITIES | | 163,316,068 |
TOTAL COMMON STOCKS (Cost $3,044,578,546) |
4,220,223,803
|
Money Market Funds - 2.0% |
| | | |
Fidelity Cash Central Fund, 0.11% (b) | 28,466,432 | | 28,466,432 |
Fidelity Securities Lending Cash Central Fund, 0.12% (b)(c) | 57,800,650 | | 57,800,650 |
TOTAL MONEY MARKET FUNDS (Cost $86,267,082) |
86,267,082
|
TOTAL INVESTMENT PORTFOLIO - 101.8% (Cost $3,130,845,628) | | 4,306,490,885 |
NET OTHER ASSETS (LIABILITIES) - (1.8)% | | (76,083,401) |
NET ASSETS - 100% | $ 4,230,407,484 |
Legend |
(a) Non-income producing |
(b) Affiliated fund that is generally available only to investment companies and other accounts managed by Fidelity Investments. The rate quoted is the annualized seven-day yield of the fund at period end. A complete unaudited listing of the fund's holdings as of its most recent quarter end is available upon request. In addition, each Fidelity Central Fund's financial statements, which are not covered by the Fund's Report of Independent Registered Public Accounting Firm, are available on the SEC's website or upon request. |
(c) Investment made with cash collateral received from securities on loan. |
(d) Security or a portion of the security is on loan at period end. |
(e) Affiliated company |
Affiliated Central Funds |
Information regarding fiscal year to date income earned by the Fund from investments in Fidelity Central Funds is as follows: |
Fund | Income earned |
Fidelity Cash Central Fund | $ 25,999 |
Fidelity Securities Lending Cash Central Fund | 546,053 |
Total | $ 572,052 |
Other Affiliated Issuers |
An affiliated company is a company in which the Fund has ownership of at least 5% of the voting securities. Fiscal year to date transactions with companies which are or were affiliates are as follows: |
Affiliate | Value, beginning of period | Purchases | Sales
Proceeds | Dividend Income | Value,
end of
period |
ACCO Brands Corp. | $ 18,634,000 | $ 60,186,015 | $ - | $ - | $ 70,270,150 |
Astoria Financial Corp. | 51,038,992 | - | 2,635,044 | 864,648 | 63,439,988 |
Blount International, Inc. | 37,039,161 | 4,861,737 | - | - | 39,210,500 |
CACI International, Inc. Class A | - | 70,903,692 | - | - | 84,031,458 |
Chiquita Brands International, Inc. | 17,482,500 | - | 18,750,066 | - | - |
Columbus McKinnon Corp. (NY Shares) | 15,414,197 | 33,512 | - | - | 23,226,000 |
Affiliate | Value, beginning of period | Purchases | Sales
Proceeds | Dividend Income | Value,
end of
period |
Forestar Group, Inc. | $ 22,724,438 | $ - | $ 37,180,120 | $ - | $ - |
Franklin Street Properties Corp. | 32,769,200 | 18,353,991 | - | 1,420,207 | - |
GrafTech International Ltd. | 62,334,250 | 15,596,640 | - | - | 57,971,680 |
HNI Corp. | 71,739,000 | - | 5,753,822 | 2,592,000 | 97,287,208 |
j2 Global, Inc. | 38,011,100 | 45,217,336 | 27,957,107 | 1,829,466 | - |
Miraial Co. Ltd. | 10,410,478 | - | 12,126,954 | 294,642 | - |
Monotype Imaging Holdings, Inc. | 38,936,219 | 295,917 | 4,511,476 | 533,522 | 61,318,401 |
PacWest Bancorp | 42,557,616 | 917,960 | - | 1,759,368 | - |
Platinum Underwriters Holdings Ltd. | 64,411,165 | - | 12,819,753 | 528,121 | 85,165,691 |
Quad/Graphics, Inc. | 28,908,484 | 12,835,355 | - | 8,161,250 | 75,007,000 |
Regis Corp. | 52,452,000 | 4,787,419 | 1,424,813 | 798,000 | 57,598,920 |
RTI International Metals, Inc. | 42,206,000 | - | - | - | 57,622,000 |
Ryoyo Electro Corp. | 20,552,790 | - | 7,311,306 | 462,475 | - |
Tech Data Corp. | 50,100,000 | 44,833,638 | - | - | 98,763,117 |
Valassis Communications, Inc. | 35,733,655 | 13,478,788 | - | 1,955,518 | 60,210,064 |
Western Liberty Bancorp | 2,879,407 | - | 3,071,972 | - | - |
Total | $ 756,334,652 | $ 292,302,000 | $ 133,542,433 | $ 21,199,217 | $ 931,122,177 |
Other Information |
All investments are categorized as Level 1 under the Fair Value Hierarchy. The inputs or methodology used for valuing securities may not be an indication of the risk associated with investing in those securities. For more information on valuation inputs, please refer to the Investment Valuation section in the accompanying Notes to Financial Statements. |
See accompanying notes which are an integral part of the financial statements.
Annual Report
Statement of Assets and Liabilities
| July 31, 2013 |
| | |
Assets | | |
Investment in securities, at value (including securities loaned of $56,776,323) - See accompanying schedule: Unaffiliated issuers (cost $2,332,604,982) | $ 3,289,101,626 | |
Fidelity Central Funds (cost $86,267,082) | 86,267,082 | |
Other affiliated issuers (cost $711,973,564) | 931,122,177 | |
Total Investments (cost $3,130,845,628) | | $ 4,306,490,885 |
Receivable for investments sold | | 4,040,206 |
Receivable for fund shares sold | | 4,754,743 |
Dividends receivable | | 2,311,882 |
Distributions receivable from Fidelity Central Funds | | 43,534 |
Other receivables | | 26,704 |
Total assets | | 4,317,667,954 |
| | |
Liabilities | | |
Payable for investments purchased | $ 4,404,382 | |
Payable for fund shares redeemed | 21,283,940 | |
Accrued management fee | 2,842,312 | |
Distribution and service plan fees payable | 168,389 | |
Other affiliated payables | 692,724 | |
Other payables and accrued expenses | 68,073 | |
Collateral on securities loaned, at value | 57,800,650 | |
Total liabilities | | 87,260,470 |
| | |
Net Assets | | $ 4,230,407,484 |
Net Assets consist of: | | |
Paid in capital | | $ 2,788,449,989 |
Undistributed net investment income | | 6,475,378 |
Accumulated undistributed net realized gain (loss) on investments and foreign currency transactions | | 259,835,177 |
Net unrealized appreciation (depreciation) on investments and assets and liabilities in foreign currencies | | 1,175,646,940 |
Net Assets | | $ 4,230,407,484 |
See accompanying notes which are an integral part of the financial statements.
Annual Report
Statement of Assets and Liabilities - continued
| July 31, 2013 |
| | |
Calculation of Maximum Offering Price Class A:
Net Asset Value and redemption price per share ($275,265,209 ÷ 13,787,655 shares) | | $ 19.96 |
| | |
Maximum offering price per share (100/94.25 of $19.96) | | $ 21.18 |
Class T:
Net Asset Value and redemption price per share ($107,443,503 ÷ 5,452,804 shares) | | $ 19.70 |
| | |
Maximum offering price per share (100/96.50 of $19.70) | | $ 20.41 |
Class B:
Net Asset Value and offering price per share ($7,052,013 ÷ 370,046 shares)A | | $ 19.06 |
| | |
Class C:
Net Asset Value and offering price per share ($76,018,400 ÷ 3,988,294 shares)A | | $ 19.06 |
| | |
Small Cap Value:
Net Asset Value, offering price and redemption price per share ($2,672,853,587 ÷ 132,174,679 shares) | | $ 20.22 |
| | |
Class F:
Net Asset Value, offering price and redemption price per share ($732,192,591 ÷ 36,098,957 shares) | | $ 20.28 |
| | |
Institutional Class:
Net Asset Value, offering price and redemption price per share ($359,582,181 ÷ 17,774,629 shares) | | $ 20.23 |
A Redemption price per share is equal to net asset value less any applicable contingent deferred sales charge.
See accompanying notes which are an integral part of the financial statements.
Annual Report
Financial Statements - continued
Statement of Operations
| Year ended July 31, 2013 |
| | |
Investment Income | | |
Dividends (including $21,199,217 earned from other affiliated issuers) | | $ 60,413,973 |
Interest | | 105 |
Income from Fidelity Central Funds | | 572,052 |
Total income | | 60,986,130 |
| | |
Expenses | | |
Management fee
Basic fee | $ 24,334,495 | |
Performance adjustment | 3,446,198 | |
Transfer agent fees | 6,387,168 | |
Distribution and service plan fees | 1,603,302 | |
Accounting and security lending fees | 964,201 | |
Custodian fees and expenses | 78,850 | |
Independent trustees' compensation | 20,817 | |
Registration fees | 179,627 | |
Audit | 69,056 | |
Legal | 9,520 | |
Interest | 508 | |
Miscellaneous | 27,296 | |
Total expenses before reductions | 37,121,038 | |
Expense reductions | (242,350) | 36,878,688 |
Net investment income (loss) | | 24,107,442 |
Realized and Unrealized Gain (Loss) Net realized gain (loss) on: | | |
Investment securities: | | |
Unaffiliated issuers | 283,388,788 | |
Other affiliated issuers | 17,171,945 | |
Foreign currency transactions | 124,131 | |
Total net realized gain (loss) | | 300,684,864 |
Change in net unrealized appreciation (depreciation) on: Investment securities | 820,353,456 | |
Assets and liabilities in foreign currencies | 1,060 | |
Total change in net unrealized appreciation (depreciation) | | 820,354,516 |
Net gain (loss) | | 1,121,039,380 |
Net increase (decrease) in net assets resulting from operations | | $ 1,145,146,822 |
See accompanying notes which are an integral part of the financial statements.
Annual Report
Statement of Changes in Net Assets
| Year ended
July 31,
2013 | Year ended
July 31,
2012 |
Increase (Decrease) in Net Assets | | |
Operations | | |
Net investment income (loss) | $ 24,107,442 | $ 9,490,811 |
Net realized gain (loss) | 300,684,864 | 99,657,152 |
Change in net unrealized appreciation (depreciation) | 820,354,516 | (37,724,900) |
Net increase (decrease) in net assets resulting
from operations | 1,145,146,822 | 71,423,063 |
Distributions to shareholders from net investment income | (21,412,021) | (3,813,704) |
Distributions to shareholders from net realized gain | (85,195,362) | (148,970,854) |
Total distributions | (106,607,383) | (152,784,558) |
Share transactions - net increase (decrease) | 507,448,391 | 230,904,084 |
Redemption fees | 726,904 | 569,163 |
Total increase (decrease) in net assets | 1,546,714,734 | 150,111,752 |
| | |
Net Assets | | |
Beginning of period | 2,683,692,750 | 2,533,580,998 |
End of period (including undistributed net investment income of $6,475,378 and undistributed net investment income of $4,596,351, respectively) | $ 4,230,407,484 | $ 2,683,692,750 |
See accompanying notes which are an integral part of the financial statements.
Annual Report
Financial Highlights - Class A
Years ended July 31, | 2013 | 2012 | 2011 | 2010 | 2009 |
Selected Per-Share Data | | | | | |
Net asset value, beginning of period | $ 14.86 | $ 15.48 | $ 13.45 | $ 11.13 | $ 11.82 |
Income from Investment Operations | | | | | |
Net investment income (loss) C | .07 | .01 | .01 F | .02 G | .08 |
Net realized and unrealized gain (loss) | 5.57 | .30 | 2.22 | 2.33 | (.60) |
Total from investment operations | 5.64 | .31 | 2.23 | 2.35 | (.52) |
Distributions from net investment income | (.07) | (.01) | (.08) | (.03) | (.06) |
Distributions from net realized gain | (.47) | (.93) | (.12) | - | (.11) |
Total distributions | (.54) | (.93) J | (.20) | (.03) | (.17) |
Redemption fees added to paid in capital C,I | - | - | - | - | - |
Net asset value, end of period | $ 19.96 | $ 14.86 | $ 15.48 | $ 13.45 | $ 11.13 |
Total Return A,B | 39.09% | 3.24% | 16.72% | 21.16% | (4.37)% |
Ratios to Average Net Assets D,H | | | | | |
Expenses before reductions | 1.36% | 1.44% | 1.44% | 1.47% | 1.45% |
Expenses net of fee waivers, if any | 1.36% | 1.44% | 1.43% | 1.40% | 1.40% |
Expenses net of all reductions | 1.36% | 1.44% | 1.43% | 1.39% | 1.40% |
Net investment income (loss) | .41% | .09% | .06% F | .17% G | .81% |
Supplemental Data | | | | | |
Net assets, end of period (000 omitted) | $ 275,265 | $ 150,285 | $ 140,707 | $ 96,994 | $ 55,029 |
Portfolio turnover rate E | 29% | 27% | 22% | 49% | 51% |
A Total returns would have been lower if certain expenses had not been reduced during the applicable periods shown.
B Total returns do not include the effect of the sales charges.
C Calculated based on average shares outstanding during the period.
D Fees and expenses of any underlying Fidelity Central Funds are not included in the Fund's expense ratio. The Fund indirectly bears its proportionate share of the expenses of any underlying Fidelity Central Funds.
E Amount does not include the portfolio activity of any underlying Fidelity Central Funds.
F Investment income per share reflects a large, non-recurring dividend which amounted to $.06 per share. Excluding this non-recurring dividend, the ratio of net investment income (loss) to average net assets would have been (.31)%.
G Investment income per share reflects a large, non-recurring dividend which amounted to $.03 per share. Excluding this non-recurring dividend, the ratio of net investment income (loss) to average net assets would have been (.10)%.
H Expense ratios reflect operating expenses of the class. Expenses before reductions do not reflect amounts reimbursed by the investment adviser or reductions from brokerage service arrangements or reductions from other expense offset arrangements and do not represent the amount paid by the class during periods when reimbursements or reductions occur. Expenses net of fee waivers reflect expenses after reimbursement by the investment adviser but prior to reductions from brokerage service arrangements or other expense offset arrangements. Expenses net of all reductions represent the net expenses paid by the class.
I Amount represents less than $.01 per share.
J Total distributions of $.93 per share is comprised of distributions from net investment income of $.006 and distributions from net realized gain of $.925 per share.
See accompanying notes which are an integral part of the financial statements.
Annual Report
Financial Highlights - Class T
Years ended July 31, | 2013 | 2012 | 2011 | 2010 | 2009 |
Selected Per-Share Data | | | | | |
Net asset value, beginning of period | $ 14.70 | $ 15.34 | $ 13.34 | $ 11.05 | $ 11.74 |
Income from Investment Operations | | | | | |
Net investment income (loss) C | .03 | (.02) | (.03) F | (.01) G | .05 |
Net realized and unrealized gain (loss) | 5.50 | .31 | 2.20 | 2.31 | (.59) |
Total from investment operations | 5.53 | .29 | 2.17 | 2.30 | (.54) |
Distributions from net investment income | (.06) | - | (.05) | (.01) | (.04) |
Distributions from net realized gain | (.47) | (.93) | (.12) | - | (.11) |
Total distributions | (.53) | (.93) | (.17) | (.01) | (.15) |
Redemption fees added to paid in capital C,I | - | - | - | - | - |
Net asset value, end of period | $ 19.70 | $ 14.70 | $ 15.34 | $ 13.34 | $ 11.05 |
Total Return A,B | 38.70% | 3.08% | 16.36% | 20.87% | (4.57)% |
Ratios to Average Net Assets D,H | | | | |
Expenses before reductions | 1.60% | 1.67% | 1.70% | 1.72% | 1.70% |
Expenses net of fee waivers, if any | 1.60% | 1.67% | 1.69% | 1.65% | 1.65% |
Expenses net of all reductions | 1.59% | 1.67% | 1.69% | 1.64% | 1.65% |
Net investment income (loss) | .18% | (.14)% | (.19)% F | (.08)% G | .56% |
Supplemental Data | | | | | |
Net assets, end of period (000 omitted) | $ 107,444 | $ 57,514 | $ 55,845 | $ 44,091 | $ 28,534 |
Portfolio turnover rate E | 29% | 27% | 22% | 49% | 51% |
A Total returns would have been lower if certain expenses had not been reduced during the applicable periods shown.
B Total returns do not include the effect of the sales charges.
C Calculated based on average shares outstanding during the period.
D Fees and expenses of any underlying Fidelity Central Funds are not included in the Fund's expense ratio. The Fund indirectly bears its proportionate share of the expenses of any underlying Fidelity Central Funds.
E Amount does not include the portfolio activity of any underlying Fidelity Central Funds.
F Investment income per share reflects a large, non-recurring dividend which amounted to $.06 per share. Excluding this non-recurring dividend, the ratio of net investment income (loss) to average net assets would have been (.57)%.
G Investment income per share reflects a large, non-recurring dividend which amounted to $.03 per share. Excluding this non-recurring dividend, the ratio of net investment income (loss) to average net assets would have been (.35)%.
H Expense ratios reflect operating expenses of the class. Expenses before reductions do not reflect amounts reimbursed by the investment adviser or reductions from brokerage service arrangements or reductions from other expense offset arrangements and do not represent the amount paid by the class during periods when reimbursements or reductions occur. Expenses net of fee waivers reflect expenses after reimbursement by the investment adviser but prior to reductions from brokerage service arrangements or other expense offset arrangements. Expenses net of all reductions represent the net expenses paid by the class.
I Amount represents less than $.01 per share.
See accompanying notes which are an integral part of the financial statements.
Annual Report
Financial Highlights - Class B
Years ended July 31, | 2013 | 2012 | 2011 | 2010 | 2009 |
Selected Per-Share Data | | | | | |
Net asset value, beginning of period | $ 14.27 | $ 15.00 | $ 13.08 | $ 10.88 | $ 11.60 |
Income from Investment Operations | | | | | |
Net investment income (loss) C | (.06) | (.09) | (.10) F | (.07) G | .01 |
Net realized and unrealized gain (loss) | 5.34 | .29 | 2.15 | 2.27 | (.59) |
Total from investment operations | 5.28 | .20 | 2.05 | 2.20 | (.58) |
Distributions from net investment income | (.02) | - | (.01) | - | (.03) |
Distributions from net realized gain | (.47) | (.93) | (.12) | - | (.11) |
Total distributions | (.49) | (.93) | (.13) | - | (.14) |
Redemption fees added to paid in capital C,I | - | - | - | - | - |
Net asset value, end of period | $ 19.06 | $ 14.27 | $ 15.00 | $ 13.08 | $ 10.88 |
Total Return A,B | 38.07% | 2.51% | 15.80% | 20.22% | (5.05)% |
Ratios to Average Net Assets D,H | | | | | |
Expenses before reductions | 2.15% | 2.19% | 2.20% | 2.22% | 2.20% |
Expenses net of fee waivers, if any | 2.15% | 2.19% | 2.19% | 2.15% | 2.15% |
Expenses net of all reductions | 2.14% | 2.19% | 2.19% | 2.14% | 2.15% |
Net investment income (loss) | (.37)% | (.66)% | (.69)% F | (.58)% G | .06% |
Supplemental Data | | | | | |
Net assets, end of period (000 omitted) | $ 7,052 | $ 6,675 | $ 8,549 | $ 9,747 | $ 7,153 |
Portfolio turnover rate E | 29% | 27% | 22% | 49% | 51% |
A Total returns would have been lower if certain expenses had not been reduced during the applicable periods shown.
B Total returns do not include the effect of the contingent deferred sales charge.
C Calculated based on average shares outstanding during the period.
D Fees and expenses of any underlying Fidelity Central Funds are not included in the Fund's expense ratio. The Fund indirectly bears its proportionate share of the expenses of any underlying Fidelity Central Funds.
E Amount does not include the portfolio activity of any underlying Fidelity Central Funds.
F Investment income per share reflects a large, non-recurring dividend which amounted to $.06 per share. Excluding this non-recurring dividend, the ratio of net investment income (loss) to average net assets would have been (1.07)%.
G Investment income per share reflects a large, non-recurring dividend which amounted to $.03 per share. Excluding this non-recurring dividend, the ratio of net investment income (loss) to average net assets would have been (.85)%.
H Expense ratios reflect operating expenses of the class. Expenses before reductions do not reflect amounts reimbursed by the investment adviser or reductions from brokerage service arrangements or reductions from other expense offset arrangements and do not represent the amount paid by the class during periods when reimbursements or reductions occur. Expenses net of fee waivers reflect expenses after reimbursement by the investment adviser but prior to reductions from brokerage service arrangements or other expense offset arrangements. Expenses net of all reductions represent the net expenses paid by the class.
I Amount represents less than $.01 per share.
See accompanying notes which are an integral part of the financial statements.
Annual Report
Financial Highlights - Class C
Years ended July 31, | 2013 | 2012 | 2011 | 2010 | 2009 |
Selected Per-Share Data | | | | | |
Net asset value, beginning of period | $ 14.28 | $ 15.01 | $ 13.08 | $ 10.89 | $ 11.60 |
Income from Investment Operations | | | | | |
Net investment income (loss) C | (.06) | (.09) | (.10) F | (.07) G | .01 |
Net realized and unrealized gain (loss) | 5.34 | .29 | 2.17 | 2.26 | (.58) |
Total from investment operations | 5.28 | .20 | 2.07 | 2.19 | (.57) |
Distributions from net investment income | (.03) | - | (.02) | - | (.03) |
Distributions from net realized gain | (.47) | (.93) | (.12) | - | (.11) |
Total distributions | (.50) | (.93) | (.14) | - | (.14) |
Redemption fees added to paid in capital C,I | - | - | - | - | - |
Net asset value, end of period | $ 19.06 | $ 14.28 | $ 15.01 | $ 13.08 | $ 10.89 |
Total Return A,B | 38.00% | 2.52% | 15.91% | 20.11% | (4.98)% |
Ratios to Average Net Assets D,H | | | | | |
Expenses before reductions | 2.13% | 2.19% | 2.18% | 2.22% | 2.20% |
Expenses net of fee waivers, if any | 2.13% | 2.19% | 2.18% | 2.15% | 2.15% |
Expenses net of all reductions | 2.12% | 2.19% | 2.18% | 2.14% | 2.15% |
Net investment income (loss) | (.35)% | (.66)% | (.68)% F | (.58)% G | .06% |
Supplemental Data | | | | | |
Net assets, end of period (000 omitted) | $ 76,018 | $ 47,265 | $ 47,457 | $ 37,346 | $ 21,345 |
Portfolio turnover rate E | 29% | 27% | 22% | 49% | 51% |
A Total returns would have been lower if certain expenses had not been reduced during the applicable periods shown.
B Total returns do not include the effect of the contingent deferred sales charge.
C Calculated based on average shares outstanding during the period.
D Fees and expenses of any underlying Fidelity Central Funds are not included in the Fund's expense ratio. The Fund indirectly bears its proportionate share of the expenses of any underlying Fidelity Central Funds.
E Amount does not include the portfolio activity of any underlying Fidelity Central Funds.
F Investment income per share reflects a large, non-recurring dividend which amounted to $.06 per share. Excluding this non-recurring dividend, the ratio of net investment income (loss) to average net assets would have been (1.06)%.
G Investment income per share reflects a large, non-recurring dividend which amounted to $.03 per share. Excluding this non-recurring dividend, the ratio of net investment income (loss) to average net assets would have been (.85)%.
H Expense ratios reflect operating expenses of the class. Expenses before reductions do not reflect amounts reimbursed by the investment adviser or reductions from brokerage service arrangements or reductions from other expense offset arrangements and do not represent the amount paid by the class during periods when reimbursements or reductions occur. Expenses net of fee waivers reflect expenses after reimbursement by the investment adviser but prior to reductions from brokerage service arrangements or other expense offset arrangements. Expenses net of all reductions represent the net expenses paid by the class.
I Amount represents less than $.01 per share.
See accompanying notes which are an integral part of the financial statements.
Annual Report
Financial Highlights - Small Cap Value
Years ended July 31, | 2013 | 2012 | 2011 | 2010 | 2009 |
Selected Per-Share Data | | | | | |
Net asset value, beginning of period | $ 15.05 | $ 15.62 | $ 13.56 | $ 11.22 | $ 11.91 |
Income from Investment Operations | | | | | |
Net investment income (loss) B | .12 | .06 | .06 E | .05 F | .10 |
Net realized and unrealized gain (loss) | 5.63 | .32 | 2.23 | 2.34 | (.60) |
Total from investment operations | 5.75 | .38 | 2.29 | 2.39 | (.50) |
Distributions from net investment income | (.11) | (.02) | (.10) | (.05) | (.08) |
Distributions from net realized gain | (.47) | (.93) | (.13) | - | (.11) |
Total distributions | (.58) | (.95) | (.23) | (.05) | (.19) |
Redemption fees added to paid in capital B,H | - | - | - | - | - |
Net asset value, end of period | $ 20.22 | $ 15.05 | $ 15.62 | $ 13.56 | $ 11.22 |
Total Return A | 39.45% | 3.67% | 17.03% | 21.32% | (4.15)% |
Ratios to Average Net Assets C,G | | | | |
Expenses before reductions | 1.07% | 1.13% | 1.13% | 1.18% | 1.20% |
Expenses net of fee waivers, if any | 1.07% | 1.13% | 1.13% | 1.18% | 1.20% |
Expenses net of all reductions | 1.06% | 1.13% | 1.13% | 1.17% | 1.20% |
Net investment income (loss) | .71% | .41% | .37% E | .39% F | 1.01% |
Supplemental Data | | | | | |
Net assets, end of period (000 omitted) | $ 2,672,854 | $ 1,756,962 | $ 1,899,805 | $ 1,770,675 | $ 1,488,736 |
Portfolio turnover rate D | 29% | 27% | 22% | 49% | 51% |
A Total returns would have been lower if certain expenses had not been reduced during the applicable periods shown.
B Calculated based on average shares outstanding during the period.
C Fees and expenses of any underlying Fidelity Central Funds are not included in the Fund's expense ratio. The Fund indirectly bears its proportionate share of the expenses of any underlying Fidelity Central Funds.
D Amount does not include the portfolio activity of any underlying Fidelity Central Funds.
E Investment income per share reflects a large, non-recurring dividend which amounted to $.06 per share. Excluding this non-recurring dividend, the ratio of net investment income (loss) to average net assets would have been (.01)%.
F Investment income per share reflects a large, non-recurring dividend which amounted to $.03 per share. Excluding this non-recurring dividend, the ratio of net investment income (loss) to average net assets would have been .12%.
G Expense ratios reflect operating expenses of the class. Expenses before reductions do not reflect amounts reimbursed by the investment adviser or reductions from brokerage service arrangements or reductions from other expense offset arrangements and do not represent the amount paid by the class during periods when reimbursements or reductions occur. Expenses net of fee waivers reflect expenses after reimbursement by the investment adviser but prior to reductions from brokerage service arrangements or other expense offset arrangements. Expenses net of all reductions represent the net expenses paid by the class.
H Amount represents less than $.01 per share.
See accompanying notes which are an integral part of the financial statements.
Annual Report
Financial Highlights - Class F
Years ended July 31, | 2013 | 2012 | 2011 | 2010 | 2009 I |
Selected Per-Share Data | | | | | |
Net asset value, beginning of period | $ 15.09 | $ 15.64 | $ 13.58 | $ 11.22 | $ 10.27 |
Income from Investment Operations | | | | |
Net investment income (loss) D | .16 | .09 | .09 G | .09 H | .01 |
Net realized and unrealized gain (loss) | 5.65 | .32 | 2.23 | 2.34 | .94 |
Total from investment operations | 5.81 | .41 | 2.32 | 2.43 | .95 |
Distributions from net investment income | (.15) | (.04) | (.14) | (.07) | - |
Distributions from net realized gain | (.47) | (.93) | (.13) | - | - |
Total distributions | (.62) | (.96) L | (.26) M | (.07) | - |
Redemption fees added to paid in capital D,K | - | - | - | - | - |
Net asset value, end of period | $ 20.28 | $ 15.09 | $ 15.64 | $ 13.58 | $ 11.22 |
Total Return B,C | 39.79% | 3.90% | 17.31% | 21.69% | 9.25% |
Ratios to Average Net Assets E,J | | | | | |
Expenses before reductions | .84% | .89% | .88% | .90% | .86% A |
Expenses net of fee waivers, if any | .84% | .89% | .88% | .90% | .86% A |
Expenses net of all reductions | .84% | .89% | .88% | .89% | .86% A |
Net investment income (loss) | .93% | .64% | .61% G | .67% H | .64% A |
Supplemental Data | | | | | |
Net assets, end of period (000 omitted) | $ 732,193 | $ 526,009 | $ 279,653 | $ 109,868 | $ 159 |
Portfolio turnover rate F | 29% | 27% | 22% | 49% | 51% |
A Annualized
B Total returns for periods of less than one year are not annualized.
C Total returns would have been lower if certain expenses had not been reduced during the applicable periods shown.
D Calculated based on average shares outstanding during the period.
E Fees and expenses of any underlying Fidelity Central Funds are not included in the Fund's expense ratio. The Fund indirectly bears its proportionate share of the expenses of any underlying Fidelity Central Funds.
F Amount does not include the portfolio activity of any underlying Fidelity Central Funds.
G Investment income per share reflects a large, non-recurring dividend which amounted to $.06 per share. Excluding this non-recurring dividend, the ratio of net investment income (loss) to average net assets would have been .24%.
H Investment income per share reflects a large, non-recurring dividend which amounted to $.03 per share. Excluding this non-recurring dividend, the ratio of net investment income (loss) to average net assets would have been .40%.
I For the period June 26, 2009 (commencement of sale of shares) to July 31, 2009.
J Expense ratios reflect operating expenses of the class. Expenses before reductions do not reflect amounts reimbursed by the investment adviser or reductions from brokerage service arrangements or reductions from other expense offset arrangements and do not represent the amount paid by the class during periods when reimbursements or reductions occur. Expense ratios before reductions for start-up periods may not be representative of longer-term operating periods. Expenses net of fee waivers reflect expenses after reimbursement by the investment adviser but prior to reductions from brokerage service arrangements or other expense offset arrangements. Expenses net of all reductions represent the net expenses paid by the class.
K Amount represents less than $.01 per share.
L Total distributions of $.96 per share is comprised of distributions from net investment income of $.036 and distributions from net realized gain of $.925 per share.
M Total distributions of $.26 per share is comprised of distributions from net investment income of $.138 and distributions from net realized gain of $.126 per share.
See accompanying notes which are an integral part of the financial statements.
Annual Report
Financial Highlights - Institutional Class
Years ended July 31, | 2013 | 2012 | 2011 | 2010 | 2009 |
Selected Per-Share Data | | | | | |
Net asset value, beginning of period | $ 15.05 | $ 15.63 | $ 13.58 | $ 11.24 | $ 11.91 |
Income from Investment Operations | | | | | |
Net investment income (loss) B | .12 | .06 | .06 E | .06 F | .10 |
Net realized and unrealized gain (loss) | 5.65 | .31 | 2.23 | 2.34 | (.59) |
Total from investment operations | 5.77 | .37 | 2.29 | 2.40 | (.49) |
Distributions from net investment income | (.12) | (.02) | (.11) | (.06) | (.07) |
Distributions from net realized gain | (.47) | (.93) | (.13) | - | (.11) |
Total distributions | (.59) | (.95) | (.24) | (.06) | (.18) |
Redemption fees added to paid in capital B,H | - | - | - | - | - |
Net asset value, end of period | $ 20.23 | $ 15.05 | $ 15.63 | $ 13.58 | $ 11.24 |
Total Return A | 39.54% | 3.59% | 17.02% | 21.42% | (4.04)% |
Ratios to Average Net Assets C,G | | | | | |
Expenses before reductions | 1.07% | 1.14% | 1.10% | 1.12% | 1.20% |
Expenses net of fee waivers, if any | 1.07% | 1.14% | 1.10% | 1.12% | 1.15% |
Expenses net of all reductions | 1.06% | 1.14% | 1.10% | 1.12% | 1.15% |
Net investment income (loss) | .70% | .39% | .39% E | .45% F | 1.06% |
Supplemental Data | | | | | |
Net assets, end of period (000 omitted) | $ 359,582 | $ 138,981 | $ 101,565 | $ 78,440 | $ 10,336 |
Portfolio turnover rate D | 29% | 27% | 22% | 49% | 51% |
A Total returns would have been lower if certain expenses had not been reduced during the applicable periods shown.
B Calculated based on average shares outstanding during the period.
C Fees and expenses of any underlying Fidelity Central Funds are not included in the Fund's expense ratio. The Fund indirectly bears its proportionate share of the expenses of any underlying Fidelity Central Funds.
D Amount does not include the portfolio activity of any underlying Fidelity Central Funds.
E Investment income per share reflects a large, non-recurring dividend which amounted to $.06 per share. Excluding this non-recurring dividend, the ratio of net investment income (loss) to average net assets would have been .01%.
F Investment income per share reflects a large, non-recurring dividend which amounted to $.03 per share. Excluding this non-recurring dividend, the ratio of net investment income (loss) to average net assets would have been .18%.
G Expense ratios reflect operating expenses of the class. Expenses before reductions do not reflect amounts reimbursed by the investment adviser or reductions from brokerage service arrangements or reductions from other expense offset arrangements and do not represent the amount paid by the class during periods when reimbursements or reductions occur. Expenses net of fee waivers reflect expenses after reimbursement by the investment adviser but prior to reductions from brokerage service arrangements or other expense offset arrangements. Expenses net of all reductions represent the net expenses paid by the class.
H Amount represents less than $.01 per share.
See accompanying notes which are an integral part of the financial statements.
Annual Report
Notes to Financial Statements
For the period ended July 31, 2013
1. Organization.
Fidelity Small Cap Value Fund (the Fund) is a fund of Fidelity Securities Fund (the Trust) and is authorized to issue an unlimited number of shares. The Trust is registered under the Investment Company Act of 1940, as amended (the 1940 Act), as an open-end management investment company organized as a Massachusetts business trust. The Fund offers Class A, Class T, Class C, Small Cap Value, Class F and Institutional Class shares, each of which, along with Class B shares, has equal rights as to assets and voting privileges. Class B shares are closed to new accounts and additional purchases, except for exchanges and reinvestments. Effective after the close of business on March 1, 2013, the Fund's other share classes were closed to new accounts with certain exceptions. Each class has exclusive voting rights with respect to matters that affect that class. Class F shares of the Fund are only available for purchase by mutual funds for which Fidelity Management & Research Company (FMR) or an affiliate serves as investment manager. Class B shares will automatically convert to Class A shares after a holding period of seven years from the initial date of purchase.
2. Investments in Fidelity Central Funds.
The Fund invests in Fidelity Central Funds, which are open-end investment companies generally available only to other investment companies and accounts managed by FMR and its affiliates. The Fund's Schedule of Investments lists each of the Fidelity Central Funds held as of period end, if any, as an investment of the Fund, but does not include the underlying holdings of each Fidelity Central Fund. As an Investing Fund, the Fund indirectly bears its proportionate share of the expenses of the underlying Fidelity Central Funds.
The Money Market Central Funds seek preservation of capital and current income and are managed by Fidelity Investments Money Management, Inc. (FIMM), an affiliate of FMR.
A complete unaudited list of holdings for each Fidelity Central Fund is available upon request or at the Securities and Exchange Commission (the SEC) website at www.sec.gov. In addition, the financial statements of the Fidelity Central Funds, which are not covered by the Fund's Report of Independent Registered Public Accounting Firm, are available on the SEC website or upon request.
3. Significant Accounting Policies.
The financial statements have been prepared in conformity with accounting principles generally accepted in the United States of America (GAAP), which require management to make certain estimates and assumptions at the date of the financial statements. Actual results could differ from those estimates. Subsequent events, if any, through the date that the financial statements were issued have been evaluated in the preparation of
Annual Report
Notes to Financial Statements - continued
3. Significant Accounting Policies - continued
the financial statements. The following summarizes the significant accounting policies of the Fund:
Investment Valuation. Investments are valued as of 4:00 p.m. Eastern time on the last calendar day of the period. In accordance with valuation policies and procedures approved by the Board of Trustees (the Board), the Fund attempts to obtain prices from one or more third party pricing vendors or brokers to value its investments. When current market prices, quotations or currency exchange rates are not readily available or reliable, investments will be fair valued in good faith by the FMR Fair Value Committee (the Committee), in accordance with procedures adopted by the Board. Factors used in determining fair value vary by investment type and may include market or investment specific events. The frequency with which these procedures are used cannot be predicted and they may be utilized to a significant extent. The Committee oversees the Fund's valuation policies and procedures and is responsible for approving and reporting to the Board all fair value determinations.
The Fund categorizes the inputs to valuation techniques used to value its investments into a disclosure hierarchy consisting of three levels as shown below:
Level 1 - quoted prices in active markets for identical investments
Level 2 - other significant observable inputs (including quoted prices for similar investments, interest rates, prepayment speeds, etc.)
Level 3 - unobservable inputs (including the Fund's own assumptions based on the best information available)
Valuation techniques used to value the Fund's investments by major category are as follows:
Equity securities, including restricted securities, for which market quotations are readily available, are valued at the last reported sale price or official closing price as reported by a third party pricing vendor on the primary market or exchange on which they are traded and are categorized as Level 1 in the hierarchy. In the event there were no sales during the day or closing prices are not available, securities are valued at the last quoted bid price or may be valued using the last available price and are generally categorized as Level 2 in the hierarchy. For foreign equity securities, when market or security specific events arise, comparisons to the valuation of American Depositary Receipts (ADRs), futures contracts, Exchange-Traded Funds (ETFs) and certain indexes as well as quoted prices for similar securities may be used and would be categorized as Level 2 in the hierarchy. Utilizing these techniques may result in transfers between Level 1 and Level 2.
Annual Report
3. Significant Accounting Policies - continued
Investment Valuation - continued
Investments in open-end mutual funds, including the Fidelity Central Funds, are valued at their closing net asset value (NAV) each business day and are categorized as Level 1 in the hierarchy.
Changes in valuation techniques may result in transfers in or out of an assigned level within the disclosure hierarchy.
Foreign Currency. The Fund may use foreign currency contracts to facilitate transactions in foreign-denominated securities. Gains and losses from these transactions may arise from changes in the value of the foreign currency or if the counterparties do not perform under the contracts' terms.
Foreign-denominated assets, including investment securities, and liabilities are translated into U.S. dollars at the exchange rates at period end. Purchases and sales of investment securities, income and dividends received and expenses denominated in foreign currencies are translated into U.S. dollars at the exchange rate in effect on the transaction date.
The effects of exchange rate fluctuations on investments are included with the net realized and unrealized gain (loss) on investment securities. Other foreign currency transactions resulting in realized and unrealized gain (loss) are disclosed separately.
Investment Transactions and Income. For financial reporting purposes, the Fund's investment holdings and NAV include trades executed through the end of the last business day of the period. The NAV per share for processing shareholder transactions is calculated as of the close of business of the New York Stock Exchange (NYSE), normally 4:00 p.m. Eastern time and includes trades executed through the end of the prior business day. Gains and losses on securities sold are determined on the basis of identified cost and may include proceeds received from litigation. Dividend income is recorded on the ex-dividend date, except for certain dividends from foreign securities where the ex-dividend date may have passed, which are recorded as soon as the Fund is informed of the ex-dividend date. Non-cash dividends included in dividend income, if any, are recorded at the fair market value of the securities received. Distributions received on securities that represent a return of capital or capital gain are recorded as a reduction of cost of investments and/or as a realized gain. Subsequent to ex-dividend date the Fund determines the components of these distributions, based upon receipt of tax filings or other correspondence relating to the underlying investment. Interest income and distributions from the Fidelity Central Funds are accrued as earned. Interest income includes coupon interest and amortization of premium and accretion of discount on debt securities. Investment income is recorded net of foreign taxes withheld where recovery of such taxes is uncertain.
Annual Report
Notes to Financial Statements - continued
3. Significant Accounting Policies - continued
Class Allocations and Expenses. Investment income, realized and unrealized capital gains and losses, common expenses of the Fund, and certain fund-level expense reductions, if any, are allocated on a pro-rata basis to each class based on the relative net assets of each class to the total net assets of the Fund. Each class differs with respect to transfer agent and distribution and service plan fees incurred. Certain expense reductions may also differ by class. Expenses directly attributable to a fund are charged to that fund. Expenses attributable to more than one fund are allocated among the respective funds on the basis of relative net assets or other appropriate methods. Expense estimates are accrued in the period to which they relate and adjustments are made when actual amounts are known.
Income Tax Information and Distributions to Shareholders. Each year, the Fund intends to qualify as a regulated investment company under Subchapter M of the Internal Revenue Code, including distributing substantially all of its taxable income and realized gains. As a result, no provision for income taxes is required. As of July 31, 2013, the Fund did not have any unrecognized tax benefits in the financial statements; nor is the Fund aware of any tax positions for which it is reasonably possible that the total amounts of unrecognized tax benefits will significantly change in the next twelve months. The Fund files a U.S. federal tax return, in addition to state and local tax returns as required. A fund's federal income tax returns are subject to examination by the Internal Revenue Service (IRS) for a period of three fiscal years after they are filed. State and local tax returns may be subject to examination for an additional fiscal year depending on the jurisdiction. Foreign taxes are provided for based on the Fund's understanding of the tax rules and rates that exist in the foreign markets in which it invests.
Distributions are declared and recorded on the ex-dividend date. Income dividends and capital gain distributions are declared separately for each class. Income and capital gain distributions are determined in accordance with income tax regulations, which may differ from GAAP. In addition, the Fund claimed a portion of the payment made to redeeming shareholders as a distribution for income tax purposes.
Capital accounts within the financial statements are adjusted for permanent book-tax differences. These adjustments have no impact on net assets or the results of operations. Temporary book-tax differences will reverse in a subsequent period.
Book-tax differences are primarily due to foreign currency transactions and losses deferred due to wash sales.
Annual Report
3. Significant Accounting Policies - continued
Income Tax Information and Distributions to Shareholders - continued
The federal tax cost of investment securities and unrealized appreciation (depreciation) as of period end were as follows:
Gross unrealized appreciation | $ 1,227,810,766 |
Gross unrealized depreciation | (53,133,128) |
Net unrealized appreciation (depreciation) on securities and other investments | $ 1,174,677,638 |
| |
Tax Cost | $ 3,131,813,247 |
The tax-based components of distributable earnings as of period end were as follows:
Undistributed ordinary income | $ 6,475,378 |
Undistributed long-term capital gain | $ 260,802,795 |
Net unrealized appreciation (depreciation) | $ 1,174,679,321 |
The tax character of distributions paid was as follows:
| July 31, 2013 | July 31, 2012 |
Ordinary Income | $ 21,412,021 | $ 3,813,704 |
Long-term Capital Gains | 85,195,362 | 148,970,854 |
Total | $ 106,607,383 | $ 152,784,558 |
Short-Term Trading (Redemption) Fees. Shares held by investors in the Fund less than 90 days may have been subject to a redemption fee equal to 1.50% of the net asset value of shares redeemed. All redemption fees, which reduce the proceeds of the shareholder redemption, are retained by the Fund and accounted for as an addition to paid in capital.
4. Purchases and Sales of Investments.
Purchases and sales of securities, other than short-term securities, aggregated $1,422,626,355 and $998,724,082, respectively.
5. Fees and Other Transactions with Affiliates.
Management Fee. FMR and its affiliates provide the Fund with investment management related services for which the Fund pays a monthly management fee. The management fee is the sum of an individual fund fee rate that is based on an annual rate of .45% of the Fund's average net assets and an annualized group fee rate that averaged .26% during the period. The group fee rate is based upon the average net assets of all the
Annual Report
Notes to Financial Statements - continued
5. Fees and Other Transactions with Affiliates - continued
Management Fee - continued
mutual funds advised by FMR. The group fee rate decreases as assets under management increase and increases as assets under management decrease. In addition, the management fee is subject to a performance adjustment (up to a maximum of ± .20% of the Fund's average net assets over a 36 month performance period). The upward or downward adjustment to the management fee is based on the relative investment performance of Small Cap Value as compared to an appropriate benchmark index. For the period, the total annual management fee rate, including the performance adjustment, was .81% of the Fund's average net assets.
Distribution and Service Plan Fees. In accordance with Rule 12b-1 of the 1940 Act, the Fund has adopted separate Distribution and Service Plans for each class of shares. Certain classes pay Fidelity Distributors Corporation (FDC), an affiliate of FMR, separate Distribution and Service Fees, each of which is based on an annual percentage of each class' average net assets. In addition, FDC may pay financial intermediaries for selling shares of the Fund and providing shareholder support services. For the period, the Distribution and Service Fee rates, total fees and amounts retained by FDC were as follows:
| Distribution
Fee | Service
Fee | Total Fees | Retained
by FDC |
Class A | -% | .25% | $ 521,981 | $ 17,754 |
Class T | .25% | .25% | 393,892 | 3,578 |
Class B | .75% | .25% | 69,430 | 52,493 |
Class C | .75% | .25% | 617,999 | 153,559 |
| | | $ 1,603,302 | $ 227,384 |
Sales Load. FDC may receive a front-end sales charge of up to 5.75% for selling Class A shares and 3.50% for selling Class T shares, some of which is paid to financial intermediaries for selling shares of the Fund. Depending on the holding period, FDC may receive contingent deferred sales charges levied on Class A, Class T, Class B and Class C redemptions. The deferred sales charges range from 5.00% to 1.00% for Class B shares, 1.00% for Class C shares, 1.00% for certain purchases of Class A shares and .25% for certain purchases of Class T shares.
Annual Report
5. Fees and Other Transactions with Affiliates - continued
Sales Load - continued
For the period, sales charge amounts retained by FDC were as follows:
| Retained
by FDC |
Class A | $ 49,310 |
Class T | 9,353 |
Class B* | 5,848 |
Class C* | 4,577 |
| $ 69,088 |
* When Class B and Class C shares are initially sold, FDC pays commissions from its own resources to financial intermediaries through which the sales are made.
Transfer Agent Fees. Fidelity Investments Institutional Operations Company, Inc., (FIIOC), an affiliate of FMR, is the transfer, dividend disbursing and shareholder servicing agent for each class of the Fund. FIIOC receives account fees and asset-based fees that vary according to the account size and type of account of the shareholders of the respective classes of the Fund, except for Class F. FIIOC receives no fees for providing transfer agency services to Class F. FIIOC pays for typesetting, printing and mailing of shareholder reports, except proxy statements. For the period, transfer agent fees for each class were as follows:
| Amount | % of
Average
Net Assets |
Class A | $ 563,024 | .27 |
Class T | 199,649 | .25 |
Class B | 20,848 | .30 |
Class C | 175,062 | .28 |
Small Cap Value | 4,868,907 | .22 |
Institutional Class | 559,678 | .23 |
| $ 6,387,168 | |
Accounting and Security Lending Fees. Fidelity Service Company, Inc. (FSC), an affiliate of FMR, maintains the Fund's accounting records. The accounting fee is based on the level of average net assets for each month. Under a separate contract, FSC administers the security lending program. The security lending fee is based on the number and duration of lending transactions.
Brokerage Commissions. The Fund placed a portion of its portfolio transactions with brokerage firms which are affiliates of the investment adviser. Brokerage commissions are included in net realized gain (loss) and change in net unrealized appreciation
Annual Report
Notes to Financial Statements - continued
5. Fees and Other Transactions with Affiliates - continued
Brokerage Commissions - continued
(depreciation) in the Statement of Operations. The commissions paid to these affiliated firms were $28,205 for the period.
Interfund Lending Program. Pursuant to an Exemptive Order issued by the SEC, the Fund, along with other registered investment companies having management contracts with FMR, may participate in an interfund lending program. This program provides an alternative credit facility allowing the funds to borrow from, or lend money to, other participating affiliated funds. At period end, there were no interfund loans outstanding. The Fund's activity in this program during the period for which loans were outstanding was as follows:
Borrower or Lender | Average Loan
Balance | Weighted Average Interest Rate | Interest
Expense |
Borrower | $ 5,199,400 | .35% | $ 508 |
6. Committed Line of Credit.
The Fund participates with other funds managed by FMR or an affiliate in a $4.25 billion credit facility (the "line of credit") to be utilized for temporary or emergency purposes to fund shareholder redemptions or for other short-term liquidity purposes. The Fund has agreed to pay commitment fees on its pro-rata portion of the line of credit, which amounted to $7,721 and is reflected in Miscellaneous expenses on the Statement of Operations. During the period, there were no borrowings on this line of credit.
7. Security Lending.
The Fund lends portfolio securities through a lending agent from time to time in order to earn additional income. For equity securities, a lending agent is used and may loan securities to certain qualified borrowers, including Fidelity Capital Markets (FCM), a broker-dealer affiliated with the Fund. On the settlement date of the loan, the Fund receives collateral (in the form of U.S. Treasury obligations, letters of credit and/or cash) against the loaned securities and maintains collateral in an amount not less than 100% of the market value of the loaned securities during the period of the loan. The market value of the loaned securities is determined at the close of business of the Fund and any additional required collateral is delivered to the Fund on the next business day. If the borrower defaults on its obligation to return the securities loaned because of insolvency or other reasons, the Fund may apply collateral received from the borrower against the obligation. The Fund may experience delays and costs in recovering the securities loaned. Any cash collateral received is invested in the Fidelity Securities Lending Cash Central Fund. The value of loaned securities and cash collateral at period end are
Annual Report
7. Security Lending - continued
disclosed on the Fund's Statement of Assets and Liabilities. The value of securities loaned to FCM at period end was $3,995,700. Security lending income represents the income earned on investing cash collateral, less rebates paid to borrowers and any lending agent fees associated with the loan, plus any premium payments received for lending certain types of securities. Security lending income is presented in the Statement of Operations as a component of income from Fidelity Central Funds. Total security lending income during the period amounted to $546,053, including $146,197 from securities loaned to FCM.
8. Expense Reductions.
Commissions paid to certain brokers with whom FMR places trades on behalf of the Fund include an amount in addition to trade execution, which is rebated back to the Fund to offset certain expenses. This amount totaled $235,596 for the period.
In addition, FMR reimbursed a portion of the Fund's operating expenses during the period in the amount of $6,754.
9. Distributions to Shareholders.
Distributions to shareholders of each class were as follows:
Years ended July 31, | 2013 | 2012 |
From net investment income | | |
Class A | $ 785,355 | $ 57,416 |
Class T | 231,402 | - |
Class B | 9,411 | - |
Class C | 90,526 | - |
Small Cap Value | 13,318,853 | 2,736,678 |
Class F | 5,669,081 | 858,633 |
Institutional Class | 1,307,393 | 160,977 |
Total | $ 21,412,021 | $ 3,813,704 |
From net realized gain | | |
Class A | $ 5,001,914 | $ 8,369,079 |
Class T | 1,871,336 | 3,332,444 |
Class B | 211,601 | 513,839 |
Class C | 1,589,582 | 2,835,863 |
Small Cap Value | 54,759,308 | 109,450,254 |
Class F | 17,097,966 | 18,207,376 |
Institutional Class | 4,663,655 | 6,261,999 |
Total | $ 85,195,362 | $ 148,970,854 |
Annual Report
Notes to Financial Statements - continued
10. Share Transactions.
Transactions for each class of shares were as follows:
| Shares | Dollars |
Years ended July 31, | 2013 | 2012 | 2013 | 2012 |
Class A | | | | |
Shares sold | 6,665,265 | 3,582,114 | $ 113,825,347 | $ 51,112,084 |
Reinvestment of distributions | 357,182 | 639,382 | 5,478,656 | 7,957,627 |
Shares redeemed | (3,345,663) | (3,203,028) | (56,976,312) | (45,298,282) |
Net increase (decrease) | 3,676,784 | 1,018,468 | $ 62,327,691 | $ 13,771,429 |
Class T | | | | |
Shares sold | 2,420,486 | 1,074,645 | $ 41,524,163 | $ 15,238,625 |
Reinvestment of distributions | 135,952 | 264,657 | 2,060,454 | 3,258,576 |
Shares redeemed | (1,017,057) | (1,066,289) | (17,196,752) | (14,773,000) |
Net increase (decrease) | 1,539,381 | 273,013 | $ 26,387,865 | $ 3,724,201 |
Class B | | | | |
Shares sold | 63,699 | 17,886 | $ 1,033,590 | $ 244,464 |
Reinvestment of distributions | 12,922 | 36,117 | 189,673 | 433,889 |
Shares redeemed | (174,192) | (156,185) | (2,861,489) | (2,129,294) |
Net increase (decrease) | (97,571) | (102,182) | $ (1,638,226) | $ (1,450,941) |
Class C | | | | |
Shares sold | 1,262,288 | 840,854 | $ 20,129,471 | $ 11,606,643 |
Reinvestment of distributions | 98,556 | 202,948 | 1,448,319 | 2,439,209 |
Shares redeemed | (683,043) | (895,789) | (11,003,236) | (12,102,998) |
Net increase (decrease) | 677,801 | 148,013 | $ 10,574,554 | $ 1,942,854 |
Small Cap Value | | | | |
Shares sold | 46,643,321 | 27,786,966 | $ 815,184,196 | $ 403,227,336 |
Reinvestment of distributions | 4,065,017 | 8,564,707 | 63,037,497 | 107,820,730 |
Shares redeemed | (35,306,999) | (41,177,942) | (618,245,939) | (579,334,071) |
Net increase (decrease) | 15,401,339 | (4,826,269) | $ 259,975,754 | $ (68,286,005) |
Class F | | | | |
Shares sold | 7,943,352 | 17,383,615 | $ 133,806,197 | $ 249,495,726 |
Reinvestment of distributions | 1,465,154 | 1,506,337 | 22,767,047 | 19,066,009 |
Shares redeemed | (8,168,596) | (1,906,027) | (151,555,822) | (26,618,099) |
Net increase (decrease) | 1,239,910 | 16,983,925 | $ 5,017,422 | $ 241,943,636 |
Institutional Class | | | | |
Shares sold | 11,988,758 | 4,662,732 | $ 206,274,907 | $ 67,294,175 |
Reinvestment of distributions | 337,968 | 445,761 | 5,246,517 | 5,619,794 |
Shares redeemed | (3,783,835) | (2,373,514) | (66,718,093) | (33,655,059) |
Net increase (decrease) | 8,542,891 | 2,734,979 | $ 144,803,331 | $ 39,258,910 |
Annual Report
11. Other.
The Fund's organizational documents provide former and current trustees and officers with a limited indemnification against liabilities arising in connection with the performance of their duties to the Fund. In the normal course of business, the Fund may also enter into contracts that provide general indemnifications. The Fund's maximum exposure under these arrangements is unknown as this would be dependent on future claims that may be made against the Fund. The risk of material loss from such claims is considered remote.
At the end of the period, Fidelity Freedom Funds and Fidelity Freedom K Funds were the owners of record, in the aggregate, of approximately 31% of the total outstanding shares of the Fund.
Annual Report
To the Trustees of Fidelity Securities Fund and the Shareholders of Fidelity Small Cap Value Fund:
In our opinion, the accompanying statement of assets and liabilities, including the schedule of investments, and the related statements of operations and of changes in net assets and the financial highlights present fairly, in all material respects, the financial position of Fidelity Small Cap Value Fund (a fund of Fidelity Securities Fund) at July 31, 2013, the results of its operations for the year then ended, the changes in its net assets for each of the two years in the period then ended and the financial highlights for each of the five years in the period then ended, in conformity with accounting principles generally accepted in the United States of America. These financial statements and financial highlights (hereafter referred to as "financial statements") are the responsibility of the Fidelity Small Cap Value Fund's management. Our responsibility is to express an opinion on these financial statements based on our audits. We conducted our audits of these financial statements in accordance with the standards of the Public Company Accounting Oversight Board (United States). Those standards require that we plan and perform the audit to obtain reasonable assurance about whether the financial statements are free of material misstatement. An audit includes examining, on a test basis, evidence supporting the amounts and disclosures in the financial statements, assessing the accounting principles used and significant estimates made by management, and evaluating the overall financial statement presentation. We believe that our audits, which included confirmation of securities at July 31, 2013 by correspondence with the custodian and brokers, provide a reasonable basis for our opinion.
PricewaterhouseCoopers LLP
Boston, Massachusetts
September 16, 2013
Annual Report
The Trustees, Member of the Advisory Board, and executive officers of the trust and fund, as applicable, are listed below. The Board of Trustees governs the fund and is responsible for protecting the interests of shareholders. The Trustees are experienced executives who meet periodically throughout the year to oversee the fund's activities, review contractual arrangements with companies that provide services to the fund, oversee management of the risks associated with such activities and contractual arrangements, and review the fund's performance. Except for James C. Curvey, Ned C. Lautenbach, Ronald P. O'Hanley, and William S. Stavropoulos, each of the Trustees oversees 166 Fidelity funds. Mr. Curvey oversees 387 Fidelity funds. Mr. Lautenbach, Mr. O'Hanley, and Mr. Stavropoulos each oversees 230 Fidelity funds.
The Trustees hold office without limit in time except that (a) any Trustee may resign; (b) any Trustee may be removed by written instrument, signed by at least two-thirds of the number of Trustees prior to such removal; (c) any Trustee who requests to be retired or who has become incapacitated by illness or injury may be retired by written instrument signed by a majority of the other Trustees; and (d) any Trustee may be removed at any special meeting of shareholders by a two-thirds vote of the outstanding voting securities of the trust. Each Trustee who is not an interested person of the trust and the fund (as defined in the 1940 Act) (Independent Trustee), shall retire not later than the last day of the calendar year in which his or her 75th birthday occurs. The Independent Trustees may waive this mandatory retirement age policy with respect to individual Trustees. The executive officers and Advisory Board Member hold office without limit in time, except that any officer and Advisory Board Member may resign or may be removed by a vote of a majority of the Trustees at any regular meeting or any special meeting of the Trustees. Except as indicated, each individual has held the office shown or other offices in the same company for the past five years.
Experience, Skills, Attributes, and Qualifications of the Fund's Trustees. The Governance and Nominating Committee has adopted a statement of policy that describes the experience, qualifications, attributes, and skills that are necessary and desirable for potential Independent Trustee candidates (Statement of Policy). The Board believes that each Trustee satisfied at the time he or she was initially elected or appointed a Trustee, and continues to satisfy, the standards contemplated by the Statement of Policy. The Governance and Nominating Committee also engages professional search firms to help identify potential Independent Trustee candidates who have the experience, qualifications, attributes, and skills consistent with the Statement of Policy. From time to time, additional criteria based on the composition and skills of the current Independent Trustees, as well as experience or skills that may be appropriate in light of future changes to board composition, business conditions, and regulatory or other developments, have also been considered by the professional search firms and the Governance and Nominating Committee. In addition, the Board takes into account the Trustees' commitment and participation in Board and committee meetings, as well as their leadership of standing and ad hoc committees throughout their tenure.
Annual Report
In determining that a particular Trustee was and continues to be qualified to serve as a Trustee, the Board has considered a variety of criteria, none of which, in isolation, was controlling. The Board believes that, collectively, the Trustees have balanced and diverse experience, qualifications, attributes, and skills, which allow the Board to operate effectively in governing the fund and protecting the interests of shareholders. Information about the specific experience, skills, attributes, and qualifications of each Trustee, which in each case led to the Board's conclusion that the Trustee should serve (or continue to serve) as a trustee of the fund, is provided below.
Board Structure and Oversight Function. James C. Curvey is an interested person (as defined in the 1940 Act) and currently serves as Chairman. The Trustees have determined that an interested Chairman is appropriate and benefits shareholders because an interested Chairman has a personal and professional stake in the quality and continuity of services provided to the fund. Independent Trustees exercise their informed business judgment to appoint an individual of their choosing to serve as Chairman, regardless of whether the Trustee happens to be independent or a member of management. The Independent Trustees have determined that they can act independently and effectively without having an Independent Trustee serve as Chairman and that a key structural component for assuring that they are in a position to do so is for the Independent Trustees to constitute a substantial majority for the Board. The Independent Trustees also regularly meet in executive session. Ned C. Lautenbach serves as Chairman of the Independent Trustees and as such (i) acts as a liaison between the Independent Trustees and management with respect to matters important to the Independent Trustees and (ii) with management prepares agendas for Board meetings.
Fidelity funds are overseen by different Boards of Trustees. The fund's Board oversees Fidelity's equity and high income funds and another Board oversees Fidelity's investment-grade bond, money market, and asset allocation funds. The asset allocation funds may invest in Fidelity funds overseen by the fund's Board. The use of separate Boards, each with its own committee structure, allows the Trustees of each group of Fidelity funds to focus on the unique issues of the funds they oversee, including common research, investment, and operational issues. On occasion, the separate Boards establish joint committees to address issues of overlapping consequences for the Fidelity funds overseen by each Board.
The Trustees operate using a system of committees to facilitate the timely and efficient consideration of all matters of importance to the Trustees, the fund, and fund shareholders and to facilitate compliance with legal and regulatory requirements and oversight of the fund's activities and associated risks. The Board, acting through its committees, has charged FMR and its affiliates with (i) identifying events or circumstances the occurrence of which could have demonstrably adverse effects on the fund's business and/or reputation; (ii) implementing processes and controls to lessen the possibility that such events or circumstances occur or to mitigate the effects of such events or circumstances if they do occur; and (iii) creating and maintaining a system designed to evaluate continuously business and market conditions in order to facilitate the identification and implementation processes described in (i) and (ii) above. Because the day-to-day operations and activities of the fund's are carried out by or through FMR, its affiliates and other service providers, the fund's exposure to risks is mitigated but not eliminated by the processes overseen by the Trustees. While each of the Board's committees has responsibility for overseeing different aspects of the fund's activities, oversight is exercised primarily through the Operations, Audit, and Compliance Committees. In addition, the Independent Trustees have worked with FMR to enhance the Board's oversight of investment and financial risks, legal and regulatory risks, technology risks, and operational risks, including the development of additional risk reporting to the Board. For example, a working group comprised of Independent Trustees and FMR has worked and continues to work to review the Fidelity funds' valuation-related activities, reporting and risk management. Appropriate personnel, including but not limited to the fund's Chief Compliance Officer (CCO), FMR's internal auditor, the independent accountants, the fund's Treasurer and portfolio management personnel, make periodic reports to the Board's committees, as appropriate, including an annual review of FMR's risk management program for the Fidelity funds. The responsibilities of each standing committee, including their oversight responsibilities, are described further under "Standing Committees of the Fund's Trustees."
Annual Report
Trustees and Officers - continued
The fund's Statement of Additional Information (SAI) includes more information about the Trustees. To request a free copy, call Fidelity at 1-877-208-0098.
Interested Trustees*:
Correspondence intended for each Trustee who is an interested person may be sent to Fidelity Investments, 245 Summer Street, Boston, Massachusetts 02210.
Name, Year of Birth; Principal Occupations and Other Relevant Experience+ |
James C. Curvey (1935) |
| Year of Election or Appointment: 2007 Mr. Curvey is Trustee and Chairman of the Board of Trustees of certain Trusts. Mr. Curvey also serves as Trustee (2007-present) of other investment companies advised by FMR. Mr. Curvey is a Director of Fidelity Investments Money Management, Inc. (2009-present), Director of Fidelity Research & Analysis Co. (2009-present) and Director of FMR and FMR Co., Inc. (2007-present). Mr. Curvey is also Vice Chairman (2007-present) and Director of FMR LLC. In addition, Mr. Curvey serves as an Overseer for the Boston Symphony Orchestra and a member of the Trustees of Villanova University. Previously, Mr. Curvey was the Vice Chairman (2006-2007) and Director (2000-2007) of FMR Corp. |
Ronald P. O'Hanley (1957) |
| Year of Election or Appointment: 2011 Mr. O'Hanley serves as a Trustee and Chairman of the Board of Trustees of other Fidelity funds (2013-present), and is Director of FMR Co., Inc. (2010-present), Director of Fidelity Investments Money Management, Inc. (2010-present), Director of Fidelity Research & Analysis Company (2010-present), President of Fidelity Asset Management and Corporate Services and a Member of Fidelity's Executive Committee (2010-present). Previously, Mr. O'Hanley served as President and Chief Executive Officer of BNY Mellon Asset Management (2007-2010). Mr. O'Hanley also served as Vice Chairman of Bank New York Mellon Corp. and a member of that firm's Executive Committee. Prior to the 2007 merger of The Bank of New York and Mellon Financial Corporation, he was Vice Chairman of Mellon Financial Corporation and President and Chief Executive Officer of Mellon Asset Management. He joined Mellon in February 1997. Mr. O'Hanley currently serves as Chairman of the Boston Public Library Foundation Board of Directors and sits on the Board of Directors of Beth Israel Deaconess Medical Center, the Board of Trustees of the Marine Biological Laboratory and the Advisory Board of the Maxwell School of Citizenship and Public Administration at Syracuse University. Mr. O'Hanley also chairs the Council on Asset Management for the Financial Services Roundtable and is a member of the Board of Directors of Institutional Investor's U.S. Institute. |
* Trustees have been determined to be "Interested Trustees" by virtue of, among other things, their affiliation with the trust or various entities under common control with FMR.
+ The information above includes each Trustee's principal occupation during the last five years and other information relating to the experience, attributes, and skills relevant to each Trustee's qualifications to serve as a Trustee, which led to the conclusion that each Trustee should serve as a Trustee for the fund.
Annual Report
Trustees and Officers - continued
Independent Trustees:
Correspondence intended for each Independent Trustee (that is, the Trustees other than the Interested Trustees) may be sent to Fidelity Investments, P.O. Box 55235, Boston, Massachusetts 02205-5235.
Name, Year of Birth; Principal Occupations and Other Relevant Experience+ |
Dennis J. Dirks (1948) |
| Year of Election or Appointment: 2005 Prior to his retirement in May 2003, Mr. Dirks was Chief Operating Officer and a member of the Board of The Depository Trust & Clearing Corporation (DTCC). He also served as President, Chief Operating Officer, and Board member of The Depository Trust Company (DTC) and President and Board member of the National Securities Clearing Corporation (NSCC). In addition, Mr. Dirks served as Chief Executive Officer and Board member of the Government Securities Clearing Corporation, Chief Executive Officer and Board member of the Mortgage-Backed Securities Clearing Corporation, as a Trustee and a member of the Finance Committee of Manhattan College (2005-2008), and as a Trustee and a member of the Finance Committee of AHRC of Nassau County (2006-2008). Mr. Dirks is a member of the Independent Directors Council (IDC) Governing Council (2010-present) and Board of Directors for The Brookville Center for Children's Services, Inc. (2009-present). |
Alan J. Lacy (1953) |
| Year of Election or Appointment: 2008 Mr. Lacy serves as Senior Adviser (2007-present) of Oak Hill Capital Partners, L.P. (private equity). Mr. Lacy also served as Chief Executive Officer (2000-2005) and Vice Chairman (2005-2006) of Sears Holdings Corporation and Sears, Roebuck and Co. (retail). In addition, Mr. Lacy serves as a member of the Board of Directors of Dave & Buster's Entertainment, Inc. (restaurant and entertainment complexes, 2010-present), Earth Fare, Inc. (retail grocery, 2012-present), The Hillman Companies, Inc. (hardware wholesalers, 2010-present), and Bristol-Myers Squibb Company (global pharmaceuticals, 2008-present). Mr. Lacy is a member of the Board of Trustees of The National Parks Conservation Association (2006-present). Previously, Mr. Lacy served as Chairman of the Board of Trustees of the National Parks Conservation Association (2008-2011) and as a member of the Board of Directors for the Western Union Company (global money transfer, 2006-2011). |
Ned C. Lautenbach (1944) |
| Year of Election or Appointment: 2000 Mr. Lautenbach is Chairman of the Independent Trustees of the Equity and High Income Funds (2006-present) and serves as a Trustee of other Fidelity funds (2013-present). Mr. Lautenbach currently serves as the Lead Director of the Eaton Corporation Board of Directors (diversified industrial, 1997-present). Mr. Lautenbach is Chairman of the Board of Directors of the Philharmonic Center for the Arts in Naples, Florida (2012-present) and a member of the Council on Foreign Relations (1994-present). Previously, Mr. Lautenbach was a Partner/Advisory Partner at Clayton, Dubilier & Rice, LLC (private equity investment, 1998-2010), as well as a Director of Sony Corporation (2006-2007). |
Joseph Mauriello (1944) |
| Year of Election or Appointment: 2008 Prior to his retirement in January 2006, Mr. Mauriello served in numerous senior management positions including Deputy Chairman and Chief Operating Officer (2004-2005), and Vice Chairman of Financial Services (2002-2004) of KPMG LLP US (professional services, 1965-2005). Mr. Mauriello currently serves as a member of the Board of Directors of XL Group plc. (global insurance and re-insurance, 2006-present). Previously, Mr. Mauriello served as a Director of the Hamilton Funds of the Bank of New York (2006-2007) and of Arcadia Resources Inc. (health care services and products, 2007-2012). |
Robert W. Selander (1950) |
| Year of Election or Appointment: 2011 Previously, Mr. Selander served as a Member of the Advisory Board of Fidelity's Equity and High Income Funds (2011), Executive Vice Chairman (2010), Chief Executive Officer (2009-2010), and President and Chief Executive Officer (1997-2009) of Mastercard, Inc. |
Cornelia M. Small (1944) |
| Year of Election or Appointment: 2005 Ms. Small is a member of the Board of Directors (2009-present) and Chair of the Investment Committee (2010-present) of the Teagle Foundation. Ms. Small also serves on the Investment Committee of the Berkshire Taconic Community Foundation (2008-present). Previously, Ms. Small served as Chairperson (2002-2008) and a member of the Investment Committee and Chairperson (2008-2012) and a member of the Board of Trustees of Smith College. In addition, Ms. Small served as Chief Investment Officer, Director of Global Equity Investments, and a member of the Board of Directors of Scudder, Stevens & Clark and Scudder Kemper Investments. |
William S. Stavropoulos (1939) |
| Year of Election or Appointment: 2002 Mr. Stavropoulos is Vice Chairman of the Independent Trustees of the Equity and High Income Funds (2006-present) and serves as a Trustee of other Fidelity funds (2013-present). Mr. Stavropoulos serves as President and Founder of the Michigan Baseball Foundation, the Great Lakes Loons (2007-present). Mr. Stavropoulos is Chairman Emeritus of the Board of Directors of The Dow Chemical Company, where he previously served in numerous senior management positions, including President, CEO (1995-2000; 2002-2004), Chairman of the Executive Committee (2000-2006), and as a member of the Board of Directors (1990-2006). Currently, Mr. Stavropoulos is Chairman of the Board of Directors of Univar Inc. (global distributor of commodity and specialty chemicals), a Director of Teradata Corporation (data warehousing and technology solutions), and Maersk Inc. (industrial conglomerate), and a member of the Advisory Board for Metalmark Capital LLC (private equity investment, 2005-present). Mr. Stavropoulos is an operating advisor to Clayton, Dubilier & Rice, LLC (private equity investment). In addition, Mr. Stavropoulos is a member of the University of Notre Dame Advisory Council for the College of Science, a Trustee of the Rollin L. Gerstacker Foundation, and a Director of the Naples Philharmonic Center for the Arts. Previously, Mr. Stavropoulos served as a Director of Chemical Financial Corporation (bank holding company, 1993-2012) and Tyco International, Ltd. (multinational manufacturing and services, 2007-2012). |
David M. Thomas (1949) |
| Year of Election or Appointment: 2008 Previously, Mr. Thomas served as Executive Chairman (2005-2006) and Chairman and Chief Executive Officer (2000-2005) of IMS Health, Inc. (pharmaceutical and healthcare information solutions), and a Director of Fortune Brands, Inc. (consumer products, 2000-2011). In addition, Mr. Thomas serves as Non-Executive Chairman of the Board of Directors of Fortune Brands Home and Security (home and security products, 2011-present), and as a member of the Board of Directors of Interpublic Group of Companies, Inc. (marketing communication, 2004-present). |
+ The information above includes each Trustee's principal occupation during the last five years and other information relating to the experience, attributes, and skills relevant to each Trustee's qualifications to serve as a Trustee, which led to the conclusion that each Trustee should serve as a Trustee for the fund.
Annual Report
Advisory Board Member and Executive Officers:
Correspondence intended for each executive officer and Peter S. Lynch may be sent to Fidelity Investments, 245 Summer Street, Boston, Massachusetts 02210.
Name, Year of Birth; Principal Occupation |
Peter S. Lynch (1944) |
| Year of Election or Appointment: 2003 Member of the Advisory Board of Fidelity's Equity and High Income Funds. Mr. Lynch is Vice Chairman and a Director of FMR and FMR Co., Inc. In addition, Mr. Lynch serves as a Trustee of Boston College and as the Chairman of the Inner-City Scholarship Fund. Previously, Mr. Lynch served on the Special Olympics International Board of Directors (1997-2006). |
Kenneth B. Robins (1969) |
| Year of Election or Appointment: 2008 President and Treasurer of Fidelity's Equity and High Income Funds. Mr. Robins also serves as President and Treasurer (2008-present) and Assistant Treasurer (2009-present) of other Fidelity funds and is an employee of Fidelity Investments (2004-present). Mr. Robins serves as Executive Vice President of Fidelity Investments Money Management, Inc. (FIMM) (2013-present). Previously, Mr. Robins served as Deputy Treasurer of the Fidelity funds (2005-2008) and Treasurer and Chief Financial Officer of The North Carolina Capital Management Trust: Cash and Term Portfolios (2006-2008). |
Brian B. Hogan (1964) |
| Year of Election or Appointment: 2009 Vice President of Equity and High Income Funds. Mr. Hogan also serves as Vice President of other Fidelity funds (2009-present) and President of FMR's Equity Division (2009-present). Previously, Mr. Hogan served as Senior Vice President, Equity Research of FMR (2006-2009) and as a portfolio manager. |
Thomas C. Hense (1964) |
| Year of Election or Appointment: 2008 or 2010 Vice President of Fidelity's High Income (2008), Small Cap (2008), and Value (2010) Funds. Previously, Mr. Hense served as a portfolio manager for Fidelity's Institutional Money Management Group (Pyramis) (2003-2008). |
Scott C. Goebel (1968) |
| Year of Election or Appointment: 2008 Secretary and Chief Legal Officer (CLO) of the Fidelity funds. Mr. Goebel also serves as Secretary of Fidelity Investments Money Management, Inc. (FIMM) (2010-present) and Fidelity Research and Analysis Company (FRAC) (2010-present); Secretary and CLO of The North Carolina Capital Management Trust: Cash and Term Portfolios (2008-present); General Counsel, Secretary, and Senior Vice President of FMR (2008-present) and FMR Co., Inc. (2008-present); employed by FMR LLC or an affiliate (2001-present); Chief Legal Officer of Fidelity Management & Research (Hong Kong) Limited (2008-present) and Assistant Secretary of Fidelity Management & Research (Japan) Inc. (2008-present), and Fidelity Management & Research (U.K.) Inc. (2008-present). Previously, Mr. Goebel served as Assistant Secretary of FIMM (2008-2010), FRAC (2008-2010), and the Funds (2007-2008) and as Vice President and Secretary of Fidelity Distributors Corporation (FDC) (2005-2007). |
William C. Coffey (1969) |
| Year of Election or Appointment: 2009 Assistant Secretary of Fidelity's Equity and High Income Funds. Mr. Coffey also serves as Assistant Secretary of other Fidelity funds (2009-present), Senior Vice President and Deputy General Counsel of FMR LLC (2010-present), and is an employee of Fidelity Investments. Previously, Mr. Coffey served as Vice President and Associate General Counsel of FMR LLC (2005-2009). |
Elizabeth Paige Baumann (1968) |
| Year of Election or Appointment: 2012 Anti-Money Laundering (AML) Officer of the Fidelity funds. Ms. Baumann also serves as AML Officer of The North Carolina Capital Management Trust: Cash and Term Portfolios (2012-present), Chief AML Officer of FMR LLC (2012-present), and is an employee of Fidelity Investments. Previously, Ms. Baumann served as Vice President and Deputy Anti-Money Laundering Officer (2007-2012). |
Christine Reynolds (1958) |
| Year of Election or Appointment: 2008 Chief Financial Officer of the Fidelity funds. Ms. Reynolds became President of Fidelity Pricing and Cash Management Services (FPCMS) in August 2008. Ms. Reynolds served as Chief Operating Officer of FPCMS (2007-2008). Previously, Ms. Reynolds served as President, Treasurer, and Anti-Money Laundering officer of the Fidelity funds (2004-2007). |
Joseph A. Hanlon (1968) |
| Year of Election or Appointment: 2012 Chief Compliance Officer of Fidelity's Equity and High Income Funds. Mr. Hanlon also serves as Chief Compliance Officer of other Fidelity funds (2012-present). Mr. Hanlon serves as Compliance Officer of FMR, FMR Co., Inc., Fidelity Investments Money Management, Inc. (FIMM), Fidelity Research and Analysis Company (FRAC), and Fidelity Management & Research (Hong Kong) (2009-present), as Senior Vice President of the Fidelity Asset Management Division (2009-present), and is an employee of Fidelity Investments. Previously, Mr. Hanlon served as Compliance Officer of Fidelity Management & Research (Japan) Inc. (2009-2013), Strategic Advisers, Inc. (2009-2013), and Fidelity Management & Research (U.K.) Inc. (2009-2013). |
Joseph F. Zambello (1957) |
| Year of Election or Appointment: 2011 Deputy Treasurer of the Fidelity funds. Mr. Zambello is an employee of Fidelity Investments. Previously, Mr. Zambello served as Vice President of FMR's Program Management Group (2009-2011) and Vice President of the Transfer Agent Oversight Group (2005-2009). |
Adrien E. Deberghes (1967) |
| Year of Election or Appointment: 2008 Deputy Treasurer of Fidelity's Equity and High Income Funds. Mr. Deberghes also serves as Vice President (2011-present), Deputy Treasurer (2008-present), and Assistant Treasurer (2010-present) of other Fidelity funds, and is an employee of Fidelity Investments (2008-present). Previously, Mr. Deberghes served as Senior Vice President of Mutual Fund Administration at State Street Corporation (2007-2008), Senior Director of Mutual Fund Administration at Investors Bank & Trust (2005-2007), and Director of Finance for Dunkin' Brands (2000-2005). |
Stephen Sadoski (1971) |
| Year of Election or Appointment: 2012 Deputy Treasurer of Fidelity's Equity and High Income Funds. Mr. Sadoski also serves as Deputy Treasurer of other Fidelity funds (2012-present) and is an employee of Fidelity Investments (2012-present). Previously, Mr. Sadoski served as Assistant Treasurer of Fidelity's Fixed Income and Asset Allocation Funds (2012-2013), an assistant chief accountant in the Division of Investment Management of the Securities and Exchange Commission (SEC) (2009-2012) and as a senior manager at Deloitte & Touche LLP (1997-2009). |
Stacie M. Smith (1974) |
| Year of Election or Appointment: 2013 Deputy Treasurer of Fidelity's Equity and High Income Funds. Ms. Smith also serves as Deputy Treasurer of other Fidelity funds (2013-present) and is an employee of Fidelity Investments (2009-present). Previously, Ms. Smith served as Senior Audit Manager of Ernst & Young LLP (1996-2009). |
Stephanie J. Dorsey (1969) |
| Year of Election or Appointment: 2010 Assistant Treasurer of Fidelity's Equity and High Income Funds. Ms. Dorsey also serves as President and Treasurer (2013-present) and Assistant Treasurer (2010-present) of other Fidelity funds, Treasurer and Chief Financial Officer of The North Carolina Capital Management Trust: Cash and Term Portfolios (2013-present), and is an employee of Fidelity Investments (2008-present). Previously, Ms. Dorsey served as Deputy Treasurer of Fidelity's Fixed Income and Asset Allocation Funds (2008-2013), Treasurer (2004-2008) of the JPMorgan Mutual Funds and Vice President (2004-2008) of JPMorgan Chase Bank. |
Gary W. Ryan (1958) |
| Year of Election or Appointment: 2005 Assistant Treasurer of the Fidelity funds. Mr. Ryan is an employee of Fidelity Investments. Previously, Mr. Ryan served as Vice President of Fund Reporting in Fidelity Pricing and Cash Management Services (FPCMS) (1999-2005). |
Jonathan Davis (1968) |
| Year of Election or Appointment: 2010 Assistant Treasurer of the Fidelity funds. Mr. Davis is also Assistant Treasurer of Fidelity Rutland Square Trust II and Fidelity Commonwealth Trust II. Mr. Davis is an employee of Fidelity Investments. Previously, Mr. Davis served as Vice President and Associate General Counsel of FMR LLC (2003-2010). |
Annual Report
The Board of Trustees of Fidelity Small Cap Value Fund voted to pay to shareholders of record at the opening of business, the following distributions per share derived from capital gains realized from sales of portfolio securities, and dividends derived from net investment income:
| Pay Date | Record Date | Dividends | Capital Gains |
Class A | 09/16/13 | 09/13/13 | $0.003 | $1.252 |
Class T | 09/16/13 | 09/13/13 | $0.000 | $1.252 |
Class B | 09/16/13 | 09/13/13 | $0.000 | $1.252 |
Class C | 09/16/13 | 09/13/13 | $0.000 | $1.252 |
The fund hereby designates as a capital gain dividend with respect to the taxable year ended July 31,2013, $300,428,923, or, if subsequently determined to be different, the net capital gain of such year.
Class A, Class T, Class B, and Class C designate 100% of the dividends distributed in December, 2012 as indicated in the Corporate Qualifying memo distributed by the Tax department, respectively during the fiscal year as qualifying for the dividends-received deduction for corporate shareholders.
Class A, Class T, Class B, and Class C designate 100% of the dividends distributed during the fiscal year as amounts which may be taken into account as a dividend for purposes of the maximum rate under section 1(h)(11) of the Internal Revenue Code.
The fund will notify shareholders in January 2014 of amounts for use in preparing 2013 income tax returns.
Annual Report
Board Approval of Investment Advisory Contracts and Management Fees
Fidelity Small Cap Value Fund
Each year, the Board of Trustees, including the Independent Trustees (together, the Board), votes on the renewal of the management contract and sub-advisory agreements (together, the Advisory Contracts) for the fund. The Board, assisted by the advice of fund counsel and Independent Trustees' counsel, requests and considers a broad range of information relevant to the renewal of the Advisory Contracts throughout the year.
The Board meets regularly and, at each of its meetings, covers an extensive agenda of topics and materials and considers factors that are relevant to its annual consideration of the renewal of the fund's Advisory Contracts, including the services and support provided to the fund and its shareholders. The Board has established various standing committees, each composed of and chaired by Independent Trustees with varying backgrounds, to which the Board has assigned specific subject matter responsibilities in order to enhance effective decision-making by the Board. The Board, acting directly and through its Committees, requests and receives information concerning the annual consideration of the renewal of the fund's Advisory Contracts. The Board also meets as needed to consider matters specifically related to the Board's annual consideration of the renewal of Advisory Contracts. Members of the Board may also meet with trustees of other Fidelity funds through ad hoc joint committees to discuss certain matters relevant to the Fidelity funds.
At its July 2013 meeting, the Board, including the Independent Trustees, unanimously determined to renew the fund's Advisory Contracts. In reaching its determination, the Board considered all factors it believed relevant, including (i) the nature, extent, and quality of the services to be provided to the fund and its shareholders (including the investment performance of the fund); (ii) the competitiveness of the fund's management fee and total expense ratio relative to peer funds; (iii) the total costs of the services to be provided by and the profits to be realized by Fidelity from its relationship with the fund; (iv) the extent to which economies of scale exist and would be realized as the fund grows; and (v) whether fee levels reflect these economies of scale, if any, for the benefit of fund shareholders.
In considering whether to renew the Advisory Contracts for the fund, the Board reached a determination, with the assistance of fund counsel and Independent Trustees' counsel and through the exercise of its business judgment, that the renewal of the Advisory Contracts was in the best interests of the fund and its shareholders and that the compensation payable under the Advisory Contracts was fair and reasonable. The Board's decision to renew the Advisory Contracts was not based on any single factor, but rather was based on a comprehensive consideration of all the information provided to the Board at its meetings throughout the year. The Board, in reaching its determination to renew the Advisory Contracts, was aware that shareholders in the fund have a broad range of investment choices available to them, including a wide choice among mutual funds offered by Fidelity's competitors, and that the fund's shareholders, who have the opportunity to review and weigh the disclosure provided by the fund in its prospectus and other public disclosures, have chosen to invest in this fund, which is a part of the Fidelity family of funds.
Annual Report
Nature, Extent, and Quality of Services Provided. The Board considered the staffing within the investment adviser, Fidelity Management & Research Company (FMR), and the sub-advisers (together, the Investment Advisers) as it relates to the fund, including the backgrounds of the fund's investment personnel, and also considered the fund's investment objective, strategies, and related investment philosophy. The Independent Trustees also had discussions with senior management of Fidelity's investment operations and investment groups. The Board considered the structure of the portfolio manager compensation program and whether this structure provides appropriate incentives to act in the best interests of the fund.
Resources Dedicated to Investment Management and Support Services. The Board and the Fund Oversight and Research Committees reviewed the general qualifications and capabilities of the Investment Advisers' investment staff, including its size, education, experience, and resources, as well as the Investment Advisers' approach to recruiting, training, managing, and compensating investment personnel. The Board noted that FMR has continued to increase the resources devoted to non-U.S. offices, including expansion of Fidelity's global investment organization. The Board also noted that Fidelity's analysts have extensive resources, tools and capabilities that allow them to conduct sophisticated quantitative and fundamental analysis, as well as credit analysis of issuers, counterparties and guarantors. Further, the Board believes that Fidelity's investment professionals have sufficient access to global information and data so as to provide competitive investment results over time, and that those professionals also have access to sophisticated tools that permit them to assess portfolio construction and risk and performance attribution characteristics continuously, as well as to transmit new information and research conclusions rapidly around the world. Additionally, in its deliberations, the Board considered the Investment Advisers' trading and risk management capabilities and resources, which are an integral part of the investment management process.
Shareholder and Administrative Services. The Board considered (i) the nature, extent, quality, and cost of advisory, administrative, and shareholder services performed by the Investment Advisers and their affiliates under the Advisory Contracts and under separate agreements covering transfer agency, pricing and bookkeeping, and securities lending services for the fund; (ii) the nature and extent of the supervision of third party service providers, principally custodians and subcustodians; and (iii) the resources devoted to, and the record of compliance with, the fund's compliance policies and procedures. The Board also reviewed the allocation of fund brokerage, including allocations to brokers affiliated with the Investment Advisers, the use of brokerage commissions to pay fund expenses, and the use of "soft" commission dollars to pay for research services.
Annual Report
Board Approval of Investment Advisory Contracts and
Management Fees - continued
The Board noted that the growth of fund assets over time across the complex allows Fidelity to reinvest in the development of services designed to enhance the value or convenience of the Fidelity funds as investment vehicles. These services include 24-hour access to account information and market information through telephone representatives and over the Internet, investor education materials and asset allocation tools, and the expanded availability of Fidelity Investor Centers.
Investment in a Large Fund Family. The Board considered the benefits to shareholders of investing in a Fidelity fund, including the benefits of investing in a fund that is part of a large family of funds offering a variety of investment disciplines and providing a large variety of mutual fund investor services. The Board noted that Fidelity had taken, or had made recommendations that resulted in the Fidelity funds taking, a number of actions over the previous year that benefited particular funds, including (i) continuing to dedicate additional resources to investment research and to the support of the senior management team that oversees asset management; (ii) persisting in efforts to enhance Fidelity's global research capabilities; (iii) launching new funds and making other enhancements to meet client needs for global and income-oriented solutions; (iv) continuing to launch dedicated lower cost underlying funds to meet portfolio construction needs related to expanding underlying fund options for Fidelity funds of funds, specifically for the Freedom Fund product lines; (v) rationalizing product lines and gaining increased efficiencies through the mergers of several funds into other funds; (vi) strengthening Fidelity's index fund offerings by reducing investment minimums and adopting or lowering existing expense caps for certain funds and classes; (vii) enhancing Global Asset Allocation product offerings by launching new funds and strategies, including "open architecture" target date funds that utilize affiliated and unaffiliated sub-advisers; (viii) modifying the eligibility criteria for Institutional Class shares of Advisor funds to increase their marketability to a portion of the defined contribution plan market; (ix) creating a new low-cost retirement share class for certain Advisor funds to appeal to large retirement plans; (x) transitioning the management of certain Fidelity commodity funds to Geode Capital Management LLC, a registered commodity pool operator, while retaining administrative responsibilities for the funds; (xi) reorganizing a number of funds; and (xii) taking steps toward establishing a new Fidelity adviser to manage sector-based funds and products.
Investment Performance. The Board considered whether the fund has operated in accordance with its investment objective, as well as its record of compliance with its investment restrictions and its performance history. The Board noted that there was a portfolio management change for the fund in January 2013.
Annual Report
The Board took into account discussions with the Investment Advisers about fund investment performance that occur at Board meetings throughout the year. In this regard the Board noted that as part of regularly scheduled fund reviews and other reports to the Board on fund performance, the Board periodically considers annualized return information for the fund, for different time periods, measured against a securities market index ("benchmark index") and a peer group of mutual funds with similar objectives ("peer group"). In its evaluation of fund investment performance, the Board gave particular attention to information indicating changes in performance of certain Fidelity funds for specific time periods and the Investment Advisers' explanations for any overperformance or underperformance.
In addition to reviewing absolute and relative fund performance, the Independent Trustees periodically consider the appropriateness of fund performance metrics in evaluating the results achieved. In general, the Independent Trustees believe that fund performance should be evaluated based on net performance (after fees and expenses) of both the highest performing and lowest performing classes, where applicable, compared to appropriate benchmark indices, over appropriate time periods which may include full market cycles, and compared to peer groups, as applicable, over the same periods, taking into account relevant factors including the following: general market conditions; issuer-specific information; tactical opportunities for investment; and fund cash flows and other factors.
The Independent Trustees recognize that shareholders evaluate performance on a net basis over their own holding periods, for which one-, three-, and five-year periods are used as a proxy. For this reason, the performance information reviewed by the Board also included net cumulative calendar year total return information for the fund and an appropriate benchmark index and peer group for the most recent one-, three-, and five-year periods, as shown below. Returns are shown compared to the 25th percentile (top of box) and 75th percentile (bottom of box) of the peer universe.
Annual Report
Board Approval of Investment Advisory Contracts and
Management Fees - continued
Fidelity Small Cap Value Fund

The Board also considered that the fund's management fee is subject to upward or downward adjustment depending upon whether, and to what extent, the fund's investment performance for the performance period exceeds, or is exceeded by, a securities index, thus leading to a performance adjustment for the same period. The Board noted that the performance adjustment provides FMR with a strong economic incentive to seek to achieve superior performance for the fund's shareholders and helps to more closely align the interests of FMR and the fund's shareholders.
Based on its review, the Board concluded that the nature, extent, and quality of services provided to the fund under the Advisory Contracts should benefit the fund's shareholders.
Competitiveness of Management Fee and Total Expense Ratio. The Board considered the fund's management fee and total expense ratio compared to "mapped groups" of competitive funds and classes. Fidelity creates "mapped groups" by combining similar Lipper investment objective categories that have comparable management fee characteristics. Combining Lipper investment objective categories aids the Board's management fee and total expense ratio comparisons by broadening the competitive group used for comparison and by reducing the number of universes to which various Fidelity funds are compared.
Management Fee. The Board considered two proprietary management fee comparisons for the 12-month periods shown in the chart below. The group of Lipper funds used by the Board for management fee comparisons is referred to below as the "Total Mapped Group." The Total Mapped Group comparison focuses on a fund's standing in terms of gross management fees before expense reimbursements or caps, and without giving effect to the fund's performance adjustment, relative to the total universe of funds with comparable investment mandates, regardless of whether their management fee structures also are comparable. Funds with comparable investment mandates offer exposure to similar types of securities. Funds with comparable management fee structures have similar management fee contractual arrangements (e.g., flat rate charged for advisory services, all-inclusive fee rate, etc.). "TMG %" represents the percentage of funds in the Total Mapped Group that had management fees that were lower than the fund's. For example, a TMG % of 14% means that 86% of the funds in the Total Mapped Group had higher management fees than the fund. The "Asset-Size Peer Group" (ASPG) comparison focuses on a fund's standing relative to a subset of non-Fidelity funds within the Total Mapped Group that are similar in size and management fee structure. The ASPG represents at least 15% of the funds in the Total Mapped Group with comparable asset size and management fee structures, subject to a minimum of 50 funds (or all funds in the Total Mapped Group if fewer than 50). Additional information, such as the ASPG quartile in which the fund's management fee ranked and the impact of the fund's performance adjustment, is also included in the chart and considered by the Board.
Annual Report
Fidelity Small Cap Value Fund

The Board noted that the fund's management fee ranked below the median of its Total Mapped Group and below the median of its ASPG for 2012. The Board also noted the effect of the fund's positive performance adjustment on the fund's management fee ranking.
Annual Report
Board Approval of Investment Advisory Contracts and
Management Fees - continued
Based on its review, the Board concluded that the fund's management fee is fair and reasonable in light of the services that the fund receives and the other factors considered.
Total Expense Ratio. In its review of each class's total expense ratio, the Board considered the fund's management fee as well as other fund or class expenses, as applicable, such as transfer agent fees, pricing and bookkeeping fees, fund-paid 12b-1 fees, and custodial, legal, and audit fees. The Board also noted the effects of any waivers and reimbursements on fees and expenses, as well as the impact of the fund's performance adjustment. As part of its review, the Board also considered the current and historical total expense ratios of each class of the fund compared to competitive fund median expenses. Each class of the fund is compared to those funds and classes in the Total Mapped Group (used by the Board for management fee comparisons) that have a similar sales load structure.
The Board noted that the total expense ratio of each of Institutional Class, the retail class and Class F ranked below its competitive median for 2012, the total expense ratio of Class A ranked equal to its competitive median for 2012, and the total expense ratio of each of Class T, Class B and Class C ranked above its competitive median for 2012. The Board considered that, in general, various factors can affect total expense ratios. The Board noted that the total expense ratio of Class T was above the competitive median primarily because of higher 12b-1 fees on Class T. Class T has a higher 12b-1 fee, but a lower front-end sales charge, than traditionally priced front-end sales charge classes. The Board considered that Class T is primarily sold load-waived in the retirement plan market where its 0.50% 12b-1 fee is comparable to competing no-load, higher 12b-1 fee classes designed specifically for retirement plans. The Board noted that the fund offers multiple classes, each of which has a different sales load and 12b-1 fee structure, and that the multiple structures are intended to offer a range of pricing options for the intermediary market. The Board also noted that the total expense ratios of the classes vary primarily by the level of their 12b-1 fees, although differences in transfer agent fees may also cause expenses to vary from class to class.
Fees Charged to Other Fidelity Clients. The Board also considered Fidelity fee structures and other information with respect to clients of FMR and its affiliates, such as other mutual funds advised or subadvised by FMR or its affiliates, pension plan clients, and other institutional clients. The Board noted the findings of the 2013 ad hoc joint committee (created with the board of other Fidelity funds), which reviewed and compared Fidelity's institutional investment advisory business with its business of providing services to the Fidelity funds, including the differences in services provided, fees charged, and costs incurred, as well as competition in their respective marketplaces.
Based on its review of total expense ratios and fees charged to other Fidelity clients, the Board concluded that the total expense ratio of each class of the fund was reasonable, although in some cases above the median of the universe presented for comparison, in light of the services that the fund and its shareholders receive and the other factors considered.
Annual Report
Costs of the Services and Profitability. The Board considered the revenues earned and the expenses incurred by Fidelity in conducting the business of developing, marketing, distributing, managing, administering and servicing the fund and servicing the fund's shareholders. The Board also considered the level of Fidelity's profits in respect of all the Fidelity funds.
On an annual basis, FMR presents to the Board Fidelity's profitability for the fund. Fidelity calculates the profitability for each fund, as well as aggregate profitability for groups of Fidelity funds and all Fidelity funds, using a series of detailed revenue and cost allocation methodologies which originate with the books and records of Fidelity on which Fidelity's audited financial statements are based. The Audit Committee of the Board reviews any significant changes from the prior year's methodologies.
PricewaterhouseCoopers LLP (PwC), independent registered public accounting firm and auditor to Fidelity and certain Fidelity funds, has been engaged annually by the Board as part of the Board's assessment of Fidelity's profitability analysis. PwC's engagement includes the review and assessment of the methodologies used by Fidelity in determining the revenues and expenses attributable to Fidelity's mutual fund business, and completion of agreed-upon procedures surrounding the mathematical accuracy of fund profitability and its conformity to allocation methodologies. After considering PwC's reports issued under the engagement and information provided by Fidelity, the Board concluded that while other allocation methods may also be reasonable, Fidelity's profitability methodologies are reasonable in all material respects.
The Board also reviewed Fidelity's non-fund businesses and fall-out benefits related to the mutual fund business as well as cases where Fidelity's affiliates may benefit from or be related to the fund's business.
The Board considered the costs of the services provided by and the profits realized by Fidelity in connection with the operation of the fund and was satisfied that the profitability was not excessive in the circumstances.
Economies of Scale. The Board considered whether there have been economies of scale in respect of the management of the Fidelity funds, whether the Fidelity funds (including the fund) have appropriately benefited from any such economies of scale, and whether there is potential for realization of any further economies of scale. The Board considered the extent to which the fund will benefit from economies of scale through increased services to the fund, through waivers or reimbursements, or through fee or expense reductions. The Board also noted that in 2009, it and the board of other Fidelity funds created an ad hoc committee (the Economies of Scale Committee) to analyze whether FMR attains economies of scale in respect of the management and servicing of the Fidelity funds, whether the Fidelity funds have appropriately benefited from such economies of scale, and whether there is potential for realization of any further economies of scale.
Annual Report
Board Approval of Investment Advisory Contracts and
Management Fees - continued
The Board recognized that the fund's management contract incorporates a "group fee" structure, which provides for lower group fee rates as total fund assets under FMR's management increase, and for higher group fee rates as total fund assets under FMR's management decrease. FMR calculates the group fee rates based on a tiered asset "breakpoint" schedule that varies based on asset class. The Board considered that the group fee is designed to deliver the benefits of economies of scale to fund shareholders when total Fidelity fund assets increase, even if assets of any particular fund are unchanged or have declined, because some portion of Fidelity's costs are attributable to services provided to all Fidelity funds, and all funds benefit if those costs can be allocated among more assets. The Board considered that although the fund is partially closed to new investors, it continues to incur investment management expenses, and marketing and distribution expenses related to the retention of existing shareholders and assets. The Board concluded that, given the group fee structure, fund shareholders will benefit from lower management fees as assets under FMR's management increase at the fund complex level, regardless of whether Fidelity achieves any such economies of scale.
The Board concluded, taking into account the analysis of the Economies of Scale Committee, that economies of scale, if any, are being appropriately shared between fund shareholders and Fidelity.
Amendment to Description of Group Fee Rate. At its July 2013 meeting, the Board voted to approve an amendment to the fund's management contract to modify the description of the "group fee rate" effective August 1, 2013. The Board noted that under the prior description in the contract, the group fee rate was based on the average net assets of all registered investment companies with which FMR has management contracts. Under the contract's tiered asset breakpoint schedule, the group fee rate is lower as total fund assets under FMR's management increase, and higher as total fund assets under FMR's management decrease. The Board considered that the prior description would have excluded the assets of 64 Fidelity sector funds from the group fee rate calculation once Fidelity SelectCo, LLC, an affiliate of FMR, assumed management responsibilities for those funds. The Board noted that modifying the description of the group fee rate to continue to include the assets of those 64 funds for purposes of determining group fee rate breakpoints would avoid an immediate adverse impact on the group fee rate for any fund.
Additional Information Requested by the Board. In order to develop fully the factual basis for consideration of the Fidelity funds' Advisory Contracts, the Board requested and received additional information on certain topics, including: (i) fund performance trends and Fidelity's long-term strategies for certain funds; (ii) the potential to further rationalize the Fidelity fund lineup with the possibility of achieving savings for the funds and Fidelity; (iii) the methodology with respect to competitive fund data and peer group classifications; (iv) the arrangements with, and performance of, certain sub-advisers on behalf of the Fidelity funds, as well as certain proposed participating affiliate arrangements; (v) the realization of fall-out benefits in certain Fidelity business units; (vi) Fidelity's group fee structures, including the rationale for the individual fee rates of certain categories of funds and the definition of group assets; (vii) trends regarding industry use of performance fee structures and the performance adjustment methodologies applicable to the Fidelity funds; (viii) additional competitive analysis regarding the total expenses for certain classes; and (ix) fund profitability methodology, including Fidelity's cost allocation methodology, and the impact of certain factors on fund profitability results.
Annual Report
Based on its evaluation of all of the conclusions noted above, and after considering all factors it believed relevant, the Board ultimately concluded that the advisory fee structures are fair and reasonable, and that the fund's Advisory Contracts should be renewed.
Annual Report
Investment Adviser
Fidelity Management & Research Company
Boston, MA
Investment Sub-Advisers
FMR Co., Inc.
Fidelity Management & Research
(U.K.) Inc.
Fidelity Management & Research
(Hong Kong) Limited
Fidelity Management & Research
(Japan) Inc.
General Distributor
Fidelity Distributors Corporation
Smithfield, RI
Transfer and Service Agents
Fidelity Investments Institutional
Operations Company, Inc.
Boston, MA
Fidelity Service Company, Inc.
Boston, MA
Custodian
Citibank, N.A.
New York, NY
(Fidelity Investment logo)(registered trademark)
ASCV-UANN-0913
1.803731.108
(Fidelity Investment logo)(registered trademark)
Fidelity Advisor®
Small Cap Value
Fund - Institutional Class
Annual Report
July 31, 2013
(Fidelity Cover Art)
Institutional Class
is a class of Fidelity®
Small Cap Value Fund
Contents
Performance | (Click Here) | How the fund has done over time. |
Management's Discussion of Fund Performance | (Click Here) | The Portfolio Manager's review of fund performance and strategy. |
Shareholder Expense Example | (Click Here) | An example of shareholder expenses. |
Investment Changes | (Click Here) | A summary of major shifts in the fund's investments over the past six months. |
Investments | (Click Here) | A complete list of the fund's investments with their market values. |
Financial Statements | (Click Here) | Statements of assets and liabilities, operations, and changes in net assets, as well as financial highlights. |
Notes | (Click Here) | Notes to the financial statements. |
Report of Independent Registered Public Accounting Firm | (Click Here) | |
Trustees and Officers | (Click Here) | |
Distributions | (Click Here) | |
Board Approval of Investment Advisory Contracts and Management Fees | (Click Here) | |
To view a fund's proxy voting guidelines and proxy voting record for the 12-month period ended June 30, visit http://www.fidelity.com/proxyvotingresults or visit the Securities and Exchange Commission's (SEC) web site at http://www.sec.gov. You may also call 1-877-208-0098 to request a free copy of the proxy voting guidelines.
Standard & Poor's, S&P and S&P 500 are registered service marks of The McGraw-Hill Companies, Inc. and have been licensed for use by Fidelity Distributors Corporation.
Other third-party marks appearing herein are the property of their respective owners.
All other marks appearing herein are registered or unregistered trademarks or service marks of FMR LLC or an affiliated company. © 2013 FMR LLC. All rights reserved.
Annual Report
This report and the financial statements contained herein are submitted for the general information of the shareholders of the fund. This report is not authorized for distribution to prospective investors in the fund unless preceded or accompanied by an effective prospectus.
A fund files its complete schedule of portfolio holdings with the SEC for the first and third quarters of each fiscal year on Form N-Q. Forms N-Q are available on the SEC's web site at http://www.sec.gov. A fund's Forms N-Q may be reviewed and copied at the SEC's Public Reference Room in Washington, DC. Information regarding the operation of the SEC's Public Reference Room may be obtained by calling 1-800-SEC-0330. For a complete list of a fund's portfolio holdings, view the most recent holdings listing, semiannual report, or annual report on Fidelity's web site at http://www.fidelity.com, http://www.advisor.fidelity.com, or http://www.401k.com, as applicable.
NOT FDIC INSURED • MAY LOSE VALUE • NO BANK GUARANTEE
Neither the fund nor Fidelity Distributors Corporation is a bank.
Annual Report
Average annual total return reflects the change in the value of an investment, assuming reinvestment of the class' distributions from dividend income and capital gains (the profits earned upon the sale of securities that have grown in value, if any) and assuming a constant rate of performance each year. The $10,000 table and the fund's returns do not reflect the deduction of taxes that a shareholder would pay on fund distributions or the redemption of fund shares. During periods of reimbursement by Fidelity, a fund's total return will be greater than it would be had the reimbursement not occurred. How a fund did yesterday is no guarantee of how it will do tomorrow.
Average Annual Total Returns
Periods ended July 31, 2013 | Past 1
year | Past 5
years | Life of
fundA |
Institutional Class | 39.54% | 14.53% | 11.79% |
A From November 3, 2004.
$10,000 Over Life of Fund
Let's say hypothetically that $10,000 was invested in Fidelity Advisor® Small Cap Value Fund - Institutional Class on November 3, 2004, when the fund started. The chart shows how the value of your investment would have changed, and also shows how the Russell 2000® Value Index performed over the same period.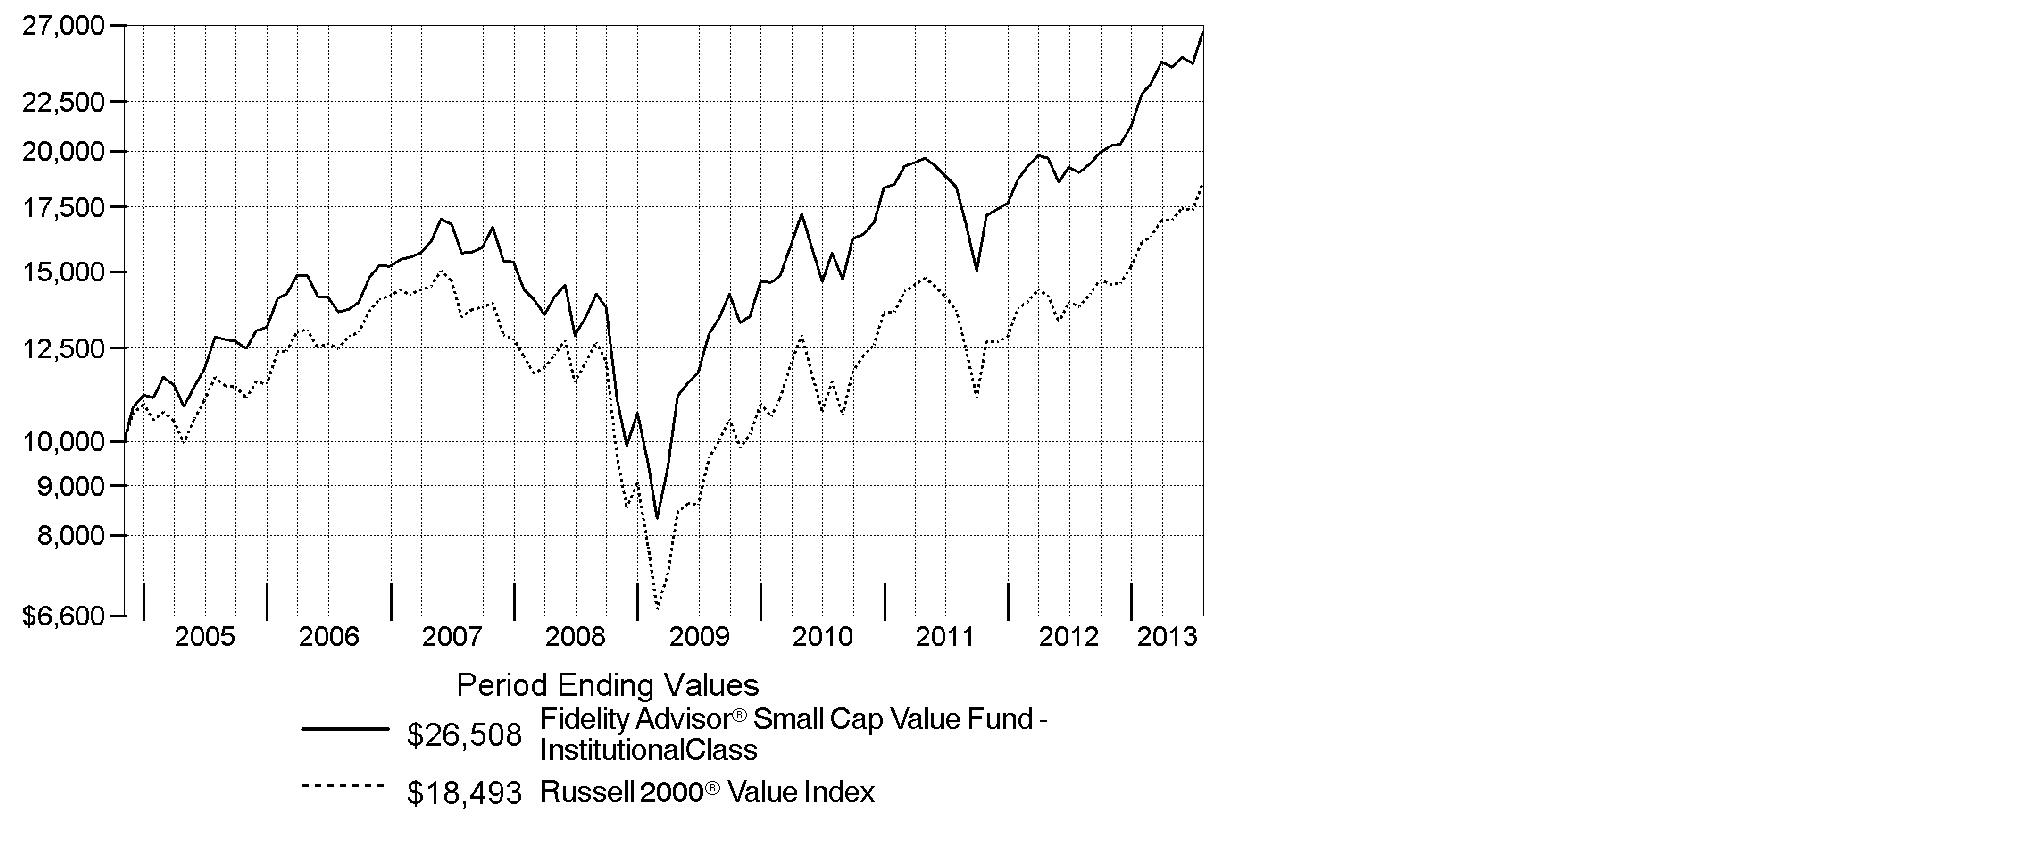
Annual Report
Market Recap: The bull run in U.S. stocks comfortably settled into a fifth year, as major equity benchmarks ripped through records during the 12 months ending July 31, 2013. Gains were fueled by a generally improving global economy and accommodative monetary policies worldwide. The tone was positive for most of the year, based largely on stronger U.S. economic data, including employment, housing and consumer sentiment. Setting a series of new highs along the way, the broad-based S&P 500® Index rose an impressive 25.00% for the 12 months, while the blue-chip-laden Dow Jones Industrial AverageSM also moved into record territory en route to a 22.36% gain. The growth-oriented Nasdaq Composite Index® had a similarly strong run, advancing 25.15%. During the year, markets were resilient amid intermittent volatility over debt woes in Europe, the 2012 U.S. presidential election and year-end Congressional gridlock over the federal budget. In mid-to-late June, concern arose about the U.S. Federal Reserve possibly tapering its sustaining bond-buying strategy - which prompted a brief, but steep, market sell-off. However, investors' continued quest for yield and the Fed's pledge to keep buying bonds until the economy showed significant improvement overpowered the uncertainty and helped equities climb notably higher in July to close the period on a strong note.
Comments from Charles Myers, who became Lead Portfolio Manager of Fidelity Advisor® Small Cap Value Fund on January 1, 2013: For the year, the fund's Institutional Class shares gained 39.54%, versus 34.15% for the Russell 2000® Value Index. The biggest contribution, by far, came from the financials sector. Stock picking in consumer staples also added significant value, while industrials hurt. Our strategy emphasizes individual stock picking while striving to minimize the performance impact of other factors, including sector over- and underweightings. The fund's top individual contributor was apparel manufacturer Hanesbrands, whose business fundamentals continued to improve. Also helping was Japanese broker Monex Group - benefiting in part from investors' renewed interest in Japan - and CapitalSource, a small-business lender that, in late July, agreed to be acquired at a premium price. None of these contributors was in the benchmark, and Monex was sold from the fund in May. In contrast, the biggest detractor was market maker Knight Capital Group, whose shares plummeted last August after a software glitch cost the firm hundreds of millions of dollars. We sold the fund's stake soon after. GrafTech International, a maker of high-end graphite electrodes, also hurt results.
Note to shareholders: Derek Janssen became Co-Portfolio Manager on January 1, 2013.
The views expressed above reflect those of the portfolio manager(s) only through the end of the period as stated on the cover of this report and do not necessarily represent the views of Fidelity or any other person in the Fidelity organization. Any such views are subject to change at any time based upon market or other conditions and Fidelity disclaims any responsibility to update such views. These views may not be relied on as investment advice and, because investment decisions for a Fidelity fund are based on numerous factors, may not be relied on as an indication of trading intent on behalf of any Fidelity fund.
Annual Report
Shareholder Expense Example
As a shareholder of the Fund, you incur two types of costs: (1) transaction costs, including sales charges (loads) on purchase payments or redemption proceeds, redemption fees and (2) ongoing costs, including management fees, distribution and/or service (12b-1) fees and other Fund expenses. This Example is intended to help you understand your ongoing costs (in dollars) of investing in the Fund and to compare these costs with the ongoing costs of investing in other mutual funds.
The Example is based on an investment of $1,000 invested at the beginning of the period and held for the entire period (February 1, 2013 to July 31, 2013).
Actual Expenses
The first line of the accompanying table for each class of the Fund provides information about actual account values and actual expenses. You may use the information in this line, together with the amount you invested, to estimate the expenses that you paid over the period. Simply divide your account value by $1,000.00 (for example, an $8,600 account value divided by $1,000.00 = 8.6), then multiply the result by the number in the first line for a class of the Fund under the heading entitled "Expenses Paid During Period" to estimate the expenses you paid on your account during this period. A small balance maintenance fee of $12.00 that is charged once a year may apply for certain accounts with a value of less than $2,000. This fee is not included in the table below. If it was, the estimate of expenses you paid during the period would be higher, and your ending account value lower, by this amount. In addition, the Fund, as a shareholder in the underlying Fidelity Central Funds, will indirectly bear its pro-rata share of the fees and expenses incurred by the underlying Fidelity Central Funds. These fees and expenses are not included in the Fund's annualized expense ratio used to calculate the expense estimate in the table below.
Hypothetical Example for Comparison Purposes
The second line of the accompanying table for each class of the Fund provides information about hypothetical account values and hypothetical expenses based on a Class' actual expense ratio and an assumed rate of return of 5% per year before expenses, which is not the Class' actual return. The hypothetical account values and expenses may not be used to estimate the actual ending account balance or expenses you paid for the period. You may use this information to compare the ongoing costs of investing in the Fund and other funds. To do so, compare this 5% hypothetical example with the 5% hypothetical examples that appear in the shareholder reports of the other funds. A small balance maintenance fee of $12.00 that is charged once a year may apply for certain accounts with a value of less than $2,000. This fee is not included in the table below. If it was, the estimate of expenses you paid during the period would be higher, and your ending account value lower, by this amount. In addition, the Fund, as a shareholder in the underlying Fidelity Central Funds, will indirectly bear its pro-rata share of the fees and expenses incurred by the underlying Fidelity Central Funds. These fees and expenses are not included in the Fund's annualized expense ratio used to calculate the expense estimate in the table below.
Please note that the expenses shown in the table are meant to highlight your ongoing costs only and do not reflect any transaction costs. Therefore, the second line of the table is useful in comparing ongoing costs only, and will not help you determine the relative total costs of owning different funds. In addition, if these transactional costs were included, your costs would have been higher.
Annual Report
| Annualized
Expense Ratio B | Beginning
Account Value
February 1, 2013 | Ending
Account Value
July 31, 2013 | Expenses Paid
During Period*
February 1, 2013
to July 31, 2013 |
Class A | 1.37% | | | |
Actual | | $ 1,000.00 | $ 1,155.80 | $ 7.32 |
Hypothetical A | | $ 1,000.00 | $ 1,018.00 | $ 6.85 |
Class T | 1.61% | | | |
Actual | | $ 1,000.00 | $ 1,154.10 | $ 8.60 |
Hypothetical A | | $ 1,000.00 | $ 1,016.81 | $ 8.05 |
Class B | 2.17% | | | |
Actual | | $ 1,000.00 | $ 1,151.70 | $ 11.58 |
Hypothetical A | | $ 1,000.00 | $ 1,014.03 | $ 10.84 |
Class C | 2.13% | | | |
Actual | | $ 1,000.00 | $ 1,151.70 | $ 11.36 |
Hypothetical A | | $ 1,000.00 | $ 1,014.23 | $ 10.64 |
Small Cap Value | 1.08% | | | |
Actual | | $ 1,000.00 | $ 1,157.40 | $ 5.78 |
Hypothetical A | | $ 1,000.00 | $ 1,019.44 | $ 5.41 |
Class F | .86% | | | |
Actual | | $ 1,000.00 | $ 1,158.90 | $ 4.60 |
Hypothetical A | | $ 1,000.00 | $ 1,020.53 | $ 4.31 |
Institutional Class | 1.08% | | | |
Actual | | $ 1,000.00 | $ 1,157.30 | $ 5.78 |
Hypothetical A | | $ 1,000.00 | $ 1,019.44 | $ 5.41 |
A 5% return per year before expenses
B Annualized expense ratio reflects expenses net of applicable fee waivers.
* Expenses are equal to each Class' annualized expense ratio, multiplied by the average account value over the period, multiplied by 181/365 (to reflect the one-half year period).
Annual Report
Investment Changes (Unaudited)
Top Ten Stocks as of July 31, 2013 |
| % of fund's
net assets | % of fund's net assets
6 months ago |
Federated Investors, Inc. Class B (non-vtg.) | 3.2 | 0.6 |
Hanesbrands, Inc. | 3.2 | 2.5 |
TCF Financial Corp. | 2.8 | 2.9 |
Superior Energy Services, Inc. | 2.6 | 3.1 |
Tech Data Corp. | 2.3 | 2.2 |
CapitalSource, Inc. | 2.3 | 2.0 |
HNI Corp. | 2.3 | 2.5 |
j2 Global, Inc. | 2.2 | 1.3 |
DCT Industrial Trust, Inc. | 2.1 | 2.5 |
Berry Petroleum Co. Class A | 2.1 | 2.7 |
| 25.1 | |
Top Five Market Sectors as of July 31, 2013 |
| % of fund's
net assets | % of fund's net assets
6 months ago |
Financials | 37.7 | 36.2 |
Industrials | 14.7 | 14.6 |
Consumer Discretionary | 13.8 | 13.1 |
Information Technology | 13.6 | 11.7 |
Health Care | 5.2 | 6.0 |
Asset Allocation (% of fund's net assets) |
As of July 31, 2013* | As of January 31, 2013** |
| Stocks 99.8% | | | Stocks 98.8% | |
| Short-Term
Investments and
Net Other Assets (Liabilities) 0.2% | | | Short-Term
Investments and
Net Other Assets (Liabilities) 1.2% | |
* Foreign investments | 6.6% | | ** Foreign investments | 8.9% | |

Annual Report
Investments July 31, 2013
Showing Percentage of Net Assets
Common Stocks - 99.8% |
| Shares | | Value |
CONSUMER DISCRETIONARY - 13.8% |
Diversified Consumer Services - 1.3% |
Regis Corp. (e) | 3,316,000 | | $ 57,598,920 |
Household Durables - 1.7% |
Tempur-Pedic International, Inc. (a) | 1,800,000 | | 71,370,000 |
Media - 1.4% |
Valassis Communications, Inc. (d)(e) | 2,103,041 | | 60,210,064 |
Multiline Retail - 1.1% |
Big Lots, Inc. (a) | 1,250,000 | | 45,162,500 |
Specialty Retail - 5.0% |
Asbury Automotive Group, Inc. (a) | 1,070,000 | | 52,258,800 |
Genesco, Inc. (a) | 856,128 | | 60,254,289 |
Rent-A-Center, Inc. | 2,021,167 | | 80,826,468 |
Tsutsumi Jewelry Co. Ltd. | 795,800 | | 18,368,991 |
| | 211,708,548 |
Textiles, Apparel & Luxury Goods - 3.3% |
Hanesbrands, Inc. | 2,100,000 | | 133,266,000 |
Vera Bradley, Inc. (a)(d) | 231,000 | | 5,599,440 |
| | 138,865,440 |
TOTAL CONSUMER DISCRETIONARY | | 584,915,472 |
CONSUMER STAPLES - 1.6% |
Food Products - 1.6% |
Chiquita Brands International, Inc. (a) | 1,783,600 | | 21,545,888 |
Post Holdings, Inc. (a) | 984,700 | | 45,680,233 |
| | 67,226,121 |
Household Products - 0.0% |
Spectrum Brands Holdings, Inc. | 25,100 | | 1,416,142 |
TOTAL CONSUMER STAPLES | | 68,642,263 |
ENERGY - 4.8% |
Energy Equipment & Services - 2.7% |
ShawCor Ltd. | 100,900 | | 4,533,672 |
Superior Energy Services, Inc. (a) | 4,211,000 | | 107,885,820 |
| | 112,419,492 |
Common Stocks - continued |
| Shares | | Value |
ENERGY - continued |
Oil, Gas & Consumable Fuels - 2.1% |
Berry Petroleum Co. Class A | 2,156,970 | | $ 87,465,134 |
World Fuel Services Corp. | 56,000 | | 2,169,440 |
| | 89,634,574 |
TOTAL ENERGY | | 202,054,066 |
FINANCIALS - 37.7% |
Capital Markets - 4.7% |
Federated Investors, Inc. Class B (non-vtg.) (d) | 4,644,763 | | 134,837,471 |
Waddell & Reed Financial, Inc. Class A | 1,300,000 | | 66,378,000 |
| | 201,215,471 |
Commercial Banks - 12.8% |
Associated Banc-Corp. | 4,500,000 | | 76,230,000 |
CapitalSource, Inc. | 8,128,000 | | 98,348,800 |
City National Corp. | 1,200,000 | | 83,436,000 |
CVB Financial Corp. | 450,000 | | 5,890,500 |
First Citizen Bancshares, Inc. | 222,700 | | 46,655,650 |
National Penn Bancshares, Inc. | 4,400,000 | | 47,476,000 |
PacWest Bancorp | 1,900,000 | | 67,298,000 |
TCF Financial Corp. | 7,700,000 | | 117,348,000 |
| | 542,682,950 |
Consumer Finance - 2.5% |
Cash America International, Inc. (d) | 816,900 | | 34,309,800 |
EZCORP, Inc. (non-vtg.) Class A (a) | 1,779,788 | | 32,178,567 |
World Acceptance Corp. (a)(d) | 475,000 | | 39,558,000 |
| | 106,046,367 |
Insurance - 8.4% |
Aspen Insurance Holdings Ltd. | 2,300,000 | | 86,227,000 |
Endurance Specialty Holdings Ltd. | 1,486,000 | | 78,208,180 |
Platinum Underwriters Holdings Ltd. (e) | 1,466,099 | | 85,165,691 |
ProAssurance Corp. | 1,100,000 | | 58,883,000 |
StanCorp Financial Group, Inc. | 850,000 | | 45,126,500 |
| | 353,610,371 |
Real Estate Investment Trusts - 5.9% |
DCT Industrial Trust, Inc. | 11,980,586 | | 89,974,201 |
Franklin Street Properties Corp. | 4,800,000 | | 63,888,000 |
Common Stocks - continued |
| Shares | | Value |
FINANCIALS - continued |
Real Estate Investment Trusts - continued |
Highwoods Properties, Inc. (SBI) | 1,720,330 | | $ 62,413,572 |
National Retail Properties, Inc. | 900,000 | | 31,491,000 |
| | 247,766,773 |
Thrifts & Mortgage Finance - 3.4% |
Astoria Financial Corp. (e) | 5,199,999 | | 63,439,988 |
Washington Federal, Inc. | 3,652,100 | | 79,433,175 |
| | 142,873,163 |
TOTAL FINANCIALS | | 1,594,195,095 |
HEALTH CARE - 5.2% |
Health Care Equipment & Supplies - 1.9% |
Hill-Rom Holdings, Inc. | 1,060,000 | | 39,294,200 |
Integra LifeSciences Holdings Corp. (a) | 1,050,000 | | 41,359,500 |
| | 80,653,700 |
Health Care Providers & Services - 3.3% |
AmSurg Corp. (a) | 1,220,000 | | 47,714,200 |
Chemed Corp. | 490,700 | | 34,638,513 |
MEDNAX, Inc. (a) | 600,000 | | 58,452,000 |
| | 140,804,713 |
TOTAL HEALTH CARE | | 221,458,413 |
INDUSTRIALS - 14.7% |
Commercial Services & Supplies - 8.4% |
ACCO Brands Corp. (a)(e) | 10,630,885 | | 70,270,150 |
HNI Corp. (e) | 2,552,800 | | 97,287,208 |
Knoll, Inc. | 1,940,000 | | 32,048,800 |
Quad/Graphics, Inc. (d)(e) | 2,675,000 | | 75,007,000 |
United Stationers, Inc. | 1,980,800 | | 81,985,312 |
| | 356,598,470 |
Electrical Equipment - 2.7% |
EnerSys | 1,065,000 | | 56,359,800 |
GrafTech International Ltd. (a)(e) | 7,709,000 | | 57,971,680 |
| | 114,331,480 |
Common Stocks - continued |
| Shares | | Value |
INDUSTRIALS - continued |
Machinery - 1.5% |
Blount International, Inc. (a)(e) | 2,975,000 | | $ 39,210,500 |
Columbus McKinnon Corp. (NY Shares) (a)(e) | 1,050,000 | | 23,226,000 |
| | 62,436,500 |
Trading Companies & Distributors - 2.1% |
WESCO International, Inc. (a)(d) | 1,138,633 | | 86,285,609 |
TOTAL INDUSTRIALS | | 619,652,059 |
INFORMATION TECHNOLOGY - 13.6% |
Communications Equipment - 1.0% |
Polycom, Inc. (a) | 3,805,145 | | 36,377,186 |
ViaSat, Inc. (a) | 95,000 | | 6,345,050 |
| | 42,722,236 |
Electronic Equipment & Components - 5.3% |
Ingram Micro, Inc. Class A (a) | 3,435,000 | | 78,421,050 |
Ryoyo Electro Corp. | 1,110,600 | | 8,961,025 |
SYNNEX Corp. (a) | 790,000 | | 39,120,800 |
Tech Data Corp. (a)(e) | 1,923,707 | | 98,763,117 |
| | 225,265,992 |
Internet Software & Services - 2.2% |
j2 Global, Inc. (d) | 2,000,000 | | 91,540,000 |
IT Services - 2.0% |
CACI International, Inc. Class A (a)(d)(e) | 1,265,534 | | 84,031,458 |
Software - 3.1% |
Monotype Imaging Holdings, Inc. (e) | 2,499,731 | | 61,318,401 |
SS&C Technologies Holdings, Inc. (a) | 2,000,000 | | 71,560,000 |
| | 132,878,401 |
TOTAL INFORMATION TECHNOLOGY | | 576,438,087 |
MATERIALS - 4.5% |
Chemicals - 1.9% |
PolyOne Corp. | 2,800,000 | | 80,948,000 |
Metals & Mining - 2.6% |
Carpenter Technology Corp. | 438,880 | | 22,944,646 |
Common Stocks - continued |
| Shares | | Value |
MATERIALS - continued |
Metals & Mining - continued |
Haynes International, Inc. | 582,903 | | $ 28,037,634 |
RTI International Metals, Inc. (a)(e) | 1,880,000 | | 57,622,000 |
| | 108,604,280 |
TOTAL MATERIALS | | 189,552,280 |
UTILITIES - 3.9% |
Electric Utilities - 2.9% |
UIL Holdings Corp. | 1,550,000 | | 63,302,000 |
UNS Energy Corp. | 1,150,000 | | 58,477,500 |
| | 121,779,500 |
Gas Utilities - 1.0% |
Southwest Gas Corp. | 836,756 | | 41,536,568 |
TOTAL UTILITIES | | 163,316,068 |
TOTAL COMMON STOCKS (Cost $3,044,578,546) |
4,220,223,803
|
Money Market Funds - 2.0% |
| | | |
Fidelity Cash Central Fund, 0.11% (b) | 28,466,432 | | 28,466,432 |
Fidelity Securities Lending Cash Central Fund, 0.12% (b)(c) | 57,800,650 | | 57,800,650 |
TOTAL MONEY MARKET FUNDS (Cost $86,267,082) |
86,267,082
|
TOTAL INVESTMENT PORTFOLIO - 101.8% (Cost $3,130,845,628) | | 4,306,490,885 |
NET OTHER ASSETS (LIABILITIES) - (1.8)% | | (76,083,401) |
NET ASSETS - 100% | $ 4,230,407,484 |
Legend |
(a) Non-income producing |
(b) Affiliated fund that is generally available only to investment companies and other accounts managed by Fidelity Investments. The rate quoted is the annualized seven-day yield of the fund at period end. A complete unaudited listing of the fund's holdings as of its most recent quarter end is available upon request. In addition, each Fidelity Central Fund's financial statements, which are not covered by the Fund's Report of Independent Registered Public Accounting Firm, are available on the SEC's website or upon request. |
(c) Investment made with cash collateral received from securities on loan. |
(d) Security or a portion of the security is on loan at period end. |
(e) Affiliated company |
Affiliated Central Funds |
Information regarding fiscal year to date income earned by the Fund from investments in Fidelity Central Funds is as follows: |
Fund | Income earned |
Fidelity Cash Central Fund | $ 25,999 |
Fidelity Securities Lending Cash Central Fund | 546,053 |
Total | $ 572,052 |
Other Affiliated Issuers |
An affiliated company is a company in which the Fund has ownership of at least 5% of the voting securities. Fiscal year to date transactions with companies which are or were affiliates are as follows: |
Affiliate | Value, beginning of period | Purchases | Sales
Proceeds | Dividend Income | Value,
end of
period |
ACCO Brands Corp. | $ 18,634,000 | $ 60,186,015 | $ - | $ - | $ 70,270,150 |
Astoria Financial Corp. | 51,038,992 | - | 2,635,044 | 864,648 | 63,439,988 |
Blount International, Inc. | 37,039,161 | 4,861,737 | - | - | 39,210,500 |
CACI International, Inc. Class A | - | 70,903,692 | - | - | 84,031,458 |
Chiquita Brands International, Inc. | 17,482,500 | - | 18,750,066 | - | - |
Columbus McKinnon Corp. (NY Shares) | 15,414,197 | 33,512 | - | - | 23,226,000 |
Affiliate | Value, beginning of period | Purchases | Sales
Proceeds | Dividend Income | Value,
end of
period |
Forestar Group, Inc. | $ 22,724,438 | $ - | $ 37,180,120 | $ - | $ - |
Franklin Street Properties Corp. | 32,769,200 | 18,353,991 | - | 1,420,207 | - |
GrafTech International Ltd. | 62,334,250 | 15,596,640 | - | - | 57,971,680 |
HNI Corp. | 71,739,000 | - | 5,753,822 | 2,592,000 | 97,287,208 |
j2 Global, Inc. | 38,011,100 | 45,217,336 | 27,957,107 | 1,829,466 | - |
Miraial Co. Ltd. | 10,410,478 | - | 12,126,954 | 294,642 | - |
Monotype Imaging Holdings, Inc. | 38,936,219 | 295,917 | 4,511,476 | 533,522 | 61,318,401 |
PacWest Bancorp | 42,557,616 | 917,960 | - | 1,759,368 | - |
Platinum Underwriters Holdings Ltd. | 64,411,165 | - | 12,819,753 | 528,121 | 85,165,691 |
Quad/Graphics, Inc. | 28,908,484 | 12,835,355 | - | 8,161,250 | 75,007,000 |
Regis Corp. | 52,452,000 | 4,787,419 | 1,424,813 | 798,000 | 57,598,920 |
RTI International Metals, Inc. | 42,206,000 | - | - | - | 57,622,000 |
Ryoyo Electro Corp. | 20,552,790 | - | 7,311,306 | 462,475 | - |
Tech Data Corp. | 50,100,000 | 44,833,638 | - | - | 98,763,117 |
Valassis Communications, Inc. | 35,733,655 | 13,478,788 | - | 1,955,518 | 60,210,064 |
Western Liberty Bancorp | 2,879,407 | - | 3,071,972 | - | - |
Total | $ 756,334,652 | $ 292,302,000 | $ 133,542,433 | $ 21,199,217 | $ 931,122,177 |
Other Information |
All investments are categorized as Level 1 under the Fair Value Hierarchy. The inputs or methodology used for valuing securities may not be an indication of the risk associated with investing in those securities. For more information on valuation inputs, please refer to the Investment Valuation section in the accompanying Notes to Financial Statements. |
See accompanying notes which are an integral part of the financial statements.
Annual Report
Statement of Assets and Liabilities
| July 31, 2013 |
| | |
Assets | | |
Investment in securities, at value (including securities loaned of $56,776,323) - See accompanying schedule: Unaffiliated issuers (cost $2,332,604,982) | $ 3,289,101,626 | |
Fidelity Central Funds (cost $86,267,082) | 86,267,082 | |
Other affiliated issuers (cost $711,973,564) | 931,122,177 | |
Total Investments (cost $3,130,845,628) | | $ 4,306,490,885 |
Receivable for investments sold | | 4,040,206 |
Receivable for fund shares sold | | 4,754,743 |
Dividends receivable | | 2,311,882 |
Distributions receivable from Fidelity Central Funds | | 43,534 |
Other receivables | | 26,704 |
Total assets | | 4,317,667,954 |
| | |
Liabilities | | |
Payable for investments purchased | $ 4,404,382 | |
Payable for fund shares redeemed | 21,283,940 | |
Accrued management fee | 2,842,312 | |
Distribution and service plan fees payable | 168,389 | |
Other affiliated payables | 692,724 | |
Other payables and accrued expenses | 68,073 | |
Collateral on securities loaned, at value | 57,800,650 | |
Total liabilities | | 87,260,470 |
| | |
Net Assets | | $ 4,230,407,484 |
Net Assets consist of: | | |
Paid in capital | | $ 2,788,449,989 |
Undistributed net investment income | | 6,475,378 |
Accumulated undistributed net realized gain (loss) on investments and foreign currency transactions | | 259,835,177 |
Net unrealized appreciation (depreciation) on investments and assets and liabilities in foreign currencies | | 1,175,646,940 |
Net Assets | | $ 4,230,407,484 |
See accompanying notes which are an integral part of the financial statements.
Annual Report
Statement of Assets and Liabilities - continued
| July 31, 2013 |
| | |
Calculation of Maximum Offering Price Class A:
Net Asset Value and redemption price per share ($275,265,209 ÷ 13,787,655 shares) | | $ 19.96 |
| | |
Maximum offering price per share (100/94.25 of $19.96) | | $ 21.18 |
Class T:
Net Asset Value and redemption price per share ($107,443,503 ÷ 5,452,804 shares) | | $ 19.70 |
| | |
Maximum offering price per share (100/96.50 of $19.70) | | $ 20.41 |
Class B:
Net Asset Value and offering price per share ($7,052,013 ÷ 370,046 shares)A | | $ 19.06 |
| | |
Class C:
Net Asset Value and offering price per share ($76,018,400 ÷ 3,988,294 shares)A | | $ 19.06 |
| | |
Small Cap Value:
Net Asset Value, offering price and redemption price per share ($2,672,853,587 ÷ 132,174,679 shares) | | $ 20.22 |
| | |
Class F:
Net Asset Value, offering price and redemption price per share ($732,192,591 ÷ 36,098,957 shares) | | $ 20.28 |
| | |
Institutional Class:
Net Asset Value, offering price and redemption price per share ($359,582,181 ÷ 17,774,629 shares) | | $ 20.23 |
A Redemption price per share is equal to net asset value less any applicable contingent deferred sales charge.
See accompanying notes which are an integral part of the financial statements.
Annual Report
Financial Statements - continued
Statement of Operations
| Year ended July 31, 2013 |
| | |
Investment Income | | |
Dividends (including $21,199,217 earned from other affiliated issuers) | | $ 60,413,973 |
Interest | | 105 |
Income from Fidelity Central Funds | | 572,052 |
Total income | | 60,986,130 |
| | |
Expenses | | |
Management fee
Basic fee | $ 24,334,495 | |
Performance adjustment | 3,446,198 | |
Transfer agent fees | 6,387,168 | |
Distribution and service plan fees | 1,603,302 | |
Accounting and security lending fees | 964,201 | |
Custodian fees and expenses | 78,850 | |
Independent trustees' compensation | 20,817 | |
Registration fees | 179,627 | |
Audit | 69,056 | |
Legal | 9,520 | |
Interest | 508 | |
Miscellaneous | 27,296 | |
Total expenses before reductions | 37,121,038 | |
Expense reductions | (242,350) | 36,878,688 |
Net investment income (loss) | | 24,107,442 |
Realized and Unrealized Gain (Loss) Net realized gain (loss) on: | | |
Investment securities: | | |
Unaffiliated issuers | 283,388,788 | |
Other affiliated issuers | 17,171,945 | |
Foreign currency transactions | 124,131 | |
Total net realized gain (loss) | | 300,684,864 |
Change in net unrealized appreciation (depreciation) on: Investment securities | 820,353,456 | |
Assets and liabilities in foreign currencies | 1,060 | |
Total change in net unrealized appreciation (depreciation) | | 820,354,516 |
Net gain (loss) | | 1,121,039,380 |
Net increase (decrease) in net assets resulting from operations | | $ 1,145,146,822 |
See accompanying notes which are an integral part of the financial statements.
Annual Report
Statement of Changes in Net Assets
| Year ended
July 31,
2013 | Year ended
July 31,
2012 |
Increase (Decrease) in Net Assets | | |
Operations | | |
Net investment income (loss) | $ 24,107,442 | $ 9,490,811 |
Net realized gain (loss) | 300,684,864 | 99,657,152 |
Change in net unrealized appreciation (depreciation) | 820,354,516 | (37,724,900) |
Net increase (decrease) in net assets resulting
from operations | 1,145,146,822 | 71,423,063 |
Distributions to shareholders from net investment income | (21,412,021) | (3,813,704) |
Distributions to shareholders from net realized gain | (85,195,362) | (148,970,854) |
Total distributions | (106,607,383) | (152,784,558) |
Share transactions - net increase (decrease) | 507,448,391 | 230,904,084 |
Redemption fees | 726,904 | 569,163 |
Total increase (decrease) in net assets | 1,546,714,734 | 150,111,752 |
| | |
Net Assets | | |
Beginning of period | 2,683,692,750 | 2,533,580,998 |
End of period (including undistributed net investment income of $6,475,378 and undistributed net investment income of $4,596,351, respectively) | $ 4,230,407,484 | $ 2,683,692,750 |
See accompanying notes which are an integral part of the financial statements.
Annual Report
Financial Highlights - Class A
Years ended July 31, | 2013 | 2012 | 2011 | 2010 | 2009 |
Selected Per-Share Data | | | | | |
Net asset value, beginning of period | $ 14.86 | $ 15.48 | $ 13.45 | $ 11.13 | $ 11.82 |
Income from Investment Operations | | | | | |
Net investment income (loss) C | .07 | .01 | .01 F | .02 G | .08 |
Net realized and unrealized gain (loss) | 5.57 | .30 | 2.22 | 2.33 | (.60) |
Total from investment operations | 5.64 | .31 | 2.23 | 2.35 | (.52) |
Distributions from net investment income | (.07) | (.01) | (.08) | (.03) | (.06) |
Distributions from net realized gain | (.47) | (.93) | (.12) | - | (.11) |
Total distributions | (.54) | (.93) J | (.20) | (.03) | (.17) |
Redemption fees added to paid in capital C,I | - | - | - | - | - |
Net asset value, end of period | $ 19.96 | $ 14.86 | $ 15.48 | $ 13.45 | $ 11.13 |
Total Return A,B | 39.09% | 3.24% | 16.72% | 21.16% | (4.37)% |
Ratios to Average Net Assets D,H | | | | | |
Expenses before reductions | 1.36% | 1.44% | 1.44% | 1.47% | 1.45% |
Expenses net of fee waivers, if any | 1.36% | 1.44% | 1.43% | 1.40% | 1.40% |
Expenses net of all reductions | 1.36% | 1.44% | 1.43% | 1.39% | 1.40% |
Net investment income (loss) | .41% | .09% | .06% F | .17% G | .81% |
Supplemental Data | | | | | |
Net assets, end of period (000 omitted) | $ 275,265 | $ 150,285 | $ 140,707 | $ 96,994 | $ 55,029 |
Portfolio turnover rate E | 29% | 27% | 22% | 49% | 51% |
A Total returns would have been lower if certain expenses had not been reduced during the applicable periods shown.
B Total returns do not include the effect of the sales charges.
C Calculated based on average shares outstanding during the period.
D Fees and expenses of any underlying Fidelity Central Funds are not included in the Fund's expense ratio. The Fund indirectly bears its proportionate share of the expenses of any underlying Fidelity Central Funds.
E Amount does not include the portfolio activity of any underlying Fidelity Central Funds.
F Investment income per share reflects a large, non-recurring dividend which amounted to $.06 per share. Excluding this non-recurring dividend, the ratio of net investment income (loss) to average net assets would have been (.31)%.
G Investment income per share reflects a large, non-recurring dividend which amounted to $.03 per share. Excluding this non-recurring dividend, the ratio of net investment income (loss) to average net assets would have been (.10)%.
H Expense ratios reflect operating expenses of the class. Expenses before reductions do not reflect amounts reimbursed by the investment adviser or reductions from brokerage service arrangements or reductions from other expense offset arrangements and do not represent the amount paid by the class during periods when reimbursements or reductions occur. Expenses net of fee waivers reflect expenses after reimbursement by the investment adviser but prior to reductions from brokerage service arrangements or other expense offset arrangements. Expenses net of all reductions represent the net expenses paid by the class.
I Amount represents less than $.01 per share.
J Total distributions of $.93 per share is comprised of distributions from net investment income of $.006 and distributions from net realized gain of $.925 per share.
See accompanying notes which are an integral part of the financial statements.
Annual Report
Financial Highlights - Class T
Years ended July 31, | 2013 | 2012 | 2011 | 2010 | 2009 |
Selected Per-Share Data | | | | | |
Net asset value, beginning of period | $ 14.70 | $ 15.34 | $ 13.34 | $ 11.05 | $ 11.74 |
Income from Investment Operations | | | | | |
Net investment income (loss) C | .03 | (.02) | (.03) F | (.01) G | .05 |
Net realized and unrealized gain (loss) | 5.50 | .31 | 2.20 | 2.31 | (.59) |
Total from investment operations | 5.53 | .29 | 2.17 | 2.30 | (.54) |
Distributions from net investment income | (.06) | - | (.05) | (.01) | (.04) |
Distributions from net realized gain | (.47) | (.93) | (.12) | - | (.11) |
Total distributions | (.53) | (.93) | (.17) | (.01) | (.15) |
Redemption fees added to paid in capital C,I | - | - | - | - | - |
Net asset value, end of period | $ 19.70 | $ 14.70 | $ 15.34 | $ 13.34 | $ 11.05 |
Total Return A,B | 38.70% | 3.08% | 16.36% | 20.87% | (4.57)% |
Ratios to Average Net Assets D,H | | | | |
Expenses before reductions | 1.60% | 1.67% | 1.70% | 1.72% | 1.70% |
Expenses net of fee waivers, if any | 1.60% | 1.67% | 1.69% | 1.65% | 1.65% |
Expenses net of all reductions | 1.59% | 1.67% | 1.69% | 1.64% | 1.65% |
Net investment income (loss) | .18% | (.14)% | (.19)% F | (.08)% G | .56% |
Supplemental Data | | | | | |
Net assets, end of period (000 omitted) | $ 107,444 | $ 57,514 | $ 55,845 | $ 44,091 | $ 28,534 |
Portfolio turnover rate E | 29% | 27% | 22% | 49% | 51% |
A Total returns would have been lower if certain expenses had not been reduced during the applicable periods shown.
B Total returns do not include the effect of the sales charges.
C Calculated based on average shares outstanding during the period.
D Fees and expenses of any underlying Fidelity Central Funds are not included in the Fund's expense ratio. The Fund indirectly bears its proportionate share of the expenses of any underlying Fidelity Central Funds.
E Amount does not include the portfolio activity of any underlying Fidelity Central Funds.
F Investment income per share reflects a large, non-recurring dividend which amounted to $.06 per share. Excluding this non-recurring dividend, the ratio of net investment income (loss) to average net assets would have been (.57)%.
G Investment income per share reflects a large, non-recurring dividend which amounted to $.03 per share. Excluding this non-recurring dividend, the ratio of net investment income (loss) to average net assets would have been (.35)%.
H Expense ratios reflect operating expenses of the class. Expenses before reductions do not reflect amounts reimbursed by the investment adviser or reductions from brokerage service arrangements or reductions from other expense offset arrangements and do not represent the amount paid by the class during periods when reimbursements or reductions occur. Expenses net of fee waivers reflect expenses after reimbursement by the investment adviser but prior to reductions from brokerage service arrangements or other expense offset arrangements. Expenses net of all reductions represent the net expenses paid by the class.
I Amount represents less than $.01 per share.
See accompanying notes which are an integral part of the financial statements.
Annual Report
Financial Highlights - Class B
Years ended July 31, | 2013 | 2012 | 2011 | 2010 | 2009 |
Selected Per-Share Data | | | | | |
Net asset value, beginning of period | $ 14.27 | $ 15.00 | $ 13.08 | $ 10.88 | $ 11.60 |
Income from Investment Operations | | | | | |
Net investment income (loss) C | (.06) | (.09) | (.10) F | (.07) G | .01 |
Net realized and unrealized gain (loss) | 5.34 | .29 | 2.15 | 2.27 | (.59) |
Total from investment operations | 5.28 | .20 | 2.05 | 2.20 | (.58) |
Distributions from net investment income | (.02) | - | (.01) | - | (.03) |
Distributions from net realized gain | (.47) | (.93) | (.12) | - | (.11) |
Total distributions | (.49) | (.93) | (.13) | - | (.14) |
Redemption fees added to paid in capital C,I | - | - | - | - | - |
Net asset value, end of period | $ 19.06 | $ 14.27 | $ 15.00 | $ 13.08 | $ 10.88 |
Total Return A,B | 38.07% | 2.51% | 15.80% | 20.22% | (5.05)% |
Ratios to Average Net Assets D,H | | | | | |
Expenses before reductions | 2.15% | 2.19% | 2.20% | 2.22% | 2.20% |
Expenses net of fee waivers, if any | 2.15% | 2.19% | 2.19% | 2.15% | 2.15% |
Expenses net of all reductions | 2.14% | 2.19% | 2.19% | 2.14% | 2.15% |
Net investment income (loss) | (.37)% | (.66)% | (.69)% F | (.58)% G | .06% |
Supplemental Data | | | | | |
Net assets, end of period (000 omitted) | $ 7,052 | $ 6,675 | $ 8,549 | $ 9,747 | $ 7,153 |
Portfolio turnover rate E | 29% | 27% | 22% | 49% | 51% |
A Total returns would have been lower if certain expenses had not been reduced during the applicable periods shown.
B Total returns do not include the effect of the contingent deferred sales charge.
C Calculated based on average shares outstanding during the period.
D Fees and expenses of any underlying Fidelity Central Funds are not included in the Fund's expense ratio. The Fund indirectly bears its proportionate share of the expenses of any underlying Fidelity Central Funds.
E Amount does not include the portfolio activity of any underlying Fidelity Central Funds.
F Investment income per share reflects a large, non-recurring dividend which amounted to $.06 per share. Excluding this non-recurring dividend, the ratio of net investment income (loss) to average net assets would have been (1.07)%.
G Investment income per share reflects a large, non-recurring dividend which amounted to $.03 per share. Excluding this non-recurring dividend, the ratio of net investment income (loss) to average net assets would have been (.85)%.
H Expense ratios reflect operating expenses of the class. Expenses before reductions do not reflect amounts reimbursed by the investment adviser or reductions from brokerage service arrangements or reductions from other expense offset arrangements and do not represent the amount paid by the class during periods when reimbursements or reductions occur. Expenses net of fee waivers reflect expenses after reimbursement by the investment adviser but prior to reductions from brokerage service arrangements or other expense offset arrangements. Expenses net of all reductions represent the net expenses paid by the class.
I Amount represents less than $.01 per share.
See accompanying notes which are an integral part of the financial statements.
Annual Report
Financial Highlights - Class C
Years ended July 31, | 2013 | 2012 | 2011 | 2010 | 2009 |
Selected Per-Share Data | | | | | |
Net asset value, beginning of period | $ 14.28 | $ 15.01 | $ 13.08 | $ 10.89 | $ 11.60 |
Income from Investment Operations | | | | | |
Net investment income (loss) C | (.06) | (.09) | (.10) F | (.07) G | .01 |
Net realized and unrealized gain (loss) | 5.34 | .29 | 2.17 | 2.26 | (.58) |
Total from investment operations | 5.28 | .20 | 2.07 | 2.19 | (.57) |
Distributions from net investment income | (.03) | - | (.02) | - | (.03) |
Distributions from net realized gain | (.47) | (.93) | (.12) | - | (.11) |
Total distributions | (.50) | (.93) | (.14) | - | (.14) |
Redemption fees added to paid in capital C,I | - | - | - | - | - |
Net asset value, end of period | $ 19.06 | $ 14.28 | $ 15.01 | $ 13.08 | $ 10.89 |
Total Return A,B | 38.00% | 2.52% | 15.91% | 20.11% | (4.98)% |
Ratios to Average Net Assets D,H | | | | | |
Expenses before reductions | 2.13% | 2.19% | 2.18% | 2.22% | 2.20% |
Expenses net of fee waivers, if any | 2.13% | 2.19% | 2.18% | 2.15% | 2.15% |
Expenses net of all reductions | 2.12% | 2.19% | 2.18% | 2.14% | 2.15% |
Net investment income (loss) | (.35)% | (.66)% | (.68)% F | (.58)% G | .06% |
Supplemental Data | | | | | |
Net assets, end of period (000 omitted) | $ 76,018 | $ 47,265 | $ 47,457 | $ 37,346 | $ 21,345 |
Portfolio turnover rate E | 29% | 27% | 22% | 49% | 51% |
A Total returns would have been lower if certain expenses had not been reduced during the applicable periods shown.
B Total returns do not include the effect of the contingent deferred sales charge.
C Calculated based on average shares outstanding during the period.
D Fees and expenses of any underlying Fidelity Central Funds are not included in the Fund's expense ratio. The Fund indirectly bears its proportionate share of the expenses of any underlying Fidelity Central Funds.
E Amount does not include the portfolio activity of any underlying Fidelity Central Funds.
F Investment income per share reflects a large, non-recurring dividend which amounted to $.06 per share. Excluding this non-recurring dividend, the ratio of net investment income (loss) to average net assets would have been (1.06)%.
G Investment income per share reflects a large, non-recurring dividend which amounted to $.03 per share. Excluding this non-recurring dividend, the ratio of net investment income (loss) to average net assets would have been (.85)%.
H Expense ratios reflect operating expenses of the class. Expenses before reductions do not reflect amounts reimbursed by the investment adviser or reductions from brokerage service arrangements or reductions from other expense offset arrangements and do not represent the amount paid by the class during periods when reimbursements or reductions occur. Expenses net of fee waivers reflect expenses after reimbursement by the investment adviser but prior to reductions from brokerage service arrangements or other expense offset arrangements. Expenses net of all reductions represent the net expenses paid by the class.
I Amount represents less than $.01 per share.
See accompanying notes which are an integral part of the financial statements.
Annual Report
Financial Highlights - Small Cap Value
Years ended July 31, | 2013 | 2012 | 2011 | 2010 | 2009 |
Selected Per-Share Data | | | | | |
Net asset value, beginning of period | $ 15.05 | $ 15.62 | $ 13.56 | $ 11.22 | $ 11.91 |
Income from Investment Operations | | | | | |
Net investment income (loss) B | .12 | .06 | .06 E | .05 F | .10 |
Net realized and unrealized gain (loss) | 5.63 | .32 | 2.23 | 2.34 | (.60) |
Total from investment operations | 5.75 | .38 | 2.29 | 2.39 | (.50) |
Distributions from net investment income | (.11) | (.02) | (.10) | (.05) | (.08) |
Distributions from net realized gain | (.47) | (.93) | (.13) | - | (.11) |
Total distributions | (.58) | (.95) | (.23) | (.05) | (.19) |
Redemption fees added to paid in capital B,H | - | - | - | - | - |
Net asset value, end of period | $ 20.22 | $ 15.05 | $ 15.62 | $ 13.56 | $ 11.22 |
Total Return A | 39.45% | 3.67% | 17.03% | 21.32% | (4.15)% |
Ratios to Average Net Assets C,G | | | | |
Expenses before reductions | 1.07% | 1.13% | 1.13% | 1.18% | 1.20% |
Expenses net of fee waivers, if any | 1.07% | 1.13% | 1.13% | 1.18% | 1.20% |
Expenses net of all reductions | 1.06% | 1.13% | 1.13% | 1.17% | 1.20% |
Net investment income (loss) | .71% | .41% | .37% E | .39% F | 1.01% |
Supplemental Data | | | | | |
Net assets, end of period (000 omitted) | $ 2,672,854 | $ 1,756,962 | $ 1,899,805 | $ 1,770,675 | $ 1,488,736 |
Portfolio turnover rate D | 29% | 27% | 22% | 49% | 51% |
A Total returns would have been lower if certain expenses had not been reduced during the applicable periods shown.
B Calculated based on average shares outstanding during the period.
C Fees and expenses of any underlying Fidelity Central Funds are not included in the Fund's expense ratio. The Fund indirectly bears its proportionate share of the expenses of any underlying Fidelity Central Funds.
D Amount does not include the portfolio activity of any underlying Fidelity Central Funds.
E Investment income per share reflects a large, non-recurring dividend which amounted to $.06 per share. Excluding this non-recurring dividend, the ratio of net investment income (loss) to average net assets would have been (.01)%.
F Investment income per share reflects a large, non-recurring dividend which amounted to $.03 per share. Excluding this non-recurring dividend, the ratio of net investment income (loss) to average net assets would have been .12%.
G Expense ratios reflect operating expenses of the class. Expenses before reductions do not reflect amounts reimbursed by the investment adviser or reductions from brokerage service arrangements or reductions from other expense offset arrangements and do not represent the amount paid by the class during periods when reimbursements or reductions occur. Expenses net of fee waivers reflect expenses after reimbursement by the investment adviser but prior to reductions from brokerage service arrangements or other expense offset arrangements. Expenses net of all reductions represent the net expenses paid by the class.
H Amount represents less than $.01 per share.
See accompanying notes which are an integral part of the financial statements.
Annual Report
Financial Highlights - Class F
Years ended July 31, | 2013 | 2012 | 2011 | 2010 | 2009 I |
Selected Per-Share Data | | | | | |
Net asset value, beginning of period | $ 15.09 | $ 15.64 | $ 13.58 | $ 11.22 | $ 10.27 |
Income from Investment Operations | | | | |
Net investment income (loss) D | .16 | .09 | .09 G | .09 H | .01 |
Net realized and unrealized gain (loss) | 5.65 | .32 | 2.23 | 2.34 | .94 |
Total from investment operations | 5.81 | .41 | 2.32 | 2.43 | .95 |
Distributions from net investment income | (.15) | (.04) | (.14) | (.07) | - |
Distributions from net realized gain | (.47) | (.93) | (.13) | - | - |
Total distributions | (.62) | (.96) L | (.26) M | (.07) | - |
Redemption fees added to paid in capital D,K | - | - | - | - | - |
Net asset value, end of period | $ 20.28 | $ 15.09 | $ 15.64 | $ 13.58 | $ 11.22 |
Total Return B,C | 39.79% | 3.90% | 17.31% | 21.69% | 9.25% |
Ratios to Average Net Assets E,J | | | | | |
Expenses before reductions | .84% | .89% | .88% | .90% | .86% A |
Expenses net of fee waivers, if any | .84% | .89% | .88% | .90% | .86% A |
Expenses net of all reductions | .84% | .89% | .88% | .89% | .86% A |
Net investment income (loss) | .93% | .64% | .61% G | .67% H | .64% A |
Supplemental Data | | | | | |
Net assets, end of period (000 omitted) | $ 732,193 | $ 526,009 | $ 279,653 | $ 109,868 | $ 159 |
Portfolio turnover rate F | 29% | 27% | 22% | 49% | 51% |
A Annualized
B Total returns for periods of less than one year are not annualized.
C Total returns would have been lower if certain expenses had not been reduced during the applicable periods shown.
D Calculated based on average shares outstanding during the period.
E Fees and expenses of any underlying Fidelity Central Funds are not included in the Fund's expense ratio. The Fund indirectly bears its proportionate share of the expenses of any underlying Fidelity Central Funds.
F Amount does not include the portfolio activity of any underlying Fidelity Central Funds.
G Investment income per share reflects a large, non-recurring dividend which amounted to $.06 per share. Excluding this non-recurring dividend, the ratio of net investment income (loss) to average net assets would have been .24%.
H Investment income per share reflects a large, non-recurring dividend which amounted to $.03 per share. Excluding this non-recurring dividend, the ratio of net investment income (loss) to average net assets would have been .40%.
I For the period June 26, 2009 (commencement of sale of shares) to July 31, 2009.
J Expense ratios reflect operating expenses of the class. Expenses before reductions do not reflect amounts reimbursed by the investment adviser or reductions from brokerage service arrangements or reductions from other expense offset arrangements and do not represent the amount paid by the class during periods when reimbursements or reductions occur. Expense ratios before reductions for start-up periods may not be representative of longer-term operating periods. Expenses net of fee waivers reflect expenses after reimbursement by the investment adviser but prior to reductions from brokerage service arrangements or other expense offset arrangements. Expenses net of all reductions represent the net expenses paid by the class.
K Amount represents less than $.01 per share.
L Total distributions of $.96 per share is comprised of distributions from net investment income of $.036 and distributions from net realized gain of $.925 per share.
M Total distributions of $.26 per share is comprised of distributions from net investment income of $.138 and distributions from net realized gain of $.126 per share.
See accompanying notes which are an integral part of the financial statements.
Annual Report
Financial Highlights - Institutional Class
Years ended July 31, | 2013 | 2012 | 2011 | 2010 | 2009 |
Selected Per-Share Data | | | | | |
Net asset value, beginning of period | $ 15.05 | $ 15.63 | $ 13.58 | $ 11.24 | $ 11.91 |
Income from Investment Operations | | | | | |
Net investment income (loss) B | .12 | .06 | .06 E | .06 F | .10 |
Net realized and unrealized gain (loss) | 5.65 | .31 | 2.23 | 2.34 | (.59) |
Total from investment operations | 5.77 | .37 | 2.29 | 2.40 | (.49) |
Distributions from net investment income | (.12) | (.02) | (.11) | (.06) | (.07) |
Distributions from net realized gain | (.47) | (.93) | (.13) | - | (.11) |
Total distributions | (.59) | (.95) | (.24) | (.06) | (.18) |
Redemption fees added to paid in capital B,H | - | - | - | - | - |
Net asset value, end of period | $ 20.23 | $ 15.05 | $ 15.63 | $ 13.58 | $ 11.24 |
Total Return A | 39.54% | 3.59% | 17.02% | 21.42% | (4.04)% |
Ratios to Average Net Assets C,G | | | | | |
Expenses before reductions | 1.07% | 1.14% | 1.10% | 1.12% | 1.20% |
Expenses net of fee waivers, if any | 1.07% | 1.14% | 1.10% | 1.12% | 1.15% |
Expenses net of all reductions | 1.06% | 1.14% | 1.10% | 1.12% | 1.15% |
Net investment income (loss) | .70% | .39% | .39% E | .45% F | 1.06% |
Supplemental Data | | | | | |
Net assets, end of period (000 omitted) | $ 359,582 | $ 138,981 | $ 101,565 | $ 78,440 | $ 10,336 |
Portfolio turnover rate D | 29% | 27% | 22% | 49% | 51% |
A Total returns would have been lower if certain expenses had not been reduced during the applicable periods shown.
B Calculated based on average shares outstanding during the period.
C Fees and expenses of any underlying Fidelity Central Funds are not included in the Fund's expense ratio. The Fund indirectly bears its proportionate share of the expenses of any underlying Fidelity Central Funds.
D Amount does not include the portfolio activity of any underlying Fidelity Central Funds.
E Investment income per share reflects a large, non-recurring dividend which amounted to $.06 per share. Excluding this non-recurring dividend, the ratio of net investment income (loss) to average net assets would have been .01%.
F Investment income per share reflects a large, non-recurring dividend which amounted to $.03 per share. Excluding this non-recurring dividend, the ratio of net investment income (loss) to average net assets would have been .18%.
G Expense ratios reflect operating expenses of the class. Expenses before reductions do not reflect amounts reimbursed by the investment adviser or reductions from brokerage service arrangements or reductions from other expense offset arrangements and do not represent the amount paid by the class during periods when reimbursements or reductions occur. Expenses net of fee waivers reflect expenses after reimbursement by the investment adviser but prior to reductions from brokerage service arrangements or other expense offset arrangements. Expenses net of all reductions represent the net expenses paid by the class.
H Amount represents less than $.01 per share.
See accompanying notes which are an integral part of the financial statements.
Annual Report
Notes to Financial Statements
For the period ended July 31, 2013
1. Organization.
Fidelity Small Cap Value Fund (the Fund) is a fund of Fidelity Securities Fund (the Trust) and is authorized to issue an unlimited number of shares. The Trust is registered under the Investment Company Act of 1940, as amended (the 1940 Act), as an open-end management investment company organized as a Massachusetts business trust. The Fund offers Class A, Class T, Class C, Small Cap Value, Class F and Institutional Class shares, each of which, along with Class B shares, has equal rights as to assets and voting privileges. Class B shares are closed to new accounts and additional purchases, except for exchanges and reinvestments. Effective after the close of business on March 1, 2013, the Fund's other share classes were closed to new accounts with certain exceptions. Each class has exclusive voting rights with respect to matters that affect that class. Class F shares of the Fund are only available for purchase by mutual funds for which Fidelity Management & Research Company (FMR) or an affiliate serves as investment manager. Class B shares will automatically convert to Class A shares after a holding period of seven years from the initial date of purchase.
2. Investments in Fidelity Central Funds.
The Fund invests in Fidelity Central Funds, which are open-end investment companies generally available only to other investment companies and accounts managed by FMR and its affiliates. The Fund's Schedule of Investments lists each of the Fidelity Central Funds held as of period end, if any, as an investment of the Fund, but does not include the underlying holdings of each Fidelity Central Fund. As an Investing Fund, the Fund indirectly bears its proportionate share of the expenses of the underlying Fidelity Central Funds.
The Money Market Central Funds seek preservation of capital and current income and are managed by Fidelity Investments Money Management, Inc. (FIMM), an affiliate of FMR.
A complete unaudited list of holdings for each Fidelity Central Fund is available upon request or at the Securities and Exchange Commission (the SEC) website at www.sec.gov. In addition, the financial statements of the Fidelity Central Funds, which are not covered by the Fund's Report of Independent Registered Public Accounting Firm, are available on the SEC website or upon request.
3. Significant Accounting Policies.
The financial statements have been prepared in conformity with accounting principles generally accepted in the United States of America (GAAP), which require management to make certain estimates and assumptions at the date of the financial statements. Actual results could differ from those estimates. Subsequent events, if any, through the date that the financial statements were issued have been evaluated in the preparation of
Annual Report
Notes to Financial Statements - continued
3. Significant Accounting Policies - continued
the financial statements. The following summarizes the significant accounting policies of the Fund:
Investment Valuation. Investments are valued as of 4:00 p.m. Eastern time on the last calendar day of the period. In accordance with valuation policies and procedures approved by the Board of Trustees (the Board), the Fund attempts to obtain prices from one or more third party pricing vendors or brokers to value its investments. When current market prices, quotations or currency exchange rates are not readily available or reliable, investments will be fair valued in good faith by the FMR Fair Value Committee (the Committee), in accordance with procedures adopted by the Board. Factors used in determining fair value vary by investment type and may include market or investment specific events. The frequency with which these procedures are used cannot be predicted and they may be utilized to a significant extent. The Committee oversees the Fund's valuation policies and procedures and is responsible for approving and reporting to the Board all fair value determinations.
The Fund categorizes the inputs to valuation techniques used to value its investments into a disclosure hierarchy consisting of three levels as shown below:
Level 1 - quoted prices in active markets for identical investments
Level 2 - other significant observable inputs (including quoted prices for similar investments, interest rates, prepayment speeds, etc.)
Level 3 - unobservable inputs (including the Fund's own assumptions based on the best information available)
Valuation techniques used to value the Fund's investments by major category are as follows:
Equity securities, including restricted securities, for which market quotations are readily available, are valued at the last reported sale price or official closing price as reported by a third party pricing vendor on the primary market or exchange on which they are traded and are categorized as Level 1 in the hierarchy. In the event there were no sales during the day or closing prices are not available, securities are valued at the last quoted bid price or may be valued using the last available price and are generally categorized as Level 2 in the hierarchy. For foreign equity securities, when market or security specific events arise, comparisons to the valuation of American Depositary Receipts (ADRs), futures contracts, Exchange-Traded Funds (ETFs) and certain indexes as well as quoted prices for similar securities may be used and would be categorized as Level 2 in the hierarchy. Utilizing these techniques may result in transfers between Level 1 and Level 2.
Annual Report
3. Significant Accounting Policies - continued
Investment Valuation - continued
Investments in open-end mutual funds, including the Fidelity Central Funds, are valued at their closing net asset value (NAV) each business day and are categorized as Level 1 in the hierarchy.
Changes in valuation techniques may result in transfers in or out of an assigned level within the disclosure hierarchy.
Foreign Currency. The Fund may use foreign currency contracts to facilitate transactions in foreign-denominated securities. Gains and losses from these transactions may arise from changes in the value of the foreign currency or if the counterparties do not perform under the contracts' terms.
Foreign-denominated assets, including investment securities, and liabilities are translated into U.S. dollars at the exchange rates at period end. Purchases and sales of investment securities, income and dividends received and expenses denominated in foreign currencies are translated into U.S. dollars at the exchange rate in effect on the transaction date.
The effects of exchange rate fluctuations on investments are included with the net realized and unrealized gain (loss) on investment securities. Other foreign currency transactions resulting in realized and unrealized gain (loss) are disclosed separately.
Investment Transactions and Income. For financial reporting purposes, the Fund's investment holdings and NAV include trades executed through the end of the last business day of the period. The NAV per share for processing shareholder transactions is calculated as of the close of business of the New York Stock Exchange (NYSE), normally 4:00 p.m. Eastern time and includes trades executed through the end of the prior business day. Gains and losses on securities sold are determined on the basis of identified cost and may include proceeds received from litigation. Dividend income is recorded on the ex-dividend date, except for certain dividends from foreign securities where the ex-dividend date may have passed, which are recorded as soon as the Fund is informed of the ex-dividend date. Non-cash dividends included in dividend income, if any, are recorded at the fair market value of the securities received. Distributions received on securities that represent a return of capital or capital gain are recorded as a reduction of cost of investments and/or as a realized gain. Subsequent to ex-dividend date the Fund determines the components of these distributions, based upon receipt of tax filings or other correspondence relating to the underlying investment. Interest income and distributions from the Fidelity Central Funds are accrued as earned. Interest income includes coupon interest and amortization of premium and accretion of discount on debt securities. Investment income is recorded net of foreign taxes withheld where recovery of such taxes is uncertain.
Annual Report
Notes to Financial Statements - continued
3. Significant Accounting Policies - continued
Class Allocations and Expenses. Investment income, realized and unrealized capital gains and losses, common expenses of the Fund, and certain fund-level expense reductions, if any, are allocated on a pro-rata basis to each class based on the relative net assets of each class to the total net assets of the Fund. Each class differs with respect to transfer agent and distribution and service plan fees incurred. Certain expense reductions may also differ by class. Expenses directly attributable to a fund are charged to that fund. Expenses attributable to more than one fund are allocated among the respective funds on the basis of relative net assets or other appropriate methods. Expense estimates are accrued in the period to which they relate and adjustments are made when actual amounts are known.
Income Tax Information and Distributions to Shareholders. Each year, the Fund intends to qualify as a regulated investment company under Subchapter M of the Internal Revenue Code, including distributing substantially all of its taxable income and realized gains. As a result, no provision for income taxes is required. As of July 31, 2013, the Fund did not have any unrecognized tax benefits in the financial statements; nor is the Fund aware of any tax positions for which it is reasonably possible that the total amounts of unrecognized tax benefits will significantly change in the next twelve months. The Fund files a U.S. federal tax return, in addition to state and local tax returns as required. A fund's federal income tax returns are subject to examination by the Internal Revenue Service (IRS) for a period of three fiscal years after they are filed. State and local tax returns may be subject to examination for an additional fiscal year depending on the jurisdiction. Foreign taxes are provided for based on the Fund's understanding of the tax rules and rates that exist in the foreign markets in which it invests.
Distributions are declared and recorded on the ex-dividend date. Income dividends and capital gain distributions are declared separately for each class. Income and capital gain distributions are determined in accordance with income tax regulations, which may differ from GAAP. In addition, the Fund claimed a portion of the payment made to redeeming shareholders as a distribution for income tax purposes.
Capital accounts within the financial statements are adjusted for permanent book-tax differences. These adjustments have no impact on net assets or the results of operations. Temporary book-tax differences will reverse in a subsequent period.
Book-tax differences are primarily due to foreign currency transactions and losses deferred due to wash sales.
Annual Report
3. Significant Accounting Policies - continued
Income Tax Information and Distributions to Shareholders - continued
The federal tax cost of investment securities and unrealized appreciation (depreciation) as of period end were as follows:
Gross unrealized appreciation | $ 1,227,810,766 |
Gross unrealized depreciation | (53,133,128) |
Net unrealized appreciation (depreciation) on securities and other investments | $ 1,174,677,638 |
| |
Tax Cost | $ 3,131,813,247 |
The tax-based components of distributable earnings as of period end were as follows:
Undistributed ordinary income | $ 6,475,378 |
Undistributed long-term capital gain | $ 260,802,795 |
Net unrealized appreciation (depreciation) | $ 1,174,679,321 |
The tax character of distributions paid was as follows:
| July 31, 2013 | July 31, 2012 |
Ordinary Income | $ 21,412,021 | $ 3,813,704 |
Long-term Capital Gains | 85,195,362 | 148,970,854 |
Total | $ 106,607,383 | $ 152,784,558 |
Short-Term Trading (Redemption) Fees. Shares held by investors in the Fund less than 90 days may have been subject to a redemption fee equal to 1.50% of the net asset value of shares redeemed. All redemption fees, which reduce the proceeds of the shareholder redemption, are retained by the Fund and accounted for as an addition to paid in capital.
4. Purchases and Sales of Investments.
Purchases and sales of securities, other than short-term securities, aggregated $1,422,626,355 and $998,724,082, respectively.
5. Fees and Other Transactions with Affiliates.
Management Fee. FMR and its affiliates provide the Fund with investment management related services for which the Fund pays a monthly management fee. The management fee is the sum of an individual fund fee rate that is based on an annual rate of .45% of the Fund's average net assets and an annualized group fee rate that averaged .26% during the period. The group fee rate is based upon the average net assets of all the
Annual Report
Notes to Financial Statements - continued
5. Fees and Other Transactions with Affiliates - continued
Management Fee - continued
mutual funds advised by FMR. The group fee rate decreases as assets under management increase and increases as assets under management decrease. In addition, the management fee is subject to a performance adjustment (up to a maximum of ± .20% of the Fund's average net assets over a 36 month performance period). The upward or downward adjustment to the management fee is based on the relative investment performance of Small Cap Value as compared to an appropriate benchmark index. For the period, the total annual management fee rate, including the performance adjustment, was .81% of the Fund's average net assets.
Distribution and Service Plan Fees. In accordance with Rule 12b-1 of the 1940 Act, the Fund has adopted separate Distribution and Service Plans for each class of shares. Certain classes pay Fidelity Distributors Corporation (FDC), an affiliate of FMR, separate Distribution and Service Fees, each of which is based on an annual percentage of each class' average net assets. In addition, FDC may pay financial intermediaries for selling shares of the Fund and providing shareholder support services. For the period, the Distribution and Service Fee rates, total fees and amounts retained by FDC were as follows:
| Distribution
Fee | Service
Fee | Total Fees | Retained
by FDC |
Class A | -% | .25% | $ 521,981 | $ 17,754 |
Class T | .25% | .25% | 393,892 | 3,578 |
Class B | .75% | .25% | 69,430 | 52,493 |
Class C | .75% | .25% | 617,999 | 153,559 |
| | | $ 1,603,302 | $ 227,384 |
Sales Load. FDC may receive a front-end sales charge of up to 5.75% for selling Class A shares and 3.50% for selling Class T shares, some of which is paid to financial intermediaries for selling shares of the Fund. Depending on the holding period, FDC may receive contingent deferred sales charges levied on Class A, Class T, Class B and Class C redemptions. The deferred sales charges range from 5.00% to 1.00% for Class B shares, 1.00% for Class C shares, 1.00% for certain purchases of Class A shares and .25% for certain purchases of Class T shares.
Annual Report
5. Fees and Other Transactions with Affiliates - continued
Sales Load - continued
For the period, sales charge amounts retained by FDC were as follows:
| Retained
by FDC |
Class A | $ 49,310 |
Class T | 9,353 |
Class B* | 5,848 |
Class C* | 4,577 |
| $ 69,088 |
* When Class B and Class C shares are initially sold, FDC pays commissions from its own resources to financial intermediaries through which the sales are made.
Transfer Agent Fees. Fidelity Investments Institutional Operations Company, Inc., (FIIOC), an affiliate of FMR, is the transfer, dividend disbursing and shareholder servicing agent for each class of the Fund. FIIOC receives account fees and asset-based fees that vary according to the account size and type of account of the shareholders of the respective classes of the Fund, except for Class F. FIIOC receives no fees for providing transfer agency services to Class F. FIIOC pays for typesetting, printing and mailing of shareholder reports, except proxy statements. For the period, transfer agent fees for each class were as follows:
| Amount | % of
Average
Net Assets |
Class A | $ 563,024 | .27 |
Class T | 199,649 | .25 |
Class B | 20,848 | .30 |
Class C | 175,062 | .28 |
Small Cap Value | 4,868,907 | .22 |
Institutional Class | 559,678 | .23 |
| $ 6,387,168 | |
Accounting and Security Lending Fees. Fidelity Service Company, Inc. (FSC), an affiliate of FMR, maintains the Fund's accounting records. The accounting fee is based on the level of average net assets for each month. Under a separate contract, FSC administers the security lending program. The security lending fee is based on the number and duration of lending transactions.
Brokerage Commissions. The Fund placed a portion of its portfolio transactions with brokerage firms which are affiliates of the investment adviser. Brokerage commissions are included in net realized gain (loss) and change in net unrealized appreciation
Annual Report
Notes to Financial Statements - continued
5. Fees and Other Transactions with Affiliates - continued
Brokerage Commissions - continued
(depreciation) in the Statement of Operations. The commissions paid to these affiliated firms were $28,205 for the period.
Interfund Lending Program. Pursuant to an Exemptive Order issued by the SEC, the Fund, along with other registered investment companies having management contracts with FMR, may participate in an interfund lending program. This program provides an alternative credit facility allowing the funds to borrow from, or lend money to, other participating affiliated funds. At period end, there were no interfund loans outstanding. The Fund's activity in this program during the period for which loans were outstanding was as follows:
Borrower or Lender | Average Loan
Balance | Weighted Average Interest Rate | Interest
Expense |
Borrower | $ 5,199,400 | .35% | $ 508 |
6. Committed Line of Credit.
The Fund participates with other funds managed by FMR or an affiliate in a $4.25 billion credit facility (the "line of credit") to be utilized for temporary or emergency purposes to fund shareholder redemptions or for other short-term liquidity purposes. The Fund has agreed to pay commitment fees on its pro-rata portion of the line of credit, which amounted to $7,721 and is reflected in Miscellaneous expenses on the Statement of Operations. During the period, there were no borrowings on this line of credit.
7. Security Lending.
The Fund lends portfolio securities through a lending agent from time to time in order to earn additional income. For equity securities, a lending agent is used and may loan securities to certain qualified borrowers, including Fidelity Capital Markets (FCM), a broker-dealer affiliated with the Fund. On the settlement date of the loan, the Fund receives collateral (in the form of U.S. Treasury obligations, letters of credit and/or cash) against the loaned securities and maintains collateral in an amount not less than 100% of the market value of the loaned securities during the period of the loan. The market value of the loaned securities is determined at the close of business of the Fund and any additional required collateral is delivered to the Fund on the next business day. If the borrower defaults on its obligation to return the securities loaned because of insolvency or other reasons, the Fund may apply collateral received from the borrower against the obligation. The Fund may experience delays and costs in recovering the securities loaned. Any cash collateral received is invested in the Fidelity Securities Lending Cash Central Fund. The value of loaned securities and cash collateral at period end are
Annual Report
7. Security Lending - continued
disclosed on the Fund's Statement of Assets and Liabilities. The value of securities loaned to FCM at period end was $3,995,700. Security lending income represents the income earned on investing cash collateral, less rebates paid to borrowers and any lending agent fees associated with the loan, plus any premium payments received for lending certain types of securities. Security lending income is presented in the Statement of Operations as a component of income from Fidelity Central Funds. Total security lending income during the period amounted to $546,053, including $146,197 from securities loaned to FCM.
8. Expense Reductions.
Commissions paid to certain brokers with whom FMR places trades on behalf of the Fund include an amount in addition to trade execution, which is rebated back to the Fund to offset certain expenses. This amount totaled $235,596 for the period.
In addition, FMR reimbursed a portion of the Fund's operating expenses during the period in the amount of $6,754.
9. Distributions to Shareholders.
Distributions to shareholders of each class were as follows:
Years ended July 31, | 2013 | 2012 |
From net investment income | | |
Class A | $ 785,355 | $ 57,416 |
Class T | 231,402 | - |
Class B | 9,411 | - |
Class C | 90,526 | - |
Small Cap Value | 13,318,853 | 2,736,678 |
Class F | 5,669,081 | 858,633 |
Institutional Class | 1,307,393 | 160,977 |
Total | $ 21,412,021 | $ 3,813,704 |
From net realized gain | | |
Class A | $ 5,001,914 | $ 8,369,079 |
Class T | 1,871,336 | 3,332,444 |
Class B | 211,601 | 513,839 |
Class C | 1,589,582 | 2,835,863 |
Small Cap Value | 54,759,308 | 109,450,254 |
Class F | 17,097,966 | 18,207,376 |
Institutional Class | 4,663,655 | 6,261,999 |
Total | $ 85,195,362 | $ 148,970,854 |
Annual Report
Notes to Financial Statements - continued
10. Share Transactions.
Transactions for each class of shares were as follows:
| Shares | Dollars |
Years ended July 31, | 2013 | 2012 | 2013 | 2012 |
Class A | | | | |
Shares sold | 6,665,265 | 3,582,114 | $ 113,825,347 | $ 51,112,084 |
Reinvestment of distributions | 357,182 | 639,382 | 5,478,656 | 7,957,627 |
Shares redeemed | (3,345,663) | (3,203,028) | (56,976,312) | (45,298,282) |
Net increase (decrease) | 3,676,784 | 1,018,468 | $ 62,327,691 | $ 13,771,429 |
Class T | | | | |
Shares sold | 2,420,486 | 1,074,645 | $ 41,524,163 | $ 15,238,625 |
Reinvestment of distributions | 135,952 | 264,657 | 2,060,454 | 3,258,576 |
Shares redeemed | (1,017,057) | (1,066,289) | (17,196,752) | (14,773,000) |
Net increase (decrease) | 1,539,381 | 273,013 | $ 26,387,865 | $ 3,724,201 |
Class B | | | | |
Shares sold | 63,699 | 17,886 | $ 1,033,590 | $ 244,464 |
Reinvestment of distributions | 12,922 | 36,117 | 189,673 | 433,889 |
Shares redeemed | (174,192) | (156,185) | (2,861,489) | (2,129,294) |
Net increase (decrease) | (97,571) | (102,182) | $ (1,638,226) | $ (1,450,941) |
Class C | | | | |
Shares sold | 1,262,288 | 840,854 | $ 20,129,471 | $ 11,606,643 |
Reinvestment of distributions | 98,556 | 202,948 | 1,448,319 | 2,439,209 |
Shares redeemed | (683,043) | (895,789) | (11,003,236) | (12,102,998) |
Net increase (decrease) | 677,801 | 148,013 | $ 10,574,554 | $ 1,942,854 |
Small Cap Value | | | | |
Shares sold | 46,643,321 | 27,786,966 | $ 815,184,196 | $ 403,227,336 |
Reinvestment of distributions | 4,065,017 | 8,564,707 | 63,037,497 | 107,820,730 |
Shares redeemed | (35,306,999) | (41,177,942) | (618,245,939) | (579,334,071) |
Net increase (decrease) | 15,401,339 | (4,826,269) | $ 259,975,754 | $ (68,286,005) |
Class F | | | | |
Shares sold | 7,943,352 | 17,383,615 | $ 133,806,197 | $ 249,495,726 |
Reinvestment of distributions | 1,465,154 | 1,506,337 | 22,767,047 | 19,066,009 |
Shares redeemed | (8,168,596) | (1,906,027) | (151,555,822) | (26,618,099) |
Net increase (decrease) | 1,239,910 | 16,983,925 | $ 5,017,422 | $ 241,943,636 |
Institutional Class | | | | |
Shares sold | 11,988,758 | 4,662,732 | $ 206,274,907 | $ 67,294,175 |
Reinvestment of distributions | 337,968 | 445,761 | 5,246,517 | 5,619,794 |
Shares redeemed | (3,783,835) | (2,373,514) | (66,718,093) | (33,655,059) |
Net increase (decrease) | 8,542,891 | 2,734,979 | $ 144,803,331 | $ 39,258,910 |
Annual Report
11. Other.
The Fund's organizational documents provide former and current trustees and officers with a limited indemnification against liabilities arising in connection with the performance of their duties to the Fund. In the normal course of business, the Fund may also enter into contracts that provide general indemnifications. The Fund's maximum exposure under these arrangements is unknown as this would be dependent on future claims that may be made against the Fund. The risk of material loss from such claims is considered remote.
At the end of the period, Fidelity Freedom Funds and Fidelity Freedom K Funds were the owners of record, in the aggregate, of approximately 31% of the total outstanding shares of the Fund.
Annual Report
To the Trustees of Fidelity Securities Fund and the Shareholders of Fidelity Small Cap Value Fund:
In our opinion, the accompanying statement of assets and liabilities, including the schedule of investments, and the related statements of operations and of changes in net assets and the financial highlights present fairly, in all material respects, the financial position of Fidelity Small Cap Value Fund (a fund of Fidelity Securities Fund) at July 31, 2013, the results of its operations for the year then ended, the changes in its net assets for each of the two years in the period then ended and the financial highlights for each of the five years in the period then ended, in conformity with accounting principles generally accepted in the United States of America. These financial statements and financial highlights (hereafter referred to as "financial statements") are the responsibility of the Fidelity Small Cap Value Fund's management. Our responsibility is to express an opinion on these financial statements based on our audits. We conducted our audits of these financial statements in accordance with the standards of the Public Company Accounting Oversight Board (United States). Those standards require that we plan and perform the audit to obtain reasonable assurance about whether the financial statements are free of material misstatement. An audit includes examining, on a test basis, evidence supporting the amounts and disclosures in the financial statements, assessing the accounting principles used and significant estimates made by management, and evaluating the overall financial statement presentation. We believe that our audits, which included confirmation of securities at July 31, 2013 by correspondence with the custodian and brokers, provide a reasonable basis for our opinion.
PricewaterhouseCoopers LLP
Boston, Massachusetts
September 16, 2013
Annual Report
The Trustees, Member of the Advisory Board, and executive officers of the trust and fund, as applicable, are listed below. The Board of Trustees governs the fund and is responsible for protecting the interests of shareholders. The Trustees are experienced executives who meet periodically throughout the year to oversee the fund's activities, review contractual arrangements with companies that provide services to the fund, oversee management of the risks associated with such activities and contractual arrangements, and review the fund's performance. Except for James C. Curvey, Ned C. Lautenbach, Ronald P. O'Hanley, and William S. Stavropoulos, each of the Trustees oversees 166 Fidelity funds. Mr. Curvey oversees 387 Fidelity funds. Mr. Lautenbach, Mr. O'Hanley, and Mr. Stavropoulos each oversees 230 Fidelity funds.
The Trustees hold office without limit in time except that (a) any Trustee may resign; (b) any Trustee may be removed by written instrument, signed by at least two-thirds of the number of Trustees prior to such removal; (c) any Trustee who requests to be retired or who has become incapacitated by illness or injury may be retired by written instrument signed by a majority of the other Trustees; and (d) any Trustee may be removed at any special meeting of shareholders by a two-thirds vote of the outstanding voting securities of the trust. Each Trustee who is not an interested person of the trust and the fund (as defined in the 1940 Act) (Independent Trustee), shall retire not later than the last day of the calendar year in which his or her 75th birthday occurs. The Independent Trustees may waive this mandatory retirement age policy with respect to individual Trustees. The executive officers and Advisory Board Member hold office without limit in time, except that any officer and Advisory Board Member may resign or may be removed by a vote of a majority of the Trustees at any regular meeting or any special meeting of the Trustees. Except as indicated, each individual has held the office shown or other offices in the same company for the past five years.
Experience, Skills, Attributes, and Qualifications of the Fund's Trustees. The Governance and Nominating Committee has adopted a statement of policy that describes the experience, qualifications, attributes, and skills that are necessary and desirable for potential Independent Trustee candidates (Statement of Policy). The Board believes that each Trustee satisfied at the time he or she was initially elected or appointed a Trustee, and continues to satisfy, the standards contemplated by the Statement of Policy. The Governance and Nominating Committee also engages professional search firms to help identify potential Independent Trustee candidates who have the experience, qualifications, attributes, and skills consistent with the Statement of Policy. From time to time, additional criteria based on the composition and skills of the current Independent Trustees, as well as experience or skills that may be appropriate in light of future changes to board composition, business conditions, and regulatory or other developments, have also been considered by the professional search firms and the Governance and Nominating Committee. In addition, the Board takes into account the Trustees' commitment and participation in Board and committee meetings, as well as their leadership of standing and ad hoc committees throughout their tenure.
Annual Report
In determining that a particular Trustee was and continues to be qualified to serve as a Trustee, the Board has considered a variety of criteria, none of which, in isolation, was controlling. The Board believes that, collectively, the Trustees have balanced and diverse experience, qualifications, attributes, and skills, which allow the Board to operate effectively in governing the fund and protecting the interests of shareholders. Information about the specific experience, skills, attributes, and qualifications of each Trustee, which in each case led to the Board's conclusion that the Trustee should serve (or continue to serve) as a trustee of the fund, is provided below.
Board Structure and Oversight Function. James C. Curvey is an interested person (as defined in the 1940 Act) and currently serves as Chairman. The Trustees have determined that an interested Chairman is appropriate and benefits shareholders because an interested Chairman has a personal and professional stake in the quality and continuity of services provided to the fund. Independent Trustees exercise their informed business judgment to appoint an individual of their choosing to serve as Chairman, regardless of whether the Trustee happens to be independent or a member of management. The Independent Trustees have determined that they can act independently and effectively without having an Independent Trustee serve as Chairman and that a key structural component for assuring that they are in a position to do so is for the Independent Trustees to constitute a substantial majority for the Board. The Independent Trustees also regularly meet in executive session. Ned C. Lautenbach serves as Chairman of the Independent Trustees and as such (i) acts as a liaison between the Independent Trustees and management with respect to matters important to the Independent Trustees and (ii) with management prepares agendas for Board meetings.
Fidelity funds are overseen by different Boards of Trustees. The fund's Board oversees Fidelity's equity and high income funds and another Board oversees Fidelity's investment-grade bond, money market, and asset allocation funds. The asset allocation funds may invest in Fidelity funds overseen by the fund's Board. The use of separate Boards, each with its own committee structure, allows the Trustees of each group of Fidelity funds to focus on the unique issues of the funds they oversee, including common research, investment, and operational issues. On occasion, the separate Boards establish joint committees to address issues of overlapping consequences for the Fidelity funds overseen by each Board.
The Trustees operate using a system of committees to facilitate the timely and efficient consideration of all matters of importance to the Trustees, the fund, and fund shareholders and to facilitate compliance with legal and regulatory requirements and oversight of the fund's activities and associated risks. The Board, acting through its committees, has charged FMR and its affiliates with (i) identifying events or circumstances the occurrence of which could have demonstrably adverse effects on the fund's business and/or reputation; (ii) implementing processes and controls to lessen the possibility that such events or circumstances occur or to mitigate the effects of such events or circumstances if they do occur; and (iii) creating and maintaining a system designed to evaluate continuously business and market conditions in order to facilitate the identification and implementation processes described in (i) and (ii) above. Because the day-to-day operations and activities of the fund's are carried out by or through FMR, its affiliates and other service providers, the fund's exposure to risks is mitigated but not eliminated by the processes overseen by the Trustees. While each of the Board's committees has responsibility for overseeing different aspects of the fund's activities, oversight is exercised primarily through the Operations, Audit, and Compliance Committees. In addition, the Independent Trustees have worked with FMR to enhance the Board's oversight of investment and financial risks, legal and regulatory risks, technology risks, and operational risks, including the development of additional risk reporting to the Board. For example, a working group comprised of Independent Trustees and FMR has worked and continues to work to review the Fidelity funds' valuation-related activities, reporting and risk management. Appropriate personnel, including but not limited to the fund's Chief Compliance Officer (CCO), FMR's internal auditor, the independent accountants, the fund's Treasurer and portfolio management personnel, make periodic reports to the Board's committees, as appropriate, including an annual review of FMR's risk management program for the Fidelity funds. The responsibilities of each standing committee, including their oversight responsibilities, are described further under "Standing Committees of the Fund's Trustees."
Annual Report
Trustees and Officers - continued
The fund's Statement of Additional Information (SAI) includes more information about the Trustees. To request a free copy, call Fidelity at 1-877-208-0098.
Interested Trustees*:
Correspondence intended for each Trustee who is an interested person may be sent to Fidelity Investments, 245 Summer Street, Boston, Massachusetts 02210.
Name, Year of Birth; Principal Occupations and Other Relevant Experience+ |
James C. Curvey (1935) |
| Year of Election or Appointment: 2007 Mr. Curvey is Trustee and Chairman of the Board of Trustees of certain Trusts. Mr. Curvey also serves as Trustee (2007-present) of other investment companies advised by FMR. Mr. Curvey is a Director of Fidelity Investments Money Management, Inc. (2009-present), Director of Fidelity Research & Analysis Co. (2009-present) and Director of FMR and FMR Co., Inc. (2007-present). Mr. Curvey is also Vice Chairman (2007-present) and Director of FMR LLC. In addition, Mr. Curvey serves as an Overseer for the Boston Symphony Orchestra and a member of the Trustees of Villanova University. Previously, Mr. Curvey was the Vice Chairman (2006-2007) and Director (2000-2007) of FMR Corp. |
Ronald P. O'Hanley (1957) |
| Year of Election or Appointment: 2011 Mr. O'Hanley serves as a Trustee and Chairman of the Board of Trustees of other Fidelity funds (2013-present), and is Director of FMR Co., Inc. (2010-present), Director of Fidelity Investments Money Management, Inc. (2010-present), Director of Fidelity Research & Analysis Company (2010-present), President of Fidelity Asset Management and Corporate Services and a Member of Fidelity's Executive Committee (2010-present). Previously, Mr. O'Hanley served as President and Chief Executive Officer of BNY Mellon Asset Management (2007-2010). Mr. O'Hanley also served as Vice Chairman of Bank New York Mellon Corp. and a member of that firm's Executive Committee. Prior to the 2007 merger of The Bank of New York and Mellon Financial Corporation, he was Vice Chairman of Mellon Financial Corporation and President and Chief Executive Officer of Mellon Asset Management. He joined Mellon in February 1997. Mr. O'Hanley currently serves as Chairman of the Boston Public Library Foundation Board of Directors and sits on the Board of Directors of Beth Israel Deaconess Medical Center, the Board of Trustees of the Marine Biological Laboratory and the Advisory Board of the Maxwell School of Citizenship and Public Administration at Syracuse University. Mr. O'Hanley also chairs the Council on Asset Management for the Financial Services Roundtable and is a member of the Board of Directors of Institutional Investor's U.S. Institute. |
* Trustees have been determined to be "Interested Trustees" by virtue of, among other things, their affiliation with the trust or various entities under common control with FMR.
+ The information above includes each Trustee's principal occupation during the last five years and other information relating to the experience, attributes, and skills relevant to each Trustee's qualifications to serve as a Trustee, which led to the conclusion that each Trustee should serve as a Trustee for the fund.
Annual Report
Trustees and Officers - continued
Independent Trustees:
Correspondence intended for each Independent Trustee (that is, the Trustees other than the Interested Trustees) may be sent to Fidelity Investments, P.O. Box 55235, Boston, Massachusetts 02205-5235.
Name, Year of Birth; Principal Occupations and Other Relevant Experience+ |
Dennis J. Dirks (1948) |
| Year of Election or Appointment: 2005 Prior to his retirement in May 2003, Mr. Dirks was Chief Operating Officer and a member of the Board of The Depository Trust & Clearing Corporation (DTCC). He also served as President, Chief Operating Officer, and Board member of The Depository Trust Company (DTC) and President and Board member of the National Securities Clearing Corporation (NSCC). In addition, Mr. Dirks served as Chief Executive Officer and Board member of the Government Securities Clearing Corporation, Chief Executive Officer and Board member of the Mortgage-Backed Securities Clearing Corporation, as a Trustee and a member of the Finance Committee of Manhattan College (2005-2008), and as a Trustee and a member of the Finance Committee of AHRC of Nassau County (2006-2008). Mr. Dirks is a member of the Independent Directors Council (IDC) Governing Council (2010-present) and Board of Directors for The Brookville Center for Children's Services, Inc. (2009-present). |
Alan J. Lacy (1953) |
| Year of Election or Appointment: 2008 Mr. Lacy serves as Senior Adviser (2007-present) of Oak Hill Capital Partners, L.P. (private equity). Mr. Lacy also served as Chief Executive Officer (2000-2005) and Vice Chairman (2005-2006) of Sears Holdings Corporation and Sears, Roebuck and Co. (retail). In addition, Mr. Lacy serves as a member of the Board of Directors of Dave & Buster's Entertainment, Inc. (restaurant and entertainment complexes, 2010-present), Earth Fare, Inc. (retail grocery, 2012-present), The Hillman Companies, Inc. (hardware wholesalers, 2010-present), and Bristol-Myers Squibb Company (global pharmaceuticals, 2008-present). Mr. Lacy is a member of the Board of Trustees of The National Parks Conservation Association (2006-present). Previously, Mr. Lacy served as Chairman of the Board of Trustees of the National Parks Conservation Association (2008-2011) and as a member of the Board of Directors for the Western Union Company (global money transfer, 2006-2011). |
Ned C. Lautenbach (1944) |
| Year of Election or Appointment: 2000 Mr. Lautenbach is Chairman of the Independent Trustees of the Equity and High Income Funds (2006-present) and serves as a Trustee of other Fidelity funds (2013-present). Mr. Lautenbach currently serves as the Lead Director of the Eaton Corporation Board of Directors (diversified industrial, 1997-present). Mr. Lautenbach is Chairman of the Board of Directors of the Philharmonic Center for the Arts in Naples, Florida (2012-present) and a member of the Council on Foreign Relations (1994-present). Previously, Mr. Lautenbach was a Partner/Advisory Partner at Clayton, Dubilier & Rice, LLC (private equity investment, 1998-2010), as well as a Director of Sony Corporation (2006-2007). |
Joseph Mauriello (1944) |
| Year of Election or Appointment: 2008 Prior to his retirement in January 2006, Mr. Mauriello served in numerous senior management positions including Deputy Chairman and Chief Operating Officer (2004-2005), and Vice Chairman of Financial Services (2002-2004) of KPMG LLP US (professional services, 1965-2005). Mr. Mauriello currently serves as a member of the Board of Directors of XL Group plc. (global insurance and re-insurance, 2006-present). Previously, Mr. Mauriello served as a Director of the Hamilton Funds of the Bank of New York (2006-2007) and of Arcadia Resources Inc. (health care services and products, 2007-2012). |
Robert W. Selander (1950) |
| Year of Election or Appointment: 2011 Previously, Mr. Selander served as a Member of the Advisory Board of Fidelity's Equity and High Income Funds (2011), Executive Vice Chairman (2010), Chief Executive Officer (2009-2010), and President and Chief Executive Officer (1997-2009) of Mastercard, Inc. |
Cornelia M. Small (1944) |
| Year of Election or Appointment: 2005 Ms. Small is a member of the Board of Directors (2009-present) and Chair of the Investment Committee (2010-present) of the Teagle Foundation. Ms. Small also serves on the Investment Committee of the Berkshire Taconic Community Foundation (2008-present). Previously, Ms. Small served as Chairperson (2002-2008) and a member of the Investment Committee and Chairperson (2008-2012) and a member of the Board of Trustees of Smith College. In addition, Ms. Small served as Chief Investment Officer, Director of Global Equity Investments, and a member of the Board of Directors of Scudder, Stevens & Clark and Scudder Kemper Investments. |
William S. Stavropoulos (1939) |
| Year of Election or Appointment: 2002 Mr. Stavropoulos is Vice Chairman of the Independent Trustees of the Equity and High Income Funds (2006-present) and serves as a Trustee of other Fidelity funds (2013-present). Mr. Stavropoulos serves as President and Founder of the Michigan Baseball Foundation, the Great Lakes Loons (2007-present). Mr. Stavropoulos is Chairman Emeritus of the Board of Directors of The Dow Chemical Company, where he previously served in numerous senior management positions, including President, CEO (1995-2000; 2002-2004), Chairman of the Executive Committee (2000-2006), and as a member of the Board of Directors (1990-2006). Currently, Mr. Stavropoulos is Chairman of the Board of Directors of Univar Inc. (global distributor of commodity and specialty chemicals), a Director of Teradata Corporation (data warehousing and technology solutions), and Maersk Inc. (industrial conglomerate), and a member of the Advisory Board for Metalmark Capital LLC (private equity investment, 2005-present). Mr. Stavropoulos is an operating advisor to Clayton, Dubilier & Rice, LLC (private equity investment). In addition, Mr. Stavropoulos is a member of the University of Notre Dame Advisory Council for the College of Science, a Trustee of the Rollin L. Gerstacker Foundation, and a Director of the Naples Philharmonic Center for the Arts. Previously, Mr. Stavropoulos served as a Director of Chemical Financial Corporation (bank holding company, 1993-2012) and Tyco International, Ltd. (multinational manufacturing and services, 2007-2012). |
David M. Thomas (1949) |
| Year of Election or Appointment: 2008 Previously, Mr. Thomas served as Executive Chairman (2005-2006) and Chairman and Chief Executive Officer (2000-2005) of IMS Health, Inc. (pharmaceutical and healthcare information solutions), and a Director of Fortune Brands, Inc. (consumer products, 2000-2011). In addition, Mr. Thomas serves as Non-Executive Chairman of the Board of Directors of Fortune Brands Home and Security (home and security products, 2011-present), and as a member of the Board of Directors of Interpublic Group of Companies, Inc. (marketing communication, 2004-present). |
+ The information above includes each Trustee's principal occupation during the last five years and other information relating to the experience, attributes, and skills relevant to each Trustee's qualifications to serve as a Trustee, which led to the conclusion that each Trustee should serve as a Trustee for the fund.
Annual Report
Advisory Board Member and Executive Officers:
Correspondence intended for each executive officer and Peter S. Lynch may be sent to Fidelity Investments, 245 Summer Street, Boston, Massachusetts 02210.
Name, Year of Birth; Principal Occupation |
Peter S. Lynch (1944) |
| Year of Election or Appointment: 2003 Member of the Advisory Board of Fidelity's Equity and High Income Funds. Mr. Lynch is Vice Chairman and a Director of FMR and FMR Co., Inc. In addition, Mr. Lynch serves as a Trustee of Boston College and as the Chairman of the Inner-City Scholarship Fund. Previously, Mr. Lynch served on the Special Olympics International Board of Directors (1997-2006). |
Kenneth B. Robins (1969) |
| Year of Election or Appointment: 2008 President and Treasurer of Fidelity's Equity and High Income Funds. Mr. Robins also serves as President and Treasurer (2008-present) and Assistant Treasurer (2009-present) of other Fidelity funds and is an employee of Fidelity Investments (2004-present). Mr. Robins serves as Executive Vice President of Fidelity Investments Money Management, Inc. (FIMM) (2013-present). Previously, Mr. Robins served as Deputy Treasurer of the Fidelity funds (2005-2008) and Treasurer and Chief Financial Officer of The North Carolina Capital Management Trust: Cash and Term Portfolios (2006-2008). |
Brian B. Hogan (1964) |
| Year of Election or Appointment: 2009 Vice President of Equity and High Income Funds. Mr. Hogan also serves as Vice President of other Fidelity funds (2009-present) and President of FMR's Equity Division (2009-present). Previously, Mr. Hogan served as Senior Vice President, Equity Research of FMR (2006-2009) and as a portfolio manager. |
Thomas C. Hense (1964) |
| Year of Election or Appointment: 2008 or 2010 Vice President of Fidelity's High Income (2008), Small Cap (2008), and Value (2010) Funds. Previously, Mr. Hense served as a portfolio manager for Fidelity's Institutional Money Management Group (Pyramis) (2003-2008). |
Scott C. Goebel (1968) |
| Year of Election or Appointment: 2008 Secretary and Chief Legal Officer (CLO) of the Fidelity funds. Mr. Goebel also serves as Secretary of Fidelity Investments Money Management, Inc. (FIMM) (2010-present) and Fidelity Research and Analysis Company (FRAC) (2010-present); Secretary and CLO of The North Carolina Capital Management Trust: Cash and Term Portfolios (2008-present); General Counsel, Secretary, and Senior Vice President of FMR (2008-present) and FMR Co., Inc. (2008-present); employed by FMR LLC or an affiliate (2001-present); Chief Legal Officer of Fidelity Management & Research (Hong Kong) Limited (2008-present) and Assistant Secretary of Fidelity Management & Research (Japan) Inc. (2008-present), and Fidelity Management & Research (U.K.) Inc. (2008-present). Previously, Mr. Goebel served as Assistant Secretary of FIMM (2008-2010), FRAC (2008-2010), and the Funds (2007-2008) and as Vice President and Secretary of Fidelity Distributors Corporation (FDC) (2005-2007). |
William C. Coffey (1969) |
| Year of Election or Appointment: 2009 Assistant Secretary of Fidelity's Equity and High Income Funds. Mr. Coffey also serves as Assistant Secretary of other Fidelity funds (2009-present), Senior Vice President and Deputy General Counsel of FMR LLC (2010-present), and is an employee of Fidelity Investments. Previously, Mr. Coffey served as Vice President and Associate General Counsel of FMR LLC (2005-2009). |
Elizabeth Paige Baumann (1968) |
| Year of Election or Appointment: 2012 Anti-Money Laundering (AML) Officer of the Fidelity funds. Ms. Baumann also serves as AML Officer of The North Carolina Capital Management Trust: Cash and Term Portfolios (2012-present), Chief AML Officer of FMR LLC (2012-present), and is an employee of Fidelity Investments. Previously, Ms. Baumann served as Vice President and Deputy Anti-Money Laundering Officer (2007-2012). |
Christine Reynolds (1958) |
| Year of Election or Appointment: 2008 Chief Financial Officer of the Fidelity funds. Ms. Reynolds became President of Fidelity Pricing and Cash Management Services (FPCMS) in August 2008. Ms. Reynolds served as Chief Operating Officer of FPCMS (2007-2008). Previously, Ms. Reynolds served as President, Treasurer, and Anti-Money Laundering officer of the Fidelity funds (2004-2007). |
Joseph A. Hanlon (1968) |
| Year of Election or Appointment: 2012 Chief Compliance Officer of Fidelity's Equity and High Income Funds. Mr. Hanlon also serves as Chief Compliance Officer of other Fidelity funds (2012-present). Mr. Hanlon serves as Compliance Officer of FMR, FMR Co., Inc., Fidelity Investments Money Management, Inc. (FIMM), Fidelity Research and Analysis Company (FRAC), and Fidelity Management & Research (Hong Kong) (2009-present), as Senior Vice President of the Fidelity Asset Management Division (2009-present), and is an employee of Fidelity Investments. Previously, Mr. Hanlon served as Compliance Officer of Fidelity Management & Research (Japan) Inc. (2009-2013), Strategic Advisers, Inc. (2009-2013), and Fidelity Management & Research (U.K.) Inc. (2009-2013). |
Joseph F. Zambello (1957) |
| Year of Election or Appointment: 2011 Deputy Treasurer of the Fidelity funds. Mr. Zambello is an employee of Fidelity Investments. Previously, Mr. Zambello served as Vice President of FMR's Program Management Group (2009-2011) and Vice President of the Transfer Agent Oversight Group (2005-2009). |
Adrien E. Deberghes (1967) |
| Year of Election or Appointment: 2008 Deputy Treasurer of Fidelity's Equity and High Income Funds. Mr. Deberghes also serves as Vice President (2011-present), Deputy Treasurer (2008-present), and Assistant Treasurer (2010-present) of other Fidelity funds, and is an employee of Fidelity Investments (2008-present). Previously, Mr. Deberghes served as Senior Vice President of Mutual Fund Administration at State Street Corporation (2007-2008), Senior Director of Mutual Fund Administration at Investors Bank & Trust (2005-2007), and Director of Finance for Dunkin' Brands (2000-2005). |
Stephen Sadoski (1971) |
| Year of Election or Appointment: 2012 Deputy Treasurer of Fidelity's Equity and High Income Funds. Mr. Sadoski also serves as Deputy Treasurer of other Fidelity funds (2012-present) and is an employee of Fidelity Investments (2012-present). Previously, Mr. Sadoski served as Assistant Treasurer of Fidelity's Fixed Income and Asset Allocation Funds (2012-2013), an assistant chief accountant in the Division of Investment Management of the Securities and Exchange Commission (SEC) (2009-2012) and as a senior manager at Deloitte & Touche LLP (1997-2009). |
Stacie M. Smith (1974) |
| Year of Election or Appointment: 2013 Deputy Treasurer of Fidelity's Equity and High Income Funds. Ms. Smith also serves as Deputy Treasurer of other Fidelity funds (2013-present) and is an employee of Fidelity Investments (2009-present). Previously, Ms. Smith served as Senior Audit Manager of Ernst & Young LLP (1996-2009). |
Stephanie J. Dorsey (1969) |
| Year of Election or Appointment: 2010 Assistant Treasurer of Fidelity's Equity and High Income Funds. Ms. Dorsey also serves as President and Treasurer (2013-present) and Assistant Treasurer (2010-present) of other Fidelity funds, Treasurer and Chief Financial Officer of The North Carolina Capital Management Trust: Cash and Term Portfolios (2013-present), and is an employee of Fidelity Investments (2008-present). Previously, Ms. Dorsey served as Deputy Treasurer of Fidelity's Fixed Income and Asset Allocation Funds (2008-2013), Treasurer (2004-2008) of the JPMorgan Mutual Funds and Vice President (2004-2008) of JPMorgan Chase Bank. |
Gary W. Ryan (1958) |
| Year of Election or Appointment: 2005 Assistant Treasurer of the Fidelity funds. Mr. Ryan is an employee of Fidelity Investments. Previously, Mr. Ryan served as Vice President of Fund Reporting in Fidelity Pricing and Cash Management Services (FPCMS) (1999-2005). |
Jonathan Davis (1968) |
| Year of Election or Appointment: 2010 Assistant Treasurer of the Fidelity funds. Mr. Davis is also Assistant Treasurer of Fidelity Rutland Square Trust II and Fidelity Commonwealth Trust II. Mr. Davis is an employee of Fidelity Investments. Previously, Mr. Davis served as Vice President and Associate General Counsel of FMR LLC (2003-2010). |
Annual Report
The Board of Trustees of Fidelity Small Cap Value Fund voted to pay to shareholders of record at the opening of business, the following distributions per share derived from capital gains realized from sales of portfolio securities, and dividends derived from net investment income:
| Pay Date | Record Date | Dividends | Capital Gains |
Institutional Class | 09/16/13 | 09/13/13 | $0.033 | $1.252 |
The fund hereby designates as a capital gain dividend with respect to the taxable year ended July 31, 2013, $300,428,923, or, if subsequently determined to be different, the net capital gain of such year.
Institutional Class designates 100% of the dividends distributed during the fiscal year as qualifying for the dividends-received deduction for corporate shareholders.
Institutional Class designates 100% of the dividends distributed during the fiscal year as amounts which can be taken into account as a dividend for the purposes of the maximum rate under section 1(h)(11) of the Internal Revenue Code.
The fund will notify shareholders in January 2014 of amounts for use in preparing 2013 income tax returns.
Annual Report
Board Approval of Investment Advisory Contracts and Management Fees
Fidelity Small Cap Value Fund
Each year, the Board of Trustees, including the Independent Trustees (together, the Board), votes on the renewal of the management contract and sub-advisory agreements (together, the Advisory Contracts) for the fund. The Board, assisted by the advice of fund counsel and Independent Trustees' counsel, requests and considers a broad range of information relevant to the renewal of the Advisory Contracts throughout the year.
The Board meets regularly and, at each of its meetings, covers an extensive agenda of topics and materials and considers factors that are relevant to its annual consideration of the renewal of the fund's Advisory Contracts, including the services and support provided to the fund and its shareholders. The Board has established various standing committees, each composed of and chaired by Independent Trustees with varying backgrounds, to which the Board has assigned specific subject matter responsibilities in order to enhance effective decision-making by the Board. The Board, acting directly and through its Committees, requests and receives information concerning the annual consideration of the renewal of the fund's Advisory Contracts. The Board also meets as needed to consider matters specifically related to the Board's annual consideration of the renewal of Advisory Contracts. Members of the Board may also meet with trustees of other Fidelity funds through ad hoc joint committees to discuss certain matters relevant to the Fidelity funds.
At its July 2013 meeting, the Board, including the Independent Trustees, unanimously determined to renew the fund's Advisory Contracts. In reaching its determination, the Board considered all factors it believed relevant, including (i) the nature, extent, and quality of the services to be provided to the fund and its shareholders (including the investment performance of the fund); (ii) the competitiveness of the fund's management fee and total expense ratio relative to peer funds; (iii) the total costs of the services to be provided by and the profits to be realized by Fidelity from its relationship with the fund; (iv) the extent to which economies of scale exist and would be realized as the fund grows; and (v) whether fee levels reflect these economies of scale, if any, for the benefit of fund shareholders.
In considering whether to renew the Advisory Contracts for the fund, the Board reached a determination, with the assistance of fund counsel and Independent Trustees' counsel and through the exercise of its business judgment, that the renewal of the Advisory Contracts was in the best interests of the fund and its shareholders and that the compensation payable under the Advisory Contracts was fair and reasonable. The Board's decision to renew the Advisory Contracts was not based on any single factor, but rather was based on a comprehensive consideration of all the information provided to the Board at its meetings throughout the year. The Board, in reaching its determination to renew the Advisory Contracts, was aware that shareholders in the fund have a broad range of investment choices available to them, including a wide choice among mutual funds offered by Fidelity's competitors, and that the fund's shareholders, who have the opportunity to review and weigh the disclosure provided by the fund in its prospectus and other public disclosures, have chosen to invest in this fund, which is a part of the Fidelity family of funds.
Annual Report
Nature, Extent, and Quality of Services Provided. The Board considered the staffing within the investment adviser, Fidelity Management & Research Company (FMR), and the sub-advisers (together, the Investment Advisers) as it relates to the fund, including the backgrounds of the fund's investment personnel, and also considered the fund's investment objective, strategies, and related investment philosophy. The Independent Trustees also had discussions with senior management of Fidelity's investment operations and investment groups. The Board considered the structure of the portfolio manager compensation program and whether this structure provides appropriate incentives to act in the best interests of the fund.
Resources Dedicated to Investment Management and Support Services. The Board and the Fund Oversight and Research Committees reviewed the general qualifications and capabilities of the Investment Advisers' investment staff, including its size, education, experience, and resources, as well as the Investment Advisers' approach to recruiting, training, managing, and compensating investment personnel. The Board noted that FMR has continued to increase the resources devoted to non-U.S. offices, including expansion of Fidelity's global investment organization. The Board also noted that Fidelity's analysts have extensive resources, tools and capabilities that allow them to conduct sophisticated quantitative and fundamental analysis, as well as credit analysis of issuers, counterparties and guarantors. Further, the Board believes that Fidelity's investment professionals have sufficient access to global information and data so as to provide competitive investment results over time, and that those professionals also have access to sophisticated tools that permit them to assess portfolio construction and risk and performance attribution characteristics continuously, as well as to transmit new information and research conclusions rapidly around the world. Additionally, in its deliberations, the Board considered the Investment Advisers' trading and risk management capabilities and resources, which are an integral part of the investment management process.
Shareholder and Administrative Services. The Board considered (i) the nature, extent, quality, and cost of advisory, administrative, and shareholder services performed by the Investment Advisers and their affiliates under the Advisory Contracts and under separate agreements covering transfer agency, pricing and bookkeeping, and securities lending services for the fund; (ii) the nature and extent of the supervision of third party service providers, principally custodians and subcustodians; and (iii) the resources devoted to, and the record of compliance with, the fund's compliance policies and procedures. The Board also reviewed the allocation of fund brokerage, including allocations to brokers affiliated with the Investment Advisers, the use of brokerage commissions to pay fund expenses, and the use of "soft" commission dollars to pay for research services.
Annual Report
Board Approval of Investment Advisory Contracts and
Management Fees - continued
The Board noted that the growth of fund assets over time across the complex allows Fidelity to reinvest in the development of services designed to enhance the value or convenience of the Fidelity funds as investment vehicles. These services include 24-hour access to account information and market information through telephone representatives and over the Internet, investor education materials and asset allocation tools, and the expanded availability of Fidelity Investor Centers.
Investment in a Large Fund Family. The Board considered the benefits to shareholders of investing in a Fidelity fund, including the benefits of investing in a fund that is part of a large family of funds offering a variety of investment disciplines and providing a large variety of mutual fund investor services. The Board noted that Fidelity had taken, or had made recommendations that resulted in the Fidelity funds taking, a number of actions over the previous year that benefited particular funds, including (i) continuing to dedicate additional resources to investment research and to the support of the senior management team that oversees asset management; (ii) persisting in efforts to enhance Fidelity's global research capabilities; (iii) launching new funds and making other enhancements to meet client needs for global and income-oriented solutions; (iv) continuing to launch dedicated lower cost underlying funds to meet portfolio construction needs related to expanding underlying fund options for Fidelity funds of funds, specifically for the Freedom Fund product lines; (v) rationalizing product lines and gaining increased efficiencies through the mergers of several funds into other funds; (vi) strengthening Fidelity's index fund offerings by reducing investment minimums and adopting or lowering existing expense caps for certain funds and classes; (vii) enhancing Global Asset Allocation product offerings by launching new funds and strategies, including "open architecture" target date funds that utilize affiliated and unaffiliated sub-advisers; (viii) modifying the eligibility criteria for Institutional Class shares of Advisor funds to increase their marketability to a portion of the defined contribution plan market; (ix) creating a new low-cost retirement share class for certain Advisor funds to appeal to large retirement plans; (x) transitioning the management of certain Fidelity commodity funds to Geode Capital Management LLC, a registered commodity pool operator, while retaining administrative responsibilities for the funds; (xi) reorganizing a number of funds; and (xii) taking steps toward establishing a new Fidelity adviser to manage sector-based funds and products.
Investment Performance. The Board considered whether the fund has operated in accordance with its investment objective, as well as its record of compliance with its investment restrictions and its performance history. The Board noted that there was a portfolio management change for the fund in January 2013.
Annual Report
The Board took into account discussions with the Investment Advisers about fund investment performance that occur at Board meetings throughout the year. In this regard the Board noted that as part of regularly scheduled fund reviews and other reports to the Board on fund performance, the Board periodically considers annualized return information for the fund, for different time periods, measured against a securities market index ("benchmark index") and a peer group of mutual funds with similar objectives ("peer group"). In its evaluation of fund investment performance, the Board gave particular attention to information indicating changes in performance of certain Fidelity funds for specific time periods and the Investment Advisers' explanations for any overperformance or underperformance.
In addition to reviewing absolute and relative fund performance, the Independent Trustees periodically consider the appropriateness of fund performance metrics in evaluating the results achieved. In general, the Independent Trustees believe that fund performance should be evaluated based on net performance (after fees and expenses) of both the highest performing and lowest performing classes, where applicable, compared to appropriate benchmark indices, over appropriate time periods which may include full market cycles, and compared to peer groups, as applicable, over the same periods, taking into account relevant factors including the following: general market conditions; issuer-specific information; tactical opportunities for investment; and fund cash flows and other factors.
The Independent Trustees recognize that shareholders evaluate performance on a net basis over their own holding periods, for which one-, three-, and five-year periods are used as a proxy. For this reason, the performance information reviewed by the Board also included net cumulative calendar year total return information for the fund and an appropriate benchmark index and peer group for the most recent one-, three-, and five-year periods, as shown below. Returns are shown compared to the 25th percentile (top of box) and 75th percentile (bottom of box) of the peer universe.
Annual Report
Board Approval of Investment Advisory Contracts and
Management Fees - continued
Fidelity Small Cap Value Fund

The Board also considered that the fund's management fee is subject to upward or downward adjustment depending upon whether, and to what extent, the fund's investment performance for the performance period exceeds, or is exceeded by, a securities index, thus leading to a performance adjustment for the same period. The Board noted that the performance adjustment provides FMR with a strong economic incentive to seek to achieve superior performance for the fund's shareholders and helps to more closely align the interests of FMR and the fund's shareholders.
Based on its review, the Board concluded that the nature, extent, and quality of services provided to the fund under the Advisory Contracts should benefit the fund's shareholders.
Competitiveness of Management Fee and Total Expense Ratio. The Board considered the fund's management fee and total expense ratio compared to "mapped groups" of competitive funds and classes. Fidelity creates "mapped groups" by combining similar Lipper investment objective categories that have comparable management fee characteristics. Combining Lipper investment objective categories aids the Board's management fee and total expense ratio comparisons by broadening the competitive group used for comparison and by reducing the number of universes to which various Fidelity funds are compared.
Management Fee. The Board considered two proprietary management fee comparisons for the 12-month periods shown in the chart below. The group of Lipper funds used by the Board for management fee comparisons is referred to below as the "Total Mapped Group." The Total Mapped Group comparison focuses on a fund's standing in terms of gross management fees before expense reimbursements or caps, and without giving effect to the fund's performance adjustment, relative to the total universe of funds with comparable investment mandates, regardless of whether their management fee structures also are comparable. Funds with comparable investment mandates offer exposure to similar types of securities. Funds with comparable management fee structures have similar management fee contractual arrangements (e.g., flat rate charged for advisory services, all-inclusive fee rate, etc.). "TMG %" represents the percentage of funds in the Total Mapped Group that had management fees that were lower than the fund's. For example, a TMG % of 14% means that 86% of the funds in the Total Mapped Group had higher management fees than the fund. The "Asset-Size Peer Group" (ASPG) comparison focuses on a fund's standing relative to a subset of non-Fidelity funds within the Total Mapped Group that are similar in size and management fee structure. The ASPG represents at least 15% of the funds in the Total Mapped Group with comparable asset size and management fee structures, subject to a minimum of 50 funds (or all funds in the Total Mapped Group if fewer than 50). Additional information, such as the ASPG quartile in which the fund's management fee ranked and the impact of the fund's performance adjustment, is also included in the chart and considered by the Board.
Annual Report
Fidelity Small Cap Value Fund
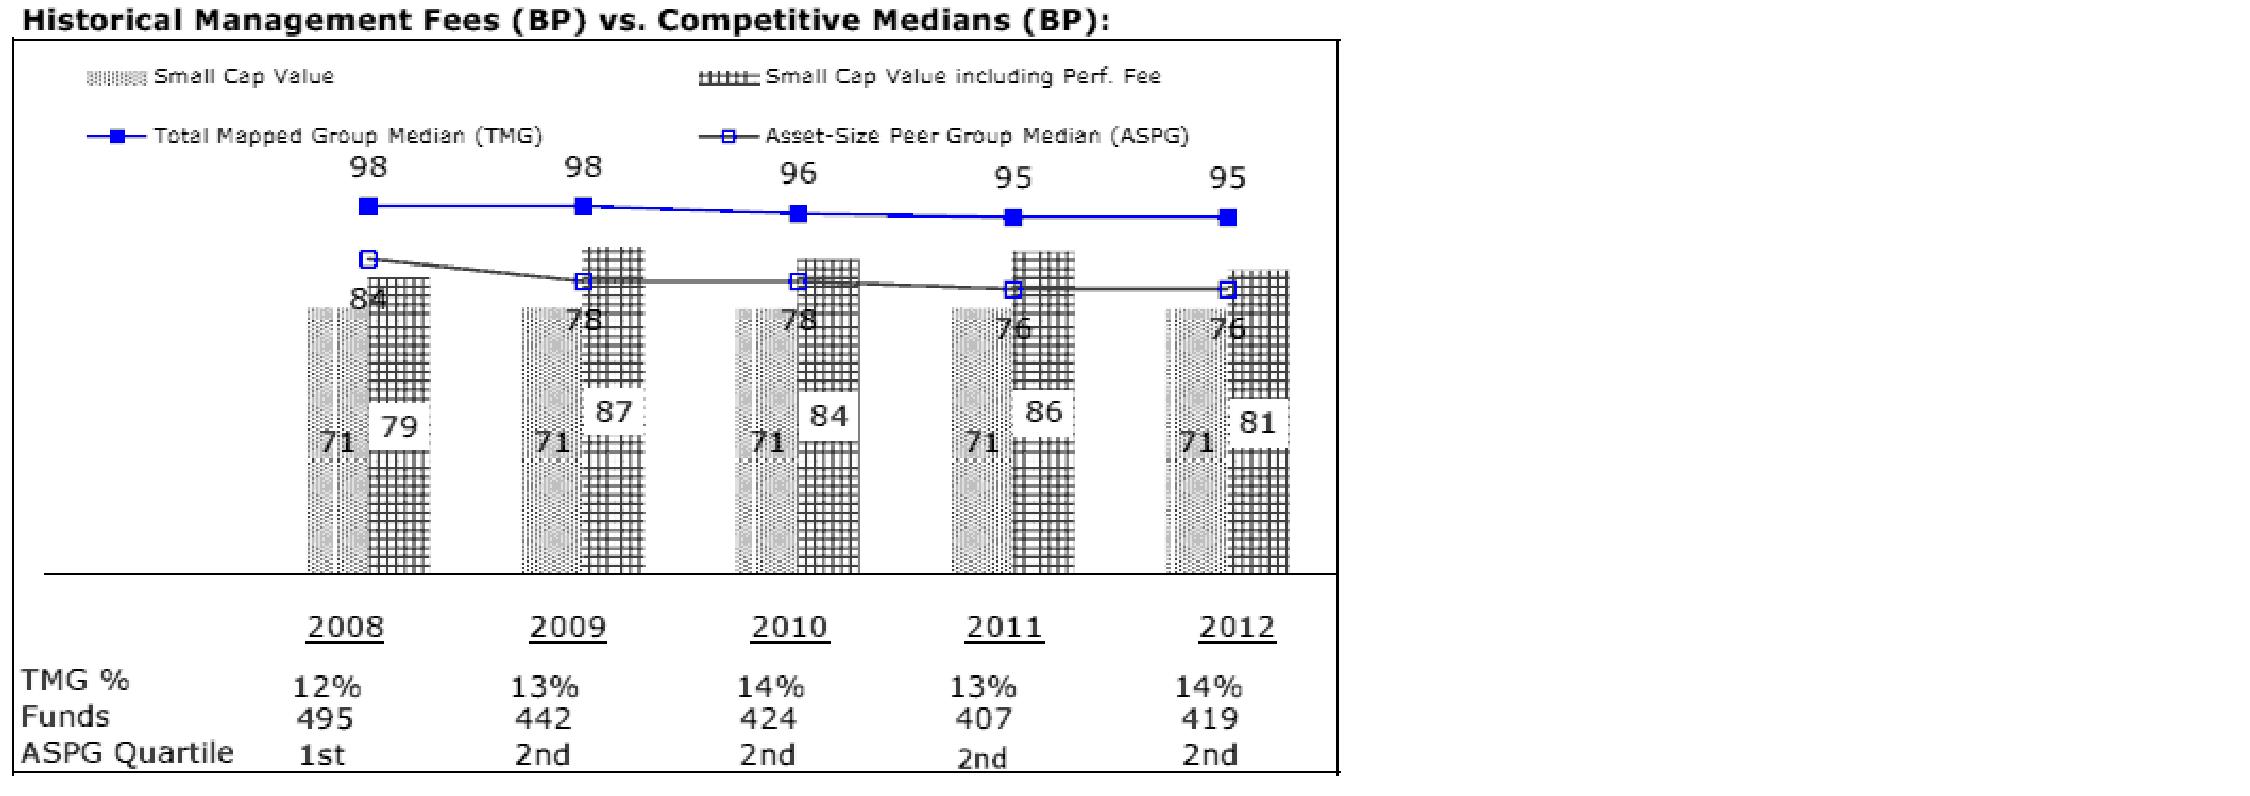
The Board noted that the fund's management fee ranked below the median of its Total Mapped Group and below the median of its ASPG for 2012. The Board also noted the effect of the fund's positive performance adjustment on the fund's management fee ranking.
Annual Report
Board Approval of Investment Advisory Contracts and
Management Fees - continued
Based on its review, the Board concluded that the fund's management fee is fair and reasonable in light of the services that the fund receives and the other factors considered.
Total Expense Ratio. In its review of each class's total expense ratio, the Board considered the fund's management fee as well as other fund or class expenses, as applicable, such as transfer agent fees, pricing and bookkeeping fees, fund-paid 12b-1 fees, and custodial, legal, and audit fees. The Board also noted the effects of any waivers and reimbursements on fees and expenses, as well as the impact of the fund's performance adjustment. As part of its review, the Board also considered the current and historical total expense ratios of each class of the fund compared to competitive fund median expenses. Each class of the fund is compared to those funds and classes in the Total Mapped Group (used by the Board for management fee comparisons) that have a similar sales load structure.
The Board noted that the total expense ratio of each of Institutional Class, the retail class and Class F ranked below its competitive median for 2012, the total expense ratio of Class A ranked equal to its competitive median for 2012, and the total expense ratio of each of Class T, Class B and Class C ranked above its competitive median for 2012. The Board considered that, in general, various factors can affect total expense ratios. The Board noted that the total expense ratio of Class T was above the competitive median primarily because of higher 12b-1 fees on Class T. Class T has a higher 12b-1 fee, but a lower front-end sales charge, than traditionally priced front-end sales charge classes. The Board considered that Class T is primarily sold load-waived in the retirement plan market where its 0.50% 12b-1 fee is comparable to competing no-load, higher 12b-1 fee classes designed specifically for retirement plans. The Board noted that the fund offers multiple classes, each of which has a different sales load and 12b-1 fee structure, and that the multiple structures are intended to offer a range of pricing options for the intermediary market. The Board also noted that the total expense ratios of the classes vary primarily by the level of their 12b-1 fees, although differences in transfer agent fees may also cause expenses to vary from class to class.
Fees Charged to Other Fidelity Clients. The Board also considered Fidelity fee structures and other information with respect to clients of FMR and its affiliates, such as other mutual funds advised or subadvised by FMR or its affiliates, pension plan clients, and other institutional clients. The Board noted the findings of the 2013 ad hoc joint committee (created with the board of other Fidelity funds), which reviewed and compared Fidelity's institutional investment advisory business with its business of providing services to the Fidelity funds, including the differences in services provided, fees charged, and costs incurred, as well as competition in their respective marketplaces.
Based on its review of total expense ratios and fees charged to other Fidelity clients, the Board concluded that the total expense ratio of each class of the fund was reasonable, although in some cases above the median of the universe presented for comparison, in light of the services that the fund and its shareholders receive and the other factors considered.
Annual Report
Costs of the Services and Profitability. The Board considered the revenues earned and the expenses incurred by Fidelity in conducting the business of developing, marketing, distributing, managing, administering and servicing the fund and servicing the fund's shareholders. The Board also considered the level of Fidelity's profits in respect of all the Fidelity funds.
On an annual basis, FMR presents to the Board Fidelity's profitability for the fund. Fidelity calculates the profitability for each fund, as well as aggregate profitability for groups of Fidelity funds and all Fidelity funds, using a series of detailed revenue and cost allocation methodologies which originate with the books and records of Fidelity on which Fidelity's audited financial statements are based. The Audit Committee of the Board reviews any significant changes from the prior year's methodologies.
PricewaterhouseCoopers LLP (PwC), independent registered public accounting firm and auditor to Fidelity and certain Fidelity funds, has been engaged annually by the Board as part of the Board's assessment of Fidelity's profitability analysis. PwC's engagement includes the review and assessment of the methodologies used by Fidelity in determining the revenues and expenses attributable to Fidelity's mutual fund business, and completion of agreed-upon procedures surrounding the mathematical accuracy of fund profitability and its conformity to allocation methodologies. After considering PwC's reports issued under the engagement and information provided by Fidelity, the Board concluded that while other allocation methods may also be reasonable, Fidelity's profitability methodologies are reasonable in all material respects.
The Board also reviewed Fidelity's non-fund businesses and fall-out benefits related to the mutual fund business as well as cases where Fidelity's affiliates may benefit from or be related to the fund's business.
The Board considered the costs of the services provided by and the profits realized by Fidelity in connection with the operation of the fund and was satisfied that the profitability was not excessive in the circumstances.
Economies of Scale. The Board considered whether there have been economies of scale in respect of the management of the Fidelity funds, whether the Fidelity funds (including the fund) have appropriately benefited from any such economies of scale, and whether there is potential for realization of any further economies of scale. The Board considered the extent to which the fund will benefit from economies of scale through increased services to the fund, through waivers or reimbursements, or through fee or expense reductions. The Board also noted that in 2009, it and the board of other Fidelity funds created an ad hoc committee (the Economies of Scale Committee) to analyze whether FMR attains economies of scale in respect of the management and servicing of the Fidelity funds, whether the Fidelity funds have appropriately benefited from such economies of scale, and whether there is potential for realization of any further economies of scale.
Annual Report
Board Approval of Investment Advisory Contracts and
Management Fees - continued
The Board recognized that the fund's management contract incorporates a "group fee" structure, which provides for lower group fee rates as total fund assets under FMR's management increase, and for higher group fee rates as total fund assets under FMR's management decrease. FMR calculates the group fee rates based on a tiered asset "breakpoint" schedule that varies based on asset class. The Board considered that the group fee is designed to deliver the benefits of economies of scale to fund shareholders when total Fidelity fund assets increase, even if assets of any particular fund are unchanged or have declined, because some portion of Fidelity's costs are attributable to services provided to all Fidelity funds, and all funds benefit if those costs can be allocated among more assets. The Board considered that although the fund is partially closed to new investors, it continues to incur investment management expenses, and marketing and distribution expenses related to the retention of existing shareholders and assets. The Board concluded that, given the group fee structure, fund shareholders will benefit from lower management fees as assets under FMR's management increase at the fund complex level, regardless of whether Fidelity achieves any such economies of scale.
The Board concluded, taking into account the analysis of the Economies of Scale Committee, that economies of scale, if any, are being appropriately shared between fund shareholders and Fidelity.
Amendment to Description of Group Fee Rate. At its July 2013 meeting, the Board voted to approve an amendment to the fund's management contract to modify the description of the "group fee rate" effective August 1, 2013. The Board noted that under the prior description in the contract, the group fee rate was based on the average net assets of all registered investment companies with which FMR has management contracts. Under the contract's tiered asset breakpoint schedule, the group fee rate is lower as total fund assets under FMR's management increase, and higher as total fund assets under FMR's management decrease. The Board considered that the prior description would have excluded the assets of 64 Fidelity sector funds from the group fee rate calculation once Fidelity SelectCo, LLC, an affiliate of FMR, assumed management responsibilities for those funds. The Board noted that modifying the description of the group fee rate to continue to include the assets of those 64 funds for purposes of determining group fee rate breakpoints would avoid an immediate adverse impact on the group fee rate for any fund.
Additional Information Requested by the Board. In order to develop fully the factual basis for consideration of the Fidelity funds' Advisory Contracts, the Board requested and received additional information on certain topics, including: (i) fund performance trends and Fidelity's long-term strategies for certain funds; (ii) the potential to further rationalize the Fidelity fund lineup with the possibility of achieving savings for the funds and Fidelity; (iii) the methodology with respect to competitive fund data and peer group classifications; (iv) the arrangements with, and performance of, certain sub-advisers on behalf of the Fidelity funds, as well as certain proposed participating affiliate arrangements; (v) the realization of fall-out benefits in certain Fidelity business units; (vi) Fidelity's group fee structures, including the rationale for the individual fee rates of certain categories of funds and the definition of group assets; (vii) trends regarding industry use of performance fee structures and the performance adjustment methodologies applicable to the Fidelity funds; (viii) additional competitive analysis regarding the total expenses for certain classes; and (ix) fund profitability methodology, including Fidelity's cost allocation methodology, and the impact of certain factors on fund profitability results.
Annual Report
Based on its evaluation of all of the conclusions noted above, and after considering all factors it believed relevant, the Board ultimately concluded that the advisory fee structures are fair and reasonable, and that the fund's Advisory Contracts should be renewed.
Annual Report
Investment Adviser
Fidelity Management & Research Company
Boston, MA
Investment Sub-Advisers
FMR Co., Inc.
Fidelity Management & Research
(U.K.) Inc.
Fidelity Management & Research
(Hong Kong) Limited
Fidelity Management & Research
(Japan) Inc.
General Distributor
Fidelity Distributors Corporation
Smithfield, RI
Transfer and Service Agents
Fidelity Investments Institutional
Operations Company, Inc.
Boston, MA
Fidelity Service Company, Inc.
Boston, MA
Custodian
Citibank, N.A.
New York, NY
(Fidelity Investment logo)(registered trademark)
ASCVI-UANN-0913
1.803743.108
Fidelity®
Blue Chip Growth
Fund
Annual Report
July 31, 2013
(Fidelity Cover Art)
Contents
Performance | (Click Here) | How the fund has done over time. |
Management's Discussion of Fund Performance | (Click Here) | The Portfolio Manager's review of fund performance and strategy. |
Shareholder Expense Example | (Click Here) | An example of shareholder expenses. |
Investment Changes | (Click Here) | A summary of major shifts in the fund's investments over the past six months. |
Investments | (Click Here) | A complete list of the fund's investments with their market values. |
Financial Statements | (Click Here) | Statements of assets and liabilities, operations, and changes in net assets, as well as financial highlights. |
Notes | (Click Here) | Notes to the financial statements. |
Report of Independent Registered Public Accounting Firm | (Click Here) | |
Trustees and Officers | (Click Here) | |
Distributions | (Click Here) | |
Board Approval of Investment Advisory Contracts and Management Fees | (Click Here) | |
To view a fund's proxy voting guidelines and proxy voting record for the 12-month period ended June 30, visit http://www.fidelity.com/proxyvotingresults or visit the Securities and Exchange Commission's (SEC) web site at http://www.sec.gov. You may also call 1-800-544-8544 to request a free copy of the proxy voting guidelines.
Standard & Poor's, S&P and S&P 500 are registered service marks of The McGraw-Hill Companies, Inc. and have been licensed for use by Fidelity Distributors Corporation.
Other third-party marks appearing herein are the property of their respective owners.
All other marks appearing herein are registered or unregistered trademarks or service marks of FMR LLC or an affiliated company. © 2013 FMR LLC. All rights reserved.
Annual Report
This report and the financial statements contained herein are submitted for the general information of the shareholders of the fund. This report is not authorized for distribution to prospective investors in the fund unless preceded or accompanied by an effective prospectus.
A fund files its complete schedule of portfolio holdings with the SEC for the first and third quarters of each fiscal year on Form N-Q. Forms N-Q are available on the SEC's web site at http://www.sec.gov. A fund's Forms N-Q may be reviewed and copied at the SEC's Public Reference Room in Washington, DC. Information regarding the operation of the SEC's Public Reference Room may be obtained by calling 1-800-SEC-0330. For a complete list of a fund's portfolio holdings, view the most recent holdings listing, semiannual report, or annual report on Fidelity's web site at http://www.fidelity.com, http://www.advisor.fidelity.com, or http://www.401k.com, as applicable.
NOT FDIC INSURED • MAY LOSE VALUE • NO BANK GUARANTEE
Neither the fund nor Fidelity Distributors Corporation is a bank.
Annual Report
Average annual total return reflects the change in the value of an investment, assuming reinvestment of the class' distributions from dividend income and capital gains (the profits earned upon the sale of securities that have grown in value, if any) and assuming a constant rate of performance each year. The $10,000 table and the fund's returns do not reflect the deduction of taxes that a shareholder would pay on fund distributions or the redemption of fund shares. During periods of reimbursement by Fidelity, a fund's total return will be greater than it would be had the reimbursement not occurred. How a fund did yesterday is no guarantee of how it will do tomorrow.
Average Annual Total Returns
Periods ended July 31, 2013 | Past 1
year | Past 5
years | Past 10
years |
Fidelity® Blue Chip Growth Fund | 28.25% | 10.84% | 7.88% |
$10,000 Over 10 Years
Let's say hypothetically that $10,000 was invested in Fidelity® Blue Chip Growth Fund, a class of the fund, on July 31, 2003. The chart shows how the value of your investment would have changed, and also shows how the Russell 1000® Growth Index performed over the same period.
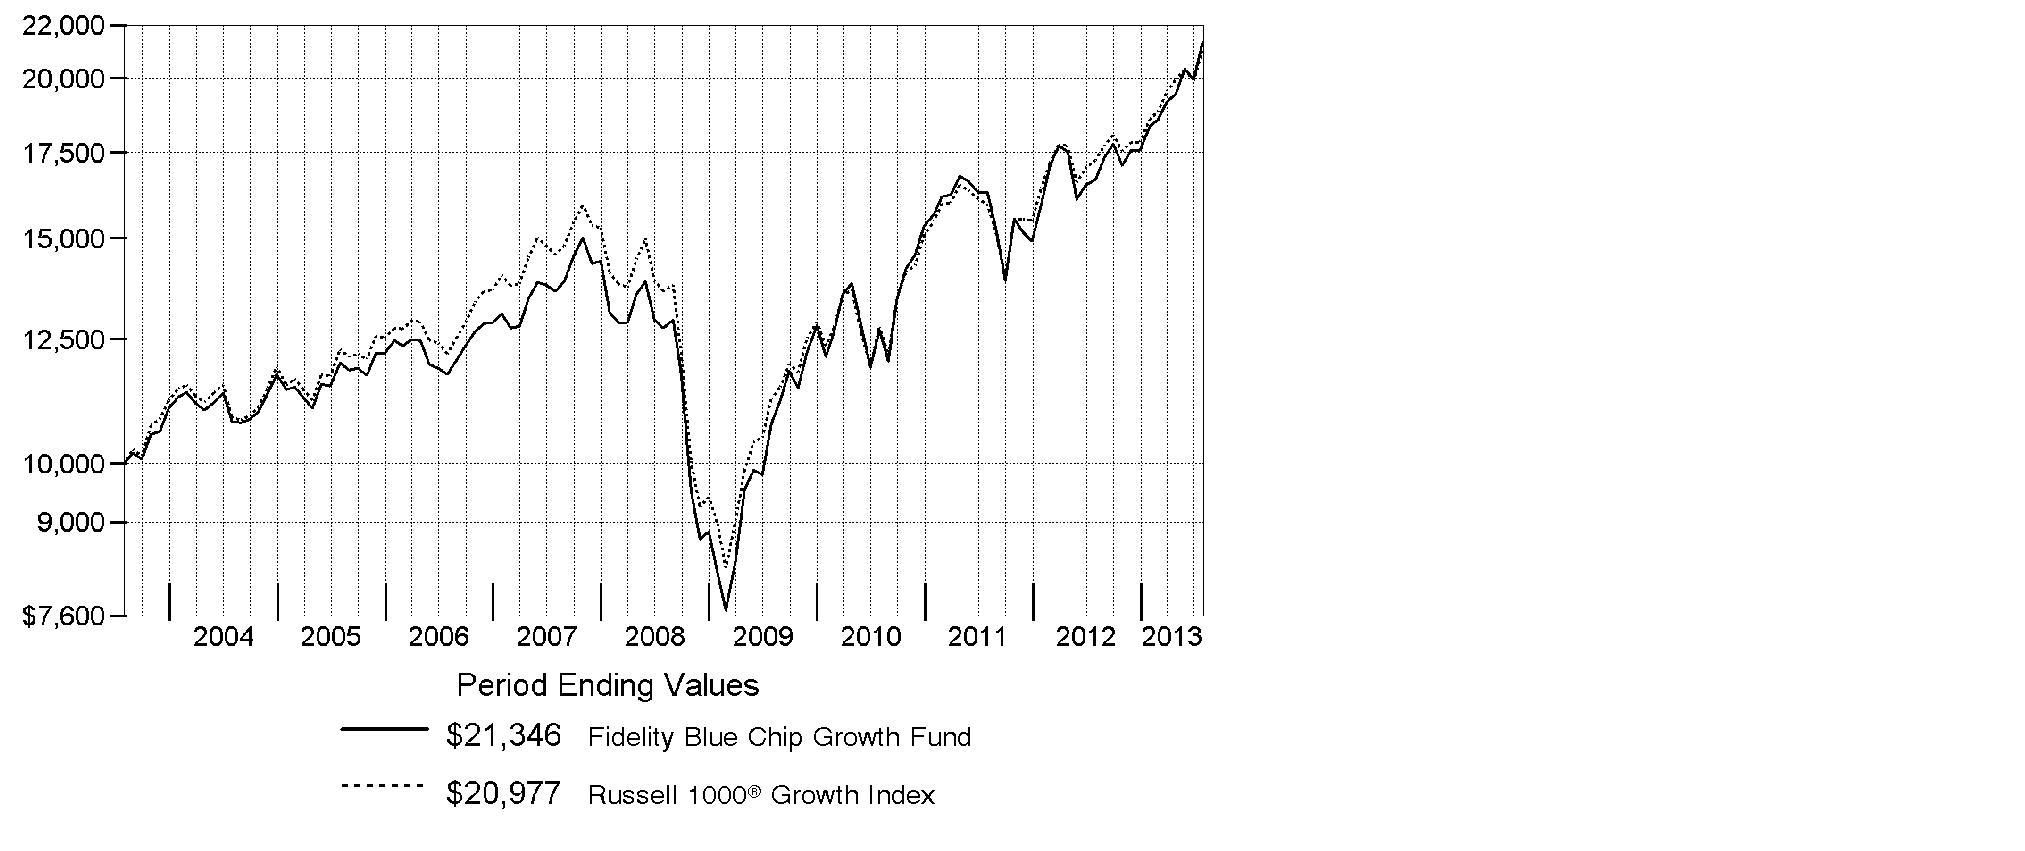
Annual Report
Market Recap: The bull run in U.S. stocks comfortably settled into a fifth year, as major equity benchmarks ripped through records during the 12 months ending July 31, 2013. Gains were fueled by a generally improving global economy and accommodative monetary policies worldwide. The tone was positive for most of the year, based largely on stronger U.S. economic data, including employment, housing and consumer sentiment. Setting a series of new highs along the way, the broad-based S&P 500® Index rose an impressive 25.00% for the 12 months, while the blue-chip-laden Dow Jones Industrial AverageSM also moved into record territory en route to a 22.36% gain. The growth-oriented Nasdaq Composite Index® had a similarly strong run, advancing 25.15%. During the year, markets were resilient amid intermittent volatility over debt woes in Europe, the 2012 U.S. presidential election and year-end Congressional gridlock over the federal budget. In mid-to-late June, concern arose about the U.S. Federal Reserve possibly tapering its sustaining bond-buying strategy - which prompted a brief, but steep, market sell-off. However, investors' continued quest for yield and the Fed's pledge to keep buying bonds until the economy showed significant improvement overpowered the uncertainty and helped equities climb notably higher in July to close the period on a strong note.
Comments from Sonu Kalra, Portfolio Manager of Fidelity® Blue Chip Growth Fund: For the year, the fund's Retail Class shares advanced 28.25%, compared with 21.64% for the Russell 1000® Growth Index. I'm focused on owning companies that can sustainably grow earnings by double digits over the long term. Shares of automaker Tesla Motors soared when the company ramped up production faster than expected, helping the company move into profitability much earlier than investors anticipated. Another top relative contributor was Green Mountain Coffee Roasters. During the past year, a new CEO and an extension of the firm's partnership with Starbucks, helped sustain Green Mountain's growth rate, and the stock took off. On the flip side, an overweighting in Broadcom - a chipmaker in the wireless area - was the fund's biggest relative detractor this period. Most investors anticipated the company's next-generation wireless chip would launch in the next year, but production was delayed until late 2014, which hurt the stock. Apple was by far the largest absolute detractor and also hurt relative results. Shares of the tech giant declined after the firm delivered disappointing sales of its iPhone® 5 smartphone and competitors, such as Samsung Electronics, began to close the gap on their devices in terms of product features.
The views expressed above reflect those of the portfolio manager(s) only through the end of the period as stated on the cover of this report and do not necessarily represent the views of Fidelity or any other person in the Fidelity organization. Any such views are subject to change at any time based upon market or other conditions and Fidelity disclaims any responsibility to update such views. These views may not be relied on as investment advice and, because investment decisions for a Fidelity fund are based on numerous factors, may not be relied on as an indication of trading intent on behalf of any Fidelity fund.
Annual Report
Shareholder Expense Example
As a shareholder of the Fund, you incur two types of costs: (1) transaction costs, and (2) ongoing costs, including management fees and other Fund expenses. This Example is intended to help you understand your ongoing costs (in dollars) of investing in the Fund and to compare these costs with the ongoing costs of investing in other mutual funds.
The Example is based on an investment of $1,000 invested at the beginning of the period and held for the entire period (February 1, 2013 to July 31, 2013).
Actual Expenses
The first line of the accompanying table for each class of the Fund provides information about actual account values and actual expenses. You may use the information in this line, together with the amount you invested, to estimate the expenses that you paid over the period. Simply divide your account value by $1,000.00 (for example, an $8,600 account value divided by $1,000.00 = 8.6), then multiply the result by the number in the first line for a class of the Fund under the heading entitled "Expenses Paid During Period" to estimate the expenses you paid on your account during this period. A small balance maintenance fee of $12.00 that is charged once a year may apply for certain accounts with a value of less than $2,000. This fee is not included in the table below. If it was, the estimate of expenses you paid during the period would be higher, and your ending account value lower, by this amount. In addition, the Fund, as a shareholder in the underlying Fidelity Central Funds, will indirectly bear its pro-rata share of the fees and expenses incurred by the underlying Fidelity Central Funds. These fees and expenses are not included in the Fund's annualized expense ratio used to calculate the expense estimate in the table below.
Hypothetical Example for Comparison Purposes
The second line of the accompanying table for each class of the Fund provides information about hypothetical account values and hypothetical expenses based on a Class' actual expense ratio and an assumed rate of return of 5% per year before expenses, which is not the Class' actual return. The hypothetical account values and expenses may not be used to estimate the actual ending account balance or expenses you paid for the period. You may use this information to compare the ongoing costs of investing in the Fund and other funds. To do so, compare this 5% hypothetical example with the 5% hypothetical examples that appear in the shareholder reports of the other funds. A small balance maintenance fee of $12.00 that is charged once a year may apply for certain accounts with a value of less than $2,000. This fee is not included in the table below. If it was, the estimate of expenses you paid during the period would be higher, and your ending account value lower, by this amount. In addition, the Fund, as a shareholder in the underlying Fidelity Central Funds, will indirectly bear its pro-rata share of the fees and expenses incurred by the underlying Fidelity Central Funds. These fees and expenses are not included in the Fund's annualized expense ratio used to calculate the expense estimate in the table below.
Please note that the expenses shown in the table are meant to highlight your ongoing costs only and do not reflect any transaction costs. Therefore, the second line of the table is useful in comparing ongoing costs only, and will not help you determine the relative total costs of owning different funds.
Annual Report
Shareholder Expense Example - continued
| Annualized
Expense Ratio B | Beginning
Account Value
February 1, 2013 | Ending
Account Value
July 31, 2013 | Expenses Paid
During Period*
February 1, 2013
to July 31, 2013 |
Blue Chip Growth | .74% | | | |
Actual | | $ 1,000.00 | $ 1,164.40 | $ 3.97 |
HypotheticalA | | $ 1,000.00 | $ 1,021.12 | $ 3.71 |
Class K | .60% | | | |
Actual | | $ 1,000.00 | $ 1,165.00 | $ 3.22 |
HypotheticalA | | $ 1,000.00 | $ 1,021.82 | $ 3.01 |
Class F | .55% | | | |
Actual | | $ 1,000.00 | $ 1,165.40 | $ 2.95 |
HypotheticalA | | $ 1,000.00 | $ 1,022.07 | $ 2.76 |
A 5% return per year before expenses
B Annualized expense ratio reflects expenses net of applicable fee waivers.
* Expenses are equal to each Class' annualized expense ratio, multiplied by the average account value over the period, multiplied by 181/365 (to reflect the one-half year period).
Annual Report
Investment Changes (Unaudited)
Top Ten Stocks as of July 31, 2013 |
| % of fund's
net assets | % of fund's net assets
6 months ago |
Google, Inc. Class A | 5.1 | 5.9 |
Apple, Inc. | 4.1 | 5.9 |
Gilead Sciences, Inc. | 2.8 | 1.7 |
Home Depot, Inc. | 1.9 | 1.8 |
Amazon.com, Inc. | 1.8 | 2.1 |
QUALCOMM, Inc. | 1.6 | 2.0 |
Amgen, Inc. | 1.4 | 1.1 |
Visa, Inc. Class A | 1.4 | 1.3 |
Starbucks Corp. | 1.4 | 1.2 |
United Technologies Corp. | 1.4 | 1.3 |
| 22.9 | |
Top Five Market Sectors as of July 31, 2013 |
| % of fund's
net assets | % of fund's net assets
6 months ago |
Information Technology | 28.5 | 31.9 |
Consumer Discretionary | 23.0 | 20.9 |
Health Care | 14.7 | 10.5 |
Consumer Staples | 13.2 | 15.2 |
Industrials | 10.7 | 10.9 |
Asset Allocation (% of fund's net assets) |
As of July 31, 2013* | As of January 31, 2013** |
 | Stocks 99.7% | | | Stocks 99.9% | |
 | Short-Term
Investments and
Net Other Assets
(Liabilities) 0.3% | | | Short-Term
Investments and
Net Other Assets
(Liabilities) 0.1% | |
* Foreign investments | 8.4% | | ** Foreign investments | 9.5% | |

Annual Report
Investments July 31, 2013
Showing Percentage of Net Assets
Common Stocks - 99.3% |
| Shares | | Value (000s) |
CONSUMER DISCRETIONARY - 22.6% |
Auto Components - 0.2% |
Johnson Controls, Inc. | 909,800 | | $ 36,583 |
The Goodyear Tire & Rubber Co. (a) | 630,700 | | 11,668 |
| | 48,251 |
Automobiles - 1.4% |
Ford Motor Co. | 2,494,100 | | 42,100 |
General Motors Co. (a) | 815,900 | | 29,266 |
Tesla Motors, Inc. (a)(d) | 1,573,964 | | 211,352 |
| | 282,718 |
Distributors - 0.1% |
LKQ Corp. (a) | 945,500 | | 24,649 |
Diversified Consumer Services - 0.4% |
H&R Block, Inc. | 2,158,700 | | 67,848 |
Kroton Educacional SA | 1,180,000 | | 16,810 |
| | 84,658 |
Hotels, Restaurants & Leisure - 4.4% |
Alsea S.A.B. de CV | 2,981,200 | | 8,146 |
Buffalo Wild Wings, Inc. (a) | 331,100 | | 34,295 |
Chipotle Mexican Grill, Inc. (a) | 158,400 | | 65,304 |
Dunkin' Brands Group, Inc. | 773,500 | | 33,415 |
Fiesta Restaurant Group, Inc. (a) | 124,000 | | 3,912 |
Jubilant Foodworks Ltd. (a) | 288,917 | | 5,344 |
Las Vegas Sands Corp. | 2,356,700 | | 130,962 |
Noodles & Co. | 149,479 | | 6,483 |
Panera Bread Co. Class A (a) | 366,200 | | 61,174 |
Penn National Gaming, Inc. (a) | 550,300 | | 27,509 |
Starbucks Corp. | 3,987,600 | | 284,077 |
Starwood Hotels & Resorts Worldwide, Inc. | 561,000 | | 37,110 |
Whitbread PLC | 464,036 | | 22,801 |
Wyndham Worldwide Corp. | 491,627 | | 30,628 |
Yum! Brands, Inc. | 1,716,600 | | 125,174 |
| | 876,334 |
Household Durables - 0.4% |
Sony Corp. sponsored ADR | 722,700 | | 15,206 |
Whirlpool Corp. | 479,678 | | 64,248 |
| | 79,454 |
Internet & Catalog Retail - 2.9% |
Amazon.com, Inc. (a) | 1,195,900 | | 360,229 |
Common Stocks - continued |
| Shares | | Value (000s) |
CONSUMER DISCRETIONARY - continued |
Internet & Catalog Retail - continued |
Netflix, Inc. (a) | 148,800 | | $ 36,340 |
priceline.com, Inc. (a) | 201,800 | | 176,710 |
| | 573,279 |
Leisure Equipment & Products - 0.2% |
Mattel, Inc. | 985,200 | | 41,408 |
Media - 2.8% |
CBS Corp. Class B | 865,900 | | 45,754 |
Comcast Corp. Class A | 6,029,400 | | 271,805 |
DIRECTV (a) | 421,200 | | 26,649 |
DISH Network Corp. Class A | 376,000 | | 16,788 |
Fuji Media Holdings, Inc. | 2,000 | | 3,622 |
Sinclair Broadcast Group, Inc. Class A | 331,300 | | 9,346 |
Sirius XM Radio, Inc. | 2,254,100 | | 8,408 |
The Walt Disney Co. | 879,500 | | 56,860 |
Time Warner, Inc. | 625,000 | | 38,913 |
Twenty-First Century Fox, Inc. Class A | 3,000,500 | | 89,655 |
| | 567,800 |
Multiline Retail - 1.0% |
Dollar General Corp. (a) | 768,200 | | 41,997 |
Dollar Tree, Inc. (a) | 156,300 | | 8,385 |
Macy's, Inc. | 1,594,900 | | 77,097 |
Target Corp. | 975,200 | | 69,483 |
| | 196,962 |
Specialty Retail - 5.8% |
Abercrombie & Fitch Co. Class A | 1,806,400 | | 90,085 |
American Eagle Outfitters, Inc. | 1,599,600 | | 31,416 |
AutoZone, Inc. (a) | 33,000 | | 14,803 |
Best Buy Co., Inc. | 2,509,100 | | 75,499 |
CarMax, Inc. (a) | 258,900 | | 12,696 |
Home Depot, Inc. | 4,733,300 | | 374,073 |
L Brands, Inc. | 1,724,700 | | 96,187 |
Lowe's Companies, Inc. | 3,379,400 | | 150,654 |
Lumber Liquidators Holdings, Inc. (a) | 272,200 | | 26,354 |
Restoration Hardware Holdings, Inc. | 136,400 | | 9,114 |
Ross Stores, Inc. | 1,935,300 | | 130,575 |
TJX Companies, Inc. | 2,452,180 | | 127,611 |
Urban Outfitters, Inc. (a) | 883,800 | | 37,615 |
| | 1,176,682 |
Common Stocks - continued |
| Shares | | Value (000s) |
CONSUMER DISCRETIONARY - continued |
Textiles, Apparel & Luxury Goods - 3.0% |
Arezzo Industria e Comercio SA | 1,646,000 | | $ 25,671 |
Fifth & Pacific Companies, Inc. (a) | 1,228,600 | | 29,265 |
Fossil Group, Inc. (a) | 509,819 | | 56,029 |
lululemon athletica, Inc. (a) | 741,380 | | 51,578 |
Michael Kors Holdings Ltd. (a) | 2,024,237 | | 136,312 |
NIKE, Inc. Class B | 1,712,800 | | 107,769 |
Prada SpA | 1,995,500 | | 18,628 |
PVH Corp. | 763,900 | | 100,674 |
Ralph Lauren Corp. | 65,500 | | 11,925 |
Under Armour, Inc. Class A (sub. vtg.) (a)(d) | 902,700 | | 60,598 |
Wolverine World Wide, Inc. | 183,500 | | 10,553 |
| | 609,002 |
TOTAL CONSUMER DISCRETIONARY | | 4,561,197 |
CONSUMER STAPLES - 13.2% |
Beverages - 3.1% |
Anheuser-Busch InBev SA NV ADR | 695,000 | | 66,518 |
Beam, Inc. | 228,300 | | 14,837 |
Monster Beverage Corp. (a) | 1,360,600 | | 82,983 |
PepsiCo, Inc. | 2,227,300 | | 186,069 |
SABMiller PLC | 147,300 | | 7,217 |
The Coca-Cola Co. | 6,952,400 | | 278,652 |
| | 636,276 |
Food & Staples Retailing - 2.8% |
Costco Wholesale Corp. | 1,409,300 | | 165,297 |
CVS Caremark Corp. | 3,050,600 | | 187,581 |
Kroger Co. | 1,485,100 | | 58,320 |
Walgreen Co. | 1,341,000 | | 67,385 |
Whole Foods Market, Inc. | 1,590,200 | | 88,383 |
| | 566,966 |
Food Products - 3.0% |
Archer Daniels Midland Co. | 163,700 | | 5,970 |
Associated British Foods PLC | 592,900 | | 17,534 |
Bunge Ltd. | 483,600 | | 36,758 |
Danone SA | 658,200 | | 52,013 |
Green Mountain Coffee Roasters, Inc. (a)(d) | 3,513,464 | | 271,169 |
Kellogg Co. | 758,600 | | 50,250 |
Kraft Foods Group, Inc. | 536,900 | | 30,378 |
Mead Johnson Nutrition Co. Class A | 787,600 | | 57,369 |
Common Stocks - continued |
| Shares | | Value (000s) |
CONSUMER STAPLES - continued |
Food Products - continued |
Mondelez International, Inc. | 1,737,400 | | $ 54,328 |
Unilever NV (NY Reg.) | 620,500 | | 24,826 |
| | 600,595 |
Household Products - 1.6% |
Energizer Holdings, Inc. | 251,500 | | 25,603 |
Procter & Gamble Co. | 3,373,400 | | 270,884 |
Svenska Cellulosa AB (SCA) (B Shares) | 811,700 | | 21,481 |
| | 317,968 |
Personal Products - 0.6% |
Herbalife Ltd. | 1,778,391 | | 116,485 |
Tobacco - 2.1% |
Altria Group, Inc. | 1,693,800 | | 59,385 |
British American Tobacco PLC (United Kingdom) | 146,800 | | 7,831 |
Japan Tobacco, Inc. | 528,000 | | 18,470 |
Lorillard, Inc. | 1,866,000 | | 79,361 |
Philip Morris International, Inc. | 2,885,900 | | 257,365 |
| | 422,412 |
TOTAL CONSUMER STAPLES | | 2,660,702 |
ENERGY - 3.8% |
Energy Equipment & Services - 0.9% |
Cameron International Corp. (a) | 402,500 | | 23,868 |
Ensco PLC Class A | 557,500 | | 31,967 |
Halliburton Co. | 2,651,300 | | 119,812 |
National Oilwell Varco, Inc. | 164,100 | | 11,515 |
| | 187,162 |
Oil, Gas & Consumable Fuels - 2.9% |
Anadarko Petroleum Corp. | 1,352,100 | | 119,688 |
Apache Corp. | 204,500 | | 16,411 |
Cabot Oil & Gas Corp. | 277,300 | | 21,025 |
Canadian Natural Resources Ltd. | 1,495,600 | | 46,349 |
Cobalt International Energy, Inc. (a) | 654,900 | | 18,894 |
Continental Resources, Inc. (a) | 394,200 | | 36,385 |
EOG Resources, Inc. | 367,800 | | 53,511 |
EQT Corp. | 204,400 | | 17,681 |
Hess Corp. | 609,500 | | 45,383 |
Occidental Petroleum Corp. | 909,000 | | 80,946 |
Common Stocks - continued |
| Shares | | Value (000s) |
ENERGY - continued |
Oil, Gas & Consumable Fuels - continued |
Pioneer Natural Resources Co. | 626,800 | | $ 97,004 |
Western Gas Equity Partners LP | 594,900 | | 23,403 |
| | 576,680 |
TOTAL ENERGY | | 763,842 |
FINANCIALS - 4.0% |
Capital Markets - 0.9% |
BlackRock, Inc. Class A | 271,700 | | 76,609 |
Invesco Ltd. | 867,000 | | 27,909 |
Monex Group, Inc. | 50,266 | | 20,330 |
Morgan Stanley | 1,780,812 | | 48,456 |
State Street Corp. | 114,000 | | 7,942 |
Virtus Investment Partners, Inc. (a) | 44,000 | | 8,206 |
| | 189,452 |
Consumer Finance - 0.4% |
American Express Co. | 964,000 | | 71,114 |
Diversified Financial Services - 2.2% |
Bank of America Corp. | 6,660,300 | | 97,240 |
Citigroup, Inc. | 4,157,520 | | 216,773 |
CME Group, Inc. | 85,800 | | 6,347 |
IntercontinentalExchange, Inc. (a) | 45,300 | | 8,265 |
JPMorgan Chase & Co. | 2,181,100 | | 121,553 |
| | 450,178 |
Insurance - 0.3% |
Berkshire Hathaway, Inc. Class B (a) | 265,800 | | 30,798 |
MetLife, Inc. | 511,600 | | 24,772 |
| | 55,570 |
Real Estate Investment Trusts - 0.1% |
Simon Property Group, Inc. | 71,400 | | 11,428 |
Real Estate Management & Development - 0.1% |
Altisource Portfolio Solutions SA | 50,000 | | 6,166 |
Howard Hughes Corp. (a) | 80,200 | | 8,759 |
Parsvnath Developers Ltd. (a)(e) | 21,771,340 | | 10,232 |
| | 25,157 |
Thrifts & Mortgage Finance - 0.0% |
Housing Development Finance Corp. Ltd. (a) | 448,663 | | 5,901 |
TOTAL FINANCIALS | | 808,800 |
Common Stocks - continued |
| Shares | | Value (000s) |
HEALTH CARE - 14.7% |
Biotechnology - 8.9% |
Acorda Therapeutics, Inc. (a) | 116,000 | | $ 4,405 |
Agios Pharmaceuticals, Inc. | 145,017 | | 4,229 |
Alexion Pharmaceuticals, Inc. (a) | 700,000 | | 81,361 |
Alkermes PLC (a) | 1,017,100 | | 34,154 |
Alnylam Pharmaceuticals, Inc. (a) | 693,263 | | 32,008 |
Amgen, Inc. | 2,680,400 | | 290,261 |
ARIAD Pharmaceuticals, Inc. (a) | 1,781,860 | | 33,107 |
Biogen Idec, Inc. (a) | 1,125,700 | | 245,549 |
BioMarin Pharmaceutical, Inc. (a) | 288,700 | | 18,664 |
Bluebird Bio, Inc. | 122,116 | | 3,801 |
Celgene Corp. (a) | 614,700 | | 90,275 |
Clovis Oncology, Inc. (a) | 195,300 | | 15,210 |
CSL Ltd. | 66,241 | | 3,934 |
Exelixis, Inc. (a) | 3,668,800 | | 18,601 |
Gilead Sciences, Inc. (a) | 9,157,000 | | 562,698 |
Grifols SA (d) | 330,400 | | 13,938 |
Grifols SA: | | | |
ADR | 292,845 | | 9,295 |
Class B | 16,520 | | 529 |
Infinity Pharmaceuticals, Inc. (a) | 640,000 | | 13,555 |
InterMune, Inc. (a) | 2,356,200 | | 36,545 |
Ironwood Pharmaceuticals, Inc. Class A (a) | 473,000 | | 5,790 |
Medivation, Inc. (a) | 299,000 | | 17,303 |
Merrimack Pharmaceuticals, Inc. (a) | 2,407,858 | | 11,510 |
Onyx Pharmaceuticals, Inc. (a) | 400,500 | | 52,586 |
Pharmacyclics, Inc. (a) | 44,300 | | 4,812 |
Regeneron Pharmaceuticals, Inc. (a) | 438,669 | | 118,467 |
Seattle Genetics, Inc. (a) | 239,900 | | 9,721 |
Synageva BioPharma Corp. (a) | 180,700 | | 8,692 |
Vertex Pharmaceuticals, Inc. (a) | 639,160 | | 51,005 |
| | 1,792,005 |
Health Care Equipment & Supplies - 0.9% |
Accuray, Inc. (a)(d) | 2,060,900 | | 12,798 |
Baxter International, Inc. | 185,400 | | 13,542 |
Boston Scientific Corp. (a) | 3,943,000 | | 43,058 |
Insulet Corp. (a) | 310,600 | | 9,905 |
The Cooper Companies, Inc. | 814,672 | | 103,748 |
| | 183,051 |
Health Care Providers & Services - 1.1% |
AmerisourceBergen Corp. | 201,900 | | 11,765 |
Common Stocks - continued |
| Shares | | Value (000s) |
HEALTH CARE - continued |
Health Care Providers & Services - continued |
Apollo Hospitals Enterprise Ltd. | 936,371 | | $ 14,435 |
Catamaran Corp. (a) | 343,600 | | 18,098 |
Express Scripts Holding Co. (a) | 2,370,900 | | 155,412 |
HCA Holdings, Inc. | 622,300 | | 24,270 |
MEDNAX, Inc. (a) | 42,000 | | 4,092 |
Qualicorp SA (a) | 1,151,000 | | 8,426 |
| | 236,498 |
Health Care Technology - 0.3% |
athenahealth, Inc. (a)(d) | 154,575 | | 17,305 |
Cerner Corp. (a) | 893,800 | | 43,796 |
| | 61,101 |
Life Sciences Tools & Services - 0.3% |
Illumina, Inc. (a) | 697,300 | | 55,658 |
Lonza Group AG | 58,001 | | 4,462 |
| | 60,120 |
Pharmaceuticals - 3.2% |
AbbVie, Inc. | 1,346,600 | | 61,243 |
Actavis, Inc. (a) | 732,100 | | 98,299 |
Allergan, Inc. | 346,000 | | 31,528 |
AVANIR Pharmaceuticals Class A (a)(d) | 2,885,556 | | 13,591 |
Bristol-Myers Squibb Co. | 663,800 | | 28,703 |
Endo Health Solutions, Inc. (a) | 720,068 | | 27,694 |
Johnson & Johnson | 1,181,540 | | 110,474 |
Merck & Co., Inc. | 642,100 | | 30,930 |
Perrigo Co. | 139,400 | | 17,340 |
Questcor Pharmaceuticals, Inc. | 608,852 | | 40,683 |
Sanofi SA sponsored ADR | 416,000 | | 21,416 |
Valeant Pharmaceuticals International, Inc. (Canada) (a) | 1,492,400 | | 138,473 |
Warner Chilcott PLC | 1,240,800 | | 26,441 |
| | 646,815 |
TOTAL HEALTH CARE | | 2,979,590 |
INDUSTRIALS - 10.7% |
Aerospace & Defense - 3.0% |
Honeywell International, Inc. | 1,207,200 | | 100,173 |
Precision Castparts Corp. | 596,000 | | 132,145 |
Common Stocks - continued |
| Shares | | Value (000s) |
INDUSTRIALS - continued |
Aerospace & Defense - continued |
The Boeing Co. | 862,500 | | $ 90,649 |
United Technologies Corp. | 2,672,600 | | 282,146 |
| | 605,113 |
Air Freight & Logistics - 0.6% |
FedEx Corp. | 125,830 | | 13,338 |
United Parcel Service, Inc. Class B | 1,236,200 | | 107,302 |
| | 120,640 |
Airlines - 0.9% |
Copa Holdings SA Class A | 84,900 | | 11,816 |
Delta Air Lines, Inc. | 2,096,800 | | 44,515 |
Spirit Airlines, Inc. (a) | 1,237,100 | | 40,886 |
U.S. Airways Group, Inc. (a) | 2,300,900 | | 44,522 |
United Continental Holdings, Inc. (a) | 898,400 | | 31,309 |
| | 173,048 |
Building Products - 0.3% |
A.O. Smith Corp. | 151,000 | | 6,239 |
Fortune Brands Home & Security, Inc. | 348,500 | | 14,397 |
Masco Corp. | 1,904,100 | | 39,072 |
| | 59,708 |
Construction & Engineering - 0.1% |
Quanta Services, Inc. (a) | 758,300 | | 20,330 |
Electrical Equipment - 0.6% |
Eaton Corp. PLC | 1,620,100 | | 111,706 |
Industrial Conglomerates - 1.0% |
Danaher Corp. | 2,848,300 | | 191,805 |
General Electric Co. | 733,900 | | 17,885 |
| | 209,690 |
Machinery - 1.8% |
Caterpillar, Inc. | 732,900 | | 60,765 |
Cummins, Inc. | 1,356,000 | | 164,334 |
Ingersoll-Rand PLC | 1,204,000 | | 73,504 |
ITT Corp. | 473,900 | | 14,805 |
Manitowoc Co., Inc. | 1,186,800 | | 24,365 |
PACCAR, Inc. | 269,200 | | 15,148 |
Snap-On, Inc. | 87,500 | | 8,299 |
| | 361,220 |
Professional Services - 0.6% |
Manpower, Inc. | 1,650,800 | | 110,389 |
Common Stocks - continued |
| Shares | | Value (000s) |
INDUSTRIALS - continued |
Professional Services - continued |
Towers Watson & Co. | 171,500 | | $ 14,445 |
Verisk Analytics, Inc. (a) | 61,900 | | 3,984 |
| | 128,818 |
Road & Rail - 1.6% |
Canadian Pacific Railway Ltd. | 537,600 | | 66,018 |
Con-way, Inc. | 431,200 | | 17,873 |
Hertz Global Holdings, Inc. (a) | 3,815,600 | | 97,718 |
Union Pacific Corp. | 840,800 | | 133,342 |
| | 314,951 |
Trading Companies & Distributors - 0.2% |
Mills Estruturas e Servicos de Engenharia SA | 827,400 | | 10,336 |
W.W. Grainger, Inc. | 55,200 | | 14,470 |
WESCO International, Inc. (a) | 305,300 | | 23,136 |
| | 47,942 |
TOTAL INDUSTRIALS | | 2,153,166 |
INFORMATION TECHNOLOGY - 28.5% |
Communications Equipment - 2.5% |
Aruba Networks, Inc. (a) | 534,200 | | 9,498 |
Cisco Systems, Inc. | 2,047,800 | | 52,321 |
F5 Networks, Inc. (a) | 631,600 | | 55,429 |
Juniper Networks, Inc. (a) | 2,603,100 | | 56,409 |
QUALCOMM, Inc. | 5,070,600 | | 327,307 |
| | 500,964 |
Computers & Peripherals - 5.9% |
Apple, Inc. | 1,835,600 | | 830,609 |
EMC Corp. | 5,267,100 | | 137,735 |
Fusion-io, Inc. (a) | 807,522 | | 11,644 |
Hewlett-Packard Co. | 2,539,700 | | 65,219 |
NCR Corp. (a) | 3,286,157 | | 118,302 |
SanDisk Corp. | 371,800 | | 20,494 |
Stratasys Ltd. (a) | 46,600 | | 4,131 |
| | 1,188,134 |
Electronic Equipment & Components - 0.1% |
InvenSense, Inc. (a) | 535,400 | | 9,466 |
Neonode, Inc. (a) | 613,800 | | 4,782 |
| | 14,248 |
Common Stocks - continued |
| Shares | | Value (000s) |
INFORMATION TECHNOLOGY - continued |
Internet Software & Services - 8.2% |
Baidu.com, Inc. sponsored ADR (a) | 115,900 | | $ 15,335 |
Cornerstone OnDemand, Inc. (a) | 149,200 | | 6,571 |
Dropbox, Inc. (a)(f) | 1,003,814 | | 10,038 |
eBay, Inc. (a) | 1,220,300 | | 63,077 |
Facebook, Inc. Class A (a) | 7,472,367 | | 275,207 |
Google, Inc. Class A (a) | 1,150,067 | | 1,020,805 |
LinkedIn Corp. (a) | 357,000 | | 72,753 |
Marketo, Inc. | 285,851 | | 8,984 |
Rackspace Hosting, Inc. (a) | 972,100 | | 44,026 |
Trulia, Inc. | 161,200 | | 6,006 |
WebMD Health Corp. (a) | 639,700 | | 21,116 |
Yahoo!, Inc. (a) | 3,808,900 | | 106,992 |
Yelp, Inc. (a)(d) | 110,200 | | 4,606 |
| | 1,655,516 |
IT Services - 3.7% |
Cognizant Technology Solutions Corp. Class A (a) | 1,700,800 | | 123,121 |
FleetCor Technologies, Inc. (a) | 118,000 | | 10,593 |
MasterCard, Inc. Class A | 446,600 | | 272,698 |
The Western Union Co. | 1,974,600 | | 35,464 |
Unisys Corp. (a) | 359,124 | | 9,316 |
Visa, Inc. Class A | 1,610,700 | | 285,110 |
| | 736,302 |
Semiconductors & Semiconductor Equipment - 3.2% |
Advanced Micro Devices, Inc. (a)(d) | 9,424,400 | | 35,530 |
Altera Corp. | 1,583,400 | | 56,306 |
Applied Materials, Inc. | 3,982,200 | | 64,950 |
Atmel Corp. (a) | 1,086,600 | | 8,584 |
Avago Technologies Ltd. | 1,028,900 | | 37,740 |
Broadcom Corp. Class A | 6,478,600 | | 178,615 |
Cree, Inc. (a) | 638,500 | | 44,631 |
First Solar, Inc. (a) | 338,700 | | 16,678 |
Lam Research Corp. (a) | 164,000 | | 8,072 |
Monolithic Power Systems, Inc. | 437,600 | | 11,456 |
NVIDIA Corp. | 1,099,200 | | 15,861 |
NXP Semiconductors NV (a) | 4,948,135 | | 161,557 |
PMC-Sierra, Inc. (a) | 2,192,700 | | 14,483 |
| | 654,463 |
Software - 4.9% |
Activision Blizzard, Inc. | 6,149,700 | | 110,572 |
Adobe Systems, Inc. (a) | 731,300 | | 34,576 |
Common Stocks - continued |
| Shares | | Value (000s) |
INFORMATION TECHNOLOGY - continued |
Software - continued |
Electronic Arts, Inc. (a) | 4,007,996 | | $ 104,689 |
FleetMatics Group PLC | 187,100 | | 7,046 |
Guidewire Software, Inc. (a) | 248,300 | | 10,866 |
Intuit, Inc. | 127,200 | | 8,131 |
Linx SA | 124,800 | | 2,067 |
Microsoft Corp. | 3,990,689 | | 127,024 |
Oracle Corp. | 3,956,200 | | 127,983 |
QLIK Technologies, Inc. (a) | 696,663 | | 21,819 |
Red Hat, Inc. (a) | 1,463,400 | | 75,760 |
salesforce.com, Inc. (a) | 4,973,660 | | 217,598 |
ServiceNow, Inc. (a) | 522,500 | | 22,771 |
Splunk, Inc. (a) | 196,000 | | 9,802 |
Tableau Software, Inc. | 50,600 | | 2,803 |
Take-Two Interactive Software, Inc. (a) | 1,200,800 | | 21,050 |
Ubisoft Entertainment SA (a) | 881,104 | | 13,445 |
VMware, Inc. Class A (a) | 409,600 | | 33,665 |
Workday, Inc. Class A (d) | 648,700 | | 44,300 |
| | 995,967 |
TOTAL INFORMATION TECHNOLOGY | | 5,745,594 |
MATERIALS - 1.7% |
Chemicals - 1.6% |
Eastman Chemical Co. | 1,196,200 | | 96,210 |
LyondellBasell Industries NV Class A | 320,800 | | 22,042 |
Mexichem S.A.B. de CV | 3,322,800 | | 15,549 |
Monsanto Co. | 1,900,300 | | 187,712 |
| | 321,513 |
Metals & Mining - 0.1% |
Freeport-McMoRan Copper & Gold, Inc. | 702,100 | | 19,855 |
TOTAL MATERIALS | | 341,368 |
TELECOMMUNICATION SERVICES - 0.1% |
Diversified Telecommunication Services - 0.1% |
Jazztel PLC (a) | 504,600 | | 4,578 |
Verizon Communications, Inc. | 383,700 | | 18,985 |
| | 23,563 |
TOTAL COMMON STOCKS (Cost $13,457,469) |
20,037,822
|
Preferred Stocks - 0.4% |
| Shares | | Value (000s) |
Convertible Preferred Stocks - 0.0% |
CONSUMER DISCRETIONARY - 0.0% |
Leisure Equipment & Products - 0.0% |
NJOY, Inc. Series C (f) | 607,766 | | $ 4,913 |
Nonconvertible Preferred Stocks - 0.4% |
CONSUMER DISCRETIONARY - 0.4% |
Automobiles - 0.4% |
Volkswagen AG | 338,600 | | 80,474 |
TOTAL PREFERRED STOCKS (Cost $40,585) |
85,387
|
Money Market Funds - 2.9% |
| | | |
Fidelity Cash Central Fund, 0.11% (b) | 65,572,089 | | 65,572 |
Fidelity Securities Lending Cash Central Fund, 0.12% (b)(c) | 529,104,648 | | 529,105 |
TOTAL MONEY MARKET FUNDS (Cost $594,677) |
594,677
|
TOTAL INVESTMENT PORTFOLIO - 102.6% (Cost $14,092,731) | | 20,717,886 |
NET OTHER ASSETS (LIABILITIES) - (2.6)% | | (534,684) |
NET ASSETS - 100% | $ 20,183,202 |
Legend |
(a) Non-income producing |
(b) Affiliated fund that is generally available only to investment companies and other accounts managed by Fidelity Investments. The rate quoted is the annualized seven-day yield of the fund at period end. A complete unaudited listing of the fund's holdings as of its most recent quarter end is available upon request. In addition, each Fidelity Central Fund's financial statements, which are not covered by the Fund's Report of Independent Registered Public Accounting Firm, are available on the SEC's website or upon request. |
(c) Investment made with cash collateral received from securities on loan. |
(d) Security or a portion of the security is on loan at period end. |
(e) Affiliated company |
(f) Restricted securities - Investment in securities not registered under the Securities Act of 1933 (excluding 144A issues). At the end of the period, the value of restricted securities (excluding 144A issues) amounted to $14,951,000 or 0.1% of net assets. |
Additional information on each restricted holding is as follows: |
Security | Acquisition Date | Acquisition Cost (000s) |
Dropbox, Inc. | 5/2/12 | $ 9,084 |
NJOY, Inc.
Series C | 6/7/13 | $ 4,913 |
Affiliated Central Funds |
Information regarding fiscal year to date income earned by the Fund from investments in Fidelity Central Funds is as follows: |
Fund | Income earned
(Amounts in thousands) |
Fidelity Cash Central Fund | $ 44 |
Fidelity Securities Lending Cash Central Fund | 10,642 |
Total | $ 10,686 |
Other Affiliated Issuers |
An affiliated company is a company in which the Fund has ownership of at least 5% of the voting securities. Fiscal year to date transactions with companies which are or were affiliates are as follows: |
Affiliate
(Amounts in thousands) | Value,
beginning of
period | Purchases | Sales
Proceeds | Dividend
Income | Value,
end of
period |
Parsvnath Developers Ltd. | $ 15,302 | $ - | $ - | $ - | $ 10,232 |
Total | $ 15,302 | $ - | $ - | $ - | $ 10,232 |
Other Information |
The following is a summary of the inputs used, as of July 31, 2013, involving the Fund's assets and liabilities carried at fair value. The inputs or methodology used for valuing securities may not be an indication of the risk associated with investing in those securities. For more information on valuation inputs, and their aggregation into the levels used in the table below, please refer to the Investment Valuation section in the accompanying Notes to Financial Statements. |
Valuation Inputs at Reporting Date: |
Description
(Amounts in thousands) | Total | Level 1 | Level 2 | Level 3 |
Investments in Securities: | | | | |
Equities: | | | | |
Consumer Discretionary | $ 4,646,584 | $ 4,641,671 | $ - | $ 4,913 |
Consumer Staples | 2,660,702 | 2,652,871 | 7,831 | - |
Energy | 763,842 | 763,842 | - | - |
Financials | 808,800 | 808,800 | - | - |
Health Care | 2,979,590 | 2,979,590 | - | - |
Industrials | 2,153,166 | 2,153,166 | - | - |
Information Technology | 5,745,594 | 5,735,556 | - | 10,038 |
Materials | 341,368 | 341,368 | - | - |
Telecommunication Services | 23,563 | 23,563 | - | - |
Money Market Funds | 594,677 | 594,677 | - | - |
Total Investments in Securities: | $ 20,717,886 | $ 20,695,104 | $ 7,831 | $ 14,951 |
See accompanying notes which are an integral part of the financial statements.
Annual Report
Statement of Assets and Liabilities
Amounts in thousands (except per-share amounts) | July 31, 2013 |
| | |
Assets | | |
Investment in securities, at value (including securities loaned of $525,836) - See accompanying schedule: Unaffiliated issuers (cost $13,467,203) | $ 20,112,977 | |
Fidelity Central Funds (cost $594,677) | 594,677 | |
Other affiliated issuers (cost $30,851) | 10,232 | |
Total Investments (cost $14,092,731) | | $ 20,717,886 |
Cash | | 159 |
Receivable for investments sold | | 173,967 |
Receivable for fund shares sold | | 16,793 |
Dividends receivable | | 7,381 |
Distributions receivable from Fidelity Central Funds | | 137 |
Other receivables | | 751 |
Total assets | | 20,917,074 |
| | |
Liabilities | | |
Payable for investments purchased | $ 160,438 | |
Payable for fund shares redeemed | 31,357 | |
Accrued management fee | 10,006 | |
Other affiliated payables | 2,227 | |
Other payables and accrued expenses | 739 | |
Collateral on securities loaned, at value | 529,105 | |
Total liabilities | | 733,872 |
| | |
Net Assets | | $ 20,183,202 |
Net Assets consist of: | | |
Paid in capital | | $ 12,472,227 |
Undistributed net investment income | | 56,036 |
Accumulated undistributed net realized gain (loss) on investments and foreign currency transactions | | 1,029,789 |
Net unrealized appreciation (depreciation) on investments and assets and liabilities in foreign currencies | | 6,625,150 |
Net Assets | | $ 20,183,202 |
See accompanying notes which are an integral part of the financial statements.
Annual Report
Financial Statements - continued
Statement of Assets and Liabilities - continued
Amounts in thousands (except per-share amounts) | July 31, 2013 |
| | |
Blue Chip Growth:
Net Asset Value, offering price and redemption price per share ($12,927,159 ÷ 216,718 shares) | | $ 59.65 |
| | |
Class K:
Net Asset Value, offering price and redemption price per share ($3,505,675 ÷ 58,679 shares) | | $ 59.74 |
| | |
Class F:
Net Asset Value, offering price and redemption price per share ($3,750,368 ÷ 62,706 shares) | | $ 59.81 |
See accompanying notes which are an integral part of the financial statements.
Annual Report
Statement of Operations
Amounts in thousands | Year ended July 31, 2013 |
| | |
Investment Income | | |
Dividends | | $ 247,142 |
Interest | | 1 |
Income from Fidelity Central Funds | | 10,686 |
Total income | | 257,829 |
| | |
Expenses | | |
Management fee
Basic fee | $ 95,910 | |
Performance adjustment | (1,291) | |
Transfer agent fees | 23,729 | |
Accounting and security lending fees | 1,648 | |
Custodian fees and expenses | 400 | |
Independent trustees' compensation | 108 | |
Registration fees | 151 | |
Audit | 107 | |
Legal | 56 | |
Interest | 8 | |
Miscellaneous | 149 | |
Total expenses before reductions | 120,975 | |
Expense reductions | (2,236) | 118,739 |
Net investment income (loss) | | 139,090 |
Realized and Unrealized Gain (Loss) Net realized gain (loss) on: | | |
Investment securities: | | |
Unaffiliated issuers | 1,392,819 | |
Foreign currency transactions | (800) | |
Total net realized gain (loss) | | 1,392,019 |
Change in net unrealized appreciation (depreciation) on: Investment securities | 2,900,644 | |
Assets and liabilities in foreign currencies | 23 | |
Total change in net unrealized appreciation (depreciation) | | 2,900,667 |
Net gain (loss) | | 4,292,686 |
Net increase (decrease) in net assets resulting from operations | | $ 4,431,776 |
See accompanying notes which are an integral part of the financial statements.
Annual Report
Financial Statements - continued
Statement of Changes in Net Assets
Amounts in thousands | Year ended
July 31,
2013 | Year ended
July 31,
2012 |
Increase (Decrease) in Net Assets | | |
Operations | | |
Net investment income (loss) | $ 139,090 | $ 35,383 |
Net realized gain (loss) | 1,392,019 | (37,431) |
Change in net unrealized appreciation (depreciation) | 2,900,667 | 271,789 |
Net increase (decrease) in net assets resulting
from operations | 4,431,776 | 269,741 |
Distributions to shareholders from net investment income | (85,342) | (15,666) |
Distributions to shareholders from net realized gain | (230,904) | (480,841) |
Total distributions | (316,246) | (496,507) |
Share transactions - net increase (decrease) | 1,247,958 | 656,032 |
Total increase (decrease) in net assets | 5,363,488 | 429,266 |
| | |
Net Assets | | |
Beginning of period | 14,819,714 | 14,390,448 |
End of period (including undistributed net investment income of $56,036 and undistributed net investment income of $10,385, respectively) | $ 20,183,202 | $ 14,819,714 |
See accompanying notes which are an integral part of the financial statements.
Annual Report
Financial Highlights - Blue Chip Growth
Years ended July 31, | 2013 | 2012 | 2011 | 2010 | 2009 |
Selected Per-Share Data | | | | | |
Net asset value, beginning of period | $ 47.38 | $ 48.17 | $ 37.63 | $ 31.97 | $ 39.06 |
Income from Investment Operations | | | | | |
Net investment income (loss) B | .39 | .10 | (.03) | .04 | .27 |
Net realized and unrealized gain (loss) | 12.79 | .75 | 10.61 | 5.80 | (6.36) |
Total from investment operations | 13.18 | .85 | 10.58 | 5.84 | (6.09) |
Distributions from net investment income | (.23) | (.04) | (.00) E, G | (.18) | (.29) |
Distributions from net realized gain | (.68) | (1.60) | (.04) E | - | (.71) |
Total distributions | (.91) | (1.64) | (.04) | (.18) | (1.00) |
Net asset value, end of period | $ 59.65 | $ 47.38 | $ 48.17 | $ 37.63 | $ 31.97 |
Total Return A | 28.25% | 2.27% | 28.12% | 18.29% | (15.85)% |
Ratios to Average Net Assets C, F | | | | | |
Expenses before reductions | .76% | .90% | .94% | .94% | .76% |
Expenses net of fee waivers, if any | .76% | .90% | .94% | .94% | .76% |
Expenses net of all reductions | .74% | .89% | .92% | .93% | .76% |
Net investment income (loss) | .75% | .21% | (.06)% | .10% | .93% |
Supplemental Data | | | | | |
Net assets, end of period (in millions) | $ 12,927 | $ 10,595 | $ 12,024 | $ 10,295 | $ 9,691 |
Portfolio turnover rate D | 75% | 95% | 132% | 135% | 134% |
A Total returns would have been lower if certain expenses had not been reduced during the applicable periods shown.
B Calculated based on average shares outstanding during the period.
C Fees and expenses of any underlying Fidelity Central Funds are not included in the Fund's expense ratio. The Fund indirectly bears its proportionate share of the expenses of any underlying Fidelity Central Funds.
D Amount does not include the portfolio activity of any underlying Fidelity Central Funds.
E The amounts shown reflect certain reclassifications related to book to tax differences that were made in the year shown.
F Expense ratios reflect operating expenses of the class. Expenses before reductions do not reflect amounts reimbursed by the investment adviser or reductions from brokerage service arrangements or reductions from other expense offset arrangements and do not represent the amount paid by the class during periods when reimbursements or reductions occur. Expenses net of fee waivers reflect expenses after reimbursement by the investment adviser but prior to reductions from brokerage service arrangements or other expense offset arrangements. Expenses net of all reductions represent the net expenses paid by the class.
G Amount represents less than $.01 per share.
See accompanying notes which are an integral part of the financial statements.
Annual Report
Financial Highlights - Class K
Years ended July 31, | 2013 | 2012 | 2011 | 2010 | 2009 |
Selected Per-Share Data | | | | | |
Net asset value, beginning of period | $ 47.46 | $ 48.21 | $ 37.66 | $ 32.01 | $ 39.07 |
Income from Investment Operations | | | | | |
Net investment income (loss) C | .47 | .17 | .05 | .11 | .32 |
Net realized and unrealized gain (loss) | 12.79 | .75 | 10.62 | 5.79 | (6.33) |
Total from investment operations | 13.26 | .92 | 10.67 | 5.90 | (6.01) |
Distributions from net investment income | (.30) | (.08) | (.05) F | (.25) | (.34) |
Distributions from net realized gain | (.68) | (1.60) | (.07) F | - | (.71) |
Total distributions | (.98) | (1.67) H | (.12) | (.25) | (1.05) |
Net asset value, end of period | $ 59.74 | $ 47.46 | $ 48.21 | $ 37.66 | $ 32.01 |
Total Return A, B | 28.42% | 2.43% | 28.37% | 18.48% | (15.61)% |
Ratios to Average Net Assets D, G | | | | | |
Expenses before reductions | .61% | .74% | .77% | .75% | .53% |
Expenses net of fee waivers, if any | .61% | .74% | .77% | .75% | .53% |
Expenses net of all reductions | .60% | .73% | .76% | .74% | .52% |
Net investment income (loss) | .89% | .37% | .11% | .30% | 1.16% |
Supplemental Data | | | | | |
Net assets, end of period (in millions) | $ 3,506 | $ 2,467 | $ 1,455 | $ 932 | $ 591 |
Portfolio turnover rate E | 75% | 95% | 132% | 135% | 134% |
A Total returns for periods of less than one year are not annualized.
B Total returns would have been lower if certain expenses had not been reduced during the applicable periods shown.
C Calculated based on average shares outstanding during the period.
D Fees and expenses of any underlying Fidelity Central Funds are not included in the Fund's expense ratio. The Fund indirectly bears its proportionate share of the expenses of any underlying Fidelity Central Funds.
E Amount does not include the portfolio activity of any underlying Fidelity Central Funds.
F The amounts shown reflect certain reclassifications related to book to tax differences that were made in the year shown.
G Expense ratios reflect operating expenses of the class. Expenses before reductions do not reflect amounts reimbursed by the investment adviser or reductions from brokerage service arrangements or reductions from other expense offset arrangements and do not represent the amount paid by the class during periods when reimbursements or reductions occur. Expenses net of fee waivers reflect expenses after reimbursement by the investment adviser but prior to reductions from brokerage service arrangements or other expense offset arrangements. Expenses net of all reductions represent the net expenses paid by the class.
H Total distributions of $1.67 per share is comprised of distributions from net investment income of $.076 and distributions from net realized gain of $1.598 per share.
See accompanying notes which are an integral part of the financial statements.
Annual Report
Financial Highlights - Class F
Years ended July 31, | 2013 | 2012 | 2011 | 2010 | 2009 G |
Selected Per-Share Data | | | | | |
Net asset value, beginning of period | $ 47.51 | $ 48.24 | $ 37.69 | $ 31.98 | $ 29.16 |
Income from Investment Operations | | | | | |
Net investment income (loss) D | .50 | .19 | .07 | .13 | - J |
Net realized and unrealized gain (loss) | 12.81 | .76 | 10.61 | 5.80 | 2.82 |
Total from investment operations | 13.31 | .95 | 10.68 | 5.93 | 2.82 |
Distributions from net investment income | (.33) | (.08) | (.06) H | (.22) | - |
Distributions from net realized gain | (.68) | (1.60) | (.08) H | - | - |
Total distributions | (1.01) | (1.68) | (.13) K | (.22) | - |
Net asset value, end of period | $ 59.81 | $ 47.51 | $ 48.24 | $ 37.69 | $ 31.98 |
Total Return B, C | 28.49% | 2.49% | 28.41% | 18.59% | 9.67% |
Ratios to Average Net Assets E, I | | | | | |
Expenses before reductions | .56% | .69% | .72% | .70% | .51% A |
Expenses net of fee waivers, if any | .56% | .69% | .72% | .70% | .51% A |
Expenses net of all reductions | .55% | .68% | .71% | .68% | .51% A |
Net investment income (loss) | .94% | .42% | .16% | .35% | (.05)% A |
Supplemental Data | | | | | |
Net assets, end of period (000 omitted) | $ 3,750,368 | $ 1,756,916 | $ 911,556 | $ 321,409 | $ 261 |
Portfolio turnover rate F | 75% | 95% | 132% | 135% | 134% |
A Annualized
B Total returns for periods of less than one year are not annualized.
C Total returns would have been lower if certain expenses had not been reduced during the applicable periods shown.
D Calculated based on average shares outstanding during the period.
E Fees and expenses of any underlying Fidelity Central Funds are not included in the Fund's expense ratio. The Fund indirectly bears its proportionate share of the expenses of any underlying Fidelity Central Funds.
F Amount does not include the portfolio activity of any underlying Fidelity Central Funds.
G For the period June 26, 2009 (commencement of sale of shares) to July 31, 2009.
H The amounts shown reflect certain reclassifications related to book to tax differences that were made in the year shown.
I Expense ratios reflect operating expenses of the class. Expenses before reductions do not reflect amounts reimbursed by the investment adviser or reductions from brokerage service arrangements or reductions from other expense offset arrangements and do not represent the amount paid by the class during periods when reimbursements or reductions occur. Expense ratios before reductions for start-up periods may not be representative of longer-term operating periods. Expenses net of fee waivers reflect expenses after reimbursement by the investment adviser but prior to reductions from brokerage service arrangements or other expense offset arrangements. Expenses net of all reductions represent the net expenses paid by the class.
J Amount represents less than $.01 per share.
K Total distributions of $.13 per share is comprised of distributions from net investment income of $.058 and distributions from net realized gain of $.076 per share.
See accompanying notes which are an integral part of the financial statements.
Annual Report
Notes to Financial Statements
For the period ended July 31, 2013
(Amounts in thousands except percentages)
1. Organization.
Fidelity® Blue Chip Growth Fund (the Fund) is a fund of Fidelity Securities Fund (the Trust) and is authorized to issue an unlimited number of shares. The Trust is registered under the Investment Company Act of 1940, as amended (the 1940 Act), as an open-end management investment company organized as a Massachusetts business trust. The Fund offers Blue Chip Growth, Class K and Class F shares, each of which has equal rights as to assets and voting privileges. Each class has exclusive voting rights with respect to matters that affect that class. Class F shares of the Fund are only available for purchase by mutual funds for which Fidelity Management & Research Company (FMR) or an affiliate serves as investment manager.
2. Investments in Fidelity Central Funds.
The Fund invests in Fidelity Central Funds, which are open-end investment companies generally available only to other investment companies and accounts managed by FMR and its affiliates. The Fund's Schedule of Investments lists each of the Fidelity Central Funds held as of period end, if any, as an investment of the Fund, but does not include the underlying holdings of each Fidelity Central Fund. As an Investing Fund, the Fund indirectly bears its proportionate share of the expenses of the underlying Fidelity Central Funds.
The Money Market Central Funds seek preservation of capital and current income and are managed by Fidelity Investments Money Management, Inc. (FIMM), an affiliate of FMR.
A complete unaudited list of holdings for each Fidelity Central Fund is available upon request or at the Securities and Exchange Commission (the SEC) website at www.sec.gov. In addition, the financial statements of the Fidelity Central Funds, which are not covered by the Fund's Report of Independent Registered Public Accounting Firm, are available on the SEC website or upon request.
3. Significant Accounting Policies.
The financial statements have been prepared in conformity with accounting principles generally accepted in the United States of America (GAAP), which require management to make certain estimates and assumptions at the date of the financial statements. Actual results could differ from those estimates. Subsequent events, if any, through the date that the financial statements were issued have been evaluated in the preparation of the financial statements. The following summarizes the significant accounting policies of the Fund:
Investment Valuation. Investments are valued as of 4:00 p.m. Eastern time on the last calendar day of the period. In accordance with valuation policies and procedures
Annual Report
3. Significant Accounting Policies - continued
Investment Valuation - continued
approved by the Board of Trustees (the Board), the Fund attempts to obtain prices from one or more third party pricing vendors or brokers to value its investments. When current market prices, quotations or currency exchange rates are not readily available or reliable, investments will be fair valued in good faith by the FMR Fair Value Committee (the Committee), in accordance with procedures adopted by the Board. Factors used in determining fair value vary by investment type and may include market or investment specific events. The frequency with which these procedures are used cannot be predicted and they may be utilized to a significant extent. The Committee oversees the Fund's valuation policies and procedures and is responsible for approving and reporting to the Board all fair value determinations.
The Fund categorizes the inputs to valuation techniques used to value its investments into a disclosure hierarchy consisting of three levels as shown below:
Level 1 - quoted prices in active markets for identical investments
Level 2 - other significant observable inputs (including quoted prices for similar investments, interest rates, prepayment speeds, etc.)
Level 3 - unobservable inputs (including the Fund's own assumptions based on the best information available)
Valuation techniques used to value the Fund's investments by major category are as follows:
Equity securities, including restricted securities, for which market quotations are readily available, are valued at the last reported sale price or official closing price as reported by a third party pricing vendor on the primary market or exchange on which they are traded and are categorized as Level 1 in the hierarchy. In the event there were no sales during the day or closing prices are not available, securities are valued at the last quoted bid price or may be valued using the last available price and are generally categorized as Level 2 in the hierarchy. For foreign equity securities, when market or security specific events arise, comparisons to the valuation of American Depositary Receipts (ADRs), futures contracts, Exchange-Traded Funds (ETFs) and certain indexes as well as quoted prices for similar securities may be used and would be categorized as Level 2 in the hierarchy. Utilizing these techniques may result in transfers between Level 1 and Level 2. For restricted equity securities and private placements where observable inputs are limited, assumptions about market activity and risk are used and these securities are generally categorized as Level 3 in the hierarchy.
Annual Report
Notes to Financial Statements - continued
(Amounts in thousands except percentages)
3. Significant Accounting Policies - continued
Investment Valuation - continued
Investments in open-end mutual funds, including the Fidelity Central Funds, are valued at their closing net asset value (NAV) each business day and are categorized as Level 1 in the hierarchy.
Changes in valuation techniques may result in transfers in or out of an assigned level within the disclosure hierarchy. The aggregate value of investments by input level, as of July 31, 2013, is included at the end of the Fund's Schedule of Investments.
Foreign Currency. The Fund may use foreign currency contracts to facilitate transactions in foreign-denominated securities. Gains and losses from these transactions may arise from changes in the value of the foreign currency or if the counterparties do not perform under the contracts' terms.
Foreign-denominated assets, including investment securities, and liabilities are translated into U.S. dollars at the exchange rates at period end. Purchases and sales of investment securities, income and dividends received and expenses denominated in foreign currencies are translated into U.S. dollars at the exchange rate in effect on the transaction date.
The effects of exchange rate fluctuations on investments are included with the net realized and unrealized gain (loss) on investment securities. Other foreign currency transactions resulting in realized and unrealized gain (loss) are disclosed separately.
Investment Transactions and Income. For financial reporting purposes, the Fund's investment holdings and NAV include trades executed through the end of the last business day of the period. The NAV per share for processing shareholder transactions is calculated as of the close of business of the New York Stock Exchange (NYSE), normally 4:00 p.m. Eastern time and includes trades executed through the end of the prior business day. Gains and losses on securities sold are determined on the basis of identified cost and may include proceeds received from litigation. Dividend income is recorded on the ex-dividend date, except for certain dividends from foreign securities where the ex-dividend date may have passed, which are recorded as soon as the Fund is informed of the ex-dividend date. Non-cash dividends included in dividend income, if any, are recorded at the fair market value of the securities received. Distributions received on securities that represent a return of capital or capital gain are recorded as a reduction of cost of investments and/or as a realized gain. Subsequent to ex-dividend date the Fund determines the components of these distributions, based upon receipt of tax filings or other correspondence relating to the underlying investment. Interest income and distributions from the Fidelity Central Funds are accrued as earned. Interest income includes coupon interest and amortization of premium and accretion of discount on debt
Annual Report
3. Significant Accounting Policies - continued
Investment Transactions and Income - continued
securities. Investment income is recorded net of foreign taxes withheld where recovery of such taxes is uncertain.
Class Allocations and Expenses. Investment income, realized and unrealized capital gains and losses, common expenses of the Fund, and certain fund-level expense reductions, if any, are allocated on a pro-rata basis to each class based on the relative net assets of each class to the total net assets of Fund. Each class differs with respect to transfer agent fees incurred. Certain expense reductions may also differ by class. Expenses directly attributable to a fund are charged to that fund. Expenses attributable to more than one fund are allocated among the respective funds on the basis of relative net assets or other appropriate methods. Expense estimates are accrued in the period to which they relate and adjustments are made when actual amounts are known.
Deferred Trustee Compensation. Under a Deferred Compensation Plan (the Plan), independent Trustees may elect to defer receipt of a portion of their annual compensation. Deferred amounts are invested in a cross-section of Fidelity funds, are marked-to-market and remain in the Fund until distributed in accordance with the Plan. The investment of deferred amounts and the offsetting payable to the Trustees are included in the accompanying Statement of Assets and Liabilities.
Income Tax Information and Distributions to Shareholders. Each year, the Fund intends to qualify as a regulated investment company under Subchapter M of the Internal Revenue Code, including distributing substantially all of its taxable income and realized gains. As a result, no provision for income taxes is required. As of July 31, 2013, the Fund did not have any unrecognized tax benefits in the financial statements; nor is the Fund aware of any tax positions for which it is reasonably possible that the total amounts of unrecognized tax benefits will significantly change in the next twelve months. The Fund files a U.S. federal tax return, in addition to state and local tax returns as required. A fund's federal income tax returns are subject to examination by the Internal Revenue Service (IRS) for a period of three fiscal years after they are filed. State and local tax returns may be subject to examination for an additional fiscal year depending on the jurisdiction. Foreign taxes are provided for based on the Fund's understanding of the tax rules and rates that exist in the foreign markets in which it invests.
Distributions are declared and recorded on the ex-dividend date. Income dividends and capital gain distributions are declared separately for each class. Income and capital gain distributions are determined in accordance with income tax regulations, which may differ from GAAP. These differences resulted in distribution reclassifications. In addition,
Annual Report
Notes to Financial Statements - continued
(Amounts in thousands except percentages)
3. Significant Accounting Policies - continued
Income Tax Information and Distributions to Shareholders - continued
the fund claimed a portion of the payment made to redeeming shareholders as a distribution for income tax purposes.
Capital accounts within the financial statements are adjusted for permanent book-tax differences. These adjustments have no impact on net assets or the results of operations. Temporary book-tax differences will reverse in a subsequent period.
Book-tax differences are primarily due to foreign currency transactions, partnerships, deferred trustees compensation, capital loss carryforwards and losses deferred due to wash sales.
The federal tax cost of investment securities and unrealized appreciation (depreciation) as of period end were as follows:
Gross unrealized appreciation | $ 6,725,212 |
Gross unrealized depreciation | (141,260) |
Net unrealized appreciation (depreciation) on securities and other investments | $ 6,583,952 |
| |
Tax Cost | $ 14,133,934 |
The tax-based components of distributable earnings as of period end were as follows:
Undistributed ordinary income | $ 130,879 |
Undistributed long-term capital gain | $ 996,747 |
Net unrealized appreciation (depreciation) | $ 6,583,947 |
The tax character of distributions paid was as follows:
| July 31, 2013 | July 31, 2012 |
Ordinary Income | $ 85,342 | $ 15,666 |
Long-term Capital Gains | 230,904 | 480,841 |
Total | $ 316,246 | $ 496,507 |
Restricted Securities. The Fund may invest in securities that are subject to legal or contractual restrictions on resale. These securities generally may be resold in transactions exempt from registration or to the public if the securities are registered. Disposal of these securities may involve time-consuming negotiations and expense, and prompt sale at an acceptable price may be difficult. Information regarding restricted securities is included at the end of the Fund's Schedule of Investments.
Annual Report
4. Purchases and Sales of Investments.
Purchases and sales of securities, other than short-term securities, aggregated $13,939,479 and $12,907,588, respectively.
5. Fees and Other Transactions with Affiliates.
Management Fee. FMR and its affiliates provide the Fund with investment management related services for which the Fund pays a monthly management fee. The management fee is the sum of an individual fund fee rate that is based on an annual rate of .30% of the Fund's average net assets and an annualized group fee rate that averaged .26% during the period. The group fee rate is based upon the average net assets of all the mutual funds advised by FMR. The group fee rate decreases as assets under management increase and increases as assets under management decrease. In addition, the management fee is subject to a performance adjustment (up to a maximum of ± .20% of the Fund's average net assets over a 36 month performance period). The upward or downward adjustment to the management fee is based on the relative investment performance of Blue Chip Growth as compared to an appropriate benchmark index. For the period, the total annual management fee rate, including the performance adjustment, was .55% of the Fund's average net assets.
Transfer Agent Fees. Fidelity Investments Institutional Operations Company, Inc., (FIIOC), an affiliate of FMR, is the transfer, dividend disbursing and shareholder servicing agent for each class of the Fund. FIIOC receives account fees and asset-based fees that vary according to the account size and type of account of the shareholders of Blue Chip Growth. FIIOC receives an asset-based fee of Class K's average net assets. FIIOC receives no fees for providing transfer agency services to Class F. FIIOC pays for typesetting, printing and mailing of shareholder reports, except proxy statements. For the period, transfer agent fees for each class were as follows:
| Amount | % of
Average
Net Assets |
Blue Chip Growth | $ 22,289 | .19 |
Class K | 1,440 | .05 |
| $ 23,729 | |
Accounting and Security Lending Fees. Fidelity Service Company, Inc. (FSC), an affiliate of FMR, maintains the Fund's accounting records. The accounting fee is based on the level of average net assets for each month. Under a separate contract, FSC administers the security lending program. The security lending fee is based on the number and duration of lending transactions.
Annual Report
Notes to Financial Statements - continued
(Amounts in thousands except percentages)
5. Fees and Other Transactions with Affiliates - continued
Brokerage Commissions. The Fund placed a portion of its portfolio transactions with brokerage firms which are affiliates of the investment adviser. Brokerage commissions are included in net realized gain (loss) and change in net unrealized appreciation (depreciation) in the Statement of Operations. The commissions paid to these affiliated firms were $401 for the period.
Interfund Lending Program. Pursuant to an Exemptive Order issued by the SEC, the Fund, along with other registered investment companies having management contracts with FMR, may participate in an interfund lending program. This program provides an alternative credit facility allowing the funds to borrow from, or lend money to, other participating affiliated funds. At period end, there were no interfund loans outstanding. The Fund's activity in this program during the period for which loans were outstanding was as follows:
Borrower or Lender | Average Loan
Balance | Weighted Average
Interest Rate | Interest
Expense |
Borrower | $ 12,940 | .41% | $ 8 |
Exchanges In-Kind. During the period, certain investment companies managed by FMR or its affiliates (Investing Funds) completed exchanges in-kind with the Fund. The Investing Funds delivered cash and securities valued at $1,605,000 in exchange for 32,348 shares of the Fund. The amount of in-kind exchanges is included in share transactions in the accompanying Statement of Changes in Net Assets, as well as Note 10: Share Transactions. The Fund recognized no gain or loss for federal income tax purposes.
6. Committed Line of Credit.
The Fund participates with other funds managed by FMR or an affiliate in a $4.25 billion credit facility (the "line of credit") to be utilized for temporary or emergency purposes to fund shareholder redemptions or for other short-term liquidity purposes. The Fund has agreed to pay commitment fees on its pro-rata portion of the line of credit, which amounted to $39 and is reflected in Miscellaneous expenses on the Statement of Operations. During the period, there were no borrowings on this line of credit.
7. Security Lending.
The Fund lends portfolio securities through a lending agent from time to time in order to earn additional income. For equity securities, a lending agent is used and may loan securities to certain qualified borrowers, including Fidelity Capital Markets (FCM), a broker-dealer affiliated with the Fund. On the settlement date of the loan, the Fund receives collateral (in the form of U.S. Treasury obligations, letters of credit and/or cash) against the loaned securities and maintains collateral in an amount not less than 100% of
Annual Report
7. Security Lending - continued
the market value of the loaned securities during the period of the loan. The market value of the loaned securities is determined at the close of business of the Fund and any additional required collateral is delivered to the Fund on the next business day. If the borrower defaults on its obligation to return the securities loaned because of insolvency or other reasons, the Fund may apply collateral received from the borrower against the obligation. The Fund may experience delays and costs in recovering the securities loaned. Any cash collateral received is invested in the Fidelity Securities Lending Cash Central Fund. The value of loaned securities and cash collateral at period end are disclosed on the Fund's Statement of Assets and Liabilities. The value of securities loaned to FCM at period end was $2,041. Security lending income represents the income earned on investing cash collateral, less rebates paid to borrowers and any lending agent fees associated with the loan, plus any premium payments received for lending certain types of securities. Security lending income is presented in the Statement of Operations as a component of income from Fidelity Central Funds. Total security lending income during the period amounted to $10,642, including $619 from securities loaned to FCM.
8. Expense Reductions.
Commissions paid to certain brokers with whom FMR places trades on behalf of the Fund include an amount in addition to trade execution, which is rebated back to the Fund to offset certain expenses. This amount totaled $2,199 for the period. In addition, FMR reimbursed a portion of the Fund's operating expenses during the period in the amount of $37.
9. Distributions to Shareholders.
Distributions to shareholders of each class were as follows:
Years ended July 31, | 2013 | 2012 |
From net investment income | | |
Blue Chip Growth | $ 51,844 | $ 10,644 |
Class K | 16,348 | 2,860 |
Class F | 17,150 | 2,162 |
Total | $ 85,342 | $ 15,666 |
From net realized gain | | |
Blue Chip Growth | $ 155,106 | $ 397,250 |
Class K | 36,829 | 51,295 |
Class F | 38,969 | 32,296 |
Total | $ 230,904 | $ 480,841 |
Annual Report
Notes to Financial Statements - continued
(Amounts in thousands except percentages)
10. Share Transactions.
Transactions for each class of shares were as follows:
| Shares | Dollars |
Years ended July 31, | 2013 | 2012 | 2013 | 2012 |
Blue Chip Growth | | | | |
Shares sold | 41,304 A | 42,825 | $ 2,121,491 A | $ 1,970,082 |
Reinvestment of distributions | 4,171 | 9,668 | 202,506 | 399,689 |
Shares redeemed | (52,364) | (78,498) | (2,708,546) | (3,530,347) |
Net increase (decrease) | (6,889) | (26,005) | $ (384,549) | $ (1,160,576) |
Class K | | | | |
Shares sold | 17,299 | 29,866 | $ 899,333 | $ 1,366,770 |
Reinvestment of distributions | 1,092 | 1,309 | 53,178 | 54,155 |
Shares redeemed | (11,703) | (9,363) | (608,221) | (426,597) |
Net increase (decrease) | 6,688 | 21,812 | $ 344,290 | $ 994,328 |
Class F | | | | |
Shares sold | 28,168 A | 19,170 | $ 1,424,726 A | $ 873,960 |
Reinvestment of distributions | 1,153 | 832 | 56,119 | 34,458 |
Shares redeemed | (3,595) | (1,918) | (192,628) | (86,138) |
Net increase (decrease) | 25,726 | 18,084 | $ 1,288,217 | $ 822,280 |
A Amount includes in-kind exchanges (See Note 5: Exchanges In-Kind)
11. Other.
The Fund's organizational documents provide former and current trustees and officers with a limited indemnification against liabilities arising in connection with the performance of their duties to the Fund. In the normal course of business, the Fund may also enter into contracts that provide general indemnifications. The Fund's maximum exposure under these arrangements is unknown as this would be dependent on future claims that may be made against the Fund. The risk of material loss from such claims is considered remote.
At the end of the period, the Fidelity Freedom Funds and Fidelity Freedom K Funds were the owners of record, in the aggregate, of approximately 33% of the total outstanding shares of the Fund.
Annual Report
To the Trustees of Fidelity Securities Fund and Shareholders of Fidelity Blue Chip Growth Fund:
We have audited the accompanying statement of assets and liabilities of Fidelity Blue Chip Growth Fund (the Fund), a fund of Fidelity Securities Fund, including the schedule of investments, as of July 31, 2013, and the related statement of operations for the year then ended, the statement of changes in net assets for each of the two years in the period then ended, and the financial highlights for each of the five years in the period then ended. These financial statements and financial highlights are the responsibility of the Fund's management. Our responsibility is to express an opinion on these financial statements and financial highlights based on our audits.
We conducted our audits in accordance with the standards of the Public Company Accounting Oversight Board (United States). Those standards require that we plan and perform the audit to obtain reasonable assurance about whether the financial statements and financial highlights are free of material misstatement. The Fund is not required to have, nor were we engaged to perform, an audit of its internal control over financial reporting. Our audits included consideration of internal control over financial reporting as a basis for designing audit procedures that are appropriate in the circumstances, but not for the purpose of expressing an opinion on the effectiveness of the Fund's internal control over financial reporting. Accordingly, we express no such opinion. An audit also includes examining, on a test basis, evidence supporting the amounts and disclosures in the financial statements, assessing the accounting principles used and significant estimates made by management, as well as evaluating the overall financial statement presentation. Our procedures included confirmation of securities owned as of July 31, 2013, by correspondence with the custodians and brokers; where replies were not received from brokers, we performed other auditing procedures. We believe that our audits provide a reasonable basis for our opinion.
In our opinion, the financial statements and financial highlights referred to above present fairly, in all material respects, the financial position of Fidelity Blue Chip Growth Fund as of July 31, 2013, the results of its operations for the year then ended, the changes in its net assets for each of the two years in the period then ended, and the financial highlights for each of the five years in the period then ended, in conformity with accounting principles generally accepted in the United States of America.
DELOITTE & TOUCHE LLP
Boston, Massachusetts
September 11, 2013
Annual Report
The Trustees, Member of the Advisory Board, and executive officers of the trust and funds, as applicable, are listed below. The Board of Trustees governs each fund and is responsible for protecting the interests of shareholders. The Trustees are experienced executives who meet periodically throughout the year to oversee each fund's activities, review contractual arrangements with companies that provide services to each fund, oversee management of the risks associated with such activities and contractual arrangements, and review each fund's performance. Except for James C. Curvey, Ned C. Lautenbach, Ronald P. O'Hanley, and William S. Stavropoulos, each of the Trustees oversees 166 Fidelity funds. Mr. Curvey oversees 387 Fidelity funds. Mr. Lautenbach, Mr. O'Hanley, and Mr. Stavropoulos each oversees 230 Fidelity funds.
The Trustees hold office without limit in time except that (a) any Trustee may resign; (b) any Trustee may be removed by written instrument, signed by at least two-thirds of the number of Trustees prior to such removal; (c) any Trustee who requests to be retired or who has become incapacitated by illness or injury may be retired by written instrument signed by a majority of the other Trustees; and (d) any Trustee may be removed at any special meeting of shareholders by a two-thirds vote of the outstanding voting securities of the trust. Each Trustee who is not an interested person of the trust and the funds (as defined in the 1940 Act) (Independent Trustee), shall retire not later than the last day of the calendar year in which his or her 75th birthday occurs. The Independent Trustees may waive this mandatory retirement age policy with respect to individual Trustees. The executive officers and Advisory Board Member hold office without limit in time, except that any officer and Advisory Board Member may resign or may be removed by a vote of a majority of the Trustees at any regular meeting or any special meeting of the Trustees. Except as indicated, each individual has held the office shown or other offices in the same company for the past five years.
Experience, Skills, Attributes, and Qualifications of the Funds' Trustees. The Governance and Nominating Committee has adopted a statement of policy that describes the experience, qualifications, attributes, and skills that are necessary and desirable for potential Independent Trustee candidates (Statement of Policy). The Board believes that each Trustee satisfied at the time he or she was initially elected or appointed a Trustee, and continues to satisfy, the standards contemplated by the Statement of Policy. The Governance and Nominating Committee also engages professional search firms to help identify potential Independent Trustee candidates who have the experience, qualifications, attributes, and skills consistent with the Statement of Policy. From time to time, additional criteria based on the composition and skills of the current Independent Trustees, as well as experience or skills that may be appropriate in light of future changes to board composition, business conditions, and regulatory or other developments, have also been considered by the professional search firms and the Governance and Nominating Committee. In addition, the Board takes into account the Trustees' commitment and participation in Board and committee meetings, as well as their leadership of standing and ad hoc committees throughout their tenure.
Annual Report
In determining that a particular Trustee was and continues to be qualified to serve as a Trustee, the Board has considered a variety of criteria, none of which, in isolation, was controlling. The Board believes that, collectively, the Trustees have balanced and diverse experience, qualifications, attributes, and skills, which allow the Board to operate effectively in governing each fund and protecting the interests of shareholders. Information about the specific experience, skills, attributes, and qualifications of each Trustee, which in each case led to the Board's conclusion that the Trustee should serve (or continue to serve) as a trustee of the funds, is provided below.
Board Structure and Oversight Function. James C. Curvey is an interested person (as defined in the 1940 Act) and currently serves as Chairman. The Trustees have determined that an interested Chairman is appropriate and benefits shareholders because an interested Chairman has a personal and professional stake in the quality and continuity of services provided to the funds. Independent Trustees exercise their informed business judgment to appoint an individual of their choosing to serve as Chairman, regardless of whether the Trustee happens to be independent or a member of management. The Independent Trustees have determined that they can act independently and effectively without having an Independent Trustee serve as Chairman and that a key structural component for assuring that they are in a position to do so is for the Independent Trustees to constitute a substantial majority for the Board. The Independent Trustees also regularly meet in executive session. Ned C. Lautenbach serves as Chairman of the Independent Trustees and as such (i) acts as a liaison between the Independent Trustees and management with respect to matters important to the Independent Trustees and (ii) with management prepares agendas for Board meetings.
Fidelity funds are overseen by different Boards of Trustees. The funds' Board oversees Fidelity's equity and high income funds and another Board oversees Fidelity's investment-grade bond, money market, and asset allocation funds. The asset allocation funds may invest in Fidelity funds overseen by the funds' Board. The use of separate Boards, each with its own committee structure, allows the Trustees of each group of Fidelity funds to focus on the unique issues of the funds they oversee, including common research, investment, and operational issues. On occasion, the separate Boards establish joint committees to address issues of overlapping consequences for the Fidelity funds overseen by each Board.
The Trustees operate using a system of committees to facilitate the timely and efficient consideration of all matters of importance to the Trustees, each fund, and fund shareholders and to facilitate compliance with legal and regulatory requirements and oversight of the funds' activities and associated risks. The Board, acting through its committees, has charged FMR and its affiliates with (i) identifying events or circumstances the occurrence of which could have demonstrably adverse effects on the funds' business and/or reputation; (ii) implementing processes and controls to lessen the possibility that such events or circumstances occur or to mitigate the effects of such events or circumstances if they do occur; and (iii) creating and maintaining a system designed to evaluate continuously business and market conditions in order to facilitate the identification and implementation processes described in (i) and (ii) above. Because the day-to-day operations and activities of the funds are carried out by or through FMR, its affiliates and other service providers, the funds' exposure to risks is mitigated but not eliminated by the processes overseen by the Trustees. While each of the Board's committees has responsibility for overseeing different aspects of the funds' activities, oversight is exercised primarily through the Operations, Audit, and Compliance Committees. In addition, the Independent Trustees have worked with FMR to enhance the Board's oversight of investment and financial risks, legal and regulatory risks, technology risks, and operational risks, including the development of additional risk reporting to the Board. For example, a working group comprised of Independent Trustees and FMR has worked and continues to work to review the Fidelity funds' valuation-related activities, reporting and risk management. Appropriate personnel, including but not limited to the funds' Chief Compliance Officer (CCO), FMR's internal auditor, the independent accountants, the funds' Treasurer and portfolio management personnel, make periodic reports to the Board's committees, as appropriate, including an annual review of FMR's risk management program for the Fidelity funds. The responsibilities of each standing committee, including their oversight responsibilities, are described further under "Standing Committees of the Funds' Trustees."
Annual Report
Trustees and Officers - continued
The fund's Statement of Additional Information (SAI) includes more information about the Trustees. To request a free copy, call Fidelity at 1-800-544-8544.
Interested Trustees*:
Correspondence intended for each Trustee who is an interested person may be sent to Fidelity Investments, 245 Summer Street, Boston, Massachusetts 02210.
Name, Year of Birth; Principal Occupations and Other Relevant Experience+ |
James C. Curvey (1935) |
| Year of Election or Appointment: 2007 Mr. Curvey is Trustee and Chairman of the Board of Trustees of certain Trusts. Mr. Curvey also serves as Trustee (2007-present) of other investment companies advised by FMR. Mr. Curvey is a Director of Fidelity Investments Money Management, Inc. (2009-present), Director of Fidelity Research & Analysis Co. (2009-present) and Director of FMR and FMR Co., Inc. (2007-present). Mr. Curvey is also Vice Chairman (2007-present) and Director of FMR LLC. In addition, Mr. Curvey serves as an Overseer for the Boston Symphony Orchestra and a member of the Trustees of Villanova University. Previously, Mr. Curvey was the Vice Chairman (2006-2007) and Director (2000-2007) of FMR Corp. |
Ronald P. O'Hanley (1957) |
| Year of Election or Appointment: 2011 Mr. O'Hanley serves as a Trustee and Chairman of the Board of Trustees of other Fidelity funds (2013-present), and is Director of FMR Co., Inc. (2010-present), Director of Fidelity Investments Money Management, Inc. (2010-present), Director of Fidelity Research & Analysis Company (2010-present), President of Fidelity Asset Management and Corporate Services and a Member of Fidelity's Executive Committee (2010-present). Previously, Mr. O'Hanley served as President and Chief Executive Officer of BNY Mellon Asset Management (2007-2010). Mr. O'Hanley also served as Vice Chairman of Bank New York Mellon Corp. and a member of that firm's Executive Committee. Prior to the 2007 merger of The Bank of New York and Mellon Financial Corporation, he was Vice Chairman of Mellon Financial Corporation and President and Chief Executive Officer of Mellon Asset Management. He joined Mellon in February 1997. Mr. O'Hanley currently serves as Chairman of the Boston Public Library Foundation Board of Directors and sits on the Board of Directors of Beth Israel Deaconess Medical Center, the Board of Trustees of the Marine Biological Laboratory and the Advisory Board of the Maxwell School of Citizenship and Public Administration at Syracuse University. Mr. O'Hanley also chairs the Council on Asset Management for the Financial Services Roundtable and is a member of the Board of Directors of Institutional Investor's U.S. Institute. |
* Trustees have been determined to be "Interested Trustees" by virtue of, among other things, their affiliation with the trust or various entities under common control with FMR.
+ The information above includes each Trustee's principal occupation during the last five years and other information relating to the experience, attributes, and skills relevant to each Trustee's qualifications to serve as a Trustee, which led to the conclusion that each Trustee should serve as a Trustee for each fund.
Annual Report
Trustees and Officers - continued
Independent Trustees:
Correspondence intended for each Independent Trustee (that is, the Trustees other than the Interested Trustees) may be sent to Fidelity Investments, P.O. Box 55235, Boston, Massachusetts 02205-5235.
Name, Year of Birth; Principal Occupations and Other Relevant Experience+ |
Dennis J. Dirks (1948) |
| Year of Election or Appointment: 2005 Prior to his retirement in May 2003, Mr. Dirks was Chief Operating Officer and a member of the Board of The Depository Trust & Clearing Corporation (DTCC). He also served as President, Chief Operating Officer, and Board member of The Depository Trust Company (DTC) and President and Board member of the National Securities Clearing Corporation (NSCC). In addition, Mr. Dirks served as Chief Executive Officer and Board member of the Government Securities Clearing Corporation, Chief Executive Officer and Board member of the Mortgage-Backed Securities Clearing Corporation, as a Trustee and a member of the Finance Committee of Manhattan College (2005-2008), and as a Trustee and a member of the Finance Committee of AHRC of Nassau County (2006-2008). Mr. Dirks is a member of the Independent Directors Council (IDC) Governing Council (2010-present) and Board of Directors for The Brookville Center for Children's Services, Inc. (2009-present). |
Alan J. Lacy (1953) |
| Year of Election or Appointment: 2008 Mr. Lacy serves as Senior Adviser (2007-present) of Oak Hill Capital Partners, L.P. (private equity). Mr. Lacy also served as Chief Executive Officer (2000-2005) and Vice Chairman (2005-2006) of Sears Holdings Corporation and Sears, Roebuck and Co. (retail). In addition, Mr. Lacy serves as a member of the Board of Directors of Dave & Buster's Entertainment, Inc. (restaurant and entertainment complexes, 2010-present), Earth Fare, Inc. (retail grocery, 2012-present), The Hillman Companies, Inc. (hardware wholesalers, 2010-present), and Bristol-Myers Squibb Company (global pharmaceuticals, 2008-present). Mr. Lacy is a member of the Board of Trustees of The National Parks Conservation Association (2006-present). Previously, Mr. Lacy served as Chairman of the Board of Trustees of the National Parks Conservation Association (2008-2011) and as a member of the Board of Directors for the Western Union Company (global money transfer, 2006-2011). |
Ned C. Lautenbach (1944) |
| Year of Election or Appointment: 2000 Mr. Lautenbach is Chairman of the Independent Trustees of the Equity and High Income Funds (2006-present) and serves as a Trustee of other Fidelity funds (2013-present). Mr. Lautenbach currently serves as the Lead Director of the Eaton Corporation Board of Directors (diversified industrial, 1997-present). Mr. Lautenbach is Chairman of the Board of Directors of the Philharmonic Center for the Arts in Naples, Florida (2012-present) and a member of the Council on Foreign Relations (1994-present). Previously, Mr. Lautenbach was a Partner/Advisory Partner at Clayton, Dubilier & Rice, LLC (private equity investment, 1998-2010), as well as a Director of Sony Corporation (2006-2007). |
Joseph Mauriello (1944) |
| Year of Election or Appointment: 2008 Prior to his retirement in January 2006, Mr. Mauriello served in numerous senior management positions including Deputy Chairman and Chief Operating Officer (2004-2005), and Vice Chairman of Financial Services (2002-2004) of KPMG LLP US (professional services, 1965-2005). Mr. Mauriello currently serves as a member of the Board of Directors of XL Group plc. (global insurance and re-insurance, 2006-present). Previously, Mr. Mauriello served as a Director of the Hamilton Funds of the Bank of New York (2006-2007) and of Arcadia Resources Inc. (health care services and products, 2007-2012). |
Robert W. Selander (1950) |
| Year of Election or Appointment: 2011 Previously, Mr. Selander served as a Member of the Advisory Board of Fidelity's Equity and High Income Funds (2011), Executive Vice Chairman (2010), Chief Executive Officer (2009-2010), and President and Chief Executive Officer (1997-2009) of Mastercard, Inc. |
Cornelia M. Small (1944) |
| Year of Election or Appointment: 2005 Ms. Small is a member of the Board of Directors (2009-present) and Chair of the Investment Committee (2010-present) of the Teagle Foundation. Ms. Small also serves on the Investment Committee of the Berkshire Taconic Community Foundation (2008-present). Previously, Ms. Small served as Chairperson (2002-2008) and a member of the Investment Committee and Chairperson (2008-2012) and a member of the Board of Trustees of Smith College. In addition, Ms. Small served as Chief Investment Officer, Director of Global Equity Investments, and a member of the Board of Directors of Scudder, Stevens & Clark and Scudder Kemper Investments. |
William S. Stavropoulos (1939) |
| Year of Election or Appointment: 2002 Mr. Stavropoulos is Vice Chairman of the Independent Trustees of the Equity and High Income Funds (2006-present) and serves as a Trustee of other Fidelity funds (2013-present). Mr. Stavropoulos serves as President and Founder of the Michigan Baseball Foundation, the Great Lakes Loons (2007-present). Mr. Stavropoulos is Chairman Emeritus of the Board of Directors of The Dow Chemical Company, where he previously served in numerous senior management positions, including President, CEO (1995-2000; 2002-2004), Chairman of the Executive Committee (2000-2006), and as a member of the Board of Directors (1990-2006). Currently, Mr. Stavropoulos is Chairman of the Board of Directors of Univar Inc. (global distributor of commodity and specialty chemicals), a Director of Teradata Corporation (data warehousing and technology solutions), and Maersk Inc. (industrial conglomerate), and a member of the Advisory Board for Metalmark Capital LLC (private equity investment, 2005-present). Mr. Stavropoulos is an operating advisor to Clayton, Dubilier & Rice, LLC (private equity investment). In addition, Mr. Stavropoulos is a member of the University of Notre Dame Advisory Council for the College of Science, a Trustee of the Rollin L. Gerstacker Foundation, and a Director of the Naples Philharmonic Center for the Arts. Previously, Mr. Stavropoulos served as a Director of Chemical Financial Corporation (bank holding company, 1993-2012) and Tyco International, Ltd. (multinational manufacturing and services, 2007-2012). |
David M. Thomas (1949) |
| Year of Election or Appointment: 2008 Previously, Mr. Thomas served as Executive Chairman (2005-2006) and Chairman and Chief Executive Officer (2000-2005) of IMS Health, Inc. (pharmaceutical and healthcare information solutions), and a Director of Fortune Brands, Inc. (consumer products, 2000-2011). In addition, Mr. Thomas serves as Non-Executive Chairman of the Board of Directors of Fortune Brands Home and Security (home and security products, 2011-present), and as a member of the Board of Directors of Interpublic Group of Companies, Inc. (marketing communication, 2004-present). |
+ The information above includes each Trustee's principal occupation during the last five years and other information relating to the experience, attributes, and skills relevant to each Trustee's qualifications to serve as a Trustee, which led to the conclusion that each Trustee should serve as a Trustee for each fund.
Annual Report
Advisory Board Member and Executive Officers:
Correspondence intended for each executive officer and Peter S. Lynch may be sent to Fidelity Investments, 245 Summer Street, Boston, Massachusetts 02210.
Name, Year of Birth; Principal Occupation |
Peter S. Lynch (1944) |
| Year of Election or Appointment: 2003 Member of the Advisory Board of Fidelity's Equity and High Income Funds. Mr. Lynch is Vice Chairman and a Director of FMR and FMR Co., Inc. In addition, Mr. Lynch serves as a Trustee of Boston College and as the Chairman of the Inner-City Scholarship Fund. Previously, Mr. Lynch served on the Special Olympics International Board of Directors (1997-2006). |
Kenneth B. Robins (1969) |
| Year of Election or Appointment: 2008 President and Treasurer of Fidelity's Equity and High Income Funds. Mr. Robins also serves as President and Treasurer (2008-present) and Assistant Treasurer (2009-present) of other Fidelity funds and is an employee of Fidelity Investments (2004-present). Mr. Robins serves as Executive Vice President of Fidelity Investments Money Management, Inc. (FIMM) (2013-present). Previously, Mr. Robins served as Deputy Treasurer of the Fidelity funds (2005-2008) and Treasurer and Chief Financial Officer of The North Carolina Capital Management Trust: Cash and Term Portfolios (2006-2008). |
Bruce T. Herring (1965) |
| Year of Election or Appointment: 2006 Vice President of certain Equity Funds. Mr. Herring also serves as Vice President of other Fidelity funds (2013-present), Chief Investment Officer of Fidelity Global Asset Allocation (GAA) (2013-present), Chief Investment Officer and Director of Fidelity Management & Research (U.K.) Inc. (2010-present), Group Chief Investment Officer of FMR, and President of Fidelity Research & Analysis Company (2010-present). Previously, Mr. Herring served as Vice President (2005-2006) and Senior Vice President (2006-2007) of Fidelity Management & Research Company, Vice President of FMR Co., Inc. (2001-2007) and as a portfolio manager for Fidelity U.S. Equity Funds. |
Brian B. Hogan (1964) |
| Year of Election or Appointment: 2009 Vice President of Equity and High Income Funds. Mr. Hogan also serves as Vice President of other Fidelity funds (2009-present) and President of FMR's Equity Division (2009-present). Previously, Mr. Hogan served as Senior Vice President, Equity Research of FMR (2006-2009) and as a portfolio manager. |
Scott C. Goebel (1968) |
| Year of Election or Appointment: 2008 Secretary and Chief Legal Officer (CLO) of the Fidelity funds. Mr. Goebel also serves as Secretary of Fidelity Investments Money Management, Inc. (FIMM) (2010-present) and Fidelity Research and Analysis Company (FRAC) (2010-present); Secretary and CLO of The North Carolina Capital Management Trust: Cash and Term Portfolios (2008-present); General Counsel, Secretary, and Senior Vice President of FMR (2008-present) and FMR Co., Inc. (2008-present); employed by FMR LLC or an affiliate (2001-present); Chief Legal Officer of Fidelity Management & Research (Hong Kong) Limited (2008-present) and Assistant Secretary of Fidelity Management & Research (Japan) Inc. (2008-present), and Fidelity Management & Research (U.K.) Inc. (2008-present). Previously, Mr. Goebel served as Assistant Secretary of FIMM (2008-2010), FRAC (2008-2010), and the Funds (2007-2008) and as Vice President and Secretary of Fidelity Distributors Corporation (FDC) (2005-2007). |
William C. Coffey (1969) |
| Year of Election or Appointment: 2009 Assistant Secretary of Fidelity's Equity and High Income Funds. Mr. Coffey also serves as Assistant Secretary of other Fidelity funds (2009-present), Senior Vice President and Deputy General Counsel of FMR LLC (2010-present), and is an employee of Fidelity Investments. Previously, Mr. Coffey served as Vice President and Associate General Counsel of FMR LLC (2005-2009). |
Elizabeth Paige Baumann (1968) |
| Year of Election or Appointment: 2012 Anti-Money Laundering (AML) Officer of the Fidelity funds. Ms. Baumann also serves as AML Officer of The North Carolina Capital Management Trust: Cash and Term Portfolios (2012-present), Chief AML Officer of FMR LLC (2012-present), and is an employee of Fidelity Investments. Previously, Ms. Baumann served as Vice President and Deputy Anti-Money Laundering Officer (2007-2012). |
Christine Reynolds (1958) |
| Year of Election or Appointment: 2008 Chief Financial Officer of the Fidelity funds. Ms. Reynolds became President of Fidelity Pricing and Cash Management Services (FPCMS) in August 2008. Ms. Reynolds served as Chief Operating Officer of FPCMS (2007-2008). Previously, Ms. Reynolds served as President, Treasurer, and Anti-Money Laundering officer of the Fidelity funds (2004-2007). |
Joseph A. Hanlon (1968) |
| Year of Election or Appointment: 2012 Chief Compliance Officer of Fidelity's Equity and High Income Funds. Mr. Hanlon also serves as Chief Compliance Officer of other Fidelity funds (2012-present). Mr. Hanlon serves as Compliance Officer of FMR, FMR Co., Inc., Fidelity Investments Money Management, Inc. (FIMM), Fidelity Research and Analysis Company (FRAC), and Fidelity Management & Research (Hong Kong) (2009-present), as Senior Vice President of the Fidelity Asset Management Division (2009-present), and is an employee of Fidelity Investments. Previously, Mr. Hanlon served as Compliance Officer of Fidelity Management & Research (Japan) Inc. (2009-2013), Strategic Advisers, Inc. (2009-2013), and Fidelity Management & Research (U.K.) Inc. (2009-2013). |
Joseph F. Zambello (1957) |
| Year of Election or Appointment: 2011 Deputy Treasurer of the Fidelity funds. Mr. Zambello is an employee of Fidelity Investments. Previously, Mr. Zambello served as Vice President of FMR's Program Management Group (2009-2011) and Vice President of the Transfer Agent Oversight Group (2005-2009). |
Adrien E. Deberghes (1967) |
| Year of Election or Appointment: 2008 Deputy Treasurer of Fidelity's Equity and High Income Funds. Mr. Deberghes also serves as Vice President (2011-present), Deputy Treasurer (2008-present), and Assistant Treasurer (2010-present) of other Fidelity funds, and is an employee of Fidelity Investments (2008-present). Previously, Mr. Deberghes served as Senior Vice President of Mutual Fund Administration at State Street Corporation (2007-2008), Senior Director of Mutual Fund Administration at Investors Bank & Trust (2005-2007), and Director of Finance for Dunkin' Brands (2000-2005). |
Stephen Sadoski (1971) |
| Year of Election or Appointment: 2012 Deputy Treasurer of Fidelity's Equity and High Income Funds. Mr. Sadoski also serves as Deputy Treasurer of other Fidelity funds (2012-present) and is an employee of Fidelity Investments (2012-present). Previously, Mr. Sadoski served as Assistant Treasurer of Fidelity's Fixed Income and Asset Allocation Funds (2012-2013), an assistant chief accountant in the Division of Investment Management of the Securities and Exchange Commission (SEC) (2009-2012) and as a senior manager at Deloitte & Touche LLP (1997-2009). |
Stacie M. Smith (1974) |
| Year of Election or Appointment: 2013 Deputy Treasurer of Fidelity's Equity and High Income Funds. Ms. Smith also serves as Deputy Treasurer of other Fidelity funds (2013-present) and is an employee of Fidelity Investments (2009-present). Previously, Ms. Smith served as Senior Audit Manager of Ernst & Young LLP (1996-2009). |
Stephanie J. Dorsey (1969) |
| Year of Election or Appointment: 2010 Assistant Treasurer of Fidelity's Equity and High Income Funds. Ms. Dorsey also serves as President and Treasurer (2013-present) and Assistant Treasurer (2010-present) of other Fidelity funds, Treasurer and Chief Financial Officer of The North Carolina Capital Management Trust: Cash and Term Portfolios (2013-present), and is an employee of Fidelity Investments (2008-present). Previously, Ms. Dorsey served as Deputy Treasurer of Fidelity's Fixed Income and Asset Allocation Funds (2008-2013), Treasurer (2004-2008) of the JPMorgan Mutual Funds and Vice President (2004-2008) of JPMorgan Chase Bank. |
Gary W. Ryan (1958) |
| Year of Election or Appointment: 2005 Assistant Treasurer of the Fidelity funds. Mr. Ryan is an employee of Fidelity Investments. Previously, Mr. Ryan served as Vice President of Fund Reporting in Fidelity Pricing and Cash Management Services (FPCMS) (1999-2005). |
Jonathan Davis (1968) |
| Year of Election or Appointment: 2010 Assistant Treasurer of the Fidelity funds. Mr. Davis is also Assistant Treasurer of Fidelity Rutland Square Trust II and Fidelity Commonwealth Trust II. Mr. Davis is an employee of Fidelity Investments. Previously, Mr. Davis served as Vice President and Associate General Counsel of FMR LLC (2003-2010). |
Annual Report
The Board of Trustees of Fidelity Blue Chip Growth Fund voted to pay on September 09, 2013, to shareholders of record at the opening of business on September 06, 2013, a distribution of $3.176 per share derived from capital gains realized from sales of portfolio securities; and a dividend of $0.148 per share from net investment income.
Blue Chip Growth hereby designates as a capital gain dividend with respect to the taxable year ended July 31, 2013, $1,227,651,246, or, if subsequently determined to be different, the net capital gain of such year.
Blue Chip Growth designates 100% of the dividends distributed during the fiscal year as qualifying for the dividends-received deduction for corporate shareholders.
Blue Chip Growth designates 100% of the dividends distributed during the fiscal year as amounts which can be taken into account as a dividend for the purposes of the maximum rate under section 1(h)(11) of the Internal Revenue Code.
The fund will notify shareholders in January 2014 of amounts for use in preparing 2013 income tax returns.
Annual Report
Board Approval of Investment Advisory Contracts and Management Fees
Fidelity Blue Chip Growth Fund
Each year, the Board of Trustees, including the Independent Trustees (together, the Board), votes on the renewal of the management contract and sub-advisory agreements (together, the Advisory Contracts) for the fund. The Board, assisted by the advice of fund counsel and Independent Trustees' counsel, requests and considers a broad range of information relevant to the renewal of the Advisory Contracts throughout the year.
The Board meets regularly and, at each of its meetings, covers an extensive agenda of topics and materials and considers factors that are relevant to its annual consideration of the renewal of the fund's Advisory Contracts, including the services and support provided to the fund and its shareholders. The Board has established various standing committees, each composed of and chaired by Independent Trustees with varying backgrounds, to which the Board has assigned specific subject matter responsibilities in order to enhance effective decision-making by the Board. The Board, acting directly and through its Committees, requests and receives information concerning the annual consideration of the renewal of the fund's Advisory Contracts. The Board also meets as needed to consider matters specifically related to the Board's annual consideration of the renewal of Advisory Contracts. Members of the Board may also meet with trustees of other Fidelity funds through ad hoc joint committees to discuss certain matters relevant to the Fidelity funds.
At its July 2013 meeting, the Board, including the Independent Trustees, unanimously determined to renew the fund's Advisory Contracts. In reaching its determination, the Board considered all factors it believed relevant, including (i) the nature, extent, and quality of the services to be provided to the fund and its shareholders (including the investment performance of the fund); (ii) the competitiveness of the fund's management fee and total expense ratio relative to peer funds; (iii) the total costs of the services to be provided by and the profits to be realized by Fidelity from its relationship with the fund; (iv) the extent to which economies of scale exist and would be realized as the fund grows; and (v) whether fee levels reflect these economies of scale, if any, for the benefit of fund shareholders.
In considering whether to renew the Advisory Contracts for the fund, the Board reached a determination, with the assistance of fund counsel and Independent Trustees' counsel and through the exercise of its business judgment, that the renewal of the Advisory Contracts was in the best interests of the fund and its shareholders and that the compensation payable under the Advisory Contracts was fair and reasonable. The Board's decision to renew the Advisory Contracts was not based on any single factor, but rather was based on a comprehensive consideration of all the information provided to the Board at its meetings throughout the year. The Board, in reaching its determination to renew the Advisory Contracts, was aware that shareholders in the fund have a broad range of investment choices available to them, including a wide choice among mutual funds offered by Fidelity's competitors, and that the fund's shareholders, who have the opportunity to review and weigh the disclosure provided by the fund in its prospectus and other public disclosures, have chosen to invest in this fund, which is a part of the Fidelity family of funds.
Annual Report
Nature, Extent, and Quality of Services Provided. The Board considered the staffing within the investment adviser, Fidelity Management & Research Company (FMR), and the sub-advisers (together, the Investment Advisers) as it relates to the fund, including the backgrounds of the fund's investment personnel, and also considered the fund's investment objective, strategies, and related investment philosophy. The Independent Trustees also had discussions with senior management of Fidelity's investment operations and investment groups. The Board considered the structure of the portfolio manager compensation program and whether this structure provides appropriate incentives to act in the best interests of the fund.
Resources Dedicated to Investment Management and Support Services. The Board and the Fund Oversight and Research Committees reviewed the general qualifications and capabilities of the Investment Advisers' investment staff, including its size, education, experience, and resources, as well as the Investment Advisers' approach to recruiting, training, managing, and compensating investment personnel. The Board noted that FMR has continued to increase the resources devoted to non-U.S. offices, including expansion of Fidelity's global investment organization. The Board also noted that Fidelity's analysts have extensive resources, tools and capabilities that allow them to conduct sophisticated quantitative and fundamental analysis, as well as credit analysis of issuers, counterparties and guarantors. Further, the Board believes that Fidelity's investment professionals have sufficient access to global information and data so as to provide competitive investment results over time, and that those professionals also have access to sophisticated tools that permit them to assess portfolio construction and risk and performance attribution characteristics continuously, as well as to transmit new information and research conclusions rapidly around the world. Additionally, in its deliberations, the Board considered the Investment Advisers' trading and risk management capabilities and resources, which are an integral part of the investment management process.
Shareholder and Administrative Services. The Board considered (i) the nature, extent, quality, and cost of advisory, administrative, and shareholder services performed by the Investment Advisers and their affiliates under the Advisory Contracts and under separate agreements covering transfer agency, pricing and bookkeeping, and securities lending services for the fund; (ii) the nature and extent of the supervision of third party service providers, principally custodians and subcustodians; and (iii) the resources devoted to, and the record of compliance with, the fund's compliance policies and procedures. The Board also reviewed the allocation of fund brokerage, including allocations to brokers affiliated with the Investment Advisers, the use of brokerage commissions to pay fund expenses, and the use of "soft" commission dollars to pay for research services.
Annual Report
Board Approval of Investment Advisory Contracts and
Management Fees - continued
The Board noted that the growth of fund assets over time across the complex allows Fidelity to reinvest in the development of services designed to enhance the value or convenience of the Fidelity funds as investment vehicles. These services include 24-hour access to account information and market information through telephone representatives and over the Internet, investor education materials and asset allocation tools, and the expanded availability of Fidelity Investor Centers.
Investment in a Large Fund Family. The Board considered the benefits to shareholders of investing in a Fidelity fund, including the benefits of investing in a fund that is part of a large family of funds offering a variety of investment disciplines and providing a large variety of mutual fund investor services. The Board noted that Fidelity had taken, or had made recommendations that resulted in the Fidelity funds taking, a number of actions over the previous year that benefited particular funds, including (i) continuing to dedicate additional resources to investment research and to the support of the senior management team that oversees asset management; (ii) persisting in efforts to enhance Fidelity's global research capabilities; (iii) launching new funds and making other enhancements to meet client needs for global and income-oriented solutions; (iv) continuing to launch dedicated lower cost underlying funds to meet portfolio construction needs related to expanding underlying fund options for Fidelity funds of funds, specifically for the Freedom Fund product lines; (v) rationalizing product lines and gaining increased efficiencies through the mergers of several funds into other funds; (vi) strengthening Fidelity's index fund offerings by reducing investment minimums and adopting or lowering existing expense caps for certain funds and classes; (vii) enhancing Global Asset Allocation product offerings by launching new funds and strategies, including "open architecture" target date funds that utilize affiliated and unaffiliated sub-advisers; (viii) modifying the eligibility criteria for Institutional Class shares of Advisor funds to increase their marketability to a portion of the defined contribution plan market; (ix) creating a new low-cost retirement share class for certain Advisor funds to appeal to large retirement plans; (x) transitioning the management of certain Fidelity commodity funds to Geode Capital Management LLC, a registered commodity pool operator, while retaining administrative responsibilities for the funds; (xi) reorganizing a number of funds; and (xii) taking steps toward establishing a new Fidelity adviser to manage sector-based funds and products.
Investment Performance. The Board considered whether the fund has operated in accordance with its investment objective, as well as its record of compliance with its investment restrictions and its performance history.
The Board took into account discussions with the Investment Advisers about fund investment performance that occur at Board meetings throughout the year. In this regard the Board noted that as part of regularly scheduled fund reviews and other reports to the Board on fund performance, the Board periodically considers annualized return information for the fund, for different time periods, measured against a securities market index ("benchmark index") and a peer group of mutual funds with similar objectives ("peer group"). In its evaluation of fund investment performance, the Board gave particular attention to information indicating changes in performance of certain Fidelity funds for specific time periods and the Investment Advisers' explanations for any overperformance or underperformance.
Annual Report
In addition to reviewing absolute and relative fund performance, the Independent Trustees periodically consider the appropriateness of fund performance metrics in evaluating the results achieved. In general, the Independent Trustees believe that fund performance should be evaluated based on net performance (after fees and expenses) of both the highest performing and lowest performing classes, where applicable, compared to appropriate benchmark indices, over appropriate time periods which may include full market cycles, and compared to peer groups, as applicable, over the same periods, taking into account relevant factors including the following: general market conditions; issuer-specific information; tactical opportunities for investment; and fund cash flows and other factors.
The Independent Trustees recognize that shareholders evaluate performance on a net basis over their own holding periods, for which one-, three-, and five-year periods are used as a proxy. For this reason, the performance information reviewed by the Board also included net cumulative calendar year total return information for the fund and an appropriate benchmark index and peer group for the most recent one-, three-, and five-year periods, as shown below. Returns are shown compared to the 25th percentile (top of box) and 75th percentile (bottom of box) of the peer universe.
Fidelity Blue Chip Growth Fund

Annual Report
Board Approval of Investment Advisory Contracts and
Management Fees - continued
The Board also considered that the fund's management fee is subject to upward or downward adjustment depending upon whether, and to what extent, the fund's investment performance for the performance period exceeds, or is exceeded by, a securities index, thus leading to a performance adjustment for the same period. The Board noted that the performance adjustment provides FMR with a strong economic incentive to seek to achieve superior performance for the fund's shareholders and helps to more closely align the interests of FMR and the fund's shareholders.
Based on its review, the Board concluded that the nature, extent, and quality of services provided to the fund under the Advisory Contracts should benefit the fund's shareholders.
Competitiveness of Management Fee and Total Expense Ratio. The Board considered the fund's management fee and total expense ratio compared to "mapped groups" of competitive funds and classes. Fidelity creates "mapped groups" by combining similar Lipper investment objective categories that have comparable management fee characteristics. Combining Lipper investment objective categories aids the Board's management fee and total expense ratio comparisons by broadening the competitive group used for comparison and by reducing the number of universes to which various Fidelity funds are compared.
Management Fee. The Board considered two proprietary management fee comparisons for the 12-month periods shown in the chart below. The group of Lipper funds used by the Board for management fee comparisons is referred to below as the "Total Mapped Group." The Total Mapped Group comparison focuses on a fund's standing in terms of gross management fees before expense reimbursements or caps, and without giving effect to the fund's performance adjustment, relative to the total universe of funds with comparable investment mandates, regardless of whether their management fee structures also are comparable. Funds with comparable investment mandates offer exposure to similar types of securities. Funds with comparable management fee structures have similar management fee contractual arrangements (e.g., flat rate charged for advisory services, all-inclusive fee rate, etc.). "TMG %" represents the percentage of funds in the Total Mapped Group that had management fees that were lower than the fund's. For example, a TMG % of 11% means that 89% of the funds in the Total Mapped Group had higher management fees than the fund. The "Asset-Size Peer Group" (ASPG) comparison focuses on a fund's standing relative to a subset of non-Fidelity funds within the Total Mapped Group that are similar in size and management fee structure. The ASPG represents at least 15% of the funds in the Total Mapped Group with comparable asset size and management fee structures, subject to a minimum of 50 funds (or all funds in the Total Mapped Group if fewer than 50). Additional information, such as the ASPG quartile in which the fund's management fee ranked and the impact of the fund's performance adjustment, is also included in the chart and considered by the Board.
Annual Report
Fidelity Blue Chip Growth Fund

The Board noted that the fund's management fee ranked below the median of its Total Mapped Group and below the median of its ASPG for 2012. The Board also noted the effect of the fund's positive performance adjustment on the fund's management fee ranking.
Furthermore, the Board considered that shareholders approved a prospective change in the index used to calculate the fund's performance adjustment beginning June 1, 2006. The Board also considered that, because the performance adjustment is based on a rolling 36-month measurement period, during a transition period the fund's performance is compared to a blended index return that reflects the performance of the former index for the portion of the measurement period prior to June 1, 2006 and the performance of the current index for the remainder of the measurement period. The Board noted that the fund's performance adjustments for 2008 and 2009 shown in the chart above reflect the effect of using the blended index return to calculate the fund's performance adjustment.
Based on its review, the Board concluded that the fund's management fee is fair and reasonable in light of the services that the fund receives and the other factors considered.
Total Expense Ratio. In its review of each class's total expense ratio, the Board considered the fund's management fee as well as other fund or class expenses, as applicable, such as transfer agent fees, pricing and bookkeeping fees, and custodial, legal, and audit fees. The Board also noted the effects of any waivers and reimbursements on fees and expenses, as well as the impact of the fund's performance adjustment. As part of its review, the Board also considered the current and historical total expense ratios of each class of the fund compared to competitive fund median expenses. Each class of the fund is compared to those funds and classes in the Total Mapped Group (used by the Board for management fee comparisons) that have a similar sales load structure.
Annual Report
Board Approval of Investment Advisory Contracts and
Management Fees - continued
The Board noted that the total expense ratio of each class ranked below its competitive median for 2012.
Fees Charged to Other Fidelity Clients. The Board also considered Fidelity fee structures and other information with respect to clients of FMR and its affiliates, such as other mutual funds advised or subadvised by FMR or its affiliates, pension plan clients, and other institutional clients. The Board noted the findings of the 2013 ad hoc joint committee (created with the board of other Fidelity funds), which reviewed and compared Fidelity's institutional investment advisory business with its business of providing services to the Fidelity funds, including the differences in services provided, fees charged, and costs incurred, as well as competition in their respective marketplaces.
Based on its review of total expense ratios and fees charged to other Fidelity clients, the Board concluded that the total expense ratio of each class of the fund was reasonable in light of the services that the fund and its shareholders receive and the other factors considered.
Costs of the Services and Profitability. The Board considered the revenues earned and the expenses incurred by Fidelity in conducting the business of developing, marketing, distributing, managing, administering and servicing the fund and servicing the fund's shareholders. The Board also considered the level of Fidelity's profits in respect of all the Fidelity funds.
On an annual basis, FMR presents to the Board Fidelity's profitability for the fund. Fidelity calculates the profitability for each fund, as well as aggregate profitability for groups of Fidelity funds and all Fidelity funds, using a series of detailed revenue and cost allocation methodologies which originate with the books and records of Fidelity on which Fidelity's audited financial statements are based. The Audit Committee of the Board reviews any significant changes from the prior year's methodologies.
PricewaterhouseCoopers LLP (PwC), independent registered public accounting firm and auditor to Fidelity and certain Fidelity funds, has been engaged annually by the Board as part of the Board's assessment of Fidelity's profitability analysis. PwC's engagement includes the review and assessment of the methodologies used by Fidelity in determining the revenues and expenses attributable to Fidelity's mutual fund business, and completion of agreed-upon procedures surrounding the mathematical accuracy of fund profitability and its conformity to allocation methodologies. After considering PwC's reports issued under the engagement and information provided by Fidelity, the Board concluded that while other allocation methods may also be reasonable, Fidelity's profitability methodologies are reasonable in all material respects.
Annual Report
The Board also reviewed Fidelity's non-fund businesses and fall-out benefits related to the mutual fund business as well as cases where Fidelity's affiliates may benefit from or be related to the fund's business.
The Board considered the costs of the services provided by and the profits realized by Fidelity in connection with the operation of the fund and was satisfied that the profitability was not excessive in the circumstances.
Economies of Scale. The Board considered whether there have been economies of scale in respect of the management of the Fidelity funds, whether the Fidelity funds (including the fund) have appropriately benefited from any such economies of scale, and whether there is potential for realization of any further economies of scale. The Board considered the extent to which the fund will benefit from economies of scale through increased services to the fund, through waivers or reimbursements, or through fee or expense reductions. The Board also noted that in 2009, it and the board of other Fidelity funds created an ad hoc committee (the Economies of Scale Committee) to analyze whether FMR attains economies of scale in respect of the management and servicing of the Fidelity funds, whether the Fidelity funds have appropriately benefited from such economies of scale, and whether there is potential for realization of any further economies of scale.
The Board recognized that the fund's management contract incorporates a "group fee" structure, which provides for lower group fee rates as total fund assets under FMR's management increase, and for higher group fee rates as total fund assets under FMR's management decrease. FMR calculates the group fee rates based on a tiered asset "breakpoint" schedule that varies based on asset class. The Board considered that the group fee is designed to deliver the benefits of economies of scale to fund shareholders when total Fidelity fund assets increase, even if assets of any particular fund are unchanged or have declined, because some portion of Fidelity's costs are attributable to services provided to all Fidelity funds, and all funds benefit if those costs can be allocated among more assets. The Board concluded that, given the group fee structure, fund shareholders will benefit from lower management fees as assets under FMR's management increase at the fund complex level, regardless of whether Fidelity achieves any such economies of scale.
The Board concluded, taking into account the analysis of the Economies of Scale Committee, that economies of scale, if any, are being appropriately shared between fund shareholders and Fidelity.
Amendment to Description of Group Fee Rate. At its July 2013 meeting, the Board voted to approve an amendment to the fund's management contract to modify the description of the "group fee rate" effective August 1, 2013. The Board noted that under the prior description in the contract, the group fee rate was based on the average net assets of all registered investment companies with which FMR has management contracts. Under the contract's tiered asset breakpoint schedule, the group fee rate is lower as total fund assets under FMR's management increase, and higher as total fund assets under FMR's management decrease. The Board considered that the prior description would have excluded the assets of 64 Fidelity sector funds from the group fee rate calculation once Fidelity SelectCo, LLC, an affiliate of FMR, assumed management responsibilities for those funds. The Board noted that modifying the description of the group fee rate to continue to include the assets of those 64 funds for purposes of determining group fee rate breakpoints would avoid an immediate adverse impact on the group fee rate for any fund.
Annual Report
Board Approval of Investment Advisory Contracts and
Management Fees - continued
Additional Information Requested by the Board. In order to develop fully the factual basis for consideration of the Fidelity funds' Advisory Contracts, the Board requested and received additional information on certain topics, including: (i) fund performance trends and Fidelity's long-term strategies for certain funds; (ii) the potential to further rationalize the Fidelity fund lineup with the possibility of achieving savings for the funds and Fidelity; (iii) the methodology with respect to competitive fund data and peer group classifications; (iv) the arrangements with, and performance of, certain sub-advisers on behalf of the Fidelity funds, as well as certain proposed participating affiliate arrangements; (v) the realization of fall-out benefits in certain Fidelity business units; (vi) Fidelity's group fee structures, including the rationale for the individual fee rates of certain categories of funds and the definition of group assets; (vii) trends regarding industry use of performance fee structures and the performance adjustment methodologies applicable to the Fidelity funds; (viii) additional competitive analysis regarding the total expenses for certain classes; and (ix) fund profitability methodology, including Fidelity's cost allocation methodology, and the impact of certain factors on fund profitability results.
Based on its evaluation of all of the conclusions noted above, and after considering all factors it believed relevant, the Board ultimately concluded that the advisory fee structures are fair and reasonable, and that the fund's Advisory Contracts should be renewed.
Annual Report
Investment Adviser
Fidelity Management & Research Company
Boston, MA
Investment Sub-Advisers
FMR Co., Inc.
Fidelity Management & Research
(U.K.) Inc.
Fidelity Management & Research
(Hong Kong) Limited
Fidelity Management & Research
(Japan) Inc.
General Distributor
Fidelity Distributors Corporation
Smithfield, RI
Transfer and Service Agents
Fidelity Investments Institutional
Operations Company, Inc.
Boston, MA
Fidelity Service Company, Inc.
Boston, MA
Custodian
Citibank, N.A.
New York, NY
The Fidelity Telephone Connection
Mutual Fund 24-Hour Service
Exchanges/Redemptions
and Account Assistance 1-800-544-6666
Product Information 1-800-544-6666
Retirement Accounts 1-800-544-4774
(8 a.m. - 9 p.m.)
TDD Service 1-800-544-0118
for the deaf and hearing impaired
(9 a.m. - 9 p.m. Eastern time)
Fidelity Automated Service
Telephone (FAST®)
1-800-544-5555
Automated line for quickest service
(Fidelity Investment logo)(registered trademark)
Corporate Headquarters
245 Summer St., Boston, MA 02210
www.fidelity.com
BCF-UANN-0913
1.789244.110
Fidelity®
Blue Chip Growth
Fund -
Class F
Annual Report
July 31, 2013
(Fidelity Cover Art)
Contents
Performance | (Click Here) | How the fund has done over time. |
Management's Discussion of Fund Performance | (Click Here) | The Portfolio Manager's review of fund performance and strategy. |
Shareholder Expense Example | (Click Here) | An example of shareholder expenses. |
Investment Changes | (Click Here) | A summary of major shifts in the fund's investments over the past six months. |
Investments | (Click Here) | A complete list of the fund's investments with their market values. |
Financial Statements | (Click Here) | Statements of assets and liabilities, operations, and changes in net assets, as well as financial highlights. |
Notes | (Click Here) | Notes to the financial statements. |
Report of Independent Registered Public Accounting Firm | (Click Here) | |
Trustees and Officers | (Click Here) | |
Distributions | (Click Here) | |
Board Approval of Investment Advisory Contracts and Management Fees | (Click Here) | |
To view a fund's proxy voting guidelines and proxy voting record for the 12-month period ended June 30, visit http://www.fidelity.com/proxyvotingresults or visit the Securities and Exchange Commission's (SEC) web site at http://www.sec.gov. You may also call 1-800-835-5092 to request a free copy of the proxy voting guidelines.
Standard & Poor's, S&P and S&P 500 are registered service marks of The McGraw-Hill Companies, Inc. and have been licensed for use by Fidelity Distributors Corporation.
Other third-party marks appearing herein are the property of their respective owners.
All other marks appearing herein are registered or unregistered trademarks or service marks of FMR LLC or an affiliated company. © 2013 FMR LLC. All rights reserved.
Annual Report
This report and the financial statements contained herein are submitted for the general information of the shareholders of the fund. This report is not authorized for distribution to prospective investors in the fund unless preceded or accompanied by an effective prospectus.
A fund files its complete schedule of portfolio holdings with the SEC for the first and third quarters of each fiscal year on Form N-Q. Forms N-Q are available on the SEC's web site at http://www.sec.gov. A fund's Forms N-Q may be reviewed and copied at the SEC's Public Reference Room in Washington, DC. Information regarding the operation of the SEC's Public Reference Room may be obtained by calling 1-800-SEC-0330. For a complete list of a fund's portfolio holdings, view the most recent holdings listing, semiannual report, or annual report on Fidelity's web site at http://www.fidelity.com, http://www.advisor.fidelity.com, or http://www.401k.com, as applicable.
NOT FDIC INSURED • MAY LOSE VALUE • NO BANK GUARANTEE
Neither the fund nor Fidelity Distributors Corporation is a bank.
Annual Report
Average annual total return reflects the change in the value of an investment, assuming reinvestment of the class' distributions from dividend income and capital gains (the profits earned upon the sale of securities that have grown in value, if any) and assuming a constant rate of performance each year. The $10,000 table and the fund's returns do not reflect the deduction of taxes that a shareholder would pay on fund distributions or the redemption of fund shares. During periods of reimbursement by Fidelity, a fund's total return will be greater than it would be had the reimbursement not occurred. How a fund did yesterday is no guarantee of how it will do tomorrow.
Average Annual Total Returns
Periods ended July 31, 2013 | Past 1
year | Past 5
years | Past 10
years |
Class F A | 28.49% | 11.04% | 7.98% |
A The initial offering of Class F shares took place on June 26, 2009. Returns prior to June 26, 2009, are those of Fidelity® Blue Chip Growth Fund, the original class of the fund.
$10,000 Over 10 Years
Let's say hypothetically that $10,000 was invested in Fidelity® Blue Chip Growth Fund - Class F on July 31, 2003. The chart shows how the value of your investment would have changed, and also shows how the Russell 1000® Growth Index performed over the same period. The initial offering of Class F took place on June 26, 2009. See above for additional information regarding the performance of Class F.
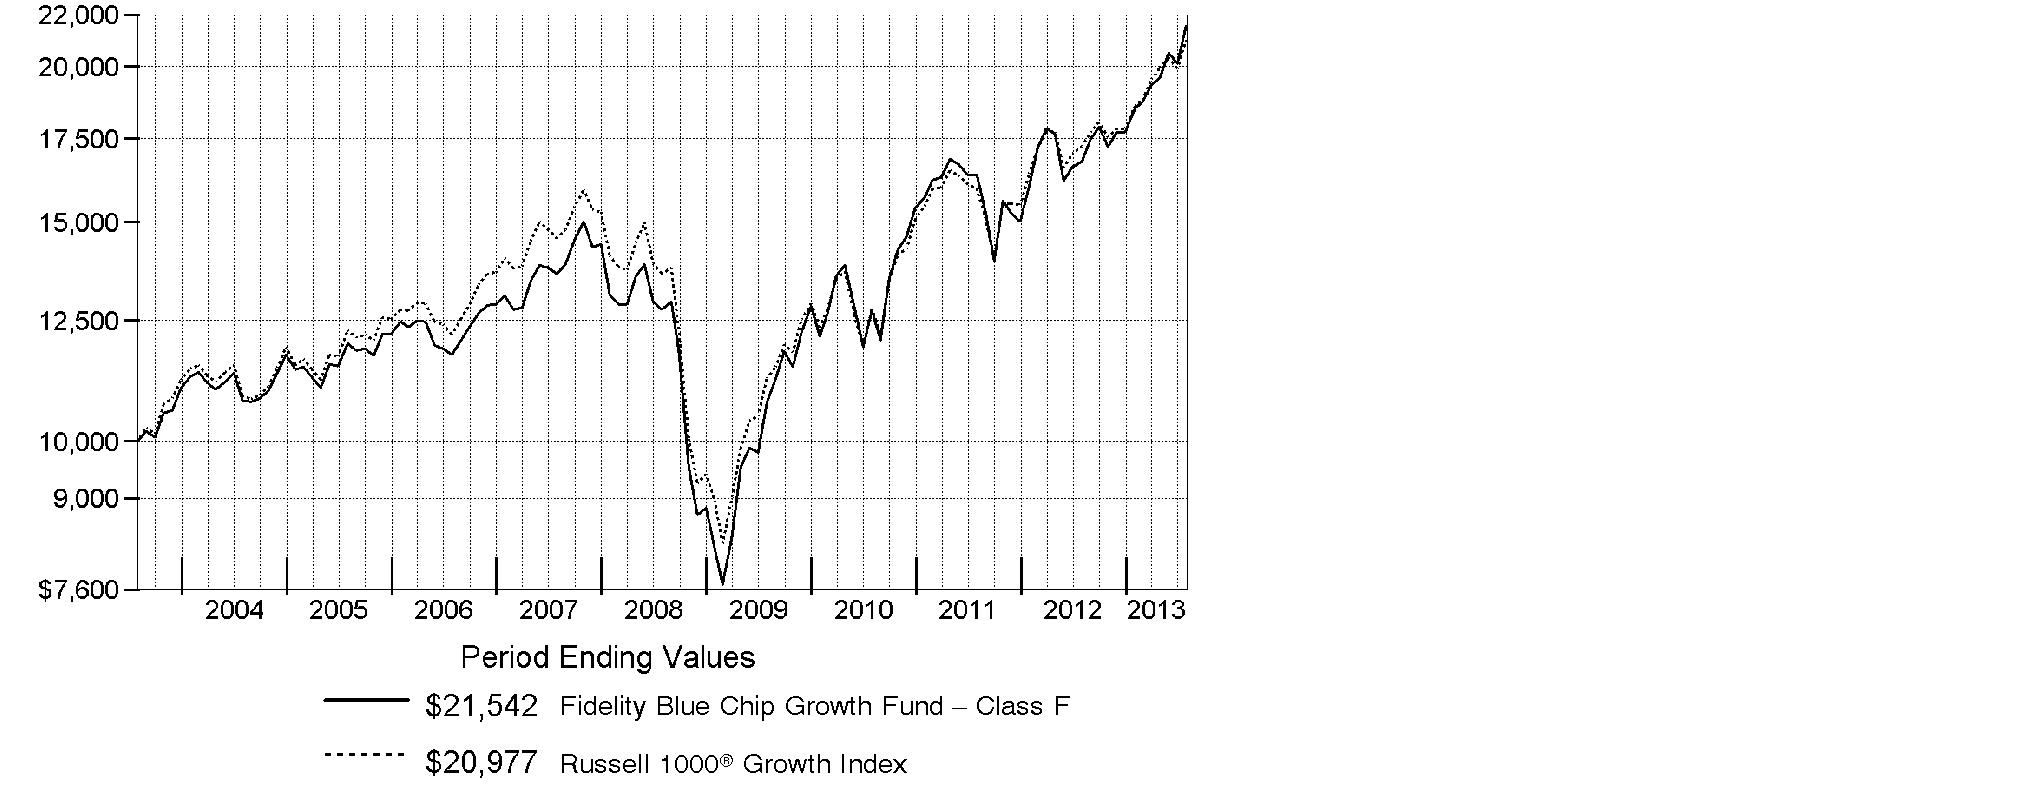
Annual Report
Market Recap: The bull run in U.S. stocks comfortably settled into a fifth year, as major equity benchmarks ripped through records during the 12 months ending July 31, 2013. Gains were fueled by a generally improving global economy and accommodative monetary policies worldwide. The tone was positive for most of the year, based largely on stronger U.S. economic data, including employment, housing and consumer sentiment. Setting a series of new highs along the way, the broad-based S&P 500® Index rose an impressive 25.00% for the 12 months, while the blue-chip-laden Dow Jones Industrial AverageSM also moved into record territory en route to a 22.36% gain. The growth-oriented Nasdaq Composite Index® had a similarly strong run, advancing 25.15%. During the year, markets were resilient amid intermittent volatility over debt woes in Europe, the 2012 U.S. presidential election and year-end Congressional gridlock over the federal budget. In mid-to-late June, concern arose about the U.S. Federal Reserve possibly tapering its sustaining bond-buying strategy - which prompted a brief, but steep, market sell-off. However, investors' continued quest for yield and the Fed's pledge to keep buying bonds until the economy showed significant improvement overpowered the uncertainty and helped equities climb notably higher in July to close the period on a strong note.
Comments from Sonu Kalra, Portfolio Manager of Fidelity® Blue Chip Growth Fund: For the year, the fund's Class F shares advanced 28.49%, compared with 21.64% for the Russell 1000® Growth Index. I'm focused on owning companies that can sustainably grow earnings by double digits over the long term, which paid off in a strong up market. Shares of automaker Tesla Motors soared when the company ramped up production faster than expected, helping the company move into profitability much earlier than investors anticipated. Another top relative contributor was Green Mountain Coffee Roasters. During the past year, a new CEO and an extension of the firm's partnership with Starbucks, helped sustain Green Mountain's growth rate, and the stock took off. On the flip side, an overweighting in Broadcom - a chipmaker in the wireless area - was the fund's biggest relative detractor this period. Most investors anticipated the company's next-generation wireless chip would launch in the next year, but production was delayed until late 2014, which hurt the stock. Apple was by far the largest absolute detractor and also hurt relative results. Shares of the tech giant declined after the firm delivered disappointing sales of its iPhone® 5 smartphone and competitors, such as Samsung Electronics, began to close the gap on their devices in terms of product features.
The views expressed above reflect those of the portfolio manager(s) only through the end of the period as stated on the cover of this report and do not necessarily represent the views of Fidelity or any other person in the Fidelity organization. Any such views are subject to change at any time based upon market or other conditions and Fidelity disclaims any responsibility to update such views. These views may not be relied on as investment advice and, because investment decisions for a Fidelity fund are based on numerous factors, may not be relied on as an indication of trading intent on behalf of any Fidelity fund.
Annual Report
Shareholder Expense Example
As a shareholder of the Fund, you incur two types of costs: (1) transaction costs, and (2) ongoing costs, including management fees and other Fund expenses. This Example is intended to help you understand your ongoing costs (in dollars) of investing in the Fund and to compare these costs with the ongoing costs of investing in other mutual funds.
The Example is based on an investment of $1,000 invested at the beginning of the period and held for the entire period (February 1, 2013 to July 31, 2013).
Actual Expenses
The first line of the accompanying table for each class of the Fund provides information about actual account values and actual expenses. You may use the information in this line, together with the amount you invested, to estimate the expenses that you paid over the period. Simply divide your account value by $1,000.00 (for example, an $8,600 account value divided by $1,000.00 = 8.6), then multiply the result by the number in the first line for a class of the Fund under the heading entitled "Expenses Paid During Period" to estimate the expenses you paid on your account during this period. A small balance maintenance fee of $12.00 that is charged once a year may apply for certain accounts with a value of less than $2,000. This fee is not included in the table below. If it was, the estimate of expenses you paid during the period would be higher, and your ending account value lower, by this amount. In addition, the Fund, as a shareholder in the underlying Fidelity Central Funds, will indirectly bear its pro-rata share of the fees and expenses incurred by the underlying Fidelity Central Funds. These fees and expenses are not included in the Fund's annualized expense ratio used to calculate the expense estimate in the table below.
Hypothetical Example for Comparison Purposes
The second line of the accompanying table for each class of the Fund provides information about hypothetical account values and hypothetical expenses based on a Class' actual expense ratio and an assumed rate of return of 5% per year before expenses, which is not the Class' actual return. The hypothetical account values and expenses may not be used to estimate the actual ending account balance or expenses you paid for the period. You may use this information to compare the ongoing costs of investing in the Fund and other funds. To do so, compare this 5% hypothetical example with the 5% hypothetical examples that appear in the shareholder reports of the other funds. A small balance maintenance fee of $12.00 that is charged once a year may apply for certain accounts with a value of less than $2,000. This fee is not included in the table below. If it was, the estimate of expenses you paid during the period would be higher, and your ending account value lower, by this amount. In addition, the Fund, as a shareholder in the underlying Fidelity Central Funds, will indirectly bear its pro-rata share of the fees and expenses incurred by the underlying Fidelity Central Funds. These fees and expenses are not included in the Fund's annualized expense ratio used to calculate the expense estimate in the table below.
Please note that the expenses shown in the table are meant to highlight your ongoing costs only and do not reflect any transaction costs. Therefore, the second line of the table is useful in comparing ongoing costs only, and will not help you determine the relative total costs of owning different funds.
Annual Report
| Annualized
Expense Ratio B | Beginning
Account Value
February 1, 2013 | Ending
Account Value
July 31, 2013 | Expenses Paid
During Period*
February 1, 2013
to July 31, 2013 |
Blue Chip Growth | .74% | | | |
Actual | | $ 1,000.00 | $ 1,164.40 | $ 3.97 |
HypotheticalA | | $ 1,000.00 | $ 1,021.12 | $ 3.71 |
Class K | .60% | | | |
Actual | | $ 1,000.00 | $ 1,165.00 | $ 3.22 |
HypotheticalA | | $ 1,000.00 | $ 1,021.82 | $ 3.01 |
Class F | .55% | | | |
Actual | | $ 1,000.00 | $ 1,165.40 | $ 2.95 |
HypotheticalA | | $ 1,000.00 | $ 1,022.07 | $ 2.76 |
A 5% return per year before expenses
B Annualized expense ratio reflects expenses net of applicable fee waivers.
* Expenses are equal to each Class' annualized expense ratio, multiplied by the average account value over the period, multiplied by 181/365 (to reflect the one-half year period).
Annual Report
Investment Changes (Unaudited)
Top Ten Stocks as of July 31, 2013 |
| % of fund's
net assets | % of fund's net assets
6 months ago |
Google, Inc. Class A | 5.1 | 5.9 |
Apple, Inc. | 4.1 | 5.9 |
Gilead Sciences, Inc. | 2.8 | 1.7 |
Home Depot, Inc. | 1.9 | 1.8 |
Amazon.com, Inc. | 1.8 | 2.1 |
QUALCOMM, Inc. | 1.6 | 2.0 |
Amgen, Inc. | 1.4 | 1.1 |
Visa, Inc. Class A | 1.4 | 1.3 |
Starbucks Corp. | 1.4 | 1.2 |
United Technologies Corp. | 1.4 | 1.3 |
| 22.9 | |
Top Five Market Sectors as of July 31, 2013 |
| % of fund's
net assets | % of fund's net assets
6 months ago |
Information Technology | 28.5 | 31.9 |
Consumer Discretionary | 23.0 | 20.9 |
Health Care | 14.7 | 10.5 |
Consumer Staples | 13.2 | 15.2 |
Industrials | 10.7 | 10.9 |
Asset Allocation (% of fund's net assets) |
As of July 31, 2013* | As of January 31, 2013** |
| Stocks 99.7% | | | Stocks 99.9% | |
| Short-Term
Investments and
Net Other Assets
(Liabilities) 0.3% | | | Short-Term
Investments and
Net Other Assets
(Liabilities) 0.1% | |
* Foreign investments | 8.4% | | ** Foreign investments | 9.5% | |

Annual Report
Investments July 31, 2013
Showing Percentage of Net Assets
Common Stocks - 99.3% |
| Shares | | Value (000s) |
CONSUMER DISCRETIONARY - 22.6% |
Auto Components - 0.2% |
Johnson Controls, Inc. | 909,800 | | $ 36,583 |
The Goodyear Tire & Rubber Co. (a) | 630,700 | | 11,668 |
| | 48,251 |
Automobiles - 1.4% |
Ford Motor Co. | 2,494,100 | | 42,100 |
General Motors Co. (a) | 815,900 | | 29,266 |
Tesla Motors, Inc. (a)(d) | 1,573,964 | | 211,352 |
| | 282,718 |
Distributors - 0.1% |
LKQ Corp. (a) | 945,500 | | 24,649 |
Diversified Consumer Services - 0.4% |
H&R Block, Inc. | 2,158,700 | | 67,848 |
Kroton Educacional SA | 1,180,000 | | 16,810 |
| | 84,658 |
Hotels, Restaurants & Leisure - 4.4% |
Alsea S.A.B. de CV | 2,981,200 | | 8,146 |
Buffalo Wild Wings, Inc. (a) | 331,100 | | 34,295 |
Chipotle Mexican Grill, Inc. (a) | 158,400 | | 65,304 |
Dunkin' Brands Group, Inc. | 773,500 | | 33,415 |
Fiesta Restaurant Group, Inc. (a) | 124,000 | | 3,912 |
Jubilant Foodworks Ltd. (a) | 288,917 | | 5,344 |
Las Vegas Sands Corp. | 2,356,700 | | 130,962 |
Noodles & Co. | 149,479 | | 6,483 |
Panera Bread Co. Class A (a) | 366,200 | | 61,174 |
Penn National Gaming, Inc. (a) | 550,300 | | 27,509 |
Starbucks Corp. | 3,987,600 | | 284,077 |
Starwood Hotels & Resorts Worldwide, Inc. | 561,000 | | 37,110 |
Whitbread PLC | 464,036 | | 22,801 |
Wyndham Worldwide Corp. | 491,627 | | 30,628 |
Yum! Brands, Inc. | 1,716,600 | | 125,174 |
| | 876,334 |
Household Durables - 0.4% |
Sony Corp. sponsored ADR | 722,700 | | 15,206 |
Whirlpool Corp. | 479,678 | | 64,248 |
| | 79,454 |
Internet & Catalog Retail - 2.9% |
Amazon.com, Inc. (a) | 1,195,900 | | 360,229 |
Common Stocks - continued |
| Shares | | Value (000s) |
CONSUMER DISCRETIONARY - continued |
Internet & Catalog Retail - continued |
Netflix, Inc. (a) | 148,800 | | $ 36,340 |
priceline.com, Inc. (a) | 201,800 | | 176,710 |
| | 573,279 |
Leisure Equipment & Products - 0.2% |
Mattel, Inc. | 985,200 | | 41,408 |
Media - 2.8% |
CBS Corp. Class B | 865,900 | | 45,754 |
Comcast Corp. Class A | 6,029,400 | | 271,805 |
DIRECTV (a) | 421,200 | | 26,649 |
DISH Network Corp. Class A | 376,000 | | 16,788 |
Fuji Media Holdings, Inc. | 2,000 | | 3,622 |
Sinclair Broadcast Group, Inc. Class A | 331,300 | | 9,346 |
Sirius XM Radio, Inc. | 2,254,100 | | 8,408 |
The Walt Disney Co. | 879,500 | | 56,860 |
Time Warner, Inc. | 625,000 | | 38,913 |
Twenty-First Century Fox, Inc. Class A | 3,000,500 | | 89,655 |
| | 567,800 |
Multiline Retail - 1.0% |
Dollar General Corp. (a) | 768,200 | | 41,997 |
Dollar Tree, Inc. (a) | 156,300 | | 8,385 |
Macy's, Inc. | 1,594,900 | | 77,097 |
Target Corp. | 975,200 | | 69,483 |
| | 196,962 |
Specialty Retail - 5.8% |
Abercrombie & Fitch Co. Class A | 1,806,400 | | 90,085 |
American Eagle Outfitters, Inc. | 1,599,600 | | 31,416 |
AutoZone, Inc. (a) | 33,000 | | 14,803 |
Best Buy Co., Inc. | 2,509,100 | | 75,499 |
CarMax, Inc. (a) | 258,900 | | 12,696 |
Home Depot, Inc. | 4,733,300 | | 374,073 |
L Brands, Inc. | 1,724,700 | | 96,187 |
Lowe's Companies, Inc. | 3,379,400 | | 150,654 |
Lumber Liquidators Holdings, Inc. (a) | 272,200 | | 26,354 |
Restoration Hardware Holdings, Inc. | 136,400 | | 9,114 |
Ross Stores, Inc. | 1,935,300 | | 130,575 |
TJX Companies, Inc. | 2,452,180 | | 127,611 |
Urban Outfitters, Inc. (a) | 883,800 | | 37,615 |
| | 1,176,682 |
Common Stocks - continued |
| Shares | | Value (000s) |
CONSUMER DISCRETIONARY - continued |
Textiles, Apparel & Luxury Goods - 3.0% |
Arezzo Industria e Comercio SA | 1,646,000 | | $ 25,671 |
Fifth & Pacific Companies, Inc. (a) | 1,228,600 | | 29,265 |
Fossil Group, Inc. (a) | 509,819 | | 56,029 |
lululemon athletica, Inc. (a) | 741,380 | | 51,578 |
Michael Kors Holdings Ltd. (a) | 2,024,237 | | 136,312 |
NIKE, Inc. Class B | 1,712,800 | | 107,769 |
Prada SpA | 1,995,500 | | 18,628 |
PVH Corp. | 763,900 | | 100,674 |
Ralph Lauren Corp. | 65,500 | | 11,925 |
Under Armour, Inc. Class A (sub. vtg.) (a)(d) | 902,700 | | 60,598 |
Wolverine World Wide, Inc. | 183,500 | | 10,553 |
| | 609,002 |
TOTAL CONSUMER DISCRETIONARY | | 4,561,197 |
CONSUMER STAPLES - 13.2% |
Beverages - 3.1% |
Anheuser-Busch InBev SA NV ADR | 695,000 | | 66,518 |
Beam, Inc. | 228,300 | | 14,837 |
Monster Beverage Corp. (a) | 1,360,600 | | 82,983 |
PepsiCo, Inc. | 2,227,300 | | 186,069 |
SABMiller PLC | 147,300 | | 7,217 |
The Coca-Cola Co. | 6,952,400 | | 278,652 |
| | 636,276 |
Food & Staples Retailing - 2.8% |
Costco Wholesale Corp. | 1,409,300 | | 165,297 |
CVS Caremark Corp. | 3,050,600 | | 187,581 |
Kroger Co. | 1,485,100 | | 58,320 |
Walgreen Co. | 1,341,000 | | 67,385 |
Whole Foods Market, Inc. | 1,590,200 | | 88,383 |
| | 566,966 |
Food Products - 3.0% |
Archer Daniels Midland Co. | 163,700 | | 5,970 |
Associated British Foods PLC | 592,900 | | 17,534 |
Bunge Ltd. | 483,600 | | 36,758 |
Danone SA | 658,200 | | 52,013 |
Green Mountain Coffee Roasters, Inc. (a)(d) | 3,513,464 | | 271,169 |
Kellogg Co. | 758,600 | | 50,250 |
Kraft Foods Group, Inc. | 536,900 | | 30,378 |
Mead Johnson Nutrition Co. Class A | 787,600 | | 57,369 |
Common Stocks - continued |
| Shares | | Value (000s) |
CONSUMER STAPLES - continued |
Food Products - continued |
Mondelez International, Inc. | 1,737,400 | | $ 54,328 |
Unilever NV (NY Reg.) | 620,500 | | 24,826 |
| | 600,595 |
Household Products - 1.6% |
Energizer Holdings, Inc. | 251,500 | | 25,603 |
Procter & Gamble Co. | 3,373,400 | | 270,884 |
Svenska Cellulosa AB (SCA) (B Shares) | 811,700 | | 21,481 |
| | 317,968 |
Personal Products - 0.6% |
Herbalife Ltd. | 1,778,391 | | 116,485 |
Tobacco - 2.1% |
Altria Group, Inc. | 1,693,800 | | 59,385 |
British American Tobacco PLC (United Kingdom) | 146,800 | | 7,831 |
Japan Tobacco, Inc. | 528,000 | | 18,470 |
Lorillard, Inc. | 1,866,000 | | 79,361 |
Philip Morris International, Inc. | 2,885,900 | | 257,365 |
| | 422,412 |
TOTAL CONSUMER STAPLES | | 2,660,702 |
ENERGY - 3.8% |
Energy Equipment & Services - 0.9% |
Cameron International Corp. (a) | 402,500 | | 23,868 |
Ensco PLC Class A | 557,500 | | 31,967 |
Halliburton Co. | 2,651,300 | | 119,812 |
National Oilwell Varco, Inc. | 164,100 | | 11,515 |
| | 187,162 |
Oil, Gas & Consumable Fuels - 2.9% |
Anadarko Petroleum Corp. | 1,352,100 | | 119,688 |
Apache Corp. | 204,500 | | 16,411 |
Cabot Oil & Gas Corp. | 277,300 | | 21,025 |
Canadian Natural Resources Ltd. | 1,495,600 | | 46,349 |
Cobalt International Energy, Inc. (a) | 654,900 | | 18,894 |
Continental Resources, Inc. (a) | 394,200 | | 36,385 |
EOG Resources, Inc. | 367,800 | | 53,511 |
EQT Corp. | 204,400 | | 17,681 |
Hess Corp. | 609,500 | | 45,383 |
Occidental Petroleum Corp. | 909,000 | | 80,946 |
Common Stocks - continued |
| Shares | | Value (000s) |
ENERGY - continued |
Oil, Gas & Consumable Fuels - continued |
Pioneer Natural Resources Co. | 626,800 | | $ 97,004 |
Western Gas Equity Partners LP | 594,900 | | 23,403 |
| | 576,680 |
TOTAL ENERGY | | 763,842 |
FINANCIALS - 4.0% |
Capital Markets - 0.9% |
BlackRock, Inc. Class A | 271,700 | | 76,609 |
Invesco Ltd. | 867,000 | | 27,909 |
Monex Group, Inc. | 50,266 | | 20,330 |
Morgan Stanley | 1,780,812 | | 48,456 |
State Street Corp. | 114,000 | | 7,942 |
Virtus Investment Partners, Inc. (a) | 44,000 | | 8,206 |
| | 189,452 |
Consumer Finance - 0.4% |
American Express Co. | 964,000 | | 71,114 |
Diversified Financial Services - 2.2% |
Bank of America Corp. | 6,660,300 | | 97,240 |
Citigroup, Inc. | 4,157,520 | | 216,773 |
CME Group, Inc. | 85,800 | | 6,347 |
IntercontinentalExchange, Inc. (a) | 45,300 | | 8,265 |
JPMorgan Chase & Co. | 2,181,100 | | 121,553 |
| | 450,178 |
Insurance - 0.3% |
Berkshire Hathaway, Inc. Class B (a) | 265,800 | | 30,798 |
MetLife, Inc. | 511,600 | | 24,772 |
| | 55,570 |
Real Estate Investment Trusts - 0.1% |
Simon Property Group, Inc. | 71,400 | | 11,428 |
Real Estate Management & Development - 0.1% |
Altisource Portfolio Solutions SA | 50,000 | | 6,166 |
Howard Hughes Corp. (a) | 80,200 | | 8,759 |
Parsvnath Developers Ltd. (a)(e) | 21,771,340 | | 10,232 |
| | 25,157 |
Thrifts & Mortgage Finance - 0.0% |
Housing Development Finance Corp. Ltd. (a) | 448,663 | | 5,901 |
TOTAL FINANCIALS | | 808,800 |
Common Stocks - continued |
| Shares | | Value (000s) |
HEALTH CARE - 14.7% |
Biotechnology - 8.9% |
Acorda Therapeutics, Inc. (a) | 116,000 | | $ 4,405 |
Agios Pharmaceuticals, Inc. | 145,017 | | 4,229 |
Alexion Pharmaceuticals, Inc. (a) | 700,000 | | 81,361 |
Alkermes PLC (a) | 1,017,100 | | 34,154 |
Alnylam Pharmaceuticals, Inc. (a) | 693,263 | | 32,008 |
Amgen, Inc. | 2,680,400 | | 290,261 |
ARIAD Pharmaceuticals, Inc. (a) | 1,781,860 | | 33,107 |
Biogen Idec, Inc. (a) | 1,125,700 | | 245,549 |
BioMarin Pharmaceutical, Inc. (a) | 288,700 | | 18,664 |
Bluebird Bio, Inc. | 122,116 | | 3,801 |
Celgene Corp. (a) | 614,700 | | 90,275 |
Clovis Oncology, Inc. (a) | 195,300 | | 15,210 |
CSL Ltd. | 66,241 | | 3,934 |
Exelixis, Inc. (a) | 3,668,800 | | 18,601 |
Gilead Sciences, Inc. (a) | 9,157,000 | | 562,698 |
Grifols SA (d) | 330,400 | | 13,938 |
Grifols SA: | | | |
ADR | 292,845 | | 9,295 |
Class B | 16,520 | | 529 |
Infinity Pharmaceuticals, Inc. (a) | 640,000 | | 13,555 |
InterMune, Inc. (a) | 2,356,200 | | 36,545 |
Ironwood Pharmaceuticals, Inc. Class A (a) | 473,000 | | 5,790 |
Medivation, Inc. (a) | 299,000 | | 17,303 |
Merrimack Pharmaceuticals, Inc. (a) | 2,407,858 | | 11,510 |
Onyx Pharmaceuticals, Inc. (a) | 400,500 | | 52,586 |
Pharmacyclics, Inc. (a) | 44,300 | | 4,812 |
Regeneron Pharmaceuticals, Inc. (a) | 438,669 | | 118,467 |
Seattle Genetics, Inc. (a) | 239,900 | | 9,721 |
Synageva BioPharma Corp. (a) | 180,700 | | 8,692 |
Vertex Pharmaceuticals, Inc. (a) | 639,160 | | 51,005 |
| | 1,792,005 |
Health Care Equipment & Supplies - 0.9% |
Accuray, Inc. (a)(d) | 2,060,900 | | 12,798 |
Baxter International, Inc. | 185,400 | | 13,542 |
Boston Scientific Corp. (a) | 3,943,000 | | 43,058 |
Insulet Corp. (a) | 310,600 | | 9,905 |
The Cooper Companies, Inc. | 814,672 | | 103,748 |
| | 183,051 |
Health Care Providers & Services - 1.1% |
AmerisourceBergen Corp. | 201,900 | | 11,765 |
Common Stocks - continued |
| Shares | | Value (000s) |
HEALTH CARE - continued |
Health Care Providers & Services - continued |
Apollo Hospitals Enterprise Ltd. | 936,371 | | $ 14,435 |
Catamaran Corp. (a) | 343,600 | | 18,098 |
Express Scripts Holding Co. (a) | 2,370,900 | | 155,412 |
HCA Holdings, Inc. | 622,300 | | 24,270 |
MEDNAX, Inc. (a) | 42,000 | | 4,092 |
Qualicorp SA (a) | 1,151,000 | | 8,426 |
| | 236,498 |
Health Care Technology - 0.3% |
athenahealth, Inc. (a)(d) | 154,575 | | 17,305 |
Cerner Corp. (a) | 893,800 | | 43,796 |
| | 61,101 |
Life Sciences Tools & Services - 0.3% |
Illumina, Inc. (a) | 697,300 | | 55,658 |
Lonza Group AG | 58,001 | | 4,462 |
| | 60,120 |
Pharmaceuticals - 3.2% |
AbbVie, Inc. | 1,346,600 | | 61,243 |
Actavis, Inc. (a) | 732,100 | | 98,299 |
Allergan, Inc. | 346,000 | | 31,528 |
AVANIR Pharmaceuticals Class A (a)(d) | 2,885,556 | | 13,591 |
Bristol-Myers Squibb Co. | 663,800 | | 28,703 |
Endo Health Solutions, Inc. (a) | 720,068 | | 27,694 |
Johnson & Johnson | 1,181,540 | | 110,474 |
Merck & Co., Inc. | 642,100 | | 30,930 |
Perrigo Co. | 139,400 | | 17,340 |
Questcor Pharmaceuticals, Inc. | 608,852 | | 40,683 |
Sanofi SA sponsored ADR | 416,000 | | 21,416 |
Valeant Pharmaceuticals International, Inc. (Canada) (a) | 1,492,400 | | 138,473 |
Warner Chilcott PLC | 1,240,800 | | 26,441 |
| | 646,815 |
TOTAL HEALTH CARE | | 2,979,590 |
INDUSTRIALS - 10.7% |
Aerospace & Defense - 3.0% |
Honeywell International, Inc. | 1,207,200 | | 100,173 |
Precision Castparts Corp. | 596,000 | | 132,145 |
Common Stocks - continued |
| Shares | | Value (000s) |
INDUSTRIALS - continued |
Aerospace & Defense - continued |
The Boeing Co. | 862,500 | | $ 90,649 |
United Technologies Corp. | 2,672,600 | | 282,146 |
| | 605,113 |
Air Freight & Logistics - 0.6% |
FedEx Corp. | 125,830 | | 13,338 |
United Parcel Service, Inc. Class B | 1,236,200 | | 107,302 |
| | 120,640 |
Airlines - 0.9% |
Copa Holdings SA Class A | 84,900 | | 11,816 |
Delta Air Lines, Inc. | 2,096,800 | | 44,515 |
Spirit Airlines, Inc. (a) | 1,237,100 | | 40,886 |
U.S. Airways Group, Inc. (a) | 2,300,900 | | 44,522 |
United Continental Holdings, Inc. (a) | 898,400 | | 31,309 |
| | 173,048 |
Building Products - 0.3% |
A.O. Smith Corp. | 151,000 | | 6,239 |
Fortune Brands Home & Security, Inc. | 348,500 | | 14,397 |
Masco Corp. | 1,904,100 | | 39,072 |
| | 59,708 |
Construction & Engineering - 0.1% |
Quanta Services, Inc. (a) | 758,300 | | 20,330 |
Electrical Equipment - 0.6% |
Eaton Corp. PLC | 1,620,100 | | 111,706 |
Industrial Conglomerates - 1.0% |
Danaher Corp. | 2,848,300 | | 191,805 |
General Electric Co. | 733,900 | | 17,885 |
| | 209,690 |
Machinery - 1.8% |
Caterpillar, Inc. | 732,900 | | 60,765 |
Cummins, Inc. | 1,356,000 | | 164,334 |
Ingersoll-Rand PLC | 1,204,000 | | 73,504 |
ITT Corp. | 473,900 | | 14,805 |
Manitowoc Co., Inc. | 1,186,800 | | 24,365 |
PACCAR, Inc. | 269,200 | | 15,148 |
Snap-On, Inc. | 87,500 | | 8,299 |
| | 361,220 |
Professional Services - 0.6% |
Manpower, Inc. | 1,650,800 | | 110,389 |
Common Stocks - continued |
| Shares | | Value (000s) |
INDUSTRIALS - continued |
Professional Services - continued |
Towers Watson & Co. | 171,500 | | $ 14,445 |
Verisk Analytics, Inc. (a) | 61,900 | | 3,984 |
| | 128,818 |
Road & Rail - 1.6% |
Canadian Pacific Railway Ltd. | 537,600 | | 66,018 |
Con-way, Inc. | 431,200 | | 17,873 |
Hertz Global Holdings, Inc. (a) | 3,815,600 | | 97,718 |
Union Pacific Corp. | 840,800 | | 133,342 |
| | 314,951 |
Trading Companies & Distributors - 0.2% |
Mills Estruturas e Servicos de Engenharia SA | 827,400 | | 10,336 |
W.W. Grainger, Inc. | 55,200 | | 14,470 |
WESCO International, Inc. (a) | 305,300 | | 23,136 |
| | 47,942 |
TOTAL INDUSTRIALS | | 2,153,166 |
INFORMATION TECHNOLOGY - 28.5% |
Communications Equipment - 2.5% |
Aruba Networks, Inc. (a) | 534,200 | | 9,498 |
Cisco Systems, Inc. | 2,047,800 | | 52,321 |
F5 Networks, Inc. (a) | 631,600 | | 55,429 |
Juniper Networks, Inc. (a) | 2,603,100 | | 56,409 |
QUALCOMM, Inc. | 5,070,600 | | 327,307 |
| | 500,964 |
Computers & Peripherals - 5.9% |
Apple, Inc. | 1,835,600 | | 830,609 |
EMC Corp. | 5,267,100 | | 137,735 |
Fusion-io, Inc. (a) | 807,522 | | 11,644 |
Hewlett-Packard Co. | 2,539,700 | | 65,219 |
NCR Corp. (a) | 3,286,157 | | 118,302 |
SanDisk Corp. | 371,800 | | 20,494 |
Stratasys Ltd. (a) | 46,600 | | 4,131 |
| | 1,188,134 |
Electronic Equipment & Components - 0.1% |
InvenSense, Inc. (a) | 535,400 | | 9,466 |
Neonode, Inc. (a) | 613,800 | | 4,782 |
| | 14,248 |
Common Stocks - continued |
| Shares | | Value (000s) |
INFORMATION TECHNOLOGY - continued |
Internet Software & Services - 8.2% |
Baidu.com, Inc. sponsored ADR (a) | 115,900 | | $ 15,335 |
Cornerstone OnDemand, Inc. (a) | 149,200 | | 6,571 |
Dropbox, Inc. (a)(f) | 1,003,814 | | 10,038 |
eBay, Inc. (a) | 1,220,300 | | 63,077 |
Facebook, Inc. Class A (a) | 7,472,367 | | 275,207 |
Google, Inc. Class A (a) | 1,150,067 | | 1,020,805 |
LinkedIn Corp. (a) | 357,000 | | 72,753 |
Marketo, Inc. | 285,851 | | 8,984 |
Rackspace Hosting, Inc. (a) | 972,100 | | 44,026 |
Trulia, Inc. | 161,200 | | 6,006 |
WebMD Health Corp. (a) | 639,700 | | 21,116 |
Yahoo!, Inc. (a) | 3,808,900 | | 106,992 |
Yelp, Inc. (a)(d) | 110,200 | | 4,606 |
| | 1,655,516 |
IT Services - 3.7% |
Cognizant Technology Solutions Corp. Class A (a) | 1,700,800 | | 123,121 |
FleetCor Technologies, Inc. (a) | 118,000 | | 10,593 |
MasterCard, Inc. Class A | 446,600 | | 272,698 |
The Western Union Co. | 1,974,600 | | 35,464 |
Unisys Corp. (a) | 359,124 | | 9,316 |
Visa, Inc. Class A | 1,610,700 | | 285,110 |
| | 736,302 |
Semiconductors & Semiconductor Equipment - 3.2% |
Advanced Micro Devices, Inc. (a)(d) | 9,424,400 | | 35,530 |
Altera Corp. | 1,583,400 | | 56,306 |
Applied Materials, Inc. | 3,982,200 | | 64,950 |
Atmel Corp. (a) | 1,086,600 | | 8,584 |
Avago Technologies Ltd. | 1,028,900 | | 37,740 |
Broadcom Corp. Class A | 6,478,600 | | 178,615 |
Cree, Inc. (a) | 638,500 | | 44,631 |
First Solar, Inc. (a) | 338,700 | | 16,678 |
Lam Research Corp. (a) | 164,000 | | 8,072 |
Monolithic Power Systems, Inc. | 437,600 | | 11,456 |
NVIDIA Corp. | 1,099,200 | | 15,861 |
NXP Semiconductors NV (a) | 4,948,135 | | 161,557 |
PMC-Sierra, Inc. (a) | 2,192,700 | | 14,483 |
| | 654,463 |
Software - 4.9% |
Activision Blizzard, Inc. | 6,149,700 | | 110,572 |
Adobe Systems, Inc. (a) | 731,300 | | 34,576 |
Common Stocks - continued |
| Shares | | Value (000s) |
INFORMATION TECHNOLOGY - continued |
Software - continued |
Electronic Arts, Inc. (a) | 4,007,996 | | $ 104,689 |
FleetMatics Group PLC | 187,100 | | 7,046 |
Guidewire Software, Inc. (a) | 248,300 | | 10,866 |
Intuit, Inc. | 127,200 | | 8,131 |
Linx SA | 124,800 | | 2,067 |
Microsoft Corp. | 3,990,689 | | 127,024 |
Oracle Corp. | 3,956,200 | | 127,983 |
QLIK Technologies, Inc. (a) | 696,663 | | 21,819 |
Red Hat, Inc. (a) | 1,463,400 | | 75,760 |
salesforce.com, Inc. (a) | 4,973,660 | | 217,598 |
ServiceNow, Inc. (a) | 522,500 | | 22,771 |
Splunk, Inc. (a) | 196,000 | | 9,802 |
Tableau Software, Inc. | 50,600 | | 2,803 |
Take-Two Interactive Software, Inc. (a) | 1,200,800 | | 21,050 |
Ubisoft Entertainment SA (a) | 881,104 | | 13,445 |
VMware, Inc. Class A (a) | 409,600 | | 33,665 |
Workday, Inc. Class A (d) | 648,700 | | 44,300 |
| | 995,967 |
TOTAL INFORMATION TECHNOLOGY | | 5,745,594 |
MATERIALS - 1.7% |
Chemicals - 1.6% |
Eastman Chemical Co. | 1,196,200 | | 96,210 |
LyondellBasell Industries NV Class A | 320,800 | | 22,042 |
Mexichem S.A.B. de CV | 3,322,800 | | 15,549 |
Monsanto Co. | 1,900,300 | | 187,712 |
| | 321,513 |
Metals & Mining - 0.1% |
Freeport-McMoRan Copper & Gold, Inc. | 702,100 | | 19,855 |
TOTAL MATERIALS | | 341,368 |
TELECOMMUNICATION SERVICES - 0.1% |
Diversified Telecommunication Services - 0.1% |
Jazztel PLC (a) | 504,600 | | 4,578 |
Verizon Communications, Inc. | 383,700 | | 18,985 |
| | 23,563 |
TOTAL COMMON STOCKS (Cost $13,457,469) |
20,037,822
|
Preferred Stocks - 0.4% |
| Shares | | Value (000s) |
Convertible Preferred Stocks - 0.0% |
CONSUMER DISCRETIONARY - 0.0% |
Leisure Equipment & Products - 0.0% |
NJOY, Inc. Series C (f) | 607,766 | | $ 4,913 |
Nonconvertible Preferred Stocks - 0.4% |
CONSUMER DISCRETIONARY - 0.4% |
Automobiles - 0.4% |
Volkswagen AG | 338,600 | | 80,474 |
TOTAL PREFERRED STOCKS (Cost $40,585) |
85,387
|
Money Market Funds - 2.9% |
| | | |
Fidelity Cash Central Fund, 0.11% (b) | 65,572,089 | | 65,572 |
Fidelity Securities Lending Cash Central Fund, 0.12% (b)(c) | 529,104,648 | | 529,105 |
TOTAL MONEY MARKET FUNDS (Cost $594,677) |
594,677
|
TOTAL INVESTMENT PORTFOLIO - 102.6% (Cost $14,092,731) | | 20,717,886 |
NET OTHER ASSETS (LIABILITIES) - (2.6)% | | (534,684) |
NET ASSETS - 100% | $ 20,183,202 |
Legend |
(a) Non-income producing |
(b) Affiliated fund that is generally available only to investment companies and other accounts managed by Fidelity Investments. The rate quoted is the annualized seven-day yield of the fund at period end. A complete unaudited listing of the fund's holdings as of its most recent quarter end is available upon request. In addition, each Fidelity Central Fund's financial statements, which are not covered by the Fund's Report of Independent Registered Public Accounting Firm, are available on the SEC's website or upon request. |
(c) Investment made with cash collateral received from securities on loan. |
(d) Security or a portion of the security is on loan at period end. |
(e) Affiliated company |
(f) Restricted securities - Investment in securities not registered under the Securities Act of 1933 (excluding 144A issues). At the end of the period, the value of restricted securities (excluding 144A issues) amounted to $14,951,000 or 0.1% of net assets. |
Additional information on each restricted holding is as follows: |
Security | Acquisition Date | Acquisition Cost (000s) |
Dropbox, Inc. | 5/2/12 | $ 9,084 |
NJOY, Inc.
Series C | 6/7/13 | $ 4,913 |
Affiliated Central Funds |
Information regarding fiscal year to date income earned by the Fund from investments in Fidelity Central Funds is as follows: |
Fund | Income earned
(Amounts in thousands) |
Fidelity Cash Central Fund | $ 44 |
Fidelity Securities Lending Cash Central Fund | 10,642 |
Total | $ 10,686 |
Other Affiliated Issuers |
An affiliated company is a company in which the Fund has ownership of at least 5% of the voting securities. Fiscal year to date transactions with companies which are or were affiliates are as follows: |
Affiliate
(Amounts in thousands) | Value,
beginning of
period | Purchases | Sales
Proceeds | Dividend
Income | Value,
end of
period |
Parsvnath Developers Ltd. | $ 15,302 | $ - | $ - | $ - | $ 10,232 |
Total | $ 15,302 | $ - | $ - | $ - | $ 10,232 |
Other Information |
The following is a summary of the inputs used, as of July 31, 2013, involving the Fund's assets and liabilities carried at fair value. The inputs or methodology used for valuing securities may not be an indication of the risk associated with investing in those securities. For more information on valuation inputs, and their aggregation into the levels used in the table below, please refer to the Investment Valuation section in the accompanying Notes to Financial Statements. |
Valuation Inputs at Reporting Date: |
Description
(Amounts in thousands) | Total | Level 1 | Level 2 | Level 3 |
Investments in Securities: | | | | |
Equities: | | | | |
Consumer Discretionary | $ 4,646,584 | $ 4,641,671 | $ - | $ 4,913 |
Consumer Staples | 2,660,702 | 2,652,871 | 7,831 | - |
Energy | 763,842 | 763,842 | - | - |
Financials | 808,800 | 808,800 | - | - |
Health Care | 2,979,590 | 2,979,590 | - | - |
Industrials | 2,153,166 | 2,153,166 | - | - |
Information Technology | 5,745,594 | 5,735,556 | - | 10,038 |
Materials | 341,368 | 341,368 | - | - |
Telecommunication Services | 23,563 | 23,563 | - | - |
Money Market Funds | 594,677 | 594,677 | - | - |
Total Investments in Securities: | $ 20,717,886 | $ 20,695,104 | $ 7,831 | $ 14,951 |
See accompanying notes which are an integral part of the financial statements.
Annual Report
Statement of Assets and Liabilities
Amounts in thousands (except per-share amounts) | July 31, 2013 |
| | |
Assets | | |
Investment in securities, at value (including securities loaned of $525,836) - See accompanying schedule: Unaffiliated issuers (cost $13,467,203) | $ 20,112,977 | |
Fidelity Central Funds (cost $594,677) | 594,677 | |
Other affiliated issuers (cost $30,851) | 10,232 | |
Total Investments (cost $14,092,731) | | $ 20,717,886 |
Cash | | 159 |
Receivable for investments sold | | 173,967 |
Receivable for fund shares sold | | 16,793 |
Dividends receivable | | 7,381 |
Distributions receivable from Fidelity Central Funds | | 137 |
Other receivables | | 751 |
Total assets | | 20,917,074 |
| | |
Liabilities | | |
Payable for investments purchased | $ 160,438 | |
Payable for fund shares redeemed | 31,357 | |
Accrued management fee | 10,006 | |
Other affiliated payables | 2,227 | |
Other payables and accrued expenses | 739 | |
Collateral on securities loaned, at value | 529,105 | |
Total liabilities | | 733,872 |
| | |
Net Assets | | $ 20,183,202 |
Net Assets consist of: | | |
Paid in capital | | $ 12,472,227 |
Undistributed net investment income | | 56,036 |
Accumulated undistributed net realized gain (loss) on investments and foreign currency transactions | | 1,029,789 |
Net unrealized appreciation (depreciation) on investments and assets and liabilities in foreign currencies | | 6,625,150 |
Net Assets | | $ 20,183,202 |
See accompanying notes which are an integral part of the financial statements.
Annual Report
Statement of Assets and Liabilities - continued
Amounts in thousands (except per-share amounts) | July 31, 2013 |
| | |
Blue Chip Growth:
Net Asset Value, offering price and redemption price per share ($12,927,159 ÷ 216,718 shares) | | $ 59.65 |
| | |
Class K:
Net Asset Value, offering price and redemption price per share ($3,505,675 ÷ 58,679 shares) | | $ 59.74 |
| | |
Class F:
Net Asset Value, offering price and redemption price per share ($3,750,368 ÷ 62,706 shares) | | $ 59.81 |
See accompanying notes which are an integral part of the financial statements.
Annual Report
Financial Statements - continued
Statement of Operations
Amounts in thousands | Year ended July 31, 2013 |
| | |
Investment Income | | |
Dividends | | $ 247,142 |
Interest | | 1 |
Income from Fidelity Central Funds | | 10,686 |
Total income | | 257,829 |
| | |
Expenses | | |
Management fee
Basic fee | $ 95,910 | |
Performance adjustment | (1,291) | |
Transfer agent fees | 23,729 | |
Accounting and security lending fees | 1,648 | |
Custodian fees and expenses | 400 | |
Independent trustees' compensation | 108 | |
Registration fees | 151 | |
Audit | 107 | |
Legal | 56 | |
Interest | 8 | |
Miscellaneous | 149 | |
Total expenses before reductions | 120,975 | |
Expense reductions | (2,236) | 118,739 |
Net investment income (loss) | | 139,090 |
Realized and Unrealized Gain (Loss) Net realized gain (loss) on: | | |
Investment securities: | | |
Unaffiliated issuers | 1,392,819 | |
Foreign currency transactions | (800) | |
Total net realized gain (loss) | | 1,392,019 |
Change in net unrealized appreciation (depreciation) on: Investment securities | 2,900,644 | |
Assets and liabilities in foreign currencies | 23 | |
Total change in net unrealized appreciation (depreciation) | | 2,900,667 |
Net gain (loss) | | 4,292,686 |
Net increase (decrease) in net assets resulting from operations | | $ 4,431,776 |
See accompanying notes which are an integral part of the financial statements.
Annual Report
Statement of Changes in Net Assets
Amounts in thousands | Year ended
July 31,
2013 | Year ended
July 31,
2012 |
Increase (Decrease) in Net Assets | | |
Operations | | |
Net investment income (loss) | $ 139,090 | $ 35,383 |
Net realized gain (loss) | 1,392,019 | (37,431) |
Change in net unrealized appreciation (depreciation) | 2,900,667 | 271,789 |
Net increase (decrease) in net assets resulting
from operations | 4,431,776 | 269,741 |
Distributions to shareholders from net investment income | (85,342) | (15,666) |
Distributions to shareholders from net realized gain | (230,904) | (480,841) |
Total distributions | (316,246) | (496,507) |
Share transactions - net increase (decrease) | 1,247,958 | 656,032 |
Total increase (decrease) in net assets | 5,363,488 | 429,266 |
| | |
Net Assets | | |
Beginning of period | 14,819,714 | 14,390,448 |
End of period (including undistributed net investment income of $56,036 and undistributed net investment income of $10,385, respectively) | $ 20,183,202 | $ 14,819,714 |
See accompanying notes which are an integral part of the financial statements.
Annual Report
Financial Highlights - Blue Chip Growth
Years ended July 31, | 2013 | 2012 | 2011 | 2010 | 2009 |
Selected Per-Share Data | | | | | |
Net asset value, beginning of period | $ 47.38 | $ 48.17 | $ 37.63 | $ 31.97 | $ 39.06 |
Income from Investment Operations | | | | | |
Net investment income (loss) B | .39 | .10 | (.03) | .04 | .27 |
Net realized and unrealized gain (loss) | 12.79 | .75 | 10.61 | 5.80 | (6.36) |
Total from investment operations | 13.18 | .85 | 10.58 | 5.84 | (6.09) |
Distributions from net investment income | (.23) | (.04) | (.00) E, G | (.18) | (.29) |
Distributions from net realized gain | (.68) | (1.60) | (.04) E | - | (.71) |
Total distributions | (.91) | (1.64) | (.04) | (.18) | (1.00) |
Net asset value, end of period | $ 59.65 | $ 47.38 | $ 48.17 | $ 37.63 | $ 31.97 |
Total Return A | 28.25% | 2.27% | 28.12% | 18.29% | (15.85)% |
Ratios to Average Net Assets C, F | | | | | |
Expenses before reductions | .76% | .90% | .94% | .94% | .76% |
Expenses net of fee waivers, if any | .76% | .90% | .94% | .94% | .76% |
Expenses net of all reductions | .74% | .89% | .92% | .93% | .76% |
Net investment income (loss) | .75% | .21% | (.06)% | .10% | .93% |
Supplemental Data | | | | | |
Net assets, end of period (in millions) | $ 12,927 | $ 10,595 | $ 12,024 | $ 10,295 | $ 9,691 |
Portfolio turnover rate D | 75% | 95% | 132% | 135% | 134% |
A Total returns would have been lower if certain expenses had not been reduced during the applicable periods shown.
B Calculated based on average shares outstanding during the period.
C Fees and expenses of any underlying Fidelity Central Funds are not included in the Fund's expense ratio. The Fund indirectly bears its proportionate share of the expenses of any underlying Fidelity Central Funds.
D Amount does not include the portfolio activity of any underlying Fidelity Central Funds.
E The amounts shown reflect certain reclassifications related to book to tax differences that were made in the year shown.
F Expense ratios reflect operating expenses of the class. Expenses before reductions do not reflect amounts reimbursed by the investment adviser or reductions from brokerage service arrangements or reductions from other expense offset arrangements and do not represent the amount paid by the class during periods when reimbursements or reductions occur. Expenses net of fee waivers reflect expenses after reimbursement by the investment adviser but prior to reductions from brokerage service arrangements or other expense offset arrangements. Expenses net of all reductions represent the net expenses paid by the class.
G Amount represents less than $.01 per share.
See accompanying notes which are an integral part of the financial statements.
Annual Report
Financial Highlights - Class K
Years ended July 31, | 2013 | 2012 | 2011 | 2010 | 2009 |
Selected Per-Share Data | | | | | |
Net asset value, beginning of period | $ 47.46 | $ 48.21 | $ 37.66 | $ 32.01 | $ 39.07 |
Income from Investment Operations | | | | | |
Net investment income (loss) C | .47 | .17 | .05 | .11 | .32 |
Net realized and unrealized gain (loss) | 12.79 | .75 | 10.62 | 5.79 | (6.33) |
Total from investment operations | 13.26 | .92 | 10.67 | 5.90 | (6.01) |
Distributions from net investment income | (.30) | (.08) | (.05) F | (.25) | (.34) |
Distributions from net realized gain | (.68) | (1.60) | (.07) F | - | (.71) |
Total distributions | (.98) | (1.67) H | (.12) | (.25) | (1.05) |
Net asset value, end of period | $ 59.74 | $ 47.46 | $ 48.21 | $ 37.66 | $ 32.01 |
Total Return A, B | 28.42% | 2.43% | 28.37% | 18.48% | (15.61)% |
Ratios to Average Net Assets D, G | | | | | |
Expenses before reductions | .61% | .74% | .77% | .75% | .53% |
Expenses net of fee waivers, if any | .61% | .74% | .77% | .75% | .53% |
Expenses net of all reductions | .60% | .73% | .76% | .74% | .52% |
Net investment income (loss) | .89% | .37% | .11% | .30% | 1.16% |
Supplemental Data | | | | | |
Net assets, end of period (in millions) | $ 3,506 | $ 2,467 | $ 1,455 | $ 932 | $ 591 |
Portfolio turnover rate E | 75% | 95% | 132% | 135% | 134% |
A Total returns for periods of less than one year are not annualized.
B Total returns would have been lower if certain expenses had not been reduced during the applicable periods shown.
C Calculated based on average shares outstanding during the period.
D Fees and expenses of any underlying Fidelity Central Funds are not included in the Fund's expense ratio. The Fund indirectly bears its proportionate share of the expenses of any underlying Fidelity Central Funds.
E Amount does not include the portfolio activity of any underlying Fidelity Central Funds.
F The amounts shown reflect certain reclassifications related to book to tax differences that were made in the year shown.
G Expense ratios reflect operating expenses of the class. Expenses before reductions do not reflect amounts reimbursed by the investment adviser or reductions from brokerage service arrangements or reductions from other expense offset arrangements and do not represent the amount paid by the class during periods when reimbursements or reductions occur. Expenses net of fee waivers reflect expenses after reimbursement by the investment adviser but prior to reductions from brokerage service arrangements or other expense offset arrangements. Expenses net of all reductions represent the net expenses paid by the class.
H Total distributions of $1.67 per share is comprised of distributions from net investment income of $.076 and distributions from net realized gain of $1.598 per share.
See accompanying notes which are an integral part of the financial statements.
Annual Report
Financial Highlights - Class F
Years ended July 31, | 2013 | 2012 | 2011 | 2010 | 2009 G |
Selected Per-Share Data | | | | | |
Net asset value, beginning of period | $ 47.51 | $ 48.24 | $ 37.69 | $ 31.98 | $ 29.16 |
Income from Investment Operations | | | | | |
Net investment income (loss) D | .50 | .19 | .07 | .13 | - J |
Net realized and unrealized gain (loss) | 12.81 | .76 | 10.61 | 5.80 | 2.82 |
Total from investment operations | 13.31 | .95 | 10.68 | 5.93 | 2.82 |
Distributions from net investment income | (.33) | (.08) | (.06) H | (.22) | - |
Distributions from net realized gain | (.68) | (1.60) | (.08) H | - | - |
Total distributions | (1.01) | (1.68) | (.13) K | (.22) | - |
Net asset value, end of period | $ 59.81 | $ 47.51 | $ 48.24 | $ 37.69 | $ 31.98 |
Total Return B, C | 28.49% | 2.49% | 28.41% | 18.59% | 9.67% |
Ratios to Average Net Assets E, I | | | | | |
Expenses before reductions | .56% | .69% | .72% | .70% | .51% A |
Expenses net of fee waivers, if any | .56% | .69% | .72% | .70% | .51% A |
Expenses net of all reductions | .55% | .68% | .71% | .68% | .51% A |
Net investment income (loss) | .94% | .42% | .16% | .35% | (.05)% A |
Supplemental Data | | | | | |
Net assets, end of period (000 omitted) | $ 3,750,368 | $ 1,756,916 | $ 911,556 | $ 321,409 | $ 261 |
Portfolio turnover rate F | 75% | 95% | 132% | 135% | 134% |
A Annualized
B Total returns for periods of less than one year are not annualized.
C Total returns would have been lower if certain expenses had not been reduced during the applicable periods shown.
D Calculated based on average shares outstanding during the period.
E Fees and expenses of any underlying Fidelity Central Funds are not included in the Fund's expense ratio. The Fund indirectly bears its proportionate share of the expenses of any underlying Fidelity Central Funds.
F Amount does not include the portfolio activity of any underlying Fidelity Central Funds.
G For the period June 26, 2009 (commencement of sale of shares) to July 31, 2009.
H The amounts shown reflect certain reclassifications related to book to tax differences that were made in the year shown.
I Expense ratios reflect operating expenses of the class. Expenses before reductions do not reflect amounts reimbursed by the investment adviser or reductions from brokerage service arrangements or reductions from other expense offset arrangements and do not represent the amount paid by the class during periods when reimbursements or reductions occur. Expense ratios before reductions for start-up periods may not be representative of longer-term operating periods. Expenses net of fee waivers reflect expenses after reimbursement by the investment adviser but prior to reductions from brokerage service arrangements or other expense offset arrangements. Expenses net of all reductions represent the net expenses paid by the class.
J Amount represents less than $.01 per share.
K Total distributions of $.13 per share is comprised of distributions from net investment income of $.058 and distributions from net realized gain of $.076 per share.
See accompanying notes which are an integral part of the financial statements.
Annual Report
Notes to Financial Statements
For the period ended July 31, 2013
(Amounts in thousands except percentages)
1. Organization.
Fidelity® Blue Chip Growth Fund (the Fund) is a fund of Fidelity Securities Fund (the Trust) and is authorized to issue an unlimited number of shares. The Trust is registered under the Investment Company Act of 1940, as amended (the 1940 Act), as an open-end management investment company organized as a Massachusetts business trust. The Fund offers Blue Chip Growth, Class K and Class F shares, each of which has equal rights as to assets and voting privileges. Each class has exclusive voting rights with respect to matters that affect that class. Class F shares of the Fund are only available for purchase by mutual funds for which Fidelity Management & Research Company (FMR) or an affiliate serves as investment manager.
2. Investments in Fidelity Central Funds.
The Fund invests in Fidelity Central Funds, which are open-end investment companies generally available only to other investment companies and accounts managed by FMR and its affiliates. The Fund's Schedule of Investments lists each of the Fidelity Central Funds held as of period end, if any, as an investment of the Fund, but does not include the underlying holdings of each Fidelity Central Fund. As an Investing Fund, the Fund indirectly bears its proportionate share of the expenses of the underlying Fidelity Central Funds.
The Money Market Central Funds seek preservation of capital and current income and are managed by Fidelity Investments Money Management, Inc. (FIMM), an affiliate of FMR.
A complete unaudited list of holdings for each Fidelity Central Fund is available upon request or at the Securities and Exchange Commission (the SEC) website at www.sec.gov. In addition, the financial statements of the Fidelity Central Funds, which are not covered by the Fund's Report of Independent Registered Public Accounting Firm, are available on the SEC website or upon request.
3. Significant Accounting Policies.
The financial statements have been prepared in conformity with accounting principles generally accepted in the United States of America (GAAP), which require management to make certain estimates and assumptions at the date of the financial statements. Actual results could differ from those estimates. Subsequent events, if any, through the date that the financial statements were issued have been evaluated in the preparation of the financial statements. The following summarizes the significant accounting policies of the Fund:
Investment Valuation. Investments are valued as of 4:00 p.m. Eastern time on the last calendar day of the period. In accordance with valuation policies and procedures
Annual Report
Notes to Financial Statements - continued
(Amounts in thousands except percentages)
3. Significant Accounting Policies - continued
Investment Valuation - continued
approved by the Board of Trustees (the Board), the Fund attempts to obtain prices from one or more third party pricing vendors or brokers to value its investments. When current market prices, quotations or currency exchange rates are not readily available or reliable, investments will be fair valued in good faith by the FMR Fair Value Committee (the Committee), in accordance with procedures adopted by the Board. Factors used in determining fair value vary by investment type and may include market or investment specific events. The frequency with which these procedures are used cannot be predicted and they may be utilized to a significant extent. The Committee oversees the Fund's valuation policies and procedures and is responsible for approving and reporting to the Board all fair value determinations.
The Fund categorizes the inputs to valuation techniques used to value its investments into a disclosure hierarchy consisting of three levels as shown below:
Level 1 - quoted prices in active markets for identical investments
Level 2 - other significant observable inputs (including quoted prices for similar investments, interest rates, prepayment speeds, etc.)
Level 3 - unobservable inputs (including the Fund's own assumptions based on the best information available)
Valuation techniques used to value the Fund's investments by major category are as follows:
Equity securities, including restricted securities, for which market quotations are readily available, are valued at the last reported sale price or official closing price as reported by a third party pricing vendor on the primary market or exchange on which they are traded and are categorized as Level 1 in the hierarchy. In the event there were no sales during the day or closing prices are not available, securities are valued at the last quoted bid price or may be valued using the last available price and are generally categorized as Level 2 in the hierarchy. For foreign equity securities, when market or security specific events arise, comparisons to the valuation of American Depositary Receipts (ADRs), futures contracts, Exchange-Traded Funds (ETFs) and certain indexes as well as quoted prices for similar securities may be used and would be categorized as Level 2 in the hierarchy. Utilizing these techniques may result in transfers between Level 1 and Level 2. For restricted equity securities and private placements where observable inputs are limited, assumptions about market activity and risk are used and these securities are generally categorized as Level 3 in the hierarchy.
Annual Report
3. Significant Accounting Policies - continued
Investment Valuation - continued
Investments in open-end mutual funds, including the Fidelity Central Funds, are valued at their closing net asset value (NAV) each business day and are categorized as Level 1 in the hierarchy.
Changes in valuation techniques may result in transfers in or out of an assigned level within the disclosure hierarchy. The aggregate value of investments by input level, as of July 31, 2013, is included at the end of the Fund's Schedule of Investments.
Foreign Currency. The Fund may use foreign currency contracts to facilitate transactions in foreign-denominated securities. Gains and losses from these transactions may arise from changes in the value of the foreign currency or if the counterparties do not perform under the contracts' terms.
Foreign-denominated assets, including investment securities, and liabilities are translated into U.S. dollars at the exchange rates at period end. Purchases and sales of investment securities, income and dividends received and expenses denominated in foreign currencies are translated into U.S. dollars at the exchange rate in effect on the transaction date.
The effects of exchange rate fluctuations on investments are included with the net realized and unrealized gain (loss) on investment securities. Other foreign currency transactions resulting in realized and unrealized gain (loss) are disclosed separately.
Investment Transactions and Income. For financial reporting purposes, the Fund's investment holdings and NAV include trades executed through the end of the last business day of the period. The NAV per share for processing shareholder transactions is calculated as of the close of business of the New York Stock Exchange (NYSE), normally 4:00 p.m. Eastern time and includes trades executed through the end of the prior business day. Gains and losses on securities sold are determined on the basis of identified cost and may include proceeds received from litigation. Dividend income is recorded on the ex-dividend date, except for certain dividends from foreign securities where the ex-dividend date may have passed, which are recorded as soon as the Fund is informed of the ex-dividend date. Non-cash dividends included in dividend income, if any, are recorded at the fair market value of the securities received. Distributions received on securities that represent a return of capital or capital gain are recorded as a reduction of cost of investments and/or as a realized gain. Subsequent to ex-dividend date the Fund determines the components of these distributions, based upon receipt of tax filings or other correspondence relating to the underlying investment. Interest income and distributions from the Fidelity Central Funds are accrued as earned. Interest income includes coupon interest and amortization of premium and accretion of discount on debt
Annual Report
Notes to Financial Statements - continued
(Amounts in thousands except percentages)
3. Significant Accounting Policies - continued
Investment Transactions and Income - continued
securities. Investment income is recorded net of foreign taxes withheld where recovery of such taxes is uncertain.
Class Allocations and Expenses. Investment income, realized and unrealized capital gains and losses, common expenses of the Fund, and certain fund-level expense reductions, if any, are allocated on a pro-rata basis to each class based on the relative net assets of each class to the total net assets of Fund. Each class differs with respect to transfer agent fees incurred. Certain expense reductions may also differ by class. Expenses directly attributable to a fund are charged to that fund. Expenses attributable to more than one fund are allocated among the respective funds on the basis of relative net assets or other appropriate methods. Expense estimates are accrued in the period to which they relate and adjustments are made when actual amounts are known.
Deferred Trustee Compensation. Under a Deferred Compensation Plan (the Plan), independent Trustees may elect to defer receipt of a portion of their annual compensation. Deferred amounts are invested in a cross-section of Fidelity funds, are marked-to-market and remain in the Fund until distributed in accordance with the Plan. The investment of deferred amounts and the offsetting payable to the Trustees are included in the accompanying Statement of Assets and Liabilities.
Income Tax Information and Distributions to Shareholders. Each year, the Fund intends to qualify as a regulated investment company under Subchapter M of the Internal Revenue Code, including distributing substantially all of its taxable income and realized gains. As a result, no provision for income taxes is required. As of July 31, 2013, the Fund did not have any unrecognized tax benefits in the financial statements; nor is the Fund aware of any tax positions for which it is reasonably possible that the total amounts of unrecognized tax benefits will significantly change in the next twelve months. The Fund files a U.S. federal tax return, in addition to state and local tax returns as required. A fund's federal income tax returns are subject to examination by the Internal Revenue Service (IRS) for a period of three fiscal years after they are filed. State and local tax returns may be subject to examination for an additional fiscal year depending on the jurisdiction. Foreign taxes are provided for based on the Fund's understanding of the tax rules and rates that exist in the foreign markets in which it invests.
Distributions are declared and recorded on the ex-dividend date. Income dividends and capital gain distributions are declared separately for each class. Income and capital gain distributions are determined in accordance with income tax regulations, which may differ from GAAP. These differences resulted in distribution reclassifications. In addition,
Annual Report
3. Significant Accounting Policies - continued
Income Tax Information and Distributions to Shareholders - continued
the fund claimed a portion of the payment made to redeeming shareholders as a distribution for income tax purposes.
Capital accounts within the financial statements are adjusted for permanent book-tax differences. These adjustments have no impact on net assets or the results of operations. Temporary book-tax differences will reverse in a subsequent period.
Book-tax differences are primarily due to foreign currency transactions, partnerships, deferred trustees compensation, capital loss carryforwards and losses deferred due to wash sales.
The federal tax cost of investment securities and unrealized appreciation (depreciation) as of period end were as follows:
Gross unrealized appreciation | $ 6,725,212 |
Gross unrealized depreciation | (141,260) |
Net unrealized appreciation (depreciation) on securities and other investments | $ 6,583,952 |
| |
Tax Cost | $ 14,133,934 |
The tax-based components of distributable earnings as of period end were as follows:
Undistributed ordinary income | $ 130,879 |
Undistributed long-term capital gain | $ 996,747 |
Net unrealized appreciation (depreciation) | $ 6,583,947 |
The tax character of distributions paid was as follows:
| July 31, 2013 | July 31, 2012 |
Ordinary Income | $ 85,342 | $ 15,666 |
Long-term Capital Gains | 230,904 | 480,841 |
Total | $ 316,246 | $ 496,507 |
Restricted Securities. The Fund may invest in securities that are subject to legal or contractual restrictions on resale. These securities generally may be resold in transactions exempt from registration or to the public if the securities are registered. Disposal of these securities may involve time-consuming negotiations and expense, and prompt sale at an acceptable price may be difficult. Information regarding restricted securities is included at the end of the Fund's Schedule of Investments.
Annual Report
Notes to Financial Statements - continued
(Amounts in thousands except percentages)
4. Purchases and Sales of Investments.
Purchases and sales of securities, other than short-term securities, aggregated $13,939,479 and $12,907,588, respectively.
5. Fees and Other Transactions with Affiliates.
Management Fee. FMR and its affiliates provide the Fund with investment management related services for which the Fund pays a monthly management fee. The management fee is the sum of an individual fund fee rate that is based on an annual rate of .30% of the Fund's average net assets and an annualized group fee rate that averaged .26% during the period. The group fee rate is based upon the average net assets of all the mutual funds advised by FMR. The group fee rate decreases as assets under management increase and increases as assets under management decrease. In addition, the management fee is subject to a performance adjustment (up to a maximum of ± .20% of the Fund's average net assets over a 36 month performance period). The upward or downward adjustment to the management fee is based on the relative investment performance of Blue Chip Growth as compared to an appropriate benchmark index. For the period, the total annual management fee rate, including the performance adjustment, was .55% of the Fund's average net assets.
Transfer Agent Fees. Fidelity Investments Institutional Operations Company, Inc., (FIIOC), an affiliate of FMR, is the transfer, dividend disbursing and shareholder servicing agent for each class of the Fund. FIIOC receives account fees and asset-based fees that vary according to the account size and type of account of the shareholders of Blue Chip Growth. FIIOC receives an asset-based fee of Class K's average net assets. FIIOC receives no fees for providing transfer agency services to Class F. FIIOC pays for typesetting, printing and mailing of shareholder reports, except proxy statements. For the period, transfer agent fees for each class were as follows:
| Amount | % of
Average
Net Assets |
Blue Chip Growth | $ 22,289 | .19 |
Class K | 1,440 | .05 |
| $ 23,729 | |
Accounting and Security Lending Fees. Fidelity Service Company, Inc. (FSC), an affiliate of FMR, maintains the Fund's accounting records. The accounting fee is based on the level of average net assets for each month. Under a separate contract, FSC administers the security lending program. The security lending fee is based on the number and duration of lending transactions.
Annual Report
5. Fees and Other Transactions with Affiliates - continued
Brokerage Commissions. The Fund placed a portion of its portfolio transactions with brokerage firms which are affiliates of the investment adviser. Brokerage commissions are included in net realized gain (loss) and change in net unrealized appreciation (depreciation) in the Statement of Operations. The commissions paid to these affiliated firms were $401 for the period.
Interfund Lending Program. Pursuant to an Exemptive Order issued by the SEC, the Fund, along with other registered investment companies having management contracts with FMR, may participate in an interfund lending program. This program provides an alternative credit facility allowing the funds to borrow from, or lend money to, other participating affiliated funds. At period end, there were no interfund loans outstanding. The Fund's activity in this program during the period for which loans were outstanding was as follows:
Borrower or Lender | Average Loan
Balance | Weighted Average
Interest Rate | Interest
Expense |
Borrower | $ 12,940 | .41% | $ 8 |
Exchanges In-Kind. During the period, certain investment companies managed by FMR or its affiliates (Investing Funds) completed exchanges in-kind with the Fund. The Investing Funds delivered cash and securities valued at $1,605,000 in exchange for 32,348 shares of the Fund. The amount of in-kind exchanges is included in share transactions in the accompanying Statement of Changes in Net Assets, as well as Note 10: Share Transactions. The Fund recognized no gain or loss for federal income tax purposes.
6. Committed Line of Credit.
The Fund participates with other funds managed by FMR or an affiliate in a $4.25 billion credit facility (the "line of credit") to be utilized for temporary or emergency purposes to fund shareholder redemptions or for other short-term liquidity purposes. The Fund has agreed to pay commitment fees on its pro-rata portion of the line of credit, which amounted to $39 and is reflected in Miscellaneous expenses on the Statement of Operations. During the period, there were no borrowings on this line of credit.
7. Security Lending.
The Fund lends portfolio securities through a lending agent from time to time in order to earn additional income. For equity securities, a lending agent is used and may loan securities to certain qualified borrowers, including Fidelity Capital Markets (FCM), a broker-dealer affiliated with the Fund. On the settlement date of the loan, the Fund receives collateral (in the form of U.S. Treasury obligations, letters of credit and/or cash) against the loaned securities and maintains collateral in an amount not less than 100% of
Annual Report
Notes to Financial Statements - continued
(Amounts in thousands except percentages)
7. Security Lending - continued
the market value of the loaned securities during the period of the loan. The market value of the loaned securities is determined at the close of business of the Fund and any additional required collateral is delivered to the Fund on the next business day. If the borrower defaults on its obligation to return the securities loaned because of insolvency or other reasons, the Fund may apply collateral received from the borrower against the obligation. The Fund may experience delays and costs in recovering the securities loaned. Any cash collateral received is invested in the Fidelity Securities Lending Cash Central Fund. The value of loaned securities and cash collateral at period end are disclosed on the Fund's Statement of Assets and Liabilities. The value of securities loaned to FCM at period end was $2,041. Security lending income represents the income earned on investing cash collateral, less rebates paid to borrowers and any lending agent fees associated with the loan, plus any premium payments received for lending certain types of securities. Security lending income is presented in the Statement of Operations as a component of income from Fidelity Central Funds. Total security lending income during the period amounted to $10,642, including $619 from securities loaned to FCM.
8. Expense Reductions.
Commissions paid to certain brokers with whom FMR places trades on behalf of the Fund include an amount in addition to trade execution, which is rebated back to the Fund to offset certain expenses. This amount totaled $2,199 for the period. In addition, FMR reimbursed a portion of the Fund's operating expenses during the period in the amount of $37.
9. Distributions to Shareholders.
Distributions to shareholders of each class were as follows:
Years ended July 31, | 2013 | 2012 |
From net investment income | | |
Blue Chip Growth | $ 51,844 | $ 10,644 |
Class K | 16,348 | 2,860 |
Class F | 17,150 | 2,162 |
Total | $ 85,342 | $ 15,666 |
From net realized gain | | |
Blue Chip Growth | $ 155,106 | $ 397,250 |
Class K | 36,829 | 51,295 |
Class F | 38,969 | 32,296 |
Total | $ 230,904 | $ 480,841 |
Annual Report
10. Share Transactions.
Transactions for each class of shares were as follows:
| Shares | Dollars |
Years ended July 31, | 2013 | 2012 | 2013 | 2012 |
Blue Chip Growth | | | | |
Shares sold | 41,304 A | 42,825 | $ 2,121,491 A | $ 1,970,082 |
Reinvestment of distributions | 4,171 | 9,668 | 202,506 | 399,689 |
Shares redeemed | (52,364) | (78,498) | (2,708,546) | (3,530,347) |
Net increase (decrease) | (6,889) | (26,005) | $ (384,549) | $ (1,160,576) |
Class K | | | | |
Shares sold | 17,299 | 29,866 | $ 899,333 | $ 1,366,770 |
Reinvestment of distributions | 1,092 | 1,309 | 53,178 | 54,155 |
Shares redeemed | (11,703) | (9,363) | (608,221) | (426,597) |
Net increase (decrease) | 6,688 | 21,812 | $ 344,290 | $ 994,328 |
Class F | | | | |
Shares sold | 28,168 A | 19,170 | $ 1,424,726 A | $ 873,960 |
Reinvestment of distributions | 1,153 | 832 | 56,119 | 34,458 |
Shares redeemed | (3,595) | (1,918) | (192,628) | (86,138) |
Net increase (decrease) | 25,726 | 18,084 | $ 1,288,217 | $ 822,280 |
A Amount includes in-kind exchanges (See Note 5: Exchanges In-Kind)
11. Other.
The Fund's organizational documents provide former and current trustees and officers with a limited indemnification against liabilities arising in connection with the performance of their duties to the Fund. In the normal course of business, the Fund may also enter into contracts that provide general indemnifications. The Fund's maximum exposure under these arrangements is unknown as this would be dependent on future claims that may be made against the Fund. The risk of material loss from such claims is considered remote.
At the end of the period, the Fidelity Freedom Funds and Fidelity Freedom K Funds were the owners of record, in the aggregate, of approximately 33% of the total outstanding shares of the Fund.
Annual Report
To the Trustees of Fidelity Securities Fund and Shareholders of Fidelity Blue Chip Growth Fund:
We have audited the accompanying statement of assets and liabilities of Fidelity Blue Chip Growth Fund (the Fund), a fund of Fidelity Securities Fund, including the schedule of investments, as of July 31, 2013, and the related statement of operations for the year then ended, the statement of changes in net assets for each of the two years in the period then ended, and the financial highlights for each of the five years in the period then ended. These financial statements and financial highlights are the responsibility of the Fund's management. Our responsibility is to express an opinion on these financial statements and financial highlights based on our audits.
We conducted our audits in accordance with the standards of the Public Company Accounting Oversight Board (United States). Those standards require that we plan and perform the audit to obtain reasonable assurance about whether the financial statements and financial highlights are free of material misstatement. The Fund is not required to have, nor were we engaged to perform, an audit of its internal control over financial reporting. Our audits included consideration of internal control over financial reporting as a basis for designing audit procedures that are appropriate in the circumstances, but not for the purpose of expressing an opinion on the effectiveness of the Fund's internal control over financial reporting. Accordingly, we express no such opinion. An audit also includes examining, on a test basis, evidence supporting the amounts and disclosures in the financial statements, assessing the accounting principles used and significant estimates made by management, as well as evaluating the overall financial statement presentation. Our procedures included confirmation of securities owned as of July 31, 2013, by correspondence with the custodians and brokers; where replies were not received from brokers, we performed other auditing procedures. We believe that our audits provide a reasonable basis for our opinion.
In our opinion, the financial statements and financial highlights referred to above present fairly, in all material respects, the financial position of Fidelity Blue Chip Growth Fund as of July 31, 2013, the results of its operations for the year then ended, the changes in its net assets for each of the two years in the period then ended, and the financial highlights for each of the five years in the period then ended, in conformity with accounting principles generally accepted in the United States of America.
DELOITTE & TOUCHE LLP
Boston, Massachusetts
September 11, 2013
Annual Report
The Trustees, Member of the Advisory Board, and executive officers of the trust and funds, as applicable, are listed below. The Board of Trustees governs each fund and is responsible for protecting the interests of shareholders. The Trustees are experienced executives who meet periodically throughout the year to oversee each fund's activities, review contractual arrangements with companies that provide services to each fund, oversee management of the risks associated with such activities and contractual arrangements, and review each fund's performance. Except for James C. Curvey, Ned C. Lautenbach, Ronald P. O'Hanley, and William S. Stavropoulos, each of the Trustees oversees 166 Fidelity funds. Mr. Curvey oversees 387 Fidelity funds. Mr. Lautenbach, Mr. O'Hanley, and Mr. Stavropoulos each oversees 230 Fidelity funds.
The Trustees hold office without limit in time except that (a) any Trustee may resign; (b) any Trustee may be removed by written instrument, signed by at least two-thirds of the number of Trustees prior to such removal; (c) any Trustee who requests to be retired or who has become incapacitated by illness or injury may be retired by written instrument signed by a majority of the other Trustees; and (d) any Trustee may be removed at any special meeting of shareholders by a two-thirds vote of the outstanding voting securities of the trust. Each Trustee who is not an interested person of the trust and the funds (as defined in the 1940 Act) (Independent Trustee), shall retire not later than the last day of the calendar year in which his or her 75th birthday occurs. The Independent Trustees may waive this mandatory retirement age policy with respect to individual Trustees. The executive officers and Advisory Board Member hold office without limit in time, except that any officer and Advisory Board Member may resign or may be removed by a vote of a majority of the Trustees at any regular meeting or any special meeting of the Trustees. Except as indicated, each individual has held the office shown or other offices in the same company for the past five years.
Experience, Skills, Attributes, and Qualifications of the Funds' Trustees. The Governance and Nominating Committee has adopted a statement of policy that describes the experience, qualifications, attributes, and skills that are necessary and desirable for potential Independent Trustee candidates (Statement of Policy). The Board believes that each Trustee satisfied at the time he or she was initially elected or appointed a Trustee, and continues to satisfy, the standards contemplated by the Statement of Policy. The Governance and Nominating Committee also engages professional search firms to help identify potential Independent Trustee candidates who have the experience, qualifications, attributes, and skills consistent with the Statement of Policy. From time to time, additional criteria based on the composition and skills of the current Independent Trustees, as well as experience or skills that may be appropriate in light of future changes to board composition, business conditions, and regulatory or other developments, have also been considered by the professional search firms and the Governance and Nominating Committee. In addition, the Board takes into account the Trustees' commitment and participation in Board and committee meetings, as well as their leadership of standing and ad hoc committees throughout their tenure.
Annual Report
In determining that a particular Trustee was and continues to be qualified to serve as a Trustee, the Board has considered a variety of criteria, none of which, in isolation, was controlling. The Board believes that, collectively, the Trustees have balanced and diverse experience, qualifications, attributes, and skills, which allow the Board to operate effectively in governing each fund and protecting the interests of shareholders. Information about the specific experience, skills, attributes, and qualifications of each Trustee, which in each case led to the Board's conclusion that the Trustee should serve (or continue to serve) as a trustee of the funds, is provided below.
Board Structure and Oversight Function. James C. Curvey is an interested person (as defined in the 1940 Act) and currently serves as Chairman. The Trustees have determined that an interested Chairman is appropriate and benefits shareholders because an interested Chairman has a personal and professional stake in the quality and continuity of services provided to the funds. Independent Trustees exercise their informed business judgment to appoint an individual of their choosing to serve as Chairman, regardless of whether the Trustee happens to be independent or a member of management. The Independent Trustees have determined that they can act independently and effectively without having an Independent Trustee serve as Chairman and that a key structural component for assuring that they are in a position to do so is for the Independent Trustees to constitute a substantial majority for the Board. The Independent Trustees also regularly meet in executive session. Ned C. Lautenbach serves as Chairman of the Independent Trustees and as such (i) acts as a liaison between the Independent Trustees and management with respect to matters important to the Independent Trustees and (ii) with management prepares agendas for Board meetings.
Fidelity funds are overseen by different Boards of Trustees. The funds' Board oversees Fidelity's equity and high income funds and another Board oversees Fidelity's investment-grade bond, money market, and asset allocation funds. The asset allocation funds may invest in Fidelity funds overseen by the funds' Board. The use of separate Boards, each with its own committee structure, allows the Trustees of each group of Fidelity funds to focus on the unique issues of the funds they oversee, including common research, investment, and operational issues. On occasion, the separate Boards establish joint committees to address issues of overlapping consequences for the Fidelity funds overseen by each Board.
The Trustees operate using a system of committees to facilitate the timely and efficient consideration of all matters of importance to the Trustees, each fund, and fund shareholders and to facilitate compliance with legal and regulatory requirements and oversight of the funds' activities and associated risks. The Board, acting through its committees, has charged FMR and its affiliates with (i) identifying events or circumstances the occurrence of which could have demonstrably adverse effects on the funds' business and/or reputation; (ii) implementing processes and controls to lessen the possibility that such events or circumstances occur or to mitigate the effects of such events or circumstances if they do occur; and (iii) creating and maintaining a system designed to evaluate continuously business and market conditions in order to facilitate the identification and implementation processes described in (i) and (ii) above. Because the day-to-day operations and activities of the funds are carried out by or through FMR, its affiliates and other service providers, the funds' exposure to risks is mitigated but not eliminated by the processes overseen by the Trustees. While each of the Board's committees has responsibility for overseeing different aspects of the funds' activities, oversight is exercised primarily through the Operations, Audit, and Compliance Committees. In addition, the Independent Trustees have worked with FMR to enhance the Board's oversight of investment and financial risks, legal and regulatory risks, technology risks, and operational risks, including the development of additional risk reporting to the Board. For example, a working group comprised of Independent Trustees and FMR has worked and continues to work to review the Fidelity funds' valuation-related activities, reporting and risk management. Appropriate personnel, including but not limited to the funds' Chief Compliance Officer (CCO), FMR's internal auditor, the independent accountants, the funds' Treasurer and portfolio management personnel, make periodic reports to the Board's committees, as appropriate, including an annual review of FMR's risk management program for the Fidelity funds. The responsibilities of each standing committee, including their oversight responsibilities, are described further under "Standing Committees of the Funds' Trustees."
Annual Report
Trustees and Officers - continued
The fund's Statement of Additional Information (SAI) includes more information about the Trustees. To request a free copy, call Fidelity at 1-800-835-5092.
Interested Trustees*:
Correspondence intended for each Trustee who is an interested person may be sent to Fidelity Investments, 245 Summer Street, Boston, Massachusetts 02210.
Name, Year of Birth; Principal Occupations and Other Relevant Experience+ |
James C. Curvey (1935) |
| Year of Election or Appointment: 2007 Mr. Curvey is Trustee and Chairman of the Board of Trustees of certain Trusts. Mr. Curvey also serves as Trustee (2007-present) of other investment companies advised by FMR. Mr. Curvey is a Director of Fidelity Investments Money Management, Inc. (2009-present), Director of Fidelity Research & Analysis Co. (2009-present) and Director of FMR and FMR Co., Inc. (2007-present). Mr. Curvey is also Vice Chairman (2007-present) and Director of FMR LLC. In addition, Mr. Curvey serves as an Overseer for the Boston Symphony Orchestra and a member of the Trustees of Villanova University. Previously, Mr. Curvey was the Vice Chairman (2006-2007) and Director (2000-2007) of FMR Corp. |
Ronald P. O'Hanley (1957) |
| Year of Election or Appointment: 2011 Mr. O'Hanley serves as a Trustee and Chairman of the Board of Trustees of other Fidelity funds (2013-present), and is Director of FMR Co., Inc. (2010-present), Director of Fidelity Investments Money Management, Inc. (2010-present), Director of Fidelity Research & Analysis Company (2010-present), President of Fidelity Asset Management and Corporate Services and a Member of Fidelity's Executive Committee (2010-present). Previously, Mr. O'Hanley served as President and Chief Executive Officer of BNY Mellon Asset Management (2007-2010). Mr. O'Hanley also served as Vice Chairman of Bank New York Mellon Corp. and a member of that firm's Executive Committee. Prior to the 2007 merger of The Bank of New York and Mellon Financial Corporation, he was Vice Chairman of Mellon Financial Corporation and President and Chief Executive Officer of Mellon Asset Management. He joined Mellon in February 1997. Mr. O'Hanley currently serves as Chairman of the Boston Public Library Foundation Board of Directors and sits on the Board of Directors of Beth Israel Deaconess Medical Center, the Board of Trustees of the Marine Biological Laboratory and the Advisory Board of the Maxwell School of Citizenship and Public Administration at Syracuse University. Mr. O'Hanley also chairs the Council on Asset Management for the Financial Services Roundtable and is a member of the Board of Directors of Institutional Investor's U.S. Institute. |
* Trustees have been determined to be "Interested Trustees" by virtue of, among other things, their affiliation with the trust or various entities under common control with FMR.
+ The information above includes each Trustee's principal occupation during the last five years and other information relating to the experience, attributes, and skills relevant to each Trustee's qualifications to serve as a Trustee, which led to the conclusion that each Trustee should serve as a Trustee for each fund.
Annual Report
Trustees and Officers - continued
Independent Trustees:
Correspondence intended for each Independent Trustee (that is, the Trustees other than the Interested Trustees) may be sent to Fidelity Investments, P.O. Box 55235, Boston, Massachusetts 02205-5235.
Name, Year of Birth; Principal Occupations and Other Relevant Experience+ |
Dennis J. Dirks (1948) |
| Year of Election or Appointment: 2005 Prior to his retirement in May 2003, Mr. Dirks was Chief Operating Officer and a member of the Board of The Depository Trust & Clearing Corporation (DTCC). He also served as President, Chief Operating Officer, and Board member of The Depository Trust Company (DTC) and President and Board member of the National Securities Clearing Corporation (NSCC). In addition, Mr. Dirks served as Chief Executive Officer and Board member of the Government Securities Clearing Corporation, Chief Executive Officer and Board member of the Mortgage-Backed Securities Clearing Corporation, as a Trustee and a member of the Finance Committee of Manhattan College (2005-2008), and as a Trustee and a member of the Finance Committee of AHRC of Nassau County (2006-2008). Mr. Dirks is a member of the Independent Directors Council (IDC) Governing Council (2010-present) and Board of Directors for The Brookville Center for Children's Services, Inc. (2009-present). |
Alan J. Lacy (1953) |
| Year of Election or Appointment: 2008 Mr. Lacy serves as Senior Adviser (2007-present) of Oak Hill Capital Partners, L.P. (private equity). Mr. Lacy also served as Chief Executive Officer (2000-2005) and Vice Chairman (2005-2006) of Sears Holdings Corporation and Sears, Roebuck and Co. (retail). In addition, Mr. Lacy serves as a member of the Board of Directors of Dave & Buster's Entertainment, Inc. (restaurant and entertainment complexes, 2010-present), Earth Fare, Inc. (retail grocery, 2012-present), The Hillman Companies, Inc. (hardware wholesalers, 2010-present), and Bristol-Myers Squibb Company (global pharmaceuticals, 2008-present). Mr. Lacy is a member of the Board of Trustees of The National Parks Conservation Association (2006-present). Previously, Mr. Lacy served as Chairman of the Board of Trustees of the National Parks Conservation Association (2008-2011) and as a member of the Board of Directors for the Western Union Company (global money transfer, 2006-2011). |
Ned C. Lautenbach (1944) |
| Year of Election or Appointment: 2000 Mr. Lautenbach is Chairman of the Independent Trustees of the Equity and High Income Funds (2006-present) and serves as a Trustee of other Fidelity funds (2013-present). Mr. Lautenbach currently serves as the Lead Director of the Eaton Corporation Board of Directors (diversified industrial, 1997-present). Mr. Lautenbach is Chairman of the Board of Directors of the Philharmonic Center for the Arts in Naples, Florida (2012-present) and a member of the Council on Foreign Relations (1994-present). Previously, Mr. Lautenbach was a Partner/Advisory Partner at Clayton, Dubilier & Rice, LLC (private equity investment, 1998-2010), as well as a Director of Sony Corporation (2006-2007). |
Joseph Mauriello (1944) |
| Year of Election or Appointment: 2008 Prior to his retirement in January 2006, Mr. Mauriello served in numerous senior management positions including Deputy Chairman and Chief Operating Officer (2004-2005), and Vice Chairman of Financial Services (2002-2004) of KPMG LLP US (professional services, 1965-2005). Mr. Mauriello currently serves as a member of the Board of Directors of XL Group plc. (global insurance and re-insurance, 2006-present). Previously, Mr. Mauriello served as a Director of the Hamilton Funds of the Bank of New York (2006-2007) and of Arcadia Resources Inc. (health care services and products, 2007-2012). |
Robert W. Selander (1950) |
| Year of Election or Appointment: 2011 Previously, Mr. Selander served as a Member of the Advisory Board of Fidelity's Equity and High Income Funds (2011), Executive Vice Chairman (2010), Chief Executive Officer (2009-2010), and President and Chief Executive Officer (1997-2009) of Mastercard, Inc. |
Cornelia M. Small (1944) |
| Year of Election or Appointment: 2005 Ms. Small is a member of the Board of Directors (2009-present) and Chair of the Investment Committee (2010-present) of the Teagle Foundation. Ms. Small also serves on the Investment Committee of the Berkshire Taconic Community Foundation (2008-present). Previously, Ms. Small served as Chairperson (2002-2008) and a member of the Investment Committee and Chairperson (2008-2012) and a member of the Board of Trustees of Smith College. In addition, Ms. Small served as Chief Investment Officer, Director of Global Equity Investments, and a member of the Board of Directors of Scudder, Stevens & Clark and Scudder Kemper Investments. |
William S. Stavropoulos (1939) |
| Year of Election or Appointment: 2002 Mr. Stavropoulos is Vice Chairman of the Independent Trustees of the Equity and High Income Funds (2006-present) and serves as a Trustee of other Fidelity funds (2013-present). Mr. Stavropoulos serves as President and Founder of the Michigan Baseball Foundation, the Great Lakes Loons (2007-present). Mr. Stavropoulos is Chairman Emeritus of the Board of Directors of The Dow Chemical Company, where he previously served in numerous senior management positions, including President, CEO (1995-2000; 2002-2004), Chairman of the Executive Committee (2000-2006), and as a member of the Board of Directors (1990-2006). Currently, Mr. Stavropoulos is Chairman of the Board of Directors of Univar Inc. (global distributor of commodity and specialty chemicals), a Director of Teradata Corporation (data warehousing and technology solutions), and Maersk Inc. (industrial conglomerate), and a member of the Advisory Board for Metalmark Capital LLC (private equity investment, 2005-present). Mr. Stavropoulos is an operating advisor to Clayton, Dubilier & Rice, LLC (private equity investment). In addition, Mr. Stavropoulos is a member of the University of Notre Dame Advisory Council for the College of Science, a Trustee of the Rollin L. Gerstacker Foundation, and a Director of the Naples Philharmonic Center for the Arts. Previously, Mr. Stavropoulos served as a Director of Chemical Financial Corporation (bank holding company, 1993-2012) and Tyco International, Ltd. (multinational manufacturing and services, 2007-2012). |
David M. Thomas (1949) |
| Year of Election or Appointment: 2008 Previously, Mr. Thomas served as Executive Chairman (2005-2006) and Chairman and Chief Executive Officer (2000-2005) of IMS Health, Inc. (pharmaceutical and healthcare information solutions), and a Director of Fortune Brands, Inc. (consumer products, 2000-2011). In addition, Mr. Thomas serves as Non-Executive Chairman of the Board of Directors of Fortune Brands Home and Security (home and security products, 2011-present), and as a member of the Board of Directors of Interpublic Group of Companies, Inc. (marketing communication, 2004-present). |
+ The information above includes each Trustee's principal occupation during the last five years and other information relating to the experience, attributes, and skills relevant to each Trustee's qualifications to serve as a Trustee, which led to the conclusion that each Trustee should serve as a Trustee for each fund.
Annual Report
Advisory Board Member and Executive Officers:
Correspondence intended for each executive officer and Peter S. Lynch may be sent to Fidelity Investments, 245 Summer Street, Boston, Massachusetts 02210.
Name, Year of Birth; Principal Occupation |
Peter S. Lynch (1944) |
| Year of Election or Appointment: 2003 Member of the Advisory Board of Fidelity's Equity and High Income Funds. Mr. Lynch is Vice Chairman and a Director of FMR and FMR Co., Inc. In addition, Mr. Lynch serves as a Trustee of Boston College and as the Chairman of the Inner-City Scholarship Fund. Previously, Mr. Lynch served on the Special Olympics International Board of Directors (1997-2006). |
Kenneth B. Robins (1969) |
| Year of Election or Appointment: 2008 President and Treasurer of Fidelity's Equity and High Income Funds. Mr. Robins also serves as President and Treasurer (2008-present) and Assistant Treasurer (2009-present) of other Fidelity funds and is an employee of Fidelity Investments (2004-present). Mr. Robins serves as Executive Vice President of Fidelity Investments Money Management, Inc. (FIMM) (2013-present). Previously, Mr. Robins served as Deputy Treasurer of the Fidelity funds (2005-2008) and Treasurer and Chief Financial Officer of The North Carolina Capital Management Trust: Cash and Term Portfolios (2006-2008). |
Bruce T. Herring (1965) |
| Year of Election or Appointment: 2006 Vice President of certain Equity Funds. Mr. Herring also serves as Vice President of other Fidelity funds (2013-present), Chief Investment Officer of Fidelity Global Asset Allocation (GAA) (2013-present), Chief Investment Officer and Director of Fidelity Management & Research (U.K.) Inc. (2010-present), Group Chief Investment Officer of FMR, and President of Fidelity Research & Analysis Company (2010-present). Previously, Mr. Herring served as Vice President (2005-2006) and Senior Vice President (2006-2007) of Fidelity Management & Research Company, Vice President of FMR Co., Inc. (2001-2007) and as a portfolio manager for Fidelity U.S. Equity Funds. |
Brian B. Hogan (1964) |
| Year of Election or Appointment: 2009 Vice President of Equity and High Income Funds. Mr. Hogan also serves as Vice President of other Fidelity funds (2009-present) and President of FMR's Equity Division (2009-present). Previously, Mr. Hogan served as Senior Vice President, Equity Research of FMR (2006-2009) and as a portfolio manager. |
Scott C. Goebel (1968) |
| Year of Election or Appointment: 2008 Secretary and Chief Legal Officer (CLO) of the Fidelity funds. Mr. Goebel also serves as Secretary of Fidelity Investments Money Management, Inc. (FIMM) (2010-present) and Fidelity Research and Analysis Company (FRAC) (2010-present); Secretary and CLO of The North Carolina Capital Management Trust: Cash and Term Portfolios (2008-present); General Counsel, Secretary, and Senior Vice President of FMR (2008-present) and FMR Co., Inc. (2008-present); employed by FMR LLC or an affiliate (2001-present); Chief Legal Officer of Fidelity Management & Research (Hong Kong) Limited (2008-present) and Assistant Secretary of Fidelity Management & Research (Japan) Inc. (2008-present), and Fidelity Management & Research (U.K.) Inc. (2008-present). Previously, Mr. Goebel served as Assistant Secretary of FIMM (2008-2010), FRAC (2008-2010), and the Funds (2007-2008) and as Vice President and Secretary of Fidelity Distributors Corporation (FDC) (2005-2007). |
William C. Coffey (1969) |
| Year of Election or Appointment: 2009 Assistant Secretary of Fidelity's Equity and High Income Funds. Mr. Coffey also serves as Assistant Secretary of other Fidelity funds (2009-present), Senior Vice President and Deputy General Counsel of FMR LLC (2010-present), and is an employee of Fidelity Investments. Previously, Mr. Coffey served as Vice President and Associate General Counsel of FMR LLC (2005-2009). |
Elizabeth Paige Baumann (1968) |
| Year of Election or Appointment: 2012 Anti-Money Laundering (AML) Officer of the Fidelity funds. Ms. Baumann also serves as AML Officer of The North Carolina Capital Management Trust: Cash and Term Portfolios (2012-present), Chief AML Officer of FMR LLC (2012-present), and is an employee of Fidelity Investments. Previously, Ms. Baumann served as Vice President and Deputy Anti-Money Laundering Officer (2007-2012). |
Christine Reynolds (1958) |
| Year of Election or Appointment: 2008 Chief Financial Officer of the Fidelity funds. Ms. Reynolds became President of Fidelity Pricing and Cash Management Services (FPCMS) in August 2008. Ms. Reynolds served as Chief Operating Officer of FPCMS (2007-2008). Previously, Ms. Reynolds served as President, Treasurer, and Anti-Money Laundering officer of the Fidelity funds (2004-2007). |
Joseph A. Hanlon (1968) |
| Year of Election or Appointment: 2012 Chief Compliance Officer of Fidelity's Equity and High Income Funds. Mr. Hanlon also serves as Chief Compliance Officer of other Fidelity funds (2012-present). Mr. Hanlon serves as Compliance Officer of FMR, FMR Co., Inc., Fidelity Investments Money Management, Inc. (FIMM), Fidelity Research and Analysis Company (FRAC), and Fidelity Management & Research (Hong Kong) (2009-present), as Senior Vice President of the Fidelity Asset Management Division (2009-present), and is an employee of Fidelity Investments. Previously, Mr. Hanlon served as Compliance Officer of Fidelity Management & Research (Japan) Inc. (2009-2013), Strategic Advisers, Inc. (2009-2013), and Fidelity Management & Research (U.K.) Inc. (2009-2013). |
Joseph F. Zambello (1957) |
| Year of Election or Appointment: 2011 Deputy Treasurer of the Fidelity funds. Mr. Zambello is an employee of Fidelity Investments. Previously, Mr. Zambello served as Vice President of FMR's Program Management Group (2009-2011) and Vice President of the Transfer Agent Oversight Group (2005-2009). |
Adrien E. Deberghes (1967) |
| Year of Election or Appointment: 2008 Deputy Treasurer of Fidelity's Equity and High Income Funds. Mr. Deberghes also serves as Vice President (2011-present), Deputy Treasurer (2008-present), and Assistant Treasurer (2010-present) of other Fidelity funds, and is an employee of Fidelity Investments (2008-present). Previously, Mr. Deberghes served as Senior Vice President of Mutual Fund Administration at State Street Corporation (2007-2008), Senior Director of Mutual Fund Administration at Investors Bank & Trust (2005-2007), and Director of Finance for Dunkin' Brands (2000-2005). |
Stephen Sadoski (1971) |
| Year of Election or Appointment: 2012 Deputy Treasurer of Fidelity's Equity and High Income Funds. Mr. Sadoski also serves as Deputy Treasurer of other Fidelity funds (2012-present) and is an employee of Fidelity Investments (2012-present). Previously, Mr. Sadoski served as Assistant Treasurer of Fidelity's Fixed Income and Asset Allocation Funds (2012-2013), an assistant chief accountant in the Division of Investment Management of the Securities and Exchange Commission (SEC) (2009-2012) and as a senior manager at Deloitte & Touche LLP (1997-2009). |
Stacie M. Smith (1974) |
| Year of Election or Appointment: 2013 Deputy Treasurer of Fidelity's Equity and High Income Funds. Ms. Smith also serves as Deputy Treasurer of other Fidelity funds (2013-present) and is an employee of Fidelity Investments (2009-present). Previously, Ms. Smith served as Senior Audit Manager of Ernst & Young LLP (1996-2009). |
Stephanie J. Dorsey (1969) |
| Year of Election or Appointment: 2010 Assistant Treasurer of Fidelity's Equity and High Income Funds. Ms. Dorsey also serves as President and Treasurer (2013-present) and Assistant Treasurer (2010-present) of other Fidelity funds, Treasurer and Chief Financial Officer of The North Carolina Capital Management Trust: Cash and Term Portfolios (2013-present), and is an employee of Fidelity Investments (2008-present). Previously, Ms. Dorsey served as Deputy Treasurer of Fidelity's Fixed Income and Asset Allocation Funds (2008-2013), Treasurer (2004-2008) of the JPMorgan Mutual Funds and Vice President (2004-2008) of JPMorgan Chase Bank. |
Gary W. Ryan (1958) |
| Year of Election or Appointment: 2005 Assistant Treasurer of the Fidelity funds. Mr. Ryan is an employee of Fidelity Investments. Previously, Mr. Ryan served as Vice President of Fund Reporting in Fidelity Pricing and Cash Management Services (FPCMS) (1999-2005). |
Jonathan Davis (1968) |
| Year of Election or Appointment: 2010 Assistant Treasurer of the Fidelity funds. Mr. Davis is also Assistant Treasurer of Fidelity Rutland Square Trust II and Fidelity Commonwealth Trust II. Mr. Davis is an employee of Fidelity Investments. Previously, Mr. Davis served as Vice President and Associate General Counsel of FMR LLC (2003-2010). |
Annual Report
The Board of Trustees of Fidelity Blue Chip Growth Fund voted to pay to shareholders of record at the opening of business on record date, the following distributions per share derived from capital gains realized from sales of portfolio securities; and dividends derived from net investment income:
| Pay Date | Record Date | Dividends | Capital Gains |
Class F | 09/09/13 | 09/06/13 | $0.210 | $3.176 |
The fund hereby designates as a capital gain dividend with respect to the taxable year ended July 31, 2013, $1,227,651,246, or, if subsequently determined to be different, the net capital gain of such year.
Class F designates 100% of the dividends distributed during the fiscal year as qualifying for the dividends-received deduction for corporate shareholders.
Class F designates 100% of the dividends distributed during the fiscal year as amounts which can be taken into account as a dividend for the purposes of the maximum rate under section 1(h)(11) of the Internal Revenue Code.
The fund will notify shareholders in January 2014 of amounts for use in preparing 2013 income tax returns.
Annual Report
Board Approval of Investment Advisory Contracts and Management Fees
Fidelity Blue Chip Growth Fund
Each year, the Board of Trustees, including the Independent Trustees (together, the Board), votes on the renewal of the management contract and sub-advisory agreements (together, the Advisory Contracts) for the fund. The Board, assisted by the advice of fund counsel and Independent Trustees' counsel, requests and considers a broad range of information relevant to the renewal of the Advisory Contracts throughout the year.
The Board meets regularly and, at each of its meetings, covers an extensive agenda of topics and materials and considers factors that are relevant to its annual consideration of the renewal of the fund's Advisory Contracts, including the services and support provided to the fund and its shareholders. The Board has established various standing committees, each composed of and chaired by Independent Trustees with varying backgrounds, to which the Board has assigned specific subject matter responsibilities in order to enhance effective decision-making by the Board. The Board, acting directly and through its Committees, requests and receives information concerning the annual consideration of the renewal of the fund's Advisory Contracts. The Board also meets as needed to consider matters specifically related to the Board's annual consideration of the renewal of Advisory Contracts. Members of the Board may also meet with trustees of other Fidelity funds through ad hoc joint committees to discuss certain matters relevant to the Fidelity funds.
At its July 2013 meeting, the Board, including the Independent Trustees, unanimously determined to renew the fund's Advisory Contracts. In reaching its determination, the Board considered all factors it believed relevant, including (i) the nature, extent, and quality of the services to be provided to the fund and its shareholders (including the investment performance of the fund); (ii) the competitiveness of the fund's management fee and total expense ratio relative to peer funds; (iii) the total costs of the services to be provided by and the profits to be realized by Fidelity from its relationship with the fund; (iv) the extent to which economies of scale exist and would be realized as the fund grows; and (v) whether fee levels reflect these economies of scale, if any, for the benefit of fund shareholders.
In considering whether to renew the Advisory Contracts for the fund, the Board reached a determination, with the assistance of fund counsel and Independent Trustees' counsel and through the exercise of its business judgment, that the renewal of the Advisory Contracts was in the best interests of the fund and its shareholders and that the compensation payable under the Advisory Contracts was fair and reasonable. The Board's decision to renew the Advisory Contracts was not based on any single factor, but rather was based on a comprehensive consideration of all the information provided to the Board at its meetings throughout the year. The Board, in reaching its determination to renew the Advisory Contracts, was aware that shareholders in the fund have a broad range of investment choices available to them, including a wide choice among mutual funds offered by Fidelity's competitors, and that the fund's shareholders, who have the opportunity to review and weigh the disclosure provided by the fund in its prospectus and other public disclosures, have chosen to invest in this fund, which is a part of the Fidelity family of funds.
Annual Report
Nature, Extent, and Quality of Services Provided. The Board considered the staffing within the investment adviser, Fidelity Management & Research Company (FMR), and the sub-advisers (together, the Investment Advisers) as it relates to the fund, including the backgrounds of the fund's investment personnel, and also considered the fund's investment objective, strategies, and related investment philosophy. The Independent Trustees also had discussions with senior management of Fidelity's investment operations and investment groups. The Board considered the structure of the portfolio manager compensation program and whether this structure provides appropriate incentives to act in the best interests of the fund.
Resources Dedicated to Investment Management and Support Services. The Board and the Fund Oversight and Research Committees reviewed the general qualifications and capabilities of the Investment Advisers' investment staff, including its size, education, experience, and resources, as well as the Investment Advisers' approach to recruiting, training, managing, and compensating investment personnel. The Board noted that FMR has continued to increase the resources devoted to non-U.S. offices, including expansion of Fidelity's global investment organization. The Board also noted that Fidelity's analysts have extensive resources, tools and capabilities that allow them to conduct sophisticated quantitative and fundamental analysis, as well as credit analysis of issuers, counterparties and guarantors. Further, the Board believes that Fidelity's investment professionals have sufficient access to global information and data so as to provide competitive investment results over time, and that those professionals also have access to sophisticated tools that permit them to assess portfolio construction and risk and performance attribution characteristics continuously, as well as to transmit new information and research conclusions rapidly around the world. Additionally, in its deliberations, the Board considered the Investment Advisers' trading and risk management capabilities and resources, which are an integral part of the investment management process.
Shareholder and Administrative Services. The Board considered (i) the nature, extent, quality, and cost of advisory, administrative, and shareholder services performed by the Investment Advisers and their affiliates under the Advisory Contracts and under separate agreements covering transfer agency, pricing and bookkeeping, and securities lending services for the fund; (ii) the nature and extent of the supervision of third party service providers, principally custodians and subcustodians; and (iii) the resources devoted to, and the record of compliance with, the fund's compliance policies and procedures. The Board also reviewed the allocation of fund brokerage, including allocations to brokers affiliated with the Investment Advisers, the use of brokerage commissions to pay fund expenses, and the use of "soft" commission dollars to pay for research services.
Annual Report
Board Approval of Investment Advisory Contracts and
Management Fees - continued
The Board noted that the growth of fund assets over time across the complex allows Fidelity to reinvest in the development of services designed to enhance the value or convenience of the Fidelity funds as investment vehicles. These services include 24-hour access to account information and market information through telephone representatives and over the Internet, investor education materials and asset allocation tools, and the expanded availability of Fidelity Investor Centers.
Investment in a Large Fund Family. The Board considered the benefits to shareholders of investing in a Fidelity fund, including the benefits of investing in a fund that is part of a large family of funds offering a variety of investment disciplines and providing a large variety of mutual fund investor services. The Board noted that Fidelity had taken, or had made recommendations that resulted in the Fidelity funds taking, a number of actions over the previous year that benefited particular funds, including (i) continuing to dedicate additional resources to investment research and to the support of the senior management team that oversees asset management; (ii) persisting in efforts to enhance Fidelity's global research capabilities; (iii) launching new funds and making other enhancements to meet client needs for global and income-oriented solutions; (iv) continuing to launch dedicated lower cost underlying funds to meet portfolio construction needs related to expanding underlying fund options for Fidelity funds of funds, specifically for the Freedom Fund product lines; (v) rationalizing product lines and gaining increased efficiencies through the mergers of several funds into other funds; (vi) strengthening Fidelity's index fund offerings by reducing investment minimums and adopting or lowering existing expense caps for certain funds and classes; (vii) enhancing Global Asset Allocation product offerings by launching new funds and strategies, including "open architecture" target date funds that utilize affiliated and unaffiliated sub-advisers; (viii) modifying the eligibility criteria for Institutional Class shares of Advisor funds to increase their marketability to a portion of the defined contribution plan market; (ix) creating a new low-cost retirement share class for certain Advisor funds to appeal to large retirement plans; (x) transitioning the management of certain Fidelity commodity funds to Geode Capital Management LLC, a registered commodity pool operator, while retaining administrative responsibilities for the funds; (xi) reorganizing a number of funds; and (xii) taking steps toward establishing a new Fidelity adviser to manage sector-based funds and products.
Investment Performance. The Board considered whether the fund has operated in accordance with its investment objective, as well as its record of compliance with its investment restrictions and its performance history.
The Board took into account discussions with the Investment Advisers about fund investment performance that occur at Board meetings throughout the year. In this regard the Board noted that as part of regularly scheduled fund reviews and other reports to the Board on fund performance, the Board periodically considers annualized return information for the fund, for different time periods, measured against a securities market index ("benchmark index") and a peer group of mutual funds with similar objectives ("peer group"). In its evaluation of fund investment performance, the Board gave particular attention to information indicating changes in performance of certain Fidelity funds for specific time periods and the Investment Advisers' explanations for any overperformance or underperformance.
Annual Report
In addition to reviewing absolute and relative fund performance, the Independent Trustees periodically consider the appropriateness of fund performance metrics in evaluating the results achieved. In general, the Independent Trustees believe that fund performance should be evaluated based on net performance (after fees and expenses) of both the highest performing and lowest performing classes, where applicable, compared to appropriate benchmark indices, over appropriate time periods which may include full market cycles, and compared to peer groups, as applicable, over the same periods, taking into account relevant factors including the following: general market conditions; issuer-specific information; tactical opportunities for investment; and fund cash flows and other factors.
The Independent Trustees recognize that shareholders evaluate performance on a net basis over their own holding periods, for which one-, three-, and five-year periods are used as a proxy. For this reason, the performance information reviewed by the Board also included net cumulative calendar year total return information for the fund and an appropriate benchmark index and peer group for the most recent one-, three-, and five-year periods, as shown below. Returns are shown compared to the 25th percentile (top of box) and 75th percentile (bottom of box) of the peer universe.
Fidelity Blue Chip Growth Fund
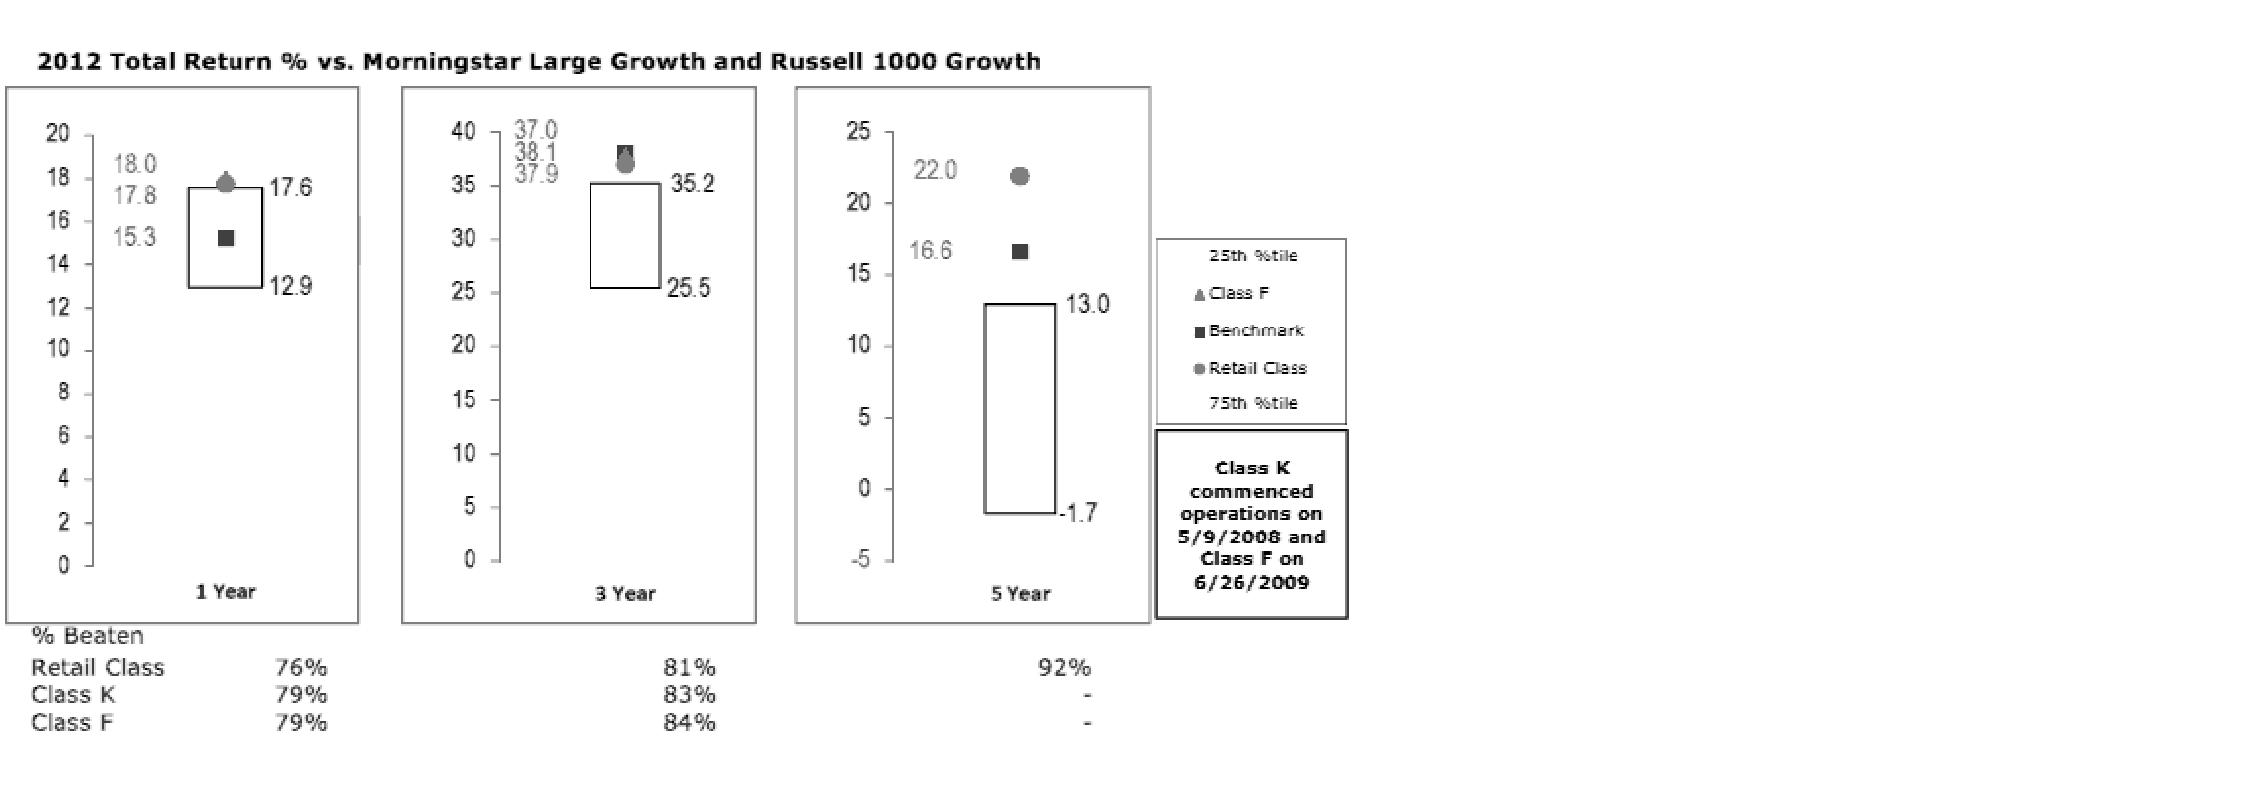
Annual Report
Board Approval of Investment Advisory Contracts and
Management Fees - continued
The Board also considered that the fund's management fee is subject to upward or downward adjustment depending upon whether, and to what extent, the fund's investment performance for the performance period exceeds, or is exceeded by, a securities index, thus leading to a performance adjustment for the same period. The Board noted that the performance adjustment provides FMR with a strong economic incentive to seek to achieve superior performance for the fund's shareholders and helps to more closely align the interests of FMR and the fund's shareholders.
Based on its review, the Board concluded that the nature, extent, and quality of services provided to the fund under the Advisory Contracts should benefit the fund's shareholders.
Competitiveness of Management Fee and Total Expense Ratio. The Board considered the fund's management fee and total expense ratio compared to "mapped groups" of competitive funds and classes. Fidelity creates "mapped groups" by combining similar Lipper investment objective categories that have comparable management fee characteristics. Combining Lipper investment objective categories aids the Board's management fee and total expense ratio comparisons by broadening the competitive group used for comparison and by reducing the number of universes to which various Fidelity funds are compared.
Management Fee. The Board considered two proprietary management fee comparisons for the 12-month periods shown in the chart below. The group of Lipper funds used by the Board for management fee comparisons is referred to below as the "Total Mapped Group." The Total Mapped Group comparison focuses on a fund's standing in terms of gross management fees before expense reimbursements or caps, and without giving effect to the fund's performance adjustment, relative to the total universe of funds with comparable investment mandates, regardless of whether their management fee structures also are comparable. Funds with comparable investment mandates offer exposure to similar types of securities. Funds with comparable management fee structures have similar management fee contractual arrangements (e.g., flat rate charged for advisory services, all-inclusive fee rate, etc.). "TMG %" represents the percentage of funds in the Total Mapped Group that had management fees that were lower than the fund's. For example, a TMG % of 11% means that 89% of the funds in the Total Mapped Group had higher management fees than the fund. The "Asset-Size Peer Group" (ASPG) comparison focuses on a fund's standing relative to a subset of non-Fidelity funds within the Total Mapped Group that are similar in size and management fee structure. The ASPG represents at least 15% of the funds in the Total Mapped Group with comparable asset size and management fee structures, subject to a minimum of 50 funds (or all funds in the Total Mapped Group if fewer than 50). Additional information, such as the ASPG quartile in which the fund's management fee ranked and the impact of the fund's performance adjustment, is also included in the chart and considered by the Board.
Annual Report
Fidelity Blue Chip Growth Fund
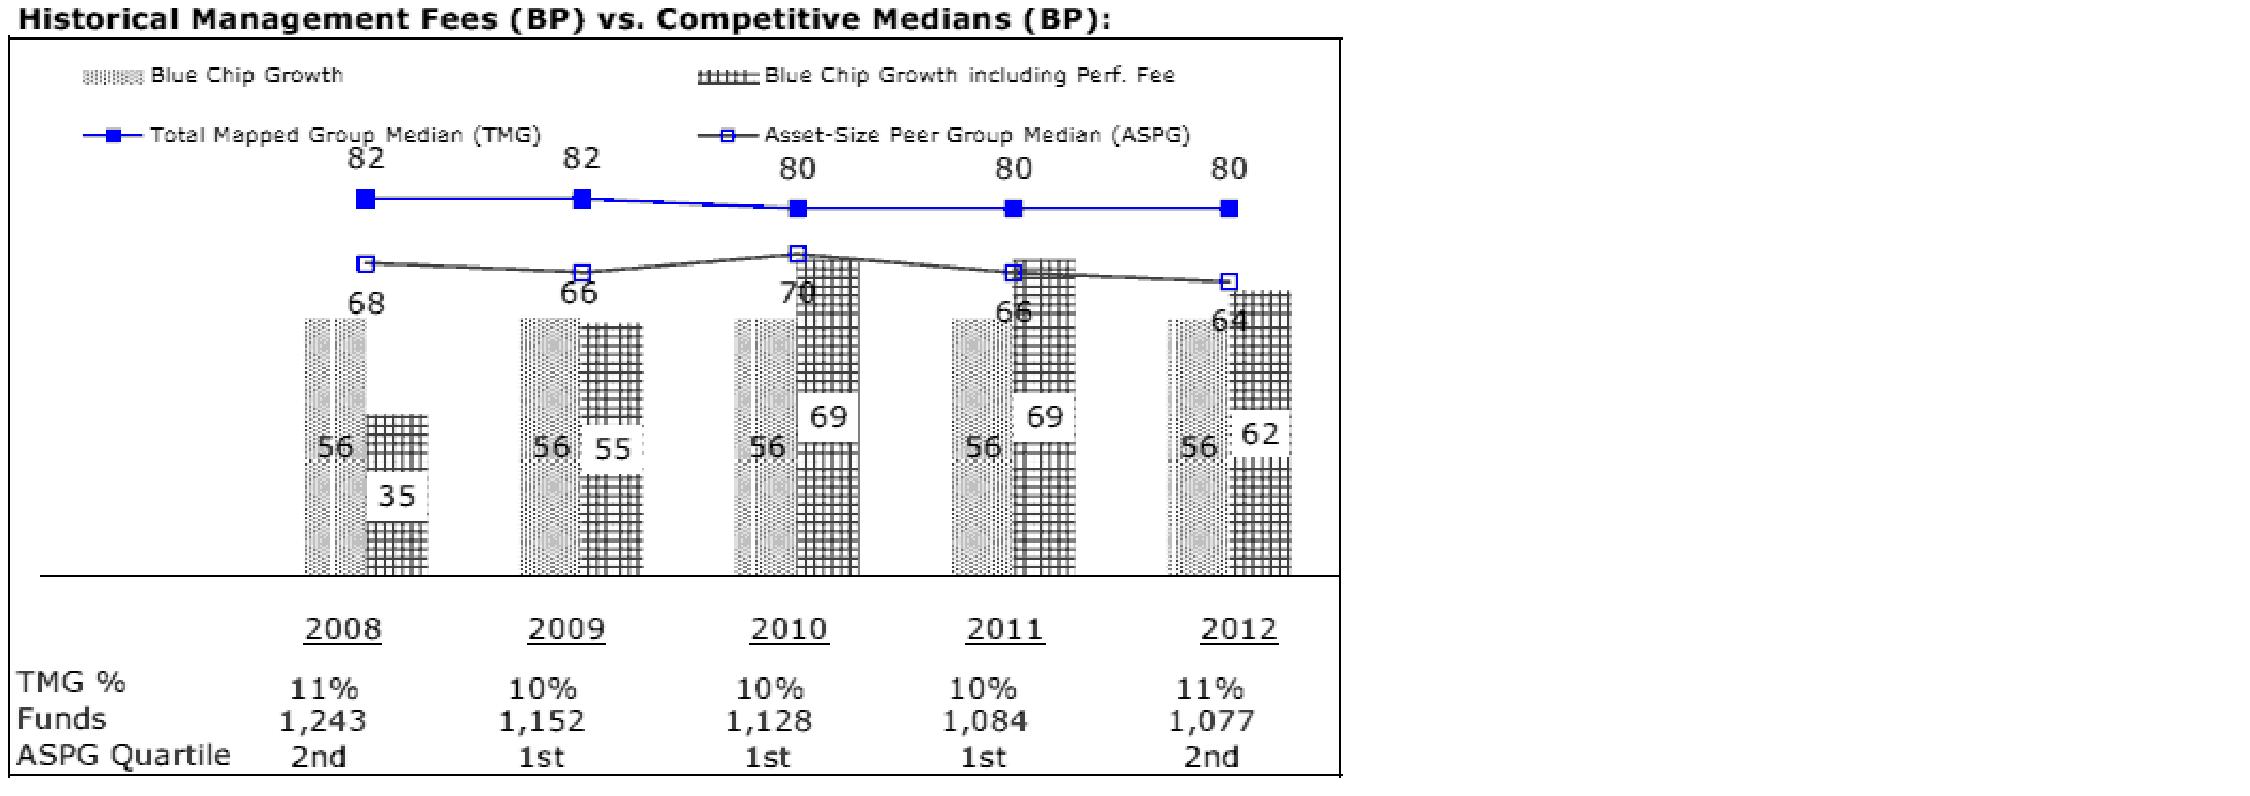
The Board noted that the fund's management fee ranked below the median of its Total Mapped Group and below the median of its ASPG for 2012. The Board also noted the effect of the fund's positive performance adjustment on the fund's management fee ranking.
Furthermore, the Board considered that shareholders approved a prospective change in the index used to calculate the fund's performance adjustment beginning June 1, 2006. The Board also considered that, because the performance adjustment is based on a rolling 36-month measurement period, during a transition period the fund's performance is compared to a blended index return that reflects the performance of the former index for the portion of the measurement period prior to June 1, 2006 and the performance of the current index for the remainder of the measurement period. The Board noted that the fund's performance adjustments for 2008 and 2009 shown in the chart above reflect the effect of using the blended index return to calculate the fund's performance adjustment.
Based on its review, the Board concluded that the fund's management fee is fair and reasonable in light of the services that the fund receives and the other factors considered.
Total Expense Ratio. In its review of each class's total expense ratio, the Board considered the fund's management fee as well as other fund or class expenses, as applicable, such as transfer agent fees, pricing and bookkeeping fees, and custodial, legal, and audit fees. The Board also noted the effects of any waivers and reimbursements on fees and expenses, as well as the impact of the fund's performance adjustment. As part of its review, the Board also considered the current and historical total expense ratios of each class of the fund compared to competitive fund median expenses. Each class of the fund is compared to those funds and classes in the Total Mapped Group (used by the Board for management fee comparisons) that have a similar sales load structure.
Annual Report
Board Approval of Investment Advisory Contracts and
Management Fees - continued
The Board noted that the total expense ratio of each class ranked below its competitive median for 2012.
Fees Charged to Other Fidelity Clients. The Board also considered Fidelity fee structures and other information with respect to clients of FMR and its affiliates, such as other mutual funds advised or subadvised by FMR or its affiliates, pension plan clients, and other institutional clients. The Board noted the findings of the 2013 ad hoc joint committee (created with the board of other Fidelity funds), which reviewed and compared Fidelity's institutional investment advisory business with its business of providing services to the Fidelity funds, including the differences in services provided, fees charged, and costs incurred, as well as competition in their respective marketplaces.
Based on its review of total expense ratios and fees charged to other Fidelity clients, the Board concluded that the total expense ratio of each class of the fund was reasonable in light of the services that the fund and its shareholders receive and the other factors considered.
Costs of the Services and Profitability. The Board considered the revenues earned and the expenses incurred by Fidelity in conducting the business of developing, marketing, distributing, managing, administering and servicing the fund and servicing the fund's shareholders. The Board also considered the level of Fidelity's profits in respect of all the Fidelity funds.
On an annual basis, FMR presents to the Board Fidelity's profitability for the fund. Fidelity calculates the profitability for each fund, as well as aggregate profitability for groups of Fidelity funds and all Fidelity funds, using a series of detailed revenue and cost allocation methodologies which originate with the books and records of Fidelity on which Fidelity's audited financial statements are based. The Audit Committee of the Board reviews any significant changes from the prior year's methodologies.
PricewaterhouseCoopers LLP (PwC), independent registered public accounting firm and auditor to Fidelity and certain Fidelity funds, has been engaged annually by the Board as part of the Board's assessment of Fidelity's profitability analysis. PwC's engagement includes the review and assessment of the methodologies used by Fidelity in determining the revenues and expenses attributable to Fidelity's mutual fund business, and completion of agreed-upon procedures surrounding the mathematical accuracy of fund profitability and its conformity to allocation methodologies. After considering PwC's reports issued under the engagement and information provided by Fidelity, the Board concluded that while other allocation methods may also be reasonable, Fidelity's profitability methodologies are reasonable in all material respects.
Annual Report
The Board also reviewed Fidelity's non-fund businesses and fall-out benefits related to the mutual fund business as well as cases where Fidelity's affiliates may benefit from or be related to the fund's business.
The Board considered the costs of the services provided by and the profits realized by Fidelity in connection with the operation of the fund and was satisfied that the profitability was not excessive in the circumstances.
Economies of Scale. The Board considered whether there have been economies of scale in respect of the management of the Fidelity funds, whether the Fidelity funds (including the fund) have appropriately benefited from any such economies of scale, and whether there is potential for realization of any further economies of scale. The Board considered the extent to which the fund will benefit from economies of scale through increased services to the fund, through waivers or reimbursements, or through fee or expense reductions. The Board also noted that in 2009, it and the board of other Fidelity funds created an ad hoc committee (the Economies of Scale Committee) to analyze whether FMR attains economies of scale in respect of the management and servicing of the Fidelity funds, whether the Fidelity funds have appropriately benefited from such economies of scale, and whether there is potential for realization of any further economies of scale.
The Board recognized that the fund's management contract incorporates a "group fee" structure, which provides for lower group fee rates as total fund assets under FMR's management increase, and for higher group fee rates as total fund assets under FMR's management decrease. FMR calculates the group fee rates based on a tiered asset "breakpoint" schedule that varies based on asset class. The Board considered that the group fee is designed to deliver the benefits of economies of scale to fund shareholders when total Fidelity fund assets increase, even if assets of any particular fund are unchanged or have declined, because some portion of Fidelity's costs are attributable to services provided to all Fidelity funds, and all funds benefit if those costs can be allocated among more assets. The Board concluded that, given the group fee structure, fund shareholders will benefit from lower management fees as assets under FMR's management increase at the fund complex level, regardless of whether Fidelity achieves any such economies of scale.
The Board concluded, taking into account the analysis of the Economies of Scale Committee, that economies of scale, if any, are being appropriately shared between fund shareholders and Fidelity.
Amendment to Description of Group Fee Rate. At its July 2013 meeting, the Board voted to approve an amendment to the fund's management contract to modify the description of the "group fee rate" effective August 1, 2013. The Board noted that under the prior description in the contract, the group fee rate was based on the average net assets of all registered investment companies with which FMR has management contracts. Under the contract's tiered asset breakpoint schedule, the group fee rate is lower as total fund assets under FMR's management increase, and higher as total fund assets under FMR's management decrease. The Board considered that the prior description would have excluded the assets of 64 Fidelity sector funds from the group fee rate calculation once Fidelity SelectCo, LLC, an affiliate of FMR, assumed management responsibilities for those funds. The Board noted that modifying the description of the group fee rate to continue to include the assets of those 64 funds for purposes of determining group fee rate breakpoints would avoid an immediate adverse impact on the group fee rate for any fund.
Annual Report
Board Approval of Investment Advisory Contracts and
Management Fees - continued
Additional Information Requested by the Board. In order to develop fully the factual basis for consideration of the Fidelity funds' Advisory Contracts, the Board requested and received additional information on certain topics, including: (i) fund performance trends and Fidelity's long-term strategies for certain funds; (ii) the potential to further rationalize the Fidelity fund lineup with the possibility of achieving savings for the funds and Fidelity; (iii) the methodology with respect to competitive fund data and peer group classifications; (iv) the arrangements with, and performance of, certain sub-advisers on behalf of the Fidelity funds, as well as certain proposed participating affiliate arrangements; (v) the realization of fall-out benefits in certain Fidelity business units; (vi) Fidelity's group fee structures, including the rationale for the individual fee rates of certain categories of funds and the definition of group assets; (vii) trends regarding industry use of performance fee structures and the performance adjustment methodologies applicable to the Fidelity funds; (viii) additional competitive analysis regarding the total expenses for certain classes; and (ix) fund profitability methodology, including Fidelity's cost allocation methodology, and the impact of certain factors on fund profitability results.
Based on its evaluation of all of the conclusions noted above, and after considering all factors it believed relevant, the Board ultimately concluded that the advisory fee structures are fair and reasonable, and that the fund's Advisory Contracts should be renewed.
Annual Report
Investment Adviser
Fidelity Management & Research Company
Boston, MA
Investment Sub-Advisers
FMR Co., Inc.
Fidelity Management & Research
(U.K.) Inc.
Fidelity Management & Research
(Hong Kong) Limited
Fidelity Management & Research
(Japan) Inc.
General Distributor
Fidelity Distributors Corporation
Smithfield, RI
Transfer and Service Agents
Fidelity Investments Institutional
Operations Company, Inc.
Boston, MA
Fidelity Service Company, Inc.
Boston, MA
Custodian
Citibank, N.A.
New York, NY
(Fidelity Investment logo)(registered trademark)
Corporate Headquarters
245 Summer St., Boston, MA 02210
www.fidelity.com
BCF-F-ANN-0913
1.891663.104
Fidelity®
Blue Chip Growth
Fund -
Class K
Annual Report
July 31, 2013
(Fidelity Cover Art)
Contents
Performance | (Click Here) | How the fund has done over time. |
Management's Discussion of Fund Performance | (Click Here) | The Portfolio Manager's review of fund performance and strategy. |
Shareholder Expense Example | (Click Here) | An example of shareholder expenses. |
Investment Changes | (Click Here) | A summary of major shifts in the fund's investments over the past six months. |
Investments | (Click Here) | A complete list of the fund's investments with their market values. |
Financial Statements | (Click Here) | Statements of assets and liabilities, operations, and changes in net assets, as well as financial highlights. |
Notes | (Click Here) | Notes to the financial statements. |
Report of Independent Registered Public Accounting Firm | (Click Here) | |
Trustees and Officers | (Click Here) | |
Distributions | (Click Here) | |
Board Approval of Investment Advisory Contracts and Management Fees | (Click Here) | |
To view a fund's proxy voting guidelines and proxy voting record for the 12-month period ended June 30, visit http://www.fidelity.com/proxyvotingresults or visit the Securities and Exchange Commission's (SEC) web site at http://www.sec.gov. You may also call 1-800-835-5092 to request a free copy of the proxy voting guidelines.
Standard & Poor's, S&P and S&P 500 are registered service marks of The McGraw-Hill Companies, Inc. and have been licensed for use by Fidelity Distributors Corporation.
Other third-party marks appearing herein are the property of their respective owners.
All other marks appearing herein are registered or unregistered trademarks or service marks of FMR LLC or an affiliated company. © 2013 FMR LLC. All rights reserved.
Annual Report
This report and the financial statements contained herein are submitted for the general information of the shareholders of the fund. This report is not authorized for distribution to prospective investors in the fund unless preceded or accompanied by an effective prospectus.
A fund files its complete schedule of portfolio holdings with the SEC for the first and third quarters of each fiscal year on Form N-Q. Forms N-Q are available on the SEC's web site at http://www.sec.gov. A fund's Forms N-Q may be reviewed and copied at the SEC's Public Reference Room in Washington, DC. Information regarding the operation of the SEC's Public Reference Room may be obtained by calling 1-800-SEC-0330. For a complete list of a fund's portfolio holdings, view the most recent holdings listing, semiannual report, or annual report on Fidelity's web site at http://www.fidelity.com, http://www.advisor.fidelity.com, or http://www.401k.com, as applicable.
NOT FDIC INSURED • MAY LOSE VALUE • NO BANK GUARANTEE
Neither the fund nor Fidelity Distributors Corporation is a bank.
Annual Report
Average annual total return reflects the change in the value of an investment, assuming reinvestment of the class' distributions from dividend income and capital gains (the profits earned upon the sale of securities that have grown in value, if any) and assuming a constant rate of performance each year. The $10,000 table and the fund's returns do not reflect the deduction of taxes that a shareholder would pay on fund distributions or the redemption of fund shares. During periods of reimbursement by Fidelity, a fund's total return will be greater than it would be had the reimbursement not occurred. How a fund did yesterday is no guarantee of how it will do tomorrow.
Average Annual Total Returns
Periods ended July 31, 2013 | Past 1
year | Past 5
years | Past 10
years |
Class K A | 28.42% | 11.04% | 7.98% |
A The initial offering of Class K shares took place on May 9, 2008. Returns prior to May 9, 2008, are those of Fidelity® Blue Chip Growth Fund, the original class of the fund.
$10,000 Over 10 Years
Let's say hypothetically that $10,000 was invested in Fidelity® Blue Chip Growth Fund - Class K on July 31, 2003. The chart shows how the value of your investment would have changed, and also shows how the Russell 1000® Growth Index performed over the same period. The initial offering of Class K took place on May 9, 2008. See above for additional information regarding the performance of Class K.

Annual Report
Market Recap: The bull run in U.S. stocks comfortably settled into a fifth year, as major equity benchmarks ripped through records during the 12 months ending July 31, 2013. Gains were fueled by a generally improving global economy and accommodative monetary policies worldwide. The tone was positive for most of the year, based largely on stronger U.S. economic data, including employment, housing and consumer sentiment. Setting a series of new highs along the way, the broad-based S&P 500® Index rose an impressive 25.00% for the 12 months, while the blue-chip-laden Dow Jones Industrial AverageSM also moved into record territory en route to a 22.36% gain. The growth-oriented Nasdaq Composite Index® had a similarly strong run, advancing 25.15%. During the year, markets were resilient amid intermittent volatility over debt woes in Europe, the 2012 U.S. presidential election and year-end Congressional gridlock over the federal budget. In mid-to-late June, concern arose about the U.S. Federal Reserve possibly tapering its sustaining bond-buying strategy - which prompted a brief, but steep, market sell-off. However, investors' continued quest for yield and the Fed's pledge to keep buying bonds until the economy showed significant improvement overpowered the uncertainty and helped equities climb notably higher in July to close the period on a strong note.
Comments from Sonu Kalra, Portfolio Manager of Fidelity® Blue Chip Growth Fund: For the year, the fund's Class K shares advanced 28.42%, compared with 21.64% for the Russell 1000® Growth Index. I'm focused on owning companies that can sustainably grow earnings by double digits over the long term, which paid off in a strong up market. Shares of automaker Tesla Motors soared when the company ramped up production faster than expected, helping the company move into profitability much earlier than investors anticipated. Another top relative contributor was Green Mountain Coffee Roasters. During the past year, a new CEO, along with an extension of the firm's partnership with Starbucks, helped sustain Green Mountain's growth rate, and the stock took off. On the flip side, an overweighting in Broadcom - a chipmaker in the wireless area - was the fund's biggest relative detractor this period. Most investors anticipated the company's next-generation wireless chip would launch in the next year, but production was delayed until late 2014, which hurt the stock. Apple was by far the largest absolute detractor and also hurt relative results. Shares of the tech giant declined after the firm delivered disappointing sales of its iPhone® 5 smartphone and competitors, such as Samsung Electronics, began to close the gap on their devices in terms of product features.
The views expressed above reflect those of the portfolio manager(s) only through the end of the period as stated on the cover of this report and do not necessarily represent the views of Fidelity or any other person in the Fidelity organization. Any such views are subject to change at any time based upon market or other conditions and Fidelity disclaims any responsibility to update such views. These views may not be relied on as investment advice and, because investment decisions for a Fidelity fund are based on numerous factors, may not be relied on as an indication of trading intent on behalf of any Fidelity fund.
Annual Report
Shareholder Expense Example
As a shareholder of the Fund, you incur two types of costs: (1) transaction costs, and (2) ongoing costs, including management fees and other Fund expenses. This Example is intended to help you understand your ongoing costs (in dollars) of investing in the Fund and to compare these costs with the ongoing costs of investing in other mutual funds.
The Example is based on an investment of $1,000 invested at the beginning of the period and held for the entire period (February 1, 2013 to July 31, 2013).
Actual Expenses
The first line of the accompanying table for each class of the Fund provides information about actual account values and actual expenses. You may use the information in this line, together with the amount you invested, to estimate the expenses that you paid over the period. Simply divide your account value by $1,000.00 (for example, an $8,600 account value divided by $1,000.00 = 8.6), then multiply the result by the number in the first line for a class of the Fund under the heading entitled "Expenses Paid During Period" to estimate the expenses you paid on your account during this period. A small balance maintenance fee of $12.00 that is charged once a year may apply for certain accounts with a value of less than $2,000. This fee is not included in the table below. If it was, the estimate of expenses you paid during the period would be higher, and your ending account value lower, by this amount. In addition, the Fund, as a shareholder in the underlying Fidelity Central Funds, will indirectly bear its pro-rata share of the fees and expenses incurred by the underlying Fidelity Central Funds. These fees and expenses are not included in the Fund's annualized expense ratio used to calculate the expense estimate in the table below.
Hypothetical Example for Comparison Purposes
The second line of the accompanying table for each class of the Fund provides information about hypothetical account values and hypothetical expenses based on a Class' actual expense ratio and an assumed rate of return of 5% per year before expenses, which is not the Class' actual return. The hypothetical account values and expenses may not be used to estimate the actual ending account balance or expenses you paid for the period. You may use this information to compare the ongoing costs of investing in the Fund and other funds. To do so, compare this 5% hypothetical example with the 5% hypothetical examples that appear in the shareholder reports of the other funds. A small balance maintenance fee of $12.00 that is charged once a year may apply for certain accounts with a value of less than $2,000. This fee is not included in the table below. If it was, the estimate of expenses you paid during the period would be higher, and your ending account value lower, by this amount. In addition, the Fund, as a shareholder in the underlying Fidelity Central Funds, will indirectly bear its pro-rata share of the fees and expenses incurred by the underlying Fidelity Central Funds. These fees and expenses are not included in the Fund's annualized expense ratio used to calculate the expense estimate in the table below.
Please note that the expenses shown in the table are meant to highlight your ongoing costs only and do not reflect any transaction costs. Therefore, the second line of the table is useful in comparing ongoing costs only, and will not help you determine the relative total costs of owning different funds.
Annual Report
| Annualized
Expense Ratio B | Beginning
Account Value
February 1, 2013 | Ending
Account Value
July 31, 2013 | Expenses Paid
During Period*
February 1, 2013
to July 31, 2013 |
Blue Chip Growth | .74% | | | |
Actual | | $ 1,000.00 | $ 1,164.40 | $ 3.97 |
HypotheticalA | | $ 1,000.00 | $ 1,021.12 | $ 3.71 |
Class K | .60% | | | |
Actual | | $ 1,000.00 | $ 1,165.00 | $ 3.22 |
HypotheticalA | | $ 1,000.00 | $ 1,021.82 | $ 3.01 |
Class F | .55% | | | |
Actual | | $ 1,000.00 | $ 1,165.40 | $ 2.95 |
HypotheticalA | | $ 1,000.00 | $ 1,022.07 | $ 2.76 |
A 5% return per year before expenses
B Annualized expense ratio reflects expenses net of applicable fee waivers.
* Expenses are equal to each Class' annualized expense ratio, multiplied by the average account value over the period, multiplied by 181/365 (to reflect the one-half year period).
Annual Report
Investment Changes (Unaudited)
Top Ten Stocks as of July 31, 2013 |
| % of fund's
net assets | % of fund's net assets
6 months ago |
Google, Inc. Class A | 5.1 | 5.9 |
Apple, Inc. | 4.1 | 5.9 |
Gilead Sciences, Inc. | 2.8 | 1.7 |
Home Depot, Inc. | 1.9 | 1.8 |
Amazon.com, Inc. | 1.8 | 2.1 |
QUALCOMM, Inc. | 1.6 | 2.0 |
Amgen, Inc. | 1.4 | 1.1 |
Visa, Inc. Class A | 1.4 | 1.3 |
Starbucks Corp. | 1.4 | 1.2 |
United Technologies Corp. | 1.4 | 1.3 |
| 22.9 | |
Top Five Market Sectors as of July 31, 2013 |
| % of fund's
net assets | % of fund's net assets
6 months ago |
Information Technology | 28.5 | 31.9 |
Consumer Discretionary | 23.0 | 20.9 |
Health Care | 14.7 | 10.5 |
Consumer Staples | 13.2 | 15.2 |
Industrials | 10.7 | 10.9 |
Asset Allocation (% of fund's net assets) |
As of July 31, 2013* | As of January 31, 2013** |
| Stocks 99.7% | | | Stocks 99.9% | |
| Short-Term
Investments and
Net Other Assets
(Liabilities) 0.3% | | | Short-Term
Investments and
Net Other Assets
(Liabilities) 0.1% | |
* Foreign investments | 8.4% | | ** Foreign investments | 9.5% | |

Annual Report
Investments July 31, 2013
Showing Percentage of Net Assets
Common Stocks - 99.3% |
| Shares | | Value (000s) |
CONSUMER DISCRETIONARY - 22.6% |
Auto Components - 0.2% |
Johnson Controls, Inc. | 909,800 | | $ 36,583 |
The Goodyear Tire & Rubber Co. (a) | 630,700 | | 11,668 |
| | 48,251 |
Automobiles - 1.4% |
Ford Motor Co. | 2,494,100 | | 42,100 |
General Motors Co. (a) | 815,900 | | 29,266 |
Tesla Motors, Inc. (a)(d) | 1,573,964 | | 211,352 |
| | 282,718 |
Distributors - 0.1% |
LKQ Corp. (a) | 945,500 | | 24,649 |
Diversified Consumer Services - 0.4% |
H&R Block, Inc. | 2,158,700 | | 67,848 |
Kroton Educacional SA | 1,180,000 | | 16,810 |
| | 84,658 |
Hotels, Restaurants & Leisure - 4.4% |
Alsea S.A.B. de CV | 2,981,200 | | 8,146 |
Buffalo Wild Wings, Inc. (a) | 331,100 | | 34,295 |
Chipotle Mexican Grill, Inc. (a) | 158,400 | | 65,304 |
Dunkin' Brands Group, Inc. | 773,500 | | 33,415 |
Fiesta Restaurant Group, Inc. (a) | 124,000 | | 3,912 |
Jubilant Foodworks Ltd. (a) | 288,917 | | 5,344 |
Las Vegas Sands Corp. | 2,356,700 | | 130,962 |
Noodles & Co. | 149,479 | | 6,483 |
Panera Bread Co. Class A (a) | 366,200 | | 61,174 |
Penn National Gaming, Inc. (a) | 550,300 | | 27,509 |
Starbucks Corp. | 3,987,600 | | 284,077 |
Starwood Hotels & Resorts Worldwide, Inc. | 561,000 | | 37,110 |
Whitbread PLC | 464,036 | | 22,801 |
Wyndham Worldwide Corp. | 491,627 | | 30,628 |
Yum! Brands, Inc. | 1,716,600 | | 125,174 |
| | 876,334 |
Household Durables - 0.4% |
Sony Corp. sponsored ADR | 722,700 | | 15,206 |
Whirlpool Corp. | 479,678 | | 64,248 |
| | 79,454 |
Internet & Catalog Retail - 2.9% |
Amazon.com, Inc. (a) | 1,195,900 | | 360,229 |
Common Stocks - continued |
| Shares | | Value (000s) |
CONSUMER DISCRETIONARY - continued |
Internet & Catalog Retail - continued |
Netflix, Inc. (a) | 148,800 | | $ 36,340 |
priceline.com, Inc. (a) | 201,800 | | 176,710 |
| | 573,279 |
Leisure Equipment & Products - 0.2% |
Mattel, Inc. | 985,200 | | 41,408 |
Media - 2.8% |
CBS Corp. Class B | 865,900 | | 45,754 |
Comcast Corp. Class A | 6,029,400 | | 271,805 |
DIRECTV (a) | 421,200 | | 26,649 |
DISH Network Corp. Class A | 376,000 | | 16,788 |
Fuji Media Holdings, Inc. | 2,000 | | 3,622 |
Sinclair Broadcast Group, Inc. Class A | 331,300 | | 9,346 |
Sirius XM Radio, Inc. | 2,254,100 | | 8,408 |
The Walt Disney Co. | 879,500 | | 56,860 |
Time Warner, Inc. | 625,000 | | 38,913 |
Twenty-First Century Fox, Inc. Class A | 3,000,500 | | 89,655 |
| | 567,800 |
Multiline Retail - 1.0% |
Dollar General Corp. (a) | 768,200 | | 41,997 |
Dollar Tree, Inc. (a) | 156,300 | | 8,385 |
Macy's, Inc. | 1,594,900 | | 77,097 |
Target Corp. | 975,200 | | 69,483 |
| | 196,962 |
Specialty Retail - 5.8% |
Abercrombie & Fitch Co. Class A | 1,806,400 | | 90,085 |
American Eagle Outfitters, Inc. | 1,599,600 | | 31,416 |
AutoZone, Inc. (a) | 33,000 | | 14,803 |
Best Buy Co., Inc. | 2,509,100 | | 75,499 |
CarMax, Inc. (a) | 258,900 | | 12,696 |
Home Depot, Inc. | 4,733,300 | | 374,073 |
L Brands, Inc. | 1,724,700 | | 96,187 |
Lowe's Companies, Inc. | 3,379,400 | | 150,654 |
Lumber Liquidators Holdings, Inc. (a) | 272,200 | | 26,354 |
Restoration Hardware Holdings, Inc. | 136,400 | | 9,114 |
Ross Stores, Inc. | 1,935,300 | | 130,575 |
TJX Companies, Inc. | 2,452,180 | | 127,611 |
Urban Outfitters, Inc. (a) | 883,800 | | 37,615 |
| | 1,176,682 |
Common Stocks - continued |
| Shares | | Value (000s) |
CONSUMER DISCRETIONARY - continued |
Textiles, Apparel & Luxury Goods - 3.0% |
Arezzo Industria e Comercio SA | 1,646,000 | | $ 25,671 |
Fifth & Pacific Companies, Inc. (a) | 1,228,600 | | 29,265 |
Fossil Group, Inc. (a) | 509,819 | | 56,029 |
lululemon athletica, Inc. (a) | 741,380 | | 51,578 |
Michael Kors Holdings Ltd. (a) | 2,024,237 | | 136,312 |
NIKE, Inc. Class B | 1,712,800 | | 107,769 |
Prada SpA | 1,995,500 | | 18,628 |
PVH Corp. | 763,900 | | 100,674 |
Ralph Lauren Corp. | 65,500 | | 11,925 |
Under Armour, Inc. Class A (sub. vtg.) (a)(d) | 902,700 | | 60,598 |
Wolverine World Wide, Inc. | 183,500 | | 10,553 |
| | 609,002 |
TOTAL CONSUMER DISCRETIONARY | | 4,561,197 |
CONSUMER STAPLES - 13.2% |
Beverages - 3.1% |
Anheuser-Busch InBev SA NV ADR | 695,000 | | 66,518 |
Beam, Inc. | 228,300 | | 14,837 |
Monster Beverage Corp. (a) | 1,360,600 | | 82,983 |
PepsiCo, Inc. | 2,227,300 | | 186,069 |
SABMiller PLC | 147,300 | | 7,217 |
The Coca-Cola Co. | 6,952,400 | | 278,652 |
| | 636,276 |
Food & Staples Retailing - 2.8% |
Costco Wholesale Corp. | 1,409,300 | | 165,297 |
CVS Caremark Corp. | 3,050,600 | | 187,581 |
Kroger Co. | 1,485,100 | | 58,320 |
Walgreen Co. | 1,341,000 | | 67,385 |
Whole Foods Market, Inc. | 1,590,200 | | 88,383 |
| | 566,966 |
Food Products - 3.0% |
Archer Daniels Midland Co. | 163,700 | | 5,970 |
Associated British Foods PLC | 592,900 | | 17,534 |
Bunge Ltd. | 483,600 | | 36,758 |
Danone SA | 658,200 | | 52,013 |
Green Mountain Coffee Roasters, Inc. (a)(d) | 3,513,464 | | 271,169 |
Kellogg Co. | 758,600 | | 50,250 |
Kraft Foods Group, Inc. | 536,900 | | 30,378 |
Mead Johnson Nutrition Co. Class A | 787,600 | | 57,369 |
Common Stocks - continued |
| Shares | | Value (000s) |
CONSUMER STAPLES - continued |
Food Products - continued |
Mondelez International, Inc. | 1,737,400 | | $ 54,328 |
Unilever NV (NY Reg.) | 620,500 | | 24,826 |
| | 600,595 |
Household Products - 1.6% |
Energizer Holdings, Inc. | 251,500 | | 25,603 |
Procter & Gamble Co. | 3,373,400 | | 270,884 |
Svenska Cellulosa AB (SCA) (B Shares) | 811,700 | | 21,481 |
| | 317,968 |
Personal Products - 0.6% |
Herbalife Ltd. | 1,778,391 | | 116,485 |
Tobacco - 2.1% |
Altria Group, Inc. | 1,693,800 | | 59,385 |
British American Tobacco PLC (United Kingdom) | 146,800 | | 7,831 |
Japan Tobacco, Inc. | 528,000 | | 18,470 |
Lorillard, Inc. | 1,866,000 | | 79,361 |
Philip Morris International, Inc. | 2,885,900 | | 257,365 |
| | 422,412 |
TOTAL CONSUMER STAPLES | | 2,660,702 |
ENERGY - 3.8% |
Energy Equipment & Services - 0.9% |
Cameron International Corp. (a) | 402,500 | | 23,868 |
Ensco PLC Class A | 557,500 | | 31,967 |
Halliburton Co. | 2,651,300 | | 119,812 |
National Oilwell Varco, Inc. | 164,100 | | 11,515 |
| | 187,162 |
Oil, Gas & Consumable Fuels - 2.9% |
Anadarko Petroleum Corp. | 1,352,100 | | 119,688 |
Apache Corp. | 204,500 | | 16,411 |
Cabot Oil & Gas Corp. | 277,300 | | 21,025 |
Canadian Natural Resources Ltd. | 1,495,600 | | 46,349 |
Cobalt International Energy, Inc. (a) | 654,900 | | 18,894 |
Continental Resources, Inc. (a) | 394,200 | | 36,385 |
EOG Resources, Inc. | 367,800 | | 53,511 |
EQT Corp. | 204,400 | | 17,681 |
Hess Corp. | 609,500 | | 45,383 |
Occidental Petroleum Corp. | 909,000 | | 80,946 |
Common Stocks - continued |
| Shares | | Value (000s) |
ENERGY - continued |
Oil, Gas & Consumable Fuels - continued |
Pioneer Natural Resources Co. | 626,800 | | $ 97,004 |
Western Gas Equity Partners LP | 594,900 | | 23,403 |
| | 576,680 |
TOTAL ENERGY | | 763,842 |
FINANCIALS - 4.0% |
Capital Markets - 0.9% |
BlackRock, Inc. Class A | 271,700 | | 76,609 |
Invesco Ltd. | 867,000 | | 27,909 |
Monex Group, Inc. | 50,266 | | 20,330 |
Morgan Stanley | 1,780,812 | | 48,456 |
State Street Corp. | 114,000 | | 7,942 |
Virtus Investment Partners, Inc. (a) | 44,000 | | 8,206 |
| | 189,452 |
Consumer Finance - 0.4% |
American Express Co. | 964,000 | | 71,114 |
Diversified Financial Services - 2.2% |
Bank of America Corp. | 6,660,300 | | 97,240 |
Citigroup, Inc. | 4,157,520 | | 216,773 |
CME Group, Inc. | 85,800 | | 6,347 |
IntercontinentalExchange, Inc. (a) | 45,300 | | 8,265 |
JPMorgan Chase & Co. | 2,181,100 | | 121,553 |
| | 450,178 |
Insurance - 0.3% |
Berkshire Hathaway, Inc. Class B (a) | 265,800 | | 30,798 |
MetLife, Inc. | 511,600 | | 24,772 |
| | 55,570 |
Real Estate Investment Trusts - 0.1% |
Simon Property Group, Inc. | 71,400 | | 11,428 |
Real Estate Management & Development - 0.1% |
Altisource Portfolio Solutions SA | 50,000 | | 6,166 |
Howard Hughes Corp. (a) | 80,200 | | 8,759 |
Parsvnath Developers Ltd. (a)(e) | 21,771,340 | | 10,232 |
| | 25,157 |
Thrifts & Mortgage Finance - 0.0% |
Housing Development Finance Corp. Ltd. (a) | 448,663 | | 5,901 |
TOTAL FINANCIALS | | 808,800 |
Common Stocks - continued |
| Shares | | Value (000s) |
HEALTH CARE - 14.7% |
Biotechnology - 8.9% |
Acorda Therapeutics, Inc. (a) | 116,000 | | $ 4,405 |
Agios Pharmaceuticals, Inc. | 145,017 | | 4,229 |
Alexion Pharmaceuticals, Inc. (a) | 700,000 | | 81,361 |
Alkermes PLC (a) | 1,017,100 | | 34,154 |
Alnylam Pharmaceuticals, Inc. (a) | 693,263 | | 32,008 |
Amgen, Inc. | 2,680,400 | | 290,261 |
ARIAD Pharmaceuticals, Inc. (a) | 1,781,860 | | 33,107 |
Biogen Idec, Inc. (a) | 1,125,700 | | 245,549 |
BioMarin Pharmaceutical, Inc. (a) | 288,700 | | 18,664 |
Bluebird Bio, Inc. | 122,116 | | 3,801 |
Celgene Corp. (a) | 614,700 | | 90,275 |
Clovis Oncology, Inc. (a) | 195,300 | | 15,210 |
CSL Ltd. | 66,241 | | 3,934 |
Exelixis, Inc. (a) | 3,668,800 | | 18,601 |
Gilead Sciences, Inc. (a) | 9,157,000 | | 562,698 |
Grifols SA (d) | 330,400 | | 13,938 |
Grifols SA: | | | |
ADR | 292,845 | | 9,295 |
Class B | 16,520 | | 529 |
Infinity Pharmaceuticals, Inc. (a) | 640,000 | | 13,555 |
InterMune, Inc. (a) | 2,356,200 | | 36,545 |
Ironwood Pharmaceuticals, Inc. Class A (a) | 473,000 | | 5,790 |
Medivation, Inc. (a) | 299,000 | | 17,303 |
Merrimack Pharmaceuticals, Inc. (a) | 2,407,858 | | 11,510 |
Onyx Pharmaceuticals, Inc. (a) | 400,500 | | 52,586 |
Pharmacyclics, Inc. (a) | 44,300 | | 4,812 |
Regeneron Pharmaceuticals, Inc. (a) | 438,669 | | 118,467 |
Seattle Genetics, Inc. (a) | 239,900 | | 9,721 |
Synageva BioPharma Corp. (a) | 180,700 | | 8,692 |
Vertex Pharmaceuticals, Inc. (a) | 639,160 | | 51,005 |
| | 1,792,005 |
Health Care Equipment & Supplies - 0.9% |
Accuray, Inc. (a)(d) | 2,060,900 | | 12,798 |
Baxter International, Inc. | 185,400 | | 13,542 |
Boston Scientific Corp. (a) | 3,943,000 | | 43,058 |
Insulet Corp. (a) | 310,600 | | 9,905 |
The Cooper Companies, Inc. | 814,672 | | 103,748 |
| | 183,051 |
Health Care Providers & Services - 1.1% |
AmerisourceBergen Corp. | 201,900 | | 11,765 |
Common Stocks - continued |
| Shares | | Value (000s) |
HEALTH CARE - continued |
Health Care Providers & Services - continued |
Apollo Hospitals Enterprise Ltd. | 936,371 | | $ 14,435 |
Catamaran Corp. (a) | 343,600 | | 18,098 |
Express Scripts Holding Co. (a) | 2,370,900 | | 155,412 |
HCA Holdings, Inc. | 622,300 | | 24,270 |
MEDNAX, Inc. (a) | 42,000 | | 4,092 |
Qualicorp SA (a) | 1,151,000 | | 8,426 |
| | 236,498 |
Health Care Technology - 0.3% |
athenahealth, Inc. (a)(d) | 154,575 | | 17,305 |
Cerner Corp. (a) | 893,800 | | 43,796 |
| | 61,101 |
Life Sciences Tools & Services - 0.3% |
Illumina, Inc. (a) | 697,300 | | 55,658 |
Lonza Group AG | 58,001 | | 4,462 |
| | 60,120 |
Pharmaceuticals - 3.2% |
AbbVie, Inc. | 1,346,600 | | 61,243 |
Actavis, Inc. (a) | 732,100 | | 98,299 |
Allergan, Inc. | 346,000 | | 31,528 |
AVANIR Pharmaceuticals Class A (a)(d) | 2,885,556 | | 13,591 |
Bristol-Myers Squibb Co. | 663,800 | | 28,703 |
Endo Health Solutions, Inc. (a) | 720,068 | | 27,694 |
Johnson & Johnson | 1,181,540 | | 110,474 |
Merck & Co., Inc. | 642,100 | | 30,930 |
Perrigo Co. | 139,400 | | 17,340 |
Questcor Pharmaceuticals, Inc. | 608,852 | | 40,683 |
Sanofi SA sponsored ADR | 416,000 | | 21,416 |
Valeant Pharmaceuticals International, Inc. (Canada) (a) | 1,492,400 | | 138,473 |
Warner Chilcott PLC | 1,240,800 | | 26,441 |
| | 646,815 |
TOTAL HEALTH CARE | | 2,979,590 |
INDUSTRIALS - 10.7% |
Aerospace & Defense - 3.0% |
Honeywell International, Inc. | 1,207,200 | | 100,173 |
Precision Castparts Corp. | 596,000 | | 132,145 |
Common Stocks - continued |
| Shares | | Value (000s) |
INDUSTRIALS - continued |
Aerospace & Defense - continued |
The Boeing Co. | 862,500 | | $ 90,649 |
United Technologies Corp. | 2,672,600 | | 282,146 |
| | 605,113 |
Air Freight & Logistics - 0.6% |
FedEx Corp. | 125,830 | | 13,338 |
United Parcel Service, Inc. Class B | 1,236,200 | | 107,302 |
| | 120,640 |
Airlines - 0.9% |
Copa Holdings SA Class A | 84,900 | | 11,816 |
Delta Air Lines, Inc. | 2,096,800 | | 44,515 |
Spirit Airlines, Inc. (a) | 1,237,100 | | 40,886 |
U.S. Airways Group, Inc. (a) | 2,300,900 | | 44,522 |
United Continental Holdings, Inc. (a) | 898,400 | | 31,309 |
| | 173,048 |
Building Products - 0.3% |
A.O. Smith Corp. | 151,000 | | 6,239 |
Fortune Brands Home & Security, Inc. | 348,500 | | 14,397 |
Masco Corp. | 1,904,100 | | 39,072 |
| | 59,708 |
Construction & Engineering - 0.1% |
Quanta Services, Inc. (a) | 758,300 | | 20,330 |
Electrical Equipment - 0.6% |
Eaton Corp. PLC | 1,620,100 | | 111,706 |
Industrial Conglomerates - 1.0% |
Danaher Corp. | 2,848,300 | | 191,805 |
General Electric Co. | 733,900 | | 17,885 |
| | 209,690 |
Machinery - 1.8% |
Caterpillar, Inc. | 732,900 | | 60,765 |
Cummins, Inc. | 1,356,000 | | 164,334 |
Ingersoll-Rand PLC | 1,204,000 | | 73,504 |
ITT Corp. | 473,900 | | 14,805 |
Manitowoc Co., Inc. | 1,186,800 | | 24,365 |
PACCAR, Inc. | 269,200 | | 15,148 |
Snap-On, Inc. | 87,500 | | 8,299 |
| | 361,220 |
Professional Services - 0.6% |
Manpower, Inc. | 1,650,800 | | 110,389 |
Common Stocks - continued |
| Shares | | Value (000s) |
INDUSTRIALS - continued |
Professional Services - continued |
Towers Watson & Co. | 171,500 | | $ 14,445 |
Verisk Analytics, Inc. (a) | 61,900 | | 3,984 |
| | 128,818 |
Road & Rail - 1.6% |
Canadian Pacific Railway Ltd. | 537,600 | | 66,018 |
Con-way, Inc. | 431,200 | | 17,873 |
Hertz Global Holdings, Inc. (a) | 3,815,600 | | 97,718 |
Union Pacific Corp. | 840,800 | | 133,342 |
| | 314,951 |
Trading Companies & Distributors - 0.2% |
Mills Estruturas e Servicos de Engenharia SA | 827,400 | | 10,336 |
W.W. Grainger, Inc. | 55,200 | | 14,470 |
WESCO International, Inc. (a) | 305,300 | | 23,136 |
| | 47,942 |
TOTAL INDUSTRIALS | | 2,153,166 |
INFORMATION TECHNOLOGY - 28.5% |
Communications Equipment - 2.5% |
Aruba Networks, Inc. (a) | 534,200 | | 9,498 |
Cisco Systems, Inc. | 2,047,800 | | 52,321 |
F5 Networks, Inc. (a) | 631,600 | | 55,429 |
Juniper Networks, Inc. (a) | 2,603,100 | | 56,409 |
QUALCOMM, Inc. | 5,070,600 | | 327,307 |
| | 500,964 |
Computers & Peripherals - 5.9% |
Apple, Inc. | 1,835,600 | | 830,609 |
EMC Corp. | 5,267,100 | | 137,735 |
Fusion-io, Inc. (a) | 807,522 | | 11,644 |
Hewlett-Packard Co. | 2,539,700 | | 65,219 |
NCR Corp. (a) | 3,286,157 | | 118,302 |
SanDisk Corp. | 371,800 | | 20,494 |
Stratasys Ltd. (a) | 46,600 | | 4,131 |
| | 1,188,134 |
Electronic Equipment & Components - 0.1% |
InvenSense, Inc. (a) | 535,400 | | 9,466 |
Neonode, Inc. (a) | 613,800 | | 4,782 |
| | 14,248 |
Common Stocks - continued |
| Shares | | Value (000s) |
INFORMATION TECHNOLOGY - continued |
Internet Software & Services - 8.2% |
Baidu.com, Inc. sponsored ADR (a) | 115,900 | | $ 15,335 |
Cornerstone OnDemand, Inc. (a) | 149,200 | | 6,571 |
Dropbox, Inc. (a)(f) | 1,003,814 | | 10,038 |
eBay, Inc. (a) | 1,220,300 | | 63,077 |
Facebook, Inc. Class A (a) | 7,472,367 | | 275,207 |
Google, Inc. Class A (a) | 1,150,067 | | 1,020,805 |
LinkedIn Corp. (a) | 357,000 | | 72,753 |
Marketo, Inc. | 285,851 | | 8,984 |
Rackspace Hosting, Inc. (a) | 972,100 | | 44,026 |
Trulia, Inc. | 161,200 | | 6,006 |
WebMD Health Corp. (a) | 639,700 | | 21,116 |
Yahoo!, Inc. (a) | 3,808,900 | | 106,992 |
Yelp, Inc. (a)(d) | 110,200 | | 4,606 |
| | 1,655,516 |
IT Services - 3.7% |
Cognizant Technology Solutions Corp. Class A (a) | 1,700,800 | | 123,121 |
FleetCor Technologies, Inc. (a) | 118,000 | | 10,593 |
MasterCard, Inc. Class A | 446,600 | | 272,698 |
The Western Union Co. | 1,974,600 | | 35,464 |
Unisys Corp. (a) | 359,124 | | 9,316 |
Visa, Inc. Class A | 1,610,700 | | 285,110 |
| | 736,302 |
Semiconductors & Semiconductor Equipment - 3.2% |
Advanced Micro Devices, Inc. (a)(d) | 9,424,400 | | 35,530 |
Altera Corp. | 1,583,400 | | 56,306 |
Applied Materials, Inc. | 3,982,200 | | 64,950 |
Atmel Corp. (a) | 1,086,600 | | 8,584 |
Avago Technologies Ltd. | 1,028,900 | | 37,740 |
Broadcom Corp. Class A | 6,478,600 | | 178,615 |
Cree, Inc. (a) | 638,500 | | 44,631 |
First Solar, Inc. (a) | 338,700 | | 16,678 |
Lam Research Corp. (a) | 164,000 | | 8,072 |
Monolithic Power Systems, Inc. | 437,600 | | 11,456 |
NVIDIA Corp. | 1,099,200 | | 15,861 |
NXP Semiconductors NV (a) | 4,948,135 | | 161,557 |
PMC-Sierra, Inc. (a) | 2,192,700 | | 14,483 |
| | 654,463 |
Software - 4.9% |
Activision Blizzard, Inc. | 6,149,700 | | 110,572 |
Adobe Systems, Inc. (a) | 731,300 | | 34,576 |
Common Stocks - continued |
| Shares | | Value (000s) |
INFORMATION TECHNOLOGY - continued |
Software - continued |
Electronic Arts, Inc. (a) | 4,007,996 | | $ 104,689 |
FleetMatics Group PLC | 187,100 | | 7,046 |
Guidewire Software, Inc. (a) | 248,300 | | 10,866 |
Intuit, Inc. | 127,200 | | 8,131 |
Linx SA | 124,800 | | 2,067 |
Microsoft Corp. | 3,990,689 | | 127,024 |
Oracle Corp. | 3,956,200 | | 127,983 |
QLIK Technologies, Inc. (a) | 696,663 | | 21,819 |
Red Hat, Inc. (a) | 1,463,400 | | 75,760 |
salesforce.com, Inc. (a) | 4,973,660 | | 217,598 |
ServiceNow, Inc. (a) | 522,500 | | 22,771 |
Splunk, Inc. (a) | 196,000 | | 9,802 |
Tableau Software, Inc. | 50,600 | | 2,803 |
Take-Two Interactive Software, Inc. (a) | 1,200,800 | | 21,050 |
Ubisoft Entertainment SA (a) | 881,104 | | 13,445 |
VMware, Inc. Class A (a) | 409,600 | | 33,665 |
Workday, Inc. Class A (d) | 648,700 | | 44,300 |
| | 995,967 |
TOTAL INFORMATION TECHNOLOGY | | 5,745,594 |
MATERIALS - 1.7% |
Chemicals - 1.6% |
Eastman Chemical Co. | 1,196,200 | | 96,210 |
LyondellBasell Industries NV Class A | 320,800 | | 22,042 |
Mexichem S.A.B. de CV | 3,322,800 | | 15,549 |
Monsanto Co. | 1,900,300 | | 187,712 |
| | 321,513 |
Metals & Mining - 0.1% |
Freeport-McMoRan Copper & Gold, Inc. | 702,100 | | 19,855 |
TOTAL MATERIALS | | 341,368 |
TELECOMMUNICATION SERVICES - 0.1% |
Diversified Telecommunication Services - 0.1% |
Jazztel PLC (a) | 504,600 | | 4,578 |
Verizon Communications, Inc. | 383,700 | | 18,985 |
| | 23,563 |
TOTAL COMMON STOCKS (Cost $13,457,469) |
20,037,822
|
Preferred Stocks - 0.4% |
| Shares | | Value (000s) |
Convertible Preferred Stocks - 0.0% |
CONSUMER DISCRETIONARY - 0.0% |
Leisure Equipment & Products - 0.0% |
NJOY, Inc. Series C (f) | 607,766 | | $ 4,913 |
Nonconvertible Preferred Stocks - 0.4% |
CONSUMER DISCRETIONARY - 0.4% |
Automobiles - 0.4% |
Volkswagen AG | 338,600 | | 80,474 |
TOTAL PREFERRED STOCKS (Cost $40,585) |
85,387
|
Money Market Funds - 2.9% |
| | | |
Fidelity Cash Central Fund, 0.11% (b) | 65,572,089 | | 65,572 |
Fidelity Securities Lending Cash Central Fund, 0.12% (b)(c) | 529,104,648 | | 529,105 |
TOTAL MONEY MARKET FUNDS (Cost $594,677) |
594,677
|
TOTAL INVESTMENT PORTFOLIO - 102.6% (Cost $14,092,731) | | 20,717,886 |
NET OTHER ASSETS (LIABILITIES) - (2.6)% | | (534,684) |
NET ASSETS - 100% | $ 20,183,202 |
Legend |
(a) Non-income producing |
(b) Affiliated fund that is generally available only to investment companies and other accounts managed by Fidelity Investments. The rate quoted is the annualized seven-day yield of the fund at period end. A complete unaudited listing of the fund's holdings as of its most recent quarter end is available upon request. In addition, each Fidelity Central Fund's financial statements, which are not covered by the Fund's Report of Independent Registered Public Accounting Firm, are available on the SEC's website or upon request. |
(c) Investment made with cash collateral received from securities on loan. |
(d) Security or a portion of the security is on loan at period end. |
(e) Affiliated company |
(f) Restricted securities - Investment in securities not registered under the Securities Act of 1933 (excluding 144A issues). At the end of the period, the value of restricted securities (excluding 144A issues) amounted to $14,951,000 or 0.1% of net assets. |
Additional information on each restricted holding is as follows: |
Security | Acquisition Date | Acquisition Cost (000s) |
Dropbox, Inc. | 5/2/12 | $ 9,084 |
NJOY, Inc.
Series C | 6/7/13 | $ 4,913 |
Affiliated Central Funds |
Information regarding fiscal year to date income earned by the Fund from investments in Fidelity Central Funds is as follows: |
Fund | Income earned
(Amounts in thousands) |
Fidelity Cash Central Fund | $ 44 |
Fidelity Securities Lending Cash Central Fund | 10,642 |
Total | $ 10,686 |
Other Affiliated Issuers |
An affiliated company is a company in which the Fund has ownership of at least 5% of the voting securities. Fiscal year to date transactions with companies which are or were affiliates are as follows: |
Affiliate
(Amounts in thousands) | Value,
beginning of
period | Purchases | Sales
Proceeds | Dividend
Income | Value,
end of
period |
Parsvnath Developers Ltd. | $ 15,302 | $ - | $ - | $ - | $ 10,232 |
Total | $ 15,302 | $ - | $ - | $ - | $ 10,232 |
Other Information |
The following is a summary of the inputs used, as of July 31, 2013, involving the Fund's assets and liabilities carried at fair value. The inputs or methodology used for valuing securities may not be an indication of the risk associated with investing in those securities. For more information on valuation inputs, and their aggregation into the levels used in the table below, please refer to the Investment Valuation section in the accompanying Notes to Financial Statements. |
Valuation Inputs at Reporting Date: |
Description
(Amounts in thousands) | Total | Level 1 | Level 2 | Level 3 |
Investments in Securities: | | | | |
Equities: | | | | |
Consumer Discretionary | $ 4,646,584 | $ 4,641,671 | $ - | $ 4,913 |
Consumer Staples | 2,660,702 | 2,652,871 | 7,831 | - |
Energy | 763,842 | 763,842 | - | - |
Financials | 808,800 | 808,800 | - | - |
Health Care | 2,979,590 | 2,979,590 | - | - |
Industrials | 2,153,166 | 2,153,166 | - | - |
Information Technology | 5,745,594 | 5,735,556 | - | 10,038 |
Materials | 341,368 | 341,368 | - | - |
Telecommunication Services | 23,563 | 23,563 | - | - |
Money Market Funds | 594,677 | 594,677 | - | - |
Total Investments in Securities: | $ 20,717,886 | $ 20,695,104 | $ 7,831 | $ 14,951 |
See accompanying notes which are an integral part of the financial statements.
Annual Report
Statement of Assets and Liabilities
Amounts in thousands (except per-share amounts) | July 31, 2013 |
| | |
Assets | | |
Investment in securities, at value (including securities loaned of $525,836) - See accompanying schedule: Unaffiliated issuers (cost $13,467,203) | $ 20,112,977 | |
Fidelity Central Funds (cost $594,677) | 594,677 | |
Other affiliated issuers (cost $30,851) | 10,232 | |
Total Investments (cost $14,092,731) | | $ 20,717,886 |
Cash | | 159 |
Receivable for investments sold | | 173,967 |
Receivable for fund shares sold | | 16,793 |
Dividends receivable | | 7,381 |
Distributions receivable from Fidelity Central Funds | | 137 |
Other receivables | | 751 |
Total assets | | 20,917,074 |
| | |
Liabilities | | |
Payable for investments purchased | $ 160,438 | |
Payable for fund shares redeemed | 31,357 | |
Accrued management fee | 10,006 | |
Other affiliated payables | 2,227 | |
Other payables and accrued expenses | 739 | |
Collateral on securities loaned, at value | 529,105 | |
Total liabilities | | 733,872 |
| | |
Net Assets | | $ 20,183,202 |
Net Assets consist of: | | |
Paid in capital | | $ 12,472,227 |
Undistributed net investment income | | 56,036 |
Accumulated undistributed net realized gain (loss) on investments and foreign currency transactions | | 1,029,789 |
Net unrealized appreciation (depreciation) on investments and assets and liabilities in foreign currencies | | 6,625,150 |
Net Assets | | $ 20,183,202 |
See accompanying notes which are an integral part of the financial statements.
Annual Report
Statement of Assets and Liabilities - continued
Amounts in thousands (except per-share amounts) | July 31, 2013 |
| | |
Blue Chip Growth:
Net Asset Value, offering price and redemption price per share ($12,927,159 ÷ 216,718 shares) | | $ 59.65 |
| | |
Class K:
Net Asset Value, offering price and redemption price per share ($3,505,675 ÷ 58,679 shares) | | $ 59.74 |
| | |
Class F:
Net Asset Value, offering price and redemption price per share ($3,750,368 ÷ 62,706 shares) | | $ 59.81 |
See accompanying notes which are an integral part of the financial statements.
Annual Report
Financial Statements - continued
Statement of Operations
Amounts in thousands | Year ended July 31, 2013 |
| | |
Investment Income | | |
Dividends | | $ 247,142 |
Interest | | 1 |
Income from Fidelity Central Funds | | 10,686 |
Total income | | 257,829 |
| | |
Expenses | | |
Management fee
Basic fee | $ 95,910 | |
Performance adjustment | (1,291) | |
Transfer agent fees | 23,729 | |
Accounting and security lending fees | 1,648 | |
Custodian fees and expenses | 400 | |
Independent trustees' compensation | 108 | |
Registration fees | 151 | |
Audit | 107 | |
Legal | 56 | |
Interest | 8 | |
Miscellaneous | 149 | |
Total expenses before reductions | 120,975 | |
Expense reductions | (2,236) | 118,739 |
Net investment income (loss) | | 139,090 |
Realized and Unrealized Gain (Loss) Net realized gain (loss) on: | | |
Investment securities: | | |
Unaffiliated issuers | 1,392,819 | |
Foreign currency transactions | (800) | |
Total net realized gain (loss) | | 1,392,019 |
Change in net unrealized appreciation (depreciation) on: Investment securities | 2,900,644 | |
Assets and liabilities in foreign currencies | 23 | |
Total change in net unrealized appreciation (depreciation) | | 2,900,667 |
Net gain (loss) | | 4,292,686 |
Net increase (decrease) in net assets resulting from operations | | $ 4,431,776 |
See accompanying notes which are an integral part of the financial statements.
Annual Report
Statement of Changes in Net Assets
Amounts in thousands | Year ended
July 31,
2013 | Year ended
July 31,
2012 |
Increase (Decrease) in Net Assets | | |
Operations | | |
Net investment income (loss) | $ 139,090 | $ 35,383 |
Net realized gain (loss) | 1,392,019 | (37,431) |
Change in net unrealized appreciation (depreciation) | 2,900,667 | 271,789 |
Net increase (decrease) in net assets resulting
from operations | 4,431,776 | 269,741 |
Distributions to shareholders from net investment income | (85,342) | (15,666) |
Distributions to shareholders from net realized gain | (230,904) | (480,841) |
Total distributions | (316,246) | (496,507) |
Share transactions - net increase (decrease) | 1,247,958 | 656,032 |
Total increase (decrease) in net assets | 5,363,488 | 429,266 |
| | |
Net Assets | | |
Beginning of period | 14,819,714 | 14,390,448 |
End of period (including undistributed net investment income of $56,036 and undistributed net investment income of $10,385, respectively) | $ 20,183,202 | $ 14,819,714 |
See accompanying notes which are an integral part of the financial statements.
Annual Report
Financial Highlights - Blue Chip Growth
Years ended July 31, | 2013 | 2012 | 2011 | 2010 | 2009 |
Selected Per-Share Data | | | | | |
Net asset value, beginning of period | $ 47.38 | $ 48.17 | $ 37.63 | $ 31.97 | $ 39.06 |
Income from Investment Operations | | | | | |
Net investment income (loss) B | .39 | .10 | (.03) | .04 | .27 |
Net realized and unrealized gain (loss) | 12.79 | .75 | 10.61 | 5.80 | (6.36) |
Total from investment operations | 13.18 | .85 | 10.58 | 5.84 | (6.09) |
Distributions from net investment income | (.23) | (.04) | (.00) E, G | (.18) | (.29) |
Distributions from net realized gain | (.68) | (1.60) | (.04) E | - | (.71) |
Total distributions | (.91) | (1.64) | (.04) | (.18) | (1.00) |
Net asset value, end of period | $ 59.65 | $ 47.38 | $ 48.17 | $ 37.63 | $ 31.97 |
Total Return A | 28.25% | 2.27% | 28.12% | 18.29% | (15.85)% |
Ratios to Average Net Assets C, F | | | | | |
Expenses before reductions | .76% | .90% | .94% | .94% | .76% |
Expenses net of fee waivers, if any | .76% | .90% | .94% | .94% | .76% |
Expenses net of all reductions | .74% | .89% | .92% | .93% | .76% |
Net investment income (loss) | .75% | .21% | (.06)% | .10% | .93% |
Supplemental Data | | | | | |
Net assets, end of period (in millions) | $ 12,927 | $ 10,595 | $ 12,024 | $ 10,295 | $ 9,691 |
Portfolio turnover rate D | 75% | 95% | 132% | 135% | 134% |
A Total returns would have been lower if certain expenses had not been reduced during the applicable periods shown.
B Calculated based on average shares outstanding during the period.
C Fees and expenses of any underlying Fidelity Central Funds are not included in the Fund's expense ratio. The Fund indirectly bears its proportionate share of the expenses of any underlying Fidelity Central Funds.
D Amount does not include the portfolio activity of any underlying Fidelity Central Funds.
E The amounts shown reflect certain reclassifications related to book to tax differences that were made in the year shown.
F Expense ratios reflect operating expenses of the class. Expenses before reductions do not reflect amounts reimbursed by the investment adviser or reductions from brokerage service arrangements or reductions from other expense offset arrangements and do not represent the amount paid by the class during periods when reimbursements or reductions occur. Expenses net of fee waivers reflect expenses after reimbursement by the investment adviser but prior to reductions from brokerage service arrangements or other expense offset arrangements. Expenses net of all reductions represent the net expenses paid by the class.
G Amount represents less than $.01 per share.
See accompanying notes which are an integral part of the financial statements.
Annual Report
Financial Highlights - Class K
Years ended July 31, | 2013 | 2012 | 2011 | 2010 | 2009 |
Selected Per-Share Data | | | | | |
Net asset value, beginning of period | $ 47.46 | $ 48.21 | $ 37.66 | $ 32.01 | $ 39.07 |
Income from Investment Operations | | | | | |
Net investment income (loss) C | .47 | .17 | .05 | .11 | .32 |
Net realized and unrealized gain (loss) | 12.79 | .75 | 10.62 | 5.79 | (6.33) |
Total from investment operations | 13.26 | .92 | 10.67 | 5.90 | (6.01) |
Distributions from net investment income | (.30) | (.08) | (.05) F | (.25) | (.34) |
Distributions from net realized gain | (.68) | (1.60) | (.07) F | - | (.71) |
Total distributions | (.98) | (1.67) H | (.12) | (.25) | (1.05) |
Net asset value, end of period | $ 59.74 | $ 47.46 | $ 48.21 | $ 37.66 | $ 32.01 |
Total Return A, B | 28.42% | 2.43% | 28.37% | 18.48% | (15.61)% |
Ratios to Average Net Assets D, G | | | | | |
Expenses before reductions | .61% | .74% | .77% | .75% | .53% |
Expenses net of fee waivers, if any | .61% | .74% | .77% | .75% | .53% |
Expenses net of all reductions | .60% | .73% | .76% | .74% | .52% |
Net investment income (loss) | .89% | .37% | .11% | .30% | 1.16% |
Supplemental Data | | | | | |
Net assets, end of period (in millions) | $ 3,506 | $ 2,467 | $ 1,455 | $ 932 | $ 591 |
Portfolio turnover rate E | 75% | 95% | 132% | 135% | 134% |
A Total returns for periods of less than one year are not annualized.
B Total returns would have been lower if certain expenses had not been reduced during the applicable periods shown.
C Calculated based on average shares outstanding during the period.
D Fees and expenses of any underlying Fidelity Central Funds are not included in the Fund's expense ratio. The Fund indirectly bears its proportionate share of the expenses of any underlying Fidelity Central Funds.
E Amount does not include the portfolio activity of any underlying Fidelity Central Funds.
F The amounts shown reflect certain reclassifications related to book to tax differences that were made in the year shown.
G Expense ratios reflect operating expenses of the class. Expenses before reductions do not reflect amounts reimbursed by the investment adviser or reductions from brokerage service arrangements or reductions from other expense offset arrangements and do not represent the amount paid by the class during periods when reimbursements or reductions occur. Expenses net of fee waivers reflect expenses after reimbursement by the investment adviser but prior to reductions from brokerage service arrangements or other expense offset arrangements. Expenses net of all reductions represent the net expenses paid by the class.
H Total distributions of $1.67 per share is comprised of distributions from net investment income of $.076 and distributions from net realized gain of $1.598 per share.
See accompanying notes which are an integral part of the financial statements.
Annual Report
Financial Highlights - Class F
Years ended July 31, | 2013 | 2012 | 2011 | 2010 | 2009 G |
Selected Per-Share Data | | | | | |
Net asset value, beginning of period | $ 47.51 | $ 48.24 | $ 37.69 | $ 31.98 | $ 29.16 |
Income from Investment Operations | | | | | |
Net investment income (loss) D | .50 | .19 | .07 | .13 | - J |
Net realized and unrealized gain (loss) | 12.81 | .76 | 10.61 | 5.80 | 2.82 |
Total from investment operations | 13.31 | .95 | 10.68 | 5.93 | 2.82 |
Distributions from net investment income | (.33) | (.08) | (.06) H | (.22) | - |
Distributions from net realized gain | (.68) | (1.60) | (.08) H | - | - |
Total distributions | (1.01) | (1.68) | (.13) K | (.22) | - |
Net asset value, end of period | $ 59.81 | $ 47.51 | $ 48.24 | $ 37.69 | $ 31.98 |
Total Return B, C | 28.49% | 2.49% | 28.41% | 18.59% | 9.67% |
Ratios to Average Net Assets E, I | | | | | |
Expenses before reductions | .56% | .69% | .72% | .70% | .51% A |
Expenses net of fee waivers, if any | .56% | .69% | .72% | .70% | .51% A |
Expenses net of all reductions | .55% | .68% | .71% | .68% | .51% A |
Net investment income (loss) | .94% | .42% | .16% | .35% | (.05)% A |
Supplemental Data | | | | | |
Net assets, end of period (000 omitted) | $ 3,750,368 | $ 1,756,916 | $ 911,556 | $ 321,409 | $ 261 |
Portfolio turnover rate F | 75% | 95% | 132% | 135% | 134% |
A Annualized
B Total returns for periods of less than one year are not annualized.
C Total returns would have been lower if certain expenses had not been reduced during the applicable periods shown.
D Calculated based on average shares outstanding during the period.
E Fees and expenses of any underlying Fidelity Central Funds are not included in the Fund's expense ratio. The Fund indirectly bears its proportionate share of the expenses of any underlying Fidelity Central Funds.
F Amount does not include the portfolio activity of any underlying Fidelity Central Funds.
G For the period June 26, 2009 (commencement of sale of shares) to July 31, 2009.
H The amounts shown reflect certain reclassifications related to book to tax differences that were made in the year shown.
I Expense ratios reflect operating expenses of the class. Expenses before reductions do not reflect amounts reimbursed by the investment adviser or reductions from brokerage service arrangements or reductions from other expense offset arrangements and do not represent the amount paid by the class during periods when reimbursements or reductions occur. Expense ratios before reductions for start-up periods may not be representative of longer-term operating periods. Expenses net of fee waivers reflect expenses after reimbursement by the investment adviser but prior to reductions from brokerage service arrangements or other expense offset arrangements. Expenses net of all reductions represent the net expenses paid by the class.
J Amount represents less than $.01 per share.
K Total distributions of $.13 per share is comprised of distributions from net investment income of $.058 and distributions from net realized gain of $.076 per share.
See accompanying notes which are an integral part of the financial statements.
Annual Report
Notes to Financial Statements
For the period ended July 31, 2013
(Amounts in thousands except percentages)
1. Organization.
Fidelity® Blue Chip Growth Fund (the Fund) is a fund of Fidelity Securities Fund (the Trust) and is authorized to issue an unlimited number of shares. The Trust is registered under the Investment Company Act of 1940, as amended (the 1940 Act), as an open-end management investment company organized as a Massachusetts business trust. The Fund offers Blue Chip Growth, Class K and Class F shares, each of which has equal rights as to assets and voting privileges. Each class has exclusive voting rights with respect to matters that affect that class. Class F shares of the Fund are only available for purchase by mutual funds for which Fidelity Management & Research Company (FMR) or an affiliate serves as investment manager.
2. Investments in Fidelity Central Funds.
The Fund invests in Fidelity Central Funds, which are open-end investment companies generally available only to other investment companies and accounts managed by FMR and its affiliates. The Fund's Schedule of Investments lists each of the Fidelity Central Funds held as of period end, if any, as an investment of the Fund, but does not include the underlying holdings of each Fidelity Central Fund. As an Investing Fund, the Fund indirectly bears its proportionate share of the expenses of the underlying Fidelity Central Funds.
The Money Market Central Funds seek preservation of capital and current income and are managed by Fidelity Investments Money Management, Inc. (FIMM), an affiliate of FMR.
A complete unaudited list of holdings for each Fidelity Central Fund is available upon request or at the Securities and Exchange Commission (the SEC) website at www.sec.gov. In addition, the financial statements of the Fidelity Central Funds, which are not covered by the Fund's Report of Independent Registered Public Accounting Firm, are available on the SEC website or upon request.
3. Significant Accounting Policies.
The financial statements have been prepared in conformity with accounting principles generally accepted in the United States of America (GAAP), which require management to make certain estimates and assumptions at the date of the financial statements. Actual results could differ from those estimates. Subsequent events, if any, through the date that the financial statements were issued have been evaluated in the preparation of the financial statements. The following summarizes the significant accounting policies of the Fund:
Investment Valuation. Investments are valued as of 4:00 p.m. Eastern time on the last calendar day of the period. In accordance with valuation policies and procedures
Annual Report
Notes to Financial Statements - continued
(Amounts in thousands except percentages)
3. Significant Accounting Policies - continued
Investment Valuation - continued
approved by the Board of Trustees (the Board), the Fund attempts to obtain prices from one or more third party pricing vendors or brokers to value its investments. When current market prices, quotations or currency exchange rates are not readily available or reliable, investments will be fair valued in good faith by the FMR Fair Value Committee (the Committee), in accordance with procedures adopted by the Board. Factors used in determining fair value vary by investment type and may include market or investment specific events. The frequency with which these procedures are used cannot be predicted and they may be utilized to a significant extent. The Committee oversees the Fund's valuation policies and procedures and is responsible for approving and reporting to the Board all fair value determinations.
The Fund categorizes the inputs to valuation techniques used to value its investments into a disclosure hierarchy consisting of three levels as shown below:
Level 1 - quoted prices in active markets for identical investments
Level 2 - other significant observable inputs (including quoted prices for similar investments, interest rates, prepayment speeds, etc.)
Level 3 - unobservable inputs (including the Fund's own assumptions based on the best information available)
Valuation techniques used to value the Fund's investments by major category are as follows:
Equity securities, including restricted securities, for which market quotations are readily available, are valued at the last reported sale price or official closing price as reported by a third party pricing vendor on the primary market or exchange on which they are traded and are categorized as Level 1 in the hierarchy. In the event there were no sales during the day or closing prices are not available, securities are valued at the last quoted bid price or may be valued using the last available price and are generally categorized as Level 2 in the hierarchy. For foreign equity securities, when market or security specific events arise, comparisons to the valuation of American Depositary Receipts (ADRs), futures contracts, Exchange-Traded Funds (ETFs) and certain indexes as well as quoted prices for similar securities may be used and would be categorized as Level 2 in the hierarchy. Utilizing these techniques may result in transfers between Level 1 and Level 2. For restricted equity securities and private placements where observable inputs are limited, assumptions about market activity and risk are used and these securities are generally categorized as Level 3 in the hierarchy.
Annual Report
3. Significant Accounting Policies - continued
Investment Valuation - continued
Investments in open-end mutual funds, including the Fidelity Central Funds, are valued at their closing net asset value (NAV) each business day and are categorized as Level 1 in the hierarchy.
Changes in valuation techniques may result in transfers in or out of an assigned level within the disclosure hierarchy. The aggregate value of investments by input level, as of July 31, 2013, is included at the end of the Fund's Schedule of Investments.
Foreign Currency. The Fund may use foreign currency contracts to facilitate transactions in foreign-denominated securities. Gains and losses from these transactions may arise from changes in the value of the foreign currency or if the counterparties do not perform under the contracts' terms.
Foreign-denominated assets, including investment securities, and liabilities are translated into U.S. dollars at the exchange rates at period end. Purchases and sales of investment securities, income and dividends received and expenses denominated in foreign currencies are translated into U.S. dollars at the exchange rate in effect on the transaction date.
The effects of exchange rate fluctuations on investments are included with the net realized and unrealized gain (loss) on investment securities. Other foreign currency transactions resulting in realized and unrealized gain (loss) are disclosed separately.
Investment Transactions and Income. For financial reporting purposes, the Fund's investment holdings and NAV include trades executed through the end of the last business day of the period. The NAV per share for processing shareholder transactions is calculated as of the close of business of the New York Stock Exchange (NYSE), normally 4:00 p.m. Eastern time and includes trades executed through the end of the prior business day. Gains and losses on securities sold are determined on the basis of identified cost and may include proceeds received from litigation. Dividend income is recorded on the ex-dividend date, except for certain dividends from foreign securities where the ex-dividend date may have passed, which are recorded as soon as the Fund is informed of the ex-dividend date. Non-cash dividends included in dividend income, if any, are recorded at the fair market value of the securities received. Distributions received on securities that represent a return of capital or capital gain are recorded as a reduction of cost of investments and/or as a realized gain. Subsequent to ex-dividend date the Fund determines the components of these distributions, based upon receipt of tax filings or other correspondence relating to the underlying investment. Interest income and distributions from the Fidelity Central Funds are accrued as earned. Interest income includes coupon interest and amortization of premium and accretion of discount on debt
Annual Report
Notes to Financial Statements - continued
(Amounts in thousands except percentages)
3. Significant Accounting Policies - continued
Investment Transactions and Income - continued
securities. Investment income is recorded net of foreign taxes withheld where recovery of such taxes is uncertain.
Class Allocations and Expenses. Investment income, realized and unrealized capital gains and losses, common expenses of the Fund, and certain fund-level expense reductions, if any, are allocated on a pro-rata basis to each class based on the relative net assets of each class to the total net assets of Fund. Each class differs with respect to transfer agent fees incurred. Certain expense reductions may also differ by class. Expenses directly attributable to a fund are charged to that fund. Expenses attributable to more than one fund are allocated among the respective funds on the basis of relative net assets or other appropriate methods. Expense estimates are accrued in the period to which they relate and adjustments are made when actual amounts are known.
Deferred Trustee Compensation. Under a Deferred Compensation Plan (the Plan), independent Trustees may elect to defer receipt of a portion of their annual compensation. Deferred amounts are invested in a cross-section of Fidelity funds, are marked-to-market and remain in the Fund until distributed in accordance with the Plan. The investment of deferred amounts and the offsetting payable to the Trustees are included in the accompanying Statement of Assets and Liabilities.
Income Tax Information and Distributions to Shareholders. Each year, the Fund intends to qualify as a regulated investment company under Subchapter M of the Internal Revenue Code, including distributing substantially all of its taxable income and realized gains. As a result, no provision for income taxes is required. As of July 31, 2013, the Fund did not have any unrecognized tax benefits in the financial statements; nor is the Fund aware of any tax positions for which it is reasonably possible that the total amounts of unrecognized tax benefits will significantly change in the next twelve months. The Fund files a U.S. federal tax return, in addition to state and local tax returns as required. A fund's federal income tax returns are subject to examination by the Internal Revenue Service (IRS) for a period of three fiscal years after they are filed. State and local tax returns may be subject to examination for an additional fiscal year depending on the jurisdiction. Foreign taxes are provided for based on the Fund's understanding of the tax rules and rates that exist in the foreign markets in which it invests.
Distributions are declared and recorded on the ex-dividend date. Income dividends and capital gain distributions are declared separately for each class. Income and capital gain distributions are determined in accordance with income tax regulations, which may differ from GAAP. These differences resulted in distribution reclassifications. In addition,
Annual Report
3. Significant Accounting Policies - continued
Income Tax Information and Distributions to Shareholders - continued
the fund claimed a portion of the payment made to redeeming shareholders as a distribution for income tax purposes.
Capital accounts within the financial statements are adjusted for permanent book-tax differences. These adjustments have no impact on net assets or the results of operations. Temporary book-tax differences will reverse in a subsequent period.
Book-tax differences are primarily due to foreign currency transactions, partnerships, deferred trustees compensation, capital loss carryforwards and losses deferred due to wash sales.
The federal tax cost of investment securities and unrealized appreciation (depreciation) as of period end were as follows:
Gross unrealized appreciation | $ 6,725,212 |
Gross unrealized depreciation | (141,260) |
Net unrealized appreciation (depreciation) on securities and other investments | $ 6,583,952 |
| |
Tax Cost | $ 14,133,934 |
The tax-based components of distributable earnings as of period end were as follows:
Undistributed ordinary income | $ 130,879 |
Undistributed long-term capital gain | $ 996,747 |
Net unrealized appreciation (depreciation) | $ 6,583,947 |
The tax character of distributions paid was as follows:
| July 31, 2013 | July 31, 2012 |
Ordinary Income | $ 85,342 | $ 15,666 |
Long-term Capital Gains | 230,904 | 480,841 |
Total | $ 316,246 | $ 496,507 |
Restricted Securities. The Fund may invest in securities that are subject to legal or contractual restrictions on resale. These securities generally may be resold in transactions exempt from registration or to the public if the securities are registered. Disposal of these securities may involve time-consuming negotiations and expense, and prompt sale at an acceptable price may be difficult. Information regarding restricted securities is included at the end of the Fund's Schedule of Investments.
Annual Report
Notes to Financial Statements - continued
(Amounts in thousands except percentages)
4. Purchases and Sales of Investments.
Purchases and sales of securities, other than short-term securities, aggregated $13,939,479 and $12,907,588, respectively.
5. Fees and Other Transactions with Affiliates.
Management Fee. FMR and its affiliates provide the Fund with investment management related services for which the Fund pays a monthly management fee. The management fee is the sum of an individual fund fee rate that is based on an annual rate of .30% of the Fund's average net assets and an annualized group fee rate that averaged .26% during the period. The group fee rate is based upon the average net assets of all the mutual funds advised by FMR. The group fee rate decreases as assets under management increase and increases as assets under management decrease. In addition, the management fee is subject to a performance adjustment (up to a maximum of ± .20% of the Fund's average net assets over a 36 month performance period). The upward or downward adjustment to the management fee is based on the relative investment performance of Blue Chip Growth as compared to an appropriate benchmark index. For the period, the total annual management fee rate, including the performance adjustment, was .55% of the Fund's average net assets.
Transfer Agent Fees. Fidelity Investments Institutional Operations Company, Inc., (FIIOC), an affiliate of FMR, is the transfer, dividend disbursing and shareholder servicing agent for each class of the Fund. FIIOC receives account fees and asset-based fees that vary according to the account size and type of account of the shareholders of Blue Chip Growth. FIIOC receives an asset-based fee of Class K's average net assets. FIIOC receives no fees for providing transfer agency services to Class F. FIIOC pays for typesetting, printing and mailing of shareholder reports, except proxy statements. For the period, transfer agent fees for each class were as follows:
| Amount | % of
Average
Net Assets |
Blue Chip Growth | $ 22,289 | .19 |
Class K | 1,440 | .05 |
| $ 23,729 | |
Accounting and Security Lending Fees. Fidelity Service Company, Inc. (FSC), an affiliate of FMR, maintains the Fund's accounting records. The accounting fee is based on the level of average net assets for each month. Under a separate contract, FSC administers the security lending program. The security lending fee is based on the number and duration of lending transactions.
Annual Report
5. Fees and Other Transactions with Affiliates - continued
Brokerage Commissions. The Fund placed a portion of its portfolio transactions with brokerage firms which are affiliates of the investment adviser. Brokerage commissions are included in net realized gain (loss) and change in net unrealized appreciation (depreciation) in the Statement of Operations. The commissions paid to these affiliated firms were $401 for the period.
Interfund Lending Program. Pursuant to an Exemptive Order issued by the SEC, the Fund, along with other registered investment companies having management contracts with FMR, may participate in an interfund lending program. This program provides an alternative credit facility allowing the funds to borrow from, or lend money to, other participating affiliated funds. At period end, there were no interfund loans outstanding. The Fund's activity in this program during the period for which loans were outstanding was as follows:
Borrower or Lender | Average Loan
Balance | Weighted Average
Interest Rate | Interest
Expense |
Borrower | $ 12,940 | .41% | $ 8 |
Exchanges In-Kind. During the period, certain investment companies managed by FMR or its affiliates (Investing Funds) completed exchanges in-kind with the Fund. The Investing Funds delivered cash and securities valued at $1,605,000 in exchange for 32,348 shares of the Fund. The amount of in-kind exchanges is included in share transactions in the accompanying Statement of Changes in Net Assets, as well as Note 10: Share Transactions. The Fund recognized no gain or loss for federal income tax purposes.
6. Committed Line of Credit.
The Fund participates with other funds managed by FMR or an affiliate in a $4.25 billion credit facility (the "line of credit") to be utilized for temporary or emergency purposes to fund shareholder redemptions or for other short-term liquidity purposes. The Fund has agreed to pay commitment fees on its pro-rata portion of the line of credit, which amounted to $39 and is reflected in Miscellaneous expenses on the Statement of Operations. During the period, there were no borrowings on this line of credit.
7. Security Lending.
The Fund lends portfolio securities through a lending agent from time to time in order to earn additional income. For equity securities, a lending agent is used and may loan securities to certain qualified borrowers, including Fidelity Capital Markets (FCM), a broker-dealer affiliated with the Fund. On the settlement date of the loan, the Fund receives collateral (in the form of U.S. Treasury obligations, letters of credit and/or cash) against the loaned securities and maintains collateral in an amount not less than 100% of
Annual Report
Notes to Financial Statements - continued
(Amounts in thousands except percentages)
7. Security Lending - continued
the market value of the loaned securities during the period of the loan. The market value of the loaned securities is determined at the close of business of the Fund and any additional required collateral is delivered to the Fund on the next business day. If the borrower defaults on its obligation to return the securities loaned because of insolvency or other reasons, the Fund may apply collateral received from the borrower against the obligation. The Fund may experience delays and costs in recovering the securities loaned. Any cash collateral received is invested in the Fidelity Securities Lending Cash Central Fund. The value of loaned securities and cash collateral at period end are disclosed on the Fund's Statement of Assets and Liabilities. The value of securities loaned to FCM at period end was $2,041. Security lending income represents the income earned on investing cash collateral, less rebates paid to borrowers and any lending agent fees associated with the loan, plus any premium payments received for lending certain types of securities. Security lending income is presented in the Statement of Operations as a component of income from Fidelity Central Funds. Total security lending income during the period amounted to $10,642, including $619 from securities loaned to FCM.
8. Expense Reductions.
Commissions paid to certain brokers with whom FMR places trades on behalf of the Fund include an amount in addition to trade execution, which is rebated back to the Fund to offset certain expenses. This amount totaled $2,199 for the period. In addition, FMR reimbursed a portion of the Fund's operating expenses during the period in the amount of $37.
9. Distributions to Shareholders.
Distributions to shareholders of each class were as follows:
Years ended July 31, | 2013 | 2012 |
From net investment income | | |
Blue Chip Growth | $ 51,844 | $ 10,644 |
Class K | 16,348 | 2,860 |
Class F | 17,150 | 2,162 |
Total | $ 85,342 | $ 15,666 |
From net realized gain | | |
Blue Chip Growth | $ 155,106 | $ 397,250 |
Class K | 36,829 | 51,295 |
Class F | 38,969 | 32,296 |
Total | $ 230,904 | $ 480,841 |
Annual Report
10. Share Transactions.
Transactions for each class of shares were as follows:
| Shares | Dollars |
Years ended July 31, | 2013 | 2012 | 2013 | 2012 |
Blue Chip Growth | | | | |
Shares sold | 41,304 A | 42,825 | $ 2,121,491 A | $ 1,970,082 |
Reinvestment of distributions | 4,171 | 9,668 | 202,506 | 399,689 |
Shares redeemed | (52,364) | (78,498) | (2,708,546) | (3,530,347) |
Net increase (decrease) | (6,889) | (26,005) | $ (384,549) | $ (1,160,576) |
Class K | | | | |
Shares sold | 17,299 | 29,866 | $ 899,333 | $ 1,366,770 |
Reinvestment of distributions | 1,092 | 1,309 | 53,178 | 54,155 |
Shares redeemed | (11,703) | (9,363) | (608,221) | (426,597) |
Net increase (decrease) | 6,688 | 21,812 | $ 344,290 | $ 994,328 |
Class F | | | | |
Shares sold | 28,168 A | 19,170 | $ 1,424,726 A | $ 873,960 |
Reinvestment of distributions | 1,153 | 832 | 56,119 | 34,458 |
Shares redeemed | (3,595) | (1,918) | (192,628) | (86,138) |
Net increase (decrease) | 25,726 | 18,084 | $ 1,288,217 | $ 822,280 |
A Amount includes in-kind exchanges (See Note 5: Exchanges In-Kind)
11. Other.
The Fund's organizational documents provide former and current trustees and officers with a limited indemnification against liabilities arising in connection with the performance of their duties to the Fund. In the normal course of business, the Fund may also enter into contracts that provide general indemnifications. The Fund's maximum exposure under these arrangements is unknown as this would be dependent on future claims that may be made against the Fund. The risk of material loss from such claims is considered remote.
At the end of the period, the Fidelity Freedom Funds and Fidelity Freedom K Funds were the owners of record, in the aggregate, of approximately 33% of the total outstanding shares of the Fund.
Annual Report
To the Trustees of Fidelity Securities Fund and Shareholders of Fidelity Blue Chip Growth Fund:
We have audited the accompanying statement of assets and liabilities of Fidelity Blue Chip Growth Fund (the Fund), a fund of Fidelity Securities Fund, including the schedule of investments, as of July 31, 2013, and the related statement of operations for the year then ended, the statement of changes in net assets for each of the two years in the period then ended, and the financial highlights for each of the five years in the period then ended. These financial statements and financial highlights are the responsibility of the Fund's management. Our responsibility is to express an opinion on these financial statements and financial highlights based on our audits.
We conducted our audits in accordance with the standards of the Public Company Accounting Oversight Board (United States). Those standards require that we plan and perform the audit to obtain reasonable assurance about whether the financial statements and financial highlights are free of material misstatement. The Fund is not required to have, nor were we engaged to perform, an audit of its internal control over financial reporting. Our audits included consideration of internal control over financial reporting as a basis for designing audit procedures that are appropriate in the circumstances, but not for the purpose of expressing an opinion on the effectiveness of the Fund's internal control over financial reporting. Accordingly, we express no such opinion. An audit also includes examining, on a test basis, evidence supporting the amounts and disclosures in the financial statements, assessing the accounting principles used and significant estimates made by management, as well as evaluating the overall financial statement presentation. Our procedures included confirmation of securities owned as of July 31, 2013, by correspondence with the custodians and brokers; where replies were not received from brokers, we performed other auditing procedures. We believe that our audits provide a reasonable basis for our opinion.
In our opinion, the financial statements and financial highlights referred to above present fairly, in all material respects, the financial position of Fidelity Blue Chip Growth Fund as of July 31, 2013, the results of its operations for the year then ended, the changes in its net assets for each of the two years in the period then ended, and the financial highlights for each of the five years in the period then ended, in conformity with accounting principles generally accepted in the United States of America.
DELOITTE & TOUCHE LLP
Boston, Massachusetts
September 11, 2013
Annual Report
The Trustees, Member of the Advisory Board, and executive officers of the trust and funds, as applicable, are listed below. The Board of Trustees governs each fund and is responsible for protecting the interests of shareholders. The Trustees are experienced executives who meet periodically throughout the year to oversee each fund's activities, review contractual arrangements with companies that provide services to each fund, oversee management of the risks associated with such activities and contractual arrangements, and review each fund's performance. Except for James C. Curvey, Ned C. Lautenbach, Ronald P. O'Hanley, and William S. Stavropoulos, each of the Trustees oversees 166 Fidelity funds. Mr. Curvey oversees 387 Fidelity funds. Mr. Lautenbach, Mr. O'Hanley, and Mr. Stavropoulos each oversees 230 Fidelity funds.
The Trustees hold office without limit in time except that (a) any Trustee may resign; (b) any Trustee may be removed by written instrument, signed by at least two-thirds of the number of Trustees prior to such removal; (c) any Trustee who requests to be retired or who has become incapacitated by illness or injury may be retired by written instrument signed by a majority of the other Trustees; and (d) any Trustee may be removed at any special meeting of shareholders by a two-thirds vote of the outstanding voting securities of the trust. Each Trustee who is not an interested person of the trust and the funds (as defined in the 1940 Act) (Independent Trustee), shall retire not later than the last day of the calendar year in which his or her 75th birthday occurs. The Independent Trustees may waive this mandatory retirement age policy with respect to individual Trustees. The executive officers and Advisory Board Member hold office without limit in time, except that any officer and Advisory Board Member may resign or may be removed by a vote of a majority of the Trustees at any regular meeting or any special meeting of the Trustees. Except as indicated, each individual has held the office shown or other offices in the same company for the past five years.
Experience, Skills, Attributes, and Qualifications of the Funds' Trustees. The Governance and Nominating Committee has adopted a statement of policy that describes the experience, qualifications, attributes, and skills that are necessary and desirable for potential Independent Trustee candidates (Statement of Policy). The Board believes that each Trustee satisfied at the time he or she was initially elected or appointed a Trustee, and continues to satisfy, the standards contemplated by the Statement of Policy. The Governance and Nominating Committee also engages professional search firms to help identify potential Independent Trustee candidates who have the experience, qualifications, attributes, and skills consistent with the Statement of Policy. From time to time, additional criteria based on the composition and skills of the current Independent Trustees, as well as experience or skills that may be appropriate in light of future changes to board composition, business conditions, and regulatory or other developments, have also been considered by the professional search firms and the Governance and Nominating Committee. In addition, the Board takes into account the Trustees' commitment and participation in Board and committee meetings, as well as their leadership of standing and ad hoc committees throughout their tenure.
Annual Report
In determining that a particular Trustee was and continues to be qualified to serve as a Trustee, the Board has considered a variety of criteria, none of which, in isolation, was controlling. The Board believes that, collectively, the Trustees have balanced and diverse experience, qualifications, attributes, and skills, which allow the Board to operate effectively in governing each fund and protecting the interests of shareholders. Information about the specific experience, skills, attributes, and qualifications of each Trustee, which in each case led to the Board's conclusion that the Trustee should serve (or continue to serve) as a trustee of the funds, is provided below.
Board Structure and Oversight Function. James C. Curvey is an interested person (as defined in the 1940 Act) and currently serves as Chairman. The Trustees have determined that an interested Chairman is appropriate and benefits shareholders because an interested Chairman has a personal and professional stake in the quality and continuity of services provided to the funds. Independent Trustees exercise their informed business judgment to appoint an individual of their choosing to serve as Chairman, regardless of whether the Trustee happens to be independent or a member of management. The Independent Trustees have determined that they can act independently and effectively without having an Independent Trustee serve as Chairman and that a key structural component for assuring that they are in a position to do so is for the Independent Trustees to constitute a substantial majority for the Board. The Independent Trustees also regularly meet in executive session. Ned C. Lautenbach serves as Chairman of the Independent Trustees and as such (i) acts as a liaison between the Independent Trustees and management with respect to matters important to the Independent Trustees and (ii) with management prepares agendas for Board meetings.
Fidelity funds are overseen by different Boards of Trustees. The funds' Board oversees Fidelity's equity and high income funds and another Board oversees Fidelity's investment-grade bond, money market, and asset allocation funds. The asset allocation funds may invest in Fidelity funds overseen by the funds' Board. The use of separate Boards, each with its own committee structure, allows the Trustees of each group of Fidelity funds to focus on the unique issues of the funds they oversee, including common research, investment, and operational issues. On occasion, the separate Boards establish joint committees to address issues of overlapping consequences for the Fidelity funds overseen by each Board.
The Trustees operate using a system of committees to facilitate the timely and efficient consideration of all matters of importance to the Trustees, each fund, and fund shareholders and to facilitate compliance with legal and regulatory requirements and oversight of the funds' activities and associated risks. The Board, acting through its committees, has charged FMR and its affiliates with (i) identifying events or circumstances the occurrence of which could have demonstrably adverse effects on the funds' business and/or reputation; (ii) implementing processes and controls to lessen the possibility that such events or circumstances occur or to mitigate the effects of such events or circumstances if they do occur; and (iii) creating and maintaining a system designed to evaluate continuously business and market conditions in order to facilitate the identification and implementation processes described in (i) and (ii) above. Because the day-to-day operations and activities of the funds are carried out by or through FMR, its affiliates and other service providers, the funds' exposure to risks is mitigated but not eliminated by the processes overseen by the Trustees. While each of the Board's committees has responsibility for overseeing different aspects of the funds' activities, oversight is exercised primarily through the Operations, Audit, and Compliance Committees. In addition, the Independent Trustees have worked with FMR to enhance the Board's oversight of investment and financial risks, legal and regulatory risks, technology risks, and operational risks, including the development of additional risk reporting to the Board. For example, a working group comprised of Independent Trustees and FMR has worked and continues to work to review the Fidelity funds' valuation-related activities, reporting and risk management. Appropriate personnel, including but not limited to the funds' Chief Compliance Officer (CCO), FMR's internal auditor, the independent accountants, the funds' Treasurer and portfolio management personnel, make periodic reports to the Board's committees, as appropriate, including an annual review of FMR's risk management program for the Fidelity funds. The responsibilities of each standing committee, including their oversight responsibilities, are described further under "Standing Committees of the Funds' Trustees."
Annual Report
Trustees and Officers - continued
The fund's Statement of Additional Information (SAI) includes more information about the Trustees. To request a free copy, call Fidelity at 1-800-835-5092.
Interested Trustees*:
Correspondence intended for each Trustee who is an interested person may be sent to Fidelity Investments, 245 Summer Street, Boston, Massachusetts 02210.
Name, Year of Birth; Principal Occupations and Other Relevant Experience+ |
James C. Curvey (1935) |
| Year of Election or Appointment: 2007 Mr. Curvey is Trustee and Chairman of the Board of Trustees of certain Trusts. Mr. Curvey also serves as Trustee (2007-present) of other investment companies advised by FMR. Mr. Curvey is a Director of Fidelity Investments Money Management, Inc. (2009-present), Director of Fidelity Research & Analysis Co. (2009-present) and Director of FMR and FMR Co., Inc. (2007-present). Mr. Curvey is also Vice Chairman (2007-present) and Director of FMR LLC. In addition, Mr. Curvey serves as an Overseer for the Boston Symphony Orchestra and a member of the Trustees of Villanova University. Previously, Mr. Curvey was the Vice Chairman (2006-2007) and Director (2000-2007) of FMR Corp. |
Ronald P. O'Hanley (1957) |
| Year of Election or Appointment: 2011 Mr. O'Hanley serves as a Trustee and Chairman of the Board of Trustees of other Fidelity funds (2013-present), and is Director of FMR Co., Inc. (2010-present), Director of Fidelity Investments Money Management, Inc. (2010-present), Director of Fidelity Research & Analysis Company (2010-present), President of Fidelity Asset Management and Corporate Services and a Member of Fidelity's Executive Committee (2010-present). Previously, Mr. O'Hanley served as President and Chief Executive Officer of BNY Mellon Asset Management (2007-2010). Mr. O'Hanley also served as Vice Chairman of Bank New York Mellon Corp. and a member of that firm's Executive Committee. Prior to the 2007 merger of The Bank of New York and Mellon Financial Corporation, he was Vice Chairman of Mellon Financial Corporation and President and Chief Executive Officer of Mellon Asset Management. He joined Mellon in February 1997. Mr. O'Hanley currently serves as Chairman of the Boston Public Library Foundation Board of Directors and sits on the Board of Directors of Beth Israel Deaconess Medical Center, the Board of Trustees of the Marine Biological Laboratory and the Advisory Board of the Maxwell School of Citizenship and Public Administration at Syracuse University. Mr. O'Hanley also chairs the Council on Asset Management for the Financial Services Roundtable and is a member of the Board of Directors of Institutional Investor's U.S. Institute. |
* Trustees have been determined to be "Interested Trustees" by virtue of, among other things, their affiliation with the trust or various entities under common control with FMR.
+ The information above includes each Trustee's principal occupation during the last five years and other information relating to the experience, attributes, and skills relevant to each Trustee's qualifications to serve as a Trustee, which led to the conclusion that each Trustee should serve as a Trustee for each fund.
Annual Report
Trustees and Officers - continued
Independent Trustees:
Correspondence intended for each Independent Trustee (that is, the Trustees other than the Interested Trustees) may be sent to Fidelity Investments, P.O. Box 55235, Boston, Massachusetts 02205-5235.
Name, Year of Birth; Principal Occupations and Other Relevant Experience+ |
Dennis J. Dirks (1948) |
| Year of Election or Appointment: 2005 Prior to his retirement in May 2003, Mr. Dirks was Chief Operating Officer and a member of the Board of The Depository Trust & Clearing Corporation (DTCC). He also served as President, Chief Operating Officer, and Board member of The Depository Trust Company (DTC) and President and Board member of the National Securities Clearing Corporation (NSCC). In addition, Mr. Dirks served as Chief Executive Officer and Board member of the Government Securities Clearing Corporation, Chief Executive Officer and Board member of the Mortgage-Backed Securities Clearing Corporation, as a Trustee and a member of the Finance Committee of Manhattan College (2005-2008), and as a Trustee and a member of the Finance Committee of AHRC of Nassau County (2006-2008). Mr. Dirks is a member of the Independent Directors Council (IDC) Governing Council (2010-present) and Board of Directors for The Brookville Center for Children's Services, Inc. (2009-present). |
Alan J. Lacy (1953) |
| Year of Election or Appointment: 2008 Mr. Lacy serves as Senior Adviser (2007-present) of Oak Hill Capital Partners, L.P. (private equity). Mr. Lacy also served as Chief Executive Officer (2000-2005) and Vice Chairman (2005-2006) of Sears Holdings Corporation and Sears, Roebuck and Co. (retail). In addition, Mr. Lacy serves as a member of the Board of Directors of Dave & Buster's Entertainment, Inc. (restaurant and entertainment complexes, 2010-present), Earth Fare, Inc. (retail grocery, 2012-present), The Hillman Companies, Inc. (hardware wholesalers, 2010-present), and Bristol-Myers Squibb Company (global pharmaceuticals, 2008-present). Mr. Lacy is a member of the Board of Trustees of The National Parks Conservation Association (2006-present). Previously, Mr. Lacy served as Chairman of the Board of Trustees of the National Parks Conservation Association (2008-2011) and as a member of the Board of Directors for the Western Union Company (global money transfer, 2006-2011). |
Ned C. Lautenbach (1944) |
| Year of Election or Appointment: 2000 Mr. Lautenbach is Chairman of the Independent Trustees of the Equity and High Income Funds (2006-present) and serves as a Trustee of other Fidelity funds (2013-present). Mr. Lautenbach currently serves as the Lead Director of the Eaton Corporation Board of Directors (diversified industrial, 1997-present). Mr. Lautenbach is Chairman of the Board of Directors of the Philharmonic Center for the Arts in Naples, Florida (2012-present) and a member of the Council on Foreign Relations (1994-present). Previously, Mr. Lautenbach was a Partner/Advisory Partner at Clayton, Dubilier & Rice, LLC (private equity investment, 1998-2010), as well as a Director of Sony Corporation (2006-2007). |
Joseph Mauriello (1944) |
| Year of Election or Appointment: 2008 Prior to his retirement in January 2006, Mr. Mauriello served in numerous senior management positions including Deputy Chairman and Chief Operating Officer (2004-2005), and Vice Chairman of Financial Services (2002-2004) of KPMG LLP US (professional services, 1965-2005). Mr. Mauriello currently serves as a member of the Board of Directors of XL Group plc. (global insurance and re-insurance, 2006-present). Previously, Mr. Mauriello served as a Director of the Hamilton Funds of the Bank of New York (2006-2007) and of Arcadia Resources Inc. (health care services and products, 2007-2012). |
Robert W. Selander (1950) |
| Year of Election or Appointment: 2011 Previously, Mr. Selander served as a Member of the Advisory Board of Fidelity's Equity and High Income Funds (2011), Executive Vice Chairman (2010), Chief Executive Officer (2009-2010), and President and Chief Executive Officer (1997-2009) of Mastercard, Inc. |
Cornelia M. Small (1944) |
| Year of Election or Appointment: 2005 Ms. Small is a member of the Board of Directors (2009-present) and Chair of the Investment Committee (2010-present) of the Teagle Foundation. Ms. Small also serves on the Investment Committee of the Berkshire Taconic Community Foundation (2008-present). Previously, Ms. Small served as Chairperson (2002-2008) and a member of the Investment Committee and Chairperson (2008-2012) and a member of the Board of Trustees of Smith College. In addition, Ms. Small served as Chief Investment Officer, Director of Global Equity Investments, and a member of the Board of Directors of Scudder, Stevens & Clark and Scudder Kemper Investments. |
William S. Stavropoulos (1939) |
| Year of Election or Appointment: 2002 Mr. Stavropoulos is Vice Chairman of the Independent Trustees of the Equity and High Income Funds (2006-present) and serves as a Trustee of other Fidelity funds (2013-present). Mr. Stavropoulos serves as President and Founder of the Michigan Baseball Foundation, the Great Lakes Loons (2007-present). Mr. Stavropoulos is Chairman Emeritus of the Board of Directors of The Dow Chemical Company, where he previously served in numerous senior management positions, including President, CEO (1995-2000; 2002-2004), Chairman of the Executive Committee (2000-2006), and as a member of the Board of Directors (1990-2006). Currently, Mr. Stavropoulos is Chairman of the Board of Directors of Univar Inc. (global distributor of commodity and specialty chemicals), a Director of Teradata Corporation (data warehousing and technology solutions), and Maersk Inc. (industrial conglomerate), and a member of the Advisory Board for Metalmark Capital LLC (private equity investment, 2005-present). Mr. Stavropoulos is an operating advisor to Clayton, Dubilier & Rice, LLC (private equity investment). In addition, Mr. Stavropoulos is a member of the University of Notre Dame Advisory Council for the College of Science, a Trustee of the Rollin L. Gerstacker Foundation, and a Director of the Naples Philharmonic Center for the Arts. Previously, Mr. Stavropoulos served as a Director of Chemical Financial Corporation (bank holding company, 1993-2012) and Tyco International, Ltd. (multinational manufacturing and services, 2007-2012). |
David M. Thomas (1949) |
| Year of Election or Appointment: 2008 Previously, Mr. Thomas served as Executive Chairman (2005-2006) and Chairman and Chief Executive Officer (2000-2005) of IMS Health, Inc. (pharmaceutical and healthcare information solutions), and a Director of Fortune Brands, Inc. (consumer products, 2000-2011). In addition, Mr. Thomas serves as Non-Executive Chairman of the Board of Directors of Fortune Brands Home and Security (home and security products, 2011-present), and as a member of the Board of Directors of Interpublic Group of Companies, Inc. (marketing communication, 2004-present). |
+ The information above includes each Trustee's principal occupation during the last five years and other information relating to the experience, attributes, and skills relevant to each Trustee's qualifications to serve as a Trustee, which led to the conclusion that each Trustee should serve as a Trustee for each fund.
Annual Report
Advisory Board Member and Executive Officers:
Correspondence intended for each executive officer and Peter S. Lynch may be sent to Fidelity Investments, 245 Summer Street, Boston, Massachusetts 02210.
Name, Year of Birth; Principal Occupation |
Peter S. Lynch (1944) |
| Year of Election or Appointment: 2003 Member of the Advisory Board of Fidelity's Equity and High Income Funds. Mr. Lynch is Vice Chairman and a Director of FMR and FMR Co., Inc. In addition, Mr. Lynch serves as a Trustee of Boston College and as the Chairman of the Inner-City Scholarship Fund. Previously, Mr. Lynch served on the Special Olympics International Board of Directors (1997-2006). |
Kenneth B. Robins (1969) |
| Year of Election or Appointment: 2008 President and Treasurer of Fidelity's Equity and High Income Funds. Mr. Robins also serves as President and Treasurer (2008-present) and Assistant Treasurer (2009-present) of other Fidelity funds and is an employee of Fidelity Investments (2004-present). Mr. Robins serves as Executive Vice President of Fidelity Investments Money Management, Inc. (FIMM) (2013-present). Previously, Mr. Robins served as Deputy Treasurer of the Fidelity funds (2005-2008) and Treasurer and Chief Financial Officer of The North Carolina Capital Management Trust: Cash and Term Portfolios (2006-2008). |
Bruce T. Herring (1965) |
| Year of Election or Appointment: 2006 Vice President of certain Equity Funds. Mr. Herring also serves as Vice President of other Fidelity funds (2013-present), Chief Investment Officer of Fidelity Global Asset Allocation (GAA) (2013-present), Chief Investment Officer and Director of Fidelity Management & Research (U.K.) Inc. (2010-present), Group Chief Investment Officer of FMR, and President of Fidelity Research & Analysis Company (2010-present). Previously, Mr. Herring served as Vice President (2005-2006) and Senior Vice President (2006-2007) of Fidelity Management & Research Company, Vice President of FMR Co., Inc. (2001-2007) and as a portfolio manager for Fidelity U.S. Equity Funds. |
Brian B. Hogan (1964) |
| Year of Election or Appointment: 2009 Vice President of Equity and High Income Funds. Mr. Hogan also serves as Vice President of other Fidelity funds (2009-present) and President of FMR's Equity Division (2009-present). Previously, Mr. Hogan served as Senior Vice President, Equity Research of FMR (2006-2009) and as a portfolio manager. |
Scott C. Goebel (1968) |
| Year of Election or Appointment: 2008 Secretary and Chief Legal Officer (CLO) of the Fidelity funds. Mr. Goebel also serves as Secretary of Fidelity Investments Money Management, Inc. (FIMM) (2010-present) and Fidelity Research and Analysis Company (FRAC) (2010-present); Secretary and CLO of The North Carolina Capital Management Trust: Cash and Term Portfolios (2008-present); General Counsel, Secretary, and Senior Vice President of FMR (2008-present) and FMR Co., Inc. (2008-present); employed by FMR LLC or an affiliate (2001-present); Chief Legal Officer of Fidelity Management & Research (Hong Kong) Limited (2008-present) and Assistant Secretary of Fidelity Management & Research (Japan) Inc. (2008-present), and Fidelity Management & Research (U.K.) Inc. (2008-present). Previously, Mr. Goebel served as Assistant Secretary of FIMM (2008-2010), FRAC (2008-2010), and the Funds (2007-2008) and as Vice President and Secretary of Fidelity Distributors Corporation (FDC) (2005-2007). |
William C. Coffey (1969) |
| Year of Election or Appointment: 2009 Assistant Secretary of Fidelity's Equity and High Income Funds. Mr. Coffey also serves as Assistant Secretary of other Fidelity funds (2009-present), Senior Vice President and Deputy General Counsel of FMR LLC (2010-present), and is an employee of Fidelity Investments. Previously, Mr. Coffey served as Vice President and Associate General Counsel of FMR LLC (2005-2009). |
Elizabeth Paige Baumann (1968) |
| Year of Election or Appointment: 2012 Anti-Money Laundering (AML) Officer of the Fidelity funds. Ms. Baumann also serves as AML Officer of The North Carolina Capital Management Trust: Cash and Term Portfolios (2012-present), Chief AML Officer of FMR LLC (2012-present), and is an employee of Fidelity Investments. Previously, Ms. Baumann served as Vice President and Deputy Anti-Money Laundering Officer (2007-2012). |
Christine Reynolds (1958) |
| Year of Election or Appointment: 2008 Chief Financial Officer of the Fidelity funds. Ms. Reynolds became President of Fidelity Pricing and Cash Management Services (FPCMS) in August 2008. Ms. Reynolds served as Chief Operating Officer of FPCMS (2007-2008). Previously, Ms. Reynolds served as President, Treasurer, and Anti-Money Laundering officer of the Fidelity funds (2004-2007). |
Joseph A. Hanlon (1968) |
| Year of Election or Appointment: 2012 Chief Compliance Officer of Fidelity's Equity and High Income Funds. Mr. Hanlon also serves as Chief Compliance Officer of other Fidelity funds (2012-present). Mr. Hanlon serves as Compliance Officer of FMR, FMR Co., Inc., Fidelity Investments Money Management, Inc. (FIMM), Fidelity Research and Analysis Company (FRAC), and Fidelity Management & Research (Hong Kong) (2009-present), as Senior Vice President of the Fidelity Asset Management Division (2009-present), and is an employee of Fidelity Investments. Previously, Mr. Hanlon served as Compliance Officer of Fidelity Management & Research (Japan) Inc. (2009-2013), Strategic Advisers, Inc. (2009-2013), and Fidelity Management & Research (U.K.) Inc. (2009-2013). |
Joseph F. Zambello (1957) |
| Year of Election or Appointment: 2011 Deputy Treasurer of the Fidelity funds. Mr. Zambello is an employee of Fidelity Investments. Previously, Mr. Zambello served as Vice President of FMR's Program Management Group (2009-2011) and Vice President of the Transfer Agent Oversight Group (2005-2009). |
Adrien E. Deberghes (1967) |
| Year of Election or Appointment: 2008 Deputy Treasurer of Fidelity's Equity and High Income Funds. Mr. Deberghes also serves as Vice President (2011-present), Deputy Treasurer (2008-present), and Assistant Treasurer (2010-present) of other Fidelity funds, and is an employee of Fidelity Investments (2008-present). Previously, Mr. Deberghes served as Senior Vice President of Mutual Fund Administration at State Street Corporation (2007-2008), Senior Director of Mutual Fund Administration at Investors Bank & Trust (2005-2007), and Director of Finance for Dunkin' Brands (2000-2005). |
Stephen Sadoski (1971) |
| Year of Election or Appointment: 2012 Deputy Treasurer of Fidelity's Equity and High Income Funds. Mr. Sadoski also serves as Deputy Treasurer of other Fidelity funds (2012-present) and is an employee of Fidelity Investments (2012-present). Previously, Mr. Sadoski served as Assistant Treasurer of Fidelity's Fixed Income and Asset Allocation Funds (2012-2013), an assistant chief accountant in the Division of Investment Management of the Securities and Exchange Commission (SEC) (2009-2012) and as a senior manager at Deloitte & Touche LLP (1997-2009). |
Stacie M. Smith (1974) |
| Year of Election or Appointment: 2013 Deputy Treasurer of Fidelity's Equity and High Income Funds. Ms. Smith also serves as Deputy Treasurer of other Fidelity funds (2013-present) and is an employee of Fidelity Investments (2009-present). Previously, Ms. Smith served as Senior Audit Manager of Ernst & Young LLP (1996-2009). |
Stephanie J. Dorsey (1969) |
| Year of Election or Appointment: 2010 Assistant Treasurer of Fidelity's Equity and High Income Funds. Ms. Dorsey also serves as President and Treasurer (2013-present) and Assistant Treasurer (2010-present) of other Fidelity funds, Treasurer and Chief Financial Officer of The North Carolina Capital Management Trust: Cash and Term Portfolios (2013-present), and is an employee of Fidelity Investments (2008-present). Previously, Ms. Dorsey served as Deputy Treasurer of Fidelity's Fixed Income and Asset Allocation Funds (2008-2013), Treasurer (2004-2008) of the JPMorgan Mutual Funds and Vice President (2004-2008) of JPMorgan Chase Bank. |
Gary W. Ryan (1958) |
| Year of Election or Appointment: 2005 Assistant Treasurer of the Fidelity funds. Mr. Ryan is an employee of Fidelity Investments. Previously, Mr. Ryan served as Vice President of Fund Reporting in Fidelity Pricing and Cash Management Services (FPCMS) (1999-2005). |
Jonathan Davis (1968) |
| Year of Election or Appointment: 2010 Assistant Treasurer of the Fidelity funds. Mr. Davis is also Assistant Treasurer of Fidelity Rutland Square Trust II and Fidelity Commonwealth Trust II. Mr. Davis is an employee of Fidelity Investments. Previously, Mr. Davis served as Vice President and Associate General Counsel of FMR LLC (2003-2010). |
Annual Report
The Board of Trustees of Fidelity Blue Chip Growth Fund voted to pay to shareholders of record at the opening of business on record date, the following distributions per share derived from capital gains realized from sales of portfolio securities; and dividends derived from net investment income:
| Pay Date | Record Date | Dividends | Capital Gains |
Class K | 09/09/13 | 09/06/13 | $0.195 | $3.176 |
The fund hereby designates as a capital gain dividend with respect to the taxable year ended July 31, 2013, $1,227,651,246, or, if subsequently determined to be different, the net capital gain of such year.
Class K designates 100% of the dividends distributed during the fiscal year as qualifying for the dividends-received deduction for corporate shareholders.
Class K designates 100% of the dividends distributed during the fiscal year as amounts which can be taken into account as a dividend for the purposes of the maximum rate under section 1(h)(11) of the Internal Revenue Code.
The fund will notify shareholders in January 2014 of amounts for use in preparing 2013 income tax returns.
Annual Report
Board Approval of Investment Advisory Contracts and Management Fees
Fidelity Blue Chip Growth Fund
Each year, the Board of Trustees, including the Independent Trustees (together, the Board), votes on the renewal of the management contract and sub-advisory agreements (together, the Advisory Contracts) for the fund. The Board, assisted by the advice of fund counsel and Independent Trustees' counsel, requests and considers a broad range of information relevant to the renewal of the Advisory Contracts throughout the year.
The Board meets regularly and, at each of its meetings, covers an extensive agenda of topics and materials and considers factors that are relevant to its annual consideration of the renewal of the fund's Advisory Contracts, including the services and support provided to the fund and its shareholders. The Board has established various standing committees, each composed of and chaired by Independent Trustees with varying backgrounds, to which the Board has assigned specific subject matter responsibilities in order to enhance effective decision-making by the Board. The Board, acting directly and through its Committees, requests and receives information concerning the annual consideration of the renewal of the fund's Advisory Contracts. The Board also meets as needed to consider matters specifically related to the Board's annual consideration of the renewal of Advisory Contracts. Members of the Board may also meet with trustees of other Fidelity funds through ad hoc joint committees to discuss certain matters relevant to the Fidelity funds.
At its July 2013 meeting, the Board, including the Independent Trustees, unanimously determined to renew the fund's Advisory Contracts. In reaching its determination, the Board considered all factors it believed relevant, including (i) the nature, extent, and quality of the services to be provided to the fund and its shareholders (including the investment performance of the fund); (ii) the competitiveness of the fund's management fee and total expense ratio relative to peer funds; (iii) the total costs of the services to be provided by and the profits to be realized by Fidelity from its relationship with the fund; (iv) the extent to which economies of scale exist and would be realized as the fund grows; and (v) whether fee levels reflect these economies of scale, if any, for the benefit of fund shareholders.
In considering whether to renew the Advisory Contracts for the fund, the Board reached a determination, with the assistance of fund counsel and Independent Trustees' counsel and through the exercise of its business judgment, that the renewal of the Advisory Contracts was in the best interests of the fund and its shareholders and that the compensation payable under the Advisory Contracts was fair and reasonable. The Board's decision to renew the Advisory Contracts was not based on any single factor, but rather was based on a comprehensive consideration of all the information provided to the Board at its meetings throughout the year. The Board, in reaching its determination to renew the Advisory Contracts, was aware that shareholders in the fund have a broad range of investment choices available to them, including a wide choice among mutual funds offered by Fidelity's competitors, and that the fund's shareholders, who have the opportunity to review and weigh the disclosure provided by the fund in its prospectus and other public disclosures, have chosen to invest in this fund, which is a part of the Fidelity family of funds.
Annual Report
Nature, Extent, and Quality of Services Provided. The Board considered the staffing within the investment adviser, Fidelity Management & Research Company (FMR), and the sub-advisers (together, the Investment Advisers) as it relates to the fund, including the backgrounds of the fund's investment personnel, and also considered the fund's investment objective, strategies, and related investment philosophy. The Independent Trustees also had discussions with senior management of Fidelity's investment operations and investment groups. The Board considered the structure of the portfolio manager compensation program and whether this structure provides appropriate incentives to act in the best interests of the fund.
Resources Dedicated to Investment Management and Support Services. The Board and the Fund Oversight and Research Committees reviewed the general qualifications and capabilities of the Investment Advisers' investment staff, including its size, education, experience, and resources, as well as the Investment Advisers' approach to recruiting, training, managing, and compensating investment personnel. The Board noted that FMR has continued to increase the resources devoted to non-U.S. offices, including expansion of Fidelity's global investment organization. The Board also noted that Fidelity's analysts have extensive resources, tools and capabilities that allow them to conduct sophisticated quantitative and fundamental analysis, as well as credit analysis of issuers, counterparties and guarantors. Further, the Board believes that Fidelity's investment professionals have sufficient access to global information and data so as to provide competitive investment results over time, and that those professionals also have access to sophisticated tools that permit them to assess portfolio construction and risk and performance attribution characteristics continuously, as well as to transmit new information and research conclusions rapidly around the world. Additionally, in its deliberations, the Board considered the Investment Advisers' trading and risk management capabilities and resources, which are an integral part of the investment management process.
Shareholder and Administrative Services. The Board considered (i) the nature, extent, quality, and cost of advisory, administrative, and shareholder services performed by the Investment Advisers and their affiliates under the Advisory Contracts and under separate agreements covering transfer agency, pricing and bookkeeping, and securities lending services for the fund; (ii) the nature and extent of the supervision of third party service providers, principally custodians and subcustodians; and (iii) the resources devoted to, and the record of compliance with, the fund's compliance policies and procedures. The Board also reviewed the allocation of fund brokerage, including allocations to brokers affiliated with the Investment Advisers, the use of brokerage commissions to pay fund expenses, and the use of "soft" commission dollars to pay for research services.
Annual Report
Board Approval of Investment Advisory Contracts and
Management Fees - continued
The Board noted that the growth of fund assets over time across the complex allows Fidelity to reinvest in the development of services designed to enhance the value or convenience of the Fidelity funds as investment vehicles. These services include 24-hour access to account information and market information through telephone representatives and over the Internet, investor education materials and asset allocation tools, and the expanded availability of Fidelity Investor Centers.
Investment in a Large Fund Family. The Board considered the benefits to shareholders of investing in a Fidelity fund, including the benefits of investing in a fund that is part of a large family of funds offering a variety of investment disciplines and providing a large variety of mutual fund investor services. The Board noted that Fidelity had taken, or had made recommendations that resulted in the Fidelity funds taking, a number of actions over the previous year that benefited particular funds, including (i) continuing to dedicate additional resources to investment research and to the support of the senior management team that oversees asset management; (ii) persisting in efforts to enhance Fidelity's global research capabilities; (iii) launching new funds and making other enhancements to meet client needs for global and income-oriented solutions; (iv) continuing to launch dedicated lower cost underlying funds to meet portfolio construction needs related to expanding underlying fund options for Fidelity funds of funds, specifically for the Freedom Fund product lines; (v) rationalizing product lines and gaining increased efficiencies through the mergers of several funds into other funds; (vi) strengthening Fidelity's index fund offerings by reducing investment minimums and adopting or lowering existing expense caps for certain funds and classes; (vii) enhancing Global Asset Allocation product offerings by launching new funds and strategies, including "open architecture" target date funds that utilize affiliated and unaffiliated sub-advisers; (viii) modifying the eligibility criteria for Institutional Class shares of Advisor funds to increase their marketability to a portion of the defined contribution plan market; (ix) creating a new low-cost retirement share class for certain Advisor funds to appeal to large retirement plans; (x) transitioning the management of certain Fidelity commodity funds to Geode Capital Management LLC, a registered commodity pool operator, while retaining administrative responsibilities for the funds; (xi) reorganizing a number of funds; and (xii) taking steps toward establishing a new Fidelity adviser to manage sector-based funds and products.
Investment Performance. The Board considered whether the fund has operated in accordance with its investment objective, as well as its record of compliance with its investment restrictions and its performance history.
The Board took into account discussions with the Investment Advisers about fund investment performance that occur at Board meetings throughout the year. In this regard the Board noted that as part of regularly scheduled fund reviews and other reports to the Board on fund performance, the Board periodically considers annualized return information for the fund, for different time periods, measured against a securities market index ("benchmark index") and a peer group of mutual funds with similar objectives ("peer group"). In its evaluation of fund investment performance, the Board gave particular attention to information indicating changes in performance of certain Fidelity funds for specific time periods and the Investment Advisers' explanations for any overperformance or underperformance.
Annual Report
In addition to reviewing absolute and relative fund performance, the Independent Trustees periodically consider the appropriateness of fund performance metrics in evaluating the results achieved. In general, the Independent Trustees believe that fund performance should be evaluated based on net performance (after fees and expenses) of both the highest performing and lowest performing classes, where applicable, compared to appropriate benchmark indices, over appropriate time periods which may include full market cycles, and compared to peer groups, as applicable, over the same periods, taking into account relevant factors including the following: general market conditions; issuer-specific information; tactical opportunities for investment; and fund cash flows and other factors.
The Independent Trustees recognize that shareholders evaluate performance on a net basis over their own holding periods, for which one-, three-, and five-year periods are used as a proxy. For this reason, the performance information reviewed by the Board also included net cumulative calendar year total return information for the fund and an appropriate benchmark index and peer group for the most recent one-, three-, and five-year periods, as shown below. Returns are shown compared to the 25th percentile (top of box) and 75th percentile (bottom of box) of the peer universe.
Fidelity Blue Chip Growth Fund

Annual Report
Board Approval of Investment Advisory Contracts and
Management Fees - continued
The Board also considered that the fund's management fee is subject to upward or downward adjustment depending upon whether, and to what extent, the fund's investment performance for the performance period exceeds, or is exceeded by, a securities index, thus leading to a performance adjustment for the same period. The Board noted that the performance adjustment provides FMR with a strong economic incentive to seek to achieve superior performance for the fund's shareholders and helps to more closely align the interests of FMR and the fund's shareholders.
Based on its review, the Board concluded that the nature, extent, and quality of services provided to the fund under the Advisory Contracts should benefit the fund's shareholders.
Competitiveness of Management Fee and Total Expense Ratio. The Board considered the fund's management fee and total expense ratio compared to "mapped groups" of competitive funds and classes. Fidelity creates "mapped groups" by combining similar Lipper investment objective categories that have comparable management fee characteristics. Combining Lipper investment objective categories aids the Board's management fee and total expense ratio comparisons by broadening the competitive group used for comparison and by reducing the number of universes to which various Fidelity funds are compared.
Management Fee. The Board considered two proprietary management fee comparisons for the 12-month periods shown in the chart below. The group of Lipper funds used by the Board for management fee comparisons is referred to below as the "Total Mapped Group." The Total Mapped Group comparison focuses on a fund's standing in terms of gross management fees before expense reimbursements or caps, and without giving effect to the fund's performance adjustment, relative to the total universe of funds with comparable investment mandates, regardless of whether their management fee structures also are comparable. Funds with comparable investment mandates offer exposure to similar types of securities. Funds with comparable management fee structures have similar management fee contractual arrangements (e.g., flat rate charged for advisory services, all-inclusive fee rate, etc.). "TMG %" represents the percentage of funds in the Total Mapped Group that had management fees that were lower than the fund's. For example, a TMG % of 11% means that 89% of the funds in the Total Mapped Group had higher management fees than the fund. The "Asset-Size Peer Group" (ASPG) comparison focuses on a fund's standing relative to a subset of non-Fidelity funds within the Total Mapped Group that are similar in size and management fee structure. The ASPG represents at least 15% of the funds in the Total Mapped Group with comparable asset size and management fee structures, subject to a minimum of 50 funds (or all funds in the Total Mapped Group if fewer than 50). Additional information, such as the ASPG quartile in which the fund's management fee ranked and the impact of the fund's performance adjustment, is also included in the chart and considered by the Board.
Annual Report
Fidelity Blue Chip Growth Fund

The Board noted that the fund's management fee ranked below the median of its Total Mapped Group and below the median of its ASPG for 2012. The Board also noted the effect of the fund's positive performance adjustment on the fund's management fee ranking.
Furthermore, the Board considered that shareholders approved a prospective change in the index used to calculate the fund's performance adjustment beginning June 1, 2006. The Board also considered that, because the performance adjustment is based on a rolling 36-month measurement period, during a transition period the fund's performance is compared to a blended index return that reflects the performance of the former index for the portion of the measurement period prior to June 1, 2006 and the performance of the current index for the remainder of the measurement period. The Board noted that the fund's performance adjustments for 2008 and 2009 shown in the chart above reflect the effect of using the blended index return to calculate the fund's performance adjustment.
Based on its review, the Board concluded that the fund's management fee is fair and reasonable in light of the services that the fund receives and the other factors considered.
Total Expense Ratio. In its review of each class's total expense ratio, the Board considered the fund's management fee as well as other fund or class expenses, as applicable, such as transfer agent fees, pricing and bookkeeping fees, and custodial, legal, and audit fees. The Board also noted the effects of any waivers and reimbursements on fees and expenses, as well as the impact of the fund's performance adjustment. As part of its review, the Board also considered the current and historical total expense ratios of each class of the fund compared to competitive fund median expenses. Each class of the fund is compared to those funds and classes in the Total Mapped Group (used by the Board for management fee comparisons) that have a similar sales load structure.
Annual Report
Board Approval of Investment Advisory Contracts and
Management Fees - continued
The Board noted that the total expense ratio of each class ranked below its competitive median for 2012.
Fees Charged to Other Fidelity Clients. The Board also considered Fidelity fee structures and other information with respect to clients of FMR and its affiliates, such as other mutual funds advised or subadvised by FMR or its affiliates, pension plan clients, and other institutional clients. The Board noted the findings of the 2013 ad hoc joint committee (created with the board of other Fidelity funds), which reviewed and compared Fidelity's institutional investment advisory business with its business of providing services to the Fidelity funds, including the differences in services provided, fees charged, and costs incurred, as well as competition in their respective marketplaces.
Based on its review of total expense ratios and fees charged to other Fidelity clients, the Board concluded that the total expense ratio of each class of the fund was reasonable in light of the services that the fund and its shareholders receive and the other factors considered.
Costs of the Services and Profitability. The Board considered the revenues earned and the expenses incurred by Fidelity in conducting the business of developing, marketing, distributing, managing, administering and servicing the fund and servicing the fund's shareholders. The Board also considered the level of Fidelity's profits in respect of all the Fidelity funds.
On an annual basis, FMR presents to the Board Fidelity's profitability for the fund. Fidelity calculates the profitability for each fund, as well as aggregate profitability for groups of Fidelity funds and all Fidelity funds, using a series of detailed revenue and cost allocation methodologies which originate with the books and records of Fidelity on which Fidelity's audited financial statements are based. The Audit Committee of the Board reviews any significant changes from the prior year's methodologies.
PricewaterhouseCoopers LLP (PwC), independent registered public accounting firm and auditor to Fidelity and certain Fidelity funds, has been engaged annually by the Board as part of the Board's assessment of Fidelity's profitability analysis. PwC's engagement includes the review and assessment of the methodologies used by Fidelity in determining the revenues and expenses attributable to Fidelity's mutual fund business, and completion of agreed-upon procedures surrounding the mathematical accuracy of fund profitability and its conformity to allocation methodologies. After considering PwC's reports issued under the engagement and information provided by Fidelity, the Board concluded that while other allocation methods may also be reasonable, Fidelity's profitability methodologies are reasonable in all material respects.
Annual Report
The Board also reviewed Fidelity's non-fund businesses and fall-out benefits related to the mutual fund business as well as cases where Fidelity's affiliates may benefit from or be related to the fund's business.
The Board considered the costs of the services provided by and the profits realized by Fidelity in connection with the operation of the fund and was satisfied that the profitability was not excessive in the circumstances.
Economies of Scale. The Board considered whether there have been economies of scale in respect of the management of the Fidelity funds, whether the Fidelity funds (including the fund) have appropriately benefited from any such economies of scale, and whether there is potential for realization of any further economies of scale. The Board considered the extent to which the fund will benefit from economies of scale through increased services to the fund, through waivers or reimbursements, or through fee or expense reductions. The Board also noted that in 2009, it and the board of other Fidelity funds created an ad hoc committee (the Economies of Scale Committee) to analyze whether FMR attains economies of scale in respect of the management and servicing of the Fidelity funds, whether the Fidelity funds have appropriately benefited from such economies of scale, and whether there is potential for realization of any further economies of scale.
The Board recognized that the fund's management contract incorporates a "group fee" structure, which provides for lower group fee rates as total fund assets under FMR's management increase, and for higher group fee rates as total fund assets under FMR's management decrease. FMR calculates the group fee rates based on a tiered asset "breakpoint" schedule that varies based on asset class. The Board considered that the group fee is designed to deliver the benefits of economies of scale to fund shareholders when total Fidelity fund assets increase, even if assets of any particular fund are unchanged or have declined, because some portion of Fidelity's costs are attributable to services provided to all Fidelity funds, and all funds benefit if those costs can be allocated among more assets. The Board concluded that, given the group fee structure, fund shareholders will benefit from lower management fees as assets under FMR's management increase at the fund complex level, regardless of whether Fidelity achieves any such economies of scale.
The Board concluded, taking into account the analysis of the Economies of Scale Committee, that economies of scale, if any, are being appropriately shared between fund shareholders and Fidelity.
Amendment to Description of Group Fee Rate. At its July 2013 meeting, the Board voted to approve an amendment to the fund's management contract to modify the description of the "group fee rate" effective August 1, 2013. The Board noted that under the prior description in the contract, the group fee rate was based on the average net assets of all registered investment companies with which FMR has management contracts. Under the contract's tiered asset breakpoint schedule, the group fee rate is lower as total fund assets under FMR's management increase, and higher as total fund assets under FMR's management decrease. The Board considered that the prior description would have excluded the assets of 64 Fidelity sector funds from the group fee rate calculation once Fidelity SelectCo, LLC, an affiliate of FMR, assumed management responsibilities for those funds. The Board noted that modifying the description of the group fee rate to continue to include the assets of those 64 funds for purposes of determining group fee rate breakpoints would avoid an immediate adverse impact on the group fee rate for any fund.
Annual Report
Board Approval of Investment Advisory Contracts and
Management Fees - continued
Additional Information Requested by the Board. In order to develop fully the factual basis for consideration of the Fidelity funds' Advisory Contracts, the Board requested and received additional information on certain topics, including: (i) fund performance trends and Fidelity's long-term strategies for certain funds; (ii) the potential to further rationalize the Fidelity fund lineup with the possibility of achieving savings for the funds and Fidelity; (iii) the methodology with respect to competitive fund data and peer group classifications; (iv) the arrangements with, and performance of, certain sub-advisers on behalf of the Fidelity funds, as well as certain proposed participating affiliate arrangements; (v) the realization of fall-out benefits in certain Fidelity business units; (vi) Fidelity's group fee structures, including the rationale for the individual fee rates of certain categories of funds and the definition of group assets; (vii) trends regarding industry use of performance fee structures and the performance adjustment methodologies applicable to the Fidelity funds; (viii) additional competitive analysis regarding the total expenses for certain classes; and (ix) fund profitability methodology, including Fidelity's cost allocation methodology, and the impact of certain factors on fund profitability results.
Based on its evaluation of all of the conclusions noted above, and after considering all factors it believed relevant, the Board ultimately concluded that the advisory fee structures are fair and reasonable, and that the fund's Advisory Contracts should be renewed.
Annual Report
Investment Adviser
Fidelity Management & Research Company
Boston, MA
Investment Sub-Advisers
FMR Co., Inc.
Fidelity Management & Research
(U.K.) Inc.
Fidelity Management & Research
(Hong Kong) Limited
Fidelity Management & Research
(Japan) Inc.
General Distributor
Fidelity Distributors Corporation
Smithfield, RI
Transfer and Service Agents
Fidelity Investments Institutional
Operations Company, Inc.
Boston, MA
Fidelity Service Company, Inc.
Boston, MA
Custodian
Citibank, N.A.
New York, NY
(Fidelity Investment logo)(registered trademark)
Corporate Headquarters
245 Summer St., Boston, MA 02210
www.fidelity.com
BCF-K-UANN-0913
1.863112.104
Fidelity®
Blue Chip Value
Fund
Annual Report
July 31, 2013
(Fidelity Cover Art)
Contents
Performance | (Click Here) | How the fund has done over time. |
Management's Discussion of Fund Performance | (Click Here) | The Portfolio Manager's review of fund performance and strategy. |
Shareholder Expense Example | (Click Here) | An example of shareholder expenses. |
Investment Changes | (Click Here) | A summary of major shifts in the fund's investments over the past 6 months. |
Investments | (Click Here) | A complete list of the fund's investments with their market values. |
Financial Statements | (Click Here) | Statements of assets and liabilities, operations, and changes in net assets, as well as financial highlights. |
Notes | (Click Here) | Notes to the financial statements. |
Report of Independent Registered Public Accounting Firm | (Click Here) | |
Trustees and Officers | (Click Here) | |
Distributions | (Click Here) | |
Board Approval of Investment Advisory Contracts and Management Fees | (Click Here) | |
To view a fund's proxy voting guidelines and proxy voting record for the 12-month period ended June 30, visit http://www.fidelity.com/proxyvotingresults or visit the Securities and Exchange Commission's (SEC) web site at http://www.sec.gov. You may also call 1-800-544-8544 to request a free copy of the proxy voting guidelines.
Standard & Poor's, S&P and S&P 500 are registered service marks of The McGraw-Hill Companies, Inc. and have been licensed for use by Fidelity Distributors Corporation.
Other third-party marks appearing herein are the property of their respective owners.
All other marks appearing herein are registered or unregistered trademarks or service marks of FMR LLC or an affiliated company. © 2013 FMR LLC. All rights reserved.
Annual Report
This report and the financial statements contained herein are submitted for the general information of the shareholders of the fund. This report is not authorized for distribution to prospective investors in the fund unless preceded or accompanied by an effective prospectus.
A fund files its complete schedule of portfolio holdings with the SEC for the first and third quarters of each fiscal year on Form N-Q. Forms N-Q are available on the SEC's web site at http://www.sec.gov. A fund's Forms N-Q may be reviewed and copied at the SEC's Public Reference Room in Washington, DC. Information regarding the operation of the SEC's Public Reference Room may be obtained by calling 1-800-SEC-0330. For a complete list of a fund's portfolio holdings, view the most recent holdings listing, semiannual report, or annual report on Fidelity's web site at http://www.fidelity.com, http://www.advisor.fidelity.com, or http://www.401k.com, as applicable.
NOT FDIC INSURED • MAY LOSE VALUE • NO BANK GUARANTEE
Neither the fund nor Fidelity Distributors Corporation is a bank.
Annual Report
Average annual total return reflects the change in the value of an investment, assuming reinvestment of the fund's distributions from dividend income and capital gains (the profits earned upon the sale of securities that have grown in value, if any) and assuming a constant rate of performance each year. The $10,000 table and the fund's returns do not reflect the deduction of taxes that a shareholder would pay on fund distributions or the redemption of fund shares. During periods of reimbursement by Fidelity, a fund's total return will be greater than it would be had the reimbursement not occurred. How a fund did yesterday is no guarantee of how it will do tomorrow.
Average Annual Total Returns
Periods ended July 31, 2013 | Past 1
year | Past 5
years | Past 10
years |
Fidelity® Blue Chip Value Fund | 33.33% | 3.70% | 5.69% |
$10,000 Over 10 Years
Let's say hypothetically that $10,000 was invested in Fidelity® Blue Chip Value Fund on July 31, 2003. The chart shows how the value of your investment would have changed, and also shows how the Russell 1000® Value Index performed over the same period.
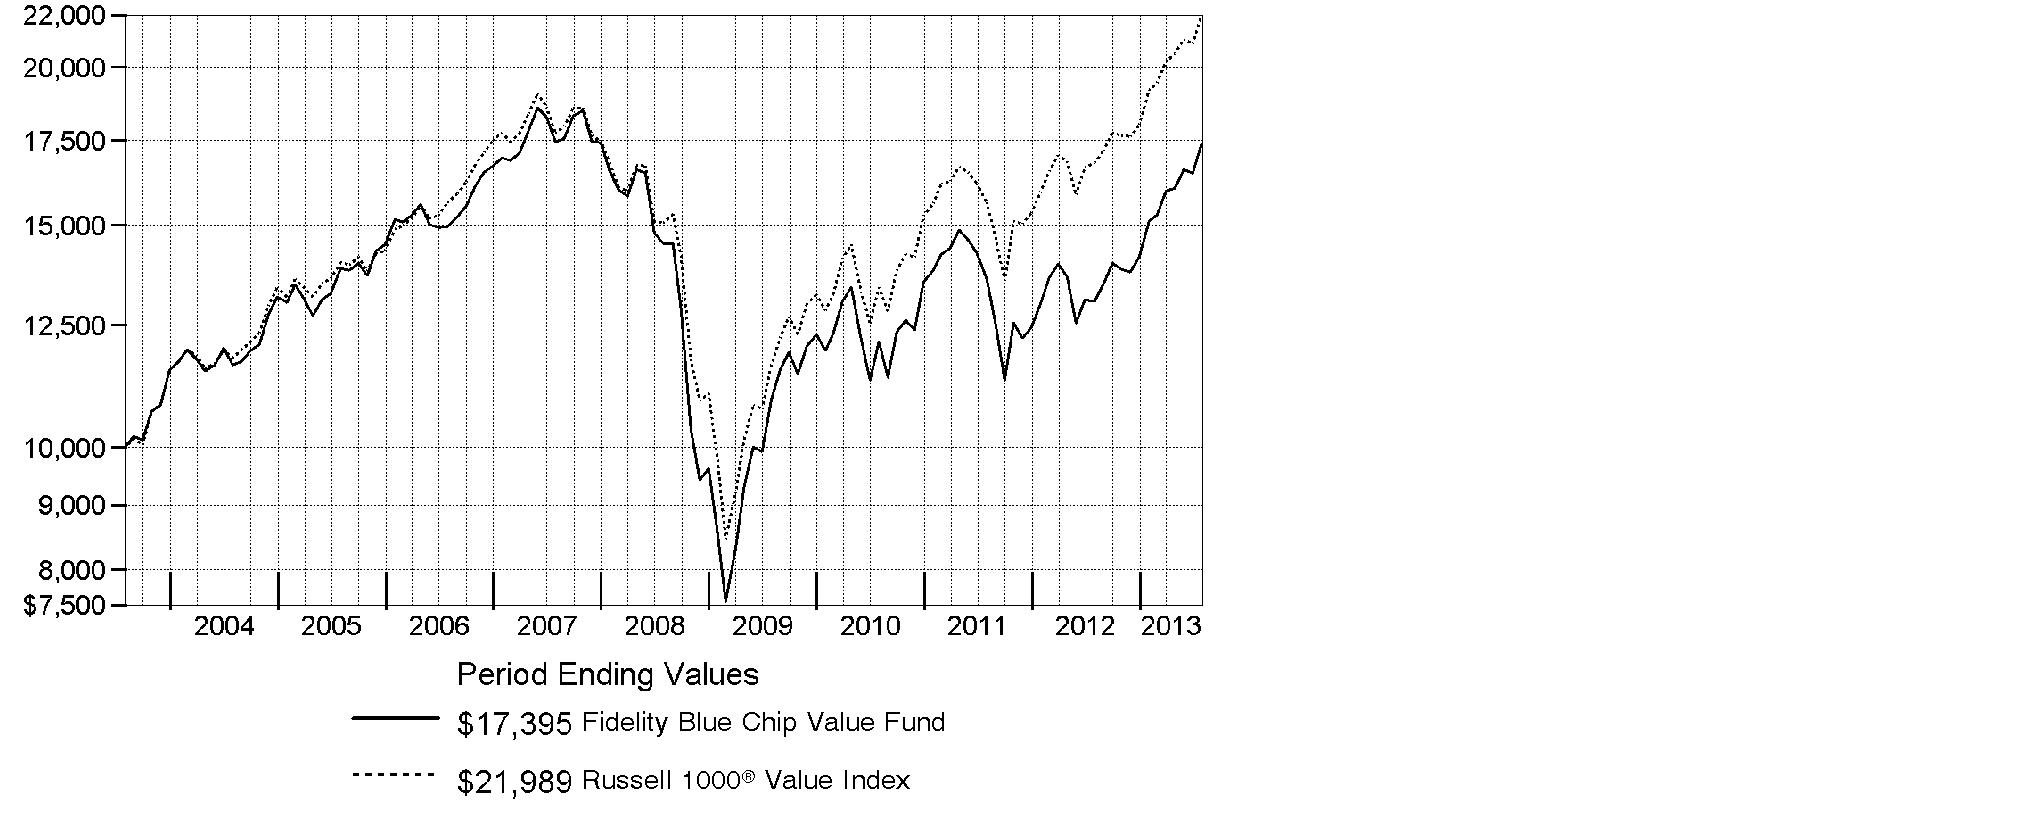
Annual Report
Market Recap: The bull run in U.S. stocks comfortably settled into a fifth year, as major equity benchmarks ripped through records during the 12 months ending July 31, 2013. Gains were fueled by a generally improving global economy and accommodative monetary policies worldwide. The tone was positive for most of the year, based largely on stronger U.S. economic data, including employment, housing and consumer sentiment. Setting a series of new highs along the way, the broad-based S&P 500® Index rose an impressive 25.00% for the 12 months, while the blue-chip-laden Dow Jones Industrial AverageSM also moved into record territory en route to a 22.36% gain. The growth-oriented Nasdaq Composite Index® had a similarly strong run, advancing 25.15%. During the year, markets were resilient amid intermittent volatility over debt woes in Europe, the 2012 U.S. presidential election and year-end Congressional gridlock over the federal budget. In mid-to-late June, concern arose about the U.S. Federal Reserve possibly tapering its sustaining bond-buying strategy - which prompted a brief, but steep, market sell-off. However, investors' continued quest for yield and the Fed's pledge to keep buying bonds until the economy showed significant improvement overpowered the uncertainty and helped equities climb notably higher in July to close the period on a strong note.
Comments from Michael Chren, Portfolio Manager of Fidelity® Blue Chip Value Fund: For the year, the fund gained 33.33%, easily outpacing the benchmark Russell 1000® Value Index, which rose 30.73%. My management strategy reflects my belief that stocks with the optimal combination of an attractive valuation and improving business dynamics offer the best probability for future relative outperformance. Good positioning in the information technology and telecommunication services sectors was very helpful for the fund's results. But, by far, stock picking in financials was the most beneficial, with mortgage insurer Radian Group, online brokerage firm E*TRADE Financial and diversified financial services provider Citigroup making outsized contributions. In the case of Radian - the fund's biggest relative contributor during the period and an out-of-benchmark holding - I believed the company's low share price failed to reflect various catalysts for future outperformance, which ultimately came to pass. During the period, Radian's shares dramatically rose, and I sold the last of the fund's stake in May. In contrast, stock selection in consumer discretionary and health care were negatives, while gold producer Newmont Mining was the biggest individual detractor. Another source of difficulty was the fund's higher-than-usual cash position, which hurt results in an up market.
The views expressed above reflect those of the portfolio manager(s) only through the end of the period as stated on the cover of this report and do not necessarily represent the views of Fidelity or any other person in the Fidelity organization. Any such views are subject to change at any time based upon market or other conditions and Fidelity disclaims any responsibility to update such views. These views may not be relied on as investment advice and, because investment decisions for a Fidelity fund are based on numerous factors, may not be relied on as an indication of trading intent on behalf of any Fidelity fund.
Annual Report
Shareholder Expense Example
As a shareholder of the Fund, you incur two types of costs: (1) transaction costs, and (2) ongoing costs, including management fees and other Fund expenses. This Example is intended to help you understand your ongoing costs (in dollars) of investing in the Fund and to compare these costs with the ongoing costs of investing in other mutual funds.
The Example is based on an investment of $1,000 invested at the beginning of the period and held for the entire period (February 1, 2013 to July 31, 2013).
Actual Expenses
The first line of the accompanying table provides information about actual account values and actual expenses. You may use the information in this line, together with the amount you invested, to estimate the expenses that you paid over the period. Simply divide your account value by $1,000.00 (for example, an $8,600 account value divided by $1,000.00 = 8.6), then multiply the result by the number in the first line under the heading entitled "Expenses Paid During Period" to estimate the expenses you paid on your account during this period. A small balance maintenance fee of $12.00 that is charged once a year may apply for certain accounts with a value of less than $2,000. This fee is not included in the table below. If it was, the estimate of expenses you paid during the period would be higher, and your ending account value lower, by this amount. In addition, the Fund, as a shareholder in the underlying Fidelity Central Funds, will indirectly bear its pro-rata share of the fees and expenses incurred by the underlying Fidelity Central Funds. These fees and expenses are not included in the Fund's annualized expense ratio used to calculate the expense estimate in the table below.
Hypothetical Example for Comparison Purposes
The second line of the accompanying table provides information about hypothetical account values and hypothetical expenses based on the Fund's actual expense ratio and an assumed rate of return of 5% per year before expenses, which is not the Fund's actual return. The hypothetical account values and expenses may not be used to estimate the actual ending account balance or expenses you paid for the period. You may use this information to compare the ongoing costs of investing in the Fund and other funds. To do so, compare this 5% hypothetical example with the 5% hypothetical examples that appear in the shareholder reports of the other funds. A small balance maintenance fee of $12.00 that is charged once a year may apply for certain accounts with a value of less than $2,000. This fee is not included in the table below. If it was, the estimate of expenses you paid during the period would be higher, and your ending account value lower, by this amount. In addition, the Fund, as a shareholder in the underlying Fidelity Central Funds, will indirectly bear its pro-rata share of the fees and expenses incurred by the underlying Fidelity Central Funds. These fees and expenses are not included in the Fund's annualized expense ratio used to calculate the expense estimate in the table below.
Please note that the expenses shown in the table are meant to highlight your ongoing costs only and do not reflect any transaction costs. Therefore, the second line of the table is useful in comparing ongoing costs only, and will not help you determine the relative total costs of owning different funds.
Annual Report
Shareholder Expense Example - continued
| Annualized
Expense RatioB | Beginning
Account Value
February 1, 2013 | Ending
Account Value
July 31, 2013 | Expenses Paid
During Period*
February 1, 2013
to July 31, 2013 |
Actual | .64% | $ 1,000.00 | $ 1,151.30 | $ 3.41 |
HypotheticalA | | $ 1,000.00 | $ 1,021.62 | $ 3.21 |
A 5% return per year before expenses
B Annualized expense ratio reflects expenses net of applicable fee waivers.
* Expenses are equal to the Fund's annualized expense ratio, multiplied by the average account value over the period, multiplied by 181/365 (to reflect the one-half year period).
Annual Report
Investment Changes (Unaudited)
Top Ten Stocks as of July 31, 2013 |
| % of fund's
net assets | % of fund's net assets
6 months ago |
General Electric Co. | 4.1 | 4.4 |
Exxon Mobil Corp. | 4.1 | 2.8 |
Pfizer, Inc. | 3.7 | 4.3 |
Merck & Co., Inc. | 3.6 | 4.3 |
Citigroup, Inc. | 3.1 | 3.5 |
Chevron Corp. | 3.0 | 3.0 |
Occidental Petroleum Corp. | 2.8 | 1.7 |
JPMorgan Chase & Co. | 2.5 | 1.9 |
Symantec Corp. | 2.4 | 0.5 |
Zoetis, Inc. Class A | 2.3 | 0.0 |
| 31.6 | |
Top Five Market Sectors as of July 31, 2013 |
| % of fund's
net assets | % of fund's net assets
6 months ago |
Financials | 25.8 | 26.4 |
Energy | 15.8 | 14.3 |
Information Technology | 13.3 | 10.7 |
Health Care | 11.2 | 11.9 |
Consumer Staples | 7.2 | 7.5 |
Asset Allocation (% of fund's net assets) |
As of July 31, 2013 * | As of January 31, 2013 ** |
 | Stocks 93.5% | | | Stocks 95.6% | |
 | Short-Term
Investments and
Net Other Assets (Liabilities) 6.5% | | | Short-Term
Investments and
Net Other Assets (Liabilities) 4.4% | |
* Foreign investments | 0.9% | | ** Foreign investments | 6.9% | |

Annual Report
Investments July 31, 2013
Showing Percentage of Net Assets
Common Stocks - 93.5% |
| Shares | | Value |
CONSUMER DISCRETIONARY - 6.8% |
Auto Components - 0.8% |
Johnson Controls, Inc. | 55,697 | | $ 2,239,576 |
Automobiles - 1.0% |
Ford Motor Co. | 157,329 | | 2,655,714 |
Diversified Consumer Services - 2.2% |
Apollo Group, Inc. Class A (non-vtg.) (a) | 254,673 | | 4,640,142 |
DeVry, Inc. | 53,622 | | 1,612,950 |
| | 6,253,092 |
Media - 2.3% |
DISH Network Corp. Class A | 64,466 | | 2,878,407 |
Washington Post Co. Class B | 6,775 | | 3,640,614 |
| | 6,519,021 |
Multiline Retail - 0.5% |
J.C. Penney Co., Inc. (a)(d) | 94,721 | | 1,382,927 |
TOTAL CONSUMER DISCRETIONARY | | 19,050,330 |
CONSUMER STAPLES - 7.2% |
Beverages - 0.2% |
PepsiCo, Inc. | 8,736 | | 729,805 |
Food & Staples Retailing - 2.7% |
CVS Caremark Corp. | 52,613 | | 3,235,173 |
Wal-Mart Stores, Inc. | 56,343 | | 4,391,373 |
| | 7,626,546 |
Food Products - 2.8% |
Kraft Foods Group, Inc. | 68,094 | | 3,852,759 |
Mondelez International, Inc. | 126,306 | | 3,949,589 |
| | 7,802,348 |
Household Products - 1.5% |
Procter & Gamble Co. | 53,304 | | 4,280,311 |
TOTAL CONSUMER STAPLES | | 20,439,010 |
ENERGY - 15.8% |
Energy Equipment & Services - 2.3% |
Cameron International Corp. (a) | 40,126 | | 2,379,472 |
Halliburton Co. | 88,036 | | 3,978,347 |
| | 6,357,819 |
Oil, Gas & Consumable Fuels - 13.5% |
Anadarko Petroleum Corp. | 61,551 | | 5,448,495 |
Common Stocks - continued |
| Shares | | Value |
ENERGY - continued |
Oil, Gas & Consumable Fuels - continued |
Apache Corp. | 61,210 | | $ 4,912,103 |
Chevron Corp. | 65,912 | | 8,297,662 |
Exxon Mobil Corp. | 122,955 | | 11,527,031 |
Occidental Petroleum Corp. | 89,522 | | 7,971,934 |
| | 38,157,225 |
TOTAL ENERGY | | 44,515,044 |
FINANCIALS - 25.8% |
Capital Markets - 5.2% |
Bank of New York Mellon Corp. | 64,000 | | 2,012,800 |
Carlyle Group LP | 50,100 | | 1,402,299 |
E*TRADE Financial Corp. (a) | 302,445 | | 4,506,431 |
Goldman Sachs Group, Inc. | 9,887 | | 1,621,765 |
Raymond James Financial, Inc. | 39,781 | | 1,753,149 |
State Street Corp. | 46,304 | | 3,226,000 |
| | 14,522,444 |
Commercial Banks - 7.2% |
Fifth Third Bancorp | 227,900 | | 4,382,517 |
KeyCorp | 486,335 | | 5,977,057 |
U.S. Bancorp | 68,197 | | 2,545,112 |
Wells Fargo & Co. | 129,798 | | 5,646,213 |
Zions Bancorporation | 54,487 | | 1,614,995 |
| | 20,165,894 |
Consumer Finance - 1.8% |
Capital One Financial Corp. | 73,633 | | 5,082,150 |
Diversified Financial Services - 7.1% |
Bank of America Corp. | 296,735 | | 4,332,331 |
Citigroup, Inc. | 170,037 | | 8,865,729 |
JPMorgan Chase & Co. | 124,916 | | 6,961,569 |
| | 20,159,629 |
Insurance - 4.5% |
Allstate Corp. | 37,000 | | 1,886,260 |
American International Group, Inc. | 44,875 | | 2,042,261 |
Assurant, Inc. | 28,279 | | 1,531,591 |
Fidelity National Financial, Inc. Class A | 52,088 | | 1,275,114 |
MetLife, Inc. | 12,319 | | 596,486 |
Reinsurance Group of America, Inc. | 13,376 | | 910,772 |
Common Stocks - continued |
| Shares | | Value |
FINANCIALS - continued |
Insurance - continued |
The Chubb Corp. | 23,916 | | $ 2,068,734 |
XL Group PLC Class A | 77,281 | | 2,422,759 |
| | 12,733,977 |
TOTAL FINANCIALS | | 72,664,094 |
HEALTH CARE - 11.2% |
Health Care Providers & Services - 1.6% |
HCA Holdings, Inc. | 80,171 | | 3,126,669 |
WellPoint, Inc. | 16,423 | | 1,405,152 |
| | 4,531,821 |
Pharmaceuticals - 9.6% |
Merck & Co., Inc. | 207,932 | | 10,016,084 |
Pfizer, Inc. | 354,675 | | 10,367,150 |
Zoetis, Inc. Class A | 220,212 | | 6,564,520 |
| | 26,947,754 |
TOTAL HEALTH CARE | | 31,479,575 |
INDUSTRIALS - 6.7% |
Aerospace & Defense - 2.0% |
Textron, Inc. | 208,399 | | 5,705,965 |
Construction & Engineering - 0.6% |
Jacobs Engineering Group, Inc. (a) | 27,660 | | 1,637,472 |
Industrial Conglomerates - 4.1% |
General Electric Co. | 473,050 | | 11,528,225 |
TOTAL INDUSTRIALS | | 18,871,662 |
INFORMATION TECHNOLOGY - 13.3% |
Communications Equipment - 1.7% |
Cisco Systems, Inc. | 185,555 | | 4,740,930 |
Computers & Peripherals - 0.5% |
Hewlett-Packard Co. | 60,467 | | 1,552,793 |
Internet Software & Services - 2.0% |
Yahoo!, Inc. (a) | 197,073 | | 5,535,781 |
IT Services - 0.2% |
Global Payments, Inc. | 14,300 | | 662,233 |
Office Electronics - 1.8% |
Xerox Corp. | 526,044 | | 5,102,627 |
Common Stocks - continued |
| Shares | | Value |
INFORMATION TECHNOLOGY - continued |
Semiconductors & Semiconductor Equipment - 0.8% |
Broadcom Corp. Class A | 35,600 | | $ 981,492 |
Intel Corp. | 31,015 | | 722,650 |
Micron Technology, Inc. (a) | 31,710 | | 420,158 |
| | 2,124,300 |
Software - 6.3% |
Activision Blizzard, Inc. | 239,046 | | 4,298,047 |
Comverse, Inc. | 96,232 | | 3,013,986 |
Symantec Corp. | 249,205 | | 6,648,789 |
Verint Systems, Inc. (a) | 102,749 | | 3,676,359 |
| | 17,637,181 |
TOTAL INFORMATION TECHNOLOGY | | 37,355,845 |
MATERIALS - 4.1% |
Chemicals - 0.9% |
The Dow Chemical Co. | 74,325 | | 2,604,348 |
Containers & Packaging - 0.7% |
Crown Holdings, Inc. (a) | 46,512 | | 2,038,621 |
Metals & Mining - 2.0% |
Freeport-McMoRan Copper & Gold, Inc. | 35,645 | | 1,008,041 |
Newmont Mining Corp. | 156,075 | | 4,682,250 |
| | 5,690,291 |
Paper & Forest Products - 0.5% |
International Paper Co. | 26,740 | | 1,291,809 |
TOTAL MATERIALS | | 11,625,069 |
TELECOMMUNICATION SERVICES - 1.3% |
Diversified Telecommunication Services - 0.3% |
tw telecom, Inc. (a) | 33,960 | | 1,011,329 |
Wireless Telecommunication Services - 1.0% |
Sprint Corp. (a) | 48,268 | | 287,677 |
T-Mobile US, Inc. (a) | 104,083 | | 2,509,441 |
| | 2,797,118 |
TOTAL TELECOMMUNICATION SERVICES | | 3,808,447 |
Common Stocks - continued |
| Shares | | Value |
UTILITIES - 1.3% |
Multi-Utilities - 1.3% |
CenterPoint Energy, Inc. | 48,200 | | $ 1,196,324 |
Sempra Energy | 28,237 | | 2,474,408 |
| | 3,670,732 |
TOTAL COMMON STOCKS (Cost $242,170,000) |
263,479,808
|
U.S. Treasury Obligations - 0.1% |
| Principal Amount | | |
U.S. Treasury Bills, yield at date of purchase 0.03% to 0.03% 8/15/13 to 8/29/13
(Cost $279,996) | | $ 280,000 | |
279,999
|
Money Market Funds - 6.5% |
| Shares | | |
Fidelity Cash Central Fund, 0.11% (b) | 17,134,586 | | 17,134,586 |
Fidelity Securities Lending Cash Central Fund, 0.12% (b)(c) | 1,273,000 | | 1,273,000 |
TOTAL MONEY MARKET FUNDS (Cost $18,407,586) |
18,407,586
|
TOTAL INVESTMENT PORTFOLIO - 100.1% (Cost $260,857,582) | | 282,167,393 |
NET OTHER ASSETS (LIABILITIES) - (0.1)% | | (307,108) |
NET ASSETS - 100% | $ 281,860,285 |
Legend |
(a) Non-income producing |
(b) Affiliated fund that is generally available only to investment companies and other accounts managed by Fidelity Investments. The rate quoted is the annualized seven-day yield of the fund at period end. A complete unaudited listing of the fund's holdings as of its most recent quarter end is available upon request. In addition, each Fidelity Central Fund's financial statements, which are not covered by the Fund's Report of Independent Registered Public Accounting Firm, are available on the SEC's website or upon request. |
(c) Investment made with cash collateral received from securities on loan. |
(d) Security or a portion of the security is on loan at period end. |
Affiliated Central Funds |
Information regarding fiscal year to date income earned by the Fund from investments in Fidelity Central Funds is as follows: |
Fund | Income earned |
Fidelity Cash Central Fund | $ 17,076 |
Fidelity Securities Lending Cash Central Fund | 125,156 |
Total | $ 142,232 |
Other Information |
The following is a summary of the inputs used, as of July 31, 2013, involving the Fund's assets and liabilities carried at fair value. The inputs or methodology used for valuing securities may not be an indication of the risk associated with investing in those securities. For more information on valuation inputs, and their aggregation into the levels used in the table below, please refer to the Investment Valuation section in the accompanying Notes to Financial Statements. |
Valuation Inputs at Reporting Date: |
Description | Total | Level 1 | Level 2 | Level 3 |
Investments in Securities: | | | | |
Equities: | | | | |
Consumer Discretionary | $ 19,050,330 | $ 19,050,330 | $ - | $ - |
Consumer Staples | 20,439,010 | 20,439,010 | - | - |
Energy | 44,515,044 | 44,515,044 | - | - |
Financials | 72,664,094 | 72,664,094 | - | - |
Health Care | 31,479,575 | 31,479,575 | - | - |
Industrials | 18,871,662 | 18,871,662 | - | - |
Information Technology | 37,355,845 | 37,355,845 | - | - |
Materials | 11,625,069 | 11,625,069 | - | - |
Telecommunication Services | 3,808,447 | 3,808,447 | - | - |
Utilities | 3,670,732 | 3,670,732 | - | - |
U.S. Government and Government Agency Obligations | 279,999 | - | 279,999 | - |
Money Market Funds | 18,407,586 | 18,407,586 | - | - |
Total Investments in Securities: | $ 282,167,393 | $ 281,887,394 | $ 279,999 | $ - |
See accompanying notes which are an integral part of the financial statements.
Annual Report
Statement of Assets and Liabilities
| July 31, 2013 |
| | |
Assets | | |
Investment in securities, at value (including securities loaned of $1,109,600) - See accompanying schedule: Unaffiliated issuers (cost $242,449,996) | $ 263,759,807 | |
Fidelity Central Funds (cost $18,407,586) | 18,407,586 | |
Total Investments (cost $260,857,582) | | $ 282,167,393 |
Receivable for investments sold | | 2,951,875 |
Receivable for fund shares sold | | 244,032 |
Dividends receivable | | 184,865 |
Distributions receivable from Fidelity Central Funds | | 1,099 |
Other receivables | | 5,637 |
Total assets | | 285,554,901 |
| | |
Liabilities | | |
Payable for investments purchased | $ 1,790,000 | |
Payable for fund shares redeemed | 442,960 | |
Accrued management fee | 72,308 | |
Other affiliated payables | 66,062 | |
Other payables and accrued expenses | 50,286 | |
Collateral on securities loaned, at value | 1,273,000 | |
Total liabilities | | 3,694,616 |
| | |
Net Assets | | $ 281,860,285 |
Net Assets consist of: | | |
Paid in capital | | $ 405,180,772 |
Undistributed net investment income | | 459,935 |
Accumulated undistributed net realized gain (loss) on investments and foreign currency transactions | | (145,090,231) |
Net unrealized appreciation (depreciation) on investments and assets and liabilities in foreign currencies | | 21,309,809 |
Net Assets, for 21,156,007 shares outstanding | | $ 281,860,285 |
Net Asset Value, offering price and redemption price per share ($281,860,285 ÷ 21,156,007 shares) | | $ 13.32 |
See accompanying notes which are an integral part of the financial statements.
Annual Report
Financial Statements - continued
Statement of Operations
| Year ended July 31, 2013 |
| | |
Investment Income | | |
Dividends | | $ 5,500,156 |
Interest | | 98 |
Income from Fidelity Central Funds | | 142,232 |
Total income | | 5,642,486 |
| | |
Expenses | | |
Management fee
Basic fee | $ 1,426,867 | |
Performance adjustment | (681,216) | |
Transfer agent fees | 694,793 | |
Accounting and security lending fees | 101,628 | |
Custodian fees and expenses | 26,704 | |
Independent trustees' compensation | 1,598 | |
Registration fees | 22,903 | |
Audit | 55,614 | |
Legal | 1,177 | |
Miscellaneous | 2,084 | |
Total expenses before reductions | 1,652,152 | |
Expense reductions | (61,961) | 1,590,191 |
Net investment income (loss) | | 4,052,295 |
Realized and Unrealized Gain (Loss) Net realized gain (loss) on: | | |
Investment securities: | | |
Unaffiliated issuers | 24,643,923 | |
Foreign currency transactions | (11,534) | |
Futures contracts | 56,067 | |
Total net realized gain (loss) | | 24,688,456 |
Change in net unrealized appreciation (depreciation) on investment securities | | 44,945,456 |
Net gain (loss) | | 69,633,912 |
Net increase (decrease) in net assets resulting from operations | | $ 73,686,207 |
See accompanying notes which are an integral part of the financial statements.
Annual Report
Statement of Changes in Net Assets
| Year ended
July 31,
2013 | Year ended
July 31,
2012 |
Increase (Decrease) in Net Assets | | |
Operations | | |
Net investment income (loss) | $ 4,052,295 | $ 5,880,195 |
Net realized gain (loss) | 24,688,456 | (30,053,867) |
Change in net unrealized appreciation (depreciation) | 44,945,456 | 4,531,869 |
Net increase (decrease) in net assets resulting
from operations | 73,686,207 | (19,641,803) |
Distributions to shareholders from net investment income | (6,479,162) | (6,210,896) |
Share transactions
Proceeds from sales of shares | 49,942,277 | 50,616,788 |
Reinvestment of distributions | 6,279,261 | 6,061,422 |
Cost of shares redeemed | (79,700,390) | (225,740,112) |
Net increase (decrease) in net assets resulting from share transactions | (23,478,852) | (169,061,902) |
Total increase (decrease) in net assets | 43,728,193 | (194,914,601) |
| | |
Net Assets | | |
Beginning of period | 238,132,092 | 433,046,693 |
End of period (including undistributed net investment income of $459,935 and undistributed net investment income of $2,888,150, respectively) | $ 281,860,285 | $ 238,132,092 |
Other Information Shares | | |
Sold | 4,200,000 | 5,083,409 |
Issued in reinvestment of distributions | 585,069 | 639,450 |
Redeemed | (6,830,380) | (22,414,922) |
Net increase (decrease) | (2,045,311) | (16,692,063) |
See accompanying notes which are an integral part of the financial statements.
Annual Report
Financial Highlights
Years ended July 31, | 2013 | 2012 | 2011 | 2010 | 2009 |
Selected Per-Share Data | | | | | |
Net asset value, beginning of period | $ 10.26 | $ 10.86 | $ 9.82 | $ 8.95 | $ 12.15 |
Income from Investment Operations | | | | | |
Net investment income (loss) B | .18 | .18 | .14 | .10 | .16 |
Net realized and unrealized gain (loss) | 3.17 | (.62) | 1.04 | .90 | (3.17) |
Total from investment operations | 3.35 | (.44) | 1.18 | 1.00 | (3.01) |
Distributions from net investment income | (.29) | (.16) | (.14) | (.13) | (.18) |
Distributions from net realized gain | - | - | (.01) | - | (.01) |
Total distributions | (.29) | (.16) | (.14) F | (.13) | (.19) |
Net asset value, end of period | $ 13.32 | $ 10.26 | $ 10.86 | $ 9.82 | $ 8.95 |
Total Return A | 33.33% | (3.95)% | 12.14% | 11.20% | (24.89)% |
Ratios to Average Net Assets C, E | | | | | |
Expenses before reductions | .64% | .77% | .75% | .87% | .77% |
Expenses net of fee waivers, if any | .64% | .77% | .75% | .87% | .77% |
Expenses net of all reductions | .62% | .76% | .74% | .86% | .77% |
Net investment income (loss) | 1.58% | 1.76% | 1.31% | 1.05% | 1.87% |
Supplemental Data | | | | | |
Net assets, end of period (000 omitted) | $ 281,860 | $ 238,132 | $ 433,047 | $ 324,913 | $ 332,765 |
Portfolio turnover rate D | 88% | 102% | 141% | 59% | 69% |
A Total returns would have been lower if certain expenses had not been reduced during the applicable periods shown.
B Calculated based on average shares outstanding during the period.
C Fees and expenses of any underlying Fidelity Central Funds are not included in the Fund's expense ratio. The Fund indirectly bears its proportionate share of the expenses of any underlying Fidelity Central Funds.
D Amount does not include the portfolio activity of any underlying Fidelity Central Funds.
E Expense ratios reflect operating expenses of the Fund. Expenses before reductions do not reflect amounts reimbursed by the investment adviser or reductions from brokerage service arrangements or reductions from other expense offset arrangements and do not represent the amount paid by the Fund during periods when reimbursements or reductions occur. Expenses net of fee waivers reflect expenses after reimbursement by the investment adviser but prior to reductions from brokerage service arrangements or other expense offset arrangements. Expenses net of all reductions represent the net expenses paid by the Fund.
F Total distributions of $.14 per share is comprised of distributions from net investment income of $.135 and distributions from net realized gain of $.005 per share.
See accompanying notes which are an integral part of the financial statements.
Annual Report
Notes to Financial Statements
For the period ended July 31, 2013
1. Organization.
Fidelity Blue Chip Value Fund (the Fund) is a fund of Fidelity Securities Fund (the Trust) and is authorized to issue an unlimited number of shares. The Trust is registered under the Investment Company Act of 1940, as amended (the 1940 Act), as an open-end management investment company organized as a Massachusetts business trust.
2. Investments in Fidelity Central Funds.
The Fund invests in Fidelity Central Funds, which are open-end investment companies generally available only to other investment companies and accounts managed by Fidelity Management & Research Company (FMR) and its affiliates. The Fund's Schedule of Investments lists each of the Fidelity Central Funds held as of period end, if any, as an investment of the Fund, but does not include the underlying holdings of each Fidelity Central Fund. As an Investing Fund, the Fund indirectly bears its proportionate share of the expenses of the underlying Fidelity Central Funds.
The Money Market Central Funds seek preservation of capital and current income and are managed by Fidelity Investments Money Management, Inc. (FIMM), an affiliate of FMR.
A complete unaudited list of holdings for each Fidelity Central Fund is available upon request or at the Securities and Exchange Commission (the SEC) website at www.sec.gov. In addition, the financial statements of the Fidelity Central Funds, which are not covered by the Fund's Report of Independent Registered Public Accounting Firm, are available on the SEC website or upon request.
3. Significant Accounting Policies.
The financial statements have been prepared in conformity with accounting principles generally accepted in the United States of America (GAAP), which require management to make certain estimates and assumptions at the date of the financial statements. Actual results could differ from those estimates. Subsequent events, if any, through the date that the financial statements were issued have been evaluated in the preparation of the financial statements. The following summarizes the significant accounting policies of the Fund:
Investment Valuation. Investments are valued as of 4:00 p.m. Eastern time on the last calendar day of the period. In accordance with valuation policies and procedures approved by the Board of Trustees (the Board), the Fund attempts to obtain prices from one or more third party pricing vendors or brokers to value its investments. When current market prices, quotations or currency exchange rates are not readily available or reliable, investments will be fair valued in good faith by the FMR Fair Value Committee (the Committee), in accordance with procedures adopted by the Board. Factors used in
Annual Report
3. Significant Accounting Policies - continued
Investment Valuation - continued
determining fair value vary by investment type and may include market or investment specific events, changes in interest rates and credit quality. The frequency with which these procedures are used cannot be predicted and they may be utilized to a significant extent. The Committee oversees the Fund's valuation policies and procedures and is responsible for approving and reporting to the Board all fair value determinations.
The Fund categorizes the inputs to valuation techniques used to value its investments into a disclosure hierarchy consisting of three levels as shown below:
Level 1 - quoted prices in active markets for identical investments
Level 2 - other significant observable inputs (including quoted prices for similar investments, interest rates, prepayment speeds, etc.)
Level 3 - unobservable inputs (including the Fund's own assumptions based on the best information available)
Valuation techniques used to value the Fund's investments by major category are as follows:
Equity securities, including restricted securities, for which market quotations are readily available, are valued at the last reported sale price or official closing price as reported by a third party pricing vendor on the primary market or exchange on which they are traded and are categorized as Level 1 in the hierarchy. In the event there were no sales during the day or closing prices are not available, securities are valued at the last quoted bid price or may be valued using the last available price and are generally categorized as Level 2 in the hierarchy. For foreign equity securities, when market or security specific events arise, comparisons to the valuation of American Depositary Receipts (ADRs), futures contracts, Exchange-Traded Funds (ETFs) and certain indexes as well as quoted prices for similar securities may be used and would be categorized as Level 2 in the hierarchy. Utilizing these techniques may result in transfers between Level 1 and Level 2.
Debt securities, including restricted securities, are valued based on evaluated prices received from third party pricing vendors or from brokers who make markets in such securities. For U.S. government and government agency obligations, pricing vendors utilize matrix pricing which considers yield or price of bonds of comparable quality, coupon, maturity and type as well as broker-supplied prices. When independent prices are unavailable or unreliable, debt securities may be valued utilizing pricing methodologies which consider similar factors that would be used by third party pricing vendors. Debt securities are generally categorized as Level 2 in the hierarchy but may be Level 3 depending on the circumstances.
Annual Report
Notes to Financial Statements - continued
3. Significant Accounting Policies - continued
Investment Valuation - continued
Investments in open-end mutual funds, including the Fidelity Central Funds, are valued at their closing net asset value (NAV) each business day and are categorized as Level 1 in the hierarchy.
Changes in valuation techniques may result in transfers in or out of an assigned level within the disclosure hierarchy. The aggregate value of investments by input level, as of July 31, 2013 is included at the end of the Fund's Schedule of Investments.
Foreign Currency. The Fund may use foreign currency contracts to facilitate transactions in foreign-denominated securities. Gains and losses from these transactions may arise from changes in the value of the foreign currency or if the counterparties do not perform under the contracts' terms.
Foreign-denominated assets, including investment securities, and liabilities are translated into U.S. dollars at the exchange rates at period end. Purchases and sales of investment securities, income and dividends received and expenses denominated in foreign currencies are translated into U.S. dollars at the exchange rate in effect on the transaction date.
The effects of exchange rate fluctuations on investments are included with the net realized and unrealized gain (loss) on investment securities. Other foreign currency transactions resulting in realized and unrealized gain (loss) are disclosed separately.
Investment Transactions and Income. For financial reporting purposes, the Fund's investment holdings and NAV include trades executed through the end of the last business day of the period. The NAV per share for processing shareholder transactions is calculated as of the close of business of the New York Stock Exchange (NYSE), normally 4:00 p.m. Eastern time and includes trades executed through the end of the prior business day. Gains and losses on securities sold are determined on the basis of identified cost and may include proceeds received from litigation. Dividend income is recorded on the ex-dividend date, except for certain dividends from foreign securities where the ex-dividend date may have passed, which are recorded as soon as the Fund is informed of the ex-dividend date. Non-cash dividends included in dividend income, if any, are recorded at the fair market value of the securities received. Distributions received on securities that represent a return of capital or capital gain are recorded as a reduction of cost of investments and/or as a realized gain. Subsequent to ex-dividend date the Fund determines the components of these distributions, based upon receipt of tax filings or other correspondence relating to the underlying investment. Interest income and distributions from the Fidelity Central Funds are accrued as earned. Interest income includes coupon interest and amortization of premium and accretion of discount on debt
Annual Report
3. Significant Accounting Policies - continued
Investment Transactions and Income - continued
securities. Investment income is recorded net of foreign taxes withheld where recovery of such taxes is uncertain.
Expenses. Expenses directly attributable to a fund are charged to that fund. Expenses attributable to more than one fund are allocated among the respective funds on the basis of relative net assets or other appropriate methods. Expense estimates are accrued in the period to which they relate and adjustments are made when actual amounts are known.
Income Tax Information and Distributions to Shareholders. Each year, the Fund intends to qualify as a regulated investment company under Subchapter M of the Internal Revenue Code, including distributing substantially all of its taxable income and realized gains. As a result, no provision for income taxes is required. As of July 31, 2013, the Fund did not have any unrecognized tax benefits in the financial statements; nor is the Fund aware of any tax positions for which it is reasonably possible that the total amounts of unrecognized tax benefits will significantly change in the next twelve months. The Fund files a U.S. federal tax return, in addition to state and local tax returns as required. A fund's federal income tax returns are subject to examination by the Internal Revenue Service (IRS) for a period of three fiscal years after they are filed. State and local tax returns may be subject to examination for an additional fiscal year depending on the jurisdiction. Foreign taxes are provided for based on the Fund's understanding of the tax rules and rates that exist in the foreign markets in which it invests.
Distributions are declared and recorded on the ex-dividend date. Income and capital gain distributions are determined in accordance with income tax regulations, which may differ from GAAP.
Capital accounts within the financial statements are adjusted for permanent book-tax differences. These adjustments have no impact on net assets or the results of operations. Temporary book-tax differences will reverse in a subsequent period.
Book-tax differences are primarily due to futures contracts, foreign currency transactions, partnerships, capital loss carryforwards and losses deferred due to wash sales and excise tax regulations.
The federal tax cost of investment securities and unrealized appreciation (depreciation) as of period end were as follows:
Gross unrealized appreciation | $ 34,566,031 |
Gross unrealized depreciation | (19,412,853) |
Net unrealized appreciation (depreciation) on securities and other investments | $ 15,153,178 |
Tax Cost | $ 267,014,215 |
Annual Report
Notes to Financial Statements - continued
3. Significant Accounting Policies - continued
Income Tax Information and Distributions to Shareholders - continued
The tax-based components of distributable earnings as of period end were as follows:
Undistributed ordinary income | $ 459,934 |
Capital loss carryforward | $ (138,933,598) |
Net unrealized appreciation (depreciation) | $ 15,153,176 |
Capital loss carryforwards are only available to offset future capital gains of the Fund to the extent provided by regulations and may be limited. Under the Regulated Investment Company Modernization Act of 2010 (the Act), the Fund is permitted to carry forward capital losses incurred in taxable years beginning after December 22, 2010 for an unlimited period and such capital losses are required to be used prior to any losses that expire. The capital loss carryforward information presented below, including any applicable limitation, is estimated as of fiscal period end and is subject to adjustment.
Fiscal year of expiration | |
2017 | $ (76,906,749) |
2018 | (55,500,128) |
Total with expiration | (132,406,877) |
No expiration | |
Short-term | (3,744,441) |
Long-term | (2,782,280) |
Total no expiration | (6,526,721) |
Total capital loss carryforward | $ (138,933,598) |
The tax character of distributions paid was as follows:
| July 31, 2013 | July 31, 2012 |
Ordinary Income | $ 6,479,162 | $ 6,210,896 |
New Accounting Pronouncement. The Financial Accounting Standards Board issued in December 2011, Accounting Standard Update No. 2011-11, Disclosures about Offsetting Assets and Liabilities, and in January 2013, Accounting Standards Update No. 2013-1 Clarifying the Scope of Disclosures about Offsetting Assets and Liabilities. These updates create new disclosure requirements requiring entities to disclose both gross and net information for derivatives and other financial instruments that are either offset in the Statement of Assets and Liabilities or subject to an enforceable master netting arrangement or similar agreement. The disclosure requirements are effective for annual reporting periods beginning on or after January 1, 2013, and interim periods within those annual periods. Management expects that the impact of the update's adoption will be limited to additional financial statement disclosures as applicable.
Annual Report
4. Derivative Instruments.
Risk Exposures and the Use of Derivative Instruments. The Fund's investment objective allows the Fund to enter into various types of derivative contracts, including futures contracts. Derivatives are investments whose value is primarily derived from underlying assets, indices or reference rates and may be transacted on an exchange or over-the-counter (OTC). Derivatives may involve a future commitment to buy or sell a specified asset based on specified terms, to exchange future cash flows at periodic intervals based on a notional principal amount, or for one party to make one or more payments upon the occurrence of specified events in exchange for periodic payments from the other party.
The Fund used derivatives to increase returns and to manage exposure to certain risks as defined below. The success of any strategy involving derivatives depends on analysis of numerous economic factors, and if the strategies for investment do not work as intended, the Fund may not achieve its objectives.
The Fund's use of derivatives increased or decreased its exposure to the following risk:
Equity Risk | Equity risk relates to the fluctuations in the value of financial instruments as a result of changes in market prices (other than those arising from interest rate risk or foreign exchange risk), whether caused by factors specific to an individual investment, its issuer, or all factors affecting all instruments traded in a market or market segment. |
The Fund is also exposed to additional risks from investing in derivatives, such as liquidity risk and counterparty credit risk. Liquidity risk is the risk that the Fund will be unable to close out the derivative in the open market in a timely manner. Counterparty credit risk is the risk that the counterparty will not be able to fulfill its obligation to the Fund. Counterparty credit risk related to exchange-traded futures contracts may be mitigated by the protection provided by the exchange on which they trade.
Investing in derivatives may involve greater risks than investing in the underlying assets directly and, to varying degrees, may involve risk of loss in excess of any initial investment and collateral received and amounts recognized in the Statement of Assets and Liabilities. In addition, there may be the risk that the change in value of the derivative contract does not correspond to the change in value of the underlying instrument.
Annual Report
Notes to Financial Statements - continued
4. Derivative Instruments - continued
Futures Contracts. A futures contract is an agreement between two parties to buy or sell a specified underlying instrument for a fixed price at a specified future date. The Fund used futures contracts to manage its exposure to the stock market.
Upon entering into a futures contract, a fund is required to deposit either cash or securities (initial margin) with a clearing broker in an amount equal to a certain percentage of the face value of the contract. Futures contracts are marked-to-market daily and subsequent daily payments (variation margin) are made or received by a fund depending on the daily fluctuations in the value of the futures contracts and are recorded as unrealized appreciation or (depreciation). This receivable and/or payable, if any, is included in daily variation margin for derivative instruments in the Statement of Assets and Liabilities. Realized gain or (loss) is recorded upon the expiration or closing of a futures contract.
Any open futures contracts at period end are presented in the Schedule of Investments under the caption "Futures Contracts." The underlying face amount at value reflects each contract's exposure to the underlying instrument or index at period end.
During the period the Fund recognized net realized gain (loss) of $56,067 related to its investment in futures contracts. This amount is included in the Statement of Operations.
5. Purchases and Sales of Investments.
Purchases and sales of securities, other than short-term securities, aggregated $216,157,878 and $249,665,003, respectively.
6. Fees and Other Transactions with Affiliates.
Management Fee. FMR and its affiliates provide the Fund with investment management related services for which the Fund pays a monthly management fee. The management fee is the sum of an individual fund fee rate that is based on an annual rate of .30% of the Fund's average net assets and an annualized group fee rate that averaged .26% during the period. The group fee rate is based upon the average net assets of all the mutual funds advised by FMR. The group fee rate decreases as assets under management increase and increases as assets under management decrease. In addition, the management fee is subject to a performance adjustment (up to a maximum of ± .20% of the Fund's average net assets over a 36 month performance period). The upward or downward adjustment to the management fee is based on the Fund's relative investment performance as compared to an appropriate benchmark index. For the period, the total annual management fee rate, including the performance adjustment, was .29% of the Fund's average net assets.
Transfer Agent Fees. Fidelity Investments Institutional Operations Company, Inc. (FIIOC), an affiliate of FMR, is the Fund's transfer, dividend disbursing and shareholder
Annual Report
6. Fees and Other Transactions with Affiliates - continued
Transfer Agent Fees - continued
servicing agent. FIIOC receives account fees and asset-based fees that vary according to account size and type of account. FIIOC pays for typesetting, printing and mailing of shareholder reports, except proxy statements. For the period, the transfer agent fees were equivalent to an annual rate of .27% of average net assets.
Accounting and Security Lending Fees. Fidelity Service Company, Inc. (FSC), an affiliate of FMR, maintains the Fund's accounting records. The accounting fee is based on the level of average net assets for each month. Under a separate contract, FSC administers the security lending program. The security lending fee is based on the number and duration of lending transactions.
Brokerage Commissions. The Fund placed a portion of its portfolio transactions with brokerage firms which are affiliates of the investment adviser. Brokerage commissions are included in net realized gain (loss) and change in net unrealized appreciation (depreciation) in the Statement of Operations. The commissions paid to these affiliated firms were $16,425 for the period.
7. Committed Line of Credit.
The Fund participates with other funds managed by FMR or an affiliate in a $4.25 billion credit facility (the "line of credit") to be utilized for temporary or emergency purposes to fund shareholder redemptions or for other short-term liquidity purposes. The Fund has agreed to pay commitment fees on its pro-rata portion of the line of credit, which amounted to $597 and is reflected in Miscellaneous expenses on the Statement of Operations. During the period, there were no borrowings on this line of credit.
8. Security Lending.
The Fund lends portfolio securities through a lending agent from time to time in order to earn additional income. For equity securities, a lending agent is used and may loan securities to certain qualified borrowers, including Fidelity Capital Markets (FCM), a broker-dealer affiliated with the Fund. On the settlement date of the loan, the Fund receives collateral (in the form of U.S. Treasury obligations, letters of credit and/or cash) against the loaned securities and maintains collateral in an amount not less than 100% of the market value of the loaned securities during the period of the loan. The market value of the loaned securities is determined at the close of business of the Fund and any additional required collateral is delivered to the Fund on the next business day. If the borrower defaults on its obligation to return the securities loaned because of insolvency or other reasons, the Fund may apply collateral received from the borrower against the obligation. The Fund may experience delays and costs in recovering the securities
Annual Report
Notes to Financial Statements - continued
8. Security Lending - continued
loaned. Any cash collateral received is invested in the Fidelity Securities Lending Cash Central Fund. The value of loaned securities and cash collateral at period end are disclosed on the Fund's Statement of Assets and Liabilities. Security lending income represents the income earned on investing cash collateral, less rebates paid to borrowers and any lending agent fees associated with the loan, plus any premium payments received for lending certain types of securities. Security lending income is presented in the Statement of Operations as a component of income from Fidelity Central Funds. Total security lending income during the period amounted to $125,156, including $20,194 from securities loaned to FCM.
9. Expense Reductions.
Many of the brokers with whom FMR places trades on behalf of the Fund provided services to the Fund in addition to trade execution. These services included payments of certain expenses on behalf of the Fund totaling $60,728 for the period. In addition, through arrangements with the Fund's custodian, credits realized as a result of uninvested cash balances were used to reduce the Fund's expenses. During the period, these credits reduced the Fund's custody expenses by $6, respectively.
In addition, FMR reimbursed a portion of the Fund's operating expenses during the period in the amount of $1,227.
10. Other.
The Fund's organizational documents provide former and current trustees and officers with a limited indemnification against liabilities arising in connection with the performance of their duties to the Fund. In the normal course of business, the Fund may also enter into contracts that provide general indemnifications. The Fund's maximum exposure under these arrangements is unknown as this would be dependent on future claims that may be made against the Fund. The risk of material loss from such claims is considered remote.
Annual Report
To the Trustees of Fidelity Securities Fund and the Shareholders of Fidelity Blue Chip Value Fund:
In our opinion, the accompanying statement of assets and liabilities, including the schedule of investments, and the related statements of operations and of changes in net assets and the financial highlights present fairly, in all material respects, the financial position of Fidelity Blue Chip Value Fund (a fund of Fidelity Securities Fund) at July 31, 2013, the results of its operations for the year then ended, the changes in its net assets for each of the two years in the period then ended and the financial highlights for each of the five years in the period then ended, in conformity with accounting principles generally accepted in the United States of America. These financial statements and financial highlights (hereafter referred to as "financial statements") are the responsibility of the Fidelity Blue Chip Value Fund's management. Our responsibility is to express an opinion on these financial statements based on our audits. We conducted our audits of these financial statements in accordance with the standards of the Public Company Accounting Oversight Board (United States). Those standards require that we plan and perform the audit to obtain reasonable assurance about whether the financial statements are free of material misstatement. An audit includes examining, on a test basis, evidence supporting the amounts and disclosures in the financial statements, assessing the accounting principles used and significant estimates made by management, and evaluating the overall financial statement presentation. We believe that our audits, which included confirmation of securities at July 31, 2013 by correspondence with the custodian and brokers, provide a reasonable basis for our opinion.
PricewaterhouseCoopers LLP
Boston, Massachusetts
September 17, 2013
Annual Report
The Trustees, Member of the Advisory Board, and executive officers of the trust and funds, as applicable, are listed below. The Board of Trustees governs each fund and is responsible for protecting the interests of shareholders. The Trustees are experienced executives who meet periodically throughout the year to oversee each fund's activities, review contractual arrangements with companies that provide services to each fund, oversee management of the risks associated with such activities and contractual arrangements, and review each fund's performance. Except for James C. Curvey, Ned C. Lautenbach, Ronald P. O'Hanley, and William S. Stavropoulos, each of the Trustees oversees 166 Fidelity funds. Mr. Curvey oversees 387 Fidelity funds. Mr. Lautenbach, Mr. O'Hanley, and Mr. Stavropoulos each oversees 230 Fidelity funds.
The Trustees hold office without limit in time except that (a) any Trustee may resign; (b) any Trustee may be removed by written instrument, signed by at least two-thirds of the number of Trustees prior to such removal; (c) any Trustee who requests to be retired or who has become incapacitated by illness or injury may be retired by written instrument signed by a majority of the other Trustees; and (d) any Trustee may be removed at any special meeting of shareholders by a two-thirds vote of the outstanding voting securities of the trust. Each Trustee who is not an interested person of the trust and the funds (as defined in the 1940 Act) (Independent Trustee), shall retire not later than the last day of the calendar year in which his or her 75th birthday occurs. The Independent Trustees may waive this mandatory retirement age policy with respect to individual Trustees. The executive officers and Advisory Board Member hold office without limit in time, except that any officer and Advisory Board Member may resign or may be removed by a vote of a majority of the Trustees at any regular meeting or any special meeting of the Trustees. Except as indicated, each individual has held the office shown or other offices in the same company for the past five years.
Experience, Skills, Attributes, and Qualifications of the Funds' Trustees. The Governance and Nominating Committee has adopted a statement of policy that describes the experience, qualifications, attributes, and skills that are necessary and desirable for potential Independent Trustee candidates (Statement of Policy). The Board believes that each Trustee satisfied at the time he or she was initially elected or appointed a Trustee, and continues to satisfy, the standards contemplated by the Statement of Policy. The Governance and Nominating Committee also engages professional search firms to help identify potential Independent Trustee candidates who have the experience, qualifications, attributes, and skills consistent with the Statement of Policy. From time to time, additional criteria based on the composition and skills of the current Independent Trustees, as well as experience or skills that may be appropriate in light of future changes to board composition, business conditions, and regulatory or other developments, have also been considered by the professional search firms and the Governance and Nominating Committee. In addition, the Board takes into account the Trustees' commitment and participation in Board and committee meetings, as well as their leadership of standing and ad hoc committees throughout their tenure.
Annual Report
Trustees and Officers - continued
In determining that a particular Trustee was and continues to be qualified to serve as a Trustee, the Board has considered a variety of criteria, none of which, in isolation, was controlling. The Board believes that, collectively, the Trustees have balanced and diverse experience, qualifications, attributes, and skills, which allow the Board to operate effectively in governing each fund and protecting the interests of shareholders. Information about the specific experience, skills, attributes, and qualifications of each Trustee, which in each case led to the Board's conclusion that the Trustee should serve (or continue to serve) as a trustee of the funds, is provided below.
Board Structure and Oversight Function. James C. Curvey is an interested person (as defined in the 1940 Act) and currently serves as Chairman. The Trustees have determined that an interested Chairman is appropriate and benefits shareholders because an interested Chairman has a personal and professional stake in the quality and continuity of services provided to the funds. Independent Trustees exercise their informed business judgment to appoint an individual of their choosing to serve as Chairman, regardless of whether the Trustee happens to be independent or a member of management. The Independent Trustees have determined that they can act independently and effectively without having an Independent Trustee serve as Chairman and that a key structural component for assuring that they are in a position to do so is for the Independent Trustees to constitute a substantial majority for the Board. The Independent Trustees also regularly meet in executive session. Ned C. Lautenbach serves as Chairman of the Independent Trustees and as such (i) acts as a liaison between the Independent Trustees and management with respect to matters important to the Independent Trustees and (ii) with management prepares agendas for Board meetings.
Fidelity funds are overseen by different Boards of Trustees. The funds' Board oversees Fidelity's equity and high income funds and another Board oversees Fidelity's investment-grade bond, money market, and asset allocation funds. The asset allocation funds may invest in Fidelity funds overseen by the funds' Board. The use of separate Boards, each with its own committee structure, allows the Trustees of each group of Fidelity funds to focus on the unique issues of the funds they oversee, including common research, investment, and operational issues. On occasion, the separate Boards establish joint committees to address issues of overlapping consequences for the Fidelity funds overseen by each Board.
The Trustees operate using a system of committees to facilitate the timely and efficient consideration of all matters of importance to the Trustees, each fund, and fund shareholders and to facilitate compliance with legal and regulatory requirements and oversight of the funds' activities and associated risks. The Board, acting through its committees, has charged FMR and its affiliates with (i) identifying events or circumstances the occurrence of which could have demonstrably adverse effects on the funds' business and/or reputation; (ii) implementing processes and controls to lessen the possibility that such events or circumstances occur or to mitigate the effects of such events or circumstances if they do occur; and (iii) creating and maintaining a system designed to evaluate continuously business and market conditions in order to facilitate the identification and implementation processes described in (i) and (ii) above. Because the day-to-day operations and activities of the funds are carried out by or through FMR, its affiliates and other service providers, the funds' exposure to risks is mitigated but not eliminated by the processes overseen by the Trustees. While each of the Board's committees has responsibility for overseeing different aspects of the funds' activities, oversight is exercised primarily through the Operations, Audit, and Compliance Committees. In addition, the Independent Trustees have worked with FMR to enhance the Board's oversight of investment and financial risks, legal and regulatory risks, technology risks, and operational risks, including the development of additional risk reporting to the Board. For example, a working group comprised of Independent Trustees and FMR has worked and continues to work to review the Fidelity funds' valuation-related activities, reporting and risk management. Appropriate personnel, including but not limited to the funds' Chief Compliance Officer (CCO), FMR's internal auditor, the independent accountants, the funds' Treasurer and portfolio management personnel, make periodic reports to the Board's committees, as appropriate, including an annual review of FMR's risk management program for the Fidelity funds. The responsibilities of each standing committee, including their oversight responsibilities, are described further under "Standing Committees of the Funds' Trustees."
Annual Report
The fund's Statement of Additional Information (SAI) includes more information about the Trustees. To request a free copy, call Fidelity at 1-800-544-8544.
Interested Trustees*:
Correspondence intended for each Trustee who is an interested person may be sent to Fidelity Investments, 245 Summer Street, Boston, Massachusetts 02210.
Name, Year of Birth; Principal Occupations and Other Relevant Experience+ |
James C. Curvey (1935) |
| Year of Election or Appointment: 2007 Mr. Curvey is Trustee and Chairman of the Board of Trustees of certain Trusts. Mr. Curvey also serves as Trustee (2007-present) of other investment companies advised by FMR. Mr. Curvey is a Director of Fidelity Investments Money Management, Inc. (2009-present), Director of Fidelity Research & Analysis Co. (2009-present) and Director of FMR and FMR Co., Inc. (2007-present). Mr. Curvey is also Vice Chairman (2007-present) and Director of FMR LLC. In addition, Mr. Curvey serves as an Overseer for the Boston Symphony Orchestra and a member of the Trustees of Villanova University. Previously, Mr. Curvey was the Vice Chairman (2006-2007) and Director (2000-2007) of FMR Corp. |
Ronald P. O'Hanley (1957) |
| Year of Election or Appointment: 2011 Mr. O'Hanley serves as a Trustee and Chairman of the Board of Trustees of other Fidelity funds (2013-present), and is Director of FMR Co., Inc. (2010-present), Director of Fidelity Investments Money Management, Inc. (2010-present), Director of Fidelity Research & Analysis Company (2010-present), President of Fidelity Asset Management and Corporate Services and a Member of Fidelity's Executive Committee (2010-present). Previously, Mr. O'Hanley served as President and Chief Executive Officer of BNY Mellon Asset Management (2007-2010). Mr. O'Hanley also served as Vice Chairman of Bank New York Mellon Corp. and a member of that firm's Executive Committee. Prior to the 2007 merger of The Bank of New York and Mellon Financial Corporation, he was Vice Chairman of Mellon Financial Corporation and President and Chief Executive Officer of Mellon Asset Management. He joined Mellon in February 1997. Mr. O'Hanley currently serves as Chairman of the Boston Public Library Foundation Board of Directors and sits on the Board of Directors of Beth Israel Deaconess Medical Center, the Board of Trustees of the Marine Biological Laboratory and the Advisory Board of the Maxwell School of Citizenship and Public Administration at Syracuse University. Mr. O'Hanley also chairs the Council on Asset Management for the Financial Services Roundtable and is a member of the Board of Directors of Institutional Investor's U.S. Institute. |
* Trustees have been determined to be "Interested Trustees" by virtue of, among other things, their affiliation with the trust or various entities under common control with FMR.
+ The information above includes each Trustee's principal occupation during the last five years and other information relating to the experience, attributes, and skills relevant to each Trustee's qualifications to serve as a Trustee, which led to the conclusion that each Trustee should serve as a Trustee for each fund.
Annual Report
Independent Trustees:
Correspondence intended for each Independent Trustee (that is, the Trustees other than the Interested Trustees) may be sent to Fidelity Investments, P.O. Box 55235, Boston, Massachusetts 02205-5235.
Name, Year of Birth; Principal Occupations and Other Relevant Experience+ |
Dennis J. Dirks (1948) |
| Year of Election or Appointment: 2005 Prior to his retirement in May 2003, Mr. Dirks was Chief Operating Officer and a member of the Board of The Depository Trust & Clearing Corporation (DTCC). He also served as President, Chief Operating Officer, and Board member of The Depository Trust Company (DTC) and President and Board member of the National Securities Clearing Corporation (NSCC). In addition, Mr. Dirks served as Chief Executive Officer and Board member of the Government Securities Clearing Corporation, Chief Executive Officer and Board member of the Mortgage-Backed Securities Clearing Corporation, as a Trustee and a member of the Finance Committee of Manhattan College (2005-2008), and as a Trustee and a member of the Finance Committee of AHRC of Nassau County (2006-2008). Mr. Dirks is a member of the Independent Directors Council (IDC) Governing Council (2010-present) and Board of Directors for The Brookville Center for Children's Services, Inc. (2009-present). |
Alan J. Lacy (1953) |
| Year of Election or Appointment: 2008 Mr. Lacy serves as Senior Adviser (2007-present) of Oak Hill Capital Partners, L.P. (private equity). Mr. Lacy also served as Chief Executive Officer (2000-2005) and Vice Chairman (2005-2006) of Sears Holdings Corporation and Sears, Roebuck and Co. (retail). In addition, Mr. Lacy serves as a member of the Board of Directors of Dave & Buster's Entertainment, Inc. (restaurant and entertainment complexes, 2010-present), Earth Fare, Inc. (retail grocery, 2012-present), The Hillman Companies, Inc. (hardware wholesalers, 2010-present), and Bristol-Myers Squibb Company (global pharmaceuticals, 2008-present). Mr. Lacy is a member of the Board of Trustees of The National Parks Conservation Association (2006-present). Previously, Mr. Lacy served as Chairman of the Board of Trustees of the National Parks Conservation Association (2008-2011) and as a member of the Board of Directors for the Western Union Company (global money transfer, 2006-2011). |
Ned C. Lautenbach (1944) |
| Year of Election or Appointment: 2000 Mr. Lautenbach is Chairman of the Independent Trustees of the Equity and High Income Funds (2006-present) and serves as a Trustee of other Fidelity funds (2013-present). Mr. Lautenbach currently serves as the Lead Director of the Eaton Corporation Board of Directors (diversified industrial, 1997-present). Mr. Lautenbach is Chairman of the Board of Directors of the Philharmonic Center for the Arts in Naples, Florida (2012-present) and a member of the Council on Foreign Relations (1994-present). Previously, Mr. Lautenbach was a Partner/Advisory Partner at Clayton, Dubilier & Rice, LLC (private equity investment, 1998-2010), as well as a Director of Sony Corporation (2006-2007). |
Joseph Mauriello (1944) |
| Year of Election or Appointment: 2008 Prior to his retirement in January 2006, Mr. Mauriello served in numerous senior management positions including Deputy Chairman and Chief Operating Officer (2004-2005), and Vice Chairman of Financial Services (2002-2004) of KPMG LLP US (professional services, 1965-2005). Mr. Mauriello currently serves as a member of the Board of Directors of XL Group plc. (global insurance and re-insurance, 2006-present). Previously, Mr. Mauriello served as a Director of the Hamilton Funds of the Bank of New York (2006-2007) and of Arcadia Resources Inc. (health care services and products, 2007-2012). |
Robert W. Selander (1950) |
| Year of Election or Appointment: 2011 Previously, Mr. Selander served as a Member of the Advisory Board of Fidelity's Equity and High Income Funds (2011), Executive Vice Chairman (2010), Chief Executive Officer (2009-2010), and President and Chief Executive Officer (1997-2009) of Mastercard, Inc. |
Cornelia M. Small (1944) |
| Year of Election or Appointment: 2005 Ms. Small is a member of the Board of Directors (2009-present) and Chair of the Investment Committee (2010-present) of the Teagle Foundation. Ms. Small also serves on the Investment Committee of the Berkshire Taconic Community Foundation (2008-present). Previously, Ms. Small served as Chairperson (2002-2008) and a member of the Investment Committee and Chairperson (2008-2012) and a member of the Board of Trustees of Smith College. In addition, Ms. Small served as Chief Investment Officer, Director of Global Equity Investments, and a member of the Board of Directors of Scudder, Stevens & Clark and Scudder Kemper Investments. |
William S. Stavropoulos (1939) |
| Year of Election or Appointment: 2002 Mr. Stavropoulos is Vice Chairman of the Independent Trustees of the Equity and High Income Funds (2006-present) and serves as a Trustee of other Fidelity funds (2013-present). Mr. Stavropoulos serves as President and Founder of the Michigan Baseball Foundation, the Great Lakes Loons (2007-present). Mr. Stavropoulos is Chairman Emeritus of the Board of Directors of The Dow Chemical Company, where he previously served in numerous senior management positions, including President, CEO (1995-2000; 2002-2004), Chairman of the Executive Committee (2000-2006), and as a member of the Board of Directors (1990-2006). Currently, Mr. Stavropoulos is Chairman of the Board of Directors of Univar Inc. (global distributor of commodity and specialty chemicals), a Director of Teradata Corporation (data warehousing and technology solutions), and Maersk Inc. (industrial conglomerate), and a member of the Advisory Board for Metalmark Capital LLC (private equity investment, 2005-present). Mr. Stavropoulos is an operating advisor to Clayton, Dubilier & Rice, LLC (private equity investment). In addition, Mr. Stavropoulos is a member of the University of Notre Dame Advisory Council for the College of Science, a Trustee of the Rollin L. Gerstacker Foundation, and a Director of the Naples Philharmonic Center for the Arts. Previously, Mr. Stavropoulos served as a Director of Chemical Financial Corporation (bank holding company, 1993-2012) and Tyco International, Ltd. (multinational manufacturing and services, 2007-2012). |
David M. Thomas (1949) |
| Year of Election or Appointment: 2008 Previously, Mr. Thomas served as Executive Chairman (2005-2006) and Chairman and Chief Executive Officer (2000-2005) of IMS Health, Inc. (pharmaceutical and healthcare information solutions), and a Director of Fortune Brands, Inc. (consumer products, 2000-2011). In addition, Mr. Thomas serves as Non-Executive Chairman of the Board of Directors of Fortune Brands Home and Security (home and security products, 2011-present), and as a member of the Board of Directors of Interpublic Group of Companies, Inc. (marketing communication, 2004-present). |
+ The information above includes each Trustee's principal occupation during the last five years and other information relating to the experience, attributes, and skills relevant to each Trustee's qualifications to serve as a Trustee, which led to the conclusion that each Trustee should serve as a Trustee for each fund.
Annual Report
Trustees and Officers - continued
Advisory Board Member and Executive Officers:
Correspondence intended for each executive officer and Peter S. Lynch may be sent to Fidelity Investments, 245 Summer Street, Boston, Massachusetts 02210.
Name, Year of Birth; Principal Occupation |
Peter S. Lynch (1944) |
| Year of Election or Appointment: 2003 Member of the Advisory Board of Fidelity's Equity and High Income Funds. Mr. Lynch is Vice Chairman and a Director of FMR and FMR Co., Inc. In addition, Mr. Lynch serves as a Trustee of Boston College and as the Chairman of the Inner-City Scholarship Fund. Previously, Mr. Lynch served on the Special Olympics International Board of Directors (1997-2006). |
Kenneth B. Robins (1969) |
| Year of Election or Appointment: 2008 President and Treasurer of Fidelity's Equity and High Income Funds. Mr. Robins also serves as President and Treasurer (2008-present) and Assistant Treasurer (2009-present) of other Fidelity funds and is an employee of Fidelity Investments (2004-present). Mr. Robins serves as Executive Vice President of Fidelity Investments Money Management, Inc. (FIMM) (2013-present). Previously, Mr. Robins served as Deputy Treasurer of the Fidelity funds (2005-2008) and Treasurer and Chief Financial Officer of The North Carolina Capital Management Trust: Cash and Term Portfolios (2006-2008). |
Bruce T. Herring (1965) |
| Year of Election or Appointment: 2006 Vice President of certain Equity Funds. Mr. Herring also serves as Vice President of other Fidelity funds (2013-present), Chief Investment Officer of Fidelity Global Asset Allocation (GAA) (2013-present), Chief Investment Officer and Director of Fidelity Management & Research (U.K.) Inc. (2010-present), Group Chief Investment Officer of FMR, and President of Fidelity Research & Analysis Company (2010-present). Previously, Mr. Herring served as Vice President (2005-2006) and Senior Vice President (2006-2007) of Fidelity Management & Research Company, Vice President of FMR Co., Inc. (2001-2007) and as a portfolio manager for Fidelity U.S. Equity Funds. |
Brian B. Hogan (1964) |
| Year of Election or Appointment: 2009 Vice President of Equity and High Income Funds. Mr. Hogan also serves as Vice President of other Fidelity funds (2009-present) and President of FMR's Equity Division (2009-present). Previously, Mr. Hogan served as Senior Vice President, Equity Research of FMR (2006-2009) and as a portfolio manager. |
Scott C. Goebel (1968) |
| Year of Election or Appointment: 2008 Secretary and Chief Legal Officer (CLO) of the Fidelity funds. Mr. Goebel also serves as Secretary of Fidelity Investments Money Management, Inc. (FIMM) (2010-present) and Fidelity Research and Analysis Company (FRAC) (2010-present); Secretary and CLO of The North Carolina Capital Management Trust: Cash and Term Portfolios (2008-present); General Counsel, Secretary, and Senior Vice President of FMR (2008-present) and FMR Co., Inc. (2008-present); employed by FMR LLC or an affiliate (2001-present); Chief Legal Officer of Fidelity Management & Research (Hong Kong) Limited (2008-present) and Assistant Secretary of Fidelity Management & Research (Japan) Inc. (2008-present), and Fidelity Management & Research (U.K.) Inc. (2008-present). Previously, Mr. Goebel served as Assistant Secretary of FIMM (2008-2010), FRAC (2008-2010), and the Funds (2007-2008) and as Vice President and Secretary of Fidelity Distributors Corporation (FDC) (2005-2007). |
William C. Coffey (1969) |
| Year of Election or Appointment: 2009 Assistant Secretary of Fidelity's Equity and High Income Funds. Mr. Coffey also serves as Assistant Secretary of other Fidelity funds (2009-present), Senior Vice President and Deputy General Counsel of FMR LLC (2010-present), and is an employee of Fidelity Investments. Previously, Mr. Coffey served as Vice President and Associate General Counsel of FMR LLC (2005-2009). |
Elizabeth Paige Baumann (1968) |
| Year of Election or Appointment: 2012 Anti-Money Laundering (AML) Officer of the Fidelity funds. Ms. Baumann also serves as AML Officer of The North Carolina Capital Management Trust: Cash and Term Portfolios (2012-present), Chief AML Officer of FMR LLC (2012-present), and is an employee of Fidelity Investments. Previously, Ms. Baumann served as Vice President and Deputy Anti-Money Laundering Officer (2007-2012). |
Christine Reynolds (1958) |
| Year of Election or Appointment: 2008 Chief Financial Officer of the Fidelity funds. Ms. Reynolds became President of Fidelity Pricing and Cash Management Services (FPCMS) in August 2008. Ms. Reynolds served as Chief Operating Officer of FPCMS (2007-2008). Previously, Ms. Reynolds served as President, Treasurer, and Anti-Money Laundering officer of the Fidelity funds (2004-2007). |
Joseph A. Hanlon (1968) |
| Year of Election or Appointment: 2012 Chief Compliance Officer of Fidelity's Equity and High Income Funds. Mr. Hanlon also serves as Chief Compliance Officer of other Fidelity funds (2012-present). Mr. Hanlon serves as Compliance Officer of FMR, FMR Co., Inc., Fidelity Investments Money Management, Inc. (FIMM), Fidelity Research and Analysis Company (FRAC), and Fidelity Management & Research (Hong Kong) (2009-present), as Senior Vice President of the Fidelity Asset Management Division (2009-present), and is an employee of Fidelity Investments. Previously, Mr. Hanlon served as Compliance Officer of Fidelity Management & Research (Japan) Inc. (2009-2013), Strategic Advisers, Inc. (2009-2013), and Fidelity Management & Research (U.K.) Inc. (2009-2013). |
Joseph F. Zambello (1957) |
| Year of Election or Appointment: 2011 Deputy Treasurer of the Fidelity funds. Mr. Zambello is an employee of Fidelity Investments. Previously, Mr. Zambello served as Vice President of FMR's Program Management Group (2009-2011) and Vice President of the Transfer Agent Oversight Group (2005-2009). |
Adrien E. Deberghes (1967) |
| Year of Election or Appointment: 2008 Deputy Treasurer of Fidelity's Equity and High Income Funds. Mr. Deberghes also serves as Vice President (2011-present), Deputy Treasurer (2008-present), and Assistant Treasurer (2010-present) of other Fidelity funds, and is an employee of Fidelity Investments (2008-present). Previously, Mr. Deberghes served as Senior Vice President of Mutual Fund Administration at State Street Corporation (2007-2008), Senior Director of Mutual Fund Administration at Investors Bank & Trust (2005-2007), and Director of Finance for Dunkin' Brands (2000-2005). |
Stephen Sadoski (1971) |
| Year of Election or Appointment: 2012 Deputy Treasurer of Fidelity's Equity and High Income Funds. Mr. Sadoski also serves as Deputy Treasurer of other Fidelity funds (2012-present) and is an employee of Fidelity Investments (2012-present). Previously, Mr. Sadoski served as Assistant Treasurer of Fidelity's Fixed Income and Asset Allocation Funds (2012-2013), an assistant chief accountant in the Division of Investment Management of the Securities and Exchange Commission (SEC) (2009-2012) and as a senior manager at Deloitte & Touche LLP (1997-2009). |
Stacie M. Smith (1974) |
| Year of Election or Appointment: 2013 Deputy Treasurer of Fidelity's Equity and High Income Funds. Ms. Smith also serves as Deputy Treasurer of other Fidelity funds (2013-present) and is an employee of Fidelity Investments (2009-present). Previously, Ms. Smith served as Senior Audit Manager of Ernst & Young LLP (1996-2009). |
Stephanie J. Dorsey (1969) |
| Year of Election or Appointment: 2010 Assistant Treasurer of Fidelity's Equity and High Income Funds. Ms. Dorsey also serves as President and Treasurer (2013-present) and Assistant Treasurer (2010-present) of other Fidelity funds, Treasurer and Chief Financial Officer of The North Carolina Capital Management Trust: Cash and Term Portfolios (2013-present), and is an employee of Fidelity Investments (2008-present). Previously, Ms. Dorsey served as Deputy Treasurer of Fidelity's Fixed Income and Asset Allocation Funds (2008-2013), Treasurer (2004-2008) of the JPMorgan Mutual Funds and Vice President (2004-2008) of JPMorgan Chase Bank. |
Gary W. Ryan (1958) |
| Year of Election or Appointment: 2005 Assistant Treasurer of the Fidelity funds. Mr. Ryan is an employee of Fidelity Investments. Previously, Mr. Ryan served as Vice President of Fund Reporting in Fidelity Pricing and Cash Management Services (FPCMS) (1999-2005). |
Jonathan Davis (1968) |
| Year of Election or Appointment: 2010 Assistant Treasurer of the Fidelity funds. Mr. Davis is also Assistant Treasurer of Fidelity Rutland Square Trust II and Fidelity Commonwealth Trust II. Mr. Davis is an employee of Fidelity Investments. Previously, Mr. Davis served as Vice President and Associate General Counsel of FMR LLC (2003-2010). |
Annual Report
The fund designates 100% of the dividends distributed during the fiscal year as qualifying for the dividends-received deduction for corporate shareholders.
The fund designates 100% of the dividends distributed during the fiscal year as amounts which may be taken into account as a dividend for the purposes of the maximum rate under section 1(h)(11) of the Internal Revenue Code.
The fund will notify shareholders in January 2014 of amounts for use in preparing 2013 income tax returns.
Annual Report
Board Approval of Investment Advisory Contracts and Management Fees
Fidelity Blue Chip Value Fund
Each year, the Board of Trustees, including the Independent Trustees (together, the Board), votes on the renewal of the management contract and sub-advisory agreements (together, the Advisory Contracts) for the fund. The Board, assisted by the advice of fund counsel and Independent Trustees' counsel, requests and considers a broad range of information relevant to the renewal of the Advisory Contracts throughout the year.
The Board meets regularly and, at each of its meetings, covers an extensive agenda of topics and materials and considers factors that are relevant to its annual consideration of the renewal of the fund's Advisory Contracts, including the services and support provided to the fund and its shareholders. The Board has established various standing committees, each composed of and chaired by Independent Trustees with varying backgrounds, to which the Board has assigned specific subject matter responsibilities in order to enhance effective decision-making by the Board. The Board, acting directly and through its Committees, requests and receives information concerning the annual consideration of the renewal of the fund's Advisory Contracts. The Board also meets as needed to consider matters specifically related to the Board's annual consideration of the renewal of Advisory Contracts. Members of the Board may also meet with trustees of other Fidelity funds through ad hoc joint committees to discuss certain matters relevant to the Fidelity funds.
At its July 2013 meeting, the Board, including the Independent Trustees, unanimously determined to renew the fund's Advisory Contracts. In reaching its determination, the Board considered all factors it believed relevant, including (i) the nature, extent, and quality of the services to be provided to the fund and its shareholders (including the investment performance of the fund); (ii) the competitiveness of the fund's management fee and total expense ratio relative to peer funds; (iii) the total costs of the services to be provided by and the profits to be realized by Fidelity from its relationship with the fund; (iv) the extent to which economies of scale exist and would be realized as the fund grows; and (v) whether fee levels reflect these economies of scale, if any, for the benefit of fund shareholders.
In considering whether to renew the Advisory Contracts for the fund, the Board reached a determination, with the assistance of fund counsel and Independent Trustees' counsel and through the exercise of its business judgment, that the renewal of the Advisory Contracts was in the best interests of the fund and its shareholders and that the compensation payable under the Advisory Contracts was fair and reasonable. The Board's decision to renew the Advisory Contracts was not based on any single factor, but rather was based on a comprehensive consideration of all the information provided to the Board at its meetings throughout the year. The Board, in reaching its determination to renew the Advisory Contracts, was aware that shareholders in the fund have a broad range of investment choices available to them, including a wide choice among mutual funds offered by Fidelity's competitors, and that the fund's shareholders, who have the opportunity to review and weigh the disclosure provided by the fund in its prospectus and other public disclosures, have chosen to invest in this fund, which is a part of the Fidelity family of funds.
Annual Report
Board Approval of Investment Advisory Contracts and
Management Fees - continued
Nature, Extent, and Quality of Services Provided. The Board considered the staffing within the investment adviser, Fidelity Management & Research Company (FMR), and the sub-advisers (together, the Investment Advisers) as it relates to the fund, including the backgrounds of the fund's investment personnel, and also considered the fund's investment objective, strategies, and related investment philosophy. The Independent Trustees also had discussions with senior management of Fidelity's investment operations and investment groups. The Board considered the structure of the portfolio manager compensation program and whether this structure provides appropriate incentives to act in the best interests of the fund.
Resources Dedicated to Investment Management and Support Services. The Board and the Fund Oversight and Research Committees reviewed the general qualifications and capabilities of the Investment Advisers' investment staff, including its size, education, experience, and resources, as well as the Investment Advisers' approach to recruiting, training, managing, and compensating investment personnel. The Board noted that FMR has continued to increase the resources devoted to non-U.S. offices, including expansion of Fidelity's global investment organization. The Board also noted that Fidelity's analysts have extensive resources, tools and capabilities that allow them to conduct sophisticated quantitative and fundamental analysis, as well as credit analysis of issuers, counterparties and guarantors. Further, the Board believes that Fidelity's investment professionals have sufficient access to global information and data so as to provide competitive investment results over time, and that those professionals also have access to sophisticated tools that permit them to assess portfolio construction and risk and performance attribution characteristics continuously, as well as to transmit new information and research conclusions rapidly around the world. Additionally, in its deliberations, the Board considered the Investment Advisers' trading and risk management capabilities and resources, which are an integral part of the investment management process.
Shareholder and Administrative Services. The Board considered (i) the nature, extent, quality, and cost of advisory, administrative, and shareholder services performed by the Investment Advisers and their affiliates under the Advisory Contracts and under separate agreements covering transfer agency, pricing and bookkeeping, and securities lending services for the fund; (ii) the nature and extent of the supervision of third party service providers, principally custodians and subcustodians; and (iii) the resources devoted to, and the record of compliance with, the fund's compliance policies and procedures. The Board also reviewed the allocation of fund brokerage, including allocations to brokers affiliated with the Investment Advisers, the use of brokerage commissions to pay fund expenses, and the use of "soft" commission dollars to pay for research services.
Annual Report
The Board noted that the growth of fund assets over time across the complex allows Fidelity to reinvest in the development of services designed to enhance the value or convenience of the Fidelity funds as investment vehicles. These services include 24-hour access to account information and market information through telephone representatives and over the Internet, investor education materials and asset allocation tools, and the expanded availability of Fidelity Investor Centers.
Investment in a Large Fund Family. The Board considered the benefits to shareholders of investing in a Fidelity fund, including the benefits of investing in a fund that is part of a large family of funds offering a variety of investment disciplines and providing a large variety of mutual fund investor services. The Board noted that Fidelity had taken, or had made recommendations that resulted in the Fidelity funds taking, a number of actions over the previous year that benefited particular funds, including (i) continuing to dedicate additional resources to investment research and to the support of the senior management team that oversees asset management; (ii) persisting in efforts to enhance Fidelity's global research capabilities; (iii) launching new funds and making other enhancements to meet client needs for global and income-oriented solutions; (iv) continuing to launch dedicated lower cost underlying funds to meet portfolio construction needs related to expanding underlying fund options for Fidelity funds of funds, specifically for the Freedom Fund product lines; (v) rationalizing product lines and gaining increased efficiencies through the mergers of several funds into other funds; (vi) strengthening Fidelity's index fund offerings by reducing investment minimums and adopting or lowering existing expense caps for certain funds and classes; (vii) enhancing Global Asset Allocation product offerings by launching new funds and strategies, including "open architecture" target date funds that utilize affiliated and unaffiliated sub-advisers; (viii) modifying the eligibility criteria for Institutional Class shares of Advisor funds to increase their marketability to a portion of the defined contribution plan market; (ix) creating a new low-cost retirement share class for certain Advisor funds to appeal to large retirement plans; (x) transitioning the management of certain Fidelity commodity funds to Geode Capital Management LLC, a registered commodity pool operator, while retaining administrative responsibilities for the funds; (xi) reorganizing a number of funds; and (xii) taking steps toward establishing a new Fidelity adviser to manage sector-based funds and products.
Investment Performance. The Board considered whether the fund has operated in accordance with its investment objective, as well as its record of compliance with its investment restrictions and its performance history.
The Board took into account discussions with the Investment Advisers about fund investment performance that occur at Board meetings throughout the year. In this regard the Board noted that as part of regularly scheduled fund reviews and other reports to the Board on fund performance, the Board periodically considers annualized return information for the fund, for different time periods, measured against a securities market index ("benchmark index") and a peer group of mutual funds with similar objectives ("peer group"). In its evaluation of fund investment performance, the Board gave particular attention to information indicating changes in performance of certain Fidelity funds for specific time periods and the Investment Advisers' explanations for any overperformance or, in the case of the fund, underperformance.
Annual Report
Board Approval of Investment Advisory Contracts and
Management Fees - continued
In addition to reviewing absolute and relative fund performance, the Independent Trustees periodically consider the appropriateness of fund performance metrics in evaluating the results achieved. In general, the Independent Trustees believe that fund performance should be evaluated based on net performance (after fees and expenses) of both the highest performing and lowest performing classes, where applicable, compared to appropriate benchmark indices, over appropriate time periods which may include full market cycles, and compared to peer groups, as applicable, over the same periods, taking into account relevant factors including the following: general market conditions; issuer-specific information; tactical opportunities for investment; and fund cash flows and other factors.
The Independent Trustees recognize that shareholders evaluate performance on a net basis over their own holding periods, for which one-, three-, and five-year periods are used as a proxy. For this reason, the performance information reviewed by the Board also included net cumulative calendar year total return information for the fund and an appropriate benchmark index and peer group for the most recent one-, three-, and five-year periods, as shown below. Returns are shown compared to the 25th percentile (top of box) and 75th percentile (bottom of box) of the peer universe.
Annual Report
Fidelity Blue Chip Value Fund
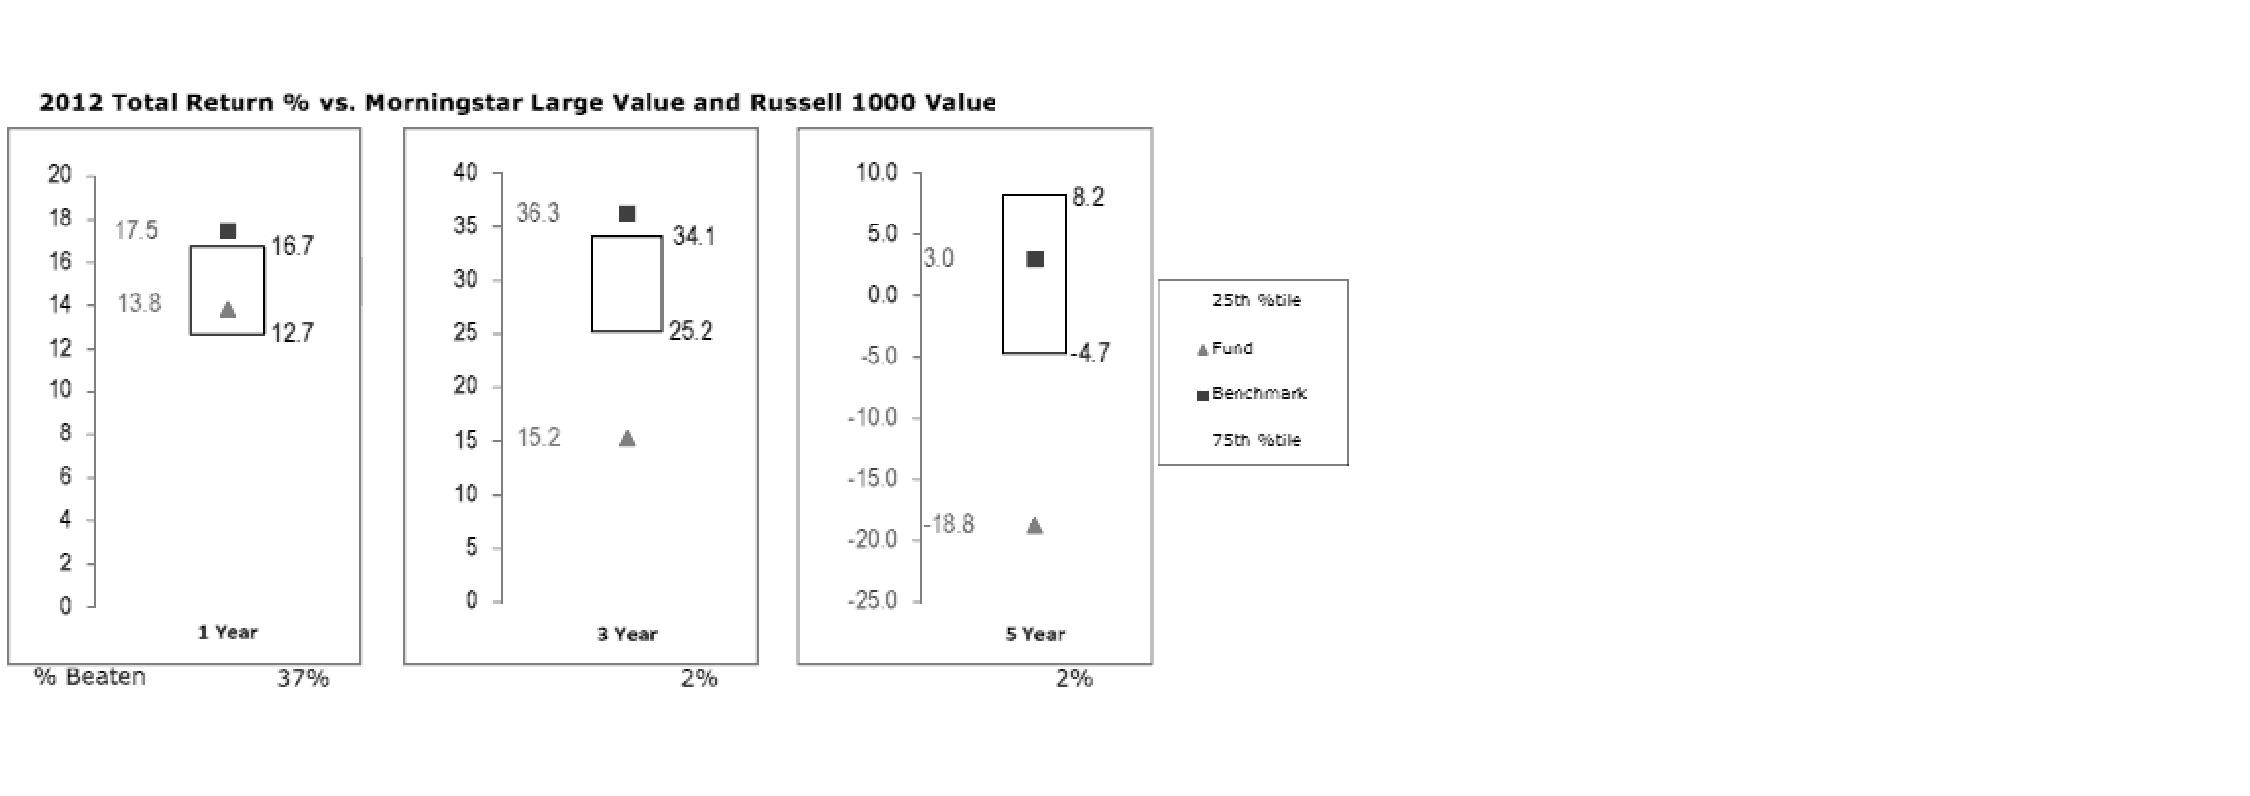
The Board has discussed the fund's underperformance with FMR and has engaged with FMR to consider what steps might be taken to remediate the fund's underperformance.
The Board also considered that the fund's management fee is subject to upward or downward adjustment depending upon whether, and to what extent, the fund's investment performance for the performance period exceeds, or is exceeded by, a securities index, thus leading to a performance adjustment for the same period. The Board noted that the performance adjustment provides FMR with a strong economic incentive to seek to achieve superior performance for the fund's shareholders and helps to more closely align the interests of FMR and the fund's shareholders.
Based on its review, the Board concluded that the nature, extent, and quality of services provided to the fund under the Advisory Contracts should benefit the fund's shareholders.
Competitiveness of Management Fee and Total Expense Ratio. The Board considered the fund's management fee and total expense ratio compared to "mapped groups" of competitive funds and classes. Fidelity creates "mapped groups" by combining similar Lipper investment objective categories that have comparable management fee characteristics. Combining Lipper investment objective categories aids the Board's management fee and total expense ratio comparisons by broadening the competitive group used for comparison and by reducing the number of universes to which various Fidelity funds are compared.
Annual Report
Board Approval of Investment Advisory Contracts and
Management Fees - continued
Management Fee. The Board considered two proprietary management fee comparisons for the 12-month periods shown in the chart below. The group of Lipper funds used by the Board for management fee comparisons is referred to below as the "Total Mapped Group." The Total Mapped Group comparison focuses on a fund's standing in terms of gross management fees before expense reimbursements or caps, and without giving effect to the fund's performance adjustment, relative to the total universe of funds with comparable investment mandates, regardless of whether their management fee structures also are comparable. Funds with comparable investment mandates offer exposure to similar types of securities. Funds with comparable management fee structures have similar management fee contractual arrangements (e.g., flat rate charged for advisory services, all-inclusive fee rate, etc.). "TMG %" represents the percentage of funds in the Total Mapped Group that had management fees that were lower than the fund's. For example, a TMG % of 11% means that 89% of the funds in the Total Mapped Group had higher management fees than the fund. The "Asset-Size Peer Group" (ASPG) comparison focuses on a fund's standing relative to a subset of non-Fidelity funds within the Total Mapped Group that are similar in size and management fee structure. The ASPG represents at least 15% of the funds in the Total Mapped Group with comparable asset size and management fee structures, subject to a minimum of 50 funds (or all funds in the Total Mapped Group if fewer than 50). Additional information, such as the ASPG quartile in which the fund's management fee ranked and the impact of the fund's performance adjustment, is also included in the chart and considered by the Board.
Fidelity Blue Chip Value Fund
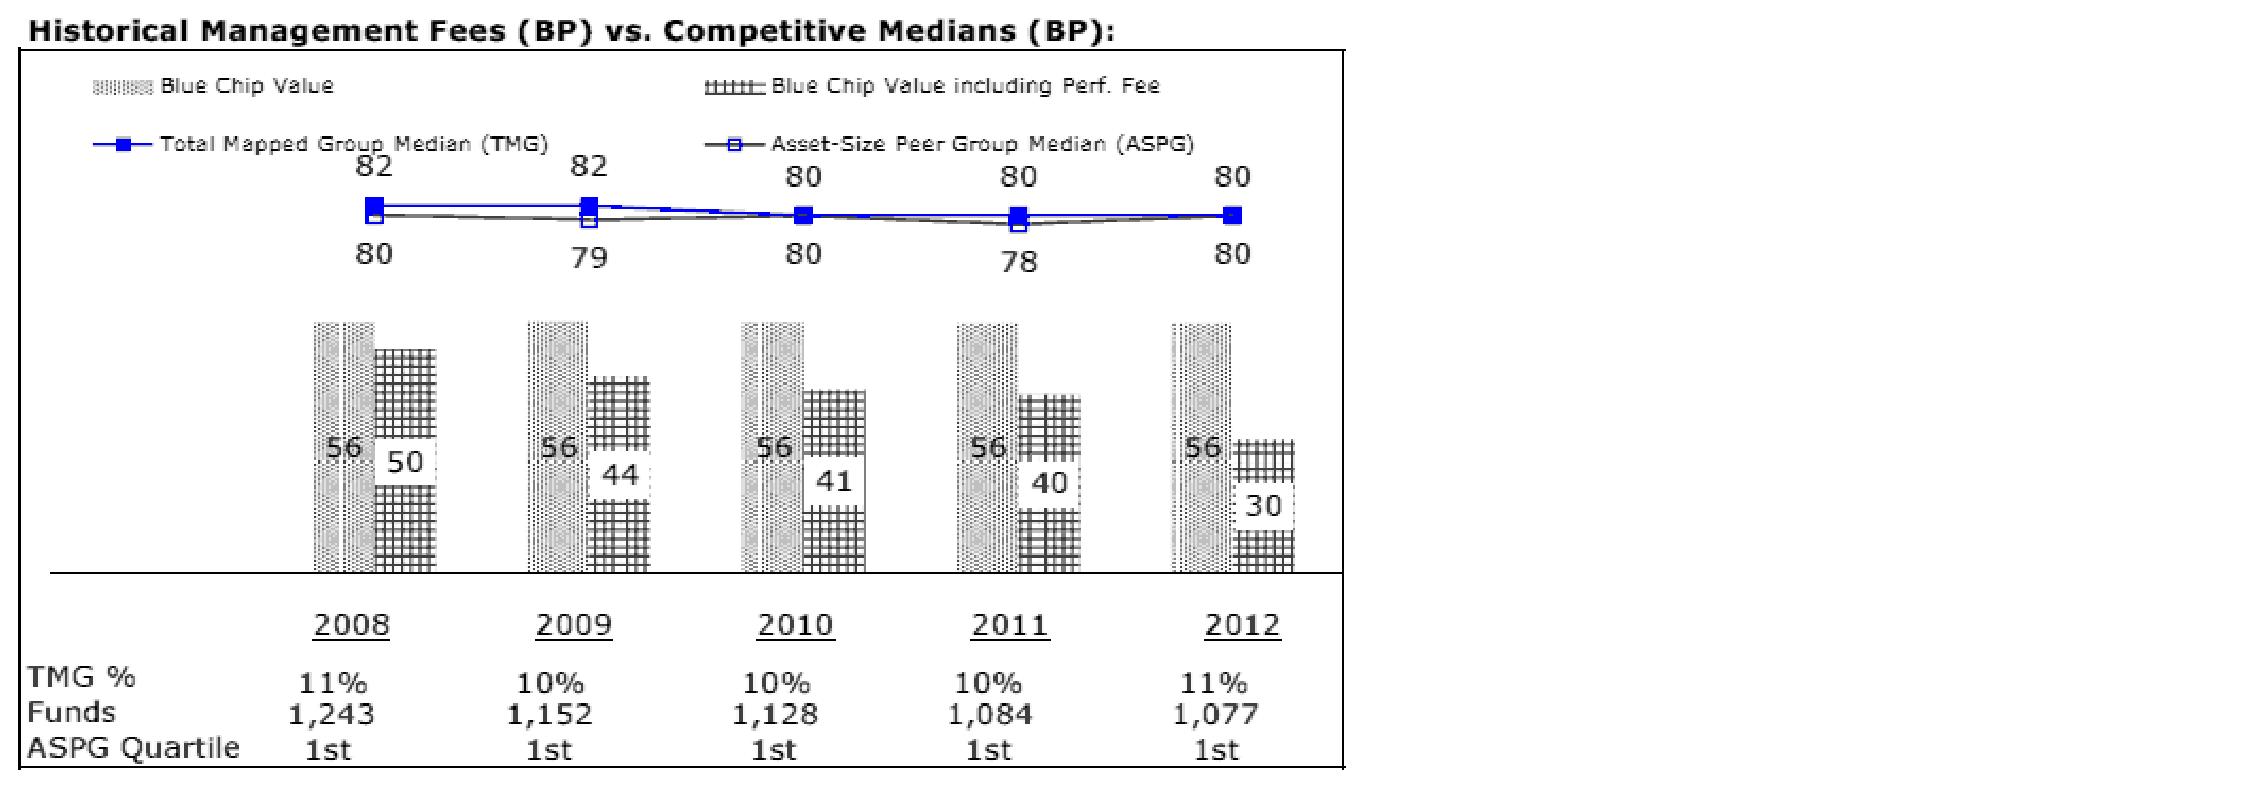
The Board noted that the fund's management fee ranked below the median of its Total Mapped Group and below the median of its ASPG for 2012. The Board also noted the effect of the fund's negative performance adjustment on the fund's management fee ranking.
Annual Report
Based on its review, the Board concluded that the fund's management fee is fair and reasonable in light of the services that the fund receives and the other factors considered.
Total Expense Ratio. In its review of the fund's total expense ratio, the Board considered the fund's management fee as well as other fund expenses, such as transfer agent fees, pricing and bookkeeping fees, and custodial, legal, and audit fees. The Board also noted the effects of any waivers and reimbursements on fees and expenses, as well as the impact of the fund's performance adjustment. As part of its review, the Board also considered the current and historical total expense ratios of the fund compared to competitive fund median expenses. The fund is compared to those funds and classes in the Total Mapped Group (used by the Board for management fee comparisons) that have a similar sales load structure.
The Board noted that the fund's total expense ratio ranked below its competitive median for 2012.
Fees Charged to Other Fidelity Clients. The Board also considered Fidelity fee structures and other information with respect to clients of FMR and its affiliates, such as other mutual funds advised or subadvised by FMR or its affiliates, pension plan clients, and other institutional clients. The Board noted the findings of the 2013 ad hoc joint committee (created with the board of other Fidelity funds), which reviewed and compared Fidelity's institutional investment advisory business with its business of providing services to the Fidelity funds, including the differences in services provided, fees charged, and costs incurred, as well as competition in their respective marketplaces.
Based on its review of total expense ratios and fees charged to other Fidelity clients, the Board concluded that the fund's total expense ratio was reasonable in light of the services that the fund and its shareholders receive and the other factors considered.
Costs of the Services and Profitability. The Board considered the revenues earned and the expenses incurred by Fidelity in conducting the business of developing, marketing, distributing, managing, administering and servicing the fund and servicing the fund's shareholders. The Board also considered the level of Fidelity's profits in respect of all the Fidelity funds.
On an annual basis, FMR presents to the Board Fidelity's profitability for the fund. Fidelity calculates the profitability for each fund, as well as aggregate profitability for groups of Fidelity funds and all Fidelity funds, using a series of detailed revenue and cost allocation methodologies which originate with the books and records of Fidelity on which Fidelity's audited financial statements are based. The Audit Committee of the Board reviews any significant changes from the prior year's methodologies.
Annual Report
Board Approval of Investment Advisory Contracts and
Management Fees - continued
PricewaterhouseCoopers LLP (PwC), independent registered public accounting firm and auditor to Fidelity and certain Fidelity funds, has been engaged annually by the Board as part of the Board's assessment of Fidelity's profitability analysis. PwC's engagement includes the review and assessment of the methodologies used by Fidelity in determining the revenues and expenses attributable to Fidelity's mutual fund business, and completion of agreed-upon procedures surrounding the mathematical accuracy of fund profitability and its conformity to allocation methodologies. After considering PwC's reports issued under the engagement and information provided by Fidelity, the Board concluded that while other allocation methods may also be reasonable, Fidelity's profitability methodologies are reasonable in all material respects.
The Board also reviewed Fidelity's non-fund businesses and fall-out benefits related to the mutual fund business as well as cases where Fidelity's affiliates may benefit from or be related to the fund's business.
The Board considered the costs of the services provided by and the profits realized by Fidelity in connection with the operation of the fund and was satisfied that the profitability was not excessive in the circumstances.
Economies of Scale. The Board considered whether there have been economies of scale in respect of the management of the Fidelity funds, whether the Fidelity funds (including the fund) have appropriately benefited from any such economies of scale, and whether there is potential for realization of any further economies of scale. The Board considered the extent to which the fund will benefit from economies of scale through increased services to the fund, through waivers or reimbursements, or through fee or expense reductions. The Board also noted that in 2009, it and the board of other Fidelity funds created an ad hoc committee (the Economies of Scale Committee) to analyze whether FMR attains economies of scale in respect of the management and servicing of the Fidelity funds, whether the Fidelity funds have appropriately benefited from such economies of scale, and whether there is potential for realization of any further economies of scale.
The Board recognized that the fund's management contract incorporates a "group fee" structure, which provides for lower group fee rates as total fund assets under FMR's management increase, and for higher group fee rates as total fund assets under FMR's management decrease. FMR calculates the group fee rates based on a tiered asset "breakpoint" schedule that varies based on asset class. The Board considered that the group fee is designed to deliver the benefits of economies of scale to fund shareholders when total Fidelity fund assets increase, even if assets of any particular fund are unchanged or have declined, because some portion of Fidelity's costs are attributable to services provided to all Fidelity funds, and all funds benefit if those costs can be allocated among more assets. The Board concluded that, given the group fee structure, fund shareholders will benefit from lower management fees as assets under FMR's management increase at the fund complex level, regardless of whether Fidelity achieves any such economies of scale.
Annual Report
The Board concluded, taking into account the analysis of the Economies of Scale Committee, that economies of scale, if any, are being appropriately shared between fund shareholders and Fidelity.
Amendment to Description of Group Fee Rate. At its July 2013 meeting, the Board voted to approve an amendment to the fund's management contract to modify the description of the "group fee rate" effective August 1, 2013. The Board noted that under the prior description in the contract, the group fee rate was based on the average net assets of all registered investment companies with which FMR has management contracts. Under the contract's tiered asset breakpoint schedule, the group fee rate is lower as total fund assets under FMR's management increase, and higher as total fund assets under FMR's management decrease. The Board considered that the prior description would have excluded the assets of 64 Fidelity sector funds from the group fee rate calculation once Fidelity SelectCo, LLC, an affiliate of FMR, assumed management responsibilities for those funds. The Board noted that modifying the description of the group fee rate to continue to include the assets of those 64 funds for purposes of determining group fee rate breakpoints would avoid an immediate adverse impact on the group fee rate for any fund.
Additional Information Requested by the Board. In order to develop fully the factual basis for consideration of the Fidelity funds' Advisory Contracts, the Board requested and received additional information on certain topics, including: (i) fund performance trends and Fidelity's long-term strategies for certain funds; (ii) the potential to further rationalize the Fidelity fund lineup with the possibility of achieving savings for the funds and Fidelity; (iii) the methodology with respect to competitive fund data and peer group classifications; (iv) the arrangements with, and performance of, certain sub-advisers on behalf of the Fidelity funds, as well as certain proposed participating affiliate arrangements; (v) the realization of fall-out benefits in certain Fidelity business units; (vi) Fidelity's group fee structures, including the rationale for the individual fee rates of certain categories of funds and the definition of group assets; (vii) trends regarding industry use of performance fee structures and the performance adjustment methodologies applicable to the Fidelity funds; (viii) additional competitive analysis regarding the total expenses for certain classes; and (ix) fund profitability methodology, including Fidelity's cost allocation methodology, and the impact of certain factors on fund profitability results.
Based on its evaluation of all of the conclusions noted above, and after considering all factors it believed relevant, the Board ultimately concluded that the advisory fee structures are fair and reasonable, and that the fund's Advisory Contracts should be renewed.
Annual Report
Investment Adviser
Fidelity Management & Research Company
Boston, MA
Investment Sub-Advisers
FMR Co., Inc.
Fidelity Management & Research
(U.K.) Inc.
Fidelity Management & Research
(Japan) Inc.
Fidelity Management & Research
(Hong Kong) Limited
General Distributor
Fidelity Distributors Corporation
Smithfield, RI
Transfer and Service Agents
Fidelity Investments Institutional
Operations Company, Inc.
Boston, MA
Fidelity Service Company, Inc.
Boston, MA
Custodian
Brown Brothers Harriman & Co.
Boston, MA
The Fidelity Telephone Connection
Mutual Fund 24-Hour Service
Exchanges/Redemptions
and Account Assistance 1-800-544-6666
Product Information 1-800-544-6666
Retirement Accounts 1-800-544-4774
(8 a.m. - 9 p.m.)
TDD Service 1-800-544-0118
for the deaf and hearing impaired
(9 a.m. - 9 p.m. Eastern time)
Fidelity Automated Service
Telephone (FAST®)
1-800-544-5555
Automated line for quickest service
(Fidelity Investment logo)(registered trademark)
Corporate Headquarters
245 Summer St., Boston, MA 02210
www.fidelity.com
BCV-UANN-0913
1.789709.110
Fidelity®
Dividend Growth
Fund
Annual Report
July 31, 2013
(Fidelity Cover Art)
Contents
Performance | (Click Here) | How the fund has done over time. |
Management's Discussion of Fund Performance | (Click Here) | The Portfolio Manager's review of fund performance and strategy. |
Shareholder Expense Example | (Click Here) | An example of shareholder expenses. |
Investment Changes | (Click Here) | A summary of major shifts in the fund's investments over the past six months. |
Investments | (Click Here) | A complete list of the fund's investments with their market values. |
Financial Statements | (Click Here) | Statements of assets and liabilities, operations, and changes in net assets, as well as financial highlights. |
Notes | (Click Here) | Notes to the financial statements. |
Report of Independent Registered Public Accounting Firm | (Click Here) | |
Trustees and Officers | (Click Here) | |
Distributions | (Click Here) | |
Board Approval of Investment Advisory Contracts and Management Fees | (Click Here) | |
To view a fund's proxy voting guidelines and proxy voting record for the 12-month period ended June 30, visit http://www.fidelity.com/proxyvotingresults or visit the Securities and Exchange Commission's (SEC) web site at http://www.sec.gov. You may also call 1-800-544-8544 to request a free copy of the proxy voting guidelines.
Standard & Poor's, S&P and S&P 500 are registered service marks of The McGraw-Hill Companies, Inc. and have been licensed for use by Fidelity Distributors Corporation.
Other third-party marks appearing herein are the property of their respective owners.
All other marks appearing herein are registered or unregistered trademarks or service marks of FMR LLC or an affiliated company. © 2013 FMR LLC. All rights reserved.
Annual Report
This report and the financial statements contained herein are submitted for the general information of the shareholders of the fund. This report is not authorized for distribution to prospective investors in the fund unless preceded or accompanied by an effective prospectus.
A fund files its complete schedule of portfolio holdings with the SEC for the first and third quarters of each fiscal year on Form N-Q. Forms N-Q are available on the SEC's web site at http://www.sec.gov. A fund's Forms N-Q may be reviewed and copied at the SEC's Public Reference Room in Washington, DC. Information regarding the operation of the SEC's Public Reference Room may be obtained by calling 1-800-SEC-0330. For a complete list of a fund's portfolio holdings, view the most recent holdings listing, semiannual report, or annual report on Fidelity's web site at http://www.fidelity.com, http://www.advisor.fidelity.com, or http://www.401k.com, as applicable.
NOT FDIC INSURED • MAY LOSE VALUE • NO BANK GUARANTEE
Neither the fund nor Fidelity Distributors Corporation is a bank.
Annual Report
Average annual total return reflects the change in the value of an investment, assuming reinvestment of the class' distributions from dividend income and capital gains (the profits earned upon the sale of securities that have grown in value, if any) and assuming a constant rate of performance each year. The $10,000 table and the fund's returns do not reflect the deduction of taxes that a shareholder would pay on fund distributions or the redemption of fund shares. During periods of reimbursement by Fidelity, a fund's total return will be greater than it would be had the reimbursement not occurred. How a fund did yesterday is no guarantee of how it will do tomorrow.
Average Annual Total Returns
Periods ended July 31, 2013 | Past 1
year | Past 5
years | Past 10
years |
Fidelity® Dividend Growth Fund | 26.83% | 9.17% | 6.58% |
$10,000 Over 10 Years
Let's say hypothetically that $10,000 was invested in Fidelity® Dividend Growth Fund, a class of the fund, on July 31, 2003. The chart shows how the value of your investment would have changed, and also shows how the S&P 500® Index performed over the same period.
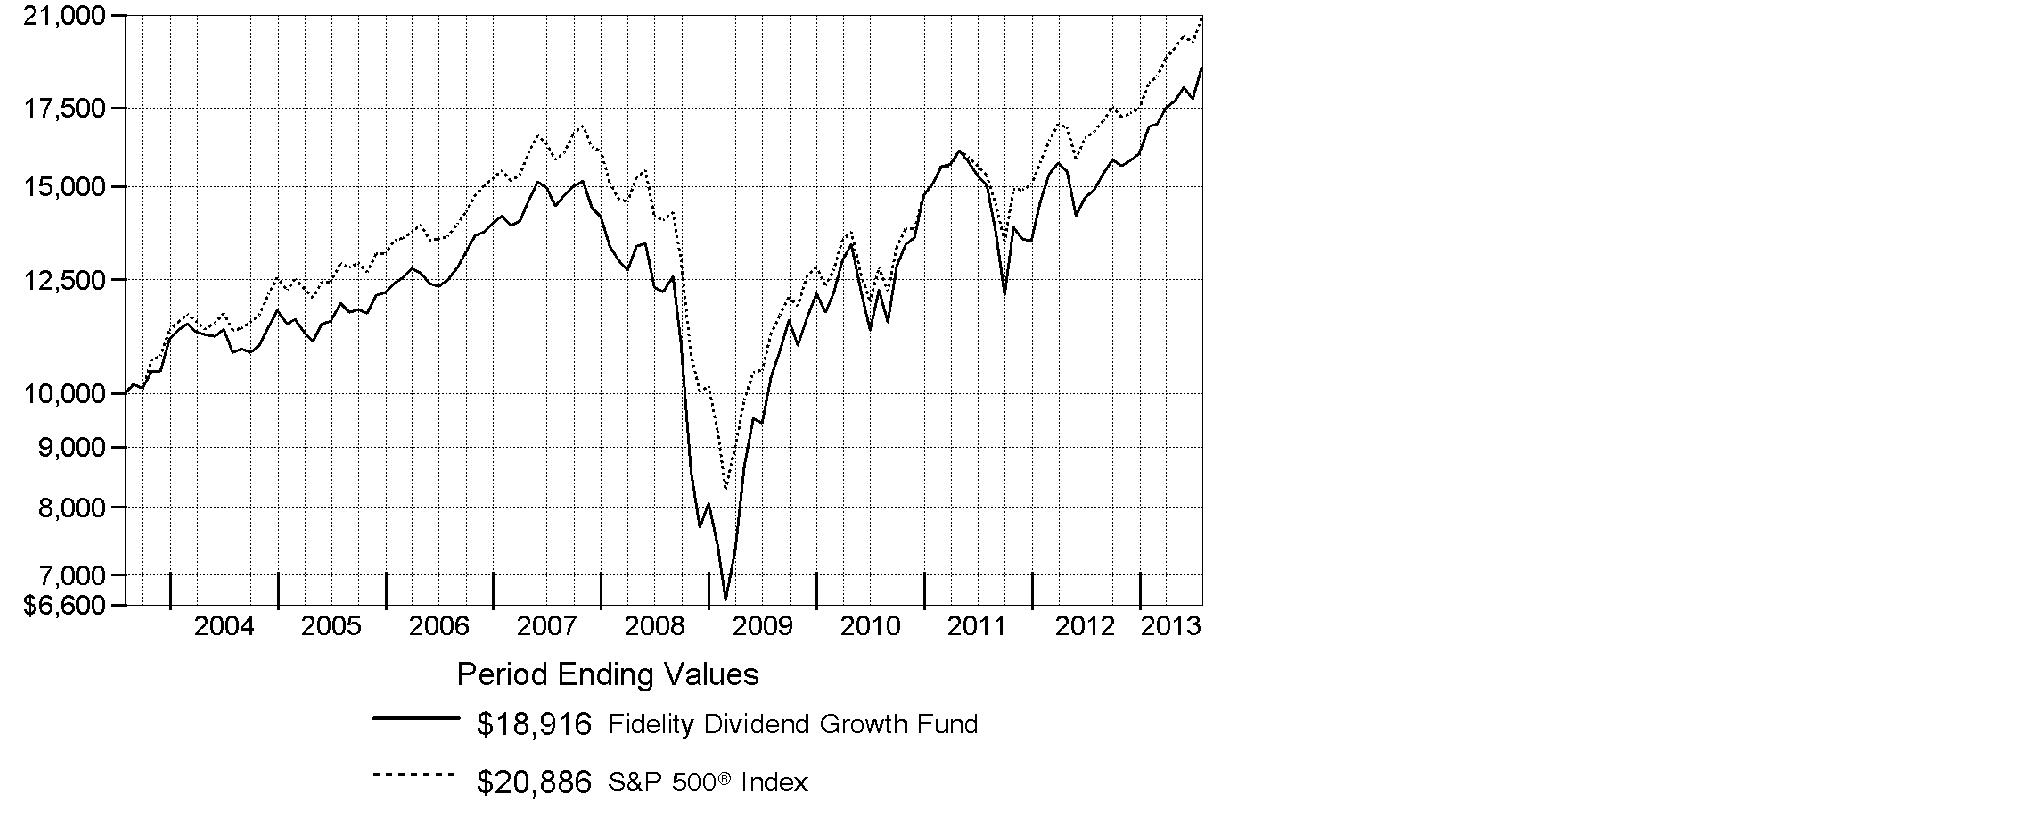
Annual Report
Market Recap: The bull run in U.S. stocks comfortably settled into a fifth year, as major equity benchmarks ripped through records during the 12 months ending July 31, 2013. Gains were fueled by a generally improving global economy and accommodative monetary policies worldwide. The tone was positive for most of the year, based largely on stronger U.S. economic data, including employment, housing and consumer sentiment. Setting a series of new highs along the way, the broad-based S&P 500® Index rose an impressive 25.00% for the 12 months, while the blue-chip-laden Dow Jones Industrial AverageSM also moved into record territory en route to a 22.36% gain. The growth-oriented Nasdaq Composite Index® had a similarly strong run, advancing 25.15%. During the year, markets were resilient amid intermittent volatility over debt woes in Europe, the 2012 U.S. presidential election and year-end Congressional gridlock over the federal budget. In mid-to-late June, concern arose about the U.S. Federal Reserve possibly tapering its sustaining bond-buying strategy - which prompted a brief, but steep, market sell-off. However, investors' continued quest for yield and the Fed's pledge to keep buying bonds until the economy showed significant improvement overpowered the uncertainty and helped equities climb notably higher in July to close the period on a strong note.
Comments from Lawrence Rakers, Portfolio Manager of Fidelity® Dividend Growth Fund: For the year, the fund's Retail Class shares returned 26.83%, topping the S&P 500®. When constructing the portfolio, I try to strike a balance between growth potential and income. For example, I avoided or significantly underweighted some lagging large-cap index stocks that had healthy dividend yields but, in my view, unexciting growth prospects, including telecommunication services carrier AT&T, energy major Exxon Mobil, information technology services provider IBM and personal computer chip manufacturer Intel, the four largest contributors to the fund's performance versus the index. Additionally, overweighting stocks in the mid-cap category worked in the fund's favor. Noteworthy individual contributors included non-index stakes in Green Mountain Coffee Roasters and Brookdale Senior Living. Conversely, the fund was hampered by weak picks in materials, where Ivanplats and Turquoise Hill Resources, both Canada-based metals miners, fared poorly, as did U.K.-headquartered gold miner Randgold Resources. Relatively light representation and unrewarding picks in diversified financials - in particular, underweighting strong-performing index component Bank of America - also worked against the fund's results. During the period, I significantly boosted the fund's allocation to this group.
The views expressed above reflect those of the portfolio manager(s) only through the end of the period as stated on the cover of this report and do not necessarily represent the views of Fidelity or any other person in the Fidelity organization. Any such views are subject to change at any time based upon market or other conditions and Fidelity disclaims any responsibility to update such views. These views may not be relied on as investment advice and, because investment decisions for a Fidelity fund are based on numerous factors, may not be relied on as an indication of trading intent on behalf of any Fidelity fund.
Annual Report
Shareholder Expense Example
As a shareholder of the Fund, you incur two types of costs: (1) transaction costs, and (2) ongoing costs, including management fees and other Fund expenses. This Example is intended to help you understand your ongoing costs (in dollars) of investing in the Fund and to compare these costs with the ongoing costs of investing in other mutual funds.
The Example is based on an investment of $1,000 invested at the beginning of the period and held for the entire period (February 1, 2013 to July 31, 2013).
Actual Expenses
The first line of the accompanying table for each class of the Fund provides information about actual account values and actual expenses. You may use the information in this line, together with the amount you invested, to estimate the expenses that you paid over the period. Simply divide your account value by $1,000.00 (for example, an $8,600 account value divided by $1,000.00 = 8.6), then multiply the result by the number in the first line for a class of the Fund under the heading entitled "Expenses Paid During Period" to estimate the expenses you paid on your account during this period. A small balance maintenance fee of $12.00 that is charged once a year may apply for certain accounts with a value of less than $2,000. This fee is not included in the table below. If it was, the estimate of expenses you paid during the period would be higher, and your ending account value lower, by this amount. In addition, the Fund, as a shareholder in the underlying Fidelity Central Funds, will indirectly bear its pro-rata share of the fees and expenses incurred by the underlying Fidelity Central Funds. These fees and expenses are not included in the Fund's annualized expense ratio used to calculate the expense estimate in the table below.
Hypothetical Example for Comparison Purposes
The second line of the accompanying table for each class of the Fund provides information about hypothetical account values and hypothetical expenses based on a Class' actual expense ratio and an assumed rate of return of 5% per year before expenses, which is not the Class' actual return. The hypothetical account values and expenses may not be used to estimate the actual ending account balance or expenses you paid for the period. You may use this information to compare the ongoing costs of investing in the Fund and other funds. To do so, compare this 5% hypothetical example with the 5% hypothetical examples that appear in the shareholder reports of the other funds. A small balance maintenance fee of $12.00 that is charged once a year may apply for certain accounts with a value of less than $2,000. This fee is not included in the table below. If it was, the estimate of expenses you paid during the period would be higher, and your ending account value lower, by this amount. In addition, the Fund, as a shareholder in the underlying Fidelity Central Funds, will indirectly bear its pro-rata share of the fees and expenses incurred by the underlying Fidelity Central Funds. These fees and expenses are not included in the Fund's annualized expense ratio used to calculate the expense estimate in the table below.
Please note that the expenses shown in the table are meant to highlight your ongoing costs only and do not reflect any transaction costs. Therefore, the second line of the table is useful in comparing ongoing costs only, and will not help you determine the relative total costs of owning different funds.
Annual Report
Shareholder Expense Example - continued
| Annualized Expense RatioB | Beginning
Account Value
February 1, 2013 | Ending
Account Value
July 31, 2013 | Expenses Paid
During Period*
February 1, 2013
to July 31, 2013 |
Dividend Growth | .58% | | | |
Actual | | $ 1,000.00 | $ 1,122.30 | $ 3.05 |
HypotheticalA | | $ 1,000.00 | $ 1,021.92 | $ 2.91 |
Class K | .44% | | | |
Actual | | $ 1,000.00 | $ 1,123.00 | $ 2.32 |
HypotheticalA | | $ 1,000.00 | $ 1,022.61 | $ 2.21 |
A 5% return per year before expenses
B Annualized expense ratio reflects expenses net of applicable fee waivers.
* Expenses are equal to each Class' annualized expense ratio, multiplied by the average account value over the period, multiplied by 181/365 (to reflect the one-half year period).
Annual Report
Investment Changes (Unaudited)
Top Ten Stocks as of July 31, 2013 |
| % of fund's
net assets | % of fund's net assets
6 months ago |
Apple, Inc. | 2.8 | 3.1 |
Wells Fargo & Co. | 1.7 | 1.7 |
General Electric Co. | 1.7 | 1.0 |
Citigroup, Inc. | 1.7 | 1.3 |
Google, Inc. Class A | 1.6 | 1.5 |
Procter & Gamble Co. | 1.4 | 1.2 |
JPMorgan Chase & Co. | 1.4 | 0.9 |
Bank of America Corp. | 1.3 | 0.0 |
Johnson & Johnson | 1.3 | 1.4 |
Philip Morris International, Inc. | 1.2 | 1.1 |
| 16.1 | |
Top Five Market Sectors as of July 31, 2013 |
| % of fund's
net assets | % of fund's net assets
6 months ago |
Information Technology | 16.8 | 18.5 |
Financials | 16.1 | 14.1 |
Health Care | 13.8 | 12.7 |
Consumer Discretionary | 12.9 | 12.3 |
Industrials | 12.5 | 12.6 |
Asset Allocation (% of fund's net assets) |
As of July 31, 2013* | As of January 31, 2013** |
 | Stocks 98.6% | | | Stocks 98.6% | |
 | Bonds 0.1% | | | Bonds 0.1% | |
 | Convertible
Securities 0.6% | | | Convertible
Securities 0.7% | |
 | Short-Term
Investments and
Net Other Assets (Liabilities) 0.7% | | | Short-Term
Investments and
Net Other Assets (Liabilities) 0.6% | |
* Foreign investments | 18.4% | | ** Foreign investments | 18.8% | |

Annual Report
Investments July 31, 2013
Showing Percentage of Net Assets
Common Stocks - 98.5% |
| Shares | | Value (000s) |
CONSUMER DISCRETIONARY - 12.8% |
Auto Components - 0.2% |
Delphi Automotive PLC | 278,506 | | $ 14,961 |
Johnson Controls, Inc. | 86,242 | | 3,468 |
| | 18,429 |
Automobiles - 0.7% |
Ford Motor Co. | 2,243,730 | | 37,874 |
Harley-Davidson, Inc. | 160,035 | | 9,085 |
Honda Motor Co. Ltd. | 249,600 | | 9,245 |
| | 56,204 |
Diversified Consumer Services - 0.7% |
Anhanguera Educacional Participacoes SA | 2,186,400 | | 13,254 |
H&R Block, Inc. | 1,184,428 | | 37,227 |
Kroton Educacional SA | 702,800 | | 10,012 |
| | 60,493 |
Hotels, Restaurants & Leisure - 1.6% |
Brinker International, Inc. | 818,163 | | 32,849 |
Icahn Enterprises LP rights (a) | 1,067,316 | | 0 |
Las Vegas Sands Corp. | 114,960 | | 6,388 |
Penn National Gaming, Inc. (a) | 21,600 | | 1,080 |
Starbucks Corp. | 388,344 | | 27,666 |
Texas Roadhouse, Inc. Class A | 543,764 | | 13,290 |
Wyndham Worldwide Corp. | 285,533 | | 17,789 |
Yum! Brands, Inc. | 426,150 | | 31,075 |
| | 130,137 |
Household Durables - 0.4% |
Harman International Industries, Inc. | 19,800 | | 1,198 |
Taylor Wimpey PLC | 5,248,749 | | 8,504 |
Toll Brothers, Inc. (a) | 226,805 | | 7,455 |
Whirlpool Corp. | 111,778 | | 14,972 |
| | 32,129 |
Leisure Equipment & Products - 0.4% |
Amer Group PLC (A Shares) | 333,861 | | 6,631 |
Brunswick Corp. | 175,321 | | 6,618 |
Polaris Industries, Inc. | 138,104 | | 15,487 |
| | 28,736 |
Media - 4.3% |
CBS Corp. Class B | 1,015,907 | | 53,681 |
Comcast Corp. Class A | 1,803,406 | | 81,298 |
Ipsos SA | 115,900 | | 4,121 |
MDC Partners, Inc. Class A (sub. vtg.) | 998,439 | | 24,572 |
Common Stocks - continued |
| Shares | | Value (000s) |
CONSUMER DISCRETIONARY - continued |
Media - continued |
Mood Media Corp. (a)(h)(i) | 888,800 | | $ 935 |
Omnicom Group, Inc. | 246,226 | | 15,825 |
Pico Far East Holdings Ltd. | 628,000 | | 219 |
Smiles SA | 883,300 | | 10,841 |
The Walt Disney Co. | 659,229 | | 42,619 |
Time Warner, Inc. | 514,307 | | 32,021 |
Twenty-First Century Fox, Inc. Class A | 1,137,693 | | 33,994 |
Valassis Communications, Inc. | 152,155 | | 4,356 |
Viacom, Inc. Class B (non-vtg.) | 648,423 | | 47,186 |
| | 351,668 |
Multiline Retail - 0.0% |
The Bon-Ton Stores, Inc. | 187,100 | | 3,529 |
Specialty Retail - 3.7% |
American Eagle Outfitters, Inc. | 865,752 | | 17,003 |
Ascena Retail Group, Inc. (a) | 238,728 | | 4,557 |
Body Central Corp. (a) | 573,065 | | 6,911 |
Express, Inc. (a) | 568,801 | | 12,826 |
Foot Locker, Inc. | 231,743 | | 8,373 |
Francescas Holdings Corp. (a) | 162,375 | | 4,037 |
GNC Holdings, Inc. | 206,500 | | 10,899 |
Home Depot, Inc. | 971,864 | | 76,806 |
Kingfisher PLC | 1,621,400 | | 9,805 |
L Brands, Inc. | 303,218 | | 16,910 |
Lowe's Companies, Inc. | 1,062,808 | | 47,380 |
OfficeMax, Inc. | 863,181 | | 9,832 |
Rent-A-Center, Inc. | 625,257 | | 25,004 |
Ross Stores, Inc. | 165,491 | | 11,166 |
Staples, Inc. | 1,184,806 | | 20,165 |
TJX Companies, Inc. | 510,970 | | 26,591 |
| | 308,265 |
Textiles, Apparel & Luxury Goods - 0.8% |
Coach, Inc. | 143,694 | | 7,634 |
Kering SA (e) | 62,904 | | 14,402 |
Kering SA rights 10/1/13 (a) | 61,204 | | 170 |
NIKE, Inc. Class B | 392,168 | | 24,675 |
Common Stocks - continued |
| Shares | | Value (000s) |
CONSUMER DISCRETIONARY - continued |
Textiles, Apparel & Luxury Goods - continued |
PVH Corp. | 45,275 | | $ 5,967 |
VF Corp. | 62,531 | | 12,319 |
| | 65,167 |
TOTAL CONSUMER DISCRETIONARY | | 1,054,757 |
CONSUMER STAPLES - 10.4% |
Beverages - 2.6% |
Anheuser-Busch InBev SA NV | 266,200 | | 25,598 |
Beam, Inc. | 97,074 | | 6,309 |
Coca-Cola Enterprises, Inc. | 211,920 | | 7,955 |
Cott Corp. | 1,102,100 | | 9,217 |
Dr. Pepper Snapple Group, Inc. | 641,778 | | 29,997 |
Molson Coors Brewing Co. Class B | 93,400 | | 4,676 |
Monster Beverage Corp. (a) | 418,325 | | 25,514 |
Remy Cointreau SA | 38,000 | | 3,934 |
SABMiller PLC | 219,800 | | 10,768 |
The Coca-Cola Co. | 2,235,502 | | 89,599 |
| | 213,567 |
Food & Staples Retailing - 1.8% |
CVS Caremark Corp. | 958,037 | | 58,910 |
Kroger Co. | 749,620 | | 29,438 |
Rami Levi Chain Stores Hashikma Marketing 2006 Ltd. | 177,460 | | 9,162 |
Wal-Mart Stores, Inc. | 117,374 | | 9,148 |
Walgreen Co. | 878,558 | | 44,148 |
| | 150,806 |
Food Products - 1.9% |
Amira Nature Foods Ltd. | 586,439 | | 4,750 |
Archer Daniels Midland Co. | 513,395 | | 18,724 |
Bunge Ltd. | 172,367 | | 13,102 |
Danone SA | 15,972 | | 1,262 |
Green Mountain Coffee Roasters, Inc. (a) | 256,810 | | 19,821 |
Hilton Food Group PLC | 665,674 | | 4,122 |
Ingredion, Inc. | 204,752 | | 13,759 |
Kellogg Co. | 348,785 | | 23,104 |
Marine Harvest ASA | 9,142,378 | | 9,216 |
Mead Johnson Nutrition Co. Class A | 147,044 | | 10,711 |
Mondelez International, Inc. | 1,224,744 | | 38,298 |
| | 156,869 |
Common Stocks - continued |
| Shares | | Value (000s) |
CONSUMER STAPLES - continued |
Household Products - 2.1% |
Energizer Holdings, Inc. | 288,229 | | $ 29,342 |
Procter & Gamble Co. | 1,488,053 | | 119,491 |
Svenska Cellulosa AB (SCA) (B Shares) | 650,480 | | 17,215 |
Unicharm Corp. (e) | 78,800 | | 4,201 |
| | 170,249 |
Personal Products - 0.2% |
Hengan International Group Co. Ltd. | 652,500 | | 7,168 |
Herbalife Ltd. | 199,300 | | 13,054 |
| | 20,222 |
Tobacco - 1.8% |
Altria Group, Inc. | 18,671 | | 655 |
British American Tobacco PLC (United Kingdom) | 311,900 | | 16,639 |
Japan Tobacco, Inc. | 1,022,600 | | 35,772 |
Philip Morris International, Inc. | 1,099,053 | | 98,014 |
| | 151,080 |
TOTAL CONSUMER STAPLES | | 862,793 |
ENERGY - 10.1% |
Energy Equipment & Services - 3.5% |
BW Offshore Ltd. | 8,762,498 | | 11,569 |
Cameron International Corp. (a) | 664,989 | | 39,434 |
Ensco PLC Class A | 766,567 | | 43,955 |
Essential Energy Services Ltd. | 3,613,600 | | 9,147 |
Halliburton Co. | 732,459 | | 33,100 |
National Oilwell Varco, Inc. | 732,461 | | 51,397 |
Noble Corp. | 397,823 | | 15,197 |
Schlumberger Ltd. | 645,410 | | 52,491 |
ShawCor Ltd. | 86,200 | | 3,873 |
Vantage Drilling Co. (a) | 7,095,626 | | 13,056 |
Xtreme Drilling & Coil Services Corp. (a) | 3,438,460 | | 12,387 |
Xtreme Drilling & Coil Services Corp. (g) | 1,117,800 | | 4,027 |
| | 289,633 |
Oil, Gas & Consumable Fuels - 6.6% |
Access Midstream Partners LP | 293,561 | | 13,789 |
Americas Petrogas, Inc. (a) | 1,310,800 | | 1,493 |
Americas Petrogas, Inc. (a)(g) | 2,665,500 | | 3,036 |
Anadarko Petroleum Corp. | 394,725 | | 34,941 |
Apache Corp. | 211,420 | | 16,966 |
Common Stocks - continued |
| Shares | | Value (000s) |
ENERGY - continued |
Oil, Gas & Consumable Fuels - continued |
Atlas Energy LP | 79,534 | | $ 4,196 |
Atlas Pipeline Partners LP | 387,221 | | 14,676 |
BPZ Energy, Inc. (a)(e) | 2,730,178 | | 6,580 |
Cabot Oil & Gas Corp. | 129,000 | | 9,781 |
Cimarex Energy Co. | 116,689 | | 8,919 |
Coal India Ltd. | 139,162 | | 644 |
Cobalt International Energy, Inc. (a) | 709,915 | | 20,481 |
Concho Resources, Inc. (a) | 169,074 | | 15,164 |
ConocoPhillips | 222,758 | | 14,448 |
Crown Point Energy, Inc. (g)(h) | 1,619,916 | | 339 |
Double Eagle Petroleum Co. (a)(f) | 873,975 | | 3,050 |
Emerald Oil, Inc. warrants 2/4/16 (a) | 171,198 | | 0 |
Energen Corp. | 381,758 | | 22,863 |
EOG Resources, Inc. | 92,979 | | 13,528 |
EQT Corp. | 228,450 | | 19,761 |
Halcon Resources Corp. (a) | 910,000 | | 4,987 |
InterOil Corp. (a)(e) | 334,378 | | 28,656 |
Magellan Midstream Partners LP | 89,822 | | 4,911 |
Marathon Oil Corp. | 287,629 | | 10,458 |
Marathon Petroleum Corp. | 124,536 | | 9,132 |
Markwest Energy Partners LP | 376,828 | | 26,457 |
Motor Oil (HELLAS) Corinth Refineries SA | 21,700 | | 220 |
Noble Energy, Inc. | 150,500 | | 9,405 |
Northern Oil & Gas, Inc. (a) | 2,218,140 | | 29,302 |
Occidental Petroleum Corp. | 567,023 | | 50,493 |
Painted Pony Petroleum Ltd. (g) | 456,400 | | 3,310 |
Painted Pony Petroleum Ltd. Class A (a) | 186,700 | | 1,354 |
Peabody Energy Corp. | 1,030,489 | | 17,065 |
Phillips 66 | 310,168 | | 19,075 |
Phillips 66 Partners LP | 157,095 | | 5,085 |
Royal Dutch Shell PLC Class A sponsored ADR | 200,098 | | 13,677 |
Scorpio Tankers, Inc. | 495,100 | | 4,926 |
Southcross Energy Partners LP | 527,828 | | 12,024 |
Suncor Energy, Inc. | 337,900 | | 10,679 |
Synergy Resources Corp. (a) | 598,600 | | 4,639 |
TAG Oil Ltd. (a)(e)(f) | 3,585,500 | | 13,370 |
TAG Oil Ltd. (f)(g) | 146,900 | | 548 |
Common Stocks - continued |
| Shares | | Value (000s) |
ENERGY - continued |
Oil, Gas & Consumable Fuels - continued |
The Williams Companies, Inc. | 1,097,738 | | $ 37,510 |
Valero Energy Corp. | 104,849 | | 3,750 |
| | 545,688 |
TOTAL ENERGY | | 835,321 |
FINANCIALS - 16.0% |
Capital Markets - 2.3% |
AllianceBernstein Holding LP | 709,485 | | 15,751 |
Ameriprise Financial, Inc. | 100,653 | | 8,958 |
BlackRock, Inc. Class A | 79,032 | | 22,284 |
GP Investments Ltd. Class A (depositary receipt) (a) | 3,540,079 | | 5,741 |
Invesco Ltd. | 588,479 | | 18,943 |
KKR & Co. LP | 601,705 | | 12,305 |
Monex Group, Inc. | 35,129 | | 14,208 |
Morgan Stanley | 801,899 | | 21,820 |
Oaktree Capital Group LLC Class A | 279,974 | | 15,116 |
The Blackstone Group LP | 468,715 | | 10,570 |
UBS AG (NY Shares) | 2,348,179 | | 46,189 |
| | 191,885 |
Commercial Banks - 3.3% |
Bank of Ireland (a) | 124,509 | | 28 |
Barclays PLC sponsored ADR | 1,652,893 | | 28,893 |
Commerce Bancshares, Inc. | 186,332 | | 8,502 |
Guaranty Trust Bank PLC GDR (Reg. S) | 318,323 | | 2,521 |
Huntington Bancshares, Inc. | 125,890 | | 1,076 |
Itau Unibanco Holding SA sponsored ADR | 485,257 | | 6,187 |
M&T Bank Corp. | 68,449 | | 7,999 |
Nordea Bank AB | 827,600 | | 10,481 |
PNC Financial Services Group, Inc. | 305,803 | | 23,256 |
Sberbank (Savings Bank of the Russian Federation) sponsored ADR | 390,100 | | 4,521 |
U.S. Bancorp | 1,010,715 | | 37,720 |
Wells Fargo & Co. | 3,280,127 | | 142,686 |
| | 273,870 |
Consumer Finance - 0.8% |
Capital One Financial Corp. | 712,667 | | 49,188 |
SLM Corp. | 734,300 | | 18,145 |
| | 67,333 |
Common Stocks - continued |
| Shares | | Value (000s) |
FINANCIALS - continued |
Diversified Financial Services - 5.2% |
Bank of America Corp. | 7,427,827 | | $ 108,446 |
Citigroup, Inc. | 2,571,171 | | 134,061 |
IntercontinentalExchange, Inc. (a) | 7,900 | | 1,441 |
JPMorgan Chase & Co. | 2,083,059 | | 116,089 |
McGraw-Hill Companies, Inc. | 520,386 | | 32,191 |
ORIX Corp. | 659,800 | | 9,805 |
PICO Holdings, Inc. (a)(f) | 1,210,990 | | 26,509 |
| | 428,542 |
Insurance - 2.5% |
ACE Ltd. | 185,252 | | 16,928 |
AFLAC, Inc. | 268,881 | | 16,585 |
Allied World Assurance Co. Holdings Ltd. | 87,329 | | 8,266 |
Arthur J. Gallagher & Co. | 154,592 | | 6,861 |
Assured Guaranty Ltd. | 1,773,784 | | 38,385 |
Axis Capital Holdings Ltd. | 98,029 | | 4,270 |
Everest Re Group Ltd. | 68,392 | | 9,132 |
Fidelity National Financial, Inc. Class A | 947,797 | | 23,202 |
Marsh & McLennan Companies, Inc. | 237,339 | | 9,937 |
MetLife, Inc. | 626,123 | | 30,317 |
ProAssurance Corp. | 19,533 | | 1,046 |
Prudential Financial, Inc. | 254,116 | | 20,068 |
Prudential PLC | 236,985 | | 4,209 |
The Travelers Companies, Inc. | 205,096 | | 17,136 |
| | 206,342 |
Real Estate Investment Trusts - 1.4% |
American Tower Corp. | 200,983 | | 14,228 |
Beni Stabili SpA SIIQ | 14,096,400 | | 9,140 |
CBL & Associates Properties, Inc. | 485,556 | | 11,056 |
Corrections Corp. of America | 125,668 | | 4,153 |
Cousins Properties, Inc. | 1,138,286 | | 11,667 |
Education Realty Trust, Inc. | 912,700 | | 8,607 |
Lexington Corporate Properties Trust | 632,940 | | 7,937 |
Parkway Properties, Inc. | 212,700 | | 3,722 |
Piedmont Office Realty Trust, Inc. Class A | 239,000 | | 4,324 |
Prologis, Inc. | 232,493 | | 8,918 |
Retail Properties America, Inc. | 125,705 | | 1,771 |
Simon Property Group, Inc. | 33,821 | | 5,413 |
SL Green Realty Corp. | 48,956 | | 4,438 |
Common Stocks - continued |
| Shares | | Value (000s) |
FINANCIALS - continued |
Real Estate Investment Trusts - continued |
Westfield Group unit | 720,383 | | $ 7,265 |
Weyerhaeuser Co. | 572,558 | | 16,261 |
| | 118,900 |
Real Estate Management & Development - 0.4% |
CBRE Group, Inc. (a) | 1,079,469 | | 25,011 |
CSI Properties Ltd. | 92,130,000 | | 3,801 |
Jones Lang LaSalle, Inc. | 14,344 | | 1,306 |
LEG Immobilien AG | 36,192 | | 1,820 |
| | 31,938 |
Thrifts & Mortgage Finance - 0.1% |
Radian Group, Inc. | 444,600 | | 6,247 |
TOTAL FINANCIALS | | 1,325,057 |
HEALTH CARE - 13.6% |
Biotechnology - 3.2% |
Agios Pharmaceuticals, Inc. | 115,200 | | 3,359 |
Alexion Pharmaceuticals, Inc. (a) | 85,800 | | 9,973 |
Alnylam Pharmaceuticals, Inc. (a) | 534,300 | | 24,669 |
Amgen, Inc. | 540,309 | | 58,510 |
Biogen Idec, Inc. (a) | 126,581 | | 27,611 |
Bluebird Bio, Inc. | 100,701 | | 3,135 |
Gilead Sciences, Inc. (a) | 1,059,863 | | 65,129 |
Grifols SA ADR | 568,297 | | 18,038 |
Infinity Pharmaceuticals, Inc. (a) | 674,412 | | 14,284 |
Insmed, Inc. (a) | 118,712 | | 1,319 |
Isis Pharmaceuticals, Inc. (a) | 331,000 | | 9,549 |
KaloBios Pharmaceuticals, Inc. | 150,700 | | 907 |
KaloBios Pharmaceuticals, Inc. (g) | 454,437 | | 2,736 |
Merrimack Pharmaceuticals, Inc. (a) | 391,800 | | 1,873 |
Theravance, Inc. (a) | 675,004 | | 26,028 |
| | 267,120 |
Health Care Equipment & Supplies - 1.3% |
Ansell Ltd. | 216,050 | | 3,600 |
Baxter International, Inc. | 301,517 | | 22,023 |
Boston Scientific Corp. (a) | 1,494,058 | | 16,315 |
Covidien PLC | 222,784 | | 13,730 |
Genmark Diagnostics, Inc. (a) | 807,700 | | 7,673 |
Hill-Rom Holdings, Inc. | 276,883 | | 10,264 |
Medtronic, Inc. | 14,400 | | 795 |
Common Stocks - continued |
| Shares | | Value (000s) |
HEALTH CARE - continued |
Health Care Equipment & Supplies - continued |
Stryker Corp. | 381,077 | | $ 26,851 |
Zimmer Holdings, Inc. | 109,658 | | 9,154 |
| | 110,405 |
Health Care Providers & Services - 3.2% |
Accretive Health, Inc. (a) | 518,455 | | 5,174 |
AmerisourceBergen Corp. | 418,087 | | 24,362 |
AmSurg Corp. (a) | 212,753 | | 8,321 |
BioScrip, Inc. (a) | 160,910 | | 2,615 |
Brookdale Senior Living, Inc. (a) | 1,618,439 | | 47,129 |
Catamaran Corp. (a) | 79,000 | | 4,161 |
DaVita, Inc. (a) | 126,075 | | 14,676 |
Emeritus Corp. (a) | 603,933 | | 14,005 |
Express Scripts Holding Co. (a) | 630,457 | | 41,326 |
McKesson Corp. | 214,640 | | 26,328 |
Qualicorp SA (a) | 897,300 | | 6,568 |
Quest Diagnostics, Inc. | 280,310 | | 16,345 |
UnitedHealth Group, Inc. | 702,175 | | 51,153 |
| | 262,163 |
Life Sciences Tools & Services - 0.2% |
Agilent Technologies, Inc. | 193,889 | | 8,673 |
Lonza Group AG | 97,821 | | 7,526 |
| | 16,199 |
Pharmaceuticals - 5.7% |
AbbVie, Inc. | 974,540 | | 44,322 |
Actavis, Inc. (a) | 168,673 | | 22,648 |
Allergan, Inc. | 42,000 | | 3,827 |
Biodelivery Sciences International, Inc. (a) | 1,210,638 | | 5,230 |
Bristol-Myers Squibb Co. | 28,719 | | 1,242 |
Cadence Pharmaceuticals, Inc. (a) | 2,091,940 | | 15,627 |
Dechra Pharmaceuticals PLC | 369,717 | | 3,841 |
Endo Health Solutions, Inc. (a) | 290,674 | | 11,179 |
GlaxoSmithKline PLC | 801,023 | | 20,493 |
Horizon Pharma, Inc. (a)(e) | 3,209,598 | | 8,088 |
Horizon Pharma, Inc.: | | | |
warrants 2/28/17 (a) | 253,903 | | 0 * |
warrants 9/25/17 (a) | 932,200 | | 1 |
Jazz Pharmaceuticals PLC (a) | 16,097 | | 1,215 |
Johnson & Johnson | 1,132,316 | | 105,872 |
Merck & Co., Inc. | 1,336,814 | | 64,394 |
Common Stocks - continued |
| Shares | | Value (000s) |
HEALTH CARE - continued |
Pharmaceuticals - continued |
Novo Nordisk A/S Series B | 116,837 | | $ 19,823 |
Perrigo Co. | 34,500 | | 4,291 |
Pfizer, Inc. | 1,494,239 | | 43,677 |
Sanofi SA | 395,924 | | 41,447 |
Teva Pharmaceutical Industries Ltd. sponsored ADR | 326,750 | | 12,972 |
Valeant Pharmaceuticals International, Inc. (Canada) (a) | 201,991 | | 18,742 |
Warner Chilcott PLC | 882,450 | | 18,805 |
| | 467,736 |
TOTAL HEALTH CARE | | 1,123,623 |
INDUSTRIALS - 12.5% |
Aerospace & Defense - 2.0% |
Astronics Corp. (a) | 43,200 | | 1,707 |
Finmeccanica SpA (a)(e) | 939,566 | | 4,910 |
General Dynamics Corp. | 107,917 | | 9,210 |
Honeywell International, Inc. | 504,471 | | 41,861 |
Meggitt PLC | 1,904,110 | | 15,859 |
Textron, Inc. | 455,952 | | 12,484 |
The Boeing Co. | 79,000 | | 8,303 |
United Technologies Corp. | 664,926 | | 70,196 |
| | 164,530 |
Air Freight & Logistics - 0.4% |
United Parcel Service, Inc. Class B | 400,710 | | 34,782 |
Airlines - 0.1% |
Copa Holdings SA Class A | 18,033 | | 2,510 |
easyJet PLC | 123,200 | | 2,646 |
| | 5,156 |
Building Products - 0.6% |
A.O. Smith Corp. | 158,012 | | 6,529 |
Masco Corp. | 1,911,369 | | 39,221 |
| | 45,750 |
Commercial Services & Supplies - 0.6% |
Iron Mountain, Inc. | 395,171 | | 10,986 |
KAR Auction Services, Inc. | 21,500 | | 547 |
Multiplus SA | 839,400 | | 11,358 |
Republic Services, Inc. | 405,917 | | 13,765 |
Swisher Hygiene, Inc. (a) | 2,081,064 | | 1,675 |
Common Stocks - continued |
| Shares | | Value (000s) |
INDUSTRIALS - continued |
Commercial Services & Supplies - continued |
Waste Management, Inc. | 259,086 | | $ 10,889 |
West Corp. | 174,000 | | 3,821 |
| | 53,041 |
Construction & Engineering - 0.3% |
Boart Longyear Ltd. | 3,560,729 | | 1,648 |
Fluor Corp. | 104,872 | | 6,561 |
MasTec, Inc. (a) | 112,139 | | 3,701 |
URS Corp. | 226,724 | | 10,543 |
| | 22,453 |
Electrical Equipment - 1.9% |
Alstom SA | 361,384 | | 12,221 |
AMETEK, Inc. | 256,842 | | 11,887 |
Bharat Heavy Electricals Ltd. | 1,340,049 | | 3,486 |
Eaton Corp. PLC | 289,245 | | 19,943 |
Emerson Electric Co. | 423,816 | | 26,010 |
Generac Holdings, Inc. | 458,494 | | 19,876 |
Hubbell, Inc. Class B | 118,067 | | 12,674 |
Polypore International, Inc. (a) | 201,347 | | 8,455 |
Prysmian SpA | 675,700 | | 13,735 |
Regal-Beloit Corp. | 228,766 | | 14,797 |
Roper Industries, Inc. | 105,858 | | 13,334 |
| | 156,418 |
Industrial Conglomerates - 2.0% |
3M Co. | 46,800 | | 5,496 |
Alliance Global Group, Inc. | 395,500 | | 239 |
Carlisle Companies, Inc. | 124,000 | | 8,400 |
General Electric Co. | 5,759,075 | | 140,349 |
Koninklijke Philips Electronics NV | 443,500 | | 14,183 |
| | 168,667 |
Machinery - 2.3% |
Andritz AG | 82,700 | | 4,461 |
Cummins, Inc. | 167,984 | | 20,358 |
Dover Corp. | 53,195 | | 4,556 |
GEA Group AG | 158,184 | | 6,527 |
Global Brass & Copper Holdings, Inc. | 389,900 | | 7,264 |
Harsco Corp. | 403,763 | | 10,401 |
Illinois Tool Works, Inc. | 234,465 | | 16,891 |
Ingersoll-Rand PLC | 521,961 | | 31,866 |
Manitowoc Co., Inc. | 1,221,919 | | 25,086 |
Common Stocks - continued |
| Shares | | Value (000s) |
INDUSTRIALS - continued |
Machinery - continued |
Pentair Ltd. | 319,562 | | $ 19,519 |
Stanley Black & Decker, Inc. | 384,996 | | 32,578 |
Timken Co. | 154,683 | | 9,037 |
Weg SA | 269,600 | | 3,309 |
| | 191,853 |
Marine - 0.1% |
Ardmore Shipping Corp. | 502,600 | | 7,036 |
Ultrapetrol (Bahamas) Ltd. (a) | 1,822,163 | | 5,594 |
| | 12,630 |
Professional Services - 0.7% |
CRA International, Inc. (a) | 303,982 | | 5,818 |
Dun & Bradstreet Corp. | 323,101 | | 33,483 |
Manpower, Inc. | 79,700 | | 5,330 |
Michael Page International PLC | 1,354,386 | | 9,200 |
Randstad Holding NV | 75,000 | | 3,618 |
Towers Watson & Co. | 25,200 | | 2,123 |
| | 59,572 |
Road & Rail - 1.2% |
Con-way, Inc. | 208,596 | | 8,646 |
CSX Corp. | 675,822 | | 16,767 |
Norfolk Southern Corp. | 174,220 | | 12,746 |
Union Pacific Corp. | 379,565 | | 60,195 |
| | 98,354 |
Trading Companies & Distributors - 0.3% |
Houston Wire & Cable Co. | 624,888 | | 9,267 |
Watsco, Inc. | 135,225 | | 12,623 |
| | 21,890 |
TOTAL INDUSTRIALS | | 1,035,096 |
INFORMATION TECHNOLOGY - 16.6% |
Communications Equipment - 1.9% |
Cisco Systems, Inc. | 3,661,647 | | 93,555 |
QUALCOMM, Inc. | 987,140 | | 63,720 |
| | 157,275 |
Computers & Peripherals - 3.2% |
Apple, Inc. | 515,180 | | 233,117 |
Common Stocks - continued |
| Shares | | Value (000s) |
INFORMATION TECHNOLOGY - continued |
Computers & Peripherals - continued |
NCR Corp. (a) | 364,477 | | $ 13,121 |
Western Digital Corp. | 242,588 | | 15,618 |
| | 261,856 |
Electronic Equipment & Components - 0.6% |
Corning, Inc. | 872,662 | | 13,256 |
Jabil Circuit, Inc. | 497,524 | | 11,438 |
TE Connectivity Ltd. | 459,696 | | 23,463 |
| | 48,157 |
Internet Software & Services - 2.2% |
Active Network, Inc. (a) | 1,074,299 | | 9,164 |
Demandware, Inc. (a) | 145,490 | | 6,463 |
Facebook, Inc. Class A (a) | 111,300 | | 4,099 |
Google, Inc. Class A (a) | 148,993 | | 132,246 |
Mail.Ru Group Ltd.: | | | |
GDR (g) | 16,600 | | 530 |
GDR (Reg. S) | 264,700 | | 8,457 |
Velti PLC (a)(e) | 3,152,629 | | 3,562 |
Velti PLC (i) | 1,639,166 | | 1,667 |
Yahoo!, Inc. (a) | 564,025 | | 15,843 |
| | 182,031 |
IT Services - 3.1% |
Accenture PLC Class A | 413,393 | | 30,513 |
Amdocs Ltd. | 279,154 | | 10,739 |
Cognizant Technology Solutions Corp. Class A (a) | 312,144 | | 22,596 |
EPAM Systems, Inc. (a) | 518,505 | | 15,011 |
EVERTEC, Inc. | 148,674 | | 3,553 |
ExlService Holdings, Inc. (a) | 294,059 | | 8,234 |
Fidelity National Information Services, Inc. | 491,135 | | 21,197 |
MasterCard, Inc. Class A | 55,823 | | 34,086 |
Sapient Corp. (a) | 1,016,603 | | 13,938 |
Total System Services, Inc. | 492,029 | | 13,487 |
Virtusa Corp. (a) | 66,454 | | 1,713 |
Visa, Inc. Class A | 453,628 | | 80,297 |
| | 255,364 |
Office Electronics - 0.3% |
Xerox Corp. | 2,852,181 | | 27,666 |
Semiconductors & Semiconductor Equipment - 2.2% |
Altera Corp. | 179,517 | | 6,384 |
Applied Materials, Inc. | 265,975 | | 4,338 |
Common Stocks - continued |
| Shares | | Value (000s) |
INFORMATION TECHNOLOGY - continued |
Semiconductors & Semiconductor Equipment - continued |
Applied Micro Circuits Corp. (a) | 308,235 | | $ 3,659 |
ASML Holding NV | 549,636 | | 49,412 |
Avago Technologies Ltd. | 600,169 | | 22,014 |
Broadcom Corp. Class A | 211,151 | | 5,821 |
Freescale Semiconductor Holdings I Ltd. (a)(e) | 384,133 | | 6,031 |
LTX-Credence Corp. (a) | 1,375,632 | | 7,373 |
Maxim Integrated Products, Inc. | 362,194 | | 10,359 |
Microchip Technology, Inc. (e) | 53,935 | | 2,143 |
Micron Technology, Inc. (a) | 1,061,096 | | 14,060 |
Monolithic Power Systems, Inc. | 168,606 | | 4,414 |
NXP Semiconductors NV (a) | 390,903 | | 12,763 |
Samsung Electronics Co. Ltd. | 13,300 | | 15,150 |
Skyworks Solutions, Inc. (a) | 956,399 | | 22,973 |
SunPower Corp. (a)(e) | 14,400 | | 398 |
| | 187,292 |
Software - 3.1% |
Activision Blizzard, Inc. | 1,643,717 | | 29,554 |
Adobe Systems, Inc. (a) | 147,067 | | 6,953 |
Autodesk, Inc. (a) | 132,000 | | 4,671 |
Check Point Software Technologies Ltd. (a) | 180,237 | | 10,149 |
Citrix Systems, Inc. (a) | 325,711 | | 23,458 |
Comverse, Inc. | 290,251 | | 9,091 |
Constellation Software, Inc. | 60,700 | | 8,856 |
Electronic Arts, Inc. (a) | 838,686 | | 21,906 |
Intuit, Inc. | 118,428 | | 7,570 |
MICROS Systems, Inc. (a) | 147,660 | | 7,195 |
Microsoft Corp. | 1,950,293 | | 62,078 |
Oracle Corp. | 1,619,223 | | 52,382 |
SS&C Technologies Holdings, Inc. (a) | 31,664 | | 1,133 |
Symantec Corp. | 361,533 | | 9,646 |
| | 254,642 |
TOTAL INFORMATION TECHNOLOGY | | 1,374,283 |
MATERIALS - 3.5% |
Chemicals - 1.8% |
Albemarle Corp. | 123,566 | | 7,662 |
Ashland, Inc. | 140,606 | | 12,210 |
Axiall Corp. | 198,880 | | 8,767 |
Cabot Corp. | 276,992 | | 11,362 |
Common Stocks - continued |
| Shares | | Value (000s) |
MATERIALS - continued |
Chemicals - continued |
Croda International PLC | 18,000 | | $ 687 |
Eastman Chemical Co. | 208,697 | | 16,785 |
FMC Corp. | 7,200 | | 476 |
LyondellBasell Industries NV Class A | 306,016 | | 21,026 |
Monsanto Co. | 326,312 | | 32,233 |
Potash Corp. of Saskatchewan, Inc. | 10,800 | | 313 |
PPG Industries, Inc. | 107,693 | | 17,278 |
Royal DSM NV | 19,800 | | 1,391 |
RPM International, Inc. | 409,045 | | 14,415 |
W.R. Grace & Co. (a) | 39,825 | | 3,059 |
| | 147,664 |
Construction Materials - 0.2% |
Lafarge SA (Bearer) (e) | 100,900 | | 6,452 |
Vulcan Materials Co. | 284,130 | | 13,405 |
| | 19,857 |
Containers & Packaging - 0.3% |
Nampak Ltd. | 2,559,600 | | 8,276 |
Rock-Tenn Co. Class A | 131,957 | | 15,089 |
| | 23,365 |
Metals & Mining - 1.0% |
Commercial Metals Co. | 290,896 | | 4,506 |
Freeport-McMoRan Copper & Gold, Inc. | 467,995 | | 13,235 |
Goldcorp, Inc. | 643,100 | | 18,139 |
Ivanplats Ltd. (g) | 7,025,028 | | 9,918 |
Randgold Resources Ltd. sponsored ADR | 225,856 | | 16,774 |
Turquoise Hill Resources Ltd. (a) | 3,201,536 | | 12,811 |
Walter Energy, Inc. (e) | 384,400 | | 4,301 |
| | 79,684 |
Paper & Forest Products - 0.2% |
Boise Cascade Co. | 152,400 | | 4,033 |
International Paper Co. | 321,858 | | 15,549 |
| | 19,582 |
TOTAL MATERIALS | | 290,152 |
Common Stocks - continued |
| Shares | | Value (000s) |
TELECOMMUNICATION SERVICES - 1.0% |
Diversified Telecommunication Services - 0.3% |
CenturyLink, Inc. | 488,772 | | $ 17,522 |
Verizon Communications, Inc. | 144,058 | | 7,128 |
| | 24,650 |
Wireless Telecommunication Services - 0.7% |
Megafon OJSC GDR | 166,500 | | 5,286 |
Mobile TeleSystems OJSC sponsored ADR (e) | 449,582 | | 8,762 |
SBA Communications Corp. Class A (a) | 244,961 | | 18,149 |
SoftBank Corp. | 93,400 | | 5,953 |
Vodafone Group PLC | 4,915,700 | | 14,723 |
| | 52,873 |
TOTAL TELECOMMUNICATION SERVICES | | 77,523 |
UTILITIES - 2.0% |
Electric Utilities - 0.8% |
Edison International | 448,224 | | 22,344 |
ITC Holdings Corp. | 272,272 | | 24,986 |
NextEra Energy, Inc. | 93,711 | | 8,116 |
Northeast Utilities | 258,042 | | 11,460 |
| | 66,906 |
Independent Power Producers & Energy Traders - 0.3% |
The AES Corp. | 2,065,096 | | 25,690 |
Multi-Utilities - 0.9% |
CenterPoint Energy, Inc. | 328,845 | | 8,162 |
PG&E Corp. | 494,102 | | 22,674 |
Sempra Energy | 467,142 | | 40,936 |
| | 71,772 |
TOTAL UTILITIES | | 164,368 |
TOTAL COMMON STOCKS (Cost $6,380,449) |
8,142,973
|
Preferred Stocks - 0.2% |
| | | |
Convertible Preferred Stocks - 0.1% |
INFORMATION TECHNOLOGY - 0.1% |
IT Services - 0.1% |
Unisys Corp. Series A, 6.25% | 92,200 | | 6,645 |
Preferred Stocks - continued |
| Shares | | Value (000s) |
Nonconvertible Preferred Stocks - 0.1% |
CONSUMER DISCRETIONARY - 0.1% |
Automobiles - 0.1% |
Volkswagen AG | 42,400 | | $ 10,077 |
TOTAL PREFERRED STOCKS (Cost $14,752) |
16,722
|
Corporate Bonds - 0.6% |
| Principal
Amount (000s) (d) | | |
Convertible Bonds - 0.5% |
ENERGY - 0.2% |
Energy Equipment & Services - 0.1% |
Cal Dive International, Inc. 5% 7/15/17 (g) | | $ 2,600 | | 2,767 |
Vantage Drilling Co. 5.5% 7/15/43 (g) | | 3,590 | | 3,850 |
| | 6,617 |
Oil, Gas & Consumable Fuels - 0.1% |
Amyris, Inc. 3% 2/27/17 | | 7,356 | | 5,191 |
BPZ Energy, Inc. 6.5% 3/1/15 | | 3,620 | | 3,118 |
| | 8,309 |
TOTAL ENERGY | | 14,926 |
HEALTH CARE - 0.2% |
Biotechnology - 0.2% |
Exelixis, Inc. 4.25% 8/15/19 | | 9,070 | | 9,416 |
InterMune, Inc. 2.5% 12/15/17 | | 2,810 | | 3,920 |
Theravance, Inc. 2.125% 1/15/23 | | 3,620 | | 5,591 |
| | 18,927 |
INDUSTRIALS - 0.0% |
Building Products - 0.0% |
Aspen Aerogels, Inc. 8% 6/1/14 (i) | | 4,618 | | 4,618 |
INFORMATION TECHNOLOGY - 0.1% |
Semiconductors & Semiconductor Equipment - 0.1% |
GT Advanced Technologies, Inc. 3% 10/1/17 | | 7,010 | | 6,716 |
TOTAL CONVERTIBLE BONDS | | 45,187 |
Corporate Bonds - continued |
| Principal Amount (000s) (d) | | Value (000s) |
Nonconvertible Bonds - 0.1% |
FINANCIALS - 0.1% |
Commercial Banks - 0.1% |
Bank of Ireland 10% 7/30/16 | EUR | 5,542 | | $ 7,690 |
TOTAL CORPORATE BONDS (Cost $49,606) |
52,877
|
Money Market Funds - 1.1% |
| Shares | | |
Fidelity Cash Central Fund, 0.11% (b) | 40,756,325 | | 40,756 |
Fidelity Securities Lending Cash Central Fund, 0.12% (b)(c) | 48,253,958 | | 48,254 |
TOTAL MONEY MARKET FUNDS (Cost $89,010) |
89,010
|
TOTAL INVESTMENT PORTFOLIO - 100.4% (Cost $6,533,817) | 8,301,582 |
NET OTHER ASSETS (LIABILITIES) - (0.4)% | (29,682) |
NET ASSETS - 100% | $ 8,271,900 |
Currency Abbreviations |
EUR | - | European Monetary Unit |
Legend |
(a) Non-income producing |
(b) Affiliated fund that is generally available only to investment companies and other accounts managed by Fidelity Investments. The rate quoted is the annualized seven-day yield of the fund at period end. A complete unaudited listing of the fund's holdings as of its most recent quarter end is available upon request. In addition, each Fidelity Central Fund's financial statements, which are not covered by the Fund's Report of Independent Registered Public Accounting Firm, are available on the SEC's website or upon request. |
(c) Investment made with cash collateral received from securities on loan. |
(d) Amount is stated in United States dollars unless otherwise noted. |
(e) Security or a portion of the security is on loan at period end. |
(f) Affiliated company |
(g) Security exempt from registration under Rule 144A of the Securities Act of 1933. These securities may be resold in transactions exempt from registration, normally to qualified institutional buyers. At the end of the period, the value of these securities amounted to $31,061,000 or 0.4% of net assets. |
(h) Security or a portion of the security sold on a delayed delivery basis. |
(i) Restricted securities - Investment in securities not registered under the Securities Act of 1933 (excluding 144A issues). At the end of the period, the value of restricted securities (excluding 144A issues) amounted to $7,220,000 or 0.1% of net assets. |
Additional information on each restricted holding is as follows: |
Security | Acquisition Date | Acquisition Cost (000s) |
Aspen Aerogels, Inc. 8% 6/1/14 | 6/1/11 - 12/31/12 | $ 4,618 |
Mood Media Corp. | 2/2/11 | $ 1,799 |
Velti PLC | 4/19/13 | $ 2,459 |
* Amount represents less than $1,000 |
Affiliated Central Funds |
Information regarding fiscal year to date income earned by the Fund from investments in Fidelity Central Funds is as follows: |
Fund | Income earned
(Amount in thousands) |
Fidelity Cash Central Fund | $ 61 |
Fidelity Securities Lending Cash Central Fund | 4,270 |
Total | $ 4,331 |
Other Affiliated Issuers |
An affiliated company is a company in which the Fund has ownership of at least 5% of the voting securities. Fiscal year to date transactions with companies which are or were affiliates are as follows: |
Affiliate
(Amount in thousands) | Value, beginning of period | Purchases | Sales Proceeds | Dividend Income | Value,
end of
period |
Body Central Corp. | $ 10,585 | $ 360 | $ 5,769 | $ - | $ - |
Double Eagle Petroleum Co. | 3,787 | 282 | 387 | - | 3,050 |
Emerald Oil, Inc. | - | 4,260 | 6,750 | - | - |
Emerald Oil, Inc. warrants 2/4/16 | - | - | - | - | - |
GeoEye, Inc. | 31,912 | - | 38,071 | - | - |
LTX-Credence Corp. | 14,900 | 898 | 7,771 | - | - |
PICO Holdings, Inc. | 33,875 | 57 | 4,350 | - | 26,509 |
TAG Oil Ltd. | 11,208 | 9,234 | - | - | 13,370 |
TAG Oil Ltd. (144A) | 1,027 | - | - | - | 548 |
Total | $ 107,294 | $ 15,091 | $ 63,098 | $ - | $ 43,477 |
Other Information |
The following is a summary of the inputs used, as of July 31, 2013, involving the Fund's assets and liabilities carried at fair value. The inputs or methodology used for valuing securities may not be an indication of the risk associated with investing in those securities. For more information on valuation inputs, and their aggregation into the levels used in the table below, please refer to the Investment Valuation section in the accompanying Notes to Financial Statements. |
Valuation Inputs at Reporting Date: |
Description
(Amounts in thousands) | Total | Level 1 | Level 2 | Level 3 |
Investments in Securities: | | | | |
Equities: | | | | |
Consumer Discretionary | $ 1,064,834 | $ 1,055,589 | $ 9,245 | $ - |
Consumer Staples | 862,793 | 820,556 | 42,237 | - |
Energy | 835,321 | 835,321 | - | - |
Financials | 1,325,057 | 1,320,820 | 4,237 | - |
Health Care | 1,123,623 | 1,041,859 | 81,764 | - |
Industrials | 1,035,096 | 1,020,913 | 14,183 | - |
Information Technology | 1,380,928 | 1,379,261 | 1,667 | - |
Materials | 290,152 | 290,152 | - | - |
Telecommunication Services | 77,523 | 62,800 | 14,723 | - |
Utilities | 164,368 | 164,368 | - | - |
Corporate Bonds | 52,877 | - | 48,259 | 4,618 |
Money Market Funds | 89,010 | 89,010 | - | - |
Total Investments in Securities: | $ 8,301,582 | $ 8,080,649 | $ 216,315 | $ 4,618 |
Distribution of investments by country or territory of incorporation, as a percentage of total net assets, is as follows. (Unaudited) |
United States of America | 81.6% |
United Kingdom | 2.5% |
Canada | 2.2% |
Ireland | 1.5% |
Bermuda | 1.5% |
Switzerland | 1.4% |
Netherlands | 1.2% |
France | 1.1% |
Japan | 1.0% |
Others (Individually Less Than 1%) | 6.0% |
| 100.0% |
See accompanying notes which are an integral part of the financial statements.
Annual Report
Statement of Assets and Liabilities
Amounts in thousands (except per-share amounts) | July 31, 2013 |
| | |
Assets | | |
Investment in securities, at value (including securities loaned of $46,687) - See accompanying schedule: Unaffiliated issuers (cost $6,374,693) | $ 8,169,095 | |
Fidelity Central Funds (cost $89,010) | 89,010 | |
Other affiliated issuers (cost $70,114) | 43,477 | |
Total Investments (cost $6,533,817) | | $ 8,301,582 |
Foreign currency held at value (cost $198) | | 198 |
Receivable for investments sold
Regular delivery | | 78,235 |
Delayed delivery | | 110 |
Receivable for fund shares sold | | 3,619 |
Dividends receivable | | 5,133 |
Interest receivable | | 1,427 |
Distributions receivable from Fidelity Central Funds | | 280 |
Other receivables | | 864 |
Total assets | | 8,391,448 |
| | |
Liabilities | | |
Payable for investments purchased | $ 60,824 | |
Payable for fund shares redeemed | 6,282 | |
Accrued management fee | 2,468 | |
Other affiliated payables | 1,192 | |
Other payables and accrued expenses | 528 | |
Collateral on securities loaned, at value | 48,254 | |
Total liabilities | | 119,548 |
| | |
Net Assets | | $ 8,271,900 |
Net Assets consist of: | | |
Paid in capital | | $ 5,901,943 |
Undistributed net investment income | | 41,183 |
Accumulated undistributed net realized gain (loss) on investments and foreign currency transactions | | 561,017 |
Net unrealized appreciation (depreciation) on investments and assets and liabilities in foreign currencies | | 1,767,757 |
Net Assets | | $ 8,271,900 |
See accompanying notes which are an integral part of the financial statements.
Annual Report
Statement of Assets and Liabilities - continued
Amounts in thousands (except per-share amounts) | July 31, 2013 |
| | |
Dividend Growth:
Net Asset Value, offering price and redemption price per share ($6,632,538 ÷ 187,715 shares) | | $ 35.33 |
| | |
Class K:
Net Asset Value, offering price and redemption price per share ($1,639,362 ÷ 46,392 shares) | | $ 35.34 |
See accompanying notes which are an integral part of the financial statements.
Annual Report
Financial Statements - continued
Statement of Operations
Amounts in thousands | Year ended July 31, 2013 |
| | |
Investment Income | | |
Dividends | | $ 134,847 |
Interest | | 3,928 |
Income from Fidelity Central Funds | | 4,331 |
Total income | | 143,106 |
| | |
Expenses | | |
Management fee
Basic fee | $ 42,265 | |
Performance adjustment | (11,294) | |
Transfer agent fees | 12,918 | |
Accounting and security lending fees | 1,211 | |
Custodian fees and expenses | 342 | |
Independent trustees' compensation | 49 | |
Registration fees | 84 | |
Audit | 88 | |
Legal | 33 | |
Miscellaneous | 72 | |
Total expenses before reductions | 45,768 | |
Expense reductions | (932) | 44,836 |
Net investment income (loss) | | 98,270 |
Realized and Unrealized Gain (Loss) Net realized gain (loss) on: | | |
Investment securities: | | |
Unaffiliated issuers | 716,355 | |
Other affiliated issuers | (17,267) | |
Foreign currency transactions | (365) | |
Total net realized gain (loss) | | 698,723 |
Change in net unrealized appreciation (depreciation) on: Investment securities | 1,016,146 | |
Assets and liabilities in foreign currencies | 28 | |
Total change in net unrealized appreciation (depreciation) | | 1,016,174 |
Net gain (loss) | | 1,714,897 |
Net increase (decrease) in net assets resulting from operations | | $ 1,813,167 |
See accompanying notes which are an integral part of the financial statements.
Annual Report
Statement of Changes in Net Assets
Amounts in thousands | Year ended
July 31,
2013 | Year ended
July 31,
2012 |
Increase (Decrease) in Net Assets | | |
Operations | | |
Net investment income (loss) | $ 98,270 | $ 62,998 |
Net realized gain (loss) | 698,723 | 282,332 |
Change in net unrealized appreciation (depreciation) | 1,016,174 | (523,395) |
Net increase (decrease) in net assets resulting
from operations | 1,813,167 | (178,065) |
Distributions to shareholders from net investment income | (73,780) | (42,120) |
Distributions to shareholders from net realized gain | (120,844) | (5,141) |
Total distributions | (194,624) | (47,261) |
Share transactions - net increase (decrease) | (472,835) | (2,591,197) |
Total increase (decrease) in net assets | 1,145,708 | (2,816,523) |
| | |
Net Assets | | |
Beginning of period | 7,126,192 | 9,942,715 |
End of period (including undistributed net investment income of $41,183 and undistributed net investment income of $20,016, respectively) | $ 8,271,900 | $ 7,126,192 |
See accompanying notes which are an integral part of the financial statements.
Annual Report
Financial Highlights - Dividend Growth
Years ended July 31, | 2013 | 2012 | 2011 | 2010 | 2009 |
Selected Per-Share Data | | | | | |
Net asset value, beginning of period | $ 28.61 | $ 28.96 | $ 23.84 | $ 20.25 | $ 25.40 |
Income from Investment Operations | | | | | |
Net investment income (loss) B | .40 | .20 | .12 | .13 E | .24 |
Net realized and unrealized gain (loss) | 7.12 | (.41) | 5.23 | 3.63 | (4.01) |
Total from investment operations | 7.52 | (.21) | 5.35 | 3.76 | (3.77) |
Distributions from net investment income | (.30) | (.12) | (.15) | (.12) | (.37) |
Distributions from net realized gain | (.50) | (.02) | (.08) | (.05) | (1.01) |
Total distributions | (.80) | (.14) | (.23) | (.17) | (1.38) H |
Net asset value, end of period | $ 35.33 | $ 28.61 | $ 28.96 | $ 23.84 | $ 20.25 |
Total Return A | 26.83% | (.67)% | 22.57% | 18.59% | (15.33)% |
Ratios to Average Net Assets C,F | | | | | |
Expenses before reductions | .63% | .91% | .93% | .93% | .62% |
Expenses net of fee waivers, if any | .63% | .91% | .93% | .93% | .62% |
Expenses net of all reductions | .62% | .91% | .93% | .92% | .62% |
Net investment income (loss) | 1.26% | .75% | .44% | .56% E | 1.34% |
Supplemental Data | | | | | |
Net assets, end of period (in millions) | $ 6,633 | $ 5,905 | $ 9,309 | $ 7,730 | $ 6,603 |
Portfolio turnover rate D | 69% | 63% G | 67% | 85% | 177% |
A Total returns would have been lower if certain expenses had not been reduced during the applicable periods shown.
B Calculated based on average shares outstanding during the period.
C Fees and expenses of any underlying Fidelity Central Funds are not included in the Fund's expense ratio. The Fund indirectly bears its proportionate share of the expenses of any underlying Fidelity Central Funds.
D Amount does not include the portfolio activity of any underlying Fidelity Central Funds.
E Investment income per share reflects a large, non-recurring dividend which amounted to $.04 per share. Excluding this non-recurring dividend, the ratio of net investment income (loss) to average net assets would have been .40%.
F Expense ratios reflect operating expenses of the class. Expenses before reductions do not reflect amounts reimbursed by the investment adviser or reductions from brokerage service arrangements or reductions from other expense offset arrangements and do not represent the amount paid by the class during periods when reimbursements or reductions occur. Expenses net of fee waivers reflect expenses after reimbursement by the investment adviser but prior to reductions from brokerage service arrangements or other expense offset arrangements. Expenses net of all reductions represent the net expenses paid by the class.
G Portfolio turnover rate excludes securities received or delivered in-kind.
H Total distributions of $1.38 per share is comprised of distributions from net investment income of $.374 and distributions from net realized gain of $1.005 per share.
See accompanying notes which are an integral part of the financial statements.
Annual Report
Financial Highlights - Class K
Years ended July 31, | 2013 | 2012 | 2011 | 2010 | 2009 |
Selected Per-Share Data | | | | | |
Net asset value, beginning of period | $ 28.62 | $ 28.98 | $ 23.86 | $ 20.26 | $ 25.41 |
Income from Investment Operations | | | | | |
Net investment income (loss) B | .45 | .25 | .17 | .18 E | .26 |
Net realized and unrealized gain (loss) | 7.12 | (.43) | 5.22 | 3.63 | (4.00) |
Total from investment operations | 7.57 | (.18) | 5.39 | 3.81 | (3.74) |
Distributions from net investment income | (.35) | (.17) | (.20) | (.16) | (.41) |
Distributions from net realized gain | (.50) | (.02) | (.08) | (.05) | (1.01) |
Total distributions | (.85) | (.18) J | (.27) I | (.21) | (1.41) H |
Net asset value, end of period | $ 35.34 | $ 28.62 | $ 28.98 | $ 23.86 | $ 20.26 |
Total Return A | 27.04% | (.52)% | 22.79% | 18.86% | (15.16)% |
Ratios to Average Net Assets C,F | | | | | |
Expenses before reductions | .48% | .75% | .78% | .72% | .40% |
Expenses net of fee waivers, if any | .48% | .75% | .78% | .72% | .40% |
Expenses net of all reductions | .47% | .75% | .77% | .71% | .39% |
Net investment income (loss) | 1.41% | .91% | .60% | .76% E | 1.57% |
Supplemental Data | | | | | |
Net assets, end of period (in millions) | $ 1,639 | $ 1,221 | $ 634 | $ 355 | $ 202 |
Portfolio turnover rate D | 69% | 63% G | 67% | 85% | 177% |
A Total returns would have been lower if certain expenses had not been reduced during the applicable periods shown.
B Calculated based on average shares outstanding during the period.
C Fees and expenses of any underlying Fidelity Central Funds are not included in the Fund's expense ratio. The Fund indirectly bears its proportionate share of the expenses of any underlying Fidelity Central Funds.
D Amount does not include the portfolio activity of any underlying Fidelity Central Funds.
E Investment income per share reflects a large, non-recurring dividend which amounted to $.04 per share. Excluding this non-recurring dividend, the ratio of net investment income (loss) to average net assets would have been .60%.
F Expense ratios reflect operating expenses of the class. Expenses before reductions do not reflect amounts reimbursed by the investment adviser or reductions from brokerage service arrangements or reductions from other expense offset arrangements and do not represent the amount paid by the class during periods when reimbursements or reductions occur. Expenses net of fee waivers reflect expenses after reimbursement by the investment adviser but prior to reductions from brokerage service arrangements or other expense offset arrangements. Expenses net of all reductions represent the net expenses paid by the class.
G Portfolio turnover rate excludes securities received or delivered in-kind.
H Total distributions of $1.41 per share is comprised of distributions from net investment income of $.407 and distributions from net realized gain of $1.005 per share.
I Total distributions of $.27 per share is comprised of distributions from net investment income of $.197 and distributions from net realized gain of $.077 per share.
J Total distributions of $.18 per share is comprised of distributions from net investment income of $.169 and distributions from net realized gain of $.015 per share.
See accompanying notes which are an integral part of the financial statements.
Annual Report
Notes to Financial Statements
For the period ended July 31, 2013
(Amounts in thousands except percentages)
1. Organization.
Fidelity Dividend Growth Fund (the Fund) is a fund of Fidelity Securities Fund (the Trust) and is authorized to issue an unlimited number of shares. The Trust is registered under the Investment Company Act of 1940, as amended (the 1940 Act), as an open-end management investment company organized as a Massachusetts business trust. The Fund offers Dividend Growth and Class K shares, each of which has equal rights as to assets and voting privileges. Each class has exclusive voting rights with respect to matters that affect that class.
2. Investments in Fidelity Central Funds.
The Fund invests in Fidelity Central Funds, which are open-end investment companies generally available only to other investment companies and accounts managed by Fidelity Management & Research Company (FMR) and its affiliates. The Fund's Schedule of Investments lists each of the Fidelity Central Funds held as of period end, if any, as an investment of the Fund, but does not include the underlying holdings of each Fidelity Central Fund. As an Investing Fund, the Fund indirectly bears its proportionate share of the expenses of the underlying Fidelity Central Funds.
The Money Market Central Funds seek preservation of capital and current income and are managed by Fidelity Investments Money Management, Inc. (FIMM), an affiliate of FMR.
A complete unaudited list of holdings for each Fidelity Central Fund is available upon request or at the Securities and Exchange Commission (the SEC) website at www.sec.gov. In addition, the financial statements of the Fidelity Central Funds, which are not covered by the Fund's Report of Independent Registered Public Accounting Firm, are available on the SEC website or upon request.
3. Significant Accounting Policies.
The financial statements have been prepared in conformity with accounting principles generally accepted in the United States of America (GAAP), which require management to make certain estimates and assumptions at the date of the financial statements. Actual results could differ from those estimates. Subsequent events, if any, through the date that the financial statements were issued have been evaluated in the preparation of the financial statements. The following summarizes the significant accounting policies of the Fund:
Annual Report
Notes to Financial Statements - continued
(Amounts in thousands except percentages)
3. Significant Accounting Policies - continued
Investment Valuation. Investments are valued as of 4:00 p.m. Eastern time on the last calendar day of the period. In accordance with valuation policies and procedures approved by the Board of Trustees (the Board), the Fund attempts to obtain prices from one or more third party pricing vendors or brokers to value its investments. When current market prices, quotations or currency exchange rates are not readily available or reliable, investments will be fair valued in good faith by the FMR Fair Value Committee (the Committee), in accordance with procedures adopted by the Board. Factors used in determining fair value vary by investment type and may include market or investment specific events, changes in interest rates and credit quality. The frequency with which these procedures are used cannot be predicted and they may be utilized to a significant extent. The Committee oversees the Fund's valuation policies and procedures and is responsible for approving and reporting to the Board all fair value determinations.
The Fund categorizes the inputs to valuation techniques used to value its investments into a disclosure hierarchy consisting of three levels as shown below:
Level 1 - quoted prices in active markets for identical investments
Level 2 - other significant observable inputs (including quoted prices for similar investments, interest rates, prepayment speeds, etc.)
Level 3 - unobservable inputs (including the Fund's own assumptions based on the best information available)
Valuation techniques used to value the Fund's investments by major category are as follows:
Equity securities, including restricted securities, for which market quotations are readily available, are valued at the last reported sale price or official closing price as reported by a third party pricing vendor on the primary market or exchange on which they are traded and are categorized as Level 1 in the hierarchy. In the event there were no sales during the day or closing prices are not available, securities are valued at the last quoted bid price or may be valued using the last available price and are generally categorized as Level 2 in the hierarchy. For foreign equity securities, when market or security specific events arise, comparisons to the valuation of American Depositary Receipts (ADRs), futures contracts, Exchange-Traded Funds (ETFs) and certain indexes as well as quoted prices for similar securities may be used and would be categorized as Level 2 in the hierarchy. Utilizing these techniques may result in transfers between Level 1 and Level 2. For restricted equity securities and private placements where observable inputs are limited, assumptions about market activity and risk are used and these securities are generally categorized as Level 3 in the hierarchy.
Annual Report
3. Significant Accounting Policies - continued
Investment Valuation - continued
Debt securities, including restricted securities, are valued based on evaluated prices received from third party pricing vendors or from brokers who make markets in such securities. For corporate bonds, pricing vendors utilize matrix pricing which considers yield or price of bonds of comparable quality, coupon, maturity and type as well as broker-supplied prices. When independent prices are unavailable or unreliable, debt securities may be valued utilizing pricing methodologies which consider similar factors that would be used by third party pricing vendors. Debt securities are generally categorized as Level 2 in the hierarchy but may be Level 3 depending on the circumstances.
Investments in open-end mutual funds, including the Fidelity Central Funds, are valued at their closing net asset value (NAV) each business day and are categorized as Level 1 in the hierarchy.
Changes in valuation techniques may result in transfers in or out of an assigned level within the disclosure hierarchy. The aggregate value of investments by input level, as of July 31, 2013, is included at the end of the Fund's Schedule of Investments.
Foreign Currency. The Fund may use foreign currency contracts to facilitate transactions in foreign-denominated securities. Gains and losses from these transactions may arise from changes in the value of the foreign currency or if the counterparties do not perform under the contracts' terms.
Foreign-denominated assets, including investment securities, and liabilities are translated into U.S. dollars at the exchange rates at period end. Purchases and sales of investment securities, income and dividends received and expenses denominated in foreign currencies are translated into U.S. dollars at the exchange rate in effect on the transaction date.
The effects of exchange rate fluctuations on investments are included with the net realized and unrealized gain (loss) on investment securities. Other foreign currency transactions resulting in realized and unrealized gain (loss) are disclosed separately.
Investment Transactions and Income. For financial reporting purposes, the Fund's investment holdings and NAV include trades executed through the end of the last business day of the period. The NAV per share for processing shareholder transactions is calculated as of the close of business of the New York Stock Exchange (NYSE), normally 4:00 p.m. Eastern time and includes trades executed through the end of the prior business day. Gains and losses on securities sold are determined on the basis of identified cost and may include proceeds received from litigation. Dividend income is recorded on the ex-dividend date, except for certain dividends from foreign securities where the
Annual Report
Notes to Financial Statements - continued
(Amounts in thousands except percentages)
3. Significant Accounting Policies - continued
Investment Transactions and Income - continued
ex-dividend date may have passed, which are recorded as soon as the Fund is informed of the ex-dividend date. Non-cash dividends included in dividend income, if any, are recorded at the fair market value of the securities received. Distributions received on securities that represent a return of capital or capital gain are recorded as a reduction of cost of investments and/or as a realized gain. Subsequent to ex-dividend date the Fund determines the components of these distributions, based upon receipt of tax filings or other correspondence relating to the underlying investment. Interest income and distributions from the Fidelity Central Funds are accrued as earned. Interest income includes coupon interest and amortization of premium and accretion of discount on debt securities. Investment income is recorded net of foreign taxes withheld where recovery of such taxes is uncertain.
Class Allocations and Expenses. Investment income, realized and unrealized capital gains and losses, common expenses of the Fund, and certain fund-level expense reductions, if any, are allocated on a pro-rata basis to each class based on the relative net assets of each class to the total net assets of the Fund. Each class differs with respect to transfer agent fees incurred. Certain expense reductions may also differ by class. Expenses directly attributable to a fund are charged to that fund. Expenses attributable to more than one fund are allocated among the respective funds on the basis of relative net assets or other appropriate methods. Expense estimates are accrued in the period to which they relate and adjustments are made when actual amounts are known.
Deferred Trustee Compensation. Under a Deferred Compensation Plan (the Plan), independent Trustees may elect to defer receipt of a portion of their annual compensation. Deferred amounts are invested in a cross-section of Fidelity funds, are marked-to-market and remain in the Fund until distributed in accordance with the Plan. The investment of deferred amounts and the offsetting payable to the Trustees are included in the accompanying Statement of Assets and Liabilities.
Income Tax Information and Distributions to Shareholders. Each year, the Fund intends to qualify as a regulated investment company under Subchapter M of the Internal Revenue Code, including distributing substantially all of its taxable income and realized gains. As a result, no provision for income taxes is required. As of July 31, 2013, the Fund did not have any unrecognized tax benefits in the financial statements; nor is the Fund aware of any tax positions for which it is reasonably possible that the total amounts of unrecognized tax benefits will significantly change in the next twelve months. The Fund files a U.S. federal tax return, in addition to state and local tax returns as required. A fund's federal income tax returns are subject to examination by the Internal Revenue Service (IRS) for a period of three fiscal years after they are filed.
Annual Report
3. Significant Accounting Policies - continued
Income Tax Information and Distributions to Shareholders - continued
State and local tax returns may be subject to examination for an additional fiscal year depending on the jurisdiction. Foreign taxes are provided for based on the Fund's understanding of the tax rules and rates that exist in the foreign markets in which it invests.
Distributions are declared and recorded on the ex-dividend date. Income dividends and capital gain distributions are declared separately for each class. Income and capital gain distributions are determined in accordance with income tax regulations, which may differ from GAAP. In addition, the Fund claimed a portion of the payment made to redeeming shareholders as a distribution for income tax purposes.
Capital accounts within the financial statements are adjusted for permanent book-tax differences. These adjustments have no impact on net assets or the results of operations. Temporary book-tax differences will reverse in a subsequent period.
Book-tax differences are primarily due to foreign currency transactions, passive foreign investment companies (PFIC), market discount, contingent interest, equity-debt classifications, partnerships, deferred trustees compensation and losses deferred due to wash sales.
The federal tax cost of investment securities and unrealized appreciation (depreciation) as of period end were as follows:
Gross unrealized appreciation | $ 1,952,043 |
Gross unrealized depreciation | (195,354) |
Net unrealized appreciation (depreciation) on securities and other investments | $ 1,756,689 |
| |
Tax Cost | $ 6,544,893 |
The tax-based components of distributable earnings as of period end were as follows:
Undistributed ordinary income | $ 195,503 |
Undistributed long-term capital gain | $ 418,131 |
Net unrealized appreciation (depreciation) | $ 1,756,680 |
Annual Report
Notes to Financial Statements - continued
(Amounts in thousands except percentages)
3. Significant Accounting Policies - continued
Income Tax Information and Distributions to Shareholders - continued
The tax character of distributions paid was as follows:
| July 31, 2013 | July 31, 2012 |
Ordinary Income | $ 80,019 | $ 47,261 |
Long-term Capital Gains | 114,605 | - |
Total | $ 194,624 | $ 47,261 |
Delayed Delivery Transactions and When-Issued Securities. During the period, the Fund transacted in securities on a delayed delivery or when-issued basis. Payment and delivery may take place after the customary settlement period for that security. The price of the underlying securities and the date when the securities will be delivered and paid for are fixed at the time the transaction is negotiated. The Fund may receive compensation for interest forgone in the purchase of a delayed delivery or when-issued security. With respect to purchase commitments, the Fund identifies securities as segregated in its records with a value at least equal to the amount of the commitment. Losses may arise due to changes in the value of the underlying securities or if the counterparty does not perform under the contract's terms, or if the issuer does not issue the securities due to political, economic, or other factors.
Restricted Securities. The Fund may invest in securities that are subject to legal or contractual restrictions on resale. These securities generally may be resold in transactions exempt from registration or to the public if the securities are registered. Disposal of these securities may involve time-consuming negotiations and expense, and prompt sale at an acceptable price may be difficult. Information regarding restricted securities is included at the end of the Fund's Schedule of Investments.
4. Purchases and Sales of Investments.
Purchases and sales of securities, other than short-term securities, aggregated $5,170,881 and $5,672,803, respectively.
5. Fees and Other Transactions with Affiliates.
Management Fee. FMR and its affiliates provide the Fund with investment management related services for which the Fund pays a monthly management fee. The management fee is the sum of an individual fund fee rate that is based on an annual rate of .30% of the Fund's average net assets and an annualized group fee rate that averaged .26% during the period. The group fee rate is based upon the average net assets of all the mutual funds advised by FMR. The group fee rate decreases as assets under management increase and increases as assets under management decrease. In addition, the
Annual Report
5. Fees and Other Transactions with Affiliates - continued
Management Fee - continued
management fee is subject to a performance adjustment (up to a maximum of ± .20% of the Fund's average net assets over a 36 month performance period). The upward or downward adjustment to the management fee is based on the relative investment performance of Dividend Growth as compared to an appropriate benchmark index. For the period, the total annual management fee rate, including the performance adjustment, was .41% of the Fund's average net assets.
Transfer Agent Fees. Fidelity Investments Institutional Operations Company, Inc., (FIIOC), an affiliate of FMR, is the transfer, dividend disbursing and shareholder servicing agent for each class of the Fund. FIIOC receives account fees and asset-based fees that vary according to the account size and type of account of the shareholders of Dividend Growth. FIIOC receives an asset-based fee of Class K's average net assets. FIIOC pays for typesetting, printing and mailing of shareholder reports, except proxy statements. For the period, transfer agent fees for each applicable class were as follows:
| Amount | % of
Average
Net Assets |
Dividend Growth | $ 12,226 | .20 |
Class K | 692 | .05 |
| $ 12,918 | |
Accounting and Security Lending Fees. Fidelity Service Company, Inc. (FSC), an affiliate of FMR, maintains the Fund's accounting records. The accounting fee is based on the level of average net assets for each month. Under a separate contract, FSC administers the security lending program. The security lending fee is based on the number and duration of lending transactions.
Brokerage Commissions. The Fund placed a portion of its portfolio transactions with brokerage firms which are affiliates of the investment adviser. Brokerage commissions are included in net realized gain (loss) and change in net unrealized appreciation (depreciation) in the Statement of Operations. The commissions paid to these affiliated firms were $133 for the period.
6. Committed Line of Credit.
The Fund participates with other funds managed by FMR or an affiliate in a $4.25 billion credit facility (the "line of credit") to be utilized for temporary or emergency purposes to fund shareholder redemptions or for other short-term liquidity purposes. The Fund has agreed to pay commitment fees on its pro-rata portion of the line of credit, which
Annual Report
Notes to Financial Statements - continued
(Amounts in thousands except percentages)
6. Committed Line of Credit - continued
amounted to $18 and is reflected in Miscellaneous expenses on the Statement of Operations. During the period, there were no borrowings on this line of credit.
7. Security Lending.
The Fund lends portfolio securities through a lending agent from time to time in order to earn additional income. For equity securities, a lending agent is used and may loan securities to certain qualified borrowers, including Fidelity Capital Markets (FCM), a broker-dealer affiliated with the Fund. On the settlement date of the loan, the Fund receives collateral (in the form of U.S. Treasury obligations, letters of credit and/or cash) against the loaned securities and maintains collateral in an amount not less than 100% of the market value of the loaned securities during the period of the loan. The market value of the loaned securities is determined at the close of business of the Fund and any additional required collateral is delivered to the Fund on the next business day. If the borrower defaults on its obligation to return the securities loaned because of insolvency or other reasons, the Fund may apply collateral received from the borrower against the obligation. The Fund may experience delays and costs in recovering the securities loaned. Any cash collateral received is invested in the Fidelity Securities Lending Cash Central Fund. The value of loaned securities and cash collateral at period end are disclosed on the Fund's Statement of Assets and Liabilities. The value of securities loaned to FCM at period end was $119. Security lending income represents the income earned on investing cash collateral, less rebates paid to borrowers and any lending agent fees associated with the loan, plus any premium payments received for lending certain types of securities. Security lending income is presented in the Statement of Operations as a component of income from Fidelity Central Funds. Total security lending income during the period amounted to $4,270, including $251 from securities loaned to FCM.
8. Expense Reductions.
Commissions paid to certain brokers with whom FMR places trades include an amount in addition to trade execution, which is rebated back to the Fund to offset certain expenses. This amount totaled $916 for the period. Through arrangements with the Fund's custodian, credits realized as a result of uninvested cash balances were used to reduce the Fund's expenses. During the period, these credits reduced the Fund's custody expenses by four hundred and nine dollars.
In addition, FMR reimbursed a portion of the Fund's operating expenses during the period in the amount of $16.
Annual Report
9. Distributions to Shareholders.
Distributions to shareholders of each class were as follows:
Years ended July 31, | 2013 | 2012 |
From net investment income | | |
Dividend Growth | $ 58,843 | $ 37,592 |
Class K | 14,937 | 4,528 |
Total | $ 73,780 | $ 42,120 |
From net realized gain | | |
Dividend Growth | $ 99,450 | $ 4,761 |
Class K | 21,394 | 380 |
Total | $ 120,844 | $ 5,141 |
10. Share Transactions.
Transactions for each class of shares were as follows:
| Shares | Dollars |
Years ended July 31, | 2013 | 2012 | 2013 | 2012 |
Dividend Growth | | | | |
Shares sold | 18,652 | 28,017 | $ 585,373 | $ 753,110 |
Reinvestment of distributions | 4,994 | 1,596 | 147,845 | 40,357 |
Shares redeemed | (42,352) | (144,643)A | (1,323,760) | (3,948,966)A |
Net increase (decrease) | (18,706) | (115,030) | $ (590,542) | $ (3,155,499) |
Class K | | | | |
Shares sold | 13,098 | 29,433 | $ 414,093 | $ 801,392 |
Reinvestment of distributions | 1,228 | 194 | 36,331 | 4,908 |
Shares redeemed | (10,587) | (8,851) | (332,717) | (241,998) |
Net increase (decrease) | 3,739 | 20,776 | $ 117,707 | $ 564,302 |
A Amount included in-kind redemptions
11. Other.
The Fund's organizational documents provide former and current trustees and officers with a limited indemnification against liabilities arising in connection with the performance of their duties to the Fund. In the normal course of business, the Fund may also enter into contracts that provide general indemnifications. The Fund's maximum exposure under these arrangements is unknown as this would be dependent on future claims that may be made against the Fund. The risk of material loss from such claims is considered remote.
Annual Report
To the Trustees of Fidelity Securities Fund and the Shareholders of Fidelity Dividend Growth Fund:
In our opinion, the accompanying statement of assets and liabilities, including the schedule of investments, and the related statements of operations and of changes in net assets and the financial highlights present fairly, in all material respects, the financial position of Fidelity Dividend Growth Fund (a fund of Fidelity Securities Fund) at July 31, 2013, the results of its operations for the year then ended, the changes in its net assets for each of the two years in the period then ended and the financial highlights for each of the five years in the period then ended, in conformity with accounting principles generally accepted in the United States of America. These financial statements and financial highlights (hereafter referred to as "financial statements") are the responsibility of the Fidelity Dividend Growth Fund's management. Our responsibility is to express an opinion on these financial statements based on our audits. We conducted our audits of these financial statements in accordance with the standards of the Public Company Accounting Oversight Board (United States). Those standards require that we plan and perform the audit to obtain reasonable assurance about whether the financial statements are free of material misstatement. An audit includes examining, on a test basis, evidence supporting the amounts and disclosures in the financial statements, assessing the accounting principles used and significant estimates made by management, and evaluating the overall financial statement presentation. We believe that our audits, which included confirmation of securities at July 31, 2013 by correspondence with the custodian and brokers, provide a reasonable basis for our opinion.
PricewaterhouseCoopers LLP
Boston, Massachusetts
September 13, 2013
Annual Report
The Trustees, Member of the Advisory Board, and executive officers of the trust and fund, as applicable, are listed below. The Board of Trustees governs the fund and is responsible for protecting the interests of shareholders. The Trustees are experienced executives who meet periodically throughout the year to oversee the fund's activities, review contractual arrangements with companies that provide services to the fund, oversee management of the risks associated with such activities and contractual arrangements, and review the fund's performance. Except for James C. Curvey, Ned C. Lautenbach, Ronald P. O'Hanley, and William S. Stavropoulos, each of the Trustees oversees 166 Fidelity funds. Mr. Curvey oversees 387 Fidelity funds. Mr. Lautenbach, Mr. O'Hanley, and Mr. Stavropoulos each oversees 230 Fidelity funds.
The Trustees hold office without limit in time except that (a) any Trustee may resign; (b) any Trustee may be removed by written instrument, signed by at least two-thirds of the number of Trustees prior to such removal; (c) any Trustee who requests to be retired or who has become incapacitated by illness or injury may be retired by written instrument signed by a majority of the other Trustees; and (d) any Trustee may be removed at any special meeting of shareholders by a two-thirds vote of the outstanding voting securities of the trust. Each Trustee who is not an interested person of the trust and the fund (as defined in the 1940 Act) (Independent Trustee), shall retire not later than the last day of the calendar year in which his or her 75th birthday occurs. The Independent Trustees may waive this mandatory retirement age policy with respect to individual Trustees. The executive officers and Advisory Board Member hold office without limit in time, except that any officer and Advisory Board Member may resign or may be removed by a vote of a majority of the Trustees at any regular meeting or any special meeting of the Trustees. Except as indicated, each individual has held the office shown or other offices in the same company for the past five years.
Experience, Skills, Attributes, and Qualifications of the Fund's Trustees. The Governance and Nominating Committee has adopted a statement of policy that describes the experience, qualifications, attributes, and skills that are necessary and desirable for potential Independent Trustee candidates (Statement of Policy). The Board believes that each Trustee satisfied at the time he or she was initially elected or appointed a Trustee, and continues to satisfy, the standards contemplated by the Statement of Policy. The Governance and Nominating Committee also engages professional search firms to help identify potential Independent Trustee candidates who have the experience, qualifications, attributes, and skills consistent with the Statement of Policy. From time to time, additional criteria based on the composition and skills of the current Independent Trustees, as well as experience or skills that may be appropriate in light of future changes to board composition, business conditions, and regulatory or other developments, have also been considered by the professional search firms and the Governance and Nominating Committee. In addition, the Board takes into account the Trustees' commitment and participation in Board and committee meetings, as well as their leadership of standing and ad hoc committees throughout their tenure.
Annual Report
In determining that a particular Trustee was and continues to be qualified to serve as a Trustee, the Board has considered a variety of criteria, none of which, in isolation, was controlling. The Board believes that, collectively, the Trustees have balanced and diverse experience, qualifications, attributes, and skills, which allow the Board to operate effectively in governing the fund and protecting the interests of shareholders. Information about the specific experience, skills, attributes, and qualifications of each Trustee, which in each case led to the Board's conclusion that the Trustee should serve (or continue to serve) as a trustee of the fund, is provided below.
Board Structure and Oversight Function. James C. Curvey is an interested person (as defined in the 1940 Act) and currently serves as Chairman. The Trustees have determined that an interested Chairman is appropriate and benefits shareholders because an interested Chairman has a personal and professional stake in the quality and continuity of services provided to the fund. Independent Trustees exercise their informed business judgment to appoint an individual of their choosing to serve as Chairman, regardless of whether the Trustee happens to be independent or a member of management. The Independent Trustees have determined that they can act independently and effectively without having an Independent Trustee serve as Chairman and that a key structural component for assuring that they are in a position to do so is for the Independent Trustees to constitute a substantial majority for the Board. The Independent Trustees also regularly meet in executive session. Ned C. Lautenbach serves as Chairman of the Independent Trustees and as such (i) acts as a liaison between the Independent Trustees and management with respect to matters important to the Independent Trustees and (ii) with management prepares agendas for Board meetings.
Fidelity funds are overseen by different Boards of Trustees. The fund's Board oversees Fidelity's equity and high income funds and another Board oversees Fidelity's investment-grade bond, money market, and asset allocation funds. The asset allocation funds may invest in Fidelity funds overseen by the fund's Board. The use of separate Boards, each with its own committee structure, allows the Trustees of each group of Fidelity funds to focus on the unique issues of the funds they oversee, including common research, investment, and operational issues. On occasion, the separate Boards establish joint committees to address issues of overlapping consequences for the Fidelity funds overseen by each Board.
The Trustees operate using a system of committees to facilitate the timely and efficient consideration of all matters of importance to the Trustees, the fund, and fund shareholders and to facilitate compliance with legal and regulatory requirements and oversight of the fund's activities and associated risks. The Board, acting through its committees, has charged FMR and its affiliates with (i) identifying events or circumstances the occurrence of which could have demonstrably adverse effects on the fund's business and/or reputation; (ii) implementing processes and controls to lessen the possibility that such events or circumstances occur or to mitigate the effects of such events or circumstances if they do occur; and (iii) creating and maintaining a system designed to evaluate continuously business and market conditions in order to facilitate the identification and implementation processes described in (i) and (ii) above. Because the day-to-day operations and activities of the fund are carried out by or through FMR, its affiliates and other service providers, the fund's exposure to risks is mitigated but not eliminated by the processes overseen by the Trustees. While each of the Board's committees has responsibility for overseeing different aspects of the fund's activities, oversight is exercised primarily through the Operations, Audit, and Compliance Committees. In addition, the Independent Trustees have worked with FMR to enhance the Board's oversight of investment and financial risks, legal and regulatory risks, technology risks, and operational risks, including the development of additional risk reporting to the Board. For example, a working group comprised of Independent Trustees and FMR has worked and continues to work to review the Fidelity funds' valuation-related activities, reporting and risk management. Appropriate personnel, including but not limited to the fund's Chief Compliance Officer (CCO), FMR's internal auditor, the independent accountants, the fund's Treasurer and portfolio management personnel, make periodic reports to the Board's committees, as appropriate, including an annual review of FMR's risk management program for the Fidelity funds. The responsibilities of each standing committee, including their oversight responsibilities, are described further under "Standing Committees of the Fund's Trustees."
Annual Report
Trustees and Officers - continued
The fund's Statement of Additional Information (SAI) includes more information about the Trustees. To request a free copy, call Fidelity at 1-800-544-8544.
Interested Trustees*:
Correspondence intended for each Trustee who is an interested person may be sent to Fidelity Investments, 245 Summer Street, Boston, Massachusetts 02210.
Name, Year of Birth; Principal Occupations and Other Relevant Experience+ |
James C. Curvey (1935) |
| Year of Election or Appointment: 2007 Mr. Curvey is Trustee and Chairman of the Board of Trustees of certain Trusts. Mr. Curvey also serves as Trustee (2007-present) of other investment companies advised by FMR. Mr. Curvey is a Director of Fidelity Investments Money Management, Inc. (2009-present), Director of Fidelity Research & Analysis Co. (2009-present) and Director of FMR and FMR Co., Inc. (2007-present). Mr. Curvey is also Vice Chairman (2007-present) and Director of FMR LLC. In addition, Mr. Curvey serves as an Overseer for the Boston Symphony Orchestra and a member of the Trustees of Villanova University. Previously, Mr. Curvey was the Vice Chairman (2006-2007) and Director (2000-2007) of FMR Corp. |
Ronald P. O'Hanley (1957) |
| Year of Election or Appointment: 2011 Mr. O'Hanley serves as a Trustee and Chairman of the Board of Trustees of other Fidelity funds (2013-present), and is Director of FMR Co., Inc. (2010-present), Director of Fidelity Investments Money Management, Inc. (2010-present), Director of Fidelity Research & Analysis Company (2010-present), President of Fidelity Asset Management and Corporate Services and a Member of Fidelity's Executive Committee (2010-present). Previously, Mr. O'Hanley served as President and Chief Executive Officer of BNY Mellon Asset Management (2007-2010). Mr. O'Hanley also served as Vice Chairman of Bank New York Mellon Corp. and a member of that firm's Executive Committee. Prior to the 2007 merger of The Bank of New York and Mellon Financial Corporation, he was Vice Chairman of Mellon Financial Corporation and President and Chief Executive Officer of Mellon Asset Management. He joined Mellon in February 1997. Mr. O'Hanley currently serves as Chairman of the Boston Public Library Foundation Board of Directors and sits on the Board of Directors of Beth Israel Deaconess Medical Center, the Board of Trustees of the Marine Biological Laboratory and the Advisory Board of the Maxwell School of Citizenship and Public Administration at Syracuse University. Mr. O'Hanley also chairs the Council on Asset Management for the Financial Services Roundtable and is a member of the Board of Directors of Institutional Investor's U.S. Institute. |
* Trustees have been determined to be "Interested Trustees" by virtue of, among other things, their affiliation with the trust or various entities under common control with FMR.
+ The information above includes each Trustee's principal occupation during the last five years and other information relating to the experience, attributes, and skills relevant to each Trustee's qualifications to serve as a Trustee, which led to the conclusion that each Trustee should serve as a Trustee for the fund.
Annual Report
Trustees and Officers - continued
Independent Trustees:
Correspondence intended for each Independent Trustee (that is, the Trustees other than the Interested Trustees) may be sent to Fidelity Investments, P.O. Box 55235, Boston, Massachusetts 02205-5235.
Name, Year of Birth; Principal Occupations and Other Relevant Experience+ |
Dennis J. Dirks (1948) |
| Year of Election or Appointment: 2005 Prior to his retirement in May 2003, Mr. Dirks was Chief Operating Officer and a member of the Board of The Depository Trust & Clearing Corporation (DTCC). He also served as President, Chief Operating Officer, and Board member of The Depository Trust Company (DTC) and President and Board member of the National Securities Clearing Corporation (NSCC). In addition, Mr. Dirks served as Chief Executive Officer and Board member of the Government Securities Clearing Corporation, Chief Executive Officer and Board member of the Mortgage-Backed Securities Clearing Corporation, as a Trustee and a member of the Finance Committee of Manhattan College (2005-2008), and as a Trustee and a member of the Finance Committee of AHRC of Nassau County (2006-2008). Mr. Dirks is a member of the Independent Directors Council (IDC) Governing Council (2010-present) and Board of Directors for The Brookville Center for Children's Services, Inc. (2009-present). |
Alan J. Lacy (1953) |
| Year of Election or Appointment: 2008 Mr. Lacy serves as Senior Adviser (2007-present) of Oak Hill Capital Partners, L.P. (private equity). Mr. Lacy also served as Chief Executive Officer (2000-2005) and Vice Chairman (2005-2006) of Sears Holdings Corporation and Sears, Roebuck and Co. (retail). In addition, Mr. Lacy serves as a member of the Board of Directors of Dave & Buster's Entertainment, Inc. (restaurant and entertainment complexes, 2010-present), Earth Fare, Inc. (retail grocery, 2012-present), The Hillman Companies, Inc. (hardware wholesalers, 2010-present), and Bristol-Myers Squibb Company (global pharmaceuticals, 2008-present). Mr. Lacy is a member of the Board of Trustees of The National Parks Conservation Association (2006-present). Previously, Mr. Lacy served as Chairman of the Board of Trustees of the National Parks Conservation Association (2008-2011) and as a member of the Board of Directors for the Western Union Company (global money transfer, 2006-2011). |
Ned C. Lautenbach (1944) |
| Year of Election or Appointment: 2000 Mr. Lautenbach is Chairman of the Independent Trustees of the Equity and High Income Funds (2006-present) and serves as a Trustee of other Fidelity funds (2013-present). Mr. Lautenbach currently serves as the Lead Director of the Eaton Corporation Board of Directors (diversified industrial, 1997-present). Mr. Lautenbach is Chairman of the Board of Directors of the Philharmonic Center for the Arts in Naples, Florida (2012-present) and a member of the Council on Foreign Relations (1994-present). Previously, Mr. Lautenbach was a Partner/Advisory Partner at Clayton, Dubilier & Rice, LLC (private equity investment, 1998-2010), as well as a Director of Sony Corporation (2006-2007). |
Joseph Mauriello (1944) |
| Year of Election or Appointment: 2008 Prior to his retirement in January 2006, Mr. Mauriello served in numerous senior management positions including Deputy Chairman and Chief Operating Officer (2004-2005), and Vice Chairman of Financial Services (2002-2004) of KPMG LLP US (professional services, 1965-2005). Mr. Mauriello currently serves as a member of the Board of Directors of XL Group plc. (global insurance and re-insurance, 2006-present). Previously, Mr. Mauriello served as a Director of the Hamilton Funds of the Bank of New York (2006-2007) and of Arcadia Resources Inc. (health care services and products, 2007-2012). |
Robert W. Selander (1950) |
| Year of Election or Appointment: 2011 Previously, Mr. Selander served as a Member of the Advisory Board of Fidelity's Equity and High Income Funds (2011), Executive Vice Chairman (2010), Chief Executive Officer (2009-2010), and President and Chief Executive Officer (1997-2009) of Mastercard, Inc. |
Cornelia M. Small (1944) |
| Year of Election or Appointment: 2005 Ms. Small is a member of the Board of Directors (2009-present) and Chair of the Investment Committee (2010-present) of the Teagle Foundation. Ms. Small also serves on the Investment Committee of the Berkshire Taconic Community Foundation (2008-present). Previously, Ms. Small served as Chairperson (2002-2008) and a member of the Investment Committee and Chairperson (2008-2012) and a member of the Board of Trustees of Smith College. In addition, Ms. Small served as Chief Investment Officer, Director of Global Equity Investments, and a member of the Board of Directors of Scudder, Stevens & Clark and Scudder Kemper Investments. |
William S. Stavropoulos (1939) |
| Year of Election or Appointment: 2002 Mr. Stavropoulos is Vice Chairman of the Independent Trustees of the Equity and High Income Funds (2006-present) and serves as a Trustee of other Fidelity funds (2013-present). Mr. Stavropoulos serves as President and Founder of the Michigan Baseball Foundation, the Great Lakes Loons (2007-present). Mr. Stavropoulos is Chairman Emeritus of the Board of Directors of The Dow Chemical Company, where he previously served in numerous senior management positions, including President, CEO (1995-2000; 2002-2004), Chairman of the Executive Committee (2000-2006), and as a member of the Board of Directors (1990-2006). Currently, Mr. Stavropoulos is Chairman of the Board of Directors of Univar Inc. (global distributor of commodity and specialty chemicals), a Director of Teradata Corporation (data warehousing and technology solutions), and Maersk Inc. (industrial conglomerate), and a member of the Advisory Board for Metalmark Capital LLC (private equity investment, 2005-present). Mr. Stavropoulos is an operating advisor to Clayton, Dubilier & Rice, LLC (private equity investment). In addition, Mr. Stavropoulos is a member of the University of Notre Dame Advisory Council for the College of Science, a Trustee of the Rollin L. Gerstacker Foundation, and a Director of the Naples Philharmonic Center for the Arts. Previously, Mr. Stavropoulos served as a Director of Chemical Financial Corporation (bank holding company, 1993-2012) and Tyco International, Ltd. (multinational manufacturing and services, 2007-2012). |
David M. Thomas (1949) |
| Year of Election or Appointment: 2008 Previously, Mr. Thomas served as Executive Chairman (2005-2006) and Chairman and Chief Executive Officer (2000-2005) of IMS Health, Inc. (pharmaceutical and healthcare information solutions), and a Director of Fortune Brands, Inc. (consumer products, 2000-2011). In addition, Mr. Thomas serves as Non-Executive Chairman of the Board of Directors of Fortune Brands Home and Security (home and security products, 2011-present), and as a member of the Board of Directors of Interpublic Group of Companies, Inc. (marketing communication, 2004-present). |
+ The information above includes each Trustee's principal occupation during the last five years and other information relating to the experience, attributes, and skills relevant to each Trustee's qualifications to serve as a Trustee, which led to the conclusion that each Trustee should serve as a Trustee for the fund.
Annual Report
Advisory Board Member and Executive Officers:
Correspondence intended for each executive officer and Peter S. Lynch may be sent to Fidelity Investments, 245 Summer Street, Boston, Massachusetts 02210.
Name, Year of Birth; Principal Occupation |
Peter S. Lynch (1944) |
| Year of Election or Appointment: 2003 Member of the Advisory Board of Fidelity's Equity and High Income Funds. Mr. Lynch is Vice Chairman and a Director of FMR and FMR Co., Inc. In addition, Mr. Lynch serves as a Trustee of Boston College and as the Chairman of the Inner-City Scholarship Fund. Previously, Mr. Lynch served on the Special Olympics International Board of Directors (1997-2006). |
Kenneth B. Robins (1969) |
| Year of Election or Appointment: 2008 President and Treasurer of Fidelity's Equity and High Income Funds. Mr. Robins also serves as President and Treasurer (2008-present) and Assistant Treasurer (2009-present) of other Fidelity funds and is an employee of Fidelity Investments (2004-present). Mr. Robins serves as Executive Vice President of Fidelity Investments Money Management, Inc. (FIMM) (2013-present). Previously, Mr. Robins served as Deputy Treasurer of the Fidelity funds (2005-2008) and Treasurer and Chief Financial Officer of The North Carolina Capital Management Trust: Cash and Term Portfolios (2006-2008). |
Bruce T. Herring (1965) |
| Year of Election or Appointment: 2006 Vice President of certain Equity Funds. Mr. Herring also serves as Vice President of other Fidelity funds (2013-present), Chief Investment Officer of Fidelity Global Asset Allocation (GAA) (2013-present), Chief Investment Officer and Director of Fidelity Management & Research (U.K.) Inc. (2010-present), Group Chief Investment Officer of FMR, and President of Fidelity Research & Analysis Company (2010-present). Previously, Mr. Herring served as Vice President (2005-2006) and Senior Vice President (2006-2007) of Fidelity Management & Research Company, Vice President of FMR Co., Inc. (2001-2007) and as a portfolio manager for Fidelity U.S. Equity Funds. |
Brian B. Hogan (1964) |
| Year of Election or Appointment: 2009 Vice President of Equity and High Income Funds. Mr. Hogan also serves as Vice President of other Fidelity funds (2009-present) and President of FMR's Equity Division (2009-present). Previously, Mr. Hogan served as Senior Vice President, Equity Research of FMR (2006-2009) and as a portfolio manager. |
Scott C. Goebel (1968) |
| Year of Election or Appointment: 2008 Secretary and Chief Legal Officer (CLO) of the Fidelity funds. Mr. Goebel also serves as Secretary of Fidelity Investments Money Management, Inc. (FIMM) (2010-present) and Fidelity Research and Analysis Company (FRAC) (2010-present); Secretary and CLO of The North Carolina Capital Management Trust: Cash and Term Portfolios (2008-present); General Counsel, Secretary, and Senior Vice President of FMR (2008-present) and FMR Co., Inc. (2008-present); employed by FMR LLC or an affiliate (2001-present); Chief Legal Officer of Fidelity Management & Research (Hong Kong) Limited (2008-present) and Assistant Secretary of Fidelity Management & Research (Japan) Inc. (2008-present), and Fidelity Management & Research (U.K.) Inc. (2008-present). Previously, Mr. Goebel served as Assistant Secretary of FIMM (2008-2010), FRAC (2008-2010), and the Funds (2007-2008) and as Vice President and Secretary of Fidelity Distributors Corporation (FDC) (2005-2007). |
William C. Coffey (1969) |
| Year of Election or Appointment: 2009 Assistant Secretary of Fidelity's Equity and High Income Funds. Mr. Coffey also serves as Assistant Secretary of other Fidelity funds (2009-present), Senior Vice President and Deputy General Counsel of FMR LLC (2010-present), and is an employee of Fidelity Investments. Previously, Mr. Coffey served as Vice President and Associate General Counsel of FMR LLC (2005-2009). |
Elizabeth Paige Baumann (1968) |
| Year of Election or Appointment: 2012 Anti-Money Laundering (AML) Officer of the Fidelity funds. Ms. Baumann also serves as AML Officer of The North Carolina Capital Management Trust: Cash and Term Portfolios (2012-present), Chief AML Officer of FMR LLC (2012-present), and is an employee of Fidelity Investments. Previously, Ms. Baumann served as Vice President and Deputy Anti-Money Laundering Officer (2007-2012). |
Christine Reynolds (1958) |
| Year of Election or Appointment: 2008 Chief Financial Officer of the Fidelity funds. Ms. Reynolds became President of Fidelity Pricing and Cash Management Services (FPCMS) in August 2008. Ms. Reynolds served as Chief Operating Officer of FPCMS (2007-2008). Previously, Ms. Reynolds served as President, Treasurer, and Anti-Money Laundering officer of the Fidelity funds (2004-2007). |
Joseph A. Hanlon (1968) |
| Year of Election or Appointment: 2012 Chief Compliance Officer of Fidelity's Equity and High Income Funds. Mr. Hanlon also serves as Chief Compliance Officer of other Fidelity funds (2012-present). Mr. Hanlon serves as Compliance Officer of FMR, FMR Co., Inc., Fidelity Investments Money Management, Inc. (FIMM), Fidelity Research and Analysis Company (FRAC), and Fidelity Management & Research (Hong Kong) (2009-present), as Senior Vice President of the Fidelity Asset Management Division (2009-present), and is an employee of Fidelity Investments. Previously, Mr. Hanlon served as Compliance Officer of Fidelity Management & Research (Japan) Inc. (2009-2013), Strategic Advisers, Inc. (2009-2013), and Fidelity Management & Research (U.K.) Inc. (2009-2013). |
Joseph F. Zambello (1957) |
| Year of Election or Appointment: 2011 Deputy Treasurer of the Fidelity funds. Mr. Zambello is an employee of Fidelity Investments. Previously, Mr. Zambello served as Vice President of FMR's Program Management Group (2009-2011) and Vice President of the Transfer Agent Oversight Group (2005-2009). |
Adrien E. Deberghes (1967) |
| Year of Election or Appointment: 2008 Deputy Treasurer of Fidelity's Equity and High Income Funds. Mr. Deberghes also serves as Vice President (2011-present), Deputy Treasurer (2008-present), and Assistant Treasurer (2010-present) of other Fidelity funds, and is an employee of Fidelity Investments (2008-present). Previously, Mr. Deberghes served as Senior Vice President of Mutual Fund Administration at State Street Corporation (2007-2008), Senior Director of Mutual Fund Administration at Investors Bank & Trust (2005-2007), and Director of Finance for Dunkin' Brands (2000-2005). |
Stephen Sadoski (1971) |
| Year of Election or Appointment: 2012 Deputy Treasurer of Fidelity's Equity and High Income Funds. Mr. Sadoski also serves as Deputy Treasurer of other Fidelity funds (2012-present) and is an employee of Fidelity Investments (2012-present). Previously, Mr. Sadoski served as Assistant Treasurer of Fidelity's Fixed Income and Asset Allocation Funds (2012-2013), an assistant chief accountant in the Division of Investment Management of the Securities and Exchange Commission (SEC) (2009-2012) and as a senior manager at Deloitte & Touche LLP (1997-2009). |
Stacie M. Smith (1974) |
| Year of Election or Appointment: 2013 Deputy Treasurer of Fidelity's Equity and High Income Funds. Ms. Smith also serves as Deputy Treasurer of other Fidelity funds (2013-present) and is an employee of Fidelity Investments (2009-present). Previously, Ms. Smith served as Senior Audit Manager of Ernst & Young LLP (1996-2009). |
Stephanie J. Dorsey (1969) |
| Year of Election or Appointment: 2010 Assistant Treasurer of Fidelity's Equity and High Income Funds. Ms. Dorsey also serves as President and Treasurer (2013-present) and Assistant Treasurer (2010-present) of other Fidelity funds, Treasurer and Chief Financial Officer of The North Carolina Capital Management Trust: Cash and Term Portfolios (2013-present), and is an employee of Fidelity Investments (2008-present). Previously, Ms. Dorsey served as Deputy Treasurer of Fidelity's Fixed Income and Asset Allocation Funds (2008-2013), Treasurer (2004-2008) of the JPMorgan Mutual Funds and Vice President (2004-2008) of JPMorgan Chase Bank. |
Gary W. Ryan (1958) |
| Year of Election or Appointment: 2005 Assistant Treasurer of the Fidelity funds. Mr. Ryan is an employee of Fidelity Investments. Previously, Mr. Ryan served as Vice President of Fund Reporting in Fidelity Pricing and Cash Management Services (FPCMS) (1999-2005). |
Jonathan Davis (1968) |
| Year of Election or Appointment: 2010 Assistant Treasurer of the Fidelity funds. Mr. Davis is also Assistant Treasurer of Fidelity Rutland Square Trust II and Fidelity Commonwealth Trust II. Mr. Davis is an employee of Fidelity Investments. Previously, Mr. Davis served as Vice President and Associate General Counsel of FMR LLC (2003-2010). |
Annual Report
The Board of Trustees of Fidelity Dividend Growth Fund voted to pay on record date, the following distributions per share derived from capital gains realized from sales of portfolio securities, and dividends derived from net investment income:
| Pay Date | Record Date | Dividends | Capital Gains |
Dividend Growth | 9/9/13 | 9/06/13 | $0.174 | $2.46 |
The fund hereby designates as a capital gain dividend with respect to the taxable year ended July 31, 2013 $500,005,624, or, if subsequently determined to be different, the net capital gain of such year.
Dividend Growth designates 100% and 93% of the dividends distributed in September 2012 and December 2012, respectively during the fiscal year as qualifying for the dividends-received deduction for corporate shareholders.
Dividend Growth designates 100% of the dividends distributed during the fiscal year as amounts which may be taken into account as a dividend for the purposes of the maximum rate under section 1(h)(11) of the Internal Revenue Code.
The fund will notify shareholders in January 2014 of amounts for use in preparing 2013 income tax returns.
Annual Report
Board Approval of Investment Advisory Contracts and Management Fees
Fidelity Dividend Growth Fund
Each year, the Board of Trustees, including the Independent Trustees (together, the Board), votes on the renewal of the management contract and sub-advisory agreements (together, the Advisory Contracts) for the fund. The Board, assisted by the advice of fund counsel and Independent Trustees' counsel, requests and considers a broad range of information relevant to the renewal of the Advisory Contracts throughout the year.
The Board meets regularly and, at each of its meetings, covers an extensive agenda of topics and materials and considers factors that are relevant to its annual consideration of the renewal of the fund's Advisory Contracts, including the services and support provided to the fund and its shareholders. The Board has established various standing committees, each composed of and chaired by Independent Trustees with varying backgrounds, to which the Board has assigned specific subject matter responsibilities in order to enhance effective decision-making by the Board. The Board, acting directly and through its Committees, requests and receives information concerning the annual consideration of the renewal of the fund's Advisory Contracts. The Board also meets as needed to consider matters specifically related to the Board's annual consideration of the renewal of Advisory Contracts. Members of the Board may also meet with trustees of other Fidelity funds through ad hoc joint committees to discuss certain matters relevant to the Fidelity funds.
At its July 2013 meeting, the Board, including the Independent Trustees, unanimously determined to renew the fund's Advisory Contracts. In reaching its determination, the Board considered all factors it believed relevant, including (i) the nature, extent, and quality of the services to be provided to the fund and its shareholders (including the investment performance of the fund); (ii) the competitiveness of the fund's management fee and total expense ratio relative to peer funds; (iii) the total costs of the services to be provided by and the profits to be realized by Fidelity from its relationship with the fund; (iv) the extent to which economies of scale exist and would be realized as the fund grows; and (v) whether fee levels reflect these economies of scale, if any, for the benefit of fund shareholders.
In considering whether to renew the Advisory Contracts for the fund, the Board reached a determination, with the assistance of fund counsel and Independent Trustees' counsel and through the exercise of its business judgment, that the renewal of the Advisory Contracts was in the best interests of the fund and its shareholders and that the compensation payable under the Advisory Contracts was fair and reasonable. The Board's decision to renew the Advisory Contracts was not based on any single factor, but rather was based on a comprehensive consideration of all the information provided to the Board at its meetings throughout the year. The Board, in reaching its determination to renew the Advisory Contracts, was aware that shareholders in the fund have a broad range of investment choices available to them, including a wide choice among mutual funds offered by Fidelity's competitors, and that the fund's shareholders, who have the opportunity to review and weigh the disclosure provided by the fund in its prospectus and other public disclosures, have chosen to invest in this fund, which is a part of the Fidelity family of funds.
Annual Report
Nature, Extent, and Quality of Services Provided. The Board considered the staffing within the investment adviser, Fidelity Management & Research Company (FMR), and the sub-advisers (together, the Investment Advisers) as it relates to the fund, including the backgrounds of the fund's investment personnel, and also considered the fund's investment objective, strategies, and related investment philosophy. The Independent Trustees also had discussions with senior management of Fidelity's investment operations and investment groups. The Board considered the structure of the portfolio manager compensation program and whether this structure provides appropriate incentives to act in the best interests of the fund.
Resources Dedicated to Investment Management and Support Services. The Board and the Fund Oversight and Research Committees reviewed the general qualifications and capabilities of the Investment Advisers' investment staff, including its size, education, experience, and resources, as well as the Investment Advisers' approach to recruiting, training, managing, and compensating investment personnel. The Board noted that FMR has continued to increase the resources devoted to non-U.S. offices, including expansion of Fidelity's global investment organization. The Board also noted that Fidelity's analysts have extensive resources, tools and capabilities that allow them to conduct sophisticated quantitative and fundamental analysis, as well as credit analysis of issuers, counterparties and guarantors. Further, the Board believes that Fidelity's investment professionals have sufficient access to global information and data so as to provide competitive investment results over time, and that those professionals also have access to sophisticated tools that permit them to assess portfolio construction and risk and performance attribution characteristics continuously, as well as to transmit new information and research conclusions rapidly around the world. Additionally, in its deliberations, the Board considered the Investment Advisers' trading and risk management capabilities and resources, which are an integral part of the investment management process.
Shareholder and Administrative Services. The Board considered (i) the nature, extent, quality, and cost of advisory, administrative, and shareholder services performed by the Investment Advisers and their affiliates under the Advisory Contracts and under separate agreements covering transfer agency, pricing and bookkeeping, and securities lending services for the fund; (ii) the nature and extent of the supervision of third party service providers, principally custodians and subcustodians; and (iii) the resources devoted to, and the record of compliance with, the fund's compliance policies and procedures. The Board also reviewed the allocation of fund brokerage, including allocations to brokers affiliated with the Investment Advisers, the use of brokerage commissions to pay fund expenses, and the use of "soft" commission dollars to pay for research services.
Annual Report
Board Approval of Investment Advisory Contracts and
Management Fees - continued
The Board noted that the growth of fund assets over time across the complex allows Fidelity to reinvest in the development of services designed to enhance the value or convenience of the Fidelity funds as investment vehicles. These services include 24-hour access to account information and market information through telephone representatives and over the Internet, investor education materials and asset allocation tools, and the expanded availability of Fidelity Investor Centers.
Investment in a Large Fund Family. The Board considered the benefits to shareholders of investing in a Fidelity fund, including the benefits of investing in a fund that is part of a large family of funds offering a variety of investment disciplines and providing a large variety of mutual fund investor services. The Board noted that Fidelity had taken, or had made recommendations that resulted in the Fidelity funds taking, a number of actions over the previous year that benefited particular funds, including (i) continuing to dedicate additional resources to investment research and to the support of the senior management team that oversees asset management; (ii) persisting in efforts to enhance Fidelity's global research capabilities; (iii) launching new funds and making other enhancements to meet client needs for global and income-oriented solutions; (iv) continuing to launch dedicated lower cost underlying funds to meet portfolio construction needs related to expanding underlying fund options for Fidelity funds of funds, specifically for the Freedom Fund product lines; (v) rationalizing product lines and gaining increased efficiencies through the mergers of several funds into other funds; (vi) strengthening Fidelity's index fund offerings by reducing investment minimums and adopting or lowering existing expense caps for certain funds and classes; (vii) enhancing Global Asset Allocation product offerings by launching new funds and strategies, including "open architecture" target date funds that utilize affiliated and unaffiliated sub-advisers; (viii) modifying the eligibility criteria for Institutional Class shares of Advisor funds to increase their marketability to a portion of the defined contribution plan market; (ix) creating a new low-cost retirement share class for certain Advisor funds to appeal to large retirement plans; (x) transitioning the management of certain Fidelity commodity funds to Geode Capital Management LLC, a registered commodity pool operator, while retaining administrative responsibilities for the funds; (xi) reorganizing a number of funds; and (xii) taking steps toward establishing a new Fidelity adviser to manage sector-based funds and products.
Investment Performance. The Board considered whether the fund has operated in accordance with its investment objective, as well as its record of compliance with its investment restrictions and its performance history.
The Board took into account discussions with the Investment Advisers about fund investment performance that occur at Board meetings throughout the year. In this regard the Board noted that as part of regularly scheduled fund reviews and other reports to the Board on fund performance, the Board periodically considers annualized return information for the fund, for different time periods, measured against a securities market index ("benchmark index") and a peer group of mutual funds with similar objectives ("peer group"). In its evaluation of fund investment performance, the Board gave particular attention to information indicating changes in performance of certain Fidelity funds for specific time periods and the Investment Advisers' explanations for any overperformance or, in the case of the fund, underperformance.
Annual Report
In addition to reviewing absolute and relative fund performance, the Independent Trustees periodically consider the appropriateness of fund performance metrics in evaluating the results achieved. In general, the Independent Trustees believe that fund performance should be evaluated based on net performance (after fees and expenses) of both the highest performing and lowest performing classes, where applicable, compared to appropriate benchmark indices, over appropriate time periods which may include full market cycles, and compared to peer groups, as applicable, over the same periods, taking into account relevant factors including the following: general market conditions; issuer-specific information; tactical opportunities for investment; and fund cash flows and other factors.
The Independent Trustees recognize that shareholders evaluate performance on a net basis over their own holding periods, for which one-, three-, and five-year periods are used as a proxy. For this reason, the performance information reviewed by the Board also included net cumulative calendar year total return information for the fund and an appropriate benchmark index and peer group for the most recent one-, three-, and five-year periods, as shown below. Returns are shown compared to the 25th percentile (top of box) and 75th percentile (bottom of box) of the peer universe.
Annual Report
Board Approval of Investment Advisory Contracts and
Management Fees - continued
Fidelity Dividend Growth Fund

The Board has discussed the fund's performance with FMR, including the fund's underperformance based on more recent periods ended after 2012 (which periods are not shown in the chart above) but prior to the date of the Board's approval of the renewal of the Advisory Contracts, and has engaged with FMR to consider what steps might be taken to remediate the fund's more recent underperformance.
The Board also considered that the fund's management fee is subject to upward or downward adjustment depending upon whether, and to what extent, the fund's investment performance for the performance period exceeds, or is exceeded by, a securities index, thus leading to a performance adjustment for the same period. The Board noted that the performance adjustment provides FMR with a strong economic incentive to seek to achieve superior performance for the fund's shareholders and helps to more closely align the interests of FMR and the fund's shareholders.
Based on its review, the Board concluded that the nature, extent, and quality of services provided to the fund under the Advisory Contracts should benefit the fund's shareholders.
Competitiveness of Management Fee and Total Expense Ratio. The Board considered the fund's management fee and total expense ratio compared to "mapped groups" of competitive funds and classes. Fidelity creates "mapped groups" by combining similar Lipper investment objective categories that have comparable management fee characteristics. Combining Lipper investment objective categories aids the Board's management fee and total expense ratio comparisons by broadening the competitive group used for comparison and by reducing the number of universes to which various Fidelity funds are compared.
Annual Report
Management Fee. The Board considered two proprietary management fee comparisons for the 12-month periods shown in the chart below. The group of Lipper funds used by the Board for management fee comparisons is referred to below as the "Total Mapped Group." The Total Mapped Group comparison focuses on a fund's standing in terms of gross management fees before expense reimbursements or caps, and without giving effect to the fund's performance adjustment, relative to the total universe of funds with comparable investment mandates, regardless of whether their management fee structures also are comparable. Funds with comparable investment mandates offer exposure to similar types of securities. Funds with comparable management fee structures have similar management fee contractual arrangements (e.g., flat rate charged for advisory services, all-inclusive fee rate, etc.). "TMG %" represents the percentage of funds in the Total Mapped Group that had management fees that were lower than the fund's. For example, a TMG % of 11% means that 89% of the funds in the Total Mapped Group had higher management fees than the fund. The "Asset-Size Peer Group" (ASPG) comparison focuses on a fund's standing relative to a subset of non-Fidelity funds within the Total Mapped Group that are similar in size and management fee structure. The ASPG represents at least 15% of the funds in the Total Mapped Group with comparable asset size and management fee structures, subject to a minimum of 50 funds (or all funds in the Total Mapped Group if fewer than 50). Additional information, such as the ASPG quartile in which the fund's management fee ranked and the impact of the fund's performance adjustment, is also included in the chart and considered by the Board.
Fidelity Dividend Growth Fund

Annual Report
Board Approval of Investment Advisory Contracts and
Management Fees - continued
The Board noted that the fund's management fee ranked below the median of its Total Mapped Group and below the median of its ASPG for 2012. The Board also noted the effect of the fund's positive performance adjustment on the fund's management fee ranking.
Based on its review, the Board concluded that the fund's management fee is fair and reasonable in light of the services that the fund receives and the other factors considered.
Total Expense Ratio. In its review of each class's total expense ratio, the Board considered the fund's management fee as well as other fund or class expenses, as applicable, such as transfer agent fees, pricing and bookkeeping fees, and custodial, legal, and audit fees. The Board also noted the effects of any waivers and reimbursements on fees and expenses, as well as the impact of the fund's performance adjustment. As part of its review, the Board also considered the current and historical total expense ratios of each class of the fund compared to competitive fund median expenses. Each class of the fund is compared to those funds and classes in the Total Mapped Group (used by the Board for management fee comparisons) that have a similar sales load structure.
The Board noted that the total expense ratio of each class ranked below its competitive median for 2012.
Fees Charged to Other Fidelity Clients. The Board also considered Fidelity fee structures and other information with respect to clients of FMR and its affiliates, such as other mutual funds advised or subadvised by FMR or its affiliates, pension plan clients, and other institutional clients. The Board noted the findings of the 2013 ad hoc joint committee (created with the board of other Fidelity funds), which reviewed and compared Fidelity's institutional investment advisory business with its business of providing services to the Fidelity funds, including the differences in services provided, fees charged, and costs incurred, as well as competition in their respective marketplaces.
Based on its review of total expense ratios and fees charged to other Fidelity clients, the Board concluded that the total expense ratio of each class of the fund was reasonable in light of the services that the fund and its shareholders receive and the other factors considered.
Costs of the Services and Profitability. The Board considered the revenues earned and the expenses incurred by Fidelity in conducting the business of developing, marketing, distributing, managing, administering and servicing the fund and servicing the fund's shareholders. The Board also considered the level of Fidelity's profits in respect of all the Fidelity funds.
On an annual basis, FMR presents to the Board Fidelity's profitability for the fund. Fidelity calculates the profitability for each fund, as well as aggregate profitability for groups of Fidelity funds and all Fidelity funds, using a series of detailed revenue and cost allocation methodologies which originate with the books and records of Fidelity on which Fidelity's audited financial statements are based. The Audit Committee of the Board reviews any significant changes from the prior year's methodologies.
Annual Report
PricewaterhouseCoopers LLP (PwC), independent registered public accounting firm and auditor to Fidelity and certain Fidelity funds, has been engaged annually by the Board as part of the Board's assessment of Fidelity's profitability analysis. PwC's engagement includes the review and assessment of the methodologies used by Fidelity in determining the revenues and expenses attributable to Fidelity's mutual fund business, and completion of agreed-upon procedures surrounding the mathematical accuracy of fund profitability and its conformity to allocation methodologies. After considering PwC's reports issued under the engagement and information provided by Fidelity, the Board concluded that while other allocation methods may also be reasonable, Fidelity's profitability methodologies are reasonable in all material respects.
The Board also reviewed Fidelity's non-fund businesses and fall-out benefits related to the mutual fund business as well as cases where Fidelity's affiliates may benefit from or be related to the fund's business.
The Board considered the costs of the services provided by and the profits realized by Fidelity in connection with the operation of the fund and was satisfied that the profitability was not excessive in the circumstances.
Economies of Scale. The Board considered whether there have been economies of scale in respect of the management of the Fidelity funds, whether the Fidelity funds (including the fund) have appropriately benefited from any such economies of scale, and whether there is potential for realization of any further economies of scale. The Board considered the extent to which the fund will benefit from economies of scale through increased services to the fund, through waivers or reimbursements, or through fee or expense reductions. The Board also noted that in 2009, it and the board of other Fidelity funds created an ad hoc committee (the Economies of Scale Committee) to analyze whether FMR attains economies of scale in respect of the management and servicing of the Fidelity funds, whether the Fidelity funds have appropriately benefited from such economies of scale, and whether there is potential for realization of any further economies of scale.
The Board recognized that the fund's management contract incorporates a "group fee" structure, which provides for lower group fee rates as total fund assets under FMR's management increase, and for higher group fee rates as total fund assets under FMR's management decrease. FMR calculates the group fee rates based on a tiered asset "breakpoint" schedule that varies based on asset class. The Board considered that the group fee is designed to deliver the benefits of economies of scale to fund shareholders when total Fidelity fund assets increase, even if assets of any particular fund are unchanged or have declined, because some portion of Fidelity's costs are attributable to services provided to all Fidelity funds, and all funds benefit if those costs can be allocated among more assets. The Board concluded that, given the group fee structure, fund shareholders will benefit from lower management fees as assets under FMR's management increase at the fund complex level, regardless of whether Fidelity achieves any such economies of scale.
Annual Report
Board Approval of Investment Advisory Contracts and
Management Fees - continued
The Board concluded, taking into account the analysis of the Economies of Scale Committee, that economies of scale, if any, are being appropriately shared between fund shareholders and Fidelity.
Amendment to Description of Group Fee Rate. At its July 2013 meeting, the Board voted to approve an amendment to the fund's management contract to modify the description of the "group fee rate" effective August 1, 2013. The Board noted that under the prior description in the contract, the group fee rate was based on the average net assets of all registered investment companies with which FMR has management contracts. Under the contract's tiered asset breakpoint schedule, the group fee rate is lower as total fund assets under FMR's management increase, and higher as total fund assets under FMR's management decrease. The Board considered that the prior description would have excluded the assets of 64 Fidelity sector funds from the group fee rate calculation once Fidelity SelectCo, LLC, an affiliate of FMR, assumed management responsibilities for those funds. The Board noted that modifying the description of the group fee rate to continue to include the assets of those 64 funds for purposes of determining group fee rate breakpoints would avoid an immediate adverse impact on the group fee rate for any fund.
Additional Information Requested by the Board. In order to develop fully the factual basis for consideration of the Fidelity funds' Advisory Contracts, the Board requested and received additional information on certain topics, including: (i) fund performance trends and Fidelity's long-term strategies for certain funds; (ii) the potential to further rationalize the Fidelity fund lineup with the possibility of achieving savings for the funds and Fidelity; (iii) the methodology with respect to competitive fund data and peer group classifications; (iv) the arrangements with, and performance of, certain sub-advisers on behalf of the Fidelity funds, as well as certain proposed participating affiliate arrangements; (v) the realization of fall-out benefits in certain Fidelity business units; (vi) Fidelity's group fee structures, including the rationale for the individual fee rates of certain categories of funds and the definition of group assets; (vii) trends regarding industry use of performance fee structures and the performance adjustment methodologies applicable to the Fidelity funds; (viii) additional competitive analysis regarding the total expenses for certain classes; and (ix) fund profitability methodology, including Fidelity's cost allocation methodology, and the impact of certain factors on fund profitability results.
Annual Report
Based on its evaluation of all of the conclusions noted above, and after considering all factors it believed relevant, the Board ultimately concluded that the advisory fee structures are fair and reasonable, and that the fund's Advisory Contracts should be renewed.
Annual Report
Investment Adviser
Fidelity Management & Research Company
Boston, MA
Investment Sub-Advisers
FMR Co., Inc.
Fidelity Management & Research
(U.K.) Inc.
Fidelity Management & Research
(Hong Kong) Limited
Fidelity Management & Research
(Japan) Inc.
General Distributor
Fidelity Distributors Corporation
Smithfield, RI
Transfer and Service Agents
Fidelity Investments Institutional
Operations Company, Inc.
Boston, MA
Fidelity Service Company, Inc.
Boston, MA
Custodian
Citibank, N.A.,
New York, NY
The Fidelity Telephone Connection
Mutual Fund 24-Hour Service
Exchanges/Redemptions
and Account Assistance 1-800-544-6666
Product Information 1-800-544-6666
Retirement Accounts 1-800-544-4774 (8 a.m. - 9 p.m.)
TDD Service 1-800-544-0118 for the deaf and hearing impaired
(9 a.m. - 9 p.m. Eastern time)
Fidelity Automated Service
Telephone (FAST®)
1-800-544-5555
Automated line for quickest service
(Fidelity Investment logo)(registered trademark)
Corporate Headquarters
245 Summer St., Boston, MA 02210
www.fidelity.com
DGF-UANN-0913
1.789245.110
Fidelity®
Dividend Growth
Fund -
Class K
Annual Report
July 31, 2013
(Fidelity Cover Art)
Contents
Performance | (Click Here) | How the fund has done over time. |
Management's Discussion of Fund Performance | (Click Here) | The Portfolio Manager's review of fund performance and strategy. |
Shareholder Expense Example | (Click Here) | An example of shareholder expenses. |
Investment Changes | (Click Here) | A summary of major shifts in the fund's investments over the past six months. |
Investments | (Click Here) | A complete list of the fund's investments with their market values. |
Financial Statements | (Click Here) | Statements of assets and liabilities, operations, and changes in net assets, as well as financial highlights. |
Notes | (Click Here) | Notes to the financial statements. |
Report of Independent Registered Public Accounting Firm | (Click Here) | |
Trustees and Officers | (Click Here) | |
Distributions | (Click Here) | |
Board Approval of Investment Advisory Contracts and Management Fees | (Click Here) | |
To view a fund's proxy voting guidelines and proxy voting record for the 12-month period ended June 30, visit http://www.fidelity.com/proxyvotingresults or visit the Securities and Exchange Commission's (SEC) web site at http://www.sec.gov. You may also call 1-800-835-5092 to request a free copy of the proxy voting guidelines.
Standard & Poor's, S&P and S&P 500 are registered service marks of The McGraw-Hill Companies, Inc. and have been licensed for use by Fidelity Distributors Corporation.
Other third-party marks appearing herein are the property of their respective owners.
All other marks appearing herein are registered or unregistered trademarks or service marks of FMR LLC or an affiliated company. © 2013 FMR LLC. All rights reserved.
Annual Report
This report and the financial statements contained herein are submitted for the general information of the shareholders of the fund. This report is not authorized for distribution to prospective investors in the fund unless preceded or accompanied by an effective prospectus.
A fund files its complete schedule of portfolio holdings with the SEC for the first and third quarters of each fiscal year on Form N-Q. Forms N-Q are available on the SEC's web site at http://www.sec.gov. A fund's Forms N-Q may be reviewed and copied at the SEC's Public Reference Room in Washington, DC. Information regarding the operation of the SEC's Public Reference Room may be obtained by calling 1-800-SEC-0330. For a complete list of a fund's portfolio holdings, view the most recent holdings listing, semiannual report, or annual report on Fidelity's web site at http://www.fidelity.com, http://www.advisor.fidelity.com, or http://www.401k.com, as applicable.
NOT FDIC INSURED • MAY LOSE VALUE • NO BANK GUARANTEE
Neither the fund nor Fidelity Distributors Corporation is a bank.
Annual Report
Average annual total return reflects the change in the value of an investment, assuming reinvestment of the class' distributions from dividend income and capital gains (the profits earned upon the sale of securities that have grown in value, if any) and assuming a constant rate of performance each year. The $10,000 table and the fund's returns do not reflect the deduction of taxes that a shareholder would pay on fund distributions or the redemption of fund shares. During periods of reimbursement by Fidelity, a fund's total return will be greater than it would be had the reimbursement not occurred. How a fund did yesterday is no guarantee of how it will do tomorrow.
Average Annual Total Returns
Periods ended July 31, 2013 | Past 1
year | Past 5
years | Past 10
years |
Class K A | 27.04% | 9.37% | 6.68% |
A The initial offering of Class K shares took place on May 9, 2008. Returns prior to May 9, 2008 are those of Fidelity® Dividend Growth Fund, the original class of the fund.
$10,000 Over 10 Years
Let's say hypothetically that $10,000 was invested in Fidelity® Dividend Growth Fund - Class K on July 31, 2003. The chart shows how the value of your investment would have changed, and also shows how the S&P 500® Index performed over the same period. The initial offering of Class K took place on May 9, 2008. See above for additional information regarding the performance of Class K.
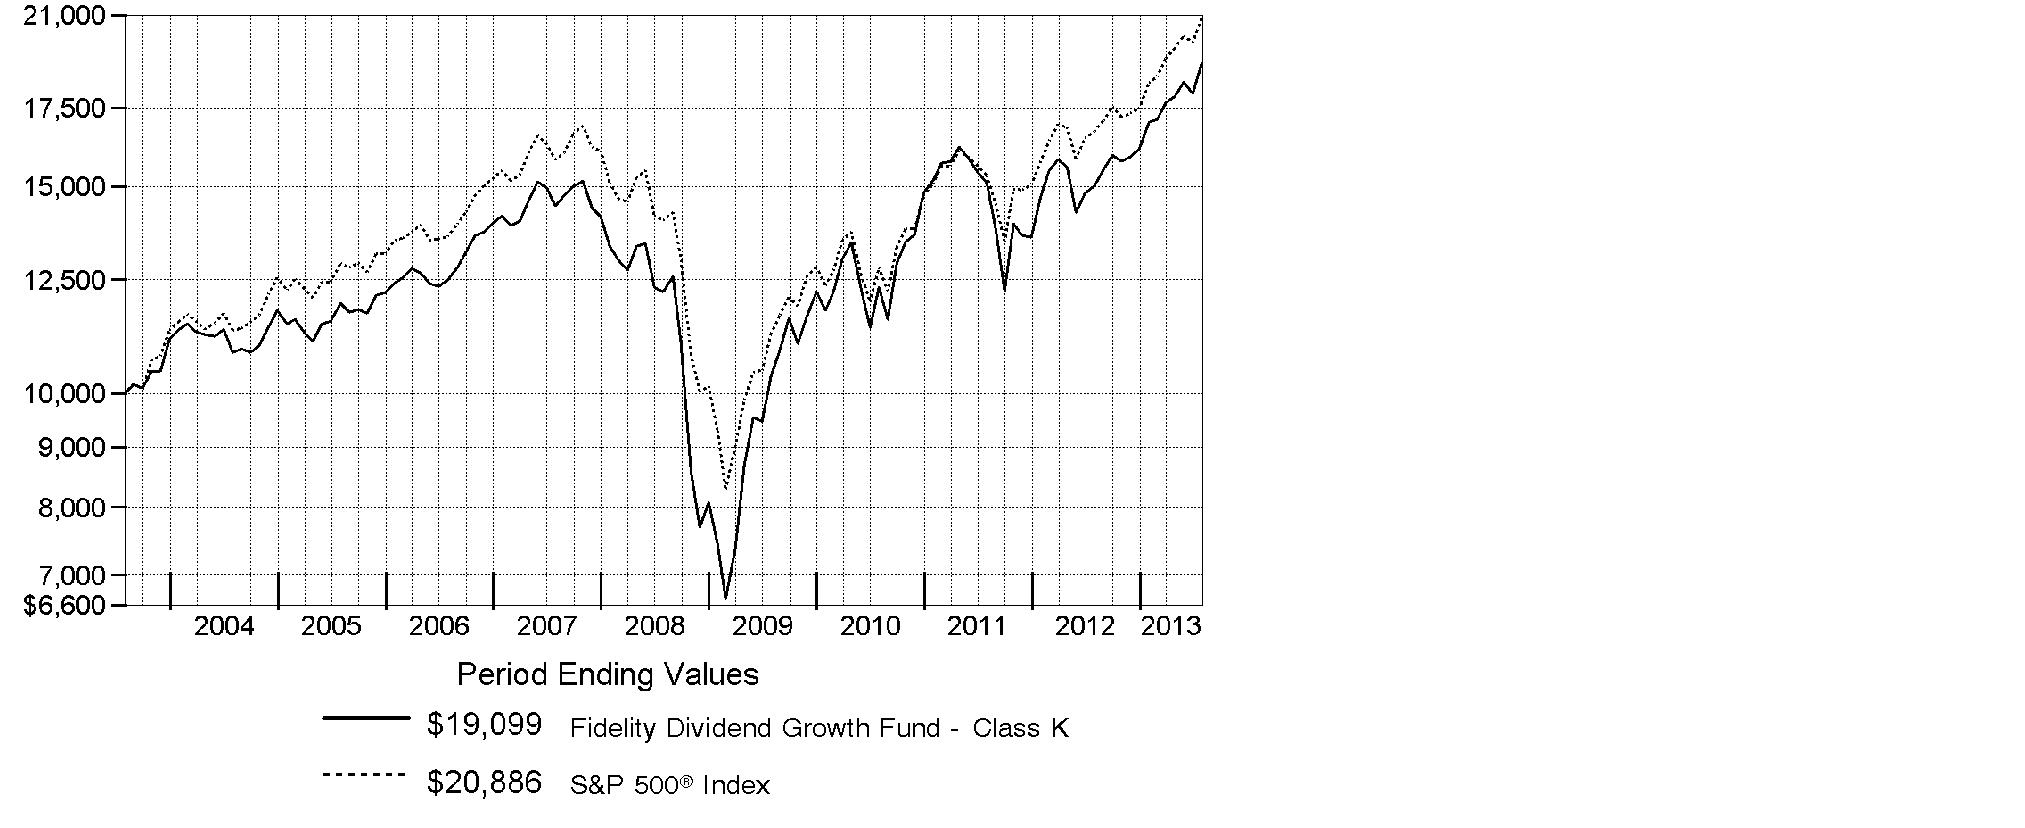
Annual Report
Market Recap: The bull run in U.S. stocks comfortably settled into a fifth year, as major equity benchmarks ripped through records during the 12 months ending July 31, 2013. Gains were fueled by a generally improving global economy and accommodative monetary policies worldwide. The tone was positive for most of the year, based largely on stronger U.S. economic data, including employment, housing and consumer sentiment. Setting a series of new highs along the way, the broad-based S&P 500® Index rose an impressive 25.00% for the 12 months, while the blue-chip-laden Dow Jones Industrial AverageSM also moved into record territory en route to a 22.36% gain. The growth-oriented Nasdaq Composite Index® had a similarly strong run, advancing 25.15%. During the year, markets were resilient amid intermittent volatility over debt woes in Europe, the 2012 U.S. presidential election and year-end Congressional gridlock over the federal budget. In mid-to-late June, concern arose about the U.S. Federal Reserve possibly tapering its sustaining bond-buying strategy - which prompted a brief, but steep, market sell-off. However, investors' continued quest for yield and the Fed's pledge to keep buying bonds until the economy showed significant improvement overpowered the uncertainty and helped equities climb notably higher in July to close the period on a strong note.
Comments from Lawrence Rakers, Portfolio Manager of Fidelity® Dividend Growth Fund: For the year, the fund's Class K shares returned 27.04%, topping the S&P 500®. When constructing the portfolio, I try to strike a balance between growth potential and income. For example, I avoided or significantly underweighted some lagging large-cap index stocks that had healthy dividend yields but, in my view, unexciting growth prospects, including telecommunication services carrier AT&T, energy major Exxon Mobil, information technology services provider IBM and personal computer chip manufacturer Intel, the four largest contributors to the fund's performance versus the index. Additionally, overweighting stocks in the mid-cap category worked in the fund's favor. Noteworthy individual contributors included non-index stakes in Green Mountain Coffee Roasters and Brookdale Senior Living. Conversely, the fund was hampered by weak picks in materials, where Ivanplats and Turquoise Hill Resources, both Canada-based metals miners, fared poorly, as did U.K.-headquartered gold miner Randgold Resources. Relatively light representation and unrewarding picks in diversified financials - in particular, underweighting strong-performing index component Bank of America - also worked against the fund's results. During the period, I significantly boosted the fund's allocation to this group.
The views expressed above reflect those of the portfolio manager(s) only through the end of the period as stated on the cover of this report and do not necessarily represent the views of Fidelity or any other person in the Fidelity organization. Any such views are subject to change at any time based upon market or other conditions and Fidelity disclaims any responsibility to update such views. These views may not be relied on as investment advice and, because investment decisions for a Fidelity fund are based on numerous factors, may not be relied on as an indication of trading intent on behalf of any Fidelity fund.
Annual Report
Shareholder Expense Example
As a shareholder of the Fund, you incur two types of costs: (1) transaction costs, and (2) ongoing costs, including management fees and other Fund expenses. This Example is intended to help you understand your ongoing costs (in dollars) of investing in the Fund and to compare these costs with the ongoing costs of investing in other mutual funds.
The Example is based on an investment of $1,000 invested at the beginning of the period and held for the entire period (February 1, 2013 to July 31, 2013).
Actual Expenses
The first line of the accompanying table for each class of the Fund provides information about actual account values and actual expenses. You may use the information in this line, together with the amount you invested, to estimate the expenses that you paid over the period. Simply divide your account value by $1,000.00 (for example, an $8,600 account value divided by $1,000.00 = 8.6), then multiply the result by the number in the first line for a class of the Fund under the heading entitled "Expenses Paid During Period" to estimate the expenses you paid on your account during this period. A small balance maintenance fee of $12.00 that is charged once a year may apply for certain accounts with a value of less than $2,000. This fee is not included in the table below. If it was, the estimate of expenses you paid during the period would be higher, and your ending account value lower, by this amount. In addition, the Fund, as a shareholder in the underlying Fidelity Central Funds, will indirectly bear its pro-rata share of the fees and expenses incurred by the underlying Fidelity Central Funds. These fees and expenses are not included in the Fund's annualized expense ratio used to calculate the expense estimate in the table below.
Hypothetical Example for Comparison Purposes
The second line of the accompanying table for each class of the Fund provides information about hypothetical account values and hypothetical expenses based on a Class' actual expense ratio and an assumed rate of return of 5% per year before expenses, which is not the Class' actual return. The hypothetical account values and expenses may not be used to estimate the actual ending account balance or expenses you paid for the period. You may use this information to compare the ongoing costs of investing in the Fund and other funds. To do so, compare this 5% hypothetical example with the 5% hypothetical examples that appear in the shareholder reports of the other funds. A small balance maintenance fee of $12.00 that is charged once a year may apply for certain accounts with a value of less than $2,000. This fee is not included in the table below. If it was, the estimate of expenses you paid during the period would be higher, and your ending account value lower, by this amount. In addition, the Fund, as a shareholder in the underlying Fidelity Central Funds, will indirectly bear its pro-rata share of the fees and expenses incurred by the underlying Fidelity Central Funds. These fees and expenses are not included in the Fund's annualized expense ratio used to calculate the expense estimate in the table below.
Please note that the expenses shown in the table are meant to highlight your ongoing costs only and do not reflect any transaction costs. Therefore, the second line of the table is useful in comparing ongoing costs only, and will not help you determine the relative total costs of owning different funds.
Annual Report
| Annualized Expense RatioB | Beginning
Account Value
February 1, 2013 | Ending
Account Value
July 31, 2013 | Expenses Paid
During Period*
February 1, 2013
to July 31, 2013 |
Dividend Growth | .58% | | | |
Actual | | $ 1,000.00 | $ 1,122.30 | $ 3.05 |
HypotheticalA | | $ 1,000.00 | $ 1,021.92 | $ 2.91 |
Class K | .44% | | | |
Actual | | $ 1,000.00 | $ 1,123.00 | $ 2.32 |
HypotheticalA | | $ 1,000.00 | $ 1,022.61 | $ 2.21 |
A 5% return per year before expenses
B Annualized expense ratio reflects expenses net of applicable fee waivers.
* Expenses are equal to each Class' annualized expense ratio, multiplied by the average account value over the period, multiplied by 181/365 (to reflect the one-half year period).
Annual Report
Investment Changes (Unaudited)
Top Ten Stocks as of July 31, 2013 |
| % of fund's
net assets | % of fund's net assets
6 months ago |
Apple, Inc. | 2.8 | 3.1 |
Wells Fargo & Co. | 1.7 | 1.7 |
General Electric Co. | 1.7 | 1.0 |
Citigroup, Inc. | 1.7 | 1.3 |
Google, Inc. Class A | 1.6 | 1.5 |
Procter & Gamble Co. | 1.4 | 1.2 |
JPMorgan Chase & Co. | 1.4 | 0.9 |
Bank of America Corp. | 1.3 | 0.0 |
Johnson & Johnson | 1.3 | 1.4 |
Philip Morris International, Inc. | 1.2 | 1.1 |
| 16.1 | |
Top Five Market Sectors as of July 31, 2013 |
| % of fund's
net assets | % of fund's net assets
6 months ago |
Information Technology | 16.8 | 18.5 |
Financials | 16.1 | 14.1 |
Health Care | 13.8 | 12.7 |
Consumer Discretionary | 12.9 | 12.3 |
Industrials | 12.5 | 12.6 |
Asset Allocation (% of fund's net assets) |
As of July 31, 2013* | As of January 31, 2013** |
| Stocks 98.6% | | | Stocks 98.6% | |
| Bonds 0.1% | | | Bonds 0.1% | |
| Convertible
Securities 0.6% | | | Convertible
Securities 0.7% | |
| Short-Term
Investments and
Net Other Assets (Liabilities) 0.7% | | | Short-Term
Investments and
Net Other Assets (Liabilities) 0.6% | |
* Foreign investments | 18.4% | | ** Foreign investments | 18.8% | |

Annual Report
Investments July 31, 2013
Showing Percentage of Net Assets
Common Stocks - 98.5% |
| Shares | | Value (000s) |
CONSUMER DISCRETIONARY - 12.8% |
Auto Components - 0.2% |
Delphi Automotive PLC | 278,506 | | $ 14,961 |
Johnson Controls, Inc. | 86,242 | | 3,468 |
| | 18,429 |
Automobiles - 0.7% |
Ford Motor Co. | 2,243,730 | | 37,874 |
Harley-Davidson, Inc. | 160,035 | | 9,085 |
Honda Motor Co. Ltd. | 249,600 | | 9,245 |
| | 56,204 |
Diversified Consumer Services - 0.7% |
Anhanguera Educacional Participacoes SA | 2,186,400 | | 13,254 |
H&R Block, Inc. | 1,184,428 | | 37,227 |
Kroton Educacional SA | 702,800 | | 10,012 |
| | 60,493 |
Hotels, Restaurants & Leisure - 1.6% |
Brinker International, Inc. | 818,163 | | 32,849 |
Icahn Enterprises LP rights (a) | 1,067,316 | | 0 |
Las Vegas Sands Corp. | 114,960 | | 6,388 |
Penn National Gaming, Inc. (a) | 21,600 | | 1,080 |
Starbucks Corp. | 388,344 | | 27,666 |
Texas Roadhouse, Inc. Class A | 543,764 | | 13,290 |
Wyndham Worldwide Corp. | 285,533 | | 17,789 |
Yum! Brands, Inc. | 426,150 | | 31,075 |
| | 130,137 |
Household Durables - 0.4% |
Harman International Industries, Inc. | 19,800 | | 1,198 |
Taylor Wimpey PLC | 5,248,749 | | 8,504 |
Toll Brothers, Inc. (a) | 226,805 | | 7,455 |
Whirlpool Corp. | 111,778 | | 14,972 |
| | 32,129 |
Leisure Equipment & Products - 0.4% |
Amer Group PLC (A Shares) | 333,861 | | 6,631 |
Brunswick Corp. | 175,321 | | 6,618 |
Polaris Industries, Inc. | 138,104 | | 15,487 |
| | 28,736 |
Media - 4.3% |
CBS Corp. Class B | 1,015,907 | | 53,681 |
Comcast Corp. Class A | 1,803,406 | | 81,298 |
Ipsos SA | 115,900 | | 4,121 |
MDC Partners, Inc. Class A (sub. vtg.) | 998,439 | | 24,572 |
Common Stocks - continued |
| Shares | | Value (000s) |
CONSUMER DISCRETIONARY - continued |
Media - continued |
Mood Media Corp. (a)(h)(i) | 888,800 | | $ 935 |
Omnicom Group, Inc. | 246,226 | | 15,825 |
Pico Far East Holdings Ltd. | 628,000 | | 219 |
Smiles SA | 883,300 | | 10,841 |
The Walt Disney Co. | 659,229 | | 42,619 |
Time Warner, Inc. | 514,307 | | 32,021 |
Twenty-First Century Fox, Inc. Class A | 1,137,693 | | 33,994 |
Valassis Communications, Inc. | 152,155 | | 4,356 |
Viacom, Inc. Class B (non-vtg.) | 648,423 | | 47,186 |
| | 351,668 |
Multiline Retail - 0.0% |
The Bon-Ton Stores, Inc. | 187,100 | | 3,529 |
Specialty Retail - 3.7% |
American Eagle Outfitters, Inc. | 865,752 | | 17,003 |
Ascena Retail Group, Inc. (a) | 238,728 | | 4,557 |
Body Central Corp. (a) | 573,065 | | 6,911 |
Express, Inc. (a) | 568,801 | | 12,826 |
Foot Locker, Inc. | 231,743 | | 8,373 |
Francescas Holdings Corp. (a) | 162,375 | | 4,037 |
GNC Holdings, Inc. | 206,500 | | 10,899 |
Home Depot, Inc. | 971,864 | | 76,806 |
Kingfisher PLC | 1,621,400 | | 9,805 |
L Brands, Inc. | 303,218 | | 16,910 |
Lowe's Companies, Inc. | 1,062,808 | | 47,380 |
OfficeMax, Inc. | 863,181 | | 9,832 |
Rent-A-Center, Inc. | 625,257 | | 25,004 |
Ross Stores, Inc. | 165,491 | | 11,166 |
Staples, Inc. | 1,184,806 | | 20,165 |
TJX Companies, Inc. | 510,970 | | 26,591 |
| | 308,265 |
Textiles, Apparel & Luxury Goods - 0.8% |
Coach, Inc. | 143,694 | | 7,634 |
Kering SA (e) | 62,904 | | 14,402 |
Kering SA rights 10/1/13 (a) | 61,204 | | 170 |
NIKE, Inc. Class B | 392,168 | | 24,675 |
Common Stocks - continued |
| Shares | | Value (000s) |
CONSUMER DISCRETIONARY - continued |
Textiles, Apparel & Luxury Goods - continued |
PVH Corp. | 45,275 | | $ 5,967 |
VF Corp. | 62,531 | | 12,319 |
| | 65,167 |
TOTAL CONSUMER DISCRETIONARY | | 1,054,757 |
CONSUMER STAPLES - 10.4% |
Beverages - 2.6% |
Anheuser-Busch InBev SA NV | 266,200 | | 25,598 |
Beam, Inc. | 97,074 | | 6,309 |
Coca-Cola Enterprises, Inc. | 211,920 | | 7,955 |
Cott Corp. | 1,102,100 | | 9,217 |
Dr. Pepper Snapple Group, Inc. | 641,778 | | 29,997 |
Molson Coors Brewing Co. Class B | 93,400 | | 4,676 |
Monster Beverage Corp. (a) | 418,325 | | 25,514 |
Remy Cointreau SA | 38,000 | | 3,934 |
SABMiller PLC | 219,800 | | 10,768 |
The Coca-Cola Co. | 2,235,502 | | 89,599 |
| | 213,567 |
Food & Staples Retailing - 1.8% |
CVS Caremark Corp. | 958,037 | | 58,910 |
Kroger Co. | 749,620 | | 29,438 |
Rami Levi Chain Stores Hashikma Marketing 2006 Ltd. | 177,460 | | 9,162 |
Wal-Mart Stores, Inc. | 117,374 | | 9,148 |
Walgreen Co. | 878,558 | | 44,148 |
| | 150,806 |
Food Products - 1.9% |
Amira Nature Foods Ltd. | 586,439 | | 4,750 |
Archer Daniels Midland Co. | 513,395 | | 18,724 |
Bunge Ltd. | 172,367 | | 13,102 |
Danone SA | 15,972 | | 1,262 |
Green Mountain Coffee Roasters, Inc. (a) | 256,810 | | 19,821 |
Hilton Food Group PLC | 665,674 | | 4,122 |
Ingredion, Inc. | 204,752 | | 13,759 |
Kellogg Co. | 348,785 | | 23,104 |
Marine Harvest ASA | 9,142,378 | | 9,216 |
Mead Johnson Nutrition Co. Class A | 147,044 | | 10,711 |
Mondelez International, Inc. | 1,224,744 | | 38,298 |
| | 156,869 |
Common Stocks - continued |
| Shares | | Value (000s) |
CONSUMER STAPLES - continued |
Household Products - 2.1% |
Energizer Holdings, Inc. | 288,229 | | $ 29,342 |
Procter & Gamble Co. | 1,488,053 | | 119,491 |
Svenska Cellulosa AB (SCA) (B Shares) | 650,480 | | 17,215 |
Unicharm Corp. (e) | 78,800 | | 4,201 |
| | 170,249 |
Personal Products - 0.2% |
Hengan International Group Co. Ltd. | 652,500 | | 7,168 |
Herbalife Ltd. | 199,300 | | 13,054 |
| | 20,222 |
Tobacco - 1.8% |
Altria Group, Inc. | 18,671 | | 655 |
British American Tobacco PLC (United Kingdom) | 311,900 | | 16,639 |
Japan Tobacco, Inc. | 1,022,600 | | 35,772 |
Philip Morris International, Inc. | 1,099,053 | | 98,014 |
| | 151,080 |
TOTAL CONSUMER STAPLES | | 862,793 |
ENERGY - 10.1% |
Energy Equipment & Services - 3.5% |
BW Offshore Ltd. | 8,762,498 | | 11,569 |
Cameron International Corp. (a) | 664,989 | | 39,434 |
Ensco PLC Class A | 766,567 | | 43,955 |
Essential Energy Services Ltd. | 3,613,600 | | 9,147 |
Halliburton Co. | 732,459 | | 33,100 |
National Oilwell Varco, Inc. | 732,461 | | 51,397 |
Noble Corp. | 397,823 | | 15,197 |
Schlumberger Ltd. | 645,410 | | 52,491 |
ShawCor Ltd. | 86,200 | | 3,873 |
Vantage Drilling Co. (a) | 7,095,626 | | 13,056 |
Xtreme Drilling & Coil Services Corp. (a) | 3,438,460 | | 12,387 |
Xtreme Drilling & Coil Services Corp. (g) | 1,117,800 | | 4,027 |
| | 289,633 |
Oil, Gas & Consumable Fuels - 6.6% |
Access Midstream Partners LP | 293,561 | | 13,789 |
Americas Petrogas, Inc. (a) | 1,310,800 | | 1,493 |
Americas Petrogas, Inc. (a)(g) | 2,665,500 | | 3,036 |
Anadarko Petroleum Corp. | 394,725 | | 34,941 |
Apache Corp. | 211,420 | | 16,966 |
Common Stocks - continued |
| Shares | | Value (000s) |
ENERGY - continued |
Oil, Gas & Consumable Fuels - continued |
Atlas Energy LP | 79,534 | | $ 4,196 |
Atlas Pipeline Partners LP | 387,221 | | 14,676 |
BPZ Energy, Inc. (a)(e) | 2,730,178 | | 6,580 |
Cabot Oil & Gas Corp. | 129,000 | | 9,781 |
Cimarex Energy Co. | 116,689 | | 8,919 |
Coal India Ltd. | 139,162 | | 644 |
Cobalt International Energy, Inc. (a) | 709,915 | | 20,481 |
Concho Resources, Inc. (a) | 169,074 | | 15,164 |
ConocoPhillips | 222,758 | | 14,448 |
Crown Point Energy, Inc. (g)(h) | 1,619,916 | | 339 |
Double Eagle Petroleum Co. (a)(f) | 873,975 | | 3,050 |
Emerald Oil, Inc. warrants 2/4/16 (a) | 171,198 | | 0 |
Energen Corp. | 381,758 | | 22,863 |
EOG Resources, Inc. | 92,979 | | 13,528 |
EQT Corp. | 228,450 | | 19,761 |
Halcon Resources Corp. (a) | 910,000 | | 4,987 |
InterOil Corp. (a)(e) | 334,378 | | 28,656 |
Magellan Midstream Partners LP | 89,822 | | 4,911 |
Marathon Oil Corp. | 287,629 | | 10,458 |
Marathon Petroleum Corp. | 124,536 | | 9,132 |
Markwest Energy Partners LP | 376,828 | | 26,457 |
Motor Oil (HELLAS) Corinth Refineries SA | 21,700 | | 220 |
Noble Energy, Inc. | 150,500 | | 9,405 |
Northern Oil & Gas, Inc. (a) | 2,218,140 | | 29,302 |
Occidental Petroleum Corp. | 567,023 | | 50,493 |
Painted Pony Petroleum Ltd. (g) | 456,400 | | 3,310 |
Painted Pony Petroleum Ltd. Class A (a) | 186,700 | | 1,354 |
Peabody Energy Corp. | 1,030,489 | | 17,065 |
Phillips 66 | 310,168 | | 19,075 |
Phillips 66 Partners LP | 157,095 | | 5,085 |
Royal Dutch Shell PLC Class A sponsored ADR | 200,098 | | 13,677 |
Scorpio Tankers, Inc. | 495,100 | | 4,926 |
Southcross Energy Partners LP | 527,828 | | 12,024 |
Suncor Energy, Inc. | 337,900 | | 10,679 |
Synergy Resources Corp. (a) | 598,600 | | 4,639 |
TAG Oil Ltd. (a)(e)(f) | 3,585,500 | | 13,370 |
TAG Oil Ltd. (f)(g) | 146,900 | | 548 |
Common Stocks - continued |
| Shares | | Value (000s) |
ENERGY - continued |
Oil, Gas & Consumable Fuels - continued |
The Williams Companies, Inc. | 1,097,738 | | $ 37,510 |
Valero Energy Corp. | 104,849 | | 3,750 |
| | 545,688 |
TOTAL ENERGY | | 835,321 |
FINANCIALS - 16.0% |
Capital Markets - 2.3% |
AllianceBernstein Holding LP | 709,485 | | 15,751 |
Ameriprise Financial, Inc. | 100,653 | | 8,958 |
BlackRock, Inc. Class A | 79,032 | | 22,284 |
GP Investments Ltd. Class A (depositary receipt) (a) | 3,540,079 | | 5,741 |
Invesco Ltd. | 588,479 | | 18,943 |
KKR & Co. LP | 601,705 | | 12,305 |
Monex Group, Inc. | 35,129 | | 14,208 |
Morgan Stanley | 801,899 | | 21,820 |
Oaktree Capital Group LLC Class A | 279,974 | | 15,116 |
The Blackstone Group LP | 468,715 | | 10,570 |
UBS AG (NY Shares) | 2,348,179 | | 46,189 |
| | 191,885 |
Commercial Banks - 3.3% |
Bank of Ireland (a) | 124,509 | | 28 |
Barclays PLC sponsored ADR | 1,652,893 | | 28,893 |
Commerce Bancshares, Inc. | 186,332 | | 8,502 |
Guaranty Trust Bank PLC GDR (Reg. S) | 318,323 | | 2,521 |
Huntington Bancshares, Inc. | 125,890 | | 1,076 |
Itau Unibanco Holding SA sponsored ADR | 485,257 | | 6,187 |
M&T Bank Corp. | 68,449 | | 7,999 |
Nordea Bank AB | 827,600 | | 10,481 |
PNC Financial Services Group, Inc. | 305,803 | | 23,256 |
Sberbank (Savings Bank of the Russian Federation) sponsored ADR | 390,100 | | 4,521 |
U.S. Bancorp | 1,010,715 | | 37,720 |
Wells Fargo & Co. | 3,280,127 | | 142,686 |
| | 273,870 |
Consumer Finance - 0.8% |
Capital One Financial Corp. | 712,667 | | 49,188 |
SLM Corp. | 734,300 | | 18,145 |
| | 67,333 |
Common Stocks - continued |
| Shares | | Value (000s) |
FINANCIALS - continued |
Diversified Financial Services - 5.2% |
Bank of America Corp. | 7,427,827 | | $ 108,446 |
Citigroup, Inc. | 2,571,171 | | 134,061 |
IntercontinentalExchange, Inc. (a) | 7,900 | | 1,441 |
JPMorgan Chase & Co. | 2,083,059 | | 116,089 |
McGraw-Hill Companies, Inc. | 520,386 | | 32,191 |
ORIX Corp. | 659,800 | | 9,805 |
PICO Holdings, Inc. (a)(f) | 1,210,990 | | 26,509 |
| | 428,542 |
Insurance - 2.5% |
ACE Ltd. | 185,252 | | 16,928 |
AFLAC, Inc. | 268,881 | | 16,585 |
Allied World Assurance Co. Holdings Ltd. | 87,329 | | 8,266 |
Arthur J. Gallagher & Co. | 154,592 | | 6,861 |
Assured Guaranty Ltd. | 1,773,784 | | 38,385 |
Axis Capital Holdings Ltd. | 98,029 | | 4,270 |
Everest Re Group Ltd. | 68,392 | | 9,132 |
Fidelity National Financial, Inc. Class A | 947,797 | | 23,202 |
Marsh & McLennan Companies, Inc. | 237,339 | | 9,937 |
MetLife, Inc. | 626,123 | | 30,317 |
ProAssurance Corp. | 19,533 | | 1,046 |
Prudential Financial, Inc. | 254,116 | | 20,068 |
Prudential PLC | 236,985 | | 4,209 |
The Travelers Companies, Inc. | 205,096 | | 17,136 |
| | 206,342 |
Real Estate Investment Trusts - 1.4% |
American Tower Corp. | 200,983 | | 14,228 |
Beni Stabili SpA SIIQ | 14,096,400 | | 9,140 |
CBL & Associates Properties, Inc. | 485,556 | | 11,056 |
Corrections Corp. of America | 125,668 | | 4,153 |
Cousins Properties, Inc. | 1,138,286 | | 11,667 |
Education Realty Trust, Inc. | 912,700 | | 8,607 |
Lexington Corporate Properties Trust | 632,940 | | 7,937 |
Parkway Properties, Inc. | 212,700 | | 3,722 |
Piedmont Office Realty Trust, Inc. Class A | 239,000 | | 4,324 |
Prologis, Inc. | 232,493 | | 8,918 |
Retail Properties America, Inc. | 125,705 | | 1,771 |
Simon Property Group, Inc. | 33,821 | | 5,413 |
SL Green Realty Corp. | 48,956 | | 4,438 |
Common Stocks - continued |
| Shares | | Value (000s) |
FINANCIALS - continued |
Real Estate Investment Trusts - continued |
Westfield Group unit | 720,383 | | $ 7,265 |
Weyerhaeuser Co. | 572,558 | | 16,261 |
| | 118,900 |
Real Estate Management & Development - 0.4% |
CBRE Group, Inc. (a) | 1,079,469 | | 25,011 |
CSI Properties Ltd. | 92,130,000 | | 3,801 |
Jones Lang LaSalle, Inc. | 14,344 | | 1,306 |
LEG Immobilien AG | 36,192 | | 1,820 |
| | 31,938 |
Thrifts & Mortgage Finance - 0.1% |
Radian Group, Inc. | 444,600 | | 6,247 |
TOTAL FINANCIALS | | 1,325,057 |
HEALTH CARE - 13.6% |
Biotechnology - 3.2% |
Agios Pharmaceuticals, Inc. | 115,200 | | 3,359 |
Alexion Pharmaceuticals, Inc. (a) | 85,800 | | 9,973 |
Alnylam Pharmaceuticals, Inc. (a) | 534,300 | | 24,669 |
Amgen, Inc. | 540,309 | | 58,510 |
Biogen Idec, Inc. (a) | 126,581 | | 27,611 |
Bluebird Bio, Inc. | 100,701 | | 3,135 |
Gilead Sciences, Inc. (a) | 1,059,863 | | 65,129 |
Grifols SA ADR | 568,297 | | 18,038 |
Infinity Pharmaceuticals, Inc. (a) | 674,412 | | 14,284 |
Insmed, Inc. (a) | 118,712 | | 1,319 |
Isis Pharmaceuticals, Inc. (a) | 331,000 | | 9,549 |
KaloBios Pharmaceuticals, Inc. | 150,700 | | 907 |
KaloBios Pharmaceuticals, Inc. (g) | 454,437 | | 2,736 |
Merrimack Pharmaceuticals, Inc. (a) | 391,800 | | 1,873 |
Theravance, Inc. (a) | 675,004 | | 26,028 |
| | 267,120 |
Health Care Equipment & Supplies - 1.3% |
Ansell Ltd. | 216,050 | | 3,600 |
Baxter International, Inc. | 301,517 | | 22,023 |
Boston Scientific Corp. (a) | 1,494,058 | | 16,315 |
Covidien PLC | 222,784 | | 13,730 |
Genmark Diagnostics, Inc. (a) | 807,700 | | 7,673 |
Hill-Rom Holdings, Inc. | 276,883 | | 10,264 |
Medtronic, Inc. | 14,400 | | 795 |
Common Stocks - continued |
| Shares | | Value (000s) |
HEALTH CARE - continued |
Health Care Equipment & Supplies - continued |
Stryker Corp. | 381,077 | | $ 26,851 |
Zimmer Holdings, Inc. | 109,658 | | 9,154 |
| | 110,405 |
Health Care Providers & Services - 3.2% |
Accretive Health, Inc. (a) | 518,455 | | 5,174 |
AmerisourceBergen Corp. | 418,087 | | 24,362 |
AmSurg Corp. (a) | 212,753 | | 8,321 |
BioScrip, Inc. (a) | 160,910 | | 2,615 |
Brookdale Senior Living, Inc. (a) | 1,618,439 | | 47,129 |
Catamaran Corp. (a) | 79,000 | | 4,161 |
DaVita, Inc. (a) | 126,075 | | 14,676 |
Emeritus Corp. (a) | 603,933 | | 14,005 |
Express Scripts Holding Co. (a) | 630,457 | | 41,326 |
McKesson Corp. | 214,640 | | 26,328 |
Qualicorp SA (a) | 897,300 | | 6,568 |
Quest Diagnostics, Inc. | 280,310 | | 16,345 |
UnitedHealth Group, Inc. | 702,175 | | 51,153 |
| | 262,163 |
Life Sciences Tools & Services - 0.2% |
Agilent Technologies, Inc. | 193,889 | | 8,673 |
Lonza Group AG | 97,821 | | 7,526 |
| | 16,199 |
Pharmaceuticals - 5.7% |
AbbVie, Inc. | 974,540 | | 44,322 |
Actavis, Inc. (a) | 168,673 | | 22,648 |
Allergan, Inc. | 42,000 | | 3,827 |
Biodelivery Sciences International, Inc. (a) | 1,210,638 | | 5,230 |
Bristol-Myers Squibb Co. | 28,719 | | 1,242 |
Cadence Pharmaceuticals, Inc. (a) | 2,091,940 | | 15,627 |
Dechra Pharmaceuticals PLC | 369,717 | | 3,841 |
Endo Health Solutions, Inc. (a) | 290,674 | | 11,179 |
GlaxoSmithKline PLC | 801,023 | | 20,493 |
Horizon Pharma, Inc. (a)(e) | 3,209,598 | | 8,088 |
Horizon Pharma, Inc.: | | | |
warrants 2/28/17 (a) | 253,903 | | 0 * |
warrants 9/25/17 (a) | 932,200 | | 1 |
Jazz Pharmaceuticals PLC (a) | 16,097 | | 1,215 |
Johnson & Johnson | 1,132,316 | | 105,872 |
Merck & Co., Inc. | 1,336,814 | | 64,394 |
Common Stocks - continued |
| Shares | | Value (000s) |
HEALTH CARE - continued |
Pharmaceuticals - continued |
Novo Nordisk A/S Series B | 116,837 | | $ 19,823 |
Perrigo Co. | 34,500 | | 4,291 |
Pfizer, Inc. | 1,494,239 | | 43,677 |
Sanofi SA | 395,924 | | 41,447 |
Teva Pharmaceutical Industries Ltd. sponsored ADR | 326,750 | | 12,972 |
Valeant Pharmaceuticals International, Inc. (Canada) (a) | 201,991 | | 18,742 |
Warner Chilcott PLC | 882,450 | | 18,805 |
| | 467,736 |
TOTAL HEALTH CARE | | 1,123,623 |
INDUSTRIALS - 12.5% |
Aerospace & Defense - 2.0% |
Astronics Corp. (a) | 43,200 | | 1,707 |
Finmeccanica SpA (a)(e) | 939,566 | | 4,910 |
General Dynamics Corp. | 107,917 | | 9,210 |
Honeywell International, Inc. | 504,471 | | 41,861 |
Meggitt PLC | 1,904,110 | | 15,859 |
Textron, Inc. | 455,952 | | 12,484 |
The Boeing Co. | 79,000 | | 8,303 |
United Technologies Corp. | 664,926 | | 70,196 |
| | 164,530 |
Air Freight & Logistics - 0.4% |
United Parcel Service, Inc. Class B | 400,710 | | 34,782 |
Airlines - 0.1% |
Copa Holdings SA Class A | 18,033 | | 2,510 |
easyJet PLC | 123,200 | | 2,646 |
| | 5,156 |
Building Products - 0.6% |
A.O. Smith Corp. | 158,012 | | 6,529 |
Masco Corp. | 1,911,369 | | 39,221 |
| | 45,750 |
Commercial Services & Supplies - 0.6% |
Iron Mountain, Inc. | 395,171 | | 10,986 |
KAR Auction Services, Inc. | 21,500 | | 547 |
Multiplus SA | 839,400 | | 11,358 |
Republic Services, Inc. | 405,917 | | 13,765 |
Swisher Hygiene, Inc. (a) | 2,081,064 | | 1,675 |
Common Stocks - continued |
| Shares | | Value (000s) |
INDUSTRIALS - continued |
Commercial Services & Supplies - continued |
Waste Management, Inc. | 259,086 | | $ 10,889 |
West Corp. | 174,000 | | 3,821 |
| | 53,041 |
Construction & Engineering - 0.3% |
Boart Longyear Ltd. | 3,560,729 | | 1,648 |
Fluor Corp. | 104,872 | | 6,561 |
MasTec, Inc. (a) | 112,139 | | 3,701 |
URS Corp. | 226,724 | | 10,543 |
| | 22,453 |
Electrical Equipment - 1.9% |
Alstom SA | 361,384 | | 12,221 |
AMETEK, Inc. | 256,842 | | 11,887 |
Bharat Heavy Electricals Ltd. | 1,340,049 | | 3,486 |
Eaton Corp. PLC | 289,245 | | 19,943 |
Emerson Electric Co. | 423,816 | | 26,010 |
Generac Holdings, Inc. | 458,494 | | 19,876 |
Hubbell, Inc. Class B | 118,067 | | 12,674 |
Polypore International, Inc. (a) | 201,347 | | 8,455 |
Prysmian SpA | 675,700 | | 13,735 |
Regal-Beloit Corp. | 228,766 | | 14,797 |
Roper Industries, Inc. | 105,858 | | 13,334 |
| | 156,418 |
Industrial Conglomerates - 2.0% |
3M Co. | 46,800 | | 5,496 |
Alliance Global Group, Inc. | 395,500 | | 239 |
Carlisle Companies, Inc. | 124,000 | | 8,400 |
General Electric Co. | 5,759,075 | | 140,349 |
Koninklijke Philips Electronics NV | 443,500 | | 14,183 |
| | 168,667 |
Machinery - 2.3% |
Andritz AG | 82,700 | | 4,461 |
Cummins, Inc. | 167,984 | | 20,358 |
Dover Corp. | 53,195 | | 4,556 |
GEA Group AG | 158,184 | | 6,527 |
Global Brass & Copper Holdings, Inc. | 389,900 | | 7,264 |
Harsco Corp. | 403,763 | | 10,401 |
Illinois Tool Works, Inc. | 234,465 | | 16,891 |
Ingersoll-Rand PLC | 521,961 | | 31,866 |
Manitowoc Co., Inc. | 1,221,919 | | 25,086 |
Common Stocks - continued |
| Shares | | Value (000s) |
INDUSTRIALS - continued |
Machinery - continued |
Pentair Ltd. | 319,562 | | $ 19,519 |
Stanley Black & Decker, Inc. | 384,996 | | 32,578 |
Timken Co. | 154,683 | | 9,037 |
Weg SA | 269,600 | | 3,309 |
| | 191,853 |
Marine - 0.1% |
Ardmore Shipping Corp. | 502,600 | | 7,036 |
Ultrapetrol (Bahamas) Ltd. (a) | 1,822,163 | | 5,594 |
| | 12,630 |
Professional Services - 0.7% |
CRA International, Inc. (a) | 303,982 | | 5,818 |
Dun & Bradstreet Corp. | 323,101 | | 33,483 |
Manpower, Inc. | 79,700 | | 5,330 |
Michael Page International PLC | 1,354,386 | | 9,200 |
Randstad Holding NV | 75,000 | | 3,618 |
Towers Watson & Co. | 25,200 | | 2,123 |
| | 59,572 |
Road & Rail - 1.2% |
Con-way, Inc. | 208,596 | | 8,646 |
CSX Corp. | 675,822 | | 16,767 |
Norfolk Southern Corp. | 174,220 | | 12,746 |
Union Pacific Corp. | 379,565 | | 60,195 |
| | 98,354 |
Trading Companies & Distributors - 0.3% |
Houston Wire & Cable Co. | 624,888 | | 9,267 |
Watsco, Inc. | 135,225 | | 12,623 |
| | 21,890 |
TOTAL INDUSTRIALS | | 1,035,096 |
INFORMATION TECHNOLOGY - 16.6% |
Communications Equipment - 1.9% |
Cisco Systems, Inc. | 3,661,647 | | 93,555 |
QUALCOMM, Inc. | 987,140 | | 63,720 |
| | 157,275 |
Computers & Peripherals - 3.2% |
Apple, Inc. | 515,180 | | 233,117 |
Common Stocks - continued |
| Shares | | Value (000s) |
INFORMATION TECHNOLOGY - continued |
Computers & Peripherals - continued |
NCR Corp. (a) | 364,477 | | $ 13,121 |
Western Digital Corp. | 242,588 | | 15,618 |
| | 261,856 |
Electronic Equipment & Components - 0.6% |
Corning, Inc. | 872,662 | | 13,256 |
Jabil Circuit, Inc. | 497,524 | | 11,438 |
TE Connectivity Ltd. | 459,696 | | 23,463 |
| | 48,157 |
Internet Software & Services - 2.2% |
Active Network, Inc. (a) | 1,074,299 | | 9,164 |
Demandware, Inc. (a) | 145,490 | | 6,463 |
Facebook, Inc. Class A (a) | 111,300 | | 4,099 |
Google, Inc. Class A (a) | 148,993 | | 132,246 |
Mail.Ru Group Ltd.: | | | |
GDR (g) | 16,600 | | 530 |
GDR (Reg. S) | 264,700 | | 8,457 |
Velti PLC (a)(e) | 3,152,629 | | 3,562 |
Velti PLC (i) | 1,639,166 | | 1,667 |
Yahoo!, Inc. (a) | 564,025 | | 15,843 |
| | 182,031 |
IT Services - 3.1% |
Accenture PLC Class A | 413,393 | | 30,513 |
Amdocs Ltd. | 279,154 | | 10,739 |
Cognizant Technology Solutions Corp. Class A (a) | 312,144 | | 22,596 |
EPAM Systems, Inc. (a) | 518,505 | | 15,011 |
EVERTEC, Inc. | 148,674 | | 3,553 |
ExlService Holdings, Inc. (a) | 294,059 | | 8,234 |
Fidelity National Information Services, Inc. | 491,135 | | 21,197 |
MasterCard, Inc. Class A | 55,823 | | 34,086 |
Sapient Corp. (a) | 1,016,603 | | 13,938 |
Total System Services, Inc. | 492,029 | | 13,487 |
Virtusa Corp. (a) | 66,454 | | 1,713 |
Visa, Inc. Class A | 453,628 | | 80,297 |
| | 255,364 |
Office Electronics - 0.3% |
Xerox Corp. | 2,852,181 | | 27,666 |
Semiconductors & Semiconductor Equipment - 2.2% |
Altera Corp. | 179,517 | | 6,384 |
Applied Materials, Inc. | 265,975 | | 4,338 |
Common Stocks - continued |
| Shares | | Value (000s) |
INFORMATION TECHNOLOGY - continued |
Semiconductors & Semiconductor Equipment - continued |
Applied Micro Circuits Corp. (a) | 308,235 | | $ 3,659 |
ASML Holding NV | 549,636 | | 49,412 |
Avago Technologies Ltd. | 600,169 | | 22,014 |
Broadcom Corp. Class A | 211,151 | | 5,821 |
Freescale Semiconductor Holdings I Ltd. (a)(e) | 384,133 | | 6,031 |
LTX-Credence Corp. (a) | 1,375,632 | | 7,373 |
Maxim Integrated Products, Inc. | 362,194 | | 10,359 |
Microchip Technology, Inc. (e) | 53,935 | | 2,143 |
Micron Technology, Inc. (a) | 1,061,096 | | 14,060 |
Monolithic Power Systems, Inc. | 168,606 | | 4,414 |
NXP Semiconductors NV (a) | 390,903 | | 12,763 |
Samsung Electronics Co. Ltd. | 13,300 | | 15,150 |
Skyworks Solutions, Inc. (a) | 956,399 | | 22,973 |
SunPower Corp. (a)(e) | 14,400 | | 398 |
| | 187,292 |
Software - 3.1% |
Activision Blizzard, Inc. | 1,643,717 | | 29,554 |
Adobe Systems, Inc. (a) | 147,067 | | 6,953 |
Autodesk, Inc. (a) | 132,000 | | 4,671 |
Check Point Software Technologies Ltd. (a) | 180,237 | | 10,149 |
Citrix Systems, Inc. (a) | 325,711 | | 23,458 |
Comverse, Inc. | 290,251 | | 9,091 |
Constellation Software, Inc. | 60,700 | | 8,856 |
Electronic Arts, Inc. (a) | 838,686 | | 21,906 |
Intuit, Inc. | 118,428 | | 7,570 |
MICROS Systems, Inc. (a) | 147,660 | | 7,195 |
Microsoft Corp. | 1,950,293 | | 62,078 |
Oracle Corp. | 1,619,223 | | 52,382 |
SS&C Technologies Holdings, Inc. (a) | 31,664 | | 1,133 |
Symantec Corp. | 361,533 | | 9,646 |
| | 254,642 |
TOTAL INFORMATION TECHNOLOGY | | 1,374,283 |
MATERIALS - 3.5% |
Chemicals - 1.8% |
Albemarle Corp. | 123,566 | | 7,662 |
Ashland, Inc. | 140,606 | | 12,210 |
Axiall Corp. | 198,880 | | 8,767 |
Cabot Corp. | 276,992 | | 11,362 |
Common Stocks - continued |
| Shares | | Value (000s) |
MATERIALS - continued |
Chemicals - continued |
Croda International PLC | 18,000 | | $ 687 |
Eastman Chemical Co. | 208,697 | | 16,785 |
FMC Corp. | 7,200 | | 476 |
LyondellBasell Industries NV Class A | 306,016 | | 21,026 |
Monsanto Co. | 326,312 | | 32,233 |
Potash Corp. of Saskatchewan, Inc. | 10,800 | | 313 |
PPG Industries, Inc. | 107,693 | | 17,278 |
Royal DSM NV | 19,800 | | 1,391 |
RPM International, Inc. | 409,045 | | 14,415 |
W.R. Grace & Co. (a) | 39,825 | | 3,059 |
| | 147,664 |
Construction Materials - 0.2% |
Lafarge SA (Bearer) (e) | 100,900 | | 6,452 |
Vulcan Materials Co. | 284,130 | | 13,405 |
| | 19,857 |
Containers & Packaging - 0.3% |
Nampak Ltd. | 2,559,600 | | 8,276 |
Rock-Tenn Co. Class A | 131,957 | | 15,089 |
| | 23,365 |
Metals & Mining - 1.0% |
Commercial Metals Co. | 290,896 | | 4,506 |
Freeport-McMoRan Copper & Gold, Inc. | 467,995 | | 13,235 |
Goldcorp, Inc. | 643,100 | | 18,139 |
Ivanplats Ltd. (g) | 7,025,028 | | 9,918 |
Randgold Resources Ltd. sponsored ADR | 225,856 | | 16,774 |
Turquoise Hill Resources Ltd. (a) | 3,201,536 | | 12,811 |
Walter Energy, Inc. (e) | 384,400 | | 4,301 |
| | 79,684 |
Paper & Forest Products - 0.2% |
Boise Cascade Co. | 152,400 | | 4,033 |
International Paper Co. | 321,858 | | 15,549 |
| | 19,582 |
TOTAL MATERIALS | | 290,152 |
Common Stocks - continued |
| Shares | | Value (000s) |
TELECOMMUNICATION SERVICES - 1.0% |
Diversified Telecommunication Services - 0.3% |
CenturyLink, Inc. | 488,772 | | $ 17,522 |
Verizon Communications, Inc. | 144,058 | | 7,128 |
| | 24,650 |
Wireless Telecommunication Services - 0.7% |
Megafon OJSC GDR | 166,500 | | 5,286 |
Mobile TeleSystems OJSC sponsored ADR (e) | 449,582 | | 8,762 |
SBA Communications Corp. Class A (a) | 244,961 | | 18,149 |
SoftBank Corp. | 93,400 | | 5,953 |
Vodafone Group PLC | 4,915,700 | | 14,723 |
| | 52,873 |
TOTAL TELECOMMUNICATION SERVICES | | 77,523 |
UTILITIES - 2.0% |
Electric Utilities - 0.8% |
Edison International | 448,224 | | 22,344 |
ITC Holdings Corp. | 272,272 | | 24,986 |
NextEra Energy, Inc. | 93,711 | | 8,116 |
Northeast Utilities | 258,042 | | 11,460 |
| | 66,906 |
Independent Power Producers & Energy Traders - 0.3% |
The AES Corp. | 2,065,096 | | 25,690 |
Multi-Utilities - 0.9% |
CenterPoint Energy, Inc. | 328,845 | | 8,162 |
PG&E Corp. | 494,102 | | 22,674 |
Sempra Energy | 467,142 | | 40,936 |
| | 71,772 |
TOTAL UTILITIES | | 164,368 |
TOTAL COMMON STOCKS (Cost $6,380,449) |
8,142,973
|
Preferred Stocks - 0.2% |
| | | |
Convertible Preferred Stocks - 0.1% |
INFORMATION TECHNOLOGY - 0.1% |
IT Services - 0.1% |
Unisys Corp. Series A, 6.25% | 92,200 | | 6,645 |
Preferred Stocks - continued |
| Shares | | Value (000s) |
Nonconvertible Preferred Stocks - 0.1% |
CONSUMER DISCRETIONARY - 0.1% |
Automobiles - 0.1% |
Volkswagen AG | 42,400 | | $ 10,077 |
TOTAL PREFERRED STOCKS (Cost $14,752) |
16,722
|
Corporate Bonds - 0.6% |
| Principal
Amount (000s) (d) | | |
Convertible Bonds - 0.5% |
ENERGY - 0.2% |
Energy Equipment & Services - 0.1% |
Cal Dive International, Inc. 5% 7/15/17 (g) | | $ 2,600 | | 2,767 |
Vantage Drilling Co. 5.5% 7/15/43 (g) | | 3,590 | | 3,850 |
| | 6,617 |
Oil, Gas & Consumable Fuels - 0.1% |
Amyris, Inc. 3% 2/27/17 | | 7,356 | | 5,191 |
BPZ Energy, Inc. 6.5% 3/1/15 | | 3,620 | | 3,118 |
| | 8,309 |
TOTAL ENERGY | | 14,926 |
HEALTH CARE - 0.2% |
Biotechnology - 0.2% |
Exelixis, Inc. 4.25% 8/15/19 | | 9,070 | | 9,416 |
InterMune, Inc. 2.5% 12/15/17 | | 2,810 | | 3,920 |
Theravance, Inc. 2.125% 1/15/23 | | 3,620 | | 5,591 |
| | 18,927 |
INDUSTRIALS - 0.0% |
Building Products - 0.0% |
Aspen Aerogels, Inc. 8% 6/1/14 (i) | | 4,618 | | 4,618 |
INFORMATION TECHNOLOGY - 0.1% |
Semiconductors & Semiconductor Equipment - 0.1% |
GT Advanced Technologies, Inc. 3% 10/1/17 | | 7,010 | | 6,716 |
TOTAL CONVERTIBLE BONDS | | 45,187 |
Corporate Bonds - continued |
| Principal Amount (000s) (d) | | Value (000s) |
Nonconvertible Bonds - 0.1% |
FINANCIALS - 0.1% |
Commercial Banks - 0.1% |
Bank of Ireland 10% 7/30/16 | EUR | 5,542 | | $ 7,690 |
TOTAL CORPORATE BONDS (Cost $49,606) |
52,877
|
Money Market Funds - 1.1% |
| Shares | | |
Fidelity Cash Central Fund, 0.11% (b) | 40,756,325 | | 40,756 |
Fidelity Securities Lending Cash Central Fund, 0.12% (b)(c) | 48,253,958 | | 48,254 |
TOTAL MONEY MARKET FUNDS (Cost $89,010) |
89,010
|
TOTAL INVESTMENT PORTFOLIO - 100.4% (Cost $6,533,817) | 8,301,582 |
NET OTHER ASSETS (LIABILITIES) - (0.4)% | (29,682) |
NET ASSETS - 100% | $ 8,271,900 |
Currency Abbreviations |
EUR | - | European Monetary Unit |
Legend |
(a) Non-income producing |
(b) Affiliated fund that is generally available only to investment companies and other accounts managed by Fidelity Investments. The rate quoted is the annualized seven-day yield of the fund at period end. A complete unaudited listing of the fund's holdings as of its most recent quarter end is available upon request. In addition, each Fidelity Central Fund's financial statements, which are not covered by the Fund's Report of Independent Registered Public Accounting Firm, are available on the SEC's website or upon request. |
(c) Investment made with cash collateral received from securities on loan. |
(d) Amount is stated in United States dollars unless otherwise noted. |
(e) Security or a portion of the security is on loan at period end. |
(f) Affiliated company |
(g) Security exempt from registration under Rule 144A of the Securities Act of 1933. These securities may be resold in transactions exempt from registration, normally to qualified institutional buyers. At the end of the period, the value of these securities amounted to $31,061,000 or 0.4% of net assets. |
(h) Security or a portion of the security sold on a delayed delivery basis. |
(i) Restricted securities - Investment in securities not registered under the Securities Act of 1933 (excluding 144A issues). At the end of the period, the value of restricted securities (excluding 144A issues) amounted to $7,220,000 or 0.1% of net assets. |
Additional information on each restricted holding is as follows: |
Security | Acquisition Date | Acquisition Cost (000s) |
Aspen Aerogels, Inc. 8% 6/1/14 | 6/1/11 - 12/31/12 | $ 4,618 |
Mood Media Corp. | 2/2/11 | $ 1,799 |
Velti PLC | 4/19/13 | $ 2,459 |
* Amount represents less than $1,000 |
Affiliated Central Funds |
Information regarding fiscal year to date income earned by the Fund from investments in Fidelity Central Funds is as follows: |
Fund | Income earned
(Amount in thousands) |
Fidelity Cash Central Fund | $ 61 |
Fidelity Securities Lending Cash Central Fund | 4,270 |
Total | $ 4,331 |
Other Affiliated Issuers |
An affiliated company is a company in which the Fund has ownership of at least 5% of the voting securities. Fiscal year to date transactions with companies which are or were affiliates are as follows: |
Affiliate
(Amount in thousands) | Value, beginning of period | Purchases | Sales Proceeds | Dividend Income | Value,
end of
period |
Body Central Corp. | $ 10,585 | $ 360 | $ 5,769 | $ - | $ - |
Double Eagle Petroleum Co. | 3,787 | 282 | 387 | - | 3,050 |
Emerald Oil, Inc. | - | 4,260 | 6,750 | - | - |
Emerald Oil, Inc. warrants 2/4/16 | - | - | - | - | - |
GeoEye, Inc. | 31,912 | - | 38,071 | - | - |
LTX-Credence Corp. | 14,900 | 898 | 7,771 | - | - |
PICO Holdings, Inc. | 33,875 | 57 | 4,350 | - | 26,509 |
TAG Oil Ltd. | 11,208 | 9,234 | - | - | 13,370 |
TAG Oil Ltd. (144A) | 1,027 | - | - | - | 548 |
Total | $ 107,294 | $ 15,091 | $ 63,098 | $ - | $ 43,477 |
Other Information |
The following is a summary of the inputs used, as of July 31, 2013, involving the Fund's assets and liabilities carried at fair value. The inputs or methodology used for valuing securities may not be an indication of the risk associated with investing in those securities. For more information on valuation inputs, and their aggregation into the levels used in the table below, please refer to the Investment Valuation section in the accompanying Notes to Financial Statements. |
Valuation Inputs at Reporting Date: |
Description
(Amounts in thousands) | Total | Level 1 | Level 2 | Level 3 |
Investments in Securities: | | | | |
Equities: | | | | |
Consumer Discretionary | $ 1,064,834 | $ 1,055,589 | $ 9,245 | $ - |
Consumer Staples | 862,793 | 820,556 | 42,237 | - |
Energy | 835,321 | 835,321 | - | - |
Financials | 1,325,057 | 1,320,820 | 4,237 | - |
Health Care | 1,123,623 | 1,041,859 | 81,764 | - |
Industrials | 1,035,096 | 1,020,913 | 14,183 | - |
Information Technology | 1,380,928 | 1,379,261 | 1,667 | - |
Materials | 290,152 | 290,152 | - | - |
Telecommunication Services | 77,523 | 62,800 | 14,723 | - |
Utilities | 164,368 | 164,368 | - | - |
Corporate Bonds | 52,877 | - | 48,259 | 4,618 |
Money Market Funds | 89,010 | 89,010 | - | - |
Total Investments in Securities: | $ 8,301,582 | $ 8,080,649 | $ 216,315 | $ 4,618 |
Distribution of investments by country or territory of incorporation, as a percentage of total net assets, is as follows. (Unaudited) |
United States of America | 81.6% |
United Kingdom | 2.5% |
Canada | 2.2% |
Ireland | 1.5% |
Bermuda | 1.5% |
Switzerland | 1.4% |
Netherlands | 1.2% |
France | 1.1% |
Japan | 1.0% |
Others (Individually Less Than 1%) | 6.0% |
| 100.0% |
See accompanying notes which are an integral part of the financial statements.
Annual Report
Statement of Assets and Liabilities
Amounts in thousands (except per-share amounts) | July 31, 2013 |
| | |
Assets | | |
Investment in securities, at value (including securities loaned of $46,687) - See accompanying schedule: Unaffiliated issuers (cost $6,374,693) | $ 8,169,095 | |
Fidelity Central Funds (cost $89,010) | 89,010 | |
Other affiliated issuers (cost $70,114) | 43,477 | |
Total Investments (cost $6,533,817) | | $ 8,301,582 |
Foreign currency held at value (cost $198) | | 198 |
Receivable for investments sold
Regular delivery | | 78,235 |
Delayed delivery | | 110 |
Receivable for fund shares sold | | 3,619 |
Dividends receivable | | 5,133 |
Interest receivable | | 1,427 |
Distributions receivable from Fidelity Central Funds | | 280 |
Other receivables | | 864 |
Total assets | | 8,391,448 |
| | |
Liabilities | | |
Payable for investments purchased | $ 60,824 | |
Payable for fund shares redeemed | 6,282 | |
Accrued management fee | 2,468 | |
Other affiliated payables | 1,192 | |
Other payables and accrued expenses | 528 | |
Collateral on securities loaned, at value | 48,254 | |
Total liabilities | | 119,548 |
| | |
Net Assets | | $ 8,271,900 |
Net Assets consist of: | | |
Paid in capital | | $ 5,901,943 |
Undistributed net investment income | | 41,183 |
Accumulated undistributed net realized gain (loss) on investments and foreign currency transactions | | 561,017 |
Net unrealized appreciation (depreciation) on investments and assets and liabilities in foreign currencies | | 1,767,757 |
Net Assets | | $ 8,271,900 |
See accompanying notes which are an integral part of the financial statements.
Annual Report
Financial Statements - continued
Statement of Assets and Liabilities - continued
Amounts in thousands (except per-share amounts) | July 31, 2013 |
| | |
Dividend Growth:
Net Asset Value, offering price and redemption price per share ($6,632,538 ÷ 187,715 shares) | | $ 35.33 |
| | |
Class K:
Net Asset Value, offering price and redemption price per share ($1,639,362 ÷ 46,392 shares) | | $ 35.34 |
See accompanying notes which are an integral part of the financial statements.
Annual Report
Statement of Operations
Amounts in thousands | Year ended July 31, 2013 |
| | |
Investment Income | | |
Dividends | | $ 134,847 |
Interest | | 3,928 |
Income from Fidelity Central Funds | | 4,331 |
Total income | | 143,106 |
| | |
Expenses | | |
Management fee
Basic fee | $ 42,265 | |
Performance adjustment | (11,294) | |
Transfer agent fees | 12,918 | |
Accounting and security lending fees | 1,211 | |
Custodian fees and expenses | 342 | |
Independent trustees' compensation | 49 | |
Registration fees | 84 | |
Audit | 88 | |
Legal | 33 | |
Miscellaneous | 72 | |
Total expenses before reductions | 45,768 | |
Expense reductions | (932) | 44,836 |
Net investment income (loss) | | 98,270 |
Realized and Unrealized Gain (Loss) Net realized gain (loss) on: | | |
Investment securities: | | |
Unaffiliated issuers | 716,355 | |
Other affiliated issuers | (17,267) | |
Foreign currency transactions | (365) | |
Total net realized gain (loss) | | 698,723 |
Change in net unrealized appreciation (depreciation) on: Investment securities | 1,016,146 | |
Assets and liabilities in foreign currencies | 28 | |
Total change in net unrealized appreciation (depreciation) | | 1,016,174 |
Net gain (loss) | | 1,714,897 |
Net increase (decrease) in net assets resulting from operations | | $ 1,813,167 |
See accompanying notes which are an integral part of the financial statements.
Annual Report
Financial Statements - continued
Statement of Changes in Net Assets
Amounts in thousands | Year ended
July 31,
2013 | Year ended
July 31,
2012 |
Increase (Decrease) in Net Assets | | |
Operations | | |
Net investment income (loss) | $ 98,270 | $ 62,998 |
Net realized gain (loss) | 698,723 | 282,332 |
Change in net unrealized appreciation (depreciation) | 1,016,174 | (523,395) |
Net increase (decrease) in net assets resulting
from operations | 1,813,167 | (178,065) |
Distributions to shareholders from net investment income | (73,780) | (42,120) |
Distributions to shareholders from net realized gain | (120,844) | (5,141) |
Total distributions | (194,624) | (47,261) |
Share transactions - net increase (decrease) | (472,835) | (2,591,197) |
Total increase (decrease) in net assets | 1,145,708 | (2,816,523) |
| | |
Net Assets | | |
Beginning of period | 7,126,192 | 9,942,715 |
End of period (including undistributed net investment income of $41,183 and undistributed net investment income of $20,016, respectively) | $ 8,271,900 | $ 7,126,192 |
See accompanying notes which are an integral part of the financial statements.
Annual Report
Financial Highlights - Dividend Growth
Years ended July 31, | 2013 | 2012 | 2011 | 2010 | 2009 |
Selected Per-Share Data | | | | | |
Net asset value, beginning of period | $ 28.61 | $ 28.96 | $ 23.84 | $ 20.25 | $ 25.40 |
Income from Investment Operations | | | | | |
Net investment income (loss) B | .40 | .20 | .12 | .13 E | .24 |
Net realized and unrealized gain (loss) | 7.12 | (.41) | 5.23 | 3.63 | (4.01) |
Total from investment operations | 7.52 | (.21) | 5.35 | 3.76 | (3.77) |
Distributions from net investment income | (.30) | (.12) | (.15) | (.12) | (.37) |
Distributions from net realized gain | (.50) | (.02) | (.08) | (.05) | (1.01) |
Total distributions | (.80) | (.14) | (.23) | (.17) | (1.38) H |
Net asset value, end of period | $ 35.33 | $ 28.61 | $ 28.96 | $ 23.84 | $ 20.25 |
Total Return A | 26.83% | (.67)% | 22.57% | 18.59% | (15.33)% |
Ratios to Average Net Assets C,F | | | | | |
Expenses before reductions | .63% | .91% | .93% | .93% | .62% |
Expenses net of fee waivers, if any | .63% | .91% | .93% | .93% | .62% |
Expenses net of all reductions | .62% | .91% | .93% | .92% | .62% |
Net investment income (loss) | 1.26% | .75% | .44% | .56% E | 1.34% |
Supplemental Data | | | | | |
Net assets, end of period (in millions) | $ 6,633 | $ 5,905 | $ 9,309 | $ 7,730 | $ 6,603 |
Portfolio turnover rate D | 69% | 63% G | 67% | 85% | 177% |
A Total returns would have been lower if certain expenses had not been reduced during the applicable periods shown.
B Calculated based on average shares outstanding during the period.
C Fees and expenses of any underlying Fidelity Central Funds are not included in the Fund's expense ratio. The Fund indirectly bears its proportionate share of the expenses of any underlying Fidelity Central Funds.
D Amount does not include the portfolio activity of any underlying Fidelity Central Funds.
E Investment income per share reflects a large, non-recurring dividend which amounted to $.04 per share. Excluding this non-recurring dividend, the ratio of net investment income (loss) to average net assets would have been .40%.
F Expense ratios reflect operating expenses of the class. Expenses before reductions do not reflect amounts reimbursed by the investment adviser or reductions from brokerage service arrangements or reductions from other expense offset arrangements and do not represent the amount paid by the class during periods when reimbursements or reductions occur. Expenses net of fee waivers reflect expenses after reimbursement by the investment adviser but prior to reductions from brokerage service arrangements or other expense offset arrangements. Expenses net of all reductions represent the net expenses paid by the class.
G Portfolio turnover rate excludes securities received or delivered in-kind.
H Total distributions of $1.38 per share is comprised of distributions from net investment income of $.374 and distributions from net realized gain of $1.005 per share.
See accompanying notes which are an integral part of the financial statements.
Annual Report
Financial Highlights - Class K
Years ended July 31, | 2013 | 2012 | 2011 | 2010 | 2009 |
Selected Per-Share Data | | | | | |
Net asset value, beginning of period | $ 28.62 | $ 28.98 | $ 23.86 | $ 20.26 | $ 25.41 |
Income from Investment Operations | | | | | |
Net investment income (loss) B | .45 | .25 | .17 | .18 E | .26 |
Net realized and unrealized gain (loss) | 7.12 | (.43) | 5.22 | 3.63 | (4.00) |
Total from investment operations | 7.57 | (.18) | 5.39 | 3.81 | (3.74) |
Distributions from net investment income | (.35) | (.17) | (.20) | (.16) | (.41) |
Distributions from net realized gain | (.50) | (.02) | (.08) | (.05) | (1.01) |
Total distributions | (.85) | (.18) J | (.27) I | (.21) | (1.41) H |
Net asset value, end of period | $ 35.34 | $ 28.62 | $ 28.98 | $ 23.86 | $ 20.26 |
Total Return A | 27.04% | (.52)% | 22.79% | 18.86% | (15.16)% |
Ratios to Average Net Assets C,F | | | | | |
Expenses before reductions | .48% | .75% | .78% | .72% | .40% |
Expenses net of fee waivers, if any | .48% | .75% | .78% | .72% | .40% |
Expenses net of all reductions | .47% | .75% | .77% | .71% | .39% |
Net investment income (loss) | 1.41% | .91% | .60% | .76% E | 1.57% |
Supplemental Data | | | | | |
Net assets, end of period (in millions) | $ 1,639 | $ 1,221 | $ 634 | $ 355 | $ 202 |
Portfolio turnover rate D | 69% | 63% G | 67% | 85% | 177% |
A Total returns would have been lower if certain expenses had not been reduced during the applicable periods shown.
B Calculated based on average shares outstanding during the period.
C Fees and expenses of any underlying Fidelity Central Funds are not included in the Fund's expense ratio. The Fund indirectly bears its proportionate share of the expenses of any underlying Fidelity Central Funds.
D Amount does not include the portfolio activity of any underlying Fidelity Central Funds.
E Investment income per share reflects a large, non-recurring dividend which amounted to $.04 per share. Excluding this non-recurring dividend, the ratio of net investment income (loss) to average net assets would have been .60%.
F Expense ratios reflect operating expenses of the class. Expenses before reductions do not reflect amounts reimbursed by the investment adviser or reductions from brokerage service arrangements or reductions from other expense offset arrangements and do not represent the amount paid by the class during periods when reimbursements or reductions occur. Expenses net of fee waivers reflect expenses after reimbursement by the investment adviser but prior to reductions from brokerage service arrangements or other expense offset arrangements. Expenses net of all reductions represent the net expenses paid by the class.
G Portfolio turnover rate excludes securities received or delivered in-kind.
H Total distributions of $1.41 per share is comprised of distributions from net investment income of $.407 and distributions from net realized gain of $1.005 per share.
I Total distributions of $.27 per share is comprised of distributions from net investment income of $.197 and distributions from net realized gain of $.077 per share.
J Total distributions of $.18 per share is comprised of distributions from net investment income of $.169 and distributions from net realized gain of $.015 per share.
See accompanying notes which are an integral part of the financial statements.
Annual Report
Notes to Financial Statements
For the period ended July 31, 2013
(Amounts in thousands except percentages)
1. Organization.
Fidelity Dividend Growth Fund (the Fund) is a fund of Fidelity Securities Fund (the Trust) and is authorized to issue an unlimited number of shares. The Trust is registered under the Investment Company Act of 1940, as amended (the 1940 Act), as an open-end management investment company organized as a Massachusetts business trust. The Fund offers Dividend Growth and Class K shares, each of which has equal rights as to assets and voting privileges. Each class has exclusive voting rights with respect to matters that affect that class.
2. Investments in Fidelity Central Funds.
The Fund invests in Fidelity Central Funds, which are open-end investment companies generally available only to other investment companies and accounts managed by Fidelity Management & Research Company (FMR) and its affiliates. The Fund's Schedule of Investments lists each of the Fidelity Central Funds held as of period end, if any, as an investment of the Fund, but does not include the underlying holdings of each Fidelity Central Fund. As an Investing Fund, the Fund indirectly bears its proportionate share of the expenses of the underlying Fidelity Central Funds.
The Money Market Central Funds seek preservation of capital and current income and are managed by Fidelity Investments Money Management, Inc. (FIMM), an affiliate of FMR.
A complete unaudited list of holdings for each Fidelity Central Fund is available upon request or at the Securities and Exchange Commission (the SEC) website at www.sec.gov. In addition, the financial statements of the Fidelity Central Funds, which are not covered by the Fund's Report of Independent Registered Public Accounting Firm, are available on the SEC website or upon request.
3. Significant Accounting Policies.
The financial statements have been prepared in conformity with accounting principles generally accepted in the United States of America (GAAP), which require management to make certain estimates and assumptions at the date of the financial statements. Actual results could differ from those estimates. Subsequent events, if any, through the date that the financial statements were issued have been evaluated in the preparation of the financial statements. The following summarizes the significant accounting policies of the Fund:
Annual Report
Notes to Financial Statements - continued
(Amounts in thousands except percentages)
3. Significant Accounting Policies - continued
Investment Valuation. Investments are valued as of 4:00 p.m. Eastern time on the last calendar day of the period. In accordance with valuation policies and procedures approved by the Board of Trustees (the Board), the Fund attempts to obtain prices from one or more third party pricing vendors or brokers to value its investments. When current market prices, quotations or currency exchange rates are not readily available or reliable, investments will be fair valued in good faith by the FMR Fair Value Committee (the Committee), in accordance with procedures adopted by the Board. Factors used in determining fair value vary by investment type and may include market or investment specific events, changes in interest rates and credit quality. The frequency with which these procedures are used cannot be predicted and they may be utilized to a significant extent. The Committee oversees the Fund's valuation policies and procedures and is responsible for approving and reporting to the Board all fair value determinations.
The Fund categorizes the inputs to valuation techniques used to value its investments into a disclosure hierarchy consisting of three levels as shown below:
Level 1 - quoted prices in active markets for identical investments
Level 2 - other significant observable inputs (including quoted prices for similar investments, interest rates, prepayment speeds, etc.)
Level 3 - unobservable inputs (including the Fund's own assumptions based on the best information available)
Valuation techniques used to value the Fund's investments by major category are as follows:
Equity securities, including restricted securities, for which market quotations are readily available, are valued at the last reported sale price or official closing price as reported by a third party pricing vendor on the primary market or exchange on which they are traded and are categorized as Level 1 in the hierarchy. In the event there were no sales during the day or closing prices are not available, securities are valued at the last quoted bid price or may be valued using the last available price and are generally categorized as Level 2 in the hierarchy. For foreign equity securities, when market or security specific events arise, comparisons to the valuation of American Depositary Receipts (ADRs), futures contracts, Exchange-Traded Funds (ETFs) and certain indexes as well as quoted prices for similar securities may be used and would be categorized as Level 2 in the hierarchy. Utilizing these techniques may result in transfers between Level 1 and Level 2. For restricted equity securities and private placements where observable inputs are limited, assumptions about market activity and risk are used and these securities are generally categorized as Level 3 in the hierarchy.
Annual Report
3. Significant Accounting Policies - continued
Investment Valuation - continued
Debt securities, including restricted securities, are valued based on evaluated prices received from third party pricing vendors or from brokers who make markets in such securities. For corporate bonds, pricing vendors utilize matrix pricing which considers yield or price of bonds of comparable quality, coupon, maturity and type as well as broker-supplied prices. When independent prices are unavailable or unreliable, debt securities may be valued utilizing pricing methodologies which consider similar factors that would be used by third party pricing vendors. Debt securities are generally categorized as Level 2 in the hierarchy but may be Level 3 depending on the circumstances.
Investments in open-end mutual funds, including the Fidelity Central Funds, are valued at their closing net asset value (NAV) each business day and are categorized as Level 1 in the hierarchy.
Changes in valuation techniques may result in transfers in or out of an assigned level within the disclosure hierarchy. The aggregate value of investments by input level, as of July 31, 2013, is included at the end of the Fund's Schedule of Investments.
Foreign Currency. The Fund may use foreign currency contracts to facilitate transactions in foreign-denominated securities. Gains and losses from these transactions may arise from changes in the value of the foreign currency or if the counterparties do not perform under the contracts' terms.
Foreign-denominated assets, including investment securities, and liabilities are translated into U.S. dollars at the exchange rates at period end. Purchases and sales of investment securities, income and dividends received and expenses denominated in foreign currencies are translated into U.S. dollars at the exchange rate in effect on the transaction date.
The effects of exchange rate fluctuations on investments are included with the net realized and unrealized gain (loss) on investment securities. Other foreign currency transactions resulting in realized and unrealized gain (loss) are disclosed separately.
Investment Transactions and Income. For financial reporting purposes, the Fund's investment holdings and NAV include trades executed through the end of the last business day of the period. The NAV per share for processing shareholder transactions is calculated as of the close of business of the New York Stock Exchange (NYSE), normally 4:00 p.m. Eastern time and includes trades executed through the end of the prior business day. Gains and losses on securities sold are determined on the basis of identified cost and may include proceeds received from litigation. Dividend income is recorded on the ex-dividend date, except for certain dividends from foreign securities where the
Annual Report
Notes to Financial Statements - continued
(Amounts in thousands except percentages)
3. Significant Accounting Policies - continued
Investment Transactions and Income - continued
ex-dividend date may have passed, which are recorded as soon as the Fund is informed of the ex-dividend date. Non-cash dividends included in dividend income, if any, are recorded at the fair market value of the securities received. Distributions received on securities that represent a return of capital or capital gain are recorded as a reduction of cost of investments and/or as a realized gain. Subsequent to ex-dividend date the Fund determines the components of these distributions, based upon receipt of tax filings or other correspondence relating to the underlying investment. Interest income and distributions from the Fidelity Central Funds are accrued as earned. Interest income includes coupon interest and amortization of premium and accretion of discount on debt securities. Investment income is recorded net of foreign taxes withheld where recovery of such taxes is uncertain.
Class Allocations and Expenses. Investment income, realized and unrealized capital gains and losses, common expenses of the Fund, and certain fund-level expense reductions, if any, are allocated on a pro-rata basis to each class based on the relative net assets of each class to the total net assets of the Fund. Each class differs with respect to transfer agent fees incurred. Certain expense reductions may also differ by class. Expenses directly attributable to a fund are charged to that fund. Expenses attributable to more than one fund are allocated among the respective funds on the basis of relative net assets or other appropriate methods. Expense estimates are accrued in the period to which they relate and adjustments are made when actual amounts are known.
Deferred Trustee Compensation. Under a Deferred Compensation Plan (the Plan), independent Trustees may elect to defer receipt of a portion of their annual compensation. Deferred amounts are invested in a cross-section of Fidelity funds, are marked-to-market and remain in the Fund until distributed in accordance with the Plan. The investment of deferred amounts and the offsetting payable to the Trustees are included in the accompanying Statement of Assets and Liabilities.
Income Tax Information and Distributions to Shareholders. Each year, the Fund intends to qualify as a regulated investment company under Subchapter M of the Internal Revenue Code, including distributing substantially all of its taxable income and realized gains. As a result, no provision for income taxes is required. As of July 31, 2013, the Fund did not have any unrecognized tax benefits in the financial statements; nor is the Fund aware of any tax positions for which it is reasonably possible that the total amounts of unrecognized tax benefits will significantly change in the next twelve months. The Fund files a U.S. federal tax return, in addition to state and local tax returns as required. A fund's federal income tax returns are subject to examination by the Internal Revenue Service (IRS) for a period of three fiscal years after they are filed.
Annual Report
3. Significant Accounting Policies - continued
Income Tax Information and Distributions to Shareholders - continued
State and local tax returns may be subject to examination for an additional fiscal year depending on the jurisdiction. Foreign taxes are provided for based on the Fund's understanding of the tax rules and rates that exist in the foreign markets in which it invests.
Distributions are declared and recorded on the ex-dividend date. Income dividends and capital gain distributions are declared separately for each class. Income and capital gain distributions are determined in accordance with income tax regulations, which may differ from GAAP. In addition, the Fund claimed a portion of the payment made to redeeming shareholders as a distribution for income tax purposes.
Capital accounts within the financial statements are adjusted for permanent book-tax differences. These adjustments have no impact on net assets or the results of operations. Temporary book-tax differences will reverse in a subsequent period.
Book-tax differences are primarily due to foreign currency transactions, passive foreign investment companies (PFIC), market discount, contingent interest, equity-debt classifications, partnerships, deferred trustees compensation and losses deferred due to wash sales.
The federal tax cost of investment securities and unrealized appreciation (depreciation) as of period end were as follows:
Gross unrealized appreciation | $ 1,952,043 |
Gross unrealized depreciation | (195,354) |
Net unrealized appreciation (depreciation) on securities and other investments | $ 1,756,689 |
| |
Tax Cost | $ 6,544,893 |
The tax-based components of distributable earnings as of period end were as follows:
Undistributed ordinary income | $ 195,503 |
Undistributed long-term capital gain | $ 418,131 |
Net unrealized appreciation (depreciation) | $ 1,756,680 |
Annual Report
Notes to Financial Statements - continued
(Amounts in thousands except percentages)
3. Significant Accounting Policies - continued
Income Tax Information and Distributions to Shareholders - continued
The tax character of distributions paid was as follows:
| July 31, 2013 | July 31, 2012 |
Ordinary Income | $ 80,019 | $ 47,261 |
Long-term Capital Gains | 114,605 | - |
Total | $ 194,624 | $ 47,261 |
Delayed Delivery Transactions and When-Issued Securities. During the period, the Fund transacted in securities on a delayed delivery or when-issued basis. Payment and delivery may take place after the customary settlement period for that security. The price of the underlying securities and the date when the securities will be delivered and paid for are fixed at the time the transaction is negotiated. The Fund may receive compensation for interest forgone in the purchase of a delayed delivery or when-issued security. With respect to purchase commitments, the Fund identifies securities as segregated in its records with a value at least equal to the amount of the commitment. Losses may arise due to changes in the value of the underlying securities or if the counterparty does not perform under the contract's terms, or if the issuer does not issue the securities due to political, economic, or other factors.
Restricted Securities. The Fund may invest in securities that are subject to legal or contractual restrictions on resale. These securities generally may be resold in transactions exempt from registration or to the public if the securities are registered. Disposal of these securities may involve time-consuming negotiations and expense, and prompt sale at an acceptable price may be difficult. Information regarding restricted securities is included at the end of the Fund's Schedule of Investments.
4. Purchases and Sales of Investments.
Purchases and sales of securities, other than short-term securities, aggregated $5,170,881 and $5,672,803, respectively.
5. Fees and Other Transactions with Affiliates.
Management Fee. FMR and its affiliates provide the Fund with investment management related services for which the Fund pays a monthly management fee. The management fee is the sum of an individual fund fee rate that is based on an annual rate of .30% of the Fund's average net assets and an annualized group fee rate that averaged .26% during the period. The group fee rate is based upon the average net assets of all the mutual funds advised by FMR. The group fee rate decreases as assets under management increase and increases as assets under management decrease. In addition, the
Annual Report
5. Fees and Other Transactions with Affiliates - continued
Management Fee - continued
management fee is subject to a performance adjustment (up to a maximum of ± .20% of the Fund's average net assets over a 36 month performance period). The upward or downward adjustment to the management fee is based on the relative investment performance of Dividend Growth as compared to an appropriate benchmark index. For the period, the total annual management fee rate, including the performance adjustment, was .41% of the Fund's average net assets.
Transfer Agent Fees. Fidelity Investments Institutional Operations Company, Inc., (FIIOC), an affiliate of FMR, is the transfer, dividend disbursing and shareholder servicing agent for each class of the Fund. FIIOC receives account fees and asset-based fees that vary according to the account size and type of account of the shareholders of Dividend Growth. FIIOC receives an asset-based fee of Class K's average net assets. FIIOC pays for typesetting, printing and mailing of shareholder reports, except proxy statements. For the period, transfer agent fees for each applicable class were as follows:
| Amount | % of
Average
Net Assets |
Dividend Growth | $ 12,226 | .20 |
Class K | 692 | .05 |
| $ 12,918 | |
Accounting and Security Lending Fees. Fidelity Service Company, Inc. (FSC), an affiliate of FMR, maintains the Fund's accounting records. The accounting fee is based on the level of average net assets for each month. Under a separate contract, FSC administers the security lending program. The security lending fee is based on the number and duration of lending transactions.
Brokerage Commissions. The Fund placed a portion of its portfolio transactions with brokerage firms which are affiliates of the investment adviser. Brokerage commissions are included in net realized gain (loss) and change in net unrealized appreciation (depreciation) in the Statement of Operations. The commissions paid to these affiliated firms were $133 for the period.
6. Committed Line of Credit.
The Fund participates with other funds managed by FMR or an affiliate in a $4.25 billion credit facility (the "line of credit") to be utilized for temporary or emergency purposes to fund shareholder redemptions or for other short-term liquidity purposes. The Fund has agreed to pay commitment fees on its pro-rata portion of the line of credit, which
Annual Report
Notes to Financial Statements - continued
(Amounts in thousands except percentages)
6. Committed Line of Credit - continued
amounted to $18 and is reflected in Miscellaneous expenses on the Statement of Operations. During the period, there were no borrowings on this line of credit.
7. Security Lending.
The Fund lends portfolio securities through a lending agent from time to time in order to earn additional income. For equity securities, a lending agent is used and may loan securities to certain qualified borrowers, including Fidelity Capital Markets (FCM), a broker-dealer affiliated with the Fund. On the settlement date of the loan, the Fund receives collateral (in the form of U.S. Treasury obligations, letters of credit and/or cash) against the loaned securities and maintains collateral in an amount not less than 100% of the market value of the loaned securities during the period of the loan. The market value of the loaned securities is determined at the close of business of the Fund and any additional required collateral is delivered to the Fund on the next business day. If the borrower defaults on its obligation to return the securities loaned because of insolvency or other reasons, the Fund may apply collateral received from the borrower against the obligation. The Fund may experience delays and costs in recovering the securities loaned. Any cash collateral received is invested in the Fidelity Securities Lending Cash Central Fund. The value of loaned securities and cash collateral at period end are disclosed on the Fund's Statement of Assets and Liabilities. The value of securities loaned to FCM at period end was $119. Security lending income represents the income earned on investing cash collateral, less rebates paid to borrowers and any lending agent fees associated with the loan, plus any premium payments received for lending certain types of securities. Security lending income is presented in the Statement of Operations as a component of income from Fidelity Central Funds. Total security lending income during the period amounted to $4,270, including $251 from securities loaned to FCM.
8. Expense Reductions.
Commissions paid to certain brokers with whom FMR places trades include an amount in addition to trade execution, which is rebated back to the Fund to offset certain expenses. This amount totaled $916 for the period. Through arrangements with the Fund's custodian, credits realized as a result of uninvested cash balances were used to reduce the Fund's expenses. During the period, these credits reduced the Fund's custody expenses by four hundred and nine dollars.
In addition, FMR reimbursed a portion of the Fund's operating expenses during the period in the amount of $16.
Annual Report
9. Distributions to Shareholders.
Distributions to shareholders of each class were as follows:
Years ended July 31, | 2013 | 2012 |
From net investment income | | |
Dividend Growth | $ 58,843 | $ 37,592 |
Class K | 14,937 | 4,528 |
Total | $ 73,780 | $ 42,120 |
From net realized gain | | |
Dividend Growth | $ 99,450 | $ 4,761 |
Class K | 21,394 | 380 |
Total | $ 120,844 | $ 5,141 |
10. Share Transactions.
Transactions for each class of shares were as follows:
| Shares | Dollars |
Years ended July 31, | 2013 | 2012 | 2013 | 2012 |
Dividend Growth | | | | |
Shares sold | 18,652 | 28,017 | $ 585,373 | $ 753,110 |
Reinvestment of distributions | 4,994 | 1,596 | 147,845 | 40,357 |
Shares redeemed | (42,352) | (144,643)A | (1,323,760) | (3,948,966)A |
Net increase (decrease) | (18,706) | (115,030) | $ (590,542) | $ (3,155,499) |
Class K | | | | |
Shares sold | 13,098 | 29,433 | $ 414,093 | $ 801,392 |
Reinvestment of distributions | 1,228 | 194 | 36,331 | 4,908 |
Shares redeemed | (10,587) | (8,851) | (332,717) | (241,998) |
Net increase (decrease) | 3,739 | 20,776 | $ 117,707 | $ 564,302 |
A Amount included in-kind redemptions
11. Other.
The Fund's organizational documents provide former and current trustees and officers with a limited indemnification against liabilities arising in connection with the performance of their duties to the Fund. In the normal course of business, the Fund may also enter into contracts that provide general indemnifications. The Fund's maximum exposure under these arrangements is unknown as this would be dependent on future claims that may be made against the Fund. The risk of material loss from such claims is considered remote.
Annual Report
To the Trustees of Fidelity Securities Fund and the Shareholders of Fidelity Dividend Growth Fund:
In our opinion, the accompanying statement of assets and liabilities, including the schedule of investments, and the related statements of operations and of changes in net assets and the financial highlights present fairly, in all material respects, the financial position of Fidelity Dividend Growth Fund (a fund of Fidelity Securities Fund) at July 31, 2013, the results of its operations for the year then ended, the changes in its net assets for each of the two years in the period then ended and the financial highlights for each of the five years in the period then ended, in conformity with accounting principles generally accepted in the United States of America. These financial statements and financial highlights (hereafter referred to as "financial statements") are the responsibility of the Fidelity Dividend Growth Fund's management. Our responsibility is to express an opinion on these financial statements based on our audits. We conducted our audits of these financial statements in accordance with the standards of the Public Company Accounting Oversight Board (United States). Those standards require that we plan and perform the audit to obtain reasonable assurance about whether the financial statements are free of material misstatement. An audit includes examining, on a test basis, evidence supporting the amounts and disclosures in the financial statements, assessing the accounting principles used and significant estimates made by management, and evaluating the overall financial statement presentation. We believe that our audits, which included confirmation of securities at July 31, 2013 by correspondence with the custodian and brokers, provide a reasonable basis for our opinion.
PricewaterhouseCoopers LLP
Boston, Massachusetts
September 13, 2013
Annual Report
The Trustees, Member of the Advisory Board, and executive officers of the trust and fund, as applicable, are listed below. The Board of Trustees governs the fund and is responsible for protecting the interests of shareholders. The Trustees are experienced executives who meet periodically throughout the year to oversee the fund's activities, review contractual arrangements with companies that provide services to the fund, oversee management of the risks associated with such activities and contractual arrangements, and review the fund's performance. Except for James C. Curvey, Ned C. Lautenbach, Ronald P. O'Hanley, and William S. Stavropoulos, each of the Trustees oversees 166 Fidelity funds. Mr. Curvey oversees 387 Fidelity funds. Mr. Lautenbach, Mr. O'Hanley, and Mr. Stavropoulos each oversees 230 Fidelity funds.
The Trustees hold office without limit in time except that (a) any Trustee may resign; (b) any Trustee may be removed by written instrument, signed by at least two-thirds of the number of Trustees prior to such removal; (c) any Trustee who requests to be retired or who has become incapacitated by illness or injury may be retired by written instrument signed by a majority of the other Trustees; and (d) any Trustee may be removed at any special meeting of shareholders by a two-thirds vote of the outstanding voting securities of the trust. Each Trustee who is not an interested person of the trust and the fund (as defined in the 1940 Act) (Independent Trustee), shall retire not later than the last day of the calendar year in which his or her 75th birthday occurs. The Independent Trustees may waive this mandatory retirement age policy with respect to individual Trustees. The executive officers and Advisory Board Member hold office without limit in time, except that any officer and Advisory Board Member may resign or may be removed by a vote of a majority of the Trustees at any regular meeting or any special meeting of the Trustees. Except as indicated, each individual has held the office shown or other offices in the same company for the past five years.
Experience, Skills, Attributes, and Qualifications of the Fund's Trustees. The Governance and Nominating Committee has adopted a statement of policy that describes the experience, qualifications, attributes, and skills that are necessary and desirable for potential Independent Trustee candidates (Statement of Policy). The Board believes that each Trustee satisfied at the time he or she was initially elected or appointed a Trustee, and continues to satisfy, the standards contemplated by the Statement of Policy. The Governance and Nominating Committee also engages professional search firms to help identify potential Independent Trustee candidates who have the experience, qualifications, attributes, and skills consistent with the Statement of Policy. From time to time, additional criteria based on the composition and skills of the current Independent Trustees, as well as experience or skills that may be appropriate in light of future changes to board composition, business conditions, and regulatory or other developments, have also been considered by the professional search firms and the Governance and Nominating Committee. In addition, the Board takes into account the Trustees' commitment and participation in Board and committee meetings, as well as their leadership of standing and ad hoc committees throughout their tenure.
Annual Report
In determining that a particular Trustee was and continues to be qualified to serve as a Trustee, the Board has considered a variety of criteria, none of which, in isolation, was controlling. The Board believes that, collectively, the Trustees have balanced and diverse experience, qualifications, attributes, and skills, which allow the Board to operate effectively in governing the fund and protecting the interests of shareholders. Information about the specific experience, skills, attributes, and qualifications of each Trustee, which in each case led to the Board's conclusion that the Trustee should serve (or continue to serve) as a trustee of the fund, is provided below.
Board Structure and Oversight Function. James C. Curvey is an interested person (as defined in the 1940 Act) and currently serves as Chairman. The Trustees have determined that an interested Chairman is appropriate and benefits shareholders because an interested Chairman has a personal and professional stake in the quality and continuity of services provided to the fund. Independent Trustees exercise their informed business judgment to appoint an individual of their choosing to serve as Chairman, regardless of whether the Trustee happens to be independent or a member of management. The Independent Trustees have determined that they can act independently and effectively without having an Independent Trustee serve as Chairman and that a key structural component for assuring that they are in a position to do so is for the Independent Trustees to constitute a substantial majority for the Board. The Independent Trustees also regularly meet in executive session. Ned C. Lautenbach serves as Chairman of the Independent Trustees and as such (i) acts as a liaison between the Independent Trustees and management with respect to matters important to the Independent Trustees and (ii) with management prepares agendas for Board meetings.
Fidelity funds are overseen by different Boards of Trustees. The fund's Board oversees Fidelity's equity and high income funds and another Board oversees Fidelity's investment-grade bond, money market, and asset allocation funds. The asset allocation funds may invest in Fidelity funds overseen by the fund's Board. The use of separate Boards, each with its own committee structure, allows the Trustees of each group of Fidelity funds to focus on the unique issues of the funds they oversee, including common research, investment, and operational issues. On occasion, the separate Boards establish joint committees to address issues of overlapping consequences for the Fidelity funds overseen by each Board.
The Trustees operate using a system of committees to facilitate the timely and efficient consideration of all matters of importance to the Trustees, the fund, and fund shareholders and to facilitate compliance with legal and regulatory requirements and oversight of the fund's activities and associated risks. The Board, acting through its committees, has charged FMR and its affiliates with (i) identifying events or circumstances the occurrence of which could have demonstrably adverse effects on the fund's business and/or reputation; (ii) implementing processes and controls to lessen the possibility that such events or circumstances occur or to mitigate the effects of such events or circumstances if they do occur; and (iii) creating and maintaining a system designed to evaluate continuously business and market conditions in order to facilitate the identification and implementation processes described in (i) and (ii) above. Because the day-to-day operations and activities of the fund are carried out by or through FMR, its affiliates and other service providers, the fund's exposure to risks is mitigated but not eliminated by the processes overseen by the Trustees. While each of the Board's committees has responsibility for overseeing different aspects of the fund's activities, oversight is exercised primarily through the Operations, Audit, and Compliance Committees. In addition, the Independent Trustees have worked with FMR to enhance the Board's oversight of investment and financial risks, legal and regulatory risks, technology risks, and operational risks, including the development of additional risk reporting to the Board. For example, a working group comprised of Independent Trustees and FMR has worked and continues to work to review the Fidelity funds' valuation-related activities, reporting and risk management. Appropriate personnel, including but not limited to the fund's Chief Compliance Officer (CCO), FMR's internal auditor, the independent accountants, the fund's Treasurer and portfolio management personnel, make periodic reports to the Board's committees, as appropriate, including an annual review of FMR's risk management program for the Fidelity funds. The responsibilities of each standing committee, including their oversight responsibilities, are described further under "Standing Committees of the Fund's Trustees."
Annual Report
Trustees and Officers - continued
The fund's Statement of Additional Information (SAI) includes more information about the Trustees. To request a free copy, call Fidelity at 1-800-835-5092.
Interested Trustees*:
Correspondence intended for each Trustee who is an interested person may be sent to Fidelity Investments, 245 Summer Street, Boston, Massachusetts 02210.
Name, Year of Birth; Principal Occupations and Other Relevant Experience+ |
James C. Curvey (1935) |
| Year of Election or Appointment: 2007 Mr. Curvey is Trustee and Chairman of the Board of Trustees of certain Trusts. Mr. Curvey also serves as Trustee (2007-present) of other investment companies advised by FMR. Mr. Curvey is a Director of Fidelity Investments Money Management, Inc. (2009-present), Director of Fidelity Research & Analysis Co. (2009-present) and Director of FMR and FMR Co., Inc. (2007-present). Mr. Curvey is also Vice Chairman (2007-present) and Director of FMR LLC. In addition, Mr. Curvey serves as an Overseer for the Boston Symphony Orchestra and a member of the Trustees of Villanova University. Previously, Mr. Curvey was the Vice Chairman (2006-2007) and Director (2000-2007) of FMR Corp. |
Ronald P. O'Hanley (1957) |
| Year of Election or Appointment: 2011 Mr. O'Hanley serves as a Trustee and Chairman of the Board of Trustees of other Fidelity funds (2013-present), and is Director of FMR Co., Inc. (2010-present), Director of Fidelity Investments Money Management, Inc. (2010-present), Director of Fidelity Research & Analysis Company (2010-present), President of Fidelity Asset Management and Corporate Services and a Member of Fidelity's Executive Committee (2010-present). Previously, Mr. O'Hanley served as President and Chief Executive Officer of BNY Mellon Asset Management (2007-2010). Mr. O'Hanley also served as Vice Chairman of Bank New York Mellon Corp. and a member of that firm's Executive Committee. Prior to the 2007 merger of The Bank of New York and Mellon Financial Corporation, he was Vice Chairman of Mellon Financial Corporation and President and Chief Executive Officer of Mellon Asset Management. He joined Mellon in February 1997. Mr. O'Hanley currently serves as Chairman of the Boston Public Library Foundation Board of Directors and sits on the Board of Directors of Beth Israel Deaconess Medical Center, the Board of Trustees of the Marine Biological Laboratory and the Advisory Board of the Maxwell School of Citizenship and Public Administration at Syracuse University. Mr. O'Hanley also chairs the Council on Asset Management for the Financial Services Roundtable and is a member of the Board of Directors of Institutional Investor's U.S. Institute. |
* Trustees have been determined to be "Interested Trustees" by virtue of, among other things, their affiliation with the trust or various entities under common control with FMR.
+ The information above includes each Trustee's principal occupation during the last five years and other information relating to the experience, attributes, and skills relevant to each Trustee's qualifications to serve as a Trustee, which led to the conclusion that each Trustee should serve as a Trustee for the fund.
Annual Report
Trustees and Officers - continued
Independent Trustees:
Correspondence intended for each Independent Trustee (that is, the Trustees other than the Interested Trustees) may be sent to Fidelity Investments, P.O. Box 55235, Boston, Massachusetts 02205-5235.
Name, Year of Birth; Principal Occupations and Other Relevant Experience+ |
Dennis J. Dirks (1948) |
| Year of Election or Appointment: 2005 Prior to his retirement in May 2003, Mr. Dirks was Chief Operating Officer and a member of the Board of The Depository Trust & Clearing Corporation (DTCC). He also served as President, Chief Operating Officer, and Board member of The Depository Trust Company (DTC) and President and Board member of the National Securities Clearing Corporation (NSCC). In addition, Mr. Dirks served as Chief Executive Officer and Board member of the Government Securities Clearing Corporation, Chief Executive Officer and Board member of the Mortgage-Backed Securities Clearing Corporation, as a Trustee and a member of the Finance Committee of Manhattan College (2005-2008), and as a Trustee and a member of the Finance Committee of AHRC of Nassau County (2006-2008). Mr. Dirks is a member of the Independent Directors Council (IDC) Governing Council (2010-present) and Board of Directors for The Brookville Center for Children's Services, Inc. (2009-present). |
Alan J. Lacy (1953) |
| Year of Election or Appointment: 2008 Mr. Lacy serves as Senior Adviser (2007-present) of Oak Hill Capital Partners, L.P. (private equity). Mr. Lacy also served as Chief Executive Officer (2000-2005) and Vice Chairman (2005-2006) of Sears Holdings Corporation and Sears, Roebuck and Co. (retail). In addition, Mr. Lacy serves as a member of the Board of Directors of Dave & Buster's Entertainment, Inc. (restaurant and entertainment complexes, 2010-present), Earth Fare, Inc. (retail grocery, 2012-present), The Hillman Companies, Inc. (hardware wholesalers, 2010-present), and Bristol-Myers Squibb Company (global pharmaceuticals, 2008-present). Mr. Lacy is a member of the Board of Trustees of The National Parks Conservation Association (2006-present). Previously, Mr. Lacy served as Chairman of the Board of Trustees of the National Parks Conservation Association (2008-2011) and as a member of the Board of Directors for the Western Union Company (global money transfer, 2006-2011). |
Ned C. Lautenbach (1944) |
| Year of Election or Appointment: 2000 Mr. Lautenbach is Chairman of the Independent Trustees of the Equity and High Income Funds (2006-present) and serves as a Trustee of other Fidelity funds (2013-present). Mr. Lautenbach currently serves as the Lead Director of the Eaton Corporation Board of Directors (diversified industrial, 1997-present). Mr. Lautenbach is Chairman of the Board of Directors of the Philharmonic Center for the Arts in Naples, Florida (2012-present) and a member of the Council on Foreign Relations (1994-present). Previously, Mr. Lautenbach was a Partner/Advisory Partner at Clayton, Dubilier & Rice, LLC (private equity investment, 1998-2010), as well as a Director of Sony Corporation (2006-2007). |
Joseph Mauriello (1944) |
| Year of Election or Appointment: 2008 Prior to his retirement in January 2006, Mr. Mauriello served in numerous senior management positions including Deputy Chairman and Chief Operating Officer (2004-2005), and Vice Chairman of Financial Services (2002-2004) of KPMG LLP US (professional services, 1965-2005). Mr. Mauriello currently serves as a member of the Board of Directors of XL Group plc. (global insurance and re-insurance, 2006-present). Previously, Mr. Mauriello served as a Director of the Hamilton Funds of the Bank of New York (2006-2007) and of Arcadia Resources Inc. (health care services and products, 2007-2012). |
Robert W. Selander (1950) |
| Year of Election or Appointment: 2011 Previously, Mr. Selander served as a Member of the Advisory Board of Fidelity's Equity and High Income Funds (2011), Executive Vice Chairman (2010), Chief Executive Officer (2009-2010), and President and Chief Executive Officer (1997-2009) of Mastercard, Inc. |
Cornelia M. Small (1944) |
| Year of Election or Appointment: 2005 Ms. Small is a member of the Board of Directors (2009-present) and Chair of the Investment Committee (2010-present) of the Teagle Foundation. Ms. Small also serves on the Investment Committee of the Berkshire Taconic Community Foundation (2008-present). Previously, Ms. Small served as Chairperson (2002-2008) and a member of the Investment Committee and Chairperson (2008-2012) and a member of the Board of Trustees of Smith College. In addition, Ms. Small served as Chief Investment Officer, Director of Global Equity Investments, and a member of the Board of Directors of Scudder, Stevens & Clark and Scudder Kemper Investments. |
William S. Stavropoulos (1939) |
| Year of Election or Appointment: 2002 Mr. Stavropoulos is Vice Chairman of the Independent Trustees of the Equity and High Income Funds (2006-present) and serves as a Trustee of other Fidelity funds (2013-present). Mr. Stavropoulos serves as President and Founder of the Michigan Baseball Foundation, the Great Lakes Loons (2007-present). Mr. Stavropoulos is Chairman Emeritus of the Board of Directors of The Dow Chemical Company, where he previously served in numerous senior management positions, including President, CEO (1995-2000; 2002-2004), Chairman of the Executive Committee (2000-2006), and as a member of the Board of Directors (1990-2006). Currently, Mr. Stavropoulos is Chairman of the Board of Directors of Univar Inc. (global distributor of commodity and specialty chemicals), a Director of Teradata Corporation (data warehousing and technology solutions), and Maersk Inc. (industrial conglomerate), and a member of the Advisory Board for Metalmark Capital LLC (private equity investment, 2005-present). Mr. Stavropoulos is an operating advisor to Clayton, Dubilier & Rice, LLC (private equity investment). In addition, Mr. Stavropoulos is a member of the University of Notre Dame Advisory Council for the College of Science, a Trustee of the Rollin L. Gerstacker Foundation, and a Director of the Naples Philharmonic Center for the Arts. Previously, Mr. Stavropoulos served as a Director of Chemical Financial Corporation (bank holding company, 1993-2012) and Tyco International, Ltd. (multinational manufacturing and services, 2007-2012). |
David M. Thomas (1949) |
| Year of Election or Appointment: 2008 Previously, Mr. Thomas served as Executive Chairman (2005-2006) and Chairman and Chief Executive Officer (2000-2005) of IMS Health, Inc. (pharmaceutical and healthcare information solutions), and a Director of Fortune Brands, Inc. (consumer products, 2000-2011). In addition, Mr. Thomas serves as Non-Executive Chairman of the Board of Directors of Fortune Brands Home and Security (home and security products, 2011-present), and as a member of the Board of Directors of Interpublic Group of Companies, Inc. (marketing communication, 2004-present). |
+ The information above includes each Trustee's principal occupation during the last five years and other information relating to the experience, attributes, and skills relevant to each Trustee's qualifications to serve as a Trustee, which led to the conclusion that each Trustee should serve as a Trustee for the fund.
Annual Report
Advisory Board Member and Executive Officers:
Correspondence intended for each executive officer and Peter S. Lynch may be sent to Fidelity Investments, 245 Summer Street, Boston, Massachusetts 02210.
Name, Year of Birth; Principal Occupation |
Peter S. Lynch (1944) |
| Year of Election or Appointment: 2003 Member of the Advisory Board of Fidelity's Equity and High Income Funds. Mr. Lynch is Vice Chairman and a Director of FMR and FMR Co., Inc. In addition, Mr. Lynch serves as a Trustee of Boston College and as the Chairman of the Inner-City Scholarship Fund. Previously, Mr. Lynch served on the Special Olympics International Board of Directors (1997-2006). |
Kenneth B. Robins (1969) |
| Year of Election or Appointment: 2008 President and Treasurer of Fidelity's Equity and High Income Funds. Mr. Robins also serves as President and Treasurer (2008-present) and Assistant Treasurer (2009-present) of other Fidelity funds and is an employee of Fidelity Investments (2004-present). Mr. Robins serves as Executive Vice President of Fidelity Investments Money Management, Inc. (FIMM) (2013-present). Previously, Mr. Robins served as Deputy Treasurer of the Fidelity funds (2005-2008) and Treasurer and Chief Financial Officer of The North Carolina Capital Management Trust: Cash and Term Portfolios (2006-2008). |
Bruce T. Herring (1965) |
| Year of Election or Appointment: 2006 Vice President of certain Equity Funds. Mr. Herring also serves as Vice President of other Fidelity funds (2013-present), Chief Investment Officer of Fidelity Global Asset Allocation (GAA) (2013-present), Chief Investment Officer and Director of Fidelity Management & Research (U.K.) Inc. (2010-present), Group Chief Investment Officer of FMR, and President of Fidelity Research & Analysis Company (2010-present). Previously, Mr. Herring served as Vice President (2005-2006) and Senior Vice President (2006-2007) of Fidelity Management & Research Company, Vice President of FMR Co., Inc. (2001-2007) and as a portfolio manager for Fidelity U.S. Equity Funds. |
Brian B. Hogan (1964) |
| Year of Election or Appointment: 2009 Vice President of Equity and High Income Funds. Mr. Hogan also serves as Vice President of other Fidelity funds (2009-present) and President of FMR's Equity Division (2009-present). Previously, Mr. Hogan served as Senior Vice President, Equity Research of FMR (2006-2009) and as a portfolio manager. |
Scott C. Goebel (1968) |
| Year of Election or Appointment: 2008 Secretary and Chief Legal Officer (CLO) of the Fidelity funds. Mr. Goebel also serves as Secretary of Fidelity Investments Money Management, Inc. (FIMM) (2010-present) and Fidelity Research and Analysis Company (FRAC) (2010-present); Secretary and CLO of The North Carolina Capital Management Trust: Cash and Term Portfolios (2008-present); General Counsel, Secretary, and Senior Vice President of FMR (2008-present) and FMR Co., Inc. (2008-present); employed by FMR LLC or an affiliate (2001-present); Chief Legal Officer of Fidelity Management & Research (Hong Kong) Limited (2008-present) and Assistant Secretary of Fidelity Management & Research (Japan) Inc. (2008-present), and Fidelity Management & Research (U.K.) Inc. (2008-present). Previously, Mr. Goebel served as Assistant Secretary of FIMM (2008-2010), FRAC (2008-2010), and the Funds (2007-2008) and as Vice President and Secretary of Fidelity Distributors Corporation (FDC) (2005-2007). |
William C. Coffey (1969) |
| Year of Election or Appointment: 2009 Assistant Secretary of Fidelity's Equity and High Income Funds. Mr. Coffey also serves as Assistant Secretary of other Fidelity funds (2009-present), Senior Vice President and Deputy General Counsel of FMR LLC (2010-present), and is an employee of Fidelity Investments. Previously, Mr. Coffey served as Vice President and Associate General Counsel of FMR LLC (2005-2009). |
Elizabeth Paige Baumann (1968) |
| Year of Election or Appointment: 2012 Anti-Money Laundering (AML) Officer of the Fidelity funds. Ms. Baumann also serves as AML Officer of The North Carolina Capital Management Trust: Cash and Term Portfolios (2012-present), Chief AML Officer of FMR LLC (2012-present), and is an employee of Fidelity Investments. Previously, Ms. Baumann served as Vice President and Deputy Anti-Money Laundering Officer (2007-2012). |
Christine Reynolds (1958) |
| Year of Election or Appointment: 2008 Chief Financial Officer of the Fidelity funds. Ms. Reynolds became President of Fidelity Pricing and Cash Management Services (FPCMS) in August 2008. Ms. Reynolds served as Chief Operating Officer of FPCMS (2007-2008). Previously, Ms. Reynolds served as President, Treasurer, and Anti-Money Laundering officer of the Fidelity funds (2004-2007). |
Joseph A. Hanlon (1968) |
| Year of Election or Appointment: 2012 Chief Compliance Officer of Fidelity's Equity and High Income Funds. Mr. Hanlon also serves as Chief Compliance Officer of other Fidelity funds (2012-present). Mr. Hanlon serves as Compliance Officer of FMR, FMR Co., Inc., Fidelity Investments Money Management, Inc. (FIMM), Fidelity Research and Analysis Company (FRAC), and Fidelity Management & Research (Hong Kong) (2009-present), as Senior Vice President of the Fidelity Asset Management Division (2009-present), and is an employee of Fidelity Investments. Previously, Mr. Hanlon served as Compliance Officer of Fidelity Management & Research (Japan) Inc. (2009-2013), Strategic Advisers, Inc. (2009-2013), and Fidelity Management & Research (U.K.) Inc. (2009-2013). |
Joseph F. Zambello (1957) |
| Year of Election or Appointment: 2011 Deputy Treasurer of the Fidelity funds. Mr. Zambello is an employee of Fidelity Investments. Previously, Mr. Zambello served as Vice President of FMR's Program Management Group (2009-2011) and Vice President of the Transfer Agent Oversight Group (2005-2009). |
Adrien E. Deberghes (1967) |
| Year of Election or Appointment: 2008 Deputy Treasurer of Fidelity's Equity and High Income Funds. Mr. Deberghes also serves as Vice President (2011-present), Deputy Treasurer (2008-present), and Assistant Treasurer (2010-present) of other Fidelity funds, and is an employee of Fidelity Investments (2008-present). Previously, Mr. Deberghes served as Senior Vice President of Mutual Fund Administration at State Street Corporation (2007-2008), Senior Director of Mutual Fund Administration at Investors Bank & Trust (2005-2007), and Director of Finance for Dunkin' Brands (2000-2005). |
Stephen Sadoski (1971) |
| Year of Election or Appointment: 2012 Deputy Treasurer of Fidelity's Equity and High Income Funds. Mr. Sadoski also serves as Deputy Treasurer of other Fidelity funds (2012-present) and is an employee of Fidelity Investments (2012-present). Previously, Mr. Sadoski served as Assistant Treasurer of Fidelity's Fixed Income and Asset Allocation Funds (2012-2013), an assistant chief accountant in the Division of Investment Management of the Securities and Exchange Commission (SEC) (2009-2012) and as a senior manager at Deloitte & Touche LLP (1997-2009). |
Stacie M. Smith (1974) |
| Year of Election or Appointment: 2013 Deputy Treasurer of Fidelity's Equity and High Income Funds. Ms. Smith also serves as Deputy Treasurer of other Fidelity funds (2013-present) and is an employee of Fidelity Investments (2009-present). Previously, Ms. Smith served as Senior Audit Manager of Ernst & Young LLP (1996-2009). |
Stephanie J. Dorsey (1969) |
| Year of Election or Appointment: 2010 Assistant Treasurer of Fidelity's Equity and High Income Funds. Ms. Dorsey also serves as President and Treasurer (2013-present) and Assistant Treasurer (2010-present) of other Fidelity funds, Treasurer and Chief Financial Officer of The North Carolina Capital Management Trust: Cash and Term Portfolios (2013-present), and is an employee of Fidelity Investments (2008-present). Previously, Ms. Dorsey served as Deputy Treasurer of Fidelity's Fixed Income and Asset Allocation Funds (2008-2013), Treasurer (2004-2008) of the JPMorgan Mutual Funds and Vice President (2004-2008) of JPMorgan Chase Bank. |
Gary W. Ryan (1958) |
| Year of Election or Appointment: 2005 Assistant Treasurer of the Fidelity funds. Mr. Ryan is an employee of Fidelity Investments. Previously, Mr. Ryan served as Vice President of Fund Reporting in Fidelity Pricing and Cash Management Services (FPCMS) (1999-2005). |
Jonathan Davis (1968) |
| Year of Election or Appointment: 2010 Assistant Treasurer of the Fidelity funds. Mr. Davis is also Assistant Treasurer of Fidelity Rutland Square Trust II and Fidelity Commonwealth Trust II. Mr. Davis is an employee of Fidelity Investments. Previously, Mr. Davis served as Vice President and Associate General Counsel of FMR LLC (2003-2010). |
Annual Report
The Board of Trustees of Fidelity Dividend Growth Fund voted to pay on record date, the following distributions per share derived from capital gains realized from sales of portfolio securities, and dividends derived from net investment income:
| Pay Date | Record Date | Dividends | Capital Gains |
Class K | 9/9/13 | 9/06/13 | $0.203 | $2.46 |
The fund hereby designates as a capital gain dividend with respect to the taxable year ended July 31, 2013 $500,005,624, or, if subsequently determined to be different, the net capital gain of such year.
Class K designates 100% and 86% of the dividends distributed in September 2012 and December 2012, respectively during the fiscal year as qualifying for the dividends-received deduction for corporate shareholders.
Class K designates 100% of the dividends distributed during the fiscal year as amounts which may be taken into account as a dividend for the purposes of the maximum rate under section 1(h)(11) of the Internal Revenue Code.
The fund will notify shareholders in January 2014 of amounts for use in preparing 2013 income tax returns.
Annual Report
Board Approval of Investment Advisory Contracts and Management Fees
Fidelity Dividend Growth Fund
Each year, the Board of Trustees, including the Independent Trustees (together, the Board), votes on the renewal of the management contract and sub-advisory agreements (together, the Advisory Contracts) for the fund. The Board, assisted by the advice of fund counsel and Independent Trustees' counsel, requests and considers a broad range of information relevant to the renewal of the Advisory Contracts throughout the year.
The Board meets regularly and, at each of its meetings, covers an extensive agenda of topics and materials and considers factors that are relevant to its annual consideration of the renewal of the fund's Advisory Contracts, including the services and support provided to the fund and its shareholders. The Board has established various standing committees, each composed of and chaired by Independent Trustees with varying backgrounds, to which the Board has assigned specific subject matter responsibilities in order to enhance effective decision-making by the Board. The Board, acting directly and through its Committees, requests and receives information concerning the annual consideration of the renewal of the fund's Advisory Contracts. The Board also meets as needed to consider matters specifically related to the Board's annual consideration of the renewal of Advisory Contracts. Members of the Board may also meet with trustees of other Fidelity funds through ad hoc joint committees to discuss certain matters relevant to the Fidelity funds.
At its July 2013 meeting, the Board, including the Independent Trustees, unanimously determined to renew the fund's Advisory Contracts. In reaching its determination, the Board considered all factors it believed relevant, including (i) the nature, extent, and quality of the services to be provided to the fund and its shareholders (including the investment performance of the fund); (ii) the competitiveness of the fund's management fee and total expense ratio relative to peer funds; (iii) the total costs of the services to be provided by and the profits to be realized by Fidelity from its relationship with the fund; (iv) the extent to which economies of scale exist and would be realized as the fund grows; and (v) whether fee levels reflect these economies of scale, if any, for the benefit of fund shareholders.
In considering whether to renew the Advisory Contracts for the fund, the Board reached a determination, with the assistance of fund counsel and Independent Trustees' counsel and through the exercise of its business judgment, that the renewal of the Advisory Contracts was in the best interests of the fund and its shareholders and that the compensation payable under the Advisory Contracts was fair and reasonable. The Board's decision to renew the Advisory Contracts was not based on any single factor, but rather was based on a comprehensive consideration of all the information provided to the Board at its meetings throughout the year. The Board, in reaching its determination to renew the Advisory Contracts, was aware that shareholders in the fund have a broad range of investment choices available to them, including a wide choice among mutual funds offered by Fidelity's competitors, and that the fund's shareholders, who have the opportunity to review and weigh the disclosure provided by the fund in its prospectus and other public disclosures, have chosen to invest in this fund, which is a part of the Fidelity family of funds.
Annual Report
Nature, Extent, and Quality of Services Provided. The Board considered the staffing within the investment adviser, Fidelity Management & Research Company (FMR), and the sub-advisers (together, the Investment Advisers) as it relates to the fund, including the backgrounds of the fund's investment personnel, and also considered the fund's investment objective, strategies, and related investment philosophy. The Independent Trustees also had discussions with senior management of Fidelity's investment operations and investment groups. The Board considered the structure of the portfolio manager compensation program and whether this structure provides appropriate incentives to act in the best interests of the fund.
Resources Dedicated to Investment Management and Support Services. The Board and the Fund Oversight and Research Committees reviewed the general qualifications and capabilities of the Investment Advisers' investment staff, including its size, education, experience, and resources, as well as the Investment Advisers' approach to recruiting, training, managing, and compensating investment personnel. The Board noted that FMR has continued to increase the resources devoted to non-U.S. offices, including expansion of Fidelity's global investment organization. The Board also noted that Fidelity's analysts have extensive resources, tools and capabilities that allow them to conduct sophisticated quantitative and fundamental analysis, as well as credit analysis of issuers, counterparties and guarantors. Further, the Board believes that Fidelity's investment professionals have sufficient access to global information and data so as to provide competitive investment results over time, and that those professionals also have access to sophisticated tools that permit them to assess portfolio construction and risk and performance attribution characteristics continuously, as well as to transmit new information and research conclusions rapidly around the world. Additionally, in its deliberations, the Board considered the Investment Advisers' trading and risk management capabilities and resources, which are an integral part of the investment management process.
Shareholder and Administrative Services. The Board considered (i) the nature, extent, quality, and cost of advisory, administrative, and shareholder services performed by the Investment Advisers and their affiliates under the Advisory Contracts and under separate agreements covering transfer agency, pricing and bookkeeping, and securities lending services for the fund; (ii) the nature and extent of the supervision of third party service providers, principally custodians and subcustodians; and (iii) the resources devoted to, and the record of compliance with, the fund's compliance policies and procedures. The Board also reviewed the allocation of fund brokerage, including allocations to brokers affiliated with the Investment Advisers, the use of brokerage commissions to pay fund expenses, and the use of "soft" commission dollars to pay for research services.
Annual Report
Board Approval of Investment Advisory Contracts and
Management Fees - continued
The Board noted that the growth of fund assets over time across the complex allows Fidelity to reinvest in the development of services designed to enhance the value or convenience of the Fidelity funds as investment vehicles. These services include 24-hour access to account information and market information through telephone representatives and over the Internet, investor education materials and asset allocation tools, and the expanded availability of Fidelity Investor Centers.
Investment in a Large Fund Family. The Board considered the benefits to shareholders of investing in a Fidelity fund, including the benefits of investing in a fund that is part of a large family of funds offering a variety of investment disciplines and providing a large variety of mutual fund investor services. The Board noted that Fidelity had taken, or had made recommendations that resulted in the Fidelity funds taking, a number of actions over the previous year that benefited particular funds, including (i) continuing to dedicate additional resources to investment research and to the support of the senior management team that oversees asset management; (ii) persisting in efforts to enhance Fidelity's global research capabilities; (iii) launching new funds and making other enhancements to meet client needs for global and income-oriented solutions; (iv) continuing to launch dedicated lower cost underlying funds to meet portfolio construction needs related to expanding underlying fund options for Fidelity funds of funds, specifically for the Freedom Fund product lines; (v) rationalizing product lines and gaining increased efficiencies through the mergers of several funds into other funds; (vi) strengthening Fidelity's index fund offerings by reducing investment minimums and adopting or lowering existing expense caps for certain funds and classes; (vii) enhancing Global Asset Allocation product offerings by launching new funds and strategies, including "open architecture" target date funds that utilize affiliated and unaffiliated sub-advisers; (viii) modifying the eligibility criteria for Institutional Class shares of Advisor funds to increase their marketability to a portion of the defined contribution plan market; (ix) creating a new low-cost retirement share class for certain Advisor funds to appeal to large retirement plans; (x) transitioning the management of certain Fidelity commodity funds to Geode Capital Management LLC, a registered commodity pool operator, while retaining administrative responsibilities for the funds; (xi) reorganizing a number of funds; and (xii) taking steps toward establishing a new Fidelity adviser to manage sector-based funds and products.
Investment Performance. The Board considered whether the fund has operated in accordance with its investment objective, as well as its record of compliance with its investment restrictions and its performance history.
The Board took into account discussions with the Investment Advisers about fund investment performance that occur at Board meetings throughout the year. In this regard the Board noted that as part of regularly scheduled fund reviews and other reports to the Board on fund performance, the Board periodically considers annualized return information for the fund, for different time periods, measured against a securities market index ("benchmark index") and a peer group of mutual funds with similar objectives ("peer group"). In its evaluation of fund investment performance, the Board gave particular attention to information indicating changes in performance of certain Fidelity funds for specific time periods and the Investment Advisers' explanations for any overperformance or, in the case of the fund, underperformance.
Annual Report
In addition to reviewing absolute and relative fund performance, the Independent Trustees periodically consider the appropriateness of fund performance metrics in evaluating the results achieved. In general, the Independent Trustees believe that fund performance should be evaluated based on net performance (after fees and expenses) of both the highest performing and lowest performing classes, where applicable, compared to appropriate benchmark indices, over appropriate time periods which may include full market cycles, and compared to peer groups, as applicable, over the same periods, taking into account relevant factors including the following: general market conditions; issuer-specific information; tactical opportunities for investment; and fund cash flows and other factors.
The Independent Trustees recognize that shareholders evaluate performance on a net basis over their own holding periods, for which one-, three-, and five-year periods are used as a proxy. For this reason, the performance information reviewed by the Board also included net cumulative calendar year total return information for the fund and an appropriate benchmark index and peer group for the most recent one-, three-, and five-year periods, as shown below. Returns are shown compared to the 25th percentile (top of box) and 75th percentile (bottom of box) of the peer universe.
Annual Report
Board Approval of Investment Advisory Contracts and
Management Fees - continued
Fidelity Dividend Growth Fund
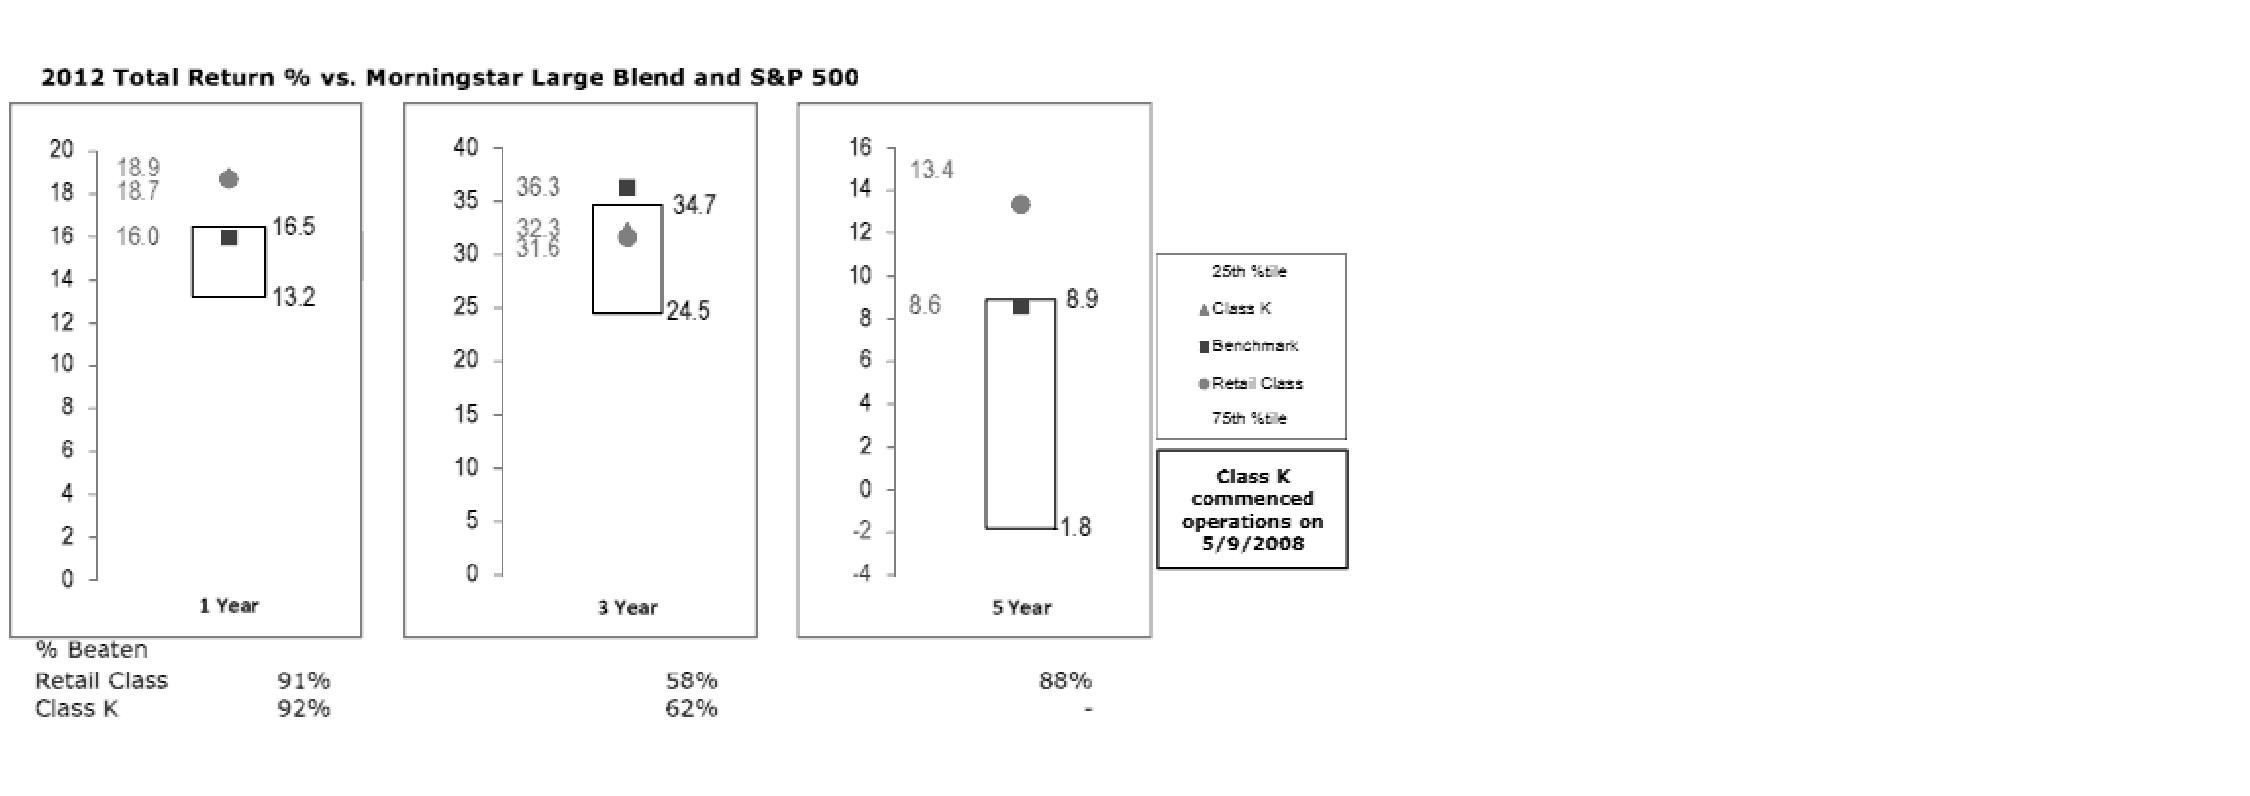
The Board has discussed the fund's performance with FMR, including the fund's underperformance based on more recent periods ended after 2012 (which periods are not shown in the chart above) but prior to the date of the Board's approval of the renewal of the Advisory Contracts, and has engaged with FMR to consider what steps might be taken to remediate the fund's more recent underperformance.
The Board also considered that the fund's management fee is subject to upward or downward adjustment depending upon whether, and to what extent, the fund's investment performance for the performance period exceeds, or is exceeded by, a securities index, thus leading to a performance adjustment for the same period. The Board noted that the performance adjustment provides FMR with a strong economic incentive to seek to achieve superior performance for the fund's shareholders and helps to more closely align the interests of FMR and the fund's shareholders.
Based on its review, the Board concluded that the nature, extent, and quality of services provided to the fund under the Advisory Contracts should benefit the fund's shareholders.
Competitiveness of Management Fee and Total Expense Ratio. The Board considered the fund's management fee and total expense ratio compared to "mapped groups" of competitive funds and classes. Fidelity creates "mapped groups" by combining similar Lipper investment objective categories that have comparable management fee characteristics. Combining Lipper investment objective categories aids the Board's management fee and total expense ratio comparisons by broadening the competitive group used for comparison and by reducing the number of universes to which various Fidelity funds are compared.
Annual Report
Management Fee. The Board considered two proprietary management fee comparisons for the 12-month periods shown in the chart below. The group of Lipper funds used by the Board for management fee comparisons is referred to below as the "Total Mapped Group." The Total Mapped Group comparison focuses on a fund's standing in terms of gross management fees before expense reimbursements or caps, and without giving effect to the fund's performance adjustment, relative to the total universe of funds with comparable investment mandates, regardless of whether their management fee structures also are comparable. Funds with comparable investment mandates offer exposure to similar types of securities. Funds with comparable management fee structures have similar management fee contractual arrangements (e.g., flat rate charged for advisory services, all-inclusive fee rate, etc.). "TMG %" represents the percentage of funds in the Total Mapped Group that had management fees that were lower than the fund's. For example, a TMG % of 11% means that 89% of the funds in the Total Mapped Group had higher management fees than the fund. The "Asset-Size Peer Group" (ASPG) comparison focuses on a fund's standing relative to a subset of non-Fidelity funds within the Total Mapped Group that are similar in size and management fee structure. The ASPG represents at least 15% of the funds in the Total Mapped Group with comparable asset size and management fee structures, subject to a minimum of 50 funds (or all funds in the Total Mapped Group if fewer than 50). Additional information, such as the ASPG quartile in which the fund's management fee ranked and the impact of the fund's performance adjustment, is also included in the chart and considered by the Board.
Fidelity Dividend Growth Fund
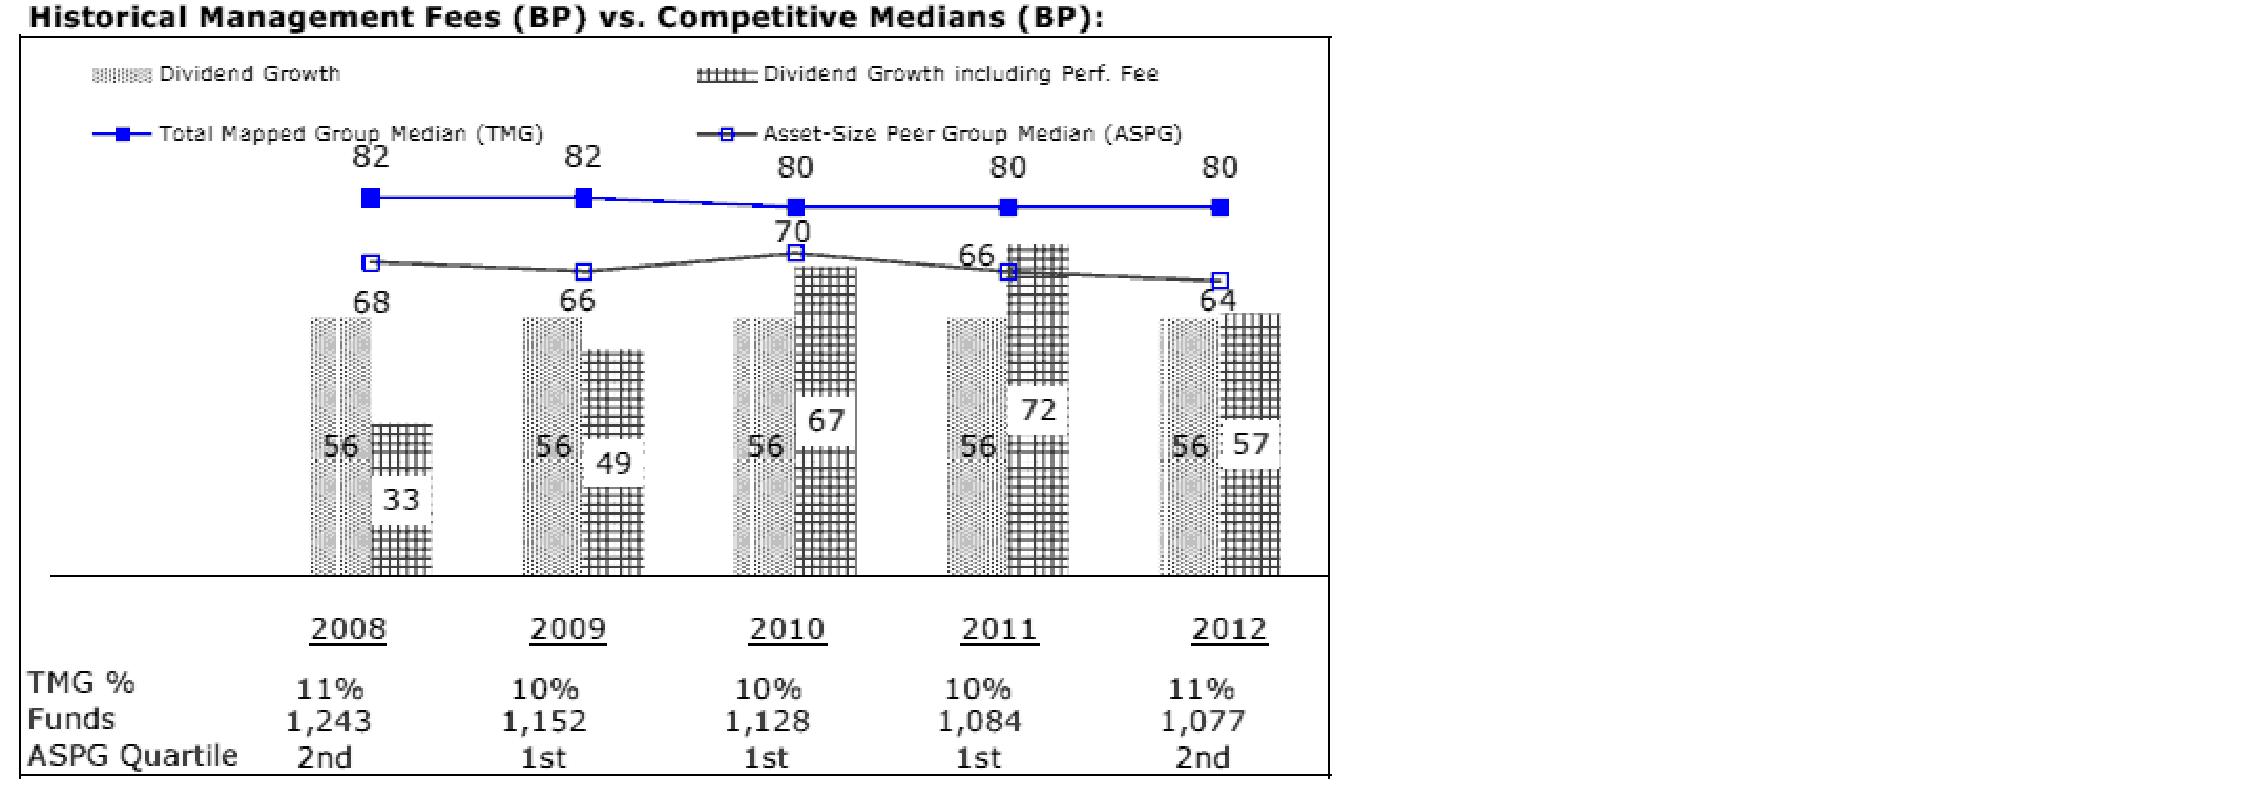
Annual Report
Board Approval of Investment Advisory Contracts and
Management Fees - continued
The Board noted that the fund's management fee ranked below the median of its Total Mapped Group and below the median of its ASPG for 2012. The Board also noted the effect of the fund's positive performance adjustment on the fund's management fee ranking.
Based on its review, the Board concluded that the fund's management fee is fair and reasonable in light of the services that the fund receives and the other factors considered.
Total Expense Ratio. In its review of each class's total expense ratio, the Board considered the fund's management fee as well as other fund or class expenses, as applicable, such as transfer agent fees, pricing and bookkeeping fees, and custodial, legal, and audit fees. The Board also noted the effects of any waivers and reimbursements on fees and expenses, as well as the impact of the fund's performance adjustment. As part of its review, the Board also considered the current and historical total expense ratios of each class of the fund compared to competitive fund median expenses. Each class of the fund is compared to those funds and classes in the Total Mapped Group (used by the Board for management fee comparisons) that have a similar sales load structure.
The Board noted that the total expense ratio of each class ranked below its competitive median for 2012.
Fees Charged to Other Fidelity Clients. The Board also considered Fidelity fee structures and other information with respect to clients of FMR and its affiliates, such as other mutual funds advised or subadvised by FMR or its affiliates, pension plan clients, and other institutional clients. The Board noted the findings of the 2013 ad hoc joint committee (created with the board of other Fidelity funds), which reviewed and compared Fidelity's institutional investment advisory business with its business of providing services to the Fidelity funds, including the differences in services provided, fees charged, and costs incurred, as well as competition in their respective marketplaces.
Based on its review of total expense ratios and fees charged to other Fidelity clients, the Board concluded that the total expense ratio of each class of the fund was reasonable in light of the services that the fund and its shareholders receive and the other factors considered.
Costs of the Services and Profitability. The Board considered the revenues earned and the expenses incurred by Fidelity in conducting the business of developing, marketing, distributing, managing, administering and servicing the fund and servicing the fund's shareholders. The Board also considered the level of Fidelity's profits in respect of all the Fidelity funds.
On an annual basis, FMR presents to the Board Fidelity's profitability for the fund. Fidelity calculates the profitability for each fund, as well as aggregate profitability for groups of Fidelity funds and all Fidelity funds, using a series of detailed revenue and cost allocation methodologies which originate with the books and records of Fidelity on which Fidelity's audited financial statements are based. The Audit Committee of the Board reviews any significant changes from the prior year's methodologies.
Annual Report
PricewaterhouseCoopers LLP (PwC), independent registered public accounting firm and auditor to Fidelity and certain Fidelity funds, has been engaged annually by the Board as part of the Board's assessment of Fidelity's profitability analysis. PwC's engagement includes the review and assessment of the methodologies used by Fidelity in determining the revenues and expenses attributable to Fidelity's mutual fund business, and completion of agreed-upon procedures surrounding the mathematical accuracy of fund profitability and its conformity to allocation methodologies. After considering PwC's reports issued under the engagement and information provided by Fidelity, the Board concluded that while other allocation methods may also be reasonable, Fidelity's profitability methodologies are reasonable in all material respects.
The Board also reviewed Fidelity's non-fund businesses and fall-out benefits related to the mutual fund business as well as cases where Fidelity's affiliates may benefit from or be related to the fund's business.
The Board considered the costs of the services provided by and the profits realized by Fidelity in connection with the operation of the fund and was satisfied that the profitability was not excessive in the circumstances.
Economies of Scale. The Board considered whether there have been economies of scale in respect of the management of the Fidelity funds, whether the Fidelity funds (including the fund) have appropriately benefited from any such economies of scale, and whether there is potential for realization of any further economies of scale. The Board considered the extent to which the fund will benefit from economies of scale through increased services to the fund, through waivers or reimbursements, or through fee or expense reductions. The Board also noted that in 2009, it and the board of other Fidelity funds created an ad hoc committee (the Economies of Scale Committee) to analyze whether FMR attains economies of scale in respect of the management and servicing of the Fidelity funds, whether the Fidelity funds have appropriately benefited from such economies of scale, and whether there is potential for realization of any further economies of scale.
The Board recognized that the fund's management contract incorporates a "group fee" structure, which provides for lower group fee rates as total fund assets under FMR's management increase, and for higher group fee rates as total fund assets under FMR's management decrease. FMR calculates the group fee rates based on a tiered asset "breakpoint" schedule that varies based on asset class. The Board considered that the group fee is designed to deliver the benefits of economies of scale to fund shareholders when total Fidelity fund assets increase, even if assets of any particular fund are unchanged or have declined, because some portion of Fidelity's costs are attributable to services provided to all Fidelity funds, and all funds benefit if those costs can be allocated among more assets. The Board concluded that, given the group fee structure, fund shareholders will benefit from lower management fees as assets under FMR's management increase at the fund complex level, regardless of whether Fidelity achieves any such economies of scale.
Annual Report
Board Approval of Investment Advisory Contracts and
Management Fees - continued
The Board concluded, taking into account the analysis of the Economies of Scale Committee, that economies of scale, if any, are being appropriately shared between fund shareholders and Fidelity.
Amendment to Description of Group Fee Rate. At its July 2013 meeting, the Board voted to approve an amendment to the fund's management contract to modify the description of the "group fee rate" effective August 1, 2013. The Board noted that under the prior description in the contract, the group fee rate was based on the average net assets of all registered investment companies with which FMR has management contracts. Under the contract's tiered asset breakpoint schedule, the group fee rate is lower as total fund assets under FMR's management increase, and higher as total fund assets under FMR's management decrease. The Board considered that the prior description would have excluded the assets of 64 Fidelity sector funds from the group fee rate calculation once Fidelity SelectCo, LLC, an affiliate of FMR, assumed management responsibilities for those funds. The Board noted that modifying the description of the group fee rate to continue to include the assets of those 64 funds for purposes of determining group fee rate breakpoints would avoid an immediate adverse impact on the group fee rate for any fund.
Additional Information Requested by the Board. In order to develop fully the factual basis for consideration of the Fidelity funds' Advisory Contracts, the Board requested and received additional information on certain topics, including: (i) fund performance trends and Fidelity's long-term strategies for certain funds; (ii) the potential to further rationalize the Fidelity fund lineup with the possibility of achieving savings for the funds and Fidelity; (iii) the methodology with respect to competitive fund data and peer group classifications; (iv) the arrangements with, and performance of, certain sub-advisers on behalf of the Fidelity funds, as well as certain proposed participating affiliate arrangements; (v) the realization of fall-out benefits in certain Fidelity business units; (vi) Fidelity's group fee structures, including the rationale for the individual fee rates of certain categories of funds and the definition of group assets; (vii) trends regarding industry use of performance fee structures and the performance adjustment methodologies applicable to the Fidelity funds; (viii) additional competitive analysis regarding the total expenses for certain classes; and (ix) fund profitability methodology, including Fidelity's cost allocation methodology, and the impact of certain factors on fund profitability results.
Annual Report
Based on its evaluation of all of the conclusions noted above, and after considering all factors it believed relevant, the Board ultimately concluded that the advisory fee structures are fair and reasonable, and that the fund's Advisory Contracts should be renewed.
Annual Report
Investment Adviser
Fidelity Management & Research Company
Boston, MA
Investment Sub-Advisers
FMR Co., Inc.
Fidelity Management & Research
(U.K.) Inc.
Fidelity Management & Research
(Hong Kong) Limited
Fidelity Management & Research
(Japan) Inc.
General Distributor
Fidelity Distributors Corporation
Smithfield, RI
Transfer and Service Agents
Fidelity Investments Institutional
Operations Company, Inc.
Boston, MA
Fidelity Service Company, Inc.
Boston, MA
Custodian
Citibank, N.A.,
New York, NY
(Fidelity Investment logo)(registered trademark)
Corporate Headquarters
245 Summer St., Boston, MA 02210
www.fidelity.com
DGF-K-UANN-0913
1.863064.104
Fidelity®
Growth & Income
Portfolio
Annual Report
July 31, 2013
(Fidelity Cover Art)
Contents
Performance | (Click Here) | How the fund has done over time. |
Management's Discussion of Fund Performance | (Click Here) | The Portfolio Manager's review of fund performance and strategy. |
Shareholder Expense Example | (Click Here) | An example of shareholder expenses. |
Investment Changes | (Click Here) | A summary of major shifts in the fund's investments over the past six months. |
Investments | (Click Here) | A complete list of the fund's investments with their market values. |
Financial Statements | (Click Here) | Statements of assets and liabilities, operations, and changes in net assets, as well as financial highlights. |
Notes | (Click Here) | Notes to the financial statements. |
Report of Independent Registered Public Accounting Firm | (Click Here) | |
Trustees and Officers | (Click Here) | |
Distributions | (Click Here) | |
Board Approval of Investment Advisory Contracts and Management Fees | (Click Here) | |
To view a fund's proxy voting guidelines and proxy voting record for the 12-month period ended June 30, visit http://www.fidelity.com/proxyvotingresults or visit the Securities and Exchange Commission's (SEC) web site at http://www.sec.gov. You may also call 1-800-544-8544 to request a free copy of the proxy voting guidelines.
Standard & Poor's, S&P and S&P 500 are registered service marks of The McGraw-Hill Companies, Inc. and have been licensed for use by Fidelity Distributors Corporation.
Other third-party marks appearing herein are the property of their respective owners.
All other marks appearing herein are registered or unregistered trademarks or service marks of FMR LLC or an affiliated company. © 2013 FMR LLC. All rights reserved.
Annual Report
This report and the financial statements contained herein are submitted for the general information of the shareholders of the fund. This report is not authorized for distribution to prospective investors in the fund unless preceded or accompanied by an effective prospectus.
A fund files its complete schedule of portfolio holdings with the SEC for the first and third quarters of each fiscal year on Form N-Q. Forms N-Q are available on the SEC's web site at http://www.sec.gov. A fund's Forms N-Q may be reviewed and copied at the SEC's Public Reference Room in Washington, DC. Information regarding the operation of the SEC's Public Reference Room may be obtained by calling 1-800-SEC-0330. For a complete list of a fund's portfolio holdings, view the most recent holdings listing, semiannual report, or annual report on Fidelity's web site at http://www.fidelity.com, http://www.advisor.fidelity.com, or http://www.401k.com, as applicable.
NOT FDIC INSURED • MAY LOSE VALUE • NO BANK GUARANTEE
Neither the fund nor Fidelity Distributors Corporation is a bank.
Annual Report
Average annual total return reflects the change in the value of an investment, assuming reinvestment of the class' distributions from dividend income and capital gains (the profits earned upon the sale of securities that have grown in value, if any) and assuming a constant rate of performance each year. The $10,000 table and the fund's returns do not reflect the deduction of taxes that a shareholder would pay on fund distributions or the redemption of fund shares. During periods of reimbursement by Fidelity, a fund's total return will be greater than it would be had the reimbursement not occurred. How a fund did yesterday is no guarantee of how it will do tomorrow.
Average Annual Total Returns
Periods ended July 31, 2013 | Past 1
year | Past 5
years | Past 10
years |
Fidelity® Growth & Income Portfolio | 30.15% | 4.72% | 3.41% |
$10,000 Over 10 Years
Let's say hypothetically that $10,000 was invested in Fidelity® Growth & Income Portfolio, a class of the fund, on July 31, 2003. The chart shows how the value of your investment would have changed, and also shows how the S&P 500® Index performed over the same period.
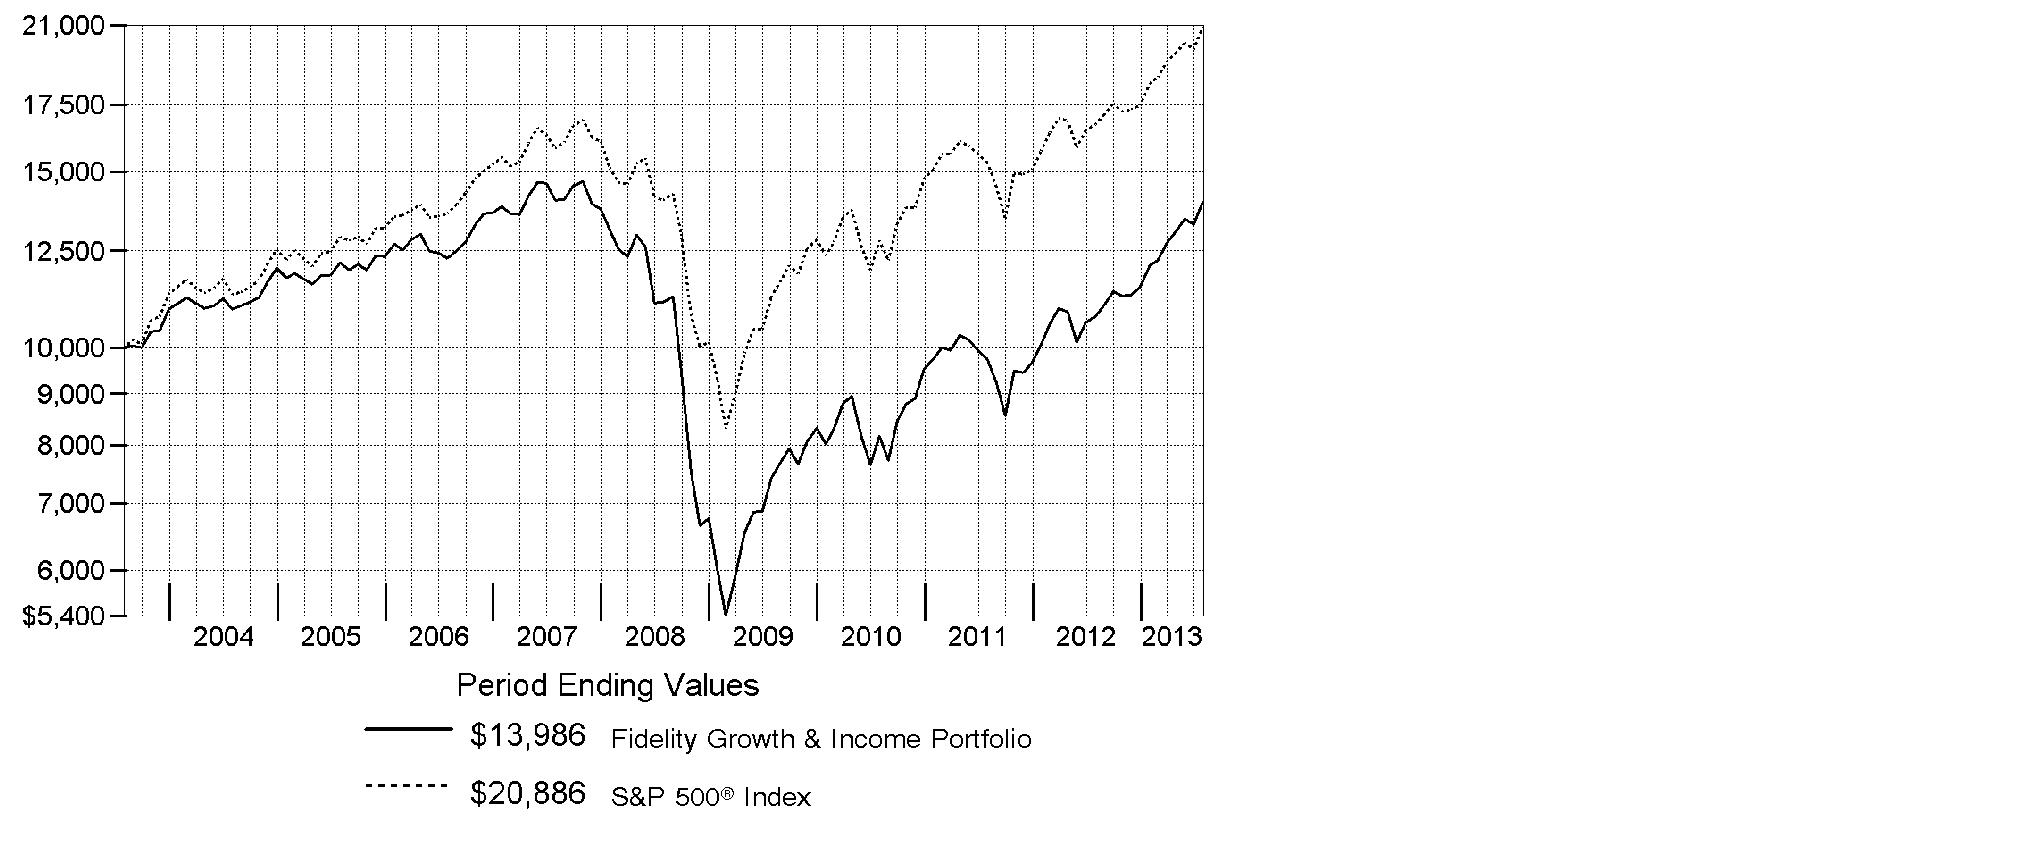
Annual Report
Market Recap: The bull run in U.S. stocks comfortably settled into a fifth year, as major equity benchmarks ripped through records during the 12 months ending July 31, 2013. Gains were fueled by a generally improving global economy and accommodative monetary policies worldwide. The tone was positive for most of the year, based largely on stronger U.S. economic data, including employment, housing and consumer sentiment. Setting a series of new highs along the way, the broad-based S&P 500® Index rose an impressive 25.00% for the 12 months, while the blue-chip-laden Dow Jones Industrial AverageSM also moved into record territory en route to a 22.36% gain. The growth-oriented Nasdaq Composite Index® had a similarly strong run, advancing 25.15%. During the year, markets were resilient amid intermittent volatility over debt woes in Europe, the 2012 U.S. presidential election and year-end Congressional gridlock over the federal budget. In mid-to-late June, concern arose about the U.S. Federal Reserve possibly tapering its sustaining bond-buying strategy - which prompted a brief, but steep, market sell-off. However, investors' continued quest for yield and the Fed's pledge to keep buying bonds until the economy showed significant improvement overpowered the uncertainty and helped equities climb notably higher in July to close the period on a strong note.
Comments from Matthew Fruhan, Portfolio Manager of Fidelity® Growth & Income Portfolio: For the year, the fund's Retail Class shares returned 30.15%, ahead of the S&P 500®. My investment philosophy is based on my belief that stock performance is driven by changes in long-term earnings and yield expectations. This approach worked as anticipated, as the market came around to my view on several major holdings, most notably a number of stocks from the diversified financials industry. This group easily outperformed the market during the past year, and my positioning here, especially a significant overweight, provided a major boost versus the benchmark. Top individual contributors included outsized stakes in financial services giants JPMorgan Chase and Morgan Stanley, discount brokerage firm Charles Schwab, and global leader Citigroup, all of which saw their stock prices gain sharply. Litigation income received during the period helped. Conversely, avoiding major index component Gilead Sciences was our biggest relative detractor because the stock moved higher as investors gained confidence in the biopharmaceutical company based on the trajectory of its earnings growth. In energy, we were hurt by out-of-index stakes in oil and gas company Royal Dutch Shell, which was pressured by lower commodity prices, and Canada's Suncor Energy, an integrated energy firm that was hampered by execution problems in delivering production growth.
The views expressed above reflect those of the portfolio manager(s) only through the end of the period as stated on the cover of this report and do not necessarily represent the views of Fidelity or any other person in the Fidelity organization. Any such views are subject to change at any time based upon market or other conditions and Fidelity disclaims any responsibility to update such views. These views may not be relied on as investment advice and, because investment decisions for a Fidelity fund are based on numerous factors, may not be relied on as an indication of trading intent on behalf of any Fidelity fund.
Annual Report
Shareholder Expense Example
As a shareholder of the Fund, you incur two types of costs: (1) transaction costs, and (2) ongoing costs, including management fees and other Fund expenses. This Example is intended to help you understand your ongoing costs (in dollars) of investing in the Fund and to compare these costs with the ongoing costs of investing in other mutual funds.
The Example is based on an investment of $1,000 invested at the beginning of the period and held for the entire period (February 1, 2013 to July 31, 2013).
Actual Expenses
The first line of the accompanying table for each class of the Fund provides information about actual account values and actual expenses. You may use the information in this line, together with the amount you invested, to estimate the expenses that you paid over the period. Simply divide your account value by $1,000.00 (for example, an $8,600 account value divided by $1,000.00 = 8.6), then multiply the result by the number in the first line for a class of the Fund under the heading entitled "Expenses Paid During Period" to estimate the expenses you paid on your account during this period. A small balance maintenance fee of $12.00 that is charged once a year may apply for certain accounts with a value of less than $2,000. This fee is not included in the table below. If it was, the estimate of expenses you paid during the period would be higher, and your ending account value lower, by this amount. In addition, the Fund, as a shareholder in the underlying Fidelity Central Funds, will indirectly bear its pro-rata share of the fees and expenses incurred by the underlying Fidelity Central Funds. These fees and expenses are not included in the Fund's annualized expense ratio used to calculate the expense estimate in the table below.
Hypothetical Example for Comparison Purposes
The second line of the accompanying table for each class of the Fund provides information about hypothetical account values and hypothetical expenses based on a Class' actual expense ratio and an assumed rate of return of 5% per year before expenses, which is not the Class' actual return. The hypothetical account values and expenses may not be used to estimate the actual ending account balance or expenses you paid for the period. You may use this information to compare the ongoing costs of investing in the Fund and other funds. To do so, compare this 5% hypothetical example with the 5% hypothetical examples that appear in the shareholder reports of the other funds. A small balance maintenance fee of $12.00 that is charged once a year may apply for certain accounts with a value of less than $2,000. This fee is not included in the table below. If it was, the estimate of expenses you paid during the period would be higher, and your ending account value lower, by this amount. In addition, the Fund, as a shareholder in the underlying Fidelity Central Funds, will indirectly bear its pro-rata share of the fees and expenses incurred by the underlying Fidelity Central Funds. These fees and expenses are not included in the Fund's annualized expense ratio used to calculate the expense estimate in the table below.
Please note that the expenses shown in the table are meant to highlight your ongoing costs only and do not reflect any transaction costs. Therefore, the second line of the table is useful in comparing ongoing costs only, and will not help you determine the relative total costs of owning different funds.
Annual Report
Shareholder Expense Example - continued
| Annualized
Expense RatioB | Beginning
Account Value
February 1, 2013 | Ending
Account Value
July 31, 2013 | Expenses Paid
During Period*
February 1, 2013
to July 31, 2013 |
Growth and Income | .67% | | | |
Actual | | $ 1,000.00 | $ 1,157.30 | $ 3.58 |
HypotheticalA | | $ 1,000.00 | $ 1,021.47 | $ 3.36 |
Class K | .53% | | | |
Actual | | $ 1,000.00 | $ 1,158.20 | $ 2.84 |
HypotheticalA | | $ 1,000.00 | $ 1,022.17 | $ 2.66 |
A 5% return per year before expenses
B Annualized expense ratio reflects expenses net of applicable fee waivers.
* Expenses are equal to each Class' annualized expense ratio, multiplied by the average account value over the period, multiplied by 181/365 (to reflect the one-half year period).
Annual Report
Investment Changes (Unaudited)
Top Ten Stocks as of July 31, 2013 |
| % of fund's
net assets | % of fund's net assets
6 months ago |
JPMorgan Chase & Co. | 3.8 | 3.8 |
Apple, Inc. | 3.3 | 3.4 |
General Electric Co. | 2.9 | 2.8 |
Chevron Corp. | 2.6 | 3.1 |
Wells Fargo & Co. | 2.4 | 3.0 |
Microsoft Corp. | 2.3 | 2.0 |
Citigroup, Inc. | 2.1 | 1.8 |
Procter & Gamble Co. | 2.0 | 2.3 |
Occidental Petroleum Corp. | 1.9 | 1.0 |
Target Corp. | 1.9 | 1.7 |
| 25.2 | |
Top Five Market Sectors as of July 31, 2013 |
| % of fund's
net assets | % of fund's net assets
6 months ago |
Financials | 20.4 | 19.8 |
Information Technology | 16.9 | 15.9 |
Health Care | 13.5 | 12.0 |
Energy | 11.9 | 11.9 |
Industrials | 11.2 | 12.3 |
Asset Allocation (% of fund's net assets) |
As of July 31, 2013 * | As of January 31, 2013 ** |
 | Stocks 98.8% | | | Stocks 98.5% | |
 | Convertible
Securities 1.1% | | | Convertible
Securities 1.2% | |
 | Short-Term
Investments and
Net Other Assets
(Liabilities) 0.1% | | | Short-Term
Investments and
Net Other Assets
(Liabilities) 0.3% | |
* Foreign investments | 11.5% | | ** Foreign investments | 10.8% | |

Annual Report
Investments July 31, 2013
Showing Percentage of Net Assets
Common Stocks - 98.8% |
| Shares | | Value (000s) |
CONSUMER DISCRETIONARY - 10.3% |
Auto Components - 0.1% |
Gentex Corp. | 288,524 | | $ 6,515 |
Automobiles - 0.5% |
Ford Motor Co. | 2,100,236 | | 35,452 |
Distributors - 0.1% |
LKQ Corp. (a) | 311,998 | | 8,134 |
Diversified Consumer Services - 0.2% |
H&R Block, Inc. | 554,707 | | 17,434 |
Hotels, Restaurants & Leisure - 1.5% |
Darden Restaurants, Inc. | 31,437 | | 1,542 |
McDonald's Corp. | 601,346 | | 58,980 |
Wyndham Worldwide Corp. | 133,467 | | 8,315 |
Yum! Brands, Inc. | 492,785 | | 35,934 |
| | 104,771 |
Leisure Equipment & Products - 0.2% |
Mattel, Inc. | 335,606 | | 14,106 |
Media - 3.5% |
Comcast Corp. Class A | 2,784,200 | | 125,512 |
Scripps Networks Interactive, Inc. Class A | 181,725 | | 12,861 |
Time Warner, Inc. | 1,397,564 | | 87,012 |
Viacom, Inc. Class B (non-vtg.) | 295,855 | | 21,529 |
| | 246,914 |
Multiline Retail - 2.1% |
Kohl's Corp. | 256,385 | | 13,583 |
Target Corp. | 1,900,103 | | 135,382 |
| | 148,965 |
Specialty Retail - 1.8% |
H&M Hennes & Mauritz AB (B Shares) | 76,600 | | 2,853 |
Lowe's Companies, Inc. | 2,371,734 | | 105,732 |
Staples, Inc. | 906,232 | | 15,424 |
| | 124,009 |
Textiles, Apparel & Luxury Goods - 0.3% |
Coach, Inc. | 150,332 | | 7,987 |
Li & Fung Ltd. | 9,512,000 | | 12,584 |
| | 20,571 |
TOTAL CONSUMER DISCRETIONARY | | 726,871 |
Common Stocks - continued |
| Shares | | Value (000s) |
CONSUMER STAPLES - 10.8% |
Beverages - 2.6% |
C&C Group PLC | 391,300 | | $ 2,160 |
Molson Coors Brewing Co. Class B | 324,112 | | 16,225 |
PepsiCo, Inc. | 767,027 | | 64,077 |
Remy Cointreau SA | 45,300 | | 4,690 |
The Coca-Cola Co. | 2,497,605 | | 100,104 |
| | 187,256 |
Food & Staples Retailing - 2.0% |
CVS Caremark Corp. | 616,404 | | 37,903 |
Walgreen Co. | 1,989,849 | | 99,990 |
| | 137,893 |
Food Products - 1.0% |
Danone SA | 313,484 | | 24,772 |
Kellogg Co. | 612,547 | | 40,575 |
Mead Johnson Nutrition Co. Class A | 83,500 | | 6,082 |
| | 71,429 |
Household Products - 2.9% |
Kimberly-Clark Corp. | 550,532 | | 54,393 |
Procter & Gamble Co. | 1,795,515 | | 144,180 |
Svenska Cellulosa AB (SCA) (B Shares) | 159,500 | | 4,221 |
| | 202,794 |
Tobacco - 2.3% |
British American Tobacco PLC sponsored ADR | 907,527 | | 96,652 |
Lorillard, Inc. | 1,320,746 | | 56,171 |
Philip Morris International, Inc. | 128,923 | | 11,497 |
| | 164,320 |
TOTAL CONSUMER STAPLES | | 763,692 |
ENERGY - 11.8% |
Energy Equipment & Services - 1.4% |
Ensco PLC Class A | 306,706 | | 17,587 |
Halliburton Co. | 1,000,327 | | 45,205 |
Schlumberger Ltd. | 451,719 | | 36,738 |
| | 99,530 |
Oil, Gas & Consumable Fuels - 10.4% |
Access Midstream Partners LP | 237,233 | | 11,143 |
Apache Corp. | 423,097 | | 33,954 |
Atlas Pipeline Partners LP | 562,134 | | 21,305 |
BG Group PLC | 680,800 | | 12,288 |
Common Stocks - continued |
| Shares | | Value (000s) |
ENERGY - continued |
Oil, Gas & Consumable Fuels - continued |
BP PLC sponsored ADR | 327,650 | | $ 13,578 |
Canadian Natural Resources Ltd. | 1,470,800 | | 45,580 |
Chevron Corp. | 1,479,705 | | 186,280 |
ENI SpA | 317,000 | | 7,002 |
Exxon Mobil Corp. | 569,711 | | 53,410 |
Legacy Reserves LP | 113,845 | | 3,089 |
Magellan Midstream Partners LP | 31,121 | | 1,702 |
Markwest Energy Partners LP | 511,743 | | 35,929 |
Occidental Petroleum Corp. | 1,528,498 | | 136,113 |
Royal Dutch Shell PLC Class A (United Kingdom) | 1,585,215 | | 54,089 |
Suncor Energy, Inc. | 1,950,450 | | 61,641 |
The Williams Companies, Inc. | 1,618,223 | | 55,295 |
Western Gas Partners LP | 67,200 | | 4,140 |
| | 736,538 |
TOTAL ENERGY | | 836,068 |
FINANCIALS - 20.3% |
Capital Markets - 4.1% |
AllianceBernstein Holding LP | 161,066 | | 3,576 |
Apollo Investment Corp. | 541,130 | | 4,399 |
Ashmore Group PLC | 1,115,278 | | 6,289 |
BlackRock, Inc. Class A | 46,736 | | 13,178 |
Charles Schwab Corp. | 3,278,562 | | 72,423 |
KKR & Co. LP | 1,298,447 | | 26,553 |
Morgan Stanley | 2,389,897 | | 65,029 |
Northern Trust Corp. | 531,251 | | 31,099 |
State Street Corp. | 628,483 | | 43,786 |
The Blackstone Group LP | 542,685 | | 12,238 |
UBS AG | 492,693 | | 9,702 |
| | 288,272 |
Commercial Banks - 5.6% |
BNP Paribas SA | 89,500 | | 5,791 |
Comerica, Inc. | 861,168 | | 36,634 |
Erste Group Bank AG | 238,550 | | 7,245 |
PNC Financial Services Group, Inc. | 786,612 | | 59,822 |
Standard Chartered PLC (United Kingdom) | 1,003,555 | | 23,274 |
SunTrust Banks, Inc. | 377,966 | | 13,149 |
Common Stocks - continued |
| Shares | | Value (000s) |
FINANCIALS - continued |
Commercial Banks - continued |
U.S. Bancorp | 2,049,173 | | $ 76,475 |
Wells Fargo & Co. | 3,944,449 | | 171,584 |
| | 393,974 |
Consumer Finance - 0.2% |
SLM Corp. | 599,485 | | 14,813 |
Diversified Financial Services - 7.7% |
Bank of America Corp. | 5,874,991 | | 85,775 |
Citigroup, Inc. | 2,843,659 | | 148,268 |
JPMorgan Chase & Co. | 4,741,229 | | 264,228 |
KKR Financial Holdings LLC | 2,810,344 | | 29,705 |
NYSE Euronext | 198,750 | | 8,379 |
The NASDAQ Stock Market, Inc. | 221,589 | | 7,179 |
| | 543,534 |
Insurance - 1.7% |
AFLAC, Inc. | 73,546 | | 4,536 |
Arthur J. Gallagher & Co. | 117,800 | | 5,228 |
Marsh & McLennan Companies, Inc. | 118,607 | | 4,966 |
MetLife, Inc. | 1,503,466 | | 72,798 |
MetLife, Inc. unit | 364,100 | | 20,757 |
Prudential Financial, Inc. | 200,068 | | 15,799 |
| | 124,084 |
Real Estate Investment Trusts - 0.6% |
American Capital Agency Corp. | 229,125 | | 5,162 |
Aviv REIT, Inc. | 33,600 | | 837 |
BioMed Realty Trust, Inc. | 100,245 | | 2,071 |
Invesco Mortgage Capital, Inc. | 131,922 | | 2,167 |
MFA Financial, Inc. | 281,750 | | 2,248 |
Sun Communities, Inc. | 552,314 | | 26,743 |
| | 39,228 |
Real Estate Management & Development - 0.1% |
Beazer Pre-Owned Rental Homes, Inc. (a)(e) | 254,400 | | 5,236 |
Thrifts & Mortgage Finance - 0.3% |
Housing Development Finance Corp. Ltd. (a) | 102,933 | | 1,354 |
Radian Group, Inc. | 1,687,868 | | 23,715 |
| | 25,069 |
TOTAL FINANCIALS | | 1,434,210 |
Common Stocks - continued |
| Shares | | Value (000s) |
HEALTH CARE - 12.7% |
Biotechnology - 0.8% |
Amgen, Inc. | 529,703 | | $ 57,362 |
Health Care Equipment & Supplies - 1.2% |
Abbott Laboratories | 330,904 | | 12,121 |
ResMed, Inc. (d) | 57,682 | | 2,749 |
St. Jude Medical, Inc. | 559,800 | | 29,328 |
Stryker Corp. | 356,188 | | 25,097 |
Zimmer Holdings, Inc. | 183,510 | | 15,319 |
| | 84,614 |
Health Care Providers & Services - 3.4% |
Aetna, Inc. | 550,998 | | 35,358 |
AmerisourceBergen Corp. | 82,600 | | 4,813 |
Fresenius Medical Care AG & Co. KGaA | 102,300 | | 6,460 |
McKesson Corp. | 361,687 | | 44,365 |
Quest Diagnostics, Inc. | 967,950 | | 56,441 |
UnitedHealth Group, Inc. | 759,704 | | 55,344 |
WellPoint, Inc. | 483,266 | | 41,348 |
| | 244,129 |
Health Care Technology - 0.2% |
Quality Systems, Inc. | 568,117 | | 12,993 |
Life Sciences Tools & Services - 0.2% |
Lonza Group AG | 216,954 | | 16,691 |
Pharmaceuticals - 6.9% |
AbbVie, Inc. | 1,090,718 | | 49,606 |
AstraZeneca PLC sponsored ADR | 348,396 | | 17,671 |
Eli Lilly & Co. | 141,980 | | 7,541 |
GlaxoSmithKline PLC sponsored ADR | 1,221,493 | | 62,247 |
Johnson & Johnson | 1,289,997 | | 120,615 |
Merck & Co., Inc. | 2,778,819 | | 133,856 |
Novartis AG sponsored ADR | 375,075 | | 26,859 |
Pfizer, Inc. | 952,269 | | 27,835 |
Sanofi SA | 248,538 | | 26,018 |
Teva Pharmaceutical Industries Ltd. sponsored ADR | 345,862 | | 13,731 |
| | 485,979 |
TOTAL HEALTH CARE | | 901,768 |
INDUSTRIALS - 11.1% |
Aerospace & Defense - 2.2% |
Honeywell International, Inc. | 151,261 | | 12,552 |
Rockwell Collins, Inc. | 367,298 | | 26,141 |
Common Stocks - continued |
| Shares | | Value (000s) |
INDUSTRIALS - continued |
Aerospace & Defense - continued |
The Boeing Co. | 699,889 | | $ 73,558 |
United Technologies Corp. | 447,782 | | 47,272 |
| | 159,523 |
Air Freight & Logistics - 1.5% |
C.H. Robinson Worldwide, Inc. | 503,673 | | 30,029 |
United Parcel Service, Inc. Class B | 913,404 | | 79,283 |
| | 109,312 |
Building Products - 0.0% |
Fagerhult AB | 16,600 | | 453 |
Commercial Services & Supplies - 0.3% |
ADT Corp. | 154,411 | | 6,189 |
KAR Auction Services, Inc. | 300,200 | | 7,637 |
Ritchie Brothers Auctioneers, Inc. | 281,140 | | 5,420 |
| | 19,246 |
Electrical Equipment - 0.5% |
Hubbell, Inc. Class B | 289,039 | | 31,028 |
Zumtobel AG | 125,161 | | 1,537 |
| | 32,565 |
Industrial Conglomerates - 3.0% |
General Electric Co. | 8,515,998 | | 207,535 |
Siemens AG sponsored ADR | 36,300 | | 4,010 |
| | 211,545 |
Machinery - 1.0% |
Douglas Dynamics, Inc. | 941,855 | | 13,534 |
Ingersoll-Rand PLC | 417,067 | | 25,462 |
ITT Corp. | 267,895 | | 8,369 |
Pfeiffer Vacuum Technology AG | 29,554 | | 3,218 |
Stanley Black & Decker, Inc. | 274,344 | | 23,215 |
| | 73,798 |
Marine - 0.0% |
Irish Continental Group PLC unit | 22,093 | | 676 |
Professional Services - 0.5% |
Acacia Research Corp. | 358,122 | | 8,172 |
Amadeus Fire AG | 49,393 | | 2,989 |
Bureau Veritas SA | 218,596 | | 6,488 |
Dun & Bradstreet Corp. | 80,314 | | 8,323 |
Michael Page International PLC | 1,131,563 | | 7,686 |
| | 33,658 |
Common Stocks - continued |
| Shares | | Value (000s) |
INDUSTRIALS - continued |
Road & Rail - 1.4% |
CSX Corp. | 2,276,271 | | $ 56,474 |
J.B. Hunt Transport Services, Inc. | 230,830 | | 17,296 |
Norfolk Southern Corp. | 344,099 | | 25,174 |
| | 98,944 |
Trading Companies & Distributors - 0.7% |
Beijer (G&L) AG Series B | 43,211 | | 696 |
Brenntag AG | 12,900 | | 2,119 |
MSC Industrial Direct Co., Inc. Class A | 255,220 | | 20,660 |
W.W. Grainger, Inc. | 88,072 | | 23,087 |
Watsco, Inc. | 36,459 | | 3,403 |
| | 49,965 |
TOTAL INDUSTRIALS | | 789,685 |
INFORMATION TECHNOLOGY - 16.9% |
Communications Equipment - 2.4% |
Cisco Systems, Inc. | 4,472,251 | | 114,266 |
QUALCOMM, Inc. | 890,446 | | 57,478 |
| | 171,744 |
Computers & Peripherals - 3.5% |
Apple, Inc. | 515,289 | | 233,168 |
EMC Corp. | 587,020 | | 15,351 |
| | 248,519 |
Internet Software & Services - 1.8% |
Google, Inc. Class A (a) | 142,489 | | 126,473 |
IT Services - 5.4% |
Accenture PLC Class A | 138,445 | | 10,219 |
Cognizant Technology Solutions Corp. Class A (a) | 421,936 | | 30,544 |
Fidelity National Information Services, Inc. | 621,836 | | 26,838 |
IBM Corp. | 122,450 | | 23,883 |
MasterCard, Inc. Class A | 108,250 | | 66,099 |
Paychex, Inc. | 3,145,172 | | 124,046 |
The Western Union Co. | 2,150,880 | | 38,630 |
Visa, Inc. Class A | 336,974 | | 59,648 |
| | 379,907 |
Semiconductors & Semiconductor Equipment - 1.2% |
Altera Corp. | 548,340 | | 19,499 |
Analog Devices, Inc. | 337,365 | | 16,652 |
Applied Materials, Inc. | 2,381,149 | | 38,837 |
Common Stocks - continued |
| Shares | | Value (000s) |
INFORMATION TECHNOLOGY - continued |
Semiconductors & Semiconductor Equipment - continued |
Broadcom Corp. Class A | 103,675 | | $ 2,858 |
Maxim Integrated Products, Inc. | 232,000 | | 6,635 |
| | 84,481 |
Software - 2.6% |
Microsoft Corp. | 5,146,302 | | 163,807 |
Oracle Corp. | 739,747 | | 23,931 |
| | 187,738 |
TOTAL INFORMATION TECHNOLOGY | | 1,198,862 |
MATERIALS - 1.7% |
Chemicals - 1.5% |
Airgas, Inc. | 183,883 | | 18,979 |
E.I. du Pont de Nemours & Co. | 389,240 | | 22,455 |
FMC Corp. | 157,061 | | 10,391 |
Monsanto Co. | 171,014 | | 16,893 |
Potash Corp. of Saskatchewan, Inc. | 111,400 | | 3,232 |
RPM International, Inc. | 83,400 | | 2,939 |
Syngenta AG (Switzerland) | 67,676 | | 26,760 |
| | 101,649 |
Metals & Mining - 0.2% |
Freeport-McMoRan Copper & Gold, Inc. | 150,200 | | 4,248 |
Grupo Mexico SA de CV Series B | 1,353,500 | | 4,170 |
Southern Copper Corp. | 304,530 | | 7,939 |
| | 16,357 |
TOTAL MATERIALS | | 118,006 |
TELECOMMUNICATION SERVICES - 2.1% |
Diversified Telecommunication Services - 1.3% |
CenturyLink, Inc. | 221,194 | | 7,930 |
Verizon Communications, Inc. | 1,745,415 | | 86,363 |
| | 94,293 |
Wireless Telecommunication Services - 0.8% |
Vodafone Group PLC sponsored ADR | 1,794,442 | | 53,744 |
TOTAL TELECOMMUNICATION SERVICES | | 148,037 |
Common Stocks - continued |
| Shares | | Value (000s) |
UTILITIES - 1.1% |
Electric Utilities - 0.7% |
Ceske Energeticke Zavody A/S | 29,900 | | $ 711 |
Duke Energy Corp. | 95,279 | | 6,765 |
EDF SA | 198,000 | | 5,809 |
FirstEnergy Corp. | 269,914 | | 10,276 |
Hawaiian Electric Industries, Inc. | 349,665 | | 9,322 |
ITC Holdings Corp. | 73,709 | | 6,764 |
Northeast Utilities | 107,072 | | 4,755 |
PPL Corp. | 242,053 | | 7,690 |
| | 52,092 |
Multi-Utilities - 0.4% |
E.ON AG | 98,728 | | 1,675 |
National Grid PLC | 109,854 | | 1,313 |
PG&E Corp. | 154,385 | | 7,085 |
Sempra Energy | 160,709 | | 14,083 |
| | 24,156 |
TOTAL UTILITIES | | 76,248 |
TOTAL COMMON STOCKS (Cost $5,578,320) |
6,993,447
|
Convertible Preferred Stocks - 1.0% |
| | | |
ENERGY - 0.0% |
Oil, Gas & Consumable Fuels - 0.0% |
Apache Corp. 6.00% | 85,000 | | 3,885 |
FINANCIALS - 0.1% |
Real Estate Investment Trusts - 0.1% |
Weyerhaeuser Co. Series A, 6.375% (a) | 136,200 | | 7,078 |
HEALTH CARE - 0.8% |
Health Care Equipment & Supplies - 0.8% |
Alere, Inc. 3.00% | 196,925 | | 54,550 |
INDUSTRIALS - 0.1% |
Aerospace & Defense - 0.1% |
United Technologies Corp. 7.50% | 110,600 | | 7,093 |
TOTAL CONVERTIBLE PREFERRED STOCKS (Cost $64,477) |
72,606
|
Convertible Bonds - 0.1% |
| Principal
Amount (000s) | | Value (000s) |
ENERGY - 0.1% |
Oil, Gas & Consumable Fuels - 0.1% |
Amyris, Inc. 3% 2/27/17 | | $ 5,615 | | $ 3,963 |
Peabody Energy Corp. 4.75% 12/15/66 | | 390 | | 293 |
| | 4,256 |
HEALTH CARE - 0.0% |
Health Care Equipment & Supplies - 0.0% |
Volcano Corp. 1.75% 12/1/17 | | 3,640 | | 3,440 |
TOTAL CONVERTIBLE BONDS (Cost $9,324) |
7,696
|
Money Market Funds - 0.1% |
| Shares | | |
Fidelity Cash Central Fund, 0.11% (b) | 4,724,889 | | 4,725 |
Fidelity Securities Lending Cash Central Fund, 0.12% (b)(c) | 1,104,000 | | 1,104 |
TOTAL MONEY MARKET FUNDS (Cost $5,829) |
5,829
|
TOTAL INVESTMENT PORTFOLIO - 100.0% (Cost $5,657,950) | | 7,079,578 |
NET OTHER ASSETS (LIABILITIES) - 0.0% | | (3,516) |
NET ASSETS - 100% | $ 7,076,062 |
Legend |
(a) Non-income producing |
(b) Affiliated fund that is generally available only to investment companies and other accounts managed by Fidelity Investments. The rate quoted is the annualized seven-day yield of the fund at period end. A complete unaudited listing of the fund's holdings as of its most recent quarter end is available upon request. In addition, each Fidelity Central Fund's financial statements, which are not covered by the Fund's Report of Independent Registered Public Accounting Firm, are available on the SEC's website or upon request. |
(c) Investment made with cash collateral received from securities on loan. |
(d) Security or a portion of the security is on loan at period end. |
(e) Restricted securities - Investment in securities not registered under the Securities Act of 1933 (excluding 144A issues). At the end of the period, the value of restricted securities (excluding 144A issues) amounted to $5,236,000 or 0.1% of net assets. |
Additional information on each restricted holding is as follows: |
Security | Acquisition
Date | Acquisition
Cost (000s) |
Beazer Pre-Owned Rental Homes, Inc. | 5/3/12 - 10/23/12 | $ 5,088 |
Affiliated Central Funds |
Information regarding fiscal year to date income earned by the Fund from investments in Fidelity Central Funds is as follows: |
Fund | Income earned
(Amounts in thousands) |
Fidelity Cash Central Fund | $ 25 |
Fidelity Securities Lending Cash Central Fund | 476 |
Total | $ 501 |
Other Information |
The following is a summary of the inputs used, as of July 31, 2013, involving the Fund's assets and liabilities carried at fair value. The inputs or methodology used for valuing securities may not be an indication of the risk associated with investing in those securities. For more information on valuation inputs, and their aggregation into the levels used in the table below, please refer to the Investment Valuation section in the accompanying Notes to Financial Statements. |
Valuation Inputs at Reporting Date: |
Description
(Amounts in thousands) | Total | Level 1 | Level 2 | Level 3 |
Investments in Securities: | | | | |
Equities: | | | | |
Consumer Discretionary | $ 726,871 | $ 726,871 | $ - | $ - |
Consumer Staples | 763,692 | 763,692 | - | - |
Energy | 839,953 | 778,862 | 61,091 | - |
Financials | 1,441,288 | 1,398,515 | 37,537 | 5,236 |
Health Care | 956,318 | 923,840 | 32,478 | - |
Industrials | 796,778 | 796,778 | - | - |
Information Technology | 1,198,862 | 1,198,862 | - | - |
Materials | 118,006 | 91,246 | 26,760 | - |
Telecommunication Services | 148,037 | 148,037 | - | - |
Utilities | 76,248 | 74,935 | 1,313 | - |
Corporate Bonds | 7,696 | - | 7,696 | - |
Money Market Funds | 5,829 | 5,829 | - | - |
Total Investments in Securities: | $ 7,079,578 | $ 6,907,467 | $ 166,875 | $ 5,236 |
Distribution of investments by country or territory of incorporation, as a percentage of total net assets, is as follows. (Unaudited) |
United States of America | 88.5% |
United Kingdom | 5.3% |
Canada | 1.7% |
Switzerland | 1.1% |
France | 1.1% |
Others (Individually Less Than 1%) | 2.3% |
| 100.0% |
See accompanying notes which are an integral part of the financial statements.
Annual Report
Statement of Assets and Liabilities
Amounts in thousands (except per-share amounts) | July 31, 2013 |
| | |
Assets | | |
Investment in securities, at value (including securities loaned of $1,096) - See accompanying schedule: Unaffiliated issuers (cost $5,652,121) | $ 7,073,749 | |
Fidelity Central Funds (cost $5,829) | 5,829 | |
Total Investments (cost $5,657,950) | | $ 7,079,578 |
Receivable for investments sold | | 29,162 |
Receivable for fund shares sold | | 3,473 |
Dividends receivable | | 8,925 |
Interest receivable | | 85 |
Distributions receivable from Fidelity Central Funds | | 3 |
Other receivables | | 696 |
Total assets | | 7,121,922 |
| | |
Liabilities | | |
Payable for investments purchased | $ 35,666 | |
Payable for fund shares redeemed | 4,638 | |
Accrued management fee | 2,644 | |
Other affiliated payables | 1,055 | |
Other payables and accrued expenses | 753 | |
Collateral on securities loaned, at value | 1,104 | |
Total liabilities | | 45,860 |
| | |
Net Assets | | $ 7,076,062 |
Net Assets consist of: | | |
Paid in capital | | $ 9,921,182 |
Undistributed net investment income | | 4,966 |
Accumulated undistributed net realized gain (loss) on investments and foreign currency transactions | | (4,271,715) |
Net unrealized appreciation (depreciation) on investments and assets and liabilities in foreign currencies | | 1,421,629 |
Net Assets | | $ 7,076,062 |
See accompanying notes which are an integral part of the financial statements.
Annual Report
Financial Statements - continued
Statement of Assets and Liabilities - continued
Amounts in thousands (except per-share amounts) | July 31, 2013 |
| | |
Growth and Income:
Net Asset Value, offering price and redemption price per share ($6,059,874 ÷ 236,205 shares) | | $ 25.66 |
| | |
Class K:
Net Asset Value, offering price and redemption price per share ($1,016,188 ÷ 39,633 shares) | | $ 25.64 |
See accompanying notes which are an integral part of the financial statements.
Annual Report
Statement of Operations
Amounts in thousands | Year ended July 31, 2013 |
| | |
Investment Income | | |
Dividends | | $ 166,067 |
Interest | | 895 |
Income from Fidelity Central Funds | | 501 |
Total income | | 167,463 |
| | |
Expenses | | |
Management fee | $ 28,101 | |
Transfer agent fees | 10,906 | |
Accounting and security lending fees | 1,135 | |
Custodian fees and expenses | 181 | |
Independent trustees' compensation | 41 | |
Appreciation in deferred trustee compensation account | 1 | |
Registration fees | 114 | |
Audit | 91 | |
Legal | 33 | |
Interest | 2 | |
Miscellaneous | 54 | |
Total expenses before reductions | 40,659 | |
Expense reductions | (678) | 39,981 |
Net investment income (loss) | | 127,482 |
Realized and Unrealized Gain (Loss) Net realized gain (loss) on: | | |
Investment securities: | | |
Unaffiliated issuers | 486,483 | |
Foreign currency transactions | 127 | |
Total net realized gain (loss) | | 486,610 |
Change in net unrealized appreciation (depreciation) on: Investment securities | 1,017,935 | |
Assets and liabilities in foreign currencies | 4 | |
Total change in net unrealized appreciation (depreciation) | | 1,017,939 |
Net gain (loss) | | 1,504,549 |
Net increase (decrease) in net assets resulting from operations | | $ 1,632,031 |
See accompanying notes which are an integral part of the financial statements.
Annual Report
Financial Statements - continued
Statement of Changes in Net Assets
Amounts in thousands | Year ended
July 31,
2013 | Year ended
July 31,
2012 |
Increase (Decrease) in Net Assets | | |
Operations | | |
Net investment income (loss) | $ 127,482 | $ 102,946 |
Net realized gain (loss) | 486,610 | 104,201 |
Change in net unrealized appreciation (depreciation) | 1,017,939 | 318,127 |
Net increase (decrease) in net assets resulting
from operations | 1,632,031 | 525,274 |
Distributions to shareholders from net investment income | (120,664) | (98,353) |
Distributions to shareholders from net realized gain | (7,383) | (2,799) |
Total distributions | (128,047) | (101,152) |
Share transactions - net increase (decrease) | (42,531) | (265,023) |
Total increase (decrease) in net assets | 1,461,453 | 159,099 |
| | |
Net Assets | | |
Beginning of period | 5,614,609 | 5,455,510 |
End of period (including undistributed net investment income of $4,966 and undistributed net investment income of $5,432, respectively) | $ 7,076,062 | $ 5,614,609 |
See accompanying notes which are an integral part of the financial statements.
Annual Report
Financial Highlights - Growth and Income
Years ended July 31, | 2013 | 2012 | 2011 | 2010 | 2009 |
Selected Per-Share Data | | | | |
Net asset value, beginning of period | $ 20.13 | $ 18.58 | $ 15.75 | $ 14.38 | $ 21.88 |
Income from Investment Operations | | | | | |
Net investment income (loss) B | .46 | .36 | .20 | .10 | .15 |
Net realized and unrealized gain (loss) | 5.54 | 1.55 | 2.82 | 1.37 | (7.43) |
Total from investment operations | 6.00 | 1.91 | 3.02 | 1.47 | (7.28) |
Distributions from net investment income | (.44) | (.35) | (.19) | (.10) | (.19) |
Distributions from net realized gain | (.03) | (.01) | - | (.01) | (.03) |
Total distributions | (.47) | (.36) | (.19) | (.10) F | (.22) |
Net asset value, end of period | $ 25.66 | $ 20.13 | $ 18.58 | $ 15.75 | $ 14.38 |
Total Return A | 30.15% | 10.45% | 19.16% | 10.25% | (33.32)% |
Ratios to Average Net Assets C, E | | | | |
Expenses before reductions | .68% | .71% | .72% | .75% | .78% |
Expenses net of fee waivers, if any | .68% | .71% | .72% | .75% | .78% |
Expenses net of all reductions | .67% | .71% | .71% | .74% | .78% |
Net investment income (loss) | 2.04% | 1.95% | 1.09% | .63% | 1.07% |
Supplemental Data | | | | |
Net assets, end of period (in millions) | $ 6,060 | $ 4,863 | $ 5,052 | $ 5,417 | $ 5,993 |
Portfolio turnover rate D | 49% | 62% | 129% | 98% | 122% |
A Total returns would have been lower if certain expenses had not been reduced during the applicable periods shown.
B Calculated based on average shares outstanding during the period.
C Fees and expenses of any underlying Fidelity Central Funds are not included in the Fund's expense ratio. The Fund indirectly bears its proportionate share of the expenses of any underlying Fidelity Central Funds.
D Amount does not include the portfolio activity of any underlying Fidelity Central Funds.
E Expense ratios reflect operating expenses of the class. Expenses before reductions do not reflect amounts reimbursed by the investment adviser or reductions from brokerage service arrangements or reductions from other expense offset arrangements and do not represent the amount paid by the class during periods when reimbursements or reductions occur. Expenses net of fee waivers reflect expenses after reimbursement by the investment adviser but prior to reductions from brokerage service arrangements or other expense offset arrangements. Expenses net of all reductions represent the net expenses paid by the class.
F Total distributions of $.10 per share is comprised of distributions from net investment income of $.095 and distributions from net realized gain of $.008 per share.
See accompanying notes which are an integral part of the financial statements.
Annual Report
Financial Highlights - Class K
Years ended July 31, | 2013 | 2012 | 2011 | 2010 | 2009 |
Selected Per-Share Data | | | | |
Net asset value, beginning of period | $ 20.12 | $ 18.57 | $ 15.74 | $ 14.38 | $ 21.88 |
Income from Investment Operations | | | | | |
Net investment income (loss) B | .50 | .40 | .23 | .13 | .16 |
Net realized and unrealized gain (loss) | 5.52 | 1.54 | 2.82 | 1.37 | (7.40) |
Total from investment operations | 6.02 | 1.94 | 3.05 | 1.50 | (7.24) |
Distributions from net investment income | (.47) | (.38) | (.22) | (.13) | (.23) |
Distributions from net realized gain | (.03) | (.01) | - | (.01) | (.03) |
Total distributions | (.50) | (.39) | (.22) | (.14) F | (.26) |
Net asset value, end of period | $ 25.64 | $ 20.12 | $ 18.57 | $ 15.74 | $ 14.38 |
Total Return A | 30.28% | 10.66% | 19.40% | 10.41% | (33.12)% |
Ratios to Average Net Assets C, E | | | | |
Expenses before reductions | .53% | .54% | .54% | .54% | .56% |
Expenses net of fee waivers, if any | .53% | .54% | .54% | .54% | .56% |
Expenses net of all reductions | .52% | .54% | .53% | .53% | .55% |
Net investment income (loss) | 2.19% | 2.13% | 1.27% | .84% | 1.29% |
Supplemental Data | | | | |
Net assets, end of period (in millions) | $ 1,016 | $ 752 | $ 403 | $ 292 | $ 349 |
Portfolio turnover rate D | 49% | 62% | 129% | 98% | 122% |
A Total returns would have been lower if certain expenses had not been reduced during the applicable periods shown.
B Calculated based on average shares outstanding during the period.
C Fees and expenses of any underlying Fidelity Central Funds are not included in the Fund's expense ratio. The Fund indirectly bears its proportionate share of the expenses of any underlying Fidelity Central Funds.
D Amount does not include the portfolio activity of any underlying Fidelity Central Funds.
E Expense ratios reflect operating expenses of the class. Expenses before reductions do not reflect amounts reimbursed by the investment adviser or reductions from brokerage service arrangements or reductions from other expense offset arrangements and do not represent the amount paid by the class during periods when reimbursements or reductions occur. Expenses net of fee waivers reflect expenses after reimbursement by the investment adviser but prior to reductions from brokerage service arrangements or other expense offset arrangements. Expenses net of all reductions represent the net expenses paid by the class.
F Total distributions of $.14 per share is comprised of distributions from net investment income of $.129 and distributions from net realized gain of $.008 per share.
See accompanying notes which are an integral part of the financial statements.
Annual Report
Notes to Financial Statements
For the period ended July 31, 2013
(Amounts in thousands except percentages)
1. Organization.
Fidelity Growth & Income Portfolio (the Fund) is a fund of Fidelity Securities Fund (the Trust) and is authorized to issue an unlimited number of shares. The Trust is registered under the Investment Company Act of 1940, as amended (the 1940 Act), as an open-end management investment company organized as a Massachusetts business trust. The Fund offers Growth & Income and Class K, each of which, has equal rights as to assets and voting privileges. Each class has exclusive voting rights with respect to matters that affect that class.
2. Investments in Fidelity Central Funds.
The Fund invests in Fidelity Central Funds, which are open-end investment companies generally available only to other investment companies and accounts managed by Fidelity Management & Research Company (FMR) and its affiliates. The Fund's Schedule of Investments lists each of the Fidelity Central Funds held as of period end, if any, as an investment of the Fund, but does not include the underlying holdings of each Fidelity Central Fund. As an Investing Fund, the Fund indirectly bears its proportionate share of the expenses of the underlying Fidelity Central Funds.
The Money Market Central Funds seek preservation of capital and current income and are managed by Fidelity Investments Money Management, Inc. (FIMM), an affiliate of FMR.
A complete unaudited list of holdings for each Fidelity Central Fund is available upon request or at the Securities and Exchange Commission (the SEC) website at www.sec.gov. In addition, the financial statements of the Fidelity Central Funds, which are not covered by the Fund's Report of Independent Registered Public Accounting Firm, are available on the SEC website or upon request.
3. Significant Accounting Policies.
The financial statements have been prepared in conformity with accounting principles generally accepted in the United States of America (GAAP), which require management to make certain estimates and assumptions at the date of the financial statements. Actual results could differ from those estimates. Subsequent events, if any, through the date that the financial statements were issued have been evaluated in the preparation of the financial statements. The following summarizes the significant accounting policies of the Fund:
Annual Report
3. Significant Accounting Policies - continued
Investment Valuation. Investments are valued as of 4:00 p.m. Eastern time on the last calendar day of the period. In accordance with valuation policies and procedures approved by the Board of Trustees (the Board), the Fund attempts to obtain prices from one or more third party pricing vendors or brokers to value its investments. When current market prices, quotations or currency exchange rates are not readily available or reliable, investments will be fair valued in good faith by the FMR Fair Value Committee (the Committee), in accordance with procedures adopted by the Board. Factors used in determining fair value vary by investment type and may include market or investment specific events, changes in interest rates and credit quality. The frequency with which these procedures are used cannot be predicted and they may be utilized to a significant extent. The Committee oversees the Fund's valuation policies and procedures and is responsible for approving and reporting to the Board all fair value determinations.
The Fund categorizes the inputs to valuation techniques used to value its investments into a disclosure hierarchy consisting of three levels as shown below:
Level 1 - quoted prices in active markets for identical investments
Level 2 - other significant observable inputs (including quoted prices for similar investments, interest rates, prepayment speeds, etc.)
Level 3 - unobservable inputs (including the Fund's own assumptions based on the best information available)
Valuation techniques used to value the Fund's investments by major category are as follows:
Equity securities, including restricted securities, for which market quotations are readily available, are valued at the last reported sale price or official closing price as reported by a third party pricing vendor on the primary market or exchange on which they are traded and are categorized as Level 1 in the hierarchy. In the event there were no sales during the day or closing prices are not available, securities are valued at the last quoted bid price or may be valued using the last available price and are generally categorized as Level 2 in the hierarchy. For foreign equity securities, when market or security specific events arise, comparisons to the valuation of American Depositary Receipts (ADRs), futures contracts, Exchange-Traded Funds (ETFs) and certain indexes as well as quoted prices for similar securities may be used and would be categorized as Level 2 in the hierarchy. Utilizing these techniques may result in transfers between Level 1 and Level 2. For restricted equity securities and private placements where observable inputs are limited, assumptions about market activity and risk are used and these securities are generally categorized as Level 3 in the hierarchy.
Annual Report
Notes to Financial Statements - continued
(Amounts in thousands except percentages)
3. Significant Accounting Policies - continued
Investment Valuation - continued
Debt securities, including restricted securities, are valued based on evaluated prices received from third party pricing vendors or from brokers who make markets in such securities. For corporate bonds, pricing vendors utilize matrix pricing which considers yield or price of bonds of comparable quality, coupon, maturity and type as well as broker-supplied prices. When independent prices are unavailable or unreliable, debt securities may be valued utilizing pricing methodologies which consider similar factors that would be used by third party pricing vendors. Debt securities are generally categorized as Level 2 in the hierarchy but may be Level 3 depending on the circumstances.
Investments in open-end mutual funds, including the Fidelity Central Funds, are valued at their closing net asset value (NAV) each business day and are categorized as Level 1 in the hierarchy.
Changes in valuation techniques may result in transfers in or out of an assigned level within the disclosure hierarchy. The aggregate value of investments by input level, as of July 31, 2013 is included at the end of the Fund's Schedule of Investments.
Foreign Currency. The Fund may use foreign currency contracts to facilitate transactions in foreign-denominated securities. Gains and losses from these transactions may arise from changes in the value of the foreign currency or if the counterparties do not perform under the contracts' terms.
Foreign-denominated assets, including investment securities, and liabilities are translated into U.S. dollars at the exchange rates at period end. Purchases and sales of investment securities, income and dividends received and expenses denominated in foreign currencies are translated into U.S. dollars at the exchange rate in effect on the transaction date.
The effects of exchange rate fluctuations on investments are included with the net realized and unrealized gain (loss) on investment securities. Other foreign currency transactions resulting in realized and unrealized gain (loss) are disclosed separately.
Investment Transactions and Income. For financial reporting purposes, the Fund's investment holdings and NAV include trades executed through the end of the last business day of the period. The NAV per share for processing shareholder transactions is calculated as of the close of business of the New York Stock Exchange (NYSE), normally 4:00 p.m. Eastern time and includes trades executed through the end of the prior business day. Gains and losses on securities sold are determined on the basis of identified cost and may include proceeds received from litigation. Dividend income is recorded on the ex-dividend date, except for certain dividends from foreign securities where the ex-dividend date may have passed, which are recorded as soon as the Fund is informed of
Annual Report
3. Significant Accounting Policies - continued
Investment Transactions and Income - continued
the ex-dividend date. Non-cash dividends included in dividend income, if any, are recorded at the fair market value of the securities received. Distributions received on securities that represent a return of capital or capital gain are recorded as a reduction of cost of investments and/or as a realized gain. Subsequent to ex-dividend date the Fund determines the components of these distributions, based upon receipt of tax filings or other correspondence relating to the underlying investment. Interest income and distributions from the Fidelity Central Funds are accrued as earned. Interest income includes coupon interest and amortization of premium and accretion of discount on debt securities. Investment income is recorded net of foreign taxes withheld where recovery of such taxes is uncertain.
Class Allocations and Expenses. Investment income, realized and unrealized capital gains and losses, common expenses of the Fund, and certain fund-level expense reductions, if any, are allocated on a pro-rata basis to each class based on the relative net assets of each class to the total net assets of the Fund. Each class differs with respect to transfer agent fees incurred. Certain expense reductions may also differ by class. Expenses directly attributable to a fund are charged to that fund. Expenses attributable to more than one fund are allocated among the respective funds on the basis of relative net assets or other appropriate methods. Expense estimates are accrued in the period to which they relate and adjustments are made when actual amounts are known.
Deferred Trustee Compensation. Under a Deferred Compensation Plan (the Plan), independent Trustees may elect to defer receipt of a portion of their annual compensation. Deferred amounts are invested in a cross-section of Fidelity funds, are marked-to-market and remain in the Fund until distributed in accordance with the Plan. The investment of deferred amounts and the offsetting payable to the Trustees are included in the accompanying Statement of Assets and Liabilities.
Income Tax Information and Distributions to Shareholders. Each year, the Fund intends to qualify as a regulated investment company under Subchapter M of the Internal Revenue Code, including distributing substantially all of its taxable income and realized gains. As a result, no provision for income taxes is required. As of July 31, 2013, the Fund did not have any unrecognized tax benefits in the financial statements; nor is the Fund aware of any tax positions for which it is reasonably possible that the total amounts of unrecognized tax benefits will significantly change in the next twelve months. The Fund files a U.S. federal tax return, in addition to state and local tax returns as required. A fund's federal income tax returns are subject to examination by the Internal Revenue Service (IRS) for a period of three fiscal years after they are filed. State and local tax returns may be subject to examination for an additional fiscal year
Annual Report
Notes to Financial Statements - continued
(Amounts in thousands except percentages)
3. Significant Accounting Policies - continued
Income Tax Information and Distributions to Shareholders - continued
depending on the jurisdiction. Foreign taxes are provided for based on the Fund's understanding of the tax rules and rates that exist in the foreign markets in which it invests.
Distributions are declared and recorded on the ex-dividend date. Income dividends and capital gain distributions are declared separately for each class. Income and capital gain distributions are determined in accordance with income tax regulations, which may differ from GAAP.
Capital accounts within the financial statements are adjusted for permanent book-tax differences. These adjustments have no impact on net assets or the results of operations. Temporary book-tax differences will reverse in a subsequent period.
Book-tax differences are primarily due to foreign currency transactions, market discount, partnerships, equity-debt classifications, deferred trustees compensation, capital loss carryforwards and losses deferred due to wash sales.
The federal tax cost of investment securities and unrealized appreciation (depreciation) as of period end were as follows:
Gross unrealized appreciation | $ 1,452,215 |
Gross unrealized depreciation | (52,037) |
Net unrealized appreciation (depreciation) on securities and other investments | $ 1,400,178 |
| |
Tax Cost | $ 5,679,400 |
The tax-based components of distributable earnings as of period end were as follows:
Undistributed ordinary income | $ 9,160 |
Capital loss carryforward | $ (4,250,317) |
Net unrealized appreciation (depreciation) | $ 1,400,180 |
Capital loss carryforwards are only available to offset future capital gains of the Fund to the extent provided by regulations and may be limited. Under the Regulated Investment Company Modernization Act of 2010 (the Act), the Fund is permitted to carry forward capital losses incurred in taxable years beginning after December 22, 2010 for an unlimited period and such capital losses are required to be used prior to any losses that expire.
Annual Report
3. Significant Accounting Policies - continued
Income Tax Information and Distributions to Shareholders - continued
The capital loss carryforward information presented below, including any applicable limitation, is estimated as of fiscal period end and is subject to adjustment.
Fiscal year of expiration | |
2017 | $ (1,081,976) |
2018 | (3,168,341) |
Total capital loss carryforward | $ (4,250,317) |
The tax character of distributions paid was as follows:
| July 31, 2013 | July 31, 2012 |
Ordinary Income | $ 128,047 | $ 101,152 |
Restricted Securities. The Fund may invest in securities that are subject to legal or contractual restrictions on resale. These securities generally may be resold in transactions exempt from registration or to the public if the securities are registered. Disposal of these securities may involve time-consuming negotiations and expense, and prompt sale at an acceptable price may be difficult. Information regarding restricted securities is included at the end of the Fund's Schedule of Investments.
4. Purchases and Sales of Investments.
Purchases and sales of securities, other than short-term securities, aggregated $3,006,067 and $2,972,293, respectively.
5. Fees and Other Transactions with Affiliates.
Management Fee. FMR and its affiliates provide the Fund with investment management related services for which the Fund pays a monthly management fee. The management fee is the sum of an individual fund fee rate that is based on an annual rate of .20% of the Fund's average net assets and an annualized group fee rate that averaged .26% during the period. The group fee rate is based upon the average net assets of all the mutual funds advised by FMR. The group fee rate decreases as assets under management increase and increases as assets under management decrease. For the period, the total annual management fee rate was .46% of the Fund's average net assets.
Transfer Agent Fees. Fidelity Investments Institutional Operations Company, Inc., (FIIOC), an affiliate of FMR, is the transfer, dividend disbursing and shareholder servicing agent for each class of the Fund. FIIOC receives account fees and asset-based fees that vary according to the account size and type of account of the shareholders of Growth
Annual Report
Notes to Financial Statements - continued
(Amounts in thousands except percentages)
5. Fees and Other Transactions with Affiliates - continued
Transfer Agent Fees - continued
& Income. FIIOC receives an asset-based fee of Class K's average net assets. FIIOC pays for typesetting, printing and mailing of shareholder reports, except proxy statements. For the period, transfer agent fees for each class were as follows:
| Amount | % of
Average
Net Assets |
Growth and Income | $ 10,471 | .20 |
Class K | 435 | .05 |
| $ 10,906 | |
Accounting and Security Lending Fees. Fidelity Service Company, Inc. (FSC), an affiliate of FMR, maintains the Fund's accounting records. The accounting fee is based on the level of average net assets for each month. Under a separate contract, FSC administers the security lending program. The security lending fee is based on the number and duration of lending transactions.
Brokerage Commissions. The Fund placed a portion of its portfolio transactions with brokerage firms which are affiliates of the investment adviser. Brokerage commissions are included in net realized gain (loss) and change in net unrealized appreciation (depreciation) in the Statement of Operations. The commissions paid to these affiliated firms were $110 for the period.
Interfund Lending Program. Pursuant to an Exemptive Order issued by the SEC, the Fund, along with other registered investment companies having management contracts with FMR, may participate in an interfund lending program. This program provides an alternative credit facility allowing the funds to borrow from, or lend money to, other participating affiliated funds. The Fund's activity in this program during the period for which loans were outstanding was as follows:
Borrower or Lender | Average Loan
Balance | Weighted Average
Interest Rate | Interest
Expense |
Borrower | $ 7,764 | .39% | $ 2 |
6. Committed Line of Credit.
The Fund participates with other funds managed by FMR or an affiliate in a $4.25 billion credit facility (the "line of credit") to be utilized for temporary or emergency purposes to fund shareholder redemptions or for other short-term liquidity purposes. The Fund has agreed to pay commitment fees on its pro-rata portion of the line of credit, which
Annual Report
6. Committed Line of Credit - continued
amounted to $14 and is reflected in Miscellaneous expenses on the Statement of Operations. During the period, there were no borrowings on this line of credit.
7. Security Lending.
The Fund lends portfolio securities through a lending agent from time to time in order to earn additional income. For equity securities, a lending agent is used and may loan securities to certain qualified borrowers, including Fidelity Capital Markets (FCM), a broker-dealer affiliated with the Fund. On the settlement date of the loan, the Fund receives collateral (in the form of U.S. Treasury obligations, letters of credit and/or cash) against the loaned securities and maintains collateral in an amount not less than 100% of the market value of the loaned securities during the period of the loan. The market value of the loaned securities is determined at the close of business of the Fund and any additional required collateral is delivered to the Fund on the next business day. If the borrower defaults on its obligation to return the securities loaned because of insolvency or other reasons, the Fund may apply collateral received from the borrower against the obligation. The Fund may experience delays and costs in recovering the securities loaned. Any cash collateral received is invested in the Fidelity Securities Lending Cash Central Fund. The value of loaned securities and cash collateral at period end are disclosed on the Fund's Statement of Assets and Liabilities. Security lending income represents the income earned on investing cash collateral, less rebates paid to borrowers and any lending agent fees associated with the loan, plus any premium payments received for lending certain types of securities. Security lending income is presented in the Statement of Operations as a component of income from Fidelity Central Funds. Total security lending income during the period amounted to $476, including $9 from securities loaned to FCM.
8. Expense Reductions.
Commissions paid to certain brokers with whom FMR places trades on behalf of the Fund include an amount in addition to trade execution, which is rebated back to the Fund to offset certain expenses. This amount totaled $666 for the period. Through arrangements with the Fund's custodian, credits realized as a result of uninvested cash balances were used to reduce the Fund's expenses. During the period, these credits reduced the Fund's custody expenses by three hundred sixty-six dollars.
In addition, FMR reimbursed a portion of the Fund's operating expenses during the period in the amount of $12.
Annual Report
Notes to Financial Statements - continued
(Amounts in thousands except percentages)
9. Distributions to Shareholders.
Distributions to shareholders of each class were as follows:
Years ended July 31, | 2013 | 2012 |
From net investment income | | |
Growth and Income | $ 102,417 | $ 87,366 |
Class K | 18,247 | 10,987 |
Total | $ 120,664 | $ 98,353 |
From net realized gain | | |
Growth and Income | $ 6,339 | $ 2,563 |
Class K | 1,044 | 236 |
Total | $ 7,383 | $ 2,799 |
10. Share Transactions.
Transactions for each class of shares were as follows:
| Shares | Dollars |
Years ended July 31, | 2013 | 2012 | 2013 | 2012 |
Growth and Income | | | | |
Shares sold | 29,843 | 21,066 | $ 688,591 | $ 402,515 |
Reinvestment of distributions | 4,672 | 4,651 | 104,347 | 86,309 |
Shares redeemed | (39,833) | (56,062) | (885,644) | (1,053,524) |
Net increase (decrease) | (5,318) | (30,345) | $ (92,706) | $ (564,700) |
Class K | | | | |
Shares sold | 11,165 | 20,227 | $ 248,185 | $ 386,187 |
Reinvestment of distributions | 863 | 596 | 19,291 | 11,223 |
Shares redeemed | (9,761) | (5,182) | (217,301) | (97,733) |
Net increase (decrease) | 2,267 | 15,641 | $ 50,175 | $ 299,677 |
11. Other.
The Fund's organizational documents provide former and current trustees and officers with a limited indemnification against liabilities arising in connection with the performance of their duties to the Fund. In the normal course of business, the Fund may also enter into contracts that provide general indemnifications. The Fund's maximum exposure under these arrangements is unknown as this would be dependent on future claims that may be made against the Fund. The risk of material loss from such claims is considered remote.
Annual Report
To the Trustees of Fidelity Securities Fund and the Shareholders of Fidelity Growth & Income Portfolio:
In our opinion, the accompanying statement of assets and liabilities, including the schedule of investments, and the related statements of operations and of changes in net assets and the financial highlights present fairly, in all material respects, the financial position of Fidelity Growth & Income Portfolio (a fund of Fidelity Securities Fund) at July 31, 2013, the results of its operations for the year then ended, the changes in its net assets for each of the two years in the period then ended and the financial highlights for each of the five years in the period then ended, in conformity with accounting principles generally accepted in the United States of America. These financial statements and financial highlights (hereafter referred to as "financial statements") are the responsibility of the Fidelity Growth & Income Portfolio's management. Our responsibility is to express an opinion on these financial statements based on our audits. We conducted our audits of these financial statements in accordance with the standards of the Public Company Accounting Oversight Board (United States). Those standards require that we plan and perform the audit to obtain reasonable assurance about whether the financial statements are free of material misstatement. An audit includes examining, on a test basis, evidence supporting the amounts and disclosures in the financial statements, assessing the accounting principles used and significant estimates made by management, and evaluating the overall financial statement presentation. We believe that our audits, which included confirmation of securities at July 31, 2013 by correspondence with the custodian and brokers, provide a reasonable basis for our opinion.
PricewaterhouseCoopers LLP
Boston, Massachusetts
September 11, 2013
Annual Report
The Trustees, Member of the Advisory Board, and executive officers of the trust and fund, as applicable, are listed below. The Board of Trustees governs the fund and is responsible for protecting the interests of shareholders. The Trustees are experienced executives who meet periodically throughout the year to oversee the fund's activities, review contractual arrangements with companies that provide services to the fund, oversee management of the risks associated with such activities and contractual arrangements, and review the fund's performance. Except for James C. Curvey, Ned C. Lautenbach, Ronald P. O'Hanley, and William S. Stavropoulos, each of the Trustees oversees 166 Fidelity funds. Mr. Curvey oversees 387 Fidelity funds. Mr. Lautenbach, Mr. O'Hanley, and Mr. Stavropoulos each oversees 230 Fidelity funds.
The Trustees hold office without limit in time except that (a) any Trustee may resign; (b) any Trustee may be removed by written instrument, signed by at least two-thirds of the number of Trustees prior to such removal; (c) any Trustee who requests to be retired or who has become incapacitated by illness or injury may be retired by written instrument signed by a majority of the other Trustees; and (d) any Trustee may be removed at any special meeting of shareholders by a two-thirds vote of the outstanding voting securities of the trust. Each Trustee who is not an interested person of the trust and the fund (as defined in the 1940 Act) (Independent Trustee), shall retire not later than the last day of the calendar year in which his or her 75th birthday occurs. The Independent Trustees may waive this mandatory retirement age policy with respect to individual Trustees. The executive officers and Advisory Board Member hold office without limit in time, except that any officer and Advisory Board Member may resign or may be removed by a vote of a majority of the Trustees at any regular meeting or any special meeting of the Trustees. Except as indicated, each individual has held the office shown or other offices in the same company for the past five years.
Experience, Skills, Attributes, and Qualifications of the Fund's Trustees. The Governance and Nominating Committee has adopted a statement of policy that describes the experience, qualifications, attributes, and skills that are necessary and desirable for potential Independent Trustee candidates (Statement of Policy). The Board believes that each Trustee satisfied at the time he or she was initially elected or appointed a Trustee, and continues to satisfy, the standards contemplated by the Statement of Policy. The Governance and Nominating Committee also engages professional search firms to help identify potential Independent Trustee candidates who have the experience, qualifications, attributes, and skills consistent with the Statement of Policy. From time to time, additional criteria based on the composition and skills of the current Independent Trustees, as well as experience or skills that may be appropriate in light of future changes to board composition, business conditions, and regulatory or other developments, have also been considered by the professional search firms and the Governance and Nominating Committee. In addition, the Board takes into account the Trustees' commitment and participation in Board and committee meetings, as well as their leadership of standing and ad hoc committees throughout their tenure.
Annual Report
Trustees and Officers - continued
In determining that a particular Trustee was and continues to be qualified to serve as a Trustee, the Board has considered a variety of criteria, none of which, in isolation, was controlling. The Board believes that, collectively, the Trustees have balanced and diverse experience, qualifications, attributes, and skills, which allow the Board to operate effectively in governing the fund and protecting the interests of shareholders. Information about the specific experience, skills, attributes, and qualifications of each Trustee, which in each case led to the Board's conclusion that the Trustee should serve (or continue to serve) as a trustee of the fund, is provided below.
Board Structure and Oversight Function. James C. Curvey is an interested person (as defined in the 1940 Act) and currently serves as Chairman. The Trustees have determined that an interested Chairman is appropriate and benefits shareholders because an interested Chairman has a personal and professional stake in the quality and continuity of services provided to the fund. Independent Trustees exercise their informed business judgment to appoint an individual of their choosing to serve as Chairman, regardless of whether the Trustee happens to be independent or a member of management. The Independent Trustees have determined that they can act independently and effectively without having an Independent Trustee serve as Chairman and that a key structural component for assuring that they are in a position to do so is for the Independent Trustees to constitute a substantial majority for the Board. The Independent Trustees also regularly meet in executive session. Ned C. Lautenbach serves as Chairman of the Independent Trustees and as such (i) acts as a liaison between the Independent Trustees and management with respect to matters important to the Independent Trustees and (ii) with management prepares agendas for Board meetings.
Fidelity funds are overseen by different Boards of Trustees. The fund's Board oversees Fidelity's equity and high income funds and another Board oversees Fidelity's investment-grade bond, money market, and asset allocation funds. The asset allocation funds may invest in Fidelity funds overseen by the fund's Board. The use of separate Boards, each with its own committee structure, allows the Trustees of each group of Fidelity funds to focus on the unique issues of the funds they oversee, including common research, investment, and operational issues. On occasion, the separate Boards establish joint committees to address issues of overlapping consequences for the Fidelity funds overseen by each Board.
The Trustees operate using a system of committees to facilitate the timely and efficient consideration of all matters of importance to the Trustees, the fund, and fund shareholders and to facilitate compliance with legal and regulatory requirements and oversight of the fund's activities and associated risks. The Board, acting through its committees, has charged FMR and its affiliates with (i) identifying events or circumstances the occurrence of which could have demonstrably adverse effects on the fund's business and/or reputation; (ii) implementing processes and controls to lessen the possibility that such events or circumstances occur or to mitigate the effects of such events or circumstances if they do occur; and (iii) creating and maintaining a system designed to evaluate continuously business and market conditions in order to facilitate the identification and implementation processes described in (i) and (ii) above. Because the day-to-day operations and activities of the fund are carried out by or through FMR, its affiliates and other service providers, the fund's exposure to risks is mitigated but not eliminated by the processes overseen by the Trustees. While each of the Board's committees has responsibility for overseeing different aspects of the fund's activities, oversight is exercised primarily through the Operations, Audit, and Compliance Committees. In addition, the Independent Trustees have worked with FMR to enhance the Board's oversight of investment and financial risks, legal and regulatory risks, technology risks, and operational risks, including the development of additional risk reporting to the Board. For example, a working group comprised of Independent Trustees and FMR has worked and continues to work to review the Fidelity funds' valuation-related activities, reporting and risk management. Appropriate personnel, including but not limited to the fund's Chief Compliance Officer (CCO), FMR's internal auditor, the independent accountants, the fund's Treasurer and portfolio management personnel, make periodic reports to the Board's committees, as appropriate, including an annual review of FMR's risk management program for the Fidelity funds. The responsibilities of each standing committee, including their oversight responsibilities, are described further under "Standing Committees of the Fund's Trustees."
Annual Report
The fund's Statement of Additional Information (SAI) includes more information about the Trustees. To request a free copy, call Fidelity at 1-800-544-8544.
Interested Trustees*:
Correspondence intended for each Trustee who is an interested person may be sent to Fidelity Investments, 245 Summer Street, Boston, Massachusetts 02210.
Name, Year of Birth; Principal Occupations and Other Relevant Experience+ |
James C. Curvey (1935) |
| Year of Election or Appointment: 2007 Mr. Curvey is Trustee and Chairman of the Board of Trustees of certain Trusts. Mr. Curvey also serves as Trustee (2007-present) of other investment companies advised by FMR. Mr. Curvey is a Director of Fidelity Investments Money Management, Inc. (2009-present), Director of Fidelity Research & Analysis Co. (2009-present) and Director of FMR and FMR Co., Inc. (2007-present). Mr. Curvey is also Vice Chairman (2007-present) and Director of FMR LLC. In addition, Mr. Curvey serves as an Overseer for the Boston Symphony Orchestra and a member of the Trustees of Villanova University. Previously, Mr. Curvey was the Vice Chairman (2006-2007) and Director (2000-2007) of FMR Corp. |
Ronald P. O'Hanley (1957) |
| Year of Election or Appointment: 2011 Mr. O'Hanley serves as a Trustee and Chairman of the Board of Trustees of other Fidelity funds (2013-present), and is Director of FMR Co., Inc. (2010-present), Director of Fidelity Investments Money Management, Inc. (2010-present), Director of Fidelity Research & Analysis Company (2010-present), President of Fidelity Asset Management and Corporate Services and a Member of Fidelity's Executive Committee (2010-present). Previously, Mr. O'Hanley served as President and Chief Executive Officer of BNY Mellon Asset Management (2007-2010). Mr. O'Hanley also served as Vice Chairman of Bank New York Mellon Corp. and a member of that firm's Executive Committee. Prior to the 2007 merger of The Bank of New York and Mellon Financial Corporation, he was Vice Chairman of Mellon Financial Corporation and President and Chief Executive Officer of Mellon Asset Management. He joined Mellon in February 1997. Mr. O'Hanley currently serves as Chairman of the Boston Public Library Foundation Board of Directors and sits on the Board of Directors of Beth Israel Deaconess Medical Center, the Board of Trustees of the Marine Biological Laboratory and the Advisory Board of the Maxwell School of Citizenship and Public Administration at Syracuse University. Mr. O'Hanley also chairs the Council on Asset Management for the Financial Services Roundtable and is a member of the Board of Directors of Institutional Investor's U.S. Institute. |
* Trustees have been determined to be "Interested Trustees" by virtue of, among other things, their affiliation with the trust or various entities under common control with FMR.
+ The information above includes each Trustee's principal occupation during the last five years and other information relating to the experience, attributes, and skills relevant to each Trustee's qualifications to serve as a Trustee, which led to the conclusion that each Trustee should serve as a Trustee for the fund.
Annual Report
Independent Trustees:
Correspondence intended for each Independent Trustee (that is, the Trustees other than the Interested Trustees) may be sent to Fidelity Investments, P.O. Box 55235, Boston, Massachusetts 02205-5235.
Name, Year of Birth; Principal Occupations and Other Relevant Experience+ |
Dennis J. Dirks (1948) |
| Year of Election or Appointment: 2005 Prior to his retirement in May 2003, Mr. Dirks was Chief Operating Officer and a member of the Board of The Depository Trust & Clearing Corporation (DTCC). He also served as President, Chief Operating Officer, and Board member of The Depository Trust Company (DTC) and President and Board member of the National Securities Clearing Corporation (NSCC). In addition, Mr. Dirks served as Chief Executive Officer and Board member of the Government Securities Clearing Corporation, Chief Executive Officer and Board member of the Mortgage-Backed Securities Clearing Corporation, as a Trustee and a member of the Finance Committee of Manhattan College (2005-2008), and as a Trustee and a member of the Finance Committee of AHRC of Nassau County (2006-2008). Mr. Dirks is a member of the Independent Directors Council (IDC) Governing Council (2010-present) and Board of Directors for The Brookville Center for Children's Services, Inc. (2009-present). |
Alan J. Lacy (1953) |
| Year of Election or Appointment: 2008 Mr. Lacy serves as Senior Adviser (2007-present) of Oak Hill Capital Partners, L.P. (private equity). Mr. Lacy also served as Chief Executive Officer (2000-2005) and Vice Chairman (2005-2006) of Sears Holdings Corporation and Sears, Roebuck and Co. (retail). In addition, Mr. Lacy serves as a member of the Board of Directors of Dave & Buster's Entertainment, Inc. (restaurant and entertainment complexes, 2010-present), Earth Fare, Inc. (retail grocery, 2012-present), The Hillman Companies, Inc. (hardware wholesalers, 2010-present), and Bristol-Myers Squibb Company (global pharmaceuticals, 2008-present). Mr. Lacy is a member of the Board of Trustees of The National Parks Conservation Association (2006-present). Previously, Mr. Lacy served as Chairman of the Board of Trustees of the National Parks Conservation Association (2008-2011) and as a member of the Board of Directors for the Western Union Company (global money transfer, 2006-2011). |
Ned C. Lautenbach (1944) |
| Year of Election or Appointment: 2000 Mr. Lautenbach is Chairman of the Independent Trustees of the Equity and High Income Funds (2006-present) and serves as a Trustee of other Fidelity funds (2013-present). Mr. Lautenbach currently serves as the Lead Director of the Eaton Corporation Board of Directors (diversified industrial, 1997-present). Mr. Lautenbach is Chairman of the Board of Directors of the Philharmonic Center for the Arts in Naples, Florida (2012-present) and a member of the Council on Foreign Relations (1994-present). Previously, Mr. Lautenbach was a Partner/Advisory Partner at Clayton, Dubilier & Rice, LLC (private equity investment, 1998-2010), as well as a Director of Sony Corporation (2006-2007). |
Joseph Mauriello (1944) |
| Year of Election or Appointment: 2008 Prior to his retirement in January 2006, Mr. Mauriello served in numerous senior management positions including Deputy Chairman and Chief Operating Officer (2004-2005), and Vice Chairman of Financial Services (2002-2004) of KPMG LLP US (professional services, 1965-2005). Mr. Mauriello currently serves as a member of the Board of Directors of XL Group plc. (global insurance and re-insurance, 2006-present). Previously, Mr. Mauriello served as a Director of the Hamilton Funds of the Bank of New York (2006-2007) and of Arcadia Resources Inc. (health care services and products, 2007-2012). |
Robert W. Selander (1950) |
| Year of Election or Appointment: 2011 Previously, Mr. Selander served as a Member of the Advisory Board of Fidelity's Equity and High Income Funds (2011), Executive Vice Chairman (2010), Chief Executive Officer (2009-2010), and President and Chief Executive Officer (1997-2009) of Mastercard, Inc. |
Cornelia M. Small (1944) |
| Year of Election or Appointment: 2005 Ms. Small is a member of the Board of Directors (2009-present) and Chair of the Investment Committee (2010-present) of the Teagle Foundation. Ms. Small also serves on the Investment Committee of the Berkshire Taconic Community Foundation (2008-present). Previously, Ms. Small served as Chairperson (2002-2008) and a member of the Investment Committee and Chairperson (2008-2012) and a member of the Board of Trustees of Smith College. In addition, Ms. Small served as Chief Investment Officer, Director of Global Equity Investments, and a member of the Board of Directors of Scudder, Stevens & Clark and Scudder Kemper Investments. |
William S. Stavropoulos (1939) |
| Year of Election or Appointment: 2002 Mr. Stavropoulos is Vice Chairman of the Independent Trustees of the Equity and High Income Funds (2006-present) and serves as a Trustee of other Fidelity funds (2013-present). Mr. Stavropoulos serves as President and Founder of the Michigan Baseball Foundation, the Great Lakes Loons (2007-present). Mr. Stavropoulos is Chairman Emeritus of the Board of Directors of The Dow Chemical Company, where he previously served in numerous senior management positions, including President, CEO (1995-2000; 2002-2004), Chairman of the Executive Committee (2000-2006), and as a member of the Board of Directors (1990-2006). Currently, Mr. Stavropoulos is Chairman of the Board of Directors of Univar Inc. (global distributor of commodity and specialty chemicals), a Director of Teradata Corporation (data warehousing and technology solutions), and Maersk Inc. (industrial conglomerate), and a member of the Advisory Board for Metalmark Capital LLC (private equity investment, 2005-present). Mr. Stavropoulos is an operating advisor to Clayton, Dubilier & Rice, LLC (private equity investment). In addition, Mr. Stavropoulos is a member of the University of Notre Dame Advisory Council for the College of Science, a Trustee of the Rollin L. Gerstacker Foundation, and a Director of the Naples Philharmonic Center for the Arts. Previously, Mr. Stavropoulos served as a Director of Chemical Financial Corporation (bank holding company, 1993-2012) and Tyco International, Ltd. (multinational manufacturing and services, 2007-2012). |
David M. Thomas (1949) |
| Year of Election or Appointment: 2008 Previously, Mr. Thomas served as Executive Chairman (2005-2006) and Chairman and Chief Executive Officer (2000-2005) of IMS Health, Inc. (pharmaceutical and healthcare information solutions), and a Director of Fortune Brands, Inc. (consumer products, 2000-2011). In addition, Mr. Thomas serves as Non-Executive Chairman of the Board of Directors of Fortune Brands Home and Security (home and security products, 2011-present), and as a member of the Board of Directors of Interpublic Group of Companies, Inc. (marketing communication, 2004-present). |
+ The information above includes each Trustee's principal occupation during the last five years and other information relating to the experience, attributes, and skills relevant to each Trustee's qualifications to serve as a Trustee, which led to the conclusion that each Trustee should serve as a Trustee for the fund.
Annual Report
Trustees and Officers - continued
Advisory Board Member and Executive Officers:
Correspondence intended for each executive officer and Peter S. Lynch may be sent to Fidelity Investments, 245 Summer Street, Boston, Massachusetts 02210.
Name, Year of Birth; Principal Occupation |
Peter S. Lynch (1944) |
| Year of Election or Appointment: 2003 Member of the Advisory Board of Fidelity's Equity and High Income Funds. Mr. Lynch is Vice Chairman and a Director of FMR and FMR Co., Inc. In addition, Mr. Lynch serves as a Trustee of Boston College and as the Chairman of the Inner-City Scholarship Fund. Previously, Mr. Lynch served on the Special Olympics International Board of Directors (1997-2006). |
Kenneth B. Robins (1969) |
| Year of Election or Appointment: 2008 President and Treasurer of Fidelity's Equity and High Income Funds. Mr. Robins also serves as President and Treasurer (2008-present) and Assistant Treasurer (2009-present) of other Fidelity funds and is an employee of Fidelity Investments (2004-present). Mr. Robins serves as Executive Vice President of Fidelity Investments Money Management, Inc. (FIMM) (2013-present). Previously, Mr. Robins served as Deputy Treasurer of the Fidelity funds (2005-2008) and Treasurer and Chief Financial Officer of The North Carolina Capital Management Trust: Cash and Term Portfolios (2006-2008). |
Bruce T. Herring (1965) |
| Year of Election or Appointment: 2006 Vice President of certain Equity Funds. Mr. Herring also serves as Vice President of other Fidelity funds (2013-present), Chief Investment Officer of Fidelity Global Asset Allocation (GAA) (2013-present), Chief Investment Officer and Director of Fidelity Management & Research (U.K.) Inc. (2010-present), Group Chief Investment Officer of FMR, and President of Fidelity Research & Analysis Company (2010-present). Previously, Mr. Herring served as Vice President (2005-2006) and Senior Vice President (2006-2007) of Fidelity Management & Research Company, Vice President of FMR Co., Inc. (2001-2007) and as a portfolio manager for Fidelity U.S. Equity Funds. |
Brian B. Hogan (1964) |
| Year of Election or Appointment: 2009 Vice President of Equity and High Income Funds. Mr. Hogan also serves as Vice President of other Fidelity funds (2009-present) and President of FMR's Equity Division (2009-present). Previously, Mr. Hogan served as Senior Vice President, Equity Research of FMR (2006-2009) and as a portfolio manager. |
Scott C. Goebel (1968) |
| Year of Election or Appointment: 2008 Secretary and Chief Legal Officer (CLO) of the Fidelity funds. Mr. Goebel also serves as Secretary of Fidelity Investments Money Management, Inc. (FIMM) (2010-present) and Fidelity Research and Analysis Company (FRAC) (2010-present); Secretary and CLO of The North Carolina Capital Management Trust: Cash and Term Portfolios (2008-present); General Counsel, Secretary, and Senior Vice President of FMR (2008-present) and FMR Co., Inc. (2008-present); employed by FMR LLC or an affiliate (2001-present); Chief Legal Officer of Fidelity Management & Research (Hong Kong) Limited (2008-present) and Assistant Secretary of Fidelity Management & Research (Japan) Inc. (2008-present), and Fidelity Management & Research (U.K.) Inc. (2008-present). Previously, Mr. Goebel served as Assistant Secretary of FIMM (2008-2010), FRAC (2008-2010), and the Funds (2007-2008) and as Vice President and Secretary of Fidelity Distributors Corporation (FDC) (2005-2007). |
William C. Coffey (1969) |
| Year of Election or Appointment: 2009 Assistant Secretary of Fidelity's Equity and High Income Funds. Mr. Coffey also serves as Assistant Secretary of other Fidelity funds (2009-present), Senior Vice President and Deputy General Counsel of FMR LLC (2010-present), and is an employee of Fidelity Investments. Previously, Mr. Coffey served as Vice President and Associate General Counsel of FMR LLC (2005-2009). |
Elizabeth Paige Baumann (1968) |
| Year of Election or Appointment: 2012 Anti-Money Laundering (AML) Officer of the Fidelity funds. Ms. Baumann also serves as AML Officer of The North Carolina Capital Management Trust: Cash and Term Portfolios (2012-present), Chief AML Officer of FMR LLC (2012-present), and is an employee of Fidelity Investments. Previously, Ms. Baumann served as Vice President and Deputy Anti-Money Laundering Officer (2007-2012). |
Christine Reynolds (1958) |
| Year of Election or Appointment: 2008 Chief Financial Officer of the Fidelity funds. Ms. Reynolds became President of Fidelity Pricing and Cash Management Services (FPCMS) in August 2008. Ms. Reynolds served as Chief Operating Officer of FPCMS (2007-2008). Previously, Ms. Reynolds served as President, Treasurer, and Anti-Money Laundering officer of the Fidelity funds (2004-2007). |
Joseph A. Hanlon (1968) |
| Year of Election or Appointment: 2012 Chief Compliance Officer of Fidelity's Equity and High Income Funds. Mr. Hanlon also serves as Chief Compliance Officer of other Fidelity funds (2012-present). Mr. Hanlon serves as Compliance Officer of FMR, FMR Co., Inc., Fidelity Investments Money Management, Inc. (FIMM), Fidelity Research and Analysis Company (FRAC), and Fidelity Management & Research (Hong Kong) (2009-present), as Senior Vice President of the Fidelity Asset Management Division (2009-present), and is an employee of Fidelity Investments. Previously, Mr. Hanlon served as Compliance Officer of Fidelity Management & Research (Japan) Inc. (2009-2013), Strategic Advisers, Inc. (2009-2013), and Fidelity Management & Research (U.K.) Inc. (2009-2013). |
Joseph F. Zambello (1957) |
| Year of Election or Appointment: 2011 Deputy Treasurer of the Fidelity funds. Mr. Zambello is an employee of Fidelity Investments. Previously, Mr. Zambello served as Vice President of FMR's Program Management Group (2009-2011) and Vice President of the Transfer Agent Oversight Group (2005-2009). |
Adrien E. Deberghes (1967) |
| Year of Election or Appointment: 2008 Deputy Treasurer of Fidelity's Equity and High Income Funds. Mr. Deberghes also serves as Vice President (2011-present), Deputy Treasurer (2008-present), and Assistant Treasurer (2010-present) of other Fidelity funds, and is an employee of Fidelity Investments (2008-present). Previously, Mr. Deberghes served as Senior Vice President of Mutual Fund Administration at State Street Corporation (2007-2008), Senior Director of Mutual Fund Administration at Investors Bank & Trust (2005-2007), and Director of Finance for Dunkin' Brands (2000-2005). |
Stephen Sadoski (1971) |
| Year of Election or Appointment: 2012 Deputy Treasurer of Fidelity's Equity and High Income Funds. Mr. Sadoski also serves as Deputy Treasurer of other Fidelity funds (2012-present) and is an employee of Fidelity Investments (2012-present). Previously, Mr. Sadoski served as Assistant Treasurer of Fidelity's Fixed Income and Asset Allocation Funds (2012-2013), an assistant chief accountant in the Division of Investment Management of the Securities and Exchange Commission (SEC) (2009-2012) and as a senior manager at Deloitte & Touche LLP (1997-2009). |
Stacie M. Smith (1974) |
| Year of Election or Appointment: 2013 Deputy Treasurer of Fidelity's Equity and High Income Funds. Ms. Smith also serves as Deputy Treasurer of other Fidelity funds (2013-present) and is an employee of Fidelity Investments (2009-present). Previously, Ms. Smith served as Senior Audit Manager of Ernst & Young LLP (1996-2009). |
Stephanie J. Dorsey (1969) |
| Year of Election or Appointment: 2010 Assistant Treasurer of Fidelity's Equity and High Income Funds. Ms. Dorsey also serves as President and Treasurer (2013-present) and Assistant Treasurer (2010-present) of other Fidelity funds, Treasurer and Chief Financial Officer of The North Carolina Capital Management Trust: Cash and Term Portfolios (2013-present), and is an employee of Fidelity Investments (2008-present). Previously, Ms. Dorsey served as Deputy Treasurer of Fidelity's Fixed Income and Asset Allocation Funds (2008-2013), Treasurer (2004-2008) of the JPMorgan Mutual Funds and Vice President (2004-2008) of JPMorgan Chase Bank. |
Gary W. Ryan (1958) |
| Year of Election or Appointment: 2005 Assistant Treasurer of the Fidelity funds. Mr. Ryan is an employee of Fidelity Investments. Previously, Mr. Ryan served as Vice President of Fund Reporting in Fidelity Pricing and Cash Management Services (FPCMS) (1999-2005). |
Jonathan Davis (1968) |
| Year of Election or Appointment: 2010 Assistant Treasurer of the Fidelity funds. Mr. Davis is also Assistant Treasurer of Fidelity Rutland Square Trust II and Fidelity Commonwealth Trust II. Mr. Davis is an employee of Fidelity Investments. Previously, Mr. Davis served as Vice President and Associate General Counsel of FMR LLC (2003-2010). |
Annual Report
Growth & Income designates 100%, 94%, 93%, 100% and 100% of the dividends distributed in September, October, December, April, July, respectively during the fiscal year as qualifying for the dividends-received deduction for corporate shareholders.
Growth & Income designates 100% of the dividends distributed during the fiscal year as amounts which may be taken into account as a dividend for the purposes of the maximum rate under section 1(h)(11) of the Internal Revenue Code.
The fund will notify shareholders in January 2014 of amounts for use in preparing 2013 income tax returns.
Annual Report
Board Approval of Investment Advisory Contracts and Management Fees
Fidelity Growth & Income Portfolio
Each year, the Board of Trustees, including the Independent Trustees (together, the Board), votes on the renewal of the management contract and sub-advisory agreements (together, the Advisory Contracts) for the fund. The Board, assisted by the advice of fund counsel and Independent Trustees' counsel, requests and considers a broad range of information relevant to the renewal of the Advisory Contracts throughout the year.
The Board meets regularly and, at each of its meetings, covers an extensive agenda of topics and materials and considers factors that are relevant to its annual consideration of the renewal of the fund's Advisory Contracts, including the services and support provided to the fund and its shareholders. The Board has established various standing committees, each composed of and chaired by Independent Trustees with varying backgrounds, to which the Board has assigned specific subject matter responsibilities in order to enhance effective decision-making by the Board. The Board, acting directly and through its Committees, requests and receives information concerning the annual consideration of the renewal of the fund's Advisory Contracts. The Board also meets as needed to consider matters specifically related to the Board's annual consideration of the renewal of Advisory Contracts. Members of the Board may also meet with trustees of other Fidelity funds through ad hoc joint committees to discuss certain matters relevant to the Fidelity funds.
At its July 2013 meeting, the Board, including the Independent Trustees, unanimously determined to renew the fund's Advisory Contracts. In reaching its determination, the Board considered all factors it believed relevant, including (i) the nature, extent, and quality of the services to be provided to the fund and its shareholders (including the investment performance of the fund); (ii) the competitiveness of the fund's management fee and total expense ratio relative to peer funds; (iii) the total costs of the services to be provided by and the profits to be realized by Fidelity from its relationship with the fund; (iv) the extent to which economies of scale exist and would be realized as the fund grows; and (v) whether fee levels reflect these economies of scale, if any, for the benefit of fund shareholders.
In considering whether to renew the Advisory Contracts for the fund, the Board reached a determination, with the assistance of fund counsel and Independent Trustees' counsel and through the exercise of its business judgment, that the renewal of the Advisory Contracts was in the best interests of the fund and its shareholders and that the compensation payable under the Advisory Contracts was fair and reasonable. The Board's decision to renew the Advisory Contracts was not based on any single factor, but rather was based on a comprehensive consideration of all the information provided to the Board at its meetings throughout the year. The Board, in reaching its determination to renew the Advisory Contracts, was aware that shareholders in the fund have a broad range of investment choices available to them, including a wide choice among mutual funds offered by Fidelity's competitors, and that the fund's shareholders, who have the opportunity to review and weigh the disclosure provided by the fund in its prospectus and other public disclosures, have chosen to invest in this fund, which is a part of the Fidelity family of funds.
Annual Report
Nature, Extent, and Quality of Services Provided. The Board considered the staffing within the investment adviser, Fidelity Management & Research Company (FMR), and the sub-advisers (together, the Investment Advisers) as it relates to the fund, including the backgrounds of the fund's investment personnel, and also considered the fund's investment objective, strategies, and related investment philosophy. The Independent Trustees also had discussions with senior management of Fidelity's investment operations and investment groups. The Board considered the structure of the portfolio manager compensation program and whether this structure provides appropriate incentives to act in the best interests of the fund.
Resources Dedicated to Investment Management and Support Services. The Board and the Fund Oversight and Research Committees reviewed the general qualifications and capabilities of the Investment Advisers' investment staff, including its size, education, experience, and resources, as well as the Investment Advisers' approach to recruiting, training, managing, and compensating investment personnel. The Board noted that FMR has continued to increase the resources devoted to non-U.S. offices, including expansion of Fidelity's global investment organization. The Board also noted that Fidelity's analysts have extensive resources, tools and capabilities that allow them to conduct sophisticated quantitative and fundamental analysis, as well as credit analysis of issuers, counterparties and guarantors. Further, the Board believes that Fidelity's investment professionals have sufficient access to global information and data so as to provide competitive investment results over time, and that those professionals also have access to sophisticated tools that permit them to assess portfolio construction and risk and performance attribution characteristics continuously, as well as to transmit new information and research conclusions rapidly around the world. Additionally, in its deliberations, the Board considered the Investment Advisers' trading and risk management capabilities and resources, which are an integral part of the investment management process.
Shareholder and Administrative Services. The Board considered (i) the nature, extent, quality, and cost of advisory, administrative, and shareholder services performed by the Investment Advisers and their affiliates under the Advisory Contracts and under separate agreements covering transfer agency, pricing and bookkeeping, and securities lending services for the fund; (ii) the nature and extent of the supervision of third party service providers, principally custodians and subcustodians; and (iii) the resources devoted to, and the record of compliance with, the fund's compliance policies and procedures. The Board also reviewed the allocation of fund brokerage, including allocations to brokers affiliated with the Investment Advisers, the use of brokerage commissions to pay fund expenses, and the use of "soft" commission dollars to pay for research services.
Annual Report
Board Approval of Investment Advisory Contracts and
Management Fees - continued
The Board noted that the growth of fund assets over time across the complex allows Fidelity to reinvest in the development of services designed to enhance the value or convenience of the Fidelity funds as investment vehicles. These services include 24-hour access to account information and market information through telephone representatives and over the Internet, investor education materials and asset allocation tools, and the expanded availability of Fidelity Investor Centers.
Investment in a Large Fund Family. The Board considered the benefits to shareholders of investing in a Fidelity fund, including the benefits of investing in a fund that is part of a large family of funds offering a variety of investment disciplines and providing a large variety of mutual fund investor services. The Board noted that Fidelity had taken, or had made recommendations that resulted in the Fidelity funds taking, a number of actions over the previous year that benefited particular funds, including (i) continuing to dedicate additional resources to investment research and to the support of the senior management team that oversees asset management; (ii) persisting in efforts to enhance Fidelity's global research capabilities; (iii) launching new funds and making other enhancements to meet client needs for global and income-oriented solutions; (iv) continuing to launch dedicated lower cost underlying funds to meet portfolio construction needs related to expanding underlying fund options for Fidelity funds of funds, specifically for the Freedom Fund product lines; (v) rationalizing product lines and gaining increased efficiencies through the mergers of several funds into other funds; (vi) strengthening Fidelity's index fund offerings by reducing investment minimums and adopting or lowering existing expense caps for certain funds and classes; (vii) enhancing Global Asset Allocation product offerings by launching new funds and strategies, including "open architecture" target date funds that utilize affiliated and unaffiliated sub-advisers; (viii) modifying the eligibility criteria for Institutional Class shares of Advisor funds to increase their marketability to a portion of the defined contribution plan market; (ix) creating a new low-cost retirement share class for certain Advisor funds to appeal to large retirement plans; (x) transitioning the management of certain Fidelity commodity funds to Geode Capital Management LLC, a registered commodity pool operator, while retaining administrative responsibilities for the funds; (xi) reorganizing a number of funds; and (xii) taking steps toward establishing a new Fidelity adviser to manage sector-based funds and products.
Investment Performance. The Board considered whether the fund has operated in accordance with its investment objective, as well as its record of compliance with its investment restrictions and its performance history.
The Board took into account discussions with the Investment Advisers about fund investment performance that occur at Board meetings throughout the year. In this regard the Board noted that as part of regularly scheduled fund reviews and other reports to the Board on fund performance, the Board periodically considers annualized return information for the fund, for different time periods, measured against a securities market index ("benchmark index") and a peer group of mutual funds with similar objectives ("peer group"). In its evaluation of fund investment performance, the Board gave particular attention to information indicating changes in performance of certain Fidelity funds for specific time periods and the Investment Advisers' explanations for any overperformance or underperformance.
Annual Report
In addition to reviewing absolute and relative fund performance, the Independent Trustees periodically consider the appropriateness of fund performance metrics in evaluating the results achieved. In general, the Independent Trustees believe that fund performance should be evaluated based on net performance (after fees and expenses) of both the highest performing and lowest performing classes, where applicable, compared to appropriate benchmark indices, over appropriate time periods which may include full market cycles, and compared to peer groups, as applicable, over the same periods, taking into account relevant factors including the following: general market conditions; issuer-specific information; tactical opportunities for investment; and fund cash flows and other factors.
The Independent Trustees recognize that shareholders evaluate performance on a net basis over their own holding periods, for which one-, three-, and five-year periods are used as a proxy. For this reason, the performance information reviewed by the Board also included net cumulative calendar year total return information for the fund and an appropriate benchmark index and peer group for the most recent one-, three-, and five-year periods, as shown below. Returns are shown compared to the 25th percentile (top of box) and 75th percentile (bottom of box) of the peer universe.
Fidelity Growth & Income Portfolio
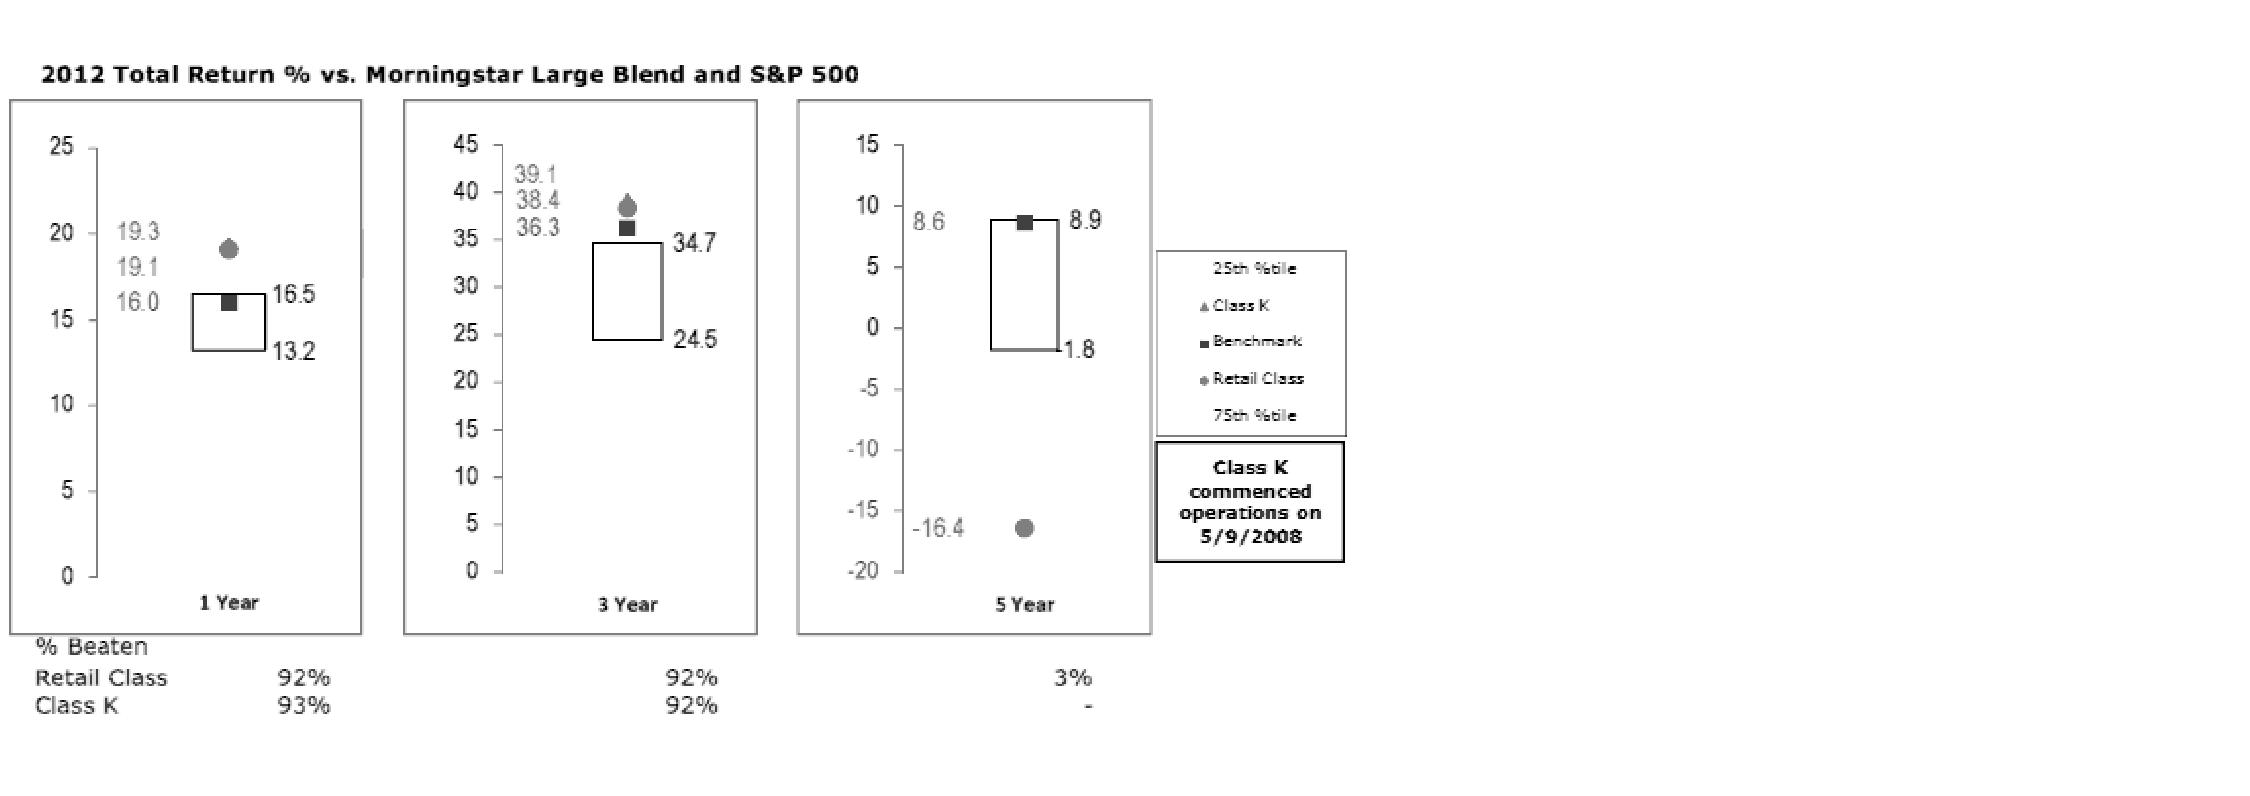
Annual Report
Board Approval of Investment Advisory Contracts and
Management Fees - continued
Based on its review, the Board concluded that the nature, extent, and quality of services provided to the fund under the Advisory Contracts should benefit the fund's shareholders.
Competitiveness of Management Fee and Total Expense Ratio. The Board considered the fund's management fee and total expense ratio compared to "mapped groups" of competitive funds and classes. Fidelity creates "mapped groups" by combining similar Lipper investment objective categories that have comparable management fee characteristics. Combining Lipper investment objective categories aids the Board's management fee and total expense ratio comparisons by broadening the competitive group used for comparison and by reducing the number of universes to which various Fidelity funds are compared.
Management Fee. The Board considered two proprietary management fee comparisons for the 12-month periods shown in the chart below. The group of Lipper funds used by the Board for management fee comparisons is referred to below as the "Total Mapped Group." The Total Mapped Group comparison focuses on a fund's standing in terms of gross management fees before expense reimbursements or caps relative to the total universe of funds with comparable investment mandates, regardless of whether their management fee structures also are comparable. Funds with comparable investment mandates offer exposure to similar types of securities. Funds with comparable management fee structures have similar management fee contractual arrangements (e.g., flat rate charged for advisory services, all-inclusive fee rate, etc.). "TMG %" represents the percentage of funds in the Total Mapped Group that had management fees that were lower than the fund's. For example, a TMG % of 15% means that 85% of the funds in the Total Mapped Group had higher management fees than the fund. The "Asset-Size Peer Group" (ASPG) comparison focuses on a fund's standing relative to a subset of non-Fidelity funds within the Total Mapped Group that are similar in size and management fee structure. The ASPG represents at least 15% of the funds in the Total Mapped Group with comparable asset size and management fee structures, subject to a minimum of 50 funds (or all funds in the Total Mapped Group if fewer than 50). Additional information, such as the ASPG quartile in which the fund's management fee ranked, is also included in the chart and considered by the Board.
Annual Report
Fidelity Growth & Income Portfolio

The Board noted that the fund's management fee ranked below the median of its Total Mapped Group and below the median of its ASPG for 2012.
Based on its review, the Board concluded that the fund's management fee is fair and reasonable in light of the services that the fund receives and the other factors considered.
Total Expense Ratio. In its review of each class's total expense ratio, the Board considered the fund's management fee as well as other fund or class expenses, as applicable, such as transfer agent fees, pricing and bookkeeping fees, and custodial, legal, and audit fees. The Board also noted the effects of any waivers and reimbursements on fees and expenses. As part of its review, the Board also considered the current and historical total expense ratios of each class of the fund compared to competitive fund median expenses. Each class of the fund is compared to those funds and classes in the Total Mapped Group (used by the Board for management fee comparisons) that have a similar sales load structure.
The Board noted that the total expense ratio of each class ranked below its competitive median for 2012.
Fees Charged to Other Fidelity Clients. The Board also considered Fidelity fee structures and other information with respect to clients of FMR and its affiliates, such as other mutual funds advised or subadvised by FMR or its affiliates, pension plan clients, and other institutional clients. The Board noted the findings of the 2013 ad hoc joint committee (created with the board of other Fidelity funds), which reviewed and compared Fidelity's institutional investment advisory business with its business of providing services to the Fidelity funds, including the differences in services provided, fees charged, and costs incurred, as well as competition in their respective marketplaces.
Annual Report
Board Approval of Investment Advisory Contracts and
Management Fees - continued
Based on its review of total expense ratios and fees charged to other Fidelity clients, the Board concluded that the total expense ratio of each class of the fund was reasonable in light of the services that the fund and its shareholders receive and the other factors considered.
Costs of the Services and Profitability. The Board considered the revenues earned and the expenses incurred by Fidelity in conducting the business of developing, marketing, distributing, managing, administering and servicing the fund and servicing the fund's shareholders. The Board also considered the level of Fidelity's profits in respect of all the Fidelity funds.
On an annual basis, FMR presents to the Board Fidelity's profitability for the fund. Fidelity calculates the profitability for each fund, as well as aggregate profitability for groups of Fidelity funds and all Fidelity funds, using a series of detailed revenue and cost allocation methodologies which originate with the books and records of Fidelity on which Fidelity's audited financial statements are based. The Audit Committee of the Board reviews any significant changes from the prior year's methodologies.
PricewaterhouseCoopers LLP (PwC), independent registered public accounting firm and auditor to Fidelity and certain Fidelity funds, has been engaged annually by the Board as part of the Board's assessment of Fidelity's profitability analysis. PwC's engagement includes the review and assessment of the methodologies used by Fidelity in determining the revenues and expenses attributable to Fidelity's mutual fund business, and completion of agreed-upon procedures surrounding the mathematical accuracy of fund profitability and its conformity to allocation methodologies. After considering PwC's reports issued under the engagement and information provided by Fidelity, the Board concluded that while other allocation methods may also be reasonable, Fidelity's profitability methodologies are reasonable in all material respects.
The Board also reviewed Fidelity's non-fund businesses and fall-out benefits related to the mutual fund business as well as cases where Fidelity's affiliates may benefit from or be related to the fund's business.
The Board considered the costs of the services provided by and the profits realized by Fidelity in connection with the operation of the fund and was satisfied that the profitability was not excessive in the circumstances.
Economies of Scale. The Board considered whether there have been economies of scale in respect of the management of the Fidelity funds, whether the Fidelity funds (including the fund) have appropriately benefited from any such economies of scale, and whether there is potential for realization of any further economies of scale. The Board considered the extent to which the fund will benefit from economies of scale through increased services to the fund, through waivers or reimbursements, or through fee or expense reductions. The Board also noted that in 2009, it and the board of other Fidelity funds created an ad hoc committee (the Economies of Scale Committee) to analyze whether FMR attains economies of scale in respect of the management and servicing of the Fidelity funds, whether the Fidelity funds have appropriately benefited from such economies of scale, and whether there is potential for realization of any further economies of scale.
Annual Report
The Board recognized that the fund's management contract incorporates a "group fee" structure, which provides for lower group fee rates as total fund assets under FMR's management increase, and for higher group fee rates as total fund assets under FMR's management decrease. FMR calculates the group fee rates based on a tiered asset "breakpoint" schedule that varies based on asset class. The Board considered that the group fee is designed to deliver the benefits of economies of scale to fund shareholders when total Fidelity fund assets increase, even if assets of any particular fund are unchanged or have declined, because some portion of Fidelity's costs are attributable to services provided to all Fidelity funds, and all funds benefit if those costs can be allocated among more assets. The Board concluded that, given the group fee structure, fund shareholders will benefit from lower management fees as assets under FMR's management increase at the fund complex level, regardless of whether Fidelity achieves any such economies of scale.
The Board concluded, taking into account the analysis of the Economies of Scale Committee, that economies of scale, if any, are being appropriately shared between fund shareholders and Fidelity.
Amendment to Description of Group Fee Rate. At its July 2013 meeting, the Board voted to approve an amendment to the fund's management contract to modify the description of the "group fee rate" effective August 1, 2013. The Board noted that under the prior description in the contract, the group fee rate was based on the average net assets of all registered investment companies with which FMR has management contracts. Under the contract's tiered asset breakpoint schedule, the group fee rate is lower as total fund assets under FMR's management increase, and higher as total fund assets under FMR's management decrease. The Board considered that the prior description would have excluded the assets of 64 Fidelity sector funds from the group fee rate calculation once Fidelity SelectCo, LLC, an affiliate of FMR, assumed management responsibilities for those funds. The Board noted that modifying the description of the group fee rate to continue to include the assets of those 64 funds for purposes of determining group fee rate breakpoints would avoid an immediate adverse impact on the group fee rate for any fund.
Additional Information Requested by the Board. In order to develop fully the factual basis for consideration of the Fidelity funds' Advisory Contracts, the Board requested and received additional information on certain topics, including: (i) fund performance trends and Fidelity's long-term strategies for certain funds; (ii) the potential to further rationalize the Fidelity fund lineup with the possibility of achieving savings for the funds and Fidelity; (iii) the methodology with respect to competitive fund data and peer group classifications; (iv) the arrangements with, and performance of, certain sub-advisers on behalf of the Fidelity funds, as well as certain proposed participating affiliate arrangements; (v) the realization of fall-out benefits in certain Fidelity business units; (vi) Fidelity's group fee structures, including the rationale for the individual fee rates of certain categories of funds and the definition of group assets; (vii) trends regarding industry use of performance fee structures and the performance adjustment methodologies applicable to the Fidelity funds; (viii) additional competitive analysis regarding the total expenses for certain classes; and (ix) fund profitability methodology, including Fidelity's cost allocation methodology, and the impact of certain factors on fund profitability results.
Annual Report
Board Approval of Investment Advisory Contracts and
Management Fees - continued
Based on its evaluation of all of the conclusions noted above, and after considering all factors it believed relevant, the Board ultimately concluded that the advisory fee structures are fair and reasonable, and that the fund's Advisory Contracts should be renewed.
Annual Report
Investment Adviser
Fidelity Management & Research Company
Boston, MA
Investment Sub-Advisers
FMR Co., Inc.
Fidelity Management & Research
(U.K.) Inc.
Fidelity Management & Research
(Japan) Inc.
Fidelity Management & Research
(Hong Kong) Limited
General Distributor
Fidelity Distributors Corporation
Smithfield, RI
Transfer and Service Agents
Fidelity Investments Institutional
Operations Company, Inc.
Boston, MA
Fidelity Service Company, Inc.
Boston, MA
Custodian
Northern Trust Company
Chicago, IL
The Fidelity Telephone Connection
Mutual Fund 24-Hour Service
Exchanges/Redemptions
and Account Assistance 1-800-544-6666
Product Information 1-800-544-6666
Retirement Accounts 1-800-544-4774
(8 a.m. - 9 p.m.)
TDD Service 1-800-544-0118
for the deaf and hearing impaired
(9 a.m. - 9 p.m. Eastern time)
Fidelity Automated Service
Telephone (FAST ®)
1-800-544-8544
Automated line for quickest service
(Fidelity Investment logo)(registered trademark)
Corporate Headquarters
245 Summer St., Boston, MA 02210
www.fidelity.com
GAI-UANN-0913
1.874515.105
Fidelity®
Growth & Income
Portfolio -
Class K
Annual Report
July 31, 2013
(Fidelity Cover Art)
Contents
Performance | (Click Here) | How the fund has done over time. |
Management's Discussion of Fund Performance | (Click Here) | The Portfolio Manager's review of fund performance and strategy. |
Shareholder Expense Example | (Click Here) | An example of shareholder expenses. |
Investment Changes | (Click Here) | A summary of major shifts in the fund's investments over the past six months. |
Investments | (Click Here) | A complete list of the fund's investments with their market values. |
Financial Statements | (Click Here) | Statements of assets and liabilities, operations, and changes in net assets, as well as financial highlights. |
Notes | (Click Here) | Notes to the financial statements. |
Report of Independent Registered Public Accounting Firm | (Click Here) | |
Trustees and Officers | (Click Here) | |
Distributions | (Click Here) | |
Board Approval of Investment Advisory Contracts and Management Fees | (Click Here) | |
To view a fund's proxy voting guidelines and proxy voting record for the 12-month period ended June 30, visit http://www.fidelity.com/proxyvotingresults or visit the Securities and Exchange Commission's (SEC) web site at http://www.sec.gov. You may also call 1-800-835-5092 to request a free copy of the proxy voting guidelines.
Standard & Poor's, S&P and S&P 500 are registered service marks of The McGraw-Hill Companies, Inc. and have been licensed for use by Fidelity Distributors Corporation.
Other third-party marks appearing herein are the property of their respective owners.
All other marks appearing herein are registered or unregistered trademarks or service marks of FMR LLC or an affiliated company. © 2013 FMR LLC. All rights reserved.
Annual Report
This report and the financial statements contained herein are submitted for the general information of the shareholders of the fund. This report is not authorized for distribution to prospective investors in the fund unless preceded or accompanied by an effective prospectus.
A fund files its complete schedule of portfolio holdings with the SEC for the first and third quarters of each fiscal year on Form N-Q. Forms N-Q are available on the SEC's web site at http://www.sec.gov. A fund's Forms N-Q may be reviewed and copied at the SEC's Public Reference Room in Washington, DC. Information regarding the operation of the SEC's Public Reference Room may be obtained by calling 1-800-SEC-0330. For a complete list of a fund's portfolio holdings, view the most recent holdings listing, semiannual report, or annual report on Fidelity's web site at http://www.fidelity.com, http://www.advisor.fidelity.com, or http://www.401k.com, as applicable.
NOT FDIC INSURED • MAY LOSE VALUE • NO BANK GUARANTEE
Neither the fund nor Fidelity Distributors Corporation is a bank.
Annual Report
Average annual total return reflects the change in the value of an investment, assuming reinvestment of the class' distributions from dividend income and capital gains (the profits earned upon the sale of securities that have grown in value, if any) and assuming a constant rate of performance each year. The $10,000 table and the fund's returns do not reflect the deduction of taxes that a shareholder would pay on fund distributions or the redemption of fund shares. During periods of reimbursement by Fidelity, a fund's total return will be greater than it would be had the reimbursement not occurred. How a fund did yesterday is no guarantee of how it will do tomorrow.
Average Annual Total Returns
Periods ended July 31, 2013 | Past 1
year | Past 5
years | Past 10
years |
Class K A | 30.28% | 4.92% | 3.51% |
A The initial offering of Class K shares took place on May 9, 2008. Returns prior to May 9, 2008, are those of Fidelity® Growth & Income Portfolio, the original class of the fund.
$10,000 Over 10 Years
Let's say hypothetically that $10,000 was invested in Fidelity® Growth & Income Portfolio - Class K on July 31, 2003. The chart shows how the value of your investment would have changed, and also shows how the S&P 500® Index performed over the same period. The initial offering of Class K took place on May 9, 2008. See above for additional information regarding the performance of Class K.
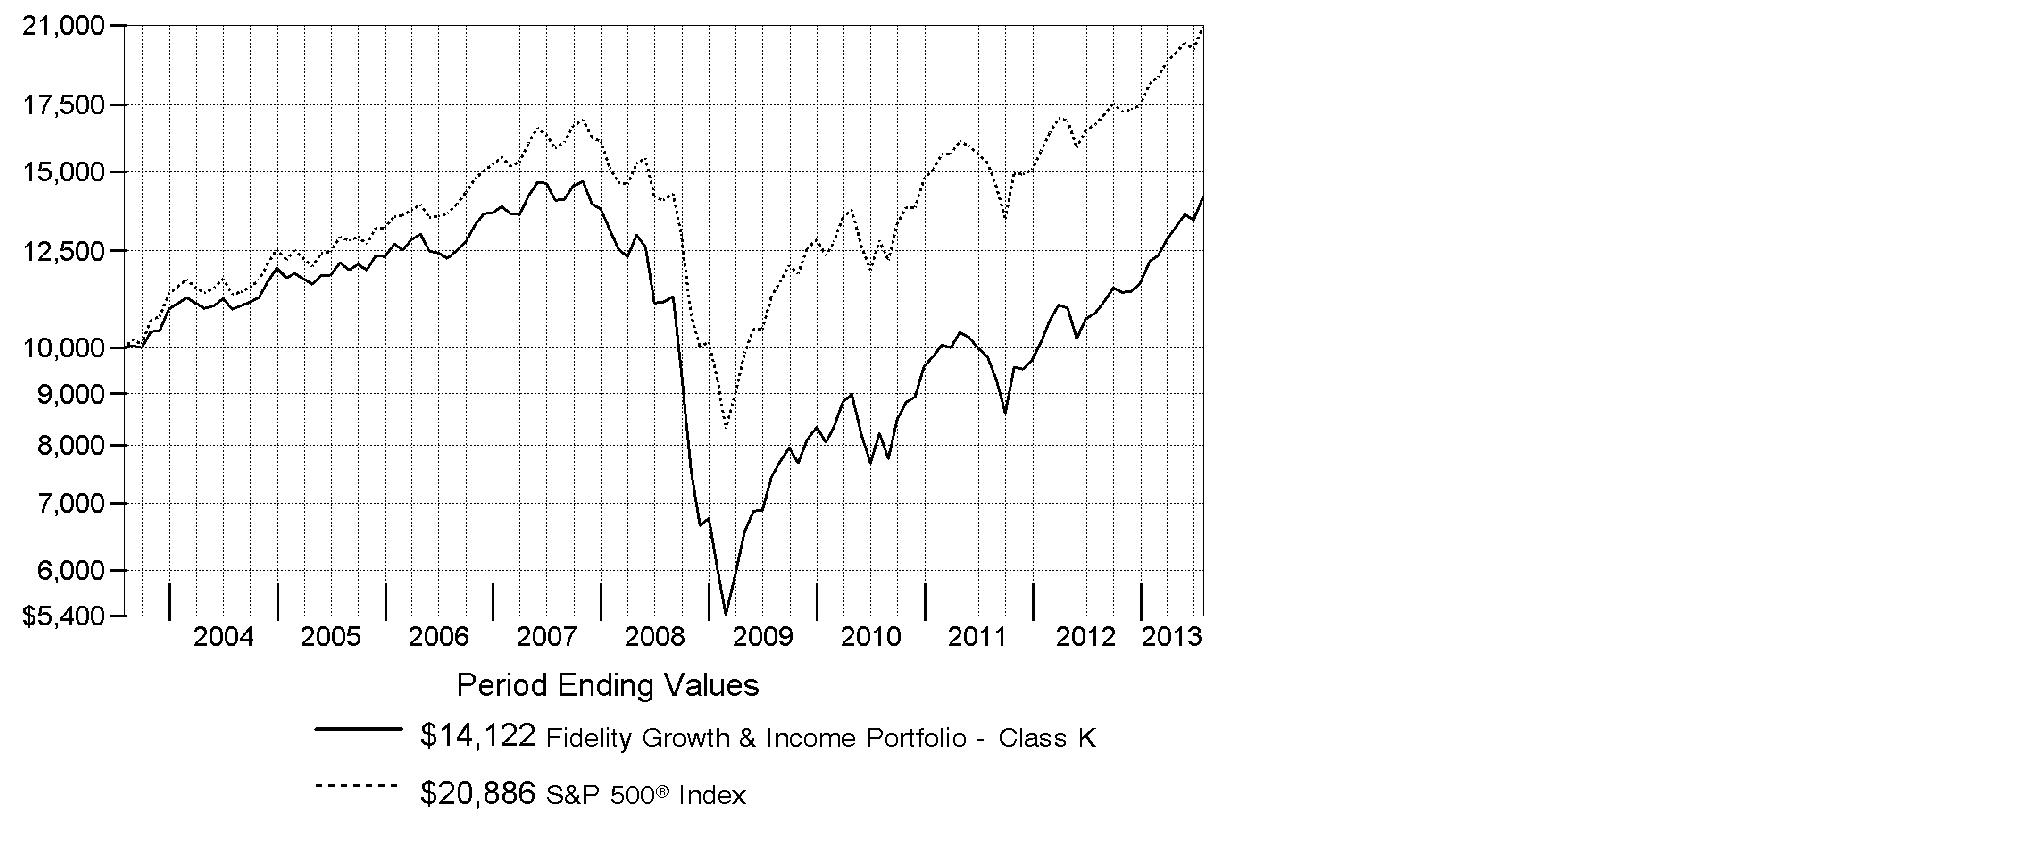
Annual Report
Market Recap: The bull run in U.S. stocks comfortably settled into a fifth year, as major equity benchmarks ripped through records during the 12 months ending July 31, 2013. Gains were fueled by a generally improving global economy and accommodative monetary policies worldwide. The tone was positive for most of the year, based largely on stronger U.S. economic data, including employment, housing and consumer sentiment. Setting a series of new highs along the way, the broad-based S&P 500® Index rose an impressive 25.00% for the 12 months, while the blue-chip-laden Dow Jones Industrial AverageSM also moved into record territory en route to a 22.36% gain. The growth-oriented Nasdaq Composite Index® had a similarly strong run, advancing 25.15%. During the year, markets were resilient amid intermittent volatility over debt woes in Europe, the 2012 U.S. presidential election and year-end Congressional gridlock over the federal budget. In mid-to-late June, concern arose about the U.S. Federal Reserve possibly tapering its sustaining bond-buying strategy - which prompted a brief, but steep, market sell-off. However, investors' continued quest for yield and the Fed's pledge to keep buying bonds until the economy showed significant improvement overpowered the uncertainty and helped equities climb notably higher in July to close the period on a strong note.
Comments from Matthew Fruhan, Portfolio Manager of Fidelity® Growth & Income Portfolio: For the year, the fund's Class K shares returned 30.28%, ahead of the S&P 500®. My investment philosophy is based on my belief that stock performance is driven by changes in long-term earnings and yield expectations. This approach worked as anticipated, as the market came around to my view on several major holdings, most notably a number of stocks from the diversified financials industry. This group easily outperformed the market during the past year, and my positioning here, especially a significant overweight, provided a major boost versus the benchmark. Top individual contributors included outsized stakes in financial services giants JPMorgan Chase and Morgan Stanley, discount brokerage firm Charles Schwab, and global leader Citigroup, all of which saw their stock prices gain sharply. Litigation income received during the period helped. Conversely, avoiding major index component Gilead Sciences was our biggest relative detractor because the stock moved higher as investors gained confidence in the biopharmaceutical company based on the trajectory of its earnings growth. In energy, we were hurt by out-of-index stakes in oil and gas company Royal Dutch Shell, which was pressured by lower commodity prices, and Canada's Suncor Energy, an integrated energy firm that was hampered by execution problems in delivering production growth.
The views expressed above reflect those of the portfolio manager(s) only through the end of the period as stated on the cover of this report and do not necessarily represent the views of Fidelity or any other person in the Fidelity organization. Any such views are subject to change at any time based upon market or other conditions and Fidelity disclaims any responsibility to update such views. These views may not be relied on as investment advice and, because investment decisions for a Fidelity fund are based on numerous factors, may not be relied on as an indication of trading intent on behalf of any Fidelity fund.
Annual Report
Shareholder Expense Example
As a shareholder of the Fund, you incur two types of costs: (1) transaction costs, and (2) ongoing costs, including management fees and other Fund expenses. This Example is intended to help you understand your ongoing costs (in dollars) of investing in the Fund and to compare these costs with the ongoing costs of investing in other mutual funds.
The Example is based on an investment of $1,000 invested at the beginning of the period and held for the entire period (February 1, 2013 to July 31, 2013).
Actual Expenses
The first line of the accompanying table for each class of the Fund provides information about actual account values and actual expenses. You may use the information in this line, together with the amount you invested, to estimate the expenses that you paid over the period. Simply divide your account value by $1,000.00 (for example, an $8,600 account value divided by $1,000.00 = 8.6), then multiply the result by the number in the first line for a class of the Fund under the heading entitled "Expenses Paid During Period" to estimate the expenses you paid on your account during this period. A small balance maintenance fee of $12.00 that is charged once a year may apply for certain accounts with a value of less than $2,000. This fee is not included in the table below. If it was, the estimate of expenses you paid during the period would be higher, and your ending account value lower, by this amount. In addition, the Fund, as a shareholder in the underlying Fidelity Central Funds, will indirectly bear its pro-rata share of the fees and expenses incurred by the underlying Fidelity Central Funds. These fees and expenses are not included in the Fund's annualized expense ratio used to calculate the expense estimate in the table below.
Hypothetical Example for Comparison Purposes
The second line of the accompanying table for each class of the Fund provides information about hypothetical account values and hypothetical expenses based on a Class' actual expense ratio and an assumed rate of return of 5% per year before expenses, which is not the Class' actual return. The hypothetical account values and expenses may not be used to estimate the actual ending account balance or expenses you paid for the period. You may use this information to compare the ongoing costs of investing in the Fund and other funds. To do so, compare this 5% hypothetical example with the 5% hypothetical examples that appear in the shareholder reports of the other funds. A small balance maintenance fee of $12.00 that is charged once a year may apply for certain accounts with a value of less than $2,000. This fee is not included in the table below. If it was, the estimate of expenses you paid during the period would be higher, and your ending account value lower, by this amount. In addition, the Fund, as a shareholder in the underlying Fidelity Central Funds, will indirectly bear its pro-rata share of the fees and expenses incurred by the underlying Fidelity Central Funds. These fees and expenses are not included in the Fund's annualized expense ratio used to calculate the expense estimate in the table below.
Please note that the expenses shown in the table are meant to highlight your ongoing costs only and do not reflect any transaction costs. Therefore, the second line of the table is useful in comparing ongoing costs only, and will not help you determine the relative total costs of owning different funds.
Annual Report
| Annualized
Expense RatioB | Beginning
Account Value
February 1, 2013 | Ending
Account Value
July 31, 2013 | Expenses Paid
During Period*
February 1, 2013
to July 31, 2013 |
Growth and Income | .67% | | | |
Actual | | $ 1,000.00 | $ 1,157.30 | $ 3.58 |
HypotheticalA | | $ 1,000.00 | $ 1,021.47 | $ 3.36 |
Class K | .53% | | | |
Actual | | $ 1,000.00 | $ 1,158.20 | $ 2.84 |
HypotheticalA | | $ 1,000.00 | $ 1,022.17 | $ 2.66 |
A 5% return per year before expenses
B Annualized expense ratio reflects expenses net of applicable fee waivers.
* Expenses are equal to each Class' annualized expense ratio, multiplied by the average account value over the period, multiplied by 181/365 (to reflect the one-half year period).
Annual Report
Investment Changes (Unaudited)
Top Ten Stocks as of July 31, 2013 |
| % of fund's
net assets | % of fund's net assets
6 months ago |
JPMorgan Chase & Co. | 3.8 | 3.8 |
Apple, Inc. | 3.3 | 3.4 |
General Electric Co. | 2.9 | 2.8 |
Chevron Corp. | 2.6 | 3.1 |
Wells Fargo & Co. | 2.4 | 3.0 |
Microsoft Corp. | 2.3 | 2.0 |
Citigroup, Inc. | 2.1 | 1.8 |
Procter & Gamble Co. | 2.0 | 2.3 |
Occidental Petroleum Corp. | 1.9 | 1.0 |
Target Corp. | 1.9 | 1.7 |
| 25.2 | |
Top Five Market Sectors as of July 31, 2013 |
| % of fund's
net assets | % of fund's net assets
6 months ago |
Financials | 20.4 | 19.8 |
Information Technology | 16.9 | 15.9 |
Health Care | 13.5 | 12.0 |
Energy | 11.9 | 11.9 |
Industrials | 11.2 | 12.3 |
Asset Allocation (% of fund's net assets) |
As of July 31, 2013 * | As of January 31, 2013 ** |
| Stocks 98.8% | | | Stocks 98.5% | |
| Convertible
Securities 1.1% | | | Convertible
Securities 1.2% | |
| Short-Term
Investments and
Net Other Assets
(Liabilities) 0.1% | | | Short-Term
Investments and
Net Other Assets
(Liabilities) 0.3% | |
* Foreign investments | 11.5% | | ** Foreign investments | 10.8% | |

Annual Report
Investments July 31, 2013
Showing Percentage of Net Assets
Common Stocks - 98.8% |
| Shares | | Value (000s) |
CONSUMER DISCRETIONARY - 10.3% |
Auto Components - 0.1% |
Gentex Corp. | 288,524 | | $ 6,515 |
Automobiles - 0.5% |
Ford Motor Co. | 2,100,236 | | 35,452 |
Distributors - 0.1% |
LKQ Corp. (a) | 311,998 | | 8,134 |
Diversified Consumer Services - 0.2% |
H&R Block, Inc. | 554,707 | | 17,434 |
Hotels, Restaurants & Leisure - 1.5% |
Darden Restaurants, Inc. | 31,437 | | 1,542 |
McDonald's Corp. | 601,346 | | 58,980 |
Wyndham Worldwide Corp. | 133,467 | | 8,315 |
Yum! Brands, Inc. | 492,785 | | 35,934 |
| | 104,771 |
Leisure Equipment & Products - 0.2% |
Mattel, Inc. | 335,606 | | 14,106 |
Media - 3.5% |
Comcast Corp. Class A | 2,784,200 | | 125,512 |
Scripps Networks Interactive, Inc. Class A | 181,725 | | 12,861 |
Time Warner, Inc. | 1,397,564 | | 87,012 |
Viacom, Inc. Class B (non-vtg.) | 295,855 | | 21,529 |
| | 246,914 |
Multiline Retail - 2.1% |
Kohl's Corp. | 256,385 | | 13,583 |
Target Corp. | 1,900,103 | | 135,382 |
| | 148,965 |
Specialty Retail - 1.8% |
H&M Hennes & Mauritz AB (B Shares) | 76,600 | | 2,853 |
Lowe's Companies, Inc. | 2,371,734 | | 105,732 |
Staples, Inc. | 906,232 | | 15,424 |
| | 124,009 |
Textiles, Apparel & Luxury Goods - 0.3% |
Coach, Inc. | 150,332 | | 7,987 |
Li & Fung Ltd. | 9,512,000 | | 12,584 |
| | 20,571 |
TOTAL CONSUMER DISCRETIONARY | | 726,871 |
Common Stocks - continued |
| Shares | | Value (000s) |
CONSUMER STAPLES - 10.8% |
Beverages - 2.6% |
C&C Group PLC | 391,300 | | $ 2,160 |
Molson Coors Brewing Co. Class B | 324,112 | | 16,225 |
PepsiCo, Inc. | 767,027 | | 64,077 |
Remy Cointreau SA | 45,300 | | 4,690 |
The Coca-Cola Co. | 2,497,605 | | 100,104 |
| | 187,256 |
Food & Staples Retailing - 2.0% |
CVS Caremark Corp. | 616,404 | | 37,903 |
Walgreen Co. | 1,989,849 | | 99,990 |
| | 137,893 |
Food Products - 1.0% |
Danone SA | 313,484 | | 24,772 |
Kellogg Co. | 612,547 | | 40,575 |
Mead Johnson Nutrition Co. Class A | 83,500 | | 6,082 |
| | 71,429 |
Household Products - 2.9% |
Kimberly-Clark Corp. | 550,532 | | 54,393 |
Procter & Gamble Co. | 1,795,515 | | 144,180 |
Svenska Cellulosa AB (SCA) (B Shares) | 159,500 | | 4,221 |
| | 202,794 |
Tobacco - 2.3% |
British American Tobacco PLC sponsored ADR | 907,527 | | 96,652 |
Lorillard, Inc. | 1,320,746 | | 56,171 |
Philip Morris International, Inc. | 128,923 | | 11,497 |
| | 164,320 |
TOTAL CONSUMER STAPLES | | 763,692 |
ENERGY - 11.8% |
Energy Equipment & Services - 1.4% |
Ensco PLC Class A | 306,706 | | 17,587 |
Halliburton Co. | 1,000,327 | | 45,205 |
Schlumberger Ltd. | 451,719 | | 36,738 |
| | 99,530 |
Oil, Gas & Consumable Fuels - 10.4% |
Access Midstream Partners LP | 237,233 | | 11,143 |
Apache Corp. | 423,097 | | 33,954 |
Atlas Pipeline Partners LP | 562,134 | | 21,305 |
BG Group PLC | 680,800 | | 12,288 |
Common Stocks - continued |
| Shares | | Value (000s) |
ENERGY - continued |
Oil, Gas & Consumable Fuels - continued |
BP PLC sponsored ADR | 327,650 | | $ 13,578 |
Canadian Natural Resources Ltd. | 1,470,800 | | 45,580 |
Chevron Corp. | 1,479,705 | | 186,280 |
ENI SpA | 317,000 | | 7,002 |
Exxon Mobil Corp. | 569,711 | | 53,410 |
Legacy Reserves LP | 113,845 | | 3,089 |
Magellan Midstream Partners LP | 31,121 | | 1,702 |
Markwest Energy Partners LP | 511,743 | | 35,929 |
Occidental Petroleum Corp. | 1,528,498 | | 136,113 |
Royal Dutch Shell PLC Class A (United Kingdom) | 1,585,215 | | 54,089 |
Suncor Energy, Inc. | 1,950,450 | | 61,641 |
The Williams Companies, Inc. | 1,618,223 | | 55,295 |
Western Gas Partners LP | 67,200 | | 4,140 |
| | 736,538 |
TOTAL ENERGY | | 836,068 |
FINANCIALS - 20.3% |
Capital Markets - 4.1% |
AllianceBernstein Holding LP | 161,066 | | 3,576 |
Apollo Investment Corp. | 541,130 | | 4,399 |
Ashmore Group PLC | 1,115,278 | | 6,289 |
BlackRock, Inc. Class A | 46,736 | | 13,178 |
Charles Schwab Corp. | 3,278,562 | | 72,423 |
KKR & Co. LP | 1,298,447 | | 26,553 |
Morgan Stanley | 2,389,897 | | 65,029 |
Northern Trust Corp. | 531,251 | | 31,099 |
State Street Corp. | 628,483 | | 43,786 |
The Blackstone Group LP | 542,685 | | 12,238 |
UBS AG | 492,693 | | 9,702 |
| | 288,272 |
Commercial Banks - 5.6% |
BNP Paribas SA | 89,500 | | 5,791 |
Comerica, Inc. | 861,168 | | 36,634 |
Erste Group Bank AG | 238,550 | | 7,245 |
PNC Financial Services Group, Inc. | 786,612 | | 59,822 |
Standard Chartered PLC (United Kingdom) | 1,003,555 | | 23,274 |
SunTrust Banks, Inc. | 377,966 | | 13,149 |
Common Stocks - continued |
| Shares | | Value (000s) |
FINANCIALS - continued |
Commercial Banks - continued |
U.S. Bancorp | 2,049,173 | | $ 76,475 |
Wells Fargo & Co. | 3,944,449 | | 171,584 |
| | 393,974 |
Consumer Finance - 0.2% |
SLM Corp. | 599,485 | | 14,813 |
Diversified Financial Services - 7.7% |
Bank of America Corp. | 5,874,991 | | 85,775 |
Citigroup, Inc. | 2,843,659 | | 148,268 |
JPMorgan Chase & Co. | 4,741,229 | | 264,228 |
KKR Financial Holdings LLC | 2,810,344 | | 29,705 |
NYSE Euronext | 198,750 | | 8,379 |
The NASDAQ Stock Market, Inc. | 221,589 | | 7,179 |
| | 543,534 |
Insurance - 1.7% |
AFLAC, Inc. | 73,546 | | 4,536 |
Arthur J. Gallagher & Co. | 117,800 | | 5,228 |
Marsh & McLennan Companies, Inc. | 118,607 | | 4,966 |
MetLife, Inc. | 1,503,466 | | 72,798 |
MetLife, Inc. unit | 364,100 | | 20,757 |
Prudential Financial, Inc. | 200,068 | | 15,799 |
| | 124,084 |
Real Estate Investment Trusts - 0.6% |
American Capital Agency Corp. | 229,125 | | 5,162 |
Aviv REIT, Inc. | 33,600 | | 837 |
BioMed Realty Trust, Inc. | 100,245 | | 2,071 |
Invesco Mortgage Capital, Inc. | 131,922 | | 2,167 |
MFA Financial, Inc. | 281,750 | | 2,248 |
Sun Communities, Inc. | 552,314 | | 26,743 |
| | 39,228 |
Real Estate Management & Development - 0.1% |
Beazer Pre-Owned Rental Homes, Inc. (a)(e) | 254,400 | | 5,236 |
Thrifts & Mortgage Finance - 0.3% |
Housing Development Finance Corp. Ltd. (a) | 102,933 | | 1,354 |
Radian Group, Inc. | 1,687,868 | | 23,715 |
| | 25,069 |
TOTAL FINANCIALS | | 1,434,210 |
Common Stocks - continued |
| Shares | | Value (000s) |
HEALTH CARE - 12.7% |
Biotechnology - 0.8% |
Amgen, Inc. | 529,703 | | $ 57,362 |
Health Care Equipment & Supplies - 1.2% |
Abbott Laboratories | 330,904 | | 12,121 |
ResMed, Inc. (d) | 57,682 | | 2,749 |
St. Jude Medical, Inc. | 559,800 | | 29,328 |
Stryker Corp. | 356,188 | | 25,097 |
Zimmer Holdings, Inc. | 183,510 | | 15,319 |
| | 84,614 |
Health Care Providers & Services - 3.4% |
Aetna, Inc. | 550,998 | | 35,358 |
AmerisourceBergen Corp. | 82,600 | | 4,813 |
Fresenius Medical Care AG & Co. KGaA | 102,300 | | 6,460 |
McKesson Corp. | 361,687 | | 44,365 |
Quest Diagnostics, Inc. | 967,950 | | 56,441 |
UnitedHealth Group, Inc. | 759,704 | | 55,344 |
WellPoint, Inc. | 483,266 | | 41,348 |
| | 244,129 |
Health Care Technology - 0.2% |
Quality Systems, Inc. | 568,117 | | 12,993 |
Life Sciences Tools & Services - 0.2% |
Lonza Group AG | 216,954 | | 16,691 |
Pharmaceuticals - 6.9% |
AbbVie, Inc. | 1,090,718 | | 49,606 |
AstraZeneca PLC sponsored ADR | 348,396 | | 17,671 |
Eli Lilly & Co. | 141,980 | | 7,541 |
GlaxoSmithKline PLC sponsored ADR | 1,221,493 | | 62,247 |
Johnson & Johnson | 1,289,997 | | 120,615 |
Merck & Co., Inc. | 2,778,819 | | 133,856 |
Novartis AG sponsored ADR | 375,075 | | 26,859 |
Pfizer, Inc. | 952,269 | | 27,835 |
Sanofi SA | 248,538 | | 26,018 |
Teva Pharmaceutical Industries Ltd. sponsored ADR | 345,862 | | 13,731 |
| | 485,979 |
TOTAL HEALTH CARE | | 901,768 |
INDUSTRIALS - 11.1% |
Aerospace & Defense - 2.2% |
Honeywell International, Inc. | 151,261 | | 12,552 |
Rockwell Collins, Inc. | 367,298 | | 26,141 |
Common Stocks - continued |
| Shares | | Value (000s) |
INDUSTRIALS - continued |
Aerospace & Defense - continued |
The Boeing Co. | 699,889 | | $ 73,558 |
United Technologies Corp. | 447,782 | | 47,272 |
| | 159,523 |
Air Freight & Logistics - 1.5% |
C.H. Robinson Worldwide, Inc. | 503,673 | | 30,029 |
United Parcel Service, Inc. Class B | 913,404 | | 79,283 |
| | 109,312 |
Building Products - 0.0% |
Fagerhult AB | 16,600 | | 453 |
Commercial Services & Supplies - 0.3% |
ADT Corp. | 154,411 | | 6,189 |
KAR Auction Services, Inc. | 300,200 | | 7,637 |
Ritchie Brothers Auctioneers, Inc. | 281,140 | | 5,420 |
| | 19,246 |
Electrical Equipment - 0.5% |
Hubbell, Inc. Class B | 289,039 | | 31,028 |
Zumtobel AG | 125,161 | | 1,537 |
| | 32,565 |
Industrial Conglomerates - 3.0% |
General Electric Co. | 8,515,998 | | 207,535 |
Siemens AG sponsored ADR | 36,300 | | 4,010 |
| | 211,545 |
Machinery - 1.0% |
Douglas Dynamics, Inc. | 941,855 | | 13,534 |
Ingersoll-Rand PLC | 417,067 | | 25,462 |
ITT Corp. | 267,895 | | 8,369 |
Pfeiffer Vacuum Technology AG | 29,554 | | 3,218 |
Stanley Black & Decker, Inc. | 274,344 | | 23,215 |
| | 73,798 |
Marine - 0.0% |
Irish Continental Group PLC unit | 22,093 | | 676 |
Professional Services - 0.5% |
Acacia Research Corp. | 358,122 | | 8,172 |
Amadeus Fire AG | 49,393 | | 2,989 |
Bureau Veritas SA | 218,596 | | 6,488 |
Dun & Bradstreet Corp. | 80,314 | | 8,323 |
Michael Page International PLC | 1,131,563 | | 7,686 |
| | 33,658 |
Common Stocks - continued |
| Shares | | Value (000s) |
INDUSTRIALS - continued |
Road & Rail - 1.4% |
CSX Corp. | 2,276,271 | | $ 56,474 |
J.B. Hunt Transport Services, Inc. | 230,830 | | 17,296 |
Norfolk Southern Corp. | 344,099 | | 25,174 |
| | 98,944 |
Trading Companies & Distributors - 0.7% |
Beijer (G&L) AG Series B | 43,211 | | 696 |
Brenntag AG | 12,900 | | 2,119 |
MSC Industrial Direct Co., Inc. Class A | 255,220 | | 20,660 |
W.W. Grainger, Inc. | 88,072 | | 23,087 |
Watsco, Inc. | 36,459 | | 3,403 |
| | 49,965 |
TOTAL INDUSTRIALS | | 789,685 |
INFORMATION TECHNOLOGY - 16.9% |
Communications Equipment - 2.4% |
Cisco Systems, Inc. | 4,472,251 | | 114,266 |
QUALCOMM, Inc. | 890,446 | | 57,478 |
| | 171,744 |
Computers & Peripherals - 3.5% |
Apple, Inc. | 515,289 | | 233,168 |
EMC Corp. | 587,020 | | 15,351 |
| | 248,519 |
Internet Software & Services - 1.8% |
Google, Inc. Class A (a) | 142,489 | | 126,473 |
IT Services - 5.4% |
Accenture PLC Class A | 138,445 | | 10,219 |
Cognizant Technology Solutions Corp. Class A (a) | 421,936 | | 30,544 |
Fidelity National Information Services, Inc. | 621,836 | | 26,838 |
IBM Corp. | 122,450 | | 23,883 |
MasterCard, Inc. Class A | 108,250 | | 66,099 |
Paychex, Inc. | 3,145,172 | | 124,046 |
The Western Union Co. | 2,150,880 | | 38,630 |
Visa, Inc. Class A | 336,974 | | 59,648 |
| | 379,907 |
Semiconductors & Semiconductor Equipment - 1.2% |
Altera Corp. | 548,340 | | 19,499 |
Analog Devices, Inc. | 337,365 | | 16,652 |
Applied Materials, Inc. | 2,381,149 | | 38,837 |
Common Stocks - continued |
| Shares | | Value (000s) |
INFORMATION TECHNOLOGY - continued |
Semiconductors & Semiconductor Equipment - continued |
Broadcom Corp. Class A | 103,675 | | $ 2,858 |
Maxim Integrated Products, Inc. | 232,000 | | 6,635 |
| | 84,481 |
Software - 2.6% |
Microsoft Corp. | 5,146,302 | | 163,807 |
Oracle Corp. | 739,747 | | 23,931 |
| | 187,738 |
TOTAL INFORMATION TECHNOLOGY | | 1,198,862 |
MATERIALS - 1.7% |
Chemicals - 1.5% |
Airgas, Inc. | 183,883 | | 18,979 |
E.I. du Pont de Nemours & Co. | 389,240 | | 22,455 |
FMC Corp. | 157,061 | | 10,391 |
Monsanto Co. | 171,014 | | 16,893 |
Potash Corp. of Saskatchewan, Inc. | 111,400 | | 3,232 |
RPM International, Inc. | 83,400 | | 2,939 |
Syngenta AG (Switzerland) | 67,676 | | 26,760 |
| | 101,649 |
Metals & Mining - 0.2% |
Freeport-McMoRan Copper & Gold, Inc. | 150,200 | | 4,248 |
Grupo Mexico SA de CV Series B | 1,353,500 | | 4,170 |
Southern Copper Corp. | 304,530 | | 7,939 |
| | 16,357 |
TOTAL MATERIALS | | 118,006 |
TELECOMMUNICATION SERVICES - 2.1% |
Diversified Telecommunication Services - 1.3% |
CenturyLink, Inc. | 221,194 | | 7,930 |
Verizon Communications, Inc. | 1,745,415 | | 86,363 |
| | 94,293 |
Wireless Telecommunication Services - 0.8% |
Vodafone Group PLC sponsored ADR | 1,794,442 | | 53,744 |
TOTAL TELECOMMUNICATION SERVICES | | 148,037 |
Common Stocks - continued |
| Shares | | Value (000s) |
UTILITIES - 1.1% |
Electric Utilities - 0.7% |
Ceske Energeticke Zavody A/S | 29,900 | | $ 711 |
Duke Energy Corp. | 95,279 | | 6,765 |
EDF SA | 198,000 | | 5,809 |
FirstEnergy Corp. | 269,914 | | 10,276 |
Hawaiian Electric Industries, Inc. | 349,665 | | 9,322 |
ITC Holdings Corp. | 73,709 | | 6,764 |
Northeast Utilities | 107,072 | | 4,755 |
PPL Corp. | 242,053 | | 7,690 |
| | 52,092 |
Multi-Utilities - 0.4% |
E.ON AG | 98,728 | | 1,675 |
National Grid PLC | 109,854 | | 1,313 |
PG&E Corp. | 154,385 | | 7,085 |
Sempra Energy | 160,709 | | 14,083 |
| | 24,156 |
TOTAL UTILITIES | | 76,248 |
TOTAL COMMON STOCKS (Cost $5,578,320) |
6,993,447
|
Convertible Preferred Stocks - 1.0% |
| | | |
ENERGY - 0.0% |
Oil, Gas & Consumable Fuels - 0.0% |
Apache Corp. 6.00% | 85,000 | | 3,885 |
FINANCIALS - 0.1% |
Real Estate Investment Trusts - 0.1% |
Weyerhaeuser Co. Series A, 6.375% (a) | 136,200 | | 7,078 |
HEALTH CARE - 0.8% |
Health Care Equipment & Supplies - 0.8% |
Alere, Inc. 3.00% | 196,925 | | 54,550 |
INDUSTRIALS - 0.1% |
Aerospace & Defense - 0.1% |
United Technologies Corp. 7.50% | 110,600 | | 7,093 |
TOTAL CONVERTIBLE PREFERRED STOCKS (Cost $64,477) |
72,606
|
Convertible Bonds - 0.1% |
| Principal
Amount (000s) | | Value (000s) |
ENERGY - 0.1% |
Oil, Gas & Consumable Fuels - 0.1% |
Amyris, Inc. 3% 2/27/17 | | $ 5,615 | | $ 3,963 |
Peabody Energy Corp. 4.75% 12/15/66 | | 390 | | 293 |
| | 4,256 |
HEALTH CARE - 0.0% |
Health Care Equipment & Supplies - 0.0% |
Volcano Corp. 1.75% 12/1/17 | | 3,640 | | 3,440 |
TOTAL CONVERTIBLE BONDS (Cost $9,324) |
7,696
|
Money Market Funds - 0.1% |
| Shares | | |
Fidelity Cash Central Fund, 0.11% (b) | 4,724,889 | | 4,725 |
Fidelity Securities Lending Cash Central Fund, 0.12% (b)(c) | 1,104,000 | | 1,104 |
TOTAL MONEY MARKET FUNDS (Cost $5,829) |
5,829
|
TOTAL INVESTMENT PORTFOLIO - 100.0% (Cost $5,657,950) | | 7,079,578 |
NET OTHER ASSETS (LIABILITIES) - 0.0% | | (3,516) |
NET ASSETS - 100% | $ 7,076,062 |
Legend |
(a) Non-income producing |
(b) Affiliated fund that is generally available only to investment companies and other accounts managed by Fidelity Investments. The rate quoted is the annualized seven-day yield of the fund at period end. A complete unaudited listing of the fund's holdings as of its most recent quarter end is available upon request. In addition, each Fidelity Central Fund's financial statements, which are not covered by the Fund's Report of Independent Registered Public Accounting Firm, are available on the SEC's website or upon request. |
(c) Investment made with cash collateral received from securities on loan. |
(d) Security or a portion of the security is on loan at period end. |
(e) Restricted securities - Investment in securities not registered under the Securities Act of 1933 (excluding 144A issues). At the end of the period, the value of restricted securities (excluding 144A issues) amounted to $5,236,000 or 0.1% of net assets. |
Additional information on each restricted holding is as follows: |
Security | Acquisition
Date | Acquisition
Cost (000s) |
Beazer Pre-Owned Rental Homes, Inc. | 5/3/12 - 10/23/12 | $ 5,088 |
Affiliated Central Funds |
Information regarding fiscal year to date income earned by the Fund from investments in Fidelity Central Funds is as follows: |
Fund | Income earned
(Amounts in thousands) |
Fidelity Cash Central Fund | $ 25 |
Fidelity Securities Lending Cash Central Fund | 476 |
Total | $ 501 |
Other Information |
The following is a summary of the inputs used, as of July 31, 2013, involving the Fund's assets and liabilities carried at fair value. The inputs or methodology used for valuing securities may not be an indication of the risk associated with investing in those securities. For more information on valuation inputs, and their aggregation into the levels used in the table below, please refer to the Investment Valuation section in the accompanying Notes to Financial Statements. |
Valuation Inputs at Reporting Date: |
Description
(Amounts in thousands) | Total | Level 1 | Level 2 | Level 3 |
Investments in Securities: | | | | |
Equities: | | | | |
Consumer Discretionary | $ 726,871 | $ 726,871 | $ - | $ - |
Consumer Staples | 763,692 | 763,692 | - | - |
Energy | 839,953 | 778,862 | 61,091 | - |
Financials | 1,441,288 | 1,398,515 | 37,537 | 5,236 |
Health Care | 956,318 | 923,840 | 32,478 | - |
Industrials | 796,778 | 796,778 | - | - |
Information Technology | 1,198,862 | 1,198,862 | - | - |
Materials | 118,006 | 91,246 | 26,760 | - |
Telecommunication Services | 148,037 | 148,037 | - | - |
Utilities | 76,248 | 74,935 | 1,313 | - |
Corporate Bonds | 7,696 | - | 7,696 | - |
Money Market Funds | 5,829 | 5,829 | - | - |
Total Investments in Securities: | $ 7,079,578 | $ 6,907,467 | $ 166,875 | $ 5,236 |
Distribution of investments by country or territory of incorporation, as a percentage of total net assets, is as follows. (Unaudited) |
United States of America | 88.5% |
United Kingdom | 5.3% |
Canada | 1.7% |
Switzerland | 1.1% |
France | 1.1% |
Others (Individually Less Than 1%) | 2.3% |
| 100.0% |
See accompanying notes which are an integral part of the financial statements.
Annual Report
Statement of Assets and Liabilities
Amounts in thousands (except per-share amounts) | July 31, 2013 |
| | |
Assets | | |
Investment in securities, at value (including securities loaned of $1,096) - See accompanying schedule: Unaffiliated issuers (cost $5,652,121) | $ 7,073,749 | |
Fidelity Central Funds (cost $5,829) | 5,829 | |
Total Investments (cost $5,657,950) | | $ 7,079,578 |
Receivable for investments sold | | 29,162 |
Receivable for fund shares sold | | 3,473 |
Dividends receivable | | 8,925 |
Interest receivable | | 85 |
Distributions receivable from Fidelity Central Funds | | 3 |
Other receivables | | 696 |
Total assets | | 7,121,922 |
| | |
Liabilities | | |
Payable for investments purchased | $ 35,666 | |
Payable for fund shares redeemed | 4,638 | |
Accrued management fee | 2,644 | |
Other affiliated payables | 1,055 | |
Other payables and accrued expenses | 753 | |
Collateral on securities loaned, at value | 1,104 | |
Total liabilities | | 45,860 |
| | |
Net Assets | | $ 7,076,062 |
Net Assets consist of: | | |
Paid in capital | | $ 9,921,182 |
Undistributed net investment income | | 4,966 |
Accumulated undistributed net realized gain (loss) on investments and foreign currency transactions | | (4,271,715) |
Net unrealized appreciation (depreciation) on investments and assets and liabilities in foreign currencies | | 1,421,629 |
Net Assets | | $ 7,076,062 |
See accompanying notes which are an integral part of the financial statements.
Annual Report
Statement of Assets and Liabilities - continued
Amounts in thousands (except per-share amounts) | July 31, 2013 |
| | |
Growth and Income:
Net Asset Value, offering price and redemption price per share ($6,059,874 ÷ 236,205 shares) | | $ 25.66 |
| | |
Class K:
Net Asset Value, offering price and redemption price per share ($1,016,188 ÷ 39,633 shares) | | $ 25.64 |
See accompanying notes which are an integral part of the financial statements.
Annual Report
Financial Statements - continued
Statement of Operations
Amounts in thousands | Year ended July 31, 2013 |
| | |
Investment Income | | |
Dividends | | $ 166,067 |
Interest | | 895 |
Income from Fidelity Central Funds | | 501 |
Total income | | 167,463 |
| | |
Expenses | | |
Management fee | $ 28,101 | |
Transfer agent fees | 10,906 | |
Accounting and security lending fees | 1,135 | |
Custodian fees and expenses | 181 | |
Independent trustees' compensation | 41 | |
Appreciation in deferred trustee compensation account | 1 | |
Registration fees | 114 | |
Audit | 91 | |
Legal | 33 | |
Interest | 2 | |
Miscellaneous | 54 | |
Total expenses before reductions | 40,659 | |
Expense reductions | (678) | 39,981 |
Net investment income (loss) | | 127,482 |
Realized and Unrealized Gain (Loss) Net realized gain (loss) on: | | |
Investment securities: | | |
Unaffiliated issuers | 486,483 | |
Foreign currency transactions | 127 | |
Total net realized gain (loss) | | 486,610 |
Change in net unrealized appreciation (depreciation) on: Investment securities | 1,017,935 | |
Assets and liabilities in foreign currencies | 4 | |
Total change in net unrealized appreciation (depreciation) | | 1,017,939 |
Net gain (loss) | | 1,504,549 |
Net increase (decrease) in net assets resulting from operations | | $ 1,632,031 |
See accompanying notes which are an integral part of the financial statements.
Annual Report
Statement of Changes in Net Assets
Amounts in thousands | Year ended
July 31,
2013 | Year ended
July 31,
2012 |
Increase (Decrease) in Net Assets | | |
Operations | | |
Net investment income (loss) | $ 127,482 | $ 102,946 |
Net realized gain (loss) | 486,610 | 104,201 |
Change in net unrealized appreciation (depreciation) | 1,017,939 | 318,127 |
Net increase (decrease) in net assets resulting
from operations | 1,632,031 | 525,274 |
Distributions to shareholders from net investment income | (120,664) | (98,353) |
Distributions to shareholders from net realized gain | (7,383) | (2,799) |
Total distributions | (128,047) | (101,152) |
Share transactions - net increase (decrease) | (42,531) | (265,023) |
Total increase (decrease) in net assets | 1,461,453 | 159,099 |
| | |
Net Assets | | |
Beginning of period | 5,614,609 | 5,455,510 |
End of period (including undistributed net investment income of $4,966 and undistributed net investment income of $5,432, respectively) | $ 7,076,062 | $ 5,614,609 |
See accompanying notes which are an integral part of the financial statements.
Annual Report
Financial Highlights - Growth and Income
Years ended July 31, | 2013 | 2012 | 2011 | 2010 | 2009 |
Selected Per-Share Data | | | | |
Net asset value, beginning of period | $ 20.13 | $ 18.58 | $ 15.75 | $ 14.38 | $ 21.88 |
Income from Investment Operations | | | | | |
Net investment income (loss) B | .46 | .36 | .20 | .10 | .15 |
Net realized and unrealized gain (loss) | 5.54 | 1.55 | 2.82 | 1.37 | (7.43) |
Total from investment operations | 6.00 | 1.91 | 3.02 | 1.47 | (7.28) |
Distributions from net investment income | (.44) | (.35) | (.19) | (.10) | (.19) |
Distributions from net realized gain | (.03) | (.01) | - | (.01) | (.03) |
Total distributions | (.47) | (.36) | (.19) | (.10) F | (.22) |
Net asset value, end of period | $ 25.66 | $ 20.13 | $ 18.58 | $ 15.75 | $ 14.38 |
Total Return A | 30.15% | 10.45% | 19.16% | 10.25% | (33.32)% |
Ratios to Average Net Assets C, E | | | | |
Expenses before reductions | .68% | .71% | .72% | .75% | .78% |
Expenses net of fee waivers, if any | .68% | .71% | .72% | .75% | .78% |
Expenses net of all reductions | .67% | .71% | .71% | .74% | .78% |
Net investment income (loss) | 2.04% | 1.95% | 1.09% | .63% | 1.07% |
Supplemental Data | | | | |
Net assets, end of period (in millions) | $ 6,060 | $ 4,863 | $ 5,052 | $ 5,417 | $ 5,993 |
Portfolio turnover rate D | 49% | 62% | 129% | 98% | 122% |
A Total returns would have been lower if certain expenses had not been reduced during the applicable periods shown.
B Calculated based on average shares outstanding during the period.
C Fees and expenses of any underlying Fidelity Central Funds are not included in the Fund's expense ratio. The Fund indirectly bears its proportionate share of the expenses of any underlying Fidelity Central Funds.
D Amount does not include the portfolio activity of any underlying Fidelity Central Funds.
E Expense ratios reflect operating expenses of the class. Expenses before reductions do not reflect amounts reimbursed by the investment adviser or reductions from brokerage service arrangements or reductions from other expense offset arrangements and do not represent the amount paid by the class during periods when reimbursements or reductions occur. Expenses net of fee waivers reflect expenses after reimbursement by the investment adviser but prior to reductions from brokerage service arrangements or other expense offset arrangements. Expenses net of all reductions represent the net expenses paid by the class.
F Total distributions of $.10 per share is comprised of distributions from net investment income of $.095 and distributions from net realized gain of $.008 per share.
See accompanying notes which are an integral part of the financial statements.
Annual Report
Financial Highlights - Class K
Years ended July 31, | 2013 | 2012 | 2011 | 2010 | 2009 |
Selected Per-Share Data | | | | |
Net asset value, beginning of period | $ 20.12 | $ 18.57 | $ 15.74 | $ 14.38 | $ 21.88 |
Income from Investment Operations | | | | | |
Net investment income (loss) B | .50 | .40 | .23 | .13 | �� .16 |
Net realized and unrealized gain (loss) | 5.52 | 1.54 | 2.82 | 1.37 | (7.40) |
Total from investment operations | 6.02 | 1.94 | 3.05 | 1.50 | (7.24) |
Distributions from net investment income | (.47) | (.38) | (.22) | (.13) | (.23) |
Distributions from net realized gain | (.03) | (.01) | - | (.01) | (.03) |
Total distributions | (.50) | (.39) | (.22) | (.14) F | (.26) |
Net asset value, end of period | $ 25.64 | $ 20.12 | $ 18.57 | $ 15.74 | $ 14.38 |
Total Return A | 30.28% | 10.66% | 19.40% | 10.41% | (33.12)% |
Ratios to Average Net Assets C, E | | | | |
Expenses before reductions | .53% | .54% | .54% | .54% | .56% |
Expenses net of fee waivers, if any | .53% | .54% | .54% | .54% | .56% |
Expenses net of all reductions | .52% | .54% | .53% | .53% | .55% |
Net investment income (loss) | 2.19% | 2.13% | 1.27% | .84% | 1.29% |
Supplemental Data | | | | |
Net assets, end of period (in millions) | $ 1,016 | $ 752 | $ 403 | $ 292 | $ 349 |
Portfolio turnover rate D | 49% | 62% | 129% | 98% | 122% |
A Total returns would have been lower if certain expenses had not been reduced during the applicable periods shown.
B Calculated based on average shares outstanding during the period.
C Fees and expenses of any underlying Fidelity Central Funds are not included in the Fund's expense ratio. The Fund indirectly bears its proportionate share of the expenses of any underlying Fidelity Central Funds.
D Amount does not include the portfolio activity of any underlying Fidelity Central Funds.
E Expense ratios reflect operating expenses of the class. Expenses before reductions do not reflect amounts reimbursed by the investment adviser or reductions from brokerage service arrangements or reductions from other expense offset arrangements and do not represent the amount paid by the class during periods when reimbursements or reductions occur. Expenses net of fee waivers reflect expenses after reimbursement by the investment adviser but prior to reductions from brokerage service arrangements or other expense offset arrangements. Expenses net of all reductions represent the net expenses paid by the class.
F Total distributions of $.14 per share is comprised of distributions from net investment income of $.129 and distributions from net realized gain of $.008 per share.
See accompanying notes which are an integral part of the financial statements.
Annual Report
Notes to Financial Statements
For the period ended July 31, 2013
(Amounts in thousands except percentages)
1. Organization.
Fidelity Growth & Income Portfolio (the Fund) is a fund of Fidelity Securities Fund (the Trust) and is authorized to issue an unlimited number of shares. The Trust is registered under the Investment Company Act of 1940, as amended (the 1940 Act), as an open-end management investment company organized as a Massachusetts business trust. The Fund offers Growth & Income and Class K, each of which, has equal rights as to assets and voting privileges. Each class has exclusive voting rights with respect to matters that affect that class.
2. Investments in Fidelity Central Funds.
The Fund invests in Fidelity Central Funds, which are open-end investment companies generally available only to other investment companies and accounts managed by Fidelity Management & Research Company (FMR) and its affiliates. The Fund's Schedule of Investments lists each of the Fidelity Central Funds held as of period end, if any, as an investment of the Fund, but does not include the underlying holdings of each Fidelity Central Fund. As an Investing Fund, the Fund indirectly bears its proportionate share of the expenses of the underlying Fidelity Central Funds.
The Money Market Central Funds seek preservation of capital and current income and are managed by Fidelity Investments Money Management, Inc. (FIMM), an affiliate of FMR.
A complete unaudited list of holdings for each Fidelity Central Fund is available upon request or at the Securities and Exchange Commission (the SEC) website at www.sec.gov. In addition, the financial statements of the Fidelity Central Funds, which are not covered by the Fund's Report of Independent Registered Public Accounting Firm, are available on the SEC website or upon request.
3. Significant Accounting Policies.
The financial statements have been prepared in conformity with accounting principles generally accepted in the United States of America (GAAP), which require management to make certain estimates and assumptions at the date of the financial statements. Actual results could differ from those estimates. Subsequent events, if any, through the date that the financial statements were issued have been evaluated in the preparation of the financial statements. The following summarizes the significant accounting policies of the Fund:
Annual Report
Notes to Financial Statements - continued
(Amounts in thousands except percentages)
3. Significant Accounting Policies - continued
Investment Valuation. Investments are valued as of 4:00 p.m. Eastern time on the last calendar day of the period. In accordance with valuation policies and procedures approved by the Board of Trustees (the Board), the Fund attempts to obtain prices from one or more third party pricing vendors or brokers to value its investments. When current market prices, quotations or currency exchange rates are not readily available or reliable, investments will be fair valued in good faith by the FMR Fair Value Committee (the Committee), in accordance with procedures adopted by the Board. Factors used in determining fair value vary by investment type and may include market or investment specific events, changes in interest rates and credit quality. The frequency with which these procedures are used cannot be predicted and they may be utilized to a significant extent. The Committee oversees the Fund's valuation policies and procedures and is responsible for approving and reporting to the Board all fair value determinations.
The Fund categorizes the inputs to valuation techniques used to value its investments into a disclosure hierarchy consisting of three levels as shown below:
Level 1 - quoted prices in active markets for identical investments
Level 2 - other significant observable inputs (including quoted prices for similar investments, interest rates, prepayment speeds, etc.)
Level 3 - unobservable inputs (including the Fund's own assumptions based on the best information available)
Valuation techniques used to value the Fund's investments by major category are as follows:
Equity securities, including restricted securities, for which market quotations are readily available, are valued at the last reported sale price or official closing price as reported by a third party pricing vendor on the primary market or exchange on which they are traded and are categorized as Level 1 in the hierarchy. In the event there were no sales during the day or closing prices are not available, securities are valued at the last quoted bid price or may be valued using the last available price and are generally categorized as Level 2 in the hierarchy. For foreign equity securities, when market or security specific events arise, comparisons to the valuation of American Depositary Receipts (ADRs), futures contracts, Exchange-Traded Funds (ETFs) and certain indexes as well as quoted prices for similar securities may be used and would be categorized as Level 2 in the hierarchy. Utilizing these techniques may result in transfers between Level 1 and Level 2. For restricted equity securities and private placements where observable inputs are limited, assumptions about market activity and risk are used and these securities are generally categorized as Level 3 in the hierarchy.
Annual Report
3. Significant Accounting Policies - continued
Investment Valuation - continued
Debt securities, including restricted securities, are valued based on evaluated prices received from third party pricing vendors or from brokers who make markets in such securities. For corporate bonds, pricing vendors utilize matrix pricing which considers yield or price of bonds of comparable quality, coupon, maturity and type as well as broker-supplied prices. When independent prices are unavailable or unreliable, debt securities may be valued utilizing pricing methodologies which consider similar factors that would be used by third party pricing vendors. Debt securities are generally categorized as Level 2 in the hierarchy but may be Level 3 depending on the circumstances.
Investments in open-end mutual funds, including the Fidelity Central Funds, are valued at their closing net asset value (NAV) each business day and are categorized as Level 1 in the hierarchy.
Changes in valuation techniques may result in transfers in or out of an assigned level within the disclosure hierarchy. The aggregate value of investments by input level, as of July 31, 2013 is included at the end of the Fund's Schedule of Investments.
Foreign Currency. The Fund may use foreign currency contracts to facilitate transactions in foreign-denominated securities. Gains and losses from these transactions may arise from changes in the value of the foreign currency or if the counterparties do not perform under the contracts' terms.
Foreign-denominated assets, including investment securities, and liabilities are translated into U.S. dollars at the exchange rates at period end. Purchases and sales of investment securities, income and dividends received and expenses denominated in foreign currencies are translated into U.S. dollars at the exchange rate in effect on the transaction date.
The effects of exchange rate fluctuations on investments are included with the net realized and unrealized gain (loss) on investment securities. Other foreign currency transactions resulting in realized and unrealized gain (loss) are disclosed separately.
Investment Transactions and Income. For financial reporting purposes, the Fund's investment holdings and NAV include trades executed through the end of the last business day of the period. The NAV per share for processing shareholder transactions is calculated as of the close of business of the New York Stock Exchange (NYSE), normally 4:00 p.m. Eastern time and includes trades executed through the end of the prior business day. Gains and losses on securities sold are determined on the basis of identified cost and may include proceeds received from litigation. Dividend income is recorded on the ex-dividend date, except for certain dividends from foreign securities where the ex-dividend date may have passed, which are recorded as soon as the Fund is informed of
Annual Report
Notes to Financial Statements - continued
(Amounts in thousands except percentages)
3. Significant Accounting Policies - continued
Investment Transactions and Income - continued
the ex-dividend date. Non-cash dividends included in dividend income, if any, are recorded at the fair market value of the securities received. Distributions received on securities that represent a return of capital or capital gain are recorded as a reduction of cost of investments and/or as a realized gain. Subsequent to ex-dividend date the Fund determines the components of these distributions, based upon receipt of tax filings or other correspondence relating to the underlying investment. Interest income and distributions from the Fidelity Central Funds are accrued as earned. Interest income includes coupon interest and amortization of premium and accretion of discount on debt securities. Investment income is recorded net of foreign taxes withheld where recovery of such taxes is uncertain.
Class Allocations and Expenses. Investment income, realized and unrealized capital gains and losses, common expenses of the Fund, and certain fund-level expense reductions, if any, are allocated on a pro-rata basis to each class based on the relative net assets of each class to the total net assets of the Fund. Each class differs with respect to transfer agent fees incurred. Certain expense reductions may also differ by class. Expenses directly attributable to a fund are charged to that fund. Expenses attributable to more than one fund are allocated among the respective funds on the basis of relative net assets or other appropriate methods. Expense estimates are accrued in the period to which they relate and adjustments are made when actual amounts are known.
Deferred Trustee Compensation. Under a Deferred Compensation Plan (the Plan), independent Trustees may elect to defer receipt of a portion of their annual compensation. Deferred amounts are invested in a cross-section of Fidelity funds, are marked-to-market and remain in the Fund until distributed in accordance with the Plan. The investment of deferred amounts and the offsetting payable to the Trustees are included in the accompanying Statement of Assets and Liabilities.
Income Tax Information and Distributions to Shareholders. Each year, the Fund intends to qualify as a regulated investment company under Subchapter M of the Internal Revenue Code, including distributing substantially all of its taxable income and realized gains. As a result, no provision for income taxes is required. As of July 31, 2013, the Fund did not have any unrecognized tax benefits in the financial statements; nor is the Fund aware of any tax positions for which it is reasonably possible that the total amounts of unrecognized tax benefits will significantly change in the next twelve months. The Fund files a U.S. federal tax return, in addition to state and local tax returns as required. A fund's federal income tax returns are subject to examination by the Internal Revenue Service (IRS) for a period of three fiscal years after they are filed. State and local tax returns may be subject to examination for an additional fiscal year
Annual Report
3. Significant Accounting Policies - continued
Income Tax Information and Distributions to Shareholders - continued
depending on the jurisdiction. Foreign taxes are provided for based on the Fund's understanding of the tax rules and rates that exist in the foreign markets in which it invests.
Distributions are declared and recorded on the ex-dividend date. Income dividends and capital gain distributions are declared separately for each class. Income and capital gain distributions are determined in accordance with income tax regulations, which may differ from GAAP.
Capital accounts within the financial statements are adjusted for permanent book-tax differences. These adjustments have no impact on net assets or the results of operations. Temporary book-tax differences will reverse in a subsequent period.
Book-tax differences are primarily due to foreign currency transactions, market discount, partnerships, equity-debt classifications, deferred trustees compensation, capital loss carryforwards and losses deferred due to wash sales.
The federal tax cost of investment securities and unrealized appreciation (depreciation) as of period end were as follows:
Gross unrealized appreciation | $ 1,452,215 |
Gross unrealized depreciation | (52,037) |
Net unrealized appreciation (depreciation) on securities and other investments | $ 1,400,178 |
| |
Tax Cost | $ 5,679,400 |
The tax-based components of distributable earnings as of period end were as follows:
Undistributed ordinary income | $ 9,160 |
Capital loss carryforward | $ (4,250,317) |
Net unrealized appreciation (depreciation) | $ 1,400,180 |
Capital loss carryforwards are only available to offset future capital gains of the Fund to the extent provided by regulations and may be limited. Under the Regulated Investment Company Modernization Act of 2010 (the Act), the Fund is permitted to carry forward capital losses incurred in taxable years beginning after December 22, 2010 for an unlimited period and such capital losses are required to be used prior to any losses that expire.
Annual Report
Notes to Financial Statements - continued
(Amounts in thousands except percentages)
3. Significant Accounting Policies - continued
Income Tax Information and Distributions to Shareholders - continued
The capital loss carryforward information presented below, including any applicable limitation, is estimated as of fiscal period end and is subject to adjustment.
Fiscal year of expiration | |
2017 | $ (1,081,976) |
2018 | (3,168,341) |
Total capital loss carryforward | $ (4,250,317) |
The tax character of distributions paid was as follows:
| July 31, 2013 | July 31, 2012 |
Ordinary Income | $ 128,047 | $ 101,152 |
Restricted Securities. The Fund may invest in securities that are subject to legal or contractual restrictions on resale. These securities generally may be resold in transactions exempt from registration or to the public if the securities are registered. Disposal of these securities may involve time-consuming negotiations and expense, and prompt sale at an acceptable price may be difficult. Information regarding restricted securities is included at the end of the Fund's Schedule of Investments.
4. Purchases and Sales of Investments.
Purchases and sales of securities, other than short-term securities, aggregated $3,006,067 and $2,972,293, respectively.
5. Fees and Other Transactions with Affiliates.
Management Fee. FMR and its affiliates provide the Fund with investment management related services for which the Fund pays a monthly management fee. The management fee is the sum of an individual fund fee rate that is based on an annual rate of .20% of the Fund's average net assets and an annualized group fee rate that averaged .26% during the period. The group fee rate is based upon the average net assets of all the mutual funds advised by FMR. The group fee rate decreases as assets under management increase and increases as assets under management decrease. For the period, the total annual management fee rate was .46% of the Fund's average net assets.
Transfer Agent Fees. Fidelity Investments Institutional Operations Company, Inc., (FIIOC), an affiliate of FMR, is the transfer, dividend disbursing and shareholder servicing agent for each class of the Fund. FIIOC receives account fees and asset-based fees that vary according to the account size and type of account of the shareholders of Growth
Annual Report
5. Fees and Other Transactions with Affiliates - continued
Transfer Agent Fees - continued
& Income. FIIOC receives an asset-based fee of Class K's average net assets. FIIOC pays for typesetting, printing and mailing of shareholder reports, except proxy statements. For the period, transfer agent fees for each class were as follows:
| Amount | % of
Average
Net Assets |
Growth and Income | $ 10,471 | .20 |
Class K | 435 | .05 |
| $ 10,906 | |
Accounting and Security Lending Fees. Fidelity Service Company, Inc. (FSC), an affiliate of FMR, maintains the Fund's accounting records. The accounting fee is based on the level of average net assets for each month. Under a separate contract, FSC administers the security lending program. The security lending fee is based on the number and duration of lending transactions.
Brokerage Commissions. The Fund placed a portion of its portfolio transactions with brokerage firms which are affiliates of the investment adviser. Brokerage commissions are included in net realized gain (loss) and change in net unrealized appreciation (depreciation) in the Statement of Operations. The commissions paid to these affiliated firms were $110 for the period.
Interfund Lending Program. Pursuant to an Exemptive Order issued by the SEC, the Fund, along with other registered investment companies having management contracts with FMR, may participate in an interfund lending program. This program provides an alternative credit facility allowing the funds to borrow from, or lend money to, other participating affiliated funds. The Fund's activity in this program during the period for which loans were outstanding was as follows:
Borrower or Lender | Average Loan
Balance | Weighted Average
Interest Rate | Interest
Expense |
Borrower | $ 7,764 | .39% | $ 2 |
6. Committed Line of Credit.
The Fund participates with other funds managed by FMR or an affiliate in a $4.25 billion credit facility (the "line of credit") to be utilized for temporary or emergency purposes to fund shareholder redemptions or for other short-term liquidity purposes. The Fund has agreed to pay commitment fees on its pro-rata portion of the line of credit, which
Annual Report
Notes to Financial Statements - continued
(Amounts in thousands except percentages)
6. Committed Line of Credit - continued
amounted to $14 and is reflected in Miscellaneous expenses on the Statement of Operations. During the period, there were no borrowings on this line of credit.
7. Security Lending.
The Fund lends portfolio securities through a lending agent from time to time in order to earn additional income. For equity securities, a lending agent is used and may loan securities to certain qualified borrowers, including Fidelity Capital Markets (FCM), a broker-dealer affiliated with the Fund. On the settlement date of the loan, the Fund receives collateral (in the form of U.S. Treasury obligations, letters of credit and/or cash) against the loaned securities and maintains collateral in an amount not less than 100% of the market value of the loaned securities during the period of the loan. The market value of the loaned securities is determined at the close of business of the Fund and any additional required collateral is delivered to the Fund on the next business day. If the borrower defaults on its obligation to return the securities loaned because of insolvency or other reasons, the Fund may apply collateral received from the borrower against the obligation. The Fund may experience delays and costs in recovering the securities loaned. Any cash collateral received is invested in the Fidelity Securities Lending Cash Central Fund. The value of loaned securities and cash collateral at period end are disclosed on the Fund's Statement of Assets and Liabilities. Security lending income represents the income earned on investing cash collateral, less rebates paid to borrowers and any lending agent fees associated with the loan, plus any premium payments received for lending certain types of securities. Security lending income is presented in the Statement of Operations as a component of income from Fidelity Central Funds. Total security lending income during the period amounted to $476, including $9 from securities loaned to FCM.
8. Expense Reductions.
Commissions paid to certain brokers with whom FMR places trades on behalf of the Fund include an amount in addition to trade execution, which is rebated back to the Fund to offset certain expenses. This amount totaled $666 for the period. Through arrangements with the Fund's custodian, credits realized as a result of uninvested cash balances were used to reduce the Fund's expenses. During the period, these credits reduced the Fund's custody expenses by three hundred sixty-six dollars.
In addition, FMR reimbursed a portion of the Fund's operating expenses during the period in the amount of $12.
Annual Report
9. Distributions to Shareholders.
Distributions to shareholders of each class were as follows:
Years ended July 31, | 2013 | 2012 |
From net investment income | | |
Growth and Income | $ 102,417 | $ 87,366 |
Class K | 18,247 | 10,987 |
Total | $ 120,664 | $ 98,353 |
From net realized gain | | |
Growth and Income | $ 6,339 | $ 2,563 |
Class K | 1,044 | 236 |
Total | $ 7,383 | $ 2,799 |
10. Share Transactions.
Transactions for each class of shares were as follows:
| Shares | Dollars |
Years ended July 31, | 2013 | 2012 | 2013 | 2012 |
Growth and Income | | | | |
Shares sold | 29,843 | 21,066 | $ 688,591 | $ 402,515 |
Reinvestment of distributions | 4,672 | 4,651 | 104,347 | 86,309 |
Shares redeemed | (39,833) | (56,062) | (885,644) | (1,053,524) |
Net increase (decrease) | (5,318) | (30,345) | $ (92,706) | $ (564,700) |
Class K | | | | |
Shares sold | 11,165 | 20,227 | $ 248,185 | $ 386,187 |
Reinvestment of distributions | 863 | 596 | 19,291 | 11,223 |
Shares redeemed | (9,761) | (5,182) | (217,301) | (97,733) |
Net increase (decrease) | 2,267 | 15,641 | $ 50,175 | $ 299,677 |
11. Other.
The Fund's organizational documents provide former and current trustees and officers with a limited indemnification against liabilities arising in connection with the performance of their duties to the Fund. In the normal course of business, the Fund may also enter into contracts that provide general indemnifications. The Fund's maximum exposure under these arrangements is unknown as this would be dependent on future claims that may be made against the Fund. The risk of material loss from such claims is considered remote.
Annual Report
To the Trustees of Fidelity Securities Fund and the Shareholders of Fidelity Growth & Income Portfolio:
In our opinion, the accompanying statement of assets and liabilities, including the schedule of investments, and the related statements of operations and of changes in net assets and the financial highlights present fairly, in all material respects, the financial position of Fidelity Growth & Income Portfolio (a fund of Fidelity Securities Fund) at July 31, 2013, the results of its operations for the year then ended, the changes in its net assets for each of the two years in the period then ended and the financial highlights for each of the five years in the period then ended, in conformity with accounting principles generally accepted in the United States of America. These financial statements and financial highlights (hereafter referred to as "financial statements") are the responsibility of the Fidelity Growth & Income Portfolio's management. Our responsibility is to express an opinion on these financial statements based on our audits. We conducted our audits of these financial statements in accordance with the standards of the Public Company Accounting Oversight Board (United States). Those standards require that we plan and perform the audit to obtain reasonable assurance about whether the financial statements are free of material misstatement. An audit includes examining, on a test basis, evidence supporting the amounts and disclosures in the financial statements, assessing the accounting principles used and significant estimates made by management, and evaluating the overall financial statement presentation. We believe that our audits, which included confirmation of securities at July 31, 2013 by correspondence with the custodian and brokers, provide a reasonable basis for our opinion.
PricewaterhouseCoopers LLP
Boston, Massachusetts
September 11, 2013
Annual Report
The Trustees, Member of the Advisory Board, and executive officers of the trust and fund, as applicable, are listed below. The Board of Trustees governs the fund and is responsible for protecting the interests of shareholders. The Trustees are experienced executives who meet periodically throughout the year to oversee the fund's activities, review contractual arrangements with companies that provide services to the fund, oversee management of the risks associated with such activities and contractual arrangements, and review the fund's performance. Except for James C. Curvey, Ned C. Lautenbach, Ronald P. O'Hanley, and William S. Stavropoulos, each of the Trustees oversees 166 Fidelity funds. Mr. Curvey oversees 387 Fidelity funds. Mr. Lautenbach, Mr. O'Hanley, and Mr. Stavropoulos each oversees 230 Fidelity funds.
The Trustees hold office without limit in time except that (a) any Trustee may resign; (b) any Trustee may be removed by written instrument, signed by at least two-thirds of the number of Trustees prior to such removal; (c) any Trustee who requests to be retired or who has become incapacitated by illness or injury may be retired by written instrument signed by a majority of the other Trustees; and (d) any Trustee may be removed at any special meeting of shareholders by a two-thirds vote of the outstanding voting securities of the trust. Each Trustee who is not an interested person of the trust and the fund (as defined in the 1940 Act) (Independent Trustee), shall retire not later than the last day of the calendar year in which his or her 75th birthday occurs. The Independent Trustees may waive this mandatory retirement age policy with respect to individual Trustees. The executive officers and Advisory Board Member hold office without limit in time, except that any officer and Advisory Board Member may resign or may be removed by a vote of a majority of the Trustees at any regular meeting or any special meeting of the Trustees. Except as indicated, each individual has held the office shown or other offices in the same company for the past five years.
Experience, Skills, Attributes, and Qualifications of the Fund's Trustees. The Governance and Nominating Committee has adopted a statement of policy that describes the experience, qualifications, attributes, and skills that are necessary and desirable for potential Independent Trustee candidates (Statement of Policy). The Board believes that each Trustee satisfied at the time he or she was initially elected or appointed a Trustee, and continues to satisfy, the standards contemplated by the Statement of Policy. The Governance and Nominating Committee also engages professional search firms to help identify potential Independent Trustee candidates who have the experience, qualifications, attributes, and skills consistent with the Statement of Policy. From time to time, additional criteria based on the composition and skills of the current Independent Trustees, as well as experience or skills that may be appropriate in light of future changes to board composition, business conditions, and regulatory or other developments, have also been considered by the professional search firms and the Governance and Nominating Committee. In addition, the Board takes into account the Trustees' commitment and participation in Board and committee meetings, as well as their leadership of standing and ad hoc committees throughout their tenure.
Annual Report
In determining that a particular Trustee was and continues to be qualified to serve as a Trustee, the Board has considered a variety of criteria, none of which, in isolation, was controlling. The Board believes that, collectively, the Trustees have balanced and diverse experience, qualifications, attributes, and skills, which allow the Board to operate effectively in governing the fund and protecting the interests of shareholders. Information about the specific experience, skills, attributes, and qualifications of each Trustee, which in each case led to the Board's conclusion that the Trustee should serve (or continue to serve) as a trustee of the fund, is provided below.
Board Structure and Oversight Function. James C. Curvey is an interested person (as defined in the 1940 Act) and currently serves as Chairman. The Trustees have determined that an interested Chairman is appropriate and benefits shareholders because an interested Chairman has a personal and professional stake in the quality and continuity of services provided to the fund. Independent Trustees exercise their informed business judgment to appoint an individual of their choosing to serve as Chairman, regardless of whether the Trustee happens to be independent or a member of management. The Independent Trustees have determined that they can act independently and effectively without having an Independent Trustee serve as Chairman and that a key structural component for assuring that they are in a position to do so is for the Independent Trustees to constitute a substantial majority for the Board. The Independent Trustees also regularly meet in executive session. Ned C. Lautenbach serves as Chairman of the Independent Trustees and as such (i) acts as a liaison between the Independent Trustees and management with respect to matters important to the Independent Trustees and (ii) with management prepares agendas for Board meetings.
Fidelity funds are overseen by different Boards of Trustees. The fund's Board oversees Fidelity's equity and high income funds and another Board oversees Fidelity's investment-grade bond, money market, and asset allocation funds. The asset allocation funds may invest in Fidelity funds overseen by the fund's Board. The use of separate Boards, each with its own committee structure, allows the Trustees of each group of Fidelity funds to focus on the unique issues of the funds they oversee, including common research, investment, and operational issues. On occasion, the separate Boards establish joint committees to address issues of overlapping consequences for the Fidelity funds overseen by each Board.
The Trustees operate using a system of committees to facilitate the timely and efficient consideration of all matters of importance to the Trustees, the fund, and fund shareholders and to facilitate compliance with legal and regulatory requirements and oversight of the fund's activities and associated risks. The Board, acting through its committees, has charged FMR and its affiliates with (i) identifying events or circumstances the occurrence of which could have demonstrably adverse effects on the fund's business and/or reputation; (ii) implementing processes and controls to lessen the possibility that such events or circumstances occur or to mitigate the effects of such events or circumstances if they do occur; and (iii) creating and maintaining a system designed to evaluate continuously business and market conditions in order to facilitate the identification and implementation processes described in (i) and (ii) above. Because the day-to-day operations and activities of the fund are carried out by or through FMR, its affiliates and other service providers, the fund's exposure to risks is mitigated but not eliminated by the processes overseen by the Trustees. While each of the Board's committees has responsibility for overseeing different aspects of the fund's activities, oversight is exercised primarily through the Operations, Audit, and Compliance Committees. In addition, the Independent Trustees have worked with FMR to enhance the Board's oversight of investment and financial risks, legal and regulatory risks, technology risks, and operational risks, including the development of additional risk reporting to the Board. For example, a working group comprised of Independent Trustees and FMR has worked and continues to work to review the Fidelity funds' valuation-related activities, reporting and risk management. Appropriate personnel, including but not limited to the fund's Chief Compliance Officer (CCO), FMR's internal auditor, the independent accountants, the fund's Treasurer and portfolio management personnel, make periodic reports to the Board's committees, as appropriate, including an annual review of FMR's risk management program for the Fidelity funds. The responsibilities of each standing committee, including their oversight responsibilities, are described further under "Standing Committees of the Fund's Trustees."
Annual Report
Trustees and Officers - continued
The fund's Statement of Additional Information (SAI) includes more information about the Trustees. To request a free copy, call Fidelity at 1-800-835-5092.
Interested Trustees*:
Correspondence intended for each Trustee who is an interested person may be sent to Fidelity Investments, 245 Summer Street, Boston, Massachusetts 02210.
Name, Year of Birth; Principal Occupations and Other Relevant Experience+ |
James C. Curvey (1935) |
| Year of Election or Appointment: 2007 Mr. Curvey is Trustee and Chairman of the Board of Trustees of certain Trusts. Mr. Curvey also serves as Trustee (2007-present) of other investment companies advised by FMR. Mr. Curvey is a Director of Fidelity Investments Money Management, Inc. (2009-present), Director of Fidelity Research & Analysis Co. (2009-present) and Director of FMR and FMR Co., Inc. (2007-present). Mr. Curvey is also Vice Chairman (2007-present) and Director of FMR LLC. In addition, Mr. Curvey serves as an Overseer for the Boston Symphony Orchestra and a member of the Trustees of Villanova University. Previously, Mr. Curvey was the Vice Chairman (2006-2007) and Director (2000-2007) of FMR Corp. |
Ronald P. O'Hanley (1957) |
| Year of Election or Appointment: 2011 Mr. O'Hanley serves as a Trustee and Chairman of the Board of Trustees of other Fidelity funds (2013-present), and is Director of FMR Co., Inc. (2010-present), Director of Fidelity Investments Money Management, Inc. (2010-present), Director of Fidelity Research & Analysis Company (2010-present), President of Fidelity Asset Management and Corporate Services and a Member of Fidelity's Executive Committee (2010-present). Previously, Mr. O'Hanley served as President and Chief Executive Officer of BNY Mellon Asset Management (2007-2010). Mr. O'Hanley also served as Vice Chairman of Bank New York Mellon Corp. and a member of that firm's Executive Committee. Prior to the 2007 merger of The Bank of New York and Mellon Financial Corporation, he was Vice Chairman of Mellon Financial Corporation and President and Chief Executive Officer of Mellon Asset Management. He joined Mellon in February 1997. Mr. O'Hanley currently serves as Chairman of the Boston Public Library Foundation Board of Directors and sits on the Board of Directors of Beth Israel Deaconess Medical Center, the Board of Trustees of the Marine Biological Laboratory and the Advisory Board of the Maxwell School of Citizenship and Public Administration at Syracuse University. Mr. O'Hanley also chairs the Council on Asset Management for the Financial Services Roundtable and is a member of the Board of Directors of Institutional Investor's U.S. Institute. |
* Trustees have been determined to be "Interested Trustees" by virtue of, among other things, their affiliation with the trust or various entities under common control with FMR.
+ The information above includes each Trustee's principal occupation during the last five years and other information relating to the experience, attributes, and skills relevant to each Trustee's qualifications to serve as a Trustee, which led to the conclusion that each Trustee should serve as a Trustee for the fund.
Annual Report
Trustees and Officers - continued
Independent Trustees:
Correspondence intended for each Independent Trustee (that is, the Trustees other than the Interested Trustees) may be sent to Fidelity Investments, P.O. Box 55235, Boston, Massachusetts 02205-5235.
Name, Year of Birth; Principal Occupations and Other Relevant Experience+ |
Dennis J. Dirks (1948) |
| Year of Election or Appointment: 2005 Prior to his retirement in May 2003, Mr. Dirks was Chief Operating Officer and a member of the Board of The Depository Trust & Clearing Corporation (DTCC). He also served as President, Chief Operating Officer, and Board member of The Depository Trust Company (DTC) and President and Board member of the National Securities Clearing Corporation (NSCC). In addition, Mr. Dirks served as Chief Executive Officer and Board member of the Government Securities Clearing Corporation, Chief Executive Officer and Board member of the Mortgage-Backed Securities Clearing Corporation, as a Trustee and a member of the Finance Committee of Manhattan College (2005-2008), and as a Trustee and a member of the Finance Committee of AHRC of Nassau County (2006-2008). Mr. Dirks is a member of the Independent Directors Council (IDC) Governing Council (2010-present) and Board of Directors for The Brookville Center for Children's Services, Inc. (2009-present). |
Alan J. Lacy (1953) |
| Year of Election or Appointment: 2008 Mr. Lacy serves as Senior Adviser (2007-present) of Oak Hill Capital Partners, L.P. (private equity). Mr. Lacy also served as Chief Executive Officer (2000-2005) and Vice Chairman (2005-2006) of Sears Holdings Corporation and Sears, Roebuck and Co. (retail). In addition, Mr. Lacy serves as a member of the Board of Directors of Dave & Buster's Entertainment, Inc. (restaurant and entertainment complexes, 2010-present), Earth Fare, Inc. (retail grocery, 2012-present), The Hillman Companies, Inc. (hardware wholesalers, 2010-present), and Bristol-Myers Squibb Company (global pharmaceuticals, 2008-present). Mr. Lacy is a member of the Board of Trustees of The National Parks Conservation Association (2006-present). Previously, Mr. Lacy served as Chairman of the Board of Trustees of the National Parks Conservation Association (2008-2011) and as a member of the Board of Directors for the Western Union Company (global money transfer, 2006-2011). |
Ned C. Lautenbach (1944) |
| Year of Election or Appointment: 2000 Mr. Lautenbach is Chairman of the Independent Trustees of the Equity and High Income Funds (2006-present) and serves as a Trustee of other Fidelity funds (2013-present). Mr. Lautenbach currently serves as the Lead Director of the Eaton Corporation Board of Directors (diversified industrial, 1997-present). Mr. Lautenbach is Chairman of the Board of Directors of the Philharmonic Center for the Arts in Naples, Florida (2012-present) and a member of the Council on Foreign Relations (1994-present). Previously, Mr. Lautenbach was a Partner/Advisory Partner at Clayton, Dubilier & Rice, LLC (private equity investment, 1998-2010), as well as a Director of Sony Corporation (2006-2007). |
Joseph Mauriello (1944) |
| Year of Election or Appointment: 2008 Prior to his retirement in January 2006, Mr. Mauriello served in numerous senior management positions including Deputy Chairman and Chief Operating Officer (2004-2005), and Vice Chairman of Financial Services (2002-2004) of KPMG LLP US (professional services, 1965-2005). Mr. Mauriello currently serves as a member of the Board of Directors of XL Group plc. (global insurance and re-insurance, 2006-present). Previously, Mr. Mauriello served as a Director of the Hamilton Funds of the Bank of New York (2006-2007) and of Arcadia Resources Inc. (health care services and products, 2007-2012). |
Robert W. Selander (1950) |
| Year of Election or Appointment: 2011 Previously, Mr. Selander served as a Member of the Advisory Board of Fidelity's Equity and High Income Funds (2011), Executive Vice Chairman (2010), Chief Executive Officer (2009-2010), and President and Chief Executive Officer (1997-2009) of Mastercard, Inc. |
Cornelia M. Small (1944) |
| Year of Election or Appointment: 2005 Ms. Small is a member of the Board of Directors (2009-present) and Chair of the Investment Committee (2010-present) of the Teagle Foundation. Ms. Small also serves on the Investment Committee of the Berkshire Taconic Community Foundation (2008-present). Previously, Ms. Small served as Chairperson (2002-2008) and a member of the Investment Committee and Chairperson (2008-2012) and a member of the Board of Trustees of Smith College. In addition, Ms. Small served as Chief Investment Officer, Director of Global Equity Investments, and a member of the Board of Directors of Scudder, Stevens & Clark and Scudder Kemper Investments. |
William S. Stavropoulos (1939) |
| Year of Election or Appointment: 2002 Mr. Stavropoulos is Vice Chairman of the Independent Trustees of the Equity and High Income Funds (2006-present) and serves as a Trustee of other Fidelity funds (2013-present). Mr. Stavropoulos serves as President and Founder of the Michigan Baseball Foundation, the Great Lakes Loons (2007-present). Mr. Stavropoulos is Chairman Emeritus of the Board of Directors of The Dow Chemical Company, where he previously served in numerous senior management positions, including President, CEO (1995-2000; 2002-2004), Chairman of the Executive Committee (2000-2006), and as a member of the Board of Directors (1990-2006). Currently, Mr. Stavropoulos is Chairman of the Board of Directors of Univar Inc. (global distributor of commodity and specialty chemicals), a Director of Teradata Corporation (data warehousing and technology solutions), and Maersk Inc. (industrial conglomerate), and a member of the Advisory Board for Metalmark Capital LLC (private equity investment, 2005-present). Mr. Stavropoulos is an operating advisor to Clayton, Dubilier & Rice, LLC (private equity investment). In addition, Mr. Stavropoulos is a member of the University of Notre Dame Advisory Council for the College of Science, a Trustee of the Rollin L. Gerstacker Foundation, and a Director of the Naples Philharmonic Center for the Arts. Previously, Mr. Stavropoulos served as a Director of Chemical Financial Corporation (bank holding company, 1993-2012) and Tyco International, Ltd. (multinational manufacturing and services, 2007-2012). |
David M. Thomas (1949) |
| Year of Election or Appointment: 2008 Previously, Mr. Thomas served as Executive Chairman (2005-2006) and Chairman and Chief Executive Officer (2000-2005) of IMS Health, Inc. (pharmaceutical and healthcare information solutions), and a Director of Fortune Brands, Inc. (consumer products, 2000-2011). In addition, Mr. Thomas serves as Non-Executive Chairman of the Board of Directors of Fortune Brands Home and Security (home and security products, 2011-present), and as a member of the Board of Directors of Interpublic Group of Companies, Inc. (marketing communication, 2004-present). |
+ The information above includes each Trustee's principal occupation during the last five years and other information relating to the experience, attributes, and skills relevant to each Trustee's qualifications to serve as a Trustee, which led to the conclusion that each Trustee should serve as a Trustee for the fund.
Annual Report
Advisory Board Member and Executive Officers:
Correspondence intended for each executive officer and Peter S. Lynch may be sent to Fidelity Investments, 245 Summer Street, Boston, Massachusetts 02210.
Name, Year of Birth; Principal Occupation |
Peter S. Lynch (1944) |
| Year of Election or Appointment: 2003 Member of the Advisory Board of Fidelity's Equity and High Income Funds. Mr. Lynch is Vice Chairman and a Director of FMR and FMR Co., Inc. In addition, Mr. Lynch serves as a Trustee of Boston College and as the Chairman of the Inner-City Scholarship Fund. Previously, Mr. Lynch served on the Special Olympics International Board of Directors (1997-2006). |
Kenneth B. Robins (1969) |
| Year of Election or Appointment: 2008 President and Treasurer of Fidelity's Equity and High Income Funds. Mr. Robins also serves as President and Treasurer (2008-present) and Assistant Treasurer (2009-present) of other Fidelity funds and is an employee of Fidelity Investments (2004-present). Mr. Robins serves as Executive Vice President of Fidelity Investments Money Management, Inc. (FIMM) (2013-present). Previously, Mr. Robins served as Deputy Treasurer of the Fidelity funds (2005-2008) and Treasurer and Chief Financial Officer of The North Carolina Capital Management Trust: Cash and Term Portfolios (2006-2008). |
Bruce T. Herring (1965) |
| Year of Election or Appointment: 2006 Vice President of certain Equity Funds. Mr. Herring also serves as Vice President of other Fidelity funds (2013-present), Chief Investment Officer of Fidelity Global Asset Allocation (GAA) (2013-present), Chief Investment Officer and Director of Fidelity Management & Research (U.K.) Inc. (2010-present), Group Chief Investment Officer of FMR, and President of Fidelity Research & Analysis Company (2010-present). Previously, Mr. Herring served as Vice President (2005-2006) and Senior Vice President (2006-2007) of Fidelity Management & Research Company, Vice President of FMR Co., Inc. (2001-2007) and as a portfolio manager for Fidelity U.S. Equity Funds. |
Brian B. Hogan (1964) |
| Year of Election or Appointment: 2009 Vice President of Equity and High Income Funds. Mr. Hogan also serves as Vice President of other Fidelity funds (2009-present) and President of FMR's Equity Division (2009-present). Previously, Mr. Hogan served as Senior Vice President, Equity Research of FMR (2006-2009) and as a portfolio manager. |
Scott C. Goebel (1968) |
| Year of Election or Appointment: 2008 Secretary and Chief Legal Officer (CLO) of the Fidelity funds. Mr. Goebel also serves as Secretary of Fidelity Investments Money Management, Inc. (FIMM) (2010-present) and Fidelity Research and Analysis Company (FRAC) (2010-present); Secretary and CLO of The North Carolina Capital Management Trust: Cash and Term Portfolios (2008-present); General Counsel, Secretary, and Senior Vice President of FMR (2008-present) and FMR Co., Inc. (2008-present); employed by FMR LLC or an affiliate (2001-present); Chief Legal Officer of Fidelity Management & Research (Hong Kong) Limited (2008-present) and Assistant Secretary of Fidelity Management & Research (Japan) Inc. (2008-present), and Fidelity Management & Research (U.K.) Inc. (2008-present). Previously, Mr. Goebel served as Assistant Secretary of FIMM (2008-2010), FRAC (2008-2010), and the Funds (2007-2008) and as Vice President and Secretary of Fidelity Distributors Corporation (FDC) (2005-2007). |
William C. Coffey (1969) |
| Year of Election or Appointment: 2009 Assistant Secretary of Fidelity's Equity and High Income Funds. Mr. Coffey also serves as Assistant Secretary of other Fidelity funds (2009-present), Senior Vice President and Deputy General Counsel of FMR LLC (2010-present), and is an employee of Fidelity Investments. Previously, Mr. Coffey served as Vice President and Associate General Counsel of FMR LLC (2005-2009). |
Elizabeth Paige Baumann (1968) |
| Year of Election or Appointment: 2012 Anti-Money Laundering (AML) Officer of the Fidelity funds. Ms. Baumann also serves as AML Officer of The North Carolina Capital Management Trust: Cash and Term Portfolios (2012-present), Chief AML Officer of FMR LLC (2012-present), and is an employee of Fidelity Investments. Previously, Ms. Baumann served as Vice President and Deputy Anti-Money Laundering Officer (2007-2012). |
Christine Reynolds (1958) |
| Year of Election or Appointment: 2008 Chief Financial Officer of the Fidelity funds. Ms. Reynolds became President of Fidelity Pricing and Cash Management Services (FPCMS) in August 2008. Ms. Reynolds served as Chief Operating Officer of FPCMS (2007-2008). Previously, Ms. Reynolds served as President, Treasurer, and Anti-Money Laundering officer of the Fidelity funds (2004-2007). |
Joseph A. Hanlon (1968) |
| Year of Election or Appointment: 2012 Chief Compliance Officer of Fidelity's Equity and High Income Funds. Mr. Hanlon also serves as Chief Compliance Officer of other Fidelity funds (2012-present). Mr. Hanlon serves as Compliance Officer of FMR, FMR Co., Inc., Fidelity Investments Money Management, Inc. (FIMM), Fidelity Research and Analysis Company (FRAC), and Fidelity Management & Research (Hong Kong) (2009-present), as Senior Vice President of the Fidelity Asset Management Division (2009-present), and is an employee of Fidelity Investments. Previously, Mr. Hanlon served as Compliance Officer of Fidelity Management & Research (Japan) Inc. (2009-2013), Strategic Advisers, Inc. (2009-2013), and Fidelity Management & Research (U.K.) Inc. (2009-2013). |
Joseph F. Zambello (1957) |
| Year of Election or Appointment: 2011 Deputy Treasurer of the Fidelity funds. Mr. Zambello is an employee of Fidelity Investments. Previously, Mr. Zambello served as Vice President of FMR's Program Management Group (2009-2011) and Vice President of the Transfer Agent Oversight Group (2005-2009). |
Adrien E. Deberghes (1967) |
| Year of Election or Appointment: 2008 Deputy Treasurer of Fidelity's Equity and High Income Funds. Mr. Deberghes also serves as Vice President (2011-present), Deputy Treasurer (2008-present), and Assistant Treasurer (2010-present) of other Fidelity funds, and is an employee of Fidelity Investments (2008-present). Previously, Mr. Deberghes served as Senior Vice President of Mutual Fund Administration at State Street Corporation (2007-2008), Senior Director of Mutual Fund Administration at Investors Bank & Trust (2005-2007), and Director of Finance for Dunkin' Brands (2000-2005). |
Stephen Sadoski (1971) |
| Year of Election or Appointment: 2012 Deputy Treasurer of Fidelity's Equity and High Income Funds. Mr. Sadoski also serves as Deputy Treasurer of other Fidelity funds (2012-present) and is an employee of Fidelity Investments (2012-present). Previously, Mr. Sadoski served as Assistant Treasurer of Fidelity's Fixed Income and Asset Allocation Funds (2012-2013), an assistant chief accountant in the Division of Investment Management of the Securities and Exchange Commission (SEC) (2009-2012) and as a senior manager at Deloitte & Touche LLP (1997-2009). |
Stacie M. Smith (1974) |
| Year of Election or Appointment: 2013 Deputy Treasurer of Fidelity's Equity and High Income Funds. Ms. Smith also serves as Deputy Treasurer of other Fidelity funds (2013-present) and is an employee of Fidelity Investments (2009-present). Previously, Ms. Smith served as Senior Audit Manager of Ernst & Young LLP (1996-2009). |
Stephanie J. Dorsey (1969) |
| Year of Election or Appointment: 2010 Assistant Treasurer of Fidelity's Equity and High Income Funds. Ms. Dorsey also serves as President and Treasurer (2013-present) and Assistant Treasurer (2010-present) of other Fidelity funds, Treasurer and Chief Financial Officer of The North Carolina Capital Management Trust: Cash and Term Portfolios (2013-present), and is an employee of Fidelity Investments (2008-present). Previously, Ms. Dorsey served as Deputy Treasurer of Fidelity's Fixed Income and Asset Allocation Funds (2008-2013), Treasurer (2004-2008) of the JPMorgan Mutual Funds and Vice President (2004-2008) of JPMorgan Chase Bank. |
Gary W. Ryan (1958) |
| Year of Election or Appointment: 2005 Assistant Treasurer of the Fidelity funds. Mr. Ryan is an employee of Fidelity Investments. Previously, Mr. Ryan served as Vice President of Fund Reporting in Fidelity Pricing and Cash Management Services (FPCMS) (1999-2005). |
Jonathan Davis (1968) |
| Year of Election or Appointment: 2010 Assistant Treasurer of the Fidelity funds. Mr. Davis is also Assistant Treasurer of Fidelity Rutland Square Trust II and Fidelity Commonwealth Trust II. Mr. Davis is an employee of Fidelity Investments. Previously, Mr. Davis served as Vice President and Associate General Counsel of FMR LLC (2003-2010). |
Annual Report
Class K designates 100%, 89%, 88%, 100% and 100% of the dividends distributed in September, October, December, April, July, respectively during the fiscal year as qualifying for the dividends-received deduction for corporate shareholders.
Class K designates 100% of the dividends distributed during the fiscal year as amounts which may be taken into account as a dividend for the purposes of the maximum rate under section 1(h)(11) of the Internal Revenue Code.
The fund will notify shareholders in January 2014 of amounts for use in preparing 2013 income tax returns.
Annual Report
Board Approval of Investment Advisory Contracts and Management Fees
Fidelity Growth & Income Portfolio
Each year, the Board of Trustees, including the Independent Trustees (together, the Board), votes on the renewal of the management contract and sub-advisory agreements (together, the Advisory Contracts) for the fund. The Board, assisted by the advice of fund counsel and Independent Trustees' counsel, requests and considers a broad range of information relevant to the renewal of the Advisory Contracts throughout the year.
The Board meets regularly and, at each of its meetings, covers an extensive agenda of topics and materials and considers factors that are relevant to its annual consideration of the renewal of the fund's Advisory Contracts, including the services and support provided to the fund and its shareholders. The Board has established various standing committees, each composed of and chaired by Independent Trustees with varying backgrounds, to which the Board has assigned specific subject matter responsibilities in order to enhance effective decision-making by the Board. The Board, acting directly and through its Committees, requests and receives information concerning the annual consideration of the renewal of the fund's Advisory Contracts. The Board also meets as needed to consider matters specifically related to the Board's annual consideration of the renewal of Advisory Contracts. Members of the Board may also meet with trustees of other Fidelity funds through ad hoc joint committees to discuss certain matters relevant to the Fidelity funds.
At its July 2013 meeting, the Board, including the Independent Trustees, unanimously determined to renew the fund's Advisory Contracts. In reaching its determination, the Board considered all factors it believed relevant, including (i) the nature, extent, and quality of the services to be provided to the fund and its shareholders (including the investment performance of the fund); (ii) the competitiveness of the fund's management fee and total expense ratio relative to peer funds; (iii) the total costs of the services to be provided by and the profits to be realized by Fidelity from its relationship with the fund; (iv) the extent to which economies of scale exist and would be realized as the fund grows; and (v) whether fee levels reflect these economies of scale, if any, for the benefit of fund shareholders.
In considering whether to renew the Advisory Contracts for the fund, the Board reached a determination, with the assistance of fund counsel and Independent Trustees' counsel and through the exercise of its business judgment, that the renewal of the Advisory Contracts was in the best interests of the fund and its shareholders and that the compensation payable under the Advisory Contracts was fair and reasonable. The Board's decision to renew the Advisory Contracts was not based on any single factor, but rather was based on a comprehensive consideration of all the information provided to the Board at its meetings throughout the year. The Board, in reaching its determination to renew the Advisory Contracts, was aware that shareholders in the fund have a broad range of investment choices available to them, including a wide choice among mutual funds offered by Fidelity's competitors, and that the fund's shareholders, who have the opportunity to review and weigh the disclosure provided by the fund in its prospectus and other public disclosures, have chosen to invest in this fund, which is a part of the Fidelity family of funds.
Annual Report
Nature, Extent, and Quality of Services Provided. The Board considered the staffing within the investment adviser, Fidelity Management & Research Company (FMR), and the sub-advisers (together, the Investment Advisers) as it relates to the fund, including the backgrounds of the fund's investment personnel, and also considered the fund's investment objective, strategies, and related investment philosophy. The Independent Trustees also had discussions with senior management of Fidelity's investment operations and investment groups. The Board considered the structure of the portfolio manager compensation program and whether this structure provides appropriate incentives to act in the best interests of the fund.
Resources Dedicated to Investment Management and Support Services. The Board and the Fund Oversight and Research Committees reviewed the general qualifications and capabilities of the Investment Advisers' investment staff, including its size, education, experience, and resources, as well as the Investment Advisers' approach to recruiting, training, managing, and compensating investment personnel. The Board noted that FMR has continued to increase the resources devoted to non-U.S. offices, including expansion of Fidelity's global investment organization. The Board also noted that Fidelity's analysts have extensive resources, tools and capabilities that allow them to conduct sophisticated quantitative and fundamental analysis, as well as credit analysis of issuers, counterparties and guarantors. Further, the Board believes that Fidelity's investment professionals have sufficient access to global information and data so as to provide competitive investment results over time, and that those professionals also have access to sophisticated tools that permit them to assess portfolio construction and risk and performance attribution characteristics continuously, as well as to transmit new information and research conclusions rapidly around the world. Additionally, in its deliberations, the Board considered the Investment Advisers' trading and risk management capabilities and resources, which are an integral part of the investment management process.
Shareholder and Administrative Services. The Board considered (i) the nature, extent, quality, and cost of advisory, administrative, and shareholder services performed by the Investment Advisers and their affiliates under the Advisory Contracts and under separate agreements covering transfer agency, pricing and bookkeeping, and securities lending services for the fund; (ii) the nature and extent of the supervision of third party service providers, principally custodians and subcustodians; and (iii) the resources devoted to, and the record of compliance with, the fund's compliance policies and procedures. The Board also reviewed the allocation of fund brokerage, including allocations to brokers affiliated with the Investment Advisers, the use of brokerage commissions to pay fund expenses, and the use of "soft" commission dollars to pay for research services.
Annual Report
Board Approval of Investment Advisory Contracts and
Management Fees - continued
The Board noted that the growth of fund assets over time across the complex allows Fidelity to reinvest in the development of services designed to enhance the value or convenience of the Fidelity funds as investment vehicles. These services include 24-hour access to account information and market information through telephone representatives and over the Internet, investor education materials and asset allocation tools, and the expanded availability of Fidelity Investor Centers.
Investment in a Large Fund Family. The Board considered the benefits to shareholders of investing in a Fidelity fund, including the benefits of investing in a fund that is part of a large family of funds offering a variety of investment disciplines and providing a large variety of mutual fund investor services. The Board noted that Fidelity had taken, or had made recommendations that resulted in the Fidelity funds taking, a number of actions over the previous year that benefited particular funds, including (i) continuing to dedicate additional resources to investment research and to the support of the senior management team that oversees asset management; (ii) persisting in efforts to enhance Fidelity's global research capabilities; (iii) launching new funds and making other enhancements to meet client needs for global and income-oriented solutions; (iv) continuing to launch dedicated lower cost underlying funds to meet portfolio construction needs related to expanding underlying fund options for Fidelity funds of funds, specifically for the Freedom Fund product lines; (v) rationalizing product lines and gaining increased efficiencies through the mergers of several funds into other funds; (vi) strengthening Fidelity's index fund offerings by reducing investment minimums and adopting or lowering existing expense caps for certain funds and classes; (vii) enhancing Global Asset Allocation product offerings by launching new funds and strategies, including "open architecture" target date funds that utilize affiliated and unaffiliated sub-advisers; (viii) modifying the eligibility criteria for Institutional Class shares of Advisor funds to increase their marketability to a portion of the defined contribution plan market; (ix) creating a new low-cost retirement share class for certain Advisor funds to appeal to large retirement plans; (x) transitioning the management of certain Fidelity commodity funds to Geode Capital Management LLC, a registered commodity pool operator, while retaining administrative responsibilities for the funds; (xi) reorganizing a number of funds; and (xii) taking steps toward establishing a new Fidelity adviser to manage sector-based funds and products.
Investment Performance. The Board considered whether the fund has operated in accordance with its investment objective, as well as its record of compliance with its investment restrictions and its performance history.
The Board took into account discussions with the Investment Advisers about fund investment performance that occur at Board meetings throughout the year. In this regard the Board noted that as part of regularly scheduled fund reviews and other reports to the Board on fund performance, the Board periodically considers annualized return information for the fund, for different time periods, measured against a securities market index ("benchmark index") and a peer group of mutual funds with similar objectives ("peer group"). In its evaluation of fund investment performance, the Board gave particular attention to information indicating changes in performance of certain Fidelity funds for specific time periods and the Investment Advisers' explanations for any overperformance or underperformance.
Annual Report
In addition to reviewing absolute and relative fund performance, the Independent Trustees periodically consider the appropriateness of fund performance metrics in evaluating the results achieved. In general, the Independent Trustees believe that fund performance should be evaluated based on net performance (after fees and expenses) of both the highest performing and lowest performing classes, where applicable, compared to appropriate benchmark indices, over appropriate time periods which may include full market cycles, and compared to peer groups, as applicable, over the same periods, taking into account relevant factors including the following: general market conditions; issuer-specific information; tactical opportunities for investment; and fund cash flows and other factors.
The Independent Trustees recognize that shareholders evaluate performance on a net basis over their own holding periods, for which one-, three-, and five-year periods are used as a proxy. For this reason, the performance information reviewed by the Board also included net cumulative calendar year total return information for the fund and an appropriate benchmark index and peer group for the most recent one-, three-, and five-year periods, as shown below. Returns are shown compared to the 25th percentile (top of box) and 75th percentile (bottom of box) of the peer universe.
Fidelity Growth & Income Portfolio

Annual Report
Board Approval of Investment Advisory Contracts and
Management Fees - continued
Based on its review, the Board concluded that the nature, extent, and quality of services provided to the fund under the Advisory Contracts should benefit the fund's shareholders.
Competitiveness of Management Fee and Total Expense Ratio. The Board considered the fund's management fee and total expense ratio compared to "mapped groups" of competitive funds and classes. Fidelity creates "mapped groups" by combining similar Lipper investment objective categories that have comparable management fee characteristics. Combining Lipper investment objective categories aids the Board's management fee and total expense ratio comparisons by broadening the competitive group used for comparison and by reducing the number of universes to which various Fidelity funds are compared.
Management Fee. The Board considered two proprietary management fee comparisons for the 12-month periods shown in the chart below. The group of Lipper funds used by the Board for management fee comparisons is referred to below as the "Total Mapped Group." The Total Mapped Group comparison focuses on a fund's standing in terms of gross management fees before expense reimbursements or caps relative to the total universe of funds with comparable investment mandates, regardless of whether their management fee structures also are comparable. Funds with comparable investment mandates offer exposure to similar types of securities. Funds with comparable management fee structures have similar management fee contractual arrangements (e.g., flat rate charged for advisory services, all-inclusive fee rate, etc.). "TMG %" represents the percentage of funds in the Total Mapped Group that had management fees that were lower than the fund's. For example, a TMG % of 15% means that 85% of the funds in the Total Mapped Group had higher management fees than the fund. The "Asset-Size Peer Group" (ASPG) comparison focuses on a fund's standing relative to a subset of non-Fidelity funds within the Total Mapped Group that are similar in size and management fee structure. The ASPG represents at least 15% of the funds in the Total Mapped Group with comparable asset size and management fee structures, subject to a minimum of 50 funds (or all funds in the Total Mapped Group if fewer than 50). Additional information, such as the ASPG quartile in which the fund's management fee ranked, is also included in the chart and considered by the Board.
Annual Report
Fidelity Growth & Income Portfolio
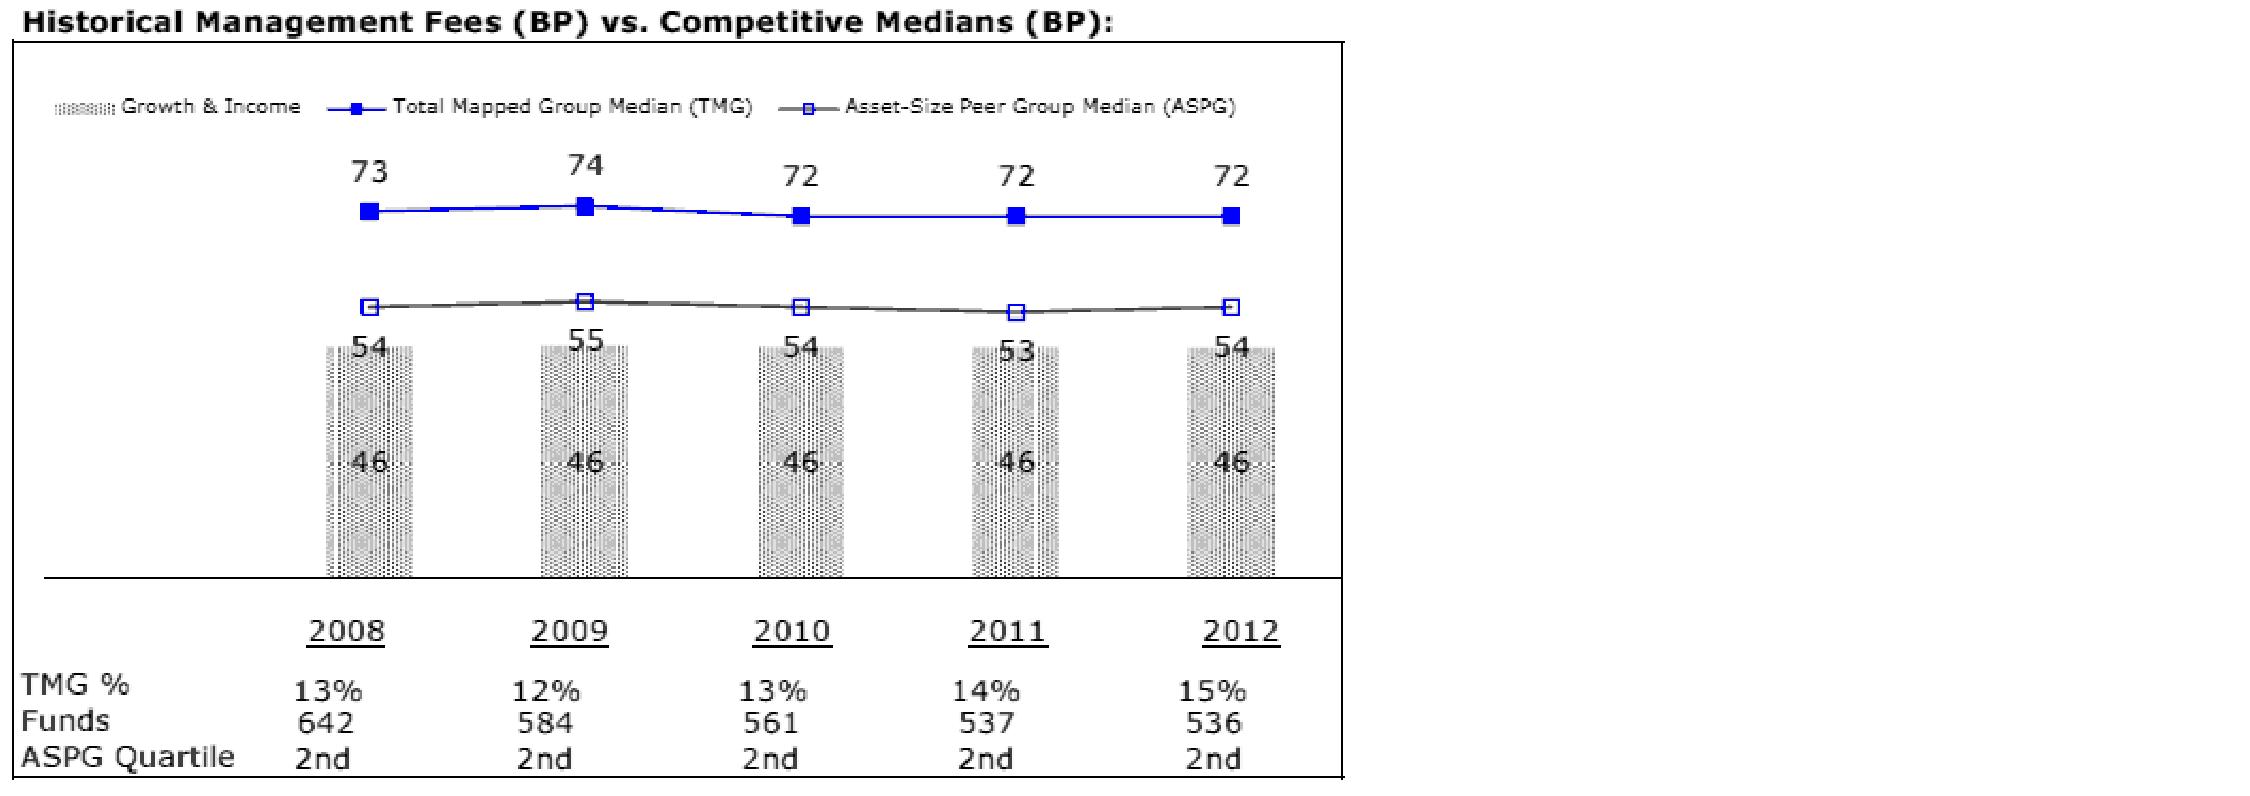
The Board noted that the fund's management fee ranked below the median of its Total Mapped Group and below the median of its ASPG for 2012.
Based on its review, the Board concluded that the fund's management fee is fair and reasonable in light of the services that the fund receives and the other factors considered.
Total Expense Ratio. In its review of each class's total expense ratio, the Board considered the fund's management fee as well as other fund or class expenses, as applicable, such as transfer agent fees, pricing and bookkeeping fees, and custodial, legal, and audit fees. The Board also noted the effects of any waivers and reimbursements on fees and expenses. As part of its review, the Board also considered the current and historical total expense ratios of each class of the fund compared to competitive fund median expenses. Each class of the fund is compared to those funds and classes in the Total Mapped Group (used by the Board for management fee comparisons) that have a similar sales load structure.
The Board noted that the total expense ratio of each class ranked below its competitive median for 2012.
Fees Charged to Other Fidelity Clients. The Board also considered Fidelity fee structures and other information with respect to clients of FMR and its affiliates, such as other mutual funds advised or subadvised by FMR or its affiliates, pension plan clients, and other institutional clients. The Board noted the findings of the 2013 ad hoc joint committee (created with the board of other Fidelity funds), which reviewed and compared Fidelity's institutional investment advisory business with its business of providing services to the Fidelity funds, including the differences in services provided, fees charged, and costs incurred, as well as competition in their respective marketplaces.
Annual Report
Board Approval of Investment Advisory Contracts and
Management Fees - continued
Based on its review of total expense ratios and fees charged to other Fidelity clients, the Board concluded that the total expense ratio of each class of the fund was reasonable in light of the services that the fund and its shareholders receive and the other factors considered.
Costs of the Services and Profitability. The Board considered the revenues earned and the expenses incurred by Fidelity in conducting the business of developing, marketing, distributing, managing, administering and servicing the fund and servicing the fund's shareholders. The Board also considered the level of Fidelity's profits in respect of all the Fidelity funds.
On an annual basis, FMR presents to the Board Fidelity's profitability for the fund. Fidelity calculates the profitability for each fund, as well as aggregate profitability for groups of Fidelity funds and all Fidelity funds, using a series of detailed revenue and cost allocation methodologies which originate with the books and records of Fidelity on which Fidelity's audited financial statements are based. The Audit Committee of the Board reviews any significant changes from the prior year's methodologies.
PricewaterhouseCoopers LLP (PwC), independent registered public accounting firm and auditor to Fidelity and certain Fidelity funds, has been engaged annually by the Board as part of the Board's assessment of Fidelity's profitability analysis. PwC's engagement includes the review and assessment of the methodologies used by Fidelity in determining the revenues and expenses attributable to Fidelity's mutual fund business, and completion of agreed-upon procedures surrounding the mathematical accuracy of fund profitability and its conformity to allocation methodologies. After considering PwC's reports issued under the engagement and information provided by Fidelity, the Board concluded that while other allocation methods may also be reasonable, Fidelity's profitability methodologies are reasonable in all material respects.
The Board also reviewed Fidelity's non-fund businesses and fall-out benefits related to the mutual fund business as well as cases where Fidelity's affiliates may benefit from or be related to the fund's business.
The Board considered the costs of the services provided by and the profits realized by Fidelity in connection with the operation of the fund and was satisfied that the profitability was not excessive in the circumstances.
Economies of Scale. The Board considered whether there have been economies of scale in respect of the management of the Fidelity funds, whether the Fidelity funds (including the fund) have appropriately benefited from any such economies of scale, and whether there is potential for realization of any further economies of scale. The Board considered the extent to which the fund will benefit from economies of scale through increased services to the fund, through waivers or reimbursements, or through fee or expense reductions. The Board also noted that in 2009, it and the board of other Fidelity funds created an ad hoc committee (the Economies of Scale Committee) to analyze whether FMR attains economies of scale in respect of the management and servicing of the Fidelity funds, whether the Fidelity funds have appropriately benefited from such economies of scale, and whether there is potential for realization of any further economies of scale.
Annual Report
The Board recognized that the fund's management contract incorporates a "group fee" structure, which provides for lower group fee rates as total fund assets under FMR's management increase, and for higher group fee rates as total fund assets under FMR's management decrease. FMR calculates the group fee rates based on a tiered asset "breakpoint" schedule that varies based on asset class. The Board considered that the group fee is designed to deliver the benefits of economies of scale to fund shareholders when total Fidelity fund assets increase, even if assets of any particular fund are unchanged or have declined, because some portion of Fidelity's costs are attributable to services provided to all Fidelity funds, and all funds benefit if those costs can be allocated among more assets. The Board concluded that, given the group fee structure, fund shareholders will benefit from lower management fees as assets under FMR's management increase at the fund complex level, regardless of whether Fidelity achieves any such economies of scale.
The Board concluded, taking into account the analysis of the Economies of Scale Committee, that economies of scale, if any, are being appropriately shared between fund shareholders and Fidelity.
Amendment to Description of Group Fee Rate. At its July 2013 meeting, the Board voted to approve an amendment to the fund's management contract to modify the description of the "group fee rate" effective August 1, 2013. The Board noted that under the prior description in the contract, the group fee rate was based on the average net assets of all registered investment companies with which FMR has management contracts. Under the contract's tiered asset breakpoint schedule, the group fee rate is lower as total fund assets under FMR's management increase, and higher as total fund assets under FMR's management decrease. The Board considered that the prior description would have excluded the assets of 64 Fidelity sector funds from the group fee rate calculation once Fidelity SelectCo, LLC, an affiliate of FMR, assumed management responsibilities for those funds. The Board noted that modifying the description of the group fee rate to continue to include the assets of those 64 funds for purposes of determining group fee rate breakpoints would avoid an immediate adverse impact on the group fee rate for any fund.
Additional Information Requested by the Board. In order to develop fully the factual basis for consideration of the Fidelity funds' Advisory Contracts, the Board requested and received additional information on certain topics, including: (i) fund performance trends and Fidelity's long-term strategies for certain funds; (ii) the potential to further rationalize the Fidelity fund lineup with the possibility of achieving savings for the funds and Fidelity; (iii) the methodology with respect to competitive fund data and peer group classifications; (iv) the arrangements with, and performance of, certain sub-advisers on behalf of the Fidelity funds, as well as certain proposed participating affiliate arrangements; (v) the realization of fall-out benefits in certain Fidelity business units; (vi) Fidelity's group fee structures, including the rationale for the individual fee rates of certain categories of funds and the definition of group assets; (vii) trends regarding industry use of performance fee structures and the performance adjustment methodologies applicable to the Fidelity funds; (viii) additional competitive analysis regarding the total expenses for certain classes; and (ix) fund profitability methodology, including Fidelity's cost allocation methodology, and the impact of certain factors on fund profitability results.
Annual Report
Board Approval of Investment Advisory Contracts and
Management Fees - continued
Based on its evaluation of all of the conclusions noted above, and after considering all factors it believed relevant, the Board ultimately concluded that the advisory fee structures are fair and reasonable, and that the fund's Advisory Contracts should be renewed.
Annual Report
Investment Adviser
Fidelity Management & Research Company
Boston, MA
Investment Sub-Advisers
FMR Co., Inc.
Fidelity Management & Research
(U.K.) Inc.
Fidelity Management & Research
(Japan) Inc.
Fidelity Management & Research
(Hong Kong) Limited
General Distributor
Fidelity Distributors Corporation
Smithfield, RI
Transfer and Service Agents
Fidelity Investments Institutional
Operations Company, Inc.
Boston, MA
Fidelity Service Company, Inc.
Boston, MA
Custodian
Northern Trust Company
Chicago, IL
(Fidelity Investment logo)(registered trademark)
Corporate Headquarters
245 Summer St., Boston, MA 02210
www.fidelity.com
GAI-K-UANN-0913
1.863229.104
Fidelity®
Leveraged Company Stock
Fund
Annual Report
July 31, 2013
(Fidelity Cover Art)
Contents
Performance | (Click Here) | How the fund has done over time. |
Management's Discussion of Fund Performance | (Click Here) | The Portfolio Manager's review of fund performance and strategy. |
Shareholder Expense Example | (Click Here) | An example of shareholder expenses. |
Investment Changes | (Click Here) | A summary of major shifts in the fund's investments over the last six months. |
Investments | (Click Here) | A complete list of the fund's investments with their market values. |
Financial Statements | (Click Here) | Statements of assets and liabilities, operations, and changes in net assets, as well as financial highlights. |
Notes | (Click Here) | Notes to the financial statements. |
Report of Independent Registered Public Accounting Firm | (Click Here) | |
Trustees and Officers | (Click Here) | |
Distributions | (Click Here) | |
Board Approval of Investment Advisory Contracts and Management Fees | (Click Here) | |
To view a fund's proxy voting guidelines and proxy voting record for the 12-month period ended June 30, visit http://www.fidelity.com/proxyvotingresults or visit the Securities and Exchange Commission's (SEC) web site at http://www.sec.gov. You may also call 1-800-544-8544 to request a free copy of the proxy voting guidelines.
Standard & Poor's, S&P and S&P 500 are registered service marks of The McGraw-Hill Companies, Inc. and have been licensed for use by Fidelity Distributors Corporation.
Other third-party marks appearing herein are the property of their respective owners.
All other marks appearing herein are registered or unregistered trademarks or service marks of FMR LLC or an affiliated company. © 2013 FMR LLC. All rights reserved.
Annual Report
This report and the financial statements contained herein are submitted for the general information of the shareholders of the fund. This report is not authorized for distribution to prospective investors in the fund unless preceded or accompanied by an effective prospectus.
A fund files its complete schedule of portfolio holdings with the SEC for the first and third quarters of each fiscal year on Form N-Q. Forms N-Q are available on the SEC's web site at http://www.sec.gov. A fund's Forms N-Q may be reviewed and copied at the SEC's Public Reference Room in Washington, DC. Information regarding the operation of the SEC's Public Reference Room may be obtained by calling 1-800-SEC-0330. For a complete list of a fund's portfolio holdings, view the most recent holdings listing, semiannual report, or annual report on Fidelity's web site at http://www.fidelity.com, http://www.advisor.fidelity.com, or http://www.401k.com, as applicable.
NOT FDIC INSURED • MAY LOSE VALUE • NO BANK GUARANTEE
Neither the fund nor Fidelity Distributors Corporation is a bank.
Annual Report
Average annual total return reflects the change in the value of an investment, assuming reinvestment of the class' distributions from dividend income and capital gains (the profits earned upon the sale of securities that have grown in value, if any) and assuming a constant rate of performance each year. The $10,000 table and the fund's returns do not reflect the deduction of taxes that a shareholder would pay on fund distributions or the redemption of fund shares. During periods of reimbursement by Fidelity, a fund's total return will be greater than it would be had the reimbursement not occurred. How a fund did yesterday is no guarantee of how it will do tomorrow.
Average Annual Total Returns
Periods ended July 31, 2013 | Past 1
year | Past 5
years | Past 10
years |
Fidelity® Leveraged Company Stock Fund | 40.31% | 5.77% | 12.99% |
$10,000 Over 10 Years
Let's say hypothetically that $10,000 was invested in Fidelity® Leveraged Company Stock Fund, a class of the fund, on July 31, 2003. The chart shows how the value of your investment would have changed, and also shows how the S&P 500® Index performed over the same period.
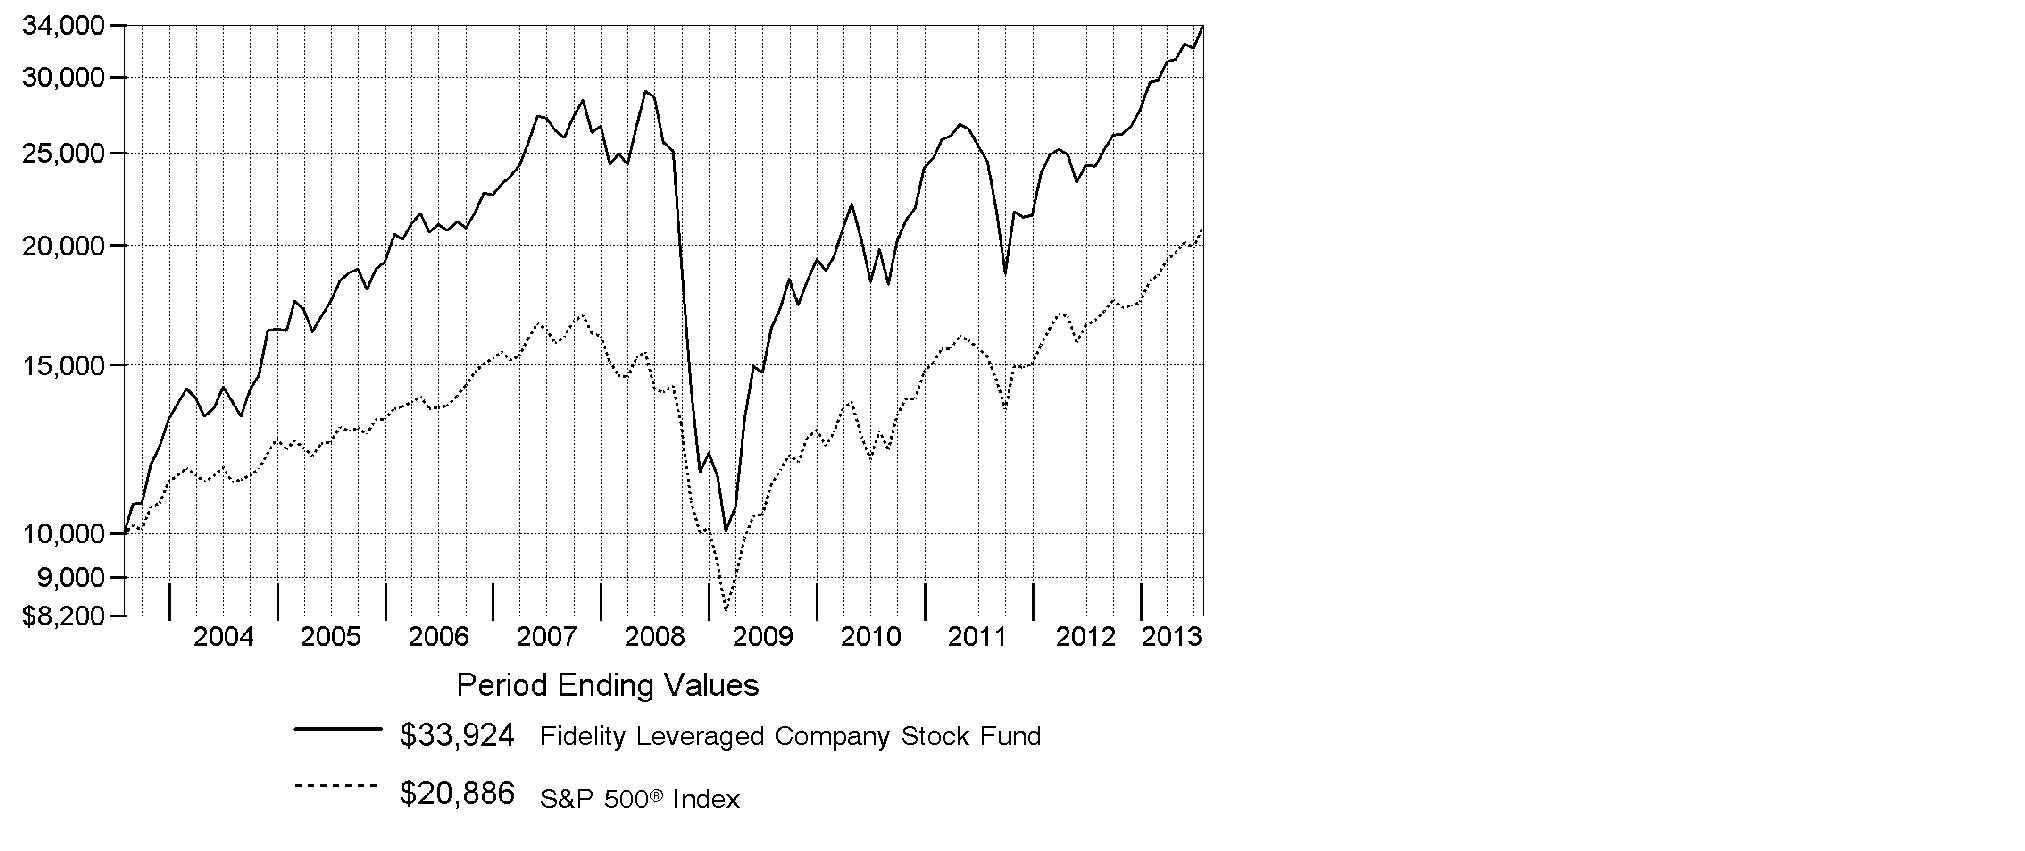
Annual Report
Market Recap: The bull run in U.S. stocks comfortably settled into a fifth year, as major equity benchmarks ripped through records during the 12 months ending July 31, 2013. Gains were fueled by a generally improving global economy and accommodative monetary policies worldwide. The tone was positive for most of the year, based largely on stronger U.S. economic data, including employment, housing and consumer sentiment. Setting a series of new highs along the way, the broad-based S&P 500® Index rose an impressive 25.00% for the 12 months, while the blue-chip-laden Dow Jones Industrial AverageSM also moved into record territory en route to a 22.36% gain. The growth-oriented Nasdaq Composite Index® had a similarly strong run, advancing 25.15%. During the year, markets were resilient amid intermittent volatility over debt woes in Europe, the 2012 U.S. presidential election and year-end Congressional gridlock over the federal budget. In mid-to-late June, concern arose about the U.S. Federal Reserve possibly tapering its sustaining bond-buying strategy - which prompted a brief, but steep, market sell-off. However, investors' continued quest for yield and the Fed's pledge to keep buying bonds until the economy showed significant improvement overpowered the uncertainty and helped equities climb notably higher in July to close the period on a strong note.
Comments from Thomas Soviero, Portfolio Manager of Fidelity® Leveraged Company Stock Fund: For the year, the fund's Retail Class shares returned 40.31%, significantly outperforming the S&P 500®. I concentrate the fund in what I consider to be my best ideas. I made the fund more U.S.-centric, adding to consumer discretionary names such as major automotive manufacturers Ford Motor and General Motors. I also sought to take advantage of the recent manufacturing renaissance in the U.S. The fund's largest holding and top contributor to relative performance was chemicals manufacturer LyondellBasell Industries. Other decisions that helped included largely avoiding consumer electronics giant and underperforming index component Apple - which was not held by the fund at period end - and overweighting outperforming video game retailer GameStop. During the period, the fund's performance relative to the index was curtailed the most by its roughly 13% cash weighting, which I held as I waited for new opportunities, but was a negative in a strong market. An underweighting in financials also detracted. At the individual issuer level, global independent power producer AES, with headquarters in Virginia, underperformed and detracted, as did an out-of-benchmark position in South Africa-based AngloGold Ashanti.
The views expressed above reflect those of the portfolio manager(s) only through the end of the period as stated on the cover of this report and do not necessarily represent the views of Fidelity or any other person in the Fidelity organization. Any such views are subject to change at any time based upon market or other conditions and Fidelity disclaims any responsibility to update such views. These views may not be relied on as investment advice and, because investment decisions for a Fidelity fund are based on numerous factors, may not be relied on as an indication of trading intent on behalf of any Fidelity fund.
Annual Report
Shareholder Expense Example
As a shareholder of the Fund, you incur two types of costs: (1) transaction costs, including redemption fees and (2) ongoing costs, including management fees and other Fund expenses. This Example is intended to help you understand your ongoing costs (in dollars) of investing in the Fund and to compare these costs with the ongoing costs of investing in other mutual funds.
The Example is based on an investment of $1,000 invested at the beginning of the period and held for the entire period (February 1, 2013 to July 31, 2013).
Actual Expenses
The first line of the accompanying table for each class of the Fund provides information about actual account values and actual expenses. You may use the information in this line, together with the amount you invested, to estimate the expenses that you paid over the period. Simply divide your account value by $1,000.00 (for example, an $8,600 account value divided by $1,000.00 = 8.6), then multiply the result by the number in the first line for a class of the Fund under the heading entitled "Expenses Paid During Period" to estimate the expenses you paid on your account during this period. A small balance maintenance fee of $12.00 that is charged once a year may apply for certain accounts with a value of less than $2,000. This fee is not included in the table below. If it was, the estimate of expenses you paid during the period would be higher, and your ending account value lower, by this amount. In addition, the Fund, as a shareholder in the underlying Fidelity Central Funds, will indirectly bear its pro-rata share of the fees and expenses incurred by the underlying Fidelity Central Funds. These fees and expenses are not included in the Fund's annualized expense ratio used to calculate the expense estimate in the table below.
Hypothetical Example for Comparison Purposes
The second line of the accompanying table for each class of the Fund provides information about hypothetical account values and hypothetical expenses based on a Class' actual expense ratio and an assumed rate of return of 5% per year before expenses, which is not the Class' actual return. The hypothetical account values and expenses may not be used to estimate the actual ending account balance or expenses you paid for the period. You may use this information to compare the ongoing costs of investing in the Fund and other funds. To do so, compare this 5% hypothetical example with the 5% hypothetical examples that appear in the shareholder reports of the other funds. A small balance maintenance fee of $12.00 that is charged once a year may apply for certain accounts with a value of less than $2,000. This fee is not included in the table below. If it was, the estimate of expenses you paid during the period would be higher, and your ending account value lower, by this amount. In addition, the Fund, as a shareholder in the underlying Fidelity Central Funds, will indirectly bear its pro-rata share of the fees and expenses incurred by the underlying Fidelity Central Funds. These fees and expenses are not included in the Fund's annualized expense ratio used to calculate the expense estimate in the table below.
Please note that the expenses shown in the table are meant to highlight your ongoing costs only and do not reflect any transaction costs. Therefore, the second line of the table is useful in comparing ongoing costs only, and will not help you determine the relative total costs of owning different funds. In addition, if these transactional costs were included, your costs would have been higher.
Annual Report
Shareholder Expense Example - continued
| Annualized
Expense Ratio B | Beginning
Account Value
February 1, 2013 | Ending
Account Value
July 31, 2013 | Expenses Paid
During Period*
February 1, 2013
to July 31, 2013 |
Leveraged Company Stock | .81% | | | |
Actual | | $ 1,000.00 | $ 1,145.50 | $ 4.31 |
Hypothetical A | | $ 1,000.00 | $ 1,020.78 | $ 4.06 |
Class K | .68% | | | |
Actual | | $ 1,000.00 | $ 1,146.20 | $ 3.62 |
Hypothetical A | | $ 1,000.00 | $ 1,021.42 | $ 3.41 |
A 5% return per year before expenses
B Annualized expense ratio reflects expenses net of applicable fee waivers.
* Expenses are equal to each Class' annualized expense ratio, multiplied by the average account value over the period, multiplied by 181/365 (to reflect the one-half year period).
Annual Report
Investment Changes (Unaudited)
Top Ten Stocks as of July 31, 2013 |
| % of fund's
net assets | % of fund's net assets
6 months ago |
LyondellBasell Industries NV Class A | 7.4 | 8.1 |
Service Corp. International | 4.6 | 4.1 |
Comcast Corp. Class A | 3.6 | 2.7 |
General Motors Co. | 3.1 | 2.8 |
Ford Motor Co. | 3.0 | 1.9 |
GameStop Corp. Class A | 2.6 | 1.6 |
Tenet Healthcare Corp. | 2.3 | 2.2 |
Bank of America Corp. | 2.2 | 0.0 |
Boston Scientific Corp. | 2.1 | 0.8 |
The AES Corp. | 1.8 | 3.0 |
| 32.7 | |
Top Five Market Sectors as of July 31, 2013 |
| % of fund's
net assets | % of fund's net assets
6 months ago |
Consumer Discretionary | 25.9 | 22.6 |
Materials | 11.5 | 12.4 |
Industrials | 10.7 | 10.4 |
Health Care | 10.1 | 7.7 |
Financials | 9.5 | 6.5 |
Asset Allocation (% of fund's net assets) |
As of July 31, 2013* | As of January 31, 2013** |
 | Stocks 88.4% | | | Stocks 83.2% | |
 | Bonds 0.3% | | | Bonds 0.9% | |
 | Convertible
Securities 0.1% | | | Convertible
Securities 0.1% | |
 | Other Investments 0.1% | | | Other Investments 0.3% | |
 | Short-Term
Investments and
Net Other Assets
(Liabilities) 11.1% | | | Short-Term
Investments and
Net Other Assets
(Liabilities) 15.5% | |
* Foreign investments | 13.2% | | ** Foreign investments | 12.6% | |

Annual Report
Investments July 31, 2013
Showing Percentage of Net Assets
Common Stocks - 88.1% |
| Shares | | Value (000s) |
CONSUMER DISCRETIONARY - 25.6% |
Auto Components - 1.9% |
Delphi Automotive PLC | 592,300 | | $ 31,818 |
Exide Technologies (a) | 3,930,293 | | 511 |
Tenneco, Inc. (a) | 825,300 | | 39,887 |
TRW Automotive Holdings Corp. (a) | 396,200 | | 29,045 |
| | 101,261 |
Automobiles - 6.8% |
Ford Motor Co. | 9,413,433 | | 158,899 |
General Motors Co. (a) | 4,578,649 | | 164,236 |
General Motors Co.: | | | |
warrants 7/10/16 (a) | 445,805 | | 11,716 |
warrants 7/10/19 (a) | 445,805 | | 8,305 |
Motors Liquidation Co. GUC Trust (a) | 123,112 | | 4,020 |
Toyota Motor Corp. sponsored ADR | 89,500 | | 10,910 |
| | 358,086 |
Diversified Consumer Services - 4.6% |
Service Corp. International (f) | 12,885,925 | | 244,446 |
Hotels, Restaurants & Leisure - 0.3% |
Penn National Gaming, Inc. (a) | 360,340 | | 18,013 |
Station Holdco LLC unit (h)(i) | 146,846 | | 9 |
| | 18,022 |
Household Durables - 2.0% |
Hovnanian Enterprises, Inc. Class A (a)(e) | 1,419,000 | | 7,592 |
Lennar Corp. Class A (e) | 983,400 | | 33,308 |
Newell Rubbermaid, Inc. | 2,341,747 | | 63,274 |
| | 104,174 |
Leisure Equipment & Products - 0.2% |
Callaway Golf Co. | 1,630,035 | | 11,704 |
Media - 6.2% |
Cinemark Holdings, Inc. | 2,601,645 | | 75,760 |
Comcast Corp. Class A | 4,239,634 | | 191,123 |
Gray Television, Inc. (a)(f) | 3,766,164 | | 29,414 |
Nexstar Broadcasting Group, Inc. Class A | 886,098 | | 31,935 |
| | 328,232 |
Multiline Retail - 0.5% |
Target Corp. | 338,600 | | 24,125 |
Specialty Retail - 3.1% |
Asbury Automotive Group, Inc. (a) | 385,122 | | 18,809 |
Common Stocks - continued |
| Shares | | Value (000s) |
CONSUMER DISCRETIONARY - continued |
Specialty Retail - continued |
GameStop Corp. Class A (e) | 2,755,507 | | $ 135,185 |
Sally Beauty Holdings, Inc. (a) | 300,000 | | 9,153 |
| | 163,147 |
TOTAL CONSUMER DISCRETIONARY | | 1,353,197 |
CONSUMER STAPLES - 2.3% |
Food Products - 2.0% |
ConAgra Foods, Inc. | 541,700 | | 19,615 |
Darling International, Inc. (a) | 3,476,642 | | 70,576 |
Smithfield Foods, Inc. (a) | 559,606 | | 18,579 |
| | 108,770 |
Personal Products - 0.3% |
Revlon, Inc. (a) | 553,261 | | 13,881 |
TOTAL CONSUMER STAPLES | | 122,651 |
ENERGY - 9.5% |
Energy Equipment & Services - 2.8% |
Ensco PLC Class A | 110,000 | | 6,307 |
Halliburton Co. | 1,126,593 | | 50,911 |
Noble Corp. | 987,610 | | 37,727 |
Oil States International, Inc. (a) | 270,466 | | 26,297 |
Schlumberger Ltd. | 109,400 | | 8,898 |
Transocean Ltd. (United States) | 381,900 | | 18,010 |
| | 148,150 |
Oil, Gas & Consumable Fuels - 6.7% |
Alpha Natural Resources, Inc. (a) | 6,794,948 | | 36,965 |
Continental Resources, Inc. (a) | 534,087 | | 49,296 |
Forest Oil Corp. (a)(e) | 1,205,652 | | 6,173 |
Hess Corp. | 835,910 | | 62,242 |
HollyFrontier Corp. | 1,682,927 | | 76,657 |
Kodiak Oil & Gas Corp. (a) | 2,019,747 | | 19,612 |
Peabody Energy Corp. | 822,825 | | 13,626 |
Range Resources Corp. | 247,200 | | 19,554 |
Common Stocks - continued |
| Shares | | Value (000s) |
ENERGY - continued |
Oil, Gas & Consumable Fuels - continued |
Valero Energy Corp. | 1,328,266 | | $ 47,512 |
Western Refining, Inc. (e) | 685,914 | | 20,667 |
| | 352,304 |
TOTAL ENERGY | | 500,454 |
FINANCIALS - 9.3% |
Commercial Banks - 2.9% |
CIT Group, Inc. (a) | 229,310 | | 11,491 |
Huntington Bancshares, Inc. | 8,526,580 | | 72,902 |
Regions Financial Corp. | 3,284,894 | | 32,882 |
SunTrust Banks, Inc. | 1,019,600 | | 35,472 |
| | 152,747 |
Consumer Finance - 0.9% |
American Express Co. | 679,548 | | 50,130 |
Diversified Financial Services - 3.6% |
Bank of America Corp. | 7,748,999 | | 113,135 |
Citigroup, Inc. | 1,458,047 | | 76,023 |
| | 189,158 |
Insurance - 1.1% |
AFLAC, Inc. | 641,700 | | 39,580 |
Lincoln National Corp. | 435,700 | | 18,156 |
| | 57,736 |
Real Estate Investment Trusts - 0.6% |
Host Hotels & Resorts, Inc. | 1,016,122 | | 18,148 |
Sabra Health Care REIT, Inc. | 547,507 | | 14,367 |
| | 32,515 |
Real Estate Management & Development - 0.1% |
Realogy Holdings Corp. | 156,900 | | 7,054 |
Thrifts & Mortgage Finance - 0.1% |
MGIC Investment Corp. (a) | 441,300 | | 3,372 |
TOTAL FINANCIALS | | 492,712 |
HEALTH CARE - 10.1% |
Health Care Equipment & Supplies - 2.1% |
Boston Scientific Corp. (a) | 10,011,725 | | 109,328 |
Health Care Providers & Services - 5.2% |
Community Health Systems, Inc. | 784,376 | | 36,128 |
Common Stocks - continued |
| Shares | | Value (000s) |
HEALTH CARE - continued |
Health Care Providers & Services - continued |
DaVita, Inc. (a) | 367,826 | | $ 42,819 |
HCA Holdings, Inc. | 1,216,779 | | 47,454 |
Tenet Healthcare Corp. (a) | 2,660,744 | | 118,802 |
Universal Health Services, Inc. Class B | 385,505 | | 26,966 |
| | 272,169 |
Pharmaceuticals - 2.8% |
Johnson & Johnson | 153,000 | | 14,306 |
Merck & Co., Inc. | 1,754,400 | | 84,509 |
Sanofi SA sponsored ADR (e) | 992,534 | | 51,096 |
| | 149,911 |
TOTAL HEALTH CARE | | 531,408 |
INDUSTRIALS - 10.6% |
Aerospace & Defense - 1.4% |
Honeywell International, Inc. | 478,776 | | 39,729 |
Huntington Ingalls Industries, Inc. | 258,160 | | 16,052 |
Textron, Inc. | 602,700 | | 16,502 |
| | 72,283 |
Airlines - 2.4% |
Delta Air Lines, Inc. | 3,665,001 | | 77,808 |
Southwest Airlines Co. | 571,283 | | 7,901 |
U.S. Airways Group, Inc. (a) | 1,481,380 | | 28,665 |
United Continental Holdings, Inc. (a) | 370,700 | | 12,919 |
| | 127,293 |
Building Products - 0.9% |
Armstrong World Industries, Inc. (a) | 693,300 | | 34,720 |
Owens Corning (a) | 294,219 | | 11,619 |
Owens Corning warrants 10/31/13 (a) | 406,600 | | 407 |
| | 46,746 |
Commercial Services & Supplies - 1.0% |
Deluxe Corp. | 1,037,373 | | 42,543 |
Tyco International Ltd. | 328,233 | | 11,426 |
| | 53,969 |
Electrical Equipment - 1.9% |
Belden, Inc. | 777,664 | | 45,579 |
Emerson Electric Co. | 163,500 | | 10,034 |
Generac Holdings, Inc. | 490,557 | | 21,266 |
Common Stocks - continued |
| Shares | | Value (000s) |
INDUSTRIALS - continued |
Electrical Equipment - continued |
General Cable Corp. | 437,132 | | $ 13,778 |
Polypore International, Inc. (a)(e) | 217,800 | | 9,145 |
| | 99,802 |
Industrial Conglomerates - 0.7% |
Carlisle Companies, Inc. | 109,910 | | 7,445 |
General Electric Co. | 1,103,883 | | 26,902 |
| | 34,347 |
Machinery - 1.6% |
Harsco Corp. | 890,712 | | 22,945 |
Ingersoll-Rand PLC | 739,500 | | 45,146 |
Pentair Ltd. | 78,757 | | 4,810 |
Timken Co. | 228,734 | | 13,363 |
| | 86,264 |
Marine - 0.2% |
Navios Maritime Holdings, Inc. | 2,162,794 | | 12,090 |
Road & Rail - 0.4% |
Hertz Global Holdings, Inc. (a) | 707,700 | | 18,124 |
Trading Companies & Distributors - 0.1% |
Edgen Group, Inc. Class A (a) | 841,256 | | 6,604 |
TOTAL INDUSTRIALS | | 557,522 |
INFORMATION TECHNOLOGY - 5.6% |
Communications Equipment - 1.1% |
Cisco Systems, Inc. | 2,383,049 | | 60,887 |
Computers & Peripherals - 0.4% |
NCR Corp. (a) | 569,631 | | 20,507 |
Electronic Equipment & Components - 0.8% |
Avnet, Inc. (a) | 594,313 | | 22,388 |
Corning, Inc. | 726,800 | | 11,040 |
Viasystems Group, Inc. (a) | 540,460 | | 8,026 |
| | 41,454 |
Internet Software & Services - 0.2% |
VeriSign, Inc. (a) | 194,300 | | 9,295 |
Semiconductors & Semiconductor Equipment - 2.5% |
Advanced Micro Devices, Inc. (a)(e) | 1,704,692 | | 6,427 |
Fairchild Semiconductor International, Inc. (a) | 1,122,274 | | 14,163 |
Freescale Semiconductor Holdings I Ltd. (a)(e) | 1,235,600 | | 19,399 |
Intersil Corp. Class A | 1,460,387 | | 14,911 |
Common Stocks - continued |
| Shares | | Value (000s) |
INFORMATION TECHNOLOGY - continued |
Semiconductors & Semiconductor Equipment - continued |
Micron Technology, Inc. (a) | 2,293,545 | | $ 30,389 |
ON Semiconductor Corp. (a) | 5,502,368 | | 45,340 |
| | 130,629 |
Software - 0.6% |
Citrix Systems, Inc. (a) | 230,899 | | 16,629 |
Microsoft Corp. | 108,800 | | 3,463 |
Nuance Communications, Inc. (a) | 573,666 | | 10,762 |
| | 30,854 |
TOTAL INFORMATION TECHNOLOGY | | 293,626 |
MATERIALS - 11.5% |
Chemicals - 8.9% |
H.B. Fuller Co. | 461,829 | | 18,542 |
LyondellBasell Industries NV Class A | 5,651,852 | | 388,336 |
OMNOVA Solutions, Inc. (a)(f) | 3,114,962 | | 25,107 |
Phosphate Holdings, Inc. (a) | 307,500 | | 308 |
The Dow Chemical Co. | 373,388 | | 13,084 |
W.R. Grace & Co. (a) | 317,904 | | 24,421 |
| | 469,798 |
Containers & Packaging - 2.2% |
Rock-Tenn Co. Class A | 814,923 | | 93,186 |
Sealed Air Corp. | 821,949 | | 22,390 |
| | 115,576 |
Metals & Mining - 0.1% |
AngloGold Ashanti Ltd. sponsored ADR | 526,100 | | 6,929 |
Ormet Corp. (a) | 330,000 | | 3 |
Ormet Corp. (a)(i) | 1,075,000 | | 10 |
| | 6,942 |
Paper & Forest Products - 0.3% |
Neenah Paper, Inc. | 418,300 | | 16,552 |
TOTAL MATERIALS | | 608,868 |
TELECOMMUNICATION SERVICES - 0.5% |
Diversified Telecommunication Services - 0.5% |
Intelsat SA | 1,144,700 | | 24,542 |
Common Stocks - continued |
| Shares | | Value (000s) |
UTILITIES - 3.1% |
Electric Utilities - 0.3% |
FirstEnergy Corp. | 421,304 | | $ 16,039 |
Independent Power Producers & Energy Traders - 2.8% |
Calpine Corp. (a) | 2,616,200 | | 52,350 |
The AES Corp. | 7,894,007 | | 98,201 |
| | 150,551 |
TOTAL UTILITIES | | 166,590 |
TOTAL COMMON STOCKS (Cost $3,235,776) |
4,651,570
|
Nonconvertible Preferred Stocks - 0.3% |
| | | |
CONSUMER STAPLES - 0.1% |
Personal Products - 0.1% |
Revlon, Inc. Series A 12.75% | 639,576 | | 3,454 |
FINANCIALS - 0.2% |
Diversified Financial Services - 0.2% |
GMAC Capital Trust I Series 2, 8.125% | 439,013 | | 11,656 |
TOTAL NONCONVERTIBLE PREFERRED STOCKS (Cost $19,207) |
15,110
|
Corporate Bonds - 0.4% |
| Principal Amount (000s) | | |
Convertible Bonds - 0.1% |
INDUSTRIALS - 0.1% |
Marine - 0.1% |
Genco Shipping & Trading Ltd. 5% 8/15/15 | | $ 12,440 | | 3,351 |
Nonconvertible Bonds - 0.3% |
CONSUMER DISCRETIONARY - 0.3% |
Automobiles - 0.0% |
General Motors Corp.: | | | | |
6.75% 5/1/28 (d) | | 3,075 | | 0 |
7.125% 7/15/49 (d) | | 8,320 | | 0 |
7.2% 1/15/11 (d) | | 22,980 | | 0 |
8.25% 7/15/23 (d) | | 25,035 | | 0 |
Corporate Bonds - continued |
| Principal Amount (000s) | | Value (000s) |
Nonconvertible Bonds - continued |
CONSUMER DISCRETIONARY - continued |
Automobiles - continued |
General Motors Corp.: - continued | | | | |
8.375% 7/15/33 (d) | | $ 50,210 | | $ 0 |
8.8% 3/1/21 (d) | | 10,765 | | 0 |
Multiline Retail - 0.3% |
The Bon-Ton Department Stores, Inc. 10.625% 7/15/17 | | 16,919 | | 16,898 |
TOTAL CORPORATE BONDS (Cost $21,338) |
20,249
|
Floating Rate Loans - 0.1% |
|
UTILITIES - 0.1% |
Electric Utilities - 0.1% |
Texas Competitive Electric Holdings Co. LLC/Texas Competitive Electric Holdings Finance, Inc. Tranche B, term loan 4.7212% 10/10/17 (g) (Cost $4,873) | | 5,458 | | 3,827 |
Money Market Funds - 15.1% |
| Shares | | |
Fidelity Cash Central Fund, 0.11% (b) | 627,652,352 | | 627,652 |
Fidelity Securities Lending Cash Central Fund, 0.12% (b)(c) | 171,038,475 | | 171,038 |
TOTAL MONEY MARKET FUNDS (Cost $798,690) |
798,690
|
TOTAL INVESTMENT PORTFOLIO - 104.0% (Cost $4,079,884) | | 5,489,446 |
NET OTHER ASSETS (LIABILITIES) - (4.0)% | | (210,002) |
NET ASSETS - 100% | $ 5,279,444 |
Legend |
(a) Non-income producing |
(b) Affiliated fund that is generally available only to investment companies and other accounts managed by Fidelity Investments. The rate quoted is the annualized seven-day yield of the fund at period end. A complete unaudited listing of the fund's holdings as of its most recent quarter end is available upon request. In addition, each Fidelity Central Fund's financial statements, which are not covered by the Fund's Report of Independent Registered Public Accounting Firm, are available on the SEC's website or upon request. |
(c) Investment made with cash collateral received from securities on loan. |
(d) Non-income producing - Security is in default. |
(e) Security or a portion of the security is on loan at period end. |
(f) Affiliated company |
(g) Coupon rates for floating and adjustable rate securities reflect the rates in effect at period end. |
(h) Investment is owned by an entity that is treated as a corporation for U.S. tax purposes and is owned by the Fund. |
(i) Restricted securities - Investment in securities not registered under the Securities Act of 1933 (excluding 144A issues). At the end of the period, the value of restricted securities (excluding 144A issues) amounted to $19,000 or 0.0% of net assets. |
Additional information on each restricted holding is as follows: |
Security | Acquisition Date | Acquisition Cost (000s) |
Ormet Corp. | 2/27/07 - 4/4/07 | $ 20,556 |
Station Holdco LLC unit | 10/28/08 - 12/1/08 | $ 5,990 |
Affiliated Central Funds |
Information regarding fiscal year to date income earned by the Fund from investments in Fidelity Central Funds is as follows: |
Fund | Income earned
(Amounts in thousands) |
Fidelity Cash Central Fund | $ 876 |
Fidelity Securities Lending Cash Central Fund | 2,121 |
Total | $ 2,997 |
Other Affiliated Issuers |
An affiliated company is a company in which the Fund has ownership of at least 5% of the voting securities. Fiscal year to date transactions with companies which are or were affiliates are as follows: |
Affiliate
(Amounts in thousands) | Value,
beginning of
period | Purchases | Sales
Proceeds | Dividend
Income | Value,
end of
period |
Exide Technologies | $ 11,516 | $ - | $ - | $ - | $ - |
Gray Television, Inc. | 6,327 | - | - | - | 29,414 |
OMNOVA Solutions, Inc. | 22,677 | - | - | - | 25,107 |
Service Corp. International | 176,344 | - | 11,722 | 3,250 | 244,446 |
Total | $ 216,864 | $ - | $ 11,722 | $ 3,250 | $ 298,967 |
Other Information |
The following is a summary of the inputs used, as of July 31, 2013, involving the Fund's assets and liabilities carried at fair value. The inputs or methodology used for valuing securities may not be an indication of the risk associated with investing in those securities. For more information on valuation inputs, and their aggregation into the levels used in the table below, please refer to the Investment Valuation section in the accompanying Notes to Financial Statements. |
Valuation Inputs at Reporting Date: |
Description
(Amounts in thousands) | Total | Level 1 | Level 2 | Level 3 |
Investments in Securities: | | | | |
Equities: | | | | |
Consumer Discretionary | $ 1,353,197 | $ 1,353,188 | $ - | $ 9 |
Consumer Staples | 126,105 | 126,105 | - | - |
Energy | 500,454 | 500,454 | - | - |
Financials | 504,368 | 504,368 | - | - |
Health Care | 531,408 | 531,408 | - | - |
Industrials | 557,522 | 557,522 | - | - |
Information Technology | 293,626 | 293,626 | - | - |
Materials | 608,868 | 608,868 | - | - |
Telecommunication Services | 24,542 | 24,542 | - | - |
Utilities | 166,590 | 166,590 | - | - |
Corporate Bonds | 20,249 | - | 20,249 | - |
Floating Rate Loans | 3,827 | - | 3,827 | - |
Money Market Funds | 798,690 | 798,690 | - | - |
Total Investments in Securities: | $ 5,489,446 | $ 5,465,361 | $ 24,076 | $ 9 |
Distribution of investments by country or territory of incorporation, as a percentage of total net assets, is as follows. (Unaudited) |
United States of America | 86.8% |
Netherlands | 7.4% |
Switzerland | 1.2% |
Others (Individually Less Than 1%) | 4.6% |
| 100.0% |
See accompanying notes which are an integral part of the financial statements.
Annual Report
Statement of Assets and Liabilities
Amounts in thousands (except per-share amounts) | July 31, 2013 |
| | |
Assets | | |
Investment in securities, at value (including securities loaned of $172,773) - See accompanying schedule: Unaffiliated issuers (cost $3,129,506) | $ 4,391,789 | |
Fidelity Central Funds (cost $798,690) | 798,690 | |
Other affiliated issuers (cost $151,688) | 298,967 | |
Total Investments (cost $4,079,884) | | $ 5,489,446 |
Receivable for fund shares sold | | 4,126 |
Dividends receivable | | 2,026 |
Interest receivable | | 997 |
Distributions receivable from Fidelity Central Funds | | 98 |
Other receivables | | 473 |
Total assets | | 5,497,166 |
| | |
Liabilities | | |
Payable for fund shares redeemed | $ 43,076 | |
Accrued management fee | 2,634 | |
Other affiliated payables | 731 | |
Other payables and accrued expenses | 243 | |
Collateral on securities loaned, at value | 171,038 | |
Total liabilities | | 217,722 |
| | |
Net Assets | | $ 5,279,444 |
Net Assets consist of: | | |
Paid in capital | | $ 4,089,583 |
Undistributed net investment income | | 22,624 |
Accumulated undistributed net realized gain (loss) on investments and foreign currency transactions | | (242,325) |
Net unrealized appreciation (depreciation) on investments | | 1,409,562 |
Net Assets | | $ 5,279,444 |
See accompanying notes which are an integral part of the financial statements.
Annual Report
Financial Statements - continued
Statement of Assets and Liabilities - continued
Amounts in thousands (except per-share amounts) | July 31, 2013 |
| | |
Leveraged Company Stock:
Net Asset Value, offering price and redemption price per share ($4,226,674 ÷ 107,175 shares) | | $ 39.44 |
| | |
Class K:
Net Asset Value, offering price and redemption price per share ($1,052,770 ÷ 26,639 shares) | | $ 39.52 |
See accompanying notes which are an integral part of the financial statements.
Annual Report
Statement of Operations
Amounts in thousands | Year ended July 31, 2013 |
| | |
Investment Income | | |
Dividends (including $3,250 earned from other affiliated issuers) | | $ 71,294 |
Special dividends | | 9,900 |
Interest | | 8,077 |
Income from Fidelity Central Funds | | 2,997 |
Total income | | 92,268 |
| | |
Expenses | | |
Management fee | $ 26,976 | |
Transfer agent fees | 7,093 | |
Accounting and security lending fees | 1,075 | |
Custodian fees and expenses | 43 | |
Independent trustees' compensation | 27 | |
Registration fees | 125 | |
Audit | 64 | |
Legal | 16 | |
Miscellaneous | 36 | |
Total expenses before reductions | 35,455 | |
Expense reductions | (194) | 35,261 |
Net investment income (loss) | | 57,007 |
Realized and Unrealized Gain (Loss) Net realized gain (loss) on: | | |
Investment securities: | | |
Unaffiliated issuers | 330,604 | |
Other affiliated issuers | 5,632 | |
Foreign currency transactions | 3 | |
Total net realized gain (loss) | | 336,239 |
Change in net unrealized appreciation (depreciation) on investment securities | | 1,098,022 |
Net gain (loss) | | 1,434,261 |
Net increase (decrease) in net assets resulting from operations | | $ 1,491,268 |
See accompanying notes which are an integral part of the financial statements.
Annual Report
Financial Statements - continued
Statement of Changes in Net Assets
Amounts in thousands | Year ended
July 31,
2013 | Year ended
July 31,
2012 |
Increase (Decrease) in Net Assets | | |
Operations | | |
Net investment income (loss) | $ 57,007 | $ 22,919 |
Net realized gain (loss) | 336,239 | 163,015 |
Change in net unrealized appreciation (depreciation) | 1,098,022 | (307,255) |
Net increase (decrease) in net assets resulting
from operations | 1,491,268 | (121,321) |
Distributions to shareholders from net investment income | (15,789) | (41,206) |
Share transactions - net increase (decrease) | 194,361 | (714,976) |
Redemption fees | 538 | 410 |
Total increase (decrease) in net assets | 1,670,378 | (877,093) |
| | |
Net Assets | | |
Beginning of period | 3,609,066 | 4,486,159 |
End of period (including undistributed net investment income of $22,624 and distributions in excess of net investment income of $18,505, respectively) | $ 5,279,444 | $ 3,609,066 |
See accompanying notes which are an integral part of the financial statements.
Annual Report
Financial Highlights - Leveraged Company Stock
Years ended July 31, | 2013 | 2012 | 2011 | 2010 | 2009 |
Selected Per-Share Data | | | | | |
Net asset value, beginning of period | $ 28.22 | $ 28.85 | $ 23.50 | $ 19.55 | $ 31.09 |
Income from Investment Operations | | | | | |
Net investment income (loss) B | .42 F | .16 | - H | .07 | .21 |
Net realized and unrealized gain (loss) | 10.92 | (.50) | 5.46 | 3.99 | (11.37) |
Total from investment operations | 11.34 | (.34) | 5.46 | 4.06 | (11.16) |
Distributions from net investment income | (.12) | (.29) | (.11) | (.11) | (.14) |
Distributions from net realized gain | - | - | - | - | (.25) |
Total distributions | (.12) | (.29) | (.11) | (.11) | (.39) |
Redemption fees added to paid in capital B | - H | - H | - H | - H | .01 |
Net asset value, end of period | $ 39.44 | $ 28.22 | $ 28.85 | $ 23.50 | $ 19.55 |
Total Return A | 40.31% | (1.05)% | 23.27% | 20.84% | (35.99)% |
Ratios to Average Net Assets C, G | | | | | |
Expenses before reductions | .82% | .86% | .85% | .88% | .92% |
Expenses net of fee waivers, if any | .82% | .86% | .85% | .88% | .92% |
Expenses net of all reductions | .82% | .85% | .84% | .88% | .92% |
Net investment income (loss) | 1.25% F | .60% | -% E | .29% | 1.17% |
Supplemental Data | | | | | |
Net assets, end of period (in millions) | $ 4,227 | $ 3,009 | $ 3,931 | $ 3,983 | $ 3,714 |
Portfolio turnover rate D | 21% | 29% | 18% | 21% | 34% |
A Total returns would have been lower if certain expenses had not been reduced during the applicable periods shown.
B Calculated based on average shares outstanding during the period.
C Fees and expenses of any underlying Fidelity Central Funds are not included in the Fund's expense ratio. The Fund indirectly bears its proportionate share of the expenses of any underlying Fidelity Central Funds.
D Amount does not include the portfolio activity of any underlying Fidelity Central Funds.
E Amount represents less than .01%.
F Investment income per share reflects a large, non-recurring dividend which amounted to $.08 per share. Excluding this non-recurring dividend, the ratio of net investment income (loss) to average net assets would have been 1.03%.
G Expense ratios reflect operating expenses of the class. Expenses before reductions do not reflect amounts reimbursed by the investment adviser or reductions from brokerage service arrangements or reductions from other expense offset arrangements and do not represent the amount paid by the class during periods when reimbursements or reductions occur. Expenses net of fee waivers reflect expenses after reimbursement by the investment adviser but prior to reductions from brokerage service arrangements or other expense offset arrangements. Expenses net of all reductions represent the net expenses paid by the class.
H Amount represents less than $.01 per share.
See accompanying notes which are an integral part of the financial statements.
Annual Report
Financial Highlights - Class K
Years ended July 31, | 2013 | 2012 | 2011 | 2010 | 2009 |
Selected Per-Share Data | | | | | |
Net asset value, beginning of period | $ 28.26 | $ 28.86 | $ 23.52 | $ 19.56 | $ 31.11 |
Income from Investment Operations | | | | | |
Net investment income (loss) B | .47 E | .20 | .04 | .11 | .21 |
Net realized and unrealized gain (loss) | 10.93 | (.49) | 5.45 | 4.00 | (11.35) |
Total from investment operations | 11.40 | (.29) | 5.49 | 4.11 | (11.14) |
Distributions from net investment income | (.14) | (.31) | (.15) | (.15) | (.17) |
Distributions from net realized gain | - | - | - | - | (.25) |
Total distributions | (.14) | (.31) | (.15) | (.15) | (.42) |
Redemption fees added to paid in capital B | - G | - G | - G | - G | .01 |
Net asset value, end of period | $ 39.52 | $ 28.26 | $ 28.86 | $ 23.52 | $ 19.56 |
Total Return A | 40.47% | (.87)% | 23.45% | 21.09% | (35.86)% |
Ratios to Average Net Assets C, F | | | | | |
Expenses before reductions | .69% | .69% | .69% | .70% | .71% |
Expenses net of fee waivers, if any | .69% | .69% | .69% | .70% | .71% |
Expenses net of all reductions | .68% | .69% | .69% | .69% | .71% |
Net investment income (loss) | 1.39% E | .76% | .16% | .47% | 1.39% |
Supplemental Data | | | | | |
Net assets, end of period (in millions) | $ 1,053 | $ 600 | $ 555 | $ 410 | $ 267 |
Portfolio turnover rate D | 21% | 29% | 18% | 21% | 34% |
A Total returns would have been lower if certain expenses had not been reduced during the applicable periods shown.
B Calculated based on average shares outstanding during the period.
C Fees and expenses of any underlying Fidelity Central Funds are not included in the Fund's expense ratio. The Fund indirectly bears its proportionate share of the expenses of any underlying Fidelity Central Funds.
D Amount does not include the portfolio activity of any underlying Fidelity Central Funds.
E Investment income per share reflects a large, non-recurring dividend which amounted to $.08 per share. Excluding this non-recurring dividend, the ratio of net investment income (loss) to average net assets would have been 1.17%.
F Expense ratios reflect operating expenses of the class. Expenses before reductions do not reflect amounts reimbursed by the investment adviser or reductions from brokerage service arrangements or reductions from other expense offset arrangements and do not represent the amount paid by the class during periods when reimbursements or reductions occur. Expenses net of fee waivers reflect expenses after reimbursement by the investment adviser but prior to reductions from brokerage service arrangements or other expense offset arrangements. Expenses net of all reductions represent the net expenses paid by the class.
G Amount represents less than $.01 per share.
See accompanying notes which are an integral part of the financial statements.
Annual Report
Notes to Financial Statements
For the period ended July 31, 2013
(Amounts in thousands except percentages)
1. Organization.
Fidelity Leveraged Company Stock Fund (the Fund) is a fund of Fidelity Securities Fund (the Trust) and is authorized to issue an unlimited number of shares. The Trust is registered under the Investment Company Act of 1940, as amended (the 1940 Act), as an open-end management investment company organized as a Massachusetts business trust. The Fund offers Leveraged Company Stock and Class K shares, each of which has equal rights as to assets and voting privileges. Each class has exclusive voting rights with respect to matters that affect that class.
2. Investments in Fidelity Central Funds.
The Fund invests in Fidelity Central Funds, which are open-end investment companies generally available only to other investment companies and accounts managed by Fidelity Management & Research Company (FMR) and its affiliates. The Fund's Schedule of Investments lists each of the Fidelity Central Funds held as of period end, if any, as an investment of the Fund, but does not include the underlying holdings of each Fidelity Central Fund. As an Investing Fund, the Fund indirectly bears its proportionate share of the expenses of the underlying Fidelity Central Funds.
The Money Market Central Funds seek preservation of capital and current income and are managed by Fidelity Investments Money Management, Inc. (FIMM), an affiliate of FMR.
A complete unaudited list of holdings for each Fidelity Central Fund is available upon request or at the Securities and Exchange Commission (the SEC) website at www.sec.gov. In addition, the financial statements of the Fidelity Central Funds, which are not covered by the Fund's Report of Independent Registered Public Accounting Firm, are available on the SEC website or upon request.
3. Significant Accounting Policies.
The financial statements have been prepared in conformity with accounting principles generally accepted in the United States of America (GAAP), which require management to make certain estimates and assumptions at the date of the financial statements. Actual results could differ from those estimates. Subsequent events, if any, through the date that the financial statements were issued have been evaluated in the preparation of the financial statements. The following summarizes the significant accounting policies of the Fund:
Investment Valuation. Investments are valued as of 4:00 p.m. Eastern time on the last calendar day of the period. In accordance with valuation policies and procedures approved by the Board of Trustees (the Board), the Fund attempts to obtain prices from one or more third party pricing vendors or brokers to value its investments. When
Annual Report
3. Significant Accounting Policies - continued
Investment Valuation - continued
current market prices, quotations or currency exchange rates are not readily available or reliable, investments will be fair valued in good faith by the FMR Fair Value Committee (the Committee), in accordance with procedures adopted by the Board. Factors used in determining fair value vary by investment type and may include market or investment specific events, changes in interest rates and credit quality. The frequency with which these procedures are used cannot be predicted and they may be utilized to a significant extent. The Committee oversees the Fund's valuation policies and procedures and is responsible for approving and reporting to the Board all fair value determinations.
The Fund categorizes the inputs to valuation techniques used to value its investments into a disclosure hierarchy consisting of three levels as shown below:
Level 1 - quoted prices in active markets for identical investments
Level 2 - other significant observable inputs (including quoted prices for similar investments, interest rates, prepayment speeds, etc.)
Level 3 - unobservable inputs (including the Fund's own assumptions based on the best information available)
Valuation techniques used to value the Fund's investments by major category are as follows:
Equity securities, including restricted securities, for which market quotations are readily available, are valued at the last reported sale price or official closing price as reported by a third party pricing vendor on the primary market or exchange on which they are traded and are categorized as Level 1 in the hierarchy. In the event there were no sales during the day or closing prices are not available, securities are valued at the last quoted bid price or may be valued using the last available price and are generally categorized as Level 2 in the hierarchy. For foreign equity securities, when market or security specific events arise, comparisons to the valuation of American Depositary Receipts (ADRs), futures contracts, Exchange-Traded Funds (ETFs) and certain indexes as well as quoted prices for similar securities may be used and would be categorized as Level 2 in the hierarchy. Utilizing these techniques may result in transfers between Level 1 and Level 2. For restricted equity securities and private placements where observable inputs are limited, assumptions about market activity and risk are used and these securities are generally categorized as Level 3 in the hierarchy.
Debt securities, including restricted securities, are valued based on evaluated prices received from third party pricing vendors or from brokers who make markets in such securities. For corporate bonds and floating rate loans, pricing vendors utilize matrix pricing which considers yield or price of bonds of comparable quality, coupon, maturity
Annual Report
Notes to Financial Statements - continued
(Amounts in thousands except percentages)
3. Significant Accounting Policies - continued
Investment Valuation - continued
and type as well as broker-supplied prices. When independent prices are unavailable or unreliable, debt securities may be valued utilizing pricing methodologies which consider similar factors that would be used by third party pricing vendors. Debt securities are generally categorized as Level 2 in the hierarchy but may be Level 3 depending on the circumstances.
Investments in open-end mutual funds, including the Fidelity Central Funds, are valued at their closing net asset value (NAV) each business day and are categorized as Level 1 in the hierarchy.
Changes in valuation techniques may result in transfers in or out of an assigned level within the disclosure hierarchy. The aggregate value of investments by input level, as of July 31, 2013, is included at the end of the Fund's Schedule of Investments.
Foreign Currency. The Fund may use foreign currency contracts to facilitate transactions in foreign-denominated securities. Gains and losses from these transactions may arise from changes in the value of the foreign currency or if the counterparties do not perform under the contracts' terms.
Foreign-denominated assets, including investment securities, and liabilities are translated into U.S. dollars at the exchange rates at period end. Purchases and sales of investment securities, income and dividends received and expenses denominated in foreign currencies are translated into U.S. dollars at the exchange rate in effect on the transaction date.
The effects of exchange rate fluctuations on investments are included with the net realized and unrealized gain (loss) on investment securities. Other foreign currency transactions resulting in realized and unrealized gain (loss) are disclosed separately.
Investment Transactions and Income. For financial reporting purposes, the Fund's investment holdings and NAV include trades executed through the end of the last business day of the period. The NAV per share for processing shareholder transactions is calculated as of the close of business of the New York Stock Exchange (NYSE), normally 4:00 p.m. Eastern time and includes trades executed through the end of the prior business day. Gains and losses on securities sold are determined on the basis of identified cost and may include proceeds received from litigation. Dividend income is recorded on the ex-dividend date, except for certain dividends from foreign securities where the ex-dividend date may have passed, which are recorded as soon as the Fund is informed of the ex-dividend date. Non-cash dividends included in dividend income, if any, are recorded at the fair market value of the securities received. Distributions received on securities that represent a return of capital or capital gain are recorded as a reduction of
Annual Report
3. Significant Accounting Policies - continued
Investment Transactions and Income - continued
cost of investments and/or as a realized gain. Subsequent to ex-dividend date the Fund determines the components of these distributions, based upon receipt of tax filings or other correspondence relating to the underlying investment. Large, non-recurring dividends recognized by the Fund are presented separately on the Statement of Operations as "Special Dividends" and the impact of these dividends is presented in the Financial Highlights. Interest income and distributions from the Fidelity Central Funds are accrued as earned. Interest income includes coupon interest and amortization of premium and accretion of discount on debt securities. Investment income is recorded net of foreign taxes withheld where recovery of such taxes is uncertain. Debt obligations may be placed on non-accrual status and related interest income may be reduced by ceasing current accruals and writing off interest receivables when the collection of all or a portion of interest has become doubtful based on consistently applied procedures. A debt obligation is removed from non-accrual status when the issuer resumes interest payments or when collectability of interest is reasonably assured.
Class Allocations and Expenses. Investment income, realized and unrealized capital gains and losses, common expenses of the Fund, and certain fund-level expense reductions, if any, are allocated on a pro-rata basis to each class based on the relative net assets of each class to the total net assets of the Fund. Each class differs with respect to transfer agent fees incurred. Certain expense reductions may also differ by class. Expenses directly attributable to a fund are charged to that fund. Expenses attributable to more than one fund are allocated among the respective funds on the basis of relative net assets or other appropriate methods. Expense estimates are accrued in the period to which they relate and adjustments are made when actual amounts are known.
Income Tax Information and Distributions to Shareholders. Each year, the Fund intends to qualify as a regulated investment company under Subchapter M of the Internal Revenue Code, including distributing substantially all of its taxable income and realized gains. As a result, no provision for income taxes is required. As of July 31, 2013, the Fund did not have any unrecognized tax benefits in the financial statements; nor is the Fund aware of any tax positions for which it is reasonably possible that the total amounts of unrecognized tax benefits will significantly change in the next twelve months. The Fund files a U.S. federal tax return, in addition to state and local tax returns as required. A fund's federal income tax returns are subject to examination by the Internal Revenue Service (IRS) for a period of three fiscal years after they are filed. State and local tax returns may be subject to examination for an additional fiscal year depending on the jurisdiction. Foreign taxes are provided for based on the Fund's understanding of the tax rules and rates that exist in the foreign markets in which it invests.
Annual Report
Notes to Financial Statements - continued
(Amounts in thousands except percentages)
3. Significant Accounting Policies - continued
Income Tax Information and Distributions to Shareholders - continued
Distributions are declared and recorded on the ex-dividend date. Income dividends and capital gain distributions are declared separately for each class. Income and capital gain distributions are determined in accordance with income tax regulations, which may differ from GAAP.
Capital accounts within the financial statements are adjusted for permanent book-tax differences. These adjustments have no impact on net assets or the results of operations. Temporary book-tax differences will reverse in a subsequent period.
Book-tax differences are primarily due to foreign currency transactions, market discount, equity debt classifications, capital loss carryforwards, losses deferred due to wash sales and excise tax regulations.
The federal tax cost of investment securities and unrealized appreciation (depreciation) as of period end were as follows:
Gross unrealized appreciation | $ 1,660,648 |
Gross unrealized depreciation | (249,320) |
Net unrealized appreciation (depreciation) on securities and other investments | $ 1,411,328 |
| |
Tax Cost | $ 4,078,118 |
The tax-based components of distributable earnings as of period end were as follows:
Undistributed ordinary income | $ 21,058 |
Capital loss carryforward | $ (242,325) |
Net unrealized appreciation (depreciation) | $ 1,411,328 |
Capital loss carryforwards are only available to offset future capital gains of the Fund to the extent provided by regulations and may be limited. Under the Regulated Investment Company Modernization Act of 2010 (the Act), the Fund is permitted to carry forward capital losses incurred in taxable years beginning after December 22, 2010 for an unlimited period and such capital losses are required to be used prior to any losses that expire. The capital loss carryforward information presented below, including any applicable limitation, is estimated as of fiscal period end and is subject to adjustment.
Fiscal year of expiration | |
2018 | $ (242,325) |
Annual Report
3. Significant Accounting Policies - continued
Income Tax Information and Distributions to Shareholders - continued
The tax character of distributions paid was as follows:
| July 31, 2013 | July 31, 2012 |
Ordinary Income | $ 15,789 | $ 41,206 |
Short-Term Trading (Redemption) Fees. Shares held by investors in the Fund less than 90 days may have been subject to a redemption fee equal to 1.50% of the net asset value of shares redeemed. All redemption fees, which reduce the proceeds of the shareholder redemption, are retained by the Fund and accounted for as an addition to paid in capital.
Restricted Securities. The Fund may invest in securities that are subject to legal or contractual restrictions on resale. These securities generally may be resold in transactions exempt from registration or to the public if the securities are registered. Disposal of these securities may involve time-consuming negotiations and expense, and prompt sale at an acceptable price may be difficult. Information regarding restricted securities is included at the end of the Fund's Schedule of Investments.
Loans and Other Direct Debt Instruments. The Fund invests in direct debt instruments which are interests in amounts owed to lenders by corporate or other borrowers. These instruments may be in the form of loans, trade claims or other receivables and may include standby financing commitments such as revolving credit facilities that obligate the Fund to supply additional cash to the borrower on demand. Loans may be acquired through assignment or participation, or may be made directly to a borrower. The Fund may be contractually obligated to receive approval from the agent bank and/or borrower prior to the sale of these loans.
4. Purchases and Sales of Investments.
Purchases and sales of securities, other than short-term securities, aggregated $825,467 and $903,237, respectively.
5. Fees and Other Transactions with Affiliates.
Management Fee. FMR and its affiliates provide the Fund with investment management related services for which the Fund pays a monthly management fee. The management fee is the sum of an individual fund fee rate that is based on an annual rate of .35% of the Fund's average net assets and an annualized group fee rate that averaged .26% during the period. The group fee rate is based upon the average net assets of all the mutual funds advised by FMR. The group fee rate decreases as assets under management
Annual Report
Notes to Financial Statements - continued
(Amounts in thousands except percentages)
5. Fees and Other Transactions with Affiliates - continued
Management Fee - continued
increase and increases as assets under management decrease. For the period, the total annual management fee rate was .61% of the Fund's average net assets.
Transfer Agent Fees. Fidelity Investments Institutional Operations Company, Inc., (FIIOC), an affiliate of FMR, is the transfer, dividend disbursing and shareholder servicing agent for each class of the Fund. FIIOC receives account fees and asset-based fees that vary according to the account size and type of account of the shareholders of Leveraged Company Stock. FIIOC receives an asset-based fee of Class K's average net assets. FIIOC pays for typesetting, printing and mailing of shareholder reports, except proxy statements. For the period, transfer agent fees for each class were as follows:
| Amount | % of
Average
Net Assets |
Leveraged Company Stock | $ 6,680 | .18 |
Class K | 413 | .05 |
| $ 7,093 | |
Accounting and Security Lending Fees. Fidelity Service Company, Inc. (FSC), an affiliate of FMR, maintains the Fund's accounting records. The accounting fee is based on the level of average net assets for each month. Under a separate contract, FSC administers the security lending program. The security lending fee is based on the number and duration of lending transactions.
Brokerage Commissions. The Fund placed a portion of its portfolio transactions with brokerage firms which are affiliates of the investment adviser. Brokerage commissions are included in net realized gain (loss) and change in net unrealized appreciation (depreciation) in the Statement of Operations. The commissions paid to these affiliated firms were $31 for the period.
6. Committed Line of Credit.
The Fund participates with other funds managed by FMR or an affiliate in a $4.25 billion credit facility (the "line of credit") to be utilized for temporary or emergency purposes to fund shareholder redemptions or for other short-term liquidity purposes. The Fund has agreed to pay commitment fees on its pro-rata portion of the line of credit, which amounted to $10 and is reflected in Miscellaneous expenses on the Statement of Operations. During the period, there were no borrowings on this line of credit.
Annual Report
7. Security Lending.
The Fund lends portfolio securities through a lending agent from time to time in order to earn additional income. For equity securities, a lending agent is used and may loan securities to certain qualified borrowers, including Fidelity Capital Markets (FCM), a broker-dealer affiliated with the Fund. On the settlement date of the loan, the Fund receives collateral (in the form of U.S. Treasury obligations, letters of credit and/or cash) against the loaned securities and maintains collateral in an amount not less than 100% of the market value of the loaned securities during the period of the loan. The market value of the loaned securities is determined at the close of business of the Fund and any additional required collateral is delivered to the Fund on the next business day. If the borrower defaults on its obligation to return the securities loaned because of insolvency or other reasons, the Fund may apply collateral received from the borrower against the obligation. The Fund may experience delays and costs in recovering the securities loaned. Any cash collateral received is invested in the Fidelity Securities Lending Cash Central Fund. The value of loaned securities and cash collateral at period end are disclosed on the Fund's Statement of Assets and Liabilities. Security lending income represents the income earned on investing cash collateral, less rebates paid to borrowers, plus any premium payments received for lending certain types of securities. Security lending income is presented in the Statement of Operations as a component of income from Fidelity Central Funds. Total security lending income during the period amounted to $2,121, including $51 from securities loaned to FCM.
8. Expense Reductions.
Commissions paid to certain brokers with whom FMR places trades on behalf of the Fund include an amount in addition to trade execution, which is rebated back to the Fund to offset certain expenses. This amount totaled $182 for the period.
Through arrangements with the Fund's custodian, credits realized as a result of uninvested cash balances were used to reduce the Fund's expenses. During the period, these credits reduced the Fund's custody expenses by three hundred and forty nine dollars.
In addition, FMR reimbursed a portion of the Fund's operating expenses during the period in the amount of $12.
9. Distributions to Shareholders.
Distributions to shareholders of each class were as follows:
Years ended July 31, | 2013 | 2012 |
From net investment income | | |
Leveraged Company Stock | $ 12,562 | $ 35,167 |
Class K | 3,227 | 6,039 |
Total | $ 15,789 | $ 41,206 |
Annual Report
Notes to Financial Statements - continued
(Amounts in thousands except percentages)
10. Share Transactions.
Transactions for each class of shares were as follows:
| Shares | Dollars |
Years ended July 31, | 2013 | 2012 | 2013 | 2012 |
Leveraged Company Stock | | | | |
Shares sold | 26,431 | 11,853 | $ 888,852 | $ 318,644 |
Reinvestment of distributions | 378 | 1,333 | 11,889 | 33,481 |
Shares redeemed | (26,251) | (42,830) | (883,700) | (1,123,666) |
Net increase (decrease) | 558 | (29,644) | $ 17,041 | $ (771,541) |
Class K | | | | |
Shares sold | 11,840 | 9,320 | $ 395,282 | $ 250,995 |
Reinvestment of distributions | 102 | 240 | 3,227 | 6,039 |
Shares redeemed | (6,546) | (7,542) | (221,189) | (200,469) |
Net increase (decrease) | 5,396 | 2,018 | $ 177,320 | $ 56,565 |
11. Other.
The Fund's organizational documents provide former and current trustees and officers with a limited indemnification against liabilities arising in connection with the performance of their duties to the Fund. In the normal course of business, the Fund may also enter into contracts that provide general indemnifications. The Fund's maximum exposure under these arrangements is unknown as this would be dependent on future claims that may be made against the Fund. The risk of material loss from such claims is considered remote.
Annual Report
To the Trustees of Fidelity Securities Fund and the Shareholders of Fidelity Leveraged Company Stock Fund:
In our opinion, the accompanying statement of assets and liabilities, including the schedule of investments, and the related statements of operations and of changes in net assets and the financial highlights present fairly, in all material respects, the financial position of Fidelity Leveraged Company Stock Fund (a fund of Fidelity Securities Fund) at July 31, 2013, the results of its operations for the year then ended, the changes in its net assets for each of the two years in the period then ended and the financial highlights for each of the five years in the period then ended, in conformity with accounting principles generally accepted in the United States of America. These financial statements and financial highlights (hereafter referred to as "financial statements") are the responsibility of the Fidelity Leveraged Company Stock Fund's management. Our responsibility is to express an opinion on these financial statements based on our audits. We conducted our audits of these financial statements in accordance with the standards of the Public Company Accounting Oversight Board (United States). Those standards require that we plan and perform the audit to obtain reasonable assurance about whether the financial statements are free of material misstatement. An audit includes examining, on a test basis, evidence supporting the amounts and disclosures in the financial statements, assessing the accounting principles used and significant estimates made by management, and evaluating the overall financial statement presentation. We believe that our audits, which included confirmation of securities at July 31, 2013 by correspondence with the custodian, agent bank and brokers, provide a reasonable basis for our opinion.
PricewaterhouseCoopers LLP
Boston, Massachusetts
September 17, 2013
Annual Report
The Trustees, Member of the Advisory Board, and executive officers of the trust and fund, as applicable, are listed below. The Board of Trustees governs the fund and is responsible for protecting the interests of shareholders. The Trustees are experienced executives who meet periodically throughout the year to oversee the fund's activities, review contractual arrangements with companies that provide services to the fund, oversee management of the risks associated with such activities and contractual arrangements, and review the fund's performance. Except for James C. Curvey, Ned C. Lautenbach, Ronald P. O'Hanley, and William S. Stavropoulos, each of the Trustees oversees 166 Fidelity funds. Mr. Curvey oversees 387 Fidelity funds. Mr. Lautenbach, Mr. O'Hanley, and Mr. Stavropoulos each oversees 230 Fidelity funds.
The Trustees hold office without limit in time except that (a) any Trustee may resign; (b) any Trustee may be removed by written instrument, signed by at least two-thirds of the number of Trustees prior to such removal; (c) any Trustee who requests to be retired or who has become incapacitated by illness or injury may be retired by written instrument signed by a majority of the other Trustees; and (d) any Trustee may be removed at any special meeting of shareholders by a two-thirds vote of the outstanding voting securities of the trust. Each Trustee who is not an interested person of the trust and the fund (as defined in the 1940 Act) (Independent Trustee), shall retire not later than the last day of the calendar year in which his or her 75th birthday occurs. The Independent Trustees may waive this mandatory retirement age policy with respect to individual Trustees. The executive officers and Advisory Board Member hold office without limit in time, except that any officer and Advisory Board Member may resign or may be removed by a vote of a majority of the Trustees at any regular meeting or any special meeting of the Trustees. Except as indicated, each individual has held the office shown or other offices in the same company for the past five years.
Experience, Skills, Attributes, and Qualifications of the Fund's Trustees. The Governance and Nominating Committee has adopted a statement of policy that describes the experience, qualifications, attributes, and skills that are necessary and desirable for potential Independent Trustee candidates (Statement of Policy). The Board believes that each Trustee satisfied at the time he or she was initially elected or appointed a Trustee, and continues to satisfy, the standards contemplated by the Statement of Policy. The Governance and Nominating Committee also engages professional search firms to help identify potential Independent Trustee candidates who have the experience, qualifications, attributes, and skills consistent with the Statement of Policy. From time to time, additional criteria based on the composition and skills of the current Independent Trustees, as well as experience or skills that may be appropriate in light of future changes to board composition, business conditions, and regulatory or other developments, have also been considered by the professional search firms and the Governance and Nominating Committee. In addition, the Board takes into account the Trustees' commitment and participation in Board and committee meetings, as well as their leadership of standing and ad hoc committees throughout their tenure.
Annual Report
Trustees and Officers - continued
In determining that a particular Trustee was and continues to be qualified to serve as a Trustee, the Board has considered a variety of criteria, none of which, in isolation, was controlling. The Board believes that, collectively, the Trustees have balanced and diverse experience, qualifications, attributes, and skills, which allow the Board to operate effectively in governing the fund and protecting the interests of shareholders. Information about the specific experience, skills, attributes, and qualifications of each Trustee, which in each case led to the Board's conclusion that the Trustee should serve (or continue to serve) as a trustee of the fund, is provided below.
Board Structure and Oversight Function. James C. Curvey is an interested person (as defined in the 1940 Act) and currently serves as Chairman. The Trustees have determined that an interested Chairman is appropriate and benefits shareholders because an interested Chairman has a personal and professional stake in the quality and continuity of services provided to the fund. Independent Trustees exercise their informed business judgment to appoint an individual of their choosing to serve as Chairman, regardless of whether the Trustee happens to be independent or a member of management. The Independent Trustees have determined that they can act independently and effectively without having an Independent Trustee serve as Chairman and that a key structural component for assuring that they are in a position to do so is for the Independent Trustees to constitute a substantial majority for the Board. The Independent Trustees also regularly meet in executive session. Ned C. Lautenbach serves as Chairman of the Independent Trustees and as such (i) acts as a liaison between the Independent Trustees and management with respect to matters important to the Independent Trustees and (ii) with management prepares agendas for Board meetings.
Fidelity funds are overseen by different Boards of Trustees. The fund's Board oversees Fidelity's equity and high income funds and another Board oversees Fidelity's investment-grade bond, money market, and asset allocation funds. The asset allocation funds may invest in Fidelity funds overseen by the fund's Board. The use of separate Boards, each with its own committee structure, allows the Trustees of each group of Fidelity funds to focus on the unique issues of the funds they oversee, including common research, investment, and operational issues. On occasion, the separate Boards establish joint committees to address issues of overlapping consequences for the Fidelity funds overseen by each Board.
The Trustees operate using a system of committees to facilitate the timely and efficient consideration of all matters of importance to the Trustees, the fund, and fund shareholders and to facilitate compliance with legal and regulatory requirements and oversight of the fund's activities and associated risks. The Board, acting through its committees, has charged FMR and its affiliates with (i) identifying events or circumstances the occurrence of which could have demonstrably adverse effects on the fund's business and/or reputation; (ii) implementing processes and controls to lessen the possibility that such events or circumstances occur or to mitigate the effects of such events or circumstances if they do occur; and (iii) creating and maintaining a system designed to evaluate continuously business and market conditions in order to facilitate the identification and implementation processes described in (i) and (ii) above. Because the day-to-day operations and activities of the fund are carried out by or through FMR, its affiliates and other service providers, the fund's exposure to risks is mitigated but not eliminated by the processes overseen by the Trustees. While each of the Board's committees has responsibility for overseeing different aspects of the fund's activities, oversight is exercised primarily through the Operations, Audit, and Compliance Committees. In addition, the Independent Trustees have worked with FMR to enhance the Board's oversight of investment and financial risks, legal and regulatory risks, technology risks, and operational risks, including the development of additional risk reporting to the Board. For example, a working group comprised of Independent Trustees and FMR has worked and continues to work to review the Fidelity funds' valuation-related activities, reporting and risk management. Appropriate personnel, including but not limited to the fund's Chief Compliance Officer (CCO), FMR's internal auditor, the independent accountants, the fund's Treasurer and portfolio management personnel, make periodic reports to the Board's committees, as appropriate, including an annual review of FMR's risk management program for the Fidelity funds. The responsibilities of each standing committee, including their oversight responsibilities, are described further under "Standing Committees of the Fund's Trustees."
Annual Report
The fund's Statement of Additional Information (SAI) includes more information about the Trustees. To request a free copy, call Fidelity at 1-800-544-8544.
Interested Trustees*:
Correspondence intended for each Trustee who is an interested person may be sent to Fidelity Investments, 245 Summer Street, Boston, Massachusetts 02210.
Name, Year of Birth; Principal Occupations and Other Relevant Experience+ |
James C. Curvey (1935) |
| Year of Election or Appointment: 2007 Mr. Curvey is Trustee and Chairman of the Board of Trustees of certain Trusts. Mr. Curvey also serves as Trustee (2007-present) of other investment companies advised by FMR. Mr. Curvey is a Director of Fidelity Investments Money Management, Inc. (2009-present), Director of Fidelity Research & Analysis Co. (2009-present) and Director of FMR and FMR Co., Inc. (2007-present). Mr. Curvey is also Vice Chairman (2007-present) and Director of FMR LLC. In addition, Mr. Curvey serves as an Overseer for the Boston Symphony Orchestra and a member of the Trustees of Villanova University. Previously, Mr. Curvey was the Vice Chairman (2006-2007) and Director (2000-2007) of FMR Corp. |
Ronald P. O'Hanley (1957) |
| Year of Election or Appointment: 2011 Mr. O'Hanley serves as a Trustee and Chairman of the Board of Trustees of other Fidelity funds (2013-present), and is Director of FMR Co., Inc. (2010-present), Director of Fidelity Investments Money Management, Inc. (2010-present), Director of Fidelity Research & Analysis Company (2010-present), President of Fidelity Asset Management and Corporate Services and a Member of Fidelity's Executive Committee (2010- present). Previously, Mr. O'Hanley served as President and Chief Executive Officer of BNY Mellon Asset Management (2007-2010). Mr. O'Hanley also served as Vice Chairman of Bank New York Mellon Corp. and a member of that firm's Executive Committee. Prior to the 2007 merger of The Bank of New York and Mellon Financial Corporation, he was Vice Chairman of Mellon Financial Corporation and President and Chief Executive Officer of Mellon Asset Management. He joined Mellon in February 1997. Mr. O'Hanley currently serves as Chairman of the Boston Public Library Foundation Board of Directors and sits on the Board of Directors of Beth Israel Deaconess Medical Center, the Board of Trustees of the Marine Biological Laboratory and the Advisory Board of the Maxwell School of Citizenship and Public Administration at Syracuse University. Mr. O'Hanley also chairs the Council on Asset Management for the Financial Services Roundtable and is a member of the Board of Directors of Institutional Investor's U.S. Institute. |
* Trustees have been determined to be "Interested Trustees" by virtue of, among other things, their affiliation with the trust or various entities under common control with FMR.
+ The information above includes each Trustee's principal occupation during the last five years and other information relating to the experience, attributes, and skills relevant to each Trustee's qualifications to serve as a Trustee, which led to the conclusion that each Trustee should serve as a Trustee for the fund.
Annual Report
Independent Trustees:
Correspondence intended for each Independent Trustee (that is, the Trustees other than the Interested Trustees) may be sent to Fidelity Investments, P.O. Box 55235, Boston, Massachusetts 02205-5235.
Name, Year of Birth; Principal Occupations and Other Relevant Experience+ |
Dennis J. Dirks (1948) |
| Year of Election or Appointment: 2005 Prior to his retirement in May 2003, Mr. Dirks was Chief Operating Officer and a member of the Board of The Depository Trust & Clearing Corporation (DTCC). He also served as President, Chief Operating Officer, and Board member of The Depository Trust Company (DTC) and President and Board member of the National Securities Clearing Corporation (NSCC). In addition, Mr. Dirks served as Chief Executive Officer and Board member of the Government Securities Clearing Corporation, Chief Executive Officer and Board member of the Mortgage-Backed Securities Clearing Corporation, as a Trustee and a member of the Finance Committee of Manhattan College (2005-2008), and as a Trustee and a member of the Finance Committee of AHRC of Nassau County (2006-2008). Mr. Dirks is a member of the Independent Directors Council (IDC) Governing Council (2010-present) and Board of Directors for The Brookville Center for Children's Services, Inc. (2009-present). |
Alan J. Lacy (1953) |
| Year of Election or Appointment: 2008 Mr. Lacy serves as Senior Adviser (2007-present) of Oak Hill Capital Partners, L.P. (private equity). Mr. Lacy also served as Chief Executive Officer (2000-2005) and Vice Chairman (2005-2006) of Sears Holdings Corporation and Sears, Roebuck and Co. (retail). In addition, Mr. Lacy serves as a member of the Board of Directors of Dave & Buster's Entertainment, Inc. (restaurant and entertainment complexes, 2010-present), Earth Fare, Inc. (retail grocery, 2012-present), The Hillman Companies, Inc. (hardware wholesalers, 2010-present), and Bristol-Myers Squibb Company (global pharmaceuticals, 2008-present). Mr. Lacy is a member of the Board of Trustees of The National Parks Conservation Association (2006-present). Previously, Mr. Lacy served as Chairman of the Board of Trustees of the National Parks Conservation Association (2008-2011) and as a member of the Board of Directors for the Western Union Company (global money transfer, 2006-2011). |
Ned C. Lautenbach (1944) |
| Year of Election or Appointment: 2000 Mr. Lautenbach is Chairman of the Independent Trustees of the Equity and High Income Funds (2006-present) and serves as a Trustee of other Fidelity funds (2013-present). Mr. Lautenbach currently serves as the Lead Director of the Eaton Corporation Board of Directors (diversified industrial, 1997-present). Mr. Lautenbach is Chairman of the Board of Directors of the Philharmonic Center for the Arts in Naples, Florida (2012-present) and a member of the Council on Foreign Relations (1994-present). Previously, Mr. Lautenbach was a Partner/Advisory Partner at Clayton, Dubilier & Rice, LLC (private equity investment, 1998-2010), as well as a Director of Sony Corporation (2006-2007). |
Joseph Mauriello (1944) |
| Year of Election or Appointment: 2008 Prior to his retirement in January 2006, Mr. Mauriello served in numerous senior management positions including Deputy Chairman and Chief Operating Officer (2004-2005), and Vice Chairman of Financial Services (2002-2004) of KPMG LLP US (professional services, 1965-2005). Mr. Mauriello currently serves as a member of the Board of Directors of XL Group plc. (global insurance and re-insurance, 2006-present). Previously, Mr. Mauriello served as a Director of the Hamilton Funds of the Bank of New York (2006-2007) and of Arcadia Resources Inc. (health care services and products, 2007-2012). |
Robert W. Selander (1950) |
| Year of Election or Appointment: 2011 Previously, Mr. Selander served as a Member of the Advisory Board of Fidelity's Equity and High Income Funds (2011), Executive Vice Chairman (2010), Chief Executive Officer (2009-2010), and President and Chief Executive Officer (1997-2009) of Mastercard, Inc. |
Cornelia M. Small (1944) |
| Year of Election or Appointment: 2005 Ms. Small is a member of the Board of Directors (2009-present) and Chair of the Investment Committee (2010-present) of the Teagle Foundation. Ms. Small also serves on the Investment Committee of the Berkshire Taconic Community Foundation (2008-present). Previously, Ms. Small served as Chairperson (2002-2008) and a member of the Investment Committee and Chairperson (2008-2012) and a member of the Board of Trustees of Smith College. In addition, Ms. Small served as Chief Investment Officer, Director of Global Equity Investments, and a member of the Board of Directors of Scudder, Stevens & Clark and Scudder Kemper Investments. |
William S. Stavropoulos (1939) |
| Year of Election or Appointment: 2002 Mr. Stavropoulos is Vice Chairman of the Independent Trustees of the Equity and High Income Funds (2006-present) and serves as a Trustee of other Fidelity funds (2013-present). Mr. Stavropoulos serves as President and Founder of the Michigan Baseball Foundation, the Great Lakes Loons (2007-present). Mr. Stavropoulos is Chairman Emeritus of the Board of Directors of The Dow Chemical Company, where he previously served in numerous senior management positions, including President, CEO (1995-2000; 2002-2004), Chairman of the Executive Committee (2000-2006), and as a member of the Board of Directors (1990-2006). Currently, Mr. Stavropoulos is Chairman of the Board of Directors of Univar Inc. (global distributor of commodity and specialty chemicals), a Director of Teradata Corporation (data warehousing and technology solutions), and Maersk Inc. (industrial conglomerate), and a member of the Advisory Board for Metalmark Capital LLC (private equity investment, 2005-present). Mr. Stavropoulos is an operating advisor to Clayton, Dubilier & Rice, LLC (private equity investment). In addition, Mr. Stavropoulos is a member of the University of Notre Dame Advisory Council for the College of Science, a Trustee of the Rollin L. Gerstacker Foundation, and a Director of the Naples Philharmonic Center for the Arts. Previously, Mr. Stavropoulos served as a Director of Chemical Financial Corporation (bank holding company, 1993-2012) and Tyco International, Ltd. (multinational manufacturing and services, 2007-2012). |
David M. Thomas (1949) |
| Year of Election or Appointment: 2008 Previously, Mr. Thomas served as Executive Chairman (2005-2006) and Chairman and Chief Executive Officer (2000-2005) of IMS Health, Inc. (pharmaceutical and healthcare information solutions), and a Director of Fortune Brands, Inc. (consumer products, 2000-2011). In addition, Mr. Thomas serves as Non-Executive Chairman of the Board of Directors of Fortune Brands Home and Security (home and security products, 2011-present), and as a member of the Board of Directors of Interpublic Group of Companies, Inc. (marketing communication, 2004-present). |
+ The information above includes each Trustee's principal occupation during the last five years and other information relating to the experience, attributes, and skills relevant to each Trustee's qualifications to serve as a Trustee, which led to the conclusion that each Trustee should serve as a Trustee for the fund.
Annual Report
Trustees and Officers - continued
Advisory Board Member and Executive Officers:
Correspondence intended for each executive officer and Peter S. Lynch may be sent to Fidelity Investments, 245 Summer Street, Boston, Massachusetts 02210.
Name, Year of Birth; Principal Occupation |
Peter S. Lynch (1944) |
| Year of Election or Appointment: 2003 Member of the Advisory Board of Fidelity's Equity and High Income Funds. Mr. Lynch is Vice Chairman and a Director of FMR and FMR Co., Inc. In addition, Mr. Lynch serves as a Trustee of Boston College and as the Chairman of the Inner-City Scholarship Fund. Previously, Mr. Lynch served on the Special Olympics International Board of Directors (1997-2006). |
Kenneth B. Robins (1969) |
| Year of Election or Appointment: 2008 President and Treasurer of Fidelity's Equity and High Income Funds. Mr. Robins also serves as President and Treasurer (2008-present) and Assistant Treasurer (2009-present) of other Fidelity funds and is an employee of Fidelity Investments (2004-present). Mr. Robins serves as Executive Vice President of Fidelity Investments Money Management, Inc. (FIMM) (2013-present). Previously, Mr. Robins served as Deputy Treasurer of the Fidelity funds (2005-2008) and Treasurer and Chief Financial Officer of The North Carolina Capital Management Trust: Cash and Term Portfolios (2006-2008). |
Bruce T. Herring (1965) |
| Year of Election or Appointment: 2006 Vice President of certain Equity Funds. Mr. Herring also serves as Vice President of other Fidelity funds (2013-present), Chief Investment Officer of Fidelity Global Asset Allocation (GAA) (2013-present), Chief Investment Officer and Director of Fidelity Management & Research (U.K.) Inc. (2010-present), Group Chief Investment Officer of FMR, and President of Fidelity Research & Analysis Company (2010-present). Previously, Mr. Herring served as Vice President (2005-2006) and Senior Vice President (2006-2007) of Fidelity Management & Research Company, Vice President of FMR Co., Inc. (2001-2007) and as a portfolio manager for Fidelity U.S. Equity Funds. |
Brian B. Hogan (1964) |
| Year of Election or Appointment: 2009 Vice President of Equity and High Income Funds. Mr. Hogan also serves as Vice President of other Fidelity funds (2009-present) and President of FMR's Equity Division (2009-present). Previously, Mr. Hogan served as Senior Vice President, Equity Research of FMR (2006-2009) and as a portfolio manager. |
Scott C. Goebel (1968) |
| Year of Election or Appointment: 2008 Secretary and Chief Legal Officer (CLO) of the Fidelity funds. Mr. Goebel also serves as Secretary of Fidelity Investments Money Management, Inc. (FIMM) (2010-present) and Fidelity Research and Analysis Company (FRAC) (2010-present); Secretary and CLO of The North Carolina Capital Management Trust: Cash and Term Portfolios (2008-present); General Counsel, Secretary, and Senior Vice President of FMR (2008-present) and FMR Co., Inc. (2008-present); employed by FMR LLC or an affiliate (2001-present); Chief Legal Officer of Fidelity Management & Research (Hong Kong) Limited (2008-present) and Assistant Secretary of Fidelity Management & Research (Japan) Inc. (2008-present), and Fidelity Management & Research (U.K.) Inc. (2008-present). Previously, Mr. Goebel served as Assistant Secretary of FIMM (2008-2010), FRAC (2008-2010), and the Funds (2007-2008) and as Vice President and Secretary of Fidelity Distributors Corporation (FDC) (2005-2007). |
William C. Coffey (1969) |
| Year of Election or Appointment: 2009 Assistant Secretary of Fidelity's Equity and High Income Funds. Mr. Coffey also serves as Assistant Secretary of other Fidelity funds (2009-present), Senior Vice President and Deputy General Counsel of FMR LLC (2010-present), and is an employee of Fidelity Investments. Previously, Mr. Coffey served as Vice President and Associate General Counsel of FMR LLC (2005-2009). |
Elizabeth Paige Baumann (1968) |
| Year of Election or Appointment: 2012 Anti-Money Laundering (AML) Officer of the Fidelity funds. Ms. Baumann also serves as AML Officer of The North Carolina Capital Management Trust: Cash and Term Portfolios (2012-present), Chief AML Officer of FMR LLC (2012-present), and is an employee of Fidelity Investments. Previously, Ms. Baumann served as Vice President and Deputy Anti-Money Laundering Officer (2007-2012). |
Christine Reynolds (1958) |
| Year of Election or Appointment: 2008 Chief Financial Officer of the Fidelity funds. Ms. Reynolds became President of Fidelity Pricing and Cash Management Services (FPCMS) in August 2008. Ms. Reynolds served as Chief Operating Officer of FPCMS (2007-2008). Previously, Ms. Reynolds served as President, Treasurer, and Anti-Money Laundering officer of the Fidelity funds (2004-2007). |
Joseph A. Hanlon (1968) |
| Year of Election or Appointment: 2012 Chief Compliance Officer of Fidelity's Equity and High Income Funds. Mr. Hanlon also serves as Chief Compliance Officer of other Fidelity funds (2012-present). Mr. Hanlon serves as Compliance Officer of FMR, FMR Co., Inc., Fidelity Investments Money Management, Inc. (FIMM), Fidelity Research and Analysis Company (FRAC), and Fidelity Management & Research (Hong Kong) (2009-present), as Senior Vice President of the Fidelity Asset Management Division (2009-present), and is an employee of Fidelity Investments. Previously, Mr. Hanlon served as Compliance Officer of Fidelity Management & Research (Japan) Inc. (2009-2013), Strategic Advisers, Inc. (2009-2013), and Fidelity Management & Research (U.K.) Inc. (2009-2013). |
Joseph F. Zambello (1957) |
| Year of Election or Appointment: 2011 Deputy Treasurer of the Fidelity funds. Mr. Zambello is an employee of Fidelity Investments. Previously, Mr. Zambello served as Vice President of FMR's Program Management Group (2009-2011) and Vice President of the Transfer Agent Oversight Group (2005-2009). |
Adrien E. Deberghes (1967) |
| Year of Election or Appointment: 2008 Deputy Treasurer of Fidelity's Equity and High Income Funds. Mr. Deberghes also serves as Vice President (2011-present), Deputy Treasurer (2008-present), and Assistant Treasurer (2010-present) of other Fidelity funds, and is an employee of Fidelity Investments (2008-present). Previously, Mr. Deberghes served as Senior Vice President of Mutual Fund Administration at State Street Corporation (2007-2008), Senior Director of Mutual Fund Administration at Investors Bank & Trust (2005-2007), and Director of Finance for Dunkin' Brands (2000-2005). |
Stephen Sadoski (1971) |
| Year of Election or Appointment: 2012 Deputy Treasurer of Fidelity's Equity and High Income Funds. Mr. Sadoski also serves as Deputy Treasurer of other Fidelity funds (2012-present) and is an employee of Fidelity Investments (2012-present). Previously, Mr. Sadoski served as Assistant Treasurer of Fidelity's Fixed Income and Asset Allocation Funds (2012-2013), an assistant chief accountant in the Division of Investment Management of the Securities and Exchange Commission (SEC) (2009-2012) and as a senior manager at Deloitte & Touche LLP (1997-2009). |
Stacie M. Smith (1974) |
| Year of Election or Appointment: 2013 Deputy Treasurer of Fidelity's Equity and High Income Funds. Ms. Smith also serves as Deputy Treasurer of other Fidelity funds (2013-present) and is an employee of Fidelity Investments (2009-present). Previously, Ms. Smith served as Senior Audit Manager of Ernst & Young LLP (1996-2009). |
Stephanie J. Dorsey (1969) |
| Year of Election or Appointment: 2010 Assistant Treasurer of Fidelity's Equity and High Income Funds. Ms. Dorsey also serves as President and Treasurer (2013-present) and Assistant Treasurer (2010-present) of other Fidelity funds, Treasurer and Chief Financial Officer of The North Carolina Capital Management Trust: Cash and Term Portfolios (2013-present), and is an employee of Fidelity Investments (2008-present). Previously, Ms. Dorsey served as Deputy Treasurer of Fidelity's Fixed Income and Asset Allocation Funds (2008-2013), Treasurer (2004-2008) of the JPMorgan Mutual Funds and Vice President (2004-2008) of JPMorgan Chase Bank. |
Gary W. Ryan (1958) |
| Year of Election or Appointment: 2005 Assistant Treasurer of the Fidelity funds. Mr. Ryan is an employee of Fidelity Investments. Previously, Mr. Ryan served as Vice President of Fund Reporting in Fidelity Pricing and Cash Management Services (FPCMS) (1999-2005). |
Jonathan Davis (1968) |
| Year of Election or Appointment: 2010 Assistant Treasurer of the Fidelity funds. Mr. Davis is also Assistant Treasurer of Fidelity Rutland Square Trust II and Fidelity Commonwealth Trust II. Mr. Davis is an employee of Fidelity Investments. Previously, Mr. Davis served as Vice President and Associate General Counsel of FMR LLC (2003-2010). |
Annual Report
Leveraged Company Stock designates 100% of the dividends distributed during the fiscal year as qualifying for the dividends-received deduction for corporate shareholders.
Leveraged Company Stock designates 100% of the dividends distributed during the fiscal year as amounts which may be taken into account as a dividend for the purposes of the maximum rate under section 1(h)(11) of the Internal Revenue Code.
The fund will notify shareholders in January 2014 of amounts for use in preparing 2013 income tax returns.
Annual Report
Board Approval of Investment Advisory Contracts and Management Fees
Fidelity Leveraged Company Stock Fund
Each year, the Board of Trustees, including the Independent Trustees (together, the Board), votes on the renewal of the management contract and sub-advisory agreements (together, the Advisory Contracts) for the fund. The Board, assisted by the advice of fund counsel and Independent Trustees' counsel, requests and considers a broad range of information relevant to the renewal of the Advisory Contracts throughout the year.
The Board meets regularly and, at each of its meetings, covers an extensive agenda of topics and materials and considers factors that are relevant to its annual consideration of the renewal of the fund's Advisory Contracts, including the services and support provided to the fund and its shareholders. The Board has established various standing committees, each composed of and chaired by Independent Trustees with varying backgrounds, to which the Board has assigned specific subject matter responsibilities in order to enhance effective decision-making by the Board. The Board, acting directly and through its Committees, requests and receives information concerning the annual consideration of the renewal of the fund's Advisory Contracts. The Board also meets as needed to consider matters specifically related to the Board's annual consideration of the renewal of Advisory Contracts. Members of the Board may also meet with trustees of other Fidelity funds through ad hoc joint committees to discuss certain matters relevant to the Fidelity funds.
At its July 2013 meeting, the Board, including the Independent Trustees, unanimously determined to renew the fund's Advisory Contracts. In reaching its determination, the Board considered all factors it believed relevant, including (i) the nature, extent, and quality of the services to be provided to the fund and its shareholders (including the investment performance of the fund); (ii) the competitiveness of the fund's management fee and total expense ratio relative to peer funds; (iii) the total costs of the services to be provided by and the profits to be realized by Fidelity from its relationship with the fund; (iv) the extent to which economies of scale exist and would be realized as the fund grows; and (v) whether fee levels reflect these economies of scale, if any, for the benefit of fund shareholders.
In considering whether to renew the Advisory Contracts for the fund, the Board reached a determination, with the assistance of fund counsel and Independent Trustees' counsel and through the exercise of its business judgment, that the renewal of the Advisory Contracts was in the best interests of the fund and its shareholders and that the compensation payable under the Advisory Contracts was fair and reasonable. The Board's decision to renew the Advisory Contracts was not based on any single factor, but rather was based on a comprehensive consideration of all the information provided to the Board at its meetings throughout the year. The Board, in reaching its determination to renew the Advisory Contracts, was aware that shareholders in the fund have a broad range of investment choices available to them, including a wide choice among mutual funds offered by Fidelity's competitors, and that the fund's shareholders, who have the opportunity to review and weigh the disclosure provided by the fund in its prospectus and other public disclosures, have chosen to invest in this fund, which is a part of the Fidelity family of funds.
Annual Report
Board Approval of Investment Advisory Contracts and
Management Fees - continued
Nature, Extent, and Quality of Services Provided. The Board considered the staffing within the investment adviser, Fidelity Management & Research Company (FMR), and the sub-advisers (together, the Investment Advisers) as it relates to the fund, including the backgrounds of the fund's investment personnel, and also considered the fund's investment objective, strategies, and related investment philosophy. The Independent Trustees also had discussions with senior management of Fidelity's investment operations and investment groups. The Board considered the structure of the portfolio manager compensation program and whether this structure provides appropriate incentives to act in the best interests of the fund.
Resources Dedicated to Investment Management and Support Services. The Board and the Fund Oversight and Research Committees reviewed the general qualifications and capabilities of the Investment Advisers' investment staff, including its size, education, experience, and resources, as well as the Investment Advisers' approach to recruiting, training, managing, and compensating investment personnel. The Board noted that FMR has continued to increase the resources devoted to non-U.S. offices, including expansion of Fidelity's global investment organization. The Board also noted that Fidelity's analysts have extensive resources, tools and capabilities that allow them to conduct sophisticated quantitative and fundamental analysis, as well as credit analysis of issuers, counterparties and guarantors. Further, the Board believes that Fidelity's investment professionals have sufficient access to global information and data so as to provide competitive investment results over time, and that those professionals also have access to sophisticated tools that permit them to assess portfolio construction and risk and performance attribution characteristics continuously, as well as to transmit new information and research conclusions rapidly around the world. Additionally, in its deliberations, the Board considered the Investment Advisers' trading and risk management capabilities and resources, which are an integral part of the investment management process.
Shareholder and Administrative Services. The Board considered (i) the nature, extent, quality, and cost of advisory, administrative, and shareholder services performed by the Investment Advisers and their affiliates under the Advisory Contracts and under separate agreements covering transfer agency, pricing and bookkeeping, and securities lending services for the fund; (ii) the nature and extent of the supervision of third party service providers, principally custodians and subcustodians; and (iii) the resources devoted to, and the record of compliance with, the fund's compliance policies and procedures. The Board also reviewed the allocation of fund brokerage, including allocations to brokers affiliated with the Investment Advisers, the use of brokerage commissions to pay fund expenses, and the use of "soft" commission dollars to pay for research services.
Annual Report
The Board noted that the growth of fund assets over time across the complex allows Fidelity to reinvest in the development of services designed to enhance the value or convenience of the Fidelity funds as investment vehicles. These services include 24-hour access to account information and market information through telephone representatives and over the Internet, investor education materials and asset allocation tools, and the expanded availability of Fidelity Investor Centers.
Investment in a Large Fund Family. The Board considered the benefits to shareholders of investing in a Fidelity fund, including the benefits of investing in a fund that is part of a large family of funds offering a variety of investment disciplines and providing a large variety of mutual fund investor services. The Board noted that Fidelity had taken, or had made recommendations that resulted in the Fidelity funds taking, a number of actions over the previous year that benefited particular funds, including (i) continuing to dedicate additional resources to investment research and to the support of the senior management team that oversees asset management; (ii) persisting in efforts to enhance Fidelity's global research capabilities; (iii) launching new funds and making other enhancements to meet client needs for global and income-oriented solutions; (iv) continuing to launch dedicated lower cost underlying funds to meet portfolio construction needs related to expanding underlying fund options for Fidelity funds of funds, specifically for the Freedom Fund product lines; (v) rationalizing product lines and gaining increased efficiencies through the mergers of several funds into other funds; (vi) strengthening Fidelity's index fund offerings by reducing investment minimums and adopting or lowering existing expense caps for certain funds and classes; (vii) enhancing Global Asset Allocation product offerings by launching new funds and strategies, including "open architecture" target date funds that utilize affiliated and unaffiliated sub-advisers; (viii) modifying the eligibility criteria for Institutional Class shares of Advisor funds to increase their marketability to a portion of the defined contribution plan market; (ix) creating a new low-cost retirement share class for certain Advisor funds to appeal to large retirement plans; (x) transitioning the management of certain Fidelity commodity funds to Geode Capital Management LLC, a registered commodity pool operator, while retaining administrative responsibilities for the funds; (xi) reorganizing a number of funds; and (xii) taking steps toward establishing a new Fidelity adviser to manage sector-based funds and products.
Investment Performance. The Board considered whether the fund has operated in accordance with its investment objective, as well as its record of compliance with its investment restrictions and its performance history.
The Board took into account discussions with the Investment Advisers about fund investment performance that occur at Board meetings throughout the year. In this regard the Board noted that as part of regularly scheduled fund reviews and other reports to the Board on fund performance, the Board periodically considers annualized return information for the fund, for different time periods, measured against a securities market index ("benchmark index") and a peer group of mutual funds with similar objectives ("peer group"). In its evaluation of fund investment performance, the Board gave particular attention to information indicating changes in performance of certain Fidelity funds for specific time periods and the Investment Advisers' explanations for any overperformance or underperformance.
Annual Report
Board Approval of Investment Advisory Contracts and
Management Fees - continued
In addition to reviewing absolute and relative fund performance, the Independent Trustees periodically consider the appropriateness of fund performance metrics in evaluating the results achieved. In general, the Independent Trustees believe that fund performance should be evaluated based on net performance (after fees and expenses) of both the highest performing and lowest performing classes, where applicable, compared to appropriate benchmark indices, over appropriate time periods which may include full market cycles, and compared to peer groups, as applicable, over the same periods, taking into account relevant factors including the following: general market conditions; issuer-specific information; tactical opportunities for investment; and fund cash flows and other factors.
The Independent Trustees recognize that shareholders evaluate performance on a net basis over their own holding periods, for which one-, three-, and five-year periods are used as a proxy. For this reason, the performance information reviewed by the Board also included net cumulative calendar year total return information for the fund and an appropriate benchmark index and peer group for the most recent one-, three-, and five-year periods, as shown below. Returns are shown compared to the 25th percentile (top of box) and 75th percentile (bottom of box) of the peer universe.
Annual Report
Fidelity Leveraged Company Stock Fund
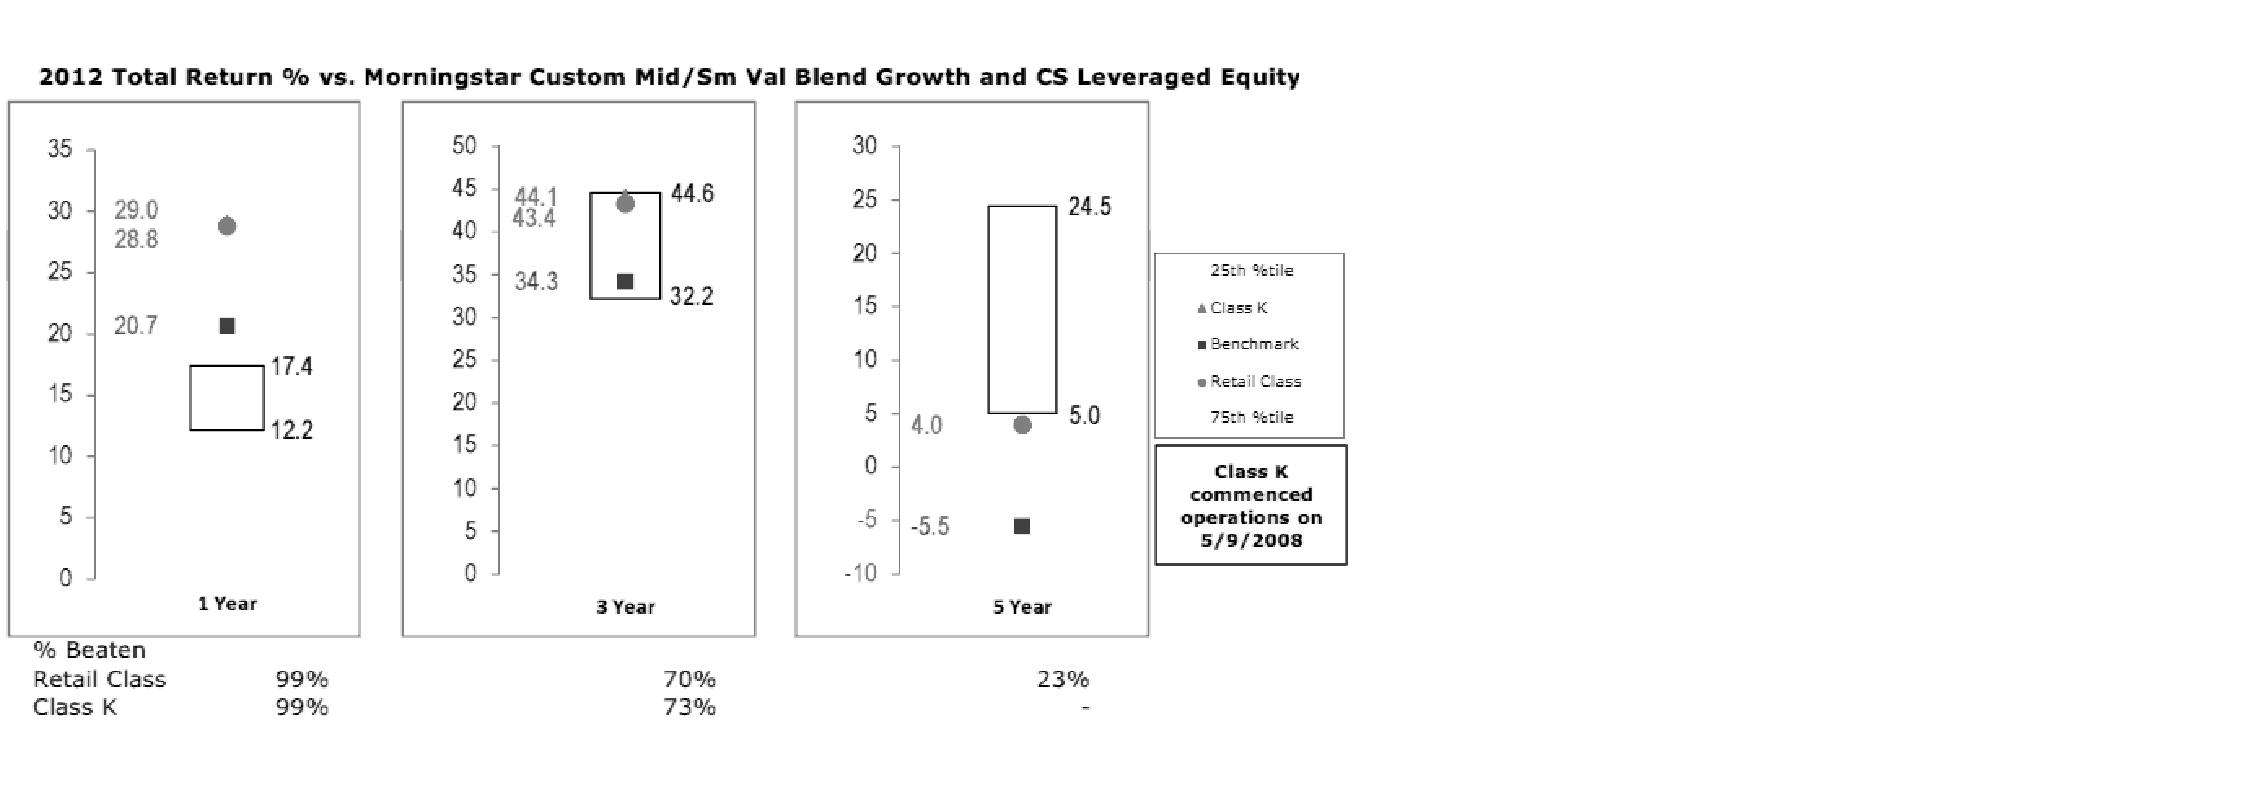
Based on its review, the Board concluded that the nature, extent, and quality of services provided to the fund under the Advisory Contracts should benefit the fund's shareholders.
Competitiveness of Management Fee and Total Expense Ratio. The Board considered the fund's management fee and total expense ratio compared to "mapped groups" of competitive funds and classes. Fidelity creates "mapped groups" by combining similar Lipper investment objective categories that have comparable management fee characteristics. Combining Lipper investment objective categories aids the Board's management fee and total expense ratio comparisons by broadening the competitive group used for comparison and by reducing the number of universes to which various Fidelity funds are compared.
Management Fee. The Board considered two proprietary management fee comparisons for the 12-month periods shown in the chart below. The group of Lipper funds used by the Board for management fee comparisons is referred to below as the "Total Mapped Group." The Total Mapped Group comparison focuses on a fund's standing in terms of gross management fees before expense reimbursements or caps relative to the total universe of funds with comparable investment mandates, regardless of whether their management fee structures also are comparable. Funds with comparable investment mandates offer exposure to similar types of securities. Funds with comparable management fee structures have similar management fee contractual arrangements (e.g., flat rate charged for advisory services, all-inclusive fee rate, etc.). "TMG %" represents the percentage of funds in the Total Mapped Group that had management fees that were lower than the fund's. For example, a TMG % of 18% means that 82% of the funds in the Total Mapped Group had higher management fees than the fund. The "Asset-Size Peer Group" (ASPG) comparison focuses on a fund's standing relative to a subset of non-Fidelity funds within the Total Mapped Group that are similar in size and management fee structure. The ASPG represents at least 15% of the funds in the Total Mapped Group with comparable asset size and management fee structures, subject to a minimum of 50 funds (or all funds in the Total Mapped Group if fewer than 50). Additional information, such as the ASPG quartile in which the fund's management fee ranked, is also included in the chart and considered by the Board.
Annual Report
Board Approval of Investment Advisory Contracts and
Management Fees - continued
Fidelity Leveraged Company Stock Fund

The Board noted that the fund's management fee ranked below the median of its Total Mapped Group and below the median of its ASPG for 2012.
Based on its review, the Board concluded that the fund's management fee is fair and reasonable in light of the services that the fund receives and the other factors considered.
Total Expense Ratio. In its review of each class's total expense ratio, the Board considered the fund's management fee as well as other fund or class expenses, as applicable, such as transfer agent fees, pricing and bookkeeping fees, and custodial, legal, and audit fees. The Board also noted the effects of any waivers and reimbursements on fees and expenses. As part of its review, the Board also considered the current and historical total expense ratios of each class of the fund compared to competitive fund median expenses. Each class of the fund is compared to those funds and classes in the Total Mapped Group (used by the Board for management fee comparisons) that have a similar sales load structure.
Annual Report
The Board noted that the total expense ratio of each class ranked below its competitive median for 2012.
Fees Charged to Other Fidelity Clients. The Board also considered Fidelity fee structures and other information with respect to clients of FMR and its affiliates, such as other mutual funds advised or subadvised by FMR or its affiliates, pension plan clients, and other institutional clients. The Board noted the findings of the 2013 ad hoc joint committee (created with the board of other Fidelity funds), which reviewed and compared Fidelity's institutional investment advisory business with its business of providing services to the Fidelity funds, including the differences in services provided, fees charged, and costs incurred, as well as competition in their respective marketplaces.
Based on its review of total expense ratios and fees charged to other Fidelity clients, the Board concluded that the total expense ratio of each class of the fund was reasonable in light of the services that the fund and its shareholders receive and the other factors considered.
Costs of the Services and Profitability. The Board considered the revenues earned and the expenses incurred by Fidelity in conducting the business of developing, marketing, distributing, managing, administering and servicing the fund and servicing the fund's shareholders. The Board also considered the level of Fidelity's profits in respect of all the Fidelity funds.
On an annual basis, FMR presents to the Board Fidelity's profitability for the fund. Fidelity calculates the profitability for each fund, as well as aggregate profitability for groups of Fidelity funds and all Fidelity funds, using a series of detailed revenue and cost allocation methodologies which originate with the books and records of Fidelity on which Fidelity's audited financial statements are based. The Audit Committee of the Board reviews any significant changes from the prior year's methodologies.
PricewaterhouseCoopers LLP (PwC), independent registered public accounting firm and auditor to Fidelity and certain Fidelity funds, has been engaged annually by the Board as part of the Board's assessment of Fidelity's profitability analysis. PwC's engagement includes the review and assessment of the methodologies used by Fidelity in determining the revenues and expenses attributable to Fidelity's mutual fund business, and completion of agreed-upon procedures surrounding the mathematical accuracy of fund profitability and its conformity to allocation methodologies. After considering PwC's reports issued under the engagement and information provided by Fidelity, the Board concluded that while other allocation methods may also be reasonable, Fidelity's profitability methodologies are reasonable in all material respects.
Annual Report
Board Approval of Investment Advisory Contracts and
Management Fees - continued
The Board also reviewed Fidelity's non-fund businesses and fall-out benefits related to the mutual fund business as well as cases where Fidelity's affiliates may benefit from or be related to the fund's business.
The Board considered the costs of the services provided by and the profits realized by Fidelity in connection with the operation of the fund and was satisfied that the profitability was not excessive in the circumstances.
Economies of Scale. The Board considered whether there have been economies of scale in respect of the management of the Fidelity funds, whether the Fidelity funds (including the fund) have appropriately benefited from any such economies of scale, and whether there is potential for realization of any further economies of scale. The Board considered the extent to which the fund will benefit from economies of scale through increased services to the fund, through waivers or reimbursements, or through fee or expense reductions. The Board also noted that in 2009, it and the board of other Fidelity funds created an ad hoc committee (the Economies of Scale Committee) to analyze whether FMR attains economies of scale in respect of the management and servicing of the Fidelity funds, whether the Fidelity funds have appropriately benefited from such economies of scale, and whether there is potential for realization of any further economies of scale.
The Board recognized that the fund's management contract incorporates a "group fee" structure, which provides for lower group fee rates as total fund assets under FMR's management increase, and for higher group fee rates as total fund assets under FMR's management decrease. FMR calculates the group fee rates based on a tiered asset "breakpoint" schedule that varies based on asset class. The Board considered that the group fee is designed to deliver the benefits of economies of scale to fund shareholders when total Fidelity fund assets increase, even if assets of any particular fund are unchanged or have declined, because some portion of Fidelity's costs are attributable to services provided to all Fidelity funds, and all funds benefit if those costs can be allocated among more assets. The Board concluded that, given the group fee structure, fund shareholders will benefit from lower management fees as assets under FMR's management increase at the fund complex level, regardless of whether Fidelity achieves any such economies of scale.
The Board concluded, taking into account the analysis of the Economies of Scale Committee, that economies of scale, if any, are being appropriately shared between fund shareholders and Fidelity.
Amendment to Description of Group Fee Rate. At its July 2013 meeting, the Board voted to approve an amendment to the fund's management contract to modify the description of the "group fee rate" effective August 1, 2013. The Board noted that under the prior description in the contract, the group fee rate was based on the average net assets of all registered investment companies with which FMR has management contracts. Under the contract's tiered asset breakpoint schedule, the group fee rate is lower as total fund assets under FMR's management increase, and higher as total fund assets under FMR's management decrease. The Board considered that the prior description would have excluded the assets of 64 Fidelity sector funds from the group fee rate calculation once Fidelity SelectCo, LLC, an affiliate of FMR, assumed management responsibilities for those funds. The Board noted that modifying the description of the group fee rate to continue to include the assets of those 64 funds for purposes of determining group fee rate breakpoints would avoid an immediate adverse impact on the group fee rate for any fund.
Annual Report
Additional Information Requested by the Board. In order to develop fully the factual basis for consideration of the Fidelity funds' Advisory Contracts, the Board requested and received additional information on certain topics, including: (i) fund performance trends and Fidelity's long-term strategies for certain funds; (ii) the potential to further rationalize the Fidelity fund lineup with the possibility of achieving savings for the funds and Fidelity; (iii) the methodology with respect to competitive fund data and peer group classifications; (iv) the arrangements with, and performance of, certain sub-advisers on behalf of the Fidelity funds, as well as certain proposed participating affiliate arrangements; (v) the realization of fall-out benefits in certain Fidelity business units; (vi) Fidelity's group fee structures, including the rationale for the individual fee rates of certain categories of funds and the definition of group assets; (vii) trends regarding industry use of performance fee structures and the performance adjustment methodologies applicable to the Fidelity funds; (viii) additional competitive analysis regarding the total expenses for certain classes; and (ix) fund profitability methodology, including Fidelity's cost allocation methodology, and the impact of certain factors on fund profitability results.
Based on its evaluation of all of the conclusions noted above, and after considering all factors it believed relevant, the Board ultimately concluded that the advisory fee structures are fair and reasonable, and that the fund's Advisory Contracts should be renewed.
Annual Report
Investment Adviser
Fidelity Management & Research Company
Boston, MA
Investment Sub-Adviser
FMR Co., Inc.
Fidelity Management & Research
(U.K.) Inc.
Fidelity Management & Research
(Hong Kong) Limited
Fidelity Management & Research
(Japan) Inc.
General Distributor
Fidelity Distributors Corporation
Smithfield, RI
Transfer and Service Agents
Fidelity Investments Institutional
Operations Company, Inc.
Boston, MA
Fidelity Service Company, Inc.
Boston, MA
Custodian
JPMorgan Chase Bank
New York, NY
The Fidelity Telephone Connection
Mutual Fund 24-Hour Service
Exchanges/Redemptions
and Account Assistance 1-800-544-6666
Product Information 1-800-544-6666
Retirement Accounts 1-800-544-4774
(8 a.m. - 9 p.m.)
TDD Service 1-800-544-0118
for the deaf and hearing impaired
(9 a.m. - 9 p.m. Eastern time)
Fidelity Automated Service
Telephone (FAST®)
1-800-544-5555
Automated line for quickest service
(Fidelity Investment logo)(registered trademark)
Corporate Headquarters
245 Summer St., Boston, MA 02210
www.fidelity.com
LSF-UANN-0913
1.789248.110
Fidelity®
Leveraged Company Stock
Fund -
Class K
Annual Report
July 31, 2013
(Fidelity Cover Art)
Contents
Performance | (Click Here) | How the fund has done over time. |
Management's Discussion of Fund Performance | (Click Here) | The Portfolio Manager's review of fund performance and strategy. |
Shareholder Expense Example | (Click Here) | An example of shareholder expenses. |
Investment Changes | (Click Here) | A summary of major shifts in the fund's investments over the last six months. |
Investments | (Click Here) | A complete list of the fund's investments with their market values. |
Financial Statements | (Click Here) | Statements of assets and liabilities, operations, and changes in net assets, as well as financial highlights. |
Notes | (Click Here) | Notes to the financial statements. |
Report of Independent Registered Public Accounting Firm | (Click Here) | |
Trustees and Officers | (Click Here) | |
Distributions | (Click Here) | |
Board Approval of Investment Advisory Contracts and Management Fees | (Click Here) | |
To view a fund's proxy voting guidelines and proxy voting record for the 12-month period ended June 30, visit http://www.fidelity.com/proxyvotingresults or visit the Securities and Exchange Commission's (SEC) web site at http://www.sec.gov. You may also call 1-800-835-5092 to request a free copy of the proxy voting guidelines.
Standard & Poor's, S&P and S&P 500 are registered service marks of The McGraw-Hill Companies, Inc. and have been licensed for use by Fidelity Distributors Corporation.
Other third-party marks appearing herein are the property of their respective owners.
All other marks appearing herein are registered or unregistered trademarks or service marks of FMR LLC or an affiliated company. © 2013 FMR LLC. All rights reserved.
Annual Report
This report and the financial statements contained herein are submitted for the general information of the shareholders of the fund. This report is not authorized for distribution to prospective investors in the fund unless preceded or accompanied by an effective prospectus.
A fund files its complete schedule of portfolio holdings with the SEC for the first and third quarters of each fiscal year on Form N-Q. Forms N-Q are available on the SEC's web site at http://www.sec.gov. A fund's Forms N-Q may be reviewed and copied at the SEC's Public Reference Room in Washington, DC. Information regarding the operation of the SEC's Public Reference Room may be obtained by calling 1-800-SEC-0330. For a complete list of a fund's portfolio holdings, view the most recent holdings listing, semiannual report, or annual report on Fidelity's web site at http://www.fidelity.com, http://www.advisor.fidelity.com, or http://www.401k.com, as applicable.
NOT FDIC INSURED • MAY LOSE VALUE • NO BANK GUARANTEE
Neither the fund nor Fidelity Distributors Corporation is a bank.
Annual Report
Average annual total return reflects the change in the value of an investment, assuming reinvestment of the class' distributions from dividend income and capital gains (the profits earned upon the sale of securities that have grown in value, if any) and assuming a constant rate of performance each year. The $10,000 table and the fund's returns do not reflect the deduction of taxes that a shareholder would pay on fund distributions or the redemption of fund shares. During periods of reimbursement by Fidelity, a fund's total return will be greater than it would be had the reimbursement not occurred. How a fund did yesterday is no guarantee of how it will do tomorrow.
Average Annual Total Returns
Periods ended July 31, 2013 | Past 1
year | Past 5
years | Past 10
years |
Class K A | 40.47% | 5.95% | 13.10% |
A The initial offering of Class K shares took place on May 9, 2008. Returns prior to May 9, 2008 are those of Fidelity® Leveraged Company Stock Fund, the original class of the fund.
$10,000 Over 10 Years
Let's say hypothetically that $10,000 was invested in Fidelity® Leveraged Company Stock Fund - Class K on July 31, 2003. The chart shows how the value of your investment would have changed, and also shows how the S&P 500® Index performed over the same period. The initial offering of Class K took place on May 9, 2008. See above for additional information regarding the performance of Class K.
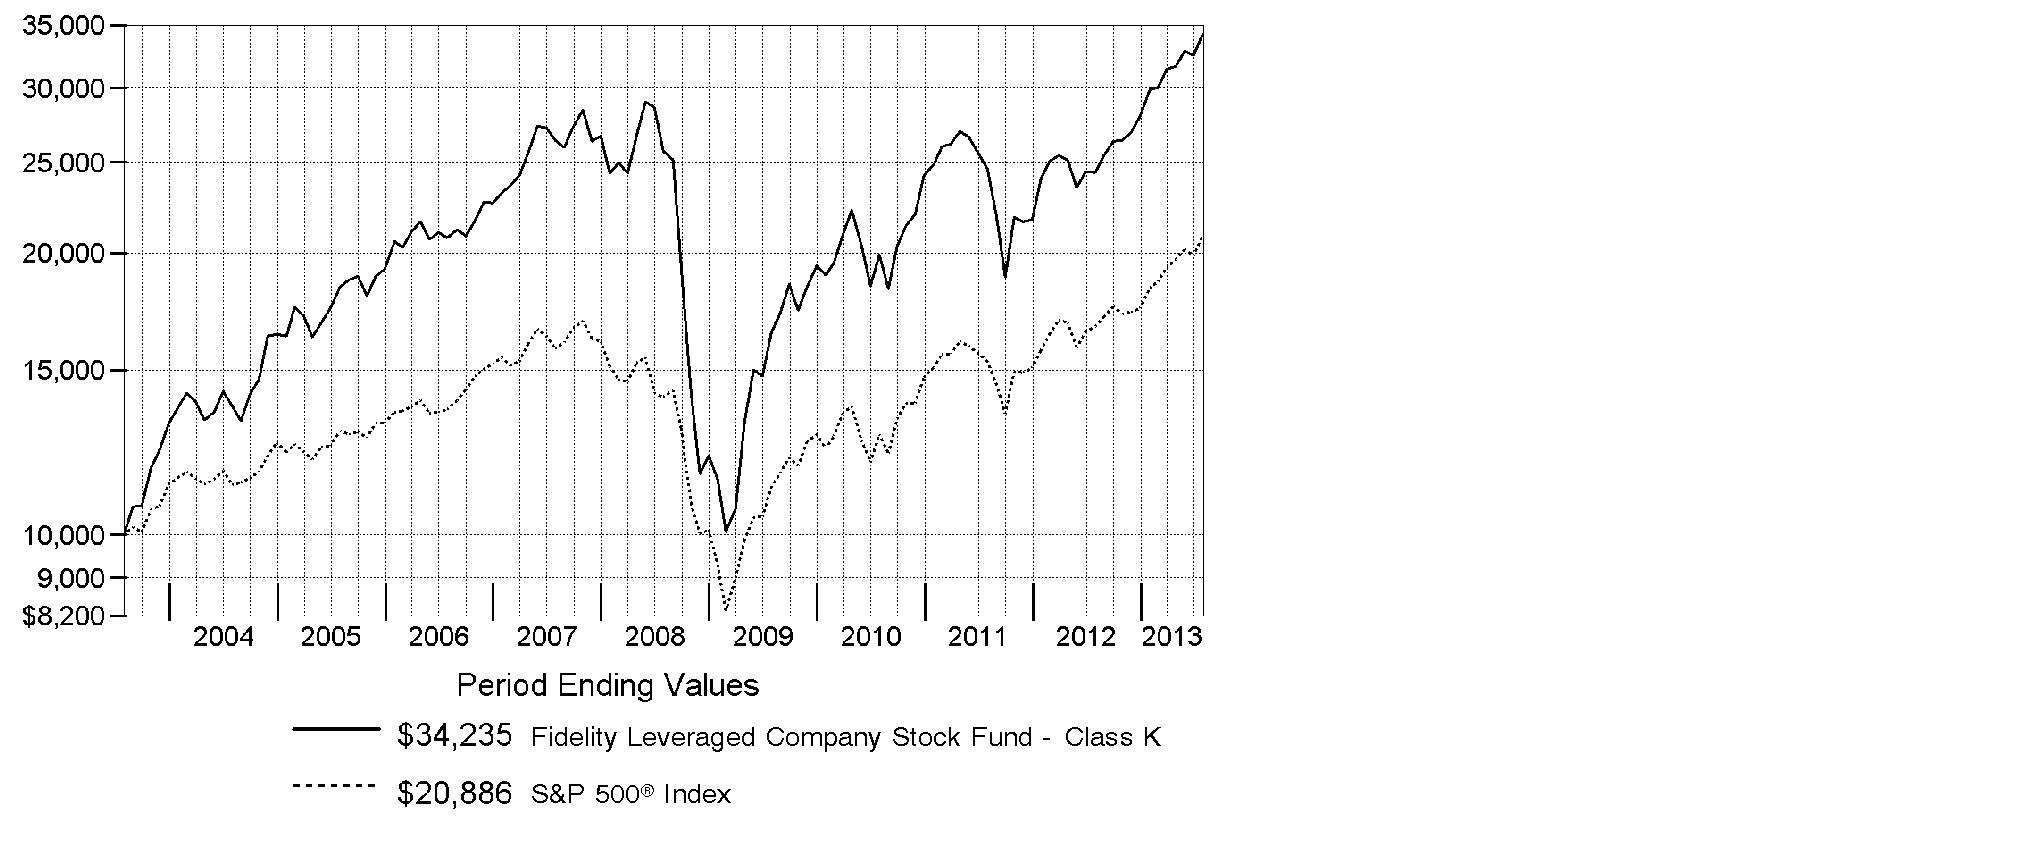
Annual Report
Market Recap: The bull run in U.S. stocks comfortably settled into a fifth year, as major equity benchmarks ripped through records during the 12 months ending July 31, 2013. Gains were fueled by a generally improving global economy and accommodative monetary policies worldwide. The tone was positive for most of the year, based largely on stronger U.S. economic data, including employment, housing and consumer sentiment. Setting a series of new highs along the way, the broad-based S&P 500® Index rose an impressive 25.00% for the 12 months, while the blue-chip-laden Dow Jones Industrial AverageSM also moved into record territory en route to a 22.36% gain. The growth-oriented Nasdaq Composite Index® had a similarly strong run, advancing 25.15%. During the year, markets were resilient amid intermittent volatility over debt woes in Europe, the 2012 U.S. presidential election and year-end Congressional gridlock over the federal budget. In mid-to-late June, concern arose about the U.S. Federal Reserve possibly tapering its sustaining bond-buying strategy - which prompted a brief, but steep, market sell-off. However, investors' continued quest for yield and the Fed's pledge to keep buying bonds until the economy showed significant improvement overpowered the uncertainty and helped equities climb notably higher in July to close the period on a strong note.
Comments from Thomas Soviero, Portfolio Manager of Fidelity® Leveraged Company Stock Fund: For the year, the fund's Class K shares returned 40.47%, significantly outperforming the S&P 500®. I concentrate the fund in what I consider to be my best ideas. I made the fund more U.S.-centric, adding to consumer discretionary names such as major automotive manufacturers Ford Motor and General Motors. I also sought to take advantage of the recent manufacturing renaissance in the U.S. The fund's largest holding and top contributor to relative performance was chemicals manufacturer LyondellBasell Industries. Other decisions that helped included largely avoiding consumer electronics giant and underperforming index component Apple - which was not held by the fund at period end - and overweighting outperforming video game retailer GameStop. During the period, the fund's performance relative to the index was curtailed the most by its roughly 13% cash weighting, which I held as I waited for new opportunities, but was a negative in a strong market. An underweighting in financials also detracted. At the individual issuer level, global independent power producer AES, with headquarters in Virginia, underperformed and detracted, as did an out-of-benchmark position in South Africa-based AngloGold Ashanti.
The views expressed above reflect those of the portfolio manager(s) only through the end of the period as stated on the cover of this report and do not necessarily represent the views of Fidelity or any other person in the Fidelity organization. Any such views are subject to change at any time based upon market or other conditions and Fidelity disclaims any responsibility to update such views. These views may not be relied on as investment advice and, because investment decisions for a Fidelity fund are based on numerous factors, may not be relied on as an indication of trading intent on behalf of any Fidelity fund.
Annual Report
Shareholder Expense Example
As a shareholder of the Fund, you incur two types of costs: (1) transaction costs, including redemption fees and (2) ongoing costs, including management fees and other Fund expenses. This Example is intended to help you understand your ongoing costs (in dollars) of investing in the Fund and to compare these costs with the ongoing costs of investing in other mutual funds.
The Example is based on an investment of $1,000 invested at the beginning of the period and held for the entire period (February 1, 2013 to July 31, 2013).
Actual Expenses
The first line of the accompanying table for each class of the Fund provides information about actual account values and actual expenses. You may use the information in this line, together with the amount you invested, to estimate the expenses that you paid over the period. Simply divide your account value by $1,000.00 (for example, an $8,600 account value divided by $1,000.00 = 8.6), then multiply the result by the number in the first line for a class of the Fund under the heading entitled "Expenses Paid During Period" to estimate the expenses you paid on your account during this period. A small balance maintenance fee of $12.00 that is charged once a year may apply for certain accounts with a value of less than $2,000. This fee is not included in the table below. If it was, the estimate of expenses you paid during the period would be higher, and your ending account value lower, by this amount. In addition, the Fund, as a shareholder in the underlying Fidelity Central Funds, will indirectly bear its pro-rata share of the fees and expenses incurred by the underlying Fidelity Central Funds. These fees and expenses are not included in the Fund's annualized expense ratio used to calculate the expense estimate in the table below.
Hypothetical Example for Comparison Purposes
The second line of the accompanying table for each class of the Fund provides information about hypothetical account values and hypothetical expenses based on a Class' actual expense ratio and an assumed rate of return of 5% per year before expenses, which is not the Class' actual return. The hypothetical account values and expenses may not be used to estimate the actual ending account balance or expenses you paid for the period. You may use this information to compare the ongoing costs of investing in the Fund and other funds. To do so, compare this 5% hypothetical example with the 5% hypothetical examples that appear in the shareholder reports of the other funds. A small balance maintenance fee of $12.00 that is charged once a year may apply for certain accounts with a value of less than $2,000. This fee is not included in the table below. If it was, the estimate of expenses you paid during the period would be higher, and your ending account value lower, by this amount. In addition, the Fund, as a shareholder in the underlying Fidelity Central Funds, will indirectly bear its pro-rata share of the fees and expenses incurred by the underlying Fidelity Central Funds. These fees and expenses are not included in the Fund's annualized expense ratio used to calculate the expense estimate in the table below.
Please note that the expenses shown in the table are meant to highlight your ongoing costs only and do not reflect any transaction costs. Therefore, the second line of the table is useful in comparing ongoing costs only, and will not help you determine the relative total costs of owning different funds. In addition, if these transactional costs were included, your costs would have been higher.
Annual Report
| Annualized
Expense Ratio B | Beginning
Account Value
February 1, 2013 | Ending
Account Value
July 31, 2013 | Expenses Paid
During Period*
February 1, 2013
to July 31, 2013 |
Leveraged Company Stock | .81% | | | |
Actual | | $ 1,000.00 | $ 1,145.50 | $ 4.31 |
Hypothetical A | | $ 1,000.00 | $ 1,020.78 | $ 4.06 |
Class K | .68% | | | |
Actual | | $ 1,000.00 | $ 1,146.20 | $ 3.62 |
Hypothetical A | | $ 1,000.00 | $ 1,021.42 | $ 3.41 |
A 5% return per year before expenses
B Annualized expense ratio reflects expenses net of applicable fee waivers.
* Expenses are equal to each Class' annualized expense ratio, multiplied by the average account value over the period, multiplied by 181/365 (to reflect the one-half year period).
Annual Report
Investment Changes (Unaudited)
Top Ten Stocks as of July 31, 2013 |
| % of fund's
net assets | % of fund's net assets
6 months ago |
LyondellBasell Industries NV Class A | 7.4 | 8.1 |
Service Corp. International | 4.6 | 4.1 |
Comcast Corp. Class A | 3.6 | 2.7 |
General Motors Co. | 3.1 | 2.8 |
Ford Motor Co. | 3.0 | 1.9 |
GameStop Corp. Class A | 2.6 | 1.6 |
Tenet Healthcare Corp. | 2.3 | 2.2 |
Bank of America Corp. | 2.2 | 0.0 |
Boston Scientific Corp. | 2.1 | 0.8 |
The AES Corp. | 1.8 | 3.0 |
| 32.7 | |
Top Five Market Sectors as of July 31, 2013 |
| % of fund's
net assets | % of fund's net assets
6 months ago |
Consumer Discretionary | 25.9 | 22.6 |
Materials | 11.5 | 12.4 |
Industrials | 10.7 | 10.4 |
Health Care | 10.1 | 7.7 |
Financials | 9.5 | 6.5 |
Asset Allocation (% of fund's net assets) |
As of July 31, 2013* | As of January 31, 2013** |
| Stocks 88.4% | | | Stocks 83.2% | |
| Bonds 0.3% | | | Bonds 0.9% | |
| Convertible
Securities 0.1% | | | Convertible
Securities 0.1% | |
| Other Investments 0.1% | | | Other Investments 0.3% | |
| Short-Term
Investments and
Net Other Assets
(Liabilities) 11.1% | | | Short-Term
Investments and
Net Other Assets
(Liabilities) 15.5% | |
* Foreign investments | 13.2% | | ** Foreign investments | 12.6% | |

Annual Report
Investments July 31, 2013
Showing Percentage of Net Assets
Common Stocks - 88.1% |
| Shares | | Value (000s) |
CONSUMER DISCRETIONARY - 25.6% |
Auto Components - 1.9% |
Delphi Automotive PLC | 592,300 | | $ 31,818 |
Exide Technologies (a) | 3,930,293 | | 511 |
Tenneco, Inc. (a) | 825,300 | | 39,887 |
TRW Automotive Holdings Corp. (a) | 396,200 | | 29,045 |
| | 101,261 |
Automobiles - 6.8% |
Ford Motor Co. | 9,413,433 | | 158,899 |
General Motors Co. (a) | 4,578,649 | | 164,236 |
General Motors Co.: | | | |
warrants 7/10/16 (a) | 445,805 | | 11,716 |
warrants 7/10/19 (a) | 445,805 | | 8,305 |
Motors Liquidation Co. GUC Trust (a) | 123,112 | | 4,020 |
Toyota Motor Corp. sponsored ADR | 89,500 | | 10,910 |
| | 358,086 |
Diversified Consumer Services - 4.6% |
Service Corp. International (f) | 12,885,925 | | 244,446 |
Hotels, Restaurants & Leisure - 0.3% |
Penn National Gaming, Inc. (a) | 360,340 | | 18,013 |
Station Holdco LLC unit (h)(i) | 146,846 | | 9 |
| | 18,022 |
Household Durables - 2.0% |
Hovnanian Enterprises, Inc. Class A (a)(e) | 1,419,000 | | 7,592 |
Lennar Corp. Class A (e) | 983,400 | | 33,308 |
Newell Rubbermaid, Inc. | 2,341,747 | | 63,274 |
| | 104,174 |
Leisure Equipment & Products - 0.2% |
Callaway Golf Co. | 1,630,035 | | 11,704 |
Media - 6.2% |
Cinemark Holdings, Inc. | 2,601,645 | | 75,760 |
Comcast Corp. Class A | 4,239,634 | | 191,123 |
Gray Television, Inc. (a)(f) | 3,766,164 | | 29,414 |
Nexstar Broadcasting Group, Inc. Class A | 886,098 | | 31,935 |
| | 328,232 |
Multiline Retail - 0.5% |
Target Corp. | 338,600 | | 24,125 |
Specialty Retail - 3.1% |
Asbury Automotive Group, Inc. (a) | 385,122 | | 18,809 |
Common Stocks - continued |
| Shares | | Value (000s) |
CONSUMER DISCRETIONARY - continued |
Specialty Retail - continued |
GameStop Corp. Class A (e) | 2,755,507 | | $ 135,185 |
Sally Beauty Holdings, Inc. (a) | 300,000 | | 9,153 |
| | 163,147 |
TOTAL CONSUMER DISCRETIONARY | | 1,353,197 |
CONSUMER STAPLES - 2.3% |
Food Products - 2.0% |
ConAgra Foods, Inc. | 541,700 | | 19,615 |
Darling International, Inc. (a) | 3,476,642 | | 70,576 |
Smithfield Foods, Inc. (a) | 559,606 | | 18,579 |
| | 108,770 |
Personal Products - 0.3% |
Revlon, Inc. (a) | 553,261 | | 13,881 |
TOTAL CONSUMER STAPLES | | 122,651 |
ENERGY - 9.5% |
Energy Equipment & Services - 2.8% |
Ensco PLC Class A | 110,000 | | 6,307 |
Halliburton Co. | 1,126,593 | | 50,911 |
Noble Corp. | 987,610 | | 37,727 |
Oil States International, Inc. (a) | 270,466 | | 26,297 |
Schlumberger Ltd. | 109,400 | | 8,898 |
Transocean Ltd. (United States) | 381,900 | | 18,010 |
| | 148,150 |
Oil, Gas & Consumable Fuels - 6.7% |
Alpha Natural Resources, Inc. (a) | 6,794,948 | | 36,965 |
Continental Resources, Inc. (a) | 534,087 | | 49,296 |
Forest Oil Corp. (a)(e) | 1,205,652 | | 6,173 |
Hess Corp. | 835,910 | | 62,242 |
HollyFrontier Corp. | 1,682,927 | | 76,657 |
Kodiak Oil & Gas Corp. (a) | 2,019,747 | | 19,612 |
Peabody Energy Corp. | 822,825 | | 13,626 |
Range Resources Corp. | 247,200 | | 19,554 |
Common Stocks - continued |
| Shares | | Value (000s) |
ENERGY - continued |
Oil, Gas & Consumable Fuels - continued |
Valero Energy Corp. | 1,328,266 | | $ 47,512 |
Western Refining, Inc. (e) | 685,914 | | 20,667 |
| | 352,304 |
TOTAL ENERGY | | 500,454 |
FINANCIALS - 9.3% |
Commercial Banks - 2.9% |
CIT Group, Inc. (a) | 229,310 | | 11,491 |
Huntington Bancshares, Inc. | 8,526,580 | | 72,902 |
Regions Financial Corp. | 3,284,894 | | 32,882 |
SunTrust Banks, Inc. | 1,019,600 | | 35,472 |
| | 152,747 |
Consumer Finance - 0.9% |
American Express Co. | 679,548 | | 50,130 |
Diversified Financial Services - 3.6% |
Bank of America Corp. | 7,748,999 | | 113,135 |
Citigroup, Inc. | 1,458,047 | | 76,023 |
| | 189,158 |
Insurance - 1.1% |
AFLAC, Inc. | 641,700 | | 39,580 |
Lincoln National Corp. | 435,700 | | 18,156 |
| | 57,736 |
Real Estate Investment Trusts - 0.6% |
Host Hotels & Resorts, Inc. | 1,016,122 | | 18,148 |
Sabra Health Care REIT, Inc. | 547,507 | | 14,367 |
| | 32,515 |
Real Estate Management & Development - 0.1% |
Realogy Holdings Corp. | 156,900 | | 7,054 |
Thrifts & Mortgage Finance - 0.1% |
MGIC Investment Corp. (a) | 441,300 | | 3,372 |
TOTAL FINANCIALS | | 492,712 |
HEALTH CARE - 10.1% |
Health Care Equipment & Supplies - 2.1% |
Boston Scientific Corp. (a) | 10,011,725 | | 109,328 |
Health Care Providers & Services - 5.2% |
Community Health Systems, Inc. | 784,376 | | 36,128 |
Common Stocks - continued |
| Shares | | Value (000s) |
HEALTH CARE - continued |
Health Care Providers & Services - continued |
DaVita, Inc. (a) | 367,826 | | $ 42,819 |
HCA Holdings, Inc. | 1,216,779 | | 47,454 |
Tenet Healthcare Corp. (a) | 2,660,744 | | 118,802 |
Universal Health Services, Inc. Class B | 385,505 | | 26,966 |
| | 272,169 |
Pharmaceuticals - 2.8% |
Johnson & Johnson | 153,000 | | 14,306 |
Merck & Co., Inc. | 1,754,400 | | 84,509 |
Sanofi SA sponsored ADR (e) | 992,534 | | 51,096 |
| | 149,911 |
TOTAL HEALTH CARE | | 531,408 |
INDUSTRIALS - 10.6% |
Aerospace & Defense - 1.4% |
Honeywell International, Inc. | 478,776 | | 39,729 |
Huntington Ingalls Industries, Inc. | 258,160 | | 16,052 |
Textron, Inc. | 602,700 | | 16,502 |
| | 72,283 |
Airlines - 2.4% |
Delta Air Lines, Inc. | 3,665,001 | | 77,808 |
Southwest Airlines Co. | 571,283 | | 7,901 |
U.S. Airways Group, Inc. (a) | 1,481,380 | | 28,665 |
United Continental Holdings, Inc. (a) | 370,700 | | 12,919 |
| | 127,293 |
Building Products - 0.9% |
Armstrong World Industries, Inc. (a) | 693,300 | | 34,720 |
Owens Corning (a) | 294,219 | | 11,619 |
Owens Corning warrants 10/31/13 (a) | 406,600 | | 407 |
| | 46,746 |
Commercial Services & Supplies - 1.0% |
Deluxe Corp. | 1,037,373 | | 42,543 |
Tyco International Ltd. | 328,233 | | 11,426 |
| | 53,969 |
Electrical Equipment - 1.9% |
Belden, Inc. | 777,664 | | 45,579 |
Emerson Electric Co. | 163,500 | | 10,034 |
Generac Holdings, Inc. | 490,557 | | 21,266 |
Common Stocks - continued |
| Shares | | Value (000s) |
INDUSTRIALS - continued |
Electrical Equipment - continued |
General Cable Corp. | 437,132 | | $ 13,778 |
Polypore International, Inc. (a)(e) | 217,800 | | 9,145 |
| | 99,802 |
Industrial Conglomerates - 0.7% |
Carlisle Companies, Inc. | 109,910 | | 7,445 |
General Electric Co. | 1,103,883 | | 26,902 |
| | 34,347 |
Machinery - 1.6% |
Harsco Corp. | 890,712 | | 22,945 |
Ingersoll-Rand PLC | 739,500 | | 45,146 |
Pentair Ltd. | 78,757 | | 4,810 |
Timken Co. | 228,734 | | 13,363 |
| | 86,264 |
Marine - 0.2% |
Navios Maritime Holdings, Inc. | 2,162,794 | | 12,090 |
Road & Rail - 0.4% |
Hertz Global Holdings, Inc. (a) | 707,700 | | 18,124 |
Trading Companies & Distributors - 0.1% |
Edgen Group, Inc. Class A (a) | 841,256 | | 6,604 |
TOTAL INDUSTRIALS | | 557,522 |
INFORMATION TECHNOLOGY - 5.6% |
Communications Equipment - 1.1% |
Cisco Systems, Inc. | 2,383,049 | | 60,887 |
Computers & Peripherals - 0.4% |
NCR Corp. (a) | 569,631 | | 20,507 |
Electronic Equipment & Components - 0.8% |
Avnet, Inc. (a) | 594,313 | | 22,388 |
Corning, Inc. | 726,800 | | 11,040 |
Viasystems Group, Inc. (a) | 540,460 | | 8,026 |
| | 41,454 |
Internet Software & Services - 0.2% |
VeriSign, Inc. (a) | 194,300 | | 9,295 |
Semiconductors & Semiconductor Equipment - 2.5% |
Advanced Micro Devices, Inc. (a)(e) | 1,704,692 | | 6,427 |
Fairchild Semiconductor International, Inc. (a) | 1,122,274 | | 14,163 |
Freescale Semiconductor Holdings I Ltd. (a)(e) | 1,235,600 | | 19,399 |
Intersil Corp. Class A | 1,460,387 | | 14,911 |
Common Stocks - continued |
| Shares | | Value (000s) |
INFORMATION TECHNOLOGY - continued |
Semiconductors & Semiconductor Equipment - continued |
Micron Technology, Inc. (a) | 2,293,545 | | $ 30,389 |
ON Semiconductor Corp. (a) | 5,502,368 | | 45,340 |
| | 130,629 |
Software - 0.6% |
Citrix Systems, Inc. (a) | 230,899 | | 16,629 |
Microsoft Corp. | 108,800 | | 3,463 |
Nuance Communications, Inc. (a) | 573,666 | | 10,762 |
| | 30,854 |
TOTAL INFORMATION TECHNOLOGY | | 293,626 |
MATERIALS - 11.5% |
Chemicals - 8.9% |
H.B. Fuller Co. | 461,829 | | 18,542 |
LyondellBasell Industries NV Class A | 5,651,852 | | 388,336 |
OMNOVA Solutions, Inc. (a)(f) | 3,114,962 | | 25,107 |
Phosphate Holdings, Inc. (a) | 307,500 | | 308 |
The Dow Chemical Co. | 373,388 | | 13,084 |
W.R. Grace & Co. (a) | 317,904 | | 24,421 |
| | 469,798 |
Containers & Packaging - 2.2% |
Rock-Tenn Co. Class A | 814,923 | | 93,186 |
Sealed Air Corp. | 821,949 | | 22,390 |
| | 115,576 |
Metals & Mining - 0.1% |
AngloGold Ashanti Ltd. sponsored ADR | 526,100 | | 6,929 |
Ormet Corp. (a) | 330,000 | | 3 |
Ormet Corp. (a)(i) | 1,075,000 | | 10 |
| | 6,942 |
Paper & Forest Products - 0.3% |
Neenah Paper, Inc. | 418,300 | | 16,552 |
TOTAL MATERIALS | | 608,868 |
TELECOMMUNICATION SERVICES - 0.5% |
Diversified Telecommunication Services - 0.5% |
Intelsat SA | 1,144,700 | | 24,542 |
Common Stocks - continued |
| Shares | | Value (000s) |
UTILITIES - 3.1% |
Electric Utilities - 0.3% |
FirstEnergy Corp. | 421,304 | | $ 16,039 |
Independent Power Producers & Energy Traders - 2.8% |
Calpine Corp. (a) | 2,616,200 | | 52,350 |
The AES Corp. | 7,894,007 | | 98,201 |
| | 150,551 |
TOTAL UTILITIES | | 166,590 |
TOTAL COMMON STOCKS (Cost $3,235,776) |
4,651,570
|
Nonconvertible Preferred Stocks - 0.3% |
| | | |
CONSUMER STAPLES - 0.1% |
Personal Products - 0.1% |
Revlon, Inc. Series A 12.75% | 639,576 | | 3,454 |
FINANCIALS - 0.2% |
Diversified Financial Services - 0.2% |
GMAC Capital Trust I Series 2, 8.125% | 439,013 | | 11,656 |
TOTAL NONCONVERTIBLE PREFERRED STOCKS (Cost $19,207) |
15,110
|
Corporate Bonds - 0.4% |
| Principal Amount (000s) | | |
Convertible Bonds - 0.1% |
INDUSTRIALS - 0.1% |
Marine - 0.1% |
Genco Shipping & Trading Ltd. 5% 8/15/15 | | $ 12,440 | | 3,351 |
Nonconvertible Bonds - 0.3% |
CONSUMER DISCRETIONARY - 0.3% |
Automobiles - 0.0% |
General Motors Corp.: | | | | |
6.75% 5/1/28 (d) | | 3,075 | | 0 |
7.125% 7/15/49 (d) | | 8,320 | | 0 |
7.2% 1/15/11 (d) | | 22,980 | | 0 |
8.25% 7/15/23 (d) | | 25,035 | | 0 |
Corporate Bonds - continued |
| Principal Amount (000s) | | Value (000s) |
Nonconvertible Bonds - continued |
CONSUMER DISCRETIONARY - continued |
Automobiles - continued |
General Motors Corp.: - continued | | | | |
8.375% 7/15/33 (d) | | $ 50,210 | | $ 0 |
8.8% 3/1/21 (d) | | 10,765 | | 0 |
Multiline Retail - 0.3% |
The Bon-Ton Department Stores, Inc. 10.625% 7/15/17 | | 16,919 | | 16,898 |
TOTAL CORPORATE BONDS (Cost $21,338) |
20,249
|
Floating Rate Loans - 0.1% |
|
UTILITIES - 0.1% |
Electric Utilities - 0.1% |
Texas Competitive Electric Holdings Co. LLC/Texas Competitive Electric Holdings Finance, Inc. Tranche B, term loan 4.7212% 10/10/17 (g) (Cost $4,873) | | 5,458 | | 3,827 |
Money Market Funds - 15.1% |
| Shares | | |
Fidelity Cash Central Fund, 0.11% (b) | 627,652,352 | | 627,652 |
Fidelity Securities Lending Cash Central Fund, 0.12% (b)(c) | 171,038,475 | | 171,038 |
TOTAL MONEY MARKET FUNDS (Cost $798,690) |
798,690
|
TOTAL INVESTMENT PORTFOLIO - 104.0% (Cost $4,079,884) | | 5,489,446 |
NET OTHER ASSETS (LIABILITIES) - (4.0)% | | (210,002) |
NET ASSETS - 100% | $ 5,279,444 |
Legend |
(a) Non-income producing |
(b) Affiliated fund that is generally available only to investment companies and other accounts managed by Fidelity Investments. The rate quoted is the annualized seven-day yield of the fund at period end. A complete unaudited listing of the fund's holdings as of its most recent quarter end is available upon request. In addition, each Fidelity Central Fund's financial statements, which are not covered by the Fund's Report of Independent Registered Public Accounting Firm, are available on the SEC's website or upon request. |
(c) Investment made with cash collateral received from securities on loan. |
(d) Non-income producing - Security is in default. |
(e) Security or a portion of the security is on loan at period end. |
(f) Affiliated company |
(g) Coupon rates for floating and adjustable rate securities reflect the rates in effect at period end. |
(h) Investment is owned by an entity that is treated as a corporation for U.S. tax purposes and is owned by the Fund. |
(i) Restricted securities - Investment in securities not registered under the Securities Act of 1933 (excluding 144A issues). At the end of the period, the value of restricted securities (excluding 144A issues) amounted to $19,000 or 0.0% of net assets. |
Additional information on each restricted holding is as follows: |
Security | Acquisition Date | Acquisition Cost (000s) |
Ormet Corp. | 2/27/07 - 4/4/07 | $ 20,556 |
Station Holdco LLC unit | 10/28/08 - 12/1/08 | $ 5,990 |
Affiliated Central Funds |
Information regarding fiscal year to date income earned by the Fund from investments in Fidelity Central Funds is as follows: |
Fund | Income earned
(Amounts in thousands) |
Fidelity Cash Central Fund | $ 876 |
Fidelity Securities Lending Cash Central Fund | 2,121 |
Total | $ 2,997 |
Other Affiliated Issuers |
An affiliated company is a company in which the Fund has ownership of at least 5% of the voting securities. Fiscal year to date transactions with companies which are or were affiliates are as follows: |
Affiliate
(Amounts in thousands) | Value,
beginning of
period | Purchases | Sales
Proceeds | Dividend
Income | Value,
end of
period |
Exide Technologies | $ 11,516 | $ - | $ - | $ - | $ - |
Gray Television, Inc. | 6,327 | - | - | - | 29,414 |
OMNOVA Solutions, Inc. | 22,677 | - | - | - | 25,107 |
Service Corp. International | 176,344 | - | 11,722 | 3,250 | 244,446 |
Total | $ 216,864 | $ - | $ 11,722 | $ 3,250 | $ 298,967 |
Other Information |
The following is a summary of the inputs used, as of July 31, 2013, involving the Fund's assets and liabilities carried at fair value. The inputs or methodology used for valuing securities may not be an indication of the risk associated with investing in those securities. For more information on valuation inputs, and their aggregation into the levels used in the table below, please refer to the Investment Valuation section in the accompanying Notes to Financial Statements. |
Valuation Inputs at Reporting Date: |
Description
(Amounts in thousands) | Total | Level 1 | Level 2 | Level 3 |
Investments in Securities: | | | | |
Equities: | | | | |
Consumer Discretionary | $ 1,353,197 | $ 1,353,188 | $ - | $ 9 |
Consumer Staples | 126,105 | 126,105 | - | - |
Energy | 500,454 | 500,454 | - | - |
Financials | 504,368 | 504,368 | - | - |
Health Care | 531,408 | 531,408 | - | - |
Industrials | 557,522 | 557,522 | - | - |
Information Technology | 293,626 | 293,626 | - | - |
Materials | 608,868 | 608,868 | - | - |
Telecommunication Services | 24,542 | 24,542 | - | - |
Utilities | 166,590 | 166,590 | - | - |
Corporate Bonds | 20,249 | - | 20,249 | - |
Floating Rate Loans | 3,827 | - | 3,827 | - |
Money Market Funds | 798,690 | 798,690 | - | - |
Total Investments in Securities: | $ 5,489,446 | $ 5,465,361 | $ 24,076 | $ 9 |
Distribution of investments by country or territory of incorporation, as a percentage of total net assets, is as follows. (Unaudited) |
United States of America | 86.8% |
Netherlands | 7.4% |
Switzerland | 1.2% |
Others (Individually Less Than 1%) | 4.6% |
| 100.0% |
See accompanying notes which are an integral part of the financial statements.
Annual Report
Statement of Assets and Liabilities
Amounts in thousands (except per-share amounts) | July 31, 2013 |
| | |
Assets | | |
Investment in securities, at value (including securities loaned of $172,773) - See accompanying schedule: Unaffiliated issuers (cost $3,129,506) | $ 4,391,789 | |
Fidelity Central Funds (cost $798,690) | 798,690 | |
Other affiliated issuers (cost $151,688) | 298,967 | |
Total Investments (cost $4,079,884) | | $ 5,489,446 |
Receivable for fund shares sold | | 4,126 |
Dividends receivable | | 2,026 |
Interest receivable | | 997 |
Distributions receivable from Fidelity Central Funds | | 98 |
Other receivables | | 473 |
Total assets | | 5,497,166 |
| | |
Liabilities | | |
Payable for fund shares redeemed | $ 43,076 | |
Accrued management fee | 2,634 | |
Other affiliated payables | 731 | |
Other payables and accrued expenses | 243 | |
Collateral on securities loaned, at value | 171,038 | |
Total liabilities | | 217,722 |
| | |
Net Assets | | $ 5,279,444 |
Net Assets consist of: | | |
Paid in capital | | $ 4,089,583 |
Undistributed net investment income | | 22,624 |
Accumulated undistributed net realized gain (loss) on investments and foreign currency transactions | | (242,325) |
Net unrealized appreciation (depreciation) on investments | | 1,409,562 |
Net Assets | | $ 5,279,444 |
See accompanying notes which are an integral part of the financial statements.
Annual Report
Statement of Assets and Liabilities - continued
Amounts in thousands (except per-share amounts) | July 31, 2013 |
| | |
Leveraged Company Stock:
Net Asset Value, offering price and redemption price per share ($4,226,674 ÷ 107,175 shares) | | $ 39.44 |
| | |
Class K:
Net Asset Value, offering price and redemption price per share ($1,052,770 ÷ 26,639 shares) | | $ 39.52 |
See accompanying notes which are an integral part of the financial statements.
Annual Report
Financial Statements - continued
Statement of Operations
Amounts in thousands | Year ended July 31, 2013 |
| | |
Investment Income | | |
Dividends (including $3,250 earned from other affiliated issuers) | | $ 71,294 |
Special dividends | | 9,900 |
Interest | | 8,077 |
Income from Fidelity Central Funds | | 2,997 |
Total income | | 92,268 |
| | |
Expenses | | |
Management fee | $ 26,976 | |
Transfer agent fees | 7,093 | |
Accounting and security lending fees | 1,075 | |
Custodian fees and expenses | 43 | |
Independent trustees' compensation | 27 | |
Registration fees | 125 | |
Audit | 64 | |
Legal | 16 | |
Miscellaneous | 36 | |
Total expenses before reductions | 35,455 | |
Expense reductions | (194) | 35,261 |
Net investment income (loss) | | 57,007 |
Realized and Unrealized Gain (Loss) Net realized gain (loss) on: | | |
Investment securities: | | |
Unaffiliated issuers | 330,604 | |
Other affiliated issuers | 5,632 | |
Foreign currency transactions | 3 | |
Total net realized gain (loss) | | 336,239 |
Change in net unrealized appreciation (depreciation) on investment securities | | 1,098,022 |
Net gain (loss) | | 1,434,261 |
Net increase (decrease) in net assets resulting from operations | | $ 1,491,268 |
See accompanying notes which are an integral part of the financial statements.
Annual Report
Statement of Changes in Net Assets
Amounts in thousands | Year ended
July 31,
2013 | Year ended
July 31,
2012 |
Increase (Decrease) in Net Assets | | |
Operations | | |
Net investment income (loss) | $ 57,007 | $ 22,919 |
Net realized gain (loss) | 336,239 | 163,015 |
Change in net unrealized appreciation (depreciation) | 1,098,022 | (307,255) |
Net increase (decrease) in net assets resulting
from operations | 1,491,268 | (121,321) |
Distributions to shareholders from net investment income | (15,789) | (41,206) |
Share transactions - net increase (decrease) | 194,361 | (714,976) |
Redemption fees | 538 | 410 |
Total increase (decrease) in net assets | 1,670,378 | (877,093) |
| | |
Net Assets | | |
Beginning of period | 3,609,066 | 4,486,159 |
End of period (including undistributed net investment income of $22,624 and distributions in excess of net investment income of $18,505, respectively) | $ 5,279,444 | $ 3,609,066 |
See accompanying notes which are an integral part of the financial statements.
Annual Report
Financial Highlights - Leveraged Company Stock
Years ended July 31, | 2013 | 2012 | 2011 | 2010 | 2009 |
Selected Per-Share Data | | | | | |
Net asset value, beginning of period | $ 28.22 | $ 28.85 | $ 23.50 | $ 19.55 | $ 31.09 |
Income from Investment Operations | | | | | |
Net investment income (loss) B | .42 F | .16 | - H | .07 | .21 |
Net realized and unrealized gain (loss) | 10.92 | (.50) | 5.46 | 3.99 | (11.37) |
Total from investment operations | 11.34 | (.34) | 5.46 | 4.06 | (11.16) |
Distributions from net investment income | (.12) | (.29) | (.11) | (.11) | (.14) |
Distributions from net realized gain | - | - | - | - | (.25) |
Total distributions | (.12) | (.29) | (.11) | (.11) | (.39) |
Redemption fees added to paid in capital B | - H | - H | - H | - H | .01 |
Net asset value, end of period | $ 39.44 | $ 28.22 | $ 28.85 | $ 23.50 | $ 19.55 |
Total Return A | 40.31% | (1.05)% | 23.27% | 20.84% | (35.99)% |
Ratios to Average Net Assets C, G | | | | | |
Expenses before reductions | .82% | .86% | .85% | .88% | .92% |
Expenses net of fee waivers, if any | .82% | .86% | .85% | .88% | .92% |
Expenses net of all reductions | .82% | .85% | .84% | .88% | .92% |
Net investment income (loss) | 1.25% F | .60% | -% E | .29% | 1.17% |
Supplemental Data | | | | | |
Net assets, end of period (in millions) | $ 4,227 | $ 3,009 | $ 3,931 | $ 3,983 | $ 3,714 |
Portfolio turnover rate D | 21% | 29% | 18% | 21% | 34% |
A Total returns would have been lower if certain expenses had not been reduced during the applicable periods shown.
B Calculated based on average shares outstanding during the period.
C Fees and expenses of any underlying Fidelity Central Funds are not included in the Fund's expense ratio. The Fund indirectly bears its proportionate share of the expenses of any underlying Fidelity Central Funds.
D Amount does not include the portfolio activity of any underlying Fidelity Central Funds.
E Amount represents less than .01%.
F Investment income per share reflects a large, non-recurring dividend which amounted to $.08 per share. Excluding this non-recurring dividend, the ratio of net investment income (loss) to average net assets would have been 1.03%.
G Expense ratios reflect operating expenses of the class. Expenses before reductions do not reflect amounts reimbursed by the investment adviser or reductions from brokerage service arrangements or reductions from other expense offset arrangements and do not represent the amount paid by the class during periods when reimbursements or reductions occur. Expenses net of fee waivers reflect expenses after reimbursement by the investment adviser but prior to reductions from brokerage service arrangements or other expense offset arrangements. Expenses net of all reductions represent the net expenses paid by the class.
H Amount represents less than $.01 per share.
See accompanying notes which are an integral part of the financial statements.
Annual Report
Financial Highlights - Class K
Years ended July 31, | 2013 | 2012 | 2011 | 2010 | 2009 |
Selected Per-Share Data | | | | | |
Net asset value, beginning of period | $ 28.26 | $ 28.86 | $ 23.52 | $ 19.56 | $ 31.11 |
Income from Investment Operations | | | | | |
Net investment income (loss) B | .47 E | .20 | .04 | .11 | .21 |
Net realized and unrealized gain (loss) | 10.93 | (.49) | 5.45 | 4.00 | (11.35) |
Total from investment operations | 11.40 | (.29) | 5.49 | 4.11 | (11.14) |
Distributions from net investment income | (.14) | (.31) | (.15) | (.15) | (.17) |
Distributions from net realized gain | - | - | - | - | (.25) |
Total distributions | (.14) | (.31) | (.15) | (.15) | (.42) |
Redemption fees added to paid in capital B | - G | - G | - G | - G | .01 |
Net asset value, end of period | $ 39.52 | $ 28.26 | $ 28.86 | $ 23.52 | $ 19.56 |
Total Return A | 40.47% | (.87)% | 23.45% | 21.09% | (35.86)% |
Ratios to Average Net Assets C, F | | | | | |
Expenses before reductions | .69% | .69% | .69% | .70% | .71% |
Expenses net of fee waivers, if any | .69% | .69% | .69% | .70% | .71% |
Expenses net of all reductions | .68% | .69% | .69% | .69% | .71% |
Net investment income (loss) | 1.39% E | .76% | .16% | .47% | 1.39% |
Supplemental Data | | | | | |
Net assets, end of period (in millions) | $ 1,053 | $ 600 | $ 555 | $ 410 | $ 267 |
Portfolio turnover rate D | 21% | 29% | 18% | 21% | 34% |
A Total returns would have been lower if certain expenses had not been reduced during the applicable periods shown.
B Calculated based on average shares outstanding during the period.
C Fees and expenses of any underlying Fidelity Central Funds are not included in the Fund's expense ratio. The Fund indirectly bears its proportionate share of the expenses of any underlying Fidelity Central Funds.
D Amount does not include the portfolio activity of any underlying Fidelity Central Funds.
E Investment income per share reflects a large, non-recurring dividend which amounted to $.08 per share. Excluding this non-recurring dividend, the ratio of net investment income (loss) to average net assets would have been 1.17%.
F Expense ratios reflect operating expenses of the class. Expenses before reductions do not reflect amounts reimbursed by the investment adviser or reductions from brokerage service arrangements or reductions from other expense offset arrangements and do not represent the amount paid by the class during periods when reimbursements or reductions occur. Expenses net of fee waivers reflect expenses after reimbursement by the investment adviser but prior to reductions from brokerage service arrangements or other expense offset arrangements. Expenses net of all reductions represent the net expenses paid by the class.
G Amount represents less than $.01 per share.
See accompanying notes which are an integral part of the financial statements.
Annual Report
Notes to Financial Statements
For the period ended July 31, 2013
(Amounts in thousands except percentages)
1. Organization.
Fidelity Leveraged Company Stock Fund (the Fund) is a fund of Fidelity Securities Fund (the Trust) and is authorized to issue an unlimited number of shares. The Trust is registered under the Investment Company Act of 1940, as amended (the 1940 Act), as an open-end management investment company organized as a Massachusetts business trust. The Fund offers Leveraged Company Stock and Class K shares, each of which has equal rights as to assets and voting privileges. Each class has exclusive voting rights with respect to matters that affect that class.
2. Investments in Fidelity Central Funds.
The Fund invests in Fidelity Central Funds, which are open-end investment companies generally available only to other investment companies and accounts managed by Fidelity Management & Research Company (FMR) and its affiliates. The Fund's Schedule of Investments lists each of the Fidelity Central Funds held as of period end, if any, as an investment of the Fund, but does not include the underlying holdings of each Fidelity Central Fund. As an Investing Fund, the Fund indirectly bears its proportionate share of the expenses of the underlying Fidelity Central Funds.
The Money Market Central Funds seek preservation of capital and current income and are managed by Fidelity Investments Money Management, Inc. (FIMM), an affiliate of FMR.
A complete unaudited list of holdings for each Fidelity Central Fund is available upon request or at the Securities and Exchange Commission (the SEC) website at www.sec.gov. In addition, the financial statements of the Fidelity Central Funds, which are not covered by the Fund's Report of Independent Registered Public Accounting Firm, are available on the SEC website or upon request.
3. Significant Accounting Policies.
The financial statements have been prepared in conformity with accounting principles generally accepted in the United States of America (GAAP), which require management to make certain estimates and assumptions at the date of the financial statements. Actual results could differ from those estimates. Subsequent events, if any, through the date that the financial statements were issued have been evaluated in the preparation of the financial statements. The following summarizes the significant accounting policies of the Fund:
Investment Valuation. Investments are valued as of 4:00 p.m. Eastern time on the last calendar day of the period. In accordance with valuation policies and procedures approved by the Board of Trustees (the Board), the Fund attempts to obtain prices from one or more third party pricing vendors or brokers to value its investments. When
Annual Report
Notes to Financial Statements - continued
(Amounts in thousands except percentages)
3. Significant Accounting Policies - continued
Investment Valuation - continued
current market prices, quotations or currency exchange rates are not readily available or reliable, investments will be fair valued in good faith by the FMR Fair Value Committee (the Committee), in accordance with procedures adopted by the Board. Factors used in determining fair value vary by investment type and may include market or investment specific events, changes in interest rates and credit quality. The frequency with which these procedures are used cannot be predicted and they may be utilized to a significant extent. The Committee oversees the Fund's valuation policies and procedures and is responsible for approving and reporting to the Board all fair value determinations.
The Fund categorizes the inputs to valuation techniques used to value its investments into a disclosure hierarchy consisting of three levels as shown below:
Level 1 - quoted prices in active markets for identical investments
Level 2 - other significant observable inputs (including quoted prices for similar investments, interest rates, prepayment speeds, etc.)
Level 3 - unobservable inputs (including the Fund's own assumptions based on the best information available)
Valuation techniques used to value the Fund's investments by major category are as follows:
Equity securities, including restricted securities, for which market quotations are readily available, are valued at the last reported sale price or official closing price as reported by a third party pricing vendor on the primary market or exchange on which they are traded and are categorized as Level 1 in the hierarchy. In the event there were no sales during the day or closing prices are not available, securities are valued at the last quoted bid price or may be valued using the last available price and are generally categorized as Level 2 in the hierarchy. For foreign equity securities, when market or security specific events arise, comparisons to the valuation of American Depositary Receipts (ADRs), futures contracts, Exchange-Traded Funds (ETFs) and certain indexes as well as quoted prices for similar securities may be used and would be categorized as Level 2 in the hierarchy. Utilizing these techniques may result in transfers between Level 1 and Level 2. For restricted equity securities and private placements where observable inputs are limited, assumptions about market activity and risk are used and these securities are generally categorized as Level 3 in the hierarchy.
Debt securities, including restricted securities, are valued based on evaluated prices received from third party pricing vendors or from brokers who make markets in such securities. For corporate bonds and floating rate loans, pricing vendors utilize matrix pricing which considers yield or price of bonds of comparable quality, coupon, maturity
Annual Report
3. Significant Accounting Policies - continued
Investment Valuation - continued
and type as well as broker-supplied prices. When independent prices are unavailable or unreliable, debt securities may be valued utilizing pricing methodologies which consider similar factors that would be used by third party pricing vendors. Debt securities are generally categorized as Level 2 in the hierarchy but may be Level 3 depending on the circumstances.
Investments in open-end mutual funds, including the Fidelity Central Funds, are valued at their closing net asset value (NAV) each business day and are categorized as Level 1 in the hierarchy.
Changes in valuation techniques may result in transfers in or out of an assigned level within the disclosure hierarchy. The aggregate value of investments by input level, as of July 31, 2013, is included at the end of the Fund's Schedule of Investments.
Foreign Currency. The Fund may use foreign currency contracts to facilitate transactions in foreign-denominated securities. Gains and losses from these transactions may arise from changes in the value of the foreign currency or if the counterparties do not perform under the contracts' terms.
Foreign-denominated assets, including investment securities, and liabilities are translated into U.S. dollars at the exchange rates at period end. Purchases and sales of investment securities, income and dividends received and expenses denominated in foreign currencies are translated into U.S. dollars at the exchange rate in effect on the transaction date.
The effects of exchange rate fluctuations on investments are included with the net realized and unrealized gain (loss) on investment securities. Other foreign currency transactions resulting in realized and unrealized gain (loss) are disclosed separately.
Investment Transactions and Income. For financial reporting purposes, the Fund's investment holdings and NAV include trades executed through the end of the last business day of the period. The NAV per share for processing shareholder transactions is calculated as of the close of business of the New York Stock Exchange (NYSE), normally 4:00 p.m. Eastern time and includes trades executed through the end of the prior business day. Gains and losses on securities sold are determined on the basis of identified cost and may include proceeds received from litigation. Dividend income is recorded on the ex-dividend date, except for certain dividends from foreign securities where the ex-dividend date may have passed, which are recorded as soon as the Fund is informed of the ex-dividend date. Non-cash dividends included in dividend income, if any, are recorded at the fair market value of the securities received. Distributions received on securities that represent a return of capital or capital gain are recorded as a reduction of
Annual Report
Notes to Financial Statements - continued
(Amounts in thousands except percentages)
3. Significant Accounting Policies - continued
Investment Transactions and Income - continued
cost of investments and/or as a realized gain. Subsequent to ex-dividend date the Fund determines the components of these distributions, based upon receipt of tax filings or other correspondence relating to the underlying investment. Large, non-recurring dividends recognized by the Fund are presented separately on the Statement of Operations as "Special Dividends" and the impact of these dividends is presented in the Financial Highlights. Interest income and distributions from the Fidelity Central Funds are accrued as earned. Interest income includes coupon interest and amortization of premium and accretion of discount on debt securities. Investment income is recorded net of foreign taxes withheld where recovery of such taxes is uncertain. Debt obligations may be placed on non-accrual status and related interest income may be reduced by ceasing current accruals and writing off interest receivables when the collection of all or a portion of interest has become doubtful based on consistently applied procedures. A debt obligation is removed from non-accrual status when the issuer resumes interest payments or when collectability of interest is reasonably assured.
Class Allocations and Expenses. Investment income, realized and unrealized capital gains and losses, common expenses of the Fund, and certain fund-level expense reductions, if any, are allocated on a pro-rata basis to each class based on the relative net assets of each class to the total net assets of the Fund. Each class differs with respect to transfer agent fees incurred. Certain expense reductions may also differ by class. Expenses directly attributable to a fund are charged to that fund. Expenses attributable to more than one fund are allocated among the respective funds on the basis of relative net assets or other appropriate methods. Expense estimates are accrued in the period to which they relate and adjustments are made when actual amounts are known.
Income Tax Information and Distributions to Shareholders. Each year, the Fund intends to qualify as a regulated investment company under Subchapter M of the Internal Revenue Code, including distributing substantially all of its taxable income and realized gains. As a result, no provision for income taxes is required. As of July 31, 2013, the Fund did not have any unrecognized tax benefits in the financial statements; nor is the Fund aware of any tax positions for which it is reasonably possible that the total amounts of unrecognized tax benefits will significantly change in the next twelve months. The Fund files a U.S. federal tax return, in addition to state and local tax returns as required. A fund's federal income tax returns are subject to examination by the Internal Revenue Service (IRS) for a period of three fiscal years after they are filed. State and local tax returns may be subject to examination for an additional fiscal year depending on the jurisdiction. Foreign taxes are provided for based on the Fund's understanding of the tax rules and rates that exist in the foreign markets in which it invests.
Annual Report
3. Significant Accounting Policies - continued
Income Tax Information and Distributions to Shareholders - continued
Distributions are declared and recorded on the ex-dividend date. Income dividends and capital gain distributions are declared separately for each class. Income and capital gain distributions are determined in accordance with income tax regulations, which may differ from GAAP.
Capital accounts within the financial statements are adjusted for permanent book-tax differences. These adjustments have no impact on net assets or the results of operations. Temporary book-tax differences will reverse in a subsequent period.
Book-tax differences are primarily due to foreign currency transactions, market discount, equity debt classifications, capital loss carryforwards, losses deferred due to wash sales and excise tax regulations.
The federal tax cost of investment securities and unrealized appreciation (depreciation) as of period end were as follows:
Gross unrealized appreciation | $ 1,660,648 |
Gross unrealized depreciation | (249,320) |
Net unrealized appreciation (depreciation) on securities and other investments | $ 1,411,328 |
| |
Tax Cost | $ 4,078,118 |
The tax-based components of distributable earnings as of period end were as follows:
Undistributed ordinary income | $ 21,058 |
Capital loss carryforward | $ (242,325) |
Net unrealized appreciation (depreciation) | $ 1,411,328 |
Capital loss carryforwards are only available to offset future capital gains of the Fund to the extent provided by regulations and may be limited. Under the Regulated Investment Company Modernization Act of 2010 (the Act), the Fund is permitted to carry forward capital losses incurred in taxable years beginning after December 22, 2010 for an unlimited period and such capital losses are required to be used prior to any losses that expire. The capital loss carryforward information presented below, including any applicable limitation, is estimated as of fiscal period end and is subject to adjustment.
Fiscal year of expiration | |
2018 | $ (242,325) |
Annual Report
Notes to Financial Statements - continued
(Amounts in thousands except percentages)
3. Significant Accounting Policies - continued
Income Tax Information and Distributions to Shareholders - continued
The tax character of distributions paid was as follows:
| July 31, 2013 | July 31, 2012 |
Ordinary Income | $ 15,789 | $ 41,206 |
Short-Term Trading (Redemption) Fees. Shares held by investors in the Fund less than 90 days may have been subject to a redemption fee equal to 1.50% of the net asset value of shares redeemed. All redemption fees, which reduce the proceeds of the shareholder redemption, are retained by the Fund and accounted for as an addition to paid in capital.
Restricted Securities. The Fund may invest in securities that are subject to legal or contractual restrictions on resale. These securities generally may be resold in transactions exempt from registration or to the public if the securities are registered. Disposal of these securities may involve time-consuming negotiations and expense, and prompt sale at an acceptable price may be difficult. Information regarding restricted securities is included at the end of the Fund's Schedule of Investments.
Loans and Other Direct Debt Instruments. The Fund invests in direct debt instruments which are interests in amounts owed to lenders by corporate or other borrowers. These instruments may be in the form of loans, trade claims or other receivables and may include standby financing commitments such as revolving credit facilities that obligate the Fund to supply additional cash to the borrower on demand. Loans may be acquired through assignment or participation, or may be made directly to a borrower. The Fund may be contractually obligated to receive approval from the agent bank and/or borrower prior to the sale of these loans.
4. Purchases and Sales of Investments.
Purchases and sales of securities, other than short-term securities, aggregated $825,467 and $903,237, respectively.
5. Fees and Other Transactions with Affiliates.
Management Fee. FMR and its affiliates provide the Fund with investment management related services for which the Fund pays a monthly management fee. The management fee is the sum of an individual fund fee rate that is based on an annual rate of .35% of the Fund's average net assets and an annualized group fee rate that averaged .26% during the period. The group fee rate is based upon the average net assets of all the mutual funds advised by FMR. The group fee rate decreases as assets under management
Annual Report
5. Fees and Other Transactions with Affiliates - continued
Management Fee - continued
increase and increases as assets under management decrease. For the period, the total annual management fee rate was .61% of the Fund's average net assets.
Transfer Agent Fees. Fidelity Investments Institutional Operations Company, Inc., (FIIOC), an affiliate of FMR, is the transfer, dividend disbursing and shareholder servicing agent for each class of the Fund. FIIOC receives account fees and asset-based fees that vary according to the account size and type of account of the shareholders of Leveraged Company Stock. FIIOC receives an asset-based fee of Class K's average net assets. FIIOC pays for typesetting, printing and mailing of shareholder reports, except proxy statements. For the period, transfer agent fees for each class were as follows:
| Amount | % of
Average
Net Assets |
Leveraged Company Stock | $ 6,680 | .18 |
Class K | 413 | .05 |
| $ 7,093 | |
Accounting and Security Lending Fees. Fidelity Service Company, Inc. (FSC), an affiliate of FMR, maintains the Fund's accounting records. The accounting fee is based on the level of average net assets for each month. Under a separate contract, FSC administers the security lending program. The security lending fee is based on the number and duration of lending transactions.
Brokerage Commissions. The Fund placed a portion of its portfolio transactions with brokerage firms which are affiliates of the investment adviser. Brokerage commissions are included in net realized gain (loss) and change in net unrealized appreciation (depreciation) in the Statement of Operations. The commissions paid to these affiliated firms were $31 for the period.
6. Committed Line of Credit.
The Fund participates with other funds managed by FMR or an affiliate in a $4.25 billion credit facility (the "line of credit") to be utilized for temporary or emergency purposes to fund shareholder redemptions or for other short-term liquidity purposes. The Fund has agreed to pay commitment fees on its pro-rata portion of the line of credit, which amounted to $10 and is reflected in Miscellaneous expenses on the Statement of Operations. During the period, there were no borrowings on this line of credit.
Annual Report
Notes to Financial Statements - continued
(Amounts in thousands except percentages)
7. Security Lending.
The Fund lends portfolio securities through a lending agent from time to time in order to earn additional income. For equity securities, a lending agent is used and may loan securities to certain qualified borrowers, including Fidelity Capital Markets (FCM), a broker-dealer affiliated with the Fund. On the settlement date of the loan, the Fund receives collateral (in the form of U.S. Treasury obligations, letters of credit and/or cash) against the loaned securities and maintains collateral in an amount not less than 100% of the market value of the loaned securities during the period of the loan. The market value of the loaned securities is determined at the close of business of the Fund and any additional required collateral is delivered to the Fund on the next business day. If the borrower defaults on its obligation to return the securities loaned because of insolvency or other reasons, the Fund may apply collateral received from the borrower against the obligation. The Fund may experience delays and costs in recovering the securities loaned. Any cash collateral received is invested in the Fidelity Securities Lending Cash Central Fund. The value of loaned securities and cash collateral at period end are disclosed on the Fund's Statement of Assets and Liabilities. Security lending income represents the income earned on investing cash collateral, less rebates paid to borrowers, plus any premium payments received for lending certain types of securities. Security lending income is presented in the Statement of Operations as a component of income from Fidelity Central Funds. Total security lending income during the period amounted to $2,121, including $51 from securities loaned to FCM.
8. Expense Reductions.
Commissions paid to certain brokers with whom FMR places trades on behalf of the Fund include an amount in addition to trade execution, which is rebated back to the Fund to offset certain expenses. This amount totaled $182 for the period.
Through arrangements with the Fund's custodian, credits realized as a result of uninvested cash balances were used to reduce the Fund's expenses. During the period, these credits reduced the Fund's custody expenses by three hundred and forty nine dollars.
In addition, FMR reimbursed a portion of the Fund's operating expenses during the period in the amount of $12.
9. Distributions to Shareholders.
Distributions to shareholders of each class were as follows:
Years ended July 31, | 2013 | 2012 |
From net investment income | | |
Leveraged Company Stock | $ 12,562 | $ 35,167 |
Class K | 3,227 | 6,039 |
Total | $ 15,789 | $ 41,206 |
Annual Report
10. Share Transactions.
Transactions for each class of shares were as follows:
| Shares | Dollars |
Years ended July 31, | 2013 | 2012 | 2013 | 2012 |
Leveraged Company Stock | | | | |
Shares sold | 26,431 | 11,853 | $ 888,852 | $ 318,644 |
Reinvestment of distributions | 378 | 1,333 | 11,889 | 33,481 |
Shares redeemed | (26,251) | (42,830) | (883,700) | (1,123,666) |
Net increase (decrease) | 558 | (29,644) | $ 17,041 | $ (771,541) |
Class K | | | | |
Shares sold | 11,840 | 9,320 | $ 395,282 | $ 250,995 |
Reinvestment of distributions | 102 | 240 | 3,227 | 6,039 |
Shares redeemed | (6,546) | (7,542) | (221,189) | (200,469) |
Net increase (decrease) | 5,396 | 2,018 | $ 177,320 | $ 56,565 |
11. Other.
The Fund's organizational documents provide former and current trustees and officers with a limited indemnification against liabilities arising in connection with the performance of their duties to the Fund. In the normal course of business, the Fund may also enter into contracts that provide general indemnifications. The Fund's maximum exposure under these arrangements is unknown as this would be dependent on future claims that may be made against the Fund. The risk of material loss from such claims is considered remote.
Annual Report
To the Trustees of Fidelity Securities Fund and the Shareholders of Fidelity Leveraged Company Stock Fund:
In our opinion, the accompanying statement of assets and liabilities, including the schedule of investments, and the related statements of operations and of changes in net assets and the financial highlights present fairly, in all material respects, the financial position of Fidelity Leveraged Company Stock Fund (a fund of Fidelity Securities Fund) at July 31, 2013, the results of its operations for the year then ended, the changes in its net assets for each of the two years in the period then ended and the financial highlights for each of the five years in the period then ended, in conformity with accounting principles generally accepted in the United States of America. These financial statements and financial highlights (hereafter referred to as "financial statements") are the responsibility of the Fidelity Leveraged Company Stock Fund's management. Our responsibility is to express an opinion on these financial statements based on our audits. We conducted our audits of these financial statements in accordance with the standards of the Public Company Accounting Oversight Board (United States). Those standards require that we plan and perform the audit to obtain reasonable assurance about whether the financial statements are free of material misstatement. An audit includes examining, on a test basis, evidence supporting the amounts and disclosures in the financial statements, assessing the accounting principles used and significant estimates made by management, and evaluating the overall financial statement presentation. We believe that our audits, which included confirmation of securities at July 31, 2013 by correspondence with the custodian, agent bank and brokers, provide a reasonable basis for our opinion.
PricewaterhouseCoopers LLP
Boston, Massachusetts
September 17, 2013
Annual Report
The Trustees, Member of the Advisory Board, and executive officers of the trust and fund, as applicable, are listed below. The Board of Trustees governs the fund and is responsible for protecting the interests of shareholders. The Trustees are experienced executives who meet periodically throughout the year to oversee the fund's activities, review contractual arrangements with companies that provide services to the fund, oversee management of the risks associated with such activities and contractual arrangements, and review the fund's performance. Except for James C. Curvey, Ned C. Lautenbach, Ronald P. O'Hanley, and William S. Stavropoulos, each of the Trustees oversees 166 Fidelity funds. Mr. Curvey oversees 387 Fidelity funds. Mr. Lautenbach, Mr. O'Hanley, and Mr. Stavropoulos each oversees 230 Fidelity funds.
The Trustees hold office without limit in time except that (a) any Trustee may resign; (b) any Trustee may be removed by written instrument, signed by at least two-thirds of the number of Trustees prior to such removal; (c) any Trustee who requests to be retired or who has become incapacitated by illness or injury may be retired by written instrument signed by a majority of the other Trustees; and (d) any Trustee may be removed at any special meeting of shareholders by a two-thirds vote of the outstanding voting securities of the trust. Each Trustee who is not an interested person of the trust and the fund (as defined in the 1940 Act) (Independent Trustee), shall retire not later than the last day of the calendar year in which his or her 75th birthday occurs. The Independent Trustees may waive this mandatory retirement age policy with respect to individual Trustees. The executive officers and Advisory Board Member hold office without limit in time, except that any officer and Advisory Board Member may resign or may be removed by a vote of a majority of the Trustees at any regular meeting or any special meeting of the Trustees. Except as indicated, each individual has held the office shown or other offices in the same company for the past five years.
Experience, Skills, Attributes, and Qualifications of the Fund's Trustees. The Governance and Nominating Committee has adopted a statement of policy that describes the experience, qualifications, attributes, and skills that are necessary and desirable for potential Independent Trustee candidates (Statement of Policy). The Board believes that each Trustee satisfied at the time he or she was initially elected or appointed a Trustee, and continues to satisfy, the standards contemplated by the Statement of Policy. The Governance and Nominating Committee also engages professional search firms to help identify potential Independent Trustee candidates who have the experience, qualifications, attributes, and skills consistent with the Statement of Policy. From time to time, additional criteria based on the composition and skills of the current Independent Trustees, as well as experience or skills that may be appropriate in light of future changes to board composition, business conditions, and regulatory or other developments, have also been considered by the professional search firms and the Governance and Nominating Committee. In addition, the Board takes into account the Trustees' commitment and participation in Board and committee meetings, as well as their leadership of standing and ad hoc committees throughout their tenure.
Annual Report
In determining that a particular Trustee was and continues to be qualified to serve as a Trustee, the Board has considered a variety of criteria, none of which, in isolation, was controlling. The Board believes that, collectively, the Trustees have balanced and diverse experience, qualifications, attributes, and skills, which allow the Board to operate effectively in governing the fund and protecting the interests of shareholders. Information about the specific experience, skills, attributes, and qualifications of each Trustee, which in each case led to the Board's conclusion that the Trustee should serve (or continue to serve) as a trustee of the fund, is provided below.
Board Structure and Oversight Function. James C. Curvey is an interested person (as defined in the 1940 Act) and currently serves as Chairman. The Trustees have determined that an interested Chairman is appropriate and benefits shareholders because an interested Chairman has a personal and professional stake in the quality and continuity of services provided to the fund. Independent Trustees exercise their informed business judgment to appoint an individual of their choosing to serve as Chairman, regardless of whether the Trustee happens to be independent or a member of management. The Independent Trustees have determined that they can act independently and effectively without having an Independent Trustee serve as Chairman and that a key structural component for assuring that they are in a position to do so is for the Independent Trustees to constitute a substantial majority for the Board. The Independent Trustees also regularly meet in executive session. Ned C. Lautenbach serves as Chairman of the Independent Trustees and as such (i) acts as a liaison between the Independent Trustees and management with respect to matters important to the Independent Trustees and (ii) with management prepares agendas for Board meetings.
Fidelity funds are overseen by different Boards of Trustees. The fund's Board oversees Fidelity's equity and high income funds and another Board oversees Fidelity's investment-grade bond, money market, and asset allocation funds. The asset allocation funds may invest in Fidelity funds overseen by the fund's Board. The use of separate Boards, each with its own committee structure, allows the Trustees of each group of Fidelity funds to focus on the unique issues of the funds they oversee, including common research, investment, and operational issues. On occasion, the separate Boards establish joint committees to address issues of overlapping consequences for the Fidelity funds overseen by each Board.
The Trustees operate using a system of committees to facilitate the timely and efficient consideration of all matters of importance to the Trustees, the fund, and fund shareholders and to facilitate compliance with legal and regulatory requirements and oversight of the fund's activities and associated risks. The Board, acting through its committees, has charged FMR and its affiliates with (i) identifying events or circumstances the occurrence of which could have demonstrably adverse effects on the fund's business and/or reputation; (ii) implementing processes and controls to lessen the possibility that such events or circumstances occur or to mitigate the effects of such events or circumstances if they do occur; and (iii) creating and maintaining a system designed to evaluate continuously business and market conditions in order to facilitate the identification and implementation processes described in (i) and (ii) above. Because the day-to-day operations and activities of the fund are carried out by or through FMR, its affiliates and other service providers, the fund's exposure to risks is mitigated but not eliminated by the processes overseen by the Trustees. While each of the Board's committees has responsibility for overseeing different aspects of the fund's activities, oversight is exercised primarily through the Operations, Audit, and Compliance Committees. In addition, the Independent Trustees have worked with FMR to enhance the Board's oversight of investment and financial risks, legal and regulatory risks, technology risks, and operational risks, including the development of additional risk reporting to the Board. For example, a working group comprised of Independent Trustees and FMR has worked and continues to work to review the Fidelity funds' valuation-related activities, reporting and risk management. Appropriate personnel, including but not limited to the fund's Chief Compliance Officer (CCO), FMR's internal auditor, the independent accountants, the fund's Treasurer and portfolio management personnel, make periodic reports to the Board's committees, as appropriate, including an annual review of FMR's risk management program for the Fidelity funds. The responsibilities of each standing committee, including their oversight responsibilities, are described further under "Standing Committees of the Fund's Trustees."
Annual Report
Trustees and Officers - continued
The fund's Statement of Additional Information (SAI) includes more information about the Trustees. To request a free copy, call Fidelity at 1-800-835-5092.
Interested Trustees*:
Correspondence intended for each Trustee who is an interested person may be sent to Fidelity Investments, 245 Summer Street, Boston, Massachusetts 02210.
Name, Year of Birth; Principal Occupations and Other Relevant Experience+ |
James C. Curvey (1935) |
| Year of Election or Appointment: 2007 Mr. Curvey is Trustee and Chairman of the Board of Trustees of certain Trusts. Mr. Curvey also serves as Trustee (2007-present) of other investment companies advised by FMR. Mr. Curvey is a Director of Fidelity Investments Money Management, Inc. (2009-present), Director of Fidelity Research & Analysis Co. (2009-present) and Director of FMR and FMR Co., Inc. (2007-present). Mr. Curvey is also Vice Chairman (2007-present) and Director of FMR LLC. In addition, Mr. Curvey serves as an Overseer for the Boston Symphony Orchestra and a member of the Trustees of Villanova University. Previously, Mr. Curvey was the Vice Chairman (2006-2007) and Director (2000-2007) of FMR Corp. |
Ronald P. O'Hanley (1957) |
| Year of Election or Appointment: 2011 Mr. O'Hanley serves as a Trustee and Chairman of the Board of Trustees of other Fidelity funds (2013-present), and is Director of FMR Co., Inc. (2010-present), Director of Fidelity Investments Money Management, Inc. (2010-present), Director of Fidelity Research & Analysis Company (2010-present), President of Fidelity Asset Management and Corporate Services and a Member of Fidelity's Executive Committee (2010- present). Previously, Mr. O'Hanley served as President and Chief Executive Officer of BNY Mellon Asset Management (2007-2010). Mr. O'Hanley also served as Vice Chairman of Bank New York Mellon Corp. and a member of that firm's Executive Committee. Prior to the 2007 merger of The Bank of New York and Mellon Financial Corporation, he was Vice Chairman of Mellon Financial Corporation and President and Chief Executive Officer of Mellon Asset Management. He joined Mellon in February 1997. Mr. O'Hanley currently serves as Chairman of the Boston Public Library Foundation Board of Directors and sits on the Board of Directors of Beth Israel Deaconess Medical Center, the Board of Trustees of the Marine Biological Laboratory and the Advisory Board of the Maxwell School of Citizenship and Public Administration at Syracuse University. Mr. O'Hanley also chairs the Council on Asset Management for the Financial Services Roundtable and is a member of the Board of Directors of Institutional Investor's U.S. Institute. |
* Trustees have been determined to be "Interested Trustees" by virtue of, among other things, their affiliation with the trust or various entities under common control with FMR.
+ The information above includes each Trustee's principal occupation during the last five years and other information relating to the experience, attributes, and skills relevant to each Trustee's qualifications to serve as a Trustee, which led to the conclusion that each Trustee should serve as a Trustee for the fund.
Annual Report
Trustees and Officers - continued
Independent Trustees:
Correspondence intended for each Independent Trustee (that is, the Trustees other than the Interested Trustees) may be sent to Fidelity Investments, P.O. Box 55235, Boston, Massachusetts 02205-5235.
Name, Year of Birth; Principal Occupations and Other Relevant Experience+ |
Dennis J. Dirks (1948) |
| Year of Election or Appointment: 2005 Prior to his retirement in May 2003, Mr. Dirks was Chief Operating Officer and a member of the Board of The Depository Trust & Clearing Corporation (DTCC). He also served as President, Chief Operating Officer, and Board member of The Depository Trust Company (DTC) and President and Board member of the National Securities Clearing Corporation (NSCC). In addition, Mr. Dirks served as Chief Executive Officer and Board member of the Government Securities Clearing Corporation, Chief Executive Officer and Board member of the Mortgage-Backed Securities Clearing Corporation, as a Trustee and a member of the Finance Committee of Manhattan College (2005-2008), and as a Trustee and a member of the Finance Committee of AHRC of Nassau County (2006-2008). Mr. Dirks is a member of the Independent Directors Council (IDC) Governing Council (2010-present) and Board of Directors for The Brookville Center for Children's Services, Inc. (2009-present). |
Alan J. Lacy (1953) |
| Year of Election or Appointment: 2008 Mr. Lacy serves as Senior Adviser (2007-present) of Oak Hill Capital Partners, L.P. (private equity). Mr. Lacy also served as Chief Executive Officer (2000-2005) and Vice Chairman (2005-2006) of Sears Holdings Corporation and Sears, Roebuck and Co. (retail). In addition, Mr. Lacy serves as a member of the Board of Directors of Dave & Buster's Entertainment, Inc. (restaurant and entertainment complexes, 2010-present), Earth Fare, Inc. (retail grocery, 2012-present), The Hillman Companies, Inc. (hardware wholesalers, 2010-present), and Bristol-Myers Squibb Company (global pharmaceuticals, 2008-present). Mr. Lacy is a member of the Board of Trustees of The National Parks Conservation Association (2006-present). Previously, Mr. Lacy served as Chairman of the Board of Trustees of the National Parks Conservation Association (2008-2011) and as a member of the Board of Directors for the Western Union Company (global money transfer, 2006-2011). |
Ned C. Lautenbach (1944) |
| Year of Election or Appointment: 2000 Mr. Lautenbach is Chairman of the Independent Trustees of the Equity and High Income Funds (2006-present) and serves as a Trustee of other Fidelity funds (2013-present). Mr. Lautenbach currently serves as the Lead Director of the Eaton Corporation Board of Directors (diversified industrial, 1997-present). Mr. Lautenbach is Chairman of the Board of Directors of the Philharmonic Center for the Arts in Naples, Florida (2012-present) and a member of the Council on Foreign Relations (1994-present). Previously, Mr. Lautenbach was a Partner/Advisory Partner at Clayton, Dubilier & Rice, LLC (private equity investment, 1998-2010), as well as a Director of Sony Corporation (2006-2007). |
Joseph Mauriello (1944) |
| Year of Election or Appointment: 2008 Prior to his retirement in January 2006, Mr. Mauriello served in numerous senior management positions including Deputy Chairman and Chief Operating Officer (2004-2005), and Vice Chairman of Financial Services (2002-2004) of KPMG LLP US (professional services, 1965-2005). Mr. Mauriello currently serves as a member of the Board of Directors of XL Group plc. (global insurance and re-insurance, 2006-present). Previously, Mr. Mauriello served as a Director of the Hamilton Funds of the Bank of New York (2006-2007) and of Arcadia Resources Inc. (health care services and products, 2007-2012). |
Robert W. Selander (1950) |
| Year of Election or Appointment: 2011 Previously, Mr. Selander served as a Member of the Advisory Board of Fidelity's Equity and High Income Funds (2011), Executive Vice Chairman (2010), Chief Executive Officer (2009-2010), and President and Chief Executive Officer (1997-2009) of Mastercard, Inc. |
Cornelia M. Small (1944) |
| Year of Election or Appointment: 2005 Ms. Small is a member of the Board of Directors (2009-present) and Chair of the Investment Committee (2010-present) of the Teagle Foundation. Ms. Small also serves on the Investment Committee of the Berkshire Taconic Community Foundation (2008-present). Previously, Ms. Small served as Chairperson (2002-2008) and a member of the Investment Committee and Chairperson (2008-2012) and a member of the Board of Trustees of Smith College. In addition, Ms. Small served as Chief Investment Officer, Director of Global Equity Investments, and a member of the Board of Directors of Scudder, Stevens & Clark and Scudder Kemper Investments. |
William S. Stavropoulos (1939) |
| Year of Election or Appointment: 2002 Mr. Stavropoulos is Vice Chairman of the Independent Trustees of the Equity and High Income Funds (2006-present) and serves as a Trustee of other Fidelity funds (2013-present). Mr. Stavropoulos serves as President and Founder of the Michigan Baseball Foundation, the Great Lakes Loons (2007-present). Mr. Stavropoulos is Chairman Emeritus of the Board of Directors of The Dow Chemical Company, where he previously served in numerous senior management positions, including President, CEO (1995-2000; 2002-2004), Chairman of the Executive Committee (2000-2006), and as a member of the Board of Directors (1990-2006). Currently, Mr. Stavropoulos is Chairman of the Board of Directors of Univar Inc. (global distributor of commodity and specialty chemicals), a Director of Teradata Corporation (data warehousing and technology solutions), and Maersk Inc. (industrial conglomerate), and a member of the Advisory Board for Metalmark Capital LLC (private equity investment, 2005-present). Mr. Stavropoulos is an operating advisor to Clayton, Dubilier & Rice, LLC (private equity investment). In addition, Mr. Stavropoulos is a member of the University of Notre Dame Advisory Council for the College of Science, a Trustee of the Rollin L. Gerstacker Foundation, and a Director of the Naples Philharmonic Center for the Arts. Previously, Mr. Stavropoulos served as a Director of Chemical Financial Corporation (bank holding company, 1993-2012) and Tyco International, Ltd. (multinational manufacturing and services, 2007-2012). |
David M. Thomas (1949) |
| Year of Election or Appointment: 2008 Previously, Mr. Thomas served as Executive Chairman (2005-2006) and Chairman and Chief Executive Officer (2000-2005) of IMS Health, Inc. (pharmaceutical and healthcare information solutions), and a Director of Fortune Brands, Inc. (consumer products, 2000-2011). In addition, Mr. Thomas serves as Non-Executive Chairman of the Board of Directors of Fortune Brands Home and Security (home and security products, 2011-present), and as a member of the Board of Directors of Interpublic Group of Companies, Inc. (marketing communication, 2004-present). |
+ The information above includes each Trustee's principal occupation during the last five years and other information relating to the experience, attributes, and skills relevant to each Trustee's qualifications to serve as a Trustee, which led to the conclusion that each Trustee should serve as a Trustee for the fund.
Annual Report
Advisory Board Member and Executive Officers:
Correspondence intended for each executive officer and Peter S. Lynch may be sent to Fidelity Investments, 245 Summer Street, Boston, Massachusetts 02210.
Name, Year of Birth; Principal Occupation |
Peter S. Lynch (1944) |
| Year of Election or Appointment: 2003 Member of the Advisory Board of Fidelity's Equity and High Income Funds. Mr. Lynch is Vice Chairman and a Director of FMR and FMR Co., Inc. In addition, Mr. Lynch serves as a Trustee of Boston College and as the Chairman of the Inner-City Scholarship Fund. Previously, Mr. Lynch served on the Special Olympics International Board of Directors (1997-2006). |
Kenneth B. Robins (1969) |
| Year of Election or Appointment: 2008 President and Treasurer of Fidelity's Equity and High Income Funds. Mr. Robins also serves as President and Treasurer (2008-present) and Assistant Treasurer (2009-present) of other Fidelity funds and is an employee of Fidelity Investments (2004-present). Mr. Robins serves as Executive Vice President of Fidelity Investments Money Management, Inc. (FIMM) (2013-present). Previously, Mr. Robins served as Deputy Treasurer of the Fidelity funds (2005-2008) and Treasurer and Chief Financial Officer of The North Carolina Capital Management Trust: Cash and Term Portfolios (2006-2008). |
Bruce T. Herring (1965) |
| Year of Election or Appointment: 2006 Vice President of certain Equity Funds. Mr. Herring also serves as Vice President of other Fidelity funds (2013-present), Chief Investment Officer of Fidelity Global Asset Allocation (GAA) (2013-present), Chief Investment Officer and Director of Fidelity Management & Research (U.K.) Inc. (2010-present), Group Chief Investment Officer of FMR, and President of Fidelity Research & Analysis Company (2010-present). Previously, Mr. Herring served as Vice President (2005-2006) and Senior Vice President (2006-2007) of Fidelity Management & Research Company, Vice President of FMR Co., Inc. (2001-2007) and as a portfolio manager for Fidelity U.S. Equity Funds. |
Brian B. Hogan (1964) |
| Year of Election or Appointment: 2009 Vice President of Equity and High Income Funds. Mr. Hogan also serves as Vice President of other Fidelity funds (2009-present) and President of FMR's Equity Division (2009-present). Previously, Mr. Hogan served as Senior Vice President, Equity Research of FMR (2006-2009) and as a portfolio manager. |
Scott C. Goebel (1968) |
| Year of Election or Appointment: 2008 Secretary and Chief Legal Officer (CLO) of the Fidelity funds. Mr. Goebel also serves as Secretary of Fidelity Investments Money Management, Inc. (FIMM) (2010-present) and Fidelity Research and Analysis Company (FRAC) (2010-present); Secretary and CLO of The North Carolina Capital Management Trust: Cash and Term Portfolios (2008-present); General Counsel, Secretary, and Senior Vice President of FMR (2008-present) and FMR Co., Inc. (2008-present); employed by FMR LLC or an affiliate (2001-present); Chief Legal Officer of Fidelity Management & Research (Hong Kong) Limited (2008-present) and Assistant Secretary of Fidelity Management & Research (Japan) Inc. (2008-present), and Fidelity Management & Research (U.K.) Inc. (2008-present). Previously, Mr. Goebel served as Assistant Secretary of FIMM (2008-2010), FRAC (2008-2010), and the Funds (2007-2008) and as Vice President and Secretary of Fidelity Distributors Corporation (FDC) (2005-2007). |
William C. Coffey (1969) |
| Year of Election or Appointment: 2009 Assistant Secretary of Fidelity's Equity and High Income Funds. Mr. Coffey also serves as Assistant Secretary of other Fidelity funds (2009-present), Senior Vice President and Deputy General Counsel of FMR LLC (2010-present), and is an employee of Fidelity Investments. Previously, Mr. Coffey served as Vice President and Associate General Counsel of FMR LLC (2005-2009). |
Elizabeth Paige Baumann (1968) |
| Year of Election or Appointment: 2012 Anti-Money Laundering (AML) Officer of the Fidelity funds. Ms. Baumann also serves as AML Officer of The North Carolina Capital Management Trust: Cash and Term Portfolios (2012-present), Chief AML Officer of FMR LLC (2012-present), and is an employee of Fidelity Investments. Previously, Ms. Baumann served as Vice President and Deputy Anti-Money Laundering Officer (2007-2012). |
Christine Reynolds (1958) |
| Year of Election or Appointment: 2008 Chief Financial Officer of the Fidelity funds. Ms. Reynolds became President of Fidelity Pricing and Cash Management Services (FPCMS) in August 2008. Ms. Reynolds served as Chief Operating Officer of FPCMS (2007-2008). Previously, Ms. Reynolds served as President, Treasurer, and Anti-Money Laundering officer of the Fidelity funds (2004-2007). |
Joseph A. Hanlon (1968) |
| Year of Election or Appointment: 2012 Chief Compliance Officer of Fidelity's Equity and High Income Funds. Mr. Hanlon also serves as Chief Compliance Officer of other Fidelity funds (2012-present). Mr. Hanlon serves as Compliance Officer of FMR, FMR Co., Inc., Fidelity Investments Money Management, Inc. (FIMM), Fidelity Research and Analysis Company (FRAC), and Fidelity Management & Research (Hong Kong) (2009-present), as Senior Vice President of the Fidelity Asset Management Division (2009-present), and is an employee of Fidelity Investments. Previously, Mr. Hanlon served as Compliance Officer of Fidelity Management & Research (Japan) Inc. (2009-2013), Strategic Advisers, Inc. (2009-2013), and Fidelity Management & Research (U.K.) Inc. (2009-2013). |
Joseph F. Zambello (1957) |
| Year of Election or Appointment: 2011 Deputy Treasurer of the Fidelity funds. Mr. Zambello is an employee of Fidelity Investments. Previously, Mr. Zambello served as Vice President of FMR's Program Management Group (2009-2011) and Vice President of the Transfer Agent Oversight Group (2005-2009). |
Adrien E. Deberghes (1967) |
| Year of Election or Appointment: 2008 Deputy Treasurer of Fidelity's Equity and High Income Funds. Mr. Deberghes also serves as Vice President (2011-present), Deputy Treasurer (2008-present), and Assistant Treasurer (2010-present) of other Fidelity funds, and is an employee of Fidelity Investments (2008-present). Previously, Mr. Deberghes served as Senior Vice President of Mutual Fund Administration at State Street Corporation (2007-2008), Senior Director of Mutual Fund Administration at Investors Bank & Trust (2005-2007), and Director of Finance for Dunkin' Brands (2000-2005). |
Stephen Sadoski (1971) |
| Year of Election or Appointment: 2012 Deputy Treasurer of Fidelity's Equity and High Income Funds. Mr. Sadoski also serves as Deputy Treasurer of other Fidelity funds (2012-present) and is an employee of Fidelity Investments (2012-present). Previously, Mr. Sadoski served as Assistant Treasurer of Fidelity's Fixed Income and Asset Allocation Funds (2012-2013), an assistant chief accountant in the Division of Investment Management of the Securities and Exchange Commission (SEC) (2009-2012) and as a senior manager at Deloitte & Touche LLP (1997-2009). |
Stacie M. Smith (1974) |
| Year of Election or Appointment: 2013 Deputy Treasurer of Fidelity's Equity and High Income Funds. Ms. Smith also serves as Deputy Treasurer of other Fidelity funds (2013-present) and is an employee of Fidelity Investments (2009-present). Previously, Ms. Smith served as Senior Audit Manager of Ernst & Young LLP (1996-2009). |
Stephanie J. Dorsey (1969) |
| Year of Election or Appointment: 2010 Assistant Treasurer of Fidelity's Equity and High Income Funds. Ms. Dorsey also serves as President and Treasurer (2013-present) and Assistant Treasurer (2010-present) of other Fidelity funds, Treasurer and Chief Financial Officer of The North Carolina Capital Management Trust: Cash and Term Portfolios (2013-present), and is an employee of Fidelity Investments (2008-present). Previously, Ms. Dorsey served as Deputy Treasurer of Fidelity's Fixed Income and Asset Allocation Funds (2008-2013), Treasurer (2004-2008) of the JPMorgan Mutual Funds and Vice President (2004-2008) of JPMorgan Chase Bank. |
Gary W. Ryan (1958) |
| Year of Election or Appointment: 2005 Assistant Treasurer of the Fidelity funds. Mr. Ryan is an employee of Fidelity Investments. Previously, Mr. Ryan served as Vice President of Fund Reporting in Fidelity Pricing and Cash Management Services (FPCMS) (1999-2005). |
Jonathan Davis (1968) |
| Year of Election or Appointment: 2010 Assistant Treasurer of the Fidelity funds. Mr. Davis is also Assistant Treasurer of Fidelity Rutland Square Trust II and Fidelity Commonwealth Trust II. Mr. Davis is an employee of Fidelity Investments. Previously, Mr. Davis served as Vice President and Associate General Counsel of FMR LLC (2003-2010). |
Annual Report
Class K designates 100% of the dividends distributed during the fiscal year as qualifying for the dividends-received deduction for corporate shareholders.
Class K designates 100% of the dividends distributed during the fiscal year as amounts which may be taken into account as a dividend for the purposes of the maximum rate under section 1(h)(11) of the Internal Revenue Code.
The fund will notify shareholders in January 2014 of amounts for use in preparing 2013 income tax returns.
Annual Report
Board Approval of Investment Advisory Contracts and Management Fees
Fidelity Leveraged Company Stock Fund
Each year, the Board of Trustees, including the Independent Trustees (together, the Board), votes on the renewal of the management contract and sub-advisory agreements (together, the Advisory Contracts) for the fund. The Board, assisted by the advice of fund counsel and Independent Trustees' counsel, requests and considers a broad range of information relevant to the renewal of the Advisory Contracts throughout the year.
The Board meets regularly and, at each of its meetings, covers an extensive agenda of topics and materials and considers factors that are relevant to its annual consideration of the renewal of the fund's Advisory Contracts, including the services and support provided to the fund and its shareholders. The Board has established various standing committees, each composed of and chaired by Independent Trustees with varying backgrounds, to which the Board has assigned specific subject matter responsibilities in order to enhance effective decision-making by the Board. The Board, acting directly and through its Committees, requests and receives information concerning the annual consideration of the renewal of the fund's Advisory Contracts. The Board also meets as needed to consider matters specifically related to the Board's annual consideration of the renewal of Advisory Contracts. Members of the Board may also meet with trustees of other Fidelity funds through ad hoc joint committees to discuss certain matters relevant to the Fidelity funds.
At its July 2013 meeting, the Board, including the Independent Trustees, unanimously determined to renew the fund's Advisory Contracts. In reaching its determination, the Board considered all factors it believed relevant, including (i) the nature, extent, and quality of the services to be provided to the fund and its shareholders (including the investment performance of the fund); (ii) the competitiveness of the fund's management fee and total expense ratio relative to peer funds; (iii) the total costs of the services to be provided by and the profits to be realized by Fidelity from its relationship with the fund; (iv) the extent to which economies of scale exist and would be realized as the fund grows; and (v) whether fee levels reflect these economies of scale, if any, for the benefit of fund shareholders.
In considering whether to renew the Advisory Contracts for the fund, the Board reached a determination, with the assistance of fund counsel and Independent Trustees' counsel and through the exercise of its business judgment, that the renewal of the Advisory Contracts was in the best interests of the fund and its shareholders and that the compensation payable under the Advisory Contracts was fair and reasonable. The Board's decision to renew the Advisory Contracts was not based on any single factor, but rather was based on a comprehensive consideration of all the information provided to the Board at its meetings throughout the year. The Board, in reaching its determination to renew the Advisory Contracts, was aware that shareholders in the fund have a broad range of investment choices available to them, including a wide choice among mutual funds offered by Fidelity's competitors, and that the fund's shareholders, who have the opportunity to review and weigh the disclosure provided by the fund in its prospectus and other public disclosures, have chosen to invest in this fund, which is a part of the Fidelity family of funds.
Annual Report
Nature, Extent, and Quality of Services Provided. The Board considered the staffing within the investment adviser, Fidelity Management & Research Company (FMR), and the sub-advisers (together, the Investment Advisers) as it relates to the fund, including the backgrounds of the fund's investment personnel, and also considered the fund's investment objective, strategies, and related investment philosophy. The Independent Trustees also had discussions with senior management of Fidelity's investment operations and investment groups. The Board considered the structure of the portfolio manager compensation program and whether this structure provides appropriate incentives to act in the best interests of the fund.
Resources Dedicated to Investment Management and Support Services. The Board and the Fund Oversight and Research Committees reviewed the general qualifications and capabilities of the Investment Advisers' investment staff, including its size, education, experience, and resources, as well as the Investment Advisers' approach to recruiting, training, managing, and compensating investment personnel. The Board noted that FMR has continued to increase the resources devoted to non-U.S. offices, including expansion of Fidelity's global investment organization. The Board also noted that Fidelity's analysts have extensive resources, tools and capabilities that allow them to conduct sophisticated quantitative and fundamental analysis, as well as credit analysis of issuers, counterparties and guarantors. Further, the Board believes that Fidelity's investment professionals have sufficient access to global information and data so as to provide competitive investment results over time, and that those professionals also have access to sophisticated tools that permit them to assess portfolio construction and risk and performance attribution characteristics continuously, as well as to transmit new information and research conclusions rapidly around the world. Additionally, in its deliberations, the Board considered the Investment Advisers' trading and risk management capabilities and resources, which are an integral part of the investment management process.
Shareholder and Administrative Services. The Board considered (i) the nature, extent, quality, and cost of advisory, administrative, and shareholder services performed by the Investment Advisers and their affiliates under the Advisory Contracts and under separate agreements covering transfer agency, pricing and bookkeeping, and securities lending services for the fund; (ii) the nature and extent of the supervision of third party service providers, principally custodians and subcustodians; and (iii) the resources devoted to, and the record of compliance with, the fund's compliance policies and procedures. The Board also reviewed the allocation of fund brokerage, including allocations to brokers affiliated with the Investment Advisers, the use of brokerage commissions to pay fund expenses, and the use of "soft" commission dollars to pay for research services.
Annual Report
Board Approval of Investment Advisory Contracts and
Management Fees - continued
The Board noted that the growth of fund assets over time across the complex allows Fidelity to reinvest in the development of services designed to enhance the value or convenience of the Fidelity funds as investment vehicles. These services include 24-hour access to account information and market information through telephone representatives and over the Internet, investor education materials and asset allocation tools, and the expanded availability of Fidelity Investor Centers.
Investment in a Large Fund Family. The Board considered the benefits to shareholders of investing in a Fidelity fund, including the benefits of investing in a fund that is part of a large family of funds offering a variety of investment disciplines and providing a large variety of mutual fund investor services. The Board noted that Fidelity had taken, or had made recommendations that resulted in the Fidelity funds taking, a number of actions over the previous year that benefited particular funds, including (i) continuing to dedicate additional resources to investment research and to the support of the senior management team that oversees asset management; (ii) persisting in efforts to enhance Fidelity's global research capabilities; (iii) launching new funds and making other enhancements to meet client needs for global and income-oriented solutions; (iv) continuing to launch dedicated lower cost underlying funds to meet portfolio construction needs related to expanding underlying fund options for Fidelity funds of funds, specifically for the Freedom Fund product lines; (v) rationalizing product lines and gaining increased efficiencies through the mergers of several funds into other funds; (vi) strengthening Fidelity's index fund offerings by reducing investment minimums and adopting or lowering existing expense caps for certain funds and classes; (vii) enhancing Global Asset Allocation product offerings by launching new funds and strategies, including "open architecture" target date funds that utilize affiliated and unaffiliated sub-advisers; (viii) modifying the eligibility criteria for Institutional Class shares of Advisor funds to increase their marketability to a portion of the defined contribution plan market; (ix) creating a new low-cost retirement share class for certain Advisor funds to appeal to large retirement plans; (x) transitioning the management of certain Fidelity commodity funds to Geode Capital Management LLC, a registered commodity pool operator, while retaining administrative responsibilities for the funds; (xi) reorganizing a number of funds; and (xii) taking steps toward establishing a new Fidelity adviser to manage sector-based funds and products.
Investment Performance. The Board considered whether the fund has operated in accordance with its investment objective, as well as its record of compliance with its investment restrictions and its performance history.
The Board took into account discussions with the Investment Advisers about fund investment performance that occur at Board meetings throughout the year. In this regard the Board noted that as part of regularly scheduled fund reviews and other reports to the Board on fund performance, the Board periodically considers annualized return information for the fund, for different time periods, measured against a securities market index ("benchmark index") and a peer group of mutual funds with similar objectives ("peer group"). In its evaluation of fund investment performance, the Board gave particular attention to information indicating changes in performance of certain Fidelity funds for specific time periods and the Investment Advisers' explanations for any overperformance or underperformance.
Annual Report
In addition to reviewing absolute and relative fund performance, the Independent Trustees periodically consider the appropriateness of fund performance metrics in evaluating the results achieved. In general, the Independent Trustees believe that fund performance should be evaluated based on net performance (after fees and expenses) of both the highest performing and lowest performing classes, where applicable, compared to appropriate benchmark indices, over appropriate time periods which may include full market cycles, and compared to peer groups, as applicable, over the same periods, taking into account relevant factors including the following: general market conditions; issuer-specific information; tactical opportunities for investment; and fund cash flows and other factors.
The Independent Trustees recognize that shareholders evaluate performance on a net basis over their own holding periods, for which one-, three-, and five-year periods are used as a proxy. For this reason, the performance information reviewed by the Board also included net cumulative calendar year total return information for the fund and an appropriate benchmark index and peer group for the most recent one-, three-, and five-year periods, as shown below. Returns are shown compared to the 25th percentile (top of box) and 75th percentile (bottom of box) of the peer universe.
Annual Report
Board Approval of Investment Advisory Contracts and
Management Fees - continued
Fidelity Leveraged Company Stock Fund

Based on its review, the Board concluded that the nature, extent, and quality of services provided to the fund under the Advisory Contracts should benefit the fund's shareholders.
Competitiveness of Management Fee and Total Expense Ratio. The Board considered the fund's management fee and total expense ratio compared to "mapped groups" of competitive funds and classes. Fidelity creates "mapped groups" by combining similar Lipper investment objective categories that have comparable management fee characteristics. Combining Lipper investment objective categories aids the Board's management fee and total expense ratio comparisons by broadening the competitive group used for comparison and by reducing the number of universes to which various Fidelity funds are compared.
Management Fee. The Board considered two proprietary management fee comparisons for the 12-month periods shown in the chart below. The group of Lipper funds used by the Board for management fee comparisons is referred to below as the "Total Mapped Group." The Total Mapped Group comparison focuses on a fund's standing in terms of gross management fees before expense reimbursements or caps relative to the total universe of funds with comparable investment mandates, regardless of whether their management fee structures also are comparable. Funds with comparable investment mandates offer exposure to similar types of securities. Funds with comparable management fee structures have similar management fee contractual arrangements (e.g., flat rate charged for advisory services, all-inclusive fee rate, etc.). "TMG %" represents the percentage of funds in the Total Mapped Group that had management fees that were lower than the fund's. For example, a TMG % of 18% means that 82% of the funds in the Total Mapped Group had higher management fees than the fund. The "Asset-Size Peer Group" (ASPG) comparison focuses on a fund's standing relative to a subset of non-Fidelity funds within the Total Mapped Group that are similar in size and management fee structure. The ASPG represents at least 15% of the funds in the Total Mapped Group with comparable asset size and management fee structures, subject to a minimum of 50 funds (or all funds in the Total Mapped Group if fewer than 50). Additional information, such as the ASPG quartile in which the fund's management fee ranked, is also included in the chart and considered by the Board.
Annual Report
Fidelity Leveraged Company Stock Fund
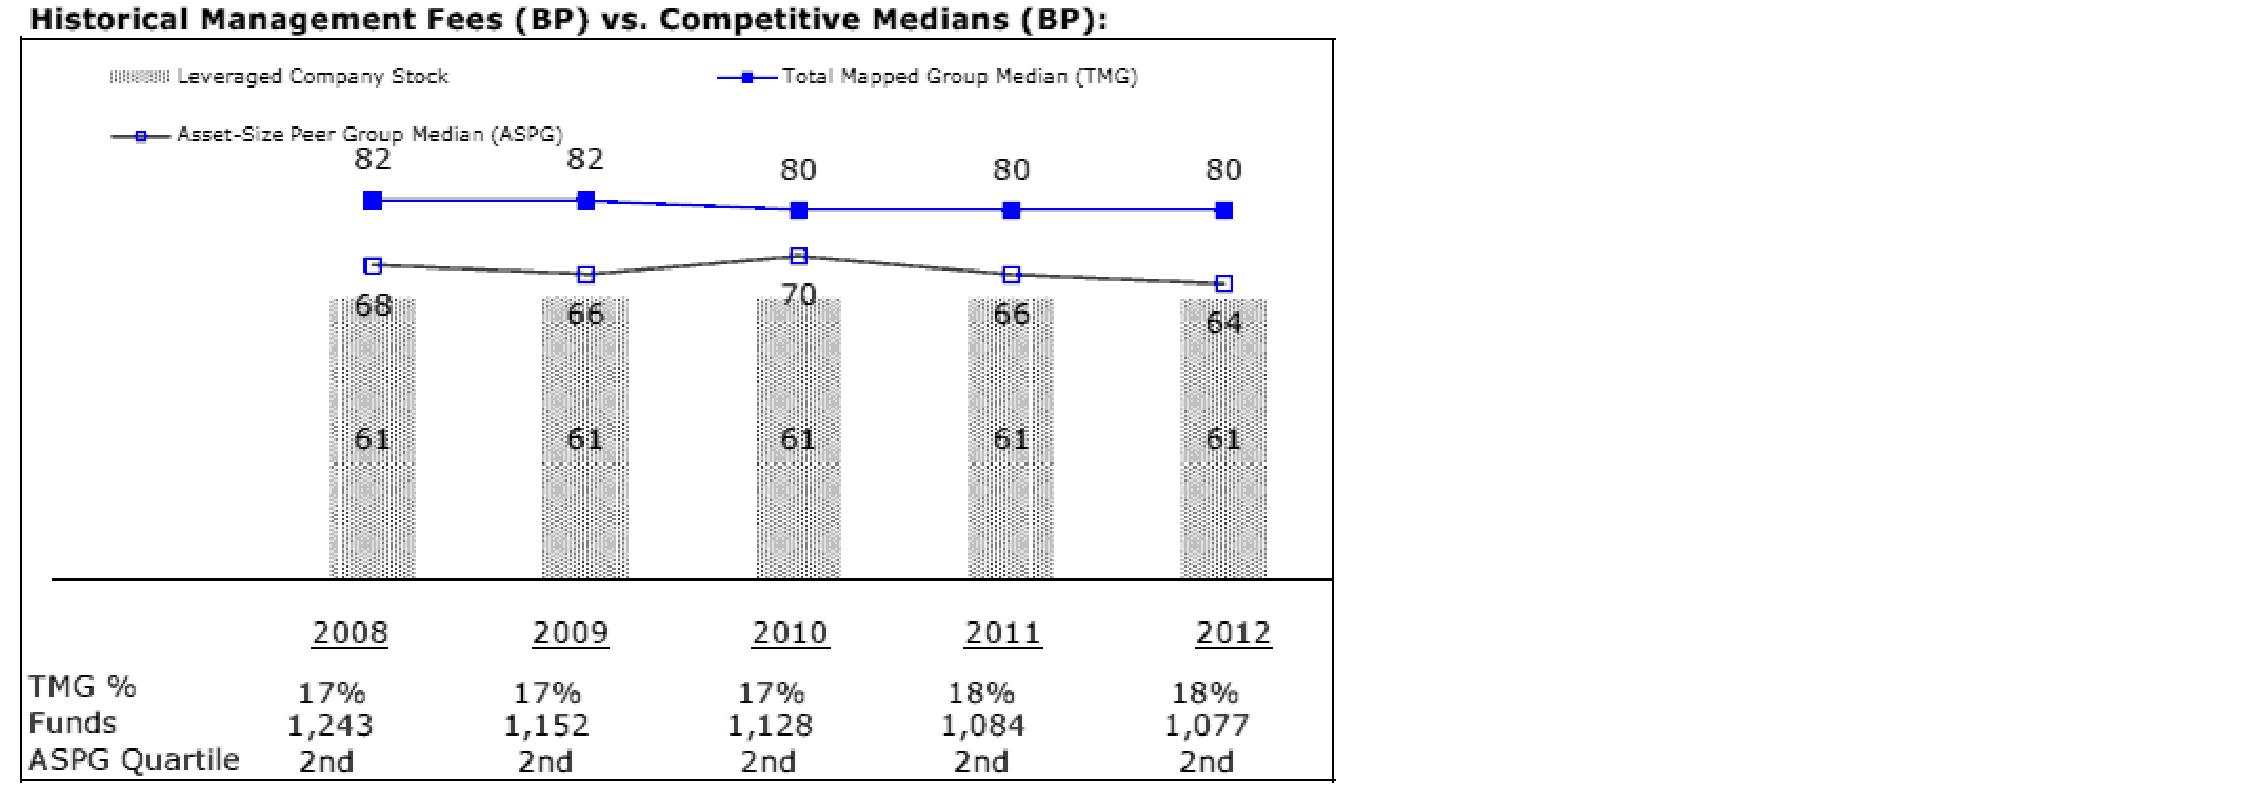
The Board noted that the fund's management fee ranked below the median of its Total Mapped Group and below the median of its ASPG for 2012.
Based on its review, the Board concluded that the fund's management fee is fair and reasonable in light of the services that the fund receives and the other factors considered.
Total Expense Ratio. In its review of each class's total expense ratio, the Board considered the fund's management fee as well as other fund or class expenses, as applicable, such as transfer agent fees, pricing and bookkeeping fees, and custodial, legal, and audit fees. The Board also noted the effects of any waivers and reimbursements on fees and expenses. As part of its review, the Board also considered the current and historical total expense ratios of each class of the fund compared to competitive fund median expenses. Each class of the fund is compared to those funds and classes in the Total Mapped Group (used by the Board for management fee comparisons) that have a similar sales load structure.
Annual Report
Board Approval of Investment Advisory Contracts and
Management Fees - continued
The Board noted that the total expense ratio of each class ranked below its competitive median for 2012.
Fees Charged to Other Fidelity Clients. The Board also considered Fidelity fee structures and other information with respect to clients of FMR and its affiliates, such as other mutual funds advised or subadvised by FMR or its affiliates, pension plan clients, and other institutional clients. The Board noted the findings of the 2013 ad hoc joint committee (created with the board of other Fidelity funds), which reviewed and compared Fidelity's institutional investment advisory business with its business of providing services to the Fidelity funds, including the differences in services provided, fees charged, and costs incurred, as well as competition in their respective marketplaces.
Based on its review of total expense ratios and fees charged to other Fidelity clients, the Board concluded that the total expense ratio of each class of the fund was reasonable in light of the services that the fund and its shareholders receive and the other factors considered.
Costs of the Services and Profitability. The Board considered the revenues earned and the expenses incurred by Fidelity in conducting the business of developing, marketing, distributing, managing, administering and servicing the fund and servicing the fund's shareholders. The Board also considered the level of Fidelity's profits in respect of all the Fidelity funds.
On an annual basis, FMR presents to the Board Fidelity's profitability for the fund. Fidelity calculates the profitability for each fund, as well as aggregate profitability for groups of Fidelity funds and all Fidelity funds, using a series of detailed revenue and cost allocation methodologies which originate with the books and records of Fidelity on which Fidelity's audited financial statements are based. The Audit Committee of the Board reviews any significant changes from the prior year's methodologies.
PricewaterhouseCoopers LLP (PwC), independent registered public accounting firm and auditor to Fidelity and certain Fidelity funds, has been engaged annually by the Board as part of the Board's assessment of Fidelity's profitability analysis. PwC's engagement includes the review and assessment of the methodologies used by Fidelity in determining the revenues and expenses attributable to Fidelity's mutual fund business, and completion of agreed-upon procedures surrounding the mathematical accuracy of fund profitability and its conformity to allocation methodologies. After considering PwC's reports issued under the engagement and information provided by Fidelity, the Board concluded that while other allocation methods may also be reasonable, Fidelity's profitability methodologies are reasonable in all material respects.
Annual Report
The Board also reviewed Fidelity's non-fund businesses and fall-out benefits related to the mutual fund business as well as cases where Fidelity's affiliates may benefit from or be related to the fund's business.
The Board considered the costs of the services provided by and the profits realized by Fidelity in connection with the operation of the fund and was satisfied that the profitability was not excessive in the circumstances.
Economies of Scale. The Board considered whether there have been economies of scale in respect of the management of the Fidelity funds, whether the Fidelity funds (including the fund) have appropriately benefited from any such economies of scale, and whether there is potential for realization of any further economies of scale. The Board considered the extent to which the fund will benefit from economies of scale through increased services to the fund, through waivers or reimbursements, or through fee or expense reductions. The Board also noted that in 2009, it and the board of other Fidelity funds created an ad hoc committee (the Economies of Scale Committee) to analyze whether FMR attains economies of scale in respect of the management and servicing of the Fidelity funds, whether the Fidelity funds have appropriately benefited from such economies of scale, and whether there is potential for realization of any further economies of scale.
The Board recognized that the fund's management contract incorporates a "group fee" structure, which provides for lower group fee rates as total fund assets under FMR's management increase, and for higher group fee rates as total fund assets under FMR's management decrease. FMR calculates the group fee rates based on a tiered asset "breakpoint" schedule that varies based on asset class. The Board considered that the group fee is designed to deliver the benefits of economies of scale to fund shareholders when total Fidelity fund assets increase, even if assets of any particular fund are unchanged or have declined, because some portion of Fidelity's costs are attributable to services provided to all Fidelity funds, and all funds benefit if those costs can be allocated among more assets. The Board concluded that, given the group fee structure, fund shareholders will benefit from lower management fees as assets under FMR's management increase at the fund complex level, regardless of whether Fidelity achieves any such economies of scale.
The Board concluded, taking into account the analysis of the Economies of Scale Committee, that economies of scale, if any, are being appropriately shared between fund shareholders and Fidelity.
Amendment to Description of Group Fee Rate. At its July 2013 meeting, the Board voted to approve an amendment to the fund's management contract to modify the description of the "group fee rate" effective August 1, 2013. The Board noted that under the prior description in the contract, the group fee rate was based on the average net assets of all registered investment companies with which FMR has management contracts. Under the contract's tiered asset breakpoint schedule, the group fee rate is lower as total fund assets under FMR's management increase, and higher as total fund assets under FMR's management decrease. The Board considered that the prior description would have excluded the assets of 64 Fidelity sector funds from the group fee rate calculation once Fidelity SelectCo, LLC, an affiliate of FMR, assumed management responsibilities for those funds. The Board noted that modifying the description of the group fee rate to continue to include the assets of those 64 funds for purposes of determining group fee rate breakpoints would avoid an immediate adverse impact on the group fee rate for any fund.
Annual Report
Board Approval of Investment Advisory Contracts and
Management Fees - continued
Additional Information Requested by the Board. In order to develop fully the factual basis for consideration of the Fidelity funds' Advisory Contracts, the Board requested and received additional information on certain topics, including: (i) fund performance trends and Fidelity's long-term strategies for certain funds; (ii) the potential to further rationalize the Fidelity fund lineup with the possibility of achieving savings for the funds and Fidelity; (iii) the methodology with respect to competitive fund data and peer group classifications; (iv) the arrangements with, and performance of, certain sub-advisers on behalf of the Fidelity funds, as well as certain proposed participating affiliate arrangements; (v) the realization of fall-out benefits in certain Fidelity business units; (vi) Fidelity's group fee structures, including the rationale for the individual fee rates of certain categories of funds and the definition of group assets; (vii) trends regarding industry use of performance fee structures and the performance adjustment methodologies applicable to the Fidelity funds; (viii) additional competitive analysis regarding the total expenses for certain classes; and (ix) fund profitability methodology, including Fidelity's cost allocation methodology, and the impact of certain factors on fund profitability results.
Based on its evaluation of all of the conclusions noted above, and after considering all factors it believed relevant, the Board ultimately concluded that the advisory fee structures are fair and reasonable, and that the fund's Advisory Contracts should be renewed.
Annual Report
Investment Adviser
Fidelity Management & Research Company
Boston, MA
Investment Sub-Adviser
FMR Co., Inc.
Fidelity Management & Research
(U.K.) Inc.
Fidelity Management & Research
(Hong Kong) Limited
Fidelity Management & Research
(Japan) Inc.
General Distributor
Fidelity Distributors Corporation
Smithfield, RI
Transfer and Service Agents
Fidelity Investments Institutional
Operations Company, Inc.
Boston, MA
Fidelity Service Company, Inc.
Boston, MA
Custodian
JPMorgan Chase Bank
New York, NY
(Fidelity Investment logo)(registered trademark)
Corporate Headquarters
245 Summer St., Boston, MA 02210
www.fidelity.com
LSF-K-UANN-0913
1.863381.104
Fidelity®
OTC
Portfolio
Annual Report
July 31, 2013
(Fidelity Cover Art)
Contents
Performance | (Click Here) | How the fund has done over time. |
Management's Discussion of Fund Performance | (Click Here) | The Portfolio Manager's review of fund performance and strategy. |
Shareholder Expense Example | (Click Here) | An example of shareholder expenses. |
Investment Changes | (Click Here) | A summary of major shifts in the fund's investments over the past six months. |
Investments | (Click Here) | A complete list of the fund's investments with their market values. |
Financial Statements | (Click Here) | Statements of assets and liabilities, operations, and changes in net assets, as well as financial highlights. |
Notes | (Click Here) | Notes to the financial statements. |
Report of Independent Registered Public Accounting Firm | (Click Here) | |
Trustees and Officers | (Click Here) | |
Distributions | (Click Here) | |
Board Approval of Investment Advisory Contracts and Management Fees | (Click Here) | |
To view a fund's proxy voting guidelines and proxy voting record for the 12-month period ended June 30, visit http://www.fidelity.com/proxyvotingresults or visit the Securities and Exchange Commission's (SEC) web site at http://www.sec.gov. You may also call 1-800-544-8544 to request a free copy of the proxy voting guidelines.
Standard & Poor's, S&P and S&P 500 are registered service marks of The McGraw-Hill Companies, Inc. and have been licensed for use by Fidelity Distributors Corporation.
Other third-party marks appearing herein are the property of their respective owners.
All other marks appearing herein are registered or unregistered trademarks or service marks of FMR LLC or an affiliated company. © 2013 FMR LLC. All rights reserved.
Annual Report
This report and the financial statements contained herein are submitted for the general information of the shareholders of the fund. This report is not authorized for distribution to prospective investors in the fund unless preceded or accompanied by an effective prospectus.
A fund files its complete schedule of portfolio holdings with the SEC for the first and third quarters of each fiscal year on Form N-Q. Forms N-Q are available on the SEC's web site at http://www.sec.gov. A fund's Forms N-Q may be reviewed and copied at the SEC's Public Reference Room in Washington, DC. Information regarding the operation of the SEC's Public Reference Room may be obtained by calling 1-800-SEC-0330. For a complete list of a fund's portfolio holdings, view the most recent holdings listing, semiannual report, or annual report on Fidelity's web site at http://www.fidelity.com, http://www.advisor.fidelity.com, or http://www.401k.com, as applicable.
NOT FDIC INSURED • MAY LOSE VALUE • NO BANK GUARANTEE
Neither the fund nor Fidelity Distributors Corporation is a bank.
Annual Report
Average annual total return reflects the change in the value of an investment, assuming reinvestment of the class' distributions from dividend income and capital gains (the profits earned upon the sale of securities that have grown in value, if any) and assuming a constant rate of performance each year. The $10,000 table and the fund's returns do not reflect the deduction of taxes that a shareholder would pay on fund distributions or the redemption of fund shares. During periods of reimbursement by Fidelity, a fund's total return will be greater than it would be had the reimbursement not occurred. How a fund did yesterday is no guarantee of how it will do tomorrow.
Average Annual Total Returns
Periods ended July 31, 2013 | Past 1
year | Past 5
years | Past 10
years |
Fidelity® OTC Portfolio | 37.93% | 12.18% | 10.98% |
$10,000 Over 10 Years
Let's say hypothetically that $10,000 was invested in Fidelity® OTC Portfolio, a class of the fund, on July 31, 2003. The chart shows how the value of your investment would have changed, and also shows how the Nasdaq Composite Index® performed over the same period.
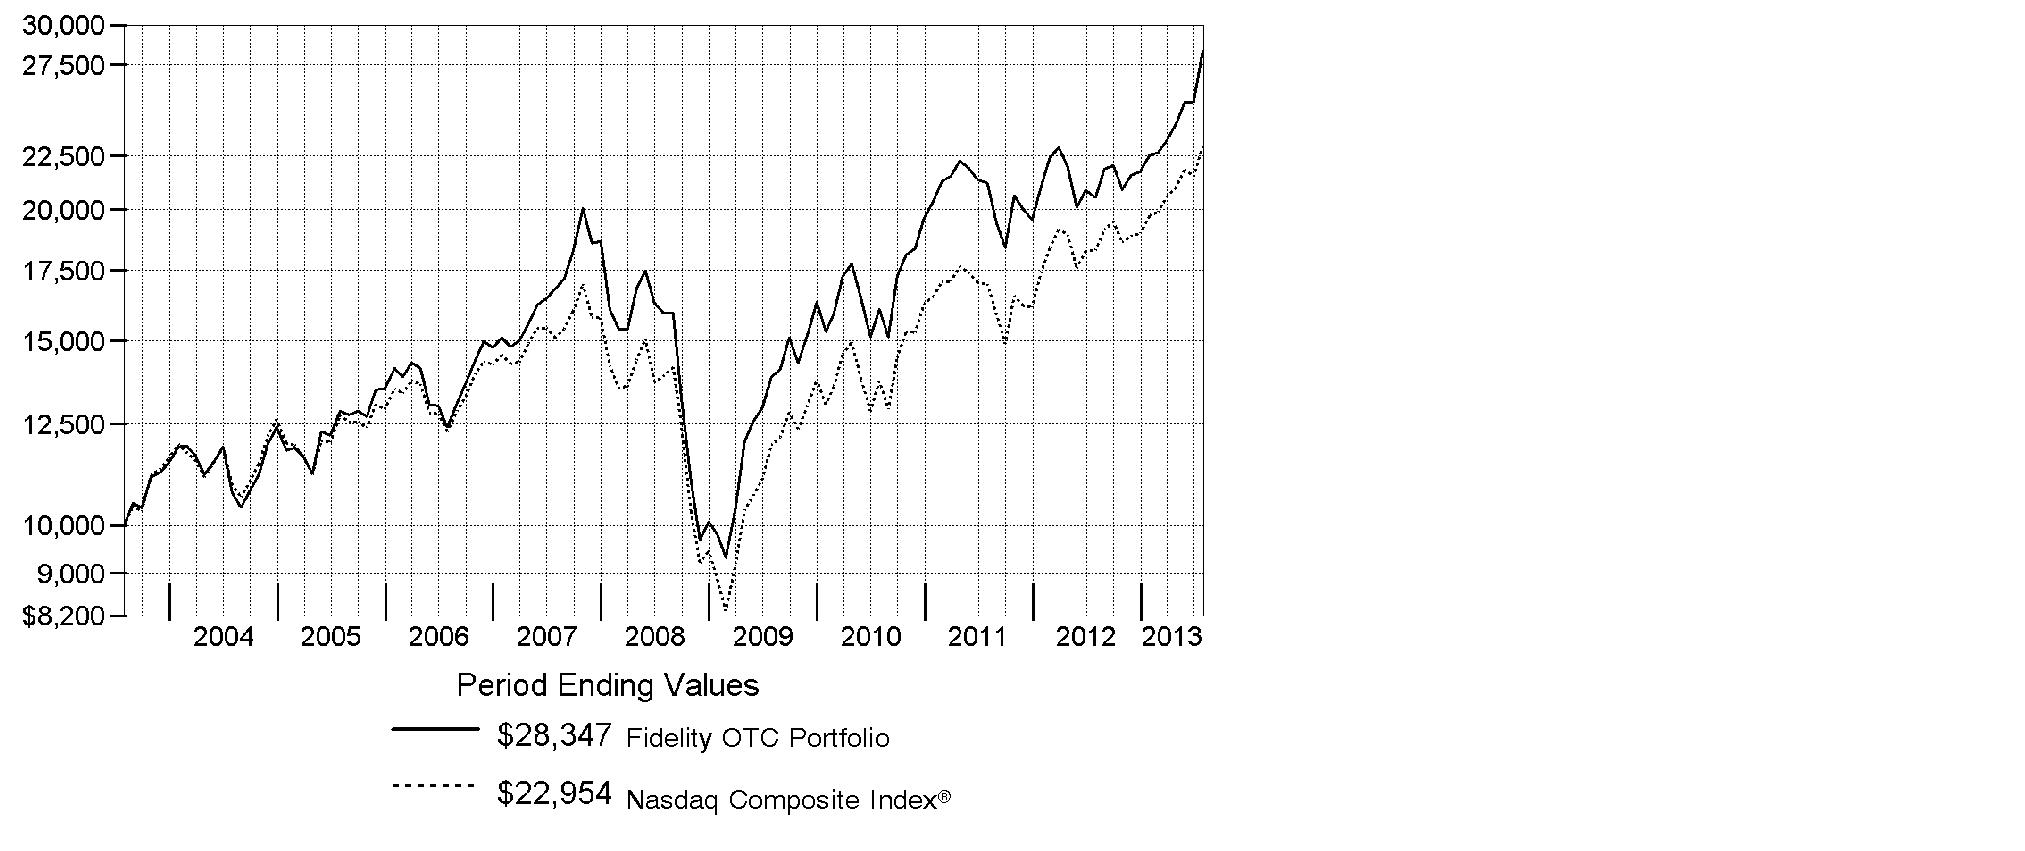
Annual Report
Market Recap: The bull run in U.S. stocks comfortably settled into a fifth year, as major equity benchmarks ripped through records during the 12 months ending July 31, 2013. Gains were fueled by a generally improving global economy and accommodative monetary policies worldwide. The tone was positive for most of the year, based largely on stronger U.S. economic data, including employment, housing and consumer sentiment. Setting a series of new highs along the way, the broad-based S&P 500® Index rose an impressive 25.00% for the 12 months, while the blue-chip-laden Dow Jones Industrial AverageSM also moved into record territory en route to a 22.36% gain. The growth-oriented Nasdaq Composite Index® had a similarly strong run, advancing 25.44%. During the year, markets were resilient amid intermittent volatility over debt woes in Europe, the 2012 U.S. presidential election and year-end Congressional gridlock over the federal budget. In mid-to-late June, concern arose about the U.S. Federal Reserve possibly tapering its sustaining bond-buying strategy - which prompted a brief, but steep, market sell-off. However, investors' continued quest for yield and the Fed's pledge to keep buying bonds until the economy showed significant improvement overpowered the uncertainty and helped equities climb notably higher in July to close the period on a strong note.
Comments from Gavin Baker, Portfolio Manager of Fidelity® OTC Portfolio: For the year, the fund's Retail Class shares returned 37.93%, considerably better than the Nasdaq Composite Index®. Versus the index, favorable stock selection was by far the main driver of performance. I aim to identify companies that have the potential to deliver above-average earnings growth and high returns on capital over a long period of time. This process led me to several outstanding picks in information technology, consumer discretionary, consumer staples and health care, the latter of which was the benchmark's best-performing sector and a group I added to during the period. The top individual contributor - both relative to the index and in absolute terms - was electric automaker Tesla Motors, whose Model S luxury sedan continued to exceed sales expectations. I significantly reduced this position. Also lifting relative performance were Green Mountain Coffee Roasters and social media provider Facebook. The largest relative detractor was a sizable out-of-benchmark position in Accretive Health, which provides revenue-enhancement services and software for hospitals. This stock continued to struggle in the aftermath of some legal difficulties. Riverbed Technology, which manufactures products for network optimization, and graphics chipmaker NVIDIA detracted as well.
The views expressed above reflect those of the portfolio manager(s) only through the end of the period as stated on the cover of this report and do not necessarily represent the views of Fidelity or any other person in the Fidelity organization. Any such views are subject to change at any time based upon market or other conditions and Fidelity disclaims any responsibility to update such views. These views may not be relied on as investment advice and, because investment decisions for a Fidelity fund are based on numerous factors, may not be relied on as an indication of trading intent on behalf of any Fidelity fund.
Annual Report
Shareholder Expense Example
As a shareholder of the Fund, you incur two types of costs: (1) transaction costs and (2) ongoing costs, including management fees and other Fund expenses. This Example is intended to help you understand your ongoing costs (in dollars) of investing in the Fund and to compare these costs with the ongoing costs of investing in other mutual funds.
The Example is based on an investment of $1,000 invested at the beginning of the period and held for the entire period (February 1, 2013 to July 31, 2013).
Actual Expenses
The first line of the accompanying table for each class of the Fund provides information about actual account values and actual expenses. You may use the information in this line, together with the amount you invested, to estimate the expenses that you paid over the period. Simply divide your account value by $1,000.00 (for example, an $8,600 account value divided by $1,000.00 = 8.6), then multiply the result by the number in the first line for a class of the Fund under the heading entitled "Expenses Paid During Period" to estimate the expenses you paid on your account during this period. A small balance maintenance fee of $12.00 that is charged once a year may apply for certain accounts with a value of less than $2,000. This fee is not included in the table below. If it was, the estimate of expenses you paid during the period would be higher, and your ending account value lower, by this amount. In addition, the Fund, as a shareholder in the underlying Fidelity Central Funds, will indirectly bear its pro-rata share of the fees and expenses incurred by the underlying Fidelity Central Funds. These fees and expenses are not included in the Fund's annualized expense ratio used to calculate the expense estimate in the table below.
Hypothetical Example for Comparison Purposes
The second line of the accompanying table for each class of the Fund provides information about hypothetical account values and hypothetical expenses based on a Class' actual expense ratio and an assumed rate of return of 5% per year before expenses, which is not the Class' actual return. The hypothetical account values and expenses may not be used to estimate the actual ending account balance or expenses you paid for the period. You may use this information to compare the ongoing costs of investing in the Fund and other funds. To do so, compare this 5% hypothetical example with the 5% hypothetical examples that appear in the shareholder reports of the other funds. A small balance maintenance fee of $12.00 that is charged once a year may apply for certain accounts with a value of less than $2,000. This fee is not included in the table below. If it was, the estimate of expenses you paid during the period would be higher, and your ending account value lower, by this amount. In addition, the Fund, as a shareholder in the underlying Fidelity Central Funds, will indirectly bear its pro-rata share of the fees and expenses incurred by the underlying Fidelity Central Funds. These fees and expenses are not included in the Fund's annualized expense ratio used to calculate the expense estimate in the table below.
Please note that the expenses shown in the table are meant to highlight your ongoing costs only and do not reflect any transaction costs. Therefore, the second line of the table is useful in comparing ongoing costs only, and will not help you determine the relative total costs of owning different funds.
Annual Report
Shareholder Expense Example - continued
| Annualized
Expense Ratio B | Beginning
Account Value
February 1, 2013 | Ending
Account Value
July 31, 2013 | Expenses Paid
During Period*
February 1, 2013
to July 31, 2013 |
OTC | .78% | | | |
Actual | | $ 1,000.00 | $ 1,256.60 | $ 4.36 |
Hypothetical A | | $ 1,000.00 | $ 1,020.93 | $ 3.91 |
Class K | .64% | | | |
Actual | | $ 1,000.00 | $ 1,257.50 | $ 3.58 |
Hypothetical A | | $ 1,000.00 | $ 1,021.62 | $ 3.21 |
A 5% return per year before expenses
B Annualized expense ratio reflects expenses net of applicable fee waivers.
* Expenses are equal to each Class' annualized expense ratio, multiplied by the average account value over the period, multiplied by 181/365 (to reflect the one-half year period).
Annual Report
Investment Changes (Unaudited)
Top Ten Stocks as of July 31, 2013 |
| % of fund's
net assets | % of fund's net assets
6 months ago |
Apple, Inc. | 9.4 | 8.3 |
Google, Inc. Class A | 5.3 | 6.3 |
Facebook, Inc. Class A | 5.0 | 2.4 |
Amazon.com, Inc. | 3.8 | 1.2 |
Rackspace Hosting, Inc. | 3.2 | 0.0 |
Questcor Pharmaceuticals, Inc. | 2.6 | 2.0 |
Comcast Corp. Class A | 2.2 | 0.0 |
athenahealth, Inc. | 2.1 | 1.8 |
Costco Wholesale Corp. | 2.0 | 2.2 |
Gilead Sciences, Inc. | 1.8 | 1.6 |
| 37.4 | |
Top Five Market Sectors as of July 31, 2013 |
| % of fund's
net assets | % of fund's net assets
6 months ago |
Information Technology | 53.5 | 55.4 |
Health Care | 20.1 | 18.9 |
Consumer Discretionary | 14.1 | 13.0 |
Consumer Staples | 5.7 | 6.2 |
Financials | 2.9 | 2.7 |
Asset Allocation (% of fund's net assets) |
As of July 31, 2013* | As of January 31, 2013** |
 | Stocks 99.2% | | | Stocks 99.8% | |
 | Convertible
Securities 0.2% | |  | Convertible
Securities 0.0% | |
 | Short-Term
Investments and
Net Other Assets
(Liabilities) 0.6% | | | Short-Term
Investments and
Net Other Assets
(Liabilities) 0.2% | |
* Foreign investments | 6.9% | | ** Foreign investments | 7.1% | |

Annual Report
Investments July 31, 2013
Showing Percentage of Net Assets
Common Stocks - 99.2% |
| Shares | | Value (000s) |
CONSUMER DISCRETIONARY - 13.9% |
Automobiles - 1.4% |
Tesla Motors, Inc. (a) | 799,049 | | $ 107,296 |
Volkswagen AG sponsored ADR | 421,300 | | 19,279 |
| | 126,575 |
Hotels, Restaurants & Leisure - 2.1% |
Buffalo Wild Wings, Inc. (a) | 45,400 | | 4,703 |
Chipotle Mexican Grill, Inc. (a) | 83,876 | | 34,580 |
Dunkin' Brands Group, Inc. | 37,400 | | 1,616 |
Noodles & Co. (d) | 7,200 | | 312 |
Panera Bread Co. Class A (a) | 259,800 | | 43,400 |
Starbucks Corp. | 1,260,600 | | 89,805 |
The Cheesecake Factory, Inc. | 304,980 | | 12,943 |
| | 187,359 |
Household Durables - 0.1% |
SodaStream International Ltd. (a)(d) | 146,958 | | 9,564 |
Internet & Catalog Retail - 4.2% |
Amazon.com, Inc. (a) | 1,134,896 | | 341,853 |
Groupon, Inc. Class A (a) | 4,169,300 | | 36,940 |
| | 378,793 |
Media - 2.5% |
Comcast Corp. Class A | 4,451,400 | | 200,669 |
DISH Network Corp. Class A | 135,800 | | 6,063 |
Lions Gate Entertainment Corp. (a)(d) | 576,169 | | 18,743 |
| | 225,475 |
Specialty Retail - 2.7% |
Bed Bath & Beyond, Inc. (a) | 1,036,700 | | 79,276 |
Best Buy Co., Inc. | 20,900 | | 629 |
Five Below, Inc. | 6,100 | | 237 |
Francescas Holdings Corp. (a) | 77,509 | | 1,927 |
Lowe's Companies, Inc. | 1,176,300 | | 52,439 |
Monro Muffler Brake, Inc. | 29,213 | | 1,256 |
Ross Stores, Inc. | 595,200 | | 40,158 |
Tile Shop Holdings, Inc. (a) | 17,400 | | 495 |
Tractor Supply Co. | 166,688 | | 20,191 |
Ulta Salon, Cosmetics & Fragrance, Inc. (a) | 182,600 | | 18,424 |
Urban Outfitters, Inc. (a) | 515,400 | | 21,935 |
| | 236,967 |
Textiles, Apparel & Luxury Goods - 0.9% |
lululemon athletica, Inc. (a)(d) | 227,746 | | 15,844 |
Michael Kors Holdings Ltd. (a) | 399,600 | | 26,909 |
Common Stocks - continued |
| Shares | | Value (000s) |
CONSUMER DISCRETIONARY - continued |
Textiles, Apparel & Luxury Goods - continued |
NIKE, Inc. Class B | 28,600 | | $ 1,800 |
Ralph Lauren Corp. | 193,500 | | 35,229 |
| | 79,782 |
TOTAL CONSUMER DISCRETIONARY | | 1,244,515 |
CONSUMER STAPLES - 5.7% |
Beverages - 0.3% |
Monster Beverage Corp. (a) | 467,400 | | 28,507 |
Food & Staples Retailing - 2.0% |
Costco Wholesale Corp. | 1,547,300 | | 181,483 |
Food Products - 3.4% |
Danone SA sponsored ADR | 1,844,700 | | 29,229 |
Green Mountain Coffee Roasters, Inc. (a)(d) | 1,657,817 | | 127,950 |
Mondelez International, Inc. | 4,478,700 | | 140,049 |
WhiteWave Foods Co. | 261,700 | | 4,891 |
| | 302,119 |
TOTAL CONSUMER STAPLES | | 512,109 |
ENERGY - 0.0% |
Oil, Gas & Consumable Fuels - 0.0% |
Noble Energy, Inc. | 18,700 | | 1,169 |
FINANCIALS - 2.9% |
Capital Markets - 0.8% |
Carlyle Group LP | 318,600 | | 8,918 |
Northern Trust Corp. | 893,400 | | 52,300 |
T. Rowe Price Group, Inc. | 200,000 | | 15,048 |
| | 76,266 |
Commercial Banks - 1.1% |
Huntington Bancshares, Inc. | 175,600 | | 1,501 |
Signature Bank (a) | 214,600 | | 19,647 |
Texas Capital Bancshares, Inc. (a) | 567,300 | | 25,806 |
Wells Fargo & Co. | 1,161,500 | | 50,525 |
| | 97,479 |
Consumer Finance - 0.8% |
Capital One Financial Corp. | 1,059,800 | | 73,147 |
Common Stocks - continued |
| Shares | | Value (000s) |
FINANCIALS - continued |
Diversified Financial Services - 0.2% |
CME Group, Inc. | 207,200 | | $ 15,329 |
TOTAL FINANCIALS | | 262,221 |
HEALTH CARE - 20.1% |
Biotechnology - 11.8% |
Aegerion Pharmaceuticals, Inc. (a) | 386,900 | | 35,436 |
Alexion Pharmaceuticals, Inc. (a) | 1,295,404 | | 150,565 |
Alkermes PLC (a) | 812,467 | | 27,283 |
Alnylam Pharmaceuticals, Inc. (a) | 285,200 | | 13,168 |
Amgen, Inc. | 370,400 | | 40,111 |
ARIAD Pharmaceuticals, Inc. (a) | 2,485,000 | | 46,171 |
Biogen Idec, Inc. (a) | 264,100 | | 57,608 |
BioMarin Pharmaceutical, Inc. (a) | 1,000,156 | | 64,660 |
Clovis Oncology, Inc. (a) | 495,655 | | 38,602 |
Genomic Health, Inc. (a) | 416,500 | | 14,844 |
Gilead Sciences, Inc. (a) | 2,656,900 | | 163,267 |
ImmunoGen, Inc. (a)(d) | 297,309 | | 5,664 |
Infinity Pharmaceuticals, Inc. (a) | 324,589 | | 6,875 |
Ironwood Pharmaceuticals, Inc. Class A (a)(d) | 2,958,742 | | 36,215 |
Isis Pharmaceuticals, Inc. (a)(d) | 80,849 | | 2,332 |
Medivation, Inc. (a) | 2,138,089 | | 123,731 |
NPS Pharmaceuticals, Inc. (a) | 372,136 | | 6,702 |
Onyx Pharmaceuticals, Inc. (a) | 386,821 | | 50,790 |
Pharmacyclics, Inc. (a) | 42,200 | | 4,584 |
Regeneron Pharmaceuticals, Inc. (a) | 74,932 | | 20,236 |
Seattle Genetics, Inc. (a)(d) | 1,401,386 | | 56,784 |
Targacept, Inc. (a) | 117,049 | | 585 |
Theravance, Inc. (a)(d) | 1,762,779 | | 67,973 |
Vertex Pharmaceuticals, Inc. (a) | 315,000 | | 25,137 |
| | 1,059,323 |
Health Care Equipment & Supplies - 1.1% |
Accuray, Inc. (a)(d) | 1,498,800 | | 9,308 |
Endologix, Inc. (a) | 155,200 | | 2,426 |
Intuitive Surgical, Inc. (a) | 210,900 | | 81,829 |
| | 93,563 |
Health Care Providers & Services - 2.4% |
Accretive Health, Inc. (a)(d)(e) | 9,842,302 | | 98,226 |
Express Scripts Holding Co. (a) | 1,760,400 | | 115,394 |
| | 213,620 |
Common Stocks - continued |
| Shares | | Value (000s) |
HEALTH CARE - continued |
Health Care Technology - 2.1% |
athenahealth, Inc. (a)(d) | 1,690,748 | | $ 189,279 |
Life Sciences Tools & Services - 0.1% |
Illumina, Inc. (a) | 141,100 | | 11,263 |
Pharmaceuticals - 2.6% |
Questcor Pharmaceuticals, Inc. (d)(e) | 3,411,690 | | 227,969 |
TOTAL HEALTH CARE | | 1,795,017 |
INDUSTRIALS - 0.5% |
Air Freight & Logistics - 0.3% |
C.H. Robinson Worldwide, Inc. | 469,200 | | 27,974 |
Electrical Equipment - 0.1% |
SolarCity Corp. (d) | 347,594 | | 14,370 |
Professional Services - 0.1% |
Verisk Analytics, Inc. (a) | 102,500 | | 6,597 |
TOTAL INDUSTRIALS | | 48,941 |
INFORMATION TECHNOLOGY - 53.5% |
Communications Equipment - 5.9% |
Aruba Networks, Inc. (a) | 3,688,484 | | 65,581 |
Cisco Systems, Inc. | 4,057,900 | | 103,679 |
Juniper Networks, Inc. (a) | 2,111,500 | | 45,756 |
QUALCOMM, Inc. | 1,937,209 | | 125,047 |
Radware Ltd. (a)(e) | 3,583,044 | | 49,088 |
Riverbed Technology, Inc. (a)(e) | 8,660,853 | | 135,456 |
| | 524,607 |
Computers & Peripherals - 10.3% |
Apple, Inc. | 1,851,100 | | 837,622 |
Cray, Inc. (a) | 1,353,436 | | 31,359 |
EMC Corp. | 21,900 | | 573 |
Fusion-io, Inc. (a)(d) | 1,964,466 | | 28,328 |
Silicon Graphics International Corp. (a)(d) | 284,874 | | 5,361 |
Stratasys Ltd. (a) | 212,900 | | 18,874 |
| | 922,117 |
Electronic Equipment & Components - 0.0% |
Neonode, Inc. (a) | 500,000 | | 3,895 |
Internet Software & Services - 19.9% |
Angie's List, Inc. (a)(d)(e) | 4,065,915 | | 89,531 |
Baidu.com, Inc. sponsored ADR (a) | 1,046,212 | | 138,424 |
Common Stocks - continued |
| Shares | | Value (000s) |
INFORMATION TECHNOLOGY - continued |
Internet Software & Services - continued |
Constant Contact, Inc. (a)(e) | 2,917,136 | | $ 55,980 |
Demandware, Inc. (a) | 474,300 | | 21,068 |
Dropbox, Inc. (a)(f) | 331,524 | | 3,315 |
E2open, Inc. (d)(e) | 1,896,838 | | 37,709 |
eBay, Inc. (a) | 937,563 | | 48,463 |
Facebook, Inc. Class A (a) | 12,044,369 | | 443,594 |
Google, Inc. Class A (a) | 536,577 | | 476,266 |
LinkedIn Corp. (a) | 42,300 | | 8,620 |
Marin Software, Inc. (d)(e) | 2,278,668 | | 26,341 |
Marketo, Inc. (d) | 150,428 | | 4,728 |
Millennial Media, Inc. (a)(d) | 2,435,808 | | 24,139 |
Rackspace Hosting, Inc. (a) | 6,286,698 | | 284,725 |
Responsys, Inc. (a) | 39,100 | | 567 |
Textura Corp. | 5,900 | | 178 |
Trulia, Inc. (d) | 1,522,696 | | 56,736 |
Velti PLC (a)(d) | 477,451 | | 540 |
Yahoo!, Inc. (a) | 2,130,500 | | 59,846 |
| | 1,780,770 |
IT Services - 0.7% |
Cognizant Technology Solutions Corp. Class A (a) | 182,400 | | 13,204 |
ServiceSource International, Inc. (a)(e) | 4,376,136 | | 46,693 |
| | 59,897 |
Semiconductors & Semiconductor Equipment - 3.8% |
Advanced Micro Devices, Inc. (a)(d) | 22,108,516 | | 83,349 |
Altera Corp. | 113,394 | | 4,032 |
Applied Micro Circuits Corp. (a) | 457,650 | | 5,432 |
Broadcom Corp. Class A | 2,112,500 | | 58,242 |
Inphi Corp. (a) | 201,395 | | 2,348 |
Lam Research Corp. (a) | 54,900 | | 2,702 |
LSI Corp. | 328,600 | | 2,557 |
Maxim Integrated Products, Inc. | 159,000 | | 4,547 |
Mellanox Technologies Ltd. (a) | 948,912 | | 43,318 |
NVE Corp. (a)(e) | 265,557 | | 13,166 |
NVIDIA Corp. | 7,039,487 | | 101,580 |
Skyworks Solutions, Inc. (a) | 713,400 | | 17,136 |
| | 338,409 |
Software - 12.9% |
Activision Blizzard, Inc. | 6,065,262 | | 109,053 |
Adobe Systems, Inc. (a) | 1,860,100 | | 87,946 |
Check Point Software Technologies Ltd. (a) | 65,200 | | 3,671 |
Common Stocks - continued |
| Shares | | Value (000s) |
INFORMATION TECHNOLOGY - continued |
Software - continued |
Electronic Arts, Inc. (a) | 5,741,947 | | $ 149,980 |
FleetMatics Group PLC | 80,500 | | 3,032 |
Gameloft Se (a)(e) | 7,764,787 | | 62,909 |
Gigamon, Inc. (a) | 55,100 | | 1,970 |
Guidewire Software, Inc. (a) | 848,830 | | 37,145 |
Intuit, Inc. | 726,000 | | 46,406 |
Microsoft Corp. | 4,288,939 | | 136,517 |
Oracle Corp. | 2,000,200 | | 64,706 |
salesforce.com, Inc. (a) | 1,885,620 | | 82,496 |
ServiceNow, Inc. (a) | 964,076 | | 42,014 |
Synchronoss Technologies, Inc. (a)(e) | 3,688,086 | | 127,202 |
Tableau Software, Inc. | 18,400 | | 1,019 |
Take-Two Interactive Software, Inc. (a) | 3,200,008 | | 56,096 |
Ubisoft Entertainment SA (a)(e) | 9,537,704 | | 145,537 |
Ubisoft Entertainment SA warrants 10/10/13 (a)(e) | 3,080,130 | | 1,651 |
| | 1,159,350 |
TOTAL INFORMATION TECHNOLOGY | | 4,789,045 |
MATERIALS - 0.1% |
Metals & Mining - 0.1% |
Randgold Resources Ltd. sponsored ADR | 76,633 | | 5,692 |
TELECOMMUNICATION SERVICES - 2.5% |
Diversified Telecommunication Services - 1.1% |
Level 3 Communications, Inc. (a) | 4,754,147 | | 104,829 |
Wireless Telecommunication Services - 1.4% |
NII Holdings, Inc. (a)(d)(e) | 17,120,769 | | 122,927 |
TOTAL TELECOMMUNICATION SERVICES | | 227,756 |
TOTAL COMMON STOCKS (Cost $6,970,007) |
8,886,465
|
Convertible Preferred Stocks - 0.2% |
| Shares | | Value (000s) |
CONSUMER DISCRETIONARY - 0.2% |
Household Durables - 0.2% |
Roku, Inc. 8.00% (f) (Cost $15,000) | 16,562,507 | | $ 15,000 |
Money Market Funds - 5.4% |
| | | |
Fidelity Cash Central Fund, 0.11% (b) | 32,349,365 | | 32,349 |
Fidelity Securities Lending Cash Central Fund, 0.12% (b)(c) | 448,257,924 | | 448,258 |
TOTAL MONEY MARKET FUNDS (Cost $480,607) |
480,607
|
Cash Equivalents - 0.2% |
| Maturity Amount (000s) | | |
Investments in repurchase agreements in a joint trading account at 0.06%, dated 7/31/13 due 8/1/13 (Collateralized by U.S. Treasury Obligations) #
(Cost $21,190) | $ 21,190 | |
21,190
|
TOTAL INVESTMENT PORTFOLIO - 105.0% (Cost $7,486,804) | | 9,403,262 |
NET OTHER ASSETS (LIABILITIES) - (5.0)% | | (450,133) |
NET ASSETS - 100% | $ 8,953,129 |
Legend |
(a) Non-income producing |
(b) Affiliated fund that is generally available only to investment companies and other accounts managed by Fidelity Investments. The rate quoted is the annualized seven-day yield of the fund at period end. A complete unaudited listing of the fund's holdings as of its most recent quarter end is available upon request. In addition, each Fidelity Central Fund's financial statements, which are not covered by the Fund's Report of Independent Registered Public Accounting Firm, are available on the SEC's website or upon request. |
(c) Investment made with cash collateral received from securities on loan. |
(d) Security or a portion of the security is on loan at period end. |
(e) Affiliated company |
(f) Restricted securities - Investment in securities not registered under the Securities Act of 1933 (excluding 144A issues). At the end of the period, the value of restricted securities (excluding 144A issues) amounted to $18,315,000 or 0.2% of net assets. |
Additional information on each restricted holding is as follows: |
Security | Acquisition Date | Acquisition Cost (000s) |
Dropbox, Inc. | 5/2/12 | $ 3,000 |
Roku, Inc. 8.00% | 5/7/13 | $ 15,000 |
# Additional information on each counterparty to the repurchase agreement is as follows: |
Repurchase Agreement / Counterparty | Value
(000s) |
$21,190,000 due 8/01/13 at 0.06% |
Barclays Capital, Inc. | $ 5,919 |
Merrill Lynch, Pierce, Fenner & Smith, Inc. | 4,143 |
UBS Securities LLC | 11,128 |
| $ 21,190 |
Affiliated Central Funds |
Information regarding fiscal year to date income earned by the Fund from investments in Fidelity Central Funds is as follows: |
Fund | Income earned
(Amounts in thousands) |
Fidelity Cash Central Fund | $ 20 |
Fidelity Securities Lending Cash Central Fund | 31,912 |
Total | $ 31,932 |
Other Affiliated Issuers |
An affiliated company is a company in which the Fund has ownership of at least 5% of the voting securities. Fiscal year to date transactions with companies which are or were affiliates are as follows: |
Affiliate
(Amounts in thousands) | Value,
beginning of
period | Purchases | Sales Proceeds | Dividend Income | Value,
end of
period |
Accretive Health, Inc. | $ 134,915 | $ - | $ 1,010 | $ - | $ 98,226 |
Angie's List, Inc. | 19,482 | 82,327 | 13,763 | - | 89,531 |
Constant Contact, Inc. | 32,819 | 21,849 | 6,097 | - | 55,980 |
Cray, Inc. | 3,901 | 34,988 | 22,364 | - | - |
E2open, Inc. | - | 33,882 | - | - | 37,709 |
ExactTarget, Inc. | - | 139,504 | 231,558 | - | - |
Gameloft Se | 44,521 | - | - | - | 62,909 |
Inphi Corp. | 19,745 | - | 16,465 | - | - |
Marin Software, Inc. | - | 23,367 | - | - | 26,341 |
NII Holdings, Inc. | 88,138 | 24,865 | - | - | 122,927 |
NVE Corp. | 25,650 | - | 9,821 | - | 13,166 |
Questcor Pharmaceuticals, Inc. | 225,333 | 11,904 | 142,191 | 4,559 | 227,969 |
Radware Ltd. | - | 78,856 | 14,022 | - | 49,088 |
Riverbed Technology, Inc. | - | 322,562 | 156,763 | - | 135,456 |
ServiceSource International, Inc. | 41,029 | 12,837 | 7,647 | - | 46,693 |
Synchronoss Technologies, Inc. | 73,630 | - | 4,961 | - | 127,202 |
Ubisoft Entertainment SA | 61,686 | 6,090 | - | - | 145,537 |
Ubisoft Entertainment SA warrants 10/10/13 | 207 | - | 217 | - | 1,651 |
Total | $ 771,056 | $ 793,031 | $ 626,879 | $ 4,559 | $ 1,240,385 |
Other Information |
The following is a summary of the inputs used, as of July 31, 2013, involving the Fund's assets and liabilities carried at fair value. The inputs or methodology used for valuing securities may not be an indication of the risk associated with investing in those securities. For more information on valuation inputs, and their aggregation into the levels used in the table below, please refer to the Investment Valuation section in the accompanying Notes to Financial Statements. |
Valuation Inputs at Reporting Date: |
Description
(Amounts in thousands) | Total | Level 1 | Level 2 | Level 3 |
Investments in Securities: | | | | |
Equities: | | | | |
Consumer Discretionary | $ 1,259,515 | $ 1,244,515 | $ - | $ 15,000 |
Consumer Staples | 512,109 | 512,109 | - | - |
Energy | 1,169 | 1,169 | - | - |
Financials | 262,221 | 262,221 | - | - |
Health Care | 1,795,017 | 1,795,017 | - | - |
Industrials | 48,941 | 48,941 | - | - |
Information Technology | 4,789,045 | 4,785,730 | - | 3,315 |
Materials | 5,692 | 5,692 | - | - |
Telecommunication Services | 227,756 | 227,756 | - | - |
Money Market Funds | 480,607 | 480,607 | - | - |
Cash Equivalents | 21,190 | - | 21,190 | - |
Total Investments in Securities: | $ 9,403,262 | $ 9,363,757 | $ 21,190 | $ 18,315 |
See accompanying notes which are an integral part of the financial statements.
Annual Report
Statement of Assets and Liabilities
Amounts in thousands (except per-share amounts) | July 31, 2013 |
| | |
Assets | | |
Investment in securities, at value (including securities loaned of $454,143 and repurchase agreements of $21,190) - See accompanying schedule: Unaffiliated issuers (cost $5,763,850) | $ 7,682,270 | |
Fidelity Central Funds (cost $480,607) | 480,607 | |
Other affiliated issuers (cost $1,242,347) | 1,240,385 | |
Total Investments (cost $7,486,804) | | $ 9,403,262 |
Cash | | 1 |
Receivable for investments sold | | 186,896 |
Receivable for fund shares sold | | 10,643 |
Dividends receivable | | 1,062 |
Distributions receivable from Fidelity Central Funds | | 488 |
Other receivables | | 278 |
Total assets | | 9,602,630 |
| | |
Liabilities | | |
Payable for investments purchased | $ 189,288 | |
Payable for fund shares redeemed | 5,330 | |
Accrued management fee | 5,284 | |
Other affiliated payables | 1,095 | |
Other payables and accrued expenses | 246 | |
Collateral on securities loaned, at value | 448,258 | |
Total liabilities | | 649,501 |
| | |
Net Assets | | $ 8,953,129 |
Net Assets consist of: | | |
Paid in capital | | $ 6,294,615 |
Undistributed net investment income | | 6,993 |
Accumulated undistributed net realized gain (loss) on investments and foreign currency transactions | | 735,092 |
Net unrealized appreciation (depreciation) on investments and assets and liabilities in foreign currencies | | 1,916,429 |
Net Assets | | $ 8,953,129 |
See accompanying notes which are an integral part of the financial statements.
Annual Report
Financial Statements - continued
Statement of Assets and Liabilities - continued
Amounts in thousands (except per-share amounts) | July 31, 2013 |
| | |
OTC:
Net Asset Value, offering price and redemption price per share ($6,693,071 ÷ 84,743 shares) | | $ 78.98 |
| | |
Class K:
Net Asset Value, offering price and redemption price per share ($2,260,058 ÷ 28,394 shares) | | $ 79.60 |
See accompanying notes which are an integral part of the financial statements.
Annual Report
Statement of Operations
Amounts in thousands | Year ended July 31, 2013 |
| | |
Investment Income | | |
Dividends (including $4,559 earned from other affiliated issuers) | | $ 52,140 |
Special dividends | | 11,578 |
Interest | | 2 |
Income from Fidelity Central Funds (including $31,912 from security lending) | | 31,932 |
Total income | | 95,652 |
| | |
Expenses | | |
Management fee
Basic fee | $ 44,865 | |
Performance adjustment | (4,103) | |
Transfer agent fees | 11,129 | |
Accounting and security lending fees | 1,305 | |
Custodian fees and expenses | 268 | |
Independent trustees' compensation | 47 | |
Registration fees | 83 | |
Audit | 73 | |
Legal | 36 | |
Interest | 11 | |
Miscellaneous | 70 | |
Total expenses before reductions | 53,784 | |
Expense reductions | (1,575) | 52,209 |
Net investment income (loss) | | 43,443 |
Realized and Unrealized Gain (Loss) Net realized gain (loss) on: | | |
Investment securities: | | |
Unaffiliated issuers | 1,020,801 | |
Other affiliated issuers | 79,420 | |
Foreign currency transactions | (97) | |
Futures contracts | 826 | |
Total net realized gain (loss) | | 1,100,950 |
Change in net unrealized appreciation (depreciation) on: Investment securities | 1,322,675 | |
Assets and liabilities in foreign currencies | (2) | |
Total change in net unrealized appreciation (depreciation) | | 1,322,673 |
Net gain (loss) | | 2,423,623 |
Net increase (decrease) in net assets resulting from operations | | $ 2,467,066 |
See accompanying notes which are an integral part of the financial statements.
Annual Report
Financial Statements - continued
Statement of Changes in Net Assets
Amounts in thousands | Year ended
July 31,
2013 | Year ended
July 31,
2012 |
Increase (Decrease) in Net Assets | | |
Operations | | |
Net investment income (loss) | $ 43,443 | $ (8,447) |
Net realized gain (loss) | 1,100,950 | 104,141 |
Change in net unrealized appreciation (depreciation) | 1,322,673 | (349,473) |
Net increase (decrease) in net assets resulting
from operations | 2,467,066 | (253,779) |
Distributions to shareholders from net investment income | (33,821) | - |
Share transactions - net increase (decrease) | (622,836) | (340,677) |
Total increase (decrease) in net assets | 1,810,409 | (594,456) |
| | |
Net Assets | | |
Beginning of period | 7,142,720 | 7,737,176 |
End of period (including undistributed net investment income of $6,993 and accumulated net investment loss of $2,569, respectively) | $ 8,953,129 | $ 7,142,720 |
See accompanying notes which are an integral part of the financial statements.
Annual Report
Financial Highlights - OTC
Years ended July 31, | 2013 | 2012 | 2011 | 2010 | 2009 |
Selected Per-Share Data | | | | | |
Net asset value, beginning of period | $ 57.53 | $ 59.28 | $ 45.00 | $ 38.73 | $ 44.66 |
Income from Investment Operations | | | | | |
Net investment income (loss) B | .36 E | (.08) F | (.27) | (.23) | (.12) |
Net realized and unrealized gain (loss) | 21.37 | (1.67) | 14.55 | 6.50 | (5.81) |
Total from investment operations | 21.73 | (1.75) | 14.28 | 6.27 | (5.93) |
Distributions from net investment income | (.28) | - | - | - | - |
Net asset value, end of period | $ 78.98 | $ 57.53 | $ 59.28 | $ 45.00 | $ 38.73 |
Total Return A | 37.93% | (2.95)% | 31.73% | 16.19% | (13.28)% |
Ratios to Average Net Assets C, G | | | | | |
Expenses before reductions | .76% | .91% | .94% | 1.06% | 1.13% |
Expenses net of fee waivers, if any | .76% | .91% | .94% | 1.06% | 1.13% |
Expenses net of all reductions | .74% | .90% | .92% | 1.04% | 1.13% |
Net investment income (loss) | .55% E | (.14)% F | (.49)% | (.51)% | (.37)% |
Supplemental Data | | | | | |
Net assets, end of period (in millions) | $ 6,693 | $ 5,499 | $ 6,374 | $ 5,080 | $ 4,677 |
Portfolio turnover rate D | 116% | 149% | 158% | 163% | 151% |
A Total returns would have been lower if certain expenses had not been reduced during the applicable periods shown.
B Calculated based on average shares outstanding during the period.
C Fees and expenses of any underlying Fidelity Central Funds are not included in the Fund's expense ratio. The Fund indirectly bears its proportionate share of the expenses of any underlying Fidelity Central Funds.
D Amount does not include the portfolio activity of any underlying Fidelity Central Funds.
E Investment income per share reflects a large, non-recurring dividend which amounted to $.10 per share. Excluding this non-recurring dividend, the ratio of net investment income (loss) to average net assets would have been .40%.
F Investment income per share reflects a large, non-recurring dividend which amounted to $.03 per share. Excluding this non-recurring dividend, the ratio of net investment income (loss) to average net assets would have been (.20)%.
G Expense ratios reflect operating expenses of the class. Expenses before reductions do not reflect amounts reimbursed by the investment adviser or reductions from brokerage service arrangements or reductions from other expense offset arrangements and do not represent the amount paid by the class during periods when reimbursements or reductions occur. Expenses net of fee waivers reflect expenses after reimbursement by the investment adviser but prior to reductions from brokerage service arrangements or other expense offset arrangements. Expenses net of all reductions represent the net expenses paid by the class.
See accompanying notes which are an integral part of the financial statements.
Annual Report
Financial Highlights - Class K
Years ended July 31, | 2013 | 2012 | 2011 | 2010 | 2009 |
Selected Per-Share Data | | | | | |
Net asset value, beginning of period | $ 57.94 | $ 59.61 | $ 45.19 | $ 38.83 | $ 44.68 |
Income from Investment Operations | | | | | |
Net investment income (loss) B | .45 F | - G, I | (.19) | (.16) | (.05) |
Net realized and unrealized gain (loss) | 21.53 | (1.67) | 14.61 | 6.52 | (5.80) |
Total from investment operations | 21.98 | (1.67) | 14.42 | 6.36 | (5.85) |
Distributions from net investment income | (.32) | - | - | - | - |
Net asset value, end of period | $ 79.60 | $ 57.94 | $ 59.61 | $ 45.19 | $ 38.83 |
Total Return A | 38.11% | (2.80)% | 31.91% | 16.38% | (13.09)% |
Ratios to Average Net Assets C, H | | | | | |
Expenses before reductions | .62% | .77% | .80% | .90% | .92% |
Expenses net of fee waivers, if any | .62% | .77% | .80% | .90% | .92% |
Expenses net of all reductions | .60% | .76% | .78% | .88% | .92% |
Net investment income (loss) | .69% F | -% E, G | (.35)% | (.35)% | (.17)% |
Supplemental Data | | | | | |
Net assets, end of period (in millions) | $ 2,260 | $ 1,644 | $ 1,363 | $ 936 | $ 489 |
Portfolio turnover rate D | 116% | 149% | 158% | 163% | 151% |
A Total returns would have been lower if certain expenses had not been reduced during the applicable periods shown.
B Calculated based on average shares outstanding during the period.
C Fees and expenses of any underlying Fidelity Central Funds are not included in the Fund's expense ratio. The Fund indirectly bears its proportionate share of the expenses of any underlying Fidelity Central Funds.
D Amount does not include the portfolio activity of any underlying Fidelity Central Funds.
E Amount represents less than .01%.
F Investment income per share reflects a large, non-recurring dividend which amounted to $.10 per share. Excluding this non-recurring dividend, the ratio of net investment income (loss) to average net assets would have been .53%.
G Investment income per share reflects a large, non-recurring dividend which amounted to $.03 per share. Excluding this non-recurring dividend, the ratio of net investment income (loss) to average net assets would have been (.06)%.
H Expense ratios reflect operating expenses of the class. Expenses before reductions do not reflect amounts reimbursed by the investment adviser or reductions from brokerage service arrangements or reductions from other expense offset arrangements and do not represent the amount paid by the class during periods when reimbursements or reductions occur. Expenses net of fee waivers reflect expenses after reimbursement by the investment adviser but prior to reductions from brokerage service arrangements or other expense offset arrangements. Expenses net of all reductions represent the net expenses paid by the class.
I Amount represents less than $.01 per share.
See accompanying notes which are an integral part of the financial statements.
Annual Report
Notes to Financial Statements
For the period ended July 31, 2013
(Amounts in thousands except percentages)
1. Organization.
Fidelity OTC Portfolio (the Fund) is a non-diversified fund of Fidelity Securities Fund (the Trust) and is authorized to issue an unlimited number of shares. The Trust is registered under the Investment Company Act of 1940, as amended (the 1940 Act), as an open-end management investment company organized as a Massachusetts business trust. The Fund offers OTC and Class K shares, each of which has equal rights as to assets and voting privileges. Each class has exclusive voting rights with respect to matters that affect that class.
2. Investments in Fidelity Central Funds.
The Fund invests in Fidelity Central Funds, which are open-end investment companies generally available only to other investment companies and accounts managed by Fidelity Management & Research Company (FMR) and its affiliates. The Fund's Schedule of Investments lists each of the Fidelity Central Funds held as of period end, if any, as an investment of the Fund, but does not include the underlying holdings of each Fidelity Central Fund. As an Investing Fund, the Fund indirectly bears its proportionate share of the expenses of the underlying Fidelity Central Funds.
The Money Market Central Funds seek preservation of capital and current income and are managed by Fidelity Investments Money Management, Inc. (FIMM), an affiliate of FMR.
A complete unaudited list of holdings for each Fidelity Central Fund is available upon request or at the Securities and Exchange Commission (the SEC) website at www.sec.gov. In addition, the financial statements of the Fidelity Central Funds, which are not covered by the Fund's Report of Independent Registered Public Accounting Firm, are available on the SEC website or upon request.
3. Significant Accounting Policies.
The financial statements have been prepared in conformity with accounting principles generally accepted in the United States of America (GAAP), which require management to make certain estimates and assumptions at the date of the financial statements. Actual results could differ from those estimates. Subsequent events, if any, through the date that the financial statements were issued have been evaluated in the preparation of the financial statements. The following summarizes the significant accounting policies of the Fund:
Investment Valuation. Investments are valued as of 4:00 p.m. Eastern time on the last calendar day of the period. In accordance with valuation policies and procedures approved by the Board of Trustees (the Board), the Fund attempts to obtain prices from one or more third party pricing vendors or brokers to value its investments. When
Annual Report
Notes to Financial Statements - continued
(Amounts in thousands except percentages)
3. Significant Accounting Policies - continued
Investment Valuation - continued
current market prices, quotations or currency exchange rates are not readily available or reliable, investments will be fair valued in good faith by the FMR Fair Value Committee (the Committee), in accordance with procedures adopted by the Board. Factors used in determining fair value vary by investment type and may include market or investment specific events. The frequency with which these procedures are used cannot be predicted and they may be utilized to a significant extent. The Committee oversees the Fund's valuation policies and procedures and is responsible for approving and reporting to the Board all fair value determinations.
The Fund categorizes the inputs to valuation techniques used to value its investments into a disclosure hierarchy consisting of three levels as shown below:
Level 1 - quoted prices in active markets for identical investments
Level 2 - other significant observable inputs (including quoted prices for similar investments, interest rates, prepayment speeds, etc.)
Level 3 - unobservable inputs (including the Fund's own assumptions based on the best information available)
Valuation techniques used to value the Fund's investments by major category are as follows:
Equity securities, including restricted securities, for which market quotations are readily available, are valued at the last reported sale price or official closing price as reported by a third party pricing vendor on the primary market or exchange on which they are traded and are categorized as Level 1 in the hierarchy. In the event there were no sales during the day or closing prices are not available, securities are valued at the last quoted bid price or may be valued using the last available price and are generally categorized as Level 2 in the hierarchy. For foreign equity securities, when market or security specific events arise, comparisons to the valuation of American Depositary Receipts (ADRs), futures contracts, Exchange-Traded Funds (ETFs) and certain indexes as well as quoted prices for similar securities may be used and would be categorized as Level 2 in the hierarchy. Utilizing these techniques may result in transfers between Level 1 and Level 2. For restricted equity securities and private placements where observable inputs are limited, assumptions about market activity and risk are used and these securities are generally categorized as Level 3 in the hierarchy.
Investments in open-end mutual funds, including the Fidelity Central Funds, are valued at their closing net asset value (NAV) each business day and are categorized as Level 1 in the hierarchy. Short-term securities with remaining maturities of sixty days or less may
Annual Report
3. Significant Accounting Policies - continued
Investment Valuation - continued
be valued at amortized cost, which approximates fair value, and are categorized as Level 2 in the hierarchy.
Changes in valuation techniques may result in transfers in or out of an assigned level within the disclosure hierarchy. The aggregate value of investments by input level, as of July 31, 2013 is included at the end of the Fund's Schedule of Investments.
Foreign Currency. The Fund may use foreign currency contracts to facilitate transactions in foreign-denominated securities. Gains and losses from these transactions may arise from changes in the value of the foreign currency or if the counterparties do not perform under the contracts' terms.
Foreign-denominated assets, including investment securities, and liabilities are translated into U.S. dollars at the exchange rates at period end. Purchases and sales of investment securities, income and dividends received and expenses denominated in foreign currencies are translated into U.S. dollars at the exchange rate in effect on the transaction date.
The effects of exchange rate fluctuations on investments are included with the net realized and unrealized gain (loss) on investment securities. Other foreign currency transactions resulting in realized and unrealized gain (loss) are disclosed separately.
Investment Transactions and Income. For financial reporting purposes, the Fund's investment holdings and NAV include trades executed through the end of the last business day of the period. The NAV per share for processing shareholder transactions is calculated as of the close of business of the New York Stock Exchange (NYSE), normally 4:00 p.m. Eastern time and includes trades executed through the end of the prior business day. Gains and losses on securities sold are determined on the basis of identified cost and may include proceeds received from litigation. Dividend income is recorded on the ex-dividend date, except for certain dividends from foreign securities where the ex-dividend date may have passed, which are recorded as soon as the Fund is informed of the ex-dividend date. Non-cash dividends included in dividend income, if any, are recorded at the fair market value of the securities received. Distributions received on securities that represent a return of capital or capital gain are recorded as a reduction of cost of investments and/or as a realized gain. Subsequent to ex-dividend date the Fund determines the components of these distributions, based upon receipt of tax filings or other correspondence relating to the underlying investment. Large, non-recurring dividends recognized by the Fund are presented separately on the Statement of Operations as "Special Dividends" and the impact of these dividends is presented in the Financial Highlights. Interest income and distributions from the Fidelity Central Funds are accrued as earned. Interest income includes coupon interest and amortization of
Annual Report
Notes to Financial Statements - continued
(Amounts in thousands except percentages)
3. Significant Accounting Policies - continued
Investment Transactions and Income - continued
premium and accretion of discount on debt securities. Investment income is recorded net of foreign taxes withheld where recovery of such taxes is uncertain.
Class Allocations and Expenses. Investment income, realized and unrealized capital gains and losses, common expenses of the Fund, and certain fund-level expense reductions, if any, are allocated on a pro-rata basis to each class based on the relative net assets of each class to the total net assets of the Fund. Each class differs with respect to transfer agent fees incurred. Certain expense reductions may also differ by class. Expenses directly attributable to a fund are charged to that fund. Expenses attributable to more than one fund are allocated among the respective funds on the basis of relative net assets or other appropriate methods. Expense estimates are accrued in the period to which they relate and adjustments are made when actual amounts are known.
Deferred Trustee Compensation. Under a Deferred Compensation Plan (the Plan), independent Trustees may elect to defer receipt of a portion of their annual compensation. Deferred amounts are invested in a cross-section of Fidelity funds, are marked-to-market and remain in the Fund until distributed in accordance with the Plan. The investment of deferred amounts and the offsetting payable to the Trustees are included in the accompanying Statement of Assets and Liabilities.
Income Tax Information and Distributions to Shareholders. Each year, the Fund intends to qualify as a regulated investment company under Subchapter M of the Internal Revenue Code, including distributing substantially all of its taxable income and realized gains. As a result, no provision for income taxes is required. As of July 31, 2013, the Fund did not have any unrecognized tax benefits in the financial statements; nor is the Fund aware of any tax positions for which it is reasonably possible that the total amounts of unrecognized tax benefits will significantly change in the next twelve months. The Fund files a U.S. federal tax return, in addition to state and local tax returns as required. A fund's federal income tax returns are subject to examination by the Internal Revenue Service (IRS) for a period of three fiscal years after they are filed. State and local tax returns may be subject to examination for an additional fiscal year depending on the jurisdiction. Foreign taxes are provided for based on the Fund's understanding of the tax rules and rates that exist in the foreign markets in which it invests.
Distributions are declared and recorded on the ex-dividend date. Income dividends and capital gain distributions are declared separately for each class. Income and capital gain distributions are determined in accordance with income tax regulations, which may differ from GAAP.
Annual Report
3. Significant Accounting Policies - continued
Income Tax Information and Distributions to Shareholders - continued
Capital accounts within the financial statements are adjusted for permanent book-tax differences. These adjustments have no impact on net assets or the results of operations. Temporary book-tax differences will reverse in a subsequent period.
Book-tax differences are primarily due to foreign currency transactions, futures transactions, deferred trustees compensation, capital loss carryforwards and losses deferred due to wash sales and excise tax regulations.
The federal tax cost of investment securities and unrealized appreciation (depreciation) as of period end were as follows:
Gross unrealized appreciation | $ 2,274,584 |
Gross unrealized depreciation | (393,969) |
Net unrealized appreciation (depreciation) on securities and other investments | $ 1,880,615 |
| |
Tax Cost | $ 7,522,647 |
The tax-based components of distributable earnings as of period end were as follows:
Undistributed ordinary income | $ 138,443 |
Undistributed long-term capital gain | $ 639,616 |
Net unrealized appreciation (depreciation) | $ 1,880,586 |
The tax character of distributions paid was as follows:
| July 31, 2013 | July 31, 2012 |
Ordinary Income | $ 33,821 | $ - |
Repurchase Agreements. FMR has received an Exemptive Order from the SEC which permits the Fund and other affiliated entities of FMR to transfer uninvested cash balances into joint trading accounts which are then invested in repurchase agreements. The Fund may also invest directly with institutions in repurchase agreements. Repurchase agreements may be collateralized by government or non-government securities. Upon settlement date, collateral is held in segregated accounts with custodian banks and may be obtained in the event of a default of the counterparty. The Fund monitors, on a daily basis, the value of the collateral to ensure it is at least equal to the principal amount of the repurchase agreement (including accrued interest). In the event of a default by
Annual Report
Notes to Financial Statements - continued
(Amounts in thousands except percentages)
3. Significant Accounting Policies - continued
Repurchase Agreements - continued
the counterparty, realization of the collateral proceeds could be delayed, during which time the value of the collateral may decline.
Restricted Securities. The Fund may invest in securities that are subject to legal or contractual restrictions on resale. These securities generally may be resold in transactions exempt from registration or to the public if the securities are registered. Disposal of these securities may involve time-consuming negotiations and expense, and prompt sale at an acceptable price may be difficult. Information regarding restricted securities is included at the end of the Fund's Schedule of Investments.
New Accounting Pronouncement. The Financial Accounting Standards Board issued in December 2011, Accounting Standard Update No. 2011-11, Disclosures about Offsetting Assets and Liabilities, and in January 2013, Accounting Standards Update No. 2013-1 Clarifying the Scope of Disclosures about Offsetting Assets and Liabilities. These updates create new disclosure requirements requiring entities to disclose both gross and net information for derivatives and other financial instruments that are either offset in the Statement of Assets and Liabilities or subject to an enforceable master netting arrangement or similar agreement. The disclosure requirements are effective for annual reporting periods beginning on or after January 1, 2013, and interim periods within those annual periods. Management expects that the impact of the update's adoption will be limited to additional financial statement disclosures as applicable.
4. Derivative Instruments.
Risk Exposures and the Use of Derivative Instruments. The Fund's investment objective allows the Fund to enter into various types of derivative contracts, including futures contracts. Derivatives are investments whose value is primarily derived from underlying assets, indices or reference rates and may be transacted on an exchange or over-the-counter (OTC). Derivatives may involve a future commitment to buy or sell a specified asset based on specified terms, to exchange future cash flows at periodic intervals based on a notional principal amount, or for one party to make one or more payments upon the occurrence of specified events in exchange for periodic payments from the other party.
The Fund used derivatives to increase returns and to manage exposure to certain risks as defined below. The success of any strategy involving derivatives depends on analysis of numerous economic factors, and if the strategies for investment do not work as intended, the Fund may not achieve its objectives.
Annual Report
4. Derivative Instruments - continued
Risk Exposures and the Use of Derivative Instruments - continued
The Fund's use of derivatives increased or decreased its exposure to the following risk:
Equity Risk | Equity risk relates to the fluctuations in the value of financial instruments as a result of changes in market prices (other than those arising from interest rate risk or foreign exchange risk), whether caused by factors specific to an individual investment, its issuer, or all factors affecting all instruments traded in a market or market segment. |
The Fund is also exposed to additional risks from investing in derivatives, such as liquidity risk and counterparty credit risk. Liquidity risk is the risk that the Fund will be unable to close out the derivative in the open market in a timely manner. Counterparty credit risk is the risk that the counterparty will not be able to fulfill its obligation to the Fund. Counterparty credit risk related to exchange-traded futures contracts may be mitigated by the protection provided by the exchange on which they trade.
Investing in derivatives may involve greater risks than investing in the underlying assets directly and, to varying degrees, may involve risk of loss in excess of any initial investment and collateral received and amounts recognized in the Statement of Assets and Liabilities. In addition, there may be the risk that the change in value of the derivative contract does not correspond to the change in value of the underlying instrument.
Futures Contracts. A futures contract is an agreement between two parties to buy or sell a specified underlying instrument for a fixed price at a specified future date. The Fund used futures contracts to manage its exposure to the stock market.
Upon entering into a futures contract, a fund is required to deposit either cash or securities (initial margin) with a clearing broker in an amount equal to a certain percentage of the face value of the contract. Futures contracts are marked-to-market daily and subsequent daily payments (variation margin) are made or received by a fund depending on the daily fluctuations in the value of the futures contracts and are recorded as unrealized appreciation or (depreciation). This receivable and/or payable, if any, is included in daily variation margin for derivative instruments in the Statement of Assets and Liabilities. Realized gain or (loss) is recorded upon the expiration or closing of a futures contract.
Any open futures contracts at period end are presented in the Schedule of Investments under the caption "Futures Contracts." The underlying face amount at value reflects each contract's exposure to the underlying instrument or index at period end.
During the period the Fund recognized net realized gain (loss) of $826 related to its investment in futures contracts. This amount is included in the Statement of Operations.
Annual Report
Notes to Financial Statements - continued
(Amounts in thousands except percentages)
5. Purchases and Sales of Investments.
Purchases and sales of securities, other than short-term securities, aggregated $8,614,135 and $9,279,939, respectively.
6. Fees and Other Transactions with Affiliates.
Management Fee. FMR and its affiliates provide the Fund with investment management related services for which the Fund pays a monthly management fee. The management fee is the sum of an individual fund fee rate that is based on an annual rate of .35% of the Fund's average net assets and an annualized group fee rate that averaged .26% during the period. The group fee rate is based upon the average net assets of all the mutual funds advised by FMR. The group fee rate decreases as assets under management increase and increases as assets under management decrease. In addition, the management fee is subject to a performance adjustment (up to a maximum of ±.20% of the Fund's average net assets over a 36 month performance period). The upward or downward adjustment to the management fee is based on the relative investment performance of OTC as compared to an appropriate benchmark index. For the period, the total annual management fee rate, including the performance adjustment, was .55% of the Fund's average net assets.
Transfer Agent Fees. Fidelity Investments Institutional Operations Company, Inc., (FIIOC), an affiliate of FMR, is the transfer, dividend disbursing and shareholder servicing agent for each class of the Fund. FIIOC receives account fees and asset-based fees that vary according to the account size and type of account of the shareholders of OTC. FIIOC receives an asset-based fee of Class K's average net assets. FIIOC pays for typesetting, printing and mailing of shareholder reports, except proxy statements. For the period, transfer agent fees for each class were as follows:
| Amount | % of
Average
Net Assets |
OTC | $ 10,208 | .18 |
Class K | 921 | .05 |
| $ 11,129 | |
Accounting and Security Lending Fees. Fidelity Service Company, Inc. (FSC), an affiliate of FMR, maintains the Fund's accounting records. The accounting fee is based on the level of average net assets for each month. Under a separate contract, FSC administers the security lending program. The security lending fee is based on the number and duration of lending transactions.
Brokerage Commissions. The Fund placed a portion of its portfolio transactions with brokerage firms which are affiliates of the investment adviser. Brokerage commissions are included in net realized gain (loss) and change in net unrealized appreciation
Annual Report
6. Fees and Other Transactions with Affiliates - continued
Brokerage Commissions - continued
(depreciation) in the Statement of Operations. The commissions paid to these affiliated firms were $349 for the period.
Interfund Lending Program. Pursuant to an Exemptive Order issued by the SEC, the Fund, along with other registered investment companies having management contracts with FMR, may participate in an interfund lending program. This program provides an alternative credit facility allowing the funds to borrow from, or lend money to, other participating affiliated funds. At period end, there were no interfund loans outstanding. The Fund's activity in this program during the period for which loans were outstanding was as follows:
Borrower or Lender | Average Loan
Balance | Weighted Average Interest Rate | Interest
Expense |
Borrower | $ 11,969 | .39% | $ 10 |
7. Committed Line of Credit.
The Fund participates with other funds managed by FMR or an affiliate in a $4.25 billion credit facility (the "line of credit") to be utilized for temporary or emergency purposes to fund shareholder redemptions or for other short-term liquidity purposes. The Fund has agreed to pay commitment fees on its pro-rata portion of the line of credit, which amounted to $17 and is reflected in Miscellaneous expenses on the Statement of Operations. During the period, there were no borrowings on this line of credit.
8. Security Lending.
The Fund lends portfolio securities through a lending agent from time to time in order to earn additional income. For equity securities, a lending agent is used and may loan securities to certain qualified borrowers, including Fidelity Capital Markets (FCM), a broker-dealer affiliated with the Fund. On the settlement date of the loan, the Fund receives collateral (in the form of U.S. Treasury obligations, letters of credit and/or cash) against the loaned securities and maintains collateral in an amount not less than 100% of the market value of the loaned securities during the period of the loan. The market value of the loaned securities is determined at the close of business of the Fund and any additional required collateral is delivered to the Fund on the next business day. If the borrower defaults on its obligation to return the securities loaned because of insolvency or other reasons, the Fund may apply collateral received from the borrower against the obligation. The Fund may experience delays and costs in recovering the securities loaned. Any cash collateral received is invested in the Fidelity Securities Lending Cash Central Fund. The value of loaned securities and cash collateral at period end are
Annual Report
Notes to Financial Statements - continued
(Amounts in thousands except percentages)
8. Security Lending - continued
disclosed on the Fund's Statement of Assets and Liabilities. The value of securities loaned to FCM at period end was $10,519. Security lending income represents the income earned on investing cash collateral, less rebates paid to borrowers and any lending agent fees associated with the loan, plus any premium payments received for lending certain types of securities. Security lending income is presented in the Statement of Operations as a component of income from Fidelity Central Funds, and includes $3,604 from securities loaned to FCM.
9. Bank Borrowings.
The Fund is permitted to have bank borrowings for temporary or emergency purposes to fund shareholder redemptions or for other short-term liquidity requirements. The Fund has established borrowing arrangements with certain banks. The interest rate on the borrowings is the bank's base rate, as revised from time to time. The average loan balance during the period for which loans were outstanding amounted to $27,714. The weighted average interest rate was .66%. The interest expense amounted to $1 under the bank borrowing program. At period end, there were no bank borrowings outstanding.
10. Expense Reductions.
Commissions paid to certain brokers with whom FMR places trades on behalf of the Fund include an amount in addition to trade execution, which is rebated back to the Fund to offset certain expenses. This amount totaled $1,568 for the period. In addition, through arrangements with the Fund's custodian, credits realized as a result of uninvested cash balances were used to reduce the Fund's expenses. During the period, these credits reduced the Fund's custody expenses by four hundred forty-one dollars.
In addition, FMR reimbursed a portion of the Fund's operating expenses during the period in the amount of $7.
11. Distributions to Shareholders.
Distributions to shareholders of each class were as follows:
Years ended July 31, | 2013 | 2012 |
From net investment income | | |
OTC | $ 24,686 | $ - |
Class K | 9,135 | - |
Total | $ 33,821 | $ - |
Annual Report
12. Share Transactions.
Transactions for each class of shares were as follows:
| Shares | Dollars |
Years ended July 31, | 2013 | 2012 | 2013 | 2012 |
OTC | | | | |
Shares sold | 13,349 | 24,727 | $ 888,988 | $ 1,432,210 |
Reinvestment of distributions | 400 | - | 23,934 | - |
Shares redeemed | (24,580) | (36,677) | (1,536,509) | (2,097,412) |
Net increase (decrease) | (10,831) | (11,950) | $ (623,587) | $ (665,202) |
Class K | | | | |
Shares sold | 8,116 | 15,671 | $ 517,177 | $ 918,563 |
Reinvestment of distributions | 152 | - | 9,135 | - |
Shares redeemed | (8,251) | (10,166) | (525,561) | (594,038) |
Net increase (decrease) | 17 | 5,505 | $ 751 | $ 324,525 |
13. Other.
The Fund's organizational documents provide former and current trustees and officers with a limited indemnification against liabilities arising in connection with the performance of their duties to the Fund. In the normal course of business, the Fund may also enter into contracts that provide general indemnifications. The Fund's maximum exposure under these arrangements is unknown as this would be dependent on future claims that may be made against the Fund. The risk of material loss from such claims is considered remote.
Annual Report
To the Trustees of Fidelity Securities Fund and Shareholders of Fidelity OTC Portfolio:
We have audited the accompanying statement of assets and liabilities of Fidelity OTC Portfolio (the Fund), a fund of Fidelity Securities Fund, including the schedule of investments, as of July 31, 2013, and the related statement of operations for the year then ended, the statement of changes in net assets for each of the two years in the period then ended, and the financial highlights for each of the five years in the period then ended. These financial statements and financial highlights are the responsibility of the Fund's management. Our responsibility is to express an opinion on these financial statements and financial highlights based on our audits.
We conducted our audits in accordance with the standards of the Public Company Accounting Oversight Board (United States). Those standards require that we plan and perform the audit to obtain reasonable assurance about whether the financial statements and financial highlights are free of material misstatement. The Fund is not required to have, nor were we engaged to perform, an audit of its internal control over financial reporting. Our audits included consideration of internal control over financial reporting as a basis for designing audit procedures that are appropriate in the circumstances, but not for the purpose of expressing an opinion on the effectiveness of the Fund's internal control over financial reporting. Accordingly, we express no such opinion. An audit also includes examining, on a test basis, evidence supporting the amounts and disclosures in the financial statements, assessing the accounting principles used and significant estimates made by management, as well as evaluating the overall financial statement presentation. Our procedures included confirmation of securities owned as of July 31, 2013, by correspondence with the custodians and brokers; where replies were not received from brokers, we performed other auditing procedures. We believe that our audits provide a reasonable basis for our opinion.
In our opinion, the financial statements and financial highlights referred to above present fairly, in all material respects, the financial position of Fidelity OTC Portfolio as of July 31, 2013, the results of its operations for the year then ended, the changes in its net assets for each of the two years in the period then ended, and the financial highlights for each of the five years in the period then ended, in conformity with accounting principles generally accepted in the United States of America.
DELOITTE & TOUCHE LLP
Boston, Massachusetts
September 13, 2013
Annual Report
The Trustees, Member of the Advisory Board, and executive officers of the trust and fund, as applicable, are listed below. The Board of Trustees governs the fund and is responsible for protecting the interests of shareholders. The Trustees are experienced executives who meet periodically throughout the year to oversee the fund's activities, review contractual arrangements with companies that provide services to the fund, oversee management of the risks associated with such activities and contractual arrangements, and review the fund's performance. Except for James C. Curvey, Ned C. Lautenbach, Ronald P. O'Hanley, and William S. Stavropoulos, each of the Trustees oversees 166 Fidelity funds. Mr. Curvey oversees 387 Fidelity funds. Mr. Lautenbach, Mr. O'Hanley, and Mr. Stavropoulos each oversees 230 Fidelity funds.
The Trustees hold office without limit in time except that (a) any Trustee may resign; (b) any Trustee may be removed by written instrument, signed by at least two-thirds of the number of Trustees prior to such removal; (c) any Trustee who requests to be retired or who has become incapacitated by illness or injury may be retired by written instrument signed by a majority of the other Trustees; and (d) any Trustee may be removed at any special meeting of shareholders by a two-thirds vote of the outstanding voting securities of the trust. Each Trustee who is not an interested person of the trust and the fund (as defined in the 1940 Act) (Independent Trustee), shall retire not later than the last day of the calendar year in which his or her 75th birthday occurs. The Independent Trustees may waive this mandatory retirement age policy with respect to individual Trustees. The executive officers and Advisory Board Member hold office without limit in time, except that any officer and Advisory Board Member may resign or may be removed by a vote of a majority of the Trustees at any regular meeting or any special meeting of the Trustees. Except as indicated, each individual has held the office shown or other offices in the same company for the past five years.
Experience, Skills, Attributes, and Qualifications of the Fund's Trustees. The Governance and Nominating Committee has adopted a statement of policy that describes the experience, qualifications, attributes, and skills that are necessary and desirable for potential Independent Trustee candidates (Statement of Policy). The Board believes that each Trustee satisfied at the time he or she was initially elected or appointed a Trustee, and continues to satisfy, the standards contemplated by the Statement of Policy. The Governance and Nominating Committee also engages professional search firms to help identify potential Independent Trustee candidates who have the experience, qualifications, attributes, and skills consistent with the Statement of Policy. From time to time, additional criteria based on the composition and skills of the current Independent Trustees, as well as experience or skills that may be appropriate in light of future changes to board composition, business conditions, and regulatory or other developments, have also been considered by the professional search firms and the Governance and Nominating Committee. In addition, the Board takes into account the Trustees' commitment and participation in Board and committee meetings, as well as their leadership of standing and ad hoc committees throughout their tenure.
Annual Report
Trustees and Officers - continued
In determining that a particular Trustee was and continues to be qualified to serve as a Trustee, the Board has considered a variety of criteria, none of which, in isolation, was controlling. The Board believes that, collectively, the Trustees have balanced and diverse experience, qualifications, attributes, and skills, which allow the Board to operate effectively in governing the fund and protecting the interests of shareholders. Information about the specific experience, skills, attributes, and qualifications of each Trustee, which in each case led to the Board's conclusion that the Trustee should serve (or continue to serve) as a trustee of the fund, is provided below.
Board Structure and Oversight Function. James C. Curvey is an interested person (as defined in the 1940 Act) and currently serves as Chairman. The Trustees have determined that an interested Chairman is appropriate and benefits shareholders because an interested Chairman has a personal and professional stake in the quality and continuity of services provided to the fund. Independent Trustees exercise their informed business judgment to appoint an individual of their choosing to serve as Chairman, regardless of whether the Trustee happens to be independent or a member of management. The Independent Trustees have determined that they can act independently and effectively without having an Independent Trustee serve as Chairman and that a key structural component for assuring that they are in a position to do so is for the Independent Trustees to constitute a substantial majority for the Board. The Independent Trustees also regularly meet in executive session. Ned C. Lautenbach serves as Chairman of the Independent Trustees and as such (i) acts as a liaison between the Independent Trustees and management with respect to matters important to the Independent Trustees and (ii) with management prepares agendas for Board meetings.
Fidelity funds are overseen by different Boards of Trustees. The fund's Board oversees Fidelity's equity and high income funds and another Board oversees Fidelity's investment-grade bond, money market, and asset allocation funds. The asset allocation funds may invest in Fidelity funds overseen by the fund's Board. The use of separate Boards, each with its own committee structure, allows the Trustees of each group of Fidelity funds to focus on the unique issues of the funds they oversee, including common research, investment, and operational issues. On occasion, the separate Boards establish joint committees to address issues of overlapping consequences for the Fidelity funds overseen by each Board.
The Trustees operate using a system of committees to facilitate the timely and efficient consideration of all matters of importance to the Trustees, the fund, and fund shareholders and to facilitate compliance with legal and regulatory requirements and oversight of the fund's activities and associated risks. The Board, acting through its committees, has charged FMR and its affiliates with (i) identifying events or circumstances the occurrence of which could have demonstrably adverse effects on the fund's business and/or reputation; (ii) implementing processes and controls to lessen the possibility that such events or circumstances occur or to mitigate the effects of such events or circumstances if they do occur; and (iii) creating and maintaining a system designed to evaluate continuously business and market conditions in order to facilitate the identification and implementation processes described in (i) and (ii) above. Because the day-to-day operations and activities of the fund are carried out by or through FMR, its affiliates and other service providers, the fund's exposure to risks is mitigated but not eliminated by the processes overseen by the Trustees. While each of the Board's committees has responsibility for overseeing different aspects of the fund's activities, oversight is exercised primarily through the Operations, Audit, and Compliance Committees. In addition, the Independent Trustees have worked with FMR to enhance the Board's oversight of investment and financial risks, legal and regulatory risks, technology risks, and operational risks, including the development of additional risk reporting to the Board. For example, a working group comprised of Independent Trustees and FMR has worked and continues to work to review the Fidelity funds' valuation-related activities, reporting and risk management. Appropriate personnel, including but not limited to the fund's Chief Compliance Officer (CCO), FMR's internal auditor, the independent accountants, the fund's Treasurer and portfolio management personnel, make periodic reports to the Board's committees, as appropriate, including an annual review of FMR's risk management program for the Fidelity funds. The responsibilities of each standing committee, including their oversight responsibilities, are described further under "Standing Committees of the Fund's Trustees."
Annual Report
The fund's Statement of Additional Information (SAI) includes more information about the Trustees. To request a free copy, call Fidelity at 1-800-544-8544.
Interested Trustees*:
Correspondence intended for each Trustee who is an interested person may be sent to Fidelity Investments, 245 Summer Street, Boston, Massachusetts 02210.
Name, Year of Birth; Principal Occupations and Other Relevant Experience+ |
James C. Curvey (1935) |
| Year of Election or Appointment: 2007 Mr. Curvey is Trustee and Chairman of the Board of Trustees of certain Trusts. Mr. Curvey also serves as Trustee (2007-present) of other investment companies advised by FMR. Mr. Curvey is a Director of Fidelity Investments Money Management, Inc. (2009-present), Director of Fidelity Research & Analysis Co. (2009-present) and Director of FMR and FMR Co., Inc. (2007-present). Mr. Curvey is also Vice Chairman (2007-present) and Director of FMR LLC. In addition, Mr. Curvey serves as an Overseer for the Boston Symphony Orchestra and a member of the Trustees of Villanova University. Previously, Mr. Curvey was the Vice Chairman (2006-2007) and Director (2000-2007) of FMR Corp. |
Ronald P. O'Hanley (1957) |
| Year of Election or Appointment: 2011 Mr. O'Hanley serves as a Trustee and Chairman of the Board of Trustees of other Fidelity funds (2013-present), and is Director of FMR Co., Inc. (2010-present), Director of Fidelity Investments Money Management, Inc. (2010-present), Director of Fidelity Research & Analysis Company (2010-present), President of Fidelity Asset Management and Corporate Services and a Member of Fidelity's Executive Committee (2010-present). Previously, Mr. O'Hanley served as President and Chief Executive Officer of BNY Mellon Asset Management (2007-2010). Mr. O'Hanley also served as Vice Chairman of Bank New York Mellon Corp. and a member of that firm's Executive Committee. Prior to the 2007 merger of The Bank of New York and Mellon Financial Corporation, he was Vice Chairman of Mellon Financial Corporation and President and Chief Executive Officer of Mellon Asset Management. He joined Mellon in February 1997. Mr. O'Hanley currently serves as Chairman of the Boston Public Library Foundation Board of Directors and sits on the Board of Directors of Beth Israel Deaconess Medical Center, the Board of Trustees of the Marine Biological Laboratory and the Advisory Board of the Maxwell School of Citizenship and Public Administration at Syracuse University. Mr. O'Hanley also chairs the Council on Asset Management for the Financial Services Roundtable and is a member of the Board of Directors of Institutional Investor's U.S. Institute. |
* Trustees have been determined to be "Interested Trustees" by virtue of, among other things, their affiliation with the trust or various entities under common control with FMR.
+ The information above includes each Trustee's principal occupation during the last five years and other information relating to the experience, attributes, and skills relevant to each Trustee's qualifications to serve as a Trustee, which led to the conclusion that each Trustee should serve as a Trustee for the fund.
Annual Report
Independent Trustees:
Correspondence intended for each Independent Trustee (that is, the Trustees other than the Interested Trustees) may be sent to Fidelity Investments, P.O. Box 55235, Boston, Massachusetts 02205-5235.
Name, Year of Birth; Principal Occupations and Other Relevant Experience+ |
Dennis J. Dirks (1948) |
| Year of Election or Appointment: 2005 Prior to his retirement in May 2003, Mr. Dirks was Chief Operating Officer and a member of the Board of The Depository Trust & Clearing Corporation (DTCC). He also served as President, Chief Operating Officer, and Board member of The Depository Trust Company (DTC) and President and Board member of the National Securities Clearing Corporation (NSCC). In addition, Mr. Dirks served as Chief Executive Officer and Board member of the Government Securities Clearing Corporation, Chief Executive Officer and Board member of the Mortgage-Backed Securities Clearing Corporation, as a Trustee and a member of the Finance Committee of Manhattan College (2005-2008), and as a Trustee and a member of the Finance Committee of AHRC of Nassau County (2006-2008). Mr. Dirks is a member of the Independent Directors Council (IDC) Governing Council (2010-present) and Board of Directors for The Brookville Center for Children's Services, Inc. (2009-present). |
Alan J. Lacy (1953) |
| Year of Election or Appointment: 2008 Mr. Lacy serves as Senior Adviser (2007-present) of Oak Hill Capital Partners, L.P. (private equity). Mr. Lacy also served as Chief Executive Officer (2000-2005) and Vice Chairman (2005-2006) of Sears Holdings Corporation and Sears, Roebuck and Co. (retail). In addition, Mr. Lacy serves as a member of the Board of Directors of Dave & Buster's Entertainment, Inc. (restaurant and entertainment complexes, 2010-present), Earth Fare, Inc. (retail grocery, 2012-present), The Hillman Companies, Inc. (hardware wholesalers, 2010-present), and Bristol-Myers Squibb Company (global pharmaceuticals, 2008-present). Mr. Lacy is a member of the Board of Trustees of The National Parks Conservation Association (2006-present). Previously, Mr. Lacy served as Chairman of the Board of Trustees of the National Parks Conservation Association (2008-2011) and as a member of the Board of Directors for the Western Union Company (global money transfer, 2006-2011). |
Ned C. Lautenbach (1944) |
| Year of Election or Appointment: 2000 Mr. Lautenbach is Chairman of the Independent Trustees of the Equity and High Income Funds (2006-present) and serves as a Trustee of other Fidelity funds (2013-present). Mr. Lautenbach currently serves as the Lead Director of the Eaton Corporation Board of Directors (diversified industrial, 1997-present). Mr. Lautenbach is Chairman of the Board of Directors of the Philharmonic Center for the Arts in Naples, Florida (2012-present) and a member of the Council on Foreign Relations (1994-present). Previously, Mr. Lautenbach was a Partner/Advisory Partner at Clayton, Dubilier & Rice, LLC (private equity investment, 1998-2010), as well as a Director of Sony Corporation (2006-2007). |
Joseph Mauriello (1944) |
| Year of Election or Appointment: 2008 Prior to his retirement in January 2006, Mr. Mauriello served in numerous senior management positions including Deputy Chairman and Chief Operating Officer (2004-2005), and Vice Chairman of Financial Services (2002-2004) of KPMG LLP US (professional services, 1965-2005). Mr. Mauriello currently serves as a member of the Board of Directors of XL Group plc. (global insurance and re-insurance, 2006-present). Previously, Mr. Mauriello served as a Director of the Hamilton Funds of the Bank of New York (2006-2007) and of Arcadia Resources Inc. (health care services and products, 2007-2012). |
Robert W. Selander (1950) |
| Year of Election or Appointment: 2011 Previously, Mr. Selander served as a Member of the Advisory Board of Fidelity's Equity and High Income Funds (2011), Executive Vice Chairman (2010), Chief Executive Officer (2009-2010), and President and Chief Executive Officer (1997-2009) of Mastercard, Inc. |
Cornelia M. Small (1944) |
| Year of Election or Appointment: 2005 Ms. Small is a member of the Board of Directors (2009-present) and Chair of the Investment Committee (2010-present) of the Teagle Foundation. Ms. Small also serves on the Investment Committee of the Berkshire Taconic Community Foundation (2008-present). Previously, Ms. Small served as Chairperson (2002-2008) and a member of the Investment Committee and Chairperson (2008-2012) and a member of the Board of Trustees of Smith College. In addition, Ms. Small served as Chief Investment Officer, Director of Global Equity Investments, and a member of the Board of Directors of Scudder, Stevens & Clark and Scudder Kemper Investments. |
William S. Stavropoulos (1939) |
| Year of Election or Appointment: 2002 Mr. Stavropoulos is Vice Chairman of the Independent Trustees of the Equity and High Income Funds (2006-present) and serves as a Trustee of other Fidelity funds (2013-present). Mr. Stavropoulos serves as President and Founder of the Michigan Baseball Foundation, the Great Lakes Loons (2007-present). Mr. Stavropoulos is Chairman Emeritus of the Board of Directors of The Dow Chemical Company, where he previously served in numerous senior management positions, including President, CEO (1995-2000; 2002-2004), Chairman of the Executive Committee (2000-2006), and as a member of the Board of Directors (1990-2006). Currently, Mr. Stavropoulos is Chairman of the Board of Directors of Univar Inc. (global distributor of commodity and specialty chemicals), a Director of Teradata Corporation (data warehousing and technology solutions), and Maersk Inc. (industrial conglomerate), and a member of the Advisory Board for Metalmark Capital LLC (private equity investment, 2005-present). Mr. Stavropoulos is an operating advisor to Clayton, Dubilier & Rice, LLC (private equity investment). In addition, Mr. Stavropoulos is a member of the University of Notre Dame Advisory Council for the College of Science, a Trustee of the Rollin L. Gerstacker Foundation, and a Director of the Naples Philharmonic Center for the Arts. Previously, Mr. Stavropoulos served as a Director of Chemical Financial Corporation (bank holding company, 1993-2012) and Tyco International, Ltd. (multinational manufacturing and services, 2007-2012). |
David M. Thomas (1949) |
| Year of Election or Appointment: 2008 Previously, Mr. Thomas served as Executive Chairman (2005-2006) and Chairman and Chief Executive Officer (2000-2005) of IMS Health, Inc. (pharmaceutical and healthcare information solutions), and a Director of Fortune Brands, Inc. (consumer products, 2000-2011). In addition, Mr. Thomas serves as Non-Executive Chairman of the Board of Directors of Fortune Brands Home and Security (home and security products, 2011-present), and as a member of the Board of Directors of Interpublic Group of Companies, Inc. (marketing communication, 2004-present). |
+ The information above includes each Trustee's principal occupation during the last five years and other information relating to the experience, attributes, and skills relevant to each Trustee's qualifications to serve as a Trustee, which led to the conclusion that each Trustee should serve as a Trustee for the fund.
Annual Report
Trustees and Officers - continued
Advisory Board Member and Executive Officers:
Correspondence intended for each executive officer and Peter S. Lynch may be sent to Fidelity Investments, 245 Summer Street, Boston, Massachusetts 02210.
Name, Year of Birth; Principal Occupation |
Peter S. Lynch (1944) |
| Year of Election or Appointment: 2003 Member of the Advisory Board of Fidelity's Equity and High Income Funds. Mr. Lynch is Vice Chairman and a Director of FMR and FMR Co., Inc. In addition, Mr. Lynch serves as a Trustee of Boston College and as the Chairman of the Inner-City Scholarship Fund. Previously, Mr. Lynch served on the Special Olympics International Board of Directors (1997-2006). |
Kenneth B. Robins (1969) |
| Year of Election or Appointment: 2008 President and Treasurer of Fidelity's Equity and High Income Funds. Mr. Robins also serves as President and Treasurer (2008-present) and Assistant Treasurer (2009-present) of other Fidelity funds and is an employee of Fidelity Investments (2004-present). Mr. Robins serves as Executive Vice President of Fidelity Investments Money Management, Inc. (FIMM) (2013-present). Previously, Mr. Robins served as Deputy Treasurer of the Fidelity funds (2005-2008) and Treasurer and Chief Financial Officer of The North Carolina Capital Management Trust: Cash and Term Portfolios (2006-2008). |
Bruce T. Herring (1965) |
| Year of Election or Appointment: 2006 Vice President of certain Equity Funds. Mr. Herring also serves as Vice President of other Fidelity funds (2013-present), Chief Investment Officer of Fidelity Global Asset Allocation (GAA) (2013-present), Chief Investment Officer and Director of Fidelity Management & Research (U.K.) Inc. (2010-present), Group Chief Investment Officer of FMR, and President of Fidelity Research & Analysis Company (2010-present). Previously, Mr. Herring served as Vice President (2005-2006) and Senior Vice President (2006-2007) of Fidelity Management & Research Company, Vice President of FMR Co., Inc. (2001-2007) and as a portfolio manager for Fidelity U.S. Equity Funds. |
Brian B. Hogan (1964) |
| Year of Election or Appointment: 2009 Vice President of Equity and High Income Funds. Mr. Hogan also serves as Vice President of other Fidelity funds (2009-present) and President of FMR's Equity Division (2009-present). Previously, Mr. Hogan served as Senior Vice President, Equity Research of FMR (2006-2009) and as a portfolio manager. |
Scott C. Goebel (1968) |
| Year of Election or Appointment: 2008 Secretary and Chief Legal Officer (CLO) of the Fidelity funds. Mr. Goebel also serves as Secretary of Fidelity Investments Money Management, Inc. (FIMM) (2010-present) and Fidelity Research and Analysis Company (FRAC) (2010-present); Secretary and CLO of The North Carolina Capital Management Trust: Cash and Term Portfolios (2008-present); General Counsel, Secretary, and Senior Vice President of FMR (2008-present) and FMR Co., Inc. (2008-present); employed by FMR LLC or an affiliate (2001-present); Chief Legal Officer of Fidelity Management & Research (Hong Kong) Limited (2008-present) and Assistant Secretary of Fidelity Management & Research (Japan) Inc. (2008-present), and Fidelity Management & Research (U.K.) Inc. (2008-present). Previously, Mr. Goebel served as Assistant Secretary of FIMM (2008-2010), FRAC (2008-2010), and the Funds (2007-2008) and as Vice President and Secretary of Fidelity Distributors Corporation (FDC) (2005-2007). |
William C. Coffey (1969) |
| Year of Election or Appointment: 2009 Assistant Secretary of Fidelity's Equity and High Income Funds. Mr. Coffey also serves as Assistant Secretary of other Fidelity funds (2009-present), Senior Vice President and Deputy General Counsel of FMR LLC (2010-present), and is an employee of Fidelity Investments. Previously, Mr. Coffey served as Vice President and Associate General Counsel of FMR LLC (2005-2009). |
Elizabeth Paige Baumann (1968) |
| Year of Election or Appointment: 2012 Anti-Money Laundering (AML) Officer of the Fidelity funds. Ms. Baumann also serves as AML Officer of The North Carolina Capital Management Trust: Cash and Term Portfolios (2012-present), Chief AML Officer of FMR LLC (2012-present), and is an employee of Fidelity Investments. Previously, Ms. Baumann served as Vice President and Deputy Anti-Money Laundering Officer (2007-2012). |
Christine Reynolds (1958) |
| Year of Election or Appointment: 2008 Chief Financial Officer of the Fidelity funds. Ms. Reynolds became President of Fidelity Pricing and Cash Management Services (FPCMS) in August 2008. Ms. Reynolds served as Chief Operating Officer of FPCMS (2007-2008). Previously, Ms. Reynolds served as President, Treasurer, and Anti-Money Laundering officer of the Fidelity funds (2004-2007). |
Joseph A. Hanlon (1968) |
| Year of Election or Appointment: 2012 Chief Compliance Officer of Fidelity's Equity and High Income Funds. Mr. Hanlon also serves as Chief Compliance Officer of other Fidelity funds (2012-present). Mr. Hanlon serves as Compliance Officer of FMR, FMR Co., Inc., Fidelity Investments Money Management, Inc. (FIMM), Fidelity Research and Analysis Company (FRAC), and Fidelity Management & Research (Hong Kong) (2009-present), as Senior Vice President of the Fidelity Asset Management Division (2009-present), and is an employee of Fidelity Investments. Previously, Mr. Hanlon served as Compliance Officer of Fidelity Management & Research (Japan) Inc. (2009-
2013), Strategic Advisers, Inc. (2009-2013), and Fidelity Management & Research (U.K.) Inc. (2009-2013). |
Joseph F. Zambello (1957) |
| Year of Election or Appointment: 2011 Deputy Treasurer of the Fidelity funds. Mr. Zambello is an employee of Fidelity Investments. Previously, Mr. Zambello served as Vice President of FMR's Program Management Group (2009-2011) and Vice President of the Transfer Agent Oversight Group (2005-2009). |
Adrien E. Deberghes (1967) |
| Year of Election or Appointment: 2008 Deputy Treasurer of Fidelity's Equity and High Income Funds. Mr. Deberghes also serves as Vice President (2011-present), Deputy Treasurer (2008-present), and Assistant Treasurer (2010-present) of other Fidelity funds, and is an employee of Fidelity Investments (2008-
present). Previously, Mr. Deberghes served as Senior Vice President of Mutual Fund Administration at State Street Corporation (2007-2008), Senior Director of Mutual Fund Administration at Investors Bank & Trust (2005-2007), and Director of Finance for Dunkin' Brands (2000-2005). |
Stephen Sadoski (1971) |
| Year of Election or Appointment: 2012 Deputy Treasurer of Fidelity's Equity and High Income Funds. Mr. Sadoski also serves as Deputy Treasurer of other Fidelity funds (2012-present) and is an employee of Fidelity Investments (2012-present). Previously, Mr. Sadoski served as Assistant Treasurer of Fidelity's Fixed Income and Asset Allocation Funds (2012-2013), an assistant chief accountant in the Division of Investment Management of the Securities and Exchange Commission (SEC) (2009-2012) and as a senior manager at Deloitte & Touche LLP (1997-2009). |
Stacie M. Smith (1974) |
| Year of Election or Appointment: 2013 Deputy Treasurer of Fidelity's Equity and High Income Funds. Ms. Smith also serves as Deputy Treasurer of other Fidelity funds (2013-present) and is an employee of Fidelity Investments (2009-present). Previously, Ms. Smith served as Senior Audit Manager of Ernst & Young LLP (1996-2009). |
Stephanie J. Dorsey (1969) |
| Year of Election or Appointment: 2010 Assistant Treasurer of Fidelity's Equity and High Income Funds. Ms. Dorsey also serves as President and Treasurer (2013-present) and Assistant Treasurer (2010-present) of other Fidelity funds, Treasurer and Chief Financial Officer of The North Carolina Capital Management Trust: Cash and Term Portfolios (2013-present), and is an employee of Fidelity Investments (2008-present). Previously, Ms. Dorsey served as Deputy Treasurer of Fidelity's Fixed Income and Asset Allocation Funds (2008-2013), Treasurer (2004-2008) of the JPMorgan Mutual Funds and Vice President (2004-2008) of JPMorgan Chase Bank. |
Gary W. Ryan (1958) |
| Year of Election or Appointment: 2005 Assistant Treasurer of the Fidelity funds. Mr. Ryan is an employee of Fidelity Investments. Previously, Mr. Ryan served as Vice President of Fund Reporting in Fidelity Pricing and Cash Management Services (FPCMS) (1999-2005). |
Jonathan Davis (1968) |
| Year of Election or Appointment: 2010 Assistant Treasurer of the Fidelity funds. Mr. Davis is also Assistant Treasurer of Fidelity Rutland Square Trust II and Fidelity Commonwealth Trust II. Mr. Davis is an employee of Fidelity Investments. Previously, Mr. Davis served as Vice President and Associate General Counsel of FMR LLC (2003-2010). |
Annual Report
The Board of Trustees of Fidelity OTC Portfolio voted to pay to shareholders of record at the opening of business on record date, the following distributions per share derived from capital gains realized from sales of portfolio securities; and dividends derived from net investment income:
| Pay Date | Record Date | Dividends | Capital Gains |
OTC Portfolio | 09/09/13 | 09/06/13 | $0.050 | $6.680 |
The fund hereby designates as a capital gain dividend with respect to the taxable year ended July 31, 2013, $639,615,759 or, if subsequently determined to be different, the net capital gain of such year.
OTC Portfolio designates 100% of the dividends distributed during the fiscal year as qualifying for the dividends-received deduction for corporate shareholders.
OTC Portfolio designates 100% of the dividends distributed during the fiscal year as amounts which can be taken into account as a dividend for the purposes of the maximum rate under section 1(h)(11) of the Internal Revenue Code.
The fund will notify shareholders in January 2014 of amounts for use in preparing 2013 income tax returns.
Annual Report
Board Approval of Investment Advisory Contracts and Management Fees
Fidelity OTC Portfolio
Each year, the Board of Trustees, including the Independent Trustees (together, the Board), votes on the renewal of the management contract and sub-advisory agreements (together, the Advisory Contracts) for the fund. The Board, assisted by the advice of fund counsel and Independent Trustees' counsel, requests and considers a broad range of information relevant to the renewal of the Advisory Contracts throughout the year.
The Board meets regularly and, at each of its meetings, covers an extensive agenda of topics and materials and considers factors that are relevant to its annual consideration of the renewal of the fund's Advisory Contracts, including the services and support provided to the fund and its shareholders. The Board has established various standing committees, each composed of and chaired by Independent Trustees with varying backgrounds, to which the Board has assigned specific subject matter responsibilities in order to enhance effective decision-making by the Board. The Board, acting directly and through its Committees, requests and receives information concerning the annual consideration of the renewal of the fund's Advisory Contracts. The Board also meets as needed to consider matters specifically related to the Board's annual consideration of the renewal of Advisory Contracts. Members of the Board may also meet with trustees of other Fidelity funds through ad hoc joint committees to discuss certain matters relevant to the Fidelity funds.
At its July 2013 meeting, the Board, including the Independent Trustees, unanimously determined to renew the fund's Advisory Contracts. In reaching its determination, the Board considered all factors it believed relevant, including (i) the nature, extent, and quality of the services to be provided to the fund and its shareholders (including the investment performance of the fund); (ii) the competitiveness of the fund's management fee and total expense ratio relative to peer funds; (iii) the total costs of the services to be provided by and the profits to be realized by Fidelity from its relationship with the fund; (iv) the extent to which economies of scale exist and would be realized as the fund grows; and (v) whether fee levels reflect these economies of scale, if any, for the benefit of fund shareholders.
In considering whether to renew the Advisory Contracts for the fund, the Board reached a determination, with the assistance of fund counsel and Independent Trustees' counsel and through the exercise of its business judgment, that the renewal of the Advisory Contracts was in the best interests of the fund and its shareholders and that the compensation payable under the Advisory Contracts was fair and reasonable. The Board's decision to renew the Advisory Contracts was not based on any single factor, but rather was based on a comprehensive consideration of all the information provided to the Board at its meetings throughout the year. The Board, in reaching its determination to renew the Advisory Contracts, was aware that shareholders in the fund have a broad range of investment choices available to them, including a wide choice among mutual funds offered by Fidelity's competitors, and that the fund's shareholders, who have the opportunity to review and weigh the disclosure provided by the fund in its prospectus and other public disclosures, have chosen to invest in this fund, which is a part of the Fidelity family of funds.
Annual Report
Board Approval of Investment Advisory Contracts and
Management Fees - continued
Nature, Extent, and Quality of Services Provided. The Board considered the staffing within the investment adviser, Fidelity Management & Research Company (FMR), and the sub-advisers (together, the Investment Advisers) as it relates to the fund, including the backgrounds of the fund's investment personnel, and also considered the fund's investment objective, strategies, and related investment philosophy. The Independent Trustees also had discussions with senior management of Fidelity's investment operations and investment groups. The Board considered the structure of the portfolio manager compensation program and whether this structure provides appropriate incentives to act in the best interests of the fund.
Resources Dedicated to Investment Management and Support Services. The Board and the Fund Oversight and Research Committees reviewed the general qualifications and capabilities of the Investment Advisers' investment staff, including its size, education, experience, and resources, as well as the Investment Advisers' approach to recruiting, training, managing, and compensating investment personnel. The Board noted that FMR has continued to increase the resources devoted to non-U.S. offices, including expansion of Fidelity's global investment organization. The Board also noted that Fidelity's analysts have extensive resources, tools and capabilities that allow them to conduct sophisticated quantitative and fundamental analysis, as well as credit analysis of issuers, counterparties and guarantors. Further, the Board believes that Fidelity's investment professionals have sufficient access to global information and data so as to provide competitive investment results over time, and that those professionals also have access to sophisticated tools that permit them to assess portfolio construction and risk and performance attribution characteristics continuously, as well as to transmit new information and research conclusions rapidly around the world. Additionally, in its deliberations, the Board considered the Investment Advisers' trading and risk management capabilities and resources, which are an integral part of the investment management process.
Shareholder and Administrative Services. The Board considered (i) the nature, extent, quality, and cost of advisory, administrative, and shareholder services performed by the Investment Advisers and their affiliates under the Advisory Contracts and under separate agreements covering transfer agency, pricing and bookkeeping, and securities lending services for the fund; (ii) the nature and extent of the supervision of third party service providers, principally custodians and subcustodians; and (iii) the resources devoted to, and the record of compliance with, the fund's compliance policies and procedures. The Board also reviewed the allocation of fund brokerage, including allocations to brokers affiliated with the Investment Advisers, the use of brokerage commissions to pay fund expenses, and the use of "soft" commission dollars to pay for research services.
Annual Report
The Board noted that the growth of fund assets over time across the complex allows Fidelity to reinvest in the development of services designed to enhance the value or convenience of the Fidelity funds as investment vehicles. These services include 24-hour access to account information and market information through telephone representatives and over the Internet, investor education materials and asset allocation tools, and the expanded availability of Fidelity Investor Centers.
Investment in a Large Fund Family. The Board considered the benefits to shareholders of investing in a Fidelity fund, including the benefits of investing in a fund that is part of a large family of funds offering a variety of investment disciplines and providing a large variety of mutual fund investor services. The Board noted that Fidelity had taken, or had made recommendations that resulted in the Fidelity funds taking, a number of actions over the previous year that benefited particular funds, including (i) continuing to dedicate additional resources to investment research and to the support of the senior management team that oversees asset management; (ii) persisting in efforts to enhance Fidelity's global research capabilities; (iii) launching new funds and making other enhancements to meet client needs for global and income-oriented solutions; (iv) continuing to launch dedicated lower cost underlying funds to meet portfolio construction needs related to expanding underlying fund options for Fidelity funds of funds, specifically for the Freedom Fund product lines; (v) rationalizing product lines and gaining increased efficiencies through the mergers of several funds into other funds; (vi) strengthening Fidelity's index fund offerings by reducing investment minimums and adopting or lowering existing expense caps for certain funds and classes; (vii) enhancing Global Asset Allocation product offerings by launching new funds and strategies, including "open architecture" target date funds that utilize affiliated and unaffiliated sub-advisers; (viii) modifying the eligibility criteria for Institutional Class shares of Advisor funds to increase their marketability to a portion of the defined contribution plan market; (ix) creating a new low-cost retirement share class for certain Advisor funds to appeal to large retirement plans; (x) transitioning the management of certain Fidelity commodity funds to Geode Capital Management LLC, a registered commodity pool operator, while retaining administrative responsibilities for the funds; (xi) reorganizing a number of funds; and (xii) taking steps toward establishing a new Fidelity adviser to manage sector-based funds and products.
Investment Performance. The Board considered whether the fund has operated in accordance with its investment objective, as well as its record of compliance with its investment restrictions and its performance history.
The Board took into account discussions with the Investment Advisers about fund investment performance that occur at Board meetings throughout the year. In this regard the Board noted that as part of regularly scheduled fund reviews and other reports to the Board on fund performance, the Board periodically considers annualized return information for the fund, for different time periods, measured against a securities market index ("benchmark index") and a peer group of mutual funds with similar objectives ("peer group"). In its evaluation of fund investment performance, the Board gave particular attention to information indicating changes in performance of certain Fidelity funds for specific time periods and the Investment Advisers' explanations for any overperformance or, in the case of the fund, underperformance.
Annual Report
Board Approval of Investment Advisory Contracts and
Management Fees - continued
In addition to reviewing absolute and relative fund performance, the Independent Trustees periodically consider the appropriateness of fund performance metrics in evaluating the results achieved. In general, the Independent Trustees believe that fund performance should be evaluated based on net performance (after fees and expenses) of both the highest performing and lowest performing classes, where applicable, compared to appropriate benchmark indices, over appropriate time periods which may include full market cycles, and compared to peer groups, as applicable, over the same periods, taking into account relevant factors including the following: general market conditions; issuer-specific information; tactical opportunities for investment; and fund cash flows and other factors.
The Independent Trustees recognize that shareholders evaluate performance on a net basis over their own holding periods, for which one-, three-, and five-year periods are used as a proxy. For this reason, the performance information reviewed by the Board also included net cumulative calendar year total return information for the fund and an appropriate benchmark index for the most recent one-, three-, and five-year periods, as shown below. A peer group comparison is not shown below.
Annual Report
Fidelity OTC Portfolio

The Board has discussed the fund's underperformance with FMR and has engaged with FMR to consider what steps might be taken to remediate the fund's underperformance.
The Board also considered that the fund's management fee is subject to upward or downward adjustment depending upon whether, and to what extent, the fund's investment performance for the performance period exceeds, or is exceeded by, a securities index, thus leading to a performance adjustment for the same period. The Board noted that the performance adjustment provides FMR with a strong economic incentive to seek to achieve superior performance for the fund's shareholders and helps to more closely align the interests of FMR and the fund's shareholders.
Based on its review, the Board concluded that the nature, extent, and quality of services provided to the fund under the Advisory Contracts should benefit the fund's shareholders.
Competitiveness of Management Fee and Total Expense Ratio. The Board considered the fund's management fee and total expense ratio compared to "mapped groups" of competitive funds and classes. Fidelity creates "mapped groups" by combining similar Lipper investment objective categories that have comparable management fee characteristics. Combining Lipper investment objective categories aids the Board's management fee and total expense ratio comparisons by broadening the competitive group used for comparison and by reducing the number of universes to which various Fidelity funds are compared.
Annual Report
Board Approval of Investment Advisory Contracts and
Management Fees - continued
Management Fee. The Board considered two proprietary management fee comparisons for the 12-month periods shown in the chart below. The group of Lipper funds used by the Board for management fee comparisons is referred to below as the "Total Mapped Group." The Total Mapped Group comparison focuses on a fund's standing in terms of gross management fees before expense reimbursements or caps, and without giving effect to the fund's performance adjustment, relative to the total universe of funds with comparable investment mandates, regardless of whether their management fee structures also are comparable. Funds with comparable investment mandates offer exposure to similar types of securities. Funds with comparable management fee structures have similar management fee contractual arrangements (e.g., flat rate charged for advisory services, all-inclusive fee rate, etc.). "TMG %" represents the percentage of funds in the Total Mapped Group that had management fees that were lower than the fund's. For example, a TMG % of 18% means that 82% of the funds in the Total Mapped Group had higher management fees than the fund. The "Asset-Size Peer Group" (ASPG) comparison focuses on a fund's standing relative to a subset of non-Fidelity funds within the Total Mapped Group that are similar in size and management fee structure. The ASPG represents at least 15% of the funds in the Total Mapped Group with comparable asset size and management fee structures, subject to a minimum of 50 funds (or all funds in the Total Mapped Group if fewer than 50). Additional information, such as the ASPG quartile in which the fund's management fee ranked and the impact of the fund's performance adjustment, is also included in the chart and considered by the Board.
Fidelity OTC Portfolio
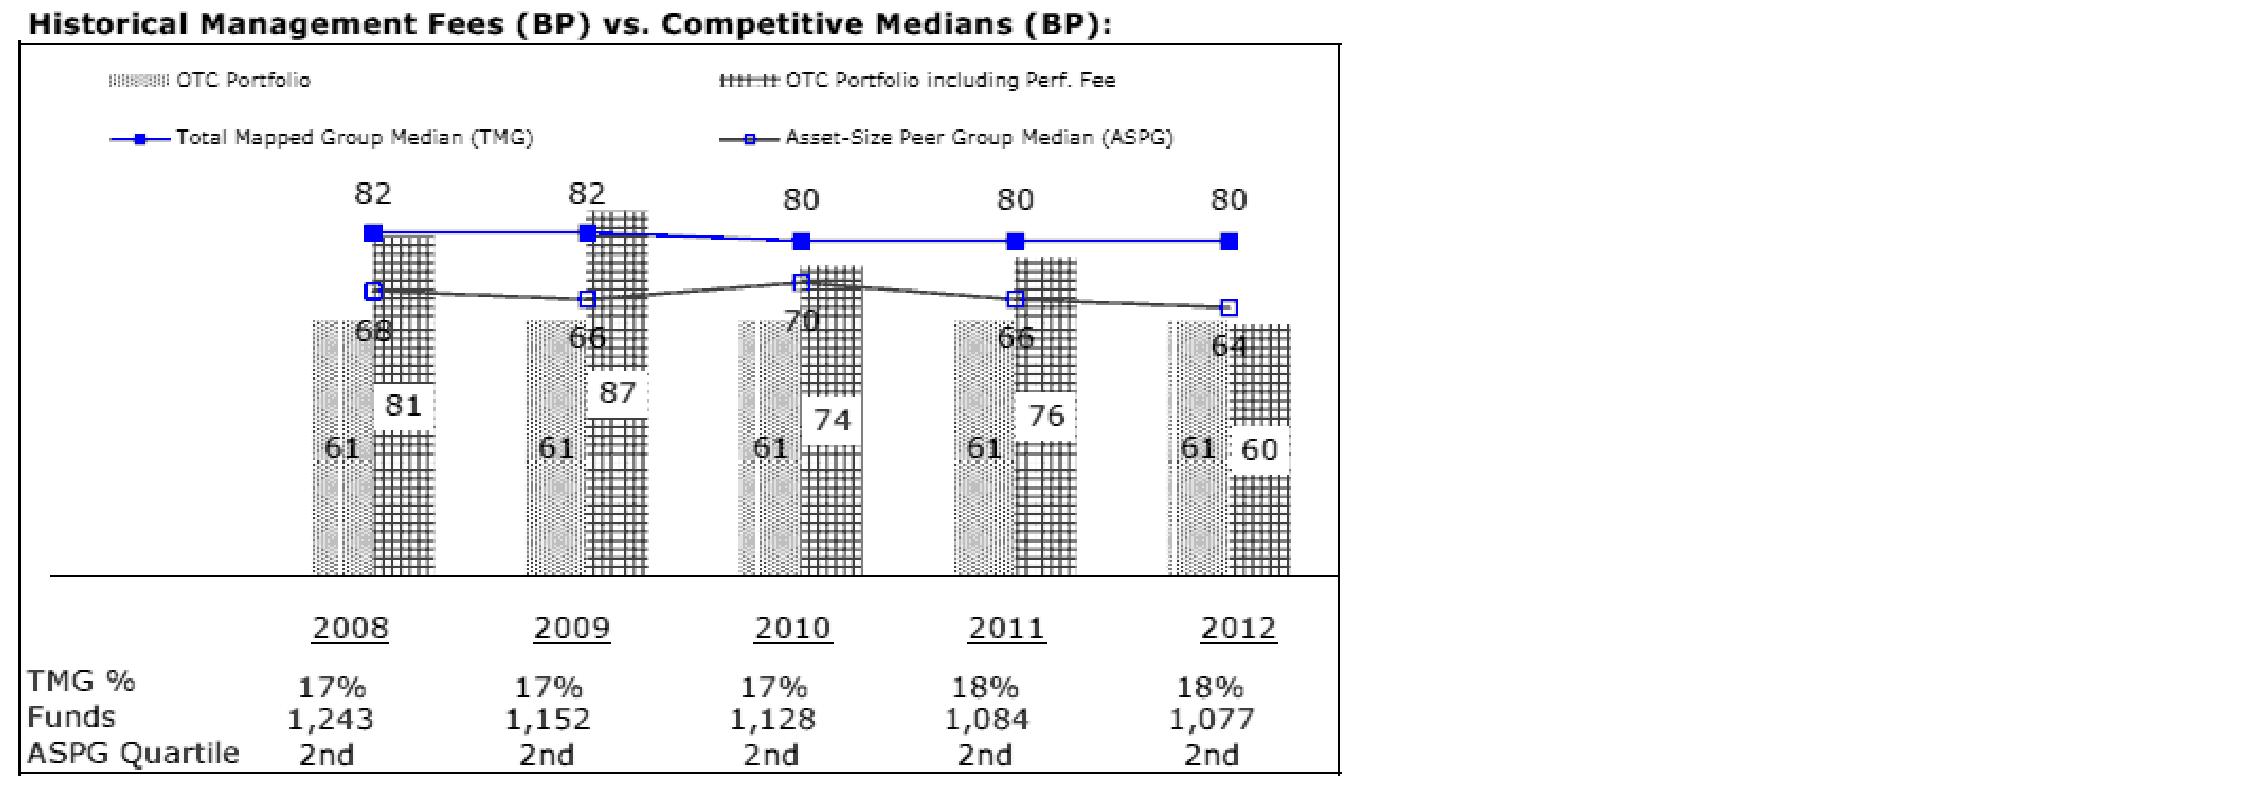
The Board noted that the fund's management fee ranked below the median of its Total Mapped Group and below the median of its ASPG for 2012. The Board also noted the effect of the fund's negative performance adjustment on the fund's management fee ranking.
Annual Report
Based on its review, the Board concluded that the fund's management fee is fair and reasonable in light of the services that the fund receives and the other factors considered.
Total Expense Ratio. In its review of each class's total expense ratio, the Board considered the fund's management fee as well as other fund or class expenses, as applicable, such as transfer agent fees, pricing and bookkeeping fees, and custodial, legal, and audit fees. The Board also noted the effects of any waivers and reimbursements on fees and expenses, as well as the impact of the fund's performance adjustment. As part of its review, the Board also considered the current and historical total expense ratios of each class of the fund compared to competitive fund median expenses. Each class of the fund is compared to those funds and classes in the Total Mapped Group (used by the Board for management fee comparisons) that have a similar sales load structure.
The Board noted that the total expense ratio of each class ranked below its competitive median for 2012.
Fees Charged to Other Fidelity Clients. The Board also considered Fidelity fee structures and other information with respect to clients of FMR and its affiliates, such as other mutual funds advised or subadvised by FMR or its affiliates, pension plan clients, and other institutional clients. The Board noted the findings of the 2013 ad hoc joint committee (created with the board of other Fidelity funds), which reviewed and compared Fidelity's institutional investment advisory business with its business of providing services to the Fidelity funds, including the differences in services provided, fees charged, and costs incurred, as well as competition in their respective marketplaces.
Based on its review of total expense ratios and fees charged to other Fidelity clients, the Board concluded that the total expense ratio of each class of the fund was reasonable in light of the services that the fund and its shareholders receive and the other factors considered.
Costs of the Services and Profitability. The Board considered the revenues earned and the expenses incurred by Fidelity in conducting the business of developing, marketing, distributing, managing, administering and servicing the fund and servicing the fund's shareholders. The Board also considered the level of Fidelity's profits in respect of all the Fidelity funds.
On an annual basis, FMR presents to the Board Fidelity's profitability for the fund. Fidelity calculates the profitability for each fund, as well as aggregate profitability for groups of Fidelity funds and all Fidelity funds, using a series of detailed revenue and cost allocation methodologies which originate with the books and records of Fidelity on which Fidelity's audited financial statements are based. The Audit Committee of the Board reviews any significant changes from the prior year's methodologies.
Annual Report
Board Approval of Investment Advisory Contracts and
Management Fees - continued
PricewaterhouseCoopers LLP (PwC), independent registered public accounting firm and auditor to Fidelity and certain Fidelity funds, has been engaged annually by the Board as part of the Board's assessment of Fidelity's profitability analysis. PwC's engagement includes the review and assessment of the methodologies used by Fidelity in determining the revenues and expenses attributable to Fidelity's mutual fund business, and completion of agreed-upon procedures surrounding the mathematical accuracy of fund profitability and its conformity to allocation methodologies. After considering PwC's reports issued under the engagement and information provided by Fidelity, the Board concluded that while other allocation methods may also be reasonable, Fidelity's profitability methodologies are reasonable in all material respects.
The Board also reviewed Fidelity's non-fund businesses and fall-out benefits related to the mutual fund business as well as cases where Fidelity's affiliates may benefit from or be related to the fund's business.
The Board considered the costs of the services provided by and the profits realized by Fidelity in connection with the operation of the fund and was satisfied that the profitability was not excessive in the circumstances.
Economies of Scale. The Board considered whether there have been economies of scale in respect of the management of the Fidelity funds, whether the Fidelity funds (including the fund) have appropriately benefited from any such economies of scale, and whether there is potential for realization of any further economies of scale. The Board considered the extent to which the fund will benefit from economies of scale through increased services to the fund, through waivers or reimbursements, or through fee or expense reductions. The Board also noted that in 2009, it and the board of other Fidelity funds created an ad hoc committee (the Economies of Scale Committee) to analyze whether FMR attains economies of scale in respect of the management and servicing of the Fidelity funds, whether the Fidelity funds have appropriately benefited from such economies of scale, and whether there is potential for realization of any further economies of scale.
The Board recognized that the fund's management contract incorporates a "group fee" structure, which provides for lower group fee rates as total fund assets under FMR's management increase, and for higher group fee rates as total fund assets under FMR's management decrease. FMR calculates the group fee rates based on a tiered asset "breakpoint" schedule that varies based on asset class. The Board considered that the group fee is designed to deliver the benefits of economies of scale to fund shareholders when total Fidelity fund assets increase, even if assets of any particular fund are unchanged or have declined, because some portion of Fidelity's costs are attributable to services provided to all Fidelity funds, and all funds benefit if those costs can be allocated among more assets. The Board concluded that, given the group fee structure, fund shareholders will benefit from lower management fees as assets under FMR's management increase at the fund complex level, regardless of whether Fidelity achieves any such economies of scale.
Annual Report
The Board concluded, taking into account the analysis of the Economies of Scale Committee, that economies of scale, if any, are being appropriately shared between fund shareholders and Fidelity.
Amendment to Description of Group Fee Rate. At its July 2013 meeting, the Board voted to approve an amendment to the fund's management contract to modify the description of the "group fee rate" effective August 1, 2013. The Board noted that under the prior description in the contract, the group fee rate was based on the average net assets of all registered investment companies with which FMR has management contracts. Under the contract's tiered asset breakpoint schedule, the group fee rate is lower as total fund assets under FMR's management increase, and higher as total fund assets under FMR's management decrease. The Board considered that the prior description would have excluded the assets of 64 Fidelity sector funds from the group fee rate calculation once Fidelity SelectCo LLC, an affiliate of FMR, assumed management responsibilities for those funds. The Board noted that modifying the description of the group fee rate to continue to include the assets of those 64 funds for purposes of determining group fee rate breakpoints would avoid an immediate adverse impact on the group fee rate for any fund.
Additional Information Requested by the Board. In order to develop fully the factual basis for consideration of the Fidelity funds' Advisory Contracts, the Board requested and received additional information on certain topics, including: (i) fund performance trends and Fidelity's long-term strategies for certain funds; (ii) the potential to further rationalize the Fidelity fund lineup with the possibility of achieving savings for the funds and Fidelity; (iii) the methodology with respect to competitive fund data and peer group classifications; (iv) the arrangements with, and performance of, certain sub-advisers on behalf of the Fidelity funds, as well as certain proposed participating affiliate arrangements; (v) the realization of fall-out benefits in certain Fidelity business units; (vi) Fidelity's group fee structures, including the rationale for the individual fee rates of certain categories of funds and the definition of group assets; (vii) trends regarding industry use of performance fee structures and the performance adjustment methodologies applicable to the Fidelity funds; (viii) additional competitive analysis regarding the total expenses for certain classes; and (ix) fund profitability methodology, including Fidelity's cost allocation methodology, and the impact of certain factors on fund profitability results.
Annual Report
Board Approval of Investment Advisory Contracts and
Management Fees - continued
Based on its evaluation of all of the conclusions noted above, and after considering all factors it believed relevant, the Board ultimately concluded that the advisory fee structures are fair and reasonable, and that the fund's Advisory Contracts should be renewed.
Annual Report
Investment Adviser
Fidelity Management & Research Company
Boston, MA
Investment Sub-Advisers
FMR Co., Inc.
Fidelity Management & Research
(U.K.) Inc.
Fidelity Management & Research
(Hong Kong) Limited
Fidelity Management & Research
(Japan) Inc.
General Distributor
Fidelity Distributors Corporation
Smithfield, RI
Transfer and Service Agents
Fidelity Investments Institutional
Operations Company, Inc.
Boston, MA
Fidelity Service Company, Inc.
Boston, MA
Custodian
The Northern Trust Company
Chicago, IL
The Fidelity Telephone Connection
Mutual Fund 24-Hour Service
Exchanges/Redemptions
and Account Assistance 1-800-544-6666
Product Information 1-800-544-6666
Retirement Accounts 1-800-544-4774
(8 a.m. - 9 p.m.)
TDD Service 1-800-544-0118
for the deaf and hearing impaired
(9 a.m. - 9 p.m. Eastern time)
Fidelity Automated Service
Telephone (FAST®)
1-800-544-5555
Automated line for quickest service
(Fidelity Investment logo)(registered trademark)
Corporate Headquarters
245 Summer St., Boston, MA 02210
www.fidelity.com
OTC-UANN-0913
1.789250.110
Fidelity®
OTC
Portfolio -
Class K
Annual Report
July 31, 2013
(Fidelity Cover Art)
Contents
Performance | (Click Here) | How the fund has done over time. |
Management's Discussion of Fund Performance | (Click Here) | The Portfolio Manager's review of fund performance and strategy. |
Shareholder Expense Example | (Click Here) | An example of shareholder expenses. |
Investment Changes | (Click Here) | A summary of major shifts in the fund's investments over the past six months. |
Investments | (Click Here) | A complete list of the fund's investments with their market values. |
Financial Statements | (Click Here) | Statements of assets and liabilities, operations, and changes in net assets, as well as financial highlights. |
Notes | (Click Here) | Notes to the financial statements. |
Report of Independent Registered Public Accounting Firm | (Click Here) | |
Trustees and Officers | (Click Here) | |
Distributions | (Click Here) | |
Board Approval of Investment Advisory Contracts and Management Fees | (Click Here) | |
To view a fund's proxy voting guidelines and proxy voting record for the 12-month period ended June 30, visit http://www.fidelity.com/proxyvotingresults or visit the Securities and Exchange Commission's (SEC) web site at http://www.sec.gov. You may also call 1-800-835-5092 to request a free copy of the proxy voting guidelines.
Standard & Poor's, S&P and S&P 500 are registered service marks of The McGraw-Hill Companies, Inc. and have been licensed for use by Fidelity Distributors Corporation.
Other third-party marks appearing herein are the property of their respective owners.
All other marks appearing herein are registered or unregistered trademarks or service marks of FMR LLC or an affiliated company. © 2013 FMR LLC. All rights reserved.
Annual Report
This report and the financial statements contained herein are submitted for the general information of the shareholders of the fund. This report is not authorized for distribution to prospective investors in the fund unless preceded or accompanied by an effective prospectus.
A fund files its complete schedule of portfolio holdings with the SEC for the first and third quarters of each fiscal year on Form N-Q. Forms N-Q are available on the SEC's web site at http://www.sec.gov. A fund's Forms N-Q may be reviewed and copied at the SEC's Public Reference Room in Washington, DC. Information regarding the operation of the SEC's Public Reference Room may be obtained by calling 1-800-SEC-0330. For a complete list of a fund's portfolio holdings, view the most recent holdings listing, semiannual report, or annual report on Fidelity's web site at http://www.fidelity.com, http://www.advisor.fidelity.com, or http://www.401k.com, as applicable.
NOT FDIC INSURED • MAY LOSE VALUE • NO BANK GUARANTEE
Neither the fund nor Fidelity Distributors Corporation is a bank.
Annual Report
Average annual total return reflects the change in the value of an investment, assuming reinvestment of the class' distributions from dividend income and capital gains (the profits earned upon the sale of securities that have grown in value, if any) and assuming a constant rate of performance each year. The $10,000 table and the fund's returns do not reflect the deduction of taxes that a shareholder would pay on fund distributions or the redemption of fund shares. During periods of reimbursement by Fidelity, a fund's total return will be greater than it would be had the reimbursement not occurred. How a fund did yesterday is no guarantee of how it will do tomorrow.
Average Annual Total Returns
Periods ended July 31, 2013 | Past 1
year | Past 5
years | Past 10
years |
Class KA | 38.11% | 12.36% | 11.07% |
A The initial offering of Class K shares took place on May 9, 2008. Returns prior to May 9, 2008, are those of Fidelity® OTC Portfolio, the original class of the fund.
$10,000 Over 10 Years
Let's say hypothetically that $10,000 was invested in Fidelity® OTC Portfolio - Class K on July 31, 2003. The chart shows how the value of your investment would have changed, and also shows how the Nasdaq Composite Index® performed over the same period. The initial offering of Class K took place on May 9, 2008. See above for additional information regarding the performance of Class K.
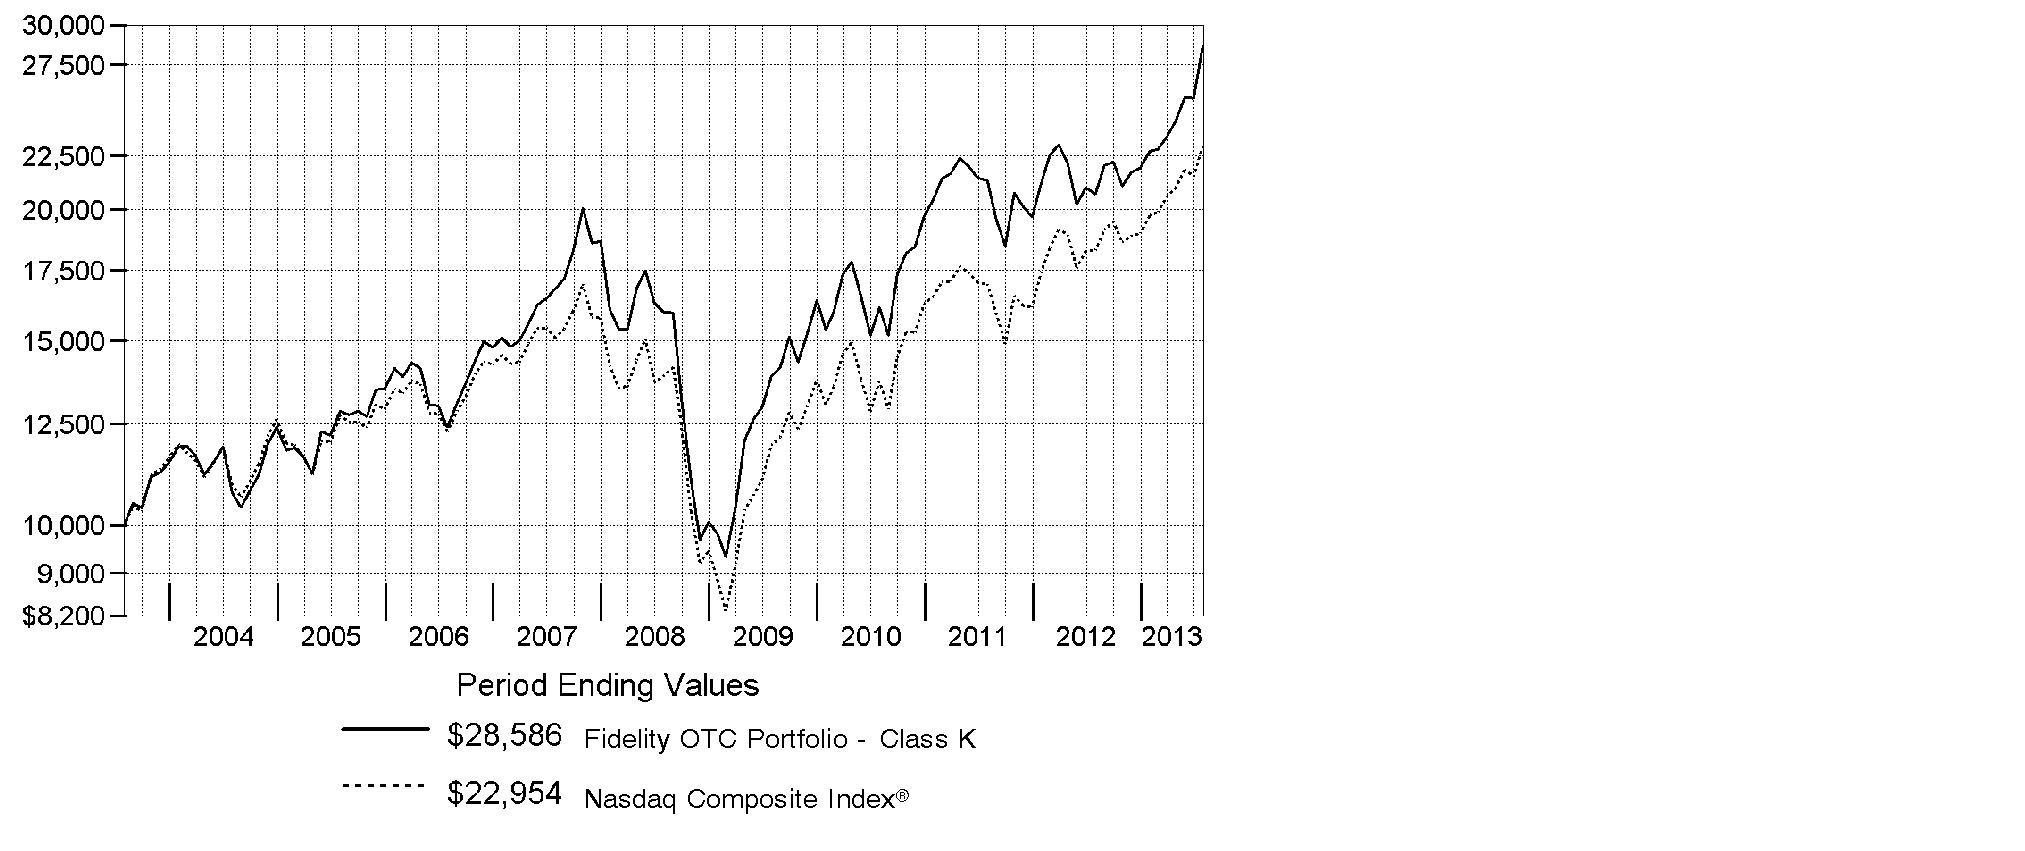
Annual Report
Market Recap: The bull run in U.S. stocks comfortably settled into a fifth year, as major equity benchmarks ripped through records during the 12 months ending July 31, 2013. Gains were fueled by a generally improving global economy and accommodative monetary policies worldwide. The tone was positive for most of the year, based largely on stronger U.S. economic data, including employment, housing and consumer sentiment. Setting a series of new highs along the way, the broad-based S&P 500® Index rose an impressive 25.00% for the 12 months, while the blue-chip-laden Dow Jones Industrial AverageSM also moved into record territory en route to a 22.36% gain. The growth-oriented Nasdaq Composite Index® had a similarly strong run, advancing 25.44%. During the year, markets were resilient amid intermittent volatility over debt woes in Europe, the 2012 U.S. presidential election and year-end Congressional gridlock over the federal budget. In mid-to-late June, concern arose about the U.S. Federal Reserve possibly tapering its sustaining bond-buying strategy - which prompted a brief, but steep, market sell-off. However, investors' continued quest for yield and the Fed's pledge to keep buying bonds until the economy showed significant improvement overpowered the uncertainty and helped equities climb notably higher in July to close the period on a strong note.
Comments from Gavin Baker, Portfolio Manager of Fidelity® OTC Portfolio: For the year, the fund's Class K shares returned 38.11%, considerably better than the Nasdaq Composite Index®. Versus the index, favorable stock selection was by far the main driver of performance. I aim to identify companies that have the potential to deliver above-average earnings growth and high returns on capital over a long period of time. This process led me to several outstanding picks in information technology, consumer discretionary, consumer staples and health care, the latter of which was the benchmark's best-performing sector and a group I added to during the period. The top individual contributor - both relative to the index and in absolute terms - was electric automaker Tesla Motors, whose Model S luxury sedan continued to exceed sales expectations. I significantly reduced this position. Also lifting relative performance were Green Mountain Coffee Roasters and social media provider Facebook. The largest relative detractor was a sizable out-of-benchmark position in Accretive Health, which provides revenue-enhancement services and software for hospitals. This stock continued to struggle in the aftermath of some legal difficulties. Riverbed Technology, which manufactures products for network optimization, and graphics chipmaker NVIDIA detracted as well.
The views expressed above reflect those of the portfolio manager(s) only through the end of the period as stated on the cover of this report and do not necessarily represent the views of Fidelity or any other person in the Fidelity organization. Any such views are subject to change at any time based upon market or other conditions and Fidelity disclaims any responsibility to update such views. These views may not be relied on as investment advice and, because investment decisions for a Fidelity fund are based on numerous factors, may not be relied on as an indication of trading intent on behalf of any Fidelity fund.
Annual Report
Shareholder Expense Example
As a shareholder of the Fund, you incur two types of costs: (1) transaction costs and (2) ongoing costs, including management fees and other Fund expenses. This Example is intended to help you understand your ongoing costs (in dollars) of investing in the Fund and to compare these costs with the ongoing costs of investing in other mutual funds.
The Example is based on an investment of $1,000 invested at the beginning of the period and held for the entire period (February 1, 2013 to July 31, 2013).
Actual Expenses
The first line of the accompanying table for each class of the Fund provides information about actual account values and actual expenses. You may use the information in this line, together with the amount you invested, to estimate the expenses that you paid over the period. Simply divide your account value by $1,000.00 (for example, an $8,600 account value divided by $1,000.00 = 8.6), then multiply the result by the number in the first line for a class of the Fund under the heading entitled "Expenses Paid During Period" to estimate the expenses you paid on your account during this period. A small balance maintenance fee of $12.00 that is charged once a year may apply for certain accounts with a value of less than $2,000. This fee is not included in the table below. If it was, the estimate of expenses you paid during the period would be higher, and your ending account value lower, by this amount. In addition, the Fund, as a shareholder in the underlying Fidelity Central Funds, will indirectly bear its pro-rata share of the fees and expenses incurred by the underlying Fidelity Central Funds. These fees and expenses are not included in the Fund's annualized expense ratio used to calculate the expense estimate in the table below.
Hypothetical Example for Comparison Purposes
The second line of the accompanying table for each class of the Fund provides information about hypothetical account values and hypothetical expenses based on a Class' actual expense ratio and an assumed rate of return of 5% per year before expenses, which is not the Class' actual return. The hypothetical account values and expenses may not be used to estimate the actual ending account balance or expenses you paid for the period. You may use this information to compare the ongoing costs of investing in the Fund and other funds. To do so, compare this 5% hypothetical example with the 5% hypothetical examples that appear in the shareholder reports of the other funds. A small balance maintenance fee of $12.00 that is charged once a year may apply for certain accounts with a value of less than $2,000. This fee is not included in the table below. If it was, the estimate of expenses you paid during the period would be higher, and your ending account value lower, by this amount. In addition, the Fund, as a shareholder in the underlying Fidelity Central Funds, will indirectly bear its pro-rata share of the fees and expenses incurred by the underlying Fidelity Central Funds. These fees and expenses are not included in the Fund's annualized expense ratio used to calculate the expense estimate in the table below.
Please note that the expenses shown in the table are meant to highlight your ongoing costs only and do not reflect any transaction costs. Therefore, the second line of the table is useful in comparing ongoing costs only, and will not help you determine the relative total costs of owning different funds.
Annual Report
| Annualized
Expense Ratio B | Beginning
Account Value
February 1, 2013 | Ending
Account Value
July 31, 2013 | Expenses Paid
During Period*
February 1, 2013
to July 31, 2013 |
OTC | .78% | | | |
Actual | | $ 1,000.00 | $ 1,256.60 | $ 4.36 |
Hypothetical A | | $ 1,000.00 | $ 1,020.93 | $ 3.91 |
Class K | .64% | | | |
Actual | | $ 1,000.00 | $ 1,257.50 | $ 3.58 |
Hypothetical A | | $ 1,000.00 | $ 1,021.62 | $ 3.21 |
A 5% return per year before expenses
B Annualized expense ratio reflects expenses net of applicable fee waivers.
* Expenses are equal to each Class' annualized expense ratio, multiplied by the average account value over the period, multiplied by 181/365 (to reflect the one-half year period).
Annual Report
Investment Changes (Unaudited)
Top Ten Stocks as of July 31, 2013 |
| % of fund's
net assets | % of fund's net assets
6 months ago |
Apple, Inc. | 9.4 | 8.3 |
Google, Inc. Class A | 5.3 | 6.3 |
Facebook, Inc. Class A | 5.0 | 2.4 |
Amazon.com, Inc. | 3.8 | 1.2 |
Rackspace Hosting, Inc. | 3.2 | 0.0 |
Questcor Pharmaceuticals, Inc. | 2.6 | 2.0 |
Comcast Corp. Class A | 2.2 | 0.0 |
athenahealth, Inc. | 2.1 | 1.8 |
Costco Wholesale Corp. | 2.0 | 2.2 |
Gilead Sciences, Inc. | 1.8 | 1.6 |
| 37.4 | |
Top Five Market Sectors as of July 31, 2013 |
| % of fund's
net assets | % of fund's net assets
6 months ago |
Information Technology | 53.5 | 55.4 |
Health Care | 20.1 | 18.9 |
Consumer Discretionary | 14.1 | 13.0 |
Consumer Staples | 5.7 | 6.2 |
Financials | 2.9 | 2.7 |
Asset Allocation (% of fund's net assets) |
As of July 31, 2013* | As of January 31, 2013** |
| Stocks 99.2% | | | Stocks 99.8% | |
| Convertible
Securities 0.2% | | | Convertible
Securities 0.0% | |
| Short-Term
Investments and
Net Other Assets
(Liabilities) 0.6% | | | Short-Term
Investments and
Net Other Assets
(Liabilities) 0.2% | |
* Foreign investments | 6.9% | | ** Foreign investments | 7.1% | |

Annual Report
Investments July 31, 2013
Showing Percentage of Net Assets
Common Stocks - 99.2% |
| Shares | | Value (000s) |
CONSUMER DISCRETIONARY - 13.9% |
Automobiles - 1.4% |
Tesla Motors, Inc. (a) | 799,049 | | $ 107,296 |
Volkswagen AG sponsored ADR | 421,300 | | 19,279 |
| | 126,575 |
Hotels, Restaurants & Leisure - 2.1% |
Buffalo Wild Wings, Inc. (a) | 45,400 | | 4,703 |
Chipotle Mexican Grill, Inc. (a) | 83,876 | | 34,580 |
Dunkin' Brands Group, Inc. | 37,400 | | 1,616 |
Noodles & Co. (d) | 7,200 | | 312 |
Panera Bread Co. Class A (a) | 259,800 | | 43,400 |
Starbucks Corp. | 1,260,600 | | 89,805 |
The Cheesecake Factory, Inc. | 304,980 | | 12,943 |
| | 187,359 |
Household Durables - 0.1% |
SodaStream International Ltd. (a)(d) | 146,958 | | 9,564 |
Internet & Catalog Retail - 4.2% |
Amazon.com, Inc. (a) | 1,134,896 | | 341,853 |
Groupon, Inc. Class A (a) | 4,169,300 | | 36,940 |
| | 378,793 |
Media - 2.5% |
Comcast Corp. Class A | 4,451,400 | | 200,669 |
DISH Network Corp. Class A | 135,800 | | 6,063 |
Lions Gate Entertainment Corp. (a)(d) | 576,169 | | 18,743 |
| | 225,475 |
Specialty Retail - 2.7% |
Bed Bath & Beyond, Inc. (a) | 1,036,700 | | 79,276 |
Best Buy Co., Inc. | 20,900 | | 629 |
Five Below, Inc. | 6,100 | | 237 |
Francescas Holdings Corp. (a) | 77,509 | | 1,927 |
Lowe's Companies, Inc. | 1,176,300 | | 52,439 |
Monro Muffler Brake, Inc. | 29,213 | | 1,256 |
Ross Stores, Inc. | 595,200 | | 40,158 |
Tile Shop Holdings, Inc. (a) | 17,400 | | 495 |
Tractor Supply Co. | 166,688 | | 20,191 |
Ulta Salon, Cosmetics & Fragrance, Inc. (a) | 182,600 | | 18,424 |
Urban Outfitters, Inc. (a) | 515,400 | | 21,935 |
| | 236,967 |
Textiles, Apparel & Luxury Goods - 0.9% |
lululemon athletica, Inc. (a)(d) | 227,746 | | 15,844 |
Michael Kors Holdings Ltd. (a) | 399,600 | | 26,909 |
Common Stocks - continued |
| Shares | | Value (000s) |
CONSUMER DISCRETIONARY - continued |
Textiles, Apparel & Luxury Goods - continued |
NIKE, Inc. Class B | 28,600 | | $ 1,800 |
Ralph Lauren Corp. | 193,500 | | 35,229 |
| | 79,782 |
TOTAL CONSUMER DISCRETIONARY | | 1,244,515 |
CONSUMER STAPLES - 5.7% |
Beverages - 0.3% |
Monster Beverage Corp. (a) | 467,400 | | 28,507 |
Food & Staples Retailing - 2.0% |
Costco Wholesale Corp. | 1,547,300 | | 181,483 |
Food Products - 3.4% |
Danone SA sponsored ADR | 1,844,700 | | 29,229 |
Green Mountain Coffee Roasters, Inc. (a)(d) | 1,657,817 | | 127,950 |
Mondelez International, Inc. | 4,478,700 | | 140,049 |
WhiteWave Foods Co. | 261,700 | | 4,891 |
| | 302,119 |
TOTAL CONSUMER STAPLES | | 512,109 |
ENERGY - 0.0% |
Oil, Gas & Consumable Fuels - 0.0% |
Noble Energy, Inc. | 18,700 | | 1,169 |
FINANCIALS - 2.9% |
Capital Markets - 0.8% |
Carlyle Group LP | 318,600 | | 8,918 |
Northern Trust Corp. | 893,400 | | 52,300 |
T. Rowe Price Group, Inc. | 200,000 | | 15,048 |
| | 76,266 |
Commercial Banks - 1.1% |
Huntington Bancshares, Inc. | 175,600 | | 1,501 |
Signature Bank (a) | 214,600 | | 19,647 |
Texas Capital Bancshares, Inc. (a) | 567,300 | | 25,806 |
Wells Fargo & Co. | 1,161,500 | | 50,525 |
| | 97,479 |
Consumer Finance - 0.8% |
Capital One Financial Corp. | 1,059,800 | | 73,147 |
Common Stocks - continued |
| Shares | | Value (000s) |
FINANCIALS - continued |
Diversified Financial Services - 0.2% |
CME Group, Inc. | 207,200 | | $ 15,329 |
TOTAL FINANCIALS | | 262,221 |
HEALTH CARE - 20.1% |
Biotechnology - 11.8% |
Aegerion Pharmaceuticals, Inc. (a) | 386,900 | | 35,436 |
Alexion Pharmaceuticals, Inc. (a) | 1,295,404 | | 150,565 |
Alkermes PLC (a) | 812,467 | | 27,283 |
Alnylam Pharmaceuticals, Inc. (a) | 285,200 | | 13,168 |
Amgen, Inc. | 370,400 | | 40,111 |
ARIAD Pharmaceuticals, Inc. (a) | 2,485,000 | | 46,171 |
Biogen Idec, Inc. (a) | 264,100 | | 57,608 |
BioMarin Pharmaceutical, Inc. (a) | 1,000,156 | | 64,660 |
Clovis Oncology, Inc. (a) | 495,655 | | 38,602 |
Genomic Health, Inc. (a) | 416,500 | | 14,844 |
Gilead Sciences, Inc. (a) | 2,656,900 | | 163,267 |
ImmunoGen, Inc. (a)(d) | 297,309 | | 5,664 |
Infinity Pharmaceuticals, Inc. (a) | 324,589 | | 6,875 |
Ironwood Pharmaceuticals, Inc. Class A (a)(d) | 2,958,742 | | 36,215 |
Isis Pharmaceuticals, Inc. (a)(d) | 80,849 | | 2,332 |
Medivation, Inc. (a) | 2,138,089 | | 123,731 |
NPS Pharmaceuticals, Inc. (a) | 372,136 | | 6,702 |
Onyx Pharmaceuticals, Inc. (a) | 386,821 | | 50,790 |
Pharmacyclics, Inc. (a) | 42,200 | | 4,584 |
Regeneron Pharmaceuticals, Inc. (a) | 74,932 | | 20,236 |
Seattle Genetics, Inc. (a)(d) | 1,401,386 | | 56,784 |
Targacept, Inc. (a) | 117,049 | | 585 |
Theravance, Inc. (a)(d) | 1,762,779 | | 67,973 |
Vertex Pharmaceuticals, Inc. (a) | 315,000 | | 25,137 |
| | 1,059,323 |
Health Care Equipment & Supplies - 1.1% |
Accuray, Inc. (a)(d) | 1,498,800 | | 9,308 |
Endologix, Inc. (a) | 155,200 | | 2,426 |
Intuitive Surgical, Inc. (a) | 210,900 | | 81,829 |
| | 93,563 |
Health Care Providers & Services - 2.4% |
Accretive Health, Inc. (a)(d)(e) | 9,842,302 | | 98,226 |
Express Scripts Holding Co. (a) | 1,760,400 | | 115,394 |
| | 213,620 |
Common Stocks - continued |
| Shares | | Value (000s) |
HEALTH CARE - continued |
Health Care Technology - 2.1% |
athenahealth, Inc. (a)(d) | 1,690,748 | | $ 189,279 |
Life Sciences Tools & Services - 0.1% |
Illumina, Inc. (a) | 141,100 | | 11,263 |
Pharmaceuticals - 2.6% |
Questcor Pharmaceuticals, Inc. (d)(e) | 3,411,690 | | 227,969 |
TOTAL HEALTH CARE | | 1,795,017 |
INDUSTRIALS - 0.5% |
Air Freight & Logistics - 0.3% |
C.H. Robinson Worldwide, Inc. | 469,200 | | 27,974 |
Electrical Equipment - 0.1% |
SolarCity Corp. (d) | 347,594 | | 14,370 |
Professional Services - 0.1% |
Verisk Analytics, Inc. (a) | 102,500 | | 6,597 |
TOTAL INDUSTRIALS | | 48,941 |
INFORMATION TECHNOLOGY - 53.5% |
Communications Equipment - 5.9% |
Aruba Networks, Inc. (a) | 3,688,484 | | 65,581 |
Cisco Systems, Inc. | 4,057,900 | | 103,679 |
Juniper Networks, Inc. (a) | 2,111,500 | | 45,756 |
QUALCOMM, Inc. | 1,937,209 | | 125,047 |
Radware Ltd. (a)(e) | 3,583,044 | | 49,088 |
Riverbed Technology, Inc. (a)(e) | 8,660,853 | | 135,456 |
| | 524,607 |
Computers & Peripherals - 10.3% |
Apple, Inc. | 1,851,100 | | 837,622 |
Cray, Inc. (a) | 1,353,436 | | 31,359 |
EMC Corp. | 21,900 | | 573 |
Fusion-io, Inc. (a)(d) | 1,964,466 | | 28,328 |
Silicon Graphics International Corp. (a)(d) | 284,874 | | 5,361 |
Stratasys Ltd. (a) | 212,900 | | 18,874 |
| | 922,117 |
Electronic Equipment & Components - 0.0% |
Neonode, Inc. (a) | 500,000 | | 3,895 |
Internet Software & Services - 19.9% |
Angie's List, Inc. (a)(d)(e) | 4,065,915 | | 89,531 |
Baidu.com, Inc. sponsored ADR (a) | 1,046,212 | | 138,424 |
Common Stocks - continued |
| Shares | | Value (000s) |
INFORMATION TECHNOLOGY - continued |
Internet Software & Services - continued |
Constant Contact, Inc. (a)(e) | 2,917,136 | | $ 55,980 |
Demandware, Inc. (a) | 474,300 | | 21,068 |
Dropbox, Inc. (a)(f) | 331,524 | | 3,315 |
E2open, Inc. (d)(e) | 1,896,838 | | 37,709 |
eBay, Inc. (a) | 937,563 | | 48,463 |
Facebook, Inc. Class A (a) | 12,044,369 | | 443,594 |
Google, Inc. Class A (a) | 536,577 | | 476,266 |
LinkedIn Corp. (a) | 42,300 | | 8,620 |
Marin Software, Inc. (d)(e) | 2,278,668 | | 26,341 |
Marketo, Inc. (d) | 150,428 | | 4,728 |
Millennial Media, Inc. (a)(d) | 2,435,808 | | 24,139 |
Rackspace Hosting, Inc. (a) | 6,286,698 | | 284,725 |
Responsys, Inc. (a) | 39,100 | | 567 |
Textura Corp. | 5,900 | | 178 |
Trulia, Inc. (d) | 1,522,696 | | 56,736 |
Velti PLC (a)(d) | 477,451 | | 540 |
Yahoo!, Inc. (a) | 2,130,500 | | 59,846 |
| | 1,780,770 |
IT Services - 0.7% |
Cognizant Technology Solutions Corp. Class A (a) | 182,400 | | 13,204 |
ServiceSource International, Inc. (a)(e) | 4,376,136 | | 46,693 |
| | 59,897 |
Semiconductors & Semiconductor Equipment - 3.8% |
Advanced Micro Devices, Inc. (a)(d) | 22,108,516 | | 83,349 |
Altera Corp. | 113,394 | | 4,032 |
Applied Micro Circuits Corp. (a) | 457,650 | | 5,432 |
Broadcom Corp. Class A | 2,112,500 | | 58,242 |
Inphi Corp. (a) | 201,395 | | 2,348 |
Lam Research Corp. (a) | 54,900 | | 2,702 |
LSI Corp. | 328,600 | | 2,557 |
Maxim Integrated Products, Inc. | 159,000 | | 4,547 |
Mellanox Technologies Ltd. (a) | 948,912 | | 43,318 |
NVE Corp. (a)(e) | 265,557 | | 13,166 |
NVIDIA Corp. | 7,039,487 | | 101,580 |
Skyworks Solutions, Inc. (a) | 713,400 | | 17,136 |
| | 338,409 |
Software - 12.9% |
Activision Blizzard, Inc. | 6,065,262 | | 109,053 |
Adobe Systems, Inc. (a) | 1,860,100 | | 87,946 |
Check Point Software Technologies Ltd. (a) | 65,200 | | 3,671 |
Common Stocks - continued |
| Shares | | Value (000s) |
INFORMATION TECHNOLOGY - continued |
Software - continued |
Electronic Arts, Inc. (a) | 5,741,947 | | $ 149,980 |
FleetMatics Group PLC | 80,500 | | 3,032 |
Gameloft Se (a)(e) | 7,764,787 | | 62,909 |
Gigamon, Inc. (a) | 55,100 | | 1,970 |
Guidewire Software, Inc. (a) | 848,830 | | 37,145 |
Intuit, Inc. | 726,000 | | 46,406 |
Microsoft Corp. | 4,288,939 | | 136,517 |
Oracle Corp. | 2,000,200 | | 64,706 |
salesforce.com, Inc. (a) | 1,885,620 | | 82,496 |
ServiceNow, Inc. (a) | 964,076 | | 42,014 |
Synchronoss Technologies, Inc. (a)(e) | 3,688,086 | | 127,202 |
Tableau Software, Inc. | 18,400 | | 1,019 |
Take-Two Interactive Software, Inc. (a) | 3,200,008 | | 56,096 |
Ubisoft Entertainment SA (a)(e) | 9,537,704 | | 145,537 |
Ubisoft Entertainment SA warrants 10/10/13 (a)(e) | 3,080,130 | | 1,651 |
| | 1,159,350 |
TOTAL INFORMATION TECHNOLOGY | | 4,789,045 |
MATERIALS - 0.1% |
Metals & Mining - 0.1% |
Randgold Resources Ltd. sponsored ADR | 76,633 | | 5,692 |
TELECOMMUNICATION SERVICES - 2.5% |
Diversified Telecommunication Services - 1.1% |
Level 3 Communications, Inc. (a) | 4,754,147 | | 104,829 |
Wireless Telecommunication Services - 1.4% |
NII Holdings, Inc. (a)(d)(e) | 17,120,769 | | 122,927 |
TOTAL TELECOMMUNICATION SERVICES | | 227,756 |
TOTAL COMMON STOCKS (Cost $6,970,007) |
8,886,465
|
Convertible Preferred Stocks - 0.2% |
| Shares | | Value (000s) |
CONSUMER DISCRETIONARY - 0.2% |
Household Durables - 0.2% |
Roku, Inc. 8.00% (f) (Cost $15,000) | 16,562,507 | | $ 15,000 |
Money Market Funds - 5.4% |
| | | |
Fidelity Cash Central Fund, 0.11% (b) | 32,349,365 | | 32,349 |
Fidelity Securities Lending Cash Central Fund, 0.12% (b)(c) | 448,257,924 | | 448,258 |
TOTAL MONEY MARKET FUNDS (Cost $480,607) |
480,607
|
Cash Equivalents - 0.2% |
| Maturity Amount (000s) | | |
Investments in repurchase agreements in a joint trading account at 0.06%, dated 7/31/13 due 8/1/13 (Collateralized by U.S. Treasury Obligations) #
(Cost $21,190) | $ 21,190 | |
21,190
|
TOTAL INVESTMENT PORTFOLIO - 105.0% (Cost $7,486,804) | | 9,403,262 |
NET OTHER ASSETS (LIABILITIES) - (5.0)% | | (450,133) |
NET ASSETS - 100% | $ 8,953,129 |
Legend |
(a) Non-income producing |
(b) Affiliated fund that is generally available only to investment companies and other accounts managed by Fidelity Investments. The rate quoted is the annualized seven-day yield of the fund at period end. A complete unaudited listing of the fund's holdings as of its most recent quarter end is available upon request. In addition, each Fidelity Central Fund's financial statements, which are not covered by the Fund's Report of Independent Registered Public Accounting Firm, are available on the SEC's website or upon request. |
(c) Investment made with cash collateral received from securities on loan. |
(d) Security or a portion of the security is on loan at period end. |
(e) Affiliated company |
(f) Restricted securities - Investment in securities not registered under the Securities Act of 1933 (excluding 144A issues). At the end of the period, the value of restricted securities (excluding 144A issues) amounted to $18,315,000 or 0.2% of net assets. |
Additional information on each restricted holding is as follows: |
Security | Acquisition Date | Acquisition Cost (000s) |
Dropbox, Inc. | 5/2/12 | $ 3,000 |
Roku, Inc. 8.00% | 5/7/13 | $ 15,000 |
# Additional information on each counterparty to the repurchase agreement is as follows: |
Repurchase Agreement / Counterparty | Value
(000s) |
$21,190,000 due 8/01/13 at 0.06% |
Barclays Capital, Inc. | $ 5,919 |
Merrill Lynch, Pierce, Fenner & Smith, Inc. | 4,143 |
UBS Securities LLC | 11,128 |
| $ 21,190 |
Affiliated Central Funds |
Information regarding fiscal year to date income earned by the Fund from investments in Fidelity Central Funds is as follows: |
Fund | Income earned
(Amounts in thousands) |
Fidelity Cash Central Fund | $ 20 |
Fidelity Securities Lending Cash Central Fund | 31,912 |
Total | $ 31,932 |
Other Affiliated Issuers |
An affiliated company is a company in which the Fund has ownership of at least 5% of the voting securities. Fiscal year to date transactions with companies which are or were affiliates are as follows: |
Affiliate
(Amounts in thousands) | Value,
beginning of
period | Purchases | Sales Proceeds | Dividend Income | Value,
end of
period |
Accretive Health, Inc. | $ 134,915 | $ - | $ 1,010 | $ - | $ 98,226 |
Angie's List, Inc. | 19,482 | 82,327 | 13,763 | - | 89,531 |
Constant Contact, Inc. | 32,819 | 21,849 | 6,097 | - | 55,980 |
Cray, Inc. | 3,901 | 34,988 | 22,364 | - | - |
E2open, Inc. | - | 33,882 | - | - | 37,709 |
ExactTarget, Inc. | - | 139,504 | 231,558 | - | - |
Gameloft Se | 44,521 | - | - | - | 62,909 |
Inphi Corp. | 19,745 | - | 16,465 | - | - |
Marin Software, Inc. | - | 23,367 | - | - | 26,341 |
NII Holdings, Inc. | 88,138 | 24,865 | - | - | 122,927 |
NVE Corp. | 25,650 | - | 9,821 | - | 13,166 |
Questcor Pharmaceuticals, Inc. | 225,333 | 11,904 | 142,191 | 4,559 | 227,969 |
Radware Ltd. | - | 78,856 | 14,022 | - | 49,088 |
Riverbed Technology, Inc. | - | 322,562 | 156,763 | - | 135,456 |
ServiceSource International, Inc. | 41,029 | 12,837 | 7,647 | - | 46,693 |
Synchronoss Technologies, Inc. | 73,630 | - | 4,961 | - | 127,202 |
Ubisoft Entertainment SA | 61,686 | 6,090 | - | - | 145,537 |
Ubisoft Entertainment SA warrants 10/10/13 | 207 | - | 217 | - | 1,651 |
Total | $ 771,056 | $ 793,031 | $ 626,879 | $ 4,559 | $ 1,240,385 |
Other Information |
The following is a summary of the inputs used, as of July 31, 2013, involving the Fund's assets and liabilities carried at fair value. The inputs or methodology used for valuing securities may not be an indication of the risk associated with investing in those securities. For more information on valuation inputs, and their aggregation into the levels used in the table below, please refer to the Investment Valuation section in the accompanying Notes to Financial Statements. |
Valuation Inputs at Reporting Date: |
Description
(Amounts in thousands) | Total | Level 1 | Level 2 | Level 3 |
Investments in Securities: | | | | |
Equities: | | | | |
Consumer Discretionary | $ 1,259,515 | $ 1,244,515 | $ - | $ 15,000 |
Consumer Staples | 512,109 | 512,109 | - | - |
Energy | 1,169 | 1,169 | - | - |
Financials | 262,221 | 262,221 | - | - |
Health Care | 1,795,017 | 1,795,017 | - | - |
Industrials | 48,941 | 48,941 | - | - |
Information Technology | 4,789,045 | 4,785,730 | - | 3,315 |
Materials | 5,692 | 5,692 | - | - |
Telecommunication Services | 227,756 | 227,756 | - | - |
Money Market Funds | 480,607 | 480,607 | - | - |
Cash Equivalents | 21,190 | - | 21,190 | - |
Total Investments in Securities: | $ 9,403,262 | $ 9,363,757 | $ 21,190 | $ 18,315 |
See accompanying notes which are an integral part of the financial statements.
Annual Report
Statement of Assets and Liabilities
Amounts in thousands (except per-share amounts) | July 31, 2013 |
| | |
Assets | | |
Investment in securities, at value (including securities loaned of $454,143 and repurchase agreements of $21,190) - See accompanying schedule: Unaffiliated issuers (cost $5,763,850) | $ 7,682,270 | |
Fidelity Central Funds (cost $480,607) | 480,607 | |
Other affiliated issuers (cost $1,242,347) | 1,240,385 | |
Total Investments (cost $7,486,804) | | $ 9,403,262 |
Cash | | 1 |
Receivable for investments sold | | 186,896 |
Receivable for fund shares sold | | 10,643 |
Dividends receivable | | 1,062 |
Distributions receivable from Fidelity Central Funds | | 488 |
Other receivables | | 278 |
Total assets | | 9,602,630 |
| | |
Liabilities | | |
Payable for investments purchased | $ 189,288 | |
Payable for fund shares redeemed | 5,330 | |
Accrued management fee | 5,284 | |
Other affiliated payables | 1,095 | |
Other payables and accrued expenses | 246 | |
Collateral on securities loaned, at value | 448,258 | |
Total liabilities | | 649,501 |
| | |
Net Assets | | $ 8,953,129 |
Net Assets consist of: | | |
Paid in capital | | $ 6,294,615 |
Undistributed net investment income | | 6,993 |
Accumulated undistributed net realized gain (loss) on investments and foreign currency transactions | | 735,092 |
Net unrealized appreciation (depreciation) on investments and assets and liabilities in foreign currencies | | 1,916,429 |
Net Assets | | $ 8,953,129 |
See accompanying notes which are an integral part of the financial statements.
Annual Report
Statement of Assets and Liabilities - continued
Amounts in thousands (except per-share amounts) | July 31, 2013 |
| | |
OTC:
Net Asset Value, offering price and redemption price per share ($6,693,071 ÷ 84,743 shares) | | $ 78.98 |
| | |
Class K:
Net Asset Value, offering price and redemption price per share ($2,260,058 ÷ 28,394 shares) | | $ 79.60 |
See accompanying notes which are an integral part of the financial statements.
Annual Report
Financial Statements - continued
Statement of Operations
Amounts in thousands | Year ended July 31, 2013 |
| | |
Investment Income | | |
Dividends (including $4,559 earned from other affiliated issuers) | | $ 52,140 |
Special dividends | | 11,578 |
Interest | | 2 |
Income from Fidelity Central Funds (including $31,912 from security lending) | | 31,932 |
Total income | | 95,652 |
| | |
Expenses | | |
Management fee
Basic fee | $ 44,865 | |
Performance adjustment | (4,103) | |
Transfer agent fees | 11,129 | |
Accounting and security lending fees | 1,305 | |
Custodian fees and expenses | 268 | |
Independent trustees' compensation | 47 | |
Registration fees | 83 | |
Audit | 73 | |
Legal | 36 | |
Interest | 11 | |
Miscellaneous | 70 | |
Total expenses before reductions | 53,784 | |
Expense reductions | (1,575) | 52,209 |
Net investment income (loss) | | 43,443 |
Realized and Unrealized Gain (Loss) Net realized gain (loss) on: | | |
Investment securities: | | |
Unaffiliated issuers | 1,020,801 | |
Other affiliated issuers | 79,420 | |
Foreign currency transactions | (97) | |
Futures contracts | 826 | |
Total net realized gain (loss) | | 1,100,950 |
Change in net unrealized appreciation (depreciation) on: Investment securities | 1,322,675 | |
Assets and liabilities in foreign currencies | (2) | |
Total change in net unrealized appreciation (depreciation) | | 1,322,673 |
Net gain (loss) | | 2,423,623 |
Net increase (decrease) in net assets resulting from operations | | $ 2,467,066 |
See accompanying notes which are an integral part of the financial statements.
Annual Report
Statement of Changes in Net Assets
Amounts in thousands | Year ended
July 31,
2013 | Year ended
July 31,
2012 |
Increase (Decrease) in Net Assets | | |
Operations | | |
Net investment income (loss) | $ 43,443 | $ (8,447) |
Net realized gain (loss) | 1,100,950 | 104,141 |
Change in net unrealized appreciation (depreciation) | 1,322,673 | (349,473) |
Net increase (decrease) in net assets resulting
from operations | 2,467,066 | (253,779) |
Distributions to shareholders from net investment income | (33,821) | - |
Share transactions - net increase (decrease) | (622,836) | (340,677) |
Total increase (decrease) in net assets | 1,810,409 | (594,456) |
| | |
Net Assets | | |
Beginning of period | 7,142,720 | 7,737,176 |
End of period (including undistributed net investment income of $6,993 and accumulated net investment loss of $2,569, respectively) | $ 8,953,129 | $ 7,142,720 |
See accompanying notes which are an integral part of the financial statements.
Annual Report
Financial Highlights - OTC
Years ended July 31, | 2013 | 2012 | 2011 | 2010 | 2009 |
Selected Per-Share Data | | | | | |
Net asset value, beginning of period | $ 57.53 | $ 59.28 | $ 45.00 | $ 38.73 | $ 44.66 |
Income from Investment Operations | | | | | |
Net investment income (loss) B | .36 E | (.08) F | (.27) | (.23) | (.12) |
Net realized and unrealized gain (loss) | 21.37 | (1.67) | 14.55 | 6.50 | (5.81) |
Total from investment operations | 21.73 | (1.75) | 14.28 | 6.27 | (5.93) |
Distributions from net investment income | (.28) | - | - | - | - |
Net asset value, end of period | $ 78.98 | $ 57.53 | $ 59.28 | $ 45.00 | $ 38.73 |
Total Return A | 37.93% | (2.95)% | 31.73% | 16.19% | (13.28)% |
Ratios to Average Net Assets C, G | | | | | |
Expenses before reductions | .76% | .91% | .94% | 1.06% | 1.13% |
Expenses net of fee waivers, if any | .76% | .91% | .94% | 1.06% | 1.13% |
Expenses net of all reductions | .74% | .90% | .92% | 1.04% | 1.13% |
Net investment income (loss) | .55% E | (.14)% F | (.49)% | (.51)% | (.37)% |
Supplemental Data | | | | | |
Net assets, end of period (in millions) | $ 6,693 | $ 5,499 | $ 6,374 | $ 5,080 | $ 4,677 |
Portfolio turnover rate D | 116% | 149% | 158% | 163% | 151% |
A Total returns would have been lower if certain expenses had not been reduced during the applicable periods shown.
B Calculated based on average shares outstanding during the period.
C Fees and expenses of any underlying Fidelity Central Funds are not included in the Fund's expense ratio. The Fund indirectly bears its proportionate share of the expenses of any underlying Fidelity Central Funds.
D Amount does not include the portfolio activity of any underlying Fidelity Central Funds.
E Investment income per share reflects a large, non-recurring dividend which amounted to $.10 per share. Excluding this non-recurring dividend, the ratio of net investment income (loss) to average net assets would have been .40%.
F Investment income per share reflects a large, non-recurring dividend which amounted to $.03 per share. Excluding this non-recurring dividend, the ratio of net investment income (loss) to average net assets would have been (.20)%.
G Expense ratios reflect operating expenses of the class. Expenses before reductions do not reflect amounts reimbursed by the investment adviser or reductions from brokerage service arrangements or reductions from other expense offset arrangements and do not represent the amount paid by the class during periods when reimbursements or reductions occur. Expenses net of fee waivers reflect expenses after reimbursement by the investment adviser but prior to reductions from brokerage service arrangements or other expense offset arrangements. Expenses net of all reductions represent the net expenses paid by the class.
See accompanying notes which are an integral part of the financial statements.
Annual Report
Financial Highlights - Class K
Years ended July 31, | 2013 | 2012 | 2011 | 2010 | 2009 |
Selected Per-Share Data | | | | | |
Net asset value, beginning of period | $ 57.94 | $ 59.61 | $ 45.19 | $ 38.83 | $ 44.68 |
Income from Investment Operations | | | | | |
Net investment income (loss) B | .45 F | - G, I | (.19) | (.16) | (.05) |
Net realized and unrealized gain (loss) | 21.53 | (1.67) | 14.61 | 6.52 | (5.80) |
Total from investment operations | 21.98 | (1.67) | 14.42 | 6.36 | (5.85) |
Distributions from net investment income | (.32) | - | - | - | - |
Net asset value, end of period | $ 79.60 | $ 57.94 | $ 59.61 | $ 45.19 | $ 38.83 |
Total Return A | 38.11% | (2.80)% | 31.91% | 16.38% | (13.09)% |
Ratios to Average Net Assets C, H | | | | | |
Expenses before reductions | .62% | .77% | .80% | .90% | .92% |
Expenses net of fee waivers, if any | .62% | .77% | .80% | .90% | .92% |
Expenses net of all reductions | .60% | .76% | .78% | .88% | .92% |
Net investment income (loss) | .69% F | -% E, G | (.35)% | (.35)% | (.17)% |
Supplemental Data | | | | | |
Net assets, end of period (in millions) | $ 2,260 | $ 1,644 | $ 1,363 | $ 936 | $ 489 |
Portfolio turnover rate D | 116% | 149% | 158% | 163% | 151% |
A Total returns would have been lower if certain expenses had not been reduced during the applicable periods shown.
B Calculated based on average shares outstanding during the period.
C Fees and expenses of any underlying Fidelity Central Funds are not included in the Fund's expense ratio. The Fund indirectly bears its proportionate share of the expenses of any underlying Fidelity Central Funds.
D Amount does not include the portfolio activity of any underlying Fidelity Central Funds.
E Amount represents less than .01%.
F Investment income per share reflects a large, non-recurring dividend which amounted to $.10 per share. Excluding this non-recurring dividend, the ratio of net investment income (loss) to average net assets would have been .53%.
G Investment income per share reflects a large, non-recurring dividend which amounted to $.03 per share. Excluding this non-recurring dividend, the ratio of net investment income (loss) to average net assets would have been (.06)%.
H Expense ratios reflect operating expenses of the class. Expenses before reductions do not reflect amounts reimbursed by the investment adviser or reductions from brokerage service arrangements or reductions from other expense offset arrangements and do not represent the amount paid by the class during periods when reimbursements or reductions occur. Expenses net of fee waivers reflect expenses after reimbursement by the investment adviser but prior to reductions from brokerage service arrangements or other expense offset arrangements. Expenses net of all reductions represent the net expenses paid by the class.
I Amount represents less than $.01 per share.
See accompanying notes which are an integral part of the financial statements.
Annual Report
Notes to Financial Statements
For the period ended July 31, 2013
(Amounts in thousands except percentages)
1. Organization.
Fidelity OTC Portfolio (the Fund) is a non-diversified fund of Fidelity Securities Fund (the Trust) and is authorized to issue an unlimited number of shares. The Trust is registered under the Investment Company Act of 1940, as amended (the 1940 Act), as an open-end management investment company organized as a Massachusetts business trust. The Fund offers OTC and Class K shares, each of which has equal rights as to assets and voting privileges. Each class has exclusive voting rights with respect to matters that affect that class.
2. Investments in Fidelity Central Funds.
The Fund invests in Fidelity Central Funds, which are open-end investment companies generally available only to other investment companies and accounts managed by Fidelity Management & Research Company (FMR) and its affiliates. The Fund's Schedule of Investments lists each of the Fidelity Central Funds held as of period end, if any, as an investment of the Fund, but does not include the underlying holdings of each Fidelity Central Fund. As an Investing Fund, the Fund indirectly bears its proportionate share of the expenses of the underlying Fidelity Central Funds.
The Money Market Central Funds seek preservation of capital and current income and are managed by Fidelity Investments Money Management, Inc. (FIMM), an affiliate of FMR.
A complete unaudited list of holdings for each Fidelity Central Fund is available upon request or at the Securities and Exchange Commission (the SEC) website at www.sec.gov. In addition, the financial statements of the Fidelity Central Funds, which are not covered by the Fund's Report of Independent Registered Public Accounting Firm, are available on the SEC website or upon request.
3. Significant Accounting Policies.
The financial statements have been prepared in conformity with accounting principles generally accepted in the United States of America (GAAP), which require management to make certain estimates and assumptions at the date of the financial statements. Actual results could differ from those estimates. Subsequent events, if any, through the date that the financial statements were issued have been evaluated in the preparation of the financial statements. The following summarizes the significant accounting policies of the Fund:
Investment Valuation. Investments are valued as of 4:00 p.m. Eastern time on the last calendar day of the period. In accordance with valuation policies and procedures approved by the Board of Trustees (the Board), the Fund attempts to obtain prices from one or more third party pricing vendors or brokers to value its investments. When
Annual Report
3. Significant Accounting Policies - continued
Investment Valuation - continued
current market prices, quotations or currency exchange rates are not readily available or reliable, investments will be fair valued in good faith by the FMR Fair Value Committee (the Committee), in accordance with procedures adopted by the Board. Factors used in determining fair value vary by investment type and may include market or investment specific events. The frequency with which these procedures are used cannot be predicted and they may be utilized to a significant extent. The Committee oversees the Fund's valuation policies and procedures and is responsible for approving and reporting to the Board all fair value determinations.
The Fund categorizes the inputs to valuation techniques used to value its investments into a disclosure hierarchy consisting of three levels as shown below:
Level 1 - quoted prices in active markets for identical investments
Level 2 - other significant observable inputs (including quoted prices for similar investments, interest rates, prepayment speeds, etc.)
Level 3 - unobservable inputs (including the Fund's own assumptions based on the best information available)
Valuation techniques used to value the Fund's investments by major category are as follows:
Equity securities, including restricted securities, for which market quotations are readily available, are valued at the last reported sale price or official closing price as reported by a third party pricing vendor on the primary market or exchange on which they are traded and are categorized as Level 1 in the hierarchy. In the event there were no sales during the day or closing prices are not available, securities are valued at the last quoted bid price or may be valued using the last available price and are generally categorized as Level 2 in the hierarchy. For foreign equity securities, when market or security specific events arise, comparisons to the valuation of American Depositary Receipts (ADRs), futures contracts, Exchange-Traded Funds (ETFs) and certain indexes as well as quoted prices for similar securities may be used and would be categorized as Level 2 in the hierarchy. Utilizing these techniques may result in transfers between Level 1 and Level 2. For restricted equity securities and private placements where observable inputs are limited, assumptions about market activity and risk are used and these securities are generally categorized as Level 3 in the hierarchy.
Investments in open-end mutual funds, including the Fidelity Central Funds, are valued at their closing net asset value (NAV) each business day and are categorized as Level 1 in the hierarchy. Short-term securities with remaining maturities of sixty days or less may
Annual Report
Notes to Financial Statements - continued
(Amounts in thousands except percentages)
3. Significant Accounting Policies - continued
Investment Valuation - continued
be valued at amortized cost, which approximates fair value, and are categorized as Level 2 in the hierarchy.
Changes in valuation techniques may result in transfers in or out of an assigned level within the disclosure hierarchy. The aggregate value of investments by input level, as of July 31, 2013 is included at the end of the Fund's Schedule of Investments.
Foreign Currency. The Fund may use foreign currency contracts to facilitate transactions in foreign-denominated securities. Gains and losses from these transactions may arise from changes in the value of the foreign currency or if the counterparties do not perform under the contracts' terms.
Foreign-denominated assets, including investment securities, and liabilities are translated into U.S. dollars at the exchange rates at period end. Purchases and sales of investment securities, income and dividends received and expenses denominated in foreign currencies are translated into U.S. dollars at the exchange rate in effect on the transaction date.
The effects of exchange rate fluctuations on investments are included with the net realized and unrealized gain (loss) on investment securities. Other foreign currency transactions resulting in realized and unrealized gain (loss) are disclosed separately.
Investment Transactions and Income. For financial reporting purposes, the Fund's investment holdings and NAV include trades executed through the end of the last business day of the period. The NAV per share for processing shareholder transactions is calculated as of the close of business of the New York Stock Exchange (NYSE), normally 4:00 p.m. Eastern time and includes trades executed through the end of the prior business day. Gains and losses on securities sold are determined on the basis of identified cost and may include proceeds received from litigation. Dividend income is recorded on the ex-dividend date, except for certain dividends from foreign securities where the ex-dividend date may have passed, which are recorded as soon as the Fund is informed of the ex-dividend date. Non-cash dividends included in dividend income, if any, are recorded at the fair market value of the securities received. Distributions received on securities that represent a return of capital or capital gain are recorded as a reduction of cost of investments and/or as a realized gain. Subsequent to ex-dividend date the Fund determines the components of these distributions, based upon receipt of tax filings or other correspondence relating to the underlying investment. Large, non-recurring dividends recognized by the Fund are presented separately on the Statement of Operations as "Special Dividends" and the impact of these dividends is presented in the Financial Highlights. Interest income and distributions from the Fidelity Central Funds are accrued as earned. Interest income includes coupon interest and amortization of
Annual Report
3. Significant Accounting Policies - continued
Investment Transactions and Income - continued
premium and accretion of discount on debt securities. Investment income is recorded net of foreign taxes withheld where recovery of such taxes is uncertain.
Class Allocations and Expenses. Investment income, realized and unrealized capital gains and losses, common expenses of the Fund, and certain fund-level expense reductions, if any, are allocated on a pro-rata basis to each class based on the relative net assets of each class to the total net assets of the Fund. Each class differs with respect to transfer agent fees incurred. Certain expense reductions may also differ by class. Expenses directly attributable to a fund are charged to that fund. Expenses attributable to more than one fund are allocated among the respective funds on the basis of relative net assets or other appropriate methods. Expense estimates are accrued in the period to which they relate and adjustments are made when actual amounts are known.
Deferred Trustee Compensation. Under a Deferred Compensation Plan (the Plan), independent Trustees may elect to defer receipt of a portion of their annual compensation. Deferred amounts are invested in a cross-section of Fidelity funds, are marked-to-market and remain in the Fund until distributed in accordance with the Plan. The investment of deferred amounts and the offsetting payable to the Trustees are included in the accompanying Statement of Assets and Liabilities.
Income Tax Information and Distributions to Shareholders. Each year, the Fund intends to qualify as a regulated investment company under Subchapter M of the Internal Revenue Code, including distributing substantially all of its taxable income and realized gains. As a result, no provision for income taxes is required. As of July 31, 2013, the Fund did not have any unrecognized tax benefits in the financial statements; nor is the Fund aware of any tax positions for which it is reasonably possible that the total amounts of unrecognized tax benefits will significantly change in the next twelve months. The Fund files a U.S. federal tax return, in addition to state and local tax returns as required. A fund's federal income tax returns are subject to examination by the Internal Revenue Service (IRS) for a period of three fiscal years after they are filed. State and local tax returns may be subject to examination for an additional fiscal year depending on the jurisdiction. Foreign taxes are provided for based on the Fund's understanding of the tax rules and rates that exist in the foreign markets in which it invests.
Distributions are declared and recorded on the ex-dividend date. Income dividends and capital gain distributions are declared separately for each class. Income and capital gain distributions are determined in accordance with income tax regulations, which may differ from GAAP.
Annual Report
Notes to Financial Statements - continued
(Amounts in thousands except percentages)
3. Significant Accounting Policies - continued
Income Tax Information and Distributions to Shareholders - continued
Capital accounts within the financial statements are adjusted for permanent book-tax differences. These adjustments have no impact on net assets or the results of operations. Temporary book-tax differences will reverse in a subsequent period.
Book-tax differences are primarily due to foreign currency transactions, futures transactions, deferred trustees compensation, capital loss carryforwards and losses deferred due to wash sales and excise tax regulations.
The federal tax cost of investment securities and unrealized appreciation (depreciation) as of period end were as follows:
Gross unrealized appreciation | $ 2,274,584 |
Gross unrealized depreciation | (393,969) |
Net unrealized appreciation (depreciation) on securities and other investments | $ 1,880,615 |
| |
Tax Cost | $ 7,522,647 |
The tax-based components of distributable earnings as of period end were as follows:
Undistributed ordinary income | $ 138,443 |
Undistributed long-term capital gain | $ 639,616 |
Net unrealized appreciation (depreciation) | $ 1,880,586 |
The tax character of distributions paid was as follows:
| July 31, 2013 | July 31, 2012 |
Ordinary Income | $ 33,821 | $ - |
Repurchase Agreements. FMR has received an Exemptive Order from the SEC which permits the Fund and other affiliated entities of FMR to transfer uninvested cash balances into joint trading accounts which are then invested in repurchase agreements. The Fund may also invest directly with institutions in repurchase agreements. Repurchase agreements may be collateralized by government or non-government securities. Upon settlement date, collateral is held in segregated accounts with custodian banks and may be obtained in the event of a default of the counterparty. The Fund monitors, on a daily basis, the value of the collateral to ensure it is at least equal to the principal amount of the repurchase agreement (including accrued interest). In the event of a default by
Annual Report
3. Significant Accounting Policies - continued
Repurchase Agreements - continued
the counterparty, realization of the collateral proceeds could be delayed, during which time the value of the collateral may decline.
Restricted Securities. The Fund may invest in securities that are subject to legal or contractual restrictions on resale. These securities generally may be resold in transactions exempt from registration or to the public if the securities are registered. Disposal of these securities may involve time-consuming negotiations and expense, and prompt sale at an acceptable price may be difficult. Information regarding restricted securities is included at the end of the Fund's Schedule of Investments.
New Accounting Pronouncement. The Financial Accounting Standards Board issued in December 2011, Accounting Standard Update No. 2011-11, Disclosures about Offsetting Assets and Liabilities, and in January 2013, Accounting Standards Update No. 2013-1 Clarifying the Scope of Disclosures about Offsetting Assets and Liabilities. These updates create new disclosure requirements requiring entities to disclose both gross and net information for derivatives and other financial instruments that are either offset in the Statement of Assets and Liabilities or subject to an enforceable master netting arrangement or similar agreement. The disclosure requirements are effective for annual reporting periods beginning on or after January 1, 2013, and interim periods within those annual periods. Management expects that the impact of the update's adoption will be limited to additional financial statement disclosures as applicable.
4. Derivative Instruments.
Risk Exposures and the Use of Derivative Instruments. The Fund's investment objective allows the Fund to enter into various types of derivative contracts, including futures contracts. Derivatives are investments whose value is primarily derived from underlying assets, indices or reference rates and may be transacted on an exchange or over-the-counter (OTC). Derivatives may involve a future commitment to buy or sell a specified asset based on specified terms, to exchange future cash flows at periodic intervals based on a notional principal amount, or for one party to make one or more payments upon the occurrence of specified events in exchange for periodic payments from the other party.
The Fund used derivatives to increase returns and to manage exposure to certain risks as defined below. The success of any strategy involving derivatives depends on analysis of numerous economic factors, and if the strategies for investment do not work as intended, the Fund may not achieve its objectives.
Annual Report
Notes to Financial Statements - continued
(Amounts in thousands except percentages)
4. Derivative Instruments - continued
Risk Exposures and the Use of Derivative Instruments - continued
The Fund's use of derivatives increased or decreased its exposure to the following risk:
Equity Risk | Equity risk relates to the fluctuations in the value of financial instruments as a result of changes in market prices (other than those arising from interest rate risk or foreign exchange risk), whether caused by factors specific to an individual investment, its issuer, or all factors affecting all instruments traded in a market or market segment. |
The Fund is also exposed to additional risks from investing in derivatives, such as liquidity risk and counterparty credit risk. Liquidity risk is the risk that the Fund will be unable to close out the derivative in the open market in a timely manner. Counterparty credit risk is the risk that the counterparty will not be able to fulfill its obligation to the Fund. Counterparty credit risk related to exchange-traded futures contracts may be mitigated by the protection provided by the exchange on which they trade.
Investing in derivatives may involve greater risks than investing in the underlying assets directly and, to varying degrees, may involve risk of loss in excess of any initial investment and collateral received and amounts recognized in the Statement of Assets and Liabilities. In addition, there may be the risk that the change in value of the derivative contract does not correspond to the change in value of the underlying instrument.
Futures Contracts. A futures contract is an agreement between two parties to buy or sell a specified underlying instrument for a fixed price at a specified future date. The Fund used futures contracts to manage its exposure to the stock market.
Upon entering into a futures contract, a fund is required to deposit either cash or securities (initial margin) with a clearing broker in an amount equal to a certain percentage of the face value of the contract. Futures contracts are marked-to-market daily and subsequent daily payments (variation margin) are made or received by a fund depending on the daily fluctuations in the value of the futures contracts and are recorded as unrealized appreciation or (depreciation). This receivable and/or payable, if any, is included in daily variation margin for derivative instruments in the Statement of Assets and Liabilities. Realized gain or (loss) is recorded upon the expiration or closing of a futures contract.
Any open futures contracts at period end are presented in the Schedule of Investments under the caption "Futures Contracts." The underlying face amount at value reflects each contract's exposure to the underlying instrument or index at period end.
During the period the Fund recognized net realized gain (loss) of $826 related to its investment in futures contracts. This amount is included in the Statement of Operations.
Annual Report
5. Purchases and Sales of Investments.
Purchases and sales of securities, other than short-term securities, aggregated $8,614,135 and $9,279,939, respectively.
6. Fees and Other Transactions with Affiliates.
Management Fee. FMR and its affiliates provide the Fund with investment management related services for which the Fund pays a monthly management fee. The management fee is the sum of an individual fund fee rate that is based on an annual rate of .35% of the Fund's average net assets and an annualized group fee rate that averaged .26% during the period. The group fee rate is based upon the average net assets of all the mutual funds advised by FMR. The group fee rate decreases as assets under management increase and increases as assets under management decrease. In addition, the management fee is subject to a performance adjustment (up to a maximum of ±.20% of the Fund's average net assets over a 36 month performance period). The upward or downward adjustment to the management fee is based on the relative investment performance of OTC as compared to an appropriate benchmark index. For the period, the total annual management fee rate, including the performance adjustment, was .55% of the Fund's average net assets.
Transfer Agent Fees. Fidelity Investments Institutional Operations Company, Inc., (FIIOC), an affiliate of FMR, is the transfer, dividend disbursing and shareholder servicing agent for each class of the Fund. FIIOC receives account fees and asset-based fees that vary according to the account size and type of account of the shareholders of OTC. FIIOC receives an asset-based fee of Class K's average net assets. FIIOC pays for typesetting, printing and mailing of shareholder reports, except proxy statements. For the period, transfer agent fees for each class were as follows:
| Amount | % of
Average
Net Assets |
OTC | $ 10,208 | .18 |
Class K | 921 | .05 |
| $ 11,129 | |
Accounting and Security Lending Fees. Fidelity Service Company, Inc. (FSC), an affiliate of FMR, maintains the Fund's accounting records. The accounting fee is based on the level of average net assets for each month. Under a separate contract, FSC administers the security lending program. The security lending fee is based on the number and duration of lending transactions.
Brokerage Commissions. The Fund placed a portion of its portfolio transactions with brokerage firms which are affiliates of the investment adviser. Brokerage commissions are included in net realized gain (loss) and change in net unrealized appreciation
Annual Report
Notes to Financial Statements - continued
(Amounts in thousands except percentages)
6. Fees and Other Transactions with Affiliates - continued
Brokerage Commissions - continued
(depreciation) in the Statement of Operations. The commissions paid to these affiliated firms were $349 for the period.
Interfund Lending Program. Pursuant to an Exemptive Order issued by the SEC, the Fund, along with other registered investment companies having management contracts with FMR, may participate in an interfund lending program. This program provides an alternative credit facility allowing the funds to borrow from, or lend money to, other participating affiliated funds. At period end, there were no interfund loans outstanding. The Fund's activity in this program during the period for which loans were outstanding was as follows:
Borrower or Lender | Average Loan
Balance | Weighted Average Interest Rate | Interest
Expense |
Borrower | $ 11,969 | .39% | $ 10 |
7. Committed Line of Credit.
The Fund participates with other funds managed by FMR or an affiliate in a $4.25 billion credit facility (the "line of credit") to be utilized for temporary or emergency purposes to fund shareholder redemptions or for other short-term liquidity purposes. The Fund has agreed to pay commitment fees on its pro-rata portion of the line of credit, which amounted to $17 and is reflected in Miscellaneous expenses on the Statement of Operations. During the period, there were no borrowings on this line of credit.
8. Security Lending.
The Fund lends portfolio securities through a lending agent from time to time in order to earn additional income. For equity securities, a lending agent is used and may loan securities to certain qualified borrowers, including Fidelity Capital Markets (FCM), a broker-dealer affiliated with the Fund. On the settlement date of the loan, the Fund receives collateral (in the form of U.S. Treasury obligations, letters of credit and/or cash) against the loaned securities and maintains collateral in an amount not less than 100% of the market value of the loaned securities during the period of the loan. The market value of the loaned securities is determined at the close of business of the Fund and any additional required collateral is delivered to the Fund on the next business day. If the borrower defaults on its obligation to return the securities loaned because of insolvency or other reasons, the Fund may apply collateral received from the borrower against the obligation. The Fund may experience delays and costs in recovering the securities loaned. Any cash collateral received is invested in the Fidelity Securities Lending Cash Central Fund. The value of loaned securities and cash collateral at period end are
Annual Report
8. Security Lending - continued
disclosed on the Fund's Statement of Assets and Liabilities. The value of securities loaned to FCM at period end was $10,519. Security lending income represents the income earned on investing cash collateral, less rebates paid to borrowers and any lending agent fees associated with the loan, plus any premium payments received for lending certain types of securities. Security lending income is presented in the Statement of Operations as a component of income from Fidelity Central Funds, and includes $3,604 from securities loaned to FCM.
9. Bank Borrowings.
The Fund is permitted to have bank borrowings for temporary or emergency purposes to fund shareholder redemptions or for other short-term liquidity requirements. The Fund has established borrowing arrangements with certain banks. The interest rate on the borrowings is the bank's base rate, as revised from time to time. The average loan balance during the period for which loans were outstanding amounted to $27,714. The weighted average interest rate was .66%. The interest expense amounted to $1 under the bank borrowing program. At period end, there were no bank borrowings outstanding.
10. Expense Reductions.
Commissions paid to certain brokers with whom FMR places trades on behalf of the Fund include an amount in addition to trade execution, which is rebated back to the Fund to offset certain expenses. This amount totaled $1,568 for the period. In addition, through arrangements with the Fund's custodian, credits realized as a result of uninvested cash balances were used to reduce the Fund's expenses. During the period, these credits reduced the Fund's custody expenses by four hundred forty-one dollars.
In addition, FMR reimbursed a portion of the Fund's operating expenses during the period in the amount of $7.
11. Distributions to Shareholders.
Distributions to shareholders of each class were as follows:
Years ended July 31, | 2013 | 2012 |
From net investment income | | |
OTC | $ 24,686 | $ - |
Class K | 9,135 | - |
Total | $ 33,821 | $ - |
Annual Report
Notes to Financial Statements - continued
(Amounts in thousands except percentages)
12. Share Transactions.
Transactions for each class of shares were as follows:
| Shares | Dollars |
Years ended July 31, | 2013 | 2012 | 2013 | 2012 |
OTC | | | | |
Shares sold | 13,349 | 24,727 | $ 888,988 | $ 1,432,210 |
Reinvestment of distributions | 400 | - | 23,934 | - |
Shares redeemed | (24,580) | (36,677) | (1,536,509) | (2,097,412) |
Net increase (decrease) | (10,831) | (11,950) | $ (623,587) | $ (665,202) |
Class K | | | | |
Shares sold | 8,116 | 15,671 | $ 517,177 | $ 918,563 |
Reinvestment of distributions | 152 | - | 9,135 | - |
Shares redeemed | (8,251) | (10,166) | (525,561) | (594,038) |
Net increase (decrease) | 17 | 5,505 | $ 751 | $ 324,525 |
13. Other.
The Fund's organizational documents provide former and current trustees and officers with a limited indemnification against liabilities arising in connection with the performance of their duties to the Fund. In the normal course of business, the Fund may also enter into contracts that provide general indemnifications. The Fund's maximum exposure under these arrangements is unknown as this would be dependent on future claims that may be made against the Fund. The risk of material loss from such claims is considered remote.
Annual Report
To the Trustees of Fidelity Securities Fund and Shareholders of Fidelity OTC Portfolio:
We have audited the accompanying statement of assets and liabilities of Fidelity OTC Portfolio (the Fund), a fund of Fidelity Securities Fund, including the schedule of investments, as of July 31, 2013, and the related statement of operations for the year then ended, the statement of changes in net assets for each of the two years in the period then ended, and the financial highlights for each of the five years in the period then ended. These financial statements and financial highlights are the responsibility of the Fund's management. Our responsibility is to express an opinion on these financial statements and financial highlights based on our audits.
We conducted our audits in accordance with the standards of the Public Company Accounting Oversight Board (United States). Those standards require that we plan and perform the audit to obtain reasonable assurance about whether the financial statements and financial highlights are free of material misstatement. The Fund is not required to have, nor were we engaged to perform, an audit of its internal control over financial reporting. Our audits included consideration of internal control over financial reporting as a basis for designing audit procedures that are appropriate in the circumstances, but not for the purpose of expressing an opinion on the effectiveness of the Fund's internal control over financial reporting. Accordingly, we express no such opinion. An audit also includes examining, on a test basis, evidence supporting the amounts and disclosures in the financial statements, assessing the accounting principles used and significant estimates made by management, as well as evaluating the overall financial statement presentation. Our procedures included confirmation of securities owned as of July 31, 2013, by correspondence with the custodians and brokers; where replies were not received from brokers, we performed other auditing procedures. We believe that our audits provide a reasonable basis for our opinion.
In our opinion, the financial statements and financial highlights referred to above present fairly, in all material respects, the financial position of Fidelity OTC Portfolio as of July 31, 2013, the results of its operations for the year then ended, the changes in its net assets for each of the two years in the period then ended, and the financial highlights for each of the five years in the period then ended, in conformity with accounting principles generally accepted in the United States of America.
DELOITTE & TOUCHE LLP
Boston, Massachusetts
September 13, 2013
Annual Report
The Trustees, Member of the Advisory Board, and executive officers of the trust and fund, as applicable, are listed below. The Board of Trustees governs the fund and is responsible for protecting the interests of shareholders. The Trustees are experienced executives who meet periodically throughout the year to oversee the fund's activities, review contractual arrangements with companies that provide services to the fund, oversee management of the risks associated with such activities and contractual arrangements, and review the fund's performance. Except for James C. Curvey, Ned C. Lautenbach, Ronald P. O'Hanley, and William S. Stavropoulos, each of the Trustees oversees 166 Fidelity funds. Mr. Curvey oversees 387 Fidelity funds. Mr. Lautenbach, Mr. O'Hanley, and Mr. Stavropoulos each oversees 230 Fidelity funds.
The Trustees hold office without limit in time except that (a) any Trustee may resign; (b) any Trustee may be removed by written instrument, signed by at least two-thirds of the number of Trustees prior to such removal; (c) any Trustee who requests to be retired or who has become incapacitated by illness or injury may be retired by written instrument signed by a majority of the other Trustees; and (d) any Trustee may be removed at any special meeting of shareholders by a two-thirds vote of the outstanding voting securities of the trust. Each Trustee who is not an interested person of the trust and the fund (as defined in the 1940 Act) (Independent Trustee), shall retire not later than the last day of the calendar year in which his or her 75th birthday occurs. The Independent Trustees may waive this mandatory retirement age policy with respect to individual Trustees. The executive officers and Advisory Board Member hold office without limit in time, except that any officer and Advisory Board Member may resign or may be removed by a vote of a majority of the Trustees at any regular meeting or any special meeting of the Trustees. Except as indicated, each individual has held the office shown or other offices in the same company for the past five years.
Experience, Skills, Attributes, and Qualifications of the Fund's Trustees. The Governance and Nominating Committee has adopted a statement of policy that describes the experience, qualifications, attributes, and skills that are necessary and desirable for potential Independent Trustee candidates (Statement of Policy). The Board believes that each Trustee satisfied at the time he or she was initially elected or appointed a Trustee, and continues to satisfy, the standards contemplated by the Statement of Policy. The Governance and Nominating Committee also engages professional search firms to help identify potential Independent Trustee candidates who have the experience, qualifications, attributes, and skills consistent with the Statement of Policy. From time to time, additional criteria based on the composition and skills of the current Independent Trustees, as well as experience or skills that may be appropriate in light of future changes to board composition, business conditions, and regulatory or other developments, have also been considered by the professional search firms and the Governance and Nominating Committee. In addition, the Board takes into account the Trustees' commitment and participation in Board and committee meetings, as well as their leadership of standing and ad hoc committees throughout their tenure.
Annual Report
In determining that a particular Trustee was and continues to be qualified to serve as a Trustee, the Board has considered a variety of criteria, none of which, in isolation, was controlling. The Board believes that, collectively, the Trustees have balanced and diverse experience, qualifications, attributes, and skills, which allow the Board to operate effectively in governing the fund and protecting the interests of shareholders. Information about the specific experience, skills, attributes, and qualifications of each Trustee, which in each case led to the Board's conclusion that the Trustee should serve (or continue to serve) as a trustee of the fund, is provided below.
Board Structure and Oversight Function. James C. Curvey is an interested person (as defined in the 1940 Act) and currently serves as Chairman. The Trustees have determined that an interested Chairman is appropriate and benefits shareholders because an interested Chairman has a personal and professional stake in the quality and continuity of services provided to the fund. Independent Trustees exercise their informed business judgment to appoint an individual of their choosing to serve as Chairman, regardless of whether the Trustee happens to be independent or a member of management. The Independent Trustees have determined that they can act independently and effectively without having an Independent Trustee serve as Chairman and that a key structural component for assuring that they are in a position to do so is for the Independent Trustees to constitute a substantial majority for the Board. The Independent Trustees also regularly meet in executive session. Ned C. Lautenbach serves as Chairman of the Independent Trustees and as such (i) acts as a liaison between the Independent Trustees and management with respect to matters important to the Independent Trustees and (ii) with management prepares agendas for Board meetings.
Fidelity funds are overseen by different Boards of Trustees. The fund's Board oversees Fidelity's equity and high income funds and another Board oversees Fidelity's investment-grade bond, money market, and asset allocation funds. The asset allocation funds may invest in Fidelity funds overseen by the fund's Board. The use of separate Boards, each with its own committee structure, allows the Trustees of each group of Fidelity funds to focus on the unique issues of the funds they oversee, including common research, investment, and operational issues. On occasion, the separate Boards establish joint committees to address issues of overlapping consequences for the Fidelity funds overseen by each Board.
The Trustees operate using a system of committees to facilitate the timely and efficient consideration of all matters of importance to the Trustees, the fund, and fund shareholders and to facilitate compliance with legal and regulatory requirements and oversight of the fund's activities and associated risks. The Board, acting through its committees, has charged FMR and its affiliates with (i) identifying events or circumstances the occurrence of which could have demonstrably adverse effects on the fund's business and/or reputation; (ii) implementing processes and controls to lessen the possibility that such events or circumstances occur or to mitigate the effects of such events or circumstances if they do occur; and (iii) creating and maintaining a system designed to evaluate continuously business and market conditions in order to facilitate the identification and implementation processes described in (i) and (ii) above. Because the day-to-day operations and activities of the fund are carried out by or through FMR, its affiliates and other service providers, the fund's exposure to risks is mitigated but not eliminated by the processes overseen by the Trustees. While each of the Board's committees has responsibility for overseeing different aspects of the fund's activities, oversight is exercised primarily through the Operations, Audit, and Compliance Committees. In addition, the Independent Trustees have worked with FMR to enhance the Board's oversight of investment and financial risks, legal and regulatory risks, technology risks, and operational risks, including the development of additional risk reporting to the Board. For example, a working group comprised of Independent Trustees and FMR has worked and continues to work to review the Fidelity funds' valuation-related activities, reporting and risk management. Appropriate personnel, including but not limited to the fund's Chief Compliance Officer (CCO), FMR's internal auditor, the independent accountants, the fund's Treasurer and portfolio management personnel, make periodic reports to the Board's committees, as appropriate, including an annual review of FMR's risk management program for the Fidelity funds. The responsibilities of each standing committee, including their oversight responsibilities, are described further under "Standing Committees of the Fund's Trustees."
Annual Report
Trustees and Officers - continued
The fund's Statement of Additional Information (SAI) includes more information about the Trustees. To request a free copy, call Fidelity at 1-800-835-5092.
Interested Trustees*:
Correspondence intended for each Trustee who is an interested person may be sent to Fidelity Investments, 245 Summer Street, Boston, Massachusetts 02210.
Name, Year of Birth; Principal Occupations and Other Relevant Experience+ |
James C. Curvey (1935) |
| Year of Election or Appointment: 2007 Mr. Curvey is Trustee and Chairman of the Board of Trustees of certain Trusts. Mr. Curvey also serves as Trustee (2007-present) of other investment companies advised by FMR. Mr. Curvey is a Director of Fidelity Investments Money Management, Inc. (2009-present), Director of Fidelity Research & Analysis Co. (2009-present) and Director of FMR and FMR Co., Inc. (2007-present). Mr. Curvey is also Vice Chairman (2007-present) and Director of FMR LLC. In addition, Mr. Curvey serves as an Overseer for the Boston Symphony Orchestra and a member of the Trustees of Villanova University. Previously, Mr. Curvey was the Vice Chairman (2006-2007) and Director (2000-2007) of FMR Corp. |
Ronald P. O'Hanley (1957) |
| Year of Election or Appointment: 2011 Mr. O'Hanley serves as a Trustee and Chairman of the Board of Trustees of other Fidelity funds (2013-present), and is Director of FMR Co., Inc. (2010-present), Director of Fidelity Investments Money Management, Inc. (2010-present), Director of Fidelity Research & Analysis Company (2010-present), President of Fidelity Asset Management and Corporate Services and a Member of Fidelity's Executive Committee (2010-present). Previously, Mr. O'Hanley served as President and Chief Executive Officer of BNY Mellon Asset Management (2007-2010). Mr. O'Hanley also served as Vice Chairman of Bank New York Mellon Corp. and a member of that firm's Executive Committee. Prior to the 2007 merger of The Bank of New York and Mellon Financial Corporation, he was Vice Chairman of Mellon Financial Corporation and President and Chief Executive Officer of Mellon Asset Management. He joined Mellon in February 1997. Mr. O'Hanley currently serves as Chairman of the Boston Public Library Foundation Board of Directors and sits on the Board of Directors of Beth Israel Deaconess Medical Center, the Board of Trustees of the Marine Biological Laboratory and the Advisory Board of the Maxwell School of Citizenship and Public Administration at Syracuse University. Mr. O'Hanley also chairs the Council on Asset Management for the Financial Services Roundtable and is a member of the Board of Directors of Institutional Investor's U.S. Institute. |
* Trustees have been determined to be "Interested Trustees" by virtue of, among other things, their affiliation with the trust or various entities under common control with FMR.
+ The information above includes each Trustee's principal occupation during the last five years and other information relating to the experience, attributes, and skills relevant to each Trustee's qualifications to serve as a Trustee, which led to the conclusion that each Trustee should serve as a Trustee for the fund.
Annual Report
Trustees and Officers - continued
Independent Trustees:
Correspondence intended for each Independent Trustee (that is, the Trustees other than the Interested Trustees) may be sent to Fidelity Investments, P.O. Box 55235, Boston, Massachusetts 02205-5235.
Name, Year of Birth; Principal Occupations and Other Relevant Experience+ |
Dennis J. Dirks (1948) |
| Year of Election or Appointment: 2005 Prior to his retirement in May 2003, Mr. Dirks was Chief Operating Officer and a member of the Board of The Depository Trust & Clearing Corporation (DTCC). He also served as President, Chief Operating Officer, and Board member of The Depository Trust Company (DTC) and President and Board member of the National Securities Clearing Corporation (NSCC). In addition, Mr. Dirks served as Chief Executive Officer and Board member of the Government Securities Clearing Corporation, Chief Executive Officer and Board member of the Mortgage-Backed Securities Clearing Corporation, as a Trustee and a member of the Finance Committee of Manhattan College (2005-2008), and as a Trustee and a member of the Finance Committee of AHRC of Nassau County (2006-2008). Mr. Dirks is a member of the Independent Directors Council (IDC) Governing Council (2010-present) and Board of Directors for The Brookville Center for Children's Services, Inc. (2009-present). |
Alan J. Lacy (1953) |
| Year of Election or Appointment: 2008 Mr. Lacy serves as Senior Adviser (2007-present) of Oak Hill Capital Partners, L.P. (private equity). Mr. Lacy also served as Chief Executive Officer (2000-2005) and Vice Chairman (2005-2006) of Sears Holdings Corporation and Sears, Roebuck and Co. (retail). In addition, Mr. Lacy serves as a member of the Board of Directors of Dave & Buster's Entertainment, Inc. (restaurant and entertainment complexes, 2010-present), Earth Fare, Inc. (retail grocery, 2012-present), The Hillman Companies, Inc. (hardware wholesalers, 2010-present), and Bristol-Myers Squibb Company (global pharmaceuticals, 2008-present). Mr. Lacy is a member of the Board of Trustees of The National Parks Conservation Association (2006-present). Previously, Mr. Lacy served as Chairman of the Board of Trustees of the National Parks Conservation Association (2008-2011) and as a member of the Board of Directors for the Western Union Company (global money transfer, 2006-2011). |
Ned C. Lautenbach (1944) |
| Year of Election or Appointment: 2000 Mr. Lautenbach is Chairman of the Independent Trustees of the Equity and High Income Funds (2006-present) and serves as a Trustee of other Fidelity funds (2013-present). Mr. Lautenbach currently serves as the Lead Director of the Eaton Corporation Board of Directors (diversified industrial, 1997-present). Mr. Lautenbach is Chairman of the Board of Directors of the Philharmonic Center for the Arts in Naples, Florida (2012-present) and a member of the Council on Foreign Relations (1994-present). Previously, Mr. Lautenbach was a Partner/Advisory Partner at Clayton, Dubilier & Rice, LLC (private equity investment, 1998-2010), as well as a Director of Sony Corporation (2006-2007). |
Joseph Mauriello (1944) |
| Year of Election or Appointment: 2008 Prior to his retirement in January 2006, Mr. Mauriello served in numerous senior management positions including Deputy Chairman and Chief Operating Officer (2004-2005), and Vice Chairman of Financial Services (2002-2004) of KPMG LLP US (professional services, 1965-2005). Mr. Mauriello currently serves as a member of the Board of Directors of XL Group plc. (global insurance and re-insurance, 2006-present). Previously, Mr. Mauriello served as a Director of the Hamilton Funds of the Bank of New York (2006-2007) and of Arcadia Resources Inc. (health care services and products, 2007-2012). |
Robert W. Selander (1950) |
| Year of Election or Appointment: 2011 Previously, Mr. Selander served as a Member of the Advisory Board of Fidelity's Equity and High Income Funds (2011), Executive Vice Chairman (2010), Chief Executive Officer (2009-2010), and President and Chief Executive Officer (1997-2009) of Mastercard, Inc. |
Cornelia M. Small (1944) |
| Year of Election or Appointment: 2005 Ms. Small is a member of the Board of Directors (2009-present) and Chair of the Investment Committee (2010-present) of the Teagle Foundation. Ms. Small also serves on the Investment Committee of the Berkshire Taconic Community Foundation (2008-present). Previously, Ms. Small served as Chairperson (2002-2008) and a member of the Investment Committee and Chairperson (2008-2012) and a member of the Board of Trustees of Smith College. In addition, Ms. Small served as Chief Investment Officer, Director of Global Equity Investments, and a member of the Board of Directors of Scudder, Stevens & Clark and Scudder Kemper Investments. |
William S. Stavropoulos (1939) |
| Year of Election or Appointment: 2002 Mr. Stavropoulos is Vice Chairman of the Independent Trustees of the Equity and High Income Funds (2006-present) and serves as a Trustee of other Fidelity funds (2013-present). Mr. Stavropoulos serves as President and Founder of the Michigan Baseball Foundation, the Great Lakes Loons (2007-present). Mr. Stavropoulos is Chairman Emeritus of the Board of Directors of The Dow Chemical Company, where he previously served in numerous senior management positions, including President, CEO (1995-2000; 2002-2004), Chairman of the Executive Committee (2000-2006), and as a member of the Board of Directors (1990-2006). Currently, Mr. Stavropoulos is Chairman of the Board of Directors of Univar Inc. (global distributor of commodity and specialty chemicals), a Director of Teradata Corporation (data warehousing and technology solutions), and Maersk Inc. (industrial conglomerate), and a member of the Advisory Board for Metalmark Capital LLC (private equity investment, 2005-present). Mr. Stavropoulos is an operating advisor to Clayton, Dubilier & Rice, LLC (private equity investment). In addition, Mr. Stavropoulos is a member of the University of Notre Dame Advisory Council for the College of Science, a Trustee of the Rollin L. Gerstacker Foundation, and a Director of the Naples Philharmonic Center for the Arts. Previously, Mr. Stavropoulos served as a Director of Chemical Financial Corporation (bank holding company, 1993-2012) and Tyco International, Ltd. (multinational manufacturing and services, 2007-2012). |
David M. Thomas (1949) |
| Year of Election or Appointment: 2008 Previously, Mr. Thomas served as Executive Chairman (2005-2006) and Chairman and Chief Executive Officer (2000-2005) of IMS Health, Inc. (pharmaceutical and healthcare information solutions), and a Director of Fortune Brands, Inc. (consumer products, 2000-2011). In addition, Mr. Thomas serves as Non-Executive Chairman of the Board of Directors of Fortune Brands Home and Security (home and security products, 2011-present), and as a member of the Board of Directors of Interpublic Group of Companies, Inc. (marketing communication, 2004-present). |
+ The information above includes each Trustee's principal occupation during the last five years and other information relating to the experience, attributes, and skills relevant to each Trustee's qualifications to serve as a Trustee, which led to the conclusion that each Trustee should serve as a Trustee for the fund.
Annual Report
Advisory Board Member and Executive Officers:
Correspondence intended for each executive officer and Peter S. Lynch may be sent to Fidelity Investments, 245 Summer Street, Boston, Massachusetts 02210.
Name, Year of Birth; Principal Occupation |
Peter S. Lynch (1944) |
| Year of Election or Appointment: 2003 Member of the Advisory Board of Fidelity's Equity and High Income Funds. Mr. Lynch is Vice Chairman and a Director of FMR and FMR Co., Inc. In addition, Mr. Lynch serves as a Trustee of Boston College and as the Chairman of the Inner-City Scholarship Fund. Previously, Mr. Lynch served on the Special Olympics International Board of Directors (1997-2006). |
Kenneth B. Robins (1969) |
| Year of Election or Appointment: 2008 President and Treasurer of Fidelity's Equity and High Income Funds. Mr. Robins also serves as President and Treasurer (2008-present) and Assistant Treasurer (2009-present) of other Fidelity funds and is an employee of Fidelity Investments (2004-present). Mr. Robins serves as Executive Vice President of Fidelity Investments Money Management, Inc. (FIMM) (2013-present). Previously, Mr. Robins served as Deputy Treasurer of the Fidelity funds (2005-2008) and Treasurer and Chief Financial Officer of The North Carolina Capital Management Trust: Cash and Term Portfolios (2006-2008). |
Bruce T. Herring (1965) |
| Year of Election or Appointment: 2006 Vice President of certain Equity Funds. Mr. Herring also serves as Vice President of other Fidelity funds (2013-present), Chief Investment Officer of Fidelity Global Asset Allocation (GAA) (2013-present), Chief Investment Officer and Director of Fidelity Management & Research (U.K.) Inc. (2010-present), Group Chief Investment Officer of FMR, and President of Fidelity Research & Analysis Company (2010-present). Previously, Mr. Herring served as Vice President (2005-2006) and Senior Vice President (2006-2007) of Fidelity Management & Research Company, Vice President of FMR Co., Inc. (2001-2007) and as a portfolio manager for Fidelity U.S. Equity Funds. |
Brian B. Hogan (1964) |
| Year of Election or Appointment: 2009 Vice President of Equity and High Income Funds. Mr. Hogan also serves as Vice President of other Fidelity funds (2009-present) and President of FMR's Equity Division (2009-present). Previously, Mr. Hogan served as Senior Vice President, Equity Research of FMR (2006-2009) and as a portfolio manager. |
Scott C. Goebel (1968) |
| Year of Election or Appointment: 2008 Secretary and Chief Legal Officer (CLO) of the Fidelity funds. Mr. Goebel also serves as Secretary of Fidelity Investments Money Management, Inc. (FIMM) (2010-present) and Fidelity Research and Analysis Company (FRAC) (2010-present); Secretary and CLO of The North Carolina Capital Management Trust: Cash and Term Portfolios (2008-present); General Counsel, Secretary, and Senior Vice President of FMR (2008-present) and FMR Co., Inc. (2008-present); employed by FMR LLC or an affiliate (2001-present); Chief Legal Officer of Fidelity Management & Research (Hong Kong) Limited (2008-present) and Assistant Secretary of Fidelity Management & Research (Japan) Inc. (2008-present), and Fidelity Management & Research (U.K.) Inc. (2008-present). Previously, Mr. Goebel served as Assistant Secretary of FIMM (2008-2010), FRAC (2008-2010), and the Funds (2007-2008) and as Vice President and Secretary of Fidelity Distributors Corporation (FDC) (2005-2007). |
William C. Coffey (1969) |
| Year of Election or Appointment: 2009 Assistant Secretary of Fidelity's Equity and High Income Funds. Mr. Coffey also serves as Assistant Secretary of other Fidelity funds (2009-present), Senior Vice President and Deputy General Counsel of FMR LLC (2010-present), and is an employee of Fidelity Investments. Previously, Mr. Coffey served as Vice President and Associate General Counsel of FMR LLC (2005-2009). |
Elizabeth Paige Baumann (1968) |
| Year of Election or Appointment: 2012 Anti-Money Laundering (AML) Officer of the Fidelity funds. Ms. Baumann also serves as AML Officer of The North Carolina Capital Management Trust: Cash and Term Portfolios (2012-present), Chief AML Officer of FMR LLC (2012-present), and is an employee of Fidelity Investments. Previously, Ms. Baumann served as Vice President and Deputy Anti-Money Laundering Officer (2007-2012). |
Christine Reynolds (1958) |
| Year of Election or Appointment: 2008 Chief Financial Officer of the Fidelity funds. Ms. Reynolds became President of Fidelity Pricing and Cash Management Services (FPCMS) in August 2008. Ms. Reynolds served as Chief Operating Officer of FPCMS (2007-2008). Previously, Ms. Reynolds served as President, Treasurer, and Anti-Money Laundering officer of the Fidelity funds (2004-2007). |
Joseph A. Hanlon (1968) |
| Year of Election or Appointment: 2012 Chief Compliance Officer of Fidelity's Equity and High Income Funds. Mr. Hanlon also serves as Chief Compliance Officer of other Fidelity funds (2012-present). Mr. Hanlon serves as Compliance Officer of FMR, FMR Co., Inc., Fidelity Investments Money Management, Inc. (FIMM), Fidelity Research and Analysis Company (FRAC), and Fidelity Management & Research (Hong Kong) (2009-present), as Senior Vice President of the Fidelity Asset Management Division (2009-present), and is an employee of Fidelity Investments. Previously, Mr. Hanlon served as Compliance Officer of Fidelity Management & Research (Japan) Inc. (2009-
2013), Strategic Advisers, Inc. (2009-2013), and Fidelity Management & Research (U.K.) Inc. (2009-2013). |
Joseph F. Zambello (1957) |
| Year of Election or Appointment: 2011 Deputy Treasurer of the Fidelity funds. Mr. Zambello is an employee of Fidelity Investments. Previously, Mr. Zambello served as Vice President of FMR's Program Management Group (2009-2011) and Vice President of the Transfer Agent Oversight Group (2005-2009). |
Adrien E. Deberghes (1967) |
| Year of Election or Appointment: 2008 Deputy Treasurer of Fidelity's Equity and High Income Funds. Mr. Deberghes also serves as Vice President (2011-present), Deputy Treasurer (2008-present), and Assistant Treasurer (2010-present) of other Fidelity funds, and is an employee of Fidelity Investments (2008-
present). Previously, Mr. Deberghes served as Senior Vice President of Mutual Fund Administration at State Street Corporation (2007-2008), Senior Director of Mutual Fund Administration at Investors Bank & Trust (2005-2007), and Director of Finance for Dunkin' Brands (2000-2005). |
Stephen Sadoski (1971) |
| Year of Election or Appointment: 2012 Deputy Treasurer of Fidelity's Equity and High Income Funds. Mr. Sadoski also serves as Deputy Treasurer of other Fidelity funds (2012-present) and is an employee of Fidelity Investments (2012-present). Previously, Mr. Sadoski served as Assistant Treasurer of Fidelity's Fixed Income and Asset Allocation Funds (2012-2013), an assistant chief accountant in the Division of Investment Management of the Securities and Exchange Commission (SEC) (2009-2012) and as a senior manager at Deloitte & Touche LLP (1997-2009). |
Stacie M. Smith (1974) |
| Year of Election or Appointment: 2013 Deputy Treasurer of Fidelity's Equity and High Income Funds. Ms. Smith also serves as Deputy Treasurer of other Fidelity funds (2013-present) and is an employee of Fidelity Investments (2009-present). Previously, Ms. Smith served as Senior Audit Manager of Ernst & Young LLP (1996-2009). |
Stephanie J. Dorsey (1969) |
| Year of Election or Appointment: 2010 Assistant Treasurer of Fidelity's Equity and High Income Funds. Ms. Dorsey also serves as President and Treasurer (2013-present) and Assistant Treasurer (2010-present) of other Fidelity funds, Treasurer and Chief Financial Officer of The North Carolina Capital Management Trust: Cash and Term Portfolios (2013-present), and is an employee of Fidelity Investments (2008-present). Previously, Ms. Dorsey served as Deputy Treasurer of Fidelity's Fixed Income and Asset Allocation Funds (2008-2013), Treasurer (2004-2008) of the JPMorgan Mutual Funds and Vice President (2004-2008) of JPMorgan Chase Bank. |
Gary W. Ryan (1958) |
| Year of Election or Appointment: 2005 Assistant Treasurer of the Fidelity funds. Mr. Ryan is an employee of Fidelity Investments. Previously, Mr. Ryan served as Vice President of Fund Reporting in Fidelity Pricing and Cash Management Services (FPCMS) (1999-2005). |
Jonathan Davis (1968) |
| Year of Election or Appointment: 2010 Assistant Treasurer of the Fidelity funds. Mr. Davis is also Assistant Treasurer of Fidelity Rutland Square Trust II and Fidelity Commonwealth Trust II. Mr. Davis is an employee of Fidelity Investments. Previously, Mr. Davis served as Vice President and Associate General Counsel of FMR LLC (2003-2010). |
Annual Report
The Board of Trustees of Fidelity OTC Portfolio voted to pay to shareholders of record at the opening of business on record date, the following distributions per share derived from capital gains realized from sales of portfolio securities; and dividends derived from net investment income:
| Pay Date | Record Date | Dividends | Capital Gains |
Class K | 09/09/13 | 09/06/13 | $0.098 | $6.680 |
The fund hereby designates as a capital gain dividend with respect to the taxable year ended July 31, 2013, $639,615,759 or, if subsequently determined to be different, the net capital gain of such year.
Class K designates 100% of the dividends distributed during the fiscal year as qualifying for the dividends-received deduction for corporate shareholders.
Class K designates 100% of the dividends distributed during the fiscal year as amounts which can be taken into account as a dividend for the purposes of the maximum rate under section 1(h)(11) of the Internal Revenue Code.
The fund will notify shareholders in January 2014 of amounts for use in preparing 2013 income tax returns.
Annual Report
Board Approval of Investment Advisory Contracts and Management Fees
Fidelity OTC Portfolio
Each year, the Board of Trustees, including the Independent Trustees (together, the Board), votes on the renewal of the management contract and sub-advisory agreements (together, the Advisory Contracts) for the fund. The Board, assisted by the advice of fund counsel and Independent Trustees' counsel, requests and considers a broad range of information relevant to the renewal of the Advisory Contracts throughout the year.
The Board meets regularly and, at each of its meetings, covers an extensive agenda of topics and materials and considers factors that are relevant to its annual consideration of the renewal of the fund's Advisory Contracts, including the services and support provided to the fund and its shareholders. The Board has established various standing committees, each composed of and chaired by Independent Trustees with varying backgrounds, to which the Board has assigned specific subject matter responsibilities in order to enhance effective decision-making by the Board. The Board, acting directly and through its Committees, requests and receives information concerning the annual consideration of the renewal of the fund's Advisory Contracts. The Board also meets as needed to consider matters specifically related to the Board's annual consideration of the renewal of Advisory Contracts. Members of the Board may also meet with trustees of other Fidelity funds through ad hoc joint committees to discuss certain matters relevant to the Fidelity funds.
At its July 2013 meeting, the Board, including the Independent Trustees, unanimously determined to renew the fund's Advisory Contracts. In reaching its determination, the Board considered all factors it believed relevant, including (i) the nature, extent, and quality of the services to be provided to the fund and its shareholders (including the investment performance of the fund); (ii) the competitiveness of the fund's management fee and total expense ratio relative to peer funds; (iii) the total costs of the services to be provided by and the profits to be realized by Fidelity from its relationship with the fund; (iv) the extent to which economies of scale exist and would be realized as the fund grows; and (v) whether fee levels reflect these economies of scale, if any, for the benefit of fund shareholders.
In considering whether to renew the Advisory Contracts for the fund, the Board reached a determination, with the assistance of fund counsel and Independent Trustees' counsel and through the exercise of its business judgment, that the renewal of the Advisory Contracts was in the best interests of the fund and its shareholders and that the compensation payable under the Advisory Contracts was fair and reasonable. The Board's decision to renew the Advisory Contracts was not based on any single factor, but rather was based on a comprehensive consideration of all the information provided to the Board at its meetings throughout the year. The Board, in reaching its determination to renew the Advisory Contracts, was aware that shareholders in the fund have a broad range of investment choices available to them, including a wide choice among mutual funds offered by Fidelity's competitors, and that the fund's shareholders, who have the opportunity to review and weigh the disclosure provided by the fund in its prospectus and other public disclosures, have chosen to invest in this fund, which is a part of the Fidelity family of funds.
Annual Report
Nature, Extent, and Quality of Services Provided. The Board considered the staffing within the investment adviser, Fidelity Management & Research Company (FMR), and the sub-advisers (together, the Investment Advisers) as it relates to the fund, including the backgrounds of the fund's investment personnel, and also considered the fund's investment objective, strategies, and related investment philosophy. The Independent Trustees also had discussions with senior management of Fidelity's investment operations and investment groups. The Board considered the structure of the portfolio manager compensation program and whether this structure provides appropriate incentives to act in the best interests of the fund.
Resources Dedicated to Investment Management and Support Services. The Board and the Fund Oversight and Research Committees reviewed the general qualifications and capabilities of the Investment Advisers' investment staff, including its size, education, experience, and resources, as well as the Investment Advisers' approach to recruiting, training, managing, and compensating investment personnel. The Board noted that FMR has continued to increase the resources devoted to non-U.S. offices, including expansion of Fidelity's global investment organization. The Board also noted that Fidelity's analysts have extensive resources, tools and capabilities that allow them to conduct sophisticated quantitative and fundamental analysis, as well as credit analysis of issuers, counterparties and guarantors. Further, the Board believes that Fidelity's investment professionals have sufficient access to global information and data so as to provide competitive investment results over time, and that those professionals also have access to sophisticated tools that permit them to assess portfolio construction and risk and performance attribution characteristics continuously, as well as to transmit new information and research conclusions rapidly around the world. Additionally, in its deliberations, the Board considered the Investment Advisers' trading and risk management capabilities and resources, which are an integral part of the investment management process.
Shareholder and Administrative Services. The Board considered (i) the nature, extent, quality, and cost of advisory, administrative, and shareholder services performed by the Investment Advisers and their affiliates under the Advisory Contracts and under separate agreements covering transfer agency, pricing and bookkeeping, and securities lending services for the fund; (ii) the nature and extent of the supervision of third party service providers, principally custodians and subcustodians; and (iii) the resources devoted to, and the record of compliance with, the fund's compliance policies and procedures. The Board also reviewed the allocation of fund brokerage, including allocations to brokers affiliated with the Investment Advisers, the use of brokerage commissions to pay fund expenses, and the use of "soft" commission dollars to pay for research services.
Annual Report
Board Approval of Investment Advisory Contracts and
Management Fees - continued
The Board noted that the growth of fund assets over time across the complex allows Fidelity to reinvest in the development of services designed to enhance the value or convenience of the Fidelity funds as investment vehicles. These services include 24-hour access to account information and market information through telephone representatives and over the Internet, investor education materials and asset allocation tools, and the expanded availability of Fidelity Investor Centers.
Investment in a Large Fund Family. The Board considered the benefits to shareholders of investing in a Fidelity fund, including the benefits of investing in a fund that is part of a large family of funds offering a variety of investment disciplines and providing a large variety of mutual fund investor services. The Board noted that Fidelity had taken, or had made recommendations that resulted in the Fidelity funds taking, a number of actions over the previous year that benefited particular funds, including (i) continuing to dedicate additional resources to investment research and to the support of the senior management team that oversees asset management; (ii) persisting in efforts to enhance Fidelity's global research capabilities; (iii) launching new funds and making other enhancements to meet client needs for global and income-oriented solutions; (iv) continuing to launch dedicated lower cost underlying funds to meet portfolio construction needs related to expanding underlying fund options for Fidelity funds of funds, specifically for the Freedom Fund product lines; (v) rationalizing product lines and gaining increased efficiencies through the mergers of several funds into other funds; (vi) strengthening Fidelity's index fund offerings by reducing investment minimums and adopting or lowering existing expense caps for certain funds and classes; (vii) enhancing Global Asset Allocation product offerings by launching new funds and strategies, including "open architecture" target date funds that utilize affiliated and unaffiliated sub-advisers; (viii) modifying the eligibility criteria for Institutional Class shares of Advisor funds to increase their marketability to a portion of the defined contribution plan market; (ix) creating a new low-cost retirement share class for certain Advisor funds to appeal to large retirement plans; (x) transitioning the management of certain Fidelity commodity funds to Geode Capital Management LLC, a registered commodity pool operator, while retaining administrative responsibilities for the funds; (xi) reorganizing a number of funds; and (xii) taking steps toward establishing a new Fidelity adviser to manage sector-based funds and products.
Investment Performance. The Board considered whether the fund has operated in accordance with its investment objective, as well as its record of compliance with its investment restrictions and its performance history.
The Board took into account discussions with the Investment Advisers about fund investment performance that occur at Board meetings throughout the year. In this regard the Board noted that as part of regularly scheduled fund reviews and other reports to the Board on fund performance, the Board periodically considers annualized return information for the fund, for different time periods, measured against a securities market index ("benchmark index") and a peer group of mutual funds with similar objectives ("peer group"). In its evaluation of fund investment performance, the Board gave particular attention to information indicating changes in performance of certain Fidelity funds for specific time periods and the Investment Advisers' explanations for any overperformance or, in the case of the fund, underperformance.
Annual Report
In addition to reviewing absolute and relative fund performance, the Independent Trustees periodically consider the appropriateness of fund performance metrics in evaluating the results achieved. In general, the Independent Trustees believe that fund performance should be evaluated based on net performance (after fees and expenses) of both the highest performing and lowest performing classes, where applicable, compared to appropriate benchmark indices, over appropriate time periods which may include full market cycles, and compared to peer groups, as applicable, over the same periods, taking into account relevant factors including the following: general market conditions; issuer-specific information; tactical opportunities for investment; and fund cash flows and other factors.
The Independent Trustees recognize that shareholders evaluate performance on a net basis over their own holding periods, for which one-, three-, and five-year periods are used as a proxy. For this reason, the performance information reviewed by the Board also included net cumulative calendar year total return information for the fund and an appropriate benchmark index for the most recent one-, three-, and five-year periods, as shown below. A peer group comparison is not shown below.
Annual Report
Board Approval of Investment Advisory Contracts and
Management Fees - continued
Fidelity OTC Portfolio
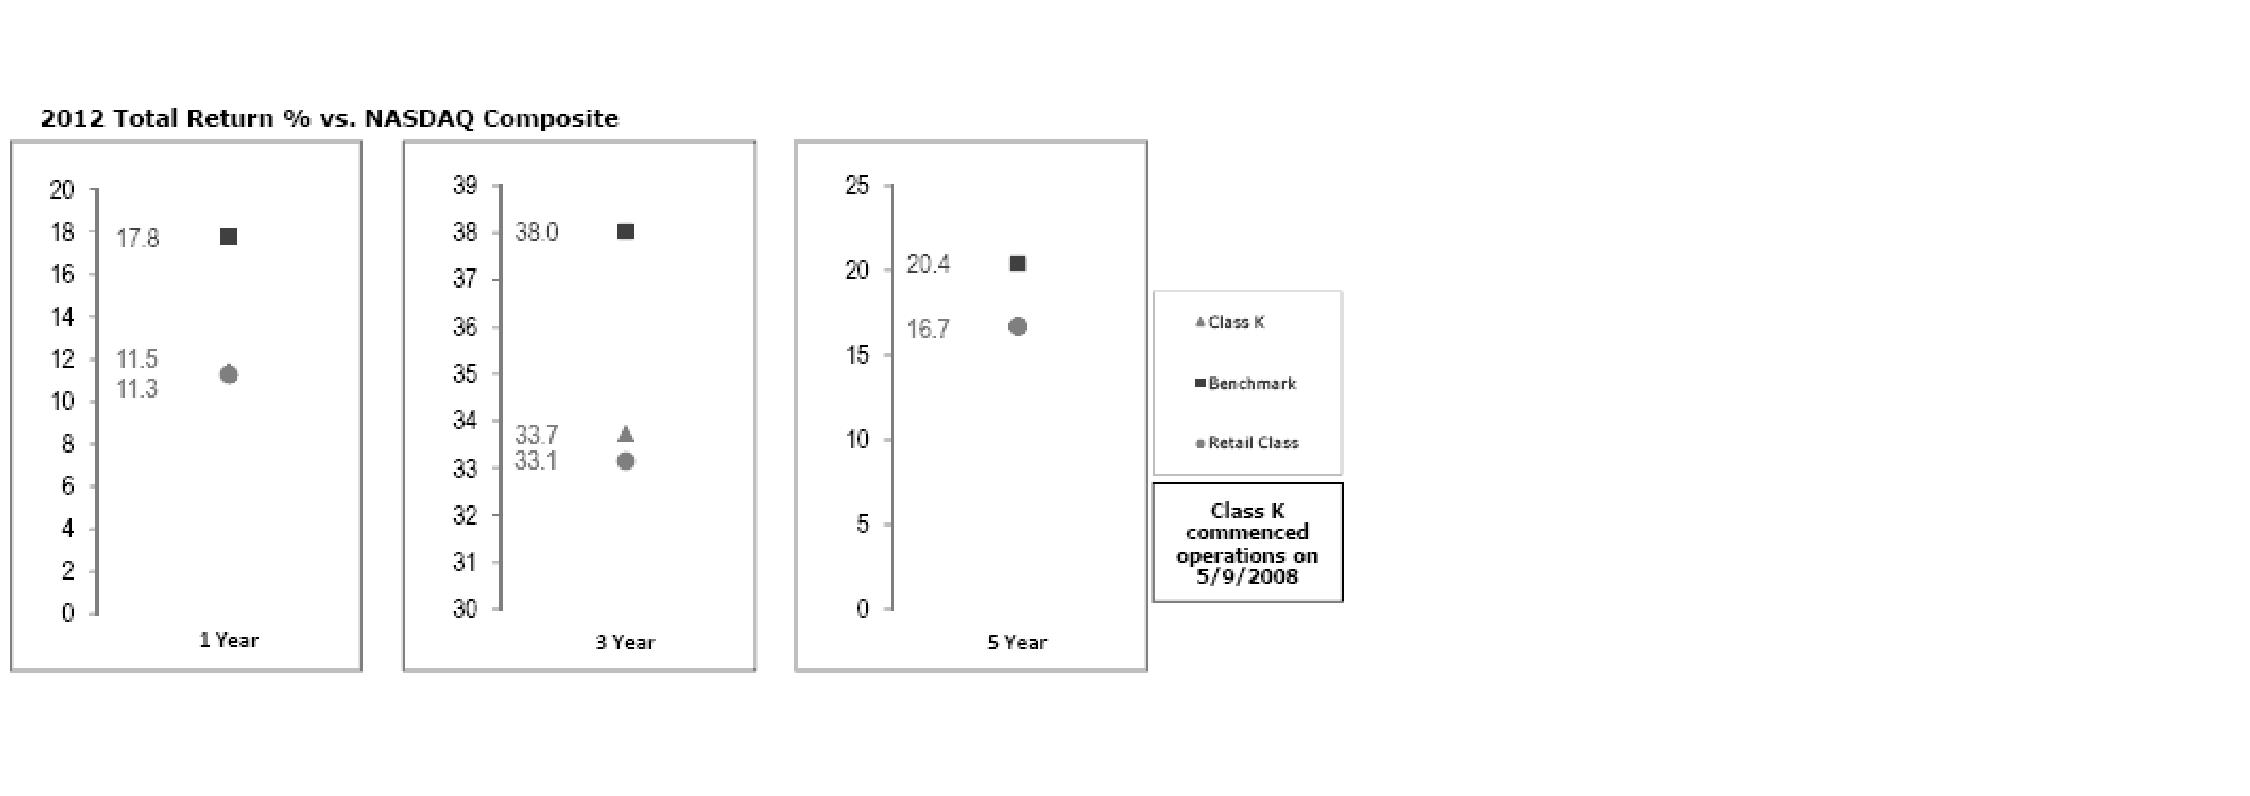
The Board has discussed the fund's underperformance with FMR and has engaged with FMR to consider what steps might be taken to remediate the fund's underperformance.
The Board also considered that the fund's management fee is subject to upward or downward adjustment depending upon whether, and to what extent, the fund's investment performance for the performance period exceeds, or is exceeded by, a securities index, thus leading to a performance adjustment for the same period. The Board noted that the performance adjustment provides FMR with a strong economic incentive to seek to achieve superior performance for the fund's shareholders and helps to more closely align the interests of FMR and the fund's shareholders.
Based on its review, the Board concluded that the nature, extent, and quality of services provided to the fund under the Advisory Contracts should benefit the fund's shareholders.
Competitiveness of Management Fee and Total Expense Ratio. The Board considered the fund's management fee and total expense ratio compared to "mapped groups" of competitive funds and classes. Fidelity creates "mapped groups" by combining similar Lipper investment objective categories that have comparable management fee characteristics. Combining Lipper investment objective categories aids the Board's management fee and total expense ratio comparisons by broadening the competitive group used for comparison and by reducing the number of universes to which various Fidelity funds are compared.
Annual Report
Management Fee. The Board considered two proprietary management fee comparisons for the 12-month periods shown in the chart below. The group of Lipper funds used by the Board for management fee comparisons is referred to below as the "Total Mapped Group." The Total Mapped Group comparison focuses on a fund's standing in terms of gross management fees before expense reimbursements or caps, and without giving effect to the fund's performance adjustment, relative to the total universe of funds with comparable investment mandates, regardless of whether their management fee structures also are comparable. Funds with comparable investment mandates offer exposure to similar types of securities. Funds with comparable management fee structures have similar management fee contractual arrangements (e.g., flat rate charged for advisory services, all-inclusive fee rate, etc.). "TMG %" represents the percentage of funds in the Total Mapped Group that had management fees that were lower than the fund's. For example, a TMG % of 18% means that 82% of the funds in the Total Mapped Group had higher management fees than the fund. The "Asset-Size Peer Group" (ASPG) comparison focuses on a fund's standing relative to a subset of non-Fidelity funds within the Total Mapped Group that are similar in size and management fee structure. The ASPG represents at least 15% of the funds in the Total Mapped Group with comparable asset size and management fee structures, subject to a minimum of 50 funds (or all funds in the Total Mapped Group if fewer than 50). Additional information, such as the ASPG quartile in which the fund's management fee ranked and the impact of the fund's performance adjustment, is also included in the chart and considered by the Board.
Fidelity OTC Portfolio

The Board noted that the fund's management fee ranked below the median of its Total Mapped Group and below the median of its ASPG for 2012. The Board also noted the effect of the fund's negative performance adjustment on the fund's management fee ranking.
Annual Report
Board Approval of Investment Advisory Contracts and
Management Fees - continued
Based on its review, the Board concluded that the fund's management fee is fair and reasonable in light of the services that the fund receives and the other factors considered.
Total Expense Ratio. In its review of each class's total expense ratio, the Board considered the fund's management fee as well as other fund or class expenses, as applicable, such as transfer agent fees, pricing and bookkeeping fees, and custodial, legal, and audit fees. The Board also noted the effects of any waivers and reimbursements on fees and expenses, as well as the impact of the fund's performance adjustment. As part of its review, the Board also considered the current and historical total expense ratios of each class of the fund compared to competitive fund median expenses. Each class of the fund is compared to those funds and classes in the Total Mapped Group (used by the Board for management fee comparisons) that have a similar sales load structure.
The Board noted that the total expense ratio of each class ranked below its competitive median for 2012.
Fees Charged to Other Fidelity Clients. The Board also considered Fidelity fee structures and other information with respect to clients of FMR and its affiliates, such as other mutual funds advised or subadvised by FMR or its affiliates, pension plan clients, and other institutional clients. The Board noted the findings of the 2013 ad hoc joint committee (created with the board of other Fidelity funds), which reviewed and compared Fidelity's institutional investment advisory business with its business of providing services to the Fidelity funds, including the differences in services provided, fees charged, and costs incurred, as well as competition in their respective marketplaces.
Based on its review of total expense ratios and fees charged to other Fidelity clients, the Board concluded that the total expense ratio of each class of the fund was reasonable in light of the services that the fund and its shareholders receive and the other factors considered.
Costs of the Services and Profitability. The Board considered the revenues earned and the expenses incurred by Fidelity in conducting the business of developing, marketing, distributing, managing, administering and servicing the fund and servicing the fund's shareholders. The Board also considered the level of Fidelity's profits in respect of all the Fidelity funds.
On an annual basis, FMR presents to the Board Fidelity's profitability for the fund. Fidelity calculates the profitability for each fund, as well as aggregate profitability for groups of Fidelity funds and all Fidelity funds, using a series of detailed revenue and cost allocation methodologies which originate with the books and records of Fidelity on which Fidelity's audited financial statements are based. The Audit Committee of the Board reviews any significant changes from the prior year's methodologies.
Annual Report
PricewaterhouseCoopers LLP (PwC), independent registered public accounting firm and auditor to Fidelity and certain Fidelity funds, has been engaged annually by the Board as part of the Board's assessment of Fidelity's profitability analysis. PwC's engagement includes the review and assessment of the methodologies used by Fidelity in determining the revenues and expenses attributable to Fidelity's mutual fund business, and completion of agreed-upon procedures surrounding the mathematical accuracy of fund profitability and its conformity to allocation methodologies. After considering PwC's reports issued under the engagement and information provided by Fidelity, the Board concluded that while other allocation methods may also be reasonable, Fidelity's profitability methodologies are reasonable in all material respects.
The Board also reviewed Fidelity's non-fund businesses and fall-out benefits related to the mutual fund business as well as cases where Fidelity's affiliates may benefit from or be related to the fund's business.
The Board considered the costs of the services provided by and the profits realized by Fidelity in connection with the operation of the fund and was satisfied that the profitability was not excessive in the circumstances.
Economies of Scale. The Board considered whether there have been economies of scale in respect of the management of the Fidelity funds, whether the Fidelity funds (including the fund) have appropriately benefited from any such economies of scale, and whether there is potential for realization of any further economies of scale. The Board considered the extent to which the fund will benefit from economies of scale through increased services to the fund, through waivers or reimbursements, or through fee or expense reductions. The Board also noted that in 2009, it and the board of other Fidelity funds created an ad hoc committee (the Economies of Scale Committee) to analyze whether FMR attains economies of scale in respect of the management and servicing of the Fidelity funds, whether the Fidelity funds have appropriately benefited from such economies of scale, and whether there is potential for realization of any further economies of scale.
The Board recognized that the fund's management contract incorporates a "group fee" structure, which provides for lower group fee rates as total fund assets under FMR's management increase, and for higher group fee rates as total fund assets under FMR's management decrease. FMR calculates the group fee rates based on a tiered asset "breakpoint" schedule that varies based on asset class. The Board considered that the group fee is designed to deliver the benefits of economies of scale to fund shareholders when total Fidelity fund assets increase, even if assets of any particular fund are unchanged or have declined, because some portion of Fidelity's costs are attributable to services provided to all Fidelity funds, and all funds benefit if those costs can be allocated among more assets. The Board concluded that, given the group fee structure, fund shareholders will benefit from lower management fees as assets under FMR's management increase at the fund complex level, regardless of whether Fidelity achieves any such economies of scale.
Annual Report
Board Approval of Investment Advisory Contracts and
Management Fees - continued
The Board concluded, taking into account the analysis of the Economies of Scale Committee, that economies of scale, if any, are being appropriately shared between fund shareholders and Fidelity.
Amendment to Description of Group Fee Rate. At its July 2013 meeting, the Board voted to approve an amendment to the fund's management contract to modify the description of the "group fee rate" effective August 1, 2013. The Board noted that under the prior description in the contract, the group fee rate was based on the average net assets of all registered investment companies with which FMR has management contracts. Under the contract's tiered asset breakpoint schedule, the group fee rate is lower as total fund assets under FMR's management increase, and higher as total fund assets under FMR's management decrease. The Board considered that the prior description would have excluded the assets of 64 Fidelity sector funds from the group fee rate calculation once Fidelity SelectCo LLC, an affiliate of FMR, assumed management responsibilities for those funds. The Board noted that modifying the description of the group fee rate to continue to include the assets of those 64 funds for purposes of determining group fee rate breakpoints would avoid an immediate adverse impact on the group fee rate for any fund.
Additional Information Requested by the Board. In order to develop fully the factual basis for consideration of the Fidelity funds' Advisory Contracts, the Board requested and received additional information on certain topics, including: (i) fund performance trends and Fidelity's long-term strategies for certain funds; (ii) the potential to further rationalize the Fidelity fund lineup with the possibility of achieving savings for the funds and Fidelity; (iii) the methodology with respect to competitive fund data and peer group classifications; (iv) the arrangements with, and performance of, certain sub-advisers on behalf of the Fidelity funds, as well as certain proposed participating affiliate arrangements; (v) the realization of fall-out benefits in certain Fidelity business units; (vi) Fidelity's group fee structures, including the rationale for the individual fee rates of certain categories of funds and the definition of group assets; (vii) trends regarding industry use of performance fee structures and the performance adjustment methodologies applicable to the Fidelity funds; (viii) additional competitive analysis regarding the total expenses for certain classes; and (ix) fund profitability methodology, including Fidelity's cost allocation methodology, and the impact of certain factors on fund profitability results.
Annual Report
Based on its evaluation of all of the conclusions noted above, and after considering all factors it believed relevant, the Board ultimately concluded that the advisory fee structures are fair and reasonable, and that the fund's Advisory Contracts should be renewed.
Annual Report
Investment Adviser
Fidelity Management & Research Company
Boston, MA
Investment Sub-Advisers
FMR Co., Inc.
Fidelity Management & Research
(U.K.) Inc.
Fidelity Management & Research
(Hong Kong) Limited
Fidelity Management & Research
(Japan) Inc.
General Distributor
Fidelity Distributors Corporation
Smithfield, RI
Transfer and Service Agents
Fidelity Investments Institutional
Operations Company, Inc.
Boston, MA
Fidelity Service Company, Inc.
Boston, MA
Custodian
The Northern Trust Company
Chicago, IL
(Fidelity Investment logo)(registered trademark)
Corporate Headquarters
245 Summer St., Boston, MA 02210
www.fidelity.com
OTC-K-UANN-0913
1.863303.104
Fidelity®
Real Estate Income
Fund
Annual Report
July 31, 2013
(Fidelity Cover Art)
Contents
Performance | (Click Here) | How the fund has done over time. |
Management's Discussion of Fund Performance | (Click Here) | The Portfolio Manager's review of fund performance and strategy. |
Shareholder Expense Example | (Click Here) | An example of shareholder expenses. |
Investment Changes | (Click Here) | A summary of major shifts in the fund's investments over the past six months. |
Investments | (Click Here) | A complete list of the fund's investments with their market values. |
Financial Statements | (Click Here) | Statements of assets and liabilities, operations, and changes in net assets, as well as financial highlights. |
Notes | (Click Here) | Notes to the financial statements. |
Report of Independent Registered Public Accounting Firm | (Click Here) | |
Trustees and Officers | (Click Here) | |
Distributions | (Click Here) | |
Board Approval of Investment Advisory Contracts and Management Fees | (Click Here) | |
To view a fund's proxy voting guidelines and proxy voting record for the 12-month period ended June 30, visit http://www.fidelity.com/proxyvotingresults or visit the Securities and Exchange Commission's (SEC) web site at http://www.sec.gov. You may also call 1-800-544-8544 to request a free copy of the proxy voting guidelines.
Standard & Poor's, S&P and S&P 500 are registered service marks of The McGraw-Hill Companies, Inc. and have been licensed for use by Fidelity Distributors Corporation.
Other third-party marks appearing herein are the property of their respective owners.
All other marks appearing herein are registered or unregistered trademarks or service marks of FMR LLC or an affiliated company. © 2013 FMR LLC. All rights reserved.
Annual Report
This report and the financial statements contained herein are submitted for the general information of the shareholders of the fund. This report is not authorized for distribution to prospective investors in the fund unless preceded or accompanied by an effective prospectus.
A fund files its complete schedule of portfolio holdings with the SEC for the first and third quarters of each fiscal year on Form N-Q. Forms N-Q are available on the SEC's web site at http://www.sec.gov. A fund's Forms N-Q may be reviewed and copied at the SEC's Public Reference Room in Washington, DC. Information regarding the operation of the SEC's Public Reference Room may be obtained by calling 1-800-SEC-0330. For a complete list of a fund's portfolio holdings, view the most recent holdings listing, semiannual report, or annual report on Fidelity's web site at http://www.fidelity.com, http://www.advisor.fidelity.com, or http://www.401k.com, as applicable.
NOT FDIC INSURED • MAY LOSE VALUE • NO BANK GUARANTEE
Neither the fund nor Fidelity Distributors Corporation is a bank.
Annual Report
Average annual total return reflects the change in the value of an investment, assuming reinvestment of the class' distributions from dividend income and capital gains (the profits earned upon the sale of securities that have grown in value, if any) and assuming a constant rate of performance each year. The $10,000 table and the fund's returns do not reflect the deduction of taxes that a shareholder would pay on fund distributions or the redemption of fund shares. During periods of reimbursement by Fidelity, a fund's total return will be greater than it would be had the reimbursement not occurred. How a fund did yesterday is no guarantee of how it will do tomorrow.
Average Annual Total Returns
Periods ended July 31, 2013 | Past 1
year | Past 5
years | Past 10 years |
Fidelity® Real Estate Income Fund | 10.71% | 10.82% | 7.48% |
$10,000 Over 10 Years
Let's say hypothetically that $10,000 was invested in Fidelity® Real Estate Income Fund, a class of the fund, on July 31, 2003. The chart shows how the value of your investment would have changed, and also shows how the S&P 500® Index performed over the same period.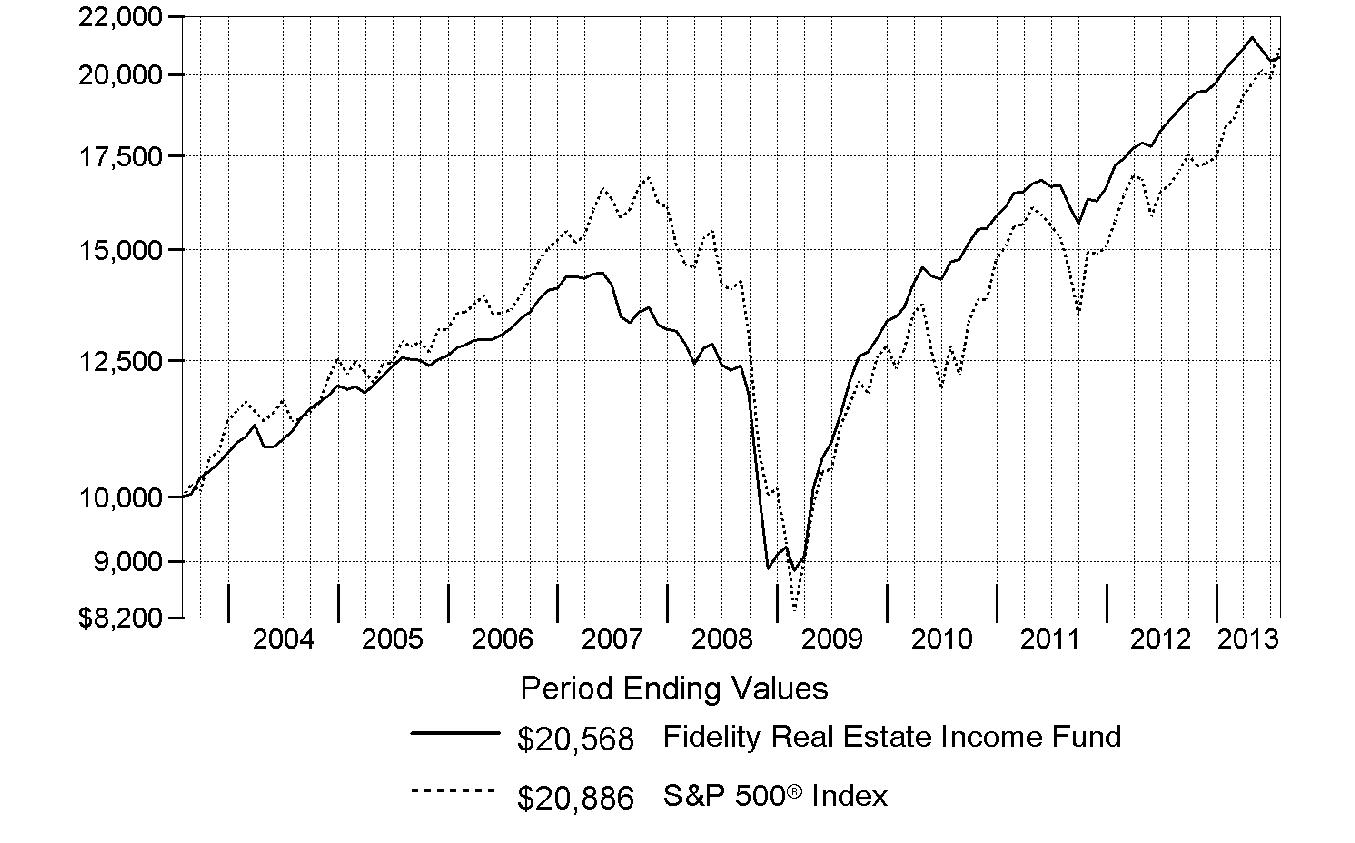
Annual Report
Market Recap: The fundamentals for commercial and residential property remained good throughout the 12-month period ending July 31, 2013. On the commercial side, demand continued to increase faster than the supply of new buildings, which, in turn, helped lift rental and occupancy rates. Meanwhile, single-family home prices continued to rise, boosting the slow-growing U.S. economy. For most of the period, real estate investment trust (REIT) common stocks performed well, although that situation abruptly reversed in May, when the Federal Reserve signaled its desire to bring its "quantitative easing" economic stimulus approach to a close. This caused a steep rise in interest rates, which weighed on the REIT market. Still, REIT stocks were positive performers for the 12 months, as the FTSE® NAREIT® All REITs Index gained 7.82%. Meanwhile, real estate bonds, reflected by The BofA Merrill LynchSM US Real Estate Index - a market-capitalization-weighted measure of the performance of investment-grade public debt of corporate issuers in the domestic real estate sector - rose 2.21%. The MSCI® REIT Preferred Index, which reflects the performance of real estate preferred stocks, returned 1.32%, while the broad U.S. equity market, as measured by the S&P 500® Index, generated a robust return of 25.00%.
Comments from Mark Snyderman, Portfolio Manager of Fidelity® Real Estate Income Fund: For the year, the fund's Retail Class shares gained 10.71%. In comparison, the Fidelity Real Estate Income Composite IndexSM - a 40/40/20 blend of the MSCI index, the BofA Merrill Lynch index and the FTSE® NAREIT® index, respectively - rose 3.02%. My strategy includes using thorough credit research to capitalize on inefficiencies in real estate securities markets. During the period, the fund's real estate investment trust (REIT) common stocks returned 21% - far ahead of the FTSE NAREIT index. Here, positions in net-lease companies Lexington Corporate Properties Trust and CapLease each added value. In contrast, mortgage REIT CYS Investments turned out to be more sensitive to the effects of rising interest rates than I anticipated, while student housing REIT American Campus Communities also lagged. Meanwhile, the fund's preferred real estate stocks were up about 7%, outpacing the MSCI index, thanks to my focus on higher-yielding preferreds. On the fixed-income side, commercial mortgage-backed securities, high-yield real estate bonds and investment-grade real estate bonds all handily beat the 2% return of the BofA Merrill Lynch index. The fund especially benefited from an investment in the bonds of commercial finance REIT iStar Financial. The fund's average cash weighting of 8%, however, limited the fund's upside.
The views expressed above reflect those of the portfolio manager(s) only through the end of the period as stated on the cover of this report and do not necessarily represent the views of Fidelity or any other person in the Fidelity organization. Any such views are subject to change at any time based upon market or other conditions and Fidelity disclaims any responsibility to update such views. These views may not be relied on as investment advice and, because investment decisions for a Fidelity fund are based on numerous factors, may not be relied on as an indication of trading intent on behalf of any Fidelity fund.
Annual Report
Shareholder Expense Example
As a shareholder of the Fund, you incur two types of costs: (1) transaction costs, including sales charges (loads) on purchase payments or redemption proceeds, redemption fees and (2) ongoing costs, including management fees, distribution and/or service (12b-1) fees and other Fund expenses. This Example is intended to help you understand your ongoing costs (in dollars) of investing in the Fund and to compare these costs with the ongoing costs of investing in other mutual funds.
The Example is based on an investment of $1,000 invested at the beginning of the period and held for the entire period (February 1, 2013 to July 31, 2013).
Actual Expenses
The first line of the accompanying table for each class of the Fund provides information about actual account values and actual expenses. You may use the information in this line, together with the amount you invested, to estimate the expenses that you paid over the period. Simply divide your account value by $1,000.00 (for example, an $8,600 account value divided by $1,000.00 = 8.6), then multiply the result by the number in the first line for a class of the Fund under the heading entitled "Expenses Paid During Period" to estimate the expenses you paid on your account during this period. A small balance maintenance fee of $12.00 that is charged once a year may apply for certain accounts with a value of less than $2,000. This fee is not included in the table below. If it was, the estimate of expenses you paid during the period would be higher, and your ending account value lower, by this amount. In addition, the Fund, as a shareholder in the underlying Fidelity Central Funds, will indirectly bear its pro-rata share of the fees and expenses incurred by the underlying Fidelity Central Funds. These fees and expenses are not included in the Fund's annualized expense ratio used to calculate the expense estimate in the table below.
Hypothetical Example for Comparison Purposes
The second line of the accompanying table for each class of the Fund provides information about hypothetical account values and hypothetical expenses based on a Class' actual expense ratio and an assumed rate of return of 5% per year before expenses, which is not the Class' actual return. The hypothetical account values and expenses may not be used to estimate the actual ending account balance or expenses you paid for the period. You may use this information to compare the ongoing costs of investing in the Fund and other funds. To do so, compare this 5% hypothetical example with the 5% hypothetical examples that appear in the shareholder reports of the other funds. A small balance maintenance fee of $12.00 that is charged once a year may apply for certain accounts with a value of less than $2,000. This fee is not included in the table below. If it was, the estimate of expenses you paid during the period would be higher, and your ending account value lower, by this amount. In addition, the Fund, as a shareholder in the underlying Fidelity Central Funds, will indirectly bear its pro-rata share of the fees and expenses incurred by the underlying Fidelity Central Funds. These fees and expenses are not included in the Fund's annualized expense ratio used to calculate the expense estimate in the table below.
Please note that the expenses shown in the table are meant to highlight your ongoing costs only and do not reflect any transaction costs. Therefore, the second line of the table is useful in comparing ongoing costs only, and will not help you determine the relative total costs of owning different funds. In addition, if these transactional costs were included, your costs would have been higher.
Annual Report
Shareholder Expense Example - continued
| Annualized
Expense RatioB | Beginning
Account Value
February 1, 2013 | Ending
Account Value
July 31, 2013 | Expenses Paid
During Period*
February 1, 2013
to July 31, 2013 |
Class A | 1.07% | | | |
Actual | | $ 1,000.00 | $ 1,018.40 | $ 5.35 |
HypotheticalA | | $ 1,000.00 | $ 1,019.49 | $ 5.36 |
Class T | 1.08% | | | |
Actual | | $ 1,000.00 | $ 1,018.40 | $ 5.40 |
HypotheticalA | | $ 1,000.00 | $ 1,019.44 | $ 5.41 |
Class C | 1.80% | | | |
Actual | | $ 1,000.00 | $ 1,014.30 | $ 8.99 |
HypotheticalA | | $ 1,000.00 | $ 1,015.87 | $ 9.00 |
Real Estate Income | .83% | | | |
Actual | | $ 1,000.00 | $ 1,019.10 | $ 4.16 |
HypotheticalA | | $ 1,000.00 | $ 1,020.68 | $ 4.16 |
Institutional Class | .79% | | | |
Actual | | $ 1,000.00 | $ 1,019.50 | $ 3.96 |
HypotheticalA | | $ 1,000.00 | $ 1,020.88 | $ 3.96 |
A 5% return per year before expenses
B Annualized expense ratio reflects expenses net of applicable fee waivers.
* Expenses are equal to each Class' annualized expense ratio, multiplied by the average account value over the period, multiplied by 181/365 (to reflect the one-half year period).
Annual Report
Investment Changes (Unaudited)
Top Five Stocks as of July 31, 2013 |
| % of fund's
net assets | % of fund's net assets
6 months ago |
MFA Financial, Inc. | 2.5 | 2.0 |
Equity Lifestyle Properties, Inc. | 2.1 | 1.8 |
Acadia Realty Trust (SBI) | 1.6 | 1.4 |
Ventas, Inc. | 1.5 | 1.7 |
CBL & Associates Properties, Inc. | 1.0 | 0.9 |
| 8.7 | |
Top 5 Bonds as of July 31, 2013 |
| % of fund's
net assets | % of fund's net assets
6 months ago |
Hilton Worldwide, Inc. term loan 4.442% 11/12/15 | 1.3 | 1.0 |
Banc of America Large Loan Trust floater Series 2010-HLTN Class HLTN, 2.491% 11/15/15 | 1.3 | 2.9 |
iStar Financial, Inc. Tranche B, term loan 4.5% 10/15/17 | 0.9 | 0.6 |
iStar Financial, Inc. 5.875% 3/15/16 | 0.9 | 1.0 |
Annaly Capital Management, Inc. 5% 5/15/15 | 0.8 | 1.0 |
| 5.2 | |
Top Five REIT Sectors as of July 31, 2013 |
| % of fund's
net assets | % of fund's net assets
6 months ago |
REITs - Mortgage | 15.3 | 12.7 |
REITs - Management/Investment | 8.9 | 8.2 |
REITs - Health Care Facilities | 6.2 | 6.5 |
REITs - Shopping Centers | 5.3 | 6.1 |
REITs - Apartments | 5.1 | 2.8 |
Asset Allocation (% of fund's net assets) |
As of July 31, 2013 * | As of January 31, 2013 ** |
 | Common Stocks 32.7% | | | Common Stocks 26.1% | |
 | Preferred Stocks 12.8% | | | Preferred Stocks 13.5% | |
 | Bonds 33.2% | | | Bonds 39.9% | |
 | Convertible
Securities 3.8% | | | Convertible
Securities 3.5% | |
 | Other Investments 11.0% | | | Other Investments 8.6% | |
 | Short-Term
Investments and
Net Other Assets
(Liabilities) 6.5% | | | Short-Term
Investments and
Net Other Assets
(Liabilities) 8.4% | |
* Foreign investments | 3.4% | | ** Foreign investments | 3.8% | |

Annual Report
Investments July 31, 2013
Showing Percentage of Net Assets
Common Stocks - 32.7% |
| Shares | | Value |
CONSUMER DISCRETIONARY - 0.6% |
Hotels, Restaurants & Leisure - 0.3% |
Hyatt Hotels Corp. Class A (a) | 257,400 | | $ 11,647,350 |
Household Durables - 0.3% |
NVR, Inc. (a) | 6,700 | | 6,201,520 |
Standard Pacific Corp. (a) | 464,495 | | 3,799,569 |
Stanley Martin Communities LLC Class B (a) | 4,620 | | 4,902,236 |
| | 14,903,325 |
TOTAL CONSUMER DISCRETIONARY | | 26,550,675 |
FINANCIALS - 31.0% |
Capital Markets - 0.3% |
Ellington Financial LLC | 519,500 | | 11,803,040 |
Real Estate Investment Trusts - 29.9% |
Acadia Realty Trust (SBI) | 2,606,449 | | 67,194,255 |
AG Mortgage Investment Trust, Inc. | 578,800 | | 10,499,432 |
American Campus Communities, Inc. | 392,100 | | 15,060,561 |
American Residential Properties, Inc. (a)(h) | 453,000 | | 7,945,620 |
American Residential Properties, Inc. (a) | 121,941 | | 2,138,845 |
American Tower Corp. | 366,600 | | 25,951,614 |
Anworth Mortgage Asset Corp. | 1,320,710 | | 6,418,651 |
Apartment Investment & Management Co. Class A | 1,317,300 | | 38,702,274 |
Arbor Realty Trust, Inc. (g) | 2,799,375 | | 21,107,288 |
Associated Estates Realty Corp. (f) | 781,408 | | 11,939,914 |
AvalonBay Communities, Inc. | 197,000 | | 26,661,980 |
BioMed Realty Trust, Inc. | 1,145,500 | | 23,666,030 |
Blackstone Mortgage Trust, Inc. | 280,900 | | 7,101,152 |
Boardwalk (REIT) | 126,200 | | 7,079,782 |
Canadian (REIT) | 131,600 | | 5,275,019 |
CapLease, Inc. | 2,656,300 | | 22,525,424 |
CBL & Associates Properties, Inc. | 1,845,873 | | 42,030,528 |
Cedar Shopping Centers, Inc. | 921,410 | | 5,104,611 |
Chambers Street Properties (f) | 687,393 | | 5,561,009 |
Chartwell Retirement Residence | 459,700 | | 4,372,767 |
Chartwell Retirement Residence (h) | 78,500 | | 746,709 |
Chesapeake Lodging Trust | 513,600 | | 11,766,576 |
CYS Investments, Inc. (f) | 2,004,739 | | 16,639,334 |
DCT Industrial Trust, Inc. | 1,235,100 | | 9,275,601 |
DiamondRock Hospitality Co. | 623,300 | | 6,046,010 |
Douglas Emmett, Inc. | 846,300 | | 21,165,963 |
DuPont Fabros Technology, Inc. | 316,600 | | 7,253,306 |
Common Stocks - continued |
| Shares | | Value |
FINANCIALS - continued |
Real Estate Investment Trusts - continued |
Dynex Capital, Inc. | 1,893,043 | | $ 18,192,143 |
EastGroup Properties, Inc. | 209,900 | | 12,984,414 |
Education Realty Trust, Inc. | 402,600 | | 3,796,518 |
Ellington Residential Mortgage REIT (f) | 230,000 | | 3,569,600 |
Equity Lifestyle Properties, Inc. | 2,264,560 | | 87,162,914 |
Equity Residential (SBI) | 491,300 | | 27,512,800 |
Excel Trust, Inc. | 1,333,928 | | 17,314,385 |
Extra Space Storage, Inc. | 100,300 | | 4,217,615 |
First Potomac Realty Trust | 1,349,015 | | 18,306,134 |
Glimcher Realty Trust | 1,192,200 | | 13,400,328 |
H&R REIT/H&R Finance Trust | 284,100 | | 5,977,413 |
Hatteras Financial Corp. | 438,000 | | 8,799,420 |
HCP, Inc. | 199,000 | | 8,730,130 |
Highwoods Properties, Inc. (SBI) | 245,000 | | 8,888,600 |
Lexington Corporate Properties Trust | 3,246,382 | | 40,709,630 |
LTC Properties, Inc. | 499,513 | | 19,316,168 |
MFA Financial, Inc. | 12,948,193 | | 103,326,569 |
Mid-America Apartment Communities, Inc. (f) | 525,200 | | 35,477,260 |
Monmouth Real Estate Investment Corp. Class A | 249,773 | | 2,442,780 |
National Retail Properties, Inc. | 173,700 | | 6,077,763 |
New Residential Investment Corp. | 923,600 | | 6,123,468 |
Newcastle Investment Corp. | 2,964,200 | | 17,192,360 |
NorthStar Realty Finance Corp. (f) | 2,867,700 | | 28,103,460 |
Parkway Properties, Inc. | 135,008 | | 2,362,640 |
Piedmont Office Realty Trust, Inc. Class A | 949,200 | | 17,171,028 |
Prologis, Inc. | 819,387 | | 31,431,685 |
RAIT Financial Trust | 150,000 | | 1,134,000 |
Rayonier, Inc. | 259,800 | | 15,182,712 |
Redwood Trust, Inc. | 330,000 | | 5,590,200 |
Retail Properties America, Inc. | 897,650 | | 12,647,889 |
Select Income (REIT) | 416,600 | | 11,239,868 |
Senior Housing Properties Trust (SBI) | 911,300 | | 22,919,195 |
Simon Property Group, Inc. | 146,800 | | 23,496,808 |
Stag Industrial, Inc. | 848,669 | | 17,592,908 |
Summit Hotel Properties, Inc. | 692,000 | | 7,003,040 |
Terreno Realty Corp. | 1,204,564 | | 22,091,704 |
Two Harbors Investment Corp. | 1,560,480 | | 15,651,614 |
Ventas, Inc. | 966,746 | | 63,553,882 |
Washington (REIT) (SBI) | 471,900 | | 12,684,672 |
Weyerhaeuser Co. | 323,400 | | 9,184,560 |
Common Stocks - continued |
| Shares | | Value |
FINANCIALS - continued |
Real Estate Investment Trusts - continued |
Whitestone REIT Class B (f) | 183,267 | | $ 2,965,260 |
WP Carey, Inc. (f) | 161,500 | | 11,405,130 |
| | 1,232,160,922 |
Real Estate Management & Development - 0.6% |
Brookfield Asset Management, Inc. Class A | 267,600 | | 9,903,102 |
Howard Hughes Corp. (a) | 26,500 | | 2,894,065 |
Kennedy-Wilson Holdings, Inc. | 664,021 | | 11,354,759 |
| | 24,151,926 |
Thrifts & Mortgage Finance - 0.2% |
Home Loan Servicing Solutions Ltd. | 388,800 | | 9,731,664 |
TOTAL FINANCIALS | | 1,277,847,552 |
HEALTH CARE - 1.1% |
Health Care Providers & Services - 1.1% |
Brookdale Senior Living, Inc. (a) | 1,081,000 | | 31,478,720 |
Emeritus Corp. (a) | 562,574 | | 13,046,091 |
| | 44,524,811 |
TOTAL COMMON STOCKS (Cost $1,192,449,014) |
1,348,923,038
|
Preferred Stocks - 13.9% |
| | | |
Convertible Preferred Stocks - 1.1% |
FINANCIALS - 1.1% |
Real Estate Investment Trusts - 1.1% |
Alexandria Real Estate Equities, Inc. Series D 7.00% | 95,000 | | 2,410,625 |
CommonWealth REIT 6.50% | 396,216 | | 9,041,649 |
Excel Trust, Inc. 7.00% (h) | 248,200 | | 6,170,252 |
Health Care REIT, Inc. Series I, 6.50% | 46,800 | | 2,808,000 |
Lexington Corporate Properties Trust Series C, 6.50% | 388,432 | | 18,838,952 |
Ramco-Gershenson Properties Trust (SBI) Series D, 7.25% | 40,000 | | 2,327,600 |
Weyerhaeuser Co. Series A, 6.375% (a) | 20,000 | | 1,039,400 |
| | 42,636,478 |
Preferred Stocks - continued |
| Shares | | Value |
Nonconvertible Preferred Stocks - 12.8% |
CONSUMER DISCRETIONARY - 0.1% |
Hotels, Restaurants & Leisure - 0.1% |
Red Lion Hotels Capital Trust 9.50% | 162,925 | | $ 4,218,128 |
FINANCIALS - 12.7% |
Capital Markets - 0.1% |
Arlington Asset Investment Corp. 6.625% | 182,517 | | 4,290,975 |
Real Estate Investment Trusts - 12.1% |
AG Mortgage Investment Trust, Inc. 8.00% | 324,817 | | 7,675,426 |
American Capital Agency Corp. 8.00% | 200,000 | | 5,070,000 |
American Home Mortgage Investment Corp.: | | | |
Series A, 9.375% (a) | 120,300 | | 12 |
Series B, 9.25% (a) | 124,100 | | 12 |
Annaly Capital Management, Inc.: | | | |
Series A, 7.875% | 134,900 | | 3,403,527 |
Series C, 7.625% | 77,837 | | 1,931,136 |
Series D, 7.50% | 213,116 | | 5,157,407 |
Anworth Mortgage Asset Corp. Series A, 8.625% | 309,630 | | 7,802,676 |
Apollo Commercial Real Estate Finance, Inc. Series A, 8.625% | 375,101 | | 9,692,610 |
Apollo Residential Mortgage, Inc. Series A, 8.00% | 279,276 | | 6,702,624 |
Arbor Realty Trust, Inc.: | | | |
Series A, 8.25% (g) | 189,089 | | 4,748,025 |
Series B, 7.75% (a)(g) | 240,000 | | 5,901,600 |
Armour Residential REIT, Inc. Series B, 7.875% | 153,654 | | 3,595,504 |
Ashford Hospitality Trust, Inc.: | | | |
Series D, 8.45% | 27,000 | | 679,050 |
Series E, 9.00% | 85,751 | | 2,263,826 |
Boston Properties, Inc. 5.25% | 50,000 | | 1,217,500 |
Campus Crest Communities, Inc. Series A, 8.00% | 248,431 | | 6,501,439 |
CapLease, Inc.: | | | |
Series A, 8.125% | 70,306 | | 1,766,087 |
Series B, 8.375% | 439,766 | | 11,082,103 |
Series C, 7.25% | 210,000 | | 5,315,100 |
Capstead Mortgage Corp. Series E, 7.50% | 202,984 | | 4,851,318 |
CBL & Associates Properties, Inc.: | | | |
7.375% | 289,876 | | 7,272,989 |
Series E, 6.625% | 95,000 | | 2,310,400 |
Cedar Shopping Centers, Inc. Series B, 7.25% | 326,128 | | 8,185,813 |
CenterPoint Properties Trust Series D, 5.377% | 3,575 | | 2,288,000 |
Chesapeake Lodging Trust Series A, 7.75% | 266,916 | | 6,776,997 |
Colony Financial, Inc. Series A, 8.50% | 282,171 | | 7,333,624 |
CommonWealth REIT 7.50% | 93,300 | | 1,949,037 |
Preferred Stocks - continued |
| Shares | | Value |
Nonconvertible Preferred Stocks - continued |
FINANCIALS - continued |
Real Estate Investment Trusts - continued |
Coresite Realty Corp. Series A, 7.25% | 258,224 | | $ 6,473,676 |
Corporate Office Properties Trust Series L, 7.375% | 80,000 | | 2,099,200 |
CubeSmart Series A, 7.75% | 40,000 | | 1,056,000 |
CYS Investments, Inc.: | | | |
Series A, 7.75% | 117,824 | | 2,733,517 |
Series B, 7.50% (a) | 311,567 | | 7,075,687 |
DDR Corp.: | | | |
Series J, 6.50% | 237,721 | | 5,702,927 |
Series K, 6.25% | 228,888 | | 5,481,868 |
Digital Realty Trust, Inc.: | | | |
Series E, 7.00% | 40,000 | | 1,000,000 |
Series G, 5.875% | 145,444 | | 3,141,590 |
Duke Realty LP Series L, 6.60% | 10,666 | | 266,543 |
Dynex Capital, Inc.: | | | |
Series A, 8.50% | 362,932 | | 9,109,593 |
Series B, 7.625% | 252,120 | | 5,889,523 |
Equity Lifestyle Properties, Inc. Series C, 6.75% | 924,148 | | 23,288,530 |
Essex Property Trust, Inc. Series H, 7.125% | 40,000 | | 1,032,000 |
Excel Trust, Inc. Series B, 8.125% | 400,000 | | 10,272,000 |
First Potomac Realty Trust 7.75% | 415,296 | | 10,847,532 |
General Growth Properties, Inc. Series A, 6.375% | 40,986 | | 940,219 |
Gladstone Commercial Corp. Series C, 7.125% | 232,238 | | 6,003,352 |
Glimcher Realty Trust: | | | |
6.875% | 256,115 | | 6,282,501 |
Series G, 8.125% | 109,192 | | 2,765,833 |
Series H, 7.50% | 198,527 | | 5,058,468 |
Hatteras Financial Corp. Series A, 7.625% | 197,288 | | 4,728,993 |
Health Care REIT, Inc. Series J, 6.50% | 20,000 | | 506,000 |
Hersha Hospitality Trust: | | | |
Series B, 8.00% | 162,538 | | 4,185,354 |
Series C, 6.875% | 50,000 | | 1,205,000 |
Hospitality Properties Trust Series D, 7.125% | 40,800 | | 1,041,216 |
Hudson Pacific Properties, Inc. 8.375% | 394,069 | | 10,328,548 |
Inland Real Estate Corp. Series A, 8.125% | 423,500 | | 10,867,010 |
Invesco Mortgage Capital, Inc. Series A, 7.75% | 113,342 | | 2,707,740 |
Investors Real Estate Trust Series B, 7.95% | 126,572 | | 3,278,215 |
iStar Financial, Inc.: | | | |
Series E, 7.875% | 156,008 | | 3,747,312 |
Series F, 7.80% | 279,421 | | 6,669,779 |
Preferred Stocks - continued |
| Shares | | Value |
Nonconvertible Preferred Stocks - continued |
FINANCIALS - continued |
Real Estate Investment Trusts - continued |
Kilroy Realty Corp. Series G, 6.875% | 40,000 | | $ 979,600 |
Kite Realty Group Trust 8.25% | 96,100 | | 2,504,366 |
LaSalle Hotel Properties: | | | |
Series G, 7.25% | 42,026 | | 1,050,230 |
Series H, 7.50% | 126,308 | | 3,190,540 |
Series I, 6.375% | 192,698 | | 4,470,594 |
LBA Realty Fund II: | | | |
Series A, 8.75% (a) | 69,000 | | 2,742,750 |
Series B, 7.625% | 31,240 | | 609,180 |
MFA Financial, Inc.: | | | |
8.00% | 538,930 | | 13,672,654 |
Series B, 7.50% (a) | 567,024 | | 13,466,820 |
Monmouth Real Estate Investment Corp.: | | | |
7.625% | 80,000 | | 2,063,200 |
Series B, 7.875% | 95,000 | | 2,464,300 |
National Retail Properties, Inc.: | | | |
5.70% (a) | 82,104 | | 1,823,530 |
Series D, 6.625% | 62,437 | | 1,561,549 |
New York Mortgage Trust, Inc. Series B, 7.75% | 123,101 | | 2,891,642 |
Newcastle Investment Corp. Series B, 9.75% | 14,660 | | 384,092 |
NorthStar Realty Finance Corp.: | | | |
Series B, 8.25% | 225,708 | | 5,631,415 |
Series C, 8.875% | 275,338 | | 7,007,352 |
Series D, 8.50% | 161,601 | | 4,085,273 |
Pebblebrook Hotel Trust: | | | |
Series A, 7.875% | 372,000 | | 9,486,000 |
Series B, 8.00% | 185,085 | | 4,784,447 |
Series C, 6.50% | 178,160 | | 4,184,978 |
Pennsylvania (REIT) 7.375% | 76,510 | | 1,917,341 |
Prologis, Inc. Series Q, 8.54% | 94,446 | | 5,772,540 |
PS Business Parks, Inc. 6.875% | 50,000 | | 1,257,000 |
Regency Centers Corp. Series 6, 6.625% | 62,261 | | 1,557,148 |
Retail Properties America, Inc. 7.00% | 194,782 | | 4,733,203 |
Sabra Health Care REIT, Inc. Series A, 7.125% | 200,000 | | 5,090,000 |
Saul Centers, Inc.: | | | |
8.00% | 38,072 | | 967,410 |
Series C, 6.875% | 315,478 | | 7,950,046 |
Stag Industrial, Inc.: | | | |
Series A, 9.00% | 280,000 | | 7,560,000 |
Preferred Stocks - continued |
| Shares | | Value |
Nonconvertible Preferred Stocks - continued |
FINANCIALS - continued |
Real Estate Investment Trusts - continued |
Stag Industrial, Inc.: - continued | | | |
Series B, 6.625% | 80,000 | | $ 1,837,600 |
Strategic Hotel & Resorts, Inc.: | | | |
Series A, 8.50% | 92,323 | | 2,215,752 |
Series B, 8.25% | 80,000 | | 1,912,000 |
Summit Hotel Properties, Inc.: | | | |
Series A, 9.25% | 138,340 | | 3,701,978 |
Series B, 7.875% | 190,173 | | 4,839,903 |
Series C, 7.125% | 153,212 | | 3,733,776 |
Sun Communities, Inc. Series A, 7.125% | 360,000 | | 9,072,000 |
Sunstone Hotel Investors, Inc. Series D, 8.00% | 60,362 | | 1,549,493 |
Taubman Centers, Inc. Series K, 6.25% | 96,120 | | 2,278,044 |
Terreno Realty Corp. Series A, 7.75% | 213,690 | | 5,523,887 |
UMH Properties, Inc. Series A, 8.25% | 600,000 | | 15,768,000 |
Urstadt Biddle Properties, Inc. Series F, 7.125% | 210,000 | | 5,363,400 |
Vornado Realty LP 7.875% | 54,682 | | 1,452,354 |
Weingarten Realty Investors (SBI) Series F, 6.50% | 49,813 | | 1,256,284 |
Winthrop Realty Trust: | | | |
7.75% | 540,000 | | 13,797,000 |
Series D, 9.25% | 65,000 | | 1,756,300 |
| | 499,176,539 |
Real Estate Management & Development - 0.5% |
Forest City Enterprises, Inc. 7.375% | 657,000 | | 16,425,000 |
Kennedy-Wilson, Inc. 7.75% | 141,574 | | 3,569,081 |
| | 19,994,081 |
TOTAL FINANCIALS | | 523,461,595 |
TOTAL NONCONVERTIBLE PREFERRED STOCKS | | 527,679,723 |
TOTAL PREFERRED STOCKS (Cost $567,835,343) |
570,316,201
|
Corporate Bonds - 19.9% |
| Principal Amount (e) | | Value |
Convertible Bonds - 2.7% |
CONSUMER DISCRETIONARY - 0.1% |
Hotels, Restaurants & Leisure - 0.1% |
Morgans Hotel Group Co. 2.375% 10/15/14 | | $ 4,510,000 | | $ 4,425,438 |
Household Durables - 0.0% |
M/I Homes, Inc. 3% 3/1/18 | | 1,790,000 | | 1,806,289 |
TOTAL CONSUMER DISCRETIONARY | | 6,231,727 |
FINANCIALS - 2.6% |
Diversified Financial Services - 0.4% |
IAS Operating Partnership LP 5% 3/15/18 (h) | | 15,490,000 | | 14,289,525 |
Real Estate Investment Trusts - 2.2% |
Annaly Capital Management, Inc. 5% 5/15/15 | | 34,396,000 | | 34,804,453 |
Ares Commercial Real Estate Corp. 7% 12/15/15 (h) | | 14,700,000 | | 14,323,313 |
CapLease, Inc. 7.5% 10/1/27 (h) | | 5,180,000 | | 5,180,000 |
Colony Financial, Inc. 5% 4/15/23 | | 9,000,000 | | 9,190,800 |
Northstar Realty Finance LP 5.375% 6/15/33 (h) | | 2,000,000 | | 2,108,000 |
Pennymac Corp. 5.375% 5/1/20 (h) | | 4,000,000 | | 3,795,000 |
Redwood Trust, Inc. 4.625% 4/15/18 | | 8,500,000 | | 8,436,250 |
Starwood Property Trust, Inc.: | | | | |
4% 1/15/19 | | 3,000,000 | | 3,163,125 |
4.55% 3/1/18 | | 9,000,000 | | 9,485,100 |
| | 90,486,041 |
Real Estate Management & Development - 0.0% |
Forest City Enterprises, Inc. 3.625% 8/15/20 (h) | | 1,000,000 | | 981,875 |
Grubb & Ellis Co. 7.95% 5/1/15 (d)(h) | | 5,500,000 | | 11,000 |
| | 992,875 |
TOTAL FINANCIALS | | 105,768,441 |
TOTAL CONVERTIBLE BONDS | | 112,000,168 |
Nonconvertible Bonds - 17.2% |
CONSUMER DISCRETIONARY - 5.7% |
Hotels, Restaurants & Leisure - 0.6% |
CityCenter Holdings LLC/CityCenter Finance Corp. 7.625% 1/15/16 | | 3,505,000 | | 3,715,300 |
FelCor Lodging LP: | | | | |
5.625% 3/1/23 | | 2,000,000 | | 1,950,000 |
Corporate Bonds - continued |
| Principal Amount (e) | | Value |
Nonconvertible Bonds - continued |
CONSUMER DISCRETIONARY - continued |
Hotels, Restaurants & Leisure - continued |
FelCor Lodging LP: - continued | | | | |
6.75% 6/1/19 | | $ 5,875,000 | | $ 6,198,125 |
RHP Hotel Properties LP/RHP Finance Co. 5% 4/15/21 (h) | | 2,000,000 | | 1,960,000 |
Times Square Hotel Trust 8.528% 8/1/26 (h) | | 8,707,232 | | 11,165,196 |
| | 24,988,621 |
Household Durables - 5.1% |
Ashton Woods USA LLC/Ashton Woods Finance Co. 6.875% 2/15/21 (h) | | 10,000,000 | | 10,175,000 |
Brookfield Residential Properties, Inc./Brookfield Residential U.S. Corp. 6.125% 7/1/22 (h) | | 1,000,000 | | 1,022,500 |
Brookfield Residential Properties, Inc. 6.5% 12/15/20 (h) | | 1,615,000 | | 1,691,713 |
D.R. Horton, Inc.: | | | | |
4.75% 5/15/17 | | 2,000,000 | | 2,080,000 |
5.75% 8/15/23 | | 2,510,000 | | 2,510,000 |
KB Home: | | | | |
5.875% 1/15/15 | | 7,000,000 | | 7,280,000 |
7.25% 6/15/18 | | 7,420,000 | | 8,106,350 |
8% 3/15/20 | | 8,465,000 | | 9,438,475 |
9.1% 9/15/17 | | 17,595,000 | | 20,146,275 |
Lennar Corp.: | | | | |
4.125% 12/1/18 (h) | | 5,520,000 | | 5,326,800 |
5.6% 5/31/15 | | 6,000,000 | | 6,358,200 |
6.5% 4/15/16 | | 4,000,000 | | 4,310,000 |
6.95% 6/1/18 | | 14,280,000 | | 15,708,000 |
M/I Homes, Inc. 8.625% 11/15/18 | | 26,055,000 | | 28,399,950 |
Meritage Homes Corp.: | | | | |
7% 4/1/22 | | 7,525,000 | | 8,202,250 |
7.15% 4/15/20 | | 7,060,000 | | 7,766,000 |
Ryland Group, Inc.: | | | | |
6.625% 5/1/20 | | 1,555,000 | | 1,644,413 |
8.4% 5/15/17 | | 5,420,000 | | 6,287,200 |
Standard Pacific Corp.: | | | | |
7% 8/15/15 | | 4,000,000 | | 4,330,000 |
8.375% 5/15/18 | | 28,983,000 | | 33,547,823 |
10.75% 9/15/16 | | 8,415,000 | | 10,129,556 |
Corporate Bonds - continued |
| Principal Amount (e) | | Value |
Nonconvertible Bonds - continued |
CONSUMER DISCRETIONARY - continued |
Household Durables - continued |
Toll Brothers Finance Corp. 5.875% 2/15/22 | | $ 1,550,000 | | $ 1,619,750 |
William Lyon Homes, Inc. 8.5% 11/15/20 | | 13,595,000 | | 14,886,525 |
| | 210,966,780 |
TOTAL CONSUMER DISCRETIONARY | | 235,955,401 |
CONSUMER STAPLES - 0.0% |
Food & Staples Retailing - 0.0% |
Ahold Lease Series 2001 A1 pass thru trust certificates 7.82% 1/2/20 | | 907,635 | | 1,030,165 |
FINANCIALS - 10.2% |
Diversified Financial Services - 0.6% |
Cantor Commercial Real Estate Co. LP/CCRE Finance Corp. 7.75% 2/15/18 (h) | | 4,755,000 | | 4,873,875 |
Icahn Enterprises LP/Icahn Enterprises Finance Corp.: | | | | |
6% 8/1/20 (h) | | 3,000,000 | | 3,003,750 |
7.75% 1/15/16 | | 10,820,000 | | 11,239,275 |
8% 1/15/18 | | 5,240,000 | | 5,534,750 |
| | 24,651,650 |
Real Estate Investment Trusts - 6.7% |
Camden Property Trust 5% 6/15/15 | | 1,100,000 | | 1,177,473 |
Commercial Net Lease Realty, Inc.: | | | | |
6.15% 12/15/15 | | 2,526,000 | | 2,802,857 |
6.25% 6/15/14 | | 8,355,000 | | 8,721,676 |
CubeSmart LP 4.8% 7/15/22 | | 2,000,000 | | 2,092,340 |
Developers Diversified Realty Corp.: | | | | |
5.5% 5/1/15 | | 4,000,000 | | 4,279,748 |
7.5% 4/1/17 | | 6,000,000 | | 7,034,316 |
7.5% 7/15/18 | | 8,756,000 | | 10,495,432 |
7.875% 9/1/20 | | 4,637,000 | | 5,723,876 |
9.625% 3/15/16 | | 3,836,000 | | 4,588,017 |
Equity One, Inc.: | | | | |
5.375% 10/15/15 | | 3,500,000 | | 3,798,533 |
6.25% 1/15/17 | | 3,000,000 | | 3,349,932 |
Equity Residential 5.125% 3/15/16 | | 7,201,000 | | 7,926,717 |
Health Care Property Investors, Inc.: | | | | |
5.625% 5/1/17 | | 2,980,000 | | 3,340,714 |
6% 6/15/14 | | 2,340,000 | | 2,439,768 |
Corporate Bonds - continued |
| Principal Amount (e) | | Value |
Nonconvertible Bonds - continued |
FINANCIALS - continued |
Real Estate Investment Trusts - continued |
Health Care Property Investors, Inc.: - continued | | | | |
6% 3/1/15 | | $ 1,000,000 | | $ 1,073,503 |
6% 1/30/17 | | 2,383,000 | | 2,691,134 |
7.072% 6/8/15 | | 1,500,000 | | 1,658,097 |
Health Care REIT, Inc.: | | | | |
3.625% 3/15/16 | | 7,685,000 | | 8,092,858 |
4.125% 4/1/19 | | 2,000,000 | | 2,114,364 |
6% 11/15/13 | | 1,000,000 | | 1,014,204 |
6.2% 6/1/16 | | 2,750,000 | | 3,094,146 |
Healthcare Realty Trust, Inc.: | | | | |
3.75% 4/15/23 | | 4,022,000 | | 3,807,491 |
5.75% 1/15/21 | | 3,095,000 | | 3,392,275 |
6.5% 1/17/17 | | 2,875,000 | | 3,239,464 |
Highwoods/Forsyth LP: | | | | |
3.625% 1/15/23 | | 1,607,000 | | 1,507,782 |
5.85% 3/15/17 | | 2,800,000 | | 3,087,101 |
Hospitality Properties Trust: | | | | |
5% 8/15/22 | | 3,177,000 | | 3,213,914 |
5.625% 3/15/17 | | 915,000 | | 995,560 |
7.875% 8/15/14 | | 1,000,000 | | 1,034,937 |
HRPT Properties Trust: | | | | |
5.75% 11/1/15 | | 4,826,000 | | 5,043,720 |
6.25% 8/15/16 | | 9,675,000 | | 10,290,775 |
6.25% 6/15/17 | | 1,055,000 | | 1,115,920 |
6.65% 1/15/18 | | 4,246,000 | | 4,551,606 |
iStar Financial, Inc.: | | | | |
3.875% 7/1/16 | | 2,855,000 | | 2,826,450 |
5.85% 3/15/17 | | 3,587,000 | | 3,694,610 |
5.875% 3/15/16 | | 34,260,000 | | 35,801,700 |
6.05% 4/15/15 | | 14,630,000 | | 15,215,200 |
7.125% 2/15/18 | | 5,725,000 | | 6,125,750 |
9% 6/1/17 | | 9,175,000 | | 10,367,750 |
MPT Operating Partnership LP/MPT Finance Corp.: | | | | |
6.375% 2/15/22 | | 3,610,000 | | 3,799,525 |
6.875% 5/1/21 | | 2,000,000 | | 2,135,000 |
National Retail Properties, Inc. 3.3% 4/15/23 | | 2,000,000 | | 1,852,958 |
Nationwide Health Properties, Inc. 6% 5/20/15 | | 5,670,000 | | 6,176,019 |
Omega Healthcare Investors, Inc.: | | | | |
6.75% 10/15/22 | | 2,115,000 | | 2,294,775 |
Corporate Bonds - continued |
| Principal Amount (e) | | Value |
Nonconvertible Bonds - continued |
FINANCIALS - continued |
Real Estate Investment Trusts - continued |
Omega Healthcare Investors, Inc.: - continued | | | | |
7.5% 2/15/20 | | $ 1,000,000 | | $ 1,095,000 |
Pan Pacific Retail Properties, Inc. 5.95% 6/1/14 | | 1,750,000 | | 1,822,919 |
Potlatch Corp. 7.5% 11/1/19 | | 1,000,000 | | 1,150,000 |
ProLogis LP: | | | | |
6.625% 5/15/18 | | 6,480,000 | | 7,555,162 |
7.625% 7/1/17 | | 4,690,000 | | 5,373,446 |
Reckson Operating Partnership LP/SL Green Realty Corp./SL Green Operating Partnership LP 7.75% 3/15/20 | | 2,000,000 | | 2,368,846 |
Senior Housing Properties Trust: | | | | |
4.3% 1/15/16 | | 5,000,000 | | 5,202,760 |
6.75% 4/15/20 | | 13,624,000 | | 15,113,893 |
6.75% 12/15/21 | | 8,000,000 | | 8,882,688 |
United Dominion Realty Trust, Inc.: | | | | |
5.13% 1/15/14 | | 2,520,000 | | 2,567,462 |
5.25% 1/15/15 | | 1,000,000 | | 1,055,403 |
5.25% 1/15/16 | | 4,000,000 | | 4,329,236 |
| | 275,596,802 |
Real Estate Management & Development - 2.8% |
AMB Property LP 5.9% 8/15/13 | | 400,000 | | 400,547 |
BioMed Realty LP 3.85% 4/15/16 | | 2,000,000 | | 2,105,004 |
Brandywine Operating Partnership LP: | | | | |
5.4% 11/1/14 | | 6,750,000 | | 7,096,356 |
7.5% 5/15/15 | | 1,000,000 | | 1,105,530 |
CB Richard Ellis Services, Inc.: | | | | |
5% 3/15/23 | | 6,020,000 | | 5,779,200 |
6.625% 10/15/20 | | 1,205,000 | | 1,284,831 |
Colonial Properties Trust 6.25% 6/15/14 | | 3,094,000 | | 3,233,901 |
Colonial Realty LP 6.05% 9/1/16 | | 2,500,000 | | 2,800,762 |
Corporate Office Properties LP 3.6% 5/15/23 (h) | | 5,000,000 | | 4,634,915 |
ERP Operating LP 5.25% 9/15/14 | | 4,815,000 | | 5,053,554 |
Forest City Enterprises, Inc. 6.5% 2/1/17 | | 17,420,000 | | 17,458,324 |
Host Hotels & Resorts LP 5.25% 3/15/22 | | 2,000,000 | | 2,083,290 |
Kennedy-Wilson, Inc. 8.75% 4/1/19 | | 20,410,000 | | 22,144,850 |
Realogy Corp.: | | | | |
7.875% 2/15/19 (h) | | 7,085,000 | | 7,687,225 |
9% 1/15/20 (h) | | 1,920,000 | | 2,198,400 |
Corporate Bonds - continued |
| Principal Amount (e) | | Value |
Nonconvertible Bonds - continued |
FINANCIALS - continued |
Real Estate Management & Development - continued |
Regency Centers LP: | | | | |
5.25% 8/1/15 | | $ 4,509,000 | | $ 4,851,756 |
5.875% 6/15/17 | | 400,000 | | 446,543 |
Toys 'R' Us Property Co. I LLC 10.75% 7/15/17 | | 2,490,000 | | 2,633,200 |
Ventas Realty LP/Ventas Capital Corp.: | | | | |
2.7% 4/1/20 | | 3,000,000 | | 2,849,517 |
3.125% 11/30/15 | | 13,807,000 | | 14,473,740 |
4% 4/30/19 | | 2,262,000 | | 2,371,949 |
Wells Operating Partnership II LP 5.875% 4/1/18 | | 3,000,000 | | 3,153,165 |
| | 115,846,559 |
Thrifts & Mortgage Finance - 0.1% |
Wrightwood Capital LLC 1.9% 4/20/20 (d) | | 3,781,040 | | 3,157,168 |
TOTAL FINANCIALS | | 419,252,179 |
HEALTH CARE - 0.9% |
Health Care Equipment & Supplies - 0.3% |
Aviv Healthcare Properties LP/Aviv Healthcare Capital Corp. 7.75% 2/15/19 | | 10,410,000 | | 11,190,750 |
Health Care Providers & Services - 0.6% |
Sabra Health Care LP/Sabra Capital Corp.: | | | | |
5.375% 6/1/23 | | 2,795,000 | | 2,725,125 |
8.125% 11/1/18 | | 21,426,000 | | 23,032,950 |
| | 25,758,075 |
TOTAL HEALTH CARE | | 36,948,825 |
INDUSTRIALS - 0.2% |
Commercial Services & Supplies - 0.1% |
Iron Mountain, Inc. 5.75% 8/15/24 | | 4,235,000 | | 4,002,075 |
Industrial Conglomerates - 0.1% |
Ladder Capital Finance Holdings LLLP/Ladder Capital Finance Corp. 7.375% 10/1/17 (h) | | 3,050,000 | | 3,149,125 |
TOTAL INDUSTRIALS | | 7,151,200 |
Corporate Bonds - continued |
| Principal Amount (e) | | Value |
Nonconvertible Bonds - continued |
INFORMATION TECHNOLOGY - 0.1% |
Internet Software & Services - 0.1% |
CyrusOne LP/CyrusOne Finance Corp. 6.375% 11/15/22 | | $ 3,000,000 | | $ 3,150,000 |
TELECOMMUNICATION SERVICES - 0.1% |
Wireless Telecommunication Services - 0.1% |
Crown Castle International Corp. 5.25% 1/15/23 | | 4,000,000 | | 3,850,000 |
TOTAL NONCONVERTIBLE BONDS | | 707,337,770 |
TOTAL CORPORATE BONDS (Cost $772,590,551) |
819,337,938
|
Asset-Backed Securities - 3.1% |
|
Anthracite CDO III Ltd./Anthracite CDO III Corp. Series 2004-1A Class A, 0.551% 3/23/19 (h)(i) | | 157,192 | | 154,442 |
Capital Trust RE CDO Ltd. Series 2005-1A Class D, 1.6915% 3/20/50 (h)(i) | | 2,250,000 | | 104,625 |
Capital Trust RE CDO Ltd./Capital Trust RE CDO Corp. Series 2005-3A Class A2, 5.16% 6/25/35 (h) | | 903,043 | | 898,528 |
CapitalSource Real Estate Loan Trust Series 2006-1A Class A2A, 0.5186% 1/20/37 (h)(i) | | 634,553 | | 599,653 |
CapLease CDO Ltd. Series 2005-1A Class A, 4.926% 1/29/40 (h) | | 1,069,411 | | 1,058,717 |
CBRE Realty Finance CDO LLC Series 2007-1A Class A1, 0.5209% 4/7/52 (h)(i) | | 4,042,150 | | 3,840,042 |
Conseco Finance Securitizations Corp. Series 2002-2 Class M2, 9.163% 3/1/33 (i) | | 500,000 | | 439,412 |
Crest Clarendon Street Ltd./Crest Clarendon Corp. Series 2002-1A Class D, 9% 12/28/35 (h) | | 536,066 | | 361,738 |
Crest Dartmouth Street Ltd./Crest Dartmouth Street Corp. Series 2003-1A Class D, 9% 6/28/38 (h) | | 1,064,351 | | 798,264 |
Deutsche Financial Capital Securitization LLC Series 1997-I Class M, 7.275% 9/15/27 | | 9,500,000 | | 9,081,535 |
Fairfield Street Solar Corp. Series 2004-1A Class E1, 3.6378% 11/28/39 (h)(i) | | 587,788 | | 17,634 |
Green Tree Financial Corp.: | | | | |
Series 1996-4 Class M1, 7.75% 6/15/27 | | 1,788,179 | | 1,701,552 |
Series 1997-3 Class M1, 7.53% 3/15/28 | | 7,238,253 | | 5,989,821 |
Asset-Backed Securities - continued |
| Principal Amount (e) | | Value |
GSR Mortgage Loan Trust Series 2005-HE3 Class B3, 2.69% 6/25/35 (i)(k) | | $ 695,471 | | $ 30,822 |
Guggenheim Structured Real Estate Funding Ltd./Guggenheim Structured Real Estate Funding LLC Series 2005-2A: | | | | |
Class D, 1.74% 8/26/30 (h)(i) | | 735,000 | | 691,856 |
Class E, 2.19% 8/26/30 (h)(i) | | 1,517,957 | | 971,493 |
HLSS Servicer Advance Receivables Backed Notes Series 2013-T2 Class D2, 2.388% 5/16/44 (h) | | 3,000,000 | | 2,966,250 |
Lehman ABS Manufactured Housing Contract Trust Series 2001-B Class M2, 7.17% 4/15/40 | | 1,084,685 | | 530,826 |
Merit Securities Corp. Series 13 Class M1, 8.63% 12/28/33 (i) | | 1,923,000 | | 2,057,320 |
Mesa West Capital CDO Ltd.: | | | | |
Series 2007-1A Class A2, 0.48% 2/25/47 (h)(i) | | 20,390,000 | | 18,758,800 |
Series 2007-1A Class A1, 0.45% 2/25/47 (h)(i) | | 6,377,223 | | 6,122,134 |
N-Star Real Estate CDO Ltd. Series 1A Class C1B, 7.696% 8/28/38 (h) | | 899,989 | | 773,990 |
Newcastle Investment Trust Series 2011-MH1 Class A, 2.45% 12/10/33 (h) | | 2,119,870 | | 2,150,019 |
Prima Capital Ltd. Series 2006-CR1A Class A2, 5.533% 12/28/48 (h) | | 7,748,554 | | 7,903,526 |
Taberna Preferred Funding III Ltd. Series 2005-3A Class D, 2.9231% 2/5/36 (h)(i) | | 3,693,580 | | 369 |
Wachovia Ltd./Wachovia LLC: | | | | |
Series 2006-1 Class 1ML, 0.9993% 9/25/26 (h)(i) | | 2,000,000 | | 1,240,000 |
Series 2006-1A: | | | | |
Class A1A, 0.5328% 9/25/26 (h)(i) | | 7,955,179 | | 7,855,739 |
Class A1B, 0.6028% 9/25/26 (h)(i) | | 22,506,000 | | 20,705,520 |
Class A2B, 0.5828% 9/25/26 (h)(i) | | 1,212,270 | | 1,154,688 |
Class B, 0.6328% 9/25/26 (h)(i) | | 3,450,000 | | 3,268,875 |
Class C, 0.8028% 9/25/26 (h)(i) | | 7,030,000 | | 6,537,900 |
Class E, 1.0028% 9/25/26 (h)(i) | | 1,000,000 | | 895,000 |
Class F, 1.4228% 9/25/26 (h)(i) | | 3,483,000 | | 3,047,625 |
Class G, 1.6228% 9/25/26 (h)(i) | | 1,599,000 | | 1,395,128 |
Class H, 1.9228% 9/25/26 (h)(i) | | 1,535,000 | | 1,331,613 |
Class J, 3.0228% 9/25/26 (h)(i) | | 1,500,000 | | 1,303,200 |
Class K, 3.5228% 9/25/26 (h)(i) | | 2,475,000 | | 2,103,750 |
Class L, 4.2728% 9/25/26 (h)(i) | | 1,500,000 | | 1,290,000 |
Asset-Backed Securities - continued |
| Principal Amount (e) | | Value |
Wrightwood Capital Real Estate CDO Ltd. Series 2005-1A: | | | | |
Class A1, 0.5936% 11/21/40 (h)(i) | | $ 8,831,580 | | $ 8,213,370 |
Class F, 2.2236% 11/21/40 (h)(i) | | 250,000 | | 50,000 |
TOTAL ASSET-BACKED SECURITIES (Cost $127,734,548) |
128,395,776
|
Collateralized Mortgage Obligations - 0.4% |
|
Private Sponsor - 0.4% |
COMM pass-thru certificates Series 2007-FL14 Class AJ, 0.371% 6/15/22 (h)(i) | | 1,672,831 | | 1,661,618 |
Countrywide Home Loans, Inc.: | | | | |
Series 2002-38 Class B3, 5% 2/25/18 (h) | | 45,480 | | 15,449 |
Series 2002-R2 Class 2B3, 3.6535% 7/25/33 (h)(i) | | 195,218 | | 35,053 |
Series 2003-40 Class B3, 4.5% 10/25/18 (h) | | 37,258 | | 949 |
Series 2003-R3: | | | | |
Class B2, 5.5% 11/25/33 (h) | | 1,272,916 | | 250,515 |
Class B3, 5.5% 11/25/33 | | 52,966 | | 1,171 |
Series 2004-R1 Class 1B3, 5.5% 11/25/34 (h)(i) | | 94,445 | | 7,011 |
FREMF Mortgage Trust: | | | | |
Series 2010-K6 Class B, 5.5328% 12/25/46 (h)(i) | | 4,500,000 | | 4,717,818 |
Series 2010-K7 Class B, 5.6188% 4/25/20 (h)(i) | | 3,200,000 | | 3,367,498 |
Merrill Lynch Mortgage Investors Trust Series 1998-C3 Class F, 6% 12/15/30 (h) | | 5,783,417 | | 5,954,004 |
RESI Finance LP/RESI Finance DE Corp. floater: | | | | |
Series 2003-B Class B9, 12.1428% 7/10/35 (h)(i) | | 216,490 | | 226,264 |
Series 2005-A Class B6, 2.1928% 3/10/37 (h)(i) | | 664,645 | | 4,254 |
Residential Funding Securities Corp. Series 2002-RM1 Class BI1, 5.5% 12/25/17 (h) | | 24,251 | | 21,211 |
RESIX Finance Ltd. floater: | | | | |
Series 2003-D Class B8, 6.6928% 12/10/35 (h)(i) | | 219,521 | | 72,333 |
Series 2004-A Class B7, 4.4428% 2/10/36 (h)(i) | | 241,587 | | 108,601 |
Series 2004-B Class B7, 4.1928% 2/10/36 (h)(i) | | 290,032 | | 119,677 |
TOTAL PRIVATE SPONSOR | | 16,563,426 |
U.S. Government Agency - 0.0% |
Fannie Mae REMIC Trust: | | | | |
Series 2001-W3 subordinate REMIC pass thru certificates, Class B3, 7% 9/25/41 (k) | | 138,253 | | 65,777 |
Series 2002-W1 subordinate REMIC pass thru certificates, Class 3B3, 3.1861% 2/25/42 (h)(i) | | 94,047 | | 53,961 |
Collateralized Mortgage Obligations - continued |
| Principal Amount (e) | | Value |
U.S. Government Agency - continued |
Fannie Mae REMIC Trust: - continued | | | | |
Series 2003-W1 subordinate REMIC pass thru certificates, Class B3, 4.8488% 12/25/42 (i)(k) | | $ 209,985 | | $ 54,010 |
Series 2003-W10 subordinate REMIC pass thru certificates, Class 2B3, 3.1684% 6/25/43 (h)(i) | | 140,041 | | 57,747 |
Series 2003-W4 subordinate REMIC pass thru certificates, Class 2B3, 3.1779% 10/25/42 (h)(i) | | 61,299 | | 32,335 |
TOTAL U.S. GOVERNMENT AGENCY | | 263,830 |
TOTAL COLLATERALIZED MORTGAGE OBLIGATIONS (Cost $17,966,869) |
16,827,256
|
Commercial Mortgage Securities - 12.5% |
|
ACGS Series 2004-1 Class P, 7.4605% 8/1/19 (k) | | 3,234,240 | | 3,192,043 |
Americold LLC Trust Series 2010-ARTA Class D, 7.443% 1/14/29 (h) | | 2,000,000 | | 2,287,786 |
Banc of America Commercial Mortgage Trust: | | | | |
Series 2005-1 Class CJ, 5.4031% 11/10/42 (i) | | 3,580,000 | | 3,803,535 |
Series 2005-5 Class D, 5.4033% 10/10/45 (i) | | 4,000,000 | | 4,036,092 |
Series 2005-6 Class AJ, 5.3576% 9/10/47 (i) | | 5,000,000 | | 5,359,625 |
Banc of America Large Loan Trust floater Series 2010-HLTN Class HLTN, 2.491% 11/15/15 (h)(i) | | 52,636,093 | | 52,890,536 |
Banc of America Large Loan, Inc. floater Series 2005-MIB1 Class K, 2.191% 3/15/22 (h)(i) | | 760,684 | | 517,153 |
Banc of America REMIC Trust Series 2012-CLMZ Class A, 7.691% 8/15/17 (h)(i) | | 4,900,000 | | 5,096,000 |
Bear Stearns Commercial Mortgage Securities, Inc. Series 2006-PW11 Class AJ, 5.6112% 3/11/39 (i) | | 5,700,000 | | 5,921,936 |
Bear Stearns Commercial Mortgage Securities Trust Series 2006-T22 Class B, 5.7655% 4/12/38 (h)(i) | | 2,520,000 | | 2,696,637 |
COMM Mortgage Trust: | | | | |
sequential payer Series 2013-LC6 Class E, 3.5% 1/10/46 (h) | | 4,300,000 | | 2,971,283 |
Series 2012-CR5 Class D, 4.4794% 12/10/45 (h)(i) | | 2,000,000 | | 1,805,966 |
Series 2013-CR9 Class D, 4.403% 7/10/45 (h) | | 1,000,000 | | 787,813 |
COMM pass-thru certificates floater Series 2006-FL12: | | | | |
Class AJ, 0.321% 12/15/20 (h)(i) | | 2,583,778 | | 2,546,874 |
Class B, 0.361% 12/15/20 (h)(i) | | 2,625,202 | | 2,567,503 |
Commercial Mortgage Trust pass-thru certificates: | | | | |
Series 2005-C6 Class AJ, 5.209% 6/10/44 (i) | | 5,000,000 | | 5,238,340 |
Commercial Mortgage Securities - continued |
| Principal Amount (e) | | Value |
Commercial Mortgage Trust pass-thru certificates: - continued | | | | |
Series 2012-CR1: | | | | |
Class C, 5.5468% 5/15/45 (i) | | $ 1,000,000 | | $ 1,011,933 |
Class D, 5.5468% 5/15/45 (h)(i) | | 5,550,000 | | 5,073,133 |
Series 2012-CR2: | | | | |
Class D, 5.02% 8/15/45 (h)(i) | | 4,500,000 | | 4,255,686 |
Class E, 5.02% 8/15/45 (h)(i) | | 6,000,000 | | 5,287,152 |
Series 2012-LC4: | | | | |
Class C, 5.8238% 12/10/44 (i) | | 2,000,000 | | 2,067,198 |
Class D, 5.8238% 12/10/44 (h)(i) | | 8,000,000 | | 7,511,608 |
Credit Suisse First Boston Mortgage Securities Corp.: | | | | |
Series 1998-C1 Class F, 6% 5/17/40 (h) | | 1,855,830 | | 2,011,970 |
Series 1998-C2 Class F, 6.75% 11/15/30 (h) | | 3,000,000 | | 3,119,874 |
DBUBS Mortgage Trust Series 2011-LC1A Class E, 5.7284% 11/10/46 (h)(i) | | 12,490,000 | | 12,137,270 |
Deutsche Mortgage & Asset Receiving Corp. Series 1998-C1 Class J, 6.22% 6/15/31 | | 543,989 | | 543,624 |
DLJ Commercial Mortgage Corp. Series 1998-CG1 Class B4, 7.3882% 6/10/31 (h)(i) | | 216,298 | | 216,252 |
Extended Stay America Trust Series 2013-ESHM Class M, 7.625% 12/5/19 (h) | | 10,950,000 | | 11,184,607 |
Freddie Mac: | | | | |
pass-thru certificates: | | | | |
Series K011 Class X3, 2.6621% 12/25/43 (i)(j) | | 12,206,096 | | 1,828,693 |
Series K012 Class X3, 2.3659% 1/25/41 (i)(j) | | 21,072,886 | | 2,820,943 |
Series K013 Class X3, 2.8848% 1/25/43 (i)(j) | | 14,360,000 | | 2,358,257 |
Series KAIV Class X2, 3.6147% 6/25/46 (i)(j) | | 7,430,000 | | 1,578,865 |
G-Force LLC sequential payer Series 2005-RRA Class A2, 4.83% 8/22/36 (h) | | 3,294,724 | | 3,311,197 |
GMAC Commercial Mortgage Securities, Inc.: | | | | |
Series 1997-C2 Class G, 6.75% 4/15/29 (i) | | 870,077 | | 967,580 |
Series 1999-C3 Class J, 6.974% 8/15/36 (h) | | 1,500,000 | | 1,561,283 |
Series 2000-C1 Class K, 7% 3/15/33 | | 190,322 | | 140,399 |
GS Mortgage Securities Corp. II: | | | | |
floater Series 2007-EOP Class L, 5.4585% 3/6/20 (h)(i) | | 1,400,000 | | 1,398,697 |
Series 2010-C1: | | | | |
Class D, 6.1268% 8/10/43 (h)(i) | | 4,000,000 | | 4,023,956 |
Class E, 4% 8/10/43 (h) | | 3,770,000 | | 2,854,120 |
Series 2012-GCJ7: | | | | |
Class C, 5.9064% 5/10/45 (i) | | 6,500,000 | | 6,802,575 |
Class D, 5.9064% 5/10/45 (h)(i) | | 2,000,000 | | 1,882,940 |
Commercial Mortgage Securities - continued |
| Principal Amount (e) | | Value |
GS Mortgage Securities Corp. Trust Series 2011-ALF Class E, 4.953% 2/10/21 (h) | | $ 9,185,000 | | $ 9,210,718 |
GS Mortgage Securities Trust: | | | | |
Series 2010-C2 Class D, 5.4004% 12/10/43 (h)(i) | | 3,000,000 | | 2,856,888 |
Series 2011-GC5: | | | | |
Class C, 5.4744% 8/10/44 (h)(i) | | 9,000,000 | | 9,317,997 |
Class D, 5.4744% 8/10/44 (h)(i) | | 4,000,000 | | 3,744,660 |
Series 2012-GC6 Class C, 5.8263% 1/10/45 (h)(i) | | 3,600,000 | | 3,782,745 |
JP Morgan Chase Commercial Mortgage Securities Trust floater: | | | | |
Series 2013-JWMZ Class M, 6.191% 4/15/18 (h)(i) | | 2,225,379 | | 2,242,065 |
Series 2013-JWRZ Class E, 3.931% 4/15/30 (h)(i) | | 3,400,000 | | 3,385,373 |
JPMorgan Chase Commercial Mortgage Securities Corp.: | | | | |
Series 2001-A: | | | | |
Class G, 6% 10/15/32 (h)(i) | | 2,034,288 | | 36,685 |
Class X, 0.6365% 10/15/32 (h)(i)(j) | | 4,717,838 | | 29,956 |
Series 2002-C1 Class E, 6.135% 7/12/37 (h) | | 1,603,638 | | 1,605,251 |
Series 2003-C1 Class F, 6.1832% 1/12/37 (h)(i) | | 1,000,000 | | 1,000,000 |
Series 2009-IWST: | | | | |
Class C, 7.6935% 12/5/27 (h)(i) | | 3,000,000 | | 3,579,231 |
Class D, 7.6935% 12/5/27 (h)(i) | | 9,550,000 | | 10,777,022 |
Series 2010-CNTM Class MZ, 8.5% 8/5/20 (h) | | 9,000,000 | | 9,555,212 |
Series 2010-CNTR: | | | | |
Class D, 6.3899% 8/5/32 (h)(i) | | 4,500,000 | | 4,911,768 |
Class XB, 1.1366% 8/5/32 (h)(i)(j) | | 32,655,000 | | 1,504,759 |
Series 2012-CBX Class C, 5.3611% 6/16/45 (i) | | 4,530,000 | | 4,548,004 |
JPMorgan Chase Commercial Mortgage Securities Trust: | | | | |
Series 2005-LDP5 Class AJ, 5.4883% 12/15/44 (i) | | 3,470,000 | | 3,671,251 |
Series 2011-C5 Class C, 5.4915% 8/15/46 (h)(i) | | 6,525,375 | | 6,838,456 |
JPMorgan Chase Commercial Mortgage Trust Series 2013-LC11 Class D, 4.3844% 4/15/46 (i) | | 3,750,000 | | 3,031,806 |
JPMorgan Commercial Mortgage Finance Corp. Series 1999-C8: | | | | |
Class G, 6% 7/15/31 (h) | | 600,122 | | 601,704 |
Class H, 6% 7/15/31 (h) | | 1,424,589 | | 838,020 |
LB Commercial Conduit Mortgage Trust Series 1998-C4 Class G, 5.6% 10/15/35 (h) | | 990,263 | | 1,003,253 |
LB-UBS Commercial Mortgage Trust: | | | | |
sequential payer: | | | | |
Series 2004-C2 Class E, 4.487% 3/15/36 | | 2,060,000 | | 2,078,231 |
Series 2005-C3 Class AJ, 4.843% 7/15/40 | | 6,620,000 | | 6,982,564 |
Series 2005-C7 Class AJ, 5.323% 11/15/40 (i) | | 8,000,000 | | 8,492,008 |
Commercial Mortgage Securities - continued |
| Principal Amount (e) | | Value |
LB-UBS Commercial Mortgage Trust: - continued | | | | |
sequential payer: | | | | |
Series 2006-C7 Class AM, 5.378% 11/15/38 | | $ 2,040,000 | | $ 2,178,318 |
Series 2004-C7 Class E, 4.918% 10/15/36 | | 5,120,000 | | 5,265,638 |
Series 2005-C1 Class E, 4.924% 2/15/40 | | 4,000,000 | | 4,075,288 |
Series 2006-C4: | | | | |
Class AJ, 6.0813% 6/15/38 (i) | | 7,005,000 | | 7,229,854 |
Class AM, 6.0813% 6/15/38 (i) | | 6,700,000 | | 7,393,631 |
Lehman Brothers Floating Rate Commercial Mortgage Trust floater Series 2007-LLFA Class E, 1.091% 6/15/22 (h)(i) | | 6,230,000 | | 6,197,691 |
LStar Commercial Mortgage Trust Series 2011-1: | | | | |
Class B, 5.5191% 6/25/43 (h)(i) | | 6,165,000 | | 6,403,467 |
Class D, 5.5191% 6/25/43 (h)(i) | | 4,699,000 | | 4,625,745 |
Mach One Trust LLC Series 2004-1A Class H, 6.3257% 5/28/40 (h)(i) | | 2,840,000 | | 2,886,150 |
Merrill Lynch Financial Asset, Inc. Series 2005-CA16: | | | | |
Class F, 4.384% 7/12/37 | CAD | 710,000 | | 583,842 |
Class G, 4.384% 7/12/37 | CAD | 355,000 | | 286,895 |
Class H, 4.384% 7/12/37 | CAD | 236,000 | | 187,458 |
Class J, 4.384% 7/12/37 | CAD | 355,000 | | 277,175 |
Class K, 4.384% 7/12/37 | CAD | 355,000 | | 272,475 |
Class L, 4.384% 7/12/37 | CAD | 236,000 | | 178,083 |
Class M, 4.384% 7/12/37 | CAD | 995,000 | | 671,534 |
Merrill Lynch Mortgage Investors Trust Series 1999-C1 Class G, 6.71% 11/15/31 (h) | | 705,632 | | 324,591 |
Merrill Lynch Mortgage Trust Series 2006-C1 Class AM, 5.8724% 5/12/39 (i) | | 1,200,000 | | 1,309,643 |
Mezz Capital Commercial Mortgage Trust: | | | | |
sequential payer: | | | | |
Series 2004-C1 Class A, 4.836% 1/15/37 (h) | | 1,267,582 | | 1,128,148 |
Series 2004-C2 Class A, 5.318% 10/15/40 (h) | | 9,062,036 | | 7,929,282 |
Series 2004-C1: | | | | |
Class D, 6.988% 1/15/37 (h) | | 223,293 | | 22 |
Class IO, 8.9651% 1/15/37 (h)(i)(j) | | 1,759,867 | | 81,482 |
Morgan Stanley BAML Trust Series 2013-C9 Class D, 4.2997% 5/15/46 (h)(i) | | 5,000,000 | | 4,087,410 |
Morgan Stanley Capital I Trust: | | | | |
sequential payer: | | | | |
Series 2012-C4 Class E, 5.71% 3/15/45 (h)(i) | | 4,630,000 | | 4,312,137 |
Series 2006-HQ10 Class AM, 5.36% 11/12/41 | | 8,200,000 | | 8,949,357 |
Series 1997-RR Class F, 7.4018% 4/30/39 (h)(i) | | 1,030,758 | | 1,030,758 |
Series 1998-CF1 Class G, 7.35% 7/15/32 (h) | | 2,638,892 | | 1,970,236 |
Commercial Mortgage Securities - continued |
| Principal Amount (e) | | Value |
Morgan Stanley Capital I Trust: - continued | | | | |
Series 2005-HQ5 Class B, 5.272% 1/14/42 | | $ 2,000,000 | | $ 2,090,064 |
Series 2005-HQ6 Class AJ, 5.073% 8/13/42 (i) | | 2,500,000 | | 2,638,195 |
Series 2006-IQ12 Class AMFX, 5.37% 12/15/43 | | 7,500,000 | | 8,239,575 |
Series 2011-C1 Class C, 5.4199% 9/15/47 (h)(i) | | 4,000,000 | | 4,260,810 |
Series 2011-C2: | | | | |
Class D, 5.4934% 6/15/44 (h)(i) | | 4,610,000 | | 4,446,580 |
Class E, 5.4934% 6/15/44 (h)(i) | | 9,600,000 | | 9,032,928 |
Class F, 5.4934% 6/15/44 (h)(i) | | 4,440,000 | | 3,591,760 |
Class XB, 0.5389% 6/15/44 (h)(i)(j) | | 63,708,222 | | 2,154,294 |
Series 2011-C3: | | | | |
Class C, 5.3573% 7/15/49 (h)(i) | | 2,000,000 | | 2,045,002 |
Class D, 5.3573% 7/15/49 (h)(i) | | 7,400,000 | | 7,220,047 |
Series 2012-C4 Class D, 5.71% 3/15/45 (h)(i) | | 6,310,000 | | 6,343,676 |
NationsLink Funding Corp. Series 1999-SL Class X, 11/10/30 (j) | | 74,656 | | 74,567 |
Providence Place Group Ltd. Partnership Series 2000-C1 Class A2, 7.75% 7/20/28 (h) | | 3,929,602 | | 5,029,498 |
RBSCF Trust Series 2010-MB1 Class D, 4.8386% 4/15/24 (h)(i) | | 9,049,000 | | 9,102,869 |
Salomon Brothers Mortgage Securities VII, Inc. Series 2001-MMA Class E3, 6.5% 2/18/34 (h)(i) | | 122,646 | | 123,767 |
TIAA Seasoned Commercial Mortgage Trust sequential payer Series 2007-C4 Class AJ, 5.5257% 8/15/39 (i) | | 2,080,000 | | 2,269,590 |
TimberStar Trust I Series 2006-1 Class F, 7.5296% 10/15/36 (h) | | 10,630,000 | | 10,871,163 |
UBS Commercial Mortgage Trust Series 2007-FL1 Class F, 0.766% 7/15/24 (h)(i) | | 1,200,000 | | 1,093,200 |
UBS-Barclays Commercial Mortgage Trust sequential payer Series 2012-C3 Class A1, 0.726% 8/10/49 | | 3,415,348 | | 3,388,131 |
UBS-Citigroup Commercial Mortgage Trust Series 2011-C1 Class B, 6.0706% 1/10/45 (h)(i) | | 3,000,000 | | 3,344,322 |
Vornado DP LLC Series 2010-VNO Class D, 6.3555% 9/13/28 (h) | | 2,540,000 | | 2,811,498 |
Wachovia Bank Commercial Mortgage Trust: | | | | |
Series 2004-C10 Class E, 4.931% 2/15/41 | | 2,000,000 | | 2,019,384 |
Series 2004-C11: | | | | |
Class D, 5.5696% 1/15/41 (i) | | 5,177,000 | | 5,246,579 |
Class E, 5.6196% 1/15/41 (i) | | 3,785,000 | | 3,835,359 |
Series 2004-C12 Class D, 5.4782% 7/15/41 (i) | | 2,750,000 | | 2,816,858 |
Series 2004-C14 Class B, 5.17% 8/15/41 | | 3,180,000 | | 3,278,764 |
Wells Fargo Commercial Mortgage Trust Series 2012-LC5 Class D, 4.7802% 10/15/45 (h) | | 9,999,000 | | 8,698,550 |
Commercial Mortgage Securities - continued |
| Principal Amount (e) | | Value |
WF-RBS Commercial Mortgage Trust: | | | | |
Series 2011-C3: | | | | |
Class C, 5.335% 3/15/44 (h) | | $ 4,900,000 | | $ 5,090,728 |
Class D, 5.7215% 3/15/44 (h)(i) | | 1,000,000 | | 961,854 |
Class E, 5% 3/15/44 (h) | | 3,000,000 | | 2,484,135 |
Series 2012-C7 Class D, 5.0045% 6/15/45 (h)(i) | | 2,380,000 | | 2,269,935 |
Series 2013-C11: | | | | |
Class D, 4.3246% 3/15/45 (h)(i) | | 5,830,000 | | 4,801,250 |
Class E, 4.3246% 3/15/45 (h)(i) | | 4,780,000 | | 3,501,097 |
Series 2013-C13 Class D, 4.2791% 5/15/45 (h)(i) | | 4,000,000 | | 3,224,236 |
WFDB Commercial Mortgage Trust Series 2011-BXR Class D, 5.914% 7/5/24 (h) | | 4,000,000 | | 4,064,472 |
TOTAL COMMERCIAL MORTGAGE SECURITIES (Cost $486,874,679) |
515,595,608
|
Floating Rate Loans - 11.0% |
|
CONSUMER DISCRETIONARY - 4.8% |
Hotels, Restaurants & Leisure - 4.5% |
Cedar Fair LP Tranche B, term loan 3.25% 3/6/20 (i) | | 2,802,975 | | 2,831,005 |
Cooper Hotel Group REL 12% 11/6/17 | | 13,350,139 | | 14,017,646 |
Extended Stay America, Inc. REL 9.625% 12/1/19 | | 7,000,000 | | 7,140,000 |
Four Seasons Holdings, Inc. Tranche 2LN, term loan 6.25% 12/27/20 (i) | | 510,000 | | 520,200 |
Hilton Worldwide, Inc.: | | | | |
term loan 4.442% 11/12/15 (i) | | 55,995,536 | | 55,365,586 |
Tranche B, term loan 3.5645% 11/12/15 (i) | | 10,902,924 | | 10,780,266 |
Tranche C, term loan 3.692% 11/12/15 (i) | | 18,171,541 | | 17,967,111 |
Tranche D, term loan 3.942% 11/12/15 (i) | | 20,986,223 | | 20,750,128 |
Tranche E, term loan 4.192% 11/12/15 (i) | | 27,257,311 | | 26,950,666 |
Intrawest U.S. Holding, Inc. Tranche 1LN, term loan 7% 12/4/17 (i) | | 4,975,000 | | 5,068,281 |
La Quinta: | | | | |
Tranche A, term loan 11.375% 7/6/14 (i) | | 7,990,026 | | 8,140,239 |
Tranche B, term loan 11.375% 7/6/14 (i) | | 5,992,520 | | 6,105,179 |
Tranche D, term loan 14.9% 7/6/14 (i) | | 12,000,000 | | 11,715,600 |
| | 187,351,907 |
Multiline Retail - 0.2% |
JC Penney Corp., Inc. Tranche B, term loan 6% 5/21/18 (i) | | 5,995,000 | | 5,957,531 |
Floating Rate Loans - continued |
| Principal Amount (e) | | Value |
CONSUMER DISCRETIONARY - continued |
Specialty Retail - 0.1% |
The Pep Boys - Manny, Moe & Jack Tranche B, term loan 5% 10/11/18 (i) | | $ 5,328,225 | | $ 5,361,526 |
TOTAL CONSUMER DISCRETIONARY | | 198,670,964 |
CONSUMER STAPLES - 0.1% |
Food & Staples Retailing - 0.1% |
Albertson's LLC Tranche B 1LN, term loan 4.25% 3/21/16 (i) | | 5,162,063 | | 5,213,683 |
ENERGY - 0.4% |
Oil, Gas & Consumable Fuels - 0.4% |
Panda Sherman Power, LLC term loan 9% 9/14/18 (i) | | 7,200,000 | | 7,326,000 |
Panda Temple Power, LLC term loan 7.25% 4/3/19 (i) | | 8,580,000 | | 8,655,075 |
| | 15,981,075 |
FINANCIALS - 4.0% |
Diversified Financial Services - 1.2% |
Blackstone REL 10% 10/1/17 | | 17,488,428 | | 18,385,584 |
BRE Select Hotels Corp. REL 5.942% 5/9/18 (i) | | 12,235,818 | | 12,235,818 |
Calpine Construction Finance Co. LP Tranche B 2LN, term loan 3.25% 1/31/22 (i) | | 5,445,000 | | 5,424,581 |
Pilot Travel Centers LLC: | | | | |
Tranche B 2LN, term loan 4.25% 8/7/19 (i) | | 7,208,218 | | 7,208,218 |
Tranche B, term loan 3.75% 3/30/18 (i) | | 6,650,166 | | 6,625,561 |
SBA Senior Finance, Inc. Tranche B, term loan 3.75% 6/30/18 (i) | | 1,083,174 | | 1,091,297 |
| | 50,971,059 |
Real Estate Investment Trusts - 1.0% |
iStar Financial, Inc. Tranche B, term loan 4.5% 10/15/17 (i) | | 37,392,090 | | 37,485,570 |
Starwood Property Trust, Inc. Tranche B, term loan 3.5% 4/10/20 (i) | | 4,987,500 | | 4,987,500 |
| | 42,473,070 |
Real Estate Management & Development - 1.7% |
CB Richard Ellis Services, Inc. Tranche B, term loan 2.9451% 3/28/21 (i) | | 4,513,688 | | 4,524,972 |
CityCenter term loan 8.75% 7/12/14 (i) | | 4,169,750 | | 4,169,750 |
EOP Operating LP term loan: | | | | |
6.02% 2/1/14 (i) | | 5,000,000 | | 4,944,000 |
Floating Rate Loans - continued |
| Principal Amount (e) | | Value |
FINANCIALS - continued |
Real Estate Management & Development - continued |
EOP Operating LP term loan: - continued | | | | |
6.27% 2/1/14 (i) | | $ 3,800,000 | | $ 3,757,440 |
Equity Inns Reality LLC: | | | | |
Tranche A, term loan 10.5% 11/4/13 (i) | | 7,888,426 | | 7,212,651 |
Tranche B 2LN, term loan 7.55% 11/4/13 (i) | | 15,000,000 | | 14,962,500 |
Realogy Corp.: | | | | |
Credit-Linked Deposit 3.1963% 10/10/13 (i) | | 431,153 | | 431,153 |
Credit-Linked Deposit 4.4463% 10/10/16 (i) | | 914,940 | | 914,940 |
Realogy Group LLC Tranche B, term loan 4.5% 3/5/20 (i) | | 27,341,475 | | 27,614,890 |
| | 68,532,296 |
Thrifts & Mortgage Finance - 0.1% |
Ocwen Loan Servicing, LLC Tranche B, term loan 5% 1/23/18 (i) | | 1,962,588 | | 1,996,933 |
TOTAL FINANCIALS | | 163,973,358 |
HEALTH CARE - 0.4% |
Health Care Providers & Services - 0.4% |
Community Health Systems, Inc. term loan 3.7728% 1/25/17 (i) | | 2,903,247 | | 2,925,022 |
Health Management Associates, Inc. Tranche B, term loan 3.5% 11/18/18 (i) | | 2,083,219 | | 2,088,427 |
Skilled Healthcare Group, Inc. term loan 6.7123% 4/9/16 (i) | | 10,118,541 | | 10,143,838 |
| | 15,157,287 |
INDUSTRIALS - 0.3% |
Construction & Engineering - 0.3% |
Drumm Investors LLC Tranche B, term loan 5% 5/4/18 (i) | | 13,326,466 | | 12,893,356 |
TELECOMMUNICATION SERVICES - 0.5% |
Wireless Telecommunication Services - 0.5% |
Crown Castle Operating Co.: | | | | |
Tranche A, term loan 2.69% 1/31/17 (i) | | 8,727,273 | | 8,727,273 |
Tranche B, term loan 3.25% 1/31/19 (i) | | 9,212,995 | | 9,212,995 |
SBA Senior Finance II, LLC term loan 3.75% 9/28/19 (i) | | 1,226,177 | | 1,235,374 |
| | 19,175,642 |
Floating Rate Loans - continued |
| Principal Amount (e) | | Value |
UTILITIES - 0.5% |
Electric Utilities - 0.3% |
EquiPower Resources Holdings LLC: | | | | |
Tranche B 1LN, term loan 5.5% 12/21/18 (i) | | $ 5,000,000 | | $ 5,037,500 |
Tranche C, term loan 4.5% 12/21/19 (i) | | 995,000 | | 1,002,463 |
Essential Power LLC Tranche B, term loan 4.25% 8/8/19 (i) | | 2,428,050 | | 2,458,401 |
La Frontera Generation, LLC Tranche B, term loan 4.5% 9/30/20 (i) | | 5,000,000 | | 5,031,500 |
| | 13,529,864 |
Independent Power Producers & Energy Traders - 0.2% |
Tempus Public Foundation Generation Holdings LLC Tranche B, term loan 4.75% 12/31/17 (i) | | 9,000,000 | | 9,090,000 |
TOTAL UTILITIES | | 22,619,864 |
TOTAL FLOATING RATE LOANS (Cost $447,883,989) |
453,685,229
|
Preferred Securities - 0.0% |
| | | |
FINANCIALS - 0.0% |
Diversified Financial Services - 0.0% |
Crest Clarendon Street 2002-1 Ltd. Series 2002-1A Class PS, 12/28/35 (h) | 500,000 | | 25,000 |
Crest Dartmouth Street 2003 1 Ltd. Series 2003-1A Class PS, 6/28/38 (h) | 1,220,000 | | 61,000 |
| | 86,000 |
TOTAL PREFERRED SECURITIES (Cost $1,293,843) |
86,000
|
Money Market Funds - 7.4% |
| Shares | | Value |
Fidelity Cash Central Fund, 0.11% (b) | 270,943,913 | | $ 270,943,913 |
Fidelity Securities Lending Cash Central Fund, 0.12% (b)(c) | 35,303,075 | | 35,303,075 |
TOTAL MONEY MARKET FUNDS (Cost $306,246,988) |
306,246,988
|
TOTAL INVESTMENT PORTFOLIO - 100.9% (Cost $3,920,875,824) | | 4,159,414,034 |
NET OTHER ASSETS (LIABILITIES) - (0.9)% | | (36,346,452) |
NET ASSETS - 100% | $ 4,123,067,582 |
Currency Abbreviations |
CAD | - | Canadian dollar |
Legend |
(a) Non-income producing |
(b) Affiliated fund that is generally available only to investment companies and other accounts managed by Fidelity Investments. The rate quoted is the annualized seven-day yield of the fund at period end. A complete unaudited listing of the fund's holdings as of its most recent quarter end is available upon request. In addition, each Fidelity Central Fund's financial statements, which are not covered by the Fund's Report of Independent Registered Public Accounting Firm, are available on the SEC's website or upon request. |
(c) Investment made with cash collateral received from securities on loan. |
(d) Non-income producing - Security is in default. |
(e) Amount is stated in United States dollars unless otherwise noted. |
(f) Security or a portion of the security is on loan at period end. |
(g) Affiliated company |
(h) Security exempt from registration under Rule 144A of the Securities Act of 1933. These securities may be resold in transactions exempt from registration, normally to qualified institutional buyers. At the end of the period, the value of these securities amounted to $602,160,428 or 14.6% of net assets. |
(i) Coupon rates for floating and adjustable rate securities reflect the rates in effect at period end. |
(j) Security represents right to receive monthly interest payments on an underlying pool of mortgages or assets. Principal shown is the outstanding par amount of the pool as of the end of the period. |
(k) Restricted securities - Investment in securities not registered under the Securities Act of 1933 (excluding 144A issues). At the end of the period, the value of restricted securities (excluding 144A issues) amounted to $3,342,652 or 0.1% of net assets. |
Additional information on each restricted holding is as follows: |
Security | Acquisition Date | Acquisition Cost |
ACGS Series 2004-1 Class P, 7.4605% 8/1/19 | 2/17/11 | $ 3,131,922 |
Fannie Mae REMIC Trust Series 2001-W3 subordinate REMIC pass thru certificates, Class B3, 7% 9/25/41 | 5/21/03 | $ 119,805 |
Fannie Mae REMIC Trust Series 2003-W1 subordinate REMIC pass thru certificates, Class B3, 4.8488% 12/25/42 | 3/25/03 | $ 124,853 |
GSR Mortgage Loan Trust Series 2005-HE3 Class B3, 2.69% 6/25/35 | 6/3/05 | $ 613,549 |
Affiliated Central Funds |
Information regarding fiscal year to date income earned by the Fund from investments in Fidelity Central Funds is as follows: |
Fund | Income earned |
Fidelity Cash Central Fund | $ 456,858 |
Fidelity Securities Lending Cash Central Fund | 106,590 |
Total | $ 563,448 |
Other Affiliated Issuers |
An affiliated company is a company in which the Fund has ownership of at least 5% of the voting securities. Fiscal year to date transactions with companies which are or were affiliates are as follows: |
Affiliate | Value, beginning of period | Purchases | Sales Proceeds | Dividend Income | Value,
end of
period |
AmREIT, Inc. Class B | $ 2,818,000 | $ - | $ 3,749,972 | $ 96,887 | $ - |
Arbor Realty Trust, Inc. | - | 20,862,754 | - | 445,338 | 21,107,288 |
Arbor Realty Trust, Inc. Series A, 8.25% | - | 4,727,225 | - | 129,999 | 4,748,025 |
Arbor Realty Trust, Inc. Series B, 7.75% | - | 6,000,000 | - | - | 5,901,600 |
Total | $ 2,818,000 | $ 31,589,979 | $ 3,749,972 | $ 672,224 | $ 31,756,913 |
Other Information |
The following is a summary of the inputs used, as of July 31, 2013, involving the Fund's assets and liabilities carried at fair value. The inputs or methodology used for valuing securities may not be an indication of the risk associated with investing in those securities. For more information on valuation inputs, and their aggregation into the levels used in the tables below, please refer to the Investment Valuation section in the accompanying Notes to Financial Statements. |
Valuation Inputs at Reporting Date: |
Description | Total | Level 1 | Level 2 | Level 3 |
Investments in Securities: | | | |
Equities: | | | | |
Consumer Discretionary | $ 30,768,803 | $ 25,866,567 | $ - | $ 4,902,236 |
Financials | 1,843,945,625 | 1,823,549,794 | 18,107,807 | 2,288,024 |
Health Care | 44,524,811 | 44,524,811 | - | - |
Corporate Bonds | 819,337,938 | - | 816,169,770 | 3,168,168 |
Asset-Backed Securities | 128,395,776 | - | 107,450,194 | 20,945,582 |
Collateralized Mortgage Obligations | 16,827,256 | - | 15,722,149 | 1,105,107 |
Commercial Mortgage Securities | 515,595,608 | - | 494,454,226 | 21,141,382 |
Floating Rate Loans | 453,685,229 | - | 348,111,473 | 105,573,756 |
Preferred Securities | 86,000 | - | - | 86,000 |
Money Market Funds | 306,246,988 | 306,246,988 | - | - |
Total Investments in Securities: | $ 4,159,414,034 | $ 2,200,188,160 | $ 1,800,015,619 | $ 159,210,255 |
Valuation Inputs at Reporting Date: |
The following is a reconciliation of Investments in Securities for which Level 3 inputs were used in determining value: |
Investments in Securities: | |
Commercial Mortgage Securities | |
Beginning Balance | $ 53,984,005 |
Net Realized Gain (Loss) on Investment Securities | 504,595 |
Net Unrealized Gain (Loss) on Investment Securities | 1,350,805 |
Cost of Purchases | 2,889,025 |
Proceeds of Sales | (20,825,300) |
Amortization/Accretion | 627,941 |
Transfers into Level 3 | 1,065,042 |
Transfers out of Level 3 | (18,454,731) |
Ending Balance | $ 21,141,382 |
The change in unrealized gain (loss) for the period attributable to Level 3 securities held at July 31, 2013 | $ 647,713 |
Floating Rate Loans | |
Beginning Balance | $ 18,003,477 |
Net Realized Gain (Loss) on Investment Securities | 264,493 |
Net Unrealized Gain (Loss) on Investment Securities | 1,632,128 |
Cost of Purchases | 95,215,441 |
Proceeds of Sales | (14,290,062) |
Amortization/Accretion | 273,279 |
Transfers into Level 3 | 4,475,000 |
Transfers out of Level 3 | - |
Ending Balance | $ 105,573,756 |
The change in unrealized gain (loss) for the period attributable to Level 3 securities held at July 31, 2013 | $ 1,772,448 |
Other Investments in Securities | |
Beginning Balance | $ 55,750,106 |
Net Realized Gain (Loss) on Investment Securities | (5,987,844) |
Net Unrealized Gain (Loss) on Investment Securities | 11,096,738 |
Cost of Purchases | 168,742 |
Proceeds of Sales | (13,480,859) |
Amortization/Accretion | (260,694) |
Transfers into Level 3 | 9,210,100 |
Transfers out of Level 3 | (24,001,172) |
Ending Balance | $ 32,495,117 |
The change in unrealized gain (loss) for the period attributable to Level 3 securities held at July 31, 2013 | $ 4,610,963 |
The information used in the above reconciliations represents fiscal year to date activity for any Investments in Securities identified as using Level 3 inputs at either the beginning or the end of the current fiscal period. Transfers into Level 3 were attributable to a lack of observable market data resulting from decreases in market activity, decreases in liquidity, security restructurings or corporate actions. Transfers out of Level 3 were attributable to observable market data becoming available for those securities. Transfers in or out of Level 3 represent the beginning value of any Security or Instrument where a change in the pricing level occurred from the beginning to the end of the period. The cost of purchases and the proceeds of sales may include securities received or delivered through corporate actions or exchanges. Realized and unrealized gains (losses) disclosed in the reconciliations are included in Net Gain (Loss) on the Fund's Statement of Operations. |
Other Information |
The composition of credit quality ratings as a percentage of net assets is as follows (Unaudited): |
U.S. Government and U.S. Government Agency Obligations | 0.2% |
AAA,AA,A | 5.7% |
BBB | 10.8% |
BB | 6.8% |
B | 11.6% |
CCC,CC,C | 0.9% |
D | 0.0% |
Not Rated | 10.9% |
Equities | 46.6% |
Short-Term Investments and Net Other Assets | 6.5% |
| 100.0% |
We have used ratings from Moody's Investors Service, Inc. Where Moody's® ratings are not available, we have used S&P® ratings. All ratings are as of the date indicated and do not reflect subsequent changes. |
See accompanying notes which are an integral part of the financial statements.
Annual Report
Statement of Assets and Liabilities
| July 31, 2013 |
| | |
Assets | | |
Investment in securities, at value (including securities loaned of $33,804,284) - See accompanying schedule: Unaffiliated issuers (cost $3,583,038,857) | $ 3,821,410,133 | |
Fidelity Central Funds (cost $306,246,988) | 306,246,988 | |
Other affiliated issuers (cost $31,589,979) | 31,756,913 | |
Total Investments (cost $3,920,875,824) | | $ 4,159,414,034 |
Cash | | 119,760 |
Foreign currency held at value (cost $26,760) | | 26,760 |
Receivable for investments sold | | 3,833,620 |
Receivable for fund shares sold | | 8,237,634 |
Dividends receivable | | 2,204,019 |
Interest receivable | | 22,132,356 |
Distributions receivable from Fidelity Central Funds | | 70,745 |
Other receivables | | 14,996 |
Total assets | | 4,196,053,924 |
| | |
Liabilities | | |
Payable for investments purchased | $ 26,371,855 | |
Payable for fund shares redeemed | 8,145,140 | |
Accrued management fee | 1,915,759 | |
Distribution and service plan fees payable | 254,617 | |
Other affiliated payables | 897,990 | |
Other payables and accrued expenses | 97,906 | |
Collateral on securities loaned, at value | 35,303,075 | |
Total liabilities | | 72,986,342 |
| | |
Net Assets | | $ 4,123,067,582 |
Net Assets consist of: | | |
Paid in capital | | $ 3,803,721,769 |
Undistributed net investment income | | 39,267,501 |
Accumulated undistributed net realized gain (loss) on investments and foreign currency transactions | | 41,514,895 |
Net unrealized appreciation (depreciation) on investments and assets and liabilities in foreign currencies | | 238,563,417 |
Net Assets | | $ 4,123,067,582 |
See accompanying notes which are an integral part of the financial statements.
Annual Report
Statement of Assets and Liabilities - continued
| July 31, 2013 |
| | |
Calculation of Maximum Offering Price Class A:
Net Asset Value and redemption price per share ($378,268,593 ÷ 32,419,120 shares) | | $ 11.67 |
| | |
Maximum offering price per share (100/96.00 of $11.67) | | $ 12.16 |
Class T:
Net Asset Value and redemption price per share ($46,197,678 ÷ 3,958,306 shares) | | $ 11.67 |
| | |
Maximum offering price per share (100/96.00 of $11.67) | | $ 12.16 |
Class C:
Net Asset Value and offering price per share ($204,011,677 ÷ 17,607,394 shares)A | | $ 11.59 |
| | |
Real Estate Income:
Net Asset Value, offering price and redemption price per share ($2,884,544,749 ÷ 246,252,183 shares) | | $ 11.71 |
| | |
Institutional Class:
Net Asset Value, offering price and redemption price per share ($610,044,885 ÷ 52,187,743 shares) | | $ 11.69 |
A Redemption price per share is equal to net asset value less any applicable contingent deferred sales charge.
See accompanying notes which are an integral part of the financial statements.
Annual Report
Financial Statements - continued
Statement of Operations
| Year ended July 31, 2013 |
| | |
Investment Income | | |
Dividends (including $672,224 earned from other affiliated issuers) | | $ 77,045,173 |
Interest | | 126,655,801 |
Income from Fidelity Central Funds | | 563,448 |
Total income | | 204,264,422 |
| | |
Expenses | | |
Management fee | $ 19,911,854 | |
Transfer agent fees | 8,252,304 | |
Distribution and service plan fees | 1,899,520 | |
Accounting and security lending fees | 1,241,312 | |
Custodian fees and expenses | 60,830 | |
Independent trustees' compensation | 21,622 | |
Registration fees | 272,305 | |
Audit | 174,326 | |
Legal | 9,979 | |
Miscellaneous | 27,598 | |
Total expenses before reductions | 31,871,650 | |
Expense reductions | (92,847) | 31,778,803 |
Net investment income (loss) | | 172,485,619 |
Realized and Unrealized Gain (Loss) Net realized gain (loss) on: | | |
Investment securities: | | |
Unaffiliated issuers | 72,495,437 | |
Other affiliated issuers | 994,485 | |
Foreign currency transactions | 4,963 | |
Total net realized gain (loss) | | 73,494,885 |
Change in net unrealized appreciation (depreciation) on: Investment securities | 61,790,330 | |
Assets and liabilities in foreign currencies | (997) | |
Total change in net unrealized appreciation (depreciation) | | 61,789,333 |
Net gain (loss) | | 135,284,218 |
Net increase (decrease) in net assets resulting from operations | | $ 307,769,837 |
See accompanying notes which are an integral part of the financial statements.
Annual Report
Statement of Changes in Net Assets
| Year ended
July 31,
2013 | Year ended
July 31,
2012 |
Increase (Decrease) in Net Assets | | |
Operations | | |
Net investment income (loss) | $ 172,485,619 | $ 106,081,413 |
Net realized gain (loss) | 73,494,885 | 46,621,459 |
Change in net unrealized appreciation (depreciation) | 61,789,333 | 99,190,890 |
Net increase (decrease) in net assets resulting
from operations | 307,769,837 | 251,893,762 |
Distributions to shareholders from net investment income | (159,910,438) | (98,117,663) |
Distributions to shareholders from net realized gain | (51,534,162) | (16,498,521) |
Total distributions | (211,444,600) | (114,616,184) |
Share transactions - net increase (decrease) | 1,340,100,515 | 755,485,569 |
Redemption fees | 782,946 | 286,688 |
Total increase (decrease) in net assets | 1,437,208,698 | 893,049,835 |
| | |
Net Assets | | |
Beginning of period | 2,685,858,884 | 1,792,809,049 |
End of period (including undistributed net investment income of $39,267,501 and undistributed net investment income of $27,923,018, respectively) | $ 4,123,067,582 | $ 2,685,858,884 |
See accompanying notes which are an integral part of the financial statements.
Annual Report
Financial Highlights - Class A
Years ended July 31, | 2013 | 2012 | 2011 | 2010 H |
Selected Per-Share Data | | | | |
Net asset value, beginning of period | $ 11.26 | $ 10.73 | $ 9.94 | $ 9.95 |
Income from Investment Operations | | | | |
Net investment income (loss) E | .54 | .52 | .53 | .18 |
Net realized and unrealized gain (loss) | .60 | .61 | .76 | (.04) |
Total from investment operations | 1.14 | 1.13 | 1.29 | .14 |
Distributions from net investment income | (.53) | (.51) | (.50) | (.15) |
Distributions from net realized gain | (.20) | (.10) | - | - |
Total distributions | (.73) | (.60) K | (.50) | (.15) |
Redemption fees added to paid in capital E,J | - | - | - | - |
Net asset value, end of period | $ 11.67 | $ 11.26 | $ 10.73 | $ 9.94 |
Total Return B, C, D | 10.45% | 11.24% | 13.27% | 1.46% |
Ratios to Average Net Assets F, I | | | | |
Expenses before reductions | 1.08% | 1.12% | 1.13% | 1.09% A |
Expenses net of fee waivers, if any | 1.08% | 1.12% | 1.13% | 1.09% A |
Expenses net of all reductions | 1.07% | 1.11% | 1.12% | 1.09% A |
Net investment income (loss) | 4.62% | 4.89% | 5.00% | 6.23% A |
Supplemental Data | | | | |
Net assets, end of period (000 omitted) | $ 378,269 | $ 137,352 | $ 60,283 | $ 3,830 |
Portfolio turnover rate G | 26% | 27% | 25% | 28% |
A Annualized
B Total returns for periods of less than one year are not annualized.
C Total returns would have been lower if certain expenses had not been reduced during the applicable periods shown.
D Total returns do not include the effect of the sales charges.
E Calculated based on average shares outstanding during the period.
F Fees and expenses of any underlying Fidelity Central Funds are not included in the Fund's expense ratio. The Fund indirectly bears its proportionate share of the expenses of any underlying Fidelity Central Funds.
G Amount does not include the portfolio activity of any underlying Fidelity Central Funds.
H For the period April 14, 2010 (commencement of sale of shares) to July 31, 2010.
I Expense ratios reflect operating expenses of the class. Expenses before reductions do not reflect amounts reimbursed by the investment adviser or reductions from brokerage service arrangements or reductions from other expense offset arrangements and do not represent the amount paid by the class during periods when reimbursements or reductions occur. Expense ratios before reductions for start-up periods may not be representative of longer-term operating periods. Expenses net of fee waivers reflect expenses after reimbursement by the investment adviser but prior to reductions from brokerage service arrangements or other expense offset arrangements. Expenses net of all reductions represent the net expenses paid by the class.
J Amount represents less than $.01 per share.
K Total distributions of $.60 per share is comprised of distributions from net investment income of $.505 and distributions from net realized gain of $.097 per share.
See accompanying notes which are an integral part of the financial statements.
Annual Report
Financial Highlights - Class T
Years ended July 31, | 2013 | 2012 | 2011 | 2010 H |
Selected Per-Share Data | | | | |
Net asset value, beginning of period | $ 11.26 | $ 10.72 | $ 9.94 | $ 9.95 |
Income from Investment Operations | | | | |
Net investment income (loss) E | .54 | .52 | .52 | .17 |
Net realized and unrealized gain (loss) | .60 | .62 | .76 | (.03) |
Total from investment operations | 1.14 | 1.14 | 1.28 | .14 |
Distributions from net investment income | (.53) | (.50) | (.50) | (.15) |
Distributions from net realized gain | (.20) | (.10) | - | - |
Total distributions | (.73) | (.60) | (.50) | (.15) |
Redemption fees added to paid in capital E,J | - | - | - | - |
Net asset value, end of period | $ 11.67 | $ 11.26 | $ 10.72 | $ 9.94 |
Total Return B, C, D | 10.42% | 11.33% | 13.11% | 1.45% |
Ratios to Average Net Assets F, I | | | | |
Expenses before reductions | 1.08% | 1.11% | 1.16% | 1.17% A |
Expenses net of fee waivers, if any | 1.08% | 1.11% | 1.16% | 1.17% A |
Expenses net of all reductions | 1.08% | 1.11% | 1.16% | 1.17% A |
Net investment income (loss) | 4.61% | 4.90% | 4.96% | 5.92% A |
Supplemental Data | | | | |
Net assets, end of period (000 omitted) | $ 46,198 | $ 26,143 | $ 7,626 | $ 862 |
Portfolio turnover rate G | 26% | 27% | 25% | 28% |
A Annualized
B Total returns for periods of less than one year are not annualized.
C Total returns would have been lower if certain expenses had not been reduced during the applicable periods shown.
D Total returns do not include the effect of the sales charges.
E Calculated based on average shares outstanding during the period.
F Fees and expenses of any underlying Fidelity Central Funds are not included in the Fund's expense ratio. The Fund indirectly bears its proportionate share of the expenses of any underlying Fidelity Central Funds.
G Amount does not include the portfolio activity of any underlying Fidelity Central Funds.
H For the period April 14, 2010 (commencement of sale of shares) to July 31, 2010.
I Expense ratios reflect operating expenses of the class. Expenses before reductions do not reflect amounts reimbursed by the investment adviser or reductions from brokerage service arrangements or reductions from other expense offset arrangements and do not represent the amount paid by the class during periods when reimbursements or reductions occur. Expense ratios before reductions for start-up periods may not be representative of longer-term operating periods. Expenses net of fee waivers reflect expenses after reimbursement by the investment adviser but prior to reductions from brokerage service arrangements or other expense offset arrangements. Expenses net of all reductions represent the net expenses paid by the class.
J Amount represents less than $.01 per share.
See accompanying notes which are an integral part of the financial statements.
Annual Report
Financial Highlights - Class C
Years ended July 31, | 2013 | 2012 | 2011 | 2010 H |
Selected Per-Share Data | | | | |
Net asset value, beginning of period | $ 11.20 | $ 10.67 | $ 9.93 | $ 9.95 |
Income from Investment Operations | | | | |
Net investment income (loss) E | .45 | .44 | .45 | .15 |
Net realized and unrealized gain (loss) | .60 | .62 | .74 | (.03) |
Total from investment operations | 1.05 | 1.06 | 1.19 | .12 |
Distributions from net investment income | (.46) | (.43) | (.45) | (.14) |
Distributions from net realized gain | (.20) | (.10) | - | - |
Total distributions | (.66) | (.53) | (.45) | (.14) |
Redemption fees added to paid in capital E,J | - | - | - | - |
Net asset value, end of period | $ 11.59 | $ 11.20 | $ 10.67 | $ 9.93 |
Total Return B, C, D | 9.66% | 10.49% | 12.25% | 1.29% |
Ratios to Average Net Assets F, I | | | | |
Expenses before reductions | 1.81% | 1.87% | 1.89% | 1.86% A |
Expenses net of fee waivers, if any | 1.81% | 1.87% | 1.89% | 1.86% A |
Expenses net of all reductions | 1.81% | 1.87% | 1.89% | 1.86% A |
Net investment income (loss) | 3.88% | 4.14% | 4.23% | 5.21% A |
Supplemental Data | | | | |
Net assets, end of period (000 omitted) | $ 204,012 | $ 52,780 | $ 21,555 | $ 836 |
Portfolio turnover rate G | 26% | 27% | 25% | 28% |
A Annualized
B Total returns for periods of less than one year are not annualized.
C Total returns would have been lower if certain expenses had not been reduced during the applicable periods shown.
D Total returns do not include the effect of the contingent deferred sales charge.
E Calculated based on average shares outstanding during the period.
F Fees and expenses of any underlying Fidelity Central Funds are not included in the Fund's expense ratio. The Fund indirectly bears its proportionate share of the expenses of any underlying Fidelity Central Funds.
G Amount does not include the portfolio activity of any underlying Fidelity Central Funds.
H For the period April 14, 2010 (commencement of sale of shares) to July 31, 2010.
I Expense ratios reflect operating expenses of the class. Expenses before reductions do not reflect amounts reimbursed by the investment adviser or reductions from brokerage service arrangements or reductions from other expense offset arrangements and do not represent the amount paid by the class during periods when reimbursements or reductions occur. Expense ratios before reductions for start-up periods may not be representative of longer-term operating periods. Expenses net of fee waivers reflect expenses after reimbursement by the investment adviser but prior to reductions from brokerage service arrangements or other expense offset arrangements. Expenses net of all reductions represent the net expenses paid by the class.
J Amount represents less than $.01 per share.
See accompanying notes which are an integral part of the financial statements.
Annual Report
Financial Highlights - Real Estate Income
Years ended July 31, | 2013 | 2012 | 2011 | 2010 | 2009 |
Selected Per-Share Data | | | | | |
Net asset value, beginning of period | $ 11.29 | $ 10.75 | $ 9.95 | $ 8.21 | $ 9.43 |
Income from Investment Operations | | | | | |
Net investment income (loss) B | .57 | .54 | .55 | .53 | .54 |
Net realized and unrealized gain (loss) | .60 | .62 | .76 | 1.73 | (1.27) |
Total from investment operations | 1.17 | 1.16 | 1.31 | 2.26 | (.73) |
Distributions from net investment income | (.55) | (.52) | (.51) | (.52) | (.50) |
Distributions from net realized gain | (.20) | (.10) | - | - | - |
Total distributions | (.75) | (.62) | (.51) | (.52) | (.50) |
Redemption fees added to paid in capital B | - F | - F | - F | - F | .01 |
Net asset value, end of period | $ 11.71 | $ 11.29 | $ 10.75 | $ 9.95 | $ 8.21 |
Total Return A | 10.71% | 11.50% | 13.41% | 28.29% | (6.92)% |
Ratios to Average Net Assets C, E | | | | | |
Expenses before reductions | .84% | .90% | .92% | .97% | 1.00% |
Expenses net of fee waivers, if any | .84% | .89% | .92% | .96% | 1.00% |
Expenses net of all reductions | .84% | .89% | .92% | .96% | 1.00% |
Net investment income (loss) | 4.85% | 5.12% | 5.21% | 5.60% | 7.15% |
Supplemental Data | | | | | |
Net assets, end of period (000 omitted) | $ 2,884,545 | $ 2,252,149 | $ 1,660,063 | $ 1,030,393 | $ 463,269 |
Portfolio turnover rate D | 26% | 27% | 25% | 28% | 47% |
A Total returns would have been lower if certain expenses had not been reduced during the applicable periods shown.
B Calculated based on average shares outstanding during the period.
C Fees and expenses of any underlying Fidelity Central Funds are not included in the Fund's expense ratio. The Fund indirectly bears its proportionate share of the expenses of any underlying Fidelity Central Funds.
D Amount does not include the portfolio activity of any underlying Fidelity Central Funds.
E Expense ratios reflect operating expenses of the class. Expenses before reductions do not reflect amounts reimbursed by the investment adviser or reductions from brokerage service arrangements or reductions from other expense offset arrangements and do not represent the amount paid by the class during periods when reimbursements or reductions occur. Expenses net of fee waivers reflect expenses after reimbursement by the investment adviser but prior to reductions from brokerage service arrangements or other expense offset arrangements. Expenses net of all reductions represent the net expenses paid by the class.
F Amount represents less than $.01 per share.
See accompanying notes which are an integral part of the financial statements.
Annual Report
Financial Highlights - Institutional Class
Years ended July 31, | 2013 | 2012 | 2011 | 2010 G |
Selected Per-Share Data | | | | |
Net asset value, beginning of period | $ 11.28 | $ 10.74 | $ 9.95 | $ 9.95 |
Income from Investment Operations | | | | |
Net investment income (loss) D | .57 | .55 | .55 | .19 |
Net realized and unrealized gain (loss) | .60 | .62 | .76 | (.04) |
Total from investment operations | 1.17 | 1.17 | 1.31 | .15 |
Distributions from net investment income | (.56) | (.53) | (.52) | (.15) |
Distributions from net realized gain | (.20) | (.10) | - | - |
Total distributions | (.76) | (.63) | (.52) | (.15) |
Redemption fees added to paid in capital D, I | - | - | - | - |
Net asset value, end of period | $ 11.69 | $ 11.28 | $ 10.74 | $ 9.95 |
Total Return B, C | 10.72% | 11.62% | 13.44% | 1.58% |
Ratios to Average Net Assets E, H | | | | |
Expenses before reductions | .80% | .84% | .89% | .85% A |
Expenses net of fee waivers, if any | .80% | .84% | .89% | .85% A |
Expenses net of all reductions | .80% | .84% | .89% | .85% A |
Net investment income (loss) | 4.89% | 5.17% | 5.24% | 6.70% A |
Supplemental Data | | | | |
Net assets, end of period (000 omitted) | $ 610,045 | $ 217,435 | $ 43,282 | $ 2,930 |
Portfolio turnover rate F | 26% | 27% | 25% | 28% |
A Annualized
B Total returns for periods of less than one year are not annualized.
C Total returns would have been lower if certain expenses had not been reduced during the applicable periods shown.
D Calculated based on average shares outstanding during the period.
E Fees and expenses of any underlying Fidelity Central Funds are not included in the Fund's expense ratio. The Fund indirectly bears its proportionate share of the expenses of any underlying Fidelity Central Funds.
F Amount does not include the portfolio activity of any underlying Fidelity Central Funds.
G For the period April 14, 2010 (commencement of sale of shares) to July 31, 2010.
H Expense ratios reflect operating expenses of the class. Expenses before reductions do not reflect amounts reimbursed by the investment adviser or reductions from brokerage service arrangements or reductions from other expense offset arrangements and do not represent the amount paid by the class during periods when reimbursements or reductions occur. Expense ratios before reductions for start-up periods may not be representative of longer-term operating periods. Expenses net of fee waivers reflect expenses after reimbursement by the investment adviser but prior to reductions from brokerage service arrangements or other expense offset arrangements. Expenses net of all reductions represent the net expenses paid by the class.
I Amount represents less than $.01 per share.
See accompanying notes which are an integral part of the financial statements.
Annual Report
Notes to Financial Statements
For the period ended July 31, 2013
1. Organization.
Fidelity Real Estate Income Fund (the Fund) is a fund of Fidelity Securities Fund (the Trust) and is authorized to issue an unlimited number of shares. The Trust is registered under the Investment Company Act of 1940, as amended (the 1940 Act), as an open-end management investment company organized as a Massachusetts business trust. The Fund offers Class A, Class T, Class C, Real Estate Income and Institutional Class shares, each of which has equal rights as to assets and voting privileges. Each class has exclusive voting rights with respect to matters that affect that class.
2. Investments in Fidelity Central Funds.
The Fund invests in Fidelity Central Funds, which are open-end investment companies generally available only to other investment companies and accounts managed by Fidelity Management & Research Company (FMR) and its affiliates. The Fund's Schedule of Investments lists each of the Fidelity Central Funds held as of period end, if any, as an investment of the Fund, but does not include the underlying holdings of each Fidelity Central Fund. As an Investing Fund, the Fund indirectly bears its proportionate share of the expenses of the underlying Fidelity Central Funds.
The Money Market Central Funds seek preservation of capital and current income and are managed by Fidelity Investments Money Management, Inc. (FIMM), an affiliate of FMR.
A complete unaudited list of holdings for each Fidelity Central Fund is available upon request or at the Securities and Exchange Commission (the SEC) website at www.sec.gov. In addition, the financial statements of the Fidelity Central Funds, which are not covered by the Fund's Report of Independent Registered Public Accounting Firm, are available on the SEC website or upon request.
3. Significant Accounting Policies.
The financial statements have been prepared in conformity with accounting principles generally accepted in the United States of America (GAAP), which require management to make certain estimates and assumptions at the date of the financial statements. Actual results could differ from those estimates. Subsequent events, if any, through the date that the financial statements were issued have been evaluated in the preparation of the financial statements. The following summarizes the significant accounting policies of the Fund:
Investment Valuation. Investments are valued as of 4:00 p.m. Eastern time on the last calendar day of the period. In accordance with valuation policies and procedures approved by the Board of Trustees (the Board), the Fund attempts to obtain prices from one or more third party pricing vendors or brokers to value its investments. When
Annual Report
3. Significant Accounting Policies - continued
Investment Valuation - continued
current market prices, quotations or currency exchange rates are not readily available or reliable, investments will be fair valued in good faith by the FMR Fair Value Committee (the Committee), in accordance with procedures adopted by the Board. Factors used in determining fair value vary by investment type and may include market or investment specific events, changes in interest rates and credit quality. The frequency with which these procedures are used cannot be predicted and they may be utilized to a significant extent. The Committee oversees the Fund's valuation policies and procedures and is responsible for approving and reporting to the Board all fair value determinations.
The Fund categorizes the inputs to valuation techniques used to value its investments into a disclosure hierarchy consisting of three levels as shown below:
Level 1 - quoted prices in active markets for identical investments
Level 2 - other significant observable inputs (including quoted prices for similar investments, interest rates, prepayment speeds, etc.)
Level 3 - unobservable inputs (including the Fund's own assumptions based on the best information available)
Valuation techniques used to value the Fund's investments by major category are as follows:
Equity securities, including restricted securities, for which market quotations are readily available, are valued at the last reported sale price or official closing price as reported by a third party pricing vendor on the primary market or exchange on which they are traded and are categorized as Level 1 in the hierarchy. In the event there were no sales during the day or closing prices are not available, securities are valued at the last quoted bid price or may be valued using the last available price and are generally categorized as Level 2 in the hierarchy. For foreign equity securities, when market or security specific events arise, comparisons to the valuation of American Depositary Receipts (ADRs), futures contracts, Exchange-Traded Funds (ETFs) and certain indexes as well as quoted prices for similar securities may be used and would be categorized as Level 2 in the hierarchy. Utilizing these techniques may result in transfers between Level 1 and Level 2. For restricted equity securities and private placements where observable inputs are limited, assumptions about market activity and risk are used and these securities are generally categorized as Level 3 in the hierarchy.
Debt securities, including restricted securities, are valued based on evaluated prices received from third party pricing vendors or from brokers who make markets in such securities. For corporate bonds, floating rate loans and preferred securities, pricing
Annual Report
Notes to Financial Statements - continued
3. Significant Accounting Policies - continued
Investment Valuation - continued
vendors utilize matrix pricing which considers yield or price of bonds of comparable quality, coupon, maturity and type as well as broker-supplied prices. For asset backed securities, collateralized mortgage obligations and commercial mortgage securities, pricing vendors utilize matrix pricing which considers prepayment speed assumptions, attributes of the collateral, yield or price of bonds of comparable quality, coupon, maturity and type as well as broker-supplied prices. Independent prices obtained from a single source or broker are evaluated by management and may be categorized as Level 3 in the hierarchy. When independent prices are unavailable or unreliable, debt securities may be valued utilizing pricing methodologies which consider similar factors that would be used by third party pricing vendors. Debt securities are generally categorized as Level 2 in the hierarchy but may be Level 3 depending on the circumstances.
Investments in open-end mutual funds, including the Fidelity Central Funds, are valued at their closing net asset value (NAV) each business day and are categorized as Level 1 in the hierarchy.
The following provides information on Level 3 securities held by the Fund that were valued at period end based on unobservable inputs. These amounts exclude valuations provided by a broker.
Asset Type | Fair Value at
07/31/13 | Valuation
Technique(s) | Unobservable
Input | Amount or Range/
Weighted
Average | Impact to
Valuation from an Increase in Input* |
Asset-Backed Securities | $ 361,738 | Discounted cash flow | Yield | 11.0% | Decrease |
Collateralized Mortgage Obligations | $ 1,089,660 | Discounted cash flow | Yield | 6.5% - 65%/23.9% | Decrease |
Commercial Mortgage Securities | $ 2,036,877 | Discounted cash flow | Yield | 10% - 20%/15.5% | Decrease |
| Market comparable | Spread | 14.0% | Decrease |
Common Stock | $ 4,902,236 | Adjusted book value | Book value multiple | 1.0 | Increase |
Corporate Bonds | $ 3,157,168 | Discounted cash flow | Yield | 20.0% | Decrease |
Floating Rate Loans | $ 30,423,214 | Discounted cash flow | Yield | 8.8% - 11%/10.5% | Decrease |
| | Market comparable | Transaction price | $100.00 | Increase |
* Represents the expected directional change in the fair value of the Level 3 investments that would result from an increase in the corresponding input. A decrease to the unobservable input would have the opposite effect. Significant changes in these inputs could result in significantly higher or lower fair value measurements.
Annual Report
3. Significant Accounting Policies - continued
Investment Valuation - continued
Changes in valuation techniques may result in transfers in or out of an assigned level within the disclosure hierarchy. The aggregate value of investments by input level, as of July 31, 2013, as well as a roll forward of Level 3 investments, is included at the end of the Fund's Schedule of Investments.
Foreign Currency. The Fund may use foreign currency contracts to facilitate transactions in foreign-denominated securities. Gains and losses from these transactions may arise from changes in the value of the foreign currency or if the counterparties do not perform under the contracts' terms.
Foreign-denominated assets, including investment securities, and liabilities are translated into U.S. dollars at the exchange rates at period end. Purchases and sales of investment securities, income and dividends received and expenses denominated in foreign currencies are translated into U.S. dollars at the exchange rate in effect on the transaction date.
The effects of exchange rate fluctuations on investments are included with the net realized and unrealized gain (loss) on investment securities. Other foreign currency transactions resulting in realized and unrealized gain (loss) are disclosed separately.
Investment Transactions and Income. For financial reporting purposes, the Fund's investment holdings and NAV include trades executed through the end of the last business day of the period. The NAV per share for processing shareholder transactions is calculated as of the close of business of the New York Stock Exchange (NYSE), normally 4:00 p.m. Eastern time and includes trades executed through the end of the prior business day. Gains and losses on securities sold are determined on the basis of identified cost and may include proceeds received from litigation. Dividend income is recorded on the ex-dividend date, except for certain dividends from foreign securities where the ex-dividend date may have passed, which are recorded as soon as the Fund is informed of the ex-dividend date. Non-cash dividends included in dividend income, if any, are recorded at the fair market value of the securities received. Distributions received on securities that represent a return of capital or capital gain are recorded as a reduction of cost of investments and/or as a realized gain. Subsequent to ex-dividend date the Fund determines the components of these distributions, based upon receipt of tax filings or other correspondence relating to the underlying investment. Interest income and distributions from the Fidelity Central Funds are accrued as earned. Interest income includes coupon interest and amortization of premium and accretion of discount on debt securities. For certain lower credit quality securitized assets that have contractual cash flows (for example, asset backed securities, collateralized mortgage obligations and
Annual Report
Notes to Financial Statements - continued
3. Significant Accounting Policies - continued
Investment Transactions and Income - continued
commercial mortgage-backed securities), changes in estimated cash flows are periodically evaluated and the estimated yield is adjusted on a prospective basis over the remaining life of the security, resulting in increases or decreases to Interest Income in the accompanying Statement of Operations. Investment income is recorded net of foreign taxes withheld where recovery of such taxes is uncertain. Debt obligations may be placed on non-accrual status and related interest income may be reduced by ceasing current accruals and writing off interest receivables when the collection of all or a portion of interest has become doubtful based on consistently applied procedures. A debt obligation is removed from non-accrual status when the issuer resumes interest payments or when collectability of interest is reasonably assured.
Class Allocations and Expenses. Investment income, realized and unrealized capital gains and losses, common expenses of the Fund, and certain fund-level expense reductions, if any, are allocated on a pro-rata basis to each class based on the relative net assets of each class to the total net assets of the Fund. Each class differs with respect to transfer agent and distribution and service plan fees incurred. Certain expense reductions may also differ by class. Expenses directly attributable to a fund are charged to that fund. Expenses attributable to more than one fund are allocated among the respective funds on the basis of relative net assets or other appropriate methods. Expense estimates are accrued in the period to which they relate and adjustments are made when actual amounts are known.
Income Tax Information and Distributions to Shareholders. Each year, the Fund intends to qualify as a regulated investment company under Subchapter M of the Internal Revenue Code, including distributing substantially all of its taxable income and realized gains. As a result, no provision for income taxes is required. As of July 31, 2013, the Fund did not have any unrecognized tax benefits in the financial statements; nor is the Fund aware of any tax positions for which it is reasonably possible that the total amounts of unrecognized tax benefits will significantly change in the next twelve months. The Fund files a U.S. federal tax return, in addition to state and local tax returns as required. A fund's federal income tax returns are subject to examination by the Internal Revenue Service (IRS) for a period of three fiscal years after they are filed. State and local tax returns may be subject to examination for an additional fiscal year depending on the jurisdiction. Foreign taxes are provided for based on the Fund's understanding of the tax rules and rates that exist in the foreign markets in which it invests.
Annual Report
3. Significant Accounting Policies - continued
Income Tax Information and Distributions to Shareholders - continued
Distributions are declared and recorded on the ex-dividend date. Income dividends and capital gain distributions are declared separately for each class. Income and capital gain distributions are determined in accordance with income tax regulations, which may differ from GAAP. In addition, the Fund claimed a portion of the payment made to redeeming shareholders as a distribution for income tax purposes.
Capital accounts within the financial statements are adjusted for permanent book-tax differences. These adjustments have no impact on net assets or the results of operations. Temporary book-tax differences will reverse in a subsequent period.
Book-tax differences are primarily due to foreign currency transactions, passive foreign investment companies (PFIC), market discount, partnerships, equity-debt classifications and losses deferred due to wash sales.
The federal tax cost of investment securities and unrealized appreciation (depreciation) as of period end were as follows:
Gross unrealized appreciation | $ 329,448,090 |
Gross unrealized depreciation | (97,431,991) |
Net unrealized appreciation (depreciation) on securities and other investments | $ 232,016,099 |
| |
Tax Cost | $ 3,927,397,935 |
The tax-based components of distributable earnings as of period end were as follows:
Undistributed ordinary income | $ 54,276,553 |
Undistributed long-term capital gain | $ 33,287,081 |
Net unrealized appreciation (depreciation) | $ 232,041,306 |
The tax character of distributions paid was as follows:
| July 31, 2013 | July 31, 2012 |
Ordinary Income | $ 170,384,735 | $ 98,117,663 |
Long-term Capital Gains | 41,059,865 | 16,498,521 |
Total | $ 211,444,600 | $ 114,616,184 |
Short-Term Trading (Redemption) Fees. Shares held by investors in the Fund less than 90 days may have been subject to a redemption fee equal to .75% of the net asset value of shares redeemed. All redemption fees, which reduce the proceeds of the shareholder redemption, are retained by the Fund and accounted for as an addition to paid in capital.
Annual Report
Notes to Financial Statements - continued
3. Significant Accounting Policies - continued
Restricted Securities. The Fund may invest in securities that are subject to legal or contractual restrictions on resale. These securities generally may be resold in transactions exempt from registration or to the public if the securities are registered. Disposal of these securities may involve time-consuming negotiations and expense, and prompt sale at an acceptable price may be difficult. Information regarding restricted securities is included at the end of the Fund's Schedule of Investments.
Loans and Other Direct Debt Instruments. The Fund invests in direct debt instruments which are interests in amounts owed to lenders by corporate or other borrowers. These instruments may be in the form of loans, trade claims or other receivables and may include standby financing commitments such as revolving credit facilities that obligate the Fund to supply additional cash to the borrower on demand. Loans may be acquired through assignment or participation, or may be made directly to a borrower. The Fund may be contractually obligated to receive approval from the agent bank and/or borrower prior to the sale of these loans. The Fund did not have any unfunded loan commitments, which are contractual obligations for future funding, at period end.
4. Purchases and Sales of Investments.
Purchases and sales of securities, other than short-term securities and U.S. government securities, aggregated $2,022,279,822 and $847,035,607, respectively.
5. Fees and Other Transactions with Affiliates.
Management Fee. FMR and its affiliates provide the Fund with investment management related services for which the Fund pays a monthly management fee. The management fee is the sum of an individual fund fee rate that is based on an annual rate of .30% of the Fund's average net assets and an annualized group fee rate that averaged .26% during the period. The group fee rate is based upon the average net assets of all the mutual funds advised by FMR. The group fee rate decreases as assets under management increase and increases as assets under management decrease. For the period, the total annual management fee rate was .56% of the Fund's average net assets.
Distribution and Service Plan Fees. In accordance with Rule 12b-1 of the 1940 Act, the Fund has adopted separate Distribution and Service Plans for each class of shares. Certain classes pay Fidelity Distributors Corporation (FDC), an affiliate of FMR, separate Distribution and Service Fees, each of which is based on an annual percentage of each class' average net assets. In addition, FDC may pay financial intermediaries for selling shares of the Fund and providing shareholder support services. For the period, the Distribution and Service Fee rates, total fees and amounts retained by FDC were as follows:
Annual Report
5. Fees and Other Transactions with Affiliates - continued
Distribution and Service Plan Fees - continued
| Distribution
Fee | Service
Fee | Total Fees | Retained
by FDC |
Class A | -% | .25% | $ 617,413 | $ 50,959 |
Class T | -% | .25% | 90,476 | 816 |
Class C | .75% | .25% | 1,191,631 | 632,739 |
| | | $ 1,899,520 | $ 684,514 |
Sales Load. FDC may receive a front-end sales charge of up to 4.00% for selling Class A shares and Class T shares, some of which is paid to financial intermediaries for selling shares of the Fund. Depending on the holding period, FDC may receive contingent deferred sales charges levied on Class A, Class T and Class C redemptions. The deferred sales charges range from 1.00% for Class C shares, 1.00% for certain purchases of Class A shares and .25% for certain purchases of Class T shares.
For the period, sales charge amounts retained by FDC were as follows:
| Retained
by FDC |
Class A | $ 119,905 |
Class T | 24,968 |
Class C* | 16,049 |
| $ 160,922 |
* When Class C shares are initially sold, FDC pays commissions from its own resources to financial intermediaries through which the sales are made.
Transfer Agent Fees. Fidelity Investments Institutional Operations Company, Inc., (FIIOC), an affiliate of FMR, is the transfer, dividend disbursing and shareholder servicing agent for each class of the Fund. FIIOC receives account fees and asset-based fees that vary according to the account size and type of account of the shareholders of the respective classes of the Fund. FIIOC pays for typesetting, printing and mailing of shareholder reports, except proxy statements. For the period, transfer agent fees for each class were as follows:
| Amount | % of
Average
Net Assets |
Class A | $ 549,009 | .22 |
Class T | 82,206 | .23 |
Class C | 250,037 | .21 |
Real Estate Income | 6,587,715 | .24 |
Institutional Class | 783,337 | .20 |
| $ 8,252,304 | |
Annual Report
Notes to Financial Statements - continued
5. Fees and Other Transactions with Affiliates - continued
Accounting and Security Lending Fees. Fidelity Service Company, Inc. (FSC), an affiliate of FMR, maintains the Fund's accounting records. The accounting fee is based on the level of average net assets for each month. Under a separate contract, FSC administers the security lending program. The security lending fee is based on the number and duration of lending transactions.
Brokerage Commissions. The Fund placed a portion of its portfolio transactions with brokerage firms which are affiliates of the investment adviser. Brokerage commissions are included in net realized gain (loss) and change in net unrealized appreciation (depreciation) in the Statement of Operations. The commissions paid to these affiliated firms were $38,551 for the period.
6. Committed Line of Credit.
The Fund participates with other funds managed by FMR or an affiliate in a $4.25 billion credit facility (the "line of credit") to be utilized for temporary or emergency purposes to fund shareholder redemptions or for other short-term liquidity purposes. The Fund has agreed to pay commitment fees on its pro-rata portion of the line of credit, which amounted to $7,997 and is reflected in Miscellaneous expenses on the Statement of Operations. During the period, there were no borrowings on this line of credit.
7. Security Lending.
The Fund lends portfolio securities through a lending agent from time to time in order to earn additional income. For equity securities, a lending agent is used and may loan securities to certain qualified borrowers, including Fidelity Capital Markets (FCM), a broker-dealer affiliated with the Fund. On the settlement date of the loan, the Fund receives collateral (in the form of U.S. Treasury obligations, letters of credit and/or cash) against the loaned securities and maintains collateral in an amount not less than 100% of the market value of the loaned securities during the period of the loan. The market value of the loaned securities is determined at the close of business of the Fund and any additional required collateral is delivered to the Fund on the next business day. If the borrower defaults on its obligation to return the securities loaned because of insolvency or other reasons, the Fund may apply collateral received from the borrower against the obligation. The Fund may experience delays and costs in recovering the securities loaned. Any cash collateral received is invested in the Fidelity Securities Lending Cash Central Fund. The value of loaned securities and cash collateral at period end are disclosed on the Fund's Statement of Assets and Liabilities. Security lending income represents the income earned on investing cash collateral, less rebates paid to borrowers
Annual Report
7. Security Lending - continued
and any lending agent fees associated with the loan, plus any premium payments received for lending certain types of securities. Security lending income is presented in the Statement of Operations as a component income from Fidelity Central Funds. Total security lending income during the period amounted to $106,590. During the period, there were no securities loaned to FCM.
8. Expense Reductions.
Commissions paid to certain brokers with whom FMR places trades on behalf of the Fund include an amount in addition to trade execution, which is rebated back to the Fund to offset certain expenses. This amount totaled $85,737 for the period. In addition, through arrangements with the Fund's custodian, credits realized as a result of uninvested cash balances were used to reduce the Fund's expenses. During the period, these credits reduced the Fund's custody expenses by $4,414.
In addition, FMR reimbursed a portion of the Fund's operating expenses during the period in the amount of $2,696.
9. Distributions to Shareholders.
Distributions to shareholders of each class were as follows:
Years ended July 31, | 2013 | 2012 |
From net investment income | | |
Class A | $ 10,238,777 | $ 3,854,404 |
Class T | 1,523,114 | 609,057 |
Class C | 4,241,554 | 1,139,599 |
Real Estate Income | 126,726,805 | 86,666,891 |
Institutional Class | 17,180,188 | 5,847,712 |
Total | $ 159,910,438 | $ 98,117,663 |
From net realized gain | | |
Class A | $ 2,837,075 | $ 603,452 |
Class T | 506,062 | 83,752 |
Class C | 1,181,312 | 208,802 |
Real Estate Income | 42,729,814 | 14,865,902 |
Institutional Class | 4,279,899 | 736,613 |
Total | $ 51,534,162 | $ 16,498,521 |
Annual Report
Notes to Financial Statements - continued
10. Share Transactions.
Transactions for each class of shares were as follows:
| Shares | Dollars |
Years ended July 31, | 2013 | 2012 | 2013 | 2012 |
Class A | | | | |
Shares sold | 25,244,691 | 8,276,874 | $ 296,851,509 | $ 88,010,262 |
Reinvestment of distributions | 900,102 | 333,613 | 10,299,964 | 3,436,744 |
Shares redeemed | (5,925,325) | (2,031,559) | (69,436,144) | (21,254,183) |
Net increase (decrease) | 20,219,468 | 6,578,928 | $ 237,715,329 | $ 70,192,823 |
Class T | | | | |
Shares sold | 2,730,063 | 1,725,200 | $ 31,978,463 | $ 18,422,015 |
Reinvestment of distributions | 132,742 | 49,495 | 1,515,681 | 511,986 |
Shares redeemed | (1,226,451) | (163,799) | (14,137,454) | (1,727,688) |
Net increase (decrease) | 1,636,354 | 1,610,896 | $ 19,356,690 | $ 17,206,313 |
Class C | | | | |
Shares sold | 14,157,408 | 3,117,808 | $ 165,598,758 | $ 33,302,251 |
Reinvestment of distributions | 375,304 | 110,126 | 4,279,651 | 1,128,377 |
Shares redeemed | (1,637,958) | (534,569) | (19,029,492) | (5,534,157) |
Net increase (decrease) | 12,894,754 | 2,693,365 | $ 150,848,917 | $ 28,896,471 |
Real Estate Income | | | | |
Shares sold | 123,727,906 | 90,720,847 | $ 1,450,014,694 | $ 959,813,942 |
Reinvestment of distributions | 13,299,047 | 8,913,831 | 151,923,311 | 91,762,119 |
Shares redeemed | (90,180,888) | (54,623,988) | (1,057,830,249) | (572,115,634) |
Net increase (decrease) | 46,846,065 | 45,010,690 | $ 544,107,756 | $ 479,460,427 |
Institutional Class | | | | |
Shares sold | 42,960,747 | 16,926,727 | $ 506,030,603 | $ 177,564,635 |
Reinvestment of distributions | 1,337,082 | 472,572 | 15,315,413 | 4,899,349 |
Shares redeemed | (11,392,454) | (2,146,783) | (133,274,193) | (22,734,449) |
Net increase (decrease) | 32,905,375 | 15,252,516 | $ 388,071,823 | $ 159,729,535 |
Annual Report
11. Other.
The Fund's organizational documents provide former and current trustees and officers with a limited indemnification against liabilities arising in connection with the performance of their duties to the Fund. In the normal course of business, the Fund may also enter into contracts that provide general indemnifications. The Fund's maximum exposure under these arrangements is unknown as this would be dependent on future claims that may be made against the Fund. The risk of material loss from such claims is considered remote.
Annual Report
To the Trustees of Fidelity Securities Fund and Shareholders of Fidelity Real Estate Income Fund:
We have audited the accompanying statement of assets and liabilities of Fidelity Real Estate Income Fund (the Fund), a fund of Fidelity Securities Fund, including the schedule of investments, as of July 31, 2013, and the related statement of operations for the year then ended, the statement of changes in net assets for each of the two years in the period then ended, and the financial highlights for each of the five years in the period then ended. These financial statements and financial highlights are the responsibility of the Fund's management. Our responsibility is to express an opinion on these financial statements and financial highlights based on our audits.
We conducted our audits in accordance with the standards of the Public Company Accounting Oversight Board (United States). Those standards require that we plan and perform the audit to obtain reasonable assurance about whether the financial statements and financial highlights are free of material misstatement. The Fund is not required to have, nor were we engaged to perform, an audit of their internal control over financial reporting. Our audits included consideration of internal control over financial reporting as a basis for designing audit procedures that are appropriate in the circumstances, but not for the purpose of expressing an opinion on the effectiveness of the Fund's internal control over financial reporting. Accordingly, we express no such opinion. An audit also includes examining, on a test basis, evidence supporting the amounts and disclosures in the financial statements, assessing the accounting principles used and significant estimates made by management, as well as evaluating the overall financial statement presentation. Our procedures included confirmation of securities owned as of July 31, 2013, by correspondence with the custodians, agent banks, and brokers; where replies were not received from brokers, we performed other auditing procedures. We believe that our audits provide a reasonable basis for our opinion.
In our opinion, the financial statements and financial highlights referred to above present fairly, in all material respects, the financial position of Fidelity Real Estate Income Fund as of July 31, 2013, the results of its operations for the year then ended, the changes in its net assets for each of the two years in the period then ended, and the financial highlights for each of the five years in the period then ended, in conformity with accounting principles generally accepted in the United States of America.
DELOITTE & TOUCHE LLP
Boston, Massachusetts
September 20, 2013
Annual Report
The Trustees, Member of the Advisory Board, and executive officers of the trust and fund, as applicable, are listed below. The Board of Trustees governs the fund and is responsible for protecting the interests of shareholders. The Trustees are experienced executives who meet periodically throughout the year to oversee the fund's activities, review contractual arrangements with companies that provide services to the fund, oversee management of the risks associated with such activities and contractual arrangements, and review the fund's performance. Except for James C. Curvey, Ned C. Lautenbach, Ronald P. O'Hanley, and William S. Stavropoulos, each of the Trustees oversees 166 Fidelity funds. Mr. Curvey oversees 387 Fidelity funds. Mr. Lautenbach, Mr. O'Hanley, and Mr. Stavropoulos each oversees 230 Fidelity funds.
The Trustees hold office without limit in time except that (a) any Trustee may resign; (b) any Trustee may be removed by written instrument, signed by at least two-thirds of the number of Trustees prior to such removal; (c) any Trustee who requests to be retired or who has become incapacitated by illness or injury may be retired by written instrument signed by a majority of the other Trustees; and (d) any Trustee may be removed at any special meeting of shareholders by a two-thirds vote of the outstanding voting securities of the trust. Each Trustee who is not an interested person of the trust and the fund (as defined in the 1940 Act) (Independent Trustee), shall retire not later than the last day of the calendar year in which his or her 75th birthday occurs. The Independent Trustees may waive this mandatory retirement age policy with respect to individual Trustees. The executive officers and Advisory Board Member hold office without limit in time, except that any officer and Advisory Board Member may resign or may be removed by a vote of a majority of the Trustees at any regular meeting or any special meeting of the Trustees. Except as indicated, each individual has held the office shown or other offices in the same company for the past five years.
Experience, Skills, Attributes, and Qualifications of the Fund's Trustees. The Governance and Nominating Committee has adopted a statement of policy that describes the experience, qualifications, attributes, and skills that are necessary and desirable for potential Independent Trustee candidates (Statement of Policy). The Board believes that each Trustee satisfied at the time he or she was initially elected or appointed a Trustee, and continues to satisfy, the standards contemplated by the Statement of Policy. The Governance and Nominating Committee also engages professional search firms to help identify potential Independent Trustee candidates who have the experience, qualifications, attributes, and skills consistent with the Statement of Policy. From time to time, additional criteria based on the composition and skills of the current Independent Trustees, as well as experience or skills that may be appropriate in light of future changes to board composition, business conditions, and regulatory or other developments, have also been considered by the professional search firms and the Governance and Nominating Committee. In addition, the Board takes into account the Trustees' commitment and participation in Board and committee meetings, as well as their leadership of standing and ad hoc committees throughout their tenure.
Annual Report
Trustees and Officers - continued
In determining that a particular Trustee was and continues to be qualified to serve as a Trustee, the Board has considered a variety of criteria, none of which, in isolation, was controlling. The Board believes that, collectively, the Trustees have balanced and diverse experience, qualifications, attributes, and skills, which allow the Board to operate effectively in governing the fund and protecting the interests of shareholders. Information about the specific experience, skills, attributes, and qualifications of each Trustee, which in each case led to the Board's conclusion that the Trustee should serve (or continue to serve) as a trustee of the fund, is provided below.
Board Structure and Oversight Function. James C. Curvey is an interested person (as defined in the 1940 Act) and currently serves as Chairman. The Trustees have determined that an interested Chairman is appropriate and benefits shareholders because an interested Chairman has a personal and professional stake in the quality and continuity of services provided to the fund. Independent Trustees exercise their informed business judgment to appoint an individual of their choosing to serve as Chairman, regardless of whether the Trustee happens to be independent or a member of management. The Independent Trustees have determined that they can act independently and effectively without having an Independent Trustee serve as Chairman and that a key structural component for assuring that they are in a position to do so is for the Independent Trustees to constitute a substantial majority for the Board. The Independent Trustees also regularly meet in executive session. Ned C. Lautenbach serves as Chairman of the Independent Trustees and as such (i) acts as a liaison between the Independent Trustees and management with respect to matters important to the Independent Trustees and (ii) with management prepares agendas for Board meetings.
Fidelity funds are overseen by different Boards of Trustees. The fund's Board oversees Fidelity's equity and high income funds and another Board oversees Fidelity's investment-grade bond, money market, and asset allocation funds. The asset allocation funds may invest in Fidelity funds overseen by the fund's Board. The use of separate Boards, each with its own committee structure, allows the Trustees of each group of Fidelity funds to focus on the unique issues of the funds they oversee, including common research, investment, and operational issues. On occasion, the separate Boards establish joint committees to address issues of overlapping consequences for the Fidelity funds overseen by each Board.
The Trustees operate using a system of committees to facilitate the timely and efficient consideration of all matters of importance to the Trustees, the fund, and fund shareholders and to facilitate compliance with legal and regulatory requirements and oversight of the fund's activities and associated risks. The Board, acting through its committees, has charged FMR and its affiliates with (i) identifying events or circumstances the occurrence of which could have demonstrably adverse effects on the fund's business and/or reputation; (ii) implementing processes and controls to lessen the possibility that such events or circumstances occur or to mitigate the effects of such events or circumstances if they do occur; and (iii) creating and maintaining a system designed to evaluate continuously business and market conditions in order to facilitate the identification and implementation processes described in (i) and (ii) above. Because the day-to-day operations and activities of the fund are carried out by or through FMR, its affiliates and other service providers, the fund's exposure to risks is mitigated but not eliminated by the processes overseen by the Trustees. While each of the Board's committees has responsibility for overseeing different aspects of the fund's activities, oversight is exercised primarily through the Operations, Audit, and Compliance Committees. In addition, the Independent Trustees have worked with FMR to enhance the Board's oversight of investment and financial risks, legal and regulatory risks, technology risks, and operational risks, including the development of additional risk reporting to the Board. For example, a working group comprised of Independent Trustees and FMR has worked and continues to work to review the Fidelity funds' valuation-related activities, reporting and risk management. Appropriate personnel, including but not limited to the fund's Chief Compliance Officer (CCO), FMR's internal auditor, the independent accountants, the fund's Treasurer and portfolio management personnel, make periodic reports to the Board's committees, as appropriate, including an annual review of FMR's risk management program for the Fidelity funds. The responsibilities of each standing committee, including their oversight responsibilities, are described further under "Standing Committees of the Fund's Trustees."
Annual Report
The fund's Statement of Additional Information (SAI) includes more information about the Trustees. To request a free copy, call Fidelity at 1-800-544-8544.
Interested Trustees*:
Correspondence intended for each Trustee who is an interested person may be sent to Fidelity Investments, 245 Summer Street, Boston, Massachusetts 02210.
Name, Year of Birth; Principal Occupations and Other Relevant Experience+ |
James C. Curvey (1935) |
| Year of Election or Appointment: 2007 Mr. Curvey is Trustee and Chairman of the Board of Trustees of certain Trusts. Mr. Curvey also serves as Trustee (2007-present) of other investment companies advised by FMR. Mr. Curvey is a Director of Fidelity Investments Money Management, Inc. (2009-present), Director of Fidelity Research & Analysis Co. (2009-present) and Director of FMR and FMR Co., Inc. (2007-present). Mr. Curvey is also Vice Chairman (2007-present) and Director of FMR LLC. In addition, Mr. Curvey serves as an Overseer for the Boston Symphony Orchestra and a member of the Trustees of Villanova University. Previously, Mr. Curvey was the Vice Chairman (2006-2007) and Director (2000-2007) of FMR Corp. |
Ronald P. O'Hanley (1957) |
| Year of Election or Appointment: 2011 Mr. O'Hanley serves as a Trustee and Chairman of the Board of Trustees of other Fidelity funds (2013-present), and is Director of FMR Co., Inc. (2010-present), Director of Fidelity Investments Money Management, Inc. (2010-present), Director of Fidelity Research & Analysis Company (2010-present), President of Fidelity Asset Management and Corporate Services and a Member of Fidelity's Executive Committee (2010- present). Previously, Mr. O'Hanley served as President and Chief Executive Officer of BNY Mellon Asset Management (2007-2010). Mr. O'Hanley also served as Vice Chairman of Bank New York Mellon Corp. and a member of that firm's Executive Committee. Prior to the 2007 merger of The Bank of New York and Mellon Financial Corporation, he was Vice Chairman of Mellon Financial Corporation and President and Chief Executive Officer of Mellon Asset Management. He joined Mellon in February 1997. Mr. O'Hanley currently serves as Chairman of the Boston Public Library Foundation Board of Directors and sits on the Board of Directors of Beth Israel Deaconess Medical Center, the Board of Trustees of the Marine Biological Laboratory and the Advisory Board of the Maxwell School of Citizenship and Public Administration at Syracuse University. Mr. O'Hanley also chairs the Council on Asset Management for the Financial Services Roundtable and is a member of the Board of Directors of Institutional Investor's U.S. Institute. |
* Trustees have been determined to be "Interested Trustees" by virtue of, among other things, their affiliation with the trust or various entities under common control with FMR.
+ The information above includes each Trustee's principal occupation during the last five years and other information relating to the experience, attributes, and skills relevant to each Trustee's qualifications to serve as a Trustee, which led to the conclusion that each Trustee should serve as a Trustee for the fund.
Annual Report
Independent Trustees:
Correspondence intended for each Independent Trustee (that is, the Trustees other than the Interested Trustees) may be sent to Fidelity Investments, P.O. Box 55235, Boston, Massachusetts 02205-5235.
Name, Year of Birth; Principal Occupations and Other Relevant Experience+ |
Dennis J. Dirks (1948) |
| Year of Election or Appointment: 2005 Prior to his retirement in May 2003, Mr. Dirks was Chief Operating Officer and a member of the Board of The Depository Trust & Clearing Corporation (DTCC). He also served as President, Chief Operating Officer, and Board member of The Depository Trust Company (DTC) and President and Board member of the National Securities Clearing Corporation (NSCC). In addition, Mr. Dirks served as Chief Executive Officer and Board member of the Government Securities Clearing Corporation, Chief Executive Officer and Board member of the Mortgage-Backed Securities Clearing Corporation, as a Trustee and a member of the Finance Committee of Manhattan College (2005-2008), and as a Trustee and a member of the Finance Committee of AHRC of Nassau County (2006-2008). Mr. Dirks is a member of the Independent Directors Council (IDC) Governing Council (2010-present) and Board of Directors for The Brookville Center for Children's Services, Inc. (2009-present). |
Alan J. Lacy (1953) |
| Year of Election or Appointment: 2008 Mr. Lacy serves as Senior Adviser (2007-present) of Oak Hill Capital Partners, L.P. (private equity). Mr. Lacy also served as Chief Executive Officer (2000-2005) and Vice Chairman (2005-2006) of Sears Holdings Corporation and Sears, Roebuck and Co. (retail). In addition, Mr. Lacy serves as a member of the Board of Directors of Dave & Buster's Entertainment, Inc. (restaurant and entertainment complexes, 2010-present), Earth Fare, Inc. (retail grocery, 2012-present), The Hillman Companies, Inc. (hardware wholesalers, 2010-present), and Bristol-Myers Squibb Company (global pharmaceuticals, 2008-present). Mr. Lacy is a member of the Board of Trustees of The National Parks Conservation Association (2006-present). Previously, Mr. Lacy served as Chairman of the Board of Trustees of the National Parks Conservation Association (2008-2011) and as a member of the Board of Directors for the Western Union Company (global money transfer, 2006-2011). |
Ned C. Lautenbach (1944) |
| Year of Election or Appointment: 2000 Mr. Lautenbach is Chairman of the Independent Trustees of the Equity and High Income Funds (2006-present) and serves as a Trustee of other Fidelity funds (2013-present). Mr. Lautenbach currently serves as the Lead Director of the Eaton Corporation Board of Directors (diversified industrial, 1997-present). Mr. Lautenbach is Chairman of the Board of Directors of the Philharmonic Center for the Arts in Naples, Florida (2012-present) and a member of the Council on Foreign Relations (1994-present). Previously, Mr. Lautenbach was a Partner/Advisory Partner at Clayton, Dubilier & Rice, LLC (private equity investment, 1998-2010), as well as a Director of Sony Corporation (2006-2007). |
Joseph Mauriello (1944) |
| Year of Election or Appointment: 2008 Prior to his retirement in January 2006, Mr. Mauriello served in numerous senior management positions including Deputy Chairman and Chief Operating Officer (2004-2005), and Vice Chairman of Financial Services (2002-2004) of KPMG LLP US (professional services, 1965-2005). Mr. Mauriello currently serves as a member of the Board of Directors of XL Group plc. (global insurance and re-insurance, 2006-present). Previously, Mr. Mauriello served as a Director of the Hamilton Funds of the Bank of New York (2006-2007) and of Arcadia Resources Inc. (health care services and products, 2007-2012). |
Robert W. Selander (1950) |
| Year of Election or Appointment: 2011 Previously, Mr. Selander served as a Member of the Advisory Board of Fidelity's Equity and High Income Funds (2011), Executive Vice Chairman (2010), Chief Executive Officer (2009-2010), and President and Chief Executive Officer (1997-2009) of Mastercard, Inc. |
Cornelia M. Small (1944) |
| Year of Election or Appointment: 2005 Ms. Small is a member of the Board of Directors (2009-present) and Chair of the Investment Committee (2010-present) of the Teagle Foundation. Ms. Small also serves on the Investment Committee of the Berkshire Taconic Community Foundation (2008-present). Previously, Ms. Small served as Chairperson (2002-2008) and a member of the Investment Committee and Chairperson (2008-2012) and a member of the Board of Trustees of Smith College. In addition, Ms. Small served as Chief Investment Officer, Director of Global Equity Investments, and a member of the Board of Directors of Scudder, Stevens & Clark and Scudder Kemper Investments. |
William S. Stavropoulos (1939) |
| Year of Election or Appointment: 2002 Mr. Stavropoulos is Vice Chairman of the Independent Trustees of the Equity and High Income Funds (2006-present) and serves as a Trustee of other Fidelity funds (2013-present). Mr. Stavropoulos serves as President and Founder of the Michigan Baseball Foundation, the Great Lakes Loons (2007-present). Mr. Stavropoulos is Chairman Emeritus of the Board of Directors of The Dow Chemical Company, where he previously served in numerous senior management positions, including President, CEO (1995-2000; 2002-2004), Chairman of the Executive Committee (2000-2006), and as a member of the Board of Directors (1990-2006). Currently, Mr. Stavropoulos is Chairman of the Board of Directors of Univar Inc. (global distributor of commodity and specialty chemicals), a Director of Teradata Corporation (data warehousing and technology solutions), and Maersk Inc. (industrial conglomerate), and a member of the Advisory Board for Metalmark Capital LLC (private equity investment, 2005-present). Mr. Stavropoulos is an operating advisor to Clayton, Dubilier & Rice, LLC (private equity investment). In addition, Mr. Stavropoulos is a member of the University of Notre Dame Advisory Council for the College of Science, a Trustee of the Rollin L. Gerstacker Foundation, and a Director of the Naples Philharmonic Center for the Arts. Previously, Mr. Stavropoulos served as a Director of Chemical Financial Corporation (bank holding company, 1993-2012) and Tyco International, Ltd. (multinational manufacturing and services, 2007-2012). |
David M. Thomas (1949) |
| Year of Election or Appointment: 2008 Previously, Mr. Thomas served as Executive Chairman (2005-2006) and Chairman and Chief Executive Officer (2000-2005) of IMS Health, Inc. (pharmaceutical and healthcare information solutions), and a Director of Fortune Brands, Inc. (consumer products, 2000-2011). In addition, Mr. Thomas serves as Non-Executive Chairman of the Board of Directors of Fortune Brands Home and Security (home and security products, 2011-present), and as a member of the Board of Directors of Interpublic Group of Companies, Inc. (marketing communication, 2004-present). |
+ The information above includes each Trustee's principal occupation during the last five years and other information relating to the experience, attributes, and skills relevant to each Trustee's qualifications to serve as a Trustee, which led to the conclusion that each Trustee should serve as a Trustee for the fund.
Annual Report
Trustees and Officers - continued
Advisory Board Member and Executive Officers:
Correspondence intended for each executive officer and Peter S. Lynch may be sent to Fidelity Investments, 245 Summer Street, Boston, Massachusetts 02210.
Name, Year of Birth; Principal Occupation |
Peter S. Lynch (1944) |
| Year of Election or Appointment: 2003 Member of the Advisory Board of Fidelity's Equity and High Income Funds. Mr. Lynch is Vice Chairman and a Director of FMR and FMR Co., Inc. In addition, Mr. Lynch serves as a Trustee of Boston College and as the Chairman of the Inner-City Scholarship Fund. Previously, Mr. Lynch served on the Special Olympics International Board of Directors (1997-2006). |
Kenneth B. Robins (1969) |
| Year of Election or Appointment: 2008 President and Treasurer of Fidelity's Equity and High Income Funds. Mr. Robins also serves as President and Treasurer (2008-present) and Assistant Treasurer (2009-present) of other Fidelity funds and is an employee of Fidelity Investments (2004-present). Mr. Robins serves as Executive Vice President of Fidelity Investments Money Management, Inc. (FIMM) (2013-present). Previously, Mr. Robins served as Deputy Treasurer of the Fidelity funds (2005-2008) and Treasurer and Chief Financial Officer of The North Carolina Capital Management Trust: Cash and Term Portfolios (2006-2008). |
Brian B. Hogan (1964) |
| Year of Election or Appointment: 2009 Vice President of Equity and High Income Funds. Mr. Hogan also serves as Vice President of other Fidelity funds (2009-present) and President of FMR's Equity Division (2009-present). Previously, Mr. Hogan served as Senior Vice President, Equity Research of FMR (2006-2009) and as a portfolio manager. |
Christopher S. Bartel (1971) |
| Year of Election or Appointment: 2009 Vice President of Fidelity's Sector and Real Estate Equity Funds. Mr. Bartel also serves as a Director, President, and Chief Executive Officer of Fidelity Management & Research (Japan) Inc. (2012-present), a Director of Fidelity Management & Research (Hong Kong) (2012-present), and Senior Vice President of Global Equity Research (2010-present). Previously, Mr. Bartel served as Senior Vice President of Equity Research (2009-2010), Managing Director of Research (2006-2009), and an analyst and portfolio manager (2000-2006). |
Scott C. Goebel (1968) |
| Year of Election or Appointment: 2008 Secretary and Chief Legal Officer (CLO) of the Fidelity funds. Mr. Goebel also serves as Secretary of Fidelity Investments Money Management, Inc. (FIMM) (2010-present) and Fidelity Research and Analysis Company (FRAC) (2010-present); Secretary and CLO of The North Carolina Capital Management Trust: Cash and Term Portfolios (2008-present); General Counsel, Secretary, and Senior Vice President of FMR (2008-present) and FMR Co., Inc. (2008-present); employed by FMR LLC or an affiliate (2001-present); Chief Legal Officer of Fidelity Management & Research (Hong Kong) Limited (2008-present) and Assistant Secretary of Fidelity Management & Research (Japan) Inc. (2008-present), and Fidelity Management & Research (U.K.) Inc. (2008-present). Previously, Mr. Goebel served as Assistant Secretary of FIMM (2008-2010), FRAC (2008-2010), and the Funds (2007-2008) and as Vice President and Secretary of Fidelity Distributors Corporation (FDC) (2005-2007). |
William C. Coffey (1969) |
| Year of Election or Appointment: 2009 Assistant Secretary of Fidelity's Equity and High Income Funds. Mr. Coffey also serves as Assistant Secretary of other Fidelity funds (2009-present), Senior Vice President and Deputy General Counsel of FMR LLC (2010-present), and is an employee of Fidelity Investments. Previously, Mr. Coffey served as Vice President and Associate General Counsel of FMR LLC (2005-2009). |
Elizabeth Paige Baumann (1968) |
| Year of Election or Appointment: 2012 Anti-Money Laundering (AML) Officer of the Fidelity funds. Ms. Baumann also serves as AML Officer of The North Carolina Capital Management Trust: Cash and Term Portfolios (2012-present), Chief AML Officer of FMR LLC (2012-present), and is an employee of Fidelity Investments. Previously, Ms. Baumann served as Vice President and Deputy Anti-Money Laundering Officer (2007-2012). |
Christine Reynolds (1958) |
| Year of Election or Appointment: 2008 Chief Financial Officer of the Fidelity funds. Ms. Reynolds became President of Fidelity Pricing and Cash Management Services (FPCMS) in August 2008. Ms. Reynolds served as Chief Operating Officer of FPCMS (2007-2008). Previously, Ms. Reynolds served as President, Treasurer, and Anti-Money Laundering officer of the Fidelity funds (2004-2007). |
Joseph A. Hanlon (1968) |
| Year of Election or Appointment: 2012 Chief Compliance Officer of Fidelity's Equity and High Income Funds. Mr. Hanlon also serves as Chief Compliance Officer of other Fidelity funds (2012-present). Mr. Hanlon serves as Compliance Officer of FMR, FMR Co., Inc., Fidelity Investments Money Management, Inc. (FIMM), Fidelity Research and Analysis Company (FRAC), and Fidelity Management & Research (Hong Kong) (2009-present), as Senior Vice President of the Fidelity Asset Management Division (2009-present), and is an employee of Fidelity Investments. Previously, Mr. Hanlon served as Compliance Officer of Fidelity Management & Research (Japan) Inc. (2009-2013), Strategic Advisers, Inc. (2009-2013), and Fidelity Management & Research (U.K.) Inc. (2009-2013). |
Joseph F. Zambello (1957) |
| Year of Election or Appointment: 2011 Deputy Treasurer of the Fidelity funds. Mr. Zambello is an employee of Fidelity Investments. Previously, Mr. Zambello served as Vice President of FMR's Program Management Group (2009-2011) and Vice President of the Transfer Agent Oversight Group (2005-2009). |
Adrien E. Deberghes (1967) |
| Year of Election or Appointment: 2008 Deputy Treasurer of Fidelity's Equity and High Income Funds. Mr. Deberghes also serves as Vice President (2011-present), Deputy Treasurer (2008-present), and Assistant Treasurer (2010-present) of other Fidelity funds, and is an employee of Fidelity Investments (2008-present). Previously, Mr. Deberghes served as Senior Vice President of Mutual Fund Administration at State Street Corporation (2007-2008), Senior Director of Mutual Fund Administration at Investors Bank & Trust (2005-2007), and Director of Finance for Dunkin' Brands (2000-2005). |
Stephen Sadoski (1971) |
| Year of Election or Appointment: 2012 Deputy Treasurer of Fidelity's Equity and High Income Funds. Mr. Sadoski also serves as Deputy Treasurer of other Fidelity funds (2012-present) and is an employee of Fidelity Investments (2012-present). Previously, Mr. Sadoski served as Assistant Treasurer of Fidelity's Fixed Income and Asset Allocation Funds (2012-2013), an assistant chief accountant in the Division of Investment Management of the Securities and Exchange Commission (SEC) (2009-2012) and as a senior manager at Deloitte & Touche LLP (1997-2009). |
Stacie M. Smith (1974) |
| Year of Election or Appointment: 2013 Deputy Treasurer of Fidelity's Equity and High Income Funds. Ms. Smith also serves as Deputy Treasurer of other Fidelity funds (2013-present) and is an employee of Fidelity Investments (2009-present). Previously, Ms. Smith served as Senior Audit Manager of Ernst & Young LLP (1996-2009). |
Stephanie J. Dorsey (1969) |
| Year of Election or Appointment: 2010 Assistant Treasurer of Fidelity's Equity and High Income Funds. Ms. Dorsey also serves as President and Treasurer (2013-present) and Assistant Treasurer (2010-present) of other Fidelity funds, Treasurer and Chief Financial Officer of The North Carolina Capital Management Trust: Cash and Term Portfolios (2013-present), and is an employee of Fidelity Investments (2008-present). Previously, Ms. Dorsey served as Deputy Treasurer of Fidelity's Fixed Income and Asset Allocation Funds (2008-2013), Treasurer (2004-2008) of the JPMorgan Mutual Funds and Vice President (2004-2008) of JPMorgan Chase Bank. |
Gary W. Ryan (1958) |
| Year of Election or Appointment: 2005 Assistant Treasurer of the Fidelity funds. Mr. Ryan is an employee of Fidelity Investments. Previously, Mr. Ryan served as Vice President of Fund Reporting in Fidelity Pricing and Cash Management Services (FPCMS) (1999-2005). |
Jonathan Davis (1968) |
| Year of Election or Appointment: 2010 Assistant Treasurer of the Fidelity funds. Mr. Davis is also Assistant Treasurer of Fidelity Rutland Square Trust II and Fidelity Commonwealth Trust II. Mr. Davis is an employee of Fidelity Investments. Previously, Mr. Davis served as Vice President and Associate General Counsel of FMR LLC (2003-2010). |
Annual Report
The Board of Trustees of Fidelity Real Estate Income Fund voted to pay on September 9, 2013, to shareholders of record at the opening of business on September 6, 2013, a distribution of $0.139 per share derived from capital gains realized from sales of portfolio securities and a dividend of $0.158 per share from net investment income.
The fund hereby designates as a capital gain dividend with respect to the taxable year ended July 31, 2013, $47,460,544 or, if subsequently determined to be different, the net capital gain of such year.
A total of 0.06% of the dividends distributed during the fiscal year was derived from interest on U.S. Government securities which is generally exempt from state income tax.
The fund will notify shareholders in January 2014 of amounts for use in preparing 2013 income tax returns.
Annual Report
Board Approval of Investment Advisory Contracts and Management Fees
Fidelity Real Estate Income Fund
Each year, the Board of Trustees, including the Independent Trustees (together, the Board), votes on the renewal of the management contract and sub-advisory agreements (together, the Advisory Contracts) for the fund. The Board, assisted by the advice of fund counsel and Independent Trustees' counsel, requests and considers a broad range of information relevant to the renewal of the Advisory Contracts throughout the year.
The Board meets regularly and, at each of its meetings, covers an extensive agenda of topics and materials and considers factors that are relevant to its annual consideration of the renewal of the fund's Advisory Contracts, including the services and support provided to the fund and its shareholders. The Board has established various standing committees, each composed of and chaired by Independent Trustees with varying backgrounds, to which the Board has assigned specific subject matter responsibilities in order to enhance effective decision-making by the Board. The Board, acting directly and through its Committees, requests and receives information concerning the annual consideration of the renewal of the fund's Advisory Contracts. The Board also meets as needed to consider matters specifically related to the Board's annual consideration of the renewal of Advisory Contracts. Members of the Board may also meet with trustees of other Fidelity funds through ad hoc joint committees to discuss certain matters relevant to the Fidelity funds.
At its July 2013 meeting, the Board, including the Independent Trustees, unanimously determined to renew the fund's Advisory Contracts. In reaching its determination, the Board considered all factors it believed relevant, including (i) the nature, extent, and quality of the services to be provided to the fund and its shareholders (including the investment performance of the fund); (ii) the competitiveness of the fund's management fee and total expense ratio relative to peer funds; (iii) the total costs of the services to be provided by and the profits to be realized by Fidelity from its relationship with the fund; (iv) the extent to which economies of scale exist and would be realized as the fund grows; and (v) whether fee levels reflect these economies of scale, if any, for the benefit of fund shareholders.
In considering whether to renew the Advisory Contracts for the fund, the Board reached a determination, with the assistance of fund counsel and Independent Trustees' counsel and through the exercise of its business judgment, that the renewal of the Advisory Contracts was in the best interests of the fund and its shareholders and that the compensation payable under the Advisory Contracts was fair and reasonable. The Board's decision to renew the Advisory Contracts was not based on any single factor, but rather was based on a comprehensive consideration of all the information provided to the Board at its meetings throughout the year. The Board, in reaching its determination to renew the Advisory Contracts, was aware that shareholders in the fund have a broad range of investment choices available to them, including a wide choice among mutual funds offered by Fidelity's competitors, and that the fund's shareholders, who have the opportunity to review and weigh the disclosure provided by the fund in its prospectus and other public disclosures, have chosen to invest in this fund, which is a part of the Fidelity family of funds.
Annual Report
Board Approval of Investment Advisory Contracts and
Management Fees - continued
Nature, Extent, and Quality of Services Provided. The Board considered the staffing within the investment adviser, Fidelity Management & Research Company (FMR), and the sub-advisers (together, the Investment Advisers) as it relates to the fund, including the backgrounds of the fund's investment personnel, and also considered the fund's investment objective, strategies, and related investment philosophy. The Independent Trustees also had discussions with senior management of Fidelity's investment operations and investment groups. The Board considered the structure of the portfolio manager compensation program and whether this structure provides appropriate incentives to act in the best interests of the fund.
Resources Dedicated to Investment Management and Support Services. The Board and the Fund Oversight and Research Committees reviewed the general qualifications and capabilities of the Investment Advisers' investment staff, including its size, education, experience, and resources, as well as the Investment Advisers' approach to recruiting, training, managing, and compensating investment personnel. The Board noted that FMR has continued to increase the resources devoted to non-U.S. offices, including expansion of Fidelity's global investment organization. The Board also noted that Fidelity's analysts have extensive resources, tools and capabilities that allow them to conduct sophisticated quantitative and fundamental analysis, as well as credit analysis of issuers, counterparties and guarantors. Further, the Board believes that Fidelity's investment professionals have sufficient access to global information and data so as to provide competitive investment results over time, and that those professionals also have access to sophisticated tools that permit them to assess portfolio construction and risk and performance attribution characteristics continuously, as well as to transmit new information and research conclusions rapidly around the world. Additionally, in its deliberations, the Board considered the Investment Advisers' trading and risk management capabilities and resources, which are an integral part of the investment management process.
Shareholder and Administrative Services. The Board considered (i) the nature, extent, quality, and cost of advisory, administrative, and shareholder services performed by the Investment Advisers and their affiliates under the Advisory Contracts and under separate agreements covering transfer agency, pricing and bookkeeping, and securities lending services for the fund; (ii) the nature and extent of the supervision of third party service providers, principally custodians and subcustodians; and (iii) the resources devoted to, and the record of compliance with, the fund's compliance policies and procedures. The Board also reviewed the allocation of fund brokerage, including allocations to brokers affiliated with the Investment Advisers, the use of brokerage commissions to pay fund expenses, and the use of "soft" commission dollars to pay for research services.
Annual Report
The Board noted that the growth of fund assets over time across the complex allows Fidelity to reinvest in the development of services designed to enhance the value or convenience of the Fidelity funds as investment vehicles. These services include 24-hour access to account information and market information through telephone representatives and over the Internet, investor education materials and asset allocation tools, and the expanded availability of Fidelity Investor Centers.
Investment in a Large Fund Family. The Board considered the benefits to shareholders of investing in a Fidelity fund, including the benefits of investing in a fund that is part of a large family of funds offering a variety of investment disciplines and providing a large variety of mutual fund investor services. The Board noted that Fidelity had taken, or had made recommendations that resulted in the Fidelity funds taking, a number of actions over the previous year that benefited particular funds, including (i) continuing to dedicate additional resources to investment research and to the support of the senior management team that oversees asset management; (ii) persisting in efforts to enhance Fidelity's global research capabilities; (iii) launching new funds and making other enhancements to meet client needs for global and income-oriented solutions; (iv) continuing to launch dedicated lower cost underlying funds to meet portfolio construction needs related to expanding underlying fund options for Fidelity funds of funds, specifically for the Freedom Fund product lines; (v) rationalizing product lines and gaining increased efficiencies through the mergers of several funds into other funds; (vi) strengthening Fidelity's index fund offerings by reducing investment minimums and adopting or lowering existing expense caps for certain funds and classes; (vii) enhancing Global Asset Allocation product offerings by launching new funds and strategies, including "open architecture" target date funds that utilize affiliated and unaffiliated sub-advisers; (viii) modifying the eligibility criteria for Institutional Class shares of Advisor funds to increase their marketability to a portion of the defined contribution plan market; (ix) creating a new low-cost retirement share class for certain Advisor funds to appeal to large retirement plans; (x) transitioning the management of certain Fidelity commodity funds to Geode Capital Management LLC, a registered commodity pool operator, while retaining administrative responsibilities for the funds; (xi) reorganizing a number of funds; and (xii) taking steps toward establishing a new Fidelity adviser to manage sector-based funds and products.
Investment Performance. The Board considered whether the fund has operated in accordance with its investment objective, as well as its record of compliance with its investment restrictions and its performance history.
The Board took into account discussions with the Investment Advisers about fund investment performance that occur at Board meetings throughout the year. In this regard the Board noted that as part of regularly scheduled fund reviews and other reports to the Board on fund performance, the Board periodically considers annualized return information for the fund, for different time periods, measured against a securities market index ("benchmark index") and a peer group of mutual funds with similar objectives ("peer group"). In its evaluation of fund investment performance, the Board gave particular attention to information indicating changes in performance of certain Fidelity funds for specific time periods and the Investment Advisers' explanations for any overperformance or underperformance.
Annual Report
Board Approval of Investment Advisory Contracts and
Management Fees - continued
In addition to reviewing absolute and relative fund performance, the Independent Trustees periodically consider the appropriateness of fund performance metrics in evaluating the results achieved. In general, the Independent Trustees believe that fund performance should be evaluated based on net performance (after fees and expenses) of both the highest performing and lowest performing classes, where applicable, compared to appropriate benchmark indices, over appropriate time periods which may include full market cycles, and compared to peer groups, as applicable, over the same periods, taking into account relevant factors including the following: general market conditions; issuer-specific information; tactical opportunities for investment; and fund cash flows and other factors.
The Independent Trustees recognize that shareholders evaluate performance on a net basis over their own holding periods, for which one-, three-, and five-year periods are used as a proxy. For this reason, the performance information reviewed by the Board also included net cumulative calendar year total return information for the fund and an appropriate benchmark index and peer group for the most recent one-, three-, and five-year periods, as shown below. Returns are shown compared to the 25th percentile (top of box) and 75th percentile (bottom of box) of the peer universe.
Fidelity Real Estate Income Fund
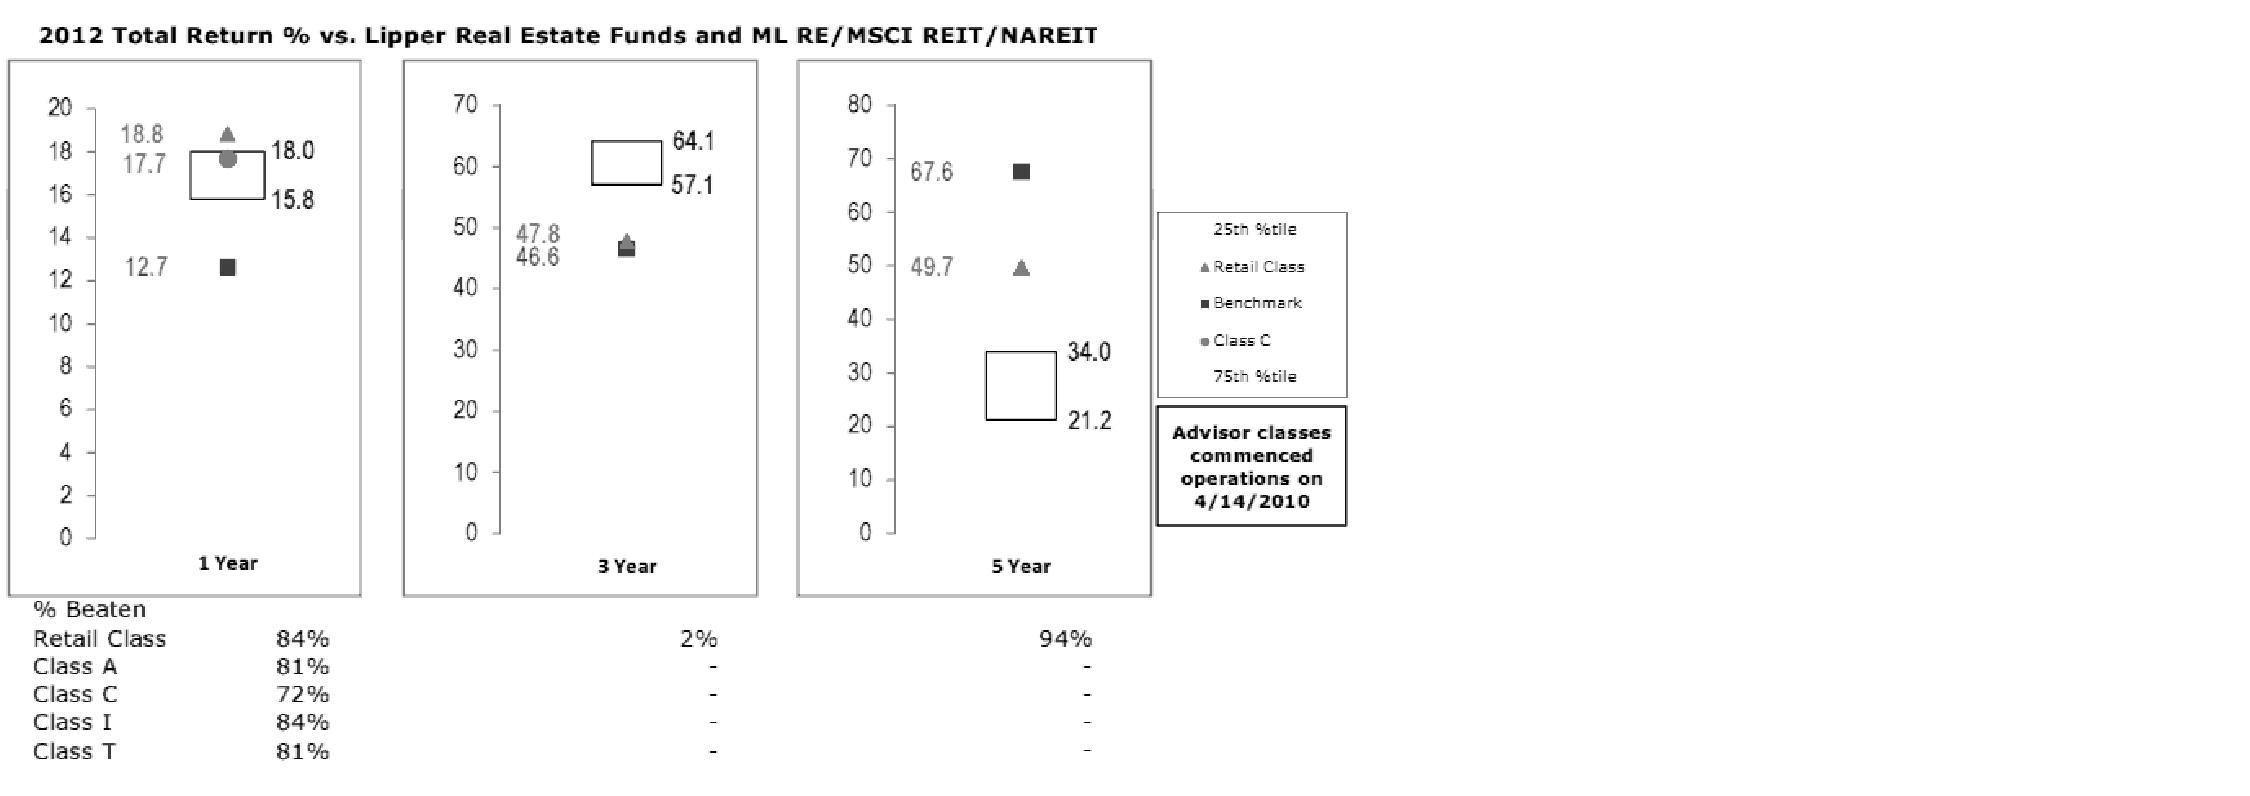
Annual Report
Based on its review, the Board concluded that the nature, extent, and quality of services provided to the fund under the Advisory Contracts should benefit the fund's shareholders.
Competitiveness of Management Fee and Total Expense Ratio. The Board considered the fund's management fee and total expense ratio compared to "mapped groups" of competitive funds and classes. Fidelity creates "mapped groups" by combining similar Lipper investment objective categories that have comparable management fee characteristics. Combining Lipper investment objective categories aids the Board's management fee and total expense ratio comparisons by broadening the competitive group used for comparison and by reducing the number of universes to which various Fidelity funds are compared.
Management Fee. The Board considered two proprietary management fee comparisons for the 12-month periods shown in the chart below. The group of Lipper funds used by the Board for management fee comparisons is referred to below as the "Total Mapped Group." The Total Mapped Group is broader than the Lipper peer group used by the Board for performance comparisons because the Total Mapped Group combines several Lipper investment objective categories while the Lipper peer group does not. The Total Mapped Group comparison focuses on a fund's standing in terms of gross management fees before expense reimbursements or caps relative to the total universe of funds with comparable investment mandates, regardless of whether their management fee structures also are comparable. Funds with comparable investment mandates offer exposure to similar types of securities. Funds with comparable management fee structures have similar management fee contractual arrangements (e.g., flat rate charged for advisory services, all-inclusive fee rate, etc.). "TMG %" represents the percentage of funds in the Total Mapped Group that had management fees that were lower than the fund's. For example, a TMG % of 7% means that 93% of the funds in the Total Mapped Group had higher management fees than the fund. The "Asset-Size Peer Group" (ASPG) comparison focuses on a fund's standing relative to a subset of non-Fidelity funds within the Total Mapped Group that are similar in size and management fee structure. The ASPG represents at least 15% of the funds in the Total Mapped Group with comparable asset size and management fee structures, subject to a minimum of 50 funds (or all funds in the Total Mapped Group if fewer than 50). Additional information, such as the ASPG quartile in which the fund's management fee ranked, is also included in the chart and considered by the Board.
Annual Report
Board Approval of Investment Advisory Contracts and
Management Fees - continued
Fidelity Real Estate Income Fund

The Board noted that the fund's management fee ranked below the median of its Total Mapped Group and below the median of its ASPG for 2012.
Based on its review, the Board concluded that the fund's management fee is fair and reasonable in light of the services that the fund receives and the other factors considered.
Total Expense Ratio. In its review of each class's total expense ratio, the Board considered the fund's management fee as well as other fund or class expenses, as applicable, such as transfer agent fees, pricing and bookkeeping fees, fund-paid 12b-1 fees, and custodial, legal, and audit fees. The Board also noted the effects of any waivers and reimbursements on fees and expenses. As part of its review, the Board also considered the current and historical total expense ratios of each class of the fund compared to competitive fund median expenses. Each class of the fund is compared to those funds and classes in the Total Mapped Group (used by the Board for management fee comparisons) that have a similar sales load structure.
The Board noted that the total expense ratio of each class ranked below its competitive median for 2012.
Fees Charged to Other Fidelity Clients. The Board also considered Fidelity fee structures and other information with respect to clients of FMR and its affiliates, such as other mutual funds advised or subadvised by FMR or its affiliates, pension plan clients, and other institutional clients. The Board noted the findings of the 2013 ad hoc joint committee (created with the board of other Fidelity funds), which reviewed and compared Fidelity's institutional investment advisory business with its business of providing services to the Fidelity funds, including the differences in services provided, fees charged, and costs incurred, as well as competition in their respective marketplaces.
Annual Report
Based on its review of total expense ratios and fees charged to other Fidelity clients, the Board concluded that the total expense ratio of each class of the fund was reasonable in light of the services that the fund and its shareholders receive and the other factors considered.
Costs of the Services and Profitability. The Board considered the revenues earned and the expenses incurred by Fidelity in conducting the business of developing, marketing, distributing, managing, administering and servicing the fund and servicing the fund's shareholders. The Board also considered the level of Fidelity's profits in respect of all the Fidelity funds.
On an annual basis, FMR presents to the Board Fidelity's profitability for the fund. Fidelity calculates the profitability for each fund, as well as aggregate profitability for groups of Fidelity funds and all Fidelity funds, using a series of detailed revenue and cost allocation methodologies which originate with the books and records of Fidelity on which Fidelity's audited financial statements are based. The Audit Committee of the Board reviews any significant changes from the prior year's methodologies.
PricewaterhouseCoopers LLP (PwC), independent registered public accounting firm and auditor to Fidelity and certain Fidelity funds, has been engaged annually by the Board as part of the Board's assessment of Fidelity's profitability analysis. PwC's engagement includes the review and assessment of the methodologies used by Fidelity in determining the revenues and expenses attributable to Fidelity's mutual fund business, and completion of agreed-upon procedures surrounding the mathematical accuracy of fund profitability and its conformity to allocation methodologies. After considering PwC's reports issued under the engagement and information provided by Fidelity, the Board concluded that while other allocation methods may also be reasonable, Fidelity's profitability methodologies are reasonable in all material respects.
The Board also reviewed Fidelity's non-fund businesses and fall-out benefits related to the mutual fund business as well as cases where Fidelity's affiliates may benefit from or be related to the fund's business.
The Board considered the costs of the services provided by and the profits realized by Fidelity in connection with the operation of the fund and was satisfied that the profitability was not excessive in the circumstances.
Economies of Scale. The Board considered whether there have been economies of scale in respect of the management of the Fidelity funds, whether the Fidelity funds (including the fund) have appropriately benefited from any such economies of scale, and whether there is potential for realization of any further economies of scale. The Board considered the extent to which the fund will benefit from economies of scale through increased services to the fund, through waivers or reimbursements, or through fee or expense reductions. The Board also noted that in 2009, it and the board of other Fidelity funds created an ad hoc committee (the Economies of Scale Committee) to analyze whether FMR attains economies of scale in respect of the management and servicing of the Fidelity funds, whether the Fidelity funds have appropriately benefited from such economies of scale, and whether there is potential for realization of any further economies of scale.
Annual Report
Board Approval of Investment Advisory Contracts and
Management Fees - continued
The Board recognized that the fund's management contract incorporates a "group fee" structure, which provides for lower group fee rates as total fund assets under FMR's management increase, and for higher group fee rates as total fund assets under FMR's management decrease. FMR calculates the group fee rates based on a tiered asset "breakpoint" schedule that varies based on asset class. The Board considered that the group fee is designed to deliver the benefits of economies of scale to fund shareholders when total Fidelity fund assets increase, even if assets of any particular fund are unchanged or have declined, because some portion of Fidelity's costs are attributable to services provided to all Fidelity funds, and all funds benefit if those costs can be allocated among more assets. The Board concluded that, given the group fee structure, fund shareholders will benefit from lower management fees as assets under FMR's management increase at the fund complex level, regardless of whether Fidelity achieves any such economies of scale.
The Board concluded, taking into account the analysis of the Economies of Scale Committee, that economies of scale, if any, are being appropriately shared between fund shareholders and Fidelity.
Amendment to Description of Group Fee Rate. At its July 2013 meeting, the Board voted to approve an amendment to the fund's management contract to modify the description of the "group fee rate" effective August 1, 2013. The Board noted that under the prior description in the contract, the group fee rate was based on the average net assets of all registered investment companies with which FMR has management contracts. Under the contract's tiered asset breakpoint schedule, the group fee rate is lower as total fund assets under FMR's management increase, and higher as total fund assets under FMR's management decrease. The Board considered that the prior description would have excluded the assets of 64 Fidelity sector funds from the group fee rate calculation once Fidelity SelectCo, LLC, an affiliate of FMR, assumed management responsibilities for those funds. The Board noted that modifying the description of the group fee rate to continue to include the assets of those 64 funds for purposes of determining group fee rate breakpoints would avoid an immediate adverse impact on the group fee rate for any fund.
Additional Information Requested by the Board. In order to develop fully the factual basis for consideration of the Fidelity funds' Advisory Contracts, the Board requested and received additional information on certain topics, including: (i) fund performance trends and Fidelity's long-term strategies for certain funds; (ii) the potential to further rationalize the Fidelity fund lineup with the possibility of achieving savings for the funds and Fidelity; (iii) the methodology with respect to competitive fund data and peer group classifications; (iv) the arrangements with, and performance of, certain sub-advisers on behalf of the Fidelity funds, as well as certain proposed participating affiliate arrangements; (v) the realization of fall-out benefits in certain Fidelity business units; (vi) Fidelity's group fee structures, including the rationale for the individual fee rates of certain categories of funds and the definition of group assets; (vii) trends regarding industry use of performance fee structures and the performance adjustment methodologies applicable to the Fidelity funds; (viii) additional competitive analysis regarding the total expenses for certain classes; and (ix) fund profitability methodology, including Fidelity's cost allocation methodology, and the impact of certain factors on fund profitability results.
Annual Report
Based on its evaluation of all of the conclusions noted above, and after considering all factors it believed relevant, the Board ultimately concluded that the advisory fee structures are fair and reasonable, and that the fund's Advisory Contracts should be renewed.
Annual Report
Investment Adviser
Fidelity Management & Research Company
Boston, MA
Investment Sub-Advisers
FMR Co., Inc.
Fidelity Management & Research
(U.K.) Inc.
Fidelity Management & Research
(Hong Kong) Limited
Fidelity Management & Research
(Japan) Inc.
General Distributor
Fidelity Distributors Corporation
Smithfield, RI
Transfer and Service Agents
Fidelity Investments Institutional
Operations Company, Inc.
Boston, MA
Fidelity Service Company, Inc.
Boston, MA
Custodian
Citibank, N.A.
New York, NY
The Fidelity Telephone Connection
Mutual Fund 24-Hour Service
Exchanges/Redemptions
and Account Assistance 1-800-544-6666
Product Information 1-800-544-6666
Retirement Accounts 1-800-544-4774
(8 a.m. - 9 p.m.)
TDD Service 1-800-544-0118
for the deaf and hearing impaired
(9 a.m. - 9 p.m. Eastern time)
Fidelity Automated Service
Telephone (FAST®)
1-800-544-5555
Automated line for quickest service
(Fidelity Investment logo)(registered trademark)
Corporate Headquarters
245 Summer St., Boston, MA 02210
www.fidelity.com
REI-UANN-0913
1.789710.110
(Fidelity Investment logo)(registered trademark)
Fidelity Advisor®
Real Estate Income
Fund - Class A, Class T, and Class C
Annual Report
July 31, 2013
(Fidelity Cover Art)
Class A , Class T, and
Class C are classes of Fidelity® Real Estate Income Fund
Contents
Performance | (Click Here) | How the fund has done over time. |
Management's Discussion of Fund Performance | (Click Here) | The Portfolio Manager's review of fund performance and strategy. |
Shareholder Expense Example | (Click Here) | An example of shareholder expenses. |
Investment Changes | (Click Here) | A summary of major shifts in the fund's investments over the past six months. |
Investments | (Click Here) | A complete list of the fund's investments with their market values. |
Financial Statements | (Click Here) | Statements of assets and liabilities, operations, and changes in net assets, as well as financial highlights. |
Notes | (Click Here) | Notes to the financial statements. |
Report of Independent Registered Public Accounting Firm | (Click Here) | |
Trustees and Officers | (Click Here) | |
Distributions | (Click Here) | |
Board Approval of Investment Advisory Contracts and Management Fees | (Click Here) | |
To view a fund's proxy voting guidelines and proxy voting record for the 12-month period ended June 30, visit http://www.fidelity.com/proxyvotingresults or visit the Securities and Exchange Commission's (SEC) web site at http://www.sec.gov. You may also call 1-877-208-0098 to request a free copy of the proxy voting guidelines.
Standard & Poor's, S&P and S&P 500 are registered service marks of The McGraw-Hill Companies, Inc. and have been licensed for use by Fidelity Distributors Corporation.
Other third-party marks appearing herein are the property of their respective owners.
All other marks appearing herein are registered or unregistered trademarks or service marks of FMR LLC or an affiliated company. © 2013 FMR LLC. All rights reserved.
Annual Report
This report and the financial statements contained herein are submitted for the general information of the shareholders of the fund. This report is not authorized for distribution to prospective investors in the fund unless preceded or accompanied by an effective prospectus.
A fund files its complete schedule of portfolio holdings with the SEC for the first and third quarters of each fiscal year on Form N-Q. Forms N-Q are available on the SEC's web site at http://www.sec.gov. A fund's Forms N-Q may be reviewed and copied at the SEC's Public Reference Room in Washington, DC. Information regarding the operation of the SEC's Public Reference Room may be obtained by calling 1-800-SEC-0330. For a complete list of a fund's portfolio holdings, view the most recent holdings listing, semiannual report, or annual report on Fidelity's web site at http://www.fidelity.com, http://www.advisor.fidelity.com, or http://www.401k.com, as applicable.
NOT FDIC INSURED • MAY LOSE VALUE • NO BANK GUARANTEE
Neither the fund nor Fidelity Distributors Corporation is a bank.
Annual Report
Average annual total return reflects the change in the value of an investment, assuming reinvestment of the class' distributions from dividend income and capital gains (the profits earned upon the sale of securities that have grown in value, if any) and assuming a constant rate of performance each year. The $10,000 table and the fund's returns do not reflect the deduction of taxes that a shareholder would pay on fund distributions or the redemption of fund shares. During periods of reimbursement by Fidelity, a fund's total return will be greater than it would be had the reimbursement not occurred. How a fund did yesterday is no guarantee of how it will do tomorrow.
Average Annual Total Returns
Periods ended July 31, 2013 | Past 1
year | Past 5
years | Past 10
years |
Class A (incl. 4.00% sales charge) A | 6.03% | 9.77% | 6.97% |
Class T (incl. 4.00% sales charge) B | 6.01% | 9.75% | 6.96% |
Class C (incl. contingent deferred sales charge)C | 8.66% | 10.13% | 7.14% |
A The initial offering of Class A shares took place on April 14, 2010. Returns prior to April 14, 2010 are those of Fidelity® Real Estate Income Fund, the original class of the fund, which has no 12b-1 fee. Had Class A's 12b-1 fee been reflected, returns prior to April 14, 2010 would have been lower.
B The initial offering of Class T shares took place on April 14, 2010. Returns prior to April 14, 2010 are those of Fidelity Real Estate Income Fund, the original class of the fund, which has no 12b-1 fee. Had Class T's 12b-1 fee been reflected, returns prior to April 14, 2010 would have been lower.
C The initial offering of Class C shares took place on April 14, 2010. Returns prior to April 14, 2010 are those of Fidelity Real Estate Income Fund, the original class of the fund, which has no 12b-1 fee. Had Class C's 12b-1 fee been reflected, returns prior to April 14, 2010 would have been lower. Class C shares' contingent deferred sales charges included in the past one year, past five years, and past ten years total return figures are 1%, 0%, and 0%, respectively.
Annual Report
$10,000 Over 10 Years
Let's say hypothetically that $10,000 was invested in Fidelity Advisor® Real Estate Income Fund - Class A on July 31, 2003, and the current 4.00% sales charge was paid. The chart shows how the value of your investment would have changed, and also shows how the S&P 500® Index performed over the same period. The initial offering of Class A took place on April 14, 2010. See footnote A on the previous page for additional information regarding the performance of Class A.
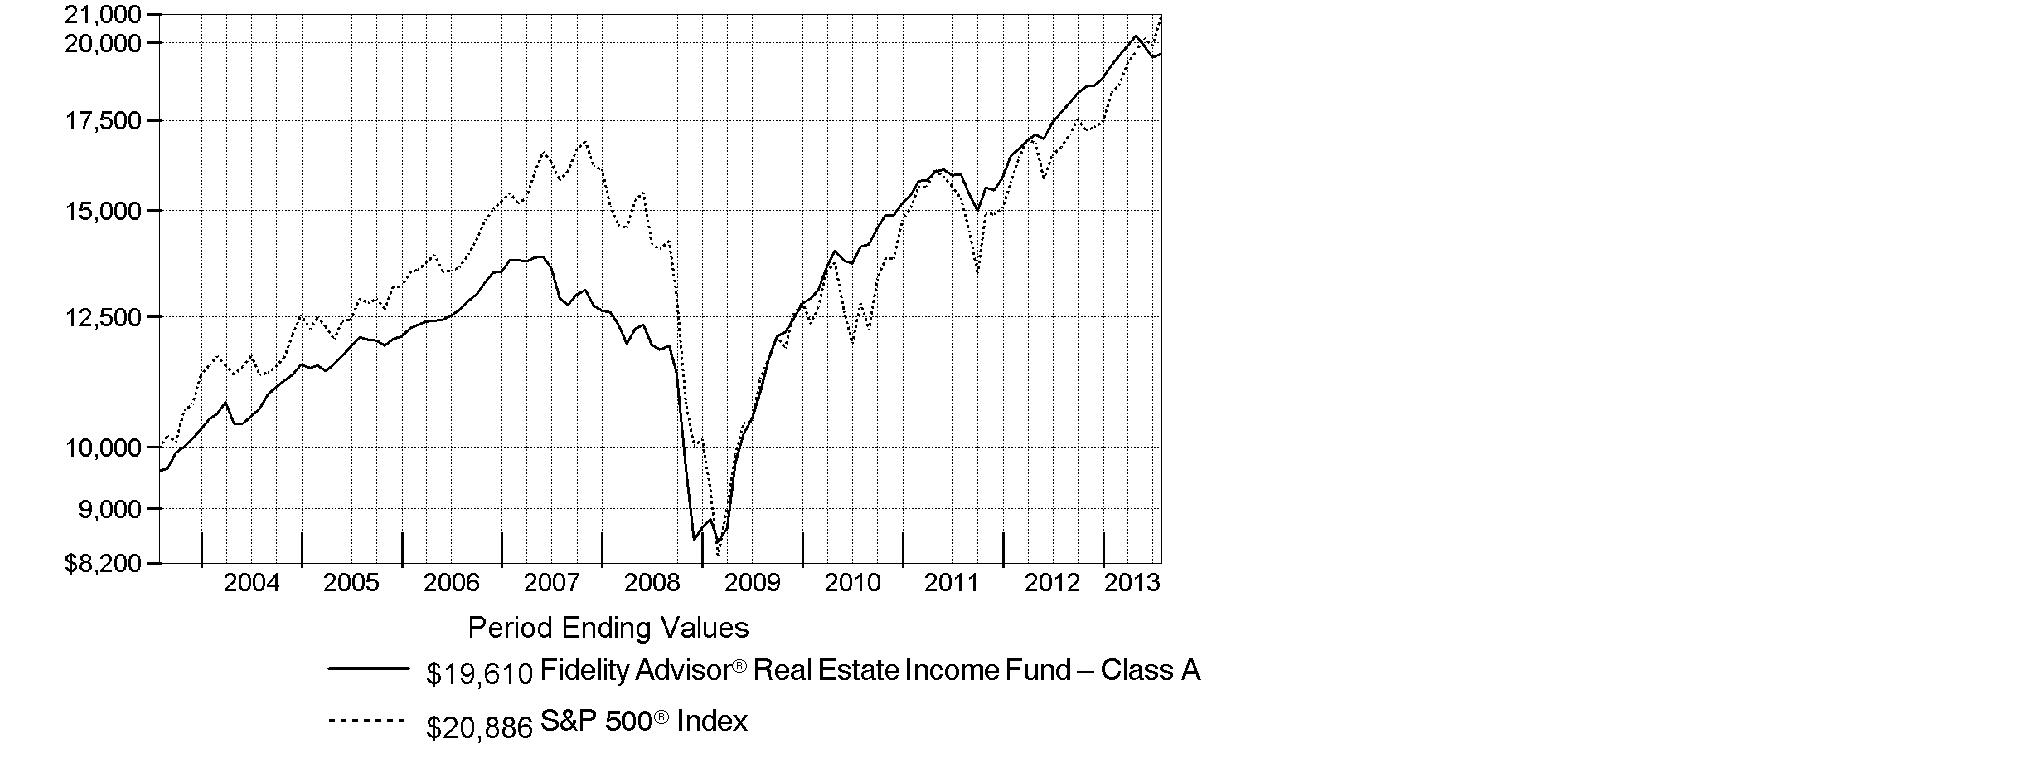
Annual Report
Market Recap: The fundamentals for commercial and residential property remained good throughout the 12-month period ending July 31, 2013. On the commercial side, demand continued to increase faster than the supply of new buildings, which, in turn, helped lift rental and occupancy rates. Meanwhile, single-family home prices continued to rise, boosting the slow-growing U.S. economy. For most of the period, real estate investment trust (REIT) common stocks performed well, although that situation abruptly reversed in May, when the Federal Reserve signaled its desire to bring its "quantitative easing" economic stimulus approach to a close. This caused a steep rise in interest rates, which weighed on the REIT market. Still, REIT stocks were positive performers for the 12 months, as the FTSE® NAREIT® All REITs Index gained 7.82%. Meanwhile, real estate bonds, reflected by The BofA Merrill LynchSM US Real Estate Index - a market-capitalization-weighted measure of the performance of investment-grade public debt of corporate issuers in the domestic real estate sector - rose 2.21%. The MSCI® REIT Preferred Index, which reflects the performance of real estate preferred stocks, returned 1.32%, while the broad U.S. equity market, as measured by the S&P 500® Index, generated a robust return of 25.00%.
Comments from Mark Snyderman, Portfolio Manager of Fidelity Advisor® Real Estate Income Fund: For the year, the fund's Class A, Class T and Class C shares gained 10.45%, 10.42% and 9.66%, respectively (excluding sales charges). In comparison, the Fidelity Real Estate Income Composite IndexSM - a 40/40/20 blend of the MSCI index, The BofA Merrill Lynch index and the FTSE® NAREIT® index, respectively - rose 3.02%. My strategy includes using thorough credit research to capitalize on inefficiencies in real estate securities markets. During the period, the fund's real estate investment trust (REIT) common stocks returned 21% - far ahead of the FTSE NAREIT index. Here, positions in net-lease companies Lexington Corporate Properties Trust and CapLease each added value. In contrast, mortgage REIT CYS Investments turned out to be more sensitive to the effects of rising interest rates than I anticipated, while student housing REIT American Campus Communities also lagged. Meanwhile, the fund's preferred real estate stocks were up roughly 7%, outpacing the MSCI index, thanks to my focus on higher-yielding preferreds. On the fixed-income side, commercial mortgage-backed securities, high-yield real estate bonds and investment-grade real estate bonds all handily beat the 2% return of the BofA Merrill Lynch index. The fund especially benefited from an investment in the bonds of commercial finance REIT iStar Financial. The fund's average cash weighting of 8%, however, limited the fund's upside.
The views expressed above reflect those of the portfolio manager(s) only through the end of the period as stated on the cover of this report and do not necessarily represent the views of Fidelity or any other person in the Fidelity organization. Any such views are subject to change at any time based upon market or other conditions and Fidelity disclaims any responsibility to update such views. These views may not be relied on as investment advice and, because investment decisions for a Fidelity fund are based on numerous factors, may not be relied on as an indication of trading intent on behalf of any Fidelity fund.
Annual Report
Shareholder Expense Example
As a shareholder of the Fund, you incur two types of costs: (1) transaction costs, including sales charges (loads) on purchase payments or redemption proceeds, redemption fees and (2) ongoing costs, including management fees, distribution and/or service (12b-1) fees and other Fund expenses. This Example is intended to help you understand your ongoing costs (in dollars) of investing in the Fund and to compare these costs with the ongoing costs of investing in other mutual funds.
The Example is based on an investment of $1,000 invested at the beginning of the period and held for the entire period (February 1, 2013 to July 31, 2013).
Actual Expenses
The first line of the accompanying table for each class of the Fund provides information about actual account values and actual expenses. You may use the information in this line, together with the amount you invested, to estimate the expenses that you paid over the period. Simply divide your account value by $1,000.00 (for example, an $8,600 account value divided by $1,000.00 = 8.6), then multiply the result by the number in the first line for a class of the Fund under the heading entitled "Expenses Paid During Period" to estimate the expenses you paid on your account during this period. A small balance maintenance fee of $12.00 that is charged once a year may apply for certain accounts with a value of less than $2,000. This fee is not included in the table below. If it was, the estimate of expenses you paid during the period would be higher, and your ending account value lower, by this amount. In addition, the Fund, as a shareholder in the underlying Fidelity Central Funds, will indirectly bear its pro-rata share of the fees and expenses incurred by the underlying Fidelity Central Funds. These fees and expenses are not included in the Fund's annualized expense ratio used to calculate the expense estimate in the table below.
Hypothetical Example for Comparison Purposes
The second line of the accompanying table for each class of the Fund provides information about hypothetical account values and hypothetical expenses based on a Class' actual expense ratio and an assumed rate of return of 5% per year before expenses, which is not the Class' actual return. The hypothetical account values and expenses may not be used to estimate the actual ending account balance or expenses you paid for the period. You may use this information to compare the ongoing costs of investing in the Fund and other funds. To do so, compare this 5% hypothetical example with the 5% hypothetical examples that appear in the shareholder reports of the other funds. A small balance maintenance fee of $12.00 that is charged once a year may apply for certain accounts with a value of less than $2,000. This fee is not included in the table below. If it was, the estimate of expenses you paid during the period would be higher, and your ending account value lower, by this amount. In addition, the Fund, as a shareholder in the underlying Fidelity Central Funds, will indirectly bear its pro-rata share of the fees and expenses incurred by the underlying Fidelity Central Funds. These fees and expenses are not included in the Fund's annualized expense ratio used to calculate the expense estimate in the table below.
Please note that the expenses shown in the table are meant to highlight your ongoing costs only and do not reflect any transaction costs. Therefore, the second line of the table is useful in comparing ongoing costs only, and will not help you determine the relative total costs of owning different funds. In addition, if these transactional costs were included, your costs would have been higher.
Annual Report
| Annualized
Expense RatioB | Beginning
Account Value
February 1, 2013 | Ending
Account Value
July 31, 2013 | Expenses Paid
During Period*
February 1, 2013
to July 31, 2013 |
Class A | 1.07% | | | |
Actual | | $ 1,000.00 | $ 1,018.40 | $ 5.35 |
HypotheticalA | | $ 1,000.00 | $ 1,019.49 | $ 5.36 |
Class T | 1.08% | | | |
Actual | | $ 1,000.00 | $ 1,018.40 | $ 5.40 |
HypotheticalA | | $ 1,000.00 | $ 1,019.44 | $ 5.41 |
Class C | 1.80% | | | |
Actual | | $ 1,000.00 | $ 1,014.30 | $ 8.99 |
HypotheticalA | | $ 1,000.00 | $ 1,015.87 | $ 9.00 |
Real Estate Income | .83% | | | |
Actual | | $ 1,000.00 | $ 1,019.10 | $ 4.16 |
HypotheticalA | | $ 1,000.00 | $ 1,020.68 | $ 4.16 |
Institutional Class | .79% | | | |
Actual | | $ 1,000.00 | $ 1,019.50 | $ 3.96 |
HypotheticalA | | $ 1,000.00 | $ 1,020.88 | $ 3.96 |
A 5% return per year before expenses
B Annualized expense ratio reflects expenses net of applicable fee waivers.
* Expenses are equal to each Class' annualized expense ratio, multiplied by the average account value over the period, multiplied by 181/365 (to reflect the one-half year period).
Annual Report
Investment Changes (Unaudited)
Top Five Stocks as of July 31, 2013 |
| % of fund's
net assets | % of fund's net assets
6 months ago |
MFA Financial, Inc. | 2.5 | 2.0 |
Equity Lifestyle Properties, Inc. | 2.1 | 1.8 |
Acadia Realty Trust (SBI) | 1.6 | 1.4 |
Ventas, Inc. | 1.5 | 1.7 |
CBL & Associates Properties, Inc. | 1.0 | 0.9 |
| 8.7 | |
Top 5 Bonds as of July 31, 2013 |
| % of fund's
net assets | % of fund's net assets
6 months ago |
Hilton Worldwide, Inc. term loan 4.442% 11/12/15 | 1.3 | 1.0 |
Banc of America Large Loan Trust floater Series 2010-HLTN Class HLTN, 2.491% 11/15/15 | 1.3 | 2.9 |
iStar Financial, Inc. Tranche B, term loan 4.5% 10/15/17 | 0.9 | 0.6 |
iStar Financial, Inc. 5.875% 3/15/16 | 0.9 | 1.0 |
Annaly Capital Management, Inc. 5% 5/15/15 | 0.8 | 1.0 |
| 5.2 | |
Top Five REIT Sectors as of July 31, 2013 |
| % of fund's
net assets | % of fund's net assets
6 months ago |
REITs - Mortgage | 15.3 | 12.7 |
REITs - Management/Investment | 8.9 | 8.2 |
REITs - Health Care Facilities | 6.2 | 6.5 |
REITs - Shopping Centers | 5.3 | 6.1 |
REITs - Apartments | 5.1 | 2.8 |
Asset Allocation (% of fund's net assets) |
As of July 31, 2013 * | As of January 31, 2013 ** |
| Common Stocks 32.7% | | | Common Stocks 26.1% | |
| Preferred Stocks 12.8% | | | Preferred Stocks 13.5% | |
| Bonds 33.2% | | | Bonds 39.9% | |
| Convertible
Securities 3.8% | | | Convertible
Securities 3.5% | |
| Other Investments 11.0% | | | Other Investments 8.6% | |
| Short-Term
Investments and
Net Other Assets
(Liabilities) 6.5% | | | Short-Term
Investments and
Net Other Assets
(Liabilities) 8.4% | |
* Foreign investments | 3.4% | | ** Foreign investments | 3.8% | |

Annual Report
Investments July 31, 2013
Showing Percentage of Net Assets
Common Stocks - 32.7% |
| Shares | | Value |
CONSUMER DISCRETIONARY - 0.6% |
Hotels, Restaurants & Leisure - 0.3% |
Hyatt Hotels Corp. Class A (a) | 257,400 | | $ 11,647,350 |
Household Durables - 0.3% |
NVR, Inc. (a) | 6,700 | | 6,201,520 |
Standard Pacific Corp. (a) | 464,495 | | 3,799,569 |
Stanley Martin Communities LLC Class B (a) | 4,620 | | 4,902,236 |
| | 14,903,325 |
TOTAL CONSUMER DISCRETIONARY | | 26,550,675 |
FINANCIALS - 31.0% |
Capital Markets - 0.3% |
Ellington Financial LLC | 519,500 | | 11,803,040 |
Real Estate Investment Trusts - 29.9% |
Acadia Realty Trust (SBI) | 2,606,449 | | 67,194,255 |
AG Mortgage Investment Trust, Inc. | 578,800 | | 10,499,432 |
American Campus Communities, Inc. | 392,100 | | 15,060,561 |
American Residential Properties, Inc. (a)(h) | 453,000 | | 7,945,620 |
American Residential Properties, Inc. (a) | 121,941 | | 2,138,845 |
American Tower Corp. | 366,600 | | 25,951,614 |
Anworth Mortgage Asset Corp. | 1,320,710 | | 6,418,651 |
Apartment Investment & Management Co. Class A | 1,317,300 | | 38,702,274 |
Arbor Realty Trust, Inc. (g) | 2,799,375 | | 21,107,288 |
Associated Estates Realty Corp. (f) | 781,408 | | 11,939,914 |
AvalonBay Communities, Inc. | 197,000 | | 26,661,980 |
BioMed Realty Trust, Inc. | 1,145,500 | | 23,666,030 |
Blackstone Mortgage Trust, Inc. | 280,900 | | 7,101,152 |
Boardwalk (REIT) | 126,200 | | 7,079,782 |
Canadian (REIT) | 131,600 | | 5,275,019 |
CapLease, Inc. | 2,656,300 | | 22,525,424 |
CBL & Associates Properties, Inc. | 1,845,873 | | 42,030,528 |
Cedar Shopping Centers, Inc. | 921,410 | | 5,104,611 |
Chambers Street Properties (f) | 687,393 | | 5,561,009 |
Chartwell Retirement Residence | 459,700 | | 4,372,767 |
Chartwell Retirement Residence (h) | 78,500 | | 746,709 |
Chesapeake Lodging Trust | 513,600 | | 11,766,576 |
CYS Investments, Inc. (f) | 2,004,739 | | 16,639,334 |
DCT Industrial Trust, Inc. | 1,235,100 | | 9,275,601 |
DiamondRock Hospitality Co. | 623,300 | | 6,046,010 |
Douglas Emmett, Inc. | 846,300 | | 21,165,963 |
DuPont Fabros Technology, Inc. | 316,600 | | 7,253,306 |
Common Stocks - continued |
| Shares | | Value |
FINANCIALS - continued |
Real Estate Investment Trusts - continued |
Dynex Capital, Inc. | 1,893,043 | | $ 18,192,143 |
EastGroup Properties, Inc. | 209,900 | | 12,984,414 |
Education Realty Trust, Inc. | 402,600 | | 3,796,518 |
Ellington Residential Mortgage REIT (f) | 230,000 | | 3,569,600 |
Equity Lifestyle Properties, Inc. | 2,264,560 | | 87,162,914 |
Equity Residential (SBI) | 491,300 | | 27,512,800 |
Excel Trust, Inc. | 1,333,928 | | 17,314,385 |
Extra Space Storage, Inc. | 100,300 | | 4,217,615 |
First Potomac Realty Trust | 1,349,015 | | 18,306,134 |
Glimcher Realty Trust | 1,192,200 | | 13,400,328 |
H&R REIT/H&R Finance Trust | 284,100 | | 5,977,413 |
Hatteras Financial Corp. | 438,000 | | 8,799,420 |
HCP, Inc. | 199,000 | | 8,730,130 |
Highwoods Properties, Inc. (SBI) | 245,000 | | 8,888,600 |
Lexington Corporate Properties Trust | 3,246,382 | | 40,709,630 |
LTC Properties, Inc. | 499,513 | | 19,316,168 |
MFA Financial, Inc. | 12,948,193 | | 103,326,569 |
Mid-America Apartment Communities, Inc. (f) | 525,200 | | 35,477,260 |
Monmouth Real Estate Investment Corp. Class A | 249,773 | | 2,442,780 |
National Retail Properties, Inc. | 173,700 | | 6,077,763 |
New Residential Investment Corp. | 923,600 | | 6,123,468 |
Newcastle Investment Corp. | 2,964,200 | | 17,192,360 |
NorthStar Realty Finance Corp. (f) | 2,867,700 | | 28,103,460 |
Parkway Properties, Inc. | 135,008 | | 2,362,640 |
Piedmont Office Realty Trust, Inc. Class A | 949,200 | | 17,171,028 |
Prologis, Inc. | 819,387 | | 31,431,685 |
RAIT Financial Trust | 150,000 | | 1,134,000 |
Rayonier, Inc. | 259,800 | | 15,182,712 |
Redwood Trust, Inc. | 330,000 | | 5,590,200 |
Retail Properties America, Inc. | 897,650 | | 12,647,889 |
Select Income (REIT) | 416,600 | | 11,239,868 |
Senior Housing Properties Trust (SBI) | 911,300 | | 22,919,195 |
Simon Property Group, Inc. | 146,800 | | 23,496,808 |
Stag Industrial, Inc. | 848,669 | | 17,592,908 |
Summit Hotel Properties, Inc. | 692,000 | | 7,003,040 |
Terreno Realty Corp. | 1,204,564 | | 22,091,704 |
Two Harbors Investment Corp. | 1,560,480 | | 15,651,614 |
Ventas, Inc. | 966,746 | | 63,553,882 |
Washington (REIT) (SBI) | 471,900 | | 12,684,672 |
Weyerhaeuser Co. | 323,400 | | 9,184,560 |
Common Stocks - continued |
| Shares | | Value |
FINANCIALS - continued |
Real Estate Investment Trusts - continued |
Whitestone REIT Class B (f) | 183,267 | | $ 2,965,260 |
WP Carey, Inc. (f) | 161,500 | | 11,405,130 |
| | 1,232,160,922 |
Real Estate Management & Development - 0.6% |
Brookfield Asset Management, Inc. Class A | 267,600 | | 9,903,102 |
Howard Hughes Corp. (a) | 26,500 | | 2,894,065 |
Kennedy-Wilson Holdings, Inc. | 664,021 | | 11,354,759 |
| | 24,151,926 |
Thrifts & Mortgage Finance - 0.2% |
Home Loan Servicing Solutions Ltd. | 388,800 | | 9,731,664 |
TOTAL FINANCIALS | | 1,277,847,552 |
HEALTH CARE - 1.1% |
Health Care Providers & Services - 1.1% |
Brookdale Senior Living, Inc. (a) | 1,081,000 | | 31,478,720 |
Emeritus Corp. (a) | 562,574 | | 13,046,091 |
| | 44,524,811 |
TOTAL COMMON STOCKS (Cost $1,192,449,014) |
1,348,923,038
|
Preferred Stocks - 13.9% |
| | | |
Convertible Preferred Stocks - 1.1% |
FINANCIALS - 1.1% |
Real Estate Investment Trusts - 1.1% |
Alexandria Real Estate Equities, Inc. Series D 7.00% | 95,000 | | 2,410,625 |
CommonWealth REIT 6.50% | 396,216 | | 9,041,649 |
Excel Trust, Inc. 7.00% (h) | 248,200 | | 6,170,252 |
Health Care REIT, Inc. Series I, 6.50% | 46,800 | | 2,808,000 |
Lexington Corporate Properties Trust Series C, 6.50% | 388,432 | | 18,838,952 |
Ramco-Gershenson Properties Trust (SBI) Series D, 7.25% | 40,000 | | 2,327,600 |
Weyerhaeuser Co. Series A, 6.375% (a) | 20,000 | | 1,039,400 |
| | 42,636,478 |
Preferred Stocks - continued |
| Shares | | Value |
Nonconvertible Preferred Stocks - 12.8% |
CONSUMER DISCRETIONARY - 0.1% |
Hotels, Restaurants & Leisure - 0.1% |
Red Lion Hotels Capital Trust 9.50% | 162,925 | | $ 4,218,128 |
FINANCIALS - 12.7% |
Capital Markets - 0.1% |
Arlington Asset Investment Corp. 6.625% | 182,517 | | 4,290,975 |
Real Estate Investment Trusts - 12.1% |
AG Mortgage Investment Trust, Inc. 8.00% | 324,817 | | 7,675,426 |
American Capital Agency Corp. 8.00% | 200,000 | | 5,070,000 |
American Home Mortgage Investment Corp.: | | | |
Series A, 9.375% (a) | 120,300 | | 12 |
Series B, 9.25% (a) | 124,100 | | 12 |
Annaly Capital Management, Inc.: | | | |
Series A, 7.875% | 134,900 | | 3,403,527 |
Series C, 7.625% | 77,837 | | 1,931,136 |
Series D, 7.50% | 213,116 | | 5,157,407 |
Anworth Mortgage Asset Corp. Series A, 8.625% | 309,630 | | 7,802,676 |
Apollo Commercial Real Estate Finance, Inc. Series A, 8.625% | 375,101 | | 9,692,610 |
Apollo Residential Mortgage, Inc. Series A, 8.00% | 279,276 | | 6,702,624 |
Arbor Realty Trust, Inc.: | | | |
Series A, 8.25% (g) | 189,089 | | 4,748,025 |
Series B, 7.75% (a)(g) | 240,000 | | 5,901,600 |
Armour Residential REIT, Inc. Series B, 7.875% | 153,654 | | 3,595,504 |
Ashford Hospitality Trust, Inc.: | | | |
Series D, 8.45% | 27,000 | | 679,050 |
Series E, 9.00% | 85,751 | | 2,263,826 |
Boston Properties, Inc. 5.25% | 50,000 | | 1,217,500 |
Campus Crest Communities, Inc. Series A, 8.00% | 248,431 | | 6,501,439 |
CapLease, Inc.: | | | |
Series A, 8.125% | 70,306 | | 1,766,087 |
Series B, 8.375% | 439,766 | | 11,082,103 |
Series C, 7.25% | 210,000 | | 5,315,100 |
Capstead Mortgage Corp. Series E, 7.50% | 202,984 | | 4,851,318 |
CBL & Associates Properties, Inc.: | | | |
7.375% | 289,876 | | 7,272,989 |
Series E, 6.625% | 95,000 | | 2,310,400 |
Cedar Shopping Centers, Inc. Series B, 7.25% | 326,128 | | 8,185,813 |
CenterPoint Properties Trust Series D, 5.377% | 3,575 | | 2,288,000 |
Chesapeake Lodging Trust Series A, 7.75% | 266,916 | | 6,776,997 |
Colony Financial, Inc. Series A, 8.50% | 282,171 | | 7,333,624 |
CommonWealth REIT 7.50% | 93,300 | | 1,949,037 |
Preferred Stocks - continued |
| Shares | | Value |
Nonconvertible Preferred Stocks - continued |
FINANCIALS - continued |
Real Estate Investment Trusts - continued |
Coresite Realty Corp. Series A, 7.25% | 258,224 | | $ 6,473,676 |
Corporate Office Properties Trust Series L, 7.375% | 80,000 | | 2,099,200 |
CubeSmart Series A, 7.75% | 40,000 | | 1,056,000 |
CYS Investments, Inc.: | | | |
Series A, 7.75% | 117,824 | | 2,733,517 |
Series B, 7.50% (a) | 311,567 | | 7,075,687 |
DDR Corp.: | | | |
Series J, 6.50% | 237,721 | | 5,702,927 |
Series K, 6.25% | 228,888 | | 5,481,868 |
Digital Realty Trust, Inc.: | | | |
Series E, 7.00% | 40,000 | | 1,000,000 |
Series G, 5.875% | 145,444 | | 3,141,590 |
Duke Realty LP Series L, 6.60% | 10,666 | | 266,543 |
Dynex Capital, Inc.: | | | |
Series A, 8.50% | 362,932 | | 9,109,593 |
Series B, 7.625% | 252,120 | | 5,889,523 |
Equity Lifestyle Properties, Inc. Series C, 6.75% | 924,148 | | 23,288,530 |
Essex Property Trust, Inc. Series H, 7.125% | 40,000 | | 1,032,000 |
Excel Trust, Inc. Series B, 8.125% | 400,000 | | 10,272,000 |
First Potomac Realty Trust 7.75% | 415,296 | | 10,847,532 |
General Growth Properties, Inc. Series A, 6.375% | 40,986 | | 940,219 |
Gladstone Commercial Corp. Series C, 7.125% | 232,238 | | 6,003,352 |
Glimcher Realty Trust: | | | |
6.875% | 256,115 | | 6,282,501 |
Series G, 8.125% | 109,192 | | 2,765,833 |
Series H, 7.50% | 198,527 | | 5,058,468 |
Hatteras Financial Corp. Series A, 7.625% | 197,288 | | 4,728,993 |
Health Care REIT, Inc. Series J, 6.50% | 20,000 | | 506,000 |
Hersha Hospitality Trust: | | | |
Series B, 8.00% | 162,538 | | 4,185,354 |
Series C, 6.875% | 50,000 | | 1,205,000 |
Hospitality Properties Trust Series D, 7.125% | 40,800 | | 1,041,216 |
Hudson Pacific Properties, Inc. 8.375% | 394,069 | | 10,328,548 |
Inland Real Estate Corp. Series A, 8.125% | 423,500 | | 10,867,010 |
Invesco Mortgage Capital, Inc. Series A, 7.75% | 113,342 | | 2,707,740 |
Investors Real Estate Trust Series B, 7.95% | 126,572 | | 3,278,215 |
iStar Financial, Inc.: | | | |
Series E, 7.875% | 156,008 | | 3,747,312 |
Series F, 7.80% | 279,421 | | 6,669,779 |
Preferred Stocks - continued |
| Shares | | Value |
Nonconvertible Preferred Stocks - continued |
FINANCIALS - continued |
Real Estate Investment Trusts - continued |
Kilroy Realty Corp. Series G, 6.875% | 40,000 | | $ 979,600 |
Kite Realty Group Trust 8.25% | 96,100 | | 2,504,366 |
LaSalle Hotel Properties: | | | |
Series G, 7.25% | 42,026 | | 1,050,230 |
Series H, 7.50% | 126,308 | | 3,190,540 |
Series I, 6.375% | 192,698 | | 4,470,594 |
LBA Realty Fund II: | | | |
Series A, 8.75% (a) | 69,000 | | 2,742,750 |
Series B, 7.625% | 31,240 | | 609,180 |
MFA Financial, Inc.: | | | |
8.00% | 538,930 | | 13,672,654 |
Series B, 7.50% (a) | 567,024 | | 13,466,820 |
Monmouth Real Estate Investment Corp.: | | | |
7.625% | 80,000 | | 2,063,200 |
Series B, 7.875% | 95,000 | | 2,464,300 |
National Retail Properties, Inc.: | | | |
5.70% (a) | 82,104 | | 1,823,530 |
Series D, 6.625% | 62,437 | | 1,561,549 |
New York Mortgage Trust, Inc. Series B, 7.75% | 123,101 | | 2,891,642 |
Newcastle Investment Corp. Series B, 9.75% | 14,660 | | 384,092 |
NorthStar Realty Finance Corp.: | | | |
Series B, 8.25% | 225,708 | | 5,631,415 |
Series C, 8.875% | 275,338 | | 7,007,352 |
Series D, 8.50% | 161,601 | | 4,085,273 |
Pebblebrook Hotel Trust: | | | |
Series A, 7.875% | 372,000 | | 9,486,000 |
Series B, 8.00% | 185,085 | | 4,784,447 |
Series C, 6.50% | 178,160 | | 4,184,978 |
Pennsylvania (REIT) 7.375% | 76,510 | | 1,917,341 |
Prologis, Inc. Series Q, 8.54% | 94,446 | | 5,772,540 |
PS Business Parks, Inc. 6.875% | 50,000 | | 1,257,000 |
Regency Centers Corp. Series 6, 6.625% | 62,261 | | 1,557,148 |
Retail Properties America, Inc. 7.00% | 194,782 | | 4,733,203 |
Sabra Health Care REIT, Inc. Series A, 7.125% | 200,000 | | 5,090,000 |
Saul Centers, Inc.: | | | |
8.00% | 38,072 | | 967,410 |
Series C, 6.875% | 315,478 | | 7,950,046 |
Stag Industrial, Inc.: | | | |
Series A, 9.00% | 280,000 | | 7,560,000 |
Preferred Stocks - continued |
| Shares | | Value |
Nonconvertible Preferred Stocks - continued |
FINANCIALS - continued |
Real Estate Investment Trusts - continued |
Stag Industrial, Inc.: - continued | | | |
Series B, 6.625% | 80,000 | | $ 1,837,600 |
Strategic Hotel & Resorts, Inc.: | | | |
Series A, 8.50% | 92,323 | | 2,215,752 |
Series B, 8.25% | 80,000 | | 1,912,000 |
Summit Hotel Properties, Inc.: | | | |
Series A, 9.25% | 138,340 | | 3,701,978 |
Series B, 7.875% | 190,173 | | 4,839,903 |
Series C, 7.125% | 153,212 | | 3,733,776 |
Sun Communities, Inc. Series A, 7.125% | 360,000 | | 9,072,000 |
Sunstone Hotel Investors, Inc. Series D, 8.00% | 60,362 | | 1,549,493 |
Taubman Centers, Inc. Series K, 6.25% | 96,120 | | 2,278,044 |
Terreno Realty Corp. Series A, 7.75% | 213,690 | | 5,523,887 |
UMH Properties, Inc. Series A, 8.25% | 600,000 | | 15,768,000 |
Urstadt Biddle Properties, Inc. Series F, 7.125% | 210,000 | | 5,363,400 |
Vornado Realty LP 7.875% | 54,682 | | 1,452,354 |
Weingarten Realty Investors (SBI) Series F, 6.50% | 49,813 | | 1,256,284 |
Winthrop Realty Trust: | | | |
7.75% | 540,000 | | 13,797,000 |
Series D, 9.25% | 65,000 | | 1,756,300 |
| | 499,176,539 |
Real Estate Management & Development - 0.5% |
Forest City Enterprises, Inc. 7.375% | 657,000 | | 16,425,000 |
Kennedy-Wilson, Inc. 7.75% | 141,574 | | 3,569,081 |
| | 19,994,081 |
TOTAL FINANCIALS | | 523,461,595 |
TOTAL NONCONVERTIBLE PREFERRED STOCKS | | 527,679,723 |
TOTAL PREFERRED STOCKS (Cost $567,835,343) |
570,316,201
|
Corporate Bonds - 19.9% |
| Principal Amount (e) | | Value |
Convertible Bonds - 2.7% |
CONSUMER DISCRETIONARY - 0.1% |
Hotels, Restaurants & Leisure - 0.1% |
Morgans Hotel Group Co. 2.375% 10/15/14 | | $ 4,510,000 | | $ 4,425,438 |
Household Durables - 0.0% |
M/I Homes, Inc. 3% 3/1/18 | | 1,790,000 | | 1,806,289 |
TOTAL CONSUMER DISCRETIONARY | | 6,231,727 |
FINANCIALS - 2.6% |
Diversified Financial Services - 0.4% |
IAS Operating Partnership LP 5% 3/15/18 (h) | | 15,490,000 | | 14,289,525 |
Real Estate Investment Trusts - 2.2% |
Annaly Capital Management, Inc. 5% 5/15/15 | | 34,396,000 | | 34,804,453 |
Ares Commercial Real Estate Corp. 7% 12/15/15 (h) | | 14,700,000 | | 14,323,313 |
CapLease, Inc. 7.5% 10/1/27 (h) | | 5,180,000 | | 5,180,000 |
Colony Financial, Inc. 5% 4/15/23 | | 9,000,000 | | 9,190,800 |
Northstar Realty Finance LP 5.375% 6/15/33 (h) | | 2,000,000 | | 2,108,000 |
Pennymac Corp. 5.375% 5/1/20 (h) | | 4,000,000 | | 3,795,000 |
Redwood Trust, Inc. 4.625% 4/15/18 | | 8,500,000 | | 8,436,250 |
Starwood Property Trust, Inc.: | | | | |
4% 1/15/19 | | 3,000,000 | | 3,163,125 |
4.55% 3/1/18 | | 9,000,000 | | 9,485,100 |
| | 90,486,041 |
Real Estate Management & Development - 0.0% |
Forest City Enterprises, Inc. 3.625% 8/15/20 (h) | | 1,000,000 | | 981,875 |
Grubb & Ellis Co. 7.95% 5/1/15 (d)(h) | | 5,500,000 | | 11,000 |
| | 992,875 |
TOTAL FINANCIALS | | 105,768,441 |
TOTAL CONVERTIBLE BONDS | | 112,000,168 |
Nonconvertible Bonds - 17.2% |
CONSUMER DISCRETIONARY - 5.7% |
Hotels, Restaurants & Leisure - 0.6% |
CityCenter Holdings LLC/CityCenter Finance Corp. 7.625% 1/15/16 | | 3,505,000 | | 3,715,300 |
FelCor Lodging LP: | | | | |
5.625% 3/1/23 | | 2,000,000 | | 1,950,000 |
Corporate Bonds - continued |
| Principal Amount (e) | | Value |
Nonconvertible Bonds - continued |
CONSUMER DISCRETIONARY - continued |
Hotels, Restaurants & Leisure - continued |
FelCor Lodging LP: - continued | | | | |
6.75% 6/1/19 | | $ 5,875,000 | | $ 6,198,125 |
RHP Hotel Properties LP/RHP Finance Co. 5% 4/15/21 (h) | | 2,000,000 | | 1,960,000 |
Times Square Hotel Trust 8.528% 8/1/26 (h) | | 8,707,232 | | 11,165,196 |
| | 24,988,621 |
Household Durables - 5.1% |
Ashton Woods USA LLC/Ashton Woods Finance Co. 6.875% 2/15/21 (h) | | 10,000,000 | | 10,175,000 |
Brookfield Residential Properties, Inc./Brookfield Residential U.S. Corp. 6.125% 7/1/22 (h) | | 1,000,000 | | 1,022,500 |
Brookfield Residential Properties, Inc. 6.5% 12/15/20 (h) | | 1,615,000 | | 1,691,713 |
D.R. Horton, Inc.: | | | | |
4.75% 5/15/17 | | 2,000,000 | | 2,080,000 |
5.75% 8/15/23 | | 2,510,000 | | 2,510,000 |
KB Home: | | | | |
5.875% 1/15/15 | | 7,000,000 | | 7,280,000 |
7.25% 6/15/18 | | 7,420,000 | | 8,106,350 |
8% 3/15/20 | | 8,465,000 | | 9,438,475 |
9.1% 9/15/17 | | 17,595,000 | | 20,146,275 |
Lennar Corp.: | | | | |
4.125% 12/1/18 (h) | | 5,520,000 | | 5,326,800 |
5.6% 5/31/15 | | 6,000,000 | | 6,358,200 |
6.5% 4/15/16 | | 4,000,000 | | 4,310,000 |
6.95% 6/1/18 | | 14,280,000 | | 15,708,000 |
M/I Homes, Inc. 8.625% 11/15/18 | | 26,055,000 | | 28,399,950 |
Meritage Homes Corp.: | | | | |
7% 4/1/22 | | 7,525,000 | | 8,202,250 |
7.15% 4/15/20 | | 7,060,000 | | 7,766,000 |
Ryland Group, Inc.: | | | | |
6.625% 5/1/20 | | 1,555,000 | | 1,644,413 |
8.4% 5/15/17 | | 5,420,000 | | 6,287,200 |
Standard Pacific Corp.: | | | | |
7% 8/15/15 | | 4,000,000 | | 4,330,000 |
8.375% 5/15/18 | | 28,983,000 | | 33,547,823 |
10.75% 9/15/16 | | 8,415,000 | | 10,129,556 |
Corporate Bonds - continued |
| Principal Amount (e) | | Value |
Nonconvertible Bonds - continued |
CONSUMER DISCRETIONARY - continued |
Household Durables - continued |
Toll Brothers Finance Corp. 5.875% 2/15/22 | | $ 1,550,000 | | $ 1,619,750 |
William Lyon Homes, Inc. 8.5% 11/15/20 | | 13,595,000 | | 14,886,525 |
| | 210,966,780 |
TOTAL CONSUMER DISCRETIONARY | | 235,955,401 |
CONSUMER STAPLES - 0.0% |
Food & Staples Retailing - 0.0% |
Ahold Lease Series 2001 A1 pass thru trust certificates 7.82% 1/2/20 | | 907,635 | | 1,030,165 |
FINANCIALS - 10.2% |
Diversified Financial Services - 0.6% |
Cantor Commercial Real Estate Co. LP/CCRE Finance Corp. 7.75% 2/15/18 (h) | | 4,755,000 | | 4,873,875 |
Icahn Enterprises LP/Icahn Enterprises Finance Corp.: | | | | |
6% 8/1/20 (h) | | 3,000,000 | | 3,003,750 |
7.75% 1/15/16 | | 10,820,000 | | 11,239,275 |
8% 1/15/18 | | 5,240,000 | | 5,534,750 |
| | 24,651,650 |
Real Estate Investment Trusts - 6.7% |
Camden Property Trust 5% 6/15/15 | | 1,100,000 | | 1,177,473 |
Commercial Net Lease Realty, Inc.: | | | | |
6.15% 12/15/15 | | 2,526,000 | | 2,802,857 |
6.25% 6/15/14 | | 8,355,000 | | 8,721,676 |
CubeSmart LP 4.8% 7/15/22 | | 2,000,000 | | 2,092,340 |
Developers Diversified Realty Corp.: | | | | |
5.5% 5/1/15 | | 4,000,000 | | 4,279,748 |
7.5% 4/1/17 | | 6,000,000 | | 7,034,316 |
7.5% 7/15/18 | | 8,756,000 | | 10,495,432 |
7.875% 9/1/20 | | 4,637,000 | | 5,723,876 |
9.625% 3/15/16 | | 3,836,000 | | 4,588,017 |
Equity One, Inc.: | | | | |
5.375% 10/15/15 | | 3,500,000 | | 3,798,533 |
6.25% 1/15/17 | | 3,000,000 | | 3,349,932 |
Equity Residential 5.125% 3/15/16 | | 7,201,000 | | 7,926,717 |
Health Care Property Investors, Inc.: | | | | |
5.625% 5/1/17 | | 2,980,000 | | 3,340,714 |
6% 6/15/14 | | 2,340,000 | | 2,439,768 |
Corporate Bonds - continued |
| Principal Amount (e) | | Value |
Nonconvertible Bonds - continued |
FINANCIALS - continued |
Real Estate Investment Trusts - continued |
Health Care Property Investors, Inc.: - continued | | | | |
6% 3/1/15 | | $ 1,000,000 | | $ 1,073,503 |
6% 1/30/17 | | 2,383,000 | | 2,691,134 |
7.072% 6/8/15 | | 1,500,000 | | 1,658,097 |
Health Care REIT, Inc.: | | | | |
3.625% 3/15/16 | | 7,685,000 | | 8,092,858 |
4.125% 4/1/19 | | 2,000,000 | | 2,114,364 |
6% 11/15/13 | | 1,000,000 | | 1,014,204 |
6.2% 6/1/16 | | 2,750,000 | | 3,094,146 |
Healthcare Realty Trust, Inc.: | | | | |
3.75% 4/15/23 | | 4,022,000 | | 3,807,491 |
5.75% 1/15/21 | | 3,095,000 | | 3,392,275 |
6.5% 1/17/17 | | 2,875,000 | | 3,239,464 |
Highwoods/Forsyth LP: | | | | |
3.625% 1/15/23 | | 1,607,000 | | 1,507,782 |
5.85% 3/15/17 | | 2,800,000 | | 3,087,101 |
Hospitality Properties Trust: | | | | |
5% 8/15/22 | | 3,177,000 | | 3,213,914 |
5.625% 3/15/17 | | 915,000 | | 995,560 |
7.875% 8/15/14 | | 1,000,000 | | 1,034,937 |
HRPT Properties Trust: | | | | |
5.75% 11/1/15 | | 4,826,000 | | 5,043,720 |
6.25% 8/15/16 | | 9,675,000 | | 10,290,775 |
6.25% 6/15/17 | | 1,055,000 | | 1,115,920 |
6.65% 1/15/18 | | 4,246,000 | | 4,551,606 |
iStar Financial, Inc.: | | | | |
3.875% 7/1/16 | | 2,855,000 | | 2,826,450 |
5.85% 3/15/17 | | 3,587,000 | | 3,694,610 |
5.875% 3/15/16 | | 34,260,000 | | 35,801,700 |
6.05% 4/15/15 | | 14,630,000 | | 15,215,200 |
7.125% 2/15/18 | | 5,725,000 | | 6,125,750 |
9% 6/1/17 | | 9,175,000 | | 10,367,750 |
MPT Operating Partnership LP/MPT Finance Corp.: | | | | |
6.375% 2/15/22 | | 3,610,000 | | 3,799,525 |
6.875% 5/1/21 | | 2,000,000 | | 2,135,000 |
National Retail Properties, Inc. 3.3% 4/15/23 | | 2,000,000 | | 1,852,958 |
Nationwide Health Properties, Inc. 6% 5/20/15 | | 5,670,000 | | 6,176,019 |
Omega Healthcare Investors, Inc.: | | | | |
6.75% 10/15/22 | | 2,115,000 | | 2,294,775 |
Corporate Bonds - continued |
| Principal Amount (e) | | Value |
Nonconvertible Bonds - continued |
FINANCIALS - continued |
Real Estate Investment Trusts - continued |
Omega Healthcare Investors, Inc.: - continued | | | | |
7.5% 2/15/20 | | $ 1,000,000 | | $ 1,095,000 |
Pan Pacific Retail Properties, Inc. 5.95% 6/1/14 | | 1,750,000 | | 1,822,919 |
Potlatch Corp. 7.5% 11/1/19 | | 1,000,000 | | 1,150,000 |
ProLogis LP: | | | | |
6.625% 5/15/18 | | 6,480,000 | | 7,555,162 |
7.625% 7/1/17 | | 4,690,000 | | 5,373,446 |
Reckson Operating Partnership LP/SL Green Realty Corp./SL Green Operating Partnership LP 7.75% 3/15/20 | | 2,000,000 | | 2,368,846 |
Senior Housing Properties Trust: | | | | |
4.3% 1/15/16 | | 5,000,000 | | 5,202,760 |
6.75% 4/15/20 | | 13,624,000 | | 15,113,893 |
6.75% 12/15/21 | | 8,000,000 | | 8,882,688 |
United Dominion Realty Trust, Inc.: | | | | |
5.13% 1/15/14 | | 2,520,000 | | 2,567,462 |
5.25% 1/15/15 | | 1,000,000 | | 1,055,403 |
5.25% 1/15/16 | | 4,000,000 | | 4,329,236 |
| | 275,596,802 |
Real Estate Management & Development - 2.8% |
AMB Property LP 5.9% 8/15/13 | | 400,000 | | 400,547 |
BioMed Realty LP 3.85% 4/15/16 | | 2,000,000 | | 2,105,004 |
Brandywine Operating Partnership LP: | | | | |
5.4% 11/1/14 | | 6,750,000 | | 7,096,356 |
7.5% 5/15/15 | | 1,000,000 | | 1,105,530 |
CB Richard Ellis Services, Inc.: | | | | |
5% 3/15/23 | | 6,020,000 | | 5,779,200 |
6.625% 10/15/20 | | 1,205,000 | | 1,284,831 |
Colonial Properties Trust 6.25% 6/15/14 | | 3,094,000 | | 3,233,901 |
Colonial Realty LP 6.05% 9/1/16 | | 2,500,000 | | 2,800,762 |
Corporate Office Properties LP 3.6% 5/15/23 (h) | | 5,000,000 | | 4,634,915 |
ERP Operating LP 5.25% 9/15/14 | | 4,815,000 | | 5,053,554 |
Forest City Enterprises, Inc. 6.5% 2/1/17 | | 17,420,000 | | 17,458,324 |
Host Hotels & Resorts LP 5.25% 3/15/22 | | 2,000,000 | | 2,083,290 |
Kennedy-Wilson, Inc. 8.75% 4/1/19 | | 20,410,000 | | 22,144,850 |
Realogy Corp.: | | | | |
7.875% 2/15/19 (h) | | 7,085,000 | | 7,687,225 |
9% 1/15/20 (h) | | 1,920,000 | | 2,198,400 |
Corporate Bonds - continued |
| Principal Amount (e) | | Value |
Nonconvertible Bonds - continued |
FINANCIALS - continued |
Real Estate Management & Development - continued |
Regency Centers LP: | | | | |
5.25% 8/1/15 | | $ 4,509,000 | | $ 4,851,756 |
5.875% 6/15/17 | | 400,000 | | 446,543 |
Toys 'R' Us Property Co. I LLC 10.75% 7/15/17 | | 2,490,000 | | 2,633,200 |
Ventas Realty LP/Ventas Capital Corp.: | | | | |
2.7% 4/1/20 | | 3,000,000 | | 2,849,517 |
3.125% 11/30/15 | | 13,807,000 | | 14,473,740 |
4% 4/30/19 | | 2,262,000 | | 2,371,949 |
Wells Operating Partnership II LP 5.875% 4/1/18 | | 3,000,000 | | 3,153,165 |
| | 115,846,559 |
Thrifts & Mortgage Finance - 0.1% |
Wrightwood Capital LLC 1.9% 4/20/20 (d) | | 3,781,040 | | 3,157,168 |
TOTAL FINANCIALS | | 419,252,179 |
HEALTH CARE - 0.9% |
Health Care Equipment & Supplies - 0.3% |
Aviv Healthcare Properties LP/Aviv Healthcare Capital Corp. 7.75% 2/15/19 | | 10,410,000 | | 11,190,750 |
Health Care Providers & Services - 0.6% |
Sabra Health Care LP/Sabra Capital Corp.: | | | | |
5.375% 6/1/23 | | 2,795,000 | | 2,725,125 |
8.125% 11/1/18 | | 21,426,000 | | 23,032,950 |
| | 25,758,075 |
TOTAL HEALTH CARE | | 36,948,825 |
INDUSTRIALS - 0.2% |
Commercial Services & Supplies - 0.1% |
Iron Mountain, Inc. 5.75% 8/15/24 | | 4,235,000 | | 4,002,075 |
Industrial Conglomerates - 0.1% |
Ladder Capital Finance Holdings LLLP/Ladder Capital Finance Corp. 7.375% 10/1/17 (h) | | 3,050,000 | | 3,149,125 |
TOTAL INDUSTRIALS | | 7,151,200 |
Corporate Bonds - continued |
| Principal Amount (e) | | Value |
Nonconvertible Bonds - continued |
INFORMATION TECHNOLOGY - 0.1% |
Internet Software & Services - 0.1% |
CyrusOne LP/CyrusOne Finance Corp. 6.375% 11/15/22 | | $ 3,000,000 | | $ 3,150,000 |
TELECOMMUNICATION SERVICES - 0.1% |
Wireless Telecommunication Services - 0.1% |
Crown Castle International Corp. 5.25% 1/15/23 | | 4,000,000 | | 3,850,000 |
TOTAL NONCONVERTIBLE BONDS | | 707,337,770 |
TOTAL CORPORATE BONDS (Cost $772,590,551) |
819,337,938
|
Asset-Backed Securities - 3.1% |
|
Anthracite CDO III Ltd./Anthracite CDO III Corp. Series 2004-1A Class A, 0.551% 3/23/19 (h)(i) | | 157,192 | | 154,442 |
Capital Trust RE CDO Ltd. Series 2005-1A Class D, 1.6915% 3/20/50 (h)(i) | | 2,250,000 | | 104,625 |
Capital Trust RE CDO Ltd./Capital Trust RE CDO Corp. Series 2005-3A Class A2, 5.16% 6/25/35 (h) | | 903,043 | | 898,528 |
CapitalSource Real Estate Loan Trust Series 2006-1A Class A2A, 0.5186% 1/20/37 (h)(i) | | 634,553 | | 599,653 |
CapLease CDO Ltd. Series 2005-1A Class A, 4.926% 1/29/40 (h) | | 1,069,411 | | 1,058,717 |
CBRE Realty Finance CDO LLC Series 2007-1A Class A1, 0.5209% 4/7/52 (h)(i) | | 4,042,150 | | 3,840,042 |
Conseco Finance Securitizations Corp. Series 2002-2 Class M2, 9.163% 3/1/33 (i) | | 500,000 | | 439,412 |
Crest Clarendon Street Ltd./Crest Clarendon Corp. Series 2002-1A Class D, 9% 12/28/35 (h) | | 536,066 | | 361,738 |
Crest Dartmouth Street Ltd./Crest Dartmouth Street Corp. Series 2003-1A Class D, 9% 6/28/38 (h) | | 1,064,351 | | 798,264 |
Deutsche Financial Capital Securitization LLC Series 1997-I Class M, 7.275% 9/15/27 | | 9,500,000 | | 9,081,535 |
Fairfield Street Solar Corp. Series 2004-1A Class E1, 3.6378% 11/28/39 (h)(i) | | 587,788 | | 17,634 |
Green Tree Financial Corp.: | | | | |
Series 1996-4 Class M1, 7.75% 6/15/27 | | 1,788,179 | | 1,701,552 |
Series 1997-3 Class M1, 7.53% 3/15/28 | | 7,238,253 | | 5,989,821 |
Asset-Backed Securities - continued |
| Principal Amount (e) | | Value |
GSR Mortgage Loan Trust Series 2005-HE3 Class B3, 2.69% 6/25/35 (i)(k) | | $ 695,471 | | $ 30,822 |
Guggenheim Structured Real Estate Funding Ltd./Guggenheim Structured Real Estate Funding LLC Series 2005-2A: | | | | |
Class D, 1.74% 8/26/30 (h)(i) | | 735,000 | | 691,856 |
Class E, 2.19% 8/26/30 (h)(i) | | 1,517,957 | | 971,493 |
HLSS Servicer Advance Receivables Backed Notes Series 2013-T2 Class D2, 2.388% 5/16/44 (h) | | 3,000,000 | | 2,966,250 |
Lehman ABS Manufactured Housing Contract Trust Series 2001-B Class M2, 7.17% 4/15/40 | | 1,084,685 | | 530,826 |
Merit Securities Corp. Series 13 Class M1, 8.63% 12/28/33 (i) | | 1,923,000 | | 2,057,320 |
Mesa West Capital CDO Ltd.: | | | | |
Series 2007-1A Class A2, 0.48% 2/25/47 (h)(i) | | 20,390,000 | | 18,758,800 |
Series 2007-1A Class A1, 0.45% 2/25/47 (h)(i) | | 6,377,223 | | 6,122,134 |
N-Star Real Estate CDO Ltd. Series 1A Class C1B, 7.696% 8/28/38 (h) | | 899,989 | | 773,990 |
Newcastle Investment Trust Series 2011-MH1 Class A, 2.45% 12/10/33 (h) | | 2,119,870 | | 2,150,019 |
Prima Capital Ltd. Series 2006-CR1A Class A2, 5.533% 12/28/48 (h) | | 7,748,554 | | 7,903,526 |
Taberna Preferred Funding III Ltd. Series 2005-3A Class D, 2.9231% 2/5/36 (h)(i) | | 3,693,580 | | 369 |
Wachovia Ltd./Wachovia LLC: | | | | |
Series 2006-1 Class 1ML, 0.9993% 9/25/26 (h)(i) | | 2,000,000 | | 1,240,000 |
Series 2006-1A: | | | | |
Class A1A, 0.5328% 9/25/26 (h)(i) | | 7,955,179 | | 7,855,739 |
Class A1B, 0.6028% 9/25/26 (h)(i) | | 22,506,000 | | 20,705,520 |
Class A2B, 0.5828% 9/25/26 (h)(i) | | 1,212,270 | | 1,154,688 |
Class B, 0.6328% 9/25/26 (h)(i) | | 3,450,000 | | 3,268,875 |
Class C, 0.8028% 9/25/26 (h)(i) | | 7,030,000 | | 6,537,900 |
Class E, 1.0028% 9/25/26 (h)(i) | | 1,000,000 | | 895,000 |
Class F, 1.4228% 9/25/26 (h)(i) | | 3,483,000 | | 3,047,625 |
Class G, 1.6228% 9/25/26 (h)(i) | | 1,599,000 | | 1,395,128 |
Class H, 1.9228% 9/25/26 (h)(i) | | 1,535,000 | | 1,331,613 |
Class J, 3.0228% 9/25/26 (h)(i) | | 1,500,000 | | 1,303,200 |
Class K, 3.5228% 9/25/26 (h)(i) | | 2,475,000 | | 2,103,750 |
Class L, 4.2728% 9/25/26 (h)(i) | | 1,500,000 | | 1,290,000 |
Asset-Backed Securities - continued |
| Principal Amount (e) | | Value |
Wrightwood Capital Real Estate CDO Ltd. Series 2005-1A: | | | | |
Class A1, 0.5936% 11/21/40 (h)(i) | | $ 8,831,580 | | $ 8,213,370 |
Class F, 2.2236% 11/21/40 (h)(i) | | 250,000 | | 50,000 |
TOTAL ASSET-BACKED SECURITIES (Cost $127,734,548) |
128,395,776
|
Collateralized Mortgage Obligations - 0.4% |
|
Private Sponsor - 0.4% |
COMM pass-thru certificates Series 2007-FL14 Class AJ, 0.371% 6/15/22 (h)(i) | | 1,672,831 | | 1,661,618 |
Countrywide Home Loans, Inc.: | | | | |
Series 2002-38 Class B3, 5% 2/25/18 (h) | | 45,480 | | 15,449 |
Series 2002-R2 Class 2B3, 3.6535% 7/25/33 (h)(i) | | 195,218 | | 35,053 |
Series 2003-40 Class B3, 4.5% 10/25/18 (h) | | 37,258 | | 949 |
Series 2003-R3: | | | | |
Class B2, 5.5% 11/25/33 (h) | | 1,272,916 | | 250,515 |
Class B3, 5.5% 11/25/33 | | 52,966 | | 1,171 |
Series 2004-R1 Class 1B3, 5.5% 11/25/34 (h)(i) | | 94,445 | | 7,011 |
FREMF Mortgage Trust: | | | | |
Series 2010-K6 Class B, 5.5328% 12/25/46 (h)(i) | | 4,500,000 | | 4,717,818 |
Series 2010-K7 Class B, 5.6188% 4/25/20 (h)(i) | | 3,200,000 | | 3,367,498 |
Merrill Lynch Mortgage Investors Trust Series 1998-C3 Class F, 6% 12/15/30 (h) | | 5,783,417 | | 5,954,004 |
RESI Finance LP/RESI Finance DE Corp. floater: | | | | |
Series 2003-B Class B9, 12.1428% 7/10/35 (h)(i) | | 216,490 | | 226,264 |
Series 2005-A Class B6, 2.1928% 3/10/37 (h)(i) | | 664,645 | | 4,254 |
Residential Funding Securities Corp. Series 2002-RM1 Class BI1, 5.5% 12/25/17 (h) | | 24,251 | | 21,211 |
RESIX Finance Ltd. floater: | | | | |
Series 2003-D Class B8, 6.6928% 12/10/35 (h)(i) | | 219,521 | | 72,333 |
Series 2004-A Class B7, 4.4428% 2/10/36 (h)(i) | | 241,587 | | 108,601 |
Series 2004-B Class B7, 4.1928% 2/10/36 (h)(i) | | 290,032 | | 119,677 |
TOTAL PRIVATE SPONSOR | | 16,563,426 |
U.S. Government Agency - 0.0% |
Fannie Mae REMIC Trust: | | | | |
Series 2001-W3 subordinate REMIC pass thru certificates, Class B3, 7% 9/25/41 (k) | | 138,253 | | 65,777 |
Series 2002-W1 subordinate REMIC pass thru certificates, Class 3B3, 3.1861% 2/25/42 (h)(i) | | 94,047 | | 53,961 |
Collateralized Mortgage Obligations - continued |
| Principal Amount (e) | | Value |
U.S. Government Agency - continued |
Fannie Mae REMIC Trust: - continued | | | | |
Series 2003-W1 subordinate REMIC pass thru certificates, Class B3, 4.8488% 12/25/42 (i)(k) | | $ 209,985 | | $ 54,010 |
Series 2003-W10 subordinate REMIC pass thru certificates, Class 2B3, 3.1684% 6/25/43 (h)(i) | | 140,041 | | 57,747 |
Series 2003-W4 subordinate REMIC pass thru certificates, Class 2B3, 3.1779% 10/25/42 (h)(i) | | 61,299 | | 32,335 |
TOTAL U.S. GOVERNMENT AGENCY | | 263,830 |
TOTAL COLLATERALIZED MORTGAGE OBLIGATIONS (Cost $17,966,869) |
16,827,256
|
Commercial Mortgage Securities - 12.5% |
|
ACGS Series 2004-1 Class P, 7.4605% 8/1/19 (k) | | 3,234,240 | | 3,192,043 |
Americold LLC Trust Series 2010-ARTA Class D, 7.443% 1/14/29 (h) | | 2,000,000 | | 2,287,786 |
Banc of America Commercial Mortgage Trust: | | | | |
Series 2005-1 Class CJ, 5.4031% 11/10/42 (i) | | 3,580,000 | | 3,803,535 |
Series 2005-5 Class D, 5.4033% 10/10/45 (i) | | 4,000,000 | | 4,036,092 |
Series 2005-6 Class AJ, 5.3576% 9/10/47 (i) | | 5,000,000 | | 5,359,625 |
Banc of America Large Loan Trust floater Series 2010-HLTN Class HLTN, 2.491% 11/15/15 (h)(i) | | 52,636,093 | | 52,890,536 |
Banc of America Large Loan, Inc. floater Series 2005-MIB1 Class K, 2.191% 3/15/22 (h)(i) | | 760,684 | | 517,153 |
Banc of America REMIC Trust Series 2012-CLMZ Class A, 7.691% 8/15/17 (h)(i) | | 4,900,000 | | 5,096,000 |
Bear Stearns Commercial Mortgage Securities, Inc. Series 2006-PW11 Class AJ, 5.6112% 3/11/39 (i) | | 5,700,000 | | 5,921,936 |
Bear Stearns Commercial Mortgage Securities Trust Series 2006-T22 Class B, 5.7655% 4/12/38 (h)(i) | | 2,520,000 | | 2,696,637 |
COMM Mortgage Trust: | | | | |
sequential payer Series 2013-LC6 Class E, 3.5% 1/10/46 (h) | | 4,300,000 | | 2,971,283 |
Series 2012-CR5 Class D, 4.4794% 12/10/45 (h)(i) | | 2,000,000 | | 1,805,966 |
Series 2013-CR9 Class D, 4.403% 7/10/45 (h) | | 1,000,000 | | 787,813 |
COMM pass-thru certificates floater Series 2006-FL12: | | | | |
Class AJ, 0.321% 12/15/20 (h)(i) | | 2,583,778 | | 2,546,874 |
Class B, 0.361% 12/15/20 (h)(i) | | 2,625,202 | | 2,567,503 |
Commercial Mortgage Trust pass-thru certificates: | | | | |
Series 2005-C6 Class AJ, 5.209% 6/10/44 (i) | | 5,000,000 | | 5,238,340 |
Commercial Mortgage Securities - continued |
| Principal Amount (e) | | Value |
Commercial Mortgage Trust pass-thru certificates: - continued | | | | |
Series 2012-CR1: | | | | |
Class C, 5.5468% 5/15/45 (i) | | $ 1,000,000 | | $ 1,011,933 |
Class D, 5.5468% 5/15/45 (h)(i) | | 5,550,000 | | 5,073,133 |
Series 2012-CR2: | | | | |
Class D, 5.02% 8/15/45 (h)(i) | | 4,500,000 | | 4,255,686 |
Class E, 5.02% 8/15/45 (h)(i) | | 6,000,000 | | 5,287,152 |
Series 2012-LC4: | | | | |
Class C, 5.8238% 12/10/44 (i) | | 2,000,000 | | 2,067,198 |
Class D, 5.8238% 12/10/44 (h)(i) | | 8,000,000 | | 7,511,608 |
Credit Suisse First Boston Mortgage Securities Corp.: | | | | |
Series 1998-C1 Class F, 6% 5/17/40 (h) | | 1,855,830 | | 2,011,970 |
Series 1998-C2 Class F, 6.75% 11/15/30 (h) | | 3,000,000 | | 3,119,874 |
DBUBS Mortgage Trust Series 2011-LC1A Class E, 5.7284% 11/10/46 (h)(i) | | 12,490,000 | | 12,137,270 |
Deutsche Mortgage & Asset Receiving Corp. Series 1998-C1 Class J, 6.22% 6/15/31 | | 543,989 | | 543,624 |
DLJ Commercial Mortgage Corp. Series 1998-CG1 Class B4, 7.3882% 6/10/31 (h)(i) | | 216,298 | | 216,252 |
Extended Stay America Trust Series 2013-ESHM Class M, 7.625% 12/5/19 (h) | | 10,950,000 | | 11,184,607 |
Freddie Mac: | | | | |
pass-thru certificates: | | | | |
Series K011 Class X3, 2.6621% 12/25/43 (i)(j) | | 12,206,096 | | 1,828,693 |
Series K012 Class X3, 2.3659% 1/25/41 (i)(j) | | 21,072,886 | | 2,820,943 |
Series K013 Class X3, 2.8848% 1/25/43 (i)(j) | | 14,360,000 | | 2,358,257 |
Series KAIV Class X2, 3.6147% 6/25/46 (i)(j) | | 7,430,000 | | 1,578,865 |
G-Force LLC sequential payer Series 2005-RRA Class A2, 4.83% 8/22/36 (h) | | 3,294,724 | | 3,311,197 |
GMAC Commercial Mortgage Securities, Inc.: | | | | |
Series 1997-C2 Class G, 6.75% 4/15/29 (i) | | 870,077 | | 967,580 |
Series 1999-C3 Class J, 6.974% 8/15/36 (h) | | 1,500,000 | | 1,561,283 |
Series 2000-C1 Class K, 7% 3/15/33 | | 190,322 | | 140,399 |
GS Mortgage Securities Corp. II: | | | | |
floater Series 2007-EOP Class L, 5.4585% 3/6/20 (h)(i) | | 1,400,000 | | 1,398,697 |
Series 2010-C1: | | | | |
Class D, 6.1268% 8/10/43 (h)(i) | | 4,000,000 | | 4,023,956 |
Class E, 4% 8/10/43 (h) | | 3,770,000 | | 2,854,120 |
Series 2012-GCJ7: | | | | |
Class C, 5.9064% 5/10/45 (i) | | 6,500,000 | | 6,802,575 |
Class D, 5.9064% 5/10/45 (h)(i) | | 2,000,000 | | 1,882,940 |
Commercial Mortgage Securities - continued |
| Principal Amount (e) | | Value |
GS Mortgage Securities Corp. Trust Series 2011-ALF Class E, 4.953% 2/10/21 (h) | | $ 9,185,000 | | $ 9,210,718 |
GS Mortgage Securities Trust: | | | | |
Series 2010-C2 Class D, 5.4004% 12/10/43 (h)(i) | | 3,000,000 | | 2,856,888 |
Series 2011-GC5: | | | | |
Class C, 5.4744% 8/10/44 (h)(i) | | 9,000,000 | | 9,317,997 |
Class D, 5.4744% 8/10/44 (h)(i) | | 4,000,000 | | 3,744,660 |
Series 2012-GC6 Class C, 5.8263% 1/10/45 (h)(i) | | 3,600,000 | | 3,782,745 |
JP Morgan Chase Commercial Mortgage Securities Trust floater: | | | | |
Series 2013-JWMZ Class M, 6.191% 4/15/18 (h)(i) | | 2,225,379 | | 2,242,065 |
Series 2013-JWRZ Class E, 3.931% 4/15/30 (h)(i) | | 3,400,000 | | 3,385,373 |
JPMorgan Chase Commercial Mortgage Securities Corp.: | | | | |
Series 2001-A: | | | | |
Class G, 6% 10/15/32 (h)(i) | | 2,034,288 | | 36,685 |
Class X, 0.6365% 10/15/32 (h)(i)(j) | | 4,717,838 | | 29,956 |
Series 2002-C1 Class E, 6.135% 7/12/37 (h) | | 1,603,638 | | 1,605,251 |
Series 2003-C1 Class F, 6.1832% 1/12/37 (h)(i) | | 1,000,000 | | 1,000,000 |
Series 2009-IWST: | | | | |
Class C, 7.6935% 12/5/27 (h)(i) | | 3,000,000 | | 3,579,231 |
Class D, 7.6935% 12/5/27 (h)(i) | | 9,550,000 | | 10,777,022 |
Series 2010-CNTM Class MZ, 8.5% 8/5/20 (h) | | 9,000,000 | | 9,555,212 |
Series 2010-CNTR: | | | | |
Class D, 6.3899% 8/5/32 (h)(i) | | 4,500,000 | | 4,911,768 |
Class XB, 1.1366% 8/5/32 (h)(i)(j) | | 32,655,000 | | 1,504,759 |
Series 2012-CBX Class C, 5.3611% 6/16/45 (i) | | 4,530,000 | | 4,548,004 |
JPMorgan Chase Commercial Mortgage Securities Trust: | | | | |
Series 2005-LDP5 Class AJ, 5.4883% 12/15/44 (i) | | 3,470,000 | | 3,671,251 |
Series 2011-C5 Class C, 5.4915% 8/15/46 (h)(i) | | 6,525,375 | | 6,838,456 |
JPMorgan Chase Commercial Mortgage Trust Series 2013-LC11 Class D, 4.3844% 4/15/46 (i) | | 3,750,000 | | 3,031,806 |
JPMorgan Commercial Mortgage Finance Corp. Series 1999-C8: | | | | |
Class G, 6% 7/15/31 (h) | | 600,122 | | 601,704 |
Class H, 6% 7/15/31 (h) | | 1,424,589 | | 838,020 |
LB Commercial Conduit Mortgage Trust Series 1998-C4 Class G, 5.6% 10/15/35 (h) | | 990,263 | | 1,003,253 |
LB-UBS Commercial Mortgage Trust: | | | | |
sequential payer: | | | | |
Series 2004-C2 Class E, 4.487% 3/15/36 | | 2,060,000 | | 2,078,231 |
Series 2005-C3 Class AJ, 4.843% 7/15/40 | | 6,620,000 | | 6,982,564 |
Series 2005-C7 Class AJ, 5.323% 11/15/40 (i) | | 8,000,000 | | 8,492,008 |
Commercial Mortgage Securities - continued |
| Principal Amount (e) | | Value |
LB-UBS Commercial Mortgage Trust: - continued | | | | |
sequential payer: | | | | |
Series 2006-C7 Class AM, 5.378% 11/15/38 | | $ 2,040,000 | | $ 2,178,318 |
Series 2004-C7 Class E, 4.918% 10/15/36 | | 5,120,000 | | 5,265,638 |
Series 2005-C1 Class E, 4.924% 2/15/40 | | 4,000,000 | | 4,075,288 |
Series 2006-C4: | | | | |
Class AJ, 6.0813% 6/15/38 (i) | | 7,005,000 | | 7,229,854 |
Class AM, 6.0813% 6/15/38 (i) | | 6,700,000 | | 7,393,631 |
Lehman Brothers Floating Rate Commercial Mortgage Trust floater Series 2007-LLFA Class E, 1.091% 6/15/22 (h)(i) | | 6,230,000 | | 6,197,691 |
LStar Commercial Mortgage Trust Series 2011-1: | | | | |
Class B, 5.5191% 6/25/43 (h)(i) | | 6,165,000 | | 6,403,467 |
Class D, 5.5191% 6/25/43 (h)(i) | | 4,699,000 | | 4,625,745 |
Mach One Trust LLC Series 2004-1A Class H, 6.3257% 5/28/40 (h)(i) | | 2,840,000 | | 2,886,150 |
Merrill Lynch Financial Asset, Inc. Series 2005-CA16: | | | | |
Class F, 4.384% 7/12/37 | CAD | 710,000 | | 583,842 |
Class G, 4.384% 7/12/37 | CAD | 355,000 | | 286,895 |
Class H, 4.384% 7/12/37 | CAD | 236,000 | | 187,458 |
Class J, 4.384% 7/12/37 | CAD | 355,000 | | 277,175 |
Class K, 4.384% 7/12/37 | CAD | 355,000 | | 272,475 |
Class L, 4.384% 7/12/37 | CAD | 236,000 | | 178,083 |
Class M, 4.384% 7/12/37 | CAD | 995,000 | | 671,534 |
Merrill Lynch Mortgage Investors Trust Series 1999-C1 Class G, 6.71% 11/15/31 (h) | | 705,632 | | 324,591 |
Merrill Lynch Mortgage Trust Series 2006-C1 Class AM, 5.8724% 5/12/39 (i) | | 1,200,000 | | 1,309,643 |
Mezz Capital Commercial Mortgage Trust: | | | | |
sequential payer: | | | | |
Series 2004-C1 Class A, 4.836% 1/15/37 (h) | | 1,267,582 | | 1,128,148 |
Series 2004-C2 Class A, 5.318% 10/15/40 (h) | | 9,062,036 | | 7,929,282 |
Series 2004-C1: | | | | |
Class D, 6.988% 1/15/37 (h) | | 223,293 | | 22 |
Class IO, 8.9651% 1/15/37 (h)(i)(j) | | 1,759,867 | | 81,482 |
Morgan Stanley BAML Trust Series 2013-C9 Class D, 4.2997% 5/15/46 (h)(i) | | 5,000,000 | | 4,087,410 |
Morgan Stanley Capital I Trust: | | | | |
sequential payer: | | | | |
Series 2012-C4 Class E, 5.71% 3/15/45 (h)(i) | | 4,630,000 | | 4,312,137 |
Series 2006-HQ10 Class AM, 5.36% 11/12/41 | | 8,200,000 | | 8,949,357 |
Series 1997-RR Class F, 7.4018% 4/30/39 (h)(i) | | 1,030,758 | | 1,030,758 |
Series 1998-CF1 Class G, 7.35% 7/15/32 (h) | | 2,638,892 | | 1,970,236 |
Commercial Mortgage Securities - continued |
| Principal Amount (e) | | Value |
Morgan Stanley Capital I Trust: - continued | | | | |
Series 2005-HQ5 Class B, 5.272% 1/14/42 | | $ 2,000,000 | | $ 2,090,064 |
Series 2005-HQ6 Class AJ, 5.073% 8/13/42 (i) | | 2,500,000 | | 2,638,195 |
Series 2006-IQ12 Class AMFX, 5.37% 12/15/43 | | 7,500,000 | | 8,239,575 |
Series 2011-C1 Class C, 5.4199% 9/15/47 (h)(i) | | 4,000,000 | | 4,260,810 |
Series 2011-C2: | | | | |
Class D, 5.4934% 6/15/44 (h)(i) | | 4,610,000 | | 4,446,580 |
Class E, 5.4934% 6/15/44 (h)(i) | | 9,600,000 | | 9,032,928 |
Class F, 5.4934% 6/15/44 (h)(i) | | 4,440,000 | | 3,591,760 |
Class XB, 0.5389% 6/15/44 (h)(i)(j) | | 63,708,222 | | 2,154,294 |
Series 2011-C3: | | | | |
Class C, 5.3573% 7/15/49 (h)(i) | | 2,000,000 | | 2,045,002 |
Class D, 5.3573% 7/15/49 (h)(i) | | 7,400,000 | | 7,220,047 |
Series 2012-C4 Class D, 5.71% 3/15/45 (h)(i) | | 6,310,000 | | 6,343,676 |
NationsLink Funding Corp. Series 1999-SL Class X, 11/10/30 (j) | | 74,656 | | 74,567 |
Providence Place Group Ltd. Partnership Series 2000-C1 Class A2, 7.75% 7/20/28 (h) | | 3,929,602 | | 5,029,498 |
RBSCF Trust Series 2010-MB1 Class D, 4.8386% 4/15/24 (h)(i) | | 9,049,000 | | 9,102,869 |
Salomon Brothers Mortgage Securities VII, Inc. Series 2001-MMA Class E3, 6.5% 2/18/34 (h)(i) | | 122,646 | | 123,767 |
TIAA Seasoned Commercial Mortgage Trust sequential payer Series 2007-C4 Class AJ, 5.5257% 8/15/39 (i) | | 2,080,000 | | 2,269,590 |
TimberStar Trust I Series 2006-1 Class F, 7.5296% 10/15/36 (h) | | 10,630,000 | | 10,871,163 |
UBS Commercial Mortgage Trust Series 2007-FL1 Class F, 0.766% 7/15/24 (h)(i) | | 1,200,000 | | 1,093,200 |
UBS-Barclays Commercial Mortgage Trust sequential payer Series 2012-C3 Class A1, 0.726% 8/10/49 | | 3,415,348 | | 3,388,131 |
UBS-Citigroup Commercial Mortgage Trust Series 2011-C1 Class B, 6.0706% 1/10/45 (h)(i) | | 3,000,000 | | 3,344,322 |
Vornado DP LLC Series 2010-VNO Class D, 6.3555% 9/13/28 (h) | | 2,540,000 | | 2,811,498 |
Wachovia Bank Commercial Mortgage Trust: | | | | |
Series 2004-C10 Class E, 4.931% 2/15/41 | | 2,000,000 | | 2,019,384 |
Series 2004-C11: | | | | |
Class D, 5.5696% 1/15/41 (i) | | 5,177,000 | | 5,246,579 |
Class E, 5.6196% 1/15/41 (i) | | 3,785,000 | | 3,835,359 |
Series 2004-C12 Class D, 5.4782% 7/15/41 (i) | | 2,750,000 | | 2,816,858 |
Series 2004-C14 Class B, 5.17% 8/15/41 | | 3,180,000 | | 3,278,764 |
Wells Fargo Commercial Mortgage Trust Series 2012-LC5 Class D, 4.7802% 10/15/45 (h) | | 9,999,000 | | 8,698,550 |
Commercial Mortgage Securities - continued |
| Principal Amount (e) | | Value |
WF-RBS Commercial Mortgage Trust: | | | | |
Series 2011-C3: | | | | |
Class C, 5.335% 3/15/44 (h) | | $ 4,900,000 | | $ 5,090,728 |
Class D, 5.7215% 3/15/44 (h)(i) | | 1,000,000 | | 961,854 |
Class E, 5% 3/15/44 (h) | | 3,000,000 | | 2,484,135 |
Series 2012-C7 Class D, 5.0045% 6/15/45 (h)(i) | | 2,380,000 | | 2,269,935 |
Series 2013-C11: | | | | |
Class D, 4.3246% 3/15/45 (h)(i) | | 5,830,000 | | 4,801,250 |
Class E, 4.3246% 3/15/45 (h)(i) | | 4,780,000 | | 3,501,097 |
Series 2013-C13 Class D, 4.2791% 5/15/45 (h)(i) | | 4,000,000 | | 3,224,236 |
WFDB Commercial Mortgage Trust Series 2011-BXR Class D, 5.914% 7/5/24 (h) | | 4,000,000 | | 4,064,472 |
TOTAL COMMERCIAL MORTGAGE SECURITIES (Cost $486,874,679) |
515,595,608
|
Floating Rate Loans - 11.0% |
|
CONSUMER DISCRETIONARY - 4.8% |
Hotels, Restaurants & Leisure - 4.5% |
Cedar Fair LP Tranche B, term loan 3.25% 3/6/20 (i) | | 2,802,975 | | 2,831,005 |
Cooper Hotel Group REL 12% 11/6/17 | | 13,350,139 | | 14,017,646 |
Extended Stay America, Inc. REL 9.625% 12/1/19 | | 7,000,000 | | 7,140,000 |
Four Seasons Holdings, Inc. Tranche 2LN, term loan 6.25% 12/27/20 (i) | | 510,000 | | 520,200 |
Hilton Worldwide, Inc.: | | | | |
term loan 4.442% 11/12/15 (i) | | 55,995,536 | | 55,365,586 |
Tranche B, term loan 3.5645% 11/12/15 (i) | | 10,902,924 | | 10,780,266 |
Tranche C, term loan 3.692% 11/12/15 (i) | | 18,171,541 | | 17,967,111 |
Tranche D, term loan 3.942% 11/12/15 (i) | | 20,986,223 | | 20,750,128 |
Tranche E, term loan 4.192% 11/12/15 (i) | | 27,257,311 | | 26,950,666 |
Intrawest U.S. Holding, Inc. Tranche 1LN, term loan 7% 12/4/17 (i) | | 4,975,000 | | 5,068,281 |
La Quinta: | | | | |
Tranche A, term loan 11.375% 7/6/14 (i) | | 7,990,026 | | 8,140,239 |
Tranche B, term loan 11.375% 7/6/14 (i) | | 5,992,520 | | 6,105,179 |
Tranche D, term loan 14.9% 7/6/14 (i) | | 12,000,000 | | 11,715,600 |
| | 187,351,907 |
Multiline Retail - 0.2% |
JC Penney Corp., Inc. Tranche B, term loan 6% 5/21/18 (i) | | 5,995,000 | | 5,957,531 |
Floating Rate Loans - continued |
| Principal Amount (e) | | Value |
CONSUMER DISCRETIONARY - continued |
Specialty Retail - 0.1% |
The Pep Boys - Manny, Moe & Jack Tranche B, term loan 5% 10/11/18 (i) | | $ 5,328,225 | | $ 5,361,526 |
TOTAL CONSUMER DISCRETIONARY | | 198,670,964 |
CONSUMER STAPLES - 0.1% |
Food & Staples Retailing - 0.1% |
Albertson's LLC Tranche B 1LN, term loan 4.25% 3/21/16 (i) | | 5,162,063 | | 5,213,683 |
ENERGY - 0.4% |
Oil, Gas & Consumable Fuels - 0.4% |
Panda Sherman Power, LLC term loan 9% 9/14/18 (i) | | 7,200,000 | | 7,326,000 |
Panda Temple Power, LLC term loan 7.25% 4/3/19 (i) | | 8,580,000 | | 8,655,075 |
| | 15,981,075 |
FINANCIALS - 4.0% |
Diversified Financial Services - 1.2% |
Blackstone REL 10% 10/1/17 | | 17,488,428 | | 18,385,584 |
BRE Select Hotels Corp. REL 5.942% 5/9/18 (i) | | 12,235,818 | | 12,235,818 |
Calpine Construction Finance Co. LP Tranche B 2LN, term loan 3.25% 1/31/22 (i) | | 5,445,000 | | 5,424,581 |
Pilot Travel Centers LLC: | | | | |
Tranche B 2LN, term loan 4.25% 8/7/19 (i) | | 7,208,218 | | 7,208,218 |
Tranche B, term loan 3.75% 3/30/18 (i) | | 6,650,166 | | 6,625,561 |
SBA Senior Finance, Inc. Tranche B, term loan 3.75% 6/30/18 (i) | | 1,083,174 | | 1,091,297 |
| | 50,971,059 |
Real Estate Investment Trusts - 1.0% |
iStar Financial, Inc. Tranche B, term loan 4.5% 10/15/17 (i) | | 37,392,090 | | 37,485,570 |
Starwood Property Trust, Inc. Tranche B, term loan 3.5% 4/10/20 (i) | | 4,987,500 | | 4,987,500 |
| | 42,473,070 |
Real Estate Management & Development - 1.7% |
CB Richard Ellis Services, Inc. Tranche B, term loan 2.9451% 3/28/21 (i) | | 4,513,688 | | 4,524,972 |
CityCenter term loan 8.75% 7/12/14 (i) | | 4,169,750 | | 4,169,750 |
EOP Operating LP term loan: | | | | |
6.02% 2/1/14 (i) | | 5,000,000 | | 4,944,000 |
Floating Rate Loans - continued |
| Principal Amount (e) | | Value |
FINANCIALS - continued |
Real Estate Management & Development - continued |
EOP Operating LP term loan: - continued | | | | |
6.27% 2/1/14 (i) | | $ 3,800,000 | | $ 3,757,440 |
Equity Inns Reality LLC: | | | | |
Tranche A, term loan 10.5% 11/4/13 (i) | | 7,888,426 | | 7,212,651 |
Tranche B 2LN, term loan 7.55% 11/4/13 (i) | | 15,000,000 | | 14,962,500 |
Realogy Corp.: | | | | |
Credit-Linked Deposit 3.1963% 10/10/13 (i) | | 431,153 | | 431,153 |
Credit-Linked Deposit 4.4463% 10/10/16 (i) | | 914,940 | | 914,940 |
Realogy Group LLC Tranche B, term loan 4.5% 3/5/20 (i) | | 27,341,475 | | 27,614,890 |
| | 68,532,296 |
Thrifts & Mortgage Finance - 0.1% |
Ocwen Loan Servicing, LLC Tranche B, term loan 5% 1/23/18 (i) | | 1,962,588 | | 1,996,933 |
TOTAL FINANCIALS | | 163,973,358 |
HEALTH CARE - 0.4% |
Health Care Providers & Services - 0.4% |
Community Health Systems, Inc. term loan 3.7728% 1/25/17 (i) | | 2,903,247 | | 2,925,022 |
Health Management Associates, Inc. Tranche B, term loan 3.5% 11/18/18 (i) | | 2,083,219 | | 2,088,427 |
Skilled Healthcare Group, Inc. term loan 6.7123% 4/9/16 (i) | | 10,118,541 | | 10,143,838 |
| | 15,157,287 |
INDUSTRIALS - 0.3% |
Construction & Engineering - 0.3% |
Drumm Investors LLC Tranche B, term loan 5% 5/4/18 (i) | | 13,326,466 | | 12,893,356 |
TELECOMMUNICATION SERVICES - 0.5% |
Wireless Telecommunication Services - 0.5% |
Crown Castle Operating Co.: | | | | |
Tranche A, term loan 2.69% 1/31/17 (i) | | 8,727,273 | | 8,727,273 |
Tranche B, term loan 3.25% 1/31/19 (i) | | 9,212,995 | | 9,212,995 |
SBA Senior Finance II, LLC term loan 3.75% 9/28/19 (i) | | 1,226,177 | | 1,235,374 |
| | 19,175,642 |
Floating Rate Loans - continued |
| Principal Amount (e) | | Value |
UTILITIES - 0.5% |
Electric Utilities - 0.3% |
EquiPower Resources Holdings LLC: | | | | |
Tranche B 1LN, term loan 5.5% 12/21/18 (i) | | $ 5,000,000 | | $ 5,037,500 |
Tranche C, term loan 4.5% 12/21/19 (i) | | 995,000 | | 1,002,463 |
Essential Power LLC Tranche B, term loan 4.25% 8/8/19 (i) | | 2,428,050 | | 2,458,401 |
La Frontera Generation, LLC Tranche B, term loan 4.5% 9/30/20 (i) | | 5,000,000 | | 5,031,500 |
| | 13,529,864 |
Independent Power Producers & Energy Traders - 0.2% |
Tempus Public Foundation Generation Holdings LLC Tranche B, term loan 4.75% 12/31/17 (i) | | 9,000,000 | | 9,090,000 |
TOTAL UTILITIES | | 22,619,864 |
TOTAL FLOATING RATE LOANS (Cost $447,883,989) |
453,685,229
|
Preferred Securities - 0.0% |
| | | |
FINANCIALS - 0.0% |
Diversified Financial Services - 0.0% |
Crest Clarendon Street 2002-1 Ltd. Series 2002-1A Class PS, 12/28/35 (h) | 500,000 | | 25,000 |
Crest Dartmouth Street 2003 1 Ltd. Series 2003-1A Class PS, 6/28/38 (h) | 1,220,000 | | 61,000 |
| | 86,000 |
TOTAL PREFERRED SECURITIES (Cost $1,293,843) |
86,000
|
Money Market Funds - 7.4% |
| Shares | | Value |
Fidelity Cash Central Fund, 0.11% (b) | 270,943,913 | | $ 270,943,913 |
Fidelity Securities Lending Cash Central Fund, 0.12% (b)(c) | 35,303,075 | | 35,303,075 |
TOTAL MONEY MARKET FUNDS (Cost $306,246,988) |
306,246,988
|
TOTAL INVESTMENT PORTFOLIO - 100.9% (Cost $3,920,875,824) | | 4,159,414,034 |
NET OTHER ASSETS (LIABILITIES) - (0.9)% | | (36,346,452) |
NET ASSETS - 100% | $ 4,123,067,582 |
Currency Abbreviations |
CAD | - | Canadian dollar |
Legend |
(a) Non-income producing |
(b) Affiliated fund that is generally available only to investment companies and other accounts managed by Fidelity Investments. The rate quoted is the annualized seven-day yield of the fund at period end. A complete unaudited listing of the fund's holdings as of its most recent quarter end is available upon request. In addition, each Fidelity Central Fund's financial statements, which are not covered by the Fund's Report of Independent Registered Public Accounting Firm, are available on the SEC's website or upon request. |
(c) Investment made with cash collateral received from securities on loan. |
(d) Non-income producing - Security is in default. |
(e) Amount is stated in United States dollars unless otherwise noted. |
(f) Security or a portion of the security is on loan at period end. |
(g) Affiliated company |
(h) Security exempt from registration under Rule 144A of the Securities Act of 1933. These securities may be resold in transactions exempt from registration, normally to qualified institutional buyers. At the end of the period, the value of these securities amounted to $602,160,428 or 14.6% of net assets. |
(i) Coupon rates for floating and adjustable rate securities reflect the rates in effect at period end. |
(j) Security represents right to receive monthly interest payments on an underlying pool of mortgages or assets. Principal shown is the outstanding par amount of the pool as of the end of the period. |
(k) Restricted securities - Investment in securities not registered under the Securities Act of 1933 (excluding 144A issues). At the end of the period, the value of restricted securities (excluding 144A issues) amounted to $3,342,652 or 0.1% of net assets. |
Additional information on each restricted holding is as follows: |
Security | Acquisition Date | Acquisition Cost |
ACGS Series 2004-1 Class P, 7.4605% 8/1/19 | 2/17/11 | $ 3,131,922 |
Fannie Mae REMIC Trust Series 2001-W3 subordinate REMIC pass thru certificates, Class B3, 7% 9/25/41 | 5/21/03 | $ 119,805 |
Fannie Mae REMIC Trust Series 2003-W1 subordinate REMIC pass thru certificates, Class B3, 4.8488% 12/25/42 | 3/25/03 | $ 124,853 |
GSR Mortgage Loan Trust Series 2005-HE3 Class B3, 2.69% 6/25/35 | 6/3/05 | $ 613,549 |
Affiliated Central Funds |
Information regarding fiscal year to date income earned by the Fund from investments in Fidelity Central Funds is as follows: |
Fund | Income earned |
Fidelity Cash Central Fund | $ 456,858 |
Fidelity Securities Lending Cash Central Fund | 106,590 |
Total | $ 563,448 |
Other Affiliated Issuers |
An affiliated company is a company in which the Fund has ownership of at least 5% of the voting securities. Fiscal year to date transactions with companies which are or were affiliates are as follows: |
Affiliate | Value, beginning of period | Purchases | Sales Proceeds | Dividend Income | Value,
end of
period |
AmREIT, Inc. Class B | $ 2,818,000 | $ - | $ 3,749,972 | $ 96,887 | $ - |
Arbor Realty Trust, Inc. | - | 20,862,754 | - | 445,338 | 21,107,288 |
Arbor Realty Trust, Inc. Series A, 8.25% | - | 4,727,225 | - | 129,999 | 4,748,025 |
Arbor Realty Trust, Inc. Series B, 7.75% | - | 6,000,000 | - | - | 5,901,600 |
Total | $ 2,818,000 | $ 31,589,979 | $ 3,749,972 | $ 672,224 | $ 31,756,913 |
Other Information |
The following is a summary of the inputs used, as of July 31, 2013, involving the Fund's assets and liabilities carried at fair value. The inputs or methodology used for valuing securities may not be an indication of the risk associated with investing in those securities. For more information on valuation inputs, and their aggregation into the levels used in the tables below, please refer to the Investment Valuation section in the accompanying Notes to Financial Statements. |
Valuation Inputs at Reporting Date: |
Description | Total | Level 1 | Level 2 | Level 3 |
Investments in Securities: | | | |
Equities: | | | | |
Consumer Discretionary | $ 30,768,803 | $ 25,866,567 | $ - | $ 4,902,236 |
Financials | 1,843,945,625 | 1,823,549,794 | 18,107,807 | 2,288,024 |
Health Care | 44,524,811 | 44,524,811 | - | - |
Corporate Bonds | 819,337,938 | - | 816,169,770 | 3,168,168 |
Asset-Backed Securities | 128,395,776 | - | 107,450,194 | 20,945,582 |
Collateralized Mortgage Obligations | 16,827,256 | - | 15,722,149 | 1,105,107 |
Commercial Mortgage Securities | 515,595,608 | - | 494,454,226 | 21,141,382 |
Floating Rate Loans | 453,685,229 | - | 348,111,473 | 105,573,756 |
Preferred Securities | 86,000 | - | - | 86,000 |
Money Market Funds | 306,246,988 | 306,246,988 | - | - |
Total Investments in Securities: | $ 4,159,414,034 | $ 2,200,188,160 | $ 1,800,015,619 | $ 159,210,255 |
Valuation Inputs at Reporting Date: |
The following is a reconciliation of Investments in Securities for which Level 3 inputs were used in determining value: |
Investments in Securities: | |
Commercial Mortgage Securities | |
Beginning Balance | $ 53,984,005 |
Net Realized Gain (Loss) on Investment Securities | 504,595 |
Net Unrealized Gain (Loss) on Investment Securities | 1,350,805 |
Cost of Purchases | 2,889,025 |
Proceeds of Sales | (20,825,300) |
Amortization/Accretion | 627,941 |
Transfers into Level 3 | 1,065,042 |
Transfers out of Level 3 | (18,454,731) |
Ending Balance | $ 21,141,382 |
The change in unrealized gain (loss) for the period attributable to Level 3 securities held at July 31, 2013 | $ 647,713 |
Floating Rate Loans | |
Beginning Balance | $ 18,003,477 |
Net Realized Gain (Loss) on Investment Securities | 264,493 |
Net Unrealized Gain (Loss) on Investment Securities | 1,632,128 |
Cost of Purchases | 95,215,441 |
Proceeds of Sales | (14,290,062) |
Amortization/Accretion | 273,279 |
Transfers into Level 3 | 4,475,000 |
Transfers out of Level 3 | - |
Ending Balance | $ 105,573,756 |
The change in unrealized gain (loss) for the period attributable to Level 3 securities held at July 31, 2013 | $ 1,772,448 |
Other Investments in Securities | |
Beginning Balance | $ 55,750,106 |
Net Realized Gain (Loss) on Investment Securities | (5,987,844) |
Net Unrealized Gain (Loss) on Investment Securities | 11,096,738 |
Cost of Purchases | 168,742 |
Proceeds of Sales | (13,480,859) |
Amortization/Accretion | (260,694) |
Transfers into Level 3 | 9,210,100 |
Transfers out of Level 3 | (24,001,172) |
Ending Balance | $ 32,495,117 |
The change in unrealized gain (loss) for the period attributable to Level 3 securities held at July 31, 2013 | $ 4,610,963 |
The information used in the above reconciliations represents fiscal year to date activity for any Investments in Securities identified as using Level 3 inputs at either the beginning or the end of the current fiscal period. Transfers into Level 3 were attributable to a lack of observable market data resulting from decreases in market activity, decreases in liquidity, security restructurings or corporate actions. Transfers out of Level 3 were attributable to observable market data becoming available for those securities. Transfers in or out of Level 3 represent the beginning value of any Security or Instrument where a change in the pricing level occurred from the beginning to the end of the period. The cost of purchases and the proceeds of sales may include securities received or delivered through corporate actions or exchanges. Realized and unrealized gains (losses) disclosed in the reconciliations are included in Net Gain (Loss) on the Fund's Statement of Operations. |
Other Information |
The composition of credit quality ratings as a percentage of net assets is as follows (Unaudited): |
U.S. Government and U.S. Government Agency Obligations | 0.2% |
AAA,AA,A | 5.7% |
BBB | 10.8% |
BB | 6.8% |
B | 11.6% |
CCC,CC,C | 0.9% |
D | 0.0% |
Not Rated | 10.9% |
Equities | 46.6% |
Short-Term Investments and Net Other Assets | 6.5% |
| 100.0% |
We have used ratings from Moody's Investors Service, Inc. Where Moody's® ratings are not available, we have used S&P® ratings. All ratings are as of the date indicated and do not reflect subsequent changes. |
See accompanying notes which are an integral part of the financial statements.
Annual Report
Statement of Assets and Liabilities
| July 31, 2013 |
| | |
Assets | | |
Investment in securities, at value (including securities loaned of $33,804,284) - See accompanying schedule: Unaffiliated issuers (cost $3,583,038,857) | $ 3,821,410,133 | |
Fidelity Central Funds (cost $306,246,988) | 306,246,988 | |
Other affiliated issuers (cost $31,589,979) | 31,756,913 | |
Total Investments (cost $3,920,875,824) | | $ 4,159,414,034 |
Cash | | 119,760 |
Foreign currency held at value (cost $26,760) | | 26,760 |
Receivable for investments sold | | 3,833,620 |
Receivable for fund shares sold | | 8,237,634 |
Dividends receivable | | 2,204,019 |
Interest receivable | | 22,132,356 |
Distributions receivable from Fidelity Central Funds | | 70,745 |
Other receivables | | 14,996 |
Total assets | | 4,196,053,924 |
| | |
Liabilities | | |
Payable for investments purchased | $ 26,371,855 | |
Payable for fund shares redeemed | 8,145,140 | |
Accrued management fee | 1,915,759 | |
Distribution and service plan fees payable | 254,617 | |
Other affiliated payables | 897,990 | |
Other payables and accrued expenses | 97,906 | |
Collateral on securities loaned, at value | 35,303,075 | |
Total liabilities | | 72,986,342 |
| | |
Net Assets | | $ 4,123,067,582 |
Net Assets consist of: | | |
Paid in capital | | $ 3,803,721,769 |
Undistributed net investment income | | 39,267,501 |
Accumulated undistributed net realized gain (loss) on investments and foreign currency transactions | | 41,514,895 |
Net unrealized appreciation (depreciation) on investments and assets and liabilities in foreign currencies | | 238,563,417 |
Net Assets | | $ 4,123,067,582 |
See accompanying notes which are an integral part of the financial statements.
Annual Report
Financial Statements - continued
Statement of Assets and Liabilities - continued
| July 31, 2013 |
| | |
Calculation of Maximum Offering Price Class A:
Net Asset Value and redemption price per share ($378,268,593 ÷ 32,419,120 shares) | | $ 11.67 |
| | |
Maximum offering price per share (100/96.00 of $11.67) | | $ 12.16 |
Class T:
Net Asset Value and redemption price per share ($46,197,678 ÷ 3,958,306 shares) | | $ 11.67 |
| | |
Maximum offering price per share (100/96.00 of $11.67) | | $ 12.16 |
Class C:
Net Asset Value and offering price per share ($204,011,677 ÷ 17,607,394 shares)A | | $ 11.59 |
| | |
Real Estate Income:
Net Asset Value, offering price and redemption price per share ($2,884,544,749 ÷ 246,252,183 shares) | | $ 11.71 |
| | |
Institutional Class:
Net Asset Value, offering price and redemption price per share ($610,044,885 ÷ 52,187,743 shares) | | $ 11.69 |
A Redemption price per share is equal to net asset value less any applicable contingent deferred sales charge.
See accompanying notes which are an integral part of the financial statements.
Annual Report
Statement of Operations
| Year ended July 31, 2013 |
| | |
Investment Income | | |
Dividends (including $672,224 earned from other affiliated issuers) | | $ 77,045,173 |
Interest | | 126,655,801 |
Income from Fidelity Central Funds | | 563,448 |
Total income | | 204,264,422 |
| | |
Expenses | | |
Management fee | $ 19,911,854 | |
Transfer agent fees | 8,252,304 | |
Distribution and service plan fees | 1,899,520 | |
Accounting and security lending fees | 1,241,312 | |
Custodian fees and expenses | 60,830 | |
Independent trustees' compensation | 21,622 | |
Registration fees | 272,305 | |
Audit | 174,326 | |
Legal | 9,979 | |
Miscellaneous | 27,598 | |
Total expenses before reductions | 31,871,650 | |
Expense reductions | (92,847) | 31,778,803 |
Net investment income (loss) | | 172,485,619 |
Realized and Unrealized Gain (Loss) Net realized gain (loss) on: | | |
Investment securities: | | |
Unaffiliated issuers | 72,495,437 | |
Other affiliated issuers | 994,485 | |
Foreign currency transactions | 4,963 | |
Total net realized gain (loss) | | 73,494,885 |
Change in net unrealized appreciation (depreciation) on: Investment securities | 61,790,330 | |
Assets and liabilities in foreign currencies | (997) | |
Total change in net unrealized appreciation (depreciation) | | 61,789,333 |
Net gain (loss) | | 135,284,218 |
Net increase (decrease) in net assets resulting from operations | | $ 307,769,837 |
See accompanying notes which are an integral part of the financial statements.
Annual Report
Financial Statements - continued
Statement of Changes in Net Assets
| Year ended
July 31,
2013 | Year ended
July 31,
2012 |
Increase (Decrease) in Net Assets | | |
Operations | | |
Net investment income (loss) | $ 172,485,619 | $ 106,081,413 |
Net realized gain (loss) | 73,494,885 | 46,621,459 |
Change in net unrealized appreciation (depreciation) | 61,789,333 | 99,190,890 |
Net increase (decrease) in net assets resulting
from operations | 307,769,837 | 251,893,762 |
Distributions to shareholders from net investment income | (159,910,438) | (98,117,663) |
Distributions to shareholders from net realized gain | (51,534,162) | (16,498,521) |
Total distributions | (211,444,600) | (114,616,184) |
Share transactions - net increase (decrease) | 1,340,100,515 | 755,485,569 |
Redemption fees | 782,946 | 286,688 |
Total increase (decrease) in net assets | 1,437,208,698 | 893,049,835 |
| | |
Net Assets | | |
Beginning of period | 2,685,858,884 | 1,792,809,049 |
End of period (including undistributed net investment income of $39,267,501 and undistributed net investment income of $27,923,018, respectively) | $ 4,123,067,582 | $ 2,685,858,884 |
See accompanying notes which are an integral part of the financial statements.
Annual Report
Financial Highlights - Class A
Years ended July 31, | 2013 | 2012 | 2011 | 2010 H |
Selected Per-Share Data | | | | |
Net asset value, beginning of period | $ 11.26 | $ 10.73 | $ 9.94 | $ 9.95 |
Income from Investment Operations | | | | |
Net investment income (loss) E | .54 | .52 | .53 | .18 |
Net realized and unrealized gain (loss) | .60 | .61 | .76 | (.04) |
Total from investment operations | 1.14 | 1.13 | 1.29 | .14 |
Distributions from net investment income | (.53) | (.51) | (.50) | (.15) |
Distributions from net realized gain | (.20) | (.10) | - | - |
Total distributions | (.73) | (.60) K | (.50) | (.15) |
Redemption fees added to paid in capital E,J | - | - | - | - |
Net asset value, end of period | $ 11.67 | $ 11.26 | $ 10.73 | $ 9.94 |
Total Return B, C, D | 10.45% | 11.24% | 13.27% | 1.46% |
Ratios to Average Net Assets F, I | | | | |
Expenses before reductions | 1.08% | 1.12% | 1.13% | 1.09% A |
Expenses net of fee waivers, if any | 1.08% | 1.12% | 1.13% | 1.09% A |
Expenses net of all reductions | 1.07% | 1.11% | 1.12% | 1.09% A |
Net investment income (loss) | 4.62% | 4.89% | 5.00% | 6.23% A |
Supplemental Data | | | | |
Net assets, end of period (000 omitted) | $ 378,269 | $ 137,352 | $ 60,283 | $ 3,830 |
Portfolio turnover rate G | 26% | 27% | 25% | 28% |
A Annualized
B Total returns for periods of less than one year are not annualized.
C Total returns would have been lower if certain expenses had not been reduced during the applicable periods shown.
D Total returns do not include the effect of the sales charges.
E Calculated based on average shares outstanding during the period.
F Fees and expenses of any underlying Fidelity Central Funds are not included in the Fund's expense ratio. The Fund indirectly bears its proportionate share of the expenses of any underlying Fidelity Central Funds.
G Amount does not include the portfolio activity of any underlying Fidelity Central Funds.
H For the period April 14, 2010 (commencement of sale of shares) to July 31, 2010.
I Expense ratios reflect operating expenses of the class. Expenses before reductions do not reflect amounts reimbursed by the investment adviser or reductions from brokerage service arrangements or reductions from other expense offset arrangements and do not represent the amount paid by the class during periods when reimbursements or reductions occur. Expense ratios before reductions for start-up periods may not be representative of longer-term operating periods. Expenses net of fee waivers reflect expenses after reimbursement by the investment adviser but prior to reductions from brokerage service arrangements or other expense offset arrangements. Expenses net of all reductions represent the net expenses paid by the class.
J Amount represents less than $.01 per share.
K Total distributions of $.60 per share is comprised of distributions from net investment income of $.505 and distributions from net realized gain of $.097 per share.
See accompanying notes which are an integral part of the financial statements.
Annual Report
Financial Highlights - Class T
Years ended July 31, | 2013 | 2012 | 2011 | 2010 H |
Selected Per-Share Data | | | | |
Net asset value, beginning of period | $ 11.26 | $ 10.72 | $ 9.94 | $ 9.95 |
Income from Investment Operations | | | | |
Net investment income (loss) E | .54 | .52 | .52 | .17 |
Net realized and unrealized gain (loss) | .60 | .62 | .76 | (.03) |
Total from investment operations | 1.14 | 1.14 | 1.28 | .14 |
Distributions from net investment income | (.53) | (.50) | (.50) | (.15) |
Distributions from net realized gain | (.20) | (.10) | - | - |
Total distributions | (.73) | (.60) | (.50) | (.15) |
Redemption fees added to paid in capital E,J | - | - | - | - |
Net asset value, end of period | $ 11.67 | $ 11.26 | $ 10.72 | $ 9.94 |
Total Return B, C, D | 10.42% | 11.33% | 13.11% | 1.45% |
Ratios to Average Net Assets F, I | | | | |
Expenses before reductions | 1.08% | 1.11% | 1.16% | 1.17% A |
Expenses net of fee waivers, if any | 1.08% | 1.11% | 1.16% | 1.17% A |
Expenses net of all reductions | 1.08% | 1.11% | 1.16% | 1.17% A |
Net investment income (loss) | 4.61% | 4.90% | 4.96% | 5.92% A |
Supplemental Data | | | | |
Net assets, end of period (000 omitted) | $ 46,198 | $ 26,143 | $ 7,626 | $ 862 |
Portfolio turnover rate G | 26% | 27% | 25% | 28% |
A Annualized
B Total returns for periods of less than one year are not annualized.
C Total returns would have been lower if certain expenses had not been reduced during the applicable periods shown.
D Total returns do not include the effect of the sales charges.
E Calculated based on average shares outstanding during the period.
F Fees and expenses of any underlying Fidelity Central Funds are not included in the Fund's expense ratio. The Fund indirectly bears its proportionate share of the expenses of any underlying Fidelity Central Funds.
G Amount does not include the portfolio activity of any underlying Fidelity Central Funds.
H For the period April 14, 2010 (commencement of sale of shares) to July 31, 2010.
I Expense ratios reflect operating expenses of the class. Expenses before reductions do not reflect amounts reimbursed by the investment adviser or reductions from brokerage service arrangements or reductions from other expense offset arrangements and do not represent the amount paid by the class during periods when reimbursements or reductions occur. Expense ratios before reductions for start-up periods may not be representative of longer-term operating periods. Expenses net of fee waivers reflect expenses after reimbursement by the investment adviser but prior to reductions from brokerage service arrangements or other expense offset arrangements. Expenses net of all reductions represent the net expenses paid by the class.
J Amount represents less than $.01 per share.
See accompanying notes which are an integral part of the financial statements.
Annual Report
Financial Highlights - Class C
Years ended July 31, | 2013 | 2012 | 2011 | 2010 H |
Selected Per-Share Data | | | | |
Net asset value, beginning of period | $ 11.20 | $ 10.67 | $ 9.93 | $ 9.95 |
Income from Investment Operations | | | | |
Net investment income (loss) E | .45 | .44 | .45 | .15 |
Net realized and unrealized gain (loss) | .60 | .62 | .74 | (.03) |
Total from investment operations | 1.05 | 1.06 | 1.19 | .12 |
Distributions from net investment income | (.46) | (.43) | (.45) | (.14) |
Distributions from net realized gain | (.20) | (.10) | - | - |
Total distributions | (.66) | (.53) | (.45) | (.14) |
Redemption fees added to paid in capital E,J | - | - | - | - |
Net asset value, end of period | $ 11.59 | $ 11.20 | $ 10.67 | $ 9.93 |
Total Return B, C, D | 9.66% | 10.49% | 12.25% | 1.29% |
Ratios to Average Net Assets F, I | | | | |
Expenses before reductions | 1.81% | 1.87% | 1.89% | 1.86% A |
Expenses net of fee waivers, if any | 1.81% | 1.87% | 1.89% | 1.86% A |
Expenses net of all reductions | 1.81% | 1.87% | 1.89% | 1.86% A |
Net investment income (loss) | 3.88% | 4.14% | 4.23% | 5.21% A |
Supplemental Data | | | | |
Net assets, end of period (000 omitted) | $ 204,012 | $ 52,780 | $ 21,555 | $ 836 |
Portfolio turnover rate G | 26% | 27% | 25% | 28% |
A Annualized
B Total returns for periods of less than one year are not annualized.
C Total returns would have been lower if certain expenses had not been reduced during the applicable periods shown.
D Total returns do not include the effect of the contingent deferred sales charge.
E Calculated based on average shares outstanding during the period.
F Fees and expenses of any underlying Fidelity Central Funds are not included in the Fund's expense ratio. The Fund indirectly bears its proportionate share of the expenses of any underlying Fidelity Central Funds.
G Amount does not include the portfolio activity of any underlying Fidelity Central Funds.
H For the period April 14, 2010 (commencement of sale of shares) to July 31, 2010.
I Expense ratios reflect operating expenses of the class. Expenses before reductions do not reflect amounts reimbursed by the investment adviser or reductions from brokerage service arrangements or reductions from other expense offset arrangements and do not represent the amount paid by the class during periods when reimbursements or reductions occur. Expense ratios before reductions for start-up periods may not be representative of longer-term operating periods. Expenses net of fee waivers reflect expenses after reimbursement by the investment adviser but prior to reductions from brokerage service arrangements or other expense offset arrangements. Expenses net of all reductions represent the net expenses paid by the class.
J Amount represents less than $.01 per share.
See accompanying notes which are an integral part of the financial statements.
Annual Report
Financial Highlights - Real Estate Income
Years ended July 31, | 2013 | 2012 | 2011 | 2010 | 2009 |
Selected Per-Share Data | | | | | |
Net asset value, beginning of period | $ 11.29 | $ 10.75 | $ 9.95 | $ 8.21 | $ 9.43 |
Income from Investment Operations | | | | | |
Net investment income (loss) B | .57 | .54 | .55 | .53 | .54 |
Net realized and unrealized gain (loss) | .60 | .62 | .76 | 1.73 | (1.27) |
Total from investment operations | 1.17 | 1.16 | 1.31 | 2.26 | (.73) |
Distributions from net investment income | (.55) | (.52) | (.51) | (.52) | (.50) |
Distributions from net realized gain | (.20) | (.10) | - | - | - |
Total distributions | (.75) | (.62) | (.51) | (.52) | (.50) |
Redemption fees added to paid in capital B | - F | - F | - F | - F | .01 |
Net asset value, end of period | $ 11.71 | $ 11.29 | $ 10.75 | $ 9.95 | $ 8.21 |
Total Return A | 10.71% | 11.50% | 13.41% | 28.29% | (6.92)% |
Ratios to Average Net Assets C, E | | | | | |
Expenses before reductions | .84% | .90% | .92% | .97% | 1.00% |
Expenses net of fee waivers, if any | .84% | .89% | .92% | .96% | 1.00% |
Expenses net of all reductions | .84% | .89% | .92% | .96% | 1.00% |
Net investment income (loss) | 4.85% | 5.12% | 5.21% | 5.60% | 7.15% |
Supplemental Data | | | | | |
Net assets, end of period (000 omitted) | $ 2,884,545 | $ 2,252,149 | $ 1,660,063 | $ 1,030,393 | $ 463,269 |
Portfolio turnover rate D | 26% | 27% | 25% | 28% | 47% |
A Total returns would have been lower if certain expenses had not been reduced during the applicable periods shown.
B Calculated based on average shares outstanding during the period.
C Fees and expenses of any underlying Fidelity Central Funds are not included in the Fund's expense ratio. The Fund indirectly bears its proportionate share of the expenses of any underlying Fidelity Central Funds.
D Amount does not include the portfolio activity of any underlying Fidelity Central Funds.
E Expense ratios reflect operating expenses of the class. Expenses before reductions do not reflect amounts reimbursed by the investment adviser or reductions from brokerage service arrangements or reductions from other expense offset arrangements and do not represent the amount paid by the class during periods when reimbursements or reductions occur. Expenses net of fee waivers reflect expenses after reimbursement by the investment adviser but prior to reductions from brokerage service arrangements or other expense offset arrangements. Expenses net of all reductions represent the net expenses paid by the class.
F Amount represents less than $.01 per share.
See accompanying notes which are an integral part of the financial statements.
Annual Report
Financial Highlights - Institutional Class
Years ended July 31, | 2013 | 2012 | 2011 | 2010 G |
Selected Per-Share Data | | | | |
Net asset value, beginning of period | $ 11.28 | $ 10.74 | $ 9.95 | $ 9.95 |
Income from Investment Operations | | | | |
Net investment income (loss) D | .57 | .55 | .55 | .19 |
Net realized and unrealized gain (loss) | .60 | .62 | .76 | (.04) |
Total from investment operations | 1.17 | 1.17 | 1.31 | .15 |
Distributions from net investment income | (.56) | (.53) | (.52) | (.15) |
Distributions from net realized gain | (.20) | (.10) | - | - |
Total distributions | (.76) | (.63) | (.52) | (.15) |
Redemption fees added to paid in capital D, I | - | - | - | - |
Net asset value, end of period | $ 11.69 | $ 11.28 | $ 10.74 | $ 9.95 |
Total Return B, C | 10.72% | 11.62% | 13.44% | 1.58% |
Ratios to Average Net Assets E, H | | | | |
Expenses before reductions | .80% | .84% | .89% | .85% A |
Expenses net of fee waivers, if any | .80% | .84% | .89% | .85% A |
Expenses net of all reductions | .80% | .84% | .89% | .85% A |
Net investment income (loss) | 4.89% | 5.17% | 5.24% | 6.70% A |
Supplemental Data | | | | |
Net assets, end of period (000 omitted) | $ 610,045 | $ 217,435 | $ 43,282 | $ 2,930 |
Portfolio turnover rate F | 26% | 27% | 25% | 28% |
A Annualized
B Total returns for periods of less than one year are not annualized.
C Total returns would have been lower if certain expenses had not been reduced during the applicable periods shown.
D Calculated based on average shares outstanding during the period.
E Fees and expenses of any underlying Fidelity Central Funds are not included in the Fund's expense ratio. The Fund indirectly bears its proportionate share of the expenses of any underlying Fidelity Central Funds.
F Amount does not include the portfolio activity of any underlying Fidelity Central Funds.
G For the period April 14, 2010 (commencement of sale of shares) to July 31, 2010.
H Expense ratios reflect operating expenses of the class. Expenses before reductions do not reflect amounts reimbursed by the investment adviser or reductions from brokerage service arrangements or reductions from other expense offset arrangements and do not represent the amount paid by the class during periods when reimbursements or reductions occur. Expense ratios before reductions for start-up periods may not be representative of longer-term operating periods. Expenses net of fee waivers reflect expenses after reimbursement by the investment adviser but prior to reductions from brokerage service arrangements or other expense offset arrangements. Expenses net of all reductions represent the net expenses paid by the class.
I Amount represents less than $.01 per share.
See accompanying notes which are an integral part of the financial statements.
Annual Report
Notes to Financial Statements
For the period ended July 31, 2013
1. Organization.
Fidelity Real Estate Income Fund (the Fund) is a fund of Fidelity Securities Fund (the Trust) and is authorized to issue an unlimited number of shares. The Trust is registered under the Investment Company Act of 1940, as amended (the 1940 Act), as an open-end management investment company organized as a Massachusetts business trust. The Fund offers Class A, Class T, Class C, Real Estate Income and Institutional Class shares, each of which has equal rights as to assets and voting privileges. Each class has exclusive voting rights with respect to matters that affect that class.
2. Investments in Fidelity Central Funds.
The Fund invests in Fidelity Central Funds, which are open-end investment companies generally available only to other investment companies and accounts managed by Fidelity Management & Research Company (FMR) and its affiliates. The Fund's Schedule of Investments lists each of the Fidelity Central Funds held as of period end, if any, as an investment of the Fund, but does not include the underlying holdings of each Fidelity Central Fund. As an Investing Fund, the Fund indirectly bears its proportionate share of the expenses of the underlying Fidelity Central Funds.
The Money Market Central Funds seek preservation of capital and current income and are managed by Fidelity Investments Money Management, Inc. (FIMM), an affiliate of FMR.
A complete unaudited list of holdings for each Fidelity Central Fund is available upon request or at the Securities and Exchange Commission (the SEC) website at www.sec.gov. In addition, the financial statements of the Fidelity Central Funds, which are not covered by the Fund's Report of Independent Registered Public Accounting Firm, are available on the SEC website or upon request.
3. Significant Accounting Policies.
The financial statements have been prepared in conformity with accounting principles generally accepted in the United States of America (GAAP), which require management to make certain estimates and assumptions at the date of the financial statements. Actual results could differ from those estimates. Subsequent events, if any, through the date that the financial statements were issued have been evaluated in the preparation of the financial statements. The following summarizes the significant accounting policies of the Fund:
Investment Valuation. Investments are valued as of 4:00 p.m. Eastern time on the last calendar day of the period. In accordance with valuation policies and procedures approved by the Board of Trustees (the Board), the Fund attempts to obtain prices from one or more third party pricing vendors or brokers to value its investments. When
Annual Report
3. Significant Accounting Policies - continued
Investment Valuation - continued
current market prices, quotations or currency exchange rates are not readily available or reliable, investments will be fair valued in good faith by the FMR Fair Value Committee (the Committee), in accordance with procedures adopted by the Board. Factors used in determining fair value vary by investment type and may include market or investment specific events, changes in interest rates and credit quality. The frequency with which these procedures are used cannot be predicted and they may be utilized to a significant extent. The Committee oversees the Fund's valuation policies and procedures and is responsible for approving and reporting to the Board all fair value determinations.
The Fund categorizes the inputs to valuation techniques used to value its investments into a disclosure hierarchy consisting of three levels as shown below:
Level 1 - quoted prices in active markets for identical investments
Level 2 - other significant observable inputs (including quoted prices for similar investments, interest rates, prepayment speeds, etc.)
Level 3 - unobservable inputs (including the Fund's own assumptions based on the best information available)
Valuation techniques used to value the Fund's investments by major category are as follows:
Equity securities, including restricted securities, for which market quotations are readily available, are valued at the last reported sale price or official closing price as reported by a third party pricing vendor on the primary market or exchange on which they are traded and are categorized as Level 1 in the hierarchy. In the event there were no sales during the day or closing prices are not available, securities are valued at the last quoted bid price or may be valued using the last available price and are generally categorized as Level 2 in the hierarchy. For foreign equity securities, when market or security specific events arise, comparisons to the valuation of American Depositary Receipts (ADRs), futures contracts, Exchange-Traded Funds (ETFs) and certain indexes as well as quoted prices for similar securities may be used and would be categorized as Level 2 in the hierarchy. Utilizing these techniques may result in transfers between Level 1 and Level 2. For restricted equity securities and private placements where observable inputs are limited, assumptions about market activity and risk are used and these securities are generally categorized as Level 3 in the hierarchy.
Debt securities, including restricted securities, are valued based on evaluated prices received from third party pricing vendors or from brokers who make markets in such securities. For corporate bonds, floating rate loans and preferred securities, pricing
Annual Report
Notes to Financial Statements - continued
3. Significant Accounting Policies - continued
Investment Valuation - continued
vendors utilize matrix pricing which considers yield or price of bonds of comparable quality, coupon, maturity and type as well as broker-supplied prices. For asset backed securities, collateralized mortgage obligations and commercial mortgage securities, pricing vendors utilize matrix pricing which considers prepayment speed assumptions, attributes of the collateral, yield or price of bonds of comparable quality, coupon, maturity and type as well as broker-supplied prices. Independent prices obtained from a single source or broker are evaluated by management and may be categorized as Level 3 in the hierarchy. When independent prices are unavailable or unreliable, debt securities may be valued utilizing pricing methodologies which consider similar factors that would be used by third party pricing vendors. Debt securities are generally categorized as Level 2 in the hierarchy but may be Level 3 depending on the circumstances.
Investments in open-end mutual funds, including the Fidelity Central Funds, are valued at their closing net asset value (NAV) each business day and are categorized as Level 1 in the hierarchy.
The following provides information on Level 3 securities held by the Fund that were valued at period end based on unobservable inputs. These amounts exclude valuations provided by a broker.
Asset Type | Fair Value at
07/31/13 | Valuation
Technique(s) | Unobservable
Input | Amount or Range/
Weighted
Average | Impact to
Valuation from an Increase in Input* |
Asset-Backed Securities | $ 361,738 | Discounted cash flow | Yield | 11.0% | Decrease |
Collateralized Mortgage Obligations | $ 1,089,660 | Discounted cash flow | Yield | 6.5% - 65%/23.9% | Decrease |
Commercial Mortgage Securities | $ 2,036,877 | Discounted cash flow | Yield | 10% - 20%/15.5% | Decrease |
| Market comparable | Spread | 14.0% | Decrease |
Common Stock | $ 4,902,236 | Adjusted book value | Book value multiple | 1.0 | Increase |
Corporate Bonds | $ 3,157,168 | Discounted cash flow | Yield | 20.0% | Decrease |
Floating Rate Loans | $ 30,423,214 | Discounted cash flow | Yield | 8.8% - 11%/10.5% | Decrease |
| | Market comparable | Transaction price | $100.00 | Increase |
* Represents the expected directional change in the fair value of the Level 3 investments that would result from an increase in the corresponding input. A decrease to the unobservable input would have the opposite effect. Significant changes in these inputs could result in significantly higher or lower fair value measurements.
Annual Report
3. Significant Accounting Policies - continued
Investment Valuation - continued
Changes in valuation techniques may result in transfers in or out of an assigned level within the disclosure hierarchy. The aggregate value of investments by input level, as of July 31, 2013, as well as a roll forward of Level 3 investments, is included at the end of the Fund's Schedule of Investments.
Foreign Currency. The Fund may use foreign currency contracts to facilitate transactions in foreign-denominated securities. Gains and losses from these transactions may arise from changes in the value of the foreign currency or if the counterparties do not perform under the contracts' terms.
Foreign-denominated assets, including investment securities, and liabilities are translated into U.S. dollars at the exchange rates at period end. Purchases and sales of investment securities, income and dividends received and expenses denominated in foreign currencies are translated into U.S. dollars at the exchange rate in effect on the transaction date.
The effects of exchange rate fluctuations on investments are included with the net realized and unrealized gain (loss) on investment securities. Other foreign currency transactions resulting in realized and unrealized gain (loss) are disclosed separately.
Investment Transactions and Income. For financial reporting purposes, the Fund's investment holdings and NAV include trades executed through the end of the last business day of the period. The NAV per share for processing shareholder transactions is calculated as of the close of business of the New York Stock Exchange (NYSE), normally 4:00 p.m. Eastern time and includes trades executed through the end of the prior business day. Gains and losses on securities sold are determined on the basis of identified cost and may include proceeds received from litigation. Dividend income is recorded on the ex-dividend date, except for certain dividends from foreign securities where the ex-dividend date may have passed, which are recorded as soon as the Fund is informed of the ex-dividend date. Non-cash dividends included in dividend income, if any, are recorded at the fair market value of the securities received. Distributions received on securities that represent a return of capital or capital gain are recorded as a reduction of cost of investments and/or as a realized gain. Subsequent to ex-dividend date the Fund determines the components of these distributions, based upon receipt of tax filings or other correspondence relating to the underlying investment. Interest income and distributions from the Fidelity Central Funds are accrued as earned. Interest income includes coupon interest and amortization of premium and accretion of discount on debt securities. For certain lower credit quality securitized assets that have contractual cash flows (for example, asset backed securities, collateralized mortgage obligations and
Annual Report
Notes to Financial Statements - continued
3. Significant Accounting Policies - continued
Investment Transactions and Income - continued
commercial mortgage-backed securities), changes in estimated cash flows are periodically evaluated and the estimated yield is adjusted on a prospective basis over the remaining life of the security, resulting in increases or decreases to Interest Income in the accompanying Statement of Operations. Investment income is recorded net of foreign taxes withheld where recovery of such taxes is uncertain. Debt obligations may be placed on non-accrual status and related interest income may be reduced by ceasing current accruals and writing off interest receivables when the collection of all or a portion of interest has become doubtful based on consistently applied procedures. A debt obligation is removed from non-accrual status when the issuer resumes interest payments or when collectability of interest is reasonably assured.
Class Allocations and Expenses. Investment income, realized and unrealized capital gains and losses, common expenses of the Fund, and certain fund-level expense reductions, if any, are allocated on a pro-rata basis to each class based on the relative net assets of each class to the total net assets of the Fund. Each class differs with respect to transfer agent and distribution and service plan fees incurred. Certain expense reductions may also differ by class. Expenses directly attributable to a fund are charged to that fund. Expenses attributable to more than one fund are allocated among the respective funds on the basis of relative net assets or other appropriate methods. Expense estimates are accrued in the period to which they relate and adjustments are made when actual amounts are known.
Income Tax Information and Distributions to Shareholders. Each year, the Fund intends to qualify as a regulated investment company under Subchapter M of the Internal Revenue Code, including distributing substantially all of its taxable income and realized gains. As a result, no provision for income taxes is required. As of July 31, 2013, the Fund did not have any unrecognized tax benefits in the financial statements; nor is the Fund aware of any tax positions for which it is reasonably possible that the total amounts of unrecognized tax benefits will significantly change in the next twelve months. The Fund files a U.S. federal tax return, in addition to state and local tax returns as required. A fund's federal income tax returns are subject to examination by the Internal Revenue Service (IRS) for a period of three fiscal years after they are filed. State and local tax returns may be subject to examination for an additional fiscal year depending on the jurisdiction. Foreign taxes are provided for based on the Fund's understanding of the tax rules and rates that exist in the foreign markets in which it invests.
Annual Report
3. Significant Accounting Policies - continued
Income Tax Information and Distributions to Shareholders - continued
Distributions are declared and recorded on the ex-dividend date. Income dividends and capital gain distributions are declared separately for each class. Income and capital gain distributions are determined in accordance with income tax regulations, which may differ from GAAP. In addition, the Fund claimed a portion of the payment made to redeeming shareholders as a distribution for income tax purposes.
Capital accounts within the financial statements are adjusted for permanent book-tax differences. These adjustments have no impact on net assets or the results of operations. Temporary book-tax differences will reverse in a subsequent period.
Book-tax differences are primarily due to foreign currency transactions, passive foreign investment companies (PFIC), market discount, partnerships, equity-debt classifications and losses deferred due to wash sales.
The federal tax cost of investment securities and unrealized appreciation (depreciation) as of period end were as follows:
Gross unrealized appreciation | $ 329,448,090 |
Gross unrealized depreciation | (97,431,991) |
Net unrealized appreciation (depreciation) on securities and other investments | $ 232,016,099 |
| |
Tax Cost | $ 3,927,397,935 |
The tax-based components of distributable earnings as of period end were as follows:
Undistributed ordinary income | $ 54,276,553 |
Undistributed long-term capital gain | $ 33,287,081 |
Net unrealized appreciation (depreciation) | $ 232,041,306 |
The tax character of distributions paid was as follows:
| July 31, 2013 | July 31, 2012 |
Ordinary Income | $ 170,384,735 | $ 98,117,663 |
Long-term Capital Gains | 41,059,865 | 16,498,521 |
Total | $ 211,444,600 | $ 114,616,184 |
Short-Term Trading (Redemption) Fees. Shares held by investors in the Fund less than 90 days may have been subject to a redemption fee equal to .75% of the net asset value of shares redeemed. All redemption fees, which reduce the proceeds of the shareholder redemption, are retained by the Fund and accounted for as an addition to paid in capital.
Annual Report
Notes to Financial Statements - continued
3. Significant Accounting Policies - continued
Restricted Securities. The Fund may invest in securities that are subject to legal or contractual restrictions on resale. These securities generally may be resold in transactions exempt from registration or to the public if the securities are registered. Disposal of these securities may involve time-consuming negotiations and expense, and prompt sale at an acceptable price may be difficult. Information regarding restricted securities is included at the end of the Fund's Schedule of Investments.
Loans and Other Direct Debt Instruments. The Fund invests in direct debt instruments which are interests in amounts owed to lenders by corporate or other borrowers. These instruments may be in the form of loans, trade claims or other receivables and may include standby financing commitments such as revolving credit facilities that obligate the Fund to supply additional cash to the borrower on demand. Loans may be acquired through assignment or participation, or may be made directly to a borrower. The Fund may be contractually obligated to receive approval from the agent bank and/or borrower prior to the sale of these loans. The Fund did not have any unfunded loan commitments, which are contractual obligations for future funding, at period end.
4. Purchases and Sales of Investments.
Purchases and sales of securities, other than short-term securities and U.S. government securities, aggregated $2,022,279,822 and $847,035,607, respectively.
5. Fees and Other Transactions with Affiliates.
Management Fee. FMR and its affiliates provide the Fund with investment management related services for which the Fund pays a monthly management fee. The management fee is the sum of an individual fund fee rate that is based on an annual rate of .30% of the Fund's average net assets and an annualized group fee rate that averaged .26% during the period. The group fee rate is based upon the average net assets of all the mutual funds advised by FMR. The group fee rate decreases as assets under management increase and increases as assets under management decrease. For the period, the total annual management fee rate was .56% of the Fund's average net assets.
Distribution and Service Plan Fees. In accordance with Rule 12b-1 of the 1940 Act, the Fund has adopted separate Distribution and Service Plans for each class of shares. Certain classes pay Fidelity Distributors Corporation (FDC), an affiliate of FMR, separate Distribution and Service Fees, each of which is based on an annual percentage of each class' average net assets. In addition, FDC may pay financial intermediaries for selling shares of the Fund and providing shareholder support services. For the period, the Distribution and Service Fee rates, total fees and amounts retained by FDC were as follows:
Annual Report
5. Fees and Other Transactions with Affiliates - continued
Distribution and Service Plan Fees - continued
| Distribution
Fee | Service
Fee | Total Fees | Retained
by FDC |
Class A | -% | .25% | $ 617,413 | $ 50,959 |
Class T | -% | .25% | 90,476 | 816 |
Class C | .75% | .25% | 1,191,631 | 632,739 |
| | | $ 1,899,520 | $ 684,514 |
Sales Load. FDC may receive a front-end sales charge of up to 4.00% for selling Class A shares and Class T shares, some of which is paid to financial intermediaries for selling shares of the Fund. Depending on the holding period, FDC may receive contingent deferred sales charges levied on Class A, Class T and Class C redemptions. The deferred sales charges range from 1.00% for Class C shares, 1.00% for certain purchases of Class A shares and .25% for certain purchases of Class T shares.
For the period, sales charge amounts retained by FDC were as follows:
| Retained
by FDC |
Class A | $ 119,905 |
Class T | 24,968 |
Class C* | 16,049 |
| $ 160,922 |
* When Class C shares are initially sold, FDC pays commissions from its own resources to financial intermediaries through which the sales are made.
Transfer Agent Fees. Fidelity Investments Institutional Operations Company, Inc., (FIIOC), an affiliate of FMR, is the transfer, dividend disbursing and shareholder servicing agent for each class of the Fund. FIIOC receives account fees and asset-based fees that vary according to the account size and type of account of the shareholders of the respective classes of the Fund. FIIOC pays for typesetting, printing and mailing of shareholder reports, except proxy statements. For the period, transfer agent fees for each class were as follows:
| Amount | % of
Average
Net Assets |
Class A | $ 549,009 | .22 |
Class T | 82,206 | .23 |
Class C | 250,037 | .21 |
Real Estate Income | 6,587,715 | .24 |
Institutional Class | 783,337 | .20 |
| $ 8,252,304 | |
Annual Report
Notes to Financial Statements - continued
5. Fees and Other Transactions with Affiliates - continued
Accounting and Security Lending Fees. Fidelity Service Company, Inc. (FSC), an affiliate of FMR, maintains the Fund's accounting records. The accounting fee is based on the level of average net assets for each month. Under a separate contract, FSC administers the security lending program. The security lending fee is based on the number and duration of lending transactions.
Brokerage Commissions. The Fund placed a portion of its portfolio transactions with brokerage firms which are affiliates of the investment adviser. Brokerage commissions are included in net realized gain (loss) and change in net unrealized appreciation (depreciation) in the Statement of Operations. The commissions paid to these affiliated firms were $38,551 for the period.
6. Committed Line of Credit.
The Fund participates with other funds managed by FMR or an affiliate in a $4.25 billion credit facility (the "line of credit") to be utilized for temporary or emergency purposes to fund shareholder redemptions or for other short-term liquidity purposes. The Fund has agreed to pay commitment fees on its pro-rata portion of the line of credit, which amounted to $7,997 and is reflected in Miscellaneous expenses on the Statement of Operations. During the period, there were no borrowings on this line of credit.
7. Security Lending.
The Fund lends portfolio securities through a lending agent from time to time in order to earn additional income. For equity securities, a lending agent is used and may loan securities to certain qualified borrowers, including Fidelity Capital Markets (FCM), a broker-dealer affiliated with the Fund. On the settlement date of the loan, the Fund receives collateral (in the form of U.S. Treasury obligations, letters of credit and/or cash) against the loaned securities and maintains collateral in an amount not less than 100% of the market value of the loaned securities during the period of the loan. The market value of the loaned securities is determined at the close of business of the Fund and any additional required collateral is delivered to the Fund on the next business day. If the borrower defaults on its obligation to return the securities loaned because of insolvency or other reasons, the Fund may apply collateral received from the borrower against the obligation. The Fund may experience delays and costs in recovering the securities loaned. Any cash collateral received is invested in the Fidelity Securities Lending Cash Central Fund. The value of loaned securities and cash collateral at period end are disclosed on the Fund's Statement of Assets and Liabilities. Security lending income represents the income earned on investing cash collateral, less rebates paid to borrowers
Annual Report
7. Security Lending - continued
and any lending agent fees associated with the loan, plus any premium payments received for lending certain types of securities. Security lending income is presented in the Statement of Operations as a component income from Fidelity Central Funds. Total security lending income during the period amounted to $106,590. During the period, there were no securities loaned to FCM.
8. Expense Reductions.
Commissions paid to certain brokers with whom FMR places trades on behalf of the Fund include an amount in addition to trade execution, which is rebated back to the Fund to offset certain expenses. This amount totaled $85,737 for the period. In addition, through arrangements with the Fund's custodian, credits realized as a result of uninvested cash balances were used to reduce the Fund's expenses. During the period, these credits reduced the Fund's custody expenses by $4,414.
In addition, FMR reimbursed a portion of the Fund's operating expenses during the period in the amount of $2,696.
9. Distributions to Shareholders.
Distributions to shareholders of each class were as follows:
Years ended July 31, | 2013 | 2012 |
From net investment income | | |
Class A | $ 10,238,777 | $ 3,854,404 |
Class T | 1,523,114 | 609,057 |
Class C | 4,241,554 | 1,139,599 |
Real Estate Income | 126,726,805 | 86,666,891 |
Institutional Class | 17,180,188 | 5,847,712 |
Total | $ 159,910,438 | $ 98,117,663 |
From net realized gain | | |
Class A | $ 2,837,075 | $ 603,452 |
Class T | 506,062 | 83,752 |
Class C | 1,181,312 | 208,802 |
Real Estate Income | 42,729,814 | 14,865,902 |
Institutional Class | 4,279,899 | 736,613 |
Total | $ 51,534,162 | $ 16,498,521 |
Annual Report
Notes to Financial Statements - continued
10. Share Transactions.
Transactions for each class of shares were as follows:
| Shares | Dollars |
Years ended July 31, | 2013 | 2012 | 2013 | 2012 |
Class A | | | | |
Shares sold | 25,244,691 | 8,276,874 | $ 296,851,509 | $ 88,010,262 |
Reinvestment of distributions | 900,102 | 333,613 | 10,299,964 | 3,436,744 |
Shares redeemed | (5,925,325) | (2,031,559) | (69,436,144) | (21,254,183) |
Net increase (decrease) | 20,219,468 | 6,578,928 | $ 237,715,329 | $ 70,192,823 |
Class T | | | | |
Shares sold | 2,730,063 | 1,725,200 | $ 31,978,463 | $ 18,422,015 |
Reinvestment of distributions | 132,742 | 49,495 | 1,515,681 | 511,986 |
Shares redeemed | (1,226,451) | (163,799) | (14,137,454) | (1,727,688) |
Net increase (decrease) | 1,636,354 | 1,610,896 | $ 19,356,690 | $ 17,206,313 |
Class C | | | | |
Shares sold | 14,157,408 | 3,117,808 | $ 165,598,758 | $ 33,302,251 |
Reinvestment of distributions | 375,304 | 110,126 | 4,279,651 | 1,128,377 |
Shares redeemed | (1,637,958) | (534,569) | (19,029,492) | (5,534,157) |
Net increase (decrease) | 12,894,754 | 2,693,365 | $ 150,848,917 | $ 28,896,471 |
Real Estate Income | | | | |
Shares sold | 123,727,906 | 90,720,847 | $ 1,450,014,694 | $ 959,813,942 |
Reinvestment of distributions | 13,299,047 | 8,913,831 | 151,923,311 | 91,762,119 |
Shares redeemed | (90,180,888) | (54,623,988) | (1,057,830,249) | (572,115,634) |
Net increase (decrease) | 46,846,065 | 45,010,690 | $ 544,107,756 | $ 479,460,427 |
Institutional Class | | | | |
Shares sold | 42,960,747 | 16,926,727 | $ 506,030,603 | $ 177,564,635 |
Reinvestment of distributions | 1,337,082 | 472,572 | 15,315,413 | 4,899,349 |
Shares redeemed | (11,392,454) | (2,146,783) | (133,274,193) | (22,734,449) |
Net increase (decrease) | 32,905,375 | 15,252,516 | $ 388,071,823 | $ 159,729,535 |
Annual Report
11. Other.
The Fund's organizational documents provide former and current trustees and officers with a limited indemnification against liabilities arising in connection with the performance of their duties to the Fund. In the normal course of business, the Fund may also enter into contracts that provide general indemnifications. The Fund's maximum exposure under these arrangements is unknown as this would be dependent on future claims that may be made against the Fund. The risk of material loss from such claims is considered remote.
Annual Report
To the Trustees of Fidelity Securities Fund and Shareholders of Fidelity Real Estate Income Fund:
We have audited the accompanying statement of assets and liabilities of Fidelity Real Estate Income Fund (the Fund), a fund of Fidelity Securities Fund, including the schedule of investments, as of July 31, 2013, and the related statement of operations for the year then ended, the statement of changes in net assets for each of the two years in the period then ended, and the financial highlights for each of the five years in the period then ended. These financial statements and financial highlights are the responsibility of the Fund's management. Our responsibility is to express an opinion on these financial statements and financial highlights based on our audits.
We conducted our audits in accordance with the standards of the Public Company Accounting Oversight Board (United States). Those standards require that we plan and perform the audit to obtain reasonable assurance about whether the financial statements and financial highlights are free of material misstatement. The Fund is not required to have, nor were we engaged to perform, an audit of their internal control over financial reporting. Our audits included consideration of internal control over financial reporting as a basis for designing audit procedures that are appropriate in the circumstances, but not for the purpose of expressing an opinion on the effectiveness of the Fund's internal control over financial reporting. Accordingly, we express no such opinion. An audit also includes examining, on a test basis, evidence supporting the amounts and disclosures in the financial statements, assessing the accounting principles used and significant estimates made by management, as well as evaluating the overall financial statement presentation. Our procedures included confirmation of securities owned as of July 31, 2013, by correspondence with the custodians, agent banks, and brokers; where replies were not received from brokers, we performed other auditing procedures. We believe that our audits provide a reasonable basis for our opinion.
In our opinion, the financial statements and financial highlights referred to above present fairly, in all material respects, the financial position of Fidelity Real Estate Income Fund as of July 31, 2013, the results of its operations for the year then ended, the changes in its net assets for each of the two years in the period then ended, and the financial highlights for each of the five years in the period then ended, in conformity with accounting principles generally accepted in the United States of America.
DELOITTE & TOUCHE LLP
Boston, Massachusetts
September 20, 2013
Annual Report
The Trustees, Member of the Advisory Board, and executive officers of the trust and fund, as applicable, are listed below. The Board of Trustees governs the fund and is responsible for protecting the interests of shareholders. The Trustees are experienced executives who meet periodically throughout the year to oversee the fund's activities, review contractual arrangements with companies that provide services to the fund, oversee management of the risks associated with such activities and contractual arrangements, and review the fund's performance. Except for James C. Curvey, Ned C. Lautenbach, Ronald P. O'Hanley, and William S. Stavropoulos, each of the Trustees oversees 166 Fidelity funds. Mr. Curvey oversees 387 Fidelity funds. Mr. Lautenbach, Mr. O'Hanley, and Mr. Stavropoulos each oversees 230 Fidelity funds.
The Trustees hold office without limit in time except that (a) any Trustee may resign; (b) any Trustee may be removed by written instrument, signed by at least two-thirds of the number of Trustees prior to such removal; (c) any Trustee who requests to be retired or who has become incapacitated by illness or injury may be retired by written instrument signed by a majority of the other Trustees; and (d) any Trustee may be removed at any special meeting of shareholders by a two-thirds vote of the outstanding voting securities of the trust. Each Trustee who is not an interested person of the trust and the fund (as defined in the 1940 Act) (Independent Trustee), shall retire not later than the last day of the calendar year in which his or her 75th birthday occurs. The Independent Trustees may waive this mandatory retirement age policy with respect to individual Trustees. The executive officers and Advisory Board Member hold office without limit in time, except that any officer and Advisory Board Member may resign or may be removed by a vote of a majority of the Trustees at any regular meeting or any special meeting of the Trustees. Except as indicated, each individual has held the office shown or other offices in the same company for the past five years.
Experience, Skills, Attributes, and Qualifications of the Fund's Trustees. The Governance and Nominating Committee has adopted a statement of policy that describes the experience, qualifications, attributes, and skills that are necessary and desirable for potential Independent Trustee candidates (Statement of Policy). The Board believes that each Trustee satisfied at the time he or she was initially elected or appointed a Trustee, and continues to satisfy, the standards contemplated by the Statement of Policy. The Governance and Nominating Committee also engages professional search firms to help identify potential Independent Trustee candidates who have the experience, qualifications, attributes, and skills consistent with the Statement of Policy. From time to time, additional criteria based on the composition and skills of the current Independent Trustees, as well as experience or skills that may be appropriate in light of future changes to board composition, business conditions, and regulatory or other developments, have also been considered by the professional search firms and the Governance and Nominating Committee. In addition, the Board takes into account the Trustees' commitment and participation in Board and committee meetings, as well as their leadership of standing and ad hoc committees throughout their tenure.
Annual Report
Trustees and Officers - continued
In determining that a particular Trustee was and continues to be qualified to serve as a Trustee, the Board has considered a variety of criteria, none of which, in isolation, was controlling. The Board believes that, collectively, the Trustees have balanced and diverse experience, qualifications, attributes, and skills, which allow the Board to operate effectively in governing the fund and protecting the interests of shareholders. Information about the specific experience, skills, attributes, and qualifications of each Trustee, which in each case led to the Board's conclusion that the Trustee should serve (or continue to serve) as a trustee of the fund, is provided below.
Board Structure and Oversight Function. James C. Curvey is an interested person (as defined in the 1940 Act) and currently serves as Chairman. The Trustees have determined that an interested Chairman is appropriate and benefits shareholders because an interested Chairman has a personal and professional stake in the quality and continuity of services provided to the fund. Independent Trustees exercise their informed business judgment to appoint an individual of their choosing to serve as Chairman, regardless of whether the Trustee happens to be independent or a member of management. The Independent Trustees have determined that they can act independently and effectively without having an Independent Trustee serve as Chairman and that a key structural component for assuring that they are in a position to do so is for the Independent Trustees to constitute a substantial majority for the Board. The Independent Trustees also regularly meet in executive session. Ned C. Lautenbach serves as Chairman of the Independent Trustees and as such (i) acts as a liaison between the Independent Trustees and management with respect to matters important to the Independent Trustees and (ii) with management prepares agendas for Board meetings.
Fidelity funds are overseen by different Boards of Trustees. The fund's Board oversees Fidelity's equity and high income funds and another Board oversees Fidelity's investment-grade bond, money market, and asset allocation funds. The asset allocation funds may invest in Fidelity funds overseen by the fund's Board. The use of separate Boards, each with its own committee structure, allows the Trustees of each group of Fidelity funds to focus on the unique issues of the funds they oversee, including common research, investment, and operational issues. On occasion, the separate Boards establish joint committees to address issues of overlapping consequences for the Fidelity funds overseen by each Board.
The Trustees operate using a system of committees to facilitate the timely and efficient consideration of all matters of importance to the Trustees, the fund, and fund shareholders and to facilitate compliance with legal and regulatory requirements and oversight of the fund's activities and associated risks. The Board, acting through its committees, has charged FMR and its affiliates with (i) identifying events or circumstances the occurrence of which could have demonstrably adverse effects on the fund's business and/or reputation; (ii) implementing processes and controls to lessen the possibility that such events or circumstances occur or to mitigate the effects of such events or circumstances if they do occur; and (iii) creating and maintaining a system designed to evaluate continuously business and market conditions in order to facilitate the identification and implementation processes described in (i) and (ii) above. Because the day-to-day operations and activities of the fund are carried out by or through FMR, its affiliates and other service providers, the fund's exposure to risks is mitigated but not eliminated by the processes overseen by the Trustees. While each of the Board's committees has responsibility for overseeing different aspects of the fund's activities, oversight is exercised primarily through the Operations, Audit, and Compliance Committees. In addition, the Independent Trustees have worked with FMR to enhance the Board's oversight of investment and financial risks, legal and regulatory risks, technology risks, and operational risks, including the development of additional risk reporting to the Board. For example, a working group comprised of Independent Trustees and FMR has worked and continues to work to review the Fidelity funds' valuation-related activities, reporting and risk management. Appropriate personnel, including but not limited to the fund's Chief Compliance Officer (CCO), FMR's internal auditor, the independent accountants, the fund's Treasurer and portfolio management personnel, make periodic reports to the Board's committees, as appropriate, including an annual review of FMR's risk management program for the Fidelity funds. The responsibilities of each standing committee, including their oversight responsibilities, are described further under "Standing Committees of the Fund's Trustees."
Annual Report
The fund's Statement of Additional Information (SAI) includes more information about the Trustees. To request a free copy, call Fidelity at 1-877-208-0098.
Interested Trustees*:
Correspondence intended for each Trustee who is an interested person may be sent to Fidelity Investments, 245 Summer Street, Boston, Massachusetts 02210.
Name, Year of Birth; Principal Occupations and Other Relevant Experience+ |
James C. Curvey (1935) |
| Year of Election or Appointment: 2007 Mr. Curvey is Trustee and Chairman of the Board of Trustees of certain Trusts. Mr. Curvey also serves as Trustee (2007-present) of other investment companies advised by FMR. Mr. Curvey is a Director of Fidelity Investments Money Management, Inc. (2009-present), Director of Fidelity Research & Analysis Co. (2009-present) and Director of FMR and FMR Co., Inc. (2007-present). Mr. Curvey is also Vice Chairman (2007-present) and Director of FMR LLC. In addition, Mr. Curvey serves as an Overseer for the Boston Symphony Orchestra and a member of the Trustees of Villanova University. Previously, Mr. Curvey was the Vice Chairman (2006-2007) and Director (2000-
2007) of FMR Corp. |
Ronald P. O'Hanley (1957) |
| Year of Election or Appointment: 2011 Mr. O'Hanley serves as a Trustee and Chairman of the Board of Trustees of other Fidelity funds (2013-present), and is Director of FMR Co., Inc. (2010-present), Director of Fidelity Investments Money Management, Inc. (2010-present), Director of Fidelity Research & Analysis Company (2010-present), President of Fidelity Asset Management and Corporate Services and a Member of Fidelity's Executive Committee (2010-present). Previously, Mr. O'Hanley served as President and Chief Executive Officer of BNY Mellon Asset Management (2007-2010). Mr. O'Hanley also served as Vice Chairman of Bank New York Mellon Corp. and a member of that firm's Executive Committee. Prior to the 2007 merger of The Bank of New York and Mellon Financial Corporation, he was Vice Chairman of Mellon Financial Corporation and President and Chief Executive Officer of Mellon Asset Management. He joined Mellon in February 1997. Mr. O'Hanley currently serves as Chairman of the Boston Public Library Foundation Board of Directors and sits on the Board of Directors of Beth Israel Deaconess Medical Center, the Board of Trustees of the Marine Biological Laboratory and the Advisory Board of the Maxwell School of Citizenship and Public Administration at Syracuse University. Mr. O'Hanley also chairs the Council on Asset Management for the Financial Services Roundtable and is a member of the Board of Directors of Institutional Investor's U.S. Institute. |
* Trustees have been determined to be "Interested Trustees" by virtue of, among other things, their affiliation with the trust or various entities under common control with FMR.
+ The information above includes each Trustee's principal occupation during the last five years and other information relating to the experience, attributes, and skills relevant to each Trustee's qualifications to serve as a Trustee, which led to the conclusion that each Trustee should serve as a Trustee for the fund.
Annual Report
Independent Trustees:
Correspondence intended for each Independent Trustee (that is, the Trustees other than the Interested Trustees) may be sent to Fidelity Investments, P.O. Box 55235, Boston, Massachusetts 02205-5235.
Name, Year of Birth; Principal Occupations and Other Relevant Experience+ |
Dennis J. Dirks (1948) |
| Year of Election or Appointment: 2005 Prior to his retirement in May 2003, Mr. Dirks was Chief Operating Officer and a member of the Board of The Depository Trust & Clearing Corporation (DTCC). He also served as President, Chief Operating Officer, and Board member of The Depository Trust Company (DTC) and President and Board member of the National Securities Clearing Corporation (NSCC). In addition, Mr. Dirks served as Chief Executive Officer and Board member of the Government Securities Clearing Corporation, Chief Executive Officer and Board member of the Mortgage-Backed Securities Clearing Corporation, as a Trustee and a member of the Finance Committee of Manhattan College (2005-2008), and as a Trustee and a member of the Finance Committee of AHRC of Nassau County (2006-2008). Mr. Dirks is a member of the Independent Directors Council (IDC) Governing Council (2010-present) and Board of Directors for The Brookville Center for Children's Services, Inc. (2009-present). |
Alan J. Lacy (1953) |
| Year of Election or Appointment: 2008 Mr. Lacy serves as Senior Adviser (2007-present) of Oak Hill Capital Partners, L.P. (private equity). Mr. Lacy also served as Chief Executive Officer (2000-2005) and Vice Chairman (2005-2006) of Sears Holdings Corporation and Sears, Roebuck and Co. (retail). In addition, Mr. Lacy serves as a member of the Board of Directors of Dave & Buster's Entertainment, Inc. (restaurant and entertainment complexes, 2010-
present), Earth Fare, Inc. (retail grocery, 2012-present), The Hillman Companies, Inc. (hardware wholesalers, 2010-present), and Bristol-Myers Squibb Company (global pharmaceuticals, 2008-present). Mr. Lacy is a member of the Board of Trustees of The National Parks Conservation Association (2006-present). Previously, Mr. Lacy served as Chairman of the Board of Trustees of the National Parks Conservation Association (2008-2011) and as a member of the Board of Directors for the Western Union Company (global money transfer, 2006-2011). |
Ned C. Lautenbach (1944) |
| Year of Election or Appointment: 2000 Mr. Lautenbach is Chairman of the Independent Trustees of the Equity and High Income Funds (2006-present) and serves as a Trustee of other Fidelity funds (2013-present). Mr. Lautenbach currently serves as the Lead Director of the Eaton Corporation Board of Directors (diversified industrial, 1997-present). Mr. Lautenbach is Chairman of the Board of Directors of the Philharmonic Center for the Arts in Naples, Florida (2012-present) and a member of the Council on Foreign Relations (1994-present). Previously, Mr. Lautenbach was a Partner/Advisory Partner at Clayton, Dubilier & Rice, LLC (private equity investment, 1998-2010), as well as a Director of Sony Corporation (2006-2007). |
Joseph Mauriello (1944) |
| Year of Election or Appointment: 2008 Prior to his retirement in January 2006, Mr. Mauriello served in numerous senior management positions including Deputy Chairman and Chief Operating Officer (2004-2005), and Vice Chairman of Financial Services (2002-2004) of KPMG LLP US (professional services, 1965-2005). Mr. Mauriello currently serves as a member of the Board of Directors of XL Group plc. (global insurance and re-insurance, 2006-present). Previously, Mr. Mauriello served as a Director of the Hamilton Funds of the Bank of New York (2006-2007) and of Arcadia Resources Inc. (health care services and products, 2007-2012). |
Robert W. Selander (1950) |
| Year of Election or Appointment: 2011 Previously, Mr. Selander served as a Member of the Advisory Board of Fidelity's Equity and High Income Funds (2011), Executive Vice Chairman (2010), Chief Executive Officer (2009-2010), and President and Chief Executive Officer (1997-2009) of Mastercard, Inc. |
Cornelia M. Small (1944) |
| Year of Election or Appointment: 2005 Ms. Small is a member of the Board of Directors (2009-present) and Chair of the Investment Committee (2010-present) of the Teagle Foundation. Ms. Small also serves on the Investment Committee of the Berkshire Taconic Community Foundation (2008-present). Previously, Ms. Small served as Chairperson (2002-2008) and a member of the Investment Committee and Chairperson (2008-2012) and a member of the Board of Trustees of Smith College. In addition, Ms. Small served as Chief Investment Officer, Director of Global Equity Investments, and a member of the Board of Directors of Scudder, Stevens & Clark and Scudder Kemper Investments. |
William S. Stavropoulos (1939) |
| Year of Election or Appointment: 2002 Mr. Stavropoulos is Vice Chairman of the Independent Trustees of the Equity and High Income Funds (2006-present) and serves as a Trustee of other Fidelity funds (2013-present). Mr. Stavropoulos serves as President and Founder of the Michigan Baseball Foundation, the Great Lakes Loons (2007-present). Mr. Stavropoulos is Chairman Emeritus of the Board of Directors of The Dow Chemical Company, where he previously served in numerous senior management positions, including President, CEO (1995-2000; 2002-2004), Chairman of the Executive Committee (2000-2006), and as a member of the Board of Directors (1990-2006). Currently, Mr. Stavropoulos is Chairman of the Board of Directors of Univar Inc. (global distributor of commodity and specialty chemicals), a Director of Teradata Corporation (data warehousing and technology solutions), and Maersk Inc. (industrial conglomerate), and a member of the Advisory Board for Metalmark Capital LLC (private equity investment, 2005-present). Mr. Stavropoulos is an operating advisor to Clayton, Dubilier & Rice, LLC (private equity investment). In addition, Mr. Stavropoulos is a member of the University of Notre Dame Advisory Council for the College of Science, a Trustee of the Rollin L. Gerstacker Foundation, and a Director of the Naples Philharmonic Center for the Arts. Previously, Mr. Stavropoulos served as a Director of Chemical Financial Corporation (bank holding company, 1993-2012) and Tyco International, Ltd. (multinational manufacturing and services, 2007-2012). |
David M. Thomas (1949) |
| Year of Election or Appointment: 2008 Previously, Mr. Thomas served as Executive Chairman (2005-2006) and Chairman and Chief Executive Officer (2000-2005) of IMS Health, Inc. (pharmaceutical and healthcare information solutions), and a Director of Fortune Brands, Inc. (consumer products, 2000-2011). In addition, Mr. Thomas serves as Non-Executive Chairman of the Board of Directors of Fortune Brands Home and Security (home and security products, 2011-
present), and as a member of the Board of Directors of Interpublic Group of Companies, Inc. (marketing communication, 2004-present). |
+ The information above includes each Trustee's principal occupation during the last five years and other information relating to the experience, attributes, and skills relevant to each Trustee's qualifications to serve as a Trustee, which led to the conclusion that each Trustee should serve as a Trustee for the fund.
Annual Report
Trustees and Officers - continued
Advisory Board Member and Executive Officers:
Correspondence intended for each executive officer and Peter S. Lynch may be sent to Fidelity Investments, 245 Summer Street, Boston, Massachusetts 02210.
Name, Year of Birth; Principal Occupation |
Peter S. Lynch (1944) |
| Year of Election or Appointment: 2003 Member of the Advisory Board of Fidelity's Equity and High Income Funds. Mr. Lynch is Vice Chairman and a Director of FMR and FMR Co., Inc. In addition, Mr. Lynch serves as a Trustee of Boston College and as the Chairman of the Inner-City Scholarship Fund. Previously, Mr. Lynch served on the Special Olympics International Board of Directors (1997-2006). |
Kenneth B. Robins (1969) |
| Year of Election or Appointment: 2008 President and Treasurer of Fidelity's Equity and High Income Funds. Mr. Robins also serves as President and Treasurer (2008-present) and Assistant Treasurer (2009-present) of other Fidelity funds and is an employee of Fidelity Investments (2004-present). Mr. Robins serves as Executive Vice President of Fidelity Investments Money Management, Inc. (FIMM) (2013-present). Previously, Mr. Robins served as Deputy Treasurer of the Fidelity funds (2005-2008) and Treasurer and Chief Financial Officer of The North Carolina Capital Management Trust: Cash and Term Portfolios (2006-2008). |
Brian B. Hogan (1964) |
| Year of Election or Appointment: 2009 Vice President of Equity and High Income Funds. Mr. Hogan also serves as Vice President of other Fidelity funds (2009-present) and President of FMR's Equity Division (2009-present). Previously, Mr. Hogan served as Senior Vice President, Equity Research of FMR (2006-2009) and as a portfolio manager. |
Christopher S. Bartel (1971) |
| Year of Election or Appointment: 2009 Vice President of Fidelity's Sector and Real Estate Equity Funds. Mr. Bartel also serves as a Director, President, and Chief Executive Officer of Fidelity Management & Research (Japan) Inc. (2012-present), a Director of Fidelity Management & Research (Hong Kong) (2012-
present), and Senior Vice President of Global Equity Research (2010-
present). Previously, Mr. Bartel served as Senior Vice President of Equity Research (2009-2010), Managing Director of Research (2006-
2009), and an analyst and portfolio manager (2000-2006). |
Scott C. Goebel (1968) |
| Year of Election or Appointment: 2008 Secretary and Chief Legal Officer (CLO) of the Fidelity funds. Mr. Goebel also serves as Secretary of Fidelity Investments Money Management, Inc. (FIMM) (2010-present) and Fidelity Research and Analysis Company (FRAC) (2010-present); Secretary and CLO of The North Carolina Capital Management Trust: Cash and Term Portfolios (2008-
present); General Counsel, Secretary, and Senior Vice President of FMR (2008-present) and FMR Co., Inc. (2008-present); employed by FMR LLC or an affiliate (2001-present); Chief Legal Officer of Fidelity Management & Research (Hong Kong) Limited (2008-present) and Assistant Secretary of Fidelity Management & Research (Japan) Inc. (2008-present), and Fidelity Management & Research (U.K.) Inc. (2008-present). Previously, Mr. Goebel served as Assistant Secretary of FIMM (2008-2010), FRAC (2008-2010), and the Funds (2007-
2008) and as Vice President and Secretary of Fidelity Distributors Corporation (FDC) (2005-2007). |
William C. Coffey (1969) |
| Year of Election or Appointment: 2009 Assistant Secretary of Fidelity's Equity and High Income Funds. Mr. Coffey also serves as Assistant Secretary of other Fidelity funds (2009-present), Senior Vice President and Deputy General Counsel of FMR LLC (2010-present), and is an employee of Fidelity Investments. Previously, Mr. Coffey served as Vice President and Associate General Counsel of FMR LLC (2005-2009). |
Elizabeth Paige Baumann (1968) |
| Year of Election or Appointment: 2012 Anti-Money Laundering (AML) Officer of the Fidelity funds. Ms. Baumann also serves as AML Officer of The North Carolina Capital Management Trust: Cash and Term Portfolios (2012-present), Chief AML Officer of FMR LLC (2012-present), and is an employee of Fidelity Investments. Previously, Ms. Baumann served as Vice President and Deputy Anti-Money Laundering Officer (2007-2012). |
Christine Reynolds (1958) |
| Year of Election or Appointment: 2008 Chief Financial Officer of the Fidelity funds. Ms. Reynolds became President of Fidelity Pricing and Cash Management Services (FPCMS) in August 2008. Ms. Reynolds served as Chief Operating Officer of FPCMS (2007-2008). Previously, Ms. Reynolds served as President, Treasurer, and Anti-Money Laundering officer of the Fidelity funds (2004-2007). |
Joseph A. Hanlon (1968) |
| Year of Election or Appointment: 2012 Chief Compliance Officer of Fidelity's Equity and High Income Funds. Mr. Hanlon also serves as Chief Compliance Officer of other Fidelity funds (2012-present). Mr. Hanlon serves as Compliance Officer of FMR, FMR Co., Inc., Fidelity Investments Money Management, Inc. (FIMM), Fidelity Research and Analysis Company (FRAC), and Fidelity Management & Research (Hong Kong) (2009-present), as Senior Vice President of the Fidelity Asset Management Division (2009-present), and is an employee of Fidelity Investments. Previously, Mr. Hanlon served as Compliance Officer of Fidelity Management & Research (Japan) Inc. (2009-2013), Strategic Advisers, Inc. (2009-2013), and Fidelity Management & Research (U.K.) Inc. (2009-2013). |
Joseph F. Zambello (1957) |
| Year of Election or Appointment: 2011 Deputy Treasurer of the Fidelity funds. Mr. Zambello is an employee of Fidelity Investments. Previously, Mr. Zambello served as Vice President of FMR's Program Management Group (2009-2011) and Vice President of the Transfer Agent Oversight Group (2005-2009). |
Adrien E. Deberghes (1967) |
| Year of Election or Appointment: 2008 Deputy Treasurer of Fidelity's Equity and High Income Funds. Mr. Deberghes also serves as Vice President (2011-present), Deputy Treasurer (2008-present), and Assistant Treasurer (2010-present) of other Fidelity funds, and is an employee of Fidelity Investments (2008-present). Previously, Mr. Deberghes served as Senior Vice President of Mutual Fund Administration at State Street Corporation (2007-2008), Senior Director of Mutual Fund Administration at Investors Bank & Trust (2005-2007), and Director of Finance for Dunkin' Brands (2000-2005). |
Stephen Sadoski (1971) |
| Year of Election or Appointment: 2012 Deputy Treasurer of Fidelity's Equity and High Income Funds. Mr. Sadoski also serves as Deputy Treasurer of other Fidelity funds (2012-present) and is an employee of Fidelity Investments (2012-present). Previously, Mr. Sadoski served as Assistant Treasurer of Fidelity's Fixed Income and Asset Allocation Funds (2012-2013), an assistant chief accountant in the Division of Investment Management of the Securities and Exchange Commission (SEC) (2009-2012) and as a senior manager at Deloitte & Touche LLP (1997-2009). |
Stacie M. Smith (1974) |
| Year of Election or Appointment: 2013 Deputy Treasurer of Fidelity's Equity and High Income Funds. Ms. Smith also serves as Deputy Treasurer of other Fidelity funds (2013-present) and is an employee of Fidelity Investments (2009-present). Previously, Ms. Smith served as Senior Audit Manager of Ernst & Young LLP (1996-2009). |
Stephanie J. Dorsey (1969) |
| Year of Election or Appointment: 2010 Assistant Treasurer of Fidelity's Equity and High Income Funds. Ms. Dorsey also serves as President and Treasurer (2013-present) and Assistant Treasurer (2010-present) of other Fidelity funds, Treasurer and Chief Financial Officer of The North Carolina Capital Management Trust: Cash and Term Portfolios (2013-present), and is an employee of Fidelity Investments (2008-present). Previously, Ms. Dorsey served as Deputy Treasurer of Fidelity's Fixed Income and Asset Allocation Funds (2008-2013), Treasurer (2004-2008) of the JPMorgan Mutual Funds and Vice President (2004-2008) of JPMorgan Chase Bank. |
Gary W. Ryan (1958) |
| Year of Election or Appointment: 2005 Assistant Treasurer of the Fidelity funds. Mr. Ryan is an employee of Fidelity Investments. Previously, Mr. Ryan served as Vice President of Fund Reporting in Fidelity Pricing and Cash Management Services (FPCMS) (1999-2005). |
Jonathan Davis (1968) |
| Year of Election or Appointment: 2010 Assistant Treasurer of the Fidelity funds. Mr. Davis is also Assistant Treasurer of Fidelity Rutland Square Trust II and Fidelity Commonwealth Trust II. Mr. Davis is an employee of Fidelity Investments. Previously, Mr. Davis served as Vice President and Associate General Counsel of FMR LLC (2003-2010). |
Annual Report
The Board of Trustees of Fidelity Advisor Real Estate Income Fund voted to pay to shareholders of record at the opening of business, the following distributions per share derived from capital gains realized from sales of portfolio securities, and dividends derived from net investment income:
| Pay Date | Record Date | Dividends | Capital Gains |
Class A | 09/09/13 | 09/06/13 | $0.152 | $0.139 |
Class T | 09/09/13 | 09/06/13 | $0.150 | $0.139 |
Class C | 09/09/13 | 09/06/13 | $0.131 | $0.139 |
The fund hereby designates as a capital gain dividend with respect to the taxable year ended July 31, 2013, $47,460,544, or, if subsequently determined to be different, the net capital gain of such year.
A total of 0.06% of the dividends distributed during the fiscal year was derived from interest on U.S. Government securities which is generally exempt from state income tax.
The fund will notify shareholders in January 2014 of amounts for use in preparing 2013 income tax returns.
Annual Report
Board Approval of Investment Advisory Contracts and Management Fees
Fidelity Real Estate Income Fund
Each year, the Board of Trustees, including the Independent Trustees (together, the Board), votes on the renewal of the management contract and sub-advisory agreements (together, the Advisory Contracts) for the fund. The Board, assisted by the advice of fund counsel and Independent Trustees' counsel, requests and considers a broad range of information relevant to the renewal of the Advisory Contracts throughout the year.
The Board meets regularly and, at each of its meetings, covers an extensive agenda of topics and materials and considers factors that are relevant to its annual consideration of the renewal of the fund's Advisory Contracts, including the services and support provided to the fund and its shareholders. The Board has established various standing committees, each composed of and chaired by Independent Trustees with varying backgrounds, to which the Board has assigned specific subject matter responsibilities in order to enhance effective decision-making by the Board. The Board, acting directly and through its Committees, requests and receives information concerning the annual consideration of the renewal of the fund's Advisory Contracts. The Board also meets as needed to consider matters specifically related to the Board's annual consideration of the renewal of Advisory Contracts. Members of the Board may also meet with trustees of other Fidelity funds through ad hoc joint committees to discuss certain matters relevant to the Fidelity funds.
At its July 2013 meeting, the Board, including the Independent Trustees, unanimously determined to renew the fund's Advisory Contracts. In reaching its determination, the Board considered all factors it believed relevant, including (i) the nature, extent, and quality of the services to be provided to the fund and its shareholders (including the investment performance of the fund); (ii) the competitiveness of the fund's management fee and total expense ratio relative to peer funds; (iii) the total costs of the services to be provided by and the profits to be realized by Fidelity from its relationship with the fund; (iv) the extent to which economies of scale exist and would be realized as the fund grows; and (v) whether fee levels reflect these economies of scale, if any, for the benefit of fund shareholders.
In considering whether to renew the Advisory Contracts for the fund, the Board reached a determination, with the assistance of fund counsel and Independent Trustees' counsel and through the exercise of its business judgment, that the renewal of the Advisory Contracts was in the best interests of the fund and its shareholders and that the compensation payable under the Advisory Contracts was fair and reasonable. The Board's decision to renew the Advisory Contracts was not based on any single factor, but rather was based on a comprehensive consideration of all the information provided to the Board at its meetings throughout the year. The Board, in reaching its determination to renew the Advisory Contracts, was aware that shareholders in the fund have a broad range of investment choices available to them, including a wide choice among mutual funds offered by Fidelity's competitors, and that the fund's shareholders, who have the opportunity to review and weigh the disclosure provided by the fund in its prospectus and other public disclosures, have chosen to invest in this fund, which is a part of the Fidelity family of funds.
Annual Report
Board Approval of Investment Advisory Contracts and
Management Fees - continued
Nature, Extent, and Quality of Services Provided. The Board considered the staffing within the investment adviser, Fidelity Management & Research Company (FMR), and the sub-advisers (together, the Investment Advisers) as it relates to the fund, including the backgrounds of the fund's investment personnel, and also considered the fund's investment objective, strategies, and related investment philosophy. The Independent Trustees also had discussions with senior management of Fidelity's investment operations and investment groups. The Board considered the structure of the portfolio manager compensation program and whether this structure provides appropriate incentives to act in the best interests of the fund.
Resources Dedicated to Investment Management and Support Services. The Board and the Fund Oversight and Research Committees reviewed the general qualifications and capabilities of the Investment Advisers' investment staff, including its size, education, experience, and resources, as well as the Investment Advisers' approach to recruiting, training, managing, and compensating investment personnel. The Board noted that FMR has continued to increase the resources devoted to non-U.S. offices, including expansion of Fidelity's global investment organization. The Board also noted that Fidelity's analysts have extensive resources, tools and capabilities that allow them to conduct sophisticated quantitative and fundamental analysis, as well as credit analysis of issuers, counterparties and guarantors. Further, the Board believes that Fidelity's investment professionals have sufficient access to global information and data so as to provide competitive investment results over time, and that those professionals also have access to sophisticated tools that permit them to assess portfolio construction and risk and performance attribution characteristics continuously, as well as to transmit new information and research conclusions rapidly around the world. Additionally, in its deliberations, the Board considered the Investment Advisers' trading and risk management capabilities and resources, which are an integral part of the investment management process.
Shareholder and Administrative Services. The Board considered (i) the nature, extent, quality, and cost of advisory, administrative, and shareholder services performed by the Investment Advisers and their affiliates under the Advisory Contracts and under separate agreements covering transfer agency, pricing and bookkeeping, and securities lending services for the fund; (ii) the nature and extent of the supervision of third party service providers, principally custodians and subcustodians; and (iii) the resources devoted to, and the record of compliance with, the fund's compliance policies and procedures. The Board also reviewed the allocation of fund brokerage, including allocations to brokers affiliated with the Investment Advisers, the use of brokerage commissions to pay fund expenses, and the use of "soft" commission dollars to pay for research services.
Annual Report
The Board noted that the growth of fund assets over time across the complex allows Fidelity to reinvest in the development of services designed to enhance the value or convenience of the Fidelity funds as investment vehicles. These services include 24-hour access to account information and market information through telephone representatives and over the Internet, investor education materials and asset allocation tools, and the expanded availability of Fidelity Investor Centers.
Investment in a Large Fund Family. The Board considered the benefits to shareholders of investing in a Fidelity fund, including the benefits of investing in a fund that is part of a large family of funds offering a variety of investment disciplines and providing a large variety of mutual fund investor services. The Board noted that Fidelity had taken, or had made recommendations that resulted in the Fidelity funds taking, a number of actions over the previous year that benefited particular funds, including (i) continuing to dedicate additional resources to investment research and to the support of the senior management team that oversees asset management; (ii) persisting in efforts to enhance Fidelity's global research capabilities; (iii) launching new funds and making other enhancements to meet client needs for global and income-oriented solutions; (iv) continuing to launch dedicated lower cost underlying funds to meet portfolio construction needs related to expanding underlying fund options for Fidelity funds of funds, specifically for the Freedom Fund product lines; (v) rationalizing product lines and gaining increased efficiencies through the mergers of several funds into other funds; (vi) strengthening Fidelity's index fund offerings by reducing investment minimums and adopting or lowering existing expense caps for certain funds and classes; (vii) enhancing Global Asset Allocation product offerings by launching new funds and strategies, including "open architecture" target date funds that utilize affiliated and unaffiliated sub-advisers; (viii) modifying the eligibility criteria for Institutional Class shares of Advisor funds to increase their marketability to a portion of the defined contribution plan market; (ix) creating a new low-cost retirement share class for certain Advisor funds to appeal to large retirement plans; (x) transitioning the management of certain Fidelity commodity funds to Geode Capital Management LLC, a registered commodity pool operator, while retaining administrative responsibilities for the funds; (xi) reorganizing a number of funds; and (xii) taking steps toward establishing a new Fidelity adviser to manage sector-based funds and products.
Investment Performance. The Board considered whether the fund has operated in accordance with its investment objective, as well as its record of compliance with its investment restrictions and its performance history.
The Board took into account discussions with the Investment Advisers about fund investment performance that occur at Board meetings throughout the year. In this regard the Board noted that as part of regularly scheduled fund reviews and other reports to the Board on fund performance, the Board periodically considers annualized return information for the fund, for different time periods, measured against a securities market index ("benchmark index") and a peer group of mutual funds with similar objectives ("peer group"). In its evaluation of fund investment performance, the Board gave particular attention to information indicating changes in performance of certain Fidelity funds for specific time periods and the Investment Advisers' explanations for any overperformance or underperformance.
Annual Report
Board Approval of Investment Advisory Contracts and
Management Fees - continued
In addition to reviewing absolute and relative fund performance, the Independent Trustees periodically consider the appropriateness of fund performance metrics in evaluating the results achieved. In general, the Independent Trustees believe that fund performance should be evaluated based on net performance (after fees and expenses) of both the highest performing and lowest performing classes, where applicable, compared to appropriate benchmark indices, over appropriate time periods which may include full market cycles, and compared to peer groups, as applicable, over the same periods, taking into account relevant factors including the following: general market conditions; issuer-specific information; tactical opportunities for investment; and fund cash flows and other factors.
The Independent Trustees recognize that shareholders evaluate performance on a net basis over their own holding periods, for which one-, three-, and five-year periods are used as a proxy. For this reason, the performance information reviewed by the Board also included net cumulative calendar year total return information for the fund and an appropriate benchmark index and peer group for the most recent one-, three-, and five-year periods, as shown below. Returns are shown compared to the 25th percentile (top of box) and 75th percentile (bottom of box) of the peer universe.
Fidelity Real Estate Income Fund

Annual Report
Based on its review, the Board concluded that the nature, extent, and quality of services provided to the fund under the Advisory Contracts should benefit the fund's shareholders.
Competitiveness of Management Fee and Total Expense Ratio. The Board considered the fund's management fee and total expense ratio compared to "mapped groups" of competitive funds and classes. Fidelity creates "mapped groups" by combining similar Lipper investment objective categories that have comparable management fee characteristics. Combining Lipper investment objective categories aids the Board's management fee and total expense ratio comparisons by broadening the competitive group used for comparison and by reducing the number of universes to which various Fidelity funds are compared.
Management Fee. The Board considered two proprietary management fee comparisons for the 12-month periods shown in the chart below. The group of Lipper funds used by the Board for management fee comparisons is referred to below as the "Total Mapped Group." The Total Mapped Group is broader than the Lipper peer group used by the Board for performance comparisons because the Total Mapped Group combines several Lipper investment objective categories while the Lipper peer group does not. The Total Mapped Group comparison focuses on a fund's standing in terms of gross management fees before expense reimbursements or caps relative to the total universe of funds with comparable investment mandates, regardless of whether their management fee structures also are comparable. Funds with comparable investment mandates offer exposure to similar types of securities. Funds with comparable management fee structures have similar management fee contractual arrangements (e.g., flat rate charged for advisory services, all-inclusive fee rate, etc.). "TMG %" represents the percentage of funds in the Total Mapped Group that had management fees that were lower than the fund's. For example, a TMG % of 7% means that 93% of the funds in the Total Mapped Group had higher management fees than the fund. The "Asset-Size Peer Group" (ASPG) comparison focuses on a fund's standing relative to a subset of non-Fidelity funds within the Total Mapped Group that are similar in size and management fee structure. The ASPG represents at least 15% of the funds in the Total Mapped Group with comparable asset size and management fee structures, subject to a minimum of 50 funds (or all funds in the Total Mapped Group if fewer than 50). Additional information, such as the ASPG quartile in which the fund's management fee ranked, is also included in the chart and considered by the Board.
Annual Report
Board Approval of Investment Advisory Contracts and
Management Fees - continued
Fidelity Real Estate Income Fund
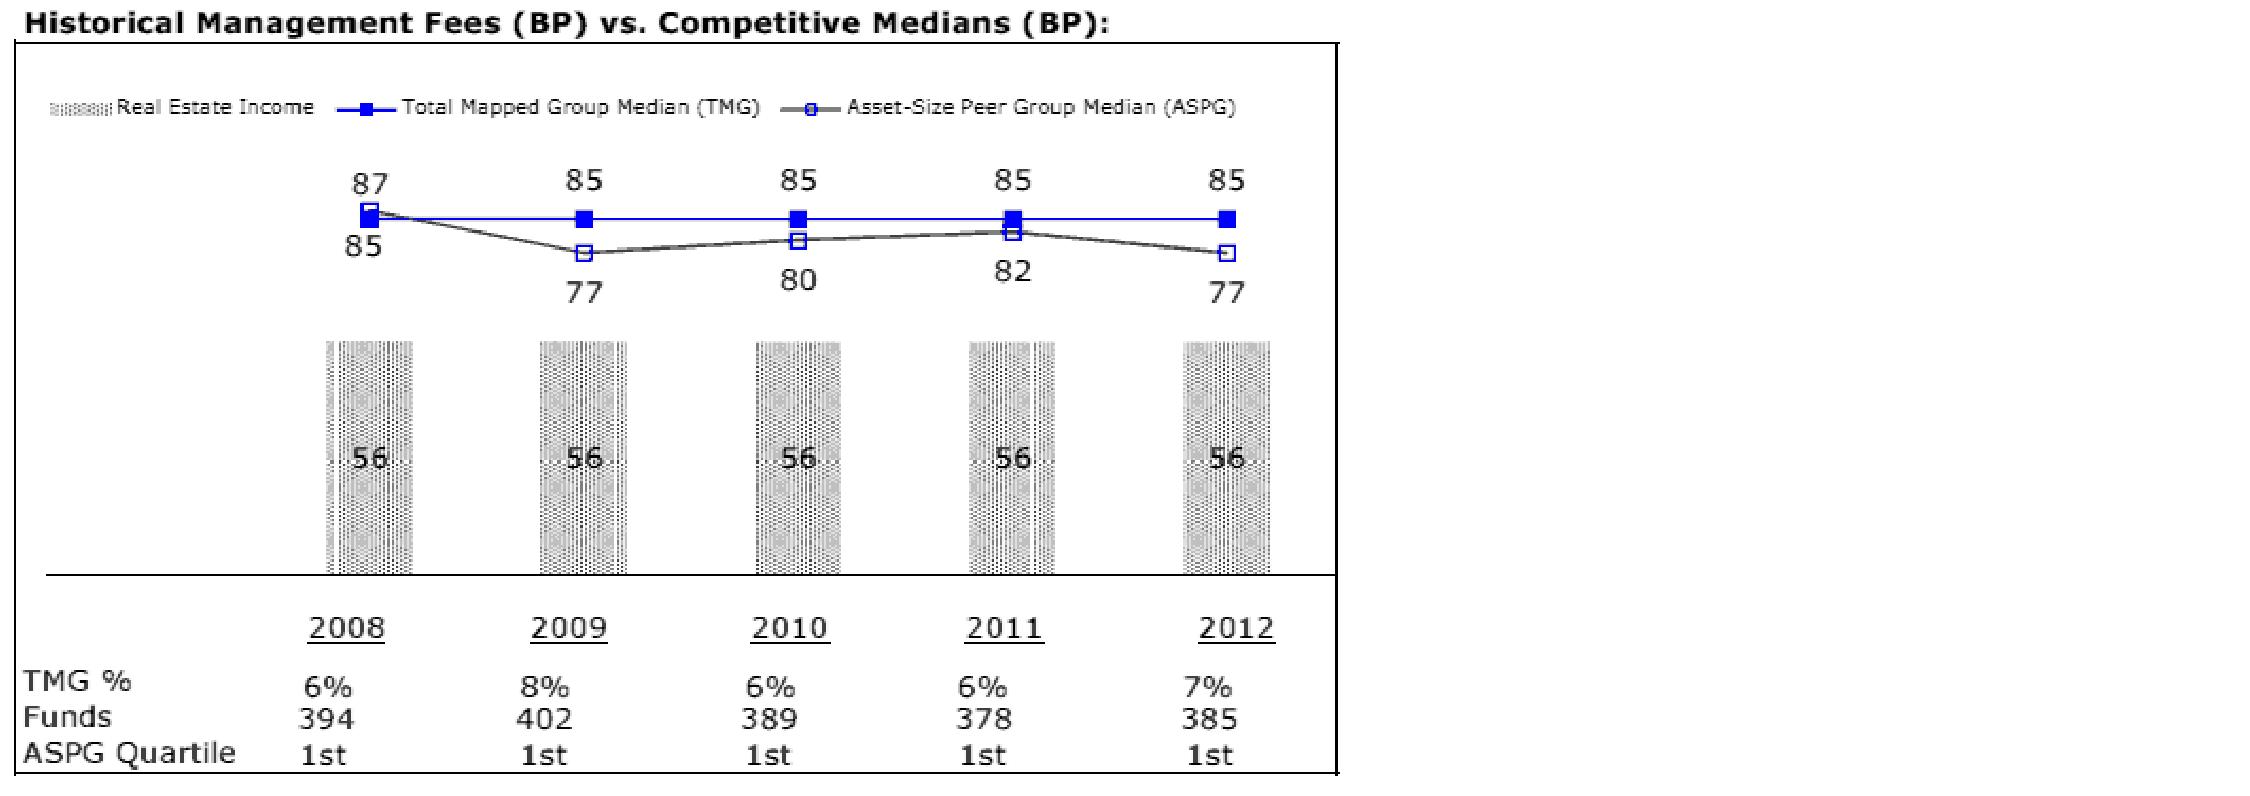
The Board noted that the fund's management fee ranked below the median of its Total Mapped Group and below the median of its ASPG for 2012.
Based on its review, the Board concluded that the fund's management fee is fair and reasonable in light of the services that the fund receives and the other factors considered.
Total Expense Ratio. In its review of each class's total expense ratio, the Board considered the fund's management fee as well as other fund or class expenses, as applicable, such as transfer agent fees, pricing and bookkeeping fees, fund-paid 12b-1 fees, and custodial, legal, and audit fees. The Board also noted the effects of any waivers and reimbursements on fees and expenses. As part of its review, the Board also considered the current and historical total expense ratios of each class of the fund compared to competitive fund median expenses. Each class of the fund is compared to those funds and classes in the Total Mapped Group (used by the Board for management fee comparisons) that have a similar sales load structure.
The Board noted that the total expense ratio of each class ranked below its competitive median for 2012.
Fees Charged to Other Fidelity Clients. The Board also considered Fidelity fee structures and other information with respect to clients of FMR and its affiliates, such as other mutual funds advised or subadvised by FMR or its affiliates, pension plan clients, and other institutional clients. The Board noted the findings of the 2013 ad hoc joint committee (created with the board of other Fidelity funds), which reviewed and compared Fidelity's institutional investment advisory business with its business of providing services to the Fidelity funds, including the differences in services provided, fees charged, and costs incurred, as well as competition in their respective marketplaces.
Annual Report
Based on its review of total expense ratios and fees charged to other Fidelity clients, the Board concluded that the total expense ratio of each class of the fund was reasonable in light of the services that the fund and its shareholders receive and the other factors considered.
Costs of the Services and Profitability. The Board considered the revenues earned and the expenses incurred by Fidelity in conducting the business of developing, marketing, distributing, managing, administering and servicing the fund and servicing the fund's shareholders. The Board also considered the level of Fidelity's profits in respect of all the Fidelity funds.
On an annual basis, FMR presents to the Board Fidelity's profitability for the fund. Fidelity calculates the profitability for each fund, as well as aggregate profitability for groups of Fidelity funds and all Fidelity funds, using a series of detailed revenue and cost allocation methodologies which originate with the books and records of Fidelity on which Fidelity's audited financial statements are based. The Audit Committee of the Board reviews any significant changes from the prior year's methodologies.
PricewaterhouseCoopers LLP (PwC), independent registered public accounting firm and auditor to Fidelity and certain Fidelity funds, has been engaged annually by the Board as part of the Board's assessment of Fidelity's profitability analysis. PwC's engagement includes the review and assessment of the methodologies used by Fidelity in determining the revenues and expenses attributable to Fidelity's mutual fund business, and completion of agreed-upon procedures surrounding the mathematical accuracy of fund profitability and its conformity to allocation methodologies. After considering PwC's reports issued under the engagement and information provided by Fidelity, the Board concluded that while other allocation methods may also be reasonable, Fidelity's profitability methodologies are reasonable in all material respects.
The Board also reviewed Fidelity's non-fund businesses and fall-out benefits related to the mutual fund business as well as cases where Fidelity's affiliates may benefit from or be related to the fund's business.
The Board considered the costs of the services provided by and the profits realized by Fidelity in connection with the operation of the fund and was satisfied that the profitability was not excessive in the circumstances.
Economies of Scale. The Board considered whether there have been economies of scale in respect of the management of the Fidelity funds, whether the Fidelity funds (including the fund) have appropriately benefited from any such economies of scale, and whether there is potential for realization of any further economies of scale. The Board considered the extent to which the fund will benefit from economies of scale through increased services to the fund, through waivers or reimbursements, or through fee or expense reductions. The Board also noted that in 2009, it and the board of other Fidelity funds created an ad hoc committee (the Economies of Scale Committee) to analyze whether FMR attains economies of scale in respect of the management and servicing of the Fidelity funds, whether the Fidelity funds have appropriately benefited from such economies of scale, and whether there is potential for realization of any further economies of scale.
Annual Report
Board Approval of Investment Advisory Contracts and
Management Fees - continued
The Board recognized that the fund's management contract incorporates a "group fee" structure, which provides for lower group fee rates as total fund assets under FMR's management increase, and for higher group fee rates as total fund assets under FMR's management decrease. FMR calculates the group fee rates based on a tiered asset "breakpoint" schedule that varies based on asset class. The Board considered that the group fee is designed to deliver the benefits of economies of scale to fund shareholders when total Fidelity fund assets increase, even if assets of any particular fund are unchanged or have declined, because some portion of Fidelity's costs are attributable to services provided to all Fidelity funds, and all funds benefit if those costs can be allocated among more assets. The Board concluded that, given the group fee structure, fund shareholders will benefit from lower management fees as assets under FMR's management increase at the fund complex level, regardless of whether Fidelity achieves any such economies of scale.
The Board concluded, taking into account the analysis of the Economies of Scale Committee, that economies of scale, if any, are being appropriately shared between fund shareholders and Fidelity.
Amendment to Description of Group Fee Rate. At its July 2013 meeting, the Board voted to approve an amendment to the fund's management contract to modify the description of the "group fee rate" effective August 1, 2013. The Board noted that under the prior description in the contract, the group fee rate was based on the average net assets of all registered investment companies with which FMR has management contracts. Under the contract's tiered asset breakpoint schedule, the group fee rate is lower as total fund assets under FMR's management increase, and higher as total fund assets under FMR's management decrease. The Board considered that the prior description would have excluded the assets of 64 Fidelity sector funds from the group fee rate calculation once Fidelity SelectCo, LLC, an affiliate of FMR, assumed management responsibilities for those funds. The Board noted that modifying the description of the group fee rate to continue to include the assets of those 64 funds for purposes of determining group fee rate breakpoints would avoid an immediate adverse impact on the group fee rate for any fund.
Additional Information Requested by the Board. In order to develop fully the factual basis for consideration of the Fidelity funds' Advisory Contracts, the Board requested and received additional information on certain topics, including: (i) fund performance trends and Fidelity's long-term strategies for certain funds; (ii) the potential to further rationalize the Fidelity fund lineup with the possibility of achieving savings for the funds and Fidelity; (iii) the methodology with respect to competitive fund data and peer group classifications; (iv) the arrangements with, and performance of, certain sub-advisers on behalf of the Fidelity funds, as well as certain proposed participating affiliate arrangements; (v) the realization of fall-out benefits in certain Fidelity business units; (vi) Fidelity's group fee structures, including the rationale for the individual fee rates of certain categories of funds and the definition of group assets; (vii) trends regarding industry use of performance fee structures and the performance adjustment methodologies applicable to the Fidelity funds; (viii) additional competitive analysis regarding the total expenses for certain classes; and (ix) fund profitability methodology, including Fidelity's cost allocation methodology, and the impact of certain factors on fund profitability results.
Annual Report
Based on its evaluation of all of the conclusions noted above, and after considering all factors it believed relevant, the Board ultimately concluded that the advisory fee structures are fair and reasonable, and that the fund's Advisory Contracts should be renewed.
Annual Report
Investment Adviser
Fidelity Management & Research Company
Boston, MA
Investment Sub-Advisers
FMR Co., Inc.
Fidelity Management & Research
(Hong Kong) Limited
Fidelity Management & Research
(Japan) Inc.
Fidelity Management & Research
(U.K.) Inc.
General Distributor
Fidelity Distributors Corporation
Smithfield, RI
Transfer and Service Agents
Fidelity Investments Institutional Operations Company, Inc.
Boston, MA
Fidelity Service Company, Inc.
Boston, MA
Custodian
Citibank, N.A.
New York, NY
(Fidelity Investment logo)(registered trademark)
REIA-UANN-0913
1.907548.103
(Fidelity Investment logo)(registered trademark)
Fidelity Advisor®
Real Estate Income
Fund - Institutional Class
Annual Report
July 31, 2013
(Fidelity Cover Art)
Institutional Class
is a class of Fidelity®
Real Estate Income Fund
Contents
Performance | (Click Here) | How the fund has done over time. |
Management's Discussion of Fund Performance | (Click Here) | The Portfolio Manager's review of fund performance and strategy. |
Shareholder Expense Example | (Click Here) | An example of shareholder expenses. |
Investment Changes | (Click Here) | A summary of major shifts in the fund's investments over the past six months. |
Investments | (Click Here) | A complete list of the fund's investments with their market values. |
Financial Statements | (Click Here) | Statements of assets and liabilities, operations, and changes in net assets, as well as financial highlights. |
Notes | (Click Here) | Notes to the financial statements. |
Report of Independent Registered Public Accounting Firm | (Click Here) | |
Trustees and Officers | (Click Here) | |
Distributions | (Click Here) | |
Board Approval of Investment Advisory Contracts and Management Fees | (Click Here) | |
To view a fund's proxy voting guidelines and proxy voting record for the 12-month period ended June 30, visit http://www.fidelity.com/proxyvotingresults or visit the Securities and Exchange Commission's (SEC) web site at http://www.sec.gov. You may also call 1-877-208-0098 to request a free copy of the proxy voting guidelines.
Standard & Poor's, S&P and S&P 500 are registered service marks of The McGraw-Hill Companies, Inc. and have been licensed for use by Fidelity Distributors Corporation.
Other third-party marks appearing herein are the property of their respective owners.
All other marks appearing herein are registered or unregistered trademarks or service marks of FMR LLC or an affiliated company. © 2013 FMR LLC. All rights reserved.
Annual Report
This report and the financial statements contained herein are submitted for the general information of the shareholders of the fund. This report is not authorized for distribution to prospective investors in the fund unless preceded or accompanied by an effective prospectus.
A fund files its complete schedule of portfolio holdings with the SEC for the first and third quarters of each fiscal year on Form N-Q. Forms N-Q are available on the SEC's web site at http://www.sec.gov. A fund's Forms N-Q may be reviewed and copied at the SEC's Public Reference Room in Washington, DC. Information regarding the operation of the SEC's Public Reference Room may be obtained by calling 1-800-SEC-0330. For a complete list of a fund's portfolio holdings, view the most recent holdings listing, semiannual report, or annual report on Fidelity's web site at http://www.fidelity.com, http://www.advisor.fidelity.com, or http://www.401k.com, as applicable.
NOT FDIC INSURED • MAY LOSE VALUE • NO BANK GUARANTEE
Neither the fund nor Fidelity Distributors Corporation is a bank.
Annual Report
Average annual total return reflects the change in the value of an investment, assuming reinvestment of the class' distributions from dividend income and capital gains (the profits earned upon the sale of securities that have grown in value, if any) and assuming a constant rate of performance each year. The $10,000 table and the fund's returns do not reflect the deduction of taxes that a shareholder would pay on fund distributions or the redemption of fund shares. During periods of reimbursement by Fidelity, a fund's total return will be greater than it would be had the reimbursement not occurred. How a fund did yesterday is no guarantee of how it will do tomorrow.
Average Annual Total Returns
Periods ended July 31, 2013 | Past 1
year | Past 5
years | Past 10
years |
Institutional ClassA | 10.72% | 10.86% | 7.50% |
A The initial offering of Institutional Class shares took place on April 14, 2010. Returns prior to April 14, 2010 are those of Fidelity® Real Estate Income Fund, the original class of the fund.
$10,000 Over 10 Years
Let's say hypothetically that $10,000 was invested in Fidelity Advisor® Real Estate Income Fund - Institutional Class on July 31, 2003. The chart shows how the value of your investment would have changed, and also shows how the S&P 500® Index performed over the same period. The initial offering of Institutional Class took place on April 14, 2010. See footnote A above for additional information regarding the performance of Institutional Class.
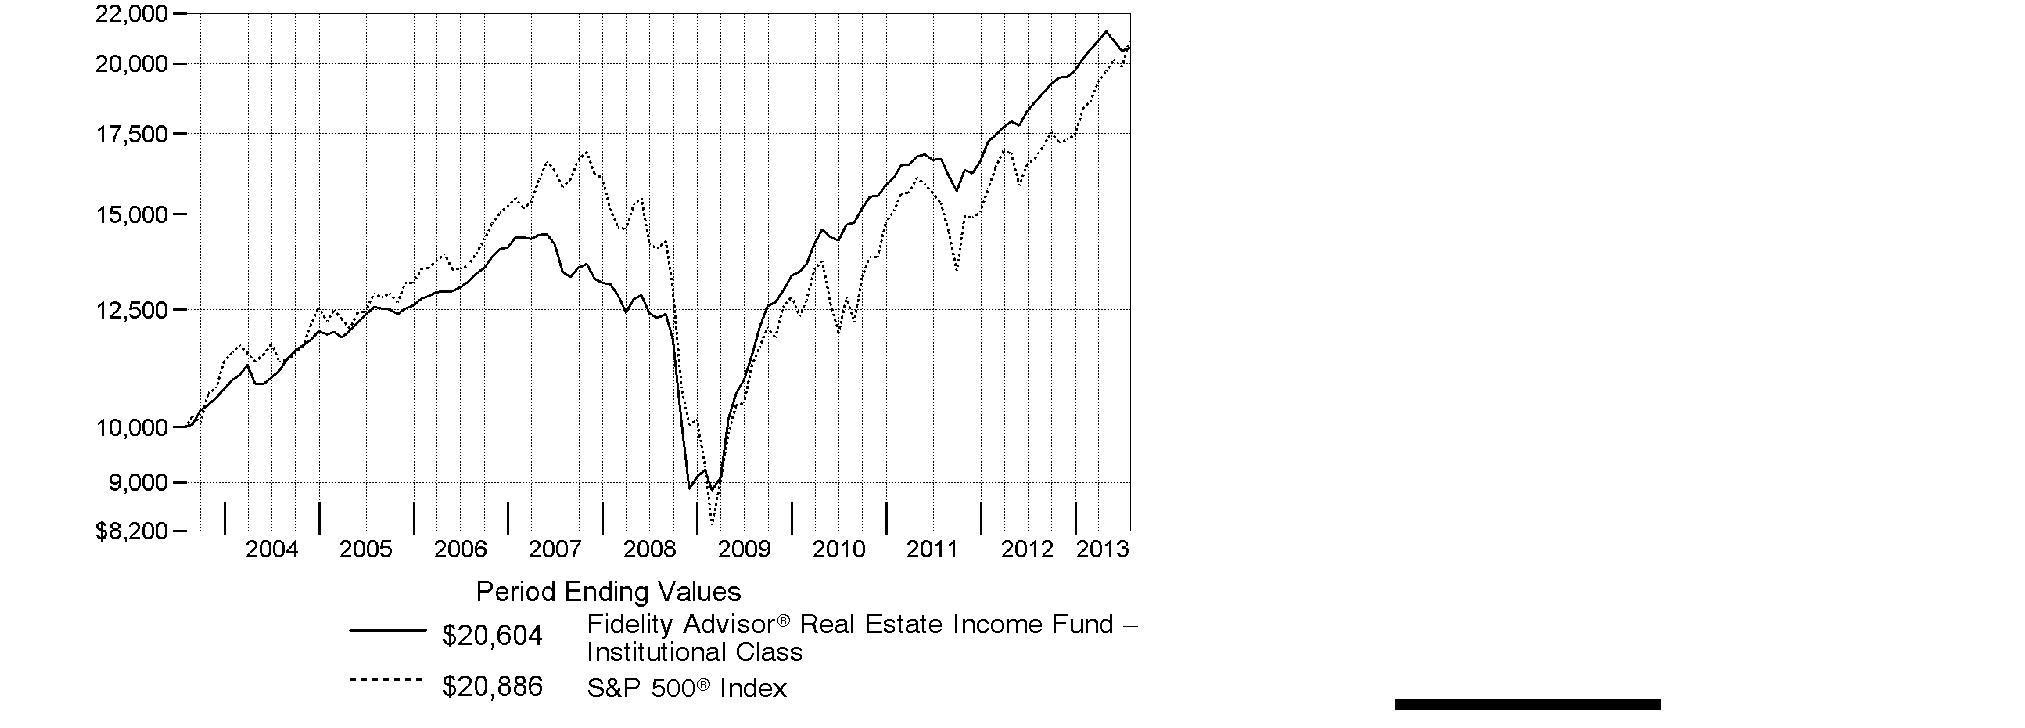
Annual Report
Market Recap: The fundamentals for commercial and residential property remained good throughout the 12-month period ending July 31, 2013. On the commercial side, demand continued to increase faster than the supply of new buildings, which, in turn, helped lift rental and occupancy rates. Meanwhile, single-family home prices continued to rise, boosting the slow-growing U.S. economy. For most of the period, real estate investment trust (REIT) common stocks performed well, although that situation abruptly reversed in May, when the Federal Reserve signaled its desire to bring its "quantitative easing" economic stimulus approach to a close. This caused a steep rise in interest rates, which weighed on the REIT market. Still, REIT stocks were positive performers for the 12 months, as the FTSE® NAREIT® All REITs Index gained 7.82%. Meanwhile, real estate bonds, reflected by The BofA Merrill LynchSM US Real Estate Index - a market-capitalization-weighted measure of the performance of investment-grade public debt of corporate issuers in the domestic real estate sector - rose 2.21%. The MSCI® REIT Preferred Index, which reflects the performance of real estate preferred stocks, returned 1.32%, while the broad U.S. equity market, as measured by the S&P 500® Index, generated a robust return of 25.00%.
Comments from Mark Snyderman, Portfolio Manager of Fidelity Advisor® Real Estate Income Fund: For the year, the fund's Institutional Class shares gained 10.72%. In comparison, the Fidelity Real Estate Income Composite IndexSM - a 40/40/20 blend of the MSCI index, The BofA Merrill Lynch index and the FTSE® NAREIT® index, respectively - rose 3.02%. My strategy includes using thorough credit research to capitalize on inefficiencies in real estate securities markets. During the period, the fund's real estate investment trust (REIT) common stocks returned 21% - far ahead of the FTSE NAREIT index. Here, positions in net-lease companies Lexington Corporate Properties Trust and CapLease each added value. In contrast, mortgage REIT CYS Investments turned out to be more sensitive to the effects of rising interest rates than I anticipated, while student housing REIT American Campus Communities also lagged. Meanwhile, the fund's preferred real estate stocks were up roughly 7%, outpacing the MSCI index, thanks to my focus on higher-yielding preferreds. On the fixed-income side, commercial mortgage-backed securities, high-yield real estate bonds and investment-grade real estate bonds all handily beat the 2% return of the BofA Merrill Lynch index. The fund especially benefited from an investment in the bonds of commercial finance REIT iStar Financial. The fund's average cash weighting of 8%, however, limited the fund's upside.
The views expressed above reflect those of the portfolio manager(s) only through the end of the period as stated on the cover of this report and do not necessarily represent the views of Fidelity or any other person in the Fidelity organization. Any such views are subject to change at any time based upon market or other conditions and Fidelity disclaims any responsibility to update such views. These views may not be relied on as investment advice and, because investment decisions for a Fidelity fund are based on numerous factors, may not be relied on as an indication of trading intent on behalf of any Fidelity fund.
Annual Report
Shareholder Expense Example
As a shareholder of the Fund, you incur two types of costs: (1) transaction costs, including sales charges (loads) on purchase payments or redemption proceeds, redemption fees and (2) ongoing costs, including management fees, distribution and/or service (12b-1) fees and other Fund expenses. This Example is intended to help you understand your ongoing costs (in dollars) of investing in the Fund and to compare these costs with the ongoing costs of investing in other mutual funds.
The Example is based on an investment of $1,000 invested at the beginning of the period and held for the entire period (February 1, 2013 to July 31, 2013).
Actual Expenses
The first line of the accompanying table for each class of the Fund provides information about actual account values and actual expenses. You may use the information in this line, together with the amount you invested, to estimate the expenses that you paid over the period. Simply divide your account value by $1,000.00 (for example, an $8,600 account value divided by $1,000.00 = 8.6), then multiply the result by the number in the first line for a class of the Fund under the heading entitled "Expenses Paid During Period" to estimate the expenses you paid on your account during this period. A small balance maintenance fee of $12.00 that is charged once a year may apply for certain accounts with a value of less than $2,000. This fee is not included in the table below. If it was, the estimate of expenses you paid during the period would be higher, and your ending account value lower, by this amount. In addition, the Fund, as a shareholder in the underlying Fidelity Central Funds, will indirectly bear its pro-rata share of the fees and expenses incurred by the underlying Fidelity Central Funds. These fees and expenses are not included in the Fund's annualized expense ratio used to calculate the expense estimate in the table below.
Hypothetical Example for Comparison Purposes
The second line of the accompanying table for each class of the Fund provides information about hypothetical account values and hypothetical expenses based on a Class' actual expense ratio and an assumed rate of return of 5% per year before expenses, which is not the Class' actual return. The hypothetical account values and expenses may not be used to estimate the actual ending account balance or expenses you paid for the period. You may use this information to compare the ongoing costs of investing in the Fund and other funds. To do so, compare this 5% hypothetical example with the 5% hypothetical examples that appear in the shareholder reports of the other funds. A small balance maintenance fee of $12.00 that is charged once a year may apply for certain accounts with a value of less than $2,000. This fee is not included in the table below. If it was, the estimate of expenses you paid during the period would be higher, and your ending account value lower, by this amount. In addition, the Fund, as a shareholder in the underlying Fidelity Central Funds, will indirectly bear its pro-rata share of the fees and expenses incurred by the underlying Fidelity Central Funds. These fees and expenses are not included in the Fund's annualized expense ratio used to calculate the expense estimate in the table below.
Please note that the expenses shown in the table are meant to highlight your ongoing costs only and do not reflect any transaction costs. Therefore, the second line of the table is useful in comparing ongoing costs only, and will not help you determine the relative total costs of owning different funds. In addition, if these transactional costs were included, your costs would have been higher.
Annual Report
| Annualized
Expense RatioB | Beginning
Account Value
February 1, 2013 | Ending
Account Value
July 31, 2013 | Expenses Paid
During Period*
February 1, 2013
to July 31, 2013 |
Class A | 1.07% | | | |
Actual | | $ 1,000.00 | $ 1,018.40 | $ 5.35 |
HypotheticalA | | $ 1,000.00 | $ 1,019.49 | $ 5.36 |
Class T | 1.08% | | | |
Actual | | $ 1,000.00 | $ 1,018.40 | $ 5.40 |
HypotheticalA | | $ 1,000.00 | $ 1,019.44 | $ 5.41 |
Class C | 1.80% | | | |
Actual | | $ 1,000.00 | $ 1,014.30 | $ 8.99 |
HypotheticalA | | $ 1,000.00 | $ 1,015.87 | $ 9.00 |
Real Estate Income | .83% | | | |
Actual | | $ 1,000.00 | $ 1,019.10 | $ 4.16 |
HypotheticalA | | $ 1,000.00 | $ 1,020.68 | $ 4.16 |
Institutional Class | .79% | | | |
Actual | | $ 1,000.00 | $ 1,019.50 | $ 3.96 |
HypotheticalA | | $ 1,000.00 | $ 1,020.88 | $ 3.96 |
A 5% return per year before expenses
B Annualized expense ratio reflects expenses net of applicable fee waivers.
* Expenses are equal to each Class' annualized expense ratio, multiplied by the average account value over the period, multiplied by 181/365 (to reflect the one-half year period).
Annual Report
Investment Changes (Unaudited)
Top Five Stocks as of July 31, 2013 |
| % of fund's
net assets | % of fund's net assets
6 months ago |
MFA Financial, Inc. | 2.5 | 2.0 |
Equity Lifestyle Properties, Inc. | 2.1 | 1.8 |
Acadia Realty Trust (SBI) | 1.6 | 1.4 |
Ventas, Inc. | 1.5 | 1.7 |
CBL & Associates Properties, Inc. | 1.0 | 0.9 |
| 8.7 | |
Top 5 Bonds as of July 31, 2013 |
| % of fund's
net assets | % of fund's net assets
6 months ago |
Hilton Worldwide, Inc. term loan 4.442% 11/12/15 | 1.3 | 1.0 |
Banc of America Large Loan Trust floater Series 2010-HLTN Class HLTN, 2.491% 11/15/15 | 1.3 | 2.9 |
iStar Financial, Inc. Tranche B, term loan 4.5% 10/15/17 | 0.9 | 0.6 |
iStar Financial, Inc. 5.875% 3/15/16 | 0.9 | 1.0 |
Annaly Capital Management, Inc. 5% 5/15/15 | 0.8 | 1.0 |
| 5.2 | |
Top Five REIT Sectors as of July 31, 2013 |
| % of fund's
net assets | % of fund's net assets
6 months ago |
REITs - Mortgage | 15.3 | 12.7 |
REITs - Management/Investment | 8.9 | 8.2 |
REITs - Health Care Facilities | 6.2 | 6.5 |
REITs - Shopping Centers | 5.3 | 6.1 |
REITs - Apartments | 5.1 | 2.8 |
Asset Allocation (% of fund's net assets) |
As of July 31, 2013 * | As of January 31, 2013 ** |
| Common Stocks 32.7% | | | Common Stocks 26.1% | |
| Preferred Stocks 12.8% | | | Preferred Stocks 13.5% | |
| Bonds 33.2% | | | Bonds 39.9% | |
| Convertible
Securities 3.8% | | | Convertible
Securities 3.5% | |
| Other Investments 11.0% | | | Other Investments 8.6% | |
| Short-Term
Investments and
Net Other Assets
(Liabilities) 6.5% | | | Short-Term
Investments and
Net Other Assets
(Liabilities) 8.4% | |
* Foreign investments | 3.4% | | ** Foreign investments | 3.8% | |

Annual Report
Investments July 31, 2013
Showing Percentage of Net Assets
Common Stocks - 32.7% |
| Shares | | Value |
CONSUMER DISCRETIONARY - 0.6% |
Hotels, Restaurants & Leisure - 0.3% |
Hyatt Hotels Corp. Class A (a) | 257,400 | | $ 11,647,350 |
Household Durables - 0.3% |
NVR, Inc. (a) | 6,700 | | 6,201,520 |
Standard Pacific Corp. (a) | 464,495 | | 3,799,569 |
Stanley Martin Communities LLC Class B (a) | 4,620 | | 4,902,236 |
| | 14,903,325 |
TOTAL CONSUMER DISCRETIONARY | | 26,550,675 |
FINANCIALS - 31.0% |
Capital Markets - 0.3% |
Ellington Financial LLC | 519,500 | | 11,803,040 |
Real Estate Investment Trusts - 29.9% |
Acadia Realty Trust (SBI) | 2,606,449 | | 67,194,255 |
AG Mortgage Investment Trust, Inc. | 578,800 | | 10,499,432 |
American Campus Communities, Inc. | 392,100 | | 15,060,561 |
American Residential Properties, Inc. (a)(h) | 453,000 | | 7,945,620 |
American Residential Properties, Inc. (a) | 121,941 | | 2,138,845 |
American Tower Corp. | 366,600 | | 25,951,614 |
Anworth Mortgage Asset Corp. | 1,320,710 | | 6,418,651 |
Apartment Investment & Management Co. Class A | 1,317,300 | | 38,702,274 |
Arbor Realty Trust, Inc. (g) | 2,799,375 | | 21,107,288 |
Associated Estates Realty Corp. (f) | 781,408 | | 11,939,914 |
AvalonBay Communities, Inc. | 197,000 | | 26,661,980 |
BioMed Realty Trust, Inc. | 1,145,500 | | 23,666,030 |
Blackstone Mortgage Trust, Inc. | 280,900 | | 7,101,152 |
Boardwalk (REIT) | 126,200 | | 7,079,782 |
Canadian (REIT) | 131,600 | | 5,275,019 |
CapLease, Inc. | 2,656,300 | | 22,525,424 |
CBL & Associates Properties, Inc. | 1,845,873 | | 42,030,528 |
Cedar Shopping Centers, Inc. | 921,410 | | 5,104,611 |
Chambers Street Properties (f) | 687,393 | | 5,561,009 |
Chartwell Retirement Residence | 459,700 | | 4,372,767 |
Chartwell Retirement Residence (h) | 78,500 | | 746,709 |
Chesapeake Lodging Trust | 513,600 | | 11,766,576 |
CYS Investments, Inc. (f) | 2,004,739 | | 16,639,334 |
DCT Industrial Trust, Inc. | 1,235,100 | | 9,275,601 |
DiamondRock Hospitality Co. | 623,300 | | 6,046,010 |
Douglas Emmett, Inc. | 846,300 | | 21,165,963 |
DuPont Fabros Technology, Inc. | 316,600 | | 7,253,306 |
Common Stocks - continued |
| Shares | | Value |
FINANCIALS - continued |
Real Estate Investment Trusts - continued |
Dynex Capital, Inc. | 1,893,043 | | $ 18,192,143 |
EastGroup Properties, Inc. | 209,900 | | 12,984,414 |
Education Realty Trust, Inc. | 402,600 | | 3,796,518 |
Ellington Residential Mortgage REIT (f) | 230,000 | | 3,569,600 |
Equity Lifestyle Properties, Inc. | 2,264,560 | | 87,162,914 |
Equity Residential (SBI) | 491,300 | | 27,512,800 |
Excel Trust, Inc. | 1,333,928 | | 17,314,385 |
Extra Space Storage, Inc. | 100,300 | | 4,217,615 |
First Potomac Realty Trust | 1,349,015 | | 18,306,134 |
Glimcher Realty Trust | 1,192,200 | | 13,400,328 |
H&R REIT/H&R Finance Trust | 284,100 | | 5,977,413 |
Hatteras Financial Corp. | 438,000 | | 8,799,420 |
HCP, Inc. | 199,000 | | 8,730,130 |
Highwoods Properties, Inc. (SBI) | 245,000 | | 8,888,600 |
Lexington Corporate Properties Trust | 3,246,382 | | 40,709,630 |
LTC Properties, Inc. | 499,513 | | 19,316,168 |
MFA Financial, Inc. | 12,948,193 | | 103,326,569 |
Mid-America Apartment Communities, Inc. (f) | 525,200 | | 35,477,260 |
Monmouth Real Estate Investment Corp. Class A | 249,773 | | 2,442,780 |
National Retail Properties, Inc. | 173,700 | | 6,077,763 |
New Residential Investment Corp. | 923,600 | | 6,123,468 |
Newcastle Investment Corp. | 2,964,200 | | 17,192,360 |
NorthStar Realty Finance Corp. (f) | 2,867,700 | | 28,103,460 |
Parkway Properties, Inc. | 135,008 | | 2,362,640 |
Piedmont Office Realty Trust, Inc. Class A | 949,200 | | 17,171,028 |
Prologis, Inc. | 819,387 | | 31,431,685 |
RAIT Financial Trust | 150,000 | | 1,134,000 |
Rayonier, Inc. | 259,800 | | 15,182,712 |
Redwood Trust, Inc. | 330,000 | | 5,590,200 |
Retail Properties America, Inc. | 897,650 | | 12,647,889 |
Select Income (REIT) | 416,600 | | 11,239,868 |
Senior Housing Properties Trust (SBI) | 911,300 | | 22,919,195 |
Simon Property Group, Inc. | 146,800 | | 23,496,808 |
Stag Industrial, Inc. | 848,669 | | 17,592,908 |
Summit Hotel Properties, Inc. | 692,000 | | 7,003,040 |
Terreno Realty Corp. | 1,204,564 | | 22,091,704 |
Two Harbors Investment Corp. | 1,560,480 | | 15,651,614 |
Ventas, Inc. | 966,746 | | 63,553,882 |
Washington (REIT) (SBI) | 471,900 | | 12,684,672 |
Weyerhaeuser Co. | 323,400 | | 9,184,560 |
Common Stocks - continued |
| Shares | | Value |
FINANCIALS - continued |
Real Estate Investment Trusts - continued |
Whitestone REIT Class B (f) | 183,267 | | $ 2,965,260 |
WP Carey, Inc. (f) | 161,500 | | 11,405,130 |
| | 1,232,160,922 |
Real Estate Management & Development - 0.6% |
Brookfield Asset Management, Inc. Class A | 267,600 | | 9,903,102 |
Howard Hughes Corp. (a) | 26,500 | | 2,894,065 |
Kennedy-Wilson Holdings, Inc. | 664,021 | | 11,354,759 |
| | 24,151,926 |
Thrifts & Mortgage Finance - 0.2% |
Home Loan Servicing Solutions Ltd. | 388,800 | | 9,731,664 |
TOTAL FINANCIALS | | 1,277,847,552 |
HEALTH CARE - 1.1% |
Health Care Providers & Services - 1.1% |
Brookdale Senior Living, Inc. (a) | 1,081,000 | | 31,478,720 |
Emeritus Corp. (a) | 562,574 | | 13,046,091 |
| | 44,524,811 |
TOTAL COMMON STOCKS (Cost $1,192,449,014) |
1,348,923,038
|
Preferred Stocks - 13.9% |
| | | |
Convertible Preferred Stocks - 1.1% |
FINANCIALS - 1.1% |
Real Estate Investment Trusts - 1.1% |
Alexandria Real Estate Equities, Inc. Series D 7.00% | 95,000 | | 2,410,625 |
CommonWealth REIT 6.50% | 396,216 | | 9,041,649 |
Excel Trust, Inc. 7.00% (h) | 248,200 | | 6,170,252 |
Health Care REIT, Inc. Series I, 6.50% | 46,800 | | 2,808,000 |
Lexington Corporate Properties Trust Series C, 6.50% | 388,432 | | 18,838,952 |
Ramco-Gershenson Properties Trust (SBI) Series D, 7.25% | 40,000 | | 2,327,600 |
Weyerhaeuser Co. Series A, 6.375% (a) | 20,000 | | 1,039,400 |
| | 42,636,478 |
Preferred Stocks - continued |
| Shares | | Value |
Nonconvertible Preferred Stocks - 12.8% |
CONSUMER DISCRETIONARY - 0.1% |
Hotels, Restaurants & Leisure - 0.1% |
Red Lion Hotels Capital Trust 9.50% | 162,925 | | $ 4,218,128 |
FINANCIALS - 12.7% |
Capital Markets - 0.1% |
Arlington Asset Investment Corp. 6.625% | 182,517 | | 4,290,975 |
Real Estate Investment Trusts - 12.1% |
AG Mortgage Investment Trust, Inc. 8.00% | 324,817 | | 7,675,426 |
American Capital Agency Corp. 8.00% | 200,000 | | 5,070,000 |
American Home Mortgage Investment Corp.: | | | |
Series A, 9.375% (a) | 120,300 | | 12 |
Series B, 9.25% (a) | 124,100 | | 12 |
Annaly Capital Management, Inc.: | | | |
Series A, 7.875% | 134,900 | | 3,403,527 |
Series C, 7.625% | 77,837 | | 1,931,136 |
Series D, 7.50% | 213,116 | | 5,157,407 |
Anworth Mortgage Asset Corp. Series A, 8.625% | 309,630 | | 7,802,676 |
Apollo Commercial Real Estate Finance, Inc. Series A, 8.625% | 375,101 | | 9,692,610 |
Apollo Residential Mortgage, Inc. Series A, 8.00% | 279,276 | | 6,702,624 |
Arbor Realty Trust, Inc.: | | | |
Series A, 8.25% (g) | 189,089 | | 4,748,025 |
Series B, 7.75% (a)(g) | 240,000 | | 5,901,600 |
Armour Residential REIT, Inc. Series B, 7.875% | 153,654 | | 3,595,504 |
Ashford Hospitality Trust, Inc.: | | | |
Series D, 8.45% | 27,000 | | 679,050 |
Series E, 9.00% | 85,751 | | 2,263,826 |
Boston Properties, Inc. 5.25% | 50,000 | | 1,217,500 |
Campus Crest Communities, Inc. Series A, 8.00% | 248,431 | | 6,501,439 |
CapLease, Inc.: | | | |
Series A, 8.125% | 70,306 | | 1,766,087 |
Series B, 8.375% | 439,766 | | 11,082,103 |
Series C, 7.25% | 210,000 | | 5,315,100 |
Capstead Mortgage Corp. Series E, 7.50% | 202,984 | | 4,851,318 |
CBL & Associates Properties, Inc.: | | | |
7.375% | 289,876 | | 7,272,989 |
Series E, 6.625% | 95,000 | | 2,310,400 |
Cedar Shopping Centers, Inc. Series B, 7.25% | 326,128 | | 8,185,813 |
CenterPoint Properties Trust Series D, 5.377% | 3,575 | | 2,288,000 |
Chesapeake Lodging Trust Series A, 7.75% | 266,916 | | 6,776,997 |
Colony Financial, Inc. Series A, 8.50% | 282,171 | | 7,333,624 |
CommonWealth REIT 7.50% | 93,300 | | 1,949,037 |
Preferred Stocks - continued |
| Shares | | Value |
Nonconvertible Preferred Stocks - continued |
FINANCIALS - continued |
Real Estate Investment Trusts - continued |
Coresite Realty Corp. Series A, 7.25% | 258,224 | | $ 6,473,676 |
Corporate Office Properties Trust Series L, 7.375% | 80,000 | | 2,099,200 |
CubeSmart Series A, 7.75% | 40,000 | | 1,056,000 |
CYS Investments, Inc.: | | | |
Series A, 7.75% | 117,824 | | 2,733,517 |
Series B, 7.50% (a) | 311,567 | | 7,075,687 |
DDR Corp.: | | | |
Series J, 6.50% | 237,721 | | 5,702,927 |
Series K, 6.25% | 228,888 | | 5,481,868 |
Digital Realty Trust, Inc.: | | | |
Series E, 7.00% | 40,000 | | 1,000,000 |
Series G, 5.875% | 145,444 | | 3,141,590 |
Duke Realty LP Series L, 6.60% | 10,666 | | 266,543 |
Dynex Capital, Inc.: | | | |
Series A, 8.50% | 362,932 | | 9,109,593 |
Series B, 7.625% | 252,120 | | 5,889,523 |
Equity Lifestyle Properties, Inc. Series C, 6.75% | 924,148 | | 23,288,530 |
Essex Property Trust, Inc. Series H, 7.125% | 40,000 | | 1,032,000 |
Excel Trust, Inc. Series B, 8.125% | 400,000 | | 10,272,000 |
First Potomac Realty Trust 7.75% | 415,296 | | 10,847,532 |
General Growth Properties, Inc. Series A, 6.375% | 40,986 | | 940,219 |
Gladstone Commercial Corp. Series C, 7.125% | 232,238 | | 6,003,352 |
Glimcher Realty Trust: | | | |
6.875% | 256,115 | | 6,282,501 |
Series G, 8.125% | 109,192 | | 2,765,833 |
Series H, 7.50% | 198,527 | | 5,058,468 |
Hatteras Financial Corp. Series A, 7.625% | 197,288 | | 4,728,993 |
Health Care REIT, Inc. Series J, 6.50% | 20,000 | | 506,000 |
Hersha Hospitality Trust: | | | |
Series B, 8.00% | 162,538 | | 4,185,354 |
Series C, 6.875% | 50,000 | | 1,205,000 |
Hospitality Properties Trust Series D, 7.125% | 40,800 | | 1,041,216 |
Hudson Pacific Properties, Inc. 8.375% | 394,069 | | 10,328,548 |
Inland Real Estate Corp. Series A, 8.125% | 423,500 | | 10,867,010 |
Invesco Mortgage Capital, Inc. Series A, 7.75% | 113,342 | | 2,707,740 |
Investors Real Estate Trust Series B, 7.95% | 126,572 | | 3,278,215 |
iStar Financial, Inc.: | | | |
Series E, 7.875% | 156,008 | | 3,747,312 |
Series F, 7.80% | 279,421 | | 6,669,779 |
Preferred Stocks - continued |
| Shares | | Value |
Nonconvertible Preferred Stocks - continued |
FINANCIALS - continued |
Real Estate Investment Trusts - continued |
Kilroy Realty Corp. Series G, 6.875% | 40,000 | | $ 979,600 |
Kite Realty Group Trust 8.25% | 96,100 | | 2,504,366 |
LaSalle Hotel Properties: | | | |
Series G, 7.25% | 42,026 | | 1,050,230 |
Series H, 7.50% | 126,308 | | 3,190,540 |
Series I, 6.375% | 192,698 | | 4,470,594 |
LBA Realty Fund II: | | | |
Series A, 8.75% (a) | 69,000 | | 2,742,750 |
Series B, 7.625% | 31,240 | | 609,180 |
MFA Financial, Inc.: | | | |
8.00% | 538,930 | | 13,672,654 |
Series B, 7.50% (a) | 567,024 | | 13,466,820 |
Monmouth Real Estate Investment Corp.: | | | |
7.625% | 80,000 | | 2,063,200 |
Series B, 7.875% | 95,000 | | 2,464,300 |
National Retail Properties, Inc.: | | | |
5.70% (a) | 82,104 | | 1,823,530 |
Series D, 6.625% | 62,437 | | 1,561,549 |
New York Mortgage Trust, Inc. Series B, 7.75% | 123,101 | | 2,891,642 |
Newcastle Investment Corp. Series B, 9.75% | 14,660 | | 384,092 |
NorthStar Realty Finance Corp.: | | | |
Series B, 8.25% | 225,708 | | 5,631,415 |
Series C, 8.875% | 275,338 | | 7,007,352 |
Series D, 8.50% | 161,601 | | 4,085,273 |
Pebblebrook Hotel Trust: | | | |
Series A, 7.875% | 372,000 | | 9,486,000 |
Series B, 8.00% | 185,085 | | 4,784,447 |
Series C, 6.50% | 178,160 | | 4,184,978 |
Pennsylvania (REIT) 7.375% | 76,510 | | 1,917,341 |
Prologis, Inc. Series Q, 8.54% | 94,446 | | 5,772,540 |
PS Business Parks, Inc. 6.875% | 50,000 | | 1,257,000 |
Regency Centers Corp. Series 6, 6.625% | 62,261 | | 1,557,148 |
Retail Properties America, Inc. 7.00% | 194,782 | | 4,733,203 |
Sabra Health Care REIT, Inc. Series A, 7.125% | 200,000 | | 5,090,000 |
Saul Centers, Inc.: | | | |
8.00% | 38,072 | | 967,410 |
Series C, 6.875% | 315,478 | | 7,950,046 |
Stag Industrial, Inc.: | | | |
Series A, 9.00% | 280,000 | | 7,560,000 |
Preferred Stocks - continued |
| Shares | | Value |
Nonconvertible Preferred Stocks - continued |
FINANCIALS - continued |
Real Estate Investment Trusts - continued |
Stag Industrial, Inc.: - continued | | | |
Series B, 6.625% | 80,000 | | $ 1,837,600 |
Strategic Hotel & Resorts, Inc.: | | | |
Series A, 8.50% | 92,323 | | 2,215,752 |
Series B, 8.25% | 80,000 | | 1,912,000 |
Summit Hotel Properties, Inc.: | | | |
Series A, 9.25% | 138,340 | | 3,701,978 |
Series B, 7.875% | 190,173 | | 4,839,903 |
Series C, 7.125% | 153,212 | | 3,733,776 |
Sun Communities, Inc. Series A, 7.125% | 360,000 | | 9,072,000 |
Sunstone Hotel Investors, Inc. Series D, 8.00% | 60,362 | | 1,549,493 |
Taubman Centers, Inc. Series K, 6.25% | 96,120 | | 2,278,044 |
Terreno Realty Corp. Series A, 7.75% | 213,690 | | 5,523,887 |
UMH Properties, Inc. Series A, 8.25% | 600,000 | | 15,768,000 |
Urstadt Biddle Properties, Inc. Series F, 7.125% | 210,000 | | 5,363,400 |
Vornado Realty LP 7.875% | 54,682 | | 1,452,354 |
Weingarten Realty Investors (SBI) Series F, 6.50% | 49,813 | | 1,256,284 |
Winthrop Realty Trust: | | | |
7.75% | 540,000 | | 13,797,000 |
Series D, 9.25% | 65,000 | | 1,756,300 |
| | 499,176,539 |
Real Estate Management & Development - 0.5% |
Forest City Enterprises, Inc. 7.375% | 657,000 | | 16,425,000 |
Kennedy-Wilson, Inc. 7.75% | 141,574 | | 3,569,081 |
| | 19,994,081 |
TOTAL FINANCIALS | | 523,461,595 |
TOTAL NONCONVERTIBLE PREFERRED STOCKS | | 527,679,723 |
TOTAL PREFERRED STOCKS (Cost $567,835,343) |
570,316,201
|
Corporate Bonds - 19.9% |
| Principal Amount (e) | | Value |
Convertible Bonds - 2.7% |
CONSUMER DISCRETIONARY - 0.1% |
Hotels, Restaurants & Leisure - 0.1% |
Morgans Hotel Group Co. 2.375% 10/15/14 | | $ 4,510,000 | | $ 4,425,438 |
Household Durables - 0.0% |
M/I Homes, Inc. 3% 3/1/18 | | 1,790,000 | | 1,806,289 |
TOTAL CONSUMER DISCRETIONARY | | 6,231,727 |
FINANCIALS - 2.6% |
Diversified Financial Services - 0.4% |
IAS Operating Partnership LP 5% 3/15/18 (h) | | 15,490,000 | | 14,289,525 |
Real Estate Investment Trusts - 2.2% |
Annaly Capital Management, Inc. 5% 5/15/15 | | 34,396,000 | | 34,804,453 |
Ares Commercial Real Estate Corp. 7% 12/15/15 (h) | | 14,700,000 | | 14,323,313 |
CapLease, Inc. 7.5% 10/1/27 (h) | | 5,180,000 | | 5,180,000 |
Colony Financial, Inc. 5% 4/15/23 | | 9,000,000 | | 9,190,800 |
Northstar Realty Finance LP 5.375% 6/15/33 (h) | | 2,000,000 | | 2,108,000 |
Pennymac Corp. 5.375% 5/1/20 (h) | | 4,000,000 | | 3,795,000 |
Redwood Trust, Inc. 4.625% 4/15/18 | | 8,500,000 | | 8,436,250 |
Starwood Property Trust, Inc.: | | | | |
4% 1/15/19 | | 3,000,000 | | 3,163,125 |
4.55% 3/1/18 | | 9,000,000 | | 9,485,100 |
| | 90,486,041 |
Real Estate Management & Development - 0.0% |
Forest City Enterprises, Inc. 3.625% 8/15/20 (h) | | 1,000,000 | | 981,875 |
Grubb & Ellis Co. 7.95% 5/1/15 (d)(h) | | 5,500,000 | | 11,000 |
| | 992,875 |
TOTAL FINANCIALS | | 105,768,441 |
TOTAL CONVERTIBLE BONDS | | 112,000,168 |
Nonconvertible Bonds - 17.2% |
CONSUMER DISCRETIONARY - 5.7% |
Hotels, Restaurants & Leisure - 0.6% |
CityCenter Holdings LLC/CityCenter Finance Corp. 7.625% 1/15/16 | | 3,505,000 | | 3,715,300 |
FelCor Lodging LP: | | | | |
5.625% 3/1/23 | | 2,000,000 | | 1,950,000 |
Corporate Bonds - continued |
| Principal Amount (e) | | Value |
Nonconvertible Bonds - continued |
CONSUMER DISCRETIONARY - continued |
Hotels, Restaurants & Leisure - continued |
FelCor Lodging LP: - continued | | | | |
6.75% 6/1/19 | | $ 5,875,000 | | $ 6,198,125 |
RHP Hotel Properties LP/RHP Finance Co. 5% 4/15/21 (h) | | 2,000,000 | | 1,960,000 |
Times Square Hotel Trust 8.528% 8/1/26 (h) | | 8,707,232 | | 11,165,196 |
| | 24,988,621 |
Household Durables - 5.1% |
Ashton Woods USA LLC/Ashton Woods Finance Co. 6.875% 2/15/21 (h) | | 10,000,000 | | 10,175,000 |
Brookfield Residential Properties, Inc./Brookfield Residential U.S. Corp. 6.125% 7/1/22 (h) | | 1,000,000 | | 1,022,500 |
Brookfield Residential Properties, Inc. 6.5% 12/15/20 (h) | | 1,615,000 | | 1,691,713 |
D.R. Horton, Inc.: | | | | |
4.75% 5/15/17 | | 2,000,000 | | 2,080,000 |
5.75% 8/15/23 | | 2,510,000 | | 2,510,000 |
KB Home: | | | | |
5.875% 1/15/15 | | 7,000,000 | | 7,280,000 |
7.25% 6/15/18 | | 7,420,000 | | 8,106,350 |
8% 3/15/20 | | 8,465,000 | | 9,438,475 |
9.1% 9/15/17 | | 17,595,000 | | 20,146,275 |
Lennar Corp.: | | | | |
4.125% 12/1/18 (h) | | 5,520,000 | | 5,326,800 |
5.6% 5/31/15 | | 6,000,000 | | 6,358,200 |
6.5% 4/15/16 | | 4,000,000 | | 4,310,000 |
6.95% 6/1/18 | | 14,280,000 | | 15,708,000 |
M/I Homes, Inc. 8.625% 11/15/18 | | 26,055,000 | | 28,399,950 |
Meritage Homes Corp.: | | | | |
7% 4/1/22 | | 7,525,000 | | 8,202,250 |
7.15% 4/15/20 | | 7,060,000 | | 7,766,000 |
Ryland Group, Inc.: | | | | |
6.625% 5/1/20 | | 1,555,000 | | 1,644,413 |
8.4% 5/15/17 | | 5,420,000 | | 6,287,200 |
Standard Pacific Corp.: | | | | |
7% 8/15/15 | | 4,000,000 | | 4,330,000 |
8.375% 5/15/18 | | 28,983,000 | | 33,547,823 |
10.75% 9/15/16 | | 8,415,000 | | 10,129,556 |
Corporate Bonds - continued |
| Principal Amount (e) | | Value |
Nonconvertible Bonds - continued |
CONSUMER DISCRETIONARY - continued |
Household Durables - continued |
Toll Brothers Finance Corp. 5.875% 2/15/22 | | $ 1,550,000 | | $ 1,619,750 |
William Lyon Homes, Inc. 8.5% 11/15/20 | | 13,595,000 | | 14,886,525 |
| | 210,966,780 |
TOTAL CONSUMER DISCRETIONARY | | 235,955,401 |
CONSUMER STAPLES - 0.0% |
Food & Staples Retailing - 0.0% |
Ahold Lease Series 2001 A1 pass thru trust certificates 7.82% 1/2/20 | | 907,635 | | 1,030,165 |
FINANCIALS - 10.2% |
Diversified Financial Services - 0.6% |
Cantor Commercial Real Estate Co. LP/CCRE Finance Corp. 7.75% 2/15/18 (h) | | 4,755,000 | | 4,873,875 |
Icahn Enterprises LP/Icahn Enterprises Finance Corp.: | | | | |
6% 8/1/20 (h) | | 3,000,000 | | 3,003,750 |
7.75% 1/15/16 | | 10,820,000 | | 11,239,275 |
8% 1/15/18 | | 5,240,000 | | 5,534,750 |
| | 24,651,650 |
Real Estate Investment Trusts - 6.7% |
Camden Property Trust 5% 6/15/15 | | 1,100,000 | | 1,177,473 |
Commercial Net Lease Realty, Inc.: | | | | |
6.15% 12/15/15 | | 2,526,000 | | 2,802,857 |
6.25% 6/15/14 | | 8,355,000 | | 8,721,676 |
CubeSmart LP 4.8% 7/15/22 | | 2,000,000 | | 2,092,340 |
Developers Diversified Realty Corp.: | | | | |
5.5% 5/1/15 | | 4,000,000 | | 4,279,748 |
7.5% 4/1/17 | | 6,000,000 | | 7,034,316 |
7.5% 7/15/18 | | 8,756,000 | | 10,495,432 |
7.875% 9/1/20 | | 4,637,000 | | 5,723,876 |
9.625% 3/15/16 | | 3,836,000 | | 4,588,017 |
Equity One, Inc.: | | | | |
5.375% 10/15/15 | | 3,500,000 | | 3,798,533 |
6.25% 1/15/17 | | 3,000,000 | | 3,349,932 |
Equity Residential 5.125% 3/15/16 | | 7,201,000 | | 7,926,717 |
Health Care Property Investors, Inc.: | | | | |
5.625% 5/1/17 | | 2,980,000 | | 3,340,714 |
6% 6/15/14 | | 2,340,000 | | 2,439,768 |
Corporate Bonds - continued |
| Principal Amount (e) | | Value |
Nonconvertible Bonds - continued |
FINANCIALS - continued |
Real Estate Investment Trusts - continued |
Health Care Property Investors, Inc.: - continued | | | | |
6% 3/1/15 | | $ 1,000,000 | | $ 1,073,503 |
6% 1/30/17 | | 2,383,000 | | 2,691,134 |
7.072% 6/8/15 | | 1,500,000 | | 1,658,097 |
Health Care REIT, Inc.: | | | | |
3.625% 3/15/16 | | 7,685,000 | | 8,092,858 |
4.125% 4/1/19 | | 2,000,000 | | 2,114,364 |
6% 11/15/13 | | 1,000,000 | | 1,014,204 |
6.2% 6/1/16 | | 2,750,000 | | 3,094,146 |
Healthcare Realty Trust, Inc.: | | | | |
3.75% 4/15/23 | | 4,022,000 | | 3,807,491 |
5.75% 1/15/21 | | 3,095,000 | | 3,392,275 |
6.5% 1/17/17 | | 2,875,000 | | 3,239,464 |
Highwoods/Forsyth LP: | | | | |
3.625% 1/15/23 | | 1,607,000 | | 1,507,782 |
5.85% 3/15/17 | | 2,800,000 | | 3,087,101 |
Hospitality Properties Trust: | | | | |
5% 8/15/22 | | 3,177,000 | | 3,213,914 |
5.625% 3/15/17 | | 915,000 | | 995,560 |
7.875% 8/15/14 | | 1,000,000 | | 1,034,937 |
HRPT Properties Trust: | | | | |
5.75% 11/1/15 | | 4,826,000 | | 5,043,720 |
6.25% 8/15/16 | | 9,675,000 | | 10,290,775 |
6.25% 6/15/17 | | 1,055,000 | | 1,115,920 |
6.65% 1/15/18 | | 4,246,000 | | 4,551,606 |
iStar Financial, Inc.: | | | | |
3.875% 7/1/16 | | 2,855,000 | | 2,826,450 |
5.85% 3/15/17 | | 3,587,000 | | 3,694,610 |
5.875% 3/15/16 | | 34,260,000 | | 35,801,700 |
6.05% 4/15/15 | | 14,630,000 | | 15,215,200 |
7.125% 2/15/18 | | 5,725,000 | | 6,125,750 |
9% 6/1/17 | | 9,175,000 | | 10,367,750 |
MPT Operating Partnership LP/MPT Finance Corp.: | | | | |
6.375% 2/15/22 | | 3,610,000 | | 3,799,525 |
6.875% 5/1/21 | | 2,000,000 | | 2,135,000 |
National Retail Properties, Inc. 3.3% 4/15/23 | | 2,000,000 | | 1,852,958 |
Nationwide Health Properties, Inc. 6% 5/20/15 | | 5,670,000 | | 6,176,019 |
Omega Healthcare Investors, Inc.: | | | | |
6.75% 10/15/22 | | 2,115,000 | | 2,294,775 |
Corporate Bonds - continued |
| Principal Amount (e) | | Value |
Nonconvertible Bonds - continued |
FINANCIALS - continued |
Real Estate Investment Trusts - continued |
Omega Healthcare Investors, Inc.: - continued | | | | |
7.5% 2/15/20 | | $ 1,000,000 | | $ 1,095,000 |
Pan Pacific Retail Properties, Inc. 5.95% 6/1/14 | | 1,750,000 | | 1,822,919 |
Potlatch Corp. 7.5% 11/1/19 | | 1,000,000 | | 1,150,000 |
ProLogis LP: | | | | |
6.625% 5/15/18 | | 6,480,000 | | 7,555,162 |
7.625% 7/1/17 | | 4,690,000 | | 5,373,446 |
Reckson Operating Partnership LP/SL Green Realty Corp./SL Green Operating Partnership LP 7.75% 3/15/20 | | 2,000,000 | | 2,368,846 |
Senior Housing Properties Trust: | | | | |
4.3% 1/15/16 | | 5,000,000 | | 5,202,760 |
6.75% 4/15/20 | | 13,624,000 | | 15,113,893 |
6.75% 12/15/21 | | 8,000,000 | | 8,882,688 |
United Dominion Realty Trust, Inc.: | | | | |
5.13% 1/15/14 | | 2,520,000 | | 2,567,462 |
5.25% 1/15/15 | | 1,000,000 | | 1,055,403 |
5.25% 1/15/16 | | 4,000,000 | | 4,329,236 |
| | 275,596,802 |
Real Estate Management & Development - 2.8% |
AMB Property LP 5.9% 8/15/13 | | 400,000 | | 400,547 |
BioMed Realty LP 3.85% 4/15/16 | | 2,000,000 | | 2,105,004 |
Brandywine Operating Partnership LP: | | | | |
5.4% 11/1/14 | | 6,750,000 | | 7,096,356 |
7.5% 5/15/15 | | 1,000,000 | | 1,105,530 |
CB Richard Ellis Services, Inc.: | | | | |
5% 3/15/23 | | 6,020,000 | | 5,779,200 |
6.625% 10/15/20 | | 1,205,000 | | 1,284,831 |
Colonial Properties Trust 6.25% 6/15/14 | | 3,094,000 | | 3,233,901 |
Colonial Realty LP 6.05% 9/1/16 | | 2,500,000 | | 2,800,762 |
Corporate Office Properties LP 3.6% 5/15/23 (h) | | 5,000,000 | | 4,634,915 |
ERP Operating LP 5.25% 9/15/14 | | 4,815,000 | | 5,053,554 |
Forest City Enterprises, Inc. 6.5% 2/1/17 | | 17,420,000 | | 17,458,324 |
Host Hotels & Resorts LP 5.25% 3/15/22 | | 2,000,000 | | 2,083,290 |
Kennedy-Wilson, Inc. 8.75% 4/1/19 | | 20,410,000 | | 22,144,850 |
Realogy Corp.: | | | | |
7.875% 2/15/19 (h) | | 7,085,000 | | 7,687,225 |
9% 1/15/20 (h) | | 1,920,000 | | 2,198,400 |
Corporate Bonds - continued |
| Principal Amount (e) | | Value |
Nonconvertible Bonds - continued |
FINANCIALS - continued |
Real Estate Management & Development - continued |
Regency Centers LP: | | | | |
5.25% 8/1/15 | | $ 4,509,000 | | $ 4,851,756 |
5.875% 6/15/17 | | 400,000 | | 446,543 |
Toys 'R' Us Property Co. I LLC 10.75% 7/15/17 | | 2,490,000 | | 2,633,200 |
Ventas Realty LP/Ventas Capital Corp.: | | | | |
2.7% 4/1/20 | | 3,000,000 | | 2,849,517 |
3.125% 11/30/15 | | 13,807,000 | | 14,473,740 |
4% 4/30/19 | | 2,262,000 | | 2,371,949 |
Wells Operating Partnership II LP 5.875% 4/1/18 | | 3,000,000 | | 3,153,165 |
| | 115,846,559 |
Thrifts & Mortgage Finance - 0.1% |
Wrightwood Capital LLC 1.9% 4/20/20 (d) | | 3,781,040 | | 3,157,168 |
TOTAL FINANCIALS | | 419,252,179 |
HEALTH CARE - 0.9% |
Health Care Equipment & Supplies - 0.3% |
Aviv Healthcare Properties LP/Aviv Healthcare Capital Corp. 7.75% 2/15/19 | | 10,410,000 | | 11,190,750 |
Health Care Providers & Services - 0.6% |
Sabra Health Care LP/Sabra Capital Corp.: | | | | |
5.375% 6/1/23 | | 2,795,000 | | 2,725,125 |
8.125% 11/1/18 | | 21,426,000 | | 23,032,950 |
| | 25,758,075 |
TOTAL HEALTH CARE | | 36,948,825 |
INDUSTRIALS - 0.2% |
Commercial Services & Supplies - 0.1% |
Iron Mountain, Inc. 5.75% 8/15/24 | | 4,235,000 | | 4,002,075 |
Industrial Conglomerates - 0.1% |
Ladder Capital Finance Holdings LLLP/Ladder Capital Finance Corp. 7.375% 10/1/17 (h) | | 3,050,000 | | 3,149,125 |
TOTAL INDUSTRIALS | | 7,151,200 |
Corporate Bonds - continued |
| Principal Amount (e) | | Value |
Nonconvertible Bonds - continued |
INFORMATION TECHNOLOGY - 0.1% |
Internet Software & Services - 0.1% |
CyrusOne LP/CyrusOne Finance Corp. 6.375% 11/15/22 | | $ 3,000,000 | | $ 3,150,000 |
TELECOMMUNICATION SERVICES - 0.1% |
Wireless Telecommunication Services - 0.1% |
Crown Castle International Corp. 5.25% 1/15/23 | | 4,000,000 | | 3,850,000 |
TOTAL NONCONVERTIBLE BONDS | | 707,337,770 |
TOTAL CORPORATE BONDS (Cost $772,590,551) |
819,337,938
|
Asset-Backed Securities - 3.1% |
|
Anthracite CDO III Ltd./Anthracite CDO III Corp. Series 2004-1A Class A, 0.551% 3/23/19 (h)(i) | | 157,192 | | 154,442 |
Capital Trust RE CDO Ltd. Series 2005-1A Class D, 1.6915% 3/20/50 (h)(i) | | 2,250,000 | | 104,625 |
Capital Trust RE CDO Ltd./Capital Trust RE CDO Corp. Series 2005-3A Class A2, 5.16% 6/25/35 (h) | | 903,043 | | 898,528 |
CapitalSource Real Estate Loan Trust Series 2006-1A Class A2A, 0.5186% 1/20/37 (h)(i) | | 634,553 | | 599,653 |
CapLease CDO Ltd. Series 2005-1A Class A, 4.926% 1/29/40 (h) | | 1,069,411 | | 1,058,717 |
CBRE Realty Finance CDO LLC Series 2007-1A Class A1, 0.5209% 4/7/52 (h)(i) | | 4,042,150 | | 3,840,042 |
Conseco Finance Securitizations Corp. Series 2002-2 Class M2, 9.163% 3/1/33 (i) | | 500,000 | | 439,412 |
Crest Clarendon Street Ltd./Crest Clarendon Corp. Series 2002-1A Class D, 9% 12/28/35 (h) | | 536,066 | | 361,738 |
Crest Dartmouth Street Ltd./Crest Dartmouth Street Corp. Series 2003-1A Class D, 9% 6/28/38 (h) | | 1,064,351 | | 798,264 |
Deutsche Financial Capital Securitization LLC Series 1997-I Class M, 7.275% 9/15/27 | | 9,500,000 | | 9,081,535 |
Fairfield Street Solar Corp. Series 2004-1A Class E1, 3.6378% 11/28/39 (h)(i) | | 587,788 | | 17,634 |
Green Tree Financial Corp.: | | | | |
Series 1996-4 Class M1, 7.75% 6/15/27 | | 1,788,179 | | 1,701,552 |
Series 1997-3 Class M1, 7.53% 3/15/28 | | 7,238,253 | | 5,989,821 |
Asset-Backed Securities - continued |
| Principal Amount (e) | | Value |
GSR Mortgage Loan Trust Series 2005-HE3 Class B3, 2.69% 6/25/35 (i)(k) | | $ 695,471 | | $ 30,822 |
Guggenheim Structured Real Estate Funding Ltd./Guggenheim Structured Real Estate Funding LLC Series 2005-2A: | | | | |
Class D, 1.74% 8/26/30 (h)(i) | | 735,000 | | 691,856 |
Class E, 2.19% 8/26/30 (h)(i) | | 1,517,957 | | 971,493 |
HLSS Servicer Advance Receivables Backed Notes Series 2013-T2 Class D2, 2.388% 5/16/44 (h) | | 3,000,000 | | 2,966,250 |
Lehman ABS Manufactured Housing Contract Trust Series 2001-B Class M2, 7.17% 4/15/40 | | 1,084,685 | | 530,826 |
Merit Securities Corp. Series 13 Class M1, 8.63% 12/28/33 (i) | | 1,923,000 | | 2,057,320 |
Mesa West Capital CDO Ltd.: | | | | |
Series 2007-1A Class A2, 0.48% 2/25/47 (h)(i) | | 20,390,000 | | 18,758,800 |
Series 2007-1A Class A1, 0.45% 2/25/47 (h)(i) | | 6,377,223 | | 6,122,134 |
N-Star Real Estate CDO Ltd. Series 1A Class C1B, 7.696% 8/28/38 (h) | | 899,989 | | 773,990 |
Newcastle Investment Trust Series 2011-MH1 Class A, 2.45% 12/10/33 (h) | | 2,119,870 | | 2,150,019 |
Prima Capital Ltd. Series 2006-CR1A Class A2, 5.533% 12/28/48 (h) | | 7,748,554 | | 7,903,526 |
Taberna Preferred Funding III Ltd. Series 2005-3A Class D, 2.9231% 2/5/36 (h)(i) | | 3,693,580 | | 369 |
Wachovia Ltd./Wachovia LLC: | | | | |
Series 2006-1 Class 1ML, 0.9993% 9/25/26 (h)(i) | | 2,000,000 | | 1,240,000 |
Series 2006-1A: | | | | |
Class A1A, 0.5328% 9/25/26 (h)(i) | | 7,955,179 | | 7,855,739 |
Class A1B, 0.6028% 9/25/26 (h)(i) | | 22,506,000 | | 20,705,520 |
Class A2B, 0.5828% 9/25/26 (h)(i) | | 1,212,270 | | 1,154,688 |
Class B, 0.6328% 9/25/26 (h)(i) | | 3,450,000 | | 3,268,875 |
Class C, 0.8028% 9/25/26 (h)(i) | | 7,030,000 | | 6,537,900 |
Class E, 1.0028% 9/25/26 (h)(i) | | 1,000,000 | | 895,000 |
Class F, 1.4228% 9/25/26 (h)(i) | | 3,483,000 | | 3,047,625 |
Class G, 1.6228% 9/25/26 (h)(i) | | 1,599,000 | | 1,395,128 |
Class H, 1.9228% 9/25/26 (h)(i) | | 1,535,000 | | 1,331,613 |
Class J, 3.0228% 9/25/26 (h)(i) | | 1,500,000 | | 1,303,200 |
Class K, 3.5228% 9/25/26 (h)(i) | | 2,475,000 | | 2,103,750 |
Class L, 4.2728% 9/25/26 (h)(i) | | 1,500,000 | | 1,290,000 |
Asset-Backed Securities - continued |
| Principal Amount (e) | | Value |
Wrightwood Capital Real Estate CDO Ltd. Series 2005-1A: | | | | |
Class A1, 0.5936% 11/21/40 (h)(i) | | $ 8,831,580 | | $ 8,213,370 |
Class F, 2.2236% 11/21/40 (h)(i) | | 250,000 | | 50,000 |
TOTAL ASSET-BACKED SECURITIES (Cost $127,734,548) |
128,395,776
|
Collateralized Mortgage Obligations - 0.4% |
|
Private Sponsor - 0.4% |
COMM pass-thru certificates Series 2007-FL14 Class AJ, 0.371% 6/15/22 (h)(i) | | 1,672,831 | | 1,661,618 |
Countrywide Home Loans, Inc.: | | | | |
Series 2002-38 Class B3, 5% 2/25/18 (h) | | 45,480 | | 15,449 |
Series 2002-R2 Class 2B3, 3.6535% 7/25/33 (h)(i) | | 195,218 | | 35,053 |
Series 2003-40 Class B3, 4.5% 10/25/18 (h) | | 37,258 | | 949 |
Series 2003-R3: | | | | |
Class B2, 5.5% 11/25/33 (h) | | 1,272,916 | | 250,515 |
Class B3, 5.5% 11/25/33 | | 52,966 | | 1,171 |
Series 2004-R1 Class 1B3, 5.5% 11/25/34 (h)(i) | | 94,445 | | 7,011 |
FREMF Mortgage Trust: | | | | |
Series 2010-K6 Class B, 5.5328% 12/25/46 (h)(i) | | 4,500,000 | | 4,717,818 |
Series 2010-K7 Class B, 5.6188% 4/25/20 (h)(i) | | 3,200,000 | | 3,367,498 |
Merrill Lynch Mortgage Investors Trust Series 1998-C3 Class F, 6% 12/15/30 (h) | | 5,783,417 | | 5,954,004 |
RESI Finance LP/RESI Finance DE Corp. floater: | | | | |
Series 2003-B Class B9, 12.1428% 7/10/35 (h)(i) | | 216,490 | | 226,264 |
Series 2005-A Class B6, 2.1928% 3/10/37 (h)(i) | | 664,645 | | 4,254 |
Residential Funding Securities Corp. Series 2002-RM1 Class BI1, 5.5% 12/25/17 (h) | | 24,251 | | 21,211 |
RESIX Finance Ltd. floater: | | | | |
Series 2003-D Class B8, 6.6928% 12/10/35 (h)(i) | | 219,521 | | 72,333 |
Series 2004-A Class B7, 4.4428% 2/10/36 (h)(i) | | 241,587 | | 108,601 |
Series 2004-B Class B7, 4.1928% 2/10/36 (h)(i) | | 290,032 | | 119,677 |
TOTAL PRIVATE SPONSOR | | 16,563,426 |
U.S. Government Agency - 0.0% |
Fannie Mae REMIC Trust: | | | | |
Series 2001-W3 subordinate REMIC pass thru certificates, Class B3, 7% 9/25/41 (k) | | 138,253 | | 65,777 |
Series 2002-W1 subordinate REMIC pass thru certificates, Class 3B3, 3.1861% 2/25/42 (h)(i) | | 94,047 | | 53,961 |
Collateralized Mortgage Obligations - continued |
| Principal Amount (e) | | Value |
U.S. Government Agency - continued |
Fannie Mae REMIC Trust: - continued | | | | |
Series 2003-W1 subordinate REMIC pass thru certificates, Class B3, 4.8488% 12/25/42 (i)(k) | | $ 209,985 | | $ 54,010 |
Series 2003-W10 subordinate REMIC pass thru certificates, Class 2B3, 3.1684% 6/25/43 (h)(i) | | 140,041 | | 57,747 |
Series 2003-W4 subordinate REMIC pass thru certificates, Class 2B3, 3.1779% 10/25/42 (h)(i) | | 61,299 | | 32,335 |
TOTAL U.S. GOVERNMENT AGENCY | | 263,830 |
TOTAL COLLATERALIZED MORTGAGE OBLIGATIONS (Cost $17,966,869) |
16,827,256
|
Commercial Mortgage Securities - 12.5% |
|
ACGS Series 2004-1 Class P, 7.4605% 8/1/19 (k) | | 3,234,240 | | 3,192,043 |
Americold LLC Trust Series 2010-ARTA Class D, 7.443% 1/14/29 (h) | | 2,000,000 | | 2,287,786 |
Banc of America Commercial Mortgage Trust: | | | | |
Series 2005-1 Class CJ, 5.4031% 11/10/42 (i) | | 3,580,000 | | 3,803,535 |
Series 2005-5 Class D, 5.4033% 10/10/45 (i) | | 4,000,000 | | 4,036,092 |
Series 2005-6 Class AJ, 5.3576% 9/10/47 (i) | | 5,000,000 | | 5,359,625 |
Banc of America Large Loan Trust floater Series 2010-HLTN Class HLTN, 2.491% 11/15/15 (h)(i) | | 52,636,093 | | 52,890,536 |
Banc of America Large Loan, Inc. floater Series 2005-MIB1 Class K, 2.191% 3/15/22 (h)(i) | | 760,684 | | 517,153 |
Banc of America REMIC Trust Series 2012-CLMZ Class A, 7.691% 8/15/17 (h)(i) | | 4,900,000 | | 5,096,000 |
Bear Stearns Commercial Mortgage Securities, Inc. Series 2006-PW11 Class AJ, 5.6112% 3/11/39 (i) | | 5,700,000 | | 5,921,936 |
Bear Stearns Commercial Mortgage Securities Trust Series 2006-T22 Class B, 5.7655% 4/12/38 (h)(i) | | 2,520,000 | | 2,696,637 |
COMM Mortgage Trust: | | | | |
sequential payer Series 2013-LC6 Class E, 3.5% 1/10/46 (h) | | 4,300,000 | | 2,971,283 |
Series 2012-CR5 Class D, 4.4794% 12/10/45 (h)(i) | | 2,000,000 | | 1,805,966 |
Series 2013-CR9 Class D, 4.403% 7/10/45 (h) | | 1,000,000 | | 787,813 |
COMM pass-thru certificates floater Series 2006-FL12: | | | | |
Class AJ, 0.321% 12/15/20 (h)(i) | | 2,583,778 | | 2,546,874 |
Class B, 0.361% 12/15/20 (h)(i) | | 2,625,202 | | 2,567,503 |
Commercial Mortgage Trust pass-thru certificates: | | | | |
Series 2005-C6 Class AJ, 5.209% 6/10/44 (i) | | 5,000,000 | | 5,238,340 |
Commercial Mortgage Securities - continued |
| Principal Amount (e) | | Value |
Commercial Mortgage Trust pass-thru certificates: - continued | | | | |
Series 2012-CR1: | | | | |
Class C, 5.5468% 5/15/45 (i) | | $ 1,000,000 | | $ 1,011,933 |
Class D, 5.5468% 5/15/45 (h)(i) | | 5,550,000 | | 5,073,133 |
Series 2012-CR2: | | | | |
Class D, 5.02% 8/15/45 (h)(i) | | 4,500,000 | | 4,255,686 |
Class E, 5.02% 8/15/45 (h)(i) | | 6,000,000 | | 5,287,152 |
Series 2012-LC4: | | | | |
Class C, 5.8238% 12/10/44 (i) | | 2,000,000 | | 2,067,198 |
Class D, 5.8238% 12/10/44 (h)(i) | | 8,000,000 | | 7,511,608 |
Credit Suisse First Boston Mortgage Securities Corp.: | | | | |
Series 1998-C1 Class F, 6% 5/17/40 (h) | | 1,855,830 | | 2,011,970 |
Series 1998-C2 Class F, 6.75% 11/15/30 (h) | | 3,000,000 | | 3,119,874 |
DBUBS Mortgage Trust Series 2011-LC1A Class E, 5.7284% 11/10/46 (h)(i) | | 12,490,000 | | 12,137,270 |
Deutsche Mortgage & Asset Receiving Corp. Series 1998-C1 Class J, 6.22% 6/15/31 | | 543,989 | | 543,624 |
DLJ Commercial Mortgage Corp. Series 1998-CG1 Class B4, 7.3882% 6/10/31 (h)(i) | | 216,298 | | 216,252 |
Extended Stay America Trust Series 2013-ESHM Class M, 7.625% 12/5/19 (h) | | 10,950,000 | | 11,184,607 |
Freddie Mac: | | | | |
pass-thru certificates: | | | | |
Series K011 Class X3, 2.6621% 12/25/43 (i)(j) | | 12,206,096 | | 1,828,693 |
Series K012 Class X3, 2.3659% 1/25/41 (i)(j) | | 21,072,886 | | 2,820,943 |
Series K013 Class X3, 2.8848% 1/25/43 (i)(j) | | 14,360,000 | | 2,358,257 |
Series KAIV Class X2, 3.6147% 6/25/46 (i)(j) | | 7,430,000 | | 1,578,865 |
G-Force LLC sequential payer Series 2005-RRA Class A2, 4.83% 8/22/36 (h) | | 3,294,724 | | 3,311,197 |
GMAC Commercial Mortgage Securities, Inc.: | | | | |
Series 1997-C2 Class G, 6.75% 4/15/29 (i) | | 870,077 | | 967,580 |
Series 1999-C3 Class J, 6.974% 8/15/36 (h) | | 1,500,000 | | 1,561,283 |
Series 2000-C1 Class K, 7% 3/15/33 | | 190,322 | | 140,399 |
GS Mortgage Securities Corp. II: | | | | |
floater Series 2007-EOP Class L, 5.4585% 3/6/20 (h)(i) | | 1,400,000 | | 1,398,697 |
Series 2010-C1: | | | | |
Class D, 6.1268% 8/10/43 (h)(i) | | 4,000,000 | | 4,023,956 |
Class E, 4% 8/10/43 (h) | | 3,770,000 | | 2,854,120 |
Series 2012-GCJ7: | | | | |
Class C, 5.9064% 5/10/45 (i) | | 6,500,000 | | 6,802,575 |
Class D, 5.9064% 5/10/45 (h)(i) | | 2,000,000 | | 1,882,940 |
Commercial Mortgage Securities - continued |
| Principal Amount (e) | | Value |
GS Mortgage Securities Corp. Trust Series 2011-ALF Class E, 4.953% 2/10/21 (h) | | $ 9,185,000 | | $ 9,210,718 |
GS Mortgage Securities Trust: | | | | |
Series 2010-C2 Class D, 5.4004% 12/10/43 (h)(i) | | 3,000,000 | | 2,856,888 |
Series 2011-GC5: | | | | |
Class C, 5.4744% 8/10/44 (h)(i) | | 9,000,000 | | 9,317,997 |
Class D, 5.4744% 8/10/44 (h)(i) | | 4,000,000 | | 3,744,660 |
Series 2012-GC6 Class C, 5.8263% 1/10/45 (h)(i) | | 3,600,000 | | 3,782,745 |
JP Morgan Chase Commercial Mortgage Securities Trust floater: | | | | |
Series 2013-JWMZ Class M, 6.191% 4/15/18 (h)(i) | | 2,225,379 | | 2,242,065 |
Series 2013-JWRZ Class E, 3.931% 4/15/30 (h)(i) | | 3,400,000 | | 3,385,373 |
JPMorgan Chase Commercial Mortgage Securities Corp.: | | | | |
Series 2001-A: | | | | |
Class G, 6% 10/15/32 (h)(i) | | 2,034,288 | | 36,685 |
Class X, 0.6365% 10/15/32 (h)(i)(j) | | 4,717,838 | | 29,956 |
Series 2002-C1 Class E, 6.135% 7/12/37 (h) | | 1,603,638 | | 1,605,251 |
Series 2003-C1 Class F, 6.1832% 1/12/37 (h)(i) | | 1,000,000 | | 1,000,000 |
Series 2009-IWST: | | | | |
Class C, 7.6935% 12/5/27 (h)(i) | | 3,000,000 | | 3,579,231 |
Class D, 7.6935% 12/5/27 (h)(i) | | 9,550,000 | | 10,777,022 |
Series 2010-CNTM Class MZ, 8.5% 8/5/20 (h) | | 9,000,000 | | 9,555,212 |
Series 2010-CNTR: | | | | |
Class D, 6.3899% 8/5/32 (h)(i) | | 4,500,000 | | 4,911,768 |
Class XB, 1.1366% 8/5/32 (h)(i)(j) | | 32,655,000 | | 1,504,759 |
Series 2012-CBX Class C, 5.3611% 6/16/45 (i) | | 4,530,000 | | 4,548,004 |
JPMorgan Chase Commercial Mortgage Securities Trust: | | | | |
Series 2005-LDP5 Class AJ, 5.4883% 12/15/44 (i) | | 3,470,000 | | 3,671,251 |
Series 2011-C5 Class C, 5.4915% 8/15/46 (h)(i) | | 6,525,375 | | 6,838,456 |
JPMorgan Chase Commercial Mortgage Trust Series 2013-LC11 Class D, 4.3844% 4/15/46 (i) | | 3,750,000 | | 3,031,806 |
JPMorgan Commercial Mortgage Finance Corp. Series 1999-C8: | | | | |
Class G, 6% 7/15/31 (h) | | 600,122 | | 601,704 |
Class H, 6% 7/15/31 (h) | | 1,424,589 | | 838,020 |
LB Commercial Conduit Mortgage Trust Series 1998-C4 Class G, 5.6% 10/15/35 (h) | | 990,263 | | 1,003,253 |
LB-UBS Commercial Mortgage Trust: | | | | |
sequential payer: | | | | |
Series 2004-C2 Class E, 4.487% 3/15/36 | | 2,060,000 | | 2,078,231 |
Series 2005-C3 Class AJ, 4.843% 7/15/40 | | 6,620,000 | | 6,982,564 |
Series 2005-C7 Class AJ, 5.323% 11/15/40 (i) | | 8,000,000 | | 8,492,008 |
Commercial Mortgage Securities - continued |
| Principal Amount (e) | | Value |
LB-UBS Commercial Mortgage Trust: - continued | | | | |
sequential payer: | | | | |
Series 2006-C7 Class AM, 5.378% 11/15/38 | | $ 2,040,000 | | $ 2,178,318 |
Series 2004-C7 Class E, 4.918% 10/15/36 | | 5,120,000 | | 5,265,638 |
Series 2005-C1 Class E, 4.924% 2/15/40 | | 4,000,000 | | 4,075,288 |
Series 2006-C4: | | | | |
Class AJ, 6.0813% 6/15/38 (i) | | 7,005,000 | | 7,229,854 |
Class AM, 6.0813% 6/15/38 (i) | | 6,700,000 | | 7,393,631 |
Lehman Brothers Floating Rate Commercial Mortgage Trust floater Series 2007-LLFA Class E, 1.091% 6/15/22 (h)(i) | | 6,230,000 | | 6,197,691 |
LStar Commercial Mortgage Trust Series 2011-1: | | | | |
Class B, 5.5191% 6/25/43 (h)(i) | | 6,165,000 | | 6,403,467 |
Class D, 5.5191% 6/25/43 (h)(i) | | 4,699,000 | | 4,625,745 |
Mach One Trust LLC Series 2004-1A Class H, 6.3257% 5/28/40 (h)(i) | | 2,840,000 | | 2,886,150 |
Merrill Lynch Financial Asset, Inc. Series 2005-CA16: | | | | |
Class F, 4.384% 7/12/37 | CAD | 710,000 | | 583,842 |
Class G, 4.384% 7/12/37 | CAD | 355,000 | | 286,895 |
Class H, 4.384% 7/12/37 | CAD | 236,000 | | 187,458 |
Class J, 4.384% 7/12/37 | CAD | 355,000 | | 277,175 |
Class K, 4.384% 7/12/37 | CAD | 355,000 | | 272,475 |
Class L, 4.384% 7/12/37 | CAD | 236,000 | | 178,083 |
Class M, 4.384% 7/12/37 | CAD | 995,000 | | 671,534 |
Merrill Lynch Mortgage Investors Trust Series 1999-C1 Class G, 6.71% 11/15/31 (h) | | 705,632 | | 324,591 |
Merrill Lynch Mortgage Trust Series 2006-C1 Class AM, 5.8724% 5/12/39 (i) | | 1,200,000 | | 1,309,643 |
Mezz Capital Commercial Mortgage Trust: | | | | |
sequential payer: | | | | |
Series 2004-C1 Class A, 4.836% 1/15/37 (h) | | 1,267,582 | | 1,128,148 |
Series 2004-C2 Class A, 5.318% 10/15/40 (h) | | 9,062,036 | | 7,929,282 |
Series 2004-C1: | | | | |
Class D, 6.988% 1/15/37 (h) | | 223,293 | | 22 |
Class IO, 8.9651% 1/15/37 (h)(i)(j) | | 1,759,867 | | 81,482 |
Morgan Stanley BAML Trust Series 2013-C9 Class D, 4.2997% 5/15/46 (h)(i) | | 5,000,000 | | 4,087,410 |
Morgan Stanley Capital I Trust: | | | | |
sequential payer: | | | | |
Series 2012-C4 Class E, 5.71% 3/15/45 (h)(i) | | 4,630,000 | | 4,312,137 |
Series 2006-HQ10 Class AM, 5.36% 11/12/41 | | 8,200,000 | | 8,949,357 |
Series 1997-RR Class F, 7.4018% 4/30/39 (h)(i) | | 1,030,758 | | 1,030,758 |
Series 1998-CF1 Class G, 7.35% 7/15/32 (h) | | 2,638,892 | | 1,970,236 |
Commercial Mortgage Securities - continued |
| Principal Amount (e) | | Value |
Morgan Stanley Capital I Trust: - continued | | | | |
Series 2005-HQ5 Class B, 5.272% 1/14/42 | | $ 2,000,000 | | $ 2,090,064 |
Series 2005-HQ6 Class AJ, 5.073% 8/13/42 (i) | | 2,500,000 | | 2,638,195 |
Series 2006-IQ12 Class AMFX, 5.37% 12/15/43 | | 7,500,000 | | 8,239,575 |
Series 2011-C1 Class C, 5.4199% 9/15/47 (h)(i) | | 4,000,000 | | 4,260,810 |
Series 2011-C2: | | | | |
Class D, 5.4934% 6/15/44 (h)(i) | | 4,610,000 | | 4,446,580 |
Class E, 5.4934% 6/15/44 (h)(i) | | 9,600,000 | | 9,032,928 |
Class F, 5.4934% 6/15/44 (h)(i) | | 4,440,000 | | 3,591,760 |
Class XB, 0.5389% 6/15/44 (h)(i)(j) | | 63,708,222 | | 2,154,294 |
Series 2011-C3: | | | | |
Class C, 5.3573% 7/15/49 (h)(i) | | 2,000,000 | | 2,045,002 |
Class D, 5.3573% 7/15/49 (h)(i) | | 7,400,000 | | 7,220,047 |
Series 2012-C4 Class D, 5.71% 3/15/45 (h)(i) | | 6,310,000 | | 6,343,676 |
NationsLink Funding Corp. Series 1999-SL Class X, 11/10/30 (j) | | 74,656 | | 74,567 |
Providence Place Group Ltd. Partnership Series 2000-C1 Class A2, 7.75% 7/20/28 (h) | | 3,929,602 | | 5,029,498 |
RBSCF Trust Series 2010-MB1 Class D, 4.8386% 4/15/24 (h)(i) | | 9,049,000 | | 9,102,869 |
Salomon Brothers Mortgage Securities VII, Inc. Series 2001-MMA Class E3, 6.5% 2/18/34 (h)(i) | | 122,646 | | 123,767 |
TIAA Seasoned Commercial Mortgage Trust sequential payer Series 2007-C4 Class AJ, 5.5257% 8/15/39 (i) | | 2,080,000 | | 2,269,590 |
TimberStar Trust I Series 2006-1 Class F, 7.5296% 10/15/36 (h) | | 10,630,000 | | 10,871,163 |
UBS Commercial Mortgage Trust Series 2007-FL1 Class F, 0.766% 7/15/24 (h)(i) | | 1,200,000 | | 1,093,200 |
UBS-Barclays Commercial Mortgage Trust sequential payer Series 2012-C3 Class A1, 0.726% 8/10/49 | | 3,415,348 | | 3,388,131 |
UBS-Citigroup Commercial Mortgage Trust Series 2011-C1 Class B, 6.0706% 1/10/45 (h)(i) | | 3,000,000 | | 3,344,322 |
Vornado DP LLC Series 2010-VNO Class D, 6.3555% 9/13/28 (h) | | 2,540,000 | | 2,811,498 |
Wachovia Bank Commercial Mortgage Trust: | | | | |
Series 2004-C10 Class E, 4.931% 2/15/41 | | 2,000,000 | | 2,019,384 |
Series 2004-C11: | | | | |
Class D, 5.5696% 1/15/41 (i) | | 5,177,000 | | 5,246,579 |
Class E, 5.6196% 1/15/41 (i) | | 3,785,000 | | 3,835,359 |
Series 2004-C12 Class D, 5.4782% 7/15/41 (i) | | 2,750,000 | | 2,816,858 |
Series 2004-C14 Class B, 5.17% 8/15/41 | | 3,180,000 | | 3,278,764 |
Wells Fargo Commercial Mortgage Trust Series 2012-LC5 Class D, 4.7802% 10/15/45 (h) | | 9,999,000 | | 8,698,550 |
Commercial Mortgage Securities - continued |
| Principal Amount (e) | | Value |
WF-RBS Commercial Mortgage Trust: | | | | |
Series 2011-C3: | | | | |
Class C, 5.335% 3/15/44 (h) | | $ 4,900,000 | | $ 5,090,728 |
Class D, 5.7215% 3/15/44 (h)(i) | | 1,000,000 | | 961,854 |
Class E, 5% 3/15/44 (h) | | 3,000,000 | | 2,484,135 |
Series 2012-C7 Class D, 5.0045% 6/15/45 (h)(i) | | 2,380,000 | | 2,269,935 |
Series 2013-C11: | | | | |
Class D, 4.3246% 3/15/45 (h)(i) | | 5,830,000 | | 4,801,250 |
Class E, 4.3246% 3/15/45 (h)(i) | | 4,780,000 | | 3,501,097 |
Series 2013-C13 Class D, 4.2791% 5/15/45 (h)(i) | | 4,000,000 | | 3,224,236 |
WFDB Commercial Mortgage Trust Series 2011-BXR Class D, 5.914% 7/5/24 (h) | | 4,000,000 | | 4,064,472 |
TOTAL COMMERCIAL MORTGAGE SECURITIES (Cost $486,874,679) |
515,595,608
|
Floating Rate Loans - 11.0% |
|
CONSUMER DISCRETIONARY - 4.8% |
Hotels, Restaurants & Leisure - 4.5% |
Cedar Fair LP Tranche B, term loan 3.25% 3/6/20 (i) | | 2,802,975 | | 2,831,005 |
Cooper Hotel Group REL 12% 11/6/17 | | 13,350,139 | | 14,017,646 |
Extended Stay America, Inc. REL 9.625% 12/1/19 | | 7,000,000 | | 7,140,000 |
Four Seasons Holdings, Inc. Tranche 2LN, term loan 6.25% 12/27/20 (i) | | 510,000 | | 520,200 |
Hilton Worldwide, Inc.: | | | | |
term loan 4.442% 11/12/15 (i) | | 55,995,536 | | 55,365,586 |
Tranche B, term loan 3.5645% 11/12/15 (i) | | 10,902,924 | | 10,780,266 |
Tranche C, term loan 3.692% 11/12/15 (i) | | 18,171,541 | | 17,967,111 |
Tranche D, term loan 3.942% 11/12/15 (i) | | 20,986,223 | | 20,750,128 |
Tranche E, term loan 4.192% 11/12/15 (i) | | 27,257,311 | | 26,950,666 |
Intrawest U.S. Holding, Inc. Tranche 1LN, term loan 7% 12/4/17 (i) | | 4,975,000 | | 5,068,281 |
La Quinta: | | | | |
Tranche A, term loan 11.375% 7/6/14 (i) | | 7,990,026 | | 8,140,239 |
Tranche B, term loan 11.375% 7/6/14 (i) | | 5,992,520 | | 6,105,179 |
Tranche D, term loan 14.9% 7/6/14 (i) | | 12,000,000 | | 11,715,600 |
| | 187,351,907 |
Multiline Retail - 0.2% |
JC Penney Corp., Inc. Tranche B, term loan 6% 5/21/18 (i) | | 5,995,000 | | 5,957,531 |
Floating Rate Loans - continued |
| Principal Amount (e) | | Value |
CONSUMER DISCRETIONARY - continued |
Specialty Retail - 0.1% |
The Pep Boys - Manny, Moe & Jack Tranche B, term loan 5% 10/11/18 (i) | | $ 5,328,225 | | $ 5,361,526 |
TOTAL CONSUMER DISCRETIONARY | | 198,670,964 |
CONSUMER STAPLES - 0.1% |
Food & Staples Retailing - 0.1% |
Albertson's LLC Tranche B 1LN, term loan 4.25% 3/21/16 (i) | | 5,162,063 | | 5,213,683 |
ENERGY - 0.4% |
Oil, Gas & Consumable Fuels - 0.4% |
Panda Sherman Power, LLC term loan 9% 9/14/18 (i) | | 7,200,000 | | 7,326,000 |
Panda Temple Power, LLC term loan 7.25% 4/3/19 (i) | | 8,580,000 | | 8,655,075 |
| | 15,981,075 |
FINANCIALS - 4.0% |
Diversified Financial Services - 1.2% |
Blackstone REL 10% 10/1/17 | | 17,488,428 | | 18,385,584 |
BRE Select Hotels Corp. REL 5.942% 5/9/18 (i) | | 12,235,818 | | 12,235,818 |
Calpine Construction Finance Co. LP Tranche B 2LN, term loan 3.25% 1/31/22 (i) | | 5,445,000 | | 5,424,581 |
Pilot Travel Centers LLC: | | | | |
Tranche B 2LN, term loan 4.25% 8/7/19 (i) | | 7,208,218 | | 7,208,218 |
Tranche B, term loan 3.75% 3/30/18 (i) | | 6,650,166 | | 6,625,561 |
SBA Senior Finance, Inc. Tranche B, term loan 3.75% 6/30/18 (i) | | 1,083,174 | | 1,091,297 |
| | 50,971,059 |
Real Estate Investment Trusts - 1.0% |
iStar Financial, Inc. Tranche B, term loan 4.5% 10/15/17 (i) | | 37,392,090 | | 37,485,570 |
Starwood Property Trust, Inc. Tranche B, term loan 3.5% 4/10/20 (i) | | 4,987,500 | | 4,987,500 |
| | 42,473,070 |
Real Estate Management & Development - 1.7% |
CB Richard Ellis Services, Inc. Tranche B, term loan 2.9451% 3/28/21 (i) | | 4,513,688 | | 4,524,972 |
CityCenter term loan 8.75% 7/12/14 (i) | | 4,169,750 | | 4,169,750 |
EOP Operating LP term loan: | | | | |
6.02% 2/1/14 (i) | | 5,000,000 | | 4,944,000 |
Floating Rate Loans - continued |
| Principal Amount (e) | | Value |
FINANCIALS - continued |
Real Estate Management & Development - continued |
EOP Operating LP term loan: - continued | | | | |
6.27% 2/1/14 (i) | | $ 3,800,000 | | $ 3,757,440 |
Equity Inns Reality LLC: | | | | |
Tranche A, term loan 10.5% 11/4/13 (i) | | 7,888,426 | | 7,212,651 |
Tranche B 2LN, term loan 7.55% 11/4/13 (i) | | 15,000,000 | | 14,962,500 |
Realogy Corp.: | | | | |
Credit-Linked Deposit 3.1963% 10/10/13 (i) | | 431,153 | | 431,153 |
Credit-Linked Deposit 4.4463% 10/10/16 (i) | | 914,940 | | 914,940 |
Realogy Group LLC Tranche B, term loan 4.5% 3/5/20 (i) | | 27,341,475 | | 27,614,890 |
| | 68,532,296 |
Thrifts & Mortgage Finance - 0.1% |
Ocwen Loan Servicing, LLC Tranche B, term loan 5% 1/23/18 (i) | | 1,962,588 | | 1,996,933 |
TOTAL FINANCIALS | | 163,973,358 |
HEALTH CARE - 0.4% |
Health Care Providers & Services - 0.4% |
Community Health Systems, Inc. term loan 3.7728% 1/25/17 (i) | | 2,903,247 | | 2,925,022 |
Health Management Associates, Inc. Tranche B, term loan 3.5% 11/18/18 (i) | | 2,083,219 | | 2,088,427 |
Skilled Healthcare Group, Inc. term loan 6.7123% 4/9/16 (i) | | 10,118,541 | | 10,143,838 |
| | 15,157,287 |
INDUSTRIALS - 0.3% |
Construction & Engineering - 0.3% |
Drumm Investors LLC Tranche B, term loan 5% 5/4/18 (i) | | 13,326,466 | | 12,893,356 |
TELECOMMUNICATION SERVICES - 0.5% |
Wireless Telecommunication Services - 0.5% |
Crown Castle Operating Co.: | | | | |
Tranche A, term loan 2.69% 1/31/17 (i) | | 8,727,273 | | 8,727,273 |
Tranche B, term loan 3.25% 1/31/19 (i) | | 9,212,995 | | 9,212,995 |
SBA Senior Finance II, LLC term loan 3.75% 9/28/19 (i) | | 1,226,177 | | 1,235,374 |
| | 19,175,642 |
Floating Rate Loans - continued |
| Principal Amount (e) | | Value |
UTILITIES - 0.5% |
Electric Utilities - 0.3% |
EquiPower Resources Holdings LLC: | | | | |
Tranche B 1LN, term loan 5.5% 12/21/18 (i) | | $ 5,000,000 | | $ 5,037,500 |
Tranche C, term loan 4.5% 12/21/19 (i) | | 995,000 | | 1,002,463 |
Essential Power LLC Tranche B, term loan 4.25% 8/8/19 (i) | | 2,428,050 | | 2,458,401 |
La Frontera Generation, LLC Tranche B, term loan 4.5% 9/30/20 (i) | | 5,000,000 | | 5,031,500 |
| | 13,529,864 |
Independent Power Producers & Energy Traders - 0.2% |
Tempus Public Foundation Generation Holdings LLC Tranche B, term loan 4.75% 12/31/17 (i) | | 9,000,000 | | 9,090,000 |
TOTAL UTILITIES | | 22,619,864 |
TOTAL FLOATING RATE LOANS (Cost $447,883,989) |
453,685,229
|
Preferred Securities - 0.0% |
| | | |
FINANCIALS - 0.0% |
Diversified Financial Services - 0.0% |
Crest Clarendon Street 2002-1 Ltd. Series 2002-1A Class PS, 12/28/35 (h) | 500,000 | | 25,000 |
Crest Dartmouth Street 2003 1 Ltd. Series 2003-1A Class PS, 6/28/38 (h) | 1,220,000 | | 61,000 |
| | 86,000 |
TOTAL PREFERRED SECURITIES (Cost $1,293,843) |
86,000
|
Money Market Funds - 7.4% |
| Shares | | Value |
Fidelity Cash Central Fund, 0.11% (b) | 270,943,913 | | $ 270,943,913 |
Fidelity Securities Lending Cash Central Fund, 0.12% (b)(c) | 35,303,075 | | 35,303,075 |
TOTAL MONEY MARKET FUNDS (Cost $306,246,988) |
306,246,988
|
TOTAL INVESTMENT PORTFOLIO - 100.9% (Cost $3,920,875,824) | | 4,159,414,034 |
NET OTHER ASSETS (LIABILITIES) - (0.9)% | | (36,346,452) |
NET ASSETS - 100% | $ 4,123,067,582 |
Currency Abbreviations |
CAD | - | Canadian dollar |
Legend |
(a) Non-income producing |
(b) Affiliated fund that is generally available only to investment companies and other accounts managed by Fidelity Investments. The rate quoted is the annualized seven-day yield of the fund at period end. A complete unaudited listing of the fund's holdings as of its most recent quarter end is available upon request. In addition, each Fidelity Central Fund's financial statements, which are not covered by the Fund's Report of Independent Registered Public Accounting Firm, are available on the SEC's website or upon request. |
(c) Investment made with cash collateral received from securities on loan. |
(d) Non-income producing - Security is in default. |
(e) Amount is stated in United States dollars unless otherwise noted. |
(f) Security or a portion of the security is on loan at period end. |
(g) Affiliated company |
(h) Security exempt from registration under Rule 144A of the Securities Act of 1933. These securities may be resold in transactions exempt from registration, normally to qualified institutional buyers. At the end of the period, the value of these securities amounted to $602,160,428 or 14.6% of net assets. |
(i) Coupon rates for floating and adjustable rate securities reflect the rates in effect at period end. |
(j) Security represents right to receive monthly interest payments on an underlying pool of mortgages or assets. Principal shown is the outstanding par amount of the pool as of the end of the period. |
(k) Restricted securities - Investment in securities not registered under the Securities Act of 1933 (excluding 144A issues). At the end of the period, the value of restricted securities (excluding 144A issues) amounted to $3,342,652 or 0.1% of net assets. |
Additional information on each restricted holding is as follows: |
Security | Acquisition Date | Acquisition Cost |
ACGS Series 2004-1 Class P, 7.4605% 8/1/19 | 2/17/11 | $ 3,131,922 |
Fannie Mae REMIC Trust Series 2001-W3 subordinate REMIC pass thru certificates, Class B3, 7% 9/25/41 | 5/21/03 | $ 119,805 |
Fannie Mae REMIC Trust Series 2003-W1 subordinate REMIC pass thru certificates, Class B3, 4.8488% 12/25/42 | 3/25/03 | $ 124,853 |
GSR Mortgage Loan Trust Series 2005-HE3 Class B3, 2.69% 6/25/35 | 6/3/05 | $ 613,549 |
Affiliated Central Funds |
Information regarding fiscal year to date income earned by the Fund from investments in Fidelity Central Funds is as follows: |
Fund | Income earned |
Fidelity Cash Central Fund | $ 456,858 |
Fidelity Securities Lending Cash Central Fund | 106,590 |
Total | $ 563,448 |
Other Affiliated Issuers |
An affiliated company is a company in which the Fund has ownership of at least 5% of the voting securities. Fiscal year to date transactions with companies which are or were affiliates are as follows: |
Affiliate | Value, beginning of period | Purchases | Sales Proceeds | Dividend Income | Value,
end of
period |
AmREIT, Inc. Class B | $ 2,818,000 | $ - | $ 3,749,972 | $ 96,887 | $ - |
Arbor Realty Trust, Inc. | - | 20,862,754 | - | 445,338 | 21,107,288 |
Arbor Realty Trust, Inc. Series A, 8.25% | - | 4,727,225 | - | 129,999 | 4,748,025 |
Arbor Realty Trust, Inc. Series B, 7.75% | - | 6,000,000 | - | - | 5,901,600 |
Total | $ 2,818,000 | $ 31,589,979 | $ 3,749,972 | $ 672,224 | $ 31,756,913 |
Other Information |
The following is a summary of the inputs used, as of July 31, 2013, involving the Fund's assets and liabilities carried at fair value. The inputs or methodology used for valuing securities may not be an indication of the risk associated with investing in those securities. For more information on valuation inputs, and their aggregation into the levels used in the tables below, please refer to the Investment Valuation section in the accompanying Notes to Financial Statements. |
Valuation Inputs at Reporting Date: |
Description | Total | Level 1 | Level 2 | Level 3 |
Investments in Securities: | | | |
Equities: | | | | |
Consumer Discretionary | $ 30,768,803 | $ 25,866,567 | $ - | $ 4,902,236 |
Financials | 1,843,945,625 | 1,823,549,794 | 18,107,807 | 2,288,024 |
Health Care | 44,524,811 | 44,524,811 | - | - |
Corporate Bonds | 819,337,938 | - | 816,169,770 | 3,168,168 |
Asset-Backed Securities | 128,395,776 | - | 107,450,194 | 20,945,582 |
Collateralized Mortgage Obligations | 16,827,256 | - | 15,722,149 | 1,105,107 |
Commercial Mortgage Securities | 515,595,608 | - | 494,454,226 | 21,141,382 |
Floating Rate Loans | 453,685,229 | - | 348,111,473 | 105,573,756 |
Preferred Securities | 86,000 | - | - | 86,000 |
Money Market Funds | 306,246,988 | 306,246,988 | - | - |
Total Investments in Securities: | $ 4,159,414,034 | $ 2,200,188,160 | $ 1,800,015,619 | $ 159,210,255 |
Valuation Inputs at Reporting Date: |
The following is a reconciliation of Investments in Securities for which Level 3 inputs were used in determining value: |
Investments in Securities: | |
Commercial Mortgage Securities | |
Beginning Balance | $ 53,984,005 |
Net Realized Gain (Loss) on Investment Securities | 504,595 |
Net Unrealized Gain (Loss) on Investment Securities | 1,350,805 |
Cost of Purchases | 2,889,025 |
Proceeds of Sales | (20,825,300) |
Amortization/Accretion | 627,941 |
Transfers into Level 3 | 1,065,042 |
Transfers out of Level 3 | (18,454,731) |
Ending Balance | $ 21,141,382 |
The change in unrealized gain (loss) for the period attributable to Level 3 securities held at July 31, 2013 | $ 647,713 |
Floating Rate Loans | |
Beginning Balance | $ 18,003,477 |
Net Realized Gain (Loss) on Investment Securities | 264,493 |
Net Unrealized Gain (Loss) on Investment Securities | 1,632,128 |
Cost of Purchases | 95,215,441 |
Proceeds of Sales | (14,290,062) |
Amortization/Accretion | 273,279 |
Transfers into Level 3 | 4,475,000 |
Transfers out of Level 3 | - |
Ending Balance | $ 105,573,756 |
The change in unrealized gain (loss) for the period attributable to Level 3 securities held at July 31, 2013 | $ 1,772,448 |
Other Investments in Securities | |
Beginning Balance | $ 55,750,106 |
Net Realized Gain (Loss) on Investment Securities | (5,987,844) |
Net Unrealized Gain (Loss) on Investment Securities | 11,096,738 |
Cost of Purchases | 168,742 |
Proceeds of Sales | (13,480,859) |
Amortization/Accretion | (260,694) |
Transfers into Level 3 | 9,210,100 |
Transfers out of Level 3 | (24,001,172) |
Ending Balance | $ 32,495,117 |
The change in unrealized gain (loss) for the period attributable to Level 3 securities held at July 31, 2013 | $ 4,610,963 |
The information used in the above reconciliations represents fiscal year to date activity for any Investments in Securities identified as using Level 3 inputs at either the beginning or the end of the current fiscal period. Transfers into Level 3 were attributable to a lack of observable market data resulting from decreases in market activity, decreases in liquidity, security restructurings or corporate actions. Transfers out of Level 3 were attributable to observable market data becoming available for those securities. Transfers in or out of Level 3 represent the beginning value of any Security or Instrument where a change in the pricing level occurred from the beginning to the end of the period. The cost of purchases and the proceeds of sales may include securities received or delivered through corporate actions or exchanges. Realized and unrealized gains (losses) disclosed in the reconciliations are included in Net Gain (Loss) on the Fund's Statement of Operations. |
Other Information |
The composition of credit quality ratings as a percentage of net assets is as follows (Unaudited): |
U.S. Government and U.S. Government Agency Obligations | 0.2% |
AAA,AA,A | 5.7% |
BBB | 10.8% |
BB | 6.8% |
B | 11.6% |
CCC,CC,C | 0.9% |
D | 0.0% |
Not Rated | 10.9% |
Equities | 46.6% |
Short-Term Investments and Net Other Assets | 6.5% |
| 100.0% |
We have used ratings from Moody's Investors Service, Inc. Where Moody's® ratings are not available, we have used S&P® ratings. All ratings are as of the date indicated and do not reflect subsequent changes. |
See accompanying notes which are an integral part of the financial statements.
Annual Report
Statement of Assets and Liabilities
| July 31, 2013 |
| | |
Assets | | |
Investment in securities, at value (including securities loaned of $33,804,284) - See accompanying schedule: Unaffiliated issuers (cost $3,583,038,857) | $ 3,821,410,133 | |
Fidelity Central Funds (cost $306,246,988) | 306,246,988 | |
Other affiliated issuers (cost $31,589,979) | 31,756,913 | |
Total Investments (cost $3,920,875,824) | | $ 4,159,414,034 |
Cash | | 119,760 |
Foreign currency held at value (cost $26,760) | | 26,760 |
Receivable for investments sold | | 3,833,620 |
Receivable for fund shares sold | | 8,237,634 |
Dividends receivable | | 2,204,019 |
Interest receivable | | 22,132,356 |
Distributions receivable from Fidelity Central Funds | | 70,745 |
Other receivables | | 14,996 |
Total assets | | 4,196,053,924 |
| | |
Liabilities | | |
Payable for investments purchased | $ 26,371,855 | |
Payable for fund shares redeemed | 8,145,140 | |
Accrued management fee | 1,915,759 | |
Distribution and service plan fees payable | 254,617 | |
Other affiliated payables | 897,990 | |
Other payables and accrued expenses | 97,906 | |
Collateral on securities loaned, at value | 35,303,075 | |
Total liabilities | | 72,986,342 |
| | |
Net Assets | | $ 4,123,067,582 |
Net Assets consist of: | | |
Paid in capital | | $ 3,803,721,769 |
Undistributed net investment income | | 39,267,501 |
Accumulated undistributed net realized gain (loss) on investments and foreign currency transactions | | 41,514,895 |
Net unrealized appreciation (depreciation) on investments and assets and liabilities in foreign currencies | | 238,563,417 |
Net Assets | | $ 4,123,067,582 |
See accompanying notes which are an integral part of the financial statements.
Annual Report
Financial Statements - continued
Statement of Assets and Liabilities - continued
| July 31, 2013 |
| | |
Calculation of Maximum Offering Price Class A:
Net Asset Value and redemption price per share ($378,268,593 ÷ 32,419,120 shares) | | $ 11.67 |
| | |
Maximum offering price per share (100/96.00 of $11.67) | | $ 12.16 |
Class T:
Net Asset Value and redemption price per share ($46,197,678 ÷ 3,958,306 shares) | | $ 11.67 |
| | |
Maximum offering price per share (100/96.00 of $11.67) | | $ 12.16 |
Class C:
Net Asset Value and offering price per share ($204,011,677 ÷ 17,607,394 shares)A | | $ 11.59 |
| | |
Real Estate Income:
Net Asset Value, offering price and redemption price per share ($2,884,544,749 ÷ 246,252,183 shares) | | $ 11.71 |
| | |
Institutional Class:
Net Asset Value, offering price and redemption price per share ($610,044,885 ÷ 52,187,743 shares) | | $ 11.69 |
A Redemption price per share is equal to net asset value less any applicable contingent deferred sales charge.
See accompanying notes which are an integral part of the financial statements.
Annual Report
Statement of Operations
| Year ended July 31, 2013 |
| | |
Investment Income | | |
Dividends (including $672,224 earned from other affiliated issuers) | | $ 77,045,173 |
Interest | | 126,655,801 |
Income from Fidelity Central Funds | | 563,448 |
Total income | | 204,264,422 |
| | |
Expenses | | |
Management fee | $ 19,911,854 | |
Transfer agent fees | 8,252,304 | |
Distribution and service plan fees | 1,899,520 | |
Accounting and security lending fees | 1,241,312 | |
Custodian fees and expenses | 60,830 | |
Independent trustees' compensation | 21,622 | |
Registration fees | 272,305 | |
Audit | 174,326 | |
Legal | 9,979 | |
Miscellaneous | 27,598 | |
Total expenses before reductions | 31,871,650 | |
Expense reductions | (92,847) | 31,778,803 |
Net investment income (loss) | | 172,485,619 |
Realized and Unrealized Gain (Loss) Net realized gain (loss) on: | | |
Investment securities: | | |
Unaffiliated issuers | 72,495,437 | |
Other affiliated issuers | 994,485 | |
Foreign currency transactions | 4,963 | |
Total net realized gain (loss) | | 73,494,885 |
Change in net unrealized appreciation (depreciation) on: Investment securities | 61,790,330 | |
Assets and liabilities in foreign currencies | (997) | |
Total change in net unrealized appreciation (depreciation) | | 61,789,333 |
Net gain (loss) | | 135,284,218 |
Net increase (decrease) in net assets resulting from operations | | $ 307,769,837 |
See accompanying notes which are an integral part of the financial statements.
Annual Report
Financial Statements - continued
Statement of Changes in Net Assets
| Year ended
July 31,
2013 | Year ended
July 31,
2012 |
Increase (Decrease) in Net Assets | | |
Operations | | |
Net investment income (loss) | $ 172,485,619 | $ 106,081,413 |
Net realized gain (loss) | 73,494,885 | 46,621,459 |
Change in net unrealized appreciation (depreciation) | 61,789,333 | 99,190,890 |
Net increase (decrease) in net assets resulting
from operations | 307,769,837 | 251,893,762 |
Distributions to shareholders from net investment income | (159,910,438) | (98,117,663) |
Distributions to shareholders from net realized gain | (51,534,162) | (16,498,521) |
Total distributions | (211,444,600) | (114,616,184) |
Share transactions - net increase (decrease) | 1,340,100,515 | 755,485,569 |
Redemption fees | 782,946 | 286,688 |
Total increase (decrease) in net assets | 1,437,208,698 | 893,049,835 |
| | |
Net Assets | | |
Beginning of period | 2,685,858,884 | 1,792,809,049 |
End of period (including undistributed net investment income of $39,267,501 and undistributed net investment income of $27,923,018, respectively) | $ 4,123,067,582 | $ 2,685,858,884 |
See accompanying notes which are an integral part of the financial statements.
Annual Report
Financial Highlights - Class A
Years ended July 31, | 2013 | 2012 | 2011 | 2010 H |
Selected Per-Share Data | | | | |
Net asset value, beginning of period | $ 11.26 | $ 10.73 | $ 9.94 | $ 9.95 |
Income from Investment Operations | | | | |
Net investment income (loss) E | .54 | .52 | .53 | .18 |
Net realized and unrealized gain (loss) | .60 | .61 | .76 | (.04) |
Total from investment operations | 1.14 | 1.13 | 1.29 | .14 |
Distributions from net investment income | (.53) | (.51) | (.50) | (.15) |
Distributions from net realized gain | (.20) | (.10) | - | - |
Total distributions | (.73) | (.60) K | (.50) | (.15) |
Redemption fees added to paid in capital E,J | - | - | - | - |
Net asset value, end of period | $ 11.67 | $ 11.26 | $ 10.73 | $ 9.94 |
Total Return B, C, D | 10.45% | 11.24% | 13.27% | 1.46% |
Ratios to Average Net Assets F, I | | | | |
Expenses before reductions | 1.08% | 1.12% | 1.13% | 1.09% A |
Expenses net of fee waivers, if any | 1.08% | 1.12% | 1.13% | 1.09% A |
Expenses net of all reductions | 1.07% | 1.11% | 1.12% | 1.09% A |
Net investment income (loss) | 4.62% | 4.89% | 5.00% | 6.23% A |
Supplemental Data | | | | |
Net assets, end of period (000 omitted) | $ 378,269 | $ 137,352 | $ 60,283 | $ 3,830 |
Portfolio turnover rate G | 26% | 27% | 25% | 28% |
A Annualized
B Total returns for periods of less than one year are not annualized.
C Total returns would have been lower if certain expenses had not been reduced during the applicable periods shown.
D Total returns do not include the effect of the sales charges.
E Calculated based on average shares outstanding during the period.
F Fees and expenses of any underlying Fidelity Central Funds are not included in the Fund's expense ratio. The Fund indirectly bears its proportionate share of the expenses of any underlying Fidelity Central Funds.
G Amount does not include the portfolio activity of any underlying Fidelity Central Funds.
H For the period April 14, 2010 (commencement of sale of shares) to July 31, 2010.
I Expense ratios reflect operating expenses of the class. Expenses before reductions do not reflect amounts reimbursed by the investment adviser or reductions from brokerage service arrangements or reductions from other expense offset arrangements and do not represent the amount paid by the class during periods when reimbursements or reductions occur. Expense ratios before reductions for start-up periods may not be representative of longer-term operating periods. Expenses net of fee waivers reflect expenses after reimbursement by the investment adviser but prior to reductions from brokerage service arrangements or other expense offset arrangements. Expenses net of all reductions represent the net expenses paid by the class.
J Amount represents less than $.01 per share.
K Total distributions of $.60 per share is comprised of distributions from net investment income of $.505 and distributions from net realized gain of $.097 per share.
See accompanying notes which are an integral part of the financial statements.
Annual Report
Financial Highlights - Class T
Years ended July 31, | 2013 | 2012 | 2011 | 2010 H |
Selected Per-Share Data | | | | |
Net asset value, beginning of period | $ 11.26 | $ 10.72 | $ 9.94 | $ 9.95 |
Income from Investment Operations | | | | |
Net investment income (loss) E | .54 | .52 | .52 | .17 |
Net realized and unrealized gain (loss) | .60 | .62 | .76 | (.03) |
Total from investment operations | 1.14 | 1.14 | 1.28 | .14 |
Distributions from net investment income | (.53) | (.50) | (.50) | (.15) |
Distributions from net realized gain | (.20) | (.10) | - | - |
Total distributions | (.73) | (.60) | (.50) | (.15) |
Redemption fees added to paid in capital E,J | - | - | - | - |
Net asset value, end of period | $ 11.67 | $ 11.26 | $ 10.72 | $ 9.94 |
Total Return B, C, D | 10.42% | 11.33% | 13.11% | 1.45% |
Ratios to Average Net Assets F, I | | | | |
Expenses before reductions | 1.08% | 1.11% | 1.16% | 1.17% A |
Expenses net of fee waivers, if any | 1.08% | 1.11% | 1.16% | 1.17% A |
Expenses net of all reductions | 1.08% | 1.11% | 1.16% | 1.17% A |
Net investment income (loss) | 4.61% | 4.90% | 4.96% | 5.92% A |
Supplemental Data | | | | |
Net assets, end of period (000 omitted) | $ 46,198 | $ 26,143 | $ 7,626 | $ 862 |
Portfolio turnover rate G | 26% | 27% | 25% | 28% |
A Annualized
B Total returns for periods of less than one year are not annualized.
C Total returns would have been lower if certain expenses had not been reduced during the applicable periods shown.
D Total returns do not include the effect of the sales charges.
E Calculated based on average shares outstanding during the period.
F Fees and expenses of any underlying Fidelity Central Funds are not included in the Fund's expense ratio. The Fund indirectly bears its proportionate share of the expenses of any underlying Fidelity Central Funds.
G Amount does not include the portfolio activity of any underlying Fidelity Central Funds.
H For the period April 14, 2010 (commencement of sale of shares) to July 31, 2010.
I Expense ratios reflect operating expenses of the class. Expenses before reductions do not reflect amounts reimbursed by the investment adviser or reductions from brokerage service arrangements or reductions from other expense offset arrangements and do not represent the amount paid by the class during periods when reimbursements or reductions occur. Expense ratios before reductions for start-up periods may not be representative of longer-term operating periods. Expenses net of fee waivers reflect expenses after reimbursement by the investment adviser but prior to reductions from brokerage service arrangements or other expense offset arrangements. Expenses net of all reductions represent the net expenses paid by the class.
J Amount represents less than $.01 per share.
See accompanying notes which are an integral part of the financial statements.
Annual Report
Financial Highlights - Class C
Years ended July 31, | 2013 | 2012 | 2011 | 2010 H |
Selected Per-Share Data | | | | |
Net asset value, beginning of period | $ 11.20 | $ 10.67 | $ 9.93 | $ 9.95 |
Income from Investment Operations | | | | |
Net investment income (loss) E | .45 | .44 | .45 | .15 |
Net realized and unrealized gain (loss) | .60 | .62 | .74 | (.03) |
Total from investment operations | 1.05 | 1.06 | 1.19 | .12 |
Distributions from net investment income | (.46) | (.43) | (.45) | (.14) |
Distributions from net realized gain | (.20) | (.10) | - | - |
Total distributions | (.66) | (.53) | (.45) | (.14) |
Redemption fees added to paid in capital E,J | - | - | - | - |
Net asset value, end of period | $ 11.59 | $ 11.20 | $ 10.67 | $ 9.93 |
Total Return B, C, D | 9.66% | 10.49% | 12.25% | 1.29% |
Ratios to Average Net Assets F, I | | | | |
Expenses before reductions | 1.81% | 1.87% | 1.89% | 1.86% A |
Expenses net of fee waivers, if any | 1.81% | 1.87% | 1.89% | 1.86% A |
Expenses net of all reductions | 1.81% | 1.87% | 1.89% | 1.86% A |
Net investment income (loss) | 3.88% | 4.14% | 4.23% | 5.21% A |
Supplemental Data | | | | |
Net assets, end of period (000 omitted) | $ 204,012 | $ 52,780 | $ 21,555 | $ 836 |
Portfolio turnover rate G | 26% | 27% | 25% | 28% |
A Annualized
B Total returns for periods of less than one year are not annualized.
C Total returns would have been lower if certain expenses had not been reduced during the applicable periods shown.
D Total returns do not include the effect of the contingent deferred sales charge.
E Calculated based on average shares outstanding during the period.
F Fees and expenses of any underlying Fidelity Central Funds are not included in the Fund's expense ratio. The Fund indirectly bears its proportionate share of the expenses of any underlying Fidelity Central Funds.
G Amount does not include the portfolio activity of any underlying Fidelity Central Funds.
H For the period April 14, 2010 (commencement of sale of shares) to July 31, 2010.
I Expense ratios reflect operating expenses of the class. Expenses before reductions do not reflect amounts reimbursed by the investment adviser or reductions from brokerage service arrangements or reductions from other expense offset arrangements and do not represent the amount paid by the class during periods when reimbursements or reductions occur. Expense ratios before reductions for start-up periods may not be representative of longer-term operating periods. Expenses net of fee waivers reflect expenses after reimbursement by the investment adviser but prior to reductions from brokerage service arrangements or other expense offset arrangements. Expenses net of all reductions represent the net expenses paid by the class.
J Amount represents less than $.01 per share.
See accompanying notes which are an integral part of the financial statements.
Annual Report
Financial Highlights - Real Estate Income
Years ended July 31, | 2013 | 2012 | 2011 | 2010 | 2009 |
Selected Per-Share Data | | | | | |
Net asset value, beginning of period | $ 11.29 | $ 10.75 | $ 9.95 | $ 8.21 | $ 9.43 |
Income from Investment Operations | | | | | |
Net investment income (loss) B | .57 | .54 | .55 | .53 | .54 |
Net realized and unrealized gain (loss) | .60 | .62 | .76 | 1.73 | (1.27) |
Total from investment operations | 1.17 | 1.16 | 1.31 | 2.26 | (.73) |
Distributions from net investment income | (.55) | (.52) | (.51) | (.52) | (.50) |
Distributions from net realized gain | (.20) | (.10) | - | - | - |
Total distributions | (.75) | (.62) | (.51) | (.52) | (.50) |
Redemption fees added to paid in capital B | - F | - F | - F | - F | .01 |
Net asset value, end of period | $ 11.71 | $ 11.29 | $ 10.75 | $ 9.95 | $ 8.21 |
Total Return A | 10.71% | 11.50% | 13.41% | 28.29% | (6.92)% |
Ratios to Average Net Assets C, E | | | | | |
Expenses before reductions | .84% | .90% | .92% | .97% | 1.00% |
Expenses net of fee waivers, if any | .84% | .89% | .92% | .96% | 1.00% |
Expenses net of all reductions | .84% | .89% | .92% | .96% | 1.00% |
Net investment income (loss) | 4.85% | 5.12% | 5.21% | 5.60% | 7.15% |
Supplemental Data | | | | | |
Net assets, end of period (000 omitted) | $ 2,884,545 | $ 2,252,149 | $ 1,660,063 | $ 1,030,393 | $ 463,269 |
Portfolio turnover rate D | 26% | 27% | 25% | 28% | 47% |
A Total returns would have been lower if certain expenses had not been reduced during the applicable periods shown.
B Calculated based on average shares outstanding during the period.
C Fees and expenses of any underlying Fidelity Central Funds are not included in the Fund's expense ratio. The Fund indirectly bears its proportionate share of the expenses of any underlying Fidelity Central Funds.
D Amount does not include the portfolio activity of any underlying Fidelity Central Funds.
E Expense ratios reflect operating expenses of the class. Expenses before reductions do not reflect amounts reimbursed by the investment adviser or reductions from brokerage service arrangements or reductions from other expense offset arrangements and do not represent the amount paid by the class during periods when reimbursements or reductions occur. Expenses net of fee waivers reflect expenses after reimbursement by the investment adviser but prior to reductions from brokerage service arrangements or other expense offset arrangements. Expenses net of all reductions represent the net expenses paid by the class.
F Amount represents less than $.01 per share.
See accompanying notes which are an integral part of the financial statements.
Annual Report
Financial Highlights - Institutional Class
Years ended July 31, | 2013 | 2012 | 2011 | 2010 G |
Selected Per-Share Data | | | | |
Net asset value, beginning of period | $ 11.28 | $ 10.74 | $ 9.95 | $ 9.95 |
Income from Investment Operations | | | | |
Net investment income (loss) D | .57 | .55 | .55 | .19 |
Net realized and unrealized gain (loss) | .60 | .62 | .76 | (.04) |
Total from investment operations | 1.17 | 1.17 | 1.31 | .15 |
Distributions from net investment income | (.56) | (.53) | (.52) | (.15) |
Distributions from net realized gain | (.20) | (.10) | - | - |
Total distributions | (.76) | (.63) | (.52) | (.15) |
Redemption fees added to paid in capital D, I | - | - | - | - |
Net asset value, end of period | $ 11.69 | $ 11.28 | $ 10.74 | $ 9.95 |
Total Return B, C | 10.72% | 11.62% | 13.44% | 1.58% |
Ratios to Average Net Assets E, H | | | | |
Expenses before reductions | .80% | .84% | .89% | .85% A |
Expenses net of fee waivers, if any | .80% | .84% | .89% | .85% A |
Expenses net of all reductions | .80% | .84% | .89% | .85% A |
Net investment income (loss) | 4.89% | 5.17% | 5.24% | 6.70% A |
Supplemental Data | | | | |
Net assets, end of period (000 omitted) | $ 610,045 | $ 217,435 | $ 43,282 | $ 2,930 |
Portfolio turnover rate F | 26% | 27% | 25% | 28% |
A Annualized
B Total returns for periods of less than one year are not annualized.
C Total returns would have been lower if certain expenses had not been reduced during the applicable periods shown.
D Calculated based on average shares outstanding during the period.
E Fees and expenses of any underlying Fidelity Central Funds are not included in the Fund's expense ratio. The Fund indirectly bears its proportionate share of the expenses of any underlying Fidelity Central Funds.
F Amount does not include the portfolio activity of any underlying Fidelity Central Funds.
G For the period April 14, 2010 (commencement of sale of shares) to July 31, 2010.
H Expense ratios reflect operating expenses of the class. Expenses before reductions do not reflect amounts reimbursed by the investment adviser or reductions from brokerage service arrangements or reductions from other expense offset arrangements and do not represent the amount paid by the class during periods when reimbursements or reductions occur. Expense ratios before reductions for start-up periods may not be representative of longer-term operating periods. Expenses net of fee waivers reflect expenses after reimbursement by the investment adviser but prior to reductions from brokerage service arrangements or other expense offset arrangements. Expenses net of all reductions represent the net expenses paid by the class.
I Amount represents less than $.01 per share.
See accompanying notes which are an integral part of the financial statements.
Annual Report
Notes to Financial Statements
For the period ended July 31, 2013
1. Organization.
Fidelity Real Estate Income Fund (the Fund) is a fund of Fidelity Securities Fund (the Trust) and is authorized to issue an unlimited number of shares. The Trust is registered under the Investment Company Act of 1940, as amended (the 1940 Act), as an open-end management investment company organized as a Massachusetts business trust. The Fund offers Class A, Class T, Class C, Real Estate Income and Institutional Class shares, each of which has equal rights as to assets and voting privileges. Each class has exclusive voting rights with respect to matters that affect that class.
2. Investments in Fidelity Central Funds.
The Fund invests in Fidelity Central Funds, which are open-end investment companies generally available only to other investment companies and accounts managed by Fidelity Management & Research Company (FMR) and its affiliates. The Fund's Schedule of Investments lists each of the Fidelity Central Funds held as of period end, if any, as an investment of the Fund, but does not include the underlying holdings of each Fidelity Central Fund. As an Investing Fund, the Fund indirectly bears its proportionate share of the expenses of the underlying Fidelity Central Funds.
The Money Market Central Funds seek preservation of capital and current income and are managed by Fidelity Investments Money Management, Inc. (FIMM), an affiliate of FMR.
A complete unaudited list of holdings for each Fidelity Central Fund is available upon request or at the Securities and Exchange Commission (the SEC) website at www.sec.gov. In addition, the financial statements of the Fidelity Central Funds, which are not covered by the Fund's Report of Independent Registered Public Accounting Firm, are available on the SEC website or upon request.
3. Significant Accounting Policies.
The financial statements have been prepared in conformity with accounting principles generally accepted in the United States of America (GAAP), which require management to make certain estimates and assumptions at the date of the financial statements. Actual results could differ from those estimates. Subsequent events, if any, through the date that the financial statements were issued have been evaluated in the preparation of the financial statements. The following summarizes the significant accounting policies of the Fund:
Investment Valuation. Investments are valued as of 4:00 p.m. Eastern time on the last calendar day of the period. In accordance with valuation policies and procedures approved by the Board of Trustees (the Board), the Fund attempts to obtain prices from one or more third party pricing vendors or brokers to value its investments. When
Annual Report
3. Significant Accounting Policies - continued
Investment Valuation - continued
current market prices, quotations or currency exchange rates are not readily available or reliable, investments will be fair valued in good faith by the FMR Fair Value Committee (the Committee), in accordance with procedures adopted by the Board. Factors used in determining fair value vary by investment type and may include market or investment specific events, changes in interest rates and credit quality. The frequency with which these procedures are used cannot be predicted and they may be utilized to a significant extent. The Committee oversees the Fund's valuation policies and procedures and is responsible for approving and reporting to the Board all fair value determinations.
The Fund categorizes the inputs to valuation techniques used to value its investments into a disclosure hierarchy consisting of three levels as shown below:
Level 1 - quoted prices in active markets for identical investments
Level 2 - other significant observable inputs (including quoted prices for similar investments, interest rates, prepayment speeds, etc.)
Level 3 - unobservable inputs (including the Fund's own assumptions based on the best information available)
Valuation techniques used to value the Fund's investments by major category are as follows:
Equity securities, including restricted securities, for which market quotations are readily available, are valued at the last reported sale price or official closing price as reported by a third party pricing vendor on the primary market or exchange on which they are traded and are categorized as Level 1 in the hierarchy. In the event there were no sales during the day or closing prices are not available, securities are valued at the last quoted bid price or may be valued using the last available price and are generally categorized as Level 2 in the hierarchy. For foreign equity securities, when market or security specific events arise, comparisons to the valuation of American Depositary Receipts (ADRs), futures contracts, Exchange-Traded Funds (ETFs) and certain indexes as well as quoted prices for similar securities may be used and would be categorized as Level 2 in the hierarchy. Utilizing these techniques may result in transfers between Level 1 and Level 2. For restricted equity securities and private placements where observable inputs are limited, assumptions about market activity and risk are used and these securities are generally categorized as Level 3 in the hierarchy.
Debt securities, including restricted securities, are valued based on evaluated prices received from third party pricing vendors or from brokers who make markets in such securities. For corporate bonds, floating rate loans and preferred securities, pricing
Annual Report
Notes to Financial Statements - continued
3. Significant Accounting Policies - continued
Investment Valuation - continued
vendors utilize matrix pricing which considers yield or price of bonds of comparable quality, coupon, maturity and type as well as broker-supplied prices. For asset backed securities, collateralized mortgage obligations and commercial mortgage securities, pricing vendors utilize matrix pricing which considers prepayment speed assumptions, attributes of the collateral, yield or price of bonds of comparable quality, coupon, maturity and type as well as broker-supplied prices. Independent prices obtained from a single source or broker are evaluated by management and may be categorized as Level 3 in the hierarchy. When independent prices are unavailable or unreliable, debt securities may be valued utilizing pricing methodologies which consider similar factors that would be used by third party pricing vendors. Debt securities are generally categorized as Level 2 in the hierarchy but may be Level 3 depending on the circumstances.
Investments in open-end mutual funds, including the Fidelity Central Funds, are valued at their closing net asset value (NAV) each business day and are categorized as Level 1 in the hierarchy.
The following provides information on Level 3 securities held by the Fund that were valued at period end based on unobservable inputs. These amounts exclude valuations provided by a broker.
Asset Type | Fair Value at
07/31/13 | Valuation
Technique(s) | Unobservable
Input | Amount or Range/
Weighted
Average | Impact to
Valuation from an Increase in Input* |
Asset-Backed Securities | $ 361,738 | Discounted cash flow | Yield | 11.0% | Decrease |
Collateralized Mortgage Obligations | $ 1,089,660 | Discounted cash flow | Yield | 6.5% - 65%/23.9% | Decrease |
Commercial Mortgage Securities | $ 2,036,877 | Discounted cash flow | Yield | 10% - 20%/15.5% | Decrease |
| Market comparable | Spread | 14.0% | Decrease |
Common Stock | $ 4,902,236 | Adjusted book value | Book value multiple | 1.0 | Increase |
Corporate Bonds | $ 3,157,168 | Discounted cash flow | Yield | 20.0% | Decrease |
Floating Rate Loans | $ 30,423,214 | Discounted cash flow | Yield | 8.8% - 11%/10.5% | Decrease |
| | Market comparable | Transaction price | $100.00 | Increase |
* Represents the expected directional change in the fair value of the Level 3 investments that would result from an increase in the corresponding input. A decrease to the unobservable input would have the opposite effect. Significant changes in these inputs could result in significantly higher or lower fair value measurements.
Annual Report
3. Significant Accounting Policies - continued
Investment Valuation - continued
Changes in valuation techniques may result in transfers in or out of an assigned level within the disclosure hierarchy. The aggregate value of investments by input level, as of July 31, 2013, as well as a roll forward of Level 3 investments, is included at the end of the Fund's Schedule of Investments.
Foreign Currency. The Fund may use foreign currency contracts to facilitate transactions in foreign-denominated securities. Gains and losses from these transactions may arise from changes in the value of the foreign currency or if the counterparties do not perform under the contracts' terms.
Foreign-denominated assets, including investment securities, and liabilities are translated into U.S. dollars at the exchange rates at period end. Purchases and sales of investment securities, income and dividends received and expenses denominated in foreign currencies are translated into U.S. dollars at the exchange rate in effect on the transaction date.
The effects of exchange rate fluctuations on investments are included with the net realized and unrealized gain (loss) on investment securities. Other foreign currency transactions resulting in realized and unrealized gain (loss) are disclosed separately.
Investment Transactions and Income. For financial reporting purposes, the Fund's investment holdings and NAV include trades executed through the end of the last business day of the period. The NAV per share for processing shareholder transactions is calculated as of the close of business of the New York Stock Exchange (NYSE), normally 4:00 p.m. Eastern time and includes trades executed through the end of the prior business day. Gains and losses on securities sold are determined on the basis of identified cost and may include proceeds received from litigation. Dividend income is recorded on the ex-dividend date, except for certain dividends from foreign securities where the ex-dividend date may have passed, which are recorded as soon as the Fund is informed of the ex-dividend date. Non-cash dividends included in dividend income, if any, are recorded at the fair market value of the securities received. Distributions received on securities that represent a return of capital or capital gain are recorded as a reduction of cost of investments and/or as a realized gain. Subsequent to ex-dividend date the Fund determines the components of these distributions, based upon receipt of tax filings or other correspondence relating to the underlying investment. Interest income and distributions from the Fidelity Central Funds are accrued as earned. Interest income includes coupon interest and amortization of premium and accretion of discount on debt securities. For certain lower credit quality securitized assets that have contractual cash flows (for example, asset backed securities, collateralized mortgage obligations and
Annual Report
Notes to Financial Statements - continued
3. Significant Accounting Policies - continued
Investment Transactions and Income - continued
commercial mortgage-backed securities), changes in estimated cash flows are periodically evaluated and the estimated yield is adjusted on a prospective basis over the remaining life of the security, resulting in increases or decreases to Interest Income in the accompanying Statement of Operations. Investment income is recorded net of foreign taxes withheld where recovery of such taxes is uncertain. Debt obligations may be placed on non-accrual status and related interest income may be reduced by ceasing current accruals and writing off interest receivables when the collection of all or a portion of interest has become doubtful based on consistently applied procedures. A debt obligation is removed from non-accrual status when the issuer resumes interest payments or when collectability of interest is reasonably assured.
Class Allocations and Expenses. Investment income, realized and unrealized capital gains and losses, common expenses of the Fund, and certain fund-level expense reductions, if any, are allocated on a pro-rata basis to each class based on the relative net assets of each class to the total net assets of the Fund. Each class differs with respect to transfer agent and distribution and service plan fees incurred. Certain expense reductions may also differ by class. Expenses directly attributable to a fund are charged to that fund. Expenses attributable to more than one fund are allocated among the respective funds on the basis of relative net assets or other appropriate methods. Expense estimates are accrued in the period to which they relate and adjustments are made when actual amounts are known.
Income Tax Information and Distributions to Shareholders. Each year, the Fund intends to qualify as a regulated investment company under Subchapter M of the Internal Revenue Code, including distributing substantially all of its taxable income and realized gains. As a result, no provision for income taxes is required. As of July 31, 2013, the Fund did not have any unrecognized tax benefits in the financial statements; nor is the Fund aware of any tax positions for which it is reasonably possible that the total amounts of unrecognized tax benefits will significantly change in the next twelve months. The Fund files a U.S. federal tax return, in addition to state and local tax returns as required. A fund's federal income tax returns are subject to examination by the Internal Revenue Service (IRS) for a period of three fiscal years after they are filed. State and local tax returns may be subject to examination for an additional fiscal year depending on the jurisdiction. Foreign taxes are provided for based on the Fund's understanding of the tax rules and rates that exist in the foreign markets in which it invests.
Annual Report
3. Significant Accounting Policies - continued
Income Tax Information and Distributions to Shareholders - continued
Distributions are declared and recorded on the ex-dividend date. Income dividends and capital gain distributions are declared separately for each class. Income and capital gain distributions are determined in accordance with income tax regulations, which may differ from GAAP. In addition, the Fund claimed a portion of the payment made to redeeming shareholders as a distribution for income tax purposes.
Capital accounts within the financial statements are adjusted for permanent book-tax differences. These adjustments have no impact on net assets or the results of operations. Temporary book-tax differences will reverse in a subsequent period.
Book-tax differences are primarily due to foreign currency transactions, passive foreign investment companies (PFIC), market discount, partnerships, equity-debt classifications and losses deferred due to wash sales.
The federal tax cost of investment securities and unrealized appreciation (depreciation) as of period end were as follows:
Gross unrealized appreciation | $ 329,448,090 |
Gross unrealized depreciation | (97,431,991) |
Net unrealized appreciation (depreciation) on securities and other investments | $ 232,016,099 |
| |
Tax Cost | $ 3,927,397,935 |
The tax-based components of distributable earnings as of period end were as follows:
Undistributed ordinary income | $ 54,276,553 |
Undistributed long-term capital gain | $ 33,287,081 |
Net unrealized appreciation (depreciation) | $ 232,041,306 |
The tax character of distributions paid was as follows:
| July 31, 2013 | July 31, 2012 |
Ordinary Income | $ 170,384,735 | $ 98,117,663 |
Long-term Capital Gains | 41,059,865 | 16,498,521 |
Total | $ 211,444,600 | $ 114,616,184 |
Short-Term Trading (Redemption) Fees. Shares held by investors in the Fund less than 90 days may have been subject to a redemption fee equal to .75% of the net asset value of shares redeemed. All redemption fees, which reduce the proceeds of the shareholder redemption, are retained by the Fund and accounted for as an addition to paid in capital.
Annual Report
Notes to Financial Statements - continued
3. Significant Accounting Policies - continued
Restricted Securities. The Fund may invest in securities that are subject to legal or contractual restrictions on resale. These securities generally may be resold in transactions exempt from registration or to the public if the securities are registered. Disposal of these securities may involve time-consuming negotiations and expense, and prompt sale at an acceptable price may be difficult. Information regarding restricted securities is included at the end of the Fund's Schedule of Investments.
Loans and Other Direct Debt Instruments. The Fund invests in direct debt instruments which are interests in amounts owed to lenders by corporate or other borrowers. These instruments may be in the form of loans, trade claims or other receivables and may include standby financing commitments such as revolving credit facilities that obligate the Fund to supply additional cash to the borrower on demand. Loans may be acquired through assignment or participation, or may be made directly to a borrower. The Fund may be contractually obligated to receive approval from the agent bank and/or borrower prior to the sale of these loans. The Fund did not have any unfunded loan commitments, which are contractual obligations for future funding, at period end.
4. Purchases and Sales of Investments.
Purchases and sales of securities, other than short-term securities and U.S. government securities, aggregated $2,022,279,822 and $847,035,607, respectively.
5. Fees and Other Transactions with Affiliates.
Management Fee. FMR and its affiliates provide the Fund with investment management related services for which the Fund pays a monthly management fee. The management fee is the sum of an individual fund fee rate that is based on an annual rate of .30% of the Fund's average net assets and an annualized group fee rate that averaged .26% during the period. The group fee rate is based upon the average net assets of all the mutual funds advised by FMR. The group fee rate decreases as assets under management increase and increases as assets under management decrease. For the period, the total annual management fee rate was .56% of the Fund's average net assets.
Distribution and Service Plan Fees. In accordance with Rule 12b-1 of the 1940 Act, the Fund has adopted separate Distribution and Service Plans for each class of shares. Certain classes pay Fidelity Distributors Corporation (FDC), an affiliate of FMR, separate Distribution and Service Fees, each of which is based on an annual percentage of each class' average net assets. In addition, FDC may pay financial intermediaries for selling shares of the Fund and providing shareholder support services. For the period, the Distribution and Service Fee rates, total fees and amounts retained by FDC were as follows:
Annual Report
5. Fees and Other Transactions with Affiliates - continued
Distribution and Service Plan Fees - continued
| Distribution
Fee | Service
Fee | Total Fees | Retained
by FDC |
Class A | -% | .25% | $ 617,413 | $ 50,959 |
Class T | -% | .25% | 90,476 | 816 |
Class C | .75% | .25% | 1,191,631 | 632,739 |
| | | $ 1,899,520 | $ 684,514 |
Sales Load. FDC may receive a front-end sales charge of up to 4.00% for selling Class A shares and Class T shares, some of which is paid to financial intermediaries for selling shares of the Fund. Depending on the holding period, FDC may receive contingent deferred sales charges levied on Class A, Class T and Class C redemptions. The deferred sales charges range from 1.00% for Class C shares, 1.00% for certain purchases of Class A shares and .25% for certain purchases of Class T shares.
For the period, sales charge amounts retained by FDC were as follows:
| Retained
by FDC |
Class A | $ 119,905 |
Class T | 24,968 |
Class C* | 16,049 |
| $ 160,922 |
* When Class C shares are initially sold, FDC pays commissions from its own resources to financial intermediaries through which the sales are made.
Transfer Agent Fees. Fidelity Investments Institutional Operations Company, Inc., (FIIOC), an affiliate of FMR, is the transfer, dividend disbursing and shareholder servicing agent for each class of the Fund. FIIOC receives account fees and asset-based fees that vary according to the account size and type of account of the shareholders of the respective classes of the Fund. FIIOC pays for typesetting, printing and mailing of shareholder reports, except proxy statements. For the period, transfer agent fees for each class were as follows:
| Amount | % of
Average
Net Assets |
Class A | $ 549,009 | .22 |
Class T | 82,206 | .23 |
Class C | 250,037 | .21 |
Real Estate Income | 6,587,715 | .24 |
Institutional Class | 783,337 | .20 |
| $ 8,252,304 | |
Annual Report
Notes to Financial Statements - continued
5. Fees and Other Transactions with Affiliates - continued
Accounting and Security Lending Fees. Fidelity Service Company, Inc. (FSC), an affiliate of FMR, maintains the Fund's accounting records. The accounting fee is based on the level of average net assets for each month. Under a separate contract, FSC administers the security lending program. The security lending fee is based on the number and duration of lending transactions.
Brokerage Commissions. The Fund placed a portion of its portfolio transactions with brokerage firms which are affiliates of the investment adviser. Brokerage commissions are included in net realized gain (loss) and change in net unrealized appreciation (depreciation) in the Statement of Operations. The commissions paid to these affiliated firms were $38,551 for the period.
6. Committed Line of Credit.
The Fund participates with other funds managed by FMR or an affiliate in a $4.25 billion credit facility (the "line of credit") to be utilized for temporary or emergency purposes to fund shareholder redemptions or for other short-term liquidity purposes. The Fund has agreed to pay commitment fees on its pro-rata portion of the line of credit, which amounted to $7,997 and is reflected in Miscellaneous expenses on the Statement of Operations. During the period, there were no borrowings on this line of credit.
7. Security Lending.
The Fund lends portfolio securities through a lending agent from time to time in order to earn additional income. For equity securities, a lending agent is used and may loan securities to certain qualified borrowers, including Fidelity Capital Markets (FCM), a broker-dealer affiliated with the Fund. On the settlement date of the loan, the Fund receives collateral (in the form of U.S. Treasury obligations, letters of credit and/or cash) against the loaned securities and maintains collateral in an amount not less than 100% of the market value of the loaned securities during the period of the loan. The market value of the loaned securities is determined at the close of business of the Fund and any additional required collateral is delivered to the Fund on the next business day. If the borrower defaults on its obligation to return the securities loaned because of insolvency or other reasons, the Fund may apply collateral received from the borrower against the obligation. The Fund may experience delays and costs in recovering the securities loaned. Any cash collateral received is invested in the Fidelity Securities Lending Cash Central Fund. The value of loaned securities and cash collateral at period end are disclosed on the Fund's Statement of Assets and Liabilities. Security lending income represents the income earned on investing cash collateral, less rebates paid to borrowers
Annual Report
7. Security Lending - continued
and any lending agent fees associated with the loan, plus any premium payments received for lending certain types of securities. Security lending income is presented in the Statement of Operations as a component income from Fidelity Central Funds. Total security lending income during the period amounted to $106,590. During the period, there were no securities loaned to FCM.
8. Expense Reductions.
Commissions paid to certain brokers with whom FMR places trades on behalf of the Fund include an amount in addition to trade execution, which is rebated back to the Fund to offset certain expenses. This amount totaled $85,737 for the period. In addition, through arrangements with the Fund's custodian, credits realized as a result of uninvested cash balances were used to reduce the Fund's expenses. During the period, these credits reduced the Fund's custody expenses by $4,414.
In addition, FMR reimbursed a portion of the Fund's operating expenses during the period in the amount of $2,696.
9. Distributions to Shareholders.
Distributions to shareholders of each class were as follows:
Years ended July 31, | 2013 | 2012 |
From net investment income | | |
Class A | $ 10,238,777 | $ 3,854,404 |
Class T | 1,523,114 | 609,057 |
Class C | 4,241,554 | 1,139,599 |
Real Estate Income | 126,726,805 | 86,666,891 |
Institutional Class | 17,180,188 | 5,847,712 |
Total | $ 159,910,438 | $ 98,117,663 |
From net realized gain | | |
Class A | $ 2,837,075 | $ 603,452 |
Class T | 506,062 | 83,752 |
Class C | 1,181,312 | 208,802 |
Real Estate Income | 42,729,814 | 14,865,902 |
Institutional Class | 4,279,899 | 736,613 |
Total | $ 51,534,162 | $ 16,498,521 |
Annual Report
Notes to Financial Statements - continued
10. Share Transactions.
Transactions for each class of shares were as follows:
| Shares | Dollars |
Years ended July 31, | 2013 | 2012 | 2013 | 2012 |
Class A | | | | |
Shares sold | 25,244,691 | 8,276,874 | $ 296,851,509 | $ 88,010,262 |
Reinvestment of distributions | 900,102 | 333,613 | 10,299,964 | 3,436,744 |
Shares redeemed | (5,925,325) | (2,031,559) | (69,436,144) | (21,254,183) |
Net increase (decrease) | 20,219,468 | 6,578,928 | $ 237,715,329 | $ 70,192,823 |
Class T | | | | |
Shares sold | 2,730,063 | 1,725,200 | $ 31,978,463 | $ 18,422,015 |
Reinvestment of distributions | 132,742 | 49,495 | 1,515,681 | 511,986 |
Shares redeemed | (1,226,451) | (163,799) | (14,137,454) | (1,727,688) |
Net increase (decrease) | 1,636,354 | 1,610,896 | $ 19,356,690 | $ 17,206,313 |
Class C | | | | |
Shares sold | 14,157,408 | 3,117,808 | $ 165,598,758 | $ 33,302,251 |
Reinvestment of distributions | 375,304 | 110,126 | 4,279,651 | 1,128,377 |
Shares redeemed | (1,637,958) | (534,569) | (19,029,492) | (5,534,157) |
Net increase (decrease) | 12,894,754 | 2,693,365 | $ 150,848,917 | $ 28,896,471 |
Real Estate Income | | | | |
Shares sold | 123,727,906 | 90,720,847 | $ 1,450,014,694 | $ 959,813,942 |
Reinvestment of distributions | 13,299,047 | 8,913,831 | 151,923,311 | 91,762,119 |
Shares redeemed | (90,180,888) | (54,623,988) | (1,057,830,249) | (572,115,634) |
Net increase (decrease) | 46,846,065 | 45,010,690 | $ 544,107,756 | $ 479,460,427 |
Institutional Class | | | | |
Shares sold | 42,960,747 | 16,926,727 | $ 506,030,603 | $ 177,564,635 |
Reinvestment of distributions | 1,337,082 | 472,572 | 15,315,413 | 4,899,349 |
Shares redeemed | (11,392,454) | (2,146,783) | (133,274,193) | (22,734,449) |
Net increase (decrease) | 32,905,375 | 15,252,516 | $ 388,071,823 | $ 159,729,535 |
Annual Report
11. Other.
The Fund's organizational documents provide former and current trustees and officers with a limited indemnification against liabilities arising in connection with the performance of their duties to the Fund. In the normal course of business, the Fund may also enter into contracts that provide general indemnifications. The Fund's maximum exposure under these arrangements is unknown as this would be dependent on future claims that may be made against the Fund. The risk of material loss from such claims is considered remote.
Annual Report
To the Trustees of Fidelity Securities Fund and Shareholders of Fidelity Real Estate Income Fund:
We have audited the accompanying statement of assets and liabilities of Fidelity Real Estate Income Fund (the Fund), a fund of Fidelity Securities Fund, including the schedule of investments, as of July 31, 2013, and the related statement of operations for the year then ended, the statement of changes in net assets for each of the two years in the period then ended, and the financial highlights for each of the five years in the period then ended. These financial statements and financial highlights are the responsibility of the Fund's management. Our responsibility is to express an opinion on these financial statements and financial highlights based on our audits.
We conducted our audits in accordance with the standards of the Public Company Accounting Oversight Board (United States). Those standards require that we plan and perform the audit to obtain reasonable assurance about whether the financial statements and financial highlights are free of material misstatement. The Fund is not required to have, nor were we engaged to perform, an audit of their internal control over financial reporting. Our audits included consideration of internal control over financial reporting as a basis for designing audit procedures that are appropriate in the circumstances, but not for the purpose of expressing an opinion on the effectiveness of the Fund's internal control over financial reporting. Accordingly, we express no such opinion. An audit also includes examining, on a test basis, evidence supporting the amounts and disclosures in the financial statements, assessing the accounting principles used and significant estimates made by management, as well as evaluating the overall financial statement presentation. Our procedures included confirmation of securities owned as of July 31, 2013, by correspondence with the custodians, agent banks, and brokers; where replies were not received from brokers, we performed other auditing procedures. We believe that our audits provide a reasonable basis for our opinion.
In our opinion, the financial statements and financial highlights referred to above present fairly, in all material respects, the financial position of Fidelity Real Estate Income Fund as of July 31, 2013, the results of its operations for the year then ended, the changes in its net assets for each of the two years in the period then ended, and the financial highlights for each of the five years in the period then ended, in conformity with accounting principles generally accepted in the United States of America.
DELOITTE & TOUCHE LLP
Boston, Massachusetts
September 20, 2013
Annual Report
The Trustees, Member of the Advisory Board, and executive officers of the trust and fund, as applicable, are listed below. The Board of Trustees governs the fund and is responsible for protecting the interests of shareholders. The Trustees are experienced executives who meet periodically throughout the year to oversee the fund's activities, review contractual arrangements with companies that provide services to the fund, oversee management of the risks associated with such activities and contractual arrangements, and review the fund's performance. Except for James C. Curvey, Ned C. Lautenbach, Ronald P. O'Hanley, and William S. Stavropoulos, each of the Trustees oversees 166 Fidelity funds. Mr. Curvey oversees 387 Fidelity funds. Mr. Lautenbach, Mr. O'Hanley, and Mr. Stavropoulos each oversees 230 Fidelity funds.
The Trustees hold office without limit in time except that (a) any Trustee may resign; (b) any Trustee may be removed by written instrument, signed by at least two-thirds of the number of Trustees prior to such removal; (c) any Trustee who requests to be retired or who has become incapacitated by illness or injury may be retired by written instrument signed by a majority of the other Trustees; and (d) any Trustee may be removed at any special meeting of shareholders by a two-thirds vote of the outstanding voting securities of the trust. Each Trustee who is not an interested person of the trust and the fund (as defined in the 1940 Act) (Independent Trustee), shall retire not later than the last day of the calendar year in which his or her 75th birthday occurs. The Independent Trustees may waive this mandatory retirement age policy with respect to individual Trustees. The executive officers and Advisory Board Member hold office without limit in time, except that any officer and Advisory Board Member may resign or may be removed by a vote of a majority of the Trustees at any regular meeting or any special meeting of the Trustees. Except as indicated, each individual has held the office shown or other offices in the same company for the past five years.
Experience, Skills, Attributes, and Qualifications of the Fund's Trustees. The Governance and Nominating Committee has adopted a statement of policy that describes the experience, qualifications, attributes, and skills that are necessary and desirable for potential Independent Trustee candidates (Statement of Policy). The Board believes that each Trustee satisfied at the time he or she was initially elected or appointed a Trustee, and continues to satisfy, the standards contemplated by the Statement of Policy. The Governance and Nominating Committee also engages professional search firms to help identify potential Independent Trustee candidates who have the experience, qualifications, attributes, and skills consistent with the Statement of Policy. From time to time, additional criteria based on the composition and skills of the current Independent Trustees, as well as experience or skills that may be appropriate in light of future changes to board composition, business conditions, and regulatory or other developments, have also been considered by the professional search firms and the Governance and Nominating Committee. In addition, the Board takes into account the Trustees' commitment and participation in Board and committee meetings, as well as their leadership of standing and ad hoc committees throughout their tenure.
Annual Report
Trustees and Officers - continued
In determining that a particular Trustee was and continues to be qualified to serve as a Trustee, the Board has considered a variety of criteria, none of which, in isolation, was controlling. The Board believes that, collectively, the Trustees have balanced and diverse experience, qualifications, attributes, and skills, which allow the Board to operate effectively in governing the fund and protecting the interests of shareholders. Information about the specific experience, skills, attributes, and qualifications of each Trustee, which in each case led to the Board's conclusion that the Trustee should serve (or continue to serve) as a trustee of the fund, is provided below.
Board Structure and Oversight Function. James C. Curvey is an interested person (as defined in the 1940 Act) and currently serves as Chairman. The Trustees have determined that an interested Chairman is appropriate and benefits shareholders because an interested Chairman has a personal and professional stake in the quality and continuity of services provided to the fund. Independent Trustees exercise their informed business judgment to appoint an individual of their choosing to serve as Chairman, regardless of whether the Trustee happens to be independent or a member of management. The Independent Trustees have determined that they can act independently and effectively without having an Independent Trustee serve as Chairman and that a key structural component for assuring that they are in a position to do so is for the Independent Trustees to constitute a substantial majority for the Board. The Independent Trustees also regularly meet in executive session. Ned C. Lautenbach serves as Chairman of the Independent Trustees and as such (i) acts as a liaison between the Independent Trustees and management with respect to matters important to the Independent Trustees and (ii) with management prepares agendas for Board meetings.
Fidelity funds are overseen by different Boards of Trustees. The fund's Board oversees Fidelity's equity and high income funds and another Board oversees Fidelity's investment-grade bond, money market, and asset allocation funds. The asset allocation funds may invest in Fidelity funds overseen by the fund's Board. The use of separate Boards, each with its own committee structure, allows the Trustees of each group of Fidelity funds to focus on the unique issues of the funds they oversee, including common research, investment, and operational issues. On occasion, the separate Boards establish joint committees to address issues of overlapping consequences for the Fidelity funds overseen by each Board.
The Trustees operate using a system of committees to facilitate the timely and efficient consideration of all matters of importance to the Trustees, the fund, and fund shareholders and to facilitate compliance with legal and regulatory requirements and oversight of the fund's activities and associated risks. The Board, acting through its committees, has charged FMR and its affiliates with (i) identifying events or circumstances the occurrence of which could have demonstrably adverse effects on the fund's business and/or reputation; (ii) implementing processes and controls to lessen the possibility that such events or circumstances occur or to mitigate the effects of such events or circumstances if they do occur; and (iii) creating and maintaining a system designed to evaluate continuously business and market conditions in order to facilitate the identification and implementation processes described in (i) and (ii) above. Because the day-to-day operations and activities of the fund are carried out by or through FMR, its affiliates and other service providers, the fund's exposure to risks is mitigated but not eliminated by the processes overseen by the Trustees. While each of the Board's committees has responsibility for overseeing different aspects of the fund's activities, oversight is exercised primarily through the Operations, Audit, and Compliance Committees. In addition, the Independent Trustees have worked with FMR to enhance the Board's oversight of investment and financial risks, legal and regulatory risks, technology risks, and operational risks, including the development of additional risk reporting to the Board. For example, a working group comprised of Independent Trustees and FMR has worked and continues to work to review the Fidelity funds' valuation-related activities, reporting and risk management. Appropriate personnel, including but not limited to the fund's Chief Compliance Officer (CCO), FMR's internal auditor, the independent accountants, the fund's Treasurer and portfolio management personnel, make periodic reports to the Board's committees, as appropriate, including an annual review of FMR's risk management program for the Fidelity funds. The responsibilities of each standing committee, including their oversight responsibilities, are described further under "Standing Committees of the Fund's Trustees."
Annual Report
The fund's Statement of Additional Information (SAI) includes more information about the Trustees. To request a free copy, call Fidelity at 1-877-208-0098.
Interested Trustees*:
Correspondence intended for each Trustee who is an interested person may be sent to Fidelity Investments, 245 Summer Street, Boston, Massachusetts 02210.
Name, Year of Birth; Principal Occupations and Other Relevant Experience+ |
James C. Curvey (1935) |
| Year of Election or Appointment: 2007 Mr. Curvey is Trustee and Chairman of the Board of Trustees of certain Trusts. Mr. Curvey also serves as Trustee (2007-present) of other investment companies advised by FMR. Mr. Curvey is a Director of Fidelity Investments Money Management, Inc. (2009-present), Director of Fidelity Research & Analysis Co. (2009-present) and Director of FMR and FMR Co., Inc. (2007-present). Mr. Curvey is also Vice Chairman (2007-present) and Director of FMR LLC. In addition, Mr. Curvey serves as an Overseer for the Boston Symphony Orchestra and a member of the Trustees of Villanova University. Previously, Mr. Curvey was the Vice Chairman (2006-2007) and Director (2000-
2007) of FMR Corp. |
Ronald P. O'Hanley (1957) |
| Year of Election or Appointment: 2011 Mr. O'Hanley serves as a Trustee and Chairman of the Board of Trustees of other Fidelity funds (2013-present), and is Director of FMR Co., Inc. (2010-present), Director of Fidelity Investments Money Management, Inc. (2010-present), Director of Fidelity Research & Analysis Company (2010-present), President of Fidelity Asset Management and Corporate Services and a Member of Fidelity's Executive Committee (2010-present). Previously, Mr. O'Hanley served as President and Chief Executive Officer of BNY Mellon Asset Management (2007-2010). Mr. O'Hanley also served as Vice Chairman of Bank New York Mellon Corp. and a member of that firm's Executive Committee. Prior to the 2007 merger of The Bank of New York and Mellon Financial Corporation, he was Vice Chairman of Mellon Financial Corporation and President and Chief Executive Officer of Mellon Asset Management. He joined Mellon in February 1997. Mr. O'Hanley currently serves as Chairman of the Boston Public Library Foundation Board of Directors and sits on the Board of Directors of Beth Israel Deaconess Medical Center, the Board of Trustees of the Marine Biological Laboratory and the Advisory Board of the Maxwell School of Citizenship and Public Administration at Syracuse University. Mr. O'Hanley also chairs the Council on Asset Management for the Financial Services Roundtable and is a member of the Board of Directors of Institutional Investor's U.S. Institute. |
* Trustees have been determined to be "Interested Trustees" by virtue of, among other things, their affiliation with the trust or various entities under common control with FMR.
+ The information above includes each Trustee's principal occupation during the last five years and other information relating to the experience, attributes, and skills relevant to each Trustee's qualifications to serve as a Trustee, which led to the conclusion that each Trustee should serve as a Trustee for the fund.
Annual Report
Independent Trustees:
Correspondence intended for each Independent Trustee (that is, the Trustees other than the Interested Trustees) may be sent to Fidelity Investments, P.O. Box 55235, Boston, Massachusetts 02205-5235.
Name, Year of Birth; Principal Occupations and Other Relevant Experience+ |
Dennis J. Dirks (1948) |
| Year of Election or Appointment: 2005 Prior to his retirement in May 2003, Mr. Dirks was Chief Operating Officer and a member of the Board of The Depository Trust & Clearing Corporation (DTCC). He also served as President, Chief Operating Officer, and Board member of The Depository Trust Company (DTC) and President and Board member of the National Securities Clearing Corporation (NSCC). In addition, Mr. Dirks served as Chief Executive Officer and Board member of the Government Securities Clearing Corporation, Chief Executive Officer and Board member of the Mortgage-Backed Securities Clearing Corporation, as a Trustee and a member of the Finance Committee of Manhattan College (2005-2008), and as a Trustee and a member of the Finance Committee of AHRC of Nassau County (2006-2008). Mr. Dirks is a member of the Independent Directors Council (IDC) Governing Council (2010-present) and Board of Directors for The Brookville Center for Children's Services, Inc. (2009-present). |
Alan J. Lacy (1953) |
| Year of Election or Appointment: 2008 Mr. Lacy serves as Senior Adviser (2007-present) of Oak Hill Capital Partners, L.P. (private equity). Mr. Lacy also served as Chief Executive Officer (2000-2005) and Vice Chairman (2005-2006) of Sears Holdings Corporation and Sears, Roebuck and Co. (retail). In addition, Mr. Lacy serves as a member of the Board of Directors of Dave & Buster's Entertainment, Inc. (restaurant and entertainment complexes, 2010-
present), Earth Fare, Inc. (retail grocery, 2012-present), The Hillman Companies, Inc. (hardware wholesalers, 2010-present), and Bristol-Myers Squibb Company (global pharmaceuticals, 2008-present). Mr. Lacy is a member of the Board of Trustees of The National Parks Conservation Association (2006-present). Previously, Mr. Lacy served as Chairman of the Board of Trustees of the National Parks Conservation Association (2008-2011) and as a member of the Board of Directors for the Western Union Company (global money transfer, 2006-2011). |
Ned C. Lautenbach (1944) |
| Year of Election or Appointment: 2000 Mr. Lautenbach is Chairman of the Independent Trustees of the Equity and High Income Funds (2006-present) and serves as a Trustee of other Fidelity funds (2013-present). Mr. Lautenbach currently serves as the Lead Director of the Eaton Corporation Board of Directors (diversified industrial, 1997-present). Mr. Lautenbach is Chairman of the Board of Directors of the Philharmonic Center for the Arts in Naples, Florida (2012-present) and a member of the Council on Foreign Relations (1994-present). Previously, Mr. Lautenbach was a Partner/Advisory Partner at Clayton, Dubilier & Rice, LLC (private equity investment, 1998-2010), as well as a Director of Sony Corporation (2006-2007). |
Joseph Mauriello (1944) |
| Year of Election or Appointment: 2008 Prior to his retirement in January 2006, Mr. Mauriello served in numerous senior management positions including Deputy Chairman and Chief Operating Officer (2004-2005), and Vice Chairman of Financial Services (2002-2004) of KPMG LLP US (professional services, 1965-2005). Mr. Mauriello currently serves as a member of the Board of Directors of XL Group plc. (global insurance and re-insurance, 2006-present). Previously, Mr. Mauriello served as a Director of the Hamilton Funds of the Bank of New York (2006-2007) and of Arcadia Resources Inc. (health care services and products, 2007-2012). |
Robert W. Selander (1950) |
| Year of Election or Appointment: 2011 Previously, Mr. Selander served as a Member of the Advisory Board of Fidelity's Equity and High Income Funds (2011), Executive Vice Chairman (2010), Chief Executive Officer (2009-2010), and President and Chief Executive Officer (1997-2009) of Mastercard, Inc. |
Cornelia M. Small (1944) |
| Year of Election or Appointment: 2005 Ms. Small is a member of the Board of Directors (2009-present) and Chair of the Investment Committee (2010-present) of the Teagle Foundation. Ms. Small also serves on the Investment Committee of the Berkshire Taconic Community Foundation (2008-present). Previously, Ms. Small served as Chairperson (2002-2008) and a member of the Investment Committee and Chairperson (2008-2012) and a member of the Board of Trustees of Smith College. In addition, Ms. Small served as Chief Investment Officer, Director of Global Equity Investments, and a member of the Board of Directors of Scudder, Stevens & Clark and Scudder Kemper Investments. |
William S. Stavropoulos (1939) |
| Year of Election or Appointment: 2002 Mr. Stavropoulos is Vice Chairman of the Independent Trustees of the Equity and High Income Funds (2006-present) and serves as a Trustee of other Fidelity funds (2013-present). Mr. Stavropoulos serves as President and Founder of the Michigan Baseball Foundation, the Great Lakes Loons (2007-present). Mr. Stavropoulos is Chairman Emeritus of the Board of Directors of The Dow Chemical Company, where he previously served in numerous senior management positions, including President, CEO (1995-2000; 2002-2004), Chairman of the Executive Committee (2000-2006), and as a member of the Board of Directors (1990-2006). Currently, Mr. Stavropoulos is Chairman of the Board of Directors of Univar Inc. (global distributor of commodity and specialty chemicals), a Director of Teradata Corporation (data warehousing and technology solutions), and Maersk Inc. (industrial conglomerate), and a member of the Advisory Board for Metalmark Capital LLC (private equity investment, 2005-present). Mr. Stavropoulos is an operating advisor to Clayton, Dubilier & Rice, LLC (private equity investment). In addition, Mr. Stavropoulos is a member of the University of Notre Dame Advisory Council for the College of Science, a Trustee of the Rollin L. Gerstacker Foundation, and a Director of the Naples Philharmonic Center for the Arts. Previously, Mr. Stavropoulos served as a Director of Chemical Financial Corporation (bank holding company, 1993-2012) and Tyco International, Ltd. (multinational manufacturing and services, 2007-2012). |
David M. Thomas (1949) |
| Year of Election or Appointment: 2008 Previously, Mr. Thomas served as Executive Chairman (2005-2006) and Chairman and Chief Executive Officer (2000-2005) of IMS Health, Inc. (pharmaceutical and healthcare information solutions), and a Director of Fortune Brands, Inc. (consumer products, 2000-2011). In addition, Mr. Thomas serves as Non-Executive Chairman of the Board of Directors of Fortune Brands Home and Security (home and security products, 2011-
present), and as a member of the Board of Directors of Interpublic Group of Companies, Inc. (marketing communication, 2004-present). |
+ The information above includes each Trustee's principal occupation during the last five years and other information relating to the experience, attributes, and skills relevant to each Trustee's qualifications to serve as a Trustee, which led to the conclusion that each Trustee should serve as a Trustee for the fund.
Annual Report
Trustees and Officers - continued
Advisory Board Member and Executive Officers:
Correspondence intended for each executive officer and Peter S. Lynch may be sent to Fidelity Investments, 245 Summer Street, Boston, Massachusetts 02210.
Name, Year of Birth; Principal Occupation |
Peter S. Lynch (1944) |
| Year of Election or Appointment: 2003 Member of the Advisory Board of Fidelity's Equity and High Income Funds. Mr. Lynch is Vice Chairman and a Director of FMR and FMR Co., Inc. In addition, Mr. Lynch serves as a Trustee of Boston College and as the Chairman of the Inner-City Scholarship Fund. Previously, Mr. Lynch served on the Special Olympics International Board of Directors (1997-2006). |
Kenneth B. Robins (1969) |
| Year of Election or Appointment: 2008 President and Treasurer of Fidelity's Equity and High Income Funds. Mr. Robins also serves as President and Treasurer (2008-present) and Assistant Treasurer (2009-present) of other Fidelity funds and is an employee of Fidelity Investments (2004-present). Mr. Robins serves as Executive Vice President of Fidelity Investments Money Management, Inc. (FIMM) (2013-present). Previously, Mr. Robins served as Deputy Treasurer of the Fidelity funds (2005-2008) and Treasurer and Chief Financial Officer of The North Carolina Capital Management Trust: Cash and Term Portfolios (2006-2008). |
Brian B. Hogan (1964) |
| Year of Election or Appointment: 2009 Vice President of Equity and High Income Funds. Mr. Hogan also serves as Vice President of other Fidelity funds (2009-present) and President of FMR's Equity Division (2009-present). Previously, Mr. Hogan served as Senior Vice President, Equity Research of FMR (2006-2009) and as a portfolio manager. |
Christopher S. Bartel (1971) |
| Year of Election or Appointment: 2009 Vice President of Fidelity's Sector and Real Estate Equity Funds. Mr. Bartel also serves as a Director, President, and Chief Executive Officer of Fidelity Management & Research (Japan) Inc. (2012-present), a Director of Fidelity Management & Research (Hong Kong) (2012-
present), and Senior Vice President of Global Equity Research (2010-
present). Previously, Mr. Bartel served as Senior Vice President of Equity Research (2009-2010), Managing Director of Research (2006-
2009), and an analyst and portfolio manager (2000-2006). |
Scott C. Goebel (1968) |
| Year of Election or Appointment: 2008 Secretary and Chief Legal Officer (CLO) of the Fidelity funds. Mr. Goebel also serves as Secretary of Fidelity Investments Money Management, Inc. (FIMM) (2010-present) and Fidelity Research and Analysis Company (FRAC) (2010-present); Secretary and CLO of The North Carolina Capital Management Trust: Cash and Term Portfolios (2008-
present); General Counsel, Secretary, and Senior Vice President of FMR (2008-present) and FMR Co., Inc. (2008-present); employed by FMR LLC or an affiliate (2001-present); Chief Legal Officer of Fidelity Management & Research (Hong Kong) Limited (2008-present) and Assistant Secretary of Fidelity Management & Research (Japan) Inc. (2008-present), and Fidelity Management & Research (U.K.) Inc. (2008-present). Previously, Mr. Goebel served as Assistant Secretary of FIMM (2008-2010), FRAC (2008-2010), and the Funds (2007-
2008) and as Vice President and Secretary of Fidelity Distributors Corporation (FDC) (2005-2007). |
William C. Coffey (1969) |
| Year of Election or Appointment: 2009 Assistant Secretary of Fidelity's Equity and High Income Funds. Mr. Coffey also serves as Assistant Secretary of other Fidelity funds (2009-present), Senior Vice President and Deputy General Counsel of FMR LLC (2010-present), and is an employee of Fidelity Investments. Previously, Mr. Coffey served as Vice President and Associate General Counsel of FMR LLC (2005-2009). |
Elizabeth Paige Baumann (1968) |
| Year of Election or Appointment: 2012 Anti-Money Laundering (AML) Officer of the Fidelity funds. Ms. Baumann also serves as AML Officer of The North Carolina Capital Management Trust: Cash and Term Portfolios (2012-present), Chief AML Officer of FMR LLC (2012-present), and is an employee of Fidelity Investments. Previously, Ms. Baumann served as Vice President and Deputy Anti-Money Laundering Officer (2007-2012). |
Christine Reynolds (1958) |
| Year of Election or Appointment: 2008 Chief Financial Officer of the Fidelity funds. Ms. Reynolds became President of Fidelity Pricing and Cash Management Services (FPCMS) in August 2008. Ms. Reynolds served as Chief Operating Officer of FPCMS (2007-2008). Previously, Ms. Reynolds served as President, Treasurer, and Anti-Money Laundering officer of the Fidelity funds (2004-2007). |
Joseph A. Hanlon (1968) |
| Year of Election or Appointment: 2012 Chief Compliance Officer of Fidelity's Equity and High Income Funds. Mr. Hanlon also serves as Chief Compliance Officer of other Fidelity funds (2012-present). Mr. Hanlon serves as Compliance Officer of FMR, FMR Co., Inc., Fidelity Investments Money Management, Inc. (FIMM), Fidelity Research and Analysis Company (FRAC), and Fidelity Management & Research (Hong Kong) (2009-present), as Senior Vice President of the Fidelity Asset Management Division (2009-present), and is an employee of Fidelity Investments. Previously, Mr. Hanlon served as Compliance Officer of Fidelity Management & Research (Japan) Inc. (2009-2013), Strategic Advisers, Inc. (2009-2013), and Fidelity Management & Research (U.K.) Inc. (2009-2013). |
Joseph F. Zambello (1957) |
| Year of Election or Appointment: 2011 Deputy Treasurer of the Fidelity funds. Mr. Zambello is an employee of Fidelity Investments. Previously, Mr. Zambello served as Vice President of FMR's Program Management Group (2009-2011) and Vice President of the Transfer Agent Oversight Group (2005-2009). |
Adrien E. Deberghes (1967) |
| Year of Election or Appointment: 2008 Deputy Treasurer of Fidelity's Equity and High Income Funds. Mr. Deberghes also serves as Vice President (2011-present), Deputy Treasurer (2008-present), and Assistant Treasurer (2010-present) of other Fidelity funds, and is an employee of Fidelity Investments (2008-present). Previously, Mr. Deberghes served as Senior Vice President of Mutual Fund Administration at State Street Corporation (2007-2008), Senior Director of Mutual Fund Administration at Investors Bank & Trust (2005-2007), and Director of Finance for Dunkin' Brands (2000-2005). |
Stephen Sadoski (1971) |
| Year of Election or Appointment: 2012 Deputy Treasurer of Fidelity's Equity and High Income Funds. Mr. Sadoski also serves as Deputy Treasurer of other Fidelity funds (2012-present) and is an employee of Fidelity Investments (2012-present). Previously, Mr. Sadoski served as Assistant Treasurer of Fidelity's Fixed Income and Asset Allocation Funds (2012-2013), an assistant chief accountant in the Division of Investment Management of the Securities and Exchange Commission (SEC) (2009-2012) and as a senior manager at Deloitte & Touche LLP (1997-2009). |
Stacie M. Smith (1974) |
| Year of Election or Appointment: 2013 Deputy Treasurer of Fidelity's Equity and High Income Funds. Ms. Smith also serves as Deputy Treasurer of other Fidelity funds (2013-present) and is an employee of Fidelity Investments (2009-present). Previously, Ms. Smith served as Senior Audit Manager of Ernst & Young LLP (1996-2009). |
Stephanie J. Dorsey (1969) |
| Year of Election or Appointment: 2010 Assistant Treasurer of Fidelity's Equity and High Income Funds. Ms. Dorsey also serves as President and Treasurer (2013-present) and Assistant Treasurer (2010-present) of other Fidelity funds, Treasurer and Chief Financial Officer of The North Carolina Capital Management Trust: Cash and Term Portfolios (2013-present), and is an employee of Fidelity Investments (2008-present). Previously, Ms. Dorsey served as Deputy Treasurer of Fidelity's Fixed Income and Asset Allocation Funds (2008-2013), Treasurer (2004-2008) of the JPMorgan Mutual Funds and Vice President (2004-2008) of JPMorgan Chase Bank. |
Gary W. Ryan (1958) |
| Year of Election or Appointment: 2005 Assistant Treasurer of the Fidelity funds. Mr. Ryan is an employee of Fidelity Investments. Previously, Mr. Ryan served as Vice President of Fund Reporting in Fidelity Pricing and Cash Management Services (FPCMS) (1999-2005). |
Jonathan Davis (1968) |
| Year of Election or Appointment: 2010 Assistant Treasurer of the Fidelity funds. Mr. Davis is also Assistant Treasurer of Fidelity Rutland Square Trust II and Fidelity Commonwealth Trust II. Mr. Davis is an employee of Fidelity Investments. Previously, Mr. Davis served as Vice President and Associate General Counsel of FMR LLC (2003-2010). |
Annual Report
The Board of Trustees of Fidelity Advisor Real Estate Income Fund voted to pay to shareholders of record at the opening of business, the following distributions per share derived from capital gains realized from sales of portfolio securities, and dividends derived from net investment income:
| Pay Date | Record Date | Dividends | Capital Gains |
Institutional Class | 09/09/13 | 09/06/13 | $0.159 | $0.139 |
The fund hereby designates as a capital gain dividend with respect to the taxable year ended July 31, 2013, $47,460,544, or, if subsequently determined to be different, the net capital gain of such year.
A total of 0.06% of the dividends distributed during the fiscal year was derived from interest on U.S. Government securities which is generally exempt from state income tax.
The fund will notify shareholders in January 2014 of amounts for use in preparing 2013 income tax returns.
Annual Report
Board Approval of Investment Advisory Contracts and Management Fees
Fidelity Real Estate Income Fund
Each year, the Board of Trustees, including the Independent Trustees (together, the Board), votes on the renewal of the management contract and sub-advisory agreements (together, the Advisory Contracts) for the fund. The Board, assisted by the advice of fund counsel and Independent Trustees' counsel, requests and considers a broad range of information relevant to the renewal of the Advisory Contracts throughout the year.
The Board meets regularly and, at each of its meetings, covers an extensive agenda of topics and materials and considers factors that are relevant to its annual consideration of the renewal of the fund's Advisory Contracts, including the services and support provided to the fund and its shareholders. The Board has established various standing committees, each composed of and chaired by Independent Trustees with varying backgrounds, to which the Board has assigned specific subject matter responsibilities in order to enhance effective decision-making by the Board. The Board, acting directly and through its Committees, requests and receives information concerning the annual consideration of the renewal of the fund's Advisory Contracts. The Board also meets as needed to consider matters specifically related to the Board's annual consideration of the renewal of Advisory Contracts. Members of the Board may also meet with trustees of other Fidelity funds through ad hoc joint committees to discuss certain matters relevant to the Fidelity funds.
At its July 2013 meeting, the Board, including the Independent Trustees, unanimously determined to renew the fund's Advisory Contracts. In reaching its determination, the Board considered all factors it believed relevant, including (i) the nature, extent, and quality of the services to be provided to the fund and its shareholders (including the investment performance of the fund); (ii) the competitiveness of the fund's management fee and total expense ratio relative to peer funds; (iii) the total costs of the services to be provided by and the profits to be realized by Fidelity from its relationship with the fund; (iv) the extent to which economies of scale exist and would be realized as the fund grows; and (v) whether fee levels reflect these economies of scale, if any, for the benefit of fund shareholders.
In considering whether to renew the Advisory Contracts for the fund, the Board reached a determination, with the assistance of fund counsel and Independent Trustees' counsel and through the exercise of its business judgment, that the renewal of the Advisory Contracts was in the best interests of the fund and its shareholders and that the compensation payable under the Advisory Contracts was fair and reasonable. The Board's decision to renew the Advisory Contracts was not based on any single factor, but rather was based on a comprehensive consideration of all the information provided to the Board at its meetings throughout the year. The Board, in reaching its determination to renew the Advisory Contracts, was aware that shareholders in the fund have a broad range of investment choices available to them, including a wide choice among mutual funds offered by Fidelity's competitors, and that the fund's shareholders, who have the opportunity to review and weigh the disclosure provided by the fund in its prospectus and other public disclosures, have chosen to invest in this fund, which is a part of the Fidelity family of funds.
Annual Report
Board Approval of Investment Advisory Contracts and
Management Fees - continued
Nature, Extent, and Quality of Services Provided. The Board considered the staffing within the investment adviser, Fidelity Management & Research Company (FMR), and the sub-advisers (together, the Investment Advisers) as it relates to the fund, including the backgrounds of the fund's investment personnel, and also considered the fund's investment objective, strategies, and related investment philosophy. The Independent Trustees also had discussions with senior management of Fidelity's investment operations and investment groups. The Board considered the structure of the portfolio manager compensation program and whether this structure provides appropriate incentives to act in the best interests of the fund.
Resources Dedicated to Investment Management and Support Services. The Board and the Fund Oversight and Research Committees reviewed the general qualifications and capabilities of the Investment Advisers' investment staff, including its size, education, experience, and resources, as well as the Investment Advisers' approach to recruiting, training, managing, and compensating investment personnel. The Board noted that FMR has continued to increase the resources devoted to non-U.S. offices, including expansion of Fidelity's global investment organization. The Board also noted that Fidelity's analysts have extensive resources, tools and capabilities that allow them to conduct sophisticated quantitative and fundamental analysis, as well as credit analysis of issuers, counterparties and guarantors. Further, the Board believes that Fidelity's investment professionals have sufficient access to global information and data so as to provide competitive investment results over time, and that those professionals also have access to sophisticated tools that permit them to assess portfolio construction and risk and performance attribution characteristics continuously, as well as to transmit new information and research conclusions rapidly around the world. Additionally, in its deliberations, the Board considered the Investment Advisers' trading and risk management capabilities and resources, which are an integral part of the investment management process.
Shareholder and Administrative Services. The Board considered (i) the nature, extent, quality, and cost of advisory, administrative, and shareholder services performed by the Investment Advisers and their affiliates under the Advisory Contracts and under separate agreements covering transfer agency, pricing and bookkeeping, and securities lending services for the fund; (ii) the nature and extent of the supervision of third party service providers, principally custodians and subcustodians; and (iii) the resources devoted to, and the record of compliance with, the fund's compliance policies and procedures. The Board also reviewed the allocation of fund brokerage, including allocations to brokers affiliated with the Investment Advisers, the use of brokerage commissions to pay fund expenses, and the use of "soft" commission dollars to pay for research services.
Annual Report
The Board noted that the growth of fund assets over time across the complex allows Fidelity to reinvest in the development of services designed to enhance the value or convenience of the Fidelity funds as investment vehicles. These services include 24-hour access to account information and market information through telephone representatives and over the Internet, investor education materials and asset allocation tools, and the expanded availability of Fidelity Investor Centers.
Investment in a Large Fund Family. The Board considered the benefits to shareholders of investing in a Fidelity fund, including the benefits of investing in a fund that is part of a large family of funds offering a variety of investment disciplines and providing a large variety of mutual fund investor services. The Board noted that Fidelity had taken, or had made recommendations that resulted in the Fidelity funds taking, a number of actions over the previous year that benefited particular funds, including (i) continuing to dedicate additional resources to investment research and to the support of the senior management team that oversees asset management; (ii) persisting in efforts to enhance Fidelity's global research capabilities; (iii) launching new funds and making other enhancements to meet client needs for global and income-oriented solutions; (iv) continuing to launch dedicated lower cost underlying funds to meet portfolio construction needs related to expanding underlying fund options for Fidelity funds of funds, specifically for the Freedom Fund product lines; (v) rationalizing product lines and gaining increased efficiencies through the mergers of several funds into other funds; (vi) strengthening Fidelity's index fund offerings by reducing investment minimums and adopting or lowering existing expense caps for certain funds and classes; (vii) enhancing Global Asset Allocation product offerings by launching new funds and strategies, including "open architecture" target date funds that utilize affiliated and unaffiliated sub-advisers; (viii) modifying the eligibility criteria for Institutional Class shares of Advisor funds to increase their marketability to a portion of the defined contribution plan market; (ix) creating a new low-cost retirement share class for certain Advisor funds to appeal to large retirement plans; (x) transitioning the management of certain Fidelity commodity funds to Geode Capital Management LLC, a registered commodity pool operator, while retaining administrative responsibilities for the funds; (xi) reorganizing a number of funds; and (xii) taking steps toward establishing a new Fidelity adviser to manage sector-based funds and products.
Investment Performance. The Board considered whether the fund has operated in accordance with its investment objective, as well as its record of compliance with its investment restrictions and its performance history.
The Board took into account discussions with the Investment Advisers about fund investment performance that occur at Board meetings throughout the year. In this regard the Board noted that as part of regularly scheduled fund reviews and other reports to the Board on fund performance, the Board periodically considers annualized return information for the fund, for different time periods, measured against a securities market index ("benchmark index") and a peer group of mutual funds with similar objectives ("peer group"). In its evaluation of fund investment performance, the Board gave particular attention to information indicating changes in performance of certain Fidelity funds for specific time periods and the Investment Advisers' explanations for any overperformance or underperformance.
Annual Report
Board Approval of Investment Advisory Contracts and
Management Fees - continued
In addition to reviewing absolute and relative fund performance, the Independent Trustees periodically consider the appropriateness of fund performance metrics in evaluating the results achieved. In general, the Independent Trustees believe that fund performance should be evaluated based on net performance (after fees and expenses) of both the highest performing and lowest performing classes, where applicable, compared to appropriate benchmark indices, over appropriate time periods which may include full market cycles, and compared to peer groups, as applicable, over the same periods, taking into account relevant factors including the following: general market conditions; issuer-specific information; tactical opportunities for investment; and fund cash flows and other factors.
The Independent Trustees recognize that shareholders evaluate performance on a net basis over their own holding periods, for which one-, three-, and five-year periods are used as a proxy. For this reason, the performance information reviewed by the Board also included net cumulative calendar year total return information for the fund and an appropriate benchmark index and peer group for the most recent one-, three-, and five-year periods, as shown below. Returns are shown compared to the 25th percentile (top of box) and 75th percentile (bottom of box) of the peer universe.
Fidelity Real Estate Income Fund

Annual Report
Based on its review, the Board concluded that the nature, extent, and quality of services provided to the fund under the Advisory Contracts should benefit the fund's shareholders.
Competitiveness of Management Fee and Total Expense Ratio. The Board considered the fund's management fee and total expense ratio compared to "mapped groups" of competitive funds and classes. Fidelity creates "mapped groups" by combining similar Lipper investment objective categories that have comparable management fee characteristics. Combining Lipper investment objective categories aids the Board's management fee and total expense ratio comparisons by broadening the competitive group used for comparison and by reducing the number of universes to which various Fidelity funds are compared.
Management Fee. The Board considered two proprietary management fee comparisons for the 12-month periods shown in the chart below. The group of Lipper funds used by the Board for management fee comparisons is referred to below as the "Total Mapped Group." The Total Mapped Group is broader than the Lipper peer group used by the Board for performance comparisons because the Total Mapped Group combines several Lipper investment objective categories while the Lipper peer group does not. The Total Mapped Group comparison focuses on a fund's standing in terms of gross management fees before expense reimbursements or caps relative to the total universe of funds with comparable investment mandates, regardless of whether their management fee structures also are comparable. Funds with comparable investment mandates offer exposure to similar types of securities. Funds with comparable management fee structures have similar management fee contractual arrangements (e.g., flat rate charged for advisory services, all-inclusive fee rate, etc.). "TMG %" represents the percentage of funds in the Total Mapped Group that had management fees that were lower than the fund's. For example, a TMG % of 7% means that 93% of the funds in the Total Mapped Group had higher management fees than the fund. The "Asset-Size Peer Group" (ASPG) comparison focuses on a fund's standing relative to a subset of non-Fidelity funds within the Total Mapped Group that are similar in size and management fee structure. The ASPG represents at least 15% of the funds in the Total Mapped Group with comparable asset size and management fee structures, subject to a minimum of 50 funds (or all funds in the Total Mapped Group if fewer than 50). Additional information, such as the ASPG quartile in which the fund's management fee ranked, is also included in the chart and considered by the Board.
Annual Report
Board Approval of Investment Advisory Contracts and
Management Fees - continued
Fidelity Real Estate Income Fund

The Board noted that the fund's management fee ranked below the median of its Total Mapped Group and below the median of its ASPG for 2012.
Based on its review, the Board concluded that the fund's management fee is fair and reasonable in light of the services that the fund receives and the other factors considered.
Total Expense Ratio. In its review of each class's total expense ratio, the Board considered the fund's management fee as well as other fund or class expenses, as applicable, such as transfer agent fees, pricing and bookkeeping fees, fund-paid 12b-1 fees, and custodial, legal, and audit fees. The Board also noted the effects of any waivers and reimbursements on fees and expenses. As part of its review, the Board also considered the current and historical total expense ratios of each class of the fund compared to competitive fund median expenses. Each class of the fund is compared to those funds and classes in the Total Mapped Group (used by the Board for management fee comparisons) that have a similar sales load structure.
The Board noted that the total expense ratio of each class ranked below its competitive median for 2012.
Fees Charged to Other Fidelity Clients. The Board also considered Fidelity fee structures and other information with respect to clients of FMR and its affiliates, such as other mutual funds advised or subadvised by FMR or its affiliates, pension plan clients, and other institutional clients. The Board noted the findings of the 2013 ad hoc joint committee (created with the board of other Fidelity funds), which reviewed and compared Fidelity's institutional investment advisory business with its business of providing services to the Fidelity funds, including the differences in services provided, fees charged, and costs incurred, as well as competition in their respective marketplaces.
Annual Report
Based on its review of total expense ratios and fees charged to other Fidelity clients, the Board concluded that the total expense ratio of each class of the fund was reasonable in light of the services that the fund and its shareholders receive and the other factors considered.
Costs of the Services and Profitability. The Board considered the revenues earned and the expenses incurred by Fidelity in conducting the business of developing, marketing, distributing, managing, administering and servicing the fund and servicing the fund's shareholders. The Board also considered the level of Fidelity's profits in respect of all the Fidelity funds.
On an annual basis, FMR presents to the Board Fidelity's profitability for the fund. Fidelity calculates the profitability for each fund, as well as aggregate profitability for groups of Fidelity funds and all Fidelity funds, using a series of detailed revenue and cost allocation methodologies which originate with the books and records of Fidelity on which Fidelity's audited financial statements are based. The Audit Committee of the Board reviews any significant changes from the prior year's methodologies.
PricewaterhouseCoopers LLP (PwC), independent registered public accounting firm and auditor to Fidelity and certain Fidelity funds, has been engaged annually by the Board as part of the Board's assessment of Fidelity's profitability analysis. PwC's engagement includes the review and assessment of the methodologies used by Fidelity in determining the revenues and expenses attributable to Fidelity's mutual fund business, and completion of agreed-upon procedures surrounding the mathematical accuracy of fund profitability and its conformity to allocation methodologies. After considering PwC's reports issued under the engagement and information provided by Fidelity, the Board concluded that while other allocation methods may also be reasonable, Fidelity's profitability methodologies are reasonable in all material respects.
The Board also reviewed Fidelity's non-fund businesses and fall-out benefits related to the mutual fund business as well as cases where Fidelity's affiliates may benefit from or be related to the fund's business.
The Board considered the costs of the services provided by and the profits realized by Fidelity in connection with the operation of the fund and was satisfied that the profitability was not excessive in the circumstances.
Economies of Scale. The Board considered whether there have been economies of scale in respect of the management of the Fidelity funds, whether the Fidelity funds (including the fund) have appropriately benefited from any such economies of scale, and whether there is potential for realization of any further economies of scale. The Board considered the extent to which the fund will benefit from economies of scale through increased services to the fund, through waivers or reimbursements, or through fee or expense reductions. The Board also noted that in 2009, it and the board of other Fidelity funds created an ad hoc committee (the Economies of Scale Committee) to analyze whether FMR attains economies of scale in respect of the management and servicing of the Fidelity funds, whether the Fidelity funds have appropriately benefited from such economies of scale, and whether there is potential for realization of any further economies of scale.
Annual Report
Board Approval of Investment Advisory Contracts and
Management Fees - continued
The Board recognized that the fund's management contract incorporates a "group fee" structure, which provides for lower group fee rates as total fund assets under FMR's management increase, and for higher group fee rates as total fund assets under FMR's management decrease. FMR calculates the group fee rates based on a tiered asset "breakpoint" schedule that varies based on asset class. The Board considered that the group fee is designed to deliver the benefits of economies of scale to fund shareholders when total Fidelity fund assets increase, even if assets of any particular fund are unchanged or have declined, because some portion of Fidelity's costs are attributable to services provided to all Fidelity funds, and all funds benefit if those costs can be allocated among more assets. The Board concluded that, given the group fee structure, fund shareholders will benefit from lower management fees as assets under FMR's management increase at the fund complex level, regardless of whether Fidelity achieves any such economies of scale.
The Board concluded, taking into account the analysis of the Economies of Scale Committee, that economies of scale, if any, are being appropriately shared between fund shareholders and Fidelity.
Amendment to Description of Group Fee Rate. At its July 2013 meeting, the Board voted to approve an amendment to the fund's management contract to modify the description of the "group fee rate" effective August 1, 2013. The Board noted that under the prior description in the contract, the group fee rate was based on the average net assets of all registered investment companies with which FMR has management contracts. Under the contract's tiered asset breakpoint schedule, the group fee rate is lower as total fund assets under FMR's management increase, and higher as total fund assets under FMR's management decrease. The Board considered that the prior description would have excluded the assets of 64 Fidelity sector funds from the group fee rate calculation once Fidelity SelectCo, LLC, an affiliate of FMR, assumed management responsibilities for those funds. The Board noted that modifying the description of the group fee rate to continue to include the assets of those 64 funds for purposes of determining group fee rate breakpoints would avoid an immediate adverse impact on the group fee rate for any fund.
Additional Information Requested by the Board. In order to develop fully the factual basis for consideration of the Fidelity funds' Advisory Contracts, the Board requested and received additional information on certain topics, including: (i) fund performance trends and Fidelity's long-term strategies for certain funds; (ii) the potential to further rationalize the Fidelity fund lineup with the possibility of achieving savings for the funds and Fidelity; (iii) the methodology with respect to competitive fund data and peer group classifications; (iv) the arrangements with, and performance of, certain sub-advisers on behalf of the Fidelity funds, as well as certain proposed participating affiliate arrangements; (v) the realization of fall-out benefits in certain Fidelity business units; (vi) Fidelity's group fee structures, including the rationale for the individual fee rates of certain categories of funds and the definition of group assets; (vii) trends regarding industry use of performance fee structures and the performance adjustment methodologies applicable to the Fidelity funds; (viii) additional competitive analysis regarding the total expenses for certain classes; and (ix) fund profitability methodology, including Fidelity's cost allocation methodology, and the impact of certain factors on fund profitability results.
Annual Report
Based on its evaluation of all of the conclusions noted above, and after considering all factors it believed relevant, the Board ultimately concluded that the advisory fee structures are fair and reasonable, and that the fund's Advisory Contracts should be renewed.
Annual Report
Investment Adviser
Fidelity Management & Research Company
Boston, MA
Investment Sub-Advisers
FMR Co., Inc.
Fidelity Management & Research
(Hong Kong) Limited
Fidelity Management & Research
(Japan) Inc.
Fidelity Management & Research
(U.K.) Inc.
General Distributor
Fidelity Distributors Corporation
Smithfield, RI
Transfer and Service Agents
Fidelity Investments Institutional
Operations Company, Inc.
Boston, MA
Fidelity Service Company, Inc.
Boston, MA
Custodian
Citibank, N.A.
New York, NY
(Fidelity Investment logo)(registered trademark)
REII-UANN-0913
1.907540.103
Fidelity®
Small Cap Growth
Fund
Annual Report
July 31, 2013
(Fidelity Cover Art)
Contents
Performance | (Click Here) | How the fund has done over time. |
Management's Discussion of Fund Performance | (Click Here) | The Portfolio Manager's review of fund performance and strategy. |
Shareholder Expense Example | (Click Here) | An example of shareholder expenses. |
Investment Changes | (Click Here) | A summary of major shifts in the fund's investments over the past six months. |
Investments | (Click Here) | A complete list of the fund's investments with their market values. |
Financial Statements | (Click Here) | Statements of assets and liabilities, operations, and changes in net assets, as well as financial highlights. |
Notes | (Click Here) | Notes to the financial statements. |
Report of Independent Registered Public Accounting Firm | (Click Here) | |
Trustees and Officers | (Click Here) | |
Distributions | (Click Here) | |
Board Approval of Investment Advisory Contracts and Management Fees | (Click Here) | |
To view a fund's proxy voting guidelines and proxy voting record for the 12-month period ended June 30, visit http://www.fidelity.com/proxyvotingresults or visit the Securities and Exchange Commission's (SEC) web site at http://www.sec.gov. You may also call 1-800-544-8544 to request a free copy of the proxy voting guidelines.
Standard & Poor's, S&P and S&P 500 are registered service marks of The McGraw-Hill Companies, Inc. and have been licensed for use by Fidelity Distributors Corporation.
Other third-party marks appearing herein are the property of their respective owners.
All other marks appearing herein are registered or unregistered trademarks or service marks of FMR LLC or an affiliated company. © 2013 FMR LLC. All rights reserved.
Annual Report
This report and the financial statements contained herein are submitted for the general information of the shareholders of the fund. This report is not authorized for distribution to prospective investors in the fund unless preceded or accompanied by an effective prospectus.
A fund files its complete schedule of portfolio holdings with the SEC for the first and third quarters of each fiscal year on Form N-Q. Forms N-Q are available on the SEC's web site at http://www.sec.gov. A fund's Forms N-Q may be reviewed and copied at the SEC's Public Reference Room in Washington, DC. Information regarding the operation of the SEC's Public Reference Room may be obtained by calling 1-800-SEC-0330. For a complete list of a fund's portfolio holdings, view the fund's most recent holdings listing, semiannual report, or annual report on Fidelity's web site at http://www.fidelity.com, http://www.advisor.fidelity.com, or http://www.401k.com, as applicable.
NOT FDIC INSURED • MAY LOSE VALUE • NO BANK GUARANTEE
Neither the fund nor Fidelity Distributors Corporation is a bank.
Annual Report
Average annual total return reflects the change in the value of an investment, assuming reinvestment of the class' distributions from dividend income and capital gains (the profits earned upon the sale of securities that have grown in value, if any) and assuming a constant rate of performance each year. The $10,000 table and the fund's returns do not reflect the deduction of taxes that a shareholder would pay on fund distributions or the redemption of fund shares. During periods of reimbursement by Fidelity, a fund's total return will be greater than it would be had the reimbursement not occurred. How a fund did yesterday is no guarantee of how it will do tomorrow.
Average Annual Total Returns
Periods ended July 31, 2013 | Past 1
year | Past 5
years | Life of
fund A |
Fidelity® Small Cap Growth Fund | 32.74% | 10.55% | 10.52% |
A From November 3, 2004.
$10,000 Over Life of Fund
Let's say hypothetically that $10,000 was invested in Fidelity® Small Cap Growth Fund, a class of the fund, on November 3, 2004, when the fund started. The chart shows how the value of your investment would have changed, and also shows how the Russell 2000® Growth Index performed over the same period.
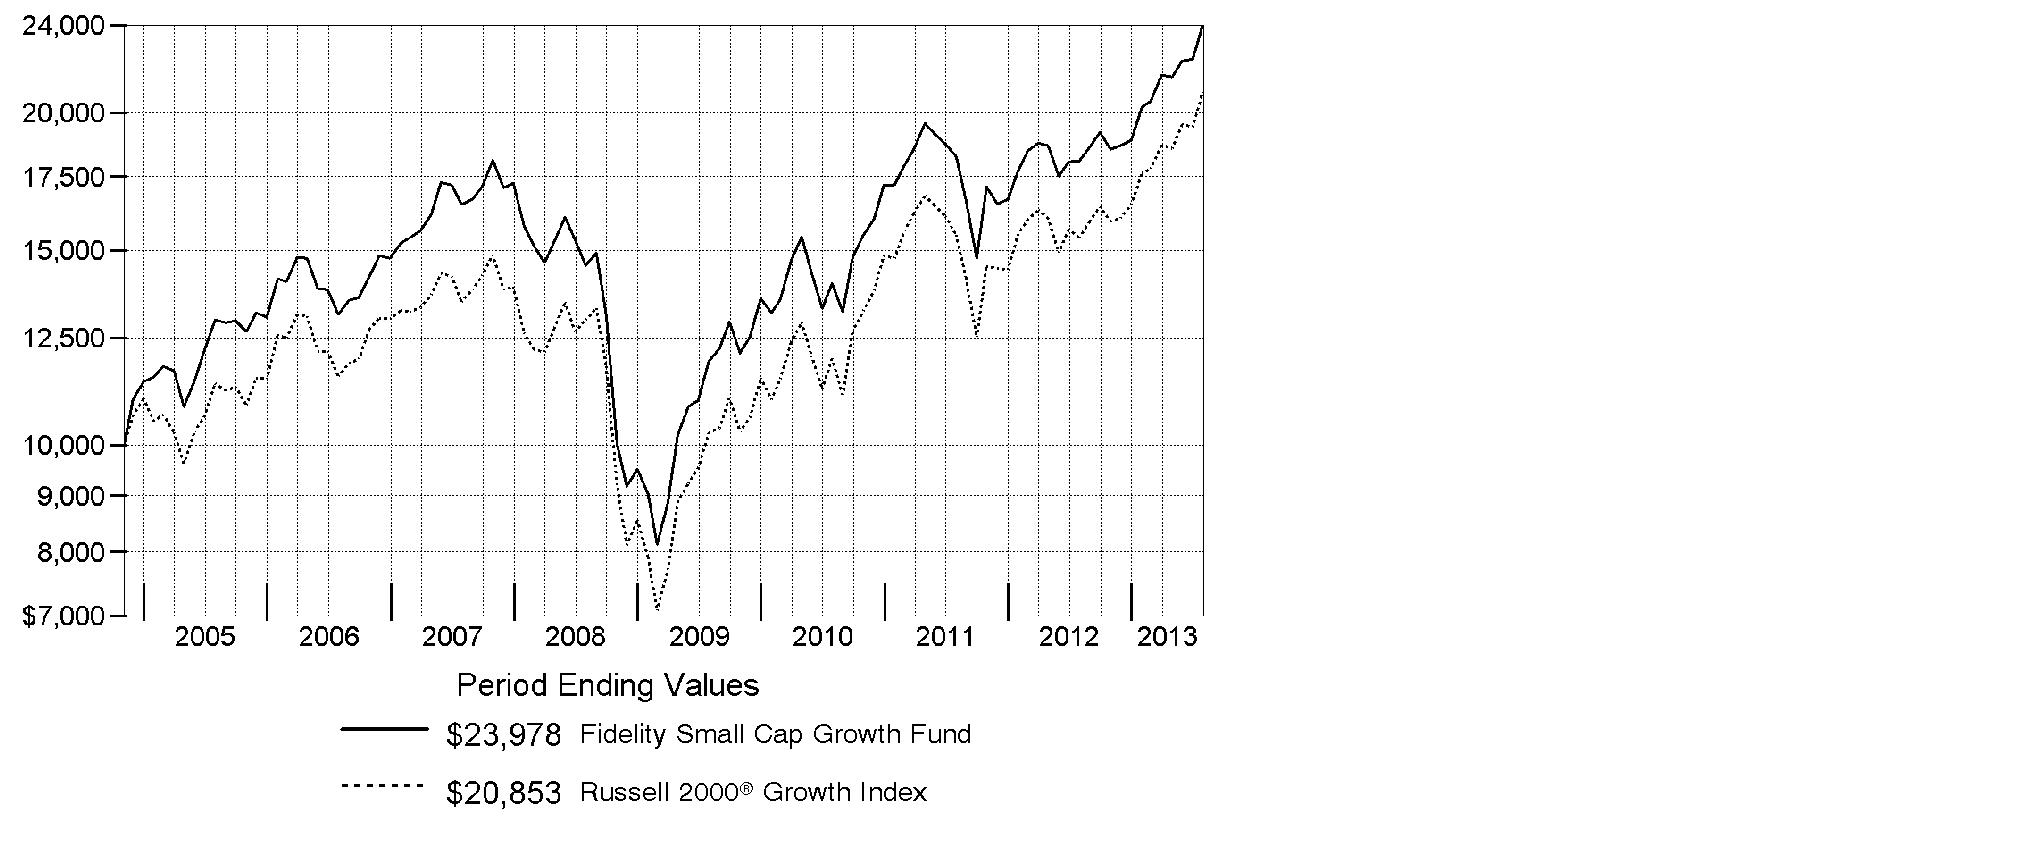
Annual Report
Market Recap: The bull run in U.S. stocks comfortably settled into a fifth year, as major equity benchmarks ripped through records during the 12 months ending July 31, 2013. Gains were fueled by a generally improving global economy and accommodative monetary policies worldwide. The tone was positive for most of the year, based largely on stronger U.S. economic data, including employment, housing and consumer sentiment. Setting a series of new highs along the way, the broad-based S&P 500® Index rose an impressive 25.00% for the 12 months, while the blue-chip-laden Dow Jones Industrial AverageSM also moved into record territory en route to a 22.36% gain. The growth-oriented Nasdaq Composite Index® had a similarly strong run, advancing 25.15%. During the year, markets were resilient amid intermittent volatility over debt woes in Europe, the 2012 U.S. presidential election and year-end Congressional gridlock over the federal budget. In mid-to-late June, concern arose about the U.S. Federal Reserve possibly tapering its sustaining bond-buying strategy - which prompted a brief, but steep, market sell-off. However, investors' continued quest for yield and the Fed's pledge to keep buying bonds until the economy showed significant improvement overpowered the uncertainty and helped equities climb notably higher in July to close the period on a strong note.
Comments from Patrick Venanzi, Portfolio Manager of Fidelity® Small Cap Growth Fund: For the year, the fund's Retail Class shares rose 32.74%, lagging the 35.39% gain of the Russell 2000® Growth Index. I aim to buy small-cap stocks with above-average growth opportunities at reasonable prices. Along with the market, the fund did very well in absolute terms, but lagged its benchmark. Given the longer-term focus and the quality bias of my investments, the fund sometimes trails the index during the market's strongest short-term periods. The fund's cash stake of roughly 4%, on average, during the past year weighed on relative performance, and a non-index position in Mellanox Technologies, a maker of data transfer and storage products, was the biggest individual detractor. Online health insurance provider eHealth was another miss for the fund, due to untimely ownership, and I sold both Mellanox and eHealth by period end. On the plus side, specialty furniture and electronics retailer Conn's was our top relative contributor, with its stock benefiting as a proactive management team effectively revamped stores, offering higher-quality products and customer-friendly financing options.
The views expressed above reflect those of the portfolio manager(s) only through the end of the period as stated on the cover of this report and do not necessarily represent the views of Fidelity or any other person in the Fidelity organization. Any such views are subject to change at any time based upon market or other conditions and Fidelity disclaims any responsibility to update such views. These views may not be relied on as investment advice and, because investment decisions for a Fidelity fund are based on numerous factors, may not be relied on as an indication of trading intent on behalf of any Fidelity fund.
Annual Report
Shareholder Expense Example
As a shareholder of the Fund, you incur two types of costs: (1) transaction costs, including sales charges (loads) on purchase payments or redemption proceeds, redemption fees and (2) ongoing costs, including management fees, distribution and/or service (12b-1) fees and other Fund expenses. This Example is intended to help you understand your ongoing costs (in dollars) of investing in the Fund and to compare these costs with the ongoing costs of investing in other mutual funds.
The Example is based on an investment of $1,000 invested at the beginning of the period and held for the entire period (February 1, 2013 to July 31, 2013).
Actual Expenses
The first line of the accompanying table for each class of the Fund provides information about actual account values and actual expenses. You may use the information in this line, together with the amount you invested, to estimate the expenses that you paid over the period. Simply divide your account value by $1,000.00 (for example, an $8,600 account value divided by $1,000.00 = 8.6), then multiply the result by the number in the first line for a class of the Fund under the heading entitled "Expenses Paid During Period" to estimate the expenses you paid on your account during this period. A small balance maintenance fee of $12.00 that is charged once a year may apply for certain accounts with a value of less than $2,000. This fee is not included in the table below. If it was, the estimate of expenses you paid during the period would be higher, and your ending account value lower, by this amount. In addition, the Fund, as a shareholder in the underlying Fidelity Central Funds, will indirectly bear its pro-rata share of the fees and expenses incurred by the underlying Fidelity Central Funds. These fees and expenses are not included in the Fund's annualized expense ratio used to calculate the expense estimate in the table below.
Hypothetical Example for Comparison Purposes
The second line of the accompanying table for each class of the Fund provides information about hypothetical account values and hypothetical expenses based on a Class' actual expense ratio and an assumed rate of return of 5% per year before expenses, which is not the Class' actual return. The hypothetical account values and expenses may not be used to estimate the actual ending account balance or expenses you paid for the period. You may use this information to compare the ongoing costs of investing in the Fund and other funds. To do so, compare this 5% hypothetical example with the 5% hypothetical examples that appear in the shareholder reports of the other funds. A small balance maintenance fee of $12.00 that is charged once a year may apply for certain accounts with a value of less than $2,000. This fee is not included in the table below. If it was, the estimate of expenses you paid during the period would be higher, and your ending account value lower, by this amount. In addition, the Fund, as a shareholder in the underlying Fidelity Central Funds, will indirectly bear its pro-rata share of the fees and expenses incurred by the underlying Fidelity Central Funds. These fees and expenses are not included in the Fund's annualized expense ratio used to calculate the expense estimate in the table below.
Please note that the expenses shown in the table are meant to highlight your ongoing costs only and do not reflect any transaction costs. Therefore, the second line of the table is useful in comparing ongoing costs only, and will not help you determine the relative total costs of owning different funds. In addition, if these transactional costs were included, your costs would have been higher.
Annual Report
| Annualized
Expense Ratio B | Beginning
Account Value
February 1, 2013 | Ending
Account Value
July 31, 2013 | Expenses Paid
During Period*
February 1, 2013
to July 31, 2013 |
Class A | 1.22% | | | |
Actual | | $ 1,000.00 | $ 1,183.60 | $ 6.61 |
HypotheticalA | | $ 1,000.00 | $ 1,018.74 | $ 6.11 |
Class T | 1.48% | | | |
Actual | | $ 1,000.00 | $ 1,181.70 | $ 8.01 |
HypotheticalA | | $ 1,000.00 | $ 1,017.46 | $ 7.40 |
Class B | 1.97% | | | |
Actual | | $ 1,000.00 | $ 1,178.90 | $ 10.64 |
HypotheticalA | | $ 1,000.00 | $ 1,015.03 | $ 9.84 |
Class C | 1.97% | | | |
Actual | | $ 1,000.00 | $ 1,179.20 | $ 10.64 |
HypotheticalA | | $ 1,000.00 | $ 1,015.03 | $ 9.84 |
Small Cap Growth | .88% | | | |
Actual | | $ 1,000.00 | $ 1,186.20 | $ 4.77 |
HypotheticalA | | $ 1,000.00 | $ 1,020.43 | $ 4.41 |
Class F | .67% | | | |
Actual | | $ 1,000.00 | $ 1,187.00 | $ 3.63 |
HypotheticalA | | $ 1,000.00 | $ 1,021.47 | $ 3.36 |
Institutional Class | .90% | | | |
Actual | | $ 1,000.00 | $ 1,185.80 | $ 4.88 |
HypotheticalA | | $ 1,000.00 | $ 1,020.33 | $ 4.51 |
A 5% return per year before expenses
B Annualized expense ratio reflects expenses net of applicable fee waivers.
* Expenses are equal to each Class' annualized expense ratio, multiplied by the average account value over the period, multiplied by 181/365 (to reflect the one-half year period).
Annual Report
Investment Changes (Unaudited)
Top Ten Stocks as of July 31, 2013 |
| % of fund's
net assets | % of fund's net assets
6 months ago |
NIC, Inc. | 1.6 | 0.0 |
Grand Canyon Education, Inc. | 1.5 | 0.9 |
Aspen Technology, Inc. | 1.4 | 1.7 |
InvenSense, Inc. | 1.3 | 1.0 |
KAR Auction Services, Inc. | 1.3 | 0.0 |
CommVault Systems, Inc. | 1.3 | 1.5 |
FEI Co. | 1.3 | 0.9 |
Service Corp. International | 1.3 | 0.0 |
HSN, Inc. | 1.3 | 1.7 |
athenahealth, Inc. | 1.2 | 0.0 |
| 13.5 | |
Top Five Market Sectors as of July 31, 2013 |
| % of fund's
net assets | % of fund's net assets
6 months ago |
Information Technology | 25.8 | 19.2 |
Health Care | 20.9 | 18.8 |
Industrials | 17.0 | 15.5 |
Consumer Discretionary | 16.0 | 17.2 |
Financials | 8.4 | 7.3 |
Asset Allocation (% of fund's net assets) |
As of July 31, 2013* | As of January 31, 2013** |
 | Stocks 97.9% | | | Stocks 95.5% | |
 | Short-Term
Investments and
Net Other Assets
(Liabilities) 2.1% | | | Short-Term
Investments and
Net Other Assets
(Liabilities) 4.5% | |
* Foreign investments | 4.0% | | ** Foreign investments | 6.6% | |

Annual Report
Investments July 31, 2013
Showing Percentage of Net Assets
Common Stocks - 97.9% |
| Shares | | Value |
CONSUMER DISCRETIONARY - 16.0% |
Auto Components - 0.5% |
Tenneco, Inc. (a) | 250,000 | | $ 12,082,500 |
Diversified Consumer Services - 2.8% |
Grand Canyon Education, Inc. (a) | 987,953 | | 33,412,570 |
Service Corp. International | 1,510,000 | | 28,644,700 |
| | 62,057,270 |
Hotels, Restaurants & Leisure - 4.4% |
AFC Enterprises, Inc. (a) | 400,231 | | 14,728,501 |
Bloomin' Brands, Inc. | 500,000 | | 11,800,000 |
Jack in the Box, Inc. (a) | 550,000 | | 22,049,500 |
Papa John's International, Inc. (a) | 300,000 | | 20,058,000 |
Sonic Corp. (a) | 912,000 | | 14,017,440 |
Texas Roadhouse, Inc. Class A | 700,000 | | 17,108,000 |
| | 99,761,441 |
Household Durables - 1.0% |
Jarden Corp. (a) | 375,000 | | 17,051,250 |
Universal Electronics, Inc. (a) | 199,089 | | 6,137,914 |
| | 23,189,164 |
Internet & Catalog Retail - 1.3% |
HSN, Inc. | 475,000 | | 28,528,500 |
Leisure Equipment & Products - 1.0% |
Brunswick Corp. | 570,000 | | 21,517,500 |
Media - 0.9% |
Cinemark Holdings, Inc. | 700,000 | | 20,384,000 |
Specialty Retail - 1.3% |
Conn's, Inc. (a) | 194,947 | | 12,597,475 |
Tile Shop Holdings, Inc. (a) | 601,100 | | 17,089,273 |
| | 29,686,748 |
Textiles, Apparel & Luxury Goods - 2.8% |
G-III Apparel Group Ltd. (a) | 470,000 | | 24,186,200 |
Steven Madden Ltd. (a) | 451,400 | | 23,210,988 |
Wolverine World Wide, Inc. | 250,000 | | 14,377,500 |
| | 61,774,688 |
TOTAL CONSUMER DISCRETIONARY | | 358,981,811 |
Common Stocks - continued |
| Shares | | Value |
CONSUMER STAPLES - 2.4% |
Food Products - 1.8% |
J&J Snack Foods Corp. | 200,000 | | $ 15,936,000 |
WhiteWave Foods Co. (d) | 1,347,200 | | 25,179,168 |
| | 41,115,168 |
Personal Products - 0.6% |
Inter Parfums, Inc. | 392,925 | | 12,958,667 |
TOTAL CONSUMER STAPLES | | 54,073,835 |
ENERGY - 4.9% |
Energy Equipment & Services - 2.7% |
Atwood Oceanics, Inc. (a) | 185,000 | | 10,422,900 |
Dril-Quip, Inc. (a) | 170,000 | | 15,454,700 |
Essential Energy Services Ltd. | 2,232,100 | | 5,650,336 |
Western Energy Services Corp. | 1,330,000 | | 10,825,431 |
Xtreme Drilling & Coil Services Corp. (a)(e) | 4,100,000 | | 14,769,740 |
Zedi, Inc. (a)(e) | 7,178,500 | | 4,053,675 |
| | 61,176,782 |
Oil, Gas & Consumable Fuels - 2.2% |
EPL Oil & Gas, Inc. (a) | 300,000 | | 9,648,000 |
Rosetta Resources, Inc. (a) | 380,000 | | 17,331,800 |
Tesoro Logistics LP | 150,000 | | 8,023,500 |
Whitecap Resources, Inc. (d) | 1,100,000 | | 11,823,581 |
Whitecap Resources, Inc. rights 8/30/13 (a) | 100,000 | | 1,077,792 |
| | 47,904,673 |
TOTAL ENERGY | | 109,081,455 |
FINANCIALS - 8.4% |
Capital Markets - 0.6% |
Virtus Investment Partners, Inc. (a) | 73,084 | | 13,630,166 |
Commercial Banks - 2.1% |
BBCN Bancorp, Inc. | 1,340,000 | | 19,577,400 |
City National Corp. | 320,000 | | 22,249,600 |
Pacific Premier Bancorp, Inc. (a) | 385,000 | | 5,016,550 |
| | 46,843,550 |
Insurance - 3.7% |
Amerisafe, Inc. | 492,900 | | 17,611,317 |
FBL Financial Group, Inc. Class A | 148,825 | | 6,582,530 |
Primerica, Inc. | 480,000 | | 19,699,200 |
Common Stocks - continued |
| Shares | | Value |
FINANCIALS - continued |
Insurance - continued |
ProAssurance Corp. | 430,000 | | $ 23,017,900 |
StanCorp Financial Group, Inc. | 300,000 | | 15,927,000 |
| | 82,837,947 |
Real Estate Investment Trusts - 1.3% |
Cousins Properties, Inc. | 1,500,000 | | 15,375,000 |
Piedmont Office Realty Trust, Inc. Class A | 800,000 | | 14,472,000 |
| | 29,847,000 |
Real Estate Management & Development - 0.7% |
Howard Hughes Corp. (a) | 145,000 | | 15,835,450 |
TOTAL FINANCIALS | | 188,994,113 |
HEALTH CARE - 20.9% |
Biotechnology - 8.1% |
Alkermes PLC (a) | 175,500 | | 5,893,290 |
ARIAD Pharmaceuticals, Inc. (a) | 260,000 | | 4,830,800 |
Array BioPharma, Inc. (a) | 1,120,000 | | 7,459,200 |
Astex Pharmaceuticals, Inc. (a) | 1,250,000 | | 6,537,500 |
BioMarin Pharmaceutical, Inc. (a) | 120,000 | | 7,758,000 |
Celldex Therapeutics, Inc. (a) | 600,000 | | 12,288,000 |
ChemoCentryx, Inc. (a) | 250,000 | | 3,495,000 |
Chimerix, Inc. | 250,000 | | 5,685,000 |
Cubist Pharmaceuticals, Inc. (a) | 194,762 | | 12,139,515 |
Hyperion Therapeutics, Inc. | 200,000 | | 5,010,000 |
Infinity Pharmaceuticals, Inc. (a) | 228,236 | | 4,834,038 |
Insmed, Inc. (a)(d) | 666,400 | | 7,403,704 |
Isis Pharmaceuticals, Inc. (a) | 447,257 | | 12,903,364 |
Medivation, Inc. (a) | 160,000 | | 9,259,200 |
Novavax, Inc. (a) | 2,100,000 | | 5,649,000 |
OncoGenex Pharmaceuticals, Inc. (a) | 116,487 | | 1,138,078 |
Stemline Therapeutics, Inc. | 154,000 | | 4,333,560 |
Sunesis Pharmaceuticals, Inc. (a)(d) | 1,097,300 | | 5,574,284 |
Synageva BioPharma Corp. (a) | 170,000 | | 8,177,000 |
Synergy Pharmaceuticals, Inc. (a)(d) | 800,000 | | 3,600,000 |
TESARO, Inc. (a) | 148,800 | | 5,077,056 |
Theravance, Inc. (a)(d) | 469,000 | | 18,084,640 |
Threshold Pharmaceuticals, Inc. (a) | 1,072,634 | | 5,813,676 |
Vanda Pharmaceuticals, Inc. (a) | 500,000 | | 5,830,000 |
XOMA Corp. (a)(d) | 2,500,000 | | 13,575,000 |
| | 182,348,905 |
Common Stocks - continued |
| Shares | | Value |
HEALTH CARE - continued |
Health Care Equipment & Supplies - 4.7% |
Align Technology, Inc. (a) | 595,798 | | $ 25,643,146 |
ICU Medical, Inc. (a) | 191,000 | | 13,692,790 |
NxStage Medical, Inc. (a) | 272,400 | | 3,530,304 |
Sirona Dental Systems, Inc. (a) | 125,000 | | 8,825,000 |
Steris Corp. | 581,000 | | 26,156,620 |
Teleflex, Inc. | 189,300 | | 15,036,099 |
The Spectranetics Corp. (a) | 650,000 | | 11,713,000 |
| | 104,596,959 |
Health Care Providers & Services - 4.1% |
BioScrip, Inc. (a) | 1,100,000 | | 17,875,000 |
Centene Corp. (a) | 330,000 | | 18,305,100 |
MEDNAX, Inc. (a) | 122,900 | | 11,972,918 |
Molina Healthcare, Inc. (a)(d) | 600,000 | | 22,272,000 |
MWI Veterinary Supply, Inc. (a) | 143,400 | | 20,387,178 |
| | 90,812,196 |
Health Care Technology - 2.2% |
athenahealth, Inc. (a)(d) | 250,000 | | 27,987,500 |
Medidata Solutions, Inc. (a) | 233,948 | | 21,647,208 |
| | 49,634,708 |
Life Sciences Tools & Services - 0.8% |
Bruker BioSciences Corp. (a) | 1,010,000 | | 18,099,200 |
Pharmaceuticals - 1.0% |
Biodelivery Sciences International, Inc. (a)(d) | 1,257,084 | | 5,430,603 |
Pacira Pharmaceuticals, Inc. (a) | 220,000 | | 7,464,600 |
ViroPharma, Inc. (a) | 270,000 | | 9,266,400 |
| | 22,161,603 |
TOTAL HEALTH CARE | | 467,653,571 |
INDUSTRIALS - 17.0% |
Aerospace & Defense - 2.8% |
Esterline Technologies Corp. (a) | 150,000 | | 12,216,000 |
Teledyne Technologies, Inc. (a) | 305,700 | | 24,507,969 |
Triumph Group, Inc. | 330,000 | | 25,891,800 |
| | 62,615,769 |
Airlines - 0.7% |
Spirit Airlines, Inc. (a) | 500,000 | | 16,525,000 |
Building Products - 0.9% |
A.O. Smith Corp. | 480,688 | | 19,862,028 |
Common Stocks - continued |
| Shares | | Value |
INDUSTRIALS - continued |
Commercial Services & Supplies - 1.3% |
KAR Auction Services, Inc. | 1,140,000 | | $ 29,001,600 |
Construction & Engineering - 1.6% |
AECOM Technology Corp. (a) | 300,000 | | 10,170,000 |
EMCOR Group, Inc. | 350,000 | | 14,448,000 |
Tutor Perini Corp. (a) | 554,285 | | 10,963,757 |
| | 35,581,757 |
Electrical Equipment - 2.1% |
EnerSys | 480,000 | | 25,401,600 |
Generac Holdings, Inc. | 409,200 | | 17,738,820 |
Preformed Line Products Co. | 60,306 | | 4,399,323 |
| | 47,539,743 |
Machinery - 5.4% |
Actuant Corp. Class A | 473,100 | | 16,705,161 |
Harsco Corp. | 445,000 | | 11,463,200 |
Manitowoc Co., Inc. | 900,000 | | 18,477,000 |
Oshkosh Truck Corp. (a) | 250,000 | | 11,205,000 |
Standex International Corp. | 301,838 | | 17,817,497 |
TriMas Corp. (a) | 605,298 | | 22,414,185 |
Wabtec Corp. | 384,600 | | 22,329,876 |
| | 120,411,919 |
Professional Services - 0.0% |
Nihon M&A Center, Inc. | 612 | | 40,942 |
Trading Companies & Distributors - 2.2% |
Applied Industrial Technologies, Inc. | 316,818 | | 16,525,227 |
Watsco, Inc. | 229,000 | | 21,377,150 |
WESCO International, Inc. (a) | 150,000 | | 11,367,000 |
| | 49,269,377 |
TOTAL INDUSTRIALS | | 380,848,135 |
INFORMATION TECHNOLOGY - 25.8% |
Communications Equipment - 0.8% |
Plantronics, Inc. | 380,000 | | 17,666,200 |
Computers & Peripherals - 1.9% |
Cray, Inc. (a) | 1,032,200 | | 23,916,074 |
Electronics for Imaging, Inc. (a) | 670,000 | | 20,120,100 |
| | 44,036,174 |
Electronic Equipment & Components - 4.6% |
FEI Co. | 370,000 | | 28,656,500 |
Common Stocks - continued |
| Shares | | Value |
INFORMATION TECHNOLOGY - continued |
Electronic Equipment & Components - continued |
FLIR Systems, Inc. | 600,000 | | $ 19,482,000 |
InvenSense, Inc. (a)(d) | 1,720,000 | | 30,409,600 |
Neonode, Inc. (a)(d) | 1,617,122 | | 12,597,380 |
Parametric Sound Corp. (a)(d)(e) | 666,810 | | 11,382,447 |
| | 102,527,927 |
Internet Software & Services - 7.8% |
Angie's List, Inc. (a)(d) | 1,055,703 | | 23,246,580 |
Blucora, Inc. (a) | 621,143 | | 12,422,860 |
Cornerstone OnDemand, Inc. (a) | 530,000 | | 23,341,200 |
Demandware, Inc. (a)(d) | 353,439 | | 15,699,760 |
E2open, Inc. (d) | 1,176,594 | | 23,390,689 |
Move, Inc. (a) | 820,000 | | 11,389,800 |
NIC, Inc. | 1,893,704 | | 34,882,028 |
SciQuest, Inc. (a) | 294,372 | | 7,259,214 |
Stamps.com, Inc. (a) | 570,281 | | 22,731,401 |
| | 174,363,532 |
IT Services - 2.7% |
Euronet Worldwide, Inc. (a) | 300,000 | | 11,043,000 |
EVERTEC, Inc. | 600,000 | | 14,340,000 |
Genpact Ltd. | 1,050,000 | | 21,409,500 |
Sapient Corp. (a) | 1,000,000 | | 13,710,000 |
| | 60,502,500 |
Semiconductors & Semiconductor Equipment - 0.8% |
PDF Solutions, Inc. (a) | 886,056 | | 18,181,869 |
Software - 7.2% |
Aspen Technology, Inc. (a) | 962,200 | | 31,309,988 |
CommVault Systems, Inc. (a) | 340,000 | | 28,706,200 |
Destiny Media Technologies, Inc. (a) | 1,620,269 | | 3,596,997 |
Guidewire Software, Inc. (a) | 434,816 | | 19,027,548 |
Interactive Intelligence Group, Inc. (a) | 200,000 | | 11,360,000 |
Synopsys, Inc. (a) | 540,000 | | 20,001,600 |
Tyler Technologies, Inc. (a) | 308,725 | | 23,037,060 |
Ultimate Software Group, Inc. (a) | 175,000 | | 23,677,500 |
| | 160,716,893 |
TOTAL INFORMATION TECHNOLOGY | | 577,995,095 |
Common Stocks - continued |
| Shares | | Value |
MATERIALS - 2.0% |
Chemicals - 0.7% |
Cytec Industries, Inc. | 210,000 | | $ 16,359,000 |
Containers & Packaging - 0.7% |
Graphic Packaging Holding Co. (a) | 1,700,000 | | 14,620,000 |
Paper & Forest Products - 0.6% |
P.H. Glatfelter Co. | 550,000 | | 14,558,500 |
TOTAL MATERIALS | | 45,537,500 |
TELECOMMUNICATION SERVICES - 0.5% |
Diversified Telecommunication Services - 0.5% |
inContact, Inc. (a) | 1,200,000 | | 10,176,000 |
TOTAL COMMON STOCKS (Cost $1,768,172,071) |
2,193,341,515
|
Money Market Funds - 8.8% |
| | | |
Fidelity Cash Central Fund, 0.11% (b) | 75,334,289 | | 75,334,289 |
Fidelity Securities Lending Cash Central Fund, 0.12% (b)(c) | 121,749,605 | | 121,749,605 |
TOTAL MONEY MARKET FUNDS (Cost $197,083,894) |
197,083,894
|
TOTAL INVESTMENT PORTFOLIO - 106.7% (Cost $1,965,255,965) | | 2,390,425,409 |
NET OTHER ASSETS (LIABILITIES) - (6.7)% | | (150,019,314) |
NET ASSETS - 100% | $ 2,240,406,095 |
Legend |
(a) Non-income producing |
(b) Affiliated fund that is generally available only to investment companies and other accounts managed by Fidelity Investments. The rate quoted is the annualized seven-day yield of the fund at period end. A complete unaudited listing of the fund's holdings as of its most recent quarter end is available upon request. In addition, each Fidelity Central Fund's financial statements, which are not covered by the Fund's Report of Independent Registered Public Accounting Firm, are available on the SEC's website or upon request. |
(c) Investment made with cash collateral received from securities on loan. |
(d) Security or a portion of the security is on loan at period end. |
(e) Affiliated company |
Affiliated Central Funds |
Information regarding fiscal year to date income earned by the Fund from investments in Fidelity Central Funds is as follows: |
Fund | Income earned |
Fidelity Cash Central Fund | $ 109,835 |
Fidelity Securities Lending Cash Central Fund | 2,002,990 |
Total | $ 2,112,825 |
Other Affiliated Issuers |
An affiliated company is a company in which the Fund has ownership of at least 5% of the voting securities. Fiscal year to date transactions with companies which are or were affiliates are as follows: |
Affiliate | Value,
beginning of
period | Purchases | Sales
Proceeds | Dividend
Income | Value,
end of
period |
Neonode, Inc. | $ 6,969,000 | $ 5,854,520 | $ 5,076,631 | $ - | $ - |
Parametric Sound Corp. | 2,428,413 | 5,644,334 | 1,370,378 | - | 11,382,447 |
Telular Corp. | 4,715,000 | 3,371,313 | 10,661,344 | 259,000 | - |
US Home Systems, Inc. | 6,604,750 | - | 8,975,299 | - | - |
Xtreme Drilling & Coil Services Corp. (144A) | - | 178,443 | 201,743 | - | - |
Xtreme Drilling & Coil Services Corp. | 6,786,658 | - | - | - | 14,769,740 |
Zedi, Inc. | 3,905,172 | 2,997,316 | 1,070,631 | - | 4,053,675 |
Total | $ 31,408,993 | $ 18,045,926 | $ 27,356,026 | $ 259,000 | $ 30,205,862 |
Other Information |
All investments are categorized as Level 1 under the Fair Value Hierarchy. The inputs or methodology used for valuing securities may not be an indication of the risk associated with investing in those securities. For more information on valuation inputs, please refer to the Investment Valuation section in the accompanying Notes to Financial Statements. |
See accompanying notes which are an integral part of the financial statements.
Annual Report
Statement of Assets and Liabilities
| July 31, 2013 |
| | |
Assets | | |
Investment in securities, at value (including securities loaned of $120,973,392) - See accompanying schedule: Unaffiliated issuers (cost $1,744,211,544) | $ 2,163,135,653 | |
Fidelity Central Funds (cost $197,083,894) | 197,083,894 | |
Other affiliated issuers (cost $23,960,527) | 30,205,862 | |
Total Investments (cost $1,965,255,965) | | $ 2,390,425,409 |
Receivable for investments sold | | 35,301,694 |
Receivable for fund shares sold | | 2,852,120 |
Dividends receivable | | 415,342 |
Distributions receivable from Fidelity Central Funds | | 231,543 |
Other receivables | | 35,774 |
Total assets | | 2,429,261,882 |
| | |
Liabilities | | |
Payable for investments purchased | $ 62,714,735 | |
Payable for fund shares redeemed | 2,747,629 | |
Accrued management fee | 1,207,297 | |
Distribution and service plan fees payable | 58,359 | |
Other affiliated payables | 312,392 | |
Other payables and accrued expenses | 65,770 | |
Collateral on securities loaned, at value | 121,749,605 | |
Total liabilities | | 188,855,787 |
| | |
Net Assets | | $ 2,240,406,095 |
Net Assets consist of: | | |
Paid in capital | | $ 1,568,067,724 |
Accumulated undistributed net realized gain (loss) on investments and foreign currency transactions | | 247,173,320 |
Net unrealized appreciation (depreciation) on investments and assets and liabilities in foreign currencies | | 425,165,051 |
Net Assets | | $ 2,240,406,095 |
See accompanying notes which are an integral part of the financial statements.
Annual Report
Financial Statements - continued
Statement of Assets and Liabilities - continued
| July 31, 2013 |
| | |
Calculation of Maximum Offering Price Class A:
Net Asset Value and redemption price per share ($74,977,899 ÷ 3,812,892 shares) | | $ 19.66 |
| | |
Maximum offering price per share (100/94.25 of $19.66) | | $ 20.86 |
Class T:
Net Asset Value and redemption price per share ($34,686,382 ÷ 1,789,472 shares) | | $ 19.38 |
| | |
Maximum offering price per share (100/96.50 of $19.38) | | $ 20.08 |
Class B:
Net Asset Value and offering price per share ($3,485,507 ÷ 186,863 shares)A | | $ 18.65 |
| | |
Class C:
Net Asset Value and offering price per share ($32,755,709 ÷ 1,759,550 shares)A | | $ 18.62 |
| | |
Small Cap Growth:
Net Asset Value, offering price and redemption price per share ($1,315,659,224 ÷ 65,562,467 shares) | | $ 20.07 |
| | |
Class F:
Net Asset Value, offering price and redemption price per share ($727,683,474 ÷ 35,934,773 shares) | | $ 20.25 |
| | |
Institutional Class:
Net Asset Value, offering price and redemption price per share ($51,157,900 ÷ 2,545,203 shares) | | $ 20.10 |
A Redemption price per share is equal to net asset value less any applicable contingent deferred sales charge.
See accompanying notes which are an integral part of the financial statements.
Annual Report
Statement of Operations
| Year ended July 31, 2013 |
| | |
Investment Income | | |
Dividends (including $259,000 earned from other affiliated issuers) | | $ 17,072,216 |
Interest | | 880 |
Income from Fidelity Central Funds (including $2,002,990 from security lending) | | 2,112,825 |
Total income | | 19,185,921 |
| | |
Expenses | | |
Management fee
Basic fee | $ 14,065,171 | |
Performance adjustment | (1,254,701) | |
Transfer agent fees | 3,015,628 | |
Distribution and service plan fees | 609,395 | |
Accounting and security lending fees | 622,239 | |
Custodian fees and expenses | 73,226 | |
Independent trustees' compensation | 12,359 | |
Registration fees | 95,429 | |
Audit | 58,673 | |
Legal | 6,422 | |
Interest | 674 | |
Miscellaneous | 18,337 | |
Total expenses before reductions | 17,322,852 | |
Expense reductions | (322,128) | 17,000,724 |
Net investment income (loss) | | 2,185,197 |
Realized and Unrealized Gain (Loss) Net realized gain (loss) on: | | |
Investment securities: | | |
Unaffiliated issuers | 326,344,850 | |
Other affiliated issuers | 925,631 | |
Foreign currency transactions | 20,901 | |
Total net realized gain (loss) | | 327,291,382 |
Change in net unrealized appreciation (depreciation) on: Investment securities | 244,672,948 | |
Assets and liabilities in foreign currencies | 6,602 | |
Total change in net unrealized appreciation (depreciation) | | 244,679,550 |
Net gain (loss) | | 571,970,932 |
Net increase (decrease) in net assets resulting from operations | | $ 574,156,129 |
See accompanying notes which are an integral part of the financial statements.
Annual Report
Financial Statements - continued
Statement of Changes in Net Assets
| Year ended
July 31,
2013 | Year ended
July 31,
2012 |
Increase (Decrease) in Net Assets | | |
Operations | | |
Net investment income (loss) | $ 2,185,197 | $ (2,581,285) |
Net realized gain (loss) | 327,291,382 | 84,159,524 |
Change in net unrealized appreciation (depreciation) | 244,679,550 | (104,802,589) |
Net increase (decrease) in net assets resulting
from operations | 574,156,129 | (23,224,350) |
Distributions to shareholders from net realized gain | (122,560,447) | (34,799,429) |
Share transactions - net increase (decrease) | (58,479,174) | 61,802,637 |
Redemption fees | 117,383 | 255,125 |
Total increase (decrease) in net assets | 393,233,891 | 4,033,983 |
| | |
Net Assets | | |
Beginning of period | 1,847,172,204 | 1,843,138,221 |
End of period (including accumulated net investment loss of $0 and accumulated net investment loss of $1,442,758, respectively) | $ 2,240,406,095 | $ 1,847,172,204 |
See accompanying notes which are an integral part of the financial statements.
Annual Report
Financial Highlights - Class A
Years ended July 31, | 2013 | 2012 | 2011 | 2010 | 2009 |
Selected Per-Share Data | | | | | |
Net asset value, beginning of period | $ 15.87 | $ 16.42 | $ 12.66 | $ 10.79 | $ 13.20 |
Income from Investment Operations | | | | | |
Net investment income (loss) C | (.04) | (.07) F | (.07) G | (.07) H | (.06) |
Net realized and unrealized gain (loss) | 4.87 | (.16) | 3.84 | 1.94 | (2.35) |
Total from investment operations | 4.83 | (.23) | 3.77 | 1.87 | (2.41) |
Distributions from net realized gain | (1.04) | (.32) | (.01) I | - | - |
Redemption fees added to paid in capital C, K | - | - | - | - | - |
Net asset value, end of period | $ 19.66 | $ 15.87 | $ 16.42 | $ 12.66 | $ 10.79 |
Total Return A, B | 32.20% | (1.14)% | 29.78% | 17.33% | (18.26)% |
Ratios to Average Net Assets D, J | | | | | |
Expenses before reductions | 1.24% | 1.35% | 1.25% | 1.35% | 1.33% |
Expenses net of fee waivers, if any | 1.24% | 1.35% | 1.25% | 1.35% | 1.33% |
Expenses net of all reductions | 1.22% | 1.34% | 1.23% | 1.34% | 1.33% |
Net investment income (loss) | (.26)% | (.49)% F | (.47)% G | (.56)% H | (.64)% |
Supplemental Data | | | | | |
Net assets, end of period (000 omitted) | $ 74,978 | $ 59,684 | $ 67,272 | $ 50,620 | $ 40,211 |
Portfolio turnover rate E | 142% | 150% | 106% | 105% | 150% |
A Total returns would have been lower if certain expenses had not been reduced during the applicable periods shown.
B Total returns do not include the effect of the sales charges.
C Calculated based on average shares outstanding during the period.
D Fees and expenses of any underlying Fidelity Central Funds are not included in the Fund's expense ratio. The Fund indirectly bears its proportionate share of the expenses of any underlying Fidelity Central Funds.
E Amount does not include the portfolio activity of any underlying Fidelity Central Funds.
F Investment income per share reflects a large, non-recurring dividend which amounted to $.01 per share. Excluding this non-recurring dividend, the ratio of net investment income (loss) to average net assets would have been (.57)%.
G Investment income per share reflects a large, non-recurring dividend which amounted to $.02 per share. Excluding this non-recurring dividend, the ratio of net investment income (loss) to average net assets would have been (.61)%.
H Investment income per share reflects a large, non-recurring dividend which amounted to $.01 per share. Excluding this non-recurring dividend, the ratio of net investment income (loss) to average net assets would have been (.67)%.
I The amounts shown reflect certain reclassifications related to book to tax differences that were made in the year shown.
J Expense ratios reflect operating expenses of the class. Expenses before reductions do not reflect amounts reimbursed by the investment adviser or reductions from brokerage service arrangements or reductions from other expense offset arrangements and do not represent the amount paid by the class during periods when reimbursements or reductions occur. Expenses net of fee waivers reflect expenses after reimbursement by the investment adviser but prior to reductions from brokerage service arrangements or other expense offset arrangements. Expenses net of all reductions represent the net expenses paid by the class.
K Amount represents less than $.01 per share.
See accompanying notes which are an integral part of the financial statements.
Annual Report
Financial Highlights - Class T
Years ended July 31, | 2013 | 2012 | 2011 | 2010 | 2009 |
Selected Per-Share Data | | | | | |
Net asset value, beginning of period | $ 15.68 | $ 16.27 | $ 12.57 | $ 10.74 | $ 13.17 |
Income from Investment Operations | | | | | |
Net investment income (loss) C | (.09) | (.11) F | (.11) G | (.10) H | (.09) |
Net realized and unrealized gain (loss) | 4.82 | (.16) | 3.81 | 1.93 | (2.34) |
Total from investment operations | 4.73 | (.27) | 3.70 | 1.83 | (2.43) |
Distributions from net realized gain | (1.03) | (.32) | - | - | - |
Redemption fees added to paid in capital C, J | - | - | - | - | - |
Net asset value, end of period | $ 19.38 | $ 15.68 | $ 16.27 | $ 12.57 | $ 10.74 |
Total Return A, B | 31.87% | (1.41)% | 29.44% | 17.04% | (18.45)% |
Ratios to Average Net Assets D, I | | | | | |
Expenses before reductions | 1.49% | 1.61% | 1.50% | 1.61% | 1.60% |
Expenses net of fee waivers, if any | 1.49% | 1.61% | 1.50% | 1.61% | 1.60% |
Expenses net of all reductions | 1.48% | 1.60% | 1.49% | 1.60% | 1.59% |
Net investment income (loss) | (.52)% | (.74)% F | (.73)% G | (.82)% H | (.91)% |
Supplemental Data | | | | | |
Net assets, end of period (000 omitted) | $ 34,686 | $ 27,658 | $ 30,764 | $ 23,930 | $ 21,533 |
Portfolio turnover rate E | 142% | 150% | 106% | 105% | 150% |
A Total returns would have been lower if certain expenses had not been reduced during the applicable periods shown.
B Total returns do not include the effect of the sales charges.
C Calculated based on average shares outstanding during the period.
D Fees and expenses of any underlying Fidelity Central Funds are not included in the Fund's expense ratio. The Fund indirectly bears its proportionate share of the expenses of any underlying Fidelity Central Funds.
E Amount does not include the portfolio activity of any underlying Fidelity Central Funds.
F Investment income per share reflects a large, non-recurring dividend which amounted to $.01 per share. Excluding this non-recurring dividend, the ratio of net investment income (loss) to average net assets would have been (.83)%.
G Investment income per share reflects a large, non-recurring dividend which amounted to $.02 per share. Excluding this non-recurring dividend, the ratio of net investment income (loss) to average net assets would have been (.86)%.
H Investment income per share reflects a large, non-recurring dividend which amounted to $.01 per share. Excluding this non-recurring dividend, the ratio of net investment income (loss) to average net assets would have been (.93)%.
I Expense ratios reflect operating expenses of the class. Expenses before reductions do not reflect amounts reimbursed by the investment adviser or reductions from brokerage service arrangements or reductions from other expense offset arrangements and do not represent the amount paid by the class during periods when reimbursements or reductions occur. Expenses net of fee waivers reflect expenses after reimbursement by the investment adviser but prior to reductions from brokerage service arrangements or other expense offset arrangements. Expenses net of all reductions represent the net expenses paid by the class.
J Amount represents less than $.01 per share.
See accompanying notes which are an integral part of the financial statements.
Annual Report
Financial Highlights - Class B
Years ended July 31, | 2013 | 2012 | 2011 | 2010 | 2009 |
Selected Per-Share Data | | | | | |
Net asset value, beginning of period | $ 15.19 | $ 15.86 | $ 12.30 | $ 10.57 | $ 13.03 |
Income from Investment Operations | | | | | |
Net investment income (loss) C | (.16) | (.18) F | (.18) G | (.16) H | (.13) |
Net realized and unrealized gain (loss) | 4.64 | (.17) | 3.74 | 1.89 | (2.33) |
Total from investment operations | 4.48 | (.35) | 3.56 | 1.73 | (2.46) |
Distributions from net realized gain | (1.02) | (.32) | - | - | - |
Redemption fees added to paid in capital C, J | - | - | - | - | - |
Net asset value, end of period | $ 18.65 | $ 15.19 | $ 15.86 | $ 12.30 | $ 10.57 |
Total Return A, B | 31.25% | (1.96)% | 28.94% | 16.37% | (18.88)% |
Ratios to Average Net Assets D, I | | | | | |
Expenses before reductions | 1.99% | 2.10% | 2.00% | 2.11% | 2.08% |
Expenses net of fee waivers, if any | 1.99% | 2.10% | 2.00% | 2.11% | 2.08% |
Expenses net of all reductions | 1.97% | 2.09% | 1.98% | 2.09% | 2.08% |
Net investment income (loss) | (1.01)% | (1.23)% F | (1.22)% G | (1.32)% H | (1.39)% |
Supplemental Data | | | | | |
Net assets, end of period (000 omitted) | $ 3,486 | $ 4,123 | $ 5,295 | $ 5,142 | $ 4,171 |
Portfolio turnover rate E | 142% | 150% | 106% | 105% | 150% |
A Total returns would have been lower if certain expenses had not been reduced during the applicable periods shown.
B Total returns do not include the effect of the contingent deferred sales charge.
C Calculated based on average shares outstanding during the period.
D Fees and expenses of any underlying Fidelity Central Funds are not included in the Fund's expense ratio. The Fund indirectly bears its proportionate share of the expenses of any underlying Fidelity Central Funds.
E Amount does not include the portfolio activity of any underlying Fidelity Central Funds.
F Investment income per share reflects a large, non-recurring dividend which amounted to $.01 per share. Excluding this non-recurring dividend, the ratio of net investment income (loss) to average net assets would have been (1.32)%.
G Investment income per share reflects a large, non-recurring dividend which amounted to $.02 per share. Excluding this non-recurring dividend, the ratio of net investment income (loss) to average net assets would have been (1.36)%.
H Investment income per share reflects a large, non-recurring dividend which amounted to $.01 per share. Excluding this non-recurring dividend, the ratio of net investment income (loss) to average net assets would have been (1.42)%.
I Expense ratios reflect operating expenses of the class. Expenses before reductions do not reflect amounts reimbursed by the investment adviser or reductions from brokerage service arrangements or reductions from other expense offset arrangements and do not represent the amount paid by the class during periods when reimbursements or reductions occur. Expenses net of fee waivers reflect expenses after reimbursement by the investment adviser but prior to reductions from brokerage service arrangements or other expense offset arrangements. Expenses net of all reductions represent the net expenses paid by the class.
J Amount represents less than $.01 per share.
See accompanying notes which are an integral part of the financial statements.
Annual Report
Financial Highlights - Class C
Years ended July 31, | 2013 | 2012 | 2011 | 2010 | 2009 |
Selected Per-Share Data | | | | | |
Net asset value, beginning of period | $ 15.16 | $ 15.83 | $ 12.28 | $ 10.55 | $ 13.00 |
Income from Investment Operations | | | | | |
Net investment income (loss) C | (.16) | (.18) F | (.18) G | (.16) H | (.13) |
Net realized and unrealized gain (loss) | 4.64 | (.17) | 3.73 | 1.89 | (2.32) |
Total from investment operations | 4.48 | (.35) | 3.55 | 1.73 | (2.45) |
Distributions from net realized gain | (1.02) | (.32) | - | - | - |
Redemption fees added to paid in capital C, J | - | - | - | - | - |
Net asset value, end of period | $ 18.62 | $ 15.16 | $ 15.83 | $ 12.28 | $ 10.55 |
Total Return A, B | 31.32% | (1.96)% | 28.91% | 16.40% | (18.85)% |
Ratios to Average Net Assets D, I | | | | | |
Expenses before reductions | 1.99% | 2.10% | 2.00% | 2.11% | 2.08% |
Expenses net of fee waivers, if any | 1.99% | 2.10% | 2.00% | 2.11% | 2.08% |
Expenses net of all reductions | 1.97% | 2.09% | 1.98% | 2.09% | 2.07% |
Net investment income (loss) | (1.01)% | (1.24)% F | (1.22)% G | (1.32)% H | (1.39)% |
Supplemental Data | | | | | |
Net assets, end of period (000 omitted) | $ 32,756 | $ 24,683 | $ 24,914 | $ 18,091 | $ 14,267 |
Portfolio turnover rate E | 142% | 150% | 106% | 105% | 150% |
A Total returns would have been lower if certain expenses had not been reduced during the applicable periods shown.
B Total returns do not include the effect of the contingent deferred sales charge.
C Calculated based on average shares outstanding during the period.
D Fees and expenses of any underlying Fidelity Central Funds are not included in the Fund's expense ratio. The Fund indirectly bears its proportionate share of the expenses of any underlying Fidelity Central Funds.
E Amount does not include the portfolio activity of any underlying Fidelity Central Funds.
F Investment income per share reflects a large, non-recurring dividend which amounted to $.01 per share. Excluding this non-recurring dividend, the ratio of net investment income (loss) to average net assets would have been (1.32)%.
G Investment income per share reflects a large, non-recurring dividend which amounted to $.02 per share. Excluding this non-recurring dividend, the ratio of net investment income (loss) to average net assets would have been (1.36)%.
H Investment income per share reflects a large, non-recurring dividend which amounted to $.01 per share. Excluding this non-recurring dividend, the ratio of net investment income (loss) to average net assets would have been (1.42)%.
I Expense ratios reflect operating expenses of the class. Expenses before reductions do not reflect amounts reimbursed by the investment adviser or reductions from brokerage service arrangements or reductions from other expense offset arrangements and do not represent the amount paid by the class during periods when reimbursements or reductions occur. Expenses net of fee waivers reflect expenses after reimbursement by the investment adviser but prior to reductions from brokerage service arrangements or other expense offset arrangements. Expenses net of all reductions represent the net expenses paid by the class.
J Amount represents less than $.01 per share.
See accompanying notes which are an integral part of the financial statements.
Annual Report
Financial Highlights - Small Cap Growth
Years ended July 31, | 2013 | 2012 | 2011 | 2010 | 2009 |
Selected Per-Share Data | | | | | |
Net asset value, beginning of period | $ 16.14 | $ 16.65 | $ 12.81 | $ 10.89 | $ 13.29 |
Income from Investment Operations | | | | | |
Net investment income (loss) B | .01 | (.03) E | (.03) F | (.04) G | (.04) |
Net realized and unrealized gain (loss) | 4.98 | (.16) | 3.90 | 1.96 | (2.36) |
Total from investment operations | 4.99 | (.19) | 3.87 | 1.92 | (2.40) |
Distributions from net realized gain | (1.06) | (.32) | (.03) H | - | - |
Redemption fees added to paid in capital B, J | - | - | - | - | - |
Net asset value, end of period | $ 20.07 | $ 16.14 | $ 16.65 | $ 12.81 | $ 10.89 |
Total Return A | 32.74% | (.88)% | 30.20% | 17.63% | (18.06)% |
Ratios to Average Net Assets C, I | | | | |
Expenses before reductions | .90% | 1.03% | .95% | 1.08% | 1.08% |
Expenses net of fee waivers, if any | .90% | 1.03% | .95% | 1.08% | 1.08% |
Expenses net of all reductions | .88% | 1.02% | .93% | 1.07% | 1.08% |
Net investment income (loss) | .08% | (.16)% E | (.17)% F | (.29)% G | (.39)% |
Supplemental Data | | | | | |
Net assets, end of period (000 omitted) | $ 1,315,659 | $ 1,166,101 | $ 1,382,688 | $ 1,204,818 | $ 1,085,184 |
Portfolio turnover rate D | 142% | 150% | 106% | 105% | 150% |
A Total returns would have been lower if certain expenses had not been reduced during the applicable periods shown.
B Calculated based on average shares outstanding during the period.
C Fees and expenses of any underlying Fidelity Central Funds are not included in the Fund's expense ratio. The Fund indirectly bears its proportionate share of the expenses of any underlying Fidelity Central Funds.
D Amount does not include the portfolio activity of any underlying Fidelity Central Funds.
E Investment income per share reflects a large, non-recurring dividend which amounted to $.01 per share. Excluding this non-recurring dividend, the ratio of net investment income (loss) to average net assets would have been (.25)%.
F Investment income per share reflects a large, non-recurring dividend which amounted to $.02 per share. Excluding this non-recurring dividend, the ratio of net investment income (loss) to average net assets would have been (.31)%.
G Investment income per share reflects a large, non-recurring dividend which amounted to $.01 per share. Excluding this non-recurring dividend, the ratio of net investment income (loss) to average net assets would have been (.39)%.
H The amounts shown reflect certain reclassifications related to book to tax differences that were made in the year shown.
I Expense ratios reflect operating expenses of the class. Expenses before reductions do not reflect amounts reimbursed by the investment adviser or reductions from brokerage service arrangements or reductions from other expense offset arrangements and do not represent the amount paid by the class during periods when reimbursements or reductions occur. Expenses net of fee waivers reflect expenses after reimbursement by the investment adviser but prior to reductions from brokerage service arrangements or other expense offset arrangements. Expenses net of all reductions represent the net expenses paid by the class.
J Amount represents less than $.01 per share.
See accompanying notes which are an integral part of the financial statements.
Annual Report
Financial Highlights - Class F
Years ended July 31, | 2013 | 2012 | 2011 | 2010 | 2009 K |
Selected Per-Share Data | | | | | |
Net asset value, beginning of period | $ 16.26 | $ 16.73 | $ 12.85 | $ 10.90 | $ 10.03 |
Income from Investment Operations | | | | | |
Net investment income (loss) D | .05 | .01 H | .01 I | - J, N | (.01) |
Net realized and unrealized gain (loss) | 5.02 | (.16) | 3.91 | 1.95 | .88 |
Total from investment operations | 5.07 | (.15) | 3.92 | 1.95 | .87 |
Distributions from net realized gain | (1.08) | (.32) | (.04) L | - | - |
Redemption fees added to paid in capital D, N | - | - | - | - | - |
Net asset value, end of period | $ 20.25 | $ 16.26 | $ 16.73 | $ 12.85 | $ 10.90 |
Total Return B, C | 33.00% | (.64)% | 30.56% | 17.89% | 8.67% |
Ratios to Average Net Assets E, M | | | | | |
Expenses before reductions | .69% | .80% | .70% | .78% | .74% A |
Expenses net of fee waivers, if any | .69% | .80% | .70% | .78% | .74% A |
Expenses net of all reductions | .67% | .79% | .68% | .77% | .73% A |
Net investment income (loss) | .29% | .07% H | .08% I | -% G, J | (.54)% A |
Supplemental Data | | | | | |
Net assets, end of period (000 omitted) | $ 727,683 | $ 528,229 | $ 290,765 | $ 106,941 | $ 159 |
Portfolio turnover rate F | 142% | 150% | 106% | 105% | 150% |
A Annualized
B Total returns for periods of less than one year are not annualized.
C Total returns would have been lower if certain expenses had not been reduced during the applicable periods shown.
D Calculated based on average shares outstanding during the period.
E Fees and expenses of any underlying Fidelity Central Funds are not included in the Fund's expense ratio. The Fund indirectly bears its proportionate share of the expenses of any underlying Fidelity Central Funds.
F Amount does not include the portfolio activity of any underlying Fidelity Central Funds.
G Amount represents less than .01%.
H Investment income per share reflects a large, non-recurring dividend which amounted to $.01 per share. Excluding this non-recurring dividend, the ratio of net investment income (loss) to average net assets would have been (.02)%.
I Investment income per share reflects a large, non-recurring dividend which amounted to $.02 per share. Excluding this non-recurring dividend, the ratio of net investment income (loss) to average net assets would have been (.06)%.
J Investment income per share reflects a large, non-recurring dividend which amounted to $.01 per share. Excluding this non-recurring dividend, the ratio of net investment income (loss) to average net assets would have been (.10)%.
K For the period June 26, 2009 (commencement of sale of shares) to July 31, 2009.
L The amounts shown reflect certain reclassifications related to book to tax differences that were made in the year shown.
M Expense ratios reflect operating expenses of the class. Expenses before reductions do not reflect amounts reimbursed by the investment adviser or reductions from brokerage service arrangements or reductions from other expense offset arrangements and do not represent the amount paid by the class during periods when reimbursements or reductions occur. Expense ratios before reductions for start-up periods may not be representative of longer-term operating periods. Expenses net of fee waivers reflect expenses after reimbursement by the investment adviser but prior to reductions from brokerage service arrangements or other expense offset arrangements. Expenses net of all reductions represent the net expenses paid by the class.
N Amount represents less than $.01 per share.
See accompanying notes which are an integral part of the financial statements.
Annual Report
Financial Highlights - Institutional Class
Years ended July 31, | 2013 | 2012 | 2011 | 2010 | 2009 |
Selected Per-Share Data | | | | | |
Net asset value, beginning of period | $ 16.17 | $ 16.68 | $ 12.83 | $ 10.91 | $ 13.30 |
Income from Investment Operations | | | | | |
Net investment income (loss) B | .01 | (.03) E | (.03) F | (.03) G | (.03) |
Net realized and unrealized gain (loss) | 4.98 | (.16) | 3.91 | 1.95 | (2.36) |
Total from investment operations | 4.99 | (.19) | 3.88 | 1.92 | (2.39) |
Distributions from net realized gain | (1.06) | (.32) | (.03) H | - | - |
Redemption fees added to paid in capital B, J | - | - | - | - | - |
Net asset value, end of period | $ 20.10 | $ 16.17 | $ 16.68 | $ 12.83 | $ 10.91 |
Total Return A | 32.65% | (.88)% | 30.24% | 17.60% | (17.97)% |
Ratios to Average Net Assets C, I | | | | | |
Expenses before reductions | .92% | 1.06% | .94% | 1.03% | 1.05% |
Expenses net of fee waivers, if any | .92% | 1.06% | .94% | 1.03% | 1.05% |
Expenses net of all reductions | .91% | 1.05% | .93% | 1.02% | 1.04% |
Net investment income (loss) | .06% | (.19)% E | (.17)% F | (.24)% G | (.36)% |
Supplemental Data | | | | | |
Net assets, end of period (000 omitted) | $ 51,158 | $ 36,694 | $ 41,440 | $ 25,650 | $ 19,204 |
Portfolio turnover rate D | 142% | 150% | 106% | 105% | 150% |
A Total returns would have been lower if certain expenses had not been reduced during the applicable periods shown.
B Calculated based on average shares outstanding during the period.
C Fees and expenses of any underlying Fidelity Central Funds are not included in the Fund's expense ratio. The Fund indirectly bears its proportionate share of the expenses of any underlying Fidelity Central Funds.
D Amount does not include the portfolio activity of any underlying Fidelity Central Funds.
E Investment income per share reflects a large, non-recurring dividend which amounted to $.01 per share. Excluding this non-recurring dividend, the ratio of net investment income (loss) to average net assets would have been (.28)%.
F Investment income per share reflects a large, non-recurring dividend which amounted to $.02 per share. Excluding this non-recurring dividend, the ratio of net investment income (loss) to average net assets would have been (.30)%.
G Investment income per share reflects a large, non-recurring dividend which amounted to $.01 per share. Excluding this non-recurring dividend, the ratio of net investment income (loss) to average net assets would have been (.34)%.
H The amounts shown reflect certain reclassifications related to book to tax differences that were made in the year shown.
I Expense ratios reflect operating expenses of the class. Expenses before reductions do not reflect amounts reimbursed by the investment adviser or reductions from brokerage service arrangements or reductions from other expense offset arrangements and do not represent the amount paid by the class during periods when reimbursements or reductions occur. Expenses net of fee waivers reflect expenses after reimbursement by the investment adviser but prior to reductions from brokerage service arrangements or other expense offset arrangements. Expenses net of all reductions represent the net expenses paid by the class.
J Amount represents less than $.01 per share.
See accompanying notes which are an integral part of the financial statements.
Annual Report
Notes to Financial Statements
For the period ended July 31, 2013
1. Organization.
Fidelity Small Cap Growth Fund (the Fund) is a fund of Fidelity Securities Fund (the Trust) and is authorized to issue an unlimited number of shares. The Trust is registered under the Investment Company Act of 1940, as amended (the 1940 Act), as an open-end management investment company organized as a Massachusetts business trust. The Fund offers Class A, Class T, Class C, Small Cap Growth, Class F and Institutional Class shares, each of which, along with Class B shares, has equal rights as to assets and voting privileges. Class B shares are closed to new accounts and additional purchases, except for exchanges and reinvestments. Each class has exclusive voting rights with respect to matters that affect that class. Class F shares of the Fund are only available for purchase by mutual funds for which Fidelity Management & Research Company (FMR) or an affiliate serves as investment manager. Class B shares will automatically convert to Class A shares after a holding period of seven years from the initial date of purchase.
2. Investments in Fidelity Central Funds.
The Fund invests in Fidelity Central Funds, which are open-end investment companies generally available only to other investment companies and accounts managed by FMR and its affiliates. The Fund's Schedule of Investments lists each of the Fidelity Central Funds held as of period end, if any, as an investment of the Fund, but does not include the underlying holdings of each Fidelity Central Fund. As an Investing Fund, the Fund indirectly bears its proportionate share of the expenses of the underlying Fidelity Central Funds.
The Money Market Central Funds seek preservation of capital and current income and are managed by Fidelity Investments Money Management, Inc. (FIMM), an affiliate of FMR.
A complete unaudited list of holdings for each Fidelity Central Fund is available upon request or at the Securities and Exchange Commission (the SEC) website at www.sec.gov. In addition, the financial statements of the Fidelity Central Funds, which are not covered by the Fund's Report of Independent Registered Public Accounting Firm, are available on the SEC website or upon request.
3. Significant Accounting Policies.
The financial statements have been prepared in conformity with accounting principles generally accepted in the United States of America (GAAP), which require management to make certain estimates and assumptions at the date of the financial statements. Actual results could differ from those estimates. Subsequent events, if any, through the date that the financial statements were issued have been evaluated in the preparation of the financial statements. The following summarizes the significant accounting policies of the Fund:
Annual Report
Notes to Financial Statements - continued
3. Significant Accounting Policies - continued
Investment Valuation. Investments are valued as of 4:00 p.m. Eastern time on the last calendar day of the period. In accordance with valuation policies and procedures approved by the Board of Trustees (the Board), the Fund attempts to obtain prices from one or more third party pricing vendors or brokers to value its investments. When current market prices, quotations or currency exchange rates are not readily available or reliable, investments will be fair valued in good faith by the FMR Fair Value Committee (the Committee), in accordance with procedures adopted by the Board. Factors used in determining fair value vary by investment type and may include market or investment specific events. The frequency with which these procedures are used cannot be predicted and they may be utilized to a significant extent. The Committee oversees the Fund's valuation policies and procedures and is responsible for approving and reporting to the Board all fair value determinations.
The Fund categorizes the inputs to valuation techniques used to value its investments into a disclosure hierarchy consisting of three levels as shown below:
Level 1 - quoted prices in active markets for identical investments
Level 2 - other significant observable inputs (including quoted prices for similar investments, interest rates, prepayment speeds, etc.)
Level 3 - unobservable inputs (including the Fund's own assumptions based on the best information available)
Valuation techniques used to value the Fund's investments by major category are as follows:
Equity securities, including restricted securities, for which market quotations are readily available, are valued at the last reported sale price or official closing price as reported by a third party pricing vendor on the primary market or exchange on which they are traded and are categorized as Level 1 in the hierarchy. In the event there were no sales during the day or closing prices are not available, securities are valued at the last quoted bid price or may be valued using the last available price and are generally categorized as Level 2 in the hierarchy. For foreign equity securities, when market or security specific events arise, comparisons to the valuation of American Depositary Receipts (ADRs), futures contracts, Exchange-Traded Funds (ETFs) and certain indexes as well as quoted prices for similar securities may be used and would be categorized as Level 2 in the hierarchy. Utilizing these techniques may result in transfers between Level 1 and Level 2.
Investments in open-end mutual funds, including the Fidelity Central Funds, are valued at their closing net asset value (NAV) each business day and are categorized as Level 1 in the hierarchy.
Annual Report
3. Significant Accounting Policies - continued
Investment Valuation - continued
Changes in valuation techniques may result in transfers in or out of an assigned level within the disclosure hierarchy.
Foreign Currency. The Fund may use foreign currency contracts to facilitate transactions in foreign-denominated securities. Gains and losses from these transactions may arise from changes in the value of the foreign currency or if the counterparties do not perform under the contracts' terms.
Foreign-denominated assets, including investment securities, and liabilities are translated into U.S. dollars at the exchange rates at period end. Purchases and sales of investment securities, income and dividends received and expenses denominated in foreign currencies are translated into U.S. dollars at the exchange rate in effect on the transaction date.
The effects of exchange rate fluctuations on investments are included with the net realized and unrealized gain (loss) on investment securities. Other foreign currency transactions resulting in realized and unrealized gain (loss) are disclosed separately.
Investment Transactions and Income. For financial reporting purposes, the Fund's investment holdings and NAV include trades executed through the end of the last business day of the period. The NAV per share for processing shareholder transactions is calculated as of the close of business of the New York Stock Exchange (NYSE), normally 4:00 p.m. Eastern time and includes trades executed through the end of the prior business day. Gains and losses on securities sold are determined on the basis of identified cost and may include proceeds received from litigation. Dividend income is recorded on the ex-dividend date, except for certain dividends from foreign securities where the ex-dividend date may have passed, which are recorded as soon as the Fund is informed of the ex-dividend date. Non-cash dividends included in dividend income, if any, are recorded at the fair market value of the securities received. Distributions received on securities that represent a return of capital or capital gain are recorded as a reduction of cost of investments and/or as a realized gain. Subsequent to ex-dividend date the Fund determines the components of these distributions, based upon receipt of tax filings or other correspondence relating to the underlying investment. Interest income and distributions from the Fidelity Central Funds are accrued as earned. Interest income includes coupon interest and amortization of premium and accretion of discount on debt securities. Investment income is recorded net of foreign taxes withheld where recovery of such taxes is uncertain.
Class Allocations and Expenses. Investment income, realized and unrealized capital gains and losses, common expenses of the Fund, and certain fund-level expense reductions, if any, are allocated on a pro-rata basis to each class based on the relative net
Annual Report
Notes to Financial Statements - continued
3. Significant Accounting Policies - continued
Class Allocations and Expenses - continued
assets of each class to the total net assets of the Fund. Each class differs with respect to transfer agent and distribution and service plan fees incurred. Certain expense reductions may also differ by class. Expenses directly attributable to a fund are charged to that fund. Expenses attributable to more than one fund are allocated among the respective funds on the basis of relative net assets or other appropriate methods. Expense estimates are accrued in the period to which they relate and adjustments are made when actual amounts are known.
Income Tax Information and Distributions to Shareholders. Each year, the Fund intends to qualify as a regulated investment company under Subchapter M of the Internal Revenue Code, including distributing substantially all of its taxable income and realized gains. As a result, no provision for income taxes is required. As of July 31, 2013, the Fund did not have any unrecognized tax benefits in the financial statements; nor is the Fund aware of any tax positions for which it is reasonably possible that the total amounts of unrecognized tax benefits will significantly change in the next twelve months. The Fund files a U.S. federal tax return, in addition to state and local tax returns as required. A fund's federal income tax returns are subject to examination by the Internal Revenue Service (IRS) for a period of three fiscal years after they are filed. State and local tax returns may be subject to examination for an additional fiscal year depending on the jurisdiction. Foreign taxes are provided for based on the Fund's understanding of the tax rules and rates that exist in the foreign markets in which it invests.
Distributions are declared and recorded on the ex-dividend date. Income dividends and capital gain distributions are declared separately for each class. Income and capital gain distributions are determined in accordance with income tax regulations, which may differ from GAAP. In addition, the Fund claimed a portion of the payment made to redeeming shareholders as a distribution for income tax purposes.
Capital accounts within the financial statements are adjusted for permanent book-tax differences. These adjustments have no impact on net assets or the results of operations. Temporary book-tax differences will reverse in a subsequent period.
Book-tax differences are primarily due to foreign currency transactions, partnerships and losses deferred due to wash sales and excise tax regulations.
Annual Report
3. Significant Accounting Policies - continued
Income Tax Information and Distributions to Shareholders - continued
The federal tax cost of investment securities and unrealized appreciation (depreciation) as of period end were as follows:
Gross unrealized appreciation | $ 440,572,794 |
Gross unrealized depreciation | (17,106,671) |
Net unrealized appreciation (depreciation) on securities and other investments | $ 423,466,123 |
| |
Tax Cost | $ 1,966,959,286 |
The tax-based components of distributable earnings as of period end were as follows:
Undistributed ordinary income | $ 106,393,413 |
Undistributed long-term capital gain | $ 142,483,227 |
Net unrealized appreciation (depreciation) | $ 423,461,730 |
The tax character of distributions paid was as follows:
| July 31, 2013 | July 31, 2012 |
Ordinary Income | $ 5,191,398 | $ - |
Long-term Capital Gains | 117,369,049 | 34,799,429 |
Total | $ 122,560,447 | $ 34,799,429 |
Short-Term Trading (Redemption) Fees. Shares held by investors in the Fund less than 90 days may have been subject to a redemption fee equal to 1.50% of the net asset value of shares redeemed. All redemption fees, which reduce the proceeds of the shareholder redemption, are retained by the Fund and accounted for as an addition to paid in capital.
4. Purchases and Sales of Investments.
Purchases and sales of securities, other than short-term securities, aggregated $2,731,095,699 and $2,897,640,503, respectively.
5. Fees and Other Transactions with Affiliates.
Management Fee. FMR and its affiliates provide the Fund with investment management related services for which the Fund pays a monthly management fee. The management fee is the sum of an individual fund fee rate that is based on an annual rate of .45% of the Fund's average net assets and an annualized group fee rate that averaged .26% during the period. The group fee rate is based upon the average net assets of all the mutual funds advised by FMR. The group fee rate decreases as assets under management increase and increases as assets under management decrease. In addition, the
Annual Report
Notes to Financial Statements - continued
5. Fees and Other Transactions with Affiliates - continued
Management Fee - continued
management fee is subject to a performance adjustment (up to a maximum of ± .20% of the Fund's average net assets over a 36 month performance period). The upward or downward adjustment to the management fee is based on the relative investment performance of Small Cap Growth as compared to an appropriate benchmark index. For the period, the total annual management fee rate, including the performance adjustment, was .64% of the Fund's average net assets.
Distribution and Service Plan Fees. In accordance with Rule 12b-1 of the 1940 Act, the Fund has adopted separate Distribution and Service Plans for each class of shares. Certain classes pay Fidelity Distributors Corporation (FDC), an affiliate of FMR, separate Distribution and Service Fees, each of which is based on an annual percentage of each class' average net assets. In addition, FDC may pay financial intermediaries for selling shares of the Fund and providing shareholder support services. For the period, the Distribution and Service Fee rates, total fees and amounts retained by FDC were as follows:
| Distribution
Fee | Service
Fee | Total Fees | Retained
by FDC |
Class A | -% | .25% | $ 158,162 | $ 3,570 |
Class T | .25% | .25% | 145,172 | 1,664 |
Class B | .75% | .25% | 37,548 | 28,458 |
Class C | .75% | .25% | 268,513 | 44,877 |
| | | $ 609,395 | $ 78,569 |
Sales Load. FDC may receive a front-end sales charge of up to 5.75% for selling Class A shares and 3.50% for selling Class T shares, some of which is paid to financial intermediaries for selling shares of the Fund. Depending on the holding period, FDC may receive contingent deferred sales charges levied on Class A, Class T, Class B, and Class C redemptions. The deferred sales charges range from 5.00% to 1.00% for Class B shares, 1.00% for Class C shares, 1.00% for certain purchases of Class A shares and .25% for certain purchases of Class T shares.
For the period, sales charge amounts retained by FDC were as follows:
| Retained
by FDC |
Class A | $ 26,925 |
Class T | 7,772 |
Class B* | 4,960 |
Class C* | 2,503 |
| $ 42,160 |
* When Class B and Class C shares are initially sold, FDC pays commissions from its own resources to financial intermediaries through which the sales
are made.
Annual Report
5. Fees and Other Transactions with Affiliates - continued
Transfer Agent Fees. Fidelity Investments Institutional Operations Company, Inc., (FIIOC), an affiliate of FMR, is the transfer, dividend disbursing and shareholder servicing agent for each class of the Fund. FIIOC receives account fees and asset-based fees that vary according to the account size and type of account of the shareholders of the respective classes of the Fund, except for Class F. FIIOC receives no fees for providing transfer agency services to Class F. FIIOC pays for typesetting, printing and mailing of shareholder reports, except proxy statements. For the period, transfer agent fees for each applicable class were as follows:
| Amount | % of
Average
Net Assets |
Class A | $ 189,665 | .30 |
Class T | 89,260 | .31 |
Class B | 11,279 | .30 |
Class C | 80,491 | .30 |
Small Cap Growth | 2,548,777 | .21 |
Institutional Class | 96,156 | .23 |
| $ 3,015,628 | |
Accounting and Security Lending Fees. Fidelity Service Company, Inc. (FSC), an affiliate of FMR, maintains the Fund's accounting records. The accounting fee is based on the level of average net assets for each month. Under a separate contract, FSC administers the security lending program. The security lending fee is based on the number and duration of lending transactions.
Brokerage Commissions. The Fund placed a portion of its portfolio transactions with brokerage firms which are affiliates of the investment adviser. Brokerage commissions are included in net realized gain (loss) and change in net unrealized appreciation (depreciation) in the Statement of Operations. The commissions paid to these affiliated firms were $81,093 for the period.
Interfund Lending Program. Pursuant to an Exemptive Order issued by the SEC, the Fund, along with other registered investment companies having management contracts with FMR, may participate in an interfund lending program. This program provides an alternative credit facility allowing the funds to borrow from, or lend money to, other participating affiliated funds. At period end, there were no interfund loans outstanding. The Fund's activity in this program during the period for which loans were outstanding was as follows:
Borrower or Lender | Average Loan
Balance | Weighted Average
Interest Rate | Interest
Expense |
Borrower | $ 10,856,167 | .37% | $ 674 |
Annual Report
Notes to Financial Statements - continued
6. Committed Line of Credit.
The Fund participates with other funds managed by FMR or an affiliate in a $4.25 billion credit facility (the "line of credit") to be utilized for temporary or emergency purposes to fund shareholder redemptions or for other short-term liquidity purposes. The Fund has agreed to pay commitment fees on its pro-rata portion of the line of credit, which amounted to $4,620 and is reflected in Miscellaneous expenses on the Statement of Operations. During the period, there were no borrowings on this line of credit.
7. Security Lending.
The Fund lends portfolio securities through a lending agent from time to time in order to earn additional income. For equity securities, a lending agent is used and may loan securities to certain qualified borrowers, including Fidelity Capital Markets (FCM), a broker-dealer affiliated with the Fund. On the settlement date of the loan, the Fund receives collateral (in the form of U.S. Treasury obligations, letters of credit and/or cash) against the loaned securities and maintains collateral in an amount not less than 100% of the market value of the loaned securities during the period of the loan. The market value of the loaned securities is determined at the close of business of the Fund and any additional required collateral is delivered to the Fund on the next business day. If the borrower defaults on its obligation to return the securities loaned because of insolvency or other reasons, the Fund may apply collateral received from the borrower against the obligation. The Fund may experience delays and costs in recovering the securities loaned. Any cash collateral received is invested in the Fidelity Securities Lending Cash Central Fund. The value of loaned securities and cash collateral at period end are disclosed on the Fund's Statement of Assets and Liabilities. The value of securities loaned to FCM at period end was $2,735,765. Security lending income represents the income earned on investing cash collateral, less rebates paid to borrowers and any lending agent fees associated with the loan, plus any premium payments received for lending certain types of securities. Security lending income is presented in the Statement of Operations as a component of income from Fidelity Central Funds, and includes $310,189 from securities loaned to FCM.
8. Expense Reductions.
Commissions paid to certain brokers with whom FMR places trades on behalf of the Fund include an amount in addition to trade execution, which is rebated back to the Fund to offset certain expenses. This amount totaled $317,619 for the period. In addition, through arrangements with the Fund's custodian, credits realized as a result of uninvested cash balances were used to reduce the Fund's expenses. During the period, these credits reduced the Fund's custody expenses by $50.
Annual Report
8. Expense Reductions - continued
In addition, FMR reimbursed a portion of the Fund's operating expenses during the period in the amount of $4,459.
9. Distributions to Shareholders.
Distributions to shareholders of each class were as follows:
Years ended July 31, | 2013 | 2012 |
From net realized gain | | |
Class A | $ 3,855,020 | $ 1,262,924 |
Class T | 1,778,904 | 573,407 |
Class B | 260,524 | 101,910 |
Class C | 1,656,727 | 481,854 |
Small Cap Growth | 74,940,038 | 25,434,274 |
Class F | 37,680,389 | 6,152,820 |
Institutional Class | 2,388,845 | 792,240 |
Total | $ 122,560,447 | $ 34,799,429 |
10. Share Transactions.
Transactions for each class of shares were as follows:
| Shares | Dollars |
Years ended July 31, | 2013 | 2012 | 2013 | 2012 |
Class A | | | | |
Shares sold | 969,311 | 986,718 | $ 16,711,827 | $ 14,926,996 |
Reinvestment of distributions | 231,282 | 85,896 | 3,646,231 | 1,194,285 |
Shares redeemed | (1,149,326) | (1,407,222) | (19,219,034) | (21,375,353) |
Net increase (decrease) | 51,267 | (334,608) | $ 1,139,024 | $ (5,254,072) |
Class T | | | | |
Shares sold | 457,321 | 358,193 | $ 7,743,595 | $ 5,456,756 |
Reinvestment of distributions | 106,640 | 38,774 | 1,660,117 | 533,890 |
Shares redeemed | (538,707) | (523,310) | (8,802,237) | (7,812,853) |
Net increase (decrease) | 25,254 | (126,343) | $ 601,475 | $ (1,822,207) |
Class B | | | | |
Shares sold | 6,696 | 11,810 | $ 106,485 | $ 172,624 |
Reinvestment of distributions | 16,337 | 7,173 | 246,159 | 96,091 |
Shares redeemed | (107,598) | (81,516) | (1,730,845) | (1,196,288) |
Net increase (decrease) | (84,565) | (62,533) | $ (1,378,201) | $ (927,573) |
Annual Report
Notes to Financial Statements - continued
10. Share Transactions - continued
| Shares | Dollars |
Years ended July 31, | 2013 | 2012 | 2013 | 2012 |
Class C | | | | |
Shares sold | 456,788 | 405,451 | $ 7,531,447 | $ 5,976,693 |
Reinvestment of distributions | 103,215 | 33,110 | 1,550,542 | 443,092 |
Shares redeemed | (428,305) | (384,855) | (6,821,754) | (5,527,477) |
Net increase (decrease) | 131,698 | 53,706 | $ 2,260,235 | $ 892,308 |
Small Cap Growth | | | | |
Shares sold | 10,379,088 | 14,552,522 | $ 182,249,151 | $ 226,496,807 |
Reinvestment of distributions | 4,595,875 | 1,774,167 | 73,721,316 | 25,022,882 |
Shares redeemed | (21,652,202) | (27,135,724) | (371,997,767) | (414,348,619) |
Net increase (decrease) | (6,677,239) | (10,809,035) | $ (116,027,300) | $ (162,828,930) |
Class F | | | | |
Shares sold | 7,670,010 | 16,430,240 | $ 131,231,307 | $ 255,874,632 |
Reinvestment of distributions | 2,336,095 | 432,802 | 37,680,389 | 6,152,820 |
Shares redeemed | (6,554,937) | (1,757,546) | (118,928,973) | (26,811,905) |
Net increase (decrease) | 3,451,168 | 15,105,496 | $ 49,982,723 | $ 235,215,547 |
Institutional Class | | | | |
Shares sold | 727,207 | 819,623 | $ 12,757,998 | $ 12,520,738 |
Reinvestment of distributions | 128,780 | 44,186 | 2,069,290 | 624,723 |
Shares redeemed | (580,321) | (1,078,752) | (9,884,418) | (16,617,897) |
Net increase (decrease) | 275,666 | (214,943) | $ 4,942,870 | $ (3,472,436) |
11. Other.
The Fund's organizational documents provide former and current trustees and officers with a limited indemnification against liabilities arising in connection with the performance of their duties to the Fund. In the normal course of business, the Fund may also enter into contracts that provide general indemnifications. The Fund's maximum exposure under these arrangements is unknown as this would be dependent on future claims that may be made against the Fund. The risk of material loss from such claims is considered remote.
At the end of the period, the Fidelity Freedom Funds and the Fidelity Freedom K Funds were the owners of record, in the aggregate, of approximately 59% of the total outstanding shares of the Fund.
Annual Report
To the Trustees of Fidelity Securities Fund and the Shareholders of Fidelity Small Cap Growth Fund:
In our opinion, the accompanying statement of assets and liabilities, including the schedule of investments, and the related statements of operations and of changes in net assets and the financial highlights present fairly, in all material respects, the financial position of Fidelity Small Cap Growth Fund (a fund of Fidelity Securities Fund) at July 31, 2013, the results of its operations for the year then ended, the changes in its net assets for each of the two years in the period then ended and the financial highlights for each of the periods indicated, in conformity with accounting principles generally accepted in the United States of America. These financial statements and financial highlights (hereafter referred to as "financial statements") are the responsibility of the Fidelity Small Cap Growth Fund's management. Our responsibility is to express an opinion on these financial statements based on our audits. We conducted our audits of these financial statements in accordance with the standards of the Public Company Accounting Oversight Board (United States). Those standards require that we plan and perform the audit to obtain reasonable assurance about whether the financial statements are free of material misstatement. An audit includes examining, on a test basis, evidence supporting the amounts and disclosures in the financial statements, assessing the accounting principles used and significant estimates made by management, and evaluating the overall financial statement presentation. We believe that our audits, which included confirmation of securities at July 31, 2013 by correspondence with the custodian and brokers, provide a reasonable basis for our opinion.
PricewaterhouseCoopers LLP
Boston, Massachusetts
September 16, 2013
Annual Report
The Trustees, Member of the Advisory Board, and executive officers of the trust and fund, as applicable, are listed below. The Board of Trustees governs the fund and is responsible for protecting the interests of shareholders. The Trustees are experienced executives who meet periodically throughout the year to oversee the fund's activities, review contractual arrangements with companies that provide services to the fund, oversee management of the risks associated with such activities and contractual arrangements, and review the fund's performance. Except for James C. Curvey, Ned C. Lautenbach, Ronald P. O'Hanley, and William S. Stavropoulos, each of the Trustees oversees 166 Fidelity funds. Mr. Curvey oversees 387 Fidelity funds. Mr. Lautenbach, Mr. O'Hanley, and Mr. Stavropoulos each oversees 230 Fidelity funds.
The Trustees hold office without limit in time except that (a) any Trustee may resign; (b) any Trustee may be removed by written instrument, signed by at least two-thirds of the number of Trustees prior to such removal; (c) any Trustee who requests to be retired or who has become incapacitated by illness or injury may be retired by written instrument signed by a majority of the other Trustees; and (d) any Trustee may be removed at any special meeting of shareholders by a two-thirds vote of the outstanding voting securities of the trust. Each Trustee who is not an interested person of the trust and the fund (as defined in the 1940 Act) (Independent Trustee), shall retire not later than the last day of the calendar year in which his or her 75th birthday occurs. The Independent Trustees may waive this mandatory retirement age policy with respect to individual Trustees. The executive officers and Advisory Board Member hold office without limit in time, except that any officer and Advisory Board Member may resign or may be removed by a vote of a majority of the Trustees at any regular meeting or any special meeting of the Trustees. Except as indicated, each individual has held the office shown or other offices in the same company for the past five years.
Experience, Skills, Attributes, and Qualifications of the Fund's Trustees. The Governance and Nominating Committee has adopted a statement of policy that describes the experience, qualifications, attributes, and skills that are necessary and desirable for potential Independent Trustee candidates (Statement of Policy). The Board believes that each Trustee satisfied at the time he or she was initially elected or appointed a Trustee, and continues to satisfy, the standards contemplated by the Statement of Policy. The Governance and Nominating Committee also engages professional search firms to help identify potential Independent Trustee candidates who have the experience, qualifications, attributes, and skills consistent with the Statement of Policy. From time to time, additional criteria based on the composition and skills of the current Independent Trustees, as well as experience or skills that may be appropriate in light of future changes to board composition, business conditions, and regulatory or other developments, have also been considered by the professional search firms and the Governance and Nominating Committee. In addition, the Board takes into account the Trustees' commitment and participation in Board and committee meetings, as well as their leadership of standing and ad hoc committees throughout their tenure.
Annual Report
Trustees and Officers - continued
In determining that a particular Trustee was and continues to be qualified to serve as a Trustee, the Board has considered a variety of criteria, none of which, in isolation, was controlling. The Board believes that, collectively, the Trustees have balanced and diverse experience, qualifications, attributes, and skills, which allow the Board to operate effectively in governing the fund and protecting the interests of shareholders. Information about the specific experience, skills, attributes, and qualifications of each Trustee, which in each case led to the Board's conclusion that the Trustee should serve (or continue to serve) as a trustee of the fund, is provided below.
Board Structure and Oversight Function. James C. Curvey is an interested person (as defined in the 1940 Act) and currently serves as Chairman. The Trustees have determined that an interested Chairman is appropriate and benefits shareholders because an interested Chairman has a personal and professional stake in the quality and continuity of services provided to the fund. Independent Trustees exercise their informed business judgment to appoint an individual of their choosing to serve as Chairman, regardless of whether the Trustee happens to be independent or a member of management. The Independent Trustees have determined that they can act independently and effectively without having an Independent Trustee serve as Chairman and that a key structural component for assuring that they are in a position to do so is for the Independent Trustees to constitute a substantial majority for the Board. The Independent Trustees also regularly meet in executive session. Ned C. Lautenbach serves as Chairman of the Independent Trustees and as such (i) acts as a liaison between the Independent Trustees and management with respect to matters important to the Independent Trustees and (ii) with management prepares agendas for Board meetings.
Fidelity funds are overseen by different Boards of Trustees. The fund's Board oversees Fidelity's equity and high income funds and another Board oversees Fidelity's investment-grade bond, money market, and asset allocation funds. The asset allocation funds may invest in Fidelity funds overseen by the fund's Board. The use of separate Boards, each with its own committee structure, allows the Trustees of each group of Fidelity funds to focus on the unique issues of the funds they oversee, including common research, investment, and operational issues. On occasion, the separate Boards establish joint committees to address issues of overlapping consequences for the Fidelity funds overseen by each Board.
The Trustees operate using a system of committees to facilitate the timely and efficient consideration of all matters of importance to the Trustees, the fund, and fund shareholders and to facilitate compliance with legal and regulatory requirements and oversight of the fund's activities and associated risks. The Board, acting through its committees, has charged FMR and its affiliates with (i) identifying events or circumstances the occurrence of which could have demonstrably adverse effects on the fund's business and/or reputation; (ii) implementing processes and controls to lessen the possibility that such events or circumstances occur or to mitigate the effects of such events or circumstances if they do occur; and (iii) creating and maintaining a system designed to evaluate continuously business and market conditions in order to facilitate the identification and implementation processes described in (i) and (ii) above. Because the day-to-day operations and activities of the fund's are carried out by or through FMR, its affiliates and other service providers, the fund's exposure to risks is mitigated but not eliminated by the processes overseen by the Trustees. While each of the Board's committees has responsibility for overseeing different aspects of the fund's activities, oversight is exercised primarily through the Operations, Audit, and Compliance Committees. In addition, the Independent Trustees have worked with FMR to enhance the Board's oversight of investment and financial risks, legal and regulatory risks, technology risks, and operational risks, including the development of additional risk reporting to the Board. For example, a working group comprised of Independent Trustees and FMR has worked and continues to work to review the Fidelity funds' valuation-related activities, reporting and risk management. Appropriate personnel, including but not limited to the fund's Chief Compliance Officer (CCO), FMR's internal auditor, the independent accountants, the fund's Treasurer and portfolio management personnel, make periodic reports to the Board's committees, as appropriate, including an annual review of FMR's risk management program for the Fidelity funds. The responsibilities of each standing committee, including their oversight responsibilities, are described further under "Standing Committees of the Fund's Trustees."
Annual Report
The fund's Statement of Additional Information (SAI) includes more information about the Trustees. To request a free copy, call Fidelity at 1-800-544-8544.
Interested Trustees*:
Correspondence intended for each Trustee who is an interested person may be sent to Fidelity Investments, 245 Summer Street, Boston, Massachusetts 02210.
Name, Year of Birth; Principal Occupations and Other Relevant Experience+ |
James C. Curvey (1935) |
| Year of Election or Appointment: 2007 Mr. Curvey is Trustee and Chairman of the Board of Trustees of certain Trusts. Mr. Curvey also serves as Trustee (2007-present) of other investment companies advised by FMR. Mr. Curvey is a Director of Fidelity Investments Money Management, Inc. (2009-present), Director of Fidelity Research & Analysis Co. (2009-present) and Director of FMR and FMR Co., Inc. (2007-present). Mr. Curvey is also Vice Chairman (2007-present) and Director of FMR LLC. In addition, Mr. Curvey serves as an Overseer for the Boston Symphony Orchestra and a member of the Trustees of Villanova University. Previously, Mr. Curvey was the Vice Chairman (2006-2007) and Director (2000-2007) of FMR Corp. |
Ronald P. O'Hanley (1957) |
| Year of Election or Appointment: 2011 Mr. O'Hanley serves as a Trustee and Chairman of the Board of Trustees of other Fidelity funds (2013-present), and is Director of FMR Co., Inc. (2010-present), Director of Fidelity Investments Money Management, Inc. (2010-present), Director of Fidelity Research & Analysis Company (2010-present), President of Fidelity Asset Management and Corporate Services and a Member of Fidelity's Executive Committee (2010-present). Previously, Mr. O'Hanley served as President and Chief Executive Officer of BNY Mellon Asset Management (2007-2010). Mr. O'Hanley also served as Vice Chairman of Bank New York Mellon Corp. and a member of that firm's Executive Committee. Prior to the 2007 merger of The Bank of New York and Mellon Financial Corporation, he was Vice Chairman of Mellon Financial Corporation and President and Chief Executive Officer of Mellon Asset Management. He joined Mellon in February 1997. Mr. O'Hanley currently serves as Chairman of the Boston Public Library Foundation Board of Directors and sits on the Board of Directors of Beth Israel Deaconess Medical Center, the Board of Trustees of the Marine Biological Laboratory and the Advisory Board of the Maxwell School of Citizenship and Public Administration at Syracuse University. Mr. O'Hanley also chairs the Council on Asset Management for the Financial Services Roundtable and is a member of the Board of Directors of Institutional Investor's U.S. Institute. |
* Trustees have been determined to be "Interested Trustees" by virtue of, among other things, their affiliation with the trust or various entities under common control with FMR.
+ The information above includes each Trustee's principal occupation during the last five years and other information relating to the experience, attributes, and skills relevant to each Trustee's qualifications to serve as a Trustee, which led to the conclusion that each Trustee should serve as a Trustee for the fund.
Annual Report
Independent Trustees:
Correspondence intended for each Independent Trustee (that is, the Trustees other than the Interested Trustees) may be sent to Fidelity Investments, P.O. Box 55235, Boston, Massachusetts 02205-5235.
Name, Year of Birth; Principal Occupations and Other Relevant Experience+ |
Dennis J. Dirks (1948) |
| Year of Election or Appointment: 2005 Prior to his retirement in May 2003, Mr. Dirks was Chief Operating Officer and a member of the Board of The Depository Trust & Clearing Corporation (DTCC). He also served as President, Chief Operating Officer, and Board member of The Depository Trust Company (DTC) and President and Board member of the National Securities Clearing Corporation (NSCC). In addition, Mr. Dirks served as Chief Executive Officer and Board member of the Government Securities Clearing Corporation, Chief Executive Officer and Board member of the Mortgage-Backed Securities Clearing Corporation, as a Trustee and a member of the Finance Committee of Manhattan College (2005-2008), and as a Trustee and a member of the Finance Committee of AHRC of Nassau County (2006-2008). Mr. Dirks is a member of the Independent Directors Council (IDC) Governing Council (2010-present) and Board of Directors for The Brookville Center for Children's Services, Inc. (2009-present). |
Alan J. Lacy (1953) |
| Year of Election or Appointment: 2008 Mr. Lacy serves as Senior Adviser (2007-present) of Oak Hill Capital Partners, L.P. (private equity). Mr. Lacy also served as Chief Executive Officer (2000-2005) and Vice Chairman (2005-2006) of Sears Holdings Corporation and Sears, Roebuck and Co. (retail). In addition, Mr. Lacy serves as a member of the Board of Directors of Dave & Buster's Entertainment, Inc. (restaurant and entertainment complexes, 2010-present), Earth Fare, Inc. (retail grocery, 2012-present), The Hillman Companies, Inc. (hardware wholesalers, 2010-present), and Bristol-Myers Squibb Company (global pharmaceuticals, 2008-present). Mr. Lacy is a member of the Board of Trustees of The National Parks Conservation Association (2006-present). Previously, Mr. Lacy served as Chairman of the Board of Trustees of the National Parks Conservation Association (2008-2011) and as a member of the Board of Directors for the Western Union Company (global money transfer, 2006-2011). |
Ned C. Lautenbach (1944) |
| Year of Election or Appointment: 2000 Mr. Lautenbach is Chairman of the Independent Trustees of the Equity and High Income Funds (2006-present) and serves as a Trustee of other Fidelity funds (2013-present). Mr. Lautenbach currently serves as the Lead Director of the Eaton Corporation Board of Directors (diversified industrial, 1997-present). Mr. Lautenbach is Chairman of the Board of Directors of the Philharmonic Center for the Arts in Naples, Florida (2012-present) and a member of the Council on Foreign Relations (1994-present). Previously, Mr. Lautenbach was a Partner/Advisory Partner at Clayton, Dubilier & Rice, LLC (private equity investment, 1998-2010), as well as a Director of Sony Corporation (2006-2007). |
Joseph Mauriello (1944) |
| Year of Election or Appointment: 2008 Prior to his retirement in January 2006, Mr. Mauriello served in numerous senior management positions including Deputy Chairman and Chief Operating Officer (2004-2005), and Vice Chairman of Financial Services (2002-2004) of KPMG LLP US (professional services, 1965-2005). Mr. Mauriello currently serves as a member of the Board of Directors of XL Group plc. (global insurance and re-insurance, 2006-present). Previously, Mr. Mauriello served as a Director of the Hamilton Funds of the Bank of New York (2006-2007) and of Arcadia Resources Inc. (health care services and products, 2007-2012). |
Robert W. Selander (1950) |
| Year of Election or Appointment: 2011 Previously, Mr. Selander served as a Member of the Advisory Board of Fidelity's Equity and High Income Funds (2011), Executive Vice Chairman (2010), Chief Executive Officer (2009-2010), and President and Chief Executive Officer (1997-2009) of Mastercard, Inc. |
Cornelia M. Small (1944) |
| Year of Election or Appointment: 2005 Ms. Small is a member of the Board of Directors (2009-present) and Chair of the Investment Committee (2010-present) of the Teagle Foundation. Ms. Small also serves on the Investment Committee of the Berkshire Taconic Community Foundation (2008-present). Previously, Ms. Small served as Chairperson (2002-2008) and a member of the Investment Committee and Chairperson (2008-2012) and a member of the Board of Trustees of Smith College. In addition, Ms. Small served as Chief Investment Officer, Director of Global Equity Investments, and a member of the Board of Directors of Scudder, Stevens & Clark and Scudder Kemper Investments. |
William S. Stavropoulos (1939) |
| Year of Election or Appointment: 2002 Mr. Stavropoulos is Vice Chairman of the Independent Trustees of the Equity and High Income Funds (2006-present) and serves as a Trustee of other Fidelity funds (2013-present). Mr. Stavropoulos serves as President and Founder of the Michigan Baseball Foundation, the Great Lakes Loons (2007-present). Mr. Stavropoulos is Chairman Emeritus of the Board of Directors of The Dow Chemical Company, where he previously served in numerous senior management positions, including President, CEO (1995-2000; 2002-2004), Chairman of the Executive Committee (2000-2006), and as a member of the Board of Directors (1990-2006). Currently, Mr. Stavropoulos is Chairman of the Board of Directors of Univar Inc. (global distributor of commodity and specialty chemicals), a Director of Teradata Corporation (data warehousing and technology solutions), and Maersk Inc. (industrial conglomerate), and a member of the Advisory Board for Metalmark Capital LLC (private equity investment, 2005-present). Mr. Stavropoulos is an operating advisor to Clayton, Dubilier & Rice, LLC (private equity investment). In addition, Mr. Stavropoulos is a member of the University of Notre Dame Advisory Council for the College of Science, a Trustee of the Rollin L. Gerstacker Foundation, and a Director of the Naples Philharmonic Center for the Arts. Previously, Mr. Stavropoulos served as a Director of Chemical Financial Corporation (bank holding company, 1993-2012) and Tyco International, Ltd. (multinational manufacturing and services, 2007-2012). |
David M. Thomas (1949) |
| Year of Election or Appointment: 2008 Previously, Mr. Thomas served as Executive Chairman (2005-2006) and Chairman and Chief Executive Officer (2000-2005) of IMS Health, Inc. (pharmaceutical and healthcare information solutions), and a Director of Fortune Brands, Inc. (consumer products, 2000-2011). In addition, Mr. Thomas serves as Non-Executive Chairman of the Board of Directors of Fortune Brands Home and Security (home and security products, 2011-present), and as a member of the Board of Directors of Interpublic Group of Companies, Inc. (marketing communication, 2004-present). |
+ The information above includes each Trustee's principal occupation during the last five years and other information relating to the experience, attributes, and skills relevant to each Trustee's qualifications to serve as a Trustee, which led to the conclusion that each Trustee should serve as a Trustee for the fund.
Annual Report
Trustees and Officers - continued
Advisory Board Member and Executive Officers:
Correspondence intended for each executive officer and Peter S. Lynch may be sent to Fidelity Investments, 245 Summer Street, Boston, Massachusetts 02210.
Name, Year of Birth; Principal Occupation |
Peter S. Lynch (1944) |
| Year of Election or Appointment: 2003 Member of the Advisory Board of Fidelity's Equity and High Income Funds. Mr. Lynch is Vice Chairman and a Director of FMR and FMR Co., Inc. In addition, Mr. Lynch serves as a Trustee of Boston College and as the Chairman of the Inner-City Scholarship Fund. Previously, Mr. Lynch served on the Special Olympics International Board of Directors (1997-2006). |
Kenneth B. Robins (1969) |
| Year of Election or Appointment: 2008 President and Treasurer of Fidelity's Equity and High Income Funds. Mr. Robins also serves as President and Treasurer (2008-present) and Assistant Treasurer (2009-present) of other Fidelity funds and is an employee of Fidelity Investments (2004-present). Mr. Robins serves as Executive Vice President of Fidelity Investments Money Management, Inc. (FIMM) (2013-present). Previously, Mr. Robins served as Deputy Treasurer of the Fidelity funds (2005-2008) and Treasurer and Chief Financial Officer of The North Carolina Capital Management Trust: Cash and Term Portfolios (2006-2008). |
Brian B. Hogan (1964) |
| Year of Election or Appointment: 2009 Vice President of Equity and High Income Funds. Mr. Hogan also serves as Vice President of other Fidelity funds (2009-present) and President of FMR's Equity Division (2009-present). Previously, Mr. Hogan served as Senior Vice President, Equity Research of FMR (2006-2009) and as a portfolio manager. |
Thomas C. Hense (1964) |
| Year of Election or Appointment: 2008 or 2010 Vice President of Fidelity's High Income (2008), Small Cap (2008), and Value (2010) Funds. Previously, Mr. Hense served as a portfolio manager for Fidelity's Institutional Money Management Group (Pyramis) (2003-2008). |
Scott C. Goebel (1968) |
| Year of Election or Appointment: 2008 Secretary and Chief Legal Officer (CLO) of the Fidelity funds. Mr. Goebel also serves as Secretary of Fidelity Investments Money Management, Inc. (FIMM) (2010-present) and Fidelity Research and Analysis Company (FRAC) (2010-present); Secretary and CLO of The North Carolina Capital Management Trust: Cash and Term Portfolios (2008-present); General Counsel, Secretary, and Senior Vice President of FMR (2008-present) and FMR Co., Inc. (2008-present); employed by FMR LLC or an affiliate (2001-present); Chief Legal Officer of Fidelity Management & Research (Hong Kong) Limited (2008-present) and Assistant Secretary of Fidelity Management & Research (Japan) Inc. (2008-present), and Fidelity Management & Research (U.K.) Inc. (2008-present). Previously, Mr. Goebel served as Assistant Secretary of FIMM (2008-2010), FRAC (2008-2010), and the Funds (2007-2008) and as Vice President and Secretary of Fidelity Distributors Corporation (FDC) (2005-2007). |
William C. Coffey (1969) |
| Year of Election or Appointment: 2009 Assistant Secretary of Fidelity's Equity and High Income Funds. Mr. Coffey also serves as Assistant Secretary of other Fidelity funds (2009-present), Senior Vice President and Deputy General Counsel of FMR LLC (2010-present), and is an employee of Fidelity Investments. Previously, Mr. Coffey served as Vice President and Associate General Counsel of FMR LLC (2005-2009). |
Elizabeth Paige Baumann (1968) |
| Year of Election or Appointment: 2012 Anti-Money Laundering (AML) Officer of the Fidelity funds. Ms. Baumann also serves as AML Officer of The North Carolina Capital Management Trust: Cash and Term Portfolios (2012-present), Chief AML Officer of FMR LLC (2012-present), and is an employee of Fidelity Investments. Previously, Ms. Baumann served as Vice President and Deputy Anti-Money Laundering Officer (2007-2012). |
Christine Reynolds (1958) |
| Year of Election or Appointment: 2008 Chief Financial Officer of the Fidelity funds. Ms. Reynolds became President of Fidelity Pricing and Cash Management Services (FPCMS) in August 2008. Ms. Reynolds served as Chief Operating Officer of FPCMS (2007-2008). Previously, Ms. Reynolds served as President, Treasurer, and Anti-Money Laundering officer of the Fidelity funds (2004-2007). |
Joseph A. Hanlon (1968) |
| Year of Election or Appointment: 2012 Chief Compliance Officer of Fidelity's Equity and High Income Funds. Mr. Hanlon also serves as Chief Compliance Officer of other Fidelity funds (2012-present). Mr. Hanlon serves as Compliance Officer of FMR, FMR Co., Inc., Fidelity Investments Money Management, Inc. (FIMM), Fidelity Research and Analysis Company (FRAC), and Fidelity Management & Research (Hong Kong) (2009-present), as Senior Vice President of the Fidelity Asset Management Division (2009-present), and is an employee of Fidelity Investments. Previously, Mr. Hanlon served as Compliance Officer of Fidelity Management & Research (Japan) Inc. (2009-2013), Strategic Advisers, Inc. (2009-2013), and Fidelity Management & Research (U.K.) Inc. (2009-2013). |
Joseph F. Zambello (1957) |
| Year of Election or Appointment: 2011 Deputy Treasurer of the Fidelity funds. Mr. Zambello is an employee of Fidelity Investments. Previously, Mr. Zambello served as Vice President of FMR's Program Management Group (2009-2011) and Vice President of the Transfer Agent Oversight Group (2005-2009). |
Adrien E. Deberghes (1967) |
| Year of Election or Appointment: 2008 Deputy Treasurer of Fidelity's Equity and High Income Funds. Mr. Deberghes also serves as Vice President (2011-present), Deputy Treasurer (2008-present), and Assistant Treasurer (2010-present) of other Fidelity funds, and is an employee of Fidelity Investments (2008-present). Previously, Mr. Deberghes served as Senior Vice President of Mutual Fund Administration at State Street Corporation (2007-2008), Senior Director of Mutual Fund Administration at Investors Bank & Trust (2005-2007), and Director of Finance for Dunkin' Brands (2000-2005). |
Stephen Sadoski (1971) |
| Year of Election or Appointment: 2012 Deputy Treasurer of Fidelity's Equity and High Income Funds. Mr. Sadoski also serves as Deputy Treasurer of other Fidelity funds (2012-present) and is an employee of Fidelity Investments (2012-present). Previously, Mr. Sadoski served as Assistant Treasurer of Fidelity's Fixed Income and Asset Allocation Funds (2012-2013), an assistant chief accountant in the Division of Investment Management of the Securities and Exchange Commission (SEC) (2009-2012) and as a senior manager at Deloitte & Touche LLP (1997-2009). |
Stacie M. Smith (1974) |
| Year of Election or Appointment: 2013 Deputy Treasurer of Fidelity's Equity and High Income Funds. Ms. Smith also serves as Deputy Treasurer of other Fidelity funds (2013-present) and is an employee of Fidelity Investments (2009-present). Previously, Ms. Smith served as Senior Audit Manager of Ernst & Young LLP (1996-2009). |
Stephanie J. Dorsey (1969) |
| Year of Election or Appointment: 2010 Assistant Treasurer of Fidelity's Equity and High Income Funds. Ms. Dorsey also serves as President and Treasurer (2013-present) and Assistant Treasurer (2010-present) of other Fidelity funds, Treasurer and Chief Financial Officer of The North Carolina Capital Management Trust: Cash and Term Portfolios (2013-present), and is an employee of Fidelity Investments (2008-present). Previously, Ms. Dorsey served as Deputy Treasurer of Fidelity's Fixed Income and Asset Allocation Funds (2008-2013), Treasurer (2004-2008) of the JPMorgan Mutual Funds and Vice President (2004-2008) of JPMorgan Chase Bank. |
Gary W. Ryan (1958) |
| Year of Election or Appointment: 2005 Assistant Treasurer of the Fidelity funds. Mr. Ryan is an employee of Fidelity Investments. Previously, Mr. Ryan served as Vice President of Fund Reporting in Fidelity Pricing and Cash Management Services (FPCMS) (1999-2005). |
Jonathan Davis (1968) |
| Year of Election or Appointment: 2010 Assistant Treasurer of the Fidelity funds. Mr. Davis is also Assistant Treasurer of Fidelity Rutland Square Trust II and Fidelity Commonwealth Trust II. Mr. Davis is an employee of Fidelity Investments. Previously, Mr. Davis served as Vice President and Associate General Counsel of FMR LLC (2003-2010). |
Annual Report
The Board of Trustees of Fidelity Small Cap Growth Fund voted to pay on September 16, 2013, to shareholders of record at the opening of business on September 13, 2013, a distribution of $2.236 per share derived from capital gains realized from sales of portfolio securities.
Fidelity Small Cap Growth Fund designates 100% of the dividends distributed during the fiscal year as qualifying for the dividends-received deduction for corporate shareholders.
Fidelity Small Cap Growth Fund designates 100% of the dividends distributed during the fiscal year as amounts which may be taken into account as a dividend for the purposes of the maximum rate under section 1(h)(11) of the Internal Revenue Code.
The fund hereby designates as a capital gain dividend with respect to the taxable year ended July 31, 2013, $193,398,519, or, if subsequently determined to be different, the net capital gain of such year.
The fund will notify shareholders in January 2014 of amounts for use in preparing 2013 income tax returns.
Annual Report
Board Approval of Investment Advisory Contracts and Management Fees
Fidelity Small Cap Growth Fund
Each year, the Board of Trustees, including the Independent Trustees (together, the Board), votes on the renewal of the management contract and sub-advisory agreements (together, the Advisory Contracts) for the fund. The Board, assisted by the advice of fund counsel and Independent Trustees' counsel, requests and considers a broad range of information relevant to the renewal of the Advisory Contracts throughout the year.
The Board meets regularly and, at each of its meetings, covers an extensive agenda of topics and materials and considers factors that are relevant to its annual consideration of the renewal of the fund's Advisory Contracts, including the services and support provided to the fund and its shareholders. The Board has established various standing committees, each composed of and chaired by Independent Trustees with varying backgrounds, to which the Board has assigned specific subject matter responsibilities in order to enhance effective decision-making by the Board. The Board, acting directly and through its Committees, requests and receives information concerning the annual consideration of the renewal of the fund's Advisory Contracts. The Board also meets as needed to consider matters specifically related to the Board's annual consideration of the renewal of Advisory Contracts. Members of the Board may also meet with trustees of other Fidelity funds through ad hoc joint committees to discuss certain matters relevant to the Fidelity funds.
At its July 2013 meeting, the Board, including the Independent Trustees, unanimously determined to renew the fund's Advisory Contracts. In reaching its determination, the Board considered all factors it believed relevant, including (i) the nature, extent, and quality of the services to be provided to the fund and its shareholders (including the investment performance of the fund); (ii) the competitiveness of the fund's management fee and total expense ratio relative to peer funds; (iii) the total costs of the services to be provided by and the profits to be realized by Fidelity from its relationship with the fund; (iv) the extent to which economies of scale exist and would be realized as the fund grows; and (v) whether fee levels reflect these economies of scale, if any, for the benefit of fund shareholders.
In considering whether to renew the Advisory Contracts for the fund, the Board reached a determination, with the assistance of fund counsel and Independent Trustees' counsel and through the exercise of its business judgment, that the renewal of the Advisory Contracts was in the best interests of the fund and its shareholders and that the compensation payable under the Advisory Contracts was fair and reasonable. The Board's decision to renew the Advisory Contracts was not based on any single factor, but rather was based on a comprehensive consideration of all the information provided to the Board at its meetings throughout the year. The Board, in reaching its determination to renew the Advisory Contracts, was aware that shareholders in the fund have a broad range of investment choices available to them, including a wide choice among mutual funds offered by Fidelity's competitors, and that the fund's shareholders, who have the opportunity to review and weigh the disclosure provided by the fund in its prospectus and other public disclosures, have chosen to invest in this fund, which is a part of the Fidelity family of funds.
Annual Report
Board Approval of Investment Advisory Contracts and
Management Fees - continued
Nature, Extent, and Quality of Services Provided. The Board considered the staffing within the investment adviser, Fidelity Management & Research Company (FMR), and the sub-advisers (together, the Investment Advisers) as it relates to the fund, including the backgrounds of the fund's investment personnel, and also considered the fund's investment objective, strategies, and related investment philosophy. The Independent Trustees also had discussions with senior management of Fidelity's investment operations and investment groups. The Board considered the structure of the portfolio manager compensation program and whether this structure provides appropriate incentives to act in the best interests of the fund.
Resources Dedicated to Investment Management and Support Services. The Board and the Fund Oversight and Research Committees reviewed the general qualifications and capabilities of the Investment Advisers' investment staff, including its size, education, experience, and resources, as well as the Investment Advisers' approach to recruiting, training, managing, and compensating investment personnel. The Board noted that FMR has continued to increase the resources devoted to non-U.S. offices, including expansion of Fidelity's global investment organization. The Board also noted that Fidelity's analysts have extensive resources, tools and capabilities that allow them to conduct sophisticated quantitative and fundamental analysis, as well as credit analysis of issuers, counterparties and guarantors. Further, the Board believes that Fidelity's investment professionals have sufficient access to global information and data so as to provide competitive investment results over time, and that those professionals also have access to sophisticated tools that permit them to assess portfolio construction and risk and performance attribution characteristics continuously, as well as to transmit new information and research conclusions rapidly around the world. Additionally, in its deliberations, the Board considered the Investment Advisers' trading and risk management capabilities and resources, which are an integral part of the investment management process.
Shareholder and Administrative Services. The Board considered (i) the nature, extent, quality, and cost of advisory, administrative, and shareholder services performed by the Investment Advisers and their affiliates under the Advisory Contracts and under separate agreements covering transfer agency, pricing and bookkeeping, and securities lending services for the fund; (ii) the nature and extent of the supervision of third party service providers, principally custodians and subcustodians; and (iii) the resources devoted to, and the record of compliance with, the fund's compliance policies and procedures. The Board also reviewed the allocation of fund brokerage, including allocations to brokers affiliated with the Investment Advisers, the use of brokerage commissions to pay fund expenses, and the use of "soft" commission dollars to pay for research services.
Annual Report
The Board noted that the growth of fund assets over time across the complex allows Fidelity to reinvest in the development of services designed to enhance the value or convenience of the Fidelity funds as investment vehicles. These services include 24-hour access to account information and market information through telephone representatives and over the Internet, investor education materials and asset allocation tools, and the expanded availability of Fidelity Investor Centers.
Investment in a Large Fund Family. The Board considered the benefits to shareholders of investing in a Fidelity fund, including the benefits of investing in a fund that is part of a large family of funds offering a variety of investment disciplines and providing a large variety of mutual fund investor services. The Board noted that Fidelity had taken, or had made recommendations that resulted in the Fidelity funds taking, a number of actions over the previous year that benefited particular funds, including (i) continuing to dedicate additional resources to investment research and to the support of the senior management team that oversees asset management; (ii) persisting in efforts to enhance Fidelity's global research capabilities; (iii) launching new funds and making other enhancements to meet client needs for global and income-oriented solutions; (iv) continuing to launch dedicated lower cost underlying funds to meet portfolio construction needs related to expanding underlying fund options for Fidelity funds of funds, specifically for the Freedom Fund product lines; (v) rationalizing product lines and gaining increased efficiencies through the mergers of several funds into other funds; (vi) strengthening Fidelity's index fund offerings by reducing investment minimums and adopting or lowering existing expense caps for certain funds and classes; (vii) enhancing Global Asset Allocation product offerings by launching new funds and strategies, including "open architecture" target date funds that utilize affiliated and unaffiliated sub-advisers; (viii) modifying the eligibility criteria for Institutional Class shares of Advisor funds to increase their marketability to a portion of the defined contribution plan market; (ix) creating a new low-cost retirement share class for certain Advisor funds to appeal to large retirement plans; (x) transitioning the management of certain Fidelity commodity funds to Geode Capital Management LLC, a registered commodity pool operator, while retaining administrative responsibilities for the funds; (xi) reorganizing a number of funds; and (xii) taking steps toward establishing a new Fidelity adviser to manage sector-based funds and products.
Investment Performance. The Board considered whether the fund has operated in accordance with its investment objective, as well as its record of compliance with its investment restrictions and its performance history. The Board noted that there was a portfolio management change for the fund in November 2011.
Annual Report
Board Approval of Investment Advisory Contracts and
Management Fees - continued
The Board took into account discussions with the Investment Advisers about fund investment performance that occur at Board meetings throughout the year. In this regard the Board noted that as part of regularly scheduled fund reviews and other reports to the Board on fund performance, the Board periodically considers annualized return information for the fund, for different time periods, measured against a securities market index ("benchmark index") and a peer group of mutual funds with similar objectives ("peer group"). In its evaluation of fund investment performance, the Board gave particular attention to information indicating changes in performance of certain Fidelity funds for specific time periods and the Investment Advisers' explanations for any overperformance or underperformance.
In addition to reviewing absolute and relative fund performance, the Independent Trustees periodically consider the appropriateness of fund performance metrics in evaluating the results achieved. In general, the Independent Trustees believe that fund performance should be evaluated based on net performance (after fees and expenses) of both the highest performing and lowest performing classes, where applicable, compared to appropriate benchmark indices, over appropriate time periods which may include full market cycles, and compared to peer groups, as applicable, over the same periods, taking into account relevant factors including the following: general market conditions; issuer-specific information; tactical opportunities for investment; and fund cash flows and other factors.
The Independent Trustees recognize that shareholders evaluate performance on a net basis over their own holding periods, for which one-, three-, and five-year periods are used as a proxy. For this reason, the performance information reviewed by the Board also included net cumulative calendar year total return information for the fund and an appropriate benchmark index and peer group for the most recent one-, three-, and five-year periods, as shown below. Returns are shown compared to the 25th percentile (top of box) and 75th percentile (bottom of box) of the peer universe.
Annual Report
Fidelity Small Cap Growth Fund

The Board has discussed with FMR the fund's underperformance (based on the December 31, 2012 data presented herein) and has engaged with FMR to consider what steps might be taken to remediate the fund's underperformance. The Board noted that the fund's performance has improved for more recent periods.
The Board also considered that the fund's management fee is subject to upward or downward adjustment depending upon whether, and to what extent, the fund's investment performance for the performance period exceeds, or is exceeded by, a securities index, thus leading to a performance adjustment for the same period. The Board noted that the performance adjustment provides FMR with a strong economic incentive to seek to achieve superior performance for the fund's shareholders and helps to more closely align the interests of FMR and the fund's shareholders.
Based on its review, the Board concluded that the nature, extent, and quality of services provided to the fund under the Advisory Contracts should benefit the fund's shareholders.
Competitiveness of Management Fee and Total Expense Ratio. The Board considered the fund's management fee and total expense ratio compared to "mapped groups" of competitive funds and classes. Fidelity creates "mapped groups" by combining similar Lipper investment objective categories that have comparable management fee characteristics. Combining Lipper investment objective categories aids the Board's management fee and total expense ratio comparisons by broadening the competitive group used for comparison and by reducing the number of universes to which various Fidelity funds are compared.
Annual Report
Board Approval of Investment Advisory Contracts and
Management Fees - continued
Management Fee. The Board considered two proprietary management fee comparisons for the 12-month periods shown in the chart below. The group of Lipper funds used by the Board for management fee comparisons is referred to below as the "Total Mapped Group." The Total Mapped Group comparison focuses on a fund's standing in terms of gross management fees before expense reimbursements or caps, and without giving effect to the fund's performance adjustment, relative to the total universe of funds with comparable investment mandates, regardless of whether their management fee structures also are comparable. Funds with comparable investment mandates offer exposure to similar types of securities. Funds with comparable management fee structures have similar management fee contractual arrangements (e.g., flat rate charged for advisory services, all-inclusive fee rate, etc.). "TMG %" represents the percentage of funds in the Total Mapped Group that had management fees that were lower than the fund's. For example, a TMG % of 14% means that 86% of the funds in the Total Mapped Group had higher management fees than the fund. The "Asset-Size Peer Group" (ASPG) comparison focuses on a fund's standing relative to a subset of non-Fidelity funds within the Total Mapped Group that are similar in size and management fee structure. The ASPG represents at least 15% of the funds in the Total Mapped Group with comparable asset size and management fee structures, subject to a minimum of 50 funds (or all funds in the Total Mapped Group if fewer than 50). Additional information, such as the ASPG quartile in which the fund's management fee ranked and the impact of the fund's performance adjustment, is also included in the chart and considered by the Board.
Fidelity Small Cap Growth Fund

The Board noted that the fund's management fee ranked below the median of its Total Mapped Group and below the median of its ASPG for 2012. The Board also noted the effect of the fund's negative performance adjustment on the fund's management fee ranking.
Annual Report
Based on its review, the Board concluded that the fund's management fee is fair and reasonable in light of the services that the fund receives and the other factors considered.
Total Expense Ratio. In its review of each class's total expense ratio, the Board considered the fund's management fee as well as other fund or class expenses, as applicable, such as transfer agent fees, pricing and bookkeeping fees, fund-paid 12b-1 fees, and custodial, legal, and audit fees. The Board also noted the effects of any waivers and reimbursements on fees and expenses, as well as the impact of the fund's performance adjustment. As part of its review, the Board also considered the current and historical total expense ratios of each class of the fund compared to competitive fund median expenses. Each class of the fund is compared to those funds and classes in the Total Mapped Group (used by the Board for management fee comparisons) that have a similar sales load structure.
The Board noted that the total expense ratio of each of Class A, Class B, Class C, Institutional Class, the retail class, and Class F ranked below its competitive median for 2012 and the total expense ratio of Class T ranked above its competitive median for 2012. The Board considered that, in general, various factors can affect total expense ratios. The Board noted that the total expense ratio of Class T was above the competitive median primarily because of higher 12b-1 fees on Class T. Class T has a higher 12b-1 fee, but a lower front-end sales charge, than traditionally priced front-end sales charge classes. The Board considered that Class T is primarily sold load-waived in the retirement plan market where its 0.50% 12b-1 fee is comparable to competing no-load, higher 12b-1 fee classes designed specifically for retirement plans. The Board noted that the fund offers multiple classes, each of which has a different sales load and 12b-1 fee structure, and that the multiple structures are intended to offer a range of pricing options for the intermediary market. The Board also noted that the total expense ratios of the classes vary primarily by the level of their 12b-1 fees, although differences in transfer agent fees may also cause expenses to vary from class to class.
Fees Charged to Other Fidelity Clients. The Board also considered Fidelity fee structures and other information with respect to clients of FMR and its affiliates, such as other mutual funds advised or subadvised by FMR or its affiliates, pension plan clients, and other institutional clients. The Board noted the findings of the 2013 ad hoc joint committee (created with the board of other Fidelity funds), which reviewed and compared Fidelity's institutional investment advisory business with its business of providing services to the Fidelity funds, including the differences in services provided, fees charged, and costs incurred, as well as competition in their respective marketplaces.
Annual Report
Board Approval of Investment Advisory Contracts and
Management Fees - continued
Based on its review of total expense ratios and fees charged to other Fidelity clients, the Board concluded that the total expense ratio of each class of the fund was reasonable, although Class T was above the median of the universe presented for comparison, in light of the services that the fund and its shareholders receive and the other factors considered.
Costs of the Services and Profitability. The Board considered the revenues earned and the expenses incurred by Fidelity in conducting the business of developing, marketing, distributing, managing, administering and servicing the fund and servicing the fund's shareholders. The Board also considered the level of Fidelity's profits in respect of all the Fidelity funds.
On an annual basis, FMR presents to the Board Fidelity's profitability for the fund. Fidelity calculates the profitability for each fund, as well as aggregate profitability for groups of Fidelity funds and all Fidelity funds, using a series of detailed revenue and cost allocation methodologies which originate with the books and records of Fidelity on which Fidelity's audited financial statements are based. The Audit Committee of the Board reviews any significant changes from the prior year's methodologies.
PricewaterhouseCoopers LLP (PwC), independent registered public accounting firm and auditor to Fidelity and certain Fidelity funds, has been engaged annually by the Board as part of the Board's assessment of Fidelity's profitability analysis. PwC's engagement includes the review and assessment of the methodologies used by Fidelity in determining the revenues and expenses attributable to Fidelity's mutual fund business, and completion of agreed-upon procedures surrounding the mathematical accuracy of fund profitability and its conformity to allocation methodologies. After considering PwC's reports issued under the engagement and information provided by Fidelity, the Board concluded that while other allocation methods may also be reasonable, Fidelity's profitability methodologies are reasonable in all material respects.
The Board also reviewed Fidelity's non-fund businesses and fall-out benefits related to the mutual fund business as well as cases where Fidelity's affiliates may benefit from or be related to the fund's business.
The Board considered the costs of the services provided by and the profits realized by Fidelity in connection with the operation of the fund and was satisfied that the profitability was not excessive in the circumstances.
Economies of Scale. The Board considered whether there have been economies of scale in respect of the management of the Fidelity funds, whether the Fidelity funds (including the fund) have appropriately benefited from any such economies of scale, and whether there is potential for realization of any further economies of scale. The Board considered the extent to which the fund will benefit from economies of scale through increased services to the fund, through waivers or reimbursements, or through fee or expense reductions. The Board also noted that in 2009, it and the board of other Fidelity funds created an ad hoc committee (the Economies of Scale Committee) to analyze whether FMR attains economies of scale in respect of the management and servicing of the Fidelity funds, whether the Fidelity funds have appropriately benefited from such economies of scale, and whether there is potential for realization of any further economies of scale.
Annual Report
The Board recognized that the fund's management contract incorporates a "group fee" structure, which provides for lower group fee rates as total fund assets under FMR's management increase, and for higher group fee rates as total fund assets under FMR's management decrease. FMR calculates the group fee rates based on a tiered asset "breakpoint" schedule that varies based on asset class. The Board considered that the group fee is designed to deliver the benefits of economies of scale to fund shareholders when total Fidelity fund assets increase, even if assets of any particular fund are unchanged or have declined, because some portion of Fidelity's costs are attributable to services provided to all Fidelity funds, and all funds benefit if those costs can be allocated among more assets. The Board concluded that, given the group fee structure, fund shareholders will benefit from lower management fees as assets under FMR's management increase at the fund complex level, regardless of whether Fidelity achieves any such economies of scale.
The Board concluded, taking into account the analysis of the Economies of Scale Committee, that economies of scale, if any, are being appropriately shared between fund shareholders and Fidelity.
Amendment to Description of Group Fee Rate. At its July 2013 meeting, the Board voted to approve an amendment to the fund's management contract to modify the description of the "group fee rate" effective August 1, 2013. The Board noted that under the prior description in the contract, the group fee rate was based on the average net assets of all registered investment companies with which FMR has management contracts. Under the contract's tiered asset breakpoint schedule, the group fee rate is lower as total fund assets under FMR's management increase, and higher as total fund assets under FMR's management decrease. The Board considered that the prior description would have excluded the assets of 64 Fidelity sector funds from the group fee rate calculation once Fidelity SelectCo, LLC, an affiliate of FMR, assumed management responsibilities for those funds. The Board noted that modifying the description of the group fee rate to continue to include the assets of those 64 funds for purposes of determining group fee rate breakpoints would avoid an immediate adverse impact on the group fee rate for any fund.
Additional Information Requested by the Board. In order to develop fully the factual basis for consideration of the Fidelity funds' Advisory Contracts, the Board requested and received additional information on certain topics, including: (i) fund performance trends and Fidelity's long-term strategies for certain funds; (ii) the potential to further rationalize the Fidelity fund lineup with the possibility of achieving savings for the funds and Fidelity; (iii) the methodology with respect to competitive fund data and peer group classifications; (iv) the arrangements with, and performance of, certain sub-advisers on behalf of the Fidelity funds, as well as certain proposed participating affiliate arrangements; (v) the realization of fall-out benefits in certain Fidelity business units; (vi) Fidelity's group fee structures, including the rationale for the individual fee rates of certain categories of funds and the definition of group assets; (vii) trends regarding industry use of performance fee structures and the performance adjustment methodologies applicable to the Fidelity funds; (viii) additional competitive analysis regarding the total expenses for certain classes; and (ix) fund profitability methodology, including Fidelity's cost allocation methodology, and the impact of certain factors on fund profitability results.
Annual Report
Board Approval of Investment Advisory Contracts and
Management Fees - continued
Based on its evaluation of all of the conclusions noted above, and after considering all factors it believed relevant, the Board ultimately concluded that the advisory fee structures are fair and reasonable, and that the fund's Advisory Contracts should be renewed.
Annual Report
Investment Adviser
Fidelity Management & Research Company
Boston, MA
Investment Sub-Advisers
FMR Co., Inc.
Fidelity Management & Research
(U.K.) Inc.
Fidelity Management & Research
(Hong Kong) Limited
Fidelity Management & Research
(Japan) Inc.
General Distributor
Fidelity Distributors Corporation
Smithfield, RI
Transfer and Service Agents
Fidelity Investments Institutional
Operations Company, Inc.
Boston, MA
Fidelity Service Company, Inc.
Boston, MA
Custodian
Citibank, N.A.
New York, NY
The Fidelity Telephone Connection
Mutual Fund 24-Hour Service
Exchanges/Redemptions
and Account Assistance 1-800-544-6666
Product Information 1-800-544-6666
Retirement Accounts 1-800-544-4774
(8 a.m. - 9 p.m.)
TDD Service 1-800-544-0118
for the deaf and hearing impaired
(9 a.m. - 9 p.m. Eastern time)
Fidelity Automated Service
Telephone (FAST®)
1-800-544-5555
Automated line for quickest service
(Fidelity Investment logo)(registered trademark)
Corporate Headquarters
245 Summer St., Boston, MA 02210
www.fidelity.com
SCP-UANN-0913
1.803694.108
Fidelity®
Small Cap Growth
Fund
Class F
Annual Report
July 31, 2013
(Fidelity Cover Art)
Contents
Performance | (Click Here) | How the fund has done over time. |
Management's Discussion of Fund Performance | (Click Here) | The Portfolio Manager's review of fund performance and strategy. |
Shareholder Expense Example | (Click Here) | An example of shareholder expenses. |
Investment Changes | (Click Here) | A summary of major shifts in the fund's investments over the past six months. |
Investments | (Click Here) | A complete list of the fund's investments with their market values. |
Financial Statements | (Click Here) | Statements of assets and liabilities, operations, and changes in net assets, as well as financial highlights. |
Notes | (Click Here) | Notes to the financial statements. |
Report of Independent Registered Public Accounting Firm | (Click Here) | |
Trustees and Officers | (Click Here) | |
Distributions | (Click Here) | |
Board Approval of Investment Advisory Contracts and Management Fees | (Click Here) | |
To view a fund's proxy voting guidelines and proxy voting record for the 12-month period ended June 30, visit http://www.fidelity.com/proxyvotingresults or visit the Securities and Exchange Commission's (SEC) web site at http://www.sec.gov. You may also call 1-800-835-5092 to request a free copy of the proxy voting guidelines.
Standard & Poor's, S&P and S&P 500 are registered service marks of The McGraw-Hill Companies, Inc. and have been licensed for use by Fidelity Distributors Corporation.
Other third-party marks appearing herein are the property of their respective owners.
All other marks appearing herein are registered or unregistered trademarks or service marks of FMR LLC or an affiliated company. © 2013 FMR LLC. All rights reserved.
Annual Report
p20
This report and the financial statements contained herein are submitted for the general information of the shareholders of the fund. This report is not authorized for distribution to prospective investors in the fund unless preceded or accompanied by an effective prospectus.
A fund files its complete schedule of portfolio holdings with the SEC for the first and third quarters of each fiscal year on Form N-Q. Forms N-Q are available on the SEC's web site at http://www.sec.gov. A fund's Forms N-Q may be reviewed and copied at the SEC's Public Reference Room in Washington, DC. Information regarding the operation of the SEC's Public Reference Room may be obtained by calling 1-800-SEC-0330. For a complete list of a fund's portfolio holdings, view the fund's most recent holdings listing, semiannual report, or annual report on Fidelity's web site at http://www.fidelity.com, http://www.advisor.fidelity.com, or http://www.401k.com, as applicable.
NOT FDIC INSURED • MAY LOSE VALUE • NO BANK GUARANTEE
Neither the fund nor Fidelity Distributors Corporation is a bank.
Annual Report
Average annual total return reflects the change in the value of an investment, assuming reinvestment of the class' distributions from dividend income and capital gains (the profits earned upon the sale of securities that have grown in value, if any) and assuming a constant rate of performance each year. The $10,000 table and the fund's returns do not reflect the deduction of taxes that a shareholder would pay on fund distributions or the redemption of fund shares. During periods of reimbursement by Fidelity, a fund's total return will be greater than it would be had the reimbursement not occurred. How a fund did yesterday is no guarantee of how it will do tomorrow.
Average Annual Total Returns
Periods ended July 31, 2013 | | Past 1
year | Past 5
years | Life of
fund A |
Class F B | | 33.00% | 10.78% | 10.65% |
A From November 3, 2004.
B The initial offering of Class F shares took place on June 26, 2009. Returns prior to June 26, 2009 are those of Fidelity® Small Cap Growth Fund, the original class of the fund.
$10,000 Over Life of Fund
Let's say hypothetically that $10,000 was invested in Fidelity® Small Cap Growth Fund - Class F on November 3, 2004, when the fund started. The chart shows how the value of your investment would have changed, and also shows how the Russell 2000® Growth Index performed over the same period. The initial offering of Class F took place on June 26, 2009. See above for additional information regarding the performance of Class F.
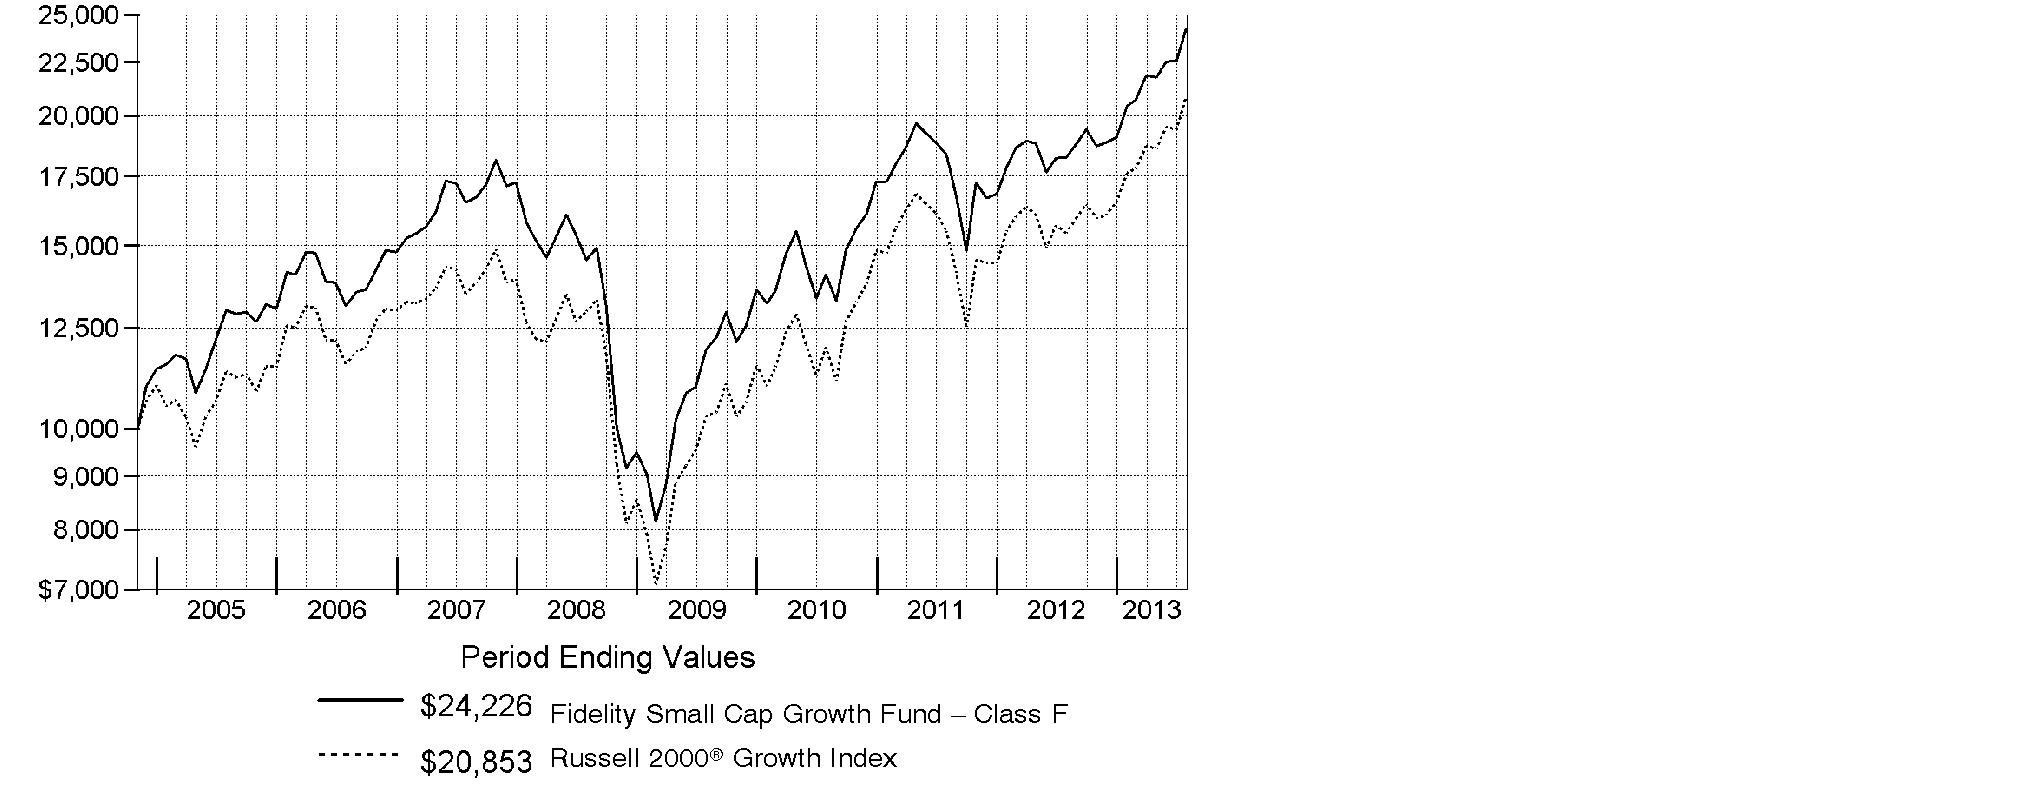
Annual Report
Market Recap: The bull run in U.S. stocks comfortably settled into a fifth year, as major equity benchmarks ripped through records during the 12 months ending July 31, 2013. Gains were fueled by a generally improving global economy and accommodative monetary policies worldwide. The tone was positive for most of the year, based largely on stronger U.S. economic data, including employment, housing and consumer sentiment. Setting a series of new highs along the way, the broad-based S&P 500® Index rose an impressive 25.00% for the 12 months, while the blue-chip-laden Dow Jones Industrial AverageSM also moved into record territory en route to a 22.36% gain. The growth-oriented Nasdaq Composite Index® had a similarly strong run, advancing 25.15%. During the year, markets were resilient amid intermittent volatility over debt woes in Europe, the 2012 U.S. presidential election and year-end Congressional gridlock over the federal budget. In mid-to-late June, concern arose about the U.S. Federal Reserve possibly tapering its sustaining bond-buying strategy - which prompted a brief, but steep, market sell-off. However, investors' continued quest for yield and the Fed's pledge to keep buying bonds until the economy showed significant improvement overpowered the uncertainty and helped equities climb notably higher in July to close the period on a strong note.
Comments from Patrick Venanzi, Portfolio Manager of Fidelity® Small Cap Growth Fund: For the year, the fund's Class F shares rose 33.00%, lagging the 35.39% gain of the Russell 2000® Growth Index. I aim to buy small-cap stocks with above-average growth opportunities at reasonable prices. Along with the market, the fund did very well in absolute terms, but lagged its benchmark. Given the longer-term focus and the quality bias of my investments, the fund sometimes trails the index during the market's strongest short-term periods. The fund's cash stake of roughly 4%, on average, during the past year weighed on relative performance, and a non-index position in Mellanox Technologies, a maker of data transfer and storage products, was the biggest individual detractor. Online health insurance provider eHealth was another miss for the fund, due to untimely ownership, and I sold both Mellanox and eHealth by period end. On the plus side, specialty furniture and electronics retailer Conn's was our top relative contributor, with its stock benefiting as a proactive management team effectively revamped stores, offering higher-quality products and customer-friendly financing options.
The views expressed above reflect those of the portfolio manager(s) only through the end of the period as stated on the cover of this report and do not necessarily represent the views of Fidelity or any other person in the Fidelity organization. Any such views are subject to change at any time based upon market or other conditions and Fidelity disclaims any responsibility to update such views. These views may not be relied on as investment advice and, because investment decisions for a Fidelity fund are based on numerous factors, may not be relied on as an indication of trading intent on behalf of any Fidelity fund.
Annual Report
Shareholder Expense Example
As a shareholder of the Fund, you incur two types of costs: (1) transaction costs, including sales charges (loads) on purchase payments or redemption proceeds, redemption fees and (2) ongoing costs, including management fees, distribution and/or service (12b-1) fees and other Fund expenses. This Example is intended to help you understand your ongoing costs (in dollars) of investing in the Fund and to compare these costs with the ongoing costs of investing in other mutual funds.
The Example is based on an investment of $1,000 invested at the beginning of the period and held for the entire period (February 1, 2013 to July 31, 2013).
Actual Expenses
The first line of the accompanying table for each class of the Fund provides information about actual account values and actual expenses. You may use the information in this line, together with the amount you invested, to estimate the expenses that you paid over the period. Simply divide your account value by $1,000.00 (for example, an $8,600 account value divided by $1,000.00 = 8.6), then multiply the result by the number in the first line for a class of the Fund under the heading entitled "Expenses Paid During Period" to estimate the expenses you paid on your account during this period. A small balance maintenance fee of $12.00 that is charged once a year may apply for certain accounts with a value of less than $2,000. This fee is not included in the table below. If it was, the estimate of expenses you paid during the period would be higher, and your ending account value lower, by this amount. In addition, the Fund, as a shareholder in the underlying Fidelity Central Funds, will indirectly bear its pro-rata share of the fees and expenses incurred by the underlying Fidelity Central Funds. These fees and expenses are not included in the Fund's annualized expense ratio used to calculate the expense estimate in the table below.
Hypothetical Example for Comparison Purposes
The second line of the accompanying table for each class of the Fund provides information about hypothetical account values and hypothetical expenses based on a Class' actual expense ratio and an assumed rate of return of 5% per year before expenses, which is not the Class' actual return. The hypothetical account values and expenses may not be used to estimate the actual ending account balance or expenses you paid for the period. You may use this information to compare the ongoing costs of investing in the Fund and other funds. To do so, compare this 5% hypothetical example with the 5% hypothetical examples that appear in the shareholder reports of the other funds. A small balance maintenance fee of $12.00 that is charged once a year may apply for certain accounts with a value of less than $2,000. This fee is not included in the table below. If it was, the estimate of expenses you paid during the period would be higher, and your ending account value lower, by this amount. In addition, the Fund, as a shareholder in the underlying Fidelity Central Funds, will indirectly bear its pro-rata share of the fees and expenses incurred by the underlying Fidelity Central Funds. These fees and expenses are not included in the Fund's annualized expense ratio used to calculate the expense estimate in the table below.
Please note that the expenses shown in the table are meant to highlight your ongoing costs only and do not reflect any transaction costs. Therefore, the second line of the table is useful in comparing ongoing costs only, and will not help you determine the relative total costs of owning different funds. In addition, if these transactional costs were included, your costs would have been higher.
Annual Report
| Annualized
Expense Ratio B | Beginning
Account Value
February 1, 2013 | Ending
Account Value
July 31, 2013 | Expenses Paid
During Period*
February 1, 2013
to July 31, 2013 |
Class A | 1.22% | | | |
Actual | | $ 1,000.00 | $ 1,183.60 | $ 6.61 |
HypotheticalA | | $ 1,000.00 | $ 1,018.74 | $ 6.11 |
Class T | 1.48% | | | |
Actual | | $ 1,000.00 | $ 1,181.70 | $ 8.01 |
HypotheticalA | | $ 1,000.00 | $ 1,017.46 | $ 7.40 |
Class B | 1.97% | | | |
Actual | | $ 1,000.00 | $ 1,178.90 | $ 10.64 |
HypotheticalA | | $ 1,000.00 | $ 1,015.03 | $ 9.84 |
Class C | 1.97% | | | |
Actual | | $ 1,000.00 | $ 1,179.20 | $ 10.64 |
HypotheticalA | | $ 1,000.00 | $ 1,015.03 | $ 9.84 |
Small Cap Growth | .88% | | | |
Actual | | $ 1,000.00 | $ 1,186.20 | $ 4.77 |
HypotheticalA | | $ 1,000.00 | $ 1,020.43 | $ 4.41 |
Class F | .67% | | | |
Actual | | $ 1,000.00 | $ 1,187.00 | $ 3.63 |
HypotheticalA | | $ 1,000.00 | $ 1,021.47 | $ 3.36 |
Institutional Class | .90% | | | |
Actual | | $ 1,000.00 | $ 1,185.80 | $ 4.88 |
HypotheticalA | | $ 1,000.00 | $ 1,020.33 | $ 4.51 |
A 5% return per year before expenses
B Annualized expense ratio reflects expenses net of applicable fee waivers.
* Expenses are equal to each Class' annualized expense ratio, multiplied by the average account value over the period, multiplied by 181/365 (to reflect the one-half year period).
Annual Report
Investment Changes (Unaudited)
Top Ten Stocks as of July 31, 2013 |
| % of fund's
net assets | % of fund's net assets
6 months ago |
NIC, Inc. | 1.6 | 0.0 |
Grand Canyon Education, Inc. | 1.5 | 0.9 |
Aspen Technology, Inc. | 1.4 | 1.7 |
InvenSense, Inc. | 1.3 | 1.0 |
KAR Auction Services, Inc. | 1.3 | 0.0 |
CommVault Systems, Inc. | 1.3 | 1.5 |
FEI Co. | 1.3 | 0.9 |
Service Corp. International | 1.3 | 0.0 |
HSN, Inc. | 1.3 | 1.7 |
athenahealth, Inc. | 1.2 | 0.0 |
| 13.5 | |
Top Five Market Sectors as of July 31, 2013 |
| % of fund's
net assets | % of fund's net assets
6 months ago |
Information Technology | 25.8 | 19.2 |
Health Care | 20.9 | 18.8 |
Industrials | 17.0 | 15.5 |
Consumer Discretionary | 16.0 | 17.2 |
Financials | 8.4 | 7.3 |
Asset Allocation (% of fund's net assets) |
As of July 31, 2013* | As of January 31, 2013** |
| Stocks 97.9% | | | Stocks 95.5% | |
| Short-Term
Investments and
Net Other Assets
(Liabilities) 2.1% | | | Short-Term
Investments and
Net Other Assets
(Liabilities) 4.5% | |
* Foreign investments | 4.0% | | ** Foreign investments | 6.6% | |

Annual Report
Investments July 31, 2013
Showing Percentage of Net Assets
Common Stocks - 97.9% |
| Shares | | Value |
CONSUMER DISCRETIONARY - 16.0% |
Auto Components - 0.5% |
Tenneco, Inc. (a) | 250,000 | | $ 12,082,500 |
Diversified Consumer Services - 2.8% |
Grand Canyon Education, Inc. (a) | 987,953 | | 33,412,570 |
Service Corp. International | 1,510,000 | | 28,644,700 |
| | 62,057,270 |
Hotels, Restaurants & Leisure - 4.4% |
AFC Enterprises, Inc. (a) | 400,231 | | 14,728,501 |
Bloomin' Brands, Inc. | 500,000 | | 11,800,000 |
Jack in the Box, Inc. (a) | 550,000 | | 22,049,500 |
Papa John's International, Inc. (a) | 300,000 | | 20,058,000 |
Sonic Corp. (a) | 912,000 | | 14,017,440 |
Texas Roadhouse, Inc. Class A | 700,000 | | 17,108,000 |
| | 99,761,441 |
Household Durables - 1.0% |
Jarden Corp. (a) | 375,000 | | 17,051,250 |
Universal Electronics, Inc. (a) | 199,089 | | 6,137,914 |
| | 23,189,164 |
Internet & Catalog Retail - 1.3% |
HSN, Inc. | 475,000 | | 28,528,500 |
Leisure Equipment & Products - 1.0% |
Brunswick Corp. | 570,000 | | 21,517,500 |
Media - 0.9% |
Cinemark Holdings, Inc. | 700,000 | | 20,384,000 |
Specialty Retail - 1.3% |
Conn's, Inc. (a) | 194,947 | | 12,597,475 |
Tile Shop Holdings, Inc. (a) | 601,100 | | 17,089,273 |
| | 29,686,748 |
Textiles, Apparel & Luxury Goods - 2.8% |
G-III Apparel Group Ltd. (a) | 470,000 | | 24,186,200 |
Steven Madden Ltd. (a) | 451,400 | | 23,210,988 |
Wolverine World Wide, Inc. | 250,000 | | 14,377,500 |
| | 61,774,688 |
TOTAL CONSUMER DISCRETIONARY | | 358,981,811 |
Common Stocks - continued |
| Shares | | Value |
CONSUMER STAPLES - 2.4% |
Food Products - 1.8% |
J&J Snack Foods Corp. | 200,000 | | $ 15,936,000 |
WhiteWave Foods Co. (d) | 1,347,200 | | 25,179,168 |
| | 41,115,168 |
Personal Products - 0.6% |
Inter Parfums, Inc. | 392,925 | | 12,958,667 |
TOTAL CONSUMER STAPLES | | 54,073,835 |
ENERGY - 4.9% |
Energy Equipment & Services - 2.7% |
Atwood Oceanics, Inc. (a) | 185,000 | | 10,422,900 |
Dril-Quip, Inc. (a) | 170,000 | | 15,454,700 |
Essential Energy Services Ltd. | 2,232,100 | | 5,650,336 |
Western Energy Services Corp. | 1,330,000 | | 10,825,431 |
Xtreme Drilling & Coil Services Corp. (a)(e) | 4,100,000 | | 14,769,740 |
Zedi, Inc. (a)(e) | 7,178,500 | | 4,053,675 |
| | 61,176,782 |
Oil, Gas & Consumable Fuels - 2.2% |
EPL Oil & Gas, Inc. (a) | 300,000 | | 9,648,000 |
Rosetta Resources, Inc. (a) | 380,000 | | 17,331,800 |
Tesoro Logistics LP | 150,000 | | 8,023,500 |
Whitecap Resources, Inc. (d) | 1,100,000 | | 11,823,581 |
Whitecap Resources, Inc. rights 8/30/13 (a) | 100,000 | | 1,077,792 |
| | 47,904,673 |
TOTAL ENERGY | | 109,081,455 |
FINANCIALS - 8.4% |
Capital Markets - 0.6% |
Virtus Investment Partners, Inc. (a) | 73,084 | | 13,630,166 |
Commercial Banks - 2.1% |
BBCN Bancorp, Inc. | 1,340,000 | | 19,577,400 |
City National Corp. | 320,000 | | 22,249,600 |
Pacific Premier Bancorp, Inc. (a) | 385,000 | | 5,016,550 |
| | 46,843,550 |
Insurance - 3.7% |
Amerisafe, Inc. | 492,900 | | 17,611,317 |
FBL Financial Group, Inc. Class A | 148,825 | | 6,582,530 |
Primerica, Inc. | 480,000 | | 19,699,200 |
Common Stocks - continued |
| Shares | | Value |
FINANCIALS - continued |
Insurance - continued |
ProAssurance Corp. | 430,000 | | $ 23,017,900 |
StanCorp Financial Group, Inc. | 300,000 | | 15,927,000 |
| | 82,837,947 |
Real Estate Investment Trusts - 1.3% |
Cousins Properties, Inc. | 1,500,000 | | 15,375,000 |
Piedmont Office Realty Trust, Inc. Class A | 800,000 | | 14,472,000 |
| | 29,847,000 |
Real Estate Management & Development - 0.7% |
Howard Hughes Corp. (a) | 145,000 | | 15,835,450 |
TOTAL FINANCIALS | | 188,994,113 |
HEALTH CARE - 20.9% |
Biotechnology - 8.1% |
Alkermes PLC (a) | 175,500 | | 5,893,290 |
ARIAD Pharmaceuticals, Inc. (a) | 260,000 | | 4,830,800 |
Array BioPharma, Inc. (a) | 1,120,000 | | 7,459,200 |
Astex Pharmaceuticals, Inc. (a) | 1,250,000 | | 6,537,500 |
BioMarin Pharmaceutical, Inc. (a) | 120,000 | | 7,758,000 |
Celldex Therapeutics, Inc. (a) | 600,000 | | 12,288,000 |
ChemoCentryx, Inc. (a) | 250,000 | | 3,495,000 |
Chimerix, Inc. | 250,000 | | 5,685,000 |
Cubist Pharmaceuticals, Inc. (a) | 194,762 | | 12,139,515 |
Hyperion Therapeutics, Inc. | 200,000 | | 5,010,000 |
Infinity Pharmaceuticals, Inc. (a) | 228,236 | | 4,834,038 |
Insmed, Inc. (a)(d) | 666,400 | | 7,403,704 |
Isis Pharmaceuticals, Inc. (a) | 447,257 | | 12,903,364 |
Medivation, Inc. (a) | 160,000 | | 9,259,200 |
Novavax, Inc. (a) | 2,100,000 | | 5,649,000 |
OncoGenex Pharmaceuticals, Inc. (a) | 116,487 | | 1,138,078 |
Stemline Therapeutics, Inc. | 154,000 | | 4,333,560 |
Sunesis Pharmaceuticals, Inc. (a)(d) | 1,097,300 | | 5,574,284 |
Synageva BioPharma Corp. (a) | 170,000 | | 8,177,000 |
Synergy Pharmaceuticals, Inc. (a)(d) | 800,000 | | 3,600,000 |
TESARO, Inc. (a) | 148,800 | | 5,077,056 |
Theravance, Inc. (a)(d) | 469,000 | | 18,084,640 |
Threshold Pharmaceuticals, Inc. (a) | 1,072,634 | | 5,813,676 |
Vanda Pharmaceuticals, Inc. (a) | 500,000 | | 5,830,000 |
XOMA Corp. (a)(d) | 2,500,000 | | 13,575,000 |
| | 182,348,905 |
Common Stocks - continued |
| Shares | | Value |
HEALTH CARE - continued |
Health Care Equipment & Supplies - 4.7% |
Align Technology, Inc. (a) | 595,798 | | $ 25,643,146 |
ICU Medical, Inc. (a) | 191,000 | | 13,692,790 |
NxStage Medical, Inc. (a) | 272,400 | | 3,530,304 |
Sirona Dental Systems, Inc. (a) | 125,000 | | 8,825,000 |
Steris Corp. | 581,000 | | 26,156,620 |
Teleflex, Inc. | 189,300 | | 15,036,099 |
The Spectranetics Corp. (a) | 650,000 | | 11,713,000 |
| | 104,596,959 |
Health Care Providers & Services - 4.1% |
BioScrip, Inc. (a) | 1,100,000 | | 17,875,000 |
Centene Corp. (a) | 330,000 | | 18,305,100 |
MEDNAX, Inc. (a) | 122,900 | | 11,972,918 |
Molina Healthcare, Inc. (a)(d) | 600,000 | | 22,272,000 |
MWI Veterinary Supply, Inc. (a) | 143,400 | | 20,387,178 |
| | 90,812,196 |
Health Care Technology - 2.2% |
athenahealth, Inc. (a)(d) | 250,000 | | 27,987,500 |
Medidata Solutions, Inc. (a) | 233,948 | | 21,647,208 |
| | 49,634,708 |
Life Sciences Tools & Services - 0.8% |
Bruker BioSciences Corp. (a) | 1,010,000 | | 18,099,200 |
Pharmaceuticals - 1.0% |
Biodelivery Sciences International, Inc. (a)(d) | 1,257,084 | | 5,430,603 |
Pacira Pharmaceuticals, Inc. (a) | 220,000 | | 7,464,600 |
ViroPharma, Inc. (a) | 270,000 | | 9,266,400 |
| | 22,161,603 |
TOTAL HEALTH CARE | | 467,653,571 |
INDUSTRIALS - 17.0% |
Aerospace & Defense - 2.8% |
Esterline Technologies Corp. (a) | 150,000 | | 12,216,000 |
Teledyne Technologies, Inc. (a) | 305,700 | | 24,507,969 |
Triumph Group, Inc. | 330,000 | | 25,891,800 |
| | 62,615,769 |
Airlines - 0.7% |
Spirit Airlines, Inc. (a) | 500,000 | | 16,525,000 |
Building Products - 0.9% |
A.O. Smith Corp. | 480,688 | | 19,862,028 |
Common Stocks - continued |
| Shares | | Value |
INDUSTRIALS - continued |
Commercial Services & Supplies - 1.3% |
KAR Auction Services, Inc. | 1,140,000 | | $ 29,001,600 |
Construction & Engineering - 1.6% |
AECOM Technology Corp. (a) | 300,000 | | 10,170,000 |
EMCOR Group, Inc. | 350,000 | | 14,448,000 |
Tutor Perini Corp. (a) | 554,285 | | 10,963,757 |
| | 35,581,757 |
Electrical Equipment - 2.1% |
EnerSys | 480,000 | | 25,401,600 |
Generac Holdings, Inc. | 409,200 | | 17,738,820 |
Preformed Line Products Co. | 60,306 | | 4,399,323 |
| | 47,539,743 |
Machinery - 5.4% |
Actuant Corp. Class A | 473,100 | | 16,705,161 |
Harsco Corp. | 445,000 | | 11,463,200 |
Manitowoc Co., Inc. | 900,000 | | 18,477,000 |
Oshkosh Truck Corp. (a) | 250,000 | | 11,205,000 |
Standex International Corp. | 301,838 | | 17,817,497 |
TriMas Corp. (a) | 605,298 | | 22,414,185 |
Wabtec Corp. | 384,600 | | 22,329,876 |
| | 120,411,919 |
Professional Services - 0.0% |
Nihon M&A Center, Inc. | 612 | | 40,942 |
Trading Companies & Distributors - 2.2% |
Applied Industrial Technologies, Inc. | 316,818 | | 16,525,227 |
Watsco, Inc. | 229,000 | | 21,377,150 |
WESCO International, Inc. (a) | 150,000 | | 11,367,000 |
| | 49,269,377 |
TOTAL INDUSTRIALS | | 380,848,135 |
INFORMATION TECHNOLOGY - 25.8% |
Communications Equipment - 0.8% |
Plantronics, Inc. | 380,000 | | 17,666,200 |
Computers & Peripherals - 1.9% |
Cray, Inc. (a) | 1,032,200 | | 23,916,074 |
Electronics for Imaging, Inc. (a) | 670,000 | | 20,120,100 |
| | 44,036,174 |
Electronic Equipment & Components - 4.6% |
FEI Co. | 370,000 | | 28,656,500 |
Common Stocks - continued |
| Shares | | Value |
INFORMATION TECHNOLOGY - continued |
Electronic Equipment & Components - continued |
FLIR Systems, Inc. | 600,000 | | $ 19,482,000 |
InvenSense, Inc. (a)(d) | 1,720,000 | | 30,409,600 |
Neonode, Inc. (a)(d) | 1,617,122 | | 12,597,380 |
Parametric Sound Corp. (a)(d)(e) | 666,810 | | 11,382,447 |
| | 102,527,927 |
Internet Software & Services - 7.8% |
Angie's List, Inc. (a)(d) | 1,055,703 | | 23,246,580 |
Blucora, Inc. (a) | 621,143 | | 12,422,860 |
Cornerstone OnDemand, Inc. (a) | 530,000 | | 23,341,200 |
Demandware, Inc. (a)(d) | 353,439 | | 15,699,760 |
E2open, Inc. (d) | 1,176,594 | | 23,390,689 |
Move, Inc. (a) | 820,000 | | 11,389,800 |
NIC, Inc. | 1,893,704 | | 34,882,028 |
SciQuest, Inc. (a) | 294,372 | | 7,259,214 |
Stamps.com, Inc. (a) | 570,281 | | 22,731,401 |
| | 174,363,532 |
IT Services - 2.7% |
Euronet Worldwide, Inc. (a) | 300,000 | | 11,043,000 |
EVERTEC, Inc. | 600,000 | | 14,340,000 |
Genpact Ltd. | 1,050,000 | | 21,409,500 |
Sapient Corp. (a) | 1,000,000 | | 13,710,000 |
| | 60,502,500 |
Semiconductors & Semiconductor Equipment - 0.8% |
PDF Solutions, Inc. (a) | 886,056 | | 18,181,869 |
Software - 7.2% |
Aspen Technology, Inc. (a) | 962,200 | | 31,309,988 |
CommVault Systems, Inc. (a) | 340,000 | | 28,706,200 |
Destiny Media Technologies, Inc. (a) | 1,620,269 | | 3,596,997 |
Guidewire Software, Inc. (a) | 434,816 | | 19,027,548 |
Interactive Intelligence Group, Inc. (a) | 200,000 | | 11,360,000 |
Synopsys, Inc. (a) | 540,000 | | 20,001,600 |
Tyler Technologies, Inc. (a) | 308,725 | | 23,037,060 |
Ultimate Software Group, Inc. (a) | 175,000 | | 23,677,500 |
| | 160,716,893 |
TOTAL INFORMATION TECHNOLOGY | | 577,995,095 |
Common Stocks - continued |
| Shares | | Value |
MATERIALS - 2.0% |
Chemicals - 0.7% |
Cytec Industries, Inc. | 210,000 | | $ 16,359,000 |
Containers & Packaging - 0.7% |
Graphic Packaging Holding Co. (a) | 1,700,000 | | 14,620,000 |
Paper & Forest Products - 0.6% |
P.H. Glatfelter Co. | 550,000 | | 14,558,500 |
TOTAL MATERIALS | | 45,537,500 |
TELECOMMUNICATION SERVICES - 0.5% |
Diversified Telecommunication Services - 0.5% |
inContact, Inc. (a) | 1,200,000 | | 10,176,000 |
TOTAL COMMON STOCKS (Cost $1,768,172,071) |
2,193,341,515
|
Money Market Funds - 8.8% |
| | | |
Fidelity Cash Central Fund, 0.11% (b) | 75,334,289 | | 75,334,289 |
Fidelity Securities Lending Cash Central Fund, 0.12% (b)(c) | 121,749,605 | | 121,749,605 |
TOTAL MONEY MARKET FUNDS (Cost $197,083,894) |
197,083,894
|
TOTAL INVESTMENT PORTFOLIO - 106.7% (Cost $1,965,255,965) | | 2,390,425,409 |
NET OTHER ASSETS (LIABILITIES) - (6.7)% | | (150,019,314) |
NET ASSETS - 100% | $ 2,240,406,095 |
Legend |
(a) Non-income producing |
(b) Affiliated fund that is generally available only to investment companies and other accounts managed by Fidelity Investments. The rate quoted is the annualized seven-day yield of the fund at period end. A complete unaudited listing of the fund's holdings as of its most recent quarter end is available upon request. In addition, each Fidelity Central Fund's financial statements, which are not covered by the Fund's Report of Independent Registered Public Accounting Firm, are available on the SEC's website or upon request. |
(c) Investment made with cash collateral received from securities on loan. |
(d) Security or a portion of the security is on loan at period end. |
(e) Affiliated company |
Affiliated Central Funds |
Information regarding fiscal year to date income earned by the Fund from investments in Fidelity Central Funds is as follows: |
Fund | Income earned |
Fidelity Cash Central Fund | $ 109,835 |
Fidelity Securities Lending Cash Central Fund | 2,002,990 |
Total | $ 2,112,825 |
Other Affiliated Issuers |
An affiliated company is a company in which the Fund has ownership of at least 5% of the voting securities. Fiscal year to date transactions with companies which are or were affiliates are as follows: |
Affiliate | Value,
beginning of
period | Purchases | Sales
Proceeds | Dividend
Income | Value,
end of
period |
Neonode, Inc. | $ 6,969,000 | $ 5,854,520 | $ 5,076,631 | $ - | $ - |
Parametric Sound Corp. | 2,428,413 | 5,644,334 | 1,370,378 | - | 11,382,447 |
Telular Corp. | 4,715,000 | 3,371,313 | 10,661,344 | 259,000 | - |
US Home Systems, Inc. | 6,604,750 | - | 8,975,299 | - | - |
Xtreme Drilling & Coil Services Corp. (144A) | - | 178,443 | 201,743 | - | - |
Xtreme Drilling & Coil Services Corp. | 6,786,658 | - | - | - | 14,769,740 |
Zedi, Inc. | 3,905,172 | 2,997,316 | 1,070,631 | - | 4,053,675 |
Total | $ 31,408,993 | $ 18,045,926 | $ 27,356,026 | $ 259,000 | $ 30,205,862 |
Other Information |
All investments are categorized as Level 1 under the Fair Value Hierarchy. The inputs or methodology used for valuing securities may not be an indication of the risk associated with investing in those securities. For more information on valuation inputs, please refer to the Investment Valuation section in the accompanying Notes to Financial Statements. |
See accompanying notes which are an integral part of the financial statements.
Annual Report
Statement of Assets and Liabilities
| July 31, 2013 |
| | |
Assets | | |
Investment in securities, at value (including securities loaned of $120,973,392) - See accompanying schedule: Unaffiliated issuers (cost $1,744,211,544) | $ 2,163,135,653 | |
Fidelity Central Funds (cost $197,083,894) | 197,083,894 | |
Other affiliated issuers (cost $23,960,527) | 30,205,862 | |
Total Investments (cost $1,965,255,965) | | $ 2,390,425,409 |
Receivable for investments sold | | 35,301,694 |
Receivable for fund shares sold | | 2,852,120 |
Dividends receivable | | 415,342 |
Distributions receivable from Fidelity Central Funds | | 231,543 |
Other receivables | | 35,774 |
Total assets | | 2,429,261,882 |
| | |
Liabilities | | |
Payable for investments purchased | $ 62,714,735 | |
Payable for fund shares redeemed | 2,747,629 | |
Accrued management fee | 1,207,297 | |
Distribution and service plan fees payable | 58,359 | |
Other affiliated payables | 312,392 | |
Other payables and accrued expenses | 65,770 | |
Collateral on securities loaned, at value | 121,749,605 | |
Total liabilities | | 188,855,787 |
| | |
Net Assets | | $ 2,240,406,095 |
Net Assets consist of: | | |
Paid in capital | | $ 1,568,067,724 |
Accumulated undistributed net realized gain (loss) on investments and foreign currency transactions | | 247,173,320 |
Net unrealized appreciation (depreciation) on investments and assets and liabilities in foreign currencies | | 425,165,051 |
Net Assets | | $ 2,240,406,095 |
See accompanying notes which are an integral part of the financial statements.
Annual Report
Financial Statements - continued
Statement of Assets and Liabilities - continued
| July 31, 2013 |
| | |
Calculation of Maximum Offering Price Class A:
Net Asset Value and redemption price per share ($74,977,899 ÷ 3,812,892 shares) | | $ 19.66 |
| | |
Maximum offering price per share (100/94.25 of $19.66) | | $ 20.86 |
Class T:
Net Asset Value and redemption price per share ($34,686,382 ÷ 1,789,472 shares) | | $ 19.38 |
| | |
Maximum offering price per share (100/96.50 of $19.38) | | $ 20.08 |
Class B:
Net Asset Value and offering price per share ($3,485,507 ÷ 186,863 shares)A | | $ 18.65 |
| | |
Class C:
Net Asset Value and offering price per share ($32,755,709 ÷ 1,759,550 shares)A | | $ 18.62 |
| | |
Small Cap Growth:
Net Asset Value, offering price and redemption price per share ($1,315,659,224 ÷ 65,562,467 shares) | | $ 20.07 |
| | |
Class F:
Net Asset Value, offering price and redemption price per share ($727,683,474 ÷ 35,934,773 shares) | | $ 20.25 |
| | |
Institutional Class:
Net Asset Value, offering price and redemption price per share ($51,157,900 ÷ 2,545,203 shares) | | $ 20.10 |
A Redemption price per share is equal to net asset value less any applicable contingent deferred sales charge.
See accompanying notes which are an integral part of the financial statements.
Annual Report
Statement of Operations
| Year ended July 31, 2013 |
| | |
Investment Income | | |
Dividends (including $259,000 earned from other affiliated issuers) | | $ 17,072,216 |
Interest | | 880 |
Income from Fidelity Central Funds (including $2,002,990 from security lending) | | 2,112,825 |
Total income | | 19,185,921 |
| | |
Expenses | | |
Management fee
Basic fee | $ 14,065,171 | |
Performance adjustment | (1,254,701) | |
Transfer agent fees | 3,015,628 | |
Distribution and service plan fees | 609,395 | |
Accounting and security lending fees | 622,239 | |
Custodian fees and expenses | 73,226 | |
Independent trustees' compensation | 12,359 | |
Registration fees | 95,429 | |
Audit | 58,673 | |
Legal | 6,422 | |
Interest | 674 | |
Miscellaneous | 18,337 | |
Total expenses before reductions | 17,322,852 | |
Expense reductions | (322,128) | 17,000,724 |
Net investment income (loss) | | 2,185,197 |
Realized and Unrealized Gain (Loss) Net realized gain (loss) on: | | |
Investment securities: | | |
Unaffiliated issuers | 326,344,850 | |
Other affiliated issuers | 925,631 | |
Foreign currency transactions | 20,901 | |
Total net realized gain (loss) | | 327,291,382 |
Change in net unrealized appreciation (depreciation) on: Investment securities | 244,672,948 | |
Assets and liabilities in foreign currencies | 6,602 | |
Total change in net unrealized appreciation (depreciation) | | 244,679,550 |
Net gain (loss) | | 571,970,932 |
Net increase (decrease) in net assets resulting from operations | | $ 574,156,129 |
See accompanying notes which are an integral part of the financial statements.
Annual Report
Financial Statements - continued
Statement of Changes in Net Assets
| Year ended
July 31,
2013 | Year ended
July 31,
2012 |
Increase (Decrease) in Net Assets | | |
Operations | | |
Net investment income (loss) | $ 2,185,197 | $ (2,581,285) |
Net realized gain (loss) | 327,291,382 | 84,159,524 |
Change in net unrealized appreciation (depreciation) | 244,679,550 | (104,802,589) |
Net increase (decrease) in net assets resulting
from operations | 574,156,129 | (23,224,350) |
Distributions to shareholders from net realized gain | (122,560,447) | (34,799,429) |
Share transactions - net increase (decrease) | (58,479,174) | 61,802,637 |
Redemption fees | 117,383 | 255,125 |
Total increase (decrease) in net assets | 393,233,891 | 4,033,983 |
| | |
Net Assets | | |
Beginning of period | 1,847,172,204 | 1,843,138,221 |
End of period (including accumulated net investment loss of $0 and accumulated net investment loss of $1,442,758, respectively) | $ 2,240,406,095 | $ 1,847,172,204 |
See accompanying notes which are an integral part of the financial statements.
Annual Report
Financial Highlights - Class A
Years ended July 31, | 2013 | 2012 | 2011 | 2010 | 2009 |
Selected Per-Share Data | | | | | |
Net asset value, beginning of period | $ 15.87 | $ 16.42 | $ 12.66 | $ 10.79 | $ 13.20 |
Income from Investment Operations | | | | | |
Net investment income (loss) C | (.04) | (.07) F | (.07) G | (.07) H | (.06) |
Net realized and unrealized gain (loss) | 4.87 | (.16) | 3.84 | 1.94 | (2.35) |
Total from investment operations | 4.83 | (.23) | 3.77 | 1.87 | (2.41) |
Distributions from net realized gain | (1.04) | (.32) | (.01) I | - | - |
Redemption fees added to paid in capital C, K | - | - | - | - | - |
Net asset value, end of period | $ 19.66 | $ 15.87 | $ 16.42 | $ 12.66 | $ 10.79 |
Total Return A, B | 32.20% | (1.14)% | 29.78% | 17.33% | (18.26)% |
Ratios to Average Net Assets D, J | | | | | |
Expenses before reductions | 1.24% | 1.35% | 1.25% | 1.35% | 1.33% |
Expenses net of fee waivers, if any | 1.24% | 1.35% | 1.25% | 1.35% | 1.33% |
Expenses net of all reductions | 1.22% | 1.34% | 1.23% | 1.34% | 1.33% |
Net investment income (loss) | (.26)% | (.49)% F | (.47)% G | (.56)% H | (.64)% |
Supplemental Data | | | | | |
Net assets, end of period (000 omitted) | $ 74,978 | $ 59,684 | $ 67,272 | $ 50,620 | $ 40,211 |
Portfolio turnover rate E | 142% | 150% | 106% | 105% | 150% |
A Total returns would have been lower if certain expenses had not been reduced during the applicable periods shown.
B Total returns do not include the effect of the sales charges.
C Calculated based on average shares outstanding during the period.
D Fees and expenses of any underlying Fidelity Central Funds are not included in the Fund's expense ratio. The Fund indirectly bears its proportionate share of the expenses of any underlying Fidelity Central Funds.
E Amount does not include the portfolio activity of any underlying Fidelity Central Funds.
F Investment income per share reflects a large, non-recurring dividend which amounted to $.01 per share. Excluding this non-recurring dividend, the ratio of net investment income (loss) to average net assets would have been (.57)%.
G Investment income per share reflects a large, non-recurring dividend which amounted to $.02 per share. Excluding this non-recurring dividend, the ratio of net investment income (loss) to average net assets would have been (.61)%.
H Investment income per share reflects a large, non-recurring dividend which amounted to $.01 per share. Excluding this non-recurring dividend, the ratio of net investment income (loss) to average net assets would have been (.67)%.
I The amounts shown reflect certain reclassifications related to book to tax differences that were made in the year shown.
J Expense ratios reflect operating expenses of the class. Expenses before reductions do not reflect amounts reimbursed by the investment adviser or reductions from brokerage service arrangements or reductions from other expense offset arrangements and do not represent the amount paid by the class during periods when reimbursements or reductions occur. Expenses net of fee waivers reflect expenses after reimbursement by the investment adviser but prior to reductions from brokerage service arrangements or other expense offset arrangements. Expenses net of all reductions represent the net expenses paid by the class.
K Amount represents less than $.01 per share.
See accompanying notes which are an integral part of the financial statements.
Annual Report
Financial Highlights - Class T
Years ended July 31, | 2013 | 2012 | 2011 | 2010 | 2009 |
Selected Per-Share Data | | | | | |
Net asset value, beginning of period | $ 15.68 | $ 16.27 | $ 12.57 | $ 10.74 | $ 13.17 |
Income from Investment Operations | | | | | |
Net investment income (loss) C | (.09) | (.11) F | (.11) G | (.10) H | (.09) |
Net realized and unrealized gain (loss) | 4.82 | (.16) | 3.81 | 1.93 | (2.34) |
Total from investment operations | 4.73 | (.27) | 3.70 | 1.83 | (2.43) |
Distributions from net realized gain | (1.03) | (.32) | - | - | - |
Redemption fees added to paid in capital C, J | - | - | - | - | - |
Net asset value, end of period | $ 19.38 | $ 15.68 | $ 16.27 | $ 12.57 | $ 10.74 |
Total Return A, B | 31.87% | (1.41)% | 29.44% | 17.04% | (18.45)% |
Ratios to Average Net Assets D, I | | | | | |
Expenses before reductions | 1.49% | 1.61% | 1.50% | 1.61% | 1.60% |
Expenses net of fee waivers, if any | 1.49% | 1.61% | 1.50% | 1.61% | 1.60% |
Expenses net of all reductions | 1.48% | 1.60% | 1.49% | 1.60% | 1.59% |
Net investment income (loss) | (.52)% | (.74)% F | (.73)% G | (.82)% H | (.91)% |
Supplemental Data | | | | | |
Net assets, end of period (000 omitted) | $ 34,686 | $ 27,658 | $ 30,764 | $ 23,930 | $ 21,533 |
Portfolio turnover rate E | 142% | 150% | 106% | 105% | 150% |
A Total returns would have been lower if certain expenses had not been reduced during the applicable periods shown.
B Total returns do not include the effect of the sales charges.
C Calculated based on average shares outstanding during the period.
D Fees and expenses of any underlying Fidelity Central Funds are not included in the Fund's expense ratio. The Fund indirectly bears its proportionate share of the expenses of any underlying Fidelity Central Funds.
E Amount does not include the portfolio activity of any underlying Fidelity Central Funds.
F Investment income per share reflects a large, non-recurring dividend which amounted to $.01 per share. Excluding this non-recurring dividend, the ratio of net investment income (loss) to average net assets would have been (.83)%.
G Investment income per share reflects a large, non-recurring dividend which amounted to $.02 per share. Excluding this non-recurring dividend, the ratio of net investment income (loss) to average net assets would have been (.86)%.
H Investment income per share reflects a large, non-recurring dividend which amounted to $.01 per share. Excluding this non-recurring dividend, the ratio of net investment income (loss) to average net assets would have been (.93)%.
I Expense ratios reflect operating expenses of the class. Expenses before reductions do not reflect amounts reimbursed by the investment adviser or reductions from brokerage service arrangements or reductions from other expense offset arrangements and do not represent the amount paid by the class during periods when reimbursements or reductions occur. Expenses net of fee waivers reflect expenses after reimbursement by the investment adviser but prior to reductions from brokerage service arrangements or other expense offset arrangements. Expenses net of all reductions represent the net expenses paid by the class.
J Amount represents less than $.01 per share.
See accompanying notes which are an integral part of the financial statements.
Annual Report
Financial Highlights - Class B
Years ended July 31, | 2013 | 2012 | 2011 | 2010 | 2009 |
Selected Per-Share Data | | | | | |
Net asset value, beginning of period | $ 15.19 | $ 15.86 | $ 12.30 | $ 10.57 | $ 13.03 |
Income from Investment Operations | | | | | |
Net investment income (loss) C | (.16) | (.18) F | (.18) G | (.16) H | (.13) |
Net realized and unrealized gain (loss) | 4.64 | (.17) | 3.74 | 1.89 | (2.33) |
Total from investment operations | 4.48 | (.35) | 3.56 | 1.73 | (2.46) |
Distributions from net realized gain | (1.02) | (.32) | - | - | - |
Redemption fees added to paid in capital C, J | - | - | - | - | - |
Net asset value, end of period | $ 18.65 | $ 15.19 | $ 15.86 | $ 12.30 | $ 10.57 |
Total Return A, B | 31.25% | (1.96)% | 28.94% | 16.37% | (18.88)% |
Ratios to Average Net Assets D, I | | | | | |
Expenses before reductions | 1.99% | 2.10% | 2.00% | 2.11% | 2.08% |
Expenses net of fee waivers, if any | 1.99% | 2.10% | 2.00% | 2.11% | 2.08% |
Expenses net of all reductions | 1.97% | 2.09% | 1.98% | 2.09% | 2.08% |
Net investment income (loss) | (1.01)% | (1.23)% F | (1.22)% G | (1.32)% H | (1.39)% |
Supplemental Data | | | | | |
Net assets, end of period (000 omitted) | $ 3,486 | $ 4,123 | $ 5,295 | $ 5,142 | $ 4,171 |
Portfolio turnover rate E | 142% | 150% | 106% | 105% | 150% |
A Total returns would have been lower if certain expenses had not been reduced during the applicable periods shown.
B Total returns do not include the effect of the contingent deferred sales charge.
C Calculated based on average shares outstanding during the period.
D Fees and expenses of any underlying Fidelity Central Funds are not included in the Fund's expense ratio. The Fund indirectly bears its proportionate share of the expenses of any underlying Fidelity Central Funds.
E Amount does not include the portfolio activity of any underlying Fidelity Central Funds.
F Investment income per share reflects a large, non-recurring dividend which amounted to $.01 per share. Excluding this non-recurring dividend, the ratio of net investment income (loss) to average net assets would have been (1.32)%.
G Investment income per share reflects a large, non-recurring dividend which amounted to $.02 per share. Excluding this non-recurring dividend, the ratio of net investment income (loss) to average net assets would have been (1.36)%.
H Investment income per share reflects a large, non-recurring dividend which amounted to $.01 per share. Excluding this non-recurring dividend, the ratio of net investment income (loss) to average net assets would have been (1.42)%.
I Expense ratios reflect operating expenses of the class. Expenses before reductions do not reflect amounts reimbursed by the investment adviser or reductions from brokerage service arrangements or reductions from other expense offset arrangements and do not represent the amount paid by the class during periods when reimbursements or reductions occur. Expenses net of fee waivers reflect expenses after reimbursement by the investment adviser but prior to reductions from brokerage service arrangements or other expense offset arrangements. Expenses net of all reductions represent the net expenses paid by the class.
J Amount represents less than $.01 per share.
See accompanying notes which are an integral part of the financial statements.
Annual Report
Financial Highlights - Class C
Years ended July 31, | 2013 | 2012 | 2011 | 2010 | 2009 |
Selected Per-Share Data | | | | | |
Net asset value, beginning of period | $ 15.16 | $ 15.83 | $ 12.28 | $ 10.55 | $ 13.00 |
Income from Investment Operations | | | | | |
Net investment income (loss) C | (.16) | (.18) F | (.18) G | (.16) H | (.13) |
Net realized and unrealized gain (loss) | 4.64 | (.17) | 3.73 | 1.89 | (2.32) |
Total from investment operations | 4.48 | (.35) | 3.55 | 1.73 | (2.45) |
Distributions from net realized gain | (1.02) | (.32) | - | - | - |
Redemption fees added to paid in capital C, J | - | - | - | - | - |
Net asset value, end of period | $ 18.62 | $ 15.16 | $ 15.83 | $ 12.28 | $ 10.55 |
Total Return A, B | 31.32% | (1.96)% | 28.91% | 16.40% | (18.85)% |
Ratios to Average Net Assets D, I | | | | | |
Expenses before reductions | 1.99% | 2.10% | 2.00% | 2.11% | 2.08% |
Expenses net of fee waivers, if any | 1.99% | 2.10% | 2.00% | 2.11% | 2.08% |
Expenses net of all reductions | 1.97% | 2.09% | 1.98% | 2.09% | 2.07% |
Net investment income (loss) | (1.01)% | (1.24)% F | (1.22)% G | (1.32)% H | (1.39)% |
Supplemental Data | | | | | |
Net assets, end of period (000 omitted) | $ 32,756 | $ 24,683 | $ 24,914 | $ 18,091 | $ 14,267 |
Portfolio turnover rate E | 142% | 150% | 106% | 105% | 150% |
A Total returns would have been lower if certain expenses had not been reduced during the applicable periods shown.
B Total returns do not include the effect of the contingent deferred sales charge.
C Calculated based on average shares outstanding during the period.
D Fees and expenses of any underlying Fidelity Central Funds are not included in the Fund's expense ratio. The Fund indirectly bears its proportionate share of the expenses of any underlying Fidelity Central Funds.
E Amount does not include the portfolio activity of any underlying Fidelity Central Funds.
F Investment income per share reflects a large, non-recurring dividend which amounted to $.01 per share. Excluding this non-recurring dividend, the ratio of net investment income (loss) to average net assets would have been (1.32)%.
G Investment income per share reflects a large, non-recurring dividend which amounted to $.02 per share. Excluding this non-recurring dividend, the ratio of net investment income (loss) to average net assets would have been (1.36)%.
H Investment income per share reflects a large, non-recurring dividend which amounted to $.01 per share. Excluding this non-recurring dividend, the ratio of net investment income (loss) to average net assets would have been (1.42)%.
I Expense ratios reflect operating expenses of the class. Expenses before reductions do not reflect amounts reimbursed by the investment adviser or reductions from brokerage service arrangements or reductions from other expense offset arrangements and do not represent the amount paid by the class during periods when reimbursements or reductions occur. Expenses net of fee waivers reflect expenses after reimbursement by the investment adviser but prior to reductions from brokerage service arrangements or other expense offset arrangements. Expenses net of all reductions represent the net expenses paid by the class.
J Amount represents less than $.01 per share.
See accompanying notes which are an integral part of the financial statements.
Annual Report
Financial Highlights - Small Cap Growth
Years ended July 31, | 2013 | 2012 | 2011 | 2010 | 2009 |
Selected Per-Share Data | | | | | |
Net asset value, beginning of period | $ 16.14 | $ 16.65 | $ 12.81 | $ 10.89 | $ 13.29 |
Income from Investment Operations | | | | | |
Net investment income (loss) B | .01 | (.03) E | (.03) F | (.04) G | (.04) |
Net realized and unrealized gain (loss) | 4.98 | (.16) | 3.90 | 1.96 | (2.36) |
Total from investment operations | 4.99 | (.19) | 3.87 | 1.92 | (2.40) |
Distributions from net realized gain | (1.06) | (.32) | (.03) H | - | - |
Redemption fees added to paid in capital B, J | - | - | - | - | - |
Net asset value, end of period | $ 20.07 | $ 16.14 | $ 16.65 | $ 12.81 | $ 10.89 |
Total Return A | 32.74% | (.88)% | 30.20% | 17.63% | (18.06)% |
Ratios to Average Net Assets C, I | | | | |
Expenses before reductions | .90% | 1.03% | .95% | 1.08% | 1.08% |
Expenses net of fee waivers, if any | .90% | 1.03% | .95% | 1.08% | 1.08% |
Expenses net of all reductions | .88% | 1.02% | .93% | 1.07% | 1.08% |
Net investment income (loss) | .08% | (.16)% E | (.17)% F | (.29)% G | (.39)% |
Supplemental Data | | | | | |
Net assets, end of period (000 omitted) | $ 1,315,659 | $ 1,166,101 | $ 1,382,688 | $ 1,204,818 | $ 1,085,184 |
Portfolio turnover rate D | 142% | 150% | 106% | 105% | 150% |
A Total returns would have been lower if certain expenses had not been reduced during the applicable periods shown.
B Calculated based on average shares outstanding during the period.
C Fees and expenses of any underlying Fidelity Central Funds are not included in the Fund's expense ratio. The Fund indirectly bears its proportionate share of the expenses of any underlying Fidelity Central Funds.
D Amount does not include the portfolio activity of any underlying Fidelity Central Funds.
E Investment income per share reflects a large, non-recurring dividend which amounted to $.01 per share. Excluding this non-recurring dividend, the ratio of net investment income (loss) to average net assets would have been (.25)%.
F Investment income per share reflects a large, non-recurring dividend which amounted to $.02 per share. Excluding this non-recurring dividend, the ratio of net investment income (loss) to average net assets would have been (.31)%.
G Investment income per share reflects a large, non-recurring dividend which amounted to $.01 per share. Excluding this non-recurring dividend, the ratio of net investment income (loss) to average net assets would have been (.39)%.
H The amounts shown reflect certain reclassifications related to book to tax differences that were made in the year shown.
I Expense ratios reflect operating expenses of the class. Expenses before reductions do not reflect amounts reimbursed by the investment adviser or reductions from brokerage service arrangements or reductions from other expense offset arrangements and do not represent the amount paid by the class during periods when reimbursements or reductions occur. Expenses net of fee waivers reflect expenses after reimbursement by the investment adviser but prior to reductions from brokerage service arrangements or other expense offset arrangements. Expenses net of all reductions represent the net expenses paid by the class.
J Amount represents less than $.01 per share.
See accompanying notes which are an integral part of the financial statements.
Annual Report
Financial Highlights - Class F
Years ended July 31, | 2013 | 2012 | 2011 | 2010 | 2009 K |
Selected Per-Share Data | | | | | |
Net asset value, beginning of period | $ 16.26 | $ 16.73 | $ 12.85 | $ 10.90 | $ 10.03 |
Income from Investment Operations | | | | | |
Net investment income (loss) D | .05 | .01 H | .01 I | - J, N | (.01) |
Net realized and unrealized gain (loss) | 5.02 | (.16) | 3.91 | 1.95 | .88 |
Total from investment operations | 5.07 | (.15) | 3.92 | 1.95 | .87 |
Distributions from net realized gain | (1.08) | (.32) | (.04) L | - | - |
Redemption fees added to paid in capital D, N | - | - | - | - | - |
Net asset value, end of period | $ 20.25 | $ 16.26 | $ 16.73 | $ 12.85 | $ 10.90 |
Total Return B, C | 33.00% | (.64)% | 30.56% | 17.89% | 8.67% |
Ratios to Average Net Assets E, M | | | | | |
Expenses before reductions | .69% | .80% | .70% | .78% | .74% A |
Expenses net of fee waivers, if any | .69% | .80% | .70% | .78% | .74% A |
Expenses net of all reductions | .67% | .79% | .68% | .77% | .73% A |
Net investment income (loss) | .29% | .07% H | .08% I | -% G, J | (.54)% A |
Supplemental Data | | | | | |
Net assets, end of period (000 omitted) | $ 727,683 | $ 528,229 | $ 290,765 | $ 106,941 | $ 159 |
Portfolio turnover rate F | 142% | 150% | 106% | 105% | 150% |
A Annualized
B Total returns for periods of less than one year are not annualized.
C Total returns would have been lower if certain expenses had not been reduced during the applicable periods shown.
D Calculated based on average shares outstanding during the period.
E Fees and expenses of any underlying Fidelity Central Funds are not included in the Fund's expense ratio. The Fund indirectly bears its proportionate share of the expenses of any underlying Fidelity Central Funds.
F Amount does not include the portfolio activity of any underlying Fidelity Central Funds.
G Amount represents less than .01%.
H Investment income per share reflects a large, non-recurring dividend which amounted to $.01 per share. Excluding this non-recurring dividend, the ratio of net investment income (loss) to average net assets would have been (.02)%.
I Investment income per share reflects a large, non-recurring dividend which amounted to $.02 per share. Excluding this non-recurring dividend, the ratio of net investment income (loss) to average net assets would have been (.06)%.
J Investment income per share reflects a large, non-recurring dividend which amounted to $.01 per share. Excluding this non-recurring dividend, the ratio of net investment income (loss) to average net assets would have been (.10)%.
K For the period June 26, 2009 (commencement of sale of shares) to July 31, 2009.
L The amounts shown reflect certain reclassifications related to book to tax differences that were made in the year shown.
M Expense ratios reflect operating expenses of the class. Expenses before reductions do not reflect amounts reimbursed by the investment adviser or reductions from brokerage service arrangements or reductions from other expense offset arrangements and do not represent the amount paid by the class during periods when reimbursements or reductions occur. Expense ratios before reductions for start-up periods may not be representative of longer-term operating periods. Expenses net of fee waivers reflect expenses after reimbursement by the investment adviser but prior to reductions from brokerage service arrangements or other expense offset arrangements. Expenses net of all reductions represent the net expenses paid by the class.
N Amount represents less than $.01 per share.
See accompanying notes which are an integral part of the financial statements.
Annual Report
Financial Highlights - Institutional Class
Years ended July 31, | 2013 | 2012 | 2011 | 2010 | 2009 |
Selected Per-Share Data | | | | | |
Net asset value, beginning of period | $ 16.17 | $ 16.68 | $ 12.83 | $ 10.91 | $ 13.30 |
Income from Investment Operations | | | | | |
Net investment income (loss) B | .01 | (.03) E | (.03) F | (.03) G | (.03) |
Net realized and unrealized gain (loss) | 4.98 | (.16) | 3.91 | 1.95 | (2.36) |
Total from investment operations | 4.99 | (.19) | 3.88 | 1.92 | (2.39) |
Distributions from net realized gain | (1.06) | (.32) | (.03) H | - | - |
Redemption fees added to paid in capital B, J | - | - | - | - | - |
Net asset value, end of period | $ 20.10 | $ 16.17 | $ 16.68 | $ 12.83 | $ 10.91 |
Total Return A | 32.65% | (.88)% | 30.24% | 17.60% | (17.97)% |
Ratios to Average Net Assets C, I | | | | | |
Expenses before reductions | .92% | 1.06% | .94% | 1.03% | 1.05% |
Expenses net of fee waivers, if any | .92% | 1.06% | .94% | 1.03% | 1.05% |
Expenses net of all reductions | .91% | 1.05% | .93% | 1.02% | 1.04% |
Net investment income (loss) | .06% | (.19)% E | (.17)% F | (.24)% G | (.36)% |
Supplemental Data | | | | | |
Net assets, end of period (000 omitted) | $ 51,158 | $ 36,694 | $ 41,440 | $ 25,650 | $ 19,204 |
Portfolio turnover rate D | 142% | 150% | 106% | 105% | 150% |
A Total returns would have been lower if certain expenses had not been reduced during the applicable periods shown.
B Calculated based on average shares outstanding during the period.
C Fees and expenses of any underlying Fidelity Central Funds are not included in the Fund's expense ratio. The Fund indirectly bears its proportionate share of the expenses of any underlying Fidelity Central Funds.
D Amount does not include the portfolio activity of any underlying Fidelity Central Funds.
E Investment income per share reflects a large, non-recurring dividend which amounted to $.01 per share. Excluding this non-recurring dividend, the ratio of net investment income (loss) to average net assets would have been (.28)%.
F Investment income per share reflects a large, non-recurring dividend which amounted to $.02 per share. Excluding this non-recurring dividend, the ratio of net investment income (loss) to average net assets would have been (.30)%.
G Investment income per share reflects a large, non-recurring dividend which amounted to $.01 per share. Excluding this non-recurring dividend, the ratio of net investment income (loss) to average net assets would have been (.34)%.
H The amounts shown reflect certain reclassifications related to book to tax differences that were made in the year shown.
I Expense ratios reflect operating expenses of the class. Expenses before reductions do not reflect amounts reimbursed by the investment adviser or reductions from brokerage service arrangements or reductions from other expense offset arrangements and do not represent the amount paid by the class during periods when reimbursements or reductions occur. Expenses net of fee waivers reflect expenses after reimbursement by the investment adviser but prior to reductions from brokerage service arrangements or other expense offset arrangements. Expenses net of all reductions represent the net expenses paid by the class.
J Amount represents less than $.01 per share.
See accompanying notes which are an integral part of the financial statements.
Annual Report
Notes to Financial Statements
For the period ended July 31, 2013
1. Organization.
Fidelity Small Cap Growth Fund (the Fund) is a fund of Fidelity Securities Fund (the Trust) and is authorized to issue an unlimited number of shares. The Trust is registered under the Investment Company Act of 1940, as amended (the 1940 Act), as an open-end management investment company organized as a Massachusetts business trust. The Fund offers Class A, Class T, Class C, Small Cap Growth, Class F and Institutional Class shares, each of which, along with Class B shares, has equal rights as to assets and voting privileges. Class B shares are closed to new accounts and additional purchases, except for exchanges and reinvestments. Each class has exclusive voting rights with respect to matters that affect that class. Class F shares of the Fund are only available for purchase by mutual funds for which Fidelity Management & Research Company (FMR) or an affiliate serves as investment manager. Class B shares will automatically convert to Class A shares after a holding period of seven years from the initial date of purchase.
2. Investments in Fidelity Central Funds.
The Fund invests in Fidelity Central Funds, which are open-end investment companies generally available only to other investment companies and accounts managed by FMR and its affiliates. The Fund's Schedule of Investments lists each of the Fidelity Central Funds held as of period end, if any, as an investment of the Fund, but does not include the underlying holdings of each Fidelity Central Fund. As an Investing Fund, the Fund indirectly bears its proportionate share of the expenses of the underlying Fidelity Central Funds.
The Money Market Central Funds seek preservation of capital and current income and are managed by Fidelity Investments Money Management, Inc. (FIMM), an affiliate of FMR.
A complete unaudited list of holdings for each Fidelity Central Fund is available upon request or at the Securities and Exchange Commission (the SEC) website at www.sec.gov. In addition, the financial statements of the Fidelity Central Funds, which are not covered by the Fund's Report of Independent Registered Public Accounting Firm, are available on the SEC website or upon request.
3. Significant Accounting Policies.
The financial statements have been prepared in conformity with accounting principles generally accepted in the United States of America (GAAP), which require management to make certain estimates and assumptions at the date of the financial statements. Actual results could differ from those estimates. Subsequent events, if any, through the date that the financial statements were issued have been evaluated in the preparation of the financial statements. The following summarizes the significant accounting policies of the Fund:
Annual Report
Notes to Financial Statements - continued
3. Significant Accounting Policies - continued
Investment Valuation. Investments are valued as of 4:00 p.m. Eastern time on the last calendar day of the period. In accordance with valuation policies and procedures approved by the Board of Trustees (the Board), the Fund attempts to obtain prices from one or more third party pricing vendors or brokers to value its investments. When current market prices, quotations or currency exchange rates are not readily available or reliable, investments will be fair valued in good faith by the FMR Fair Value Committee (the Committee), in accordance with procedures adopted by the Board. Factors used in determining fair value vary by investment type and may include market or investment specific events. The frequency with which these procedures are used cannot be predicted and they may be utilized to a significant extent. The Committee oversees the Fund's valuation policies and procedures and is responsible for approving and reporting to the Board all fair value determinations.
The Fund categorizes the inputs to valuation techniques used to value its investments into a disclosure hierarchy consisting of three levels as shown below:
Level 1 - quoted prices in active markets for identical investments
Level 2 - other significant observable inputs (including quoted prices for similar investments, interest rates, prepayment speeds, etc.)
Level 3 - unobservable inputs (including the Fund's own assumptions based on the best information available)
Valuation techniques used to value the Fund's investments by major category are as follows:
Equity securities, including restricted securities, for which market quotations are readily available, are valued at the last reported sale price or official closing price as reported by a third party pricing vendor on the primary market or exchange on which they are traded and are categorized as Level 1 in the hierarchy. In the event there were no sales during the day or closing prices are not available, securities are valued at the last quoted bid price or may be valued using the last available price and are generally categorized as Level 2 in the hierarchy. For foreign equity securities, when market or security specific events arise, comparisons to the valuation of American Depositary Receipts (ADRs), futures contracts, Exchange-Traded Funds (ETFs) and certain indexes as well as quoted prices for similar securities may be used and would be categorized as Level 2 in the hierarchy. Utilizing these techniques may result in transfers between Level 1 and Level 2.
Investments in open-end mutual funds, including the Fidelity Central Funds, are valued at their closing net asset value (NAV) each business day and are categorized as Level 1 in the hierarchy.
Annual Report
3. Significant Accounting Policies - continued
Investment Valuation - continued
Changes in valuation techniques may result in transfers in or out of an assigned level within the disclosure hierarchy.
Foreign Currency. The Fund may use foreign currency contracts to facilitate transactions in foreign-denominated securities. Gains and losses from these transactions may arise from changes in the value of the foreign currency or if the counterparties do not perform under the contracts' terms.
Foreign-denominated assets, including investment securities, and liabilities are translated into U.S. dollars at the exchange rates at period end. Purchases and sales of investment securities, income and dividends received and expenses denominated in foreign currencies are translated into U.S. dollars at the exchange rate in effect on the transaction date.
The effects of exchange rate fluctuations on investments are included with the net realized and unrealized gain (loss) on investment securities. Other foreign currency transactions resulting in realized and unrealized gain (loss) are disclosed separately.
Investment Transactions and Income. For financial reporting purposes, the Fund's investment holdings and NAV include trades executed through the end of the last business day of the period. The NAV per share for processing shareholder transactions is calculated as of the close of business of the New York Stock Exchange (NYSE), normally 4:00 p.m. Eastern time and includes trades executed through the end of the prior business day. Gains and losses on securities sold are determined on the basis of identified cost and may include proceeds received from litigation. Dividend income is recorded on the ex-dividend date, except for certain dividends from foreign securities where the ex-dividend date may have passed, which are recorded as soon as the Fund is informed of the ex-dividend date. Non-cash dividends included in dividend income, if any, are recorded at the fair market value of the securities received. Distributions received on securities that represent a return of capital or capital gain are recorded as a reduction of cost of investments and/or as a realized gain. Subsequent to ex-dividend date the Fund determines the components of these distributions, based upon receipt of tax filings or other correspondence relating to the underlying investment. Interest income and distributions from the Fidelity Central Funds are accrued as earned. Interest income includes coupon interest and amortization of premium and accretion of discount on debt securities. Investment income is recorded net of foreign taxes withheld where recovery of such taxes is uncertain.
Class Allocations and Expenses. Investment income, realized and unrealized capital gains and losses, common expenses of the Fund, and certain fund-level expense reductions, if any, are allocated on a pro-rata basis to each class based on the relative net
Annual Report
Notes to Financial Statements - continued
3. Significant Accounting Policies - continued
Class Allocations and Expenses - continued
assets of each class to the total net assets of the Fund. Each class differs with respect to transfer agent and distribution and service plan fees incurred. Certain expense reductions may also differ by class. Expenses directly attributable to a fund are charged to that fund. Expenses attributable to more than one fund are allocated among the respective funds on the basis of relative net assets or other appropriate methods. Expense estimates are accrued in the period to which they relate and adjustments are made when actual amounts are known.
Income Tax Information and Distributions to Shareholders. Each year, the Fund intends to qualify as a regulated investment company under Subchapter M of the Internal Revenue Code, including distributing substantially all of its taxable income and realized gains. As a result, no provision for income taxes is required. As of July 31, 2013, the Fund did not have any unrecognized tax benefits in the financial statements; nor is the Fund aware of any tax positions for which it is reasonably possible that the total amounts of unrecognized tax benefits will significantly change in the next twelve months. The Fund files a U.S. federal tax return, in addition to state and local tax returns as required. A fund's federal income tax returns are subject to examination by the Internal Revenue Service (IRS) for a period of three fiscal years after they are filed. State and local tax returns may be subject to examination for an additional fiscal year depending on the jurisdiction. Foreign taxes are provided for based on the Fund's understanding of the tax rules and rates that exist in the foreign markets in which it invests.
Distributions are declared and recorded on the ex-dividend date. Income dividends and capital gain distributions are declared separately for each class. Income and capital gain distributions are determined in accordance with income tax regulations, which may differ from GAAP. In addition, the Fund claimed a portion of the payment made to redeeming shareholders as a distribution for income tax purposes.
Capital accounts within the financial statements are adjusted for permanent book-tax differences. These adjustments have no impact on net assets or the results of operations. Temporary book-tax differences will reverse in a subsequent period.
Book-tax differences are primarily due to foreign currency transactions, partnerships and losses deferred due to wash sales and excise tax regulations.
Annual Report
3. Significant Accounting Policies - continued
Income Tax Information and Distributions to Shareholders - continued
The federal tax cost of investment securities and unrealized appreciation (depreciation) as of period end were as follows:
Gross unrealized appreciation | $ 440,572,794 |
Gross unrealized depreciation | (17,106,671) |
Net unrealized appreciation (depreciation) on securities and other investments | $ 423,466,123 |
| |
Tax Cost | $ 1,966,959,286 |
The tax-based components of distributable earnings as of period end were as follows:
Undistributed ordinary income | $ 106,393,413 |
Undistributed long-term capital gain | $ 142,483,227 |
Net unrealized appreciation (depreciation) | $ 423,461,730 |
The tax character of distributions paid was as follows:
| July 31, 2013 | July 31, 2012 |
Ordinary Income | $ 5,191,398 | $ - |
Long-term Capital Gains | 117,369,049 | 34,799,429 |
Total | $ 122,560,447 | $ 34,799,429 |
Short-Term Trading (Redemption) Fees. Shares held by investors in the Fund less than 90 days may have been subject to a redemption fee equal to 1.50% of the net asset value of shares redeemed. All redemption fees, which reduce the proceeds of the shareholder redemption, are retained by the Fund and accounted for as an addition to paid in capital.
4. Purchases and Sales of Investments.
Purchases and sales of securities, other than short-term securities, aggregated $2,731,095,699 and $2,897,640,503, respectively.
5. Fees and Other Transactions with Affiliates.
Management Fee. FMR and its affiliates provide the Fund with investment management related services for which the Fund pays a monthly management fee. The management fee is the sum of an individual fund fee rate that is based on an annual rate of .45% of the Fund's average net assets and an annualized group fee rate that averaged .26% during the period. The group fee rate is based upon the average net assets of all the mutual funds advised by FMR. The group fee rate decreases as assets under management increase and increases as assets under management decrease. In addition, the
Annual Report
Notes to Financial Statements - continued
5. Fees and Other Transactions with Affiliates - continued
Management Fee - continued
management fee is subject to a performance adjustment (up to a maximum of ± .20% of the Fund's average net assets over a 36 month performance period). The upward or downward adjustment to the management fee is based on the relative investment performance of Small Cap Growth as compared to an appropriate benchmark index. For the period, the total annual management fee rate, including the performance adjustment, was .64% of the Fund's average net assets.
Distribution and Service Plan Fees. In accordance with Rule 12b-1 of the 1940 Act, the Fund has adopted separate Distribution and Service Plans for each class of shares. Certain classes pay Fidelity Distributors Corporation (FDC), an affiliate of FMR, separate Distribution and Service Fees, each of which is based on an annual percentage of each class' average net assets. In addition, FDC may pay financial intermediaries for selling shares of the Fund and providing shareholder support services. For the period, the Distribution and Service Fee rates, total fees and amounts retained by FDC were as follows:
| Distribution
Fee | Service
Fee | Total Fees | Retained
by FDC |
Class A | -% | .25% | $ 158,162 | $ 3,570 |
Class T | .25% | .25% | 145,172 | 1,664 |
Class B | .75% | .25% | 37,548 | 28,458 |
Class C | .75% | .25% | 268,513 | 44,877 |
| | | $ 609,395 | $ 78,569 |
Sales Load. FDC may receive a front-end sales charge of up to 5.75% for selling Class A shares and 3.50% for selling Class T shares, some of which is paid to financial intermediaries for selling shares of the Fund. Depending on the holding period, FDC may receive contingent deferred sales charges levied on Class A, Class T, Class B, and Class C redemptions. The deferred sales charges range from 5.00% to 1.00% for Class B shares, 1.00% for Class C shares, 1.00% for certain purchases of Class A shares and .25% for certain purchases of Class T shares.
For the period, sales charge amounts retained by FDC were as follows:
| Retained
by FDC |
Class A | $ 26,925 |
Class T | 7,772 |
Class B* | 4,960 |
Class C* | 2,503 |
| $ 42,160 |
* When Class B and Class C shares are initially sold, FDC pays commissions from its own resources to financial intermediaries through which the sales
are made.
Annual Report
5. Fees and Other Transactions with Affiliates - continued
Transfer Agent Fees. Fidelity Investments Institutional Operations Company, Inc., (FIIOC), an affiliate of FMR, is the transfer, dividend disbursing and shareholder servicing agent for each class of the Fund. FIIOC receives account fees and asset-based fees that vary according to the account size and type of account of the shareholders of the respective classes of the Fund, except for Class F. FIIOC receives no fees for providing transfer agency services to Class F. FIIOC pays for typesetting, printing and mailing of shareholder reports, except proxy statements. For the period, transfer agent fees for each applicable class were as follows:
| Amount | % of
Average
Net Assets |
Class A | $ 189,665 | .30 |
Class T | 89,260 | .31 |
Class B | 11,279 | .30 |
Class C | 80,491 | .30 |
Small Cap Growth | 2,548,777 | .21 |
Institutional Class | 96,156 | .23 |
| $ 3,015,628 | |
Accounting and Security Lending Fees. Fidelity Service Company, Inc. (FSC), an affiliate of FMR, maintains the Fund's accounting records. The accounting fee is based on the level of average net assets for each month. Under a separate contract, FSC administers the security lending program. The security lending fee is based on the number and duration of lending transactions.
Brokerage Commissions. The Fund placed a portion of its portfolio transactions with brokerage firms which are affiliates of the investment adviser. Brokerage commissions are included in net realized gain (loss) and change in net unrealized appreciation (depreciation) in the Statement of Operations. The commissions paid to these affiliated firms were $81,093 for the period.
Interfund Lending Program. Pursuant to an Exemptive Order issued by the SEC, the Fund, along with other registered investment companies having management contracts with FMR, may participate in an interfund lending program. This program provides an alternative credit facility allowing the funds to borrow from, or lend money to, other participating affiliated funds. At period end, there were no interfund loans outstanding. The Fund's activity in this program during the period for which loans were outstanding was as follows:
Borrower or Lender | Average Loan
Balance | Weighted Average
Interest Rate | Interest
Expense |
Borrower | $ 10,856,167 | .37% | $ 674 |
Annual Report
Notes to Financial Statements - continued
6. Committed Line of Credit.
The Fund participates with other funds managed by FMR or an affiliate in a $4.25 billion credit facility (the "line of credit") to be utilized for temporary or emergency purposes to fund shareholder redemptions or for other short-term liquidity purposes. The Fund has agreed to pay commitment fees on its pro-rata portion of the line of credit, which amounted to $4,620 and is reflected in Miscellaneous expenses on the Statement of Operations. During the period, there were no borrowings on this line of credit.
7. Security Lending.
The Fund lends portfolio securities through a lending agent from time to time in order to earn additional income. For equity securities, a lending agent is used and may loan securities to certain qualified borrowers, including Fidelity Capital Markets (FCM), a broker-dealer affiliated with the Fund. On the settlement date of the loan, the Fund receives collateral (in the form of U.S. Treasury obligations, letters of credit and/or cash) against the loaned securities and maintains collateral in an amount not less than 100% of the market value of the loaned securities during the period of the loan. The market value of the loaned securities is determined at the close of business of the Fund and any additional required collateral is delivered to the Fund on the next business day. If the borrower defaults on its obligation to return the securities loaned because of insolvency or other reasons, the Fund may apply collateral received from the borrower against the obligation. The Fund may experience delays and costs in recovering the securities loaned. Any cash collateral received is invested in the Fidelity Securities Lending Cash Central Fund. The value of loaned securities and cash collateral at period end are disclosed on the Fund's Statement of Assets and Liabilities. The value of securities loaned to FCM at period end was $2,735,765. Security lending income represents the income earned on investing cash collateral, less rebates paid to borrowers and any lending agent fees associated with the loan, plus any premium payments received for lending certain types of securities. Security lending income is presented in the Statement of Operations as a component of income from Fidelity Central Funds, and includes $310,189 from securities loaned to FCM.
8. Expense Reductions.
Commissions paid to certain brokers with whom FMR places trades on behalf of the Fund include an amount in addition to trade execution, which is rebated back to the Fund to offset certain expenses. This amount totaled $317,619 for the period. In addition, through arrangements with the Fund's custodian, credits realized as a result of uninvested cash balances were used to reduce the Fund's expenses. During the period, these credits reduced the Fund's custody expenses by $50.
Annual Report
8. Expense Reductions - continued
In addition, FMR reimbursed a portion of the Fund's operating expenses during the period in the amount of $4,459.
9. Distributions to Shareholders.
Distributions to shareholders of each class were as follows:
Years ended July 31, | 2013 | 2012 |
From net realized gain | | |
Class A | $ 3,855,020 | $ 1,262,924 |
Class T | 1,778,904 | 573,407 |
Class B | 260,524 | 101,910 |
Class C | 1,656,727 | 481,854 |
Small Cap Growth | 74,940,038 | 25,434,274 |
Class F | 37,680,389 | 6,152,820 |
Institutional Class | 2,388,845 | 792,240 |
Total | $ 122,560,447 | $ 34,799,429 |
10. Share Transactions.
Transactions for each class of shares were as follows:
| Shares | Dollars |
Years ended July 31, | 2013 | 2012 | 2013 | 2012 |
Class A | | | | |
Shares sold | 969,311 | 986,718 | $ 16,711,827 | $ 14,926,996 |
Reinvestment of distributions | 231,282 | 85,896 | 3,646,231 | 1,194,285 |
Shares redeemed | (1,149,326) | (1,407,222) | (19,219,034) | (21,375,353) |
Net increase (decrease) | 51,267 | (334,608) | $ 1,139,024 | $ (5,254,072) |
Class T | | | | |
Shares sold | 457,321 | 358,193 | $ 7,743,595 | $ 5,456,756 |
Reinvestment of distributions | 106,640 | 38,774 | 1,660,117 | 533,890 |
Shares redeemed | (538,707) | (523,310) | (8,802,237) | (7,812,853) |
Net increase (decrease) | 25,254 | (126,343) | $ 601,475 | $ (1,822,207) |
Class B | | | | |
Shares sold | 6,696 | 11,810 | $ 106,485 | $ 172,624 |
Reinvestment of distributions | 16,337 | 7,173 | 246,159 | 96,091 |
Shares redeemed | (107,598) | (81,516) | (1,730,845) | (1,196,288) |
Net increase (decrease) | (84,565) | (62,533) | $ (1,378,201) | $ (927,573) |
Annual Report
Notes to Financial Statements - continued
10. Share Transactions - continued
| Shares | Dollars |
Years ended July 31, | 2013 | 2012 | 2013 | 2012 |
Class C | | | | |
Shares sold | 456,788 | 405,451 | $ 7,531,447 | $ 5,976,693 |
Reinvestment of distributions | 103,215 | 33,110 | 1,550,542 | 443,092 |
Shares redeemed | (428,305) | (384,855) | (6,821,754) | (5,527,477) |
Net increase (decrease) | 131,698 | 53,706 | $ 2,260,235 | $ 892,308 |
Small Cap Growth | | | | |
Shares sold | 10,379,088 | 14,552,522 | $ 182,249,151 | $ 226,496,807 |
Reinvestment of distributions | 4,595,875 | 1,774,167 | 73,721,316 | 25,022,882 |
Shares redeemed | (21,652,202) | (27,135,724) | (371,997,767) | (414,348,619) |
Net increase (decrease) | (6,677,239) | (10,809,035) | $ (116,027,300) | $ (162,828,930) |
Class F | | | | |
Shares sold | 7,670,010 | 16,430,240 | $ 131,231,307 | $ 255,874,632 |
Reinvestment of distributions | 2,336,095 | 432,802 | 37,680,389 | 6,152,820 |
Shares redeemed | (6,554,937) | (1,757,546) | (118,928,973) | (26,811,905) |
Net increase (decrease) | 3,451,168 | 15,105,496 | $ 49,982,723 | $ 235,215,547 |
Institutional Class | | | | |
Shares sold | 727,207 | 819,623 | $ 12,757,998 | $ 12,520,738 |
Reinvestment of distributions | 128,780 | 44,186 | 2,069,290 | 624,723 |
Shares redeemed | (580,321) | (1,078,752) | (9,884,418) | (16,617,897) |
Net increase (decrease) | 275,666 | (214,943) | $ 4,942,870 | $ (3,472,436) |
11. Other.
The Fund's organizational documents provide former and current trustees and officers with a limited indemnification against liabilities arising in connection with the performance of their duties to the Fund. In the normal course of business, the Fund may also enter into contracts that provide general indemnifications. The Fund's maximum exposure under these arrangements is unknown as this would be dependent on future claims that may be made against the Fund. The risk of material loss from such claims is considered remote.
At the end of the period, the Fidelity Freedom Funds and the Fidelity Freedom K Funds were the owners of record, in the aggregate, of approximately 59% of the total outstanding shares of the Fund.
Annual Report
To the Trustees of Fidelity Securities Fund and the Shareholders of Fidelity Small Cap Growth Fund:
In our opinion, the accompanying statement of assets and liabilities, including the schedule of investments, and the related statements of operations and of changes in net assets and the financial highlights present fairly, in all material respects, the financial position of Fidelity Small Cap Growth Fund (a fund of Fidelity Securities Fund) at July 31, 2013, the results of its operations for the year then ended, the changes in its net assets for each of the two years in the period then ended and the financial highlights for each of the periods indicated, in conformity with accounting principles generally accepted in the United States of America. These financial statements and financial highlights (hereafter referred to as "financial statements") are the responsibility of the Fidelity Small Cap Growth Fund's management. Our responsibility is to express an opinion on these financial statements based on our audits. We conducted our audits of these financial statements in accordance with the standards of the Public Company Accounting Oversight Board (United States). Those standards require that we plan and perform the audit to obtain reasonable assurance about whether the financial statements are free of material misstatement. An audit includes examining, on a test basis, evidence supporting the amounts and disclosures in the financial statements, assessing the accounting principles used and significant estimates made by management, and evaluating the overall financial statement presentation. We believe that our audits, which included confirmation of securities at July 31, 2013 by correspondence with the custodian and brokers, provide a reasonable basis for our opinion.
PricewaterhouseCoopers LLP
Boston, Massachusetts
September 16, 2013
Annual Report
The Trustees, Member of the Advisory Board, and executive officers of the trust and fund, as applicable, are listed below. The Board of Trustees governs the fund and is responsible for protecting the interests of shareholders. The Trustees are experienced executives who meet periodically throughout the year to oversee the fund's activities, review contractual arrangements with companies that provide services to the fund, oversee management of the risks associated with such activities and contractual arrangements, and review the fund's performance. Except for James C. Curvey, Ned C. Lautenbach, Ronald P. O'Hanley, and William S. Stavropoulos, each of the Trustees oversees 166 Fidelity funds. Mr. Curvey oversees 387 Fidelity funds. Mr. Lautenbach, Mr. O'Hanley, and Mr. Stavropoulos oversee 230 Fidelity funds.
The Trustees hold office without limit in time except that (a) any Trustee may resign; (b) any Trustee may be removed by written instrument, signed by at least two-thirds of the number of Trustees prior to such removal; (c) any Trustee who requests to be retired or who has become incapacitated by illness or injury may be retired by written instrument signed by a majority of the other Trustees; and (d) any Trustee may be removed at any special meeting of shareholders by a two-thirds vote of the outstanding voting securities of the trust. Each Trustee who is not an interested person of the trust and the fund (as defined in the 1940 Act) (Independent Trustee), shall retire not later than the last day of the calendar year in which his or her 75th birthday occurs. The Independent Trustees may waive this mandatory retirement age policy with respect to individual Trustees. The executive officers and Advisory Board Member hold office without limit in time, except that any officer and Advisory Board Member may resign or may be removed by a vote of a majority of the Trustees at any regular meeting or any special meeting of the Trustees. Except as indicated, each individual has held the office shown or other offices in the same company for the past five years.
Experience, Skills, Attributes, and Qualifications of the Fund's Trustees. The Governance and Nominating Committee has adopted a statement of policy that describes the experience, qualifications, attributes, and skills that are necessary and desirable for potential Independent Trustee candidates (Statement of Policy). The Board believes that each Trustee satisfied at the time he or she was initially elected or appointed a Trustee, and continues to satisfy, the standards contemplated by the Statement of Policy. The Governance and Nominating Committee also engages professional search firms to help identify potential Independent Trustee candidates who have the experience, qualifications, attributes, and skills consistent with the Statement of Policy. From time to time, additional criteria based on the composition and skills of the current Independent Trustees, as well as experience or skills that may be appropriate in light of future changes to board composition, business conditions, and regulatory or other developments, have also been considered by the professional search firms and the Governance and Nominating Committee. In addition, the Board takes into account the Trustees' commitment and participation in Board and committee meetings, as well as their leadership of standing and ad hoc committees throughout their tenure.
Annual Report
Trustees and Officers - continued
In determining that a particular Trustee was and continues to be qualified to serve as a Trustee, the Board has considered a variety of criteria, none of which, in isolation, was controlling. The Board believes that, collectively, the Trustees have balanced and diverse experience, qualifications, attributes, and skills, which allow the Board to operate effectively in governing the fund and protecting the interests of shareholders. Information about the specific experience, skills, attributes, and qualifications of each Trustee, which in each case led to the Board's conclusion that the Trustee should serve (or continue to serve) as a trustee of the fund, is provided below.
Board Structure and Oversight Function. James C. Curvey is an interested person (as defined in the 1940 Act) and currently serves as Chairman. The Trustees have determined that an interested Chairman is appropriate and benefits shareholders because an interested Chairman has a personal and professional stake in the quality and continuity of services provided to the fund. Independent Trustees exercise their informed business judgment to appoint an individual of their choosing to serve as Chairman, regardless of whether the Trustee happens to be independent or a member of management. The Independent Trustees have determined that they can act independently and effectively without having an Independent Trustee serve as Chairman and that a key structural component for assuring that they are in a position to do so is for the Independent Trustees to constitute a substantial majority for the Board. The Independent Trustees also regularly meet in executive session. Ned C. Lautenbach serves as Chairman of the Independent Trustees and as such (i) acts as a liaison between the Independent Trustees and management with respect to matters important to the Independent Trustees and (ii) with management prepares agendas for Board meetings.
Fidelity funds are overseen by different Boards of Trustees. The fund's Board oversees Fidelity's equity and high income funds and another Board oversees Fidelity's investment-grade bond, money market, and asset allocation funds. The asset allocation funds may invest in Fidelity funds overseen by the fund's Board. The use of separate Boards, each with its own committee structure, allows the Trustees of each group of Fidelity funds to focus on the unique issues of the funds they oversee, including common research, investment, and operational issues. On occasion, the separate Boards establish joint committees to address issues of overlapping consequences for the Fidelity funds overseen by each Board.
The Trustees operate using a system of committees to facilitate the timely and efficient consideration of all matters of importance to the Trustees, the fund, and fund shareholders and to facilitate compliance with legal and regulatory requirements and oversight of the fund's activities and associated risks. The Board, acting through its committees, has charged FMR and its affiliates with (i) identifying events or circumstances the occurrence of which could have demonstrably adverse effects on the fund's business and/or reputation; (ii) implementing processes and controls to lessen the possibility that such events or circumstances occur or to mitigate the effects of such events or circumstances if they do occur; and (iii) creating and maintaining a system designed to evaluate continuously business and market conditions in order to facilitate the identification and implementation processes described in (i) and (ii) above. Because the day-to-day operations and activities of the fund are carried out by or through FMR, its affiliates and other service providers, the fund's exposure to risks is mitigated but not eliminated by the processes overseen by the Trustees. While each of the Board's committees has responsibility for overseeing different aspects of the fund's activities, oversight is exercised primarily through the Operations, Audit, and Compliance Committees. In addition, the Independent Trustees have worked with FMR to enhance the Board's oversight of investment and financial risks, legal and regulatory risks, technology risks, and operational risks, including the development of additional risk reporting to the Board. For example, a working group comprised of Independent Trustees and FMR has worked and continues to work to review the Fidelity funds' valuation-related activities, reporting and risk management. Appropriate personnel, including but not limited to the fund's Chief Compliance Officer (CCO), FMR's internal auditor, the independent accountants, the fund's Treasurer and portfolio management personnel, make periodic reports to the Board's committees, as appropriate, including an annual review of FMR's risk management program for the Fidelity funds. The responsibilities of each standing committee, including their oversight responsibilities, are described further under "Standing Committees of the Fund's Trustees."
Annual Report
The fund's Statement of Additional Information (SAI) includes more information about the Trustees. To request a free copy, call Fidelity at 1-800-835-5092.
Interested Trustees*:
Correspondence intended for each Trustee who is an interested person may be sent to Fidelity Investments, 245 Summer Street, Boston, Massachusetts 02210.
Name, Year of Birth; Principal Occupations and Other Relevant Experience+ |
James C. Curvey (1935) |
| Year of Election or Appointment: 2007 Mr. Curvey is Trustee and Chairman of the Board of Trustees of certain Trusts. Mr. Curvey also serves as Trustee (2007-present) of other investment companies advised by FMR. Mr. Curvey is a Director of Fidelity Investments Money Management, Inc. (2009-present), Director of Fidelity Research & Analysis Co. (2009-present) and Director of FMR and FMR Co., Inc. (2007-present). Mr. Curvey is also Vice Chairman (2007-present) and Director of FMR LLC. In addition, Mr. Curvey serves as an Overseer for the Boston Symphony Orchestra and a member of the Trustees of Villanova University. Previously, Mr. Curvey was the Vice Chairman (2006-2007) and Director (2000-2007) of FMR Corp. |
Ronald P. O'Hanley (1957) |
| Year of Election or Appointment: 2011 Mr. O'Hanley serves as a Trustee and Chairman of the Board of Trustees of other Fidelity funds (2013-present), and is Director of FMR Co., Inc. (2010-present), Director of Fidelity Investments Money Management, Inc. (2010-present), Director of Fidelity Research & Analysis Company (2010-present), President of Fidelity Asset Management and Corporate Services and a Member of Fidelity's Executive Committee (2010-present). Previously, Mr. O'Hanley served as President and Chief Executive Officer of BNY Mellon Asset Management (2007-2010). Mr. O'Hanley also served as Vice Chairman of Bank New York Mellon Corp. and a member of that firm's Executive Committee. Prior to the 2007 merger of The Bank of New York and Mellon Financial Corporation, he was Vice Chairman of Mellon Financial Corporation and President and Chief Executive Officer of Mellon Asset Management. He joined Mellon in February 1997. Mr. O'Hanley currently serves as Chairman of the Boston Public Library Foundation Board of Directors and sits on the Board of Directors of Beth Israel Deaconess Medical Center, the Board of Trustees of the Marine Biological Laboratory and the Advisory Board of the Maxwell School of Citizenship and Public Administration at Syracuse University. Mr. O'Hanley also chairs the Council on Asset Management for the Financial Services Roundtable and is a member of the Board of Directors of Institutional Investor's U.S. Institute. |
* Trustees have been determined to be "Interested Trustees" by virtue of, among other things, their affiliation with the trust or various entities under common control with FMR.
+ The information above includes each Trustee's principal occupation during the last five years and other information relating to the experience, attributes, and skills relevant to each Trustee's qualifications to serve as a Trustee, which led to the conclusion that each Trustee should serve as a Trustee for the fund.
Annual Report
Independent Trustees:
Correspondence intended for each Independent Trustee (that is, the Trustees other than the Interested Trustees) may be sent to Fidelity Investments, P.O. Box 55235, Boston, Massachusetts 02205-5235.
Name, Year of Birth; Principal Occupations and Other Relevant Experience+ |
Dennis J. Dirks (1948) |
| Year of Election or Appointment: 2005 Prior to his retirement in May 2003, Mr. Dirks was Chief Operating Officer and a member of the Board of The Depository Trust & Clearing Corporation (DTCC). He also served as President, Chief Operating Officer, and Board member of The Depository Trust Company (DTC) and President and Board member of the National Securities Clearing Corporation (NSCC). In addition, Mr. Dirks served as Chief Executive Officer and Board member of the Government Securities Clearing Corporation, Chief Executive Officer and Board member of the Mortgage-Backed Securities Clearing Corporation, as a Trustee and a member of the Finance Committee of Manhattan College (2005-2008), and as a Trustee and a member of the Finance Committee of AHRC of Nassau County (2006-2008). Mr. Dirks is a member of the Independent Directors Council (IDC) Governing Council (2010-present) and Board of Directors for The Brookville Center for Children's Services, Inc. (2009-present). |
Alan J. Lacy (1953) |
| Year of Election or Appointment: 2008 Mr. Lacy serves as Senior Adviser (2007-present) of Oak Hill Capital Partners, L.P. (private equity). Mr. Lacy also served as Chief Executive Officer (2000-2005) and Vice Chairman (2005-2006) of Sears Holdings Corporation and Sears, Roebuck and Co. (retail). In addition, Mr. Lacy serves as a member of the Board of Directors of Dave & Buster's Entertainment, Inc. (restaurant and entertainment complexes, 2010-present), Earth Fare, Inc. (retail grocery, 2012-present), The Hillman Companies, Inc. (hardware wholesalers, 2010-present), and Bristol-Myers Squibb Company (global pharmaceuticals, 2008-present). Mr. Lacy is a member of the Board of Trustees of The National Parks Conservation Association (2006-present). Previously, Mr. Lacy served as Chairman of the Board of Trustees of the National Parks Conservation Association (2008-2011) and as a member of the Board of Directors for the Western Union Company (global money transfer, 2006-2011). |
Ned C. Lautenbach (1944) |
| Year of Election or Appointment: 2000 Mr. Lautenbach is Chairman of the Independent Trustees of the Equity and High Income Funds (2006-present) and serves as a Trustee of other Fidelity funds (2013-present). Mr. Lautenbach currently serves as the Lead Director of the Eaton Corporation Board of Directors (diversified industrial, 1997-present). Mr. Lautenbach is Chairman of the Board of Directors of the Philharmonic Center for the Arts in Naples, Florida (2012-present) and a member of the Council on Foreign Relations (1994-present). Previously, Mr. Lautenbach was a Partner/Advisory Partner at Clayton, Dubilier & Rice, LLC (private equity investment, 1998-2010), as well as a Director of Sony Corporation (2006-2007). |
Joseph Mauriello (1944) |
| Year of Election or Appointment: 2008 Prior to his retirement in January 2006, Mr. Mauriello served in numerous senior management positions including Deputy Chairman and Chief Operating Officer (2004-2005), and Vice Chairman of Financial Services (2002-2004) of KPMG LLP US (professional services, 1965-2005). Mr. Mauriello currently serves as a member of the Board of Directors of XL Group plc. (global insurance and re-insurance, 2006-present). Previously, Mr. Mauriello served as a Director of the Hamilton Funds of the Bank of New York (2006-2007) and of Arcadia Resources Inc. (health care services and products, 2007-2012). |
Robert W. Selander (1950) |
| Year of Election or Appointment: 2011 Previously, Mr. Selander served as a Member of the Advisory Board of Fidelity's Equity and High Income Funds (2011), Executive Vice Chairman (2010), Chief Executive Officer (2009-2010), and President and Chief Executive Officer (1997-2009) of Mastercard, Inc. |
Cornelia M. Small (1944) |
| Year of Election or Appointment: 2005 Ms. Small is a member of the Board of Directors (2009-present) and Chair of the Investment Committee (2010-present) of the Teagle Foundation. Ms. Small also serves on the Investment Committee of the Berkshire Taconic Community Foundation (2008-present). Previously, Ms. Small served as Chairperson (2002-2008) and a member of the Investment Committee and Chairperson (2008-2012) and a member of the Board of Trustees of Smith College. In addition, Ms. Small served as Chief Investment Officer, Director of Global Equity Investments, and a member of the Board of Directors of Scudder, Stevens & Clark and Scudder Kemper Investments. |
William S. Stavropoulos (1939) |
| Year of Election or Appointment: 2002 Mr. Stavropoulos is Vice Chairman of the Independent Trustees of the Equity and High Income Funds (2006-present) and serves as a Trustee of other Fidelity funds (2013-present). Mr. Stavropoulos serves as President and Founder of the Michigan Baseball Foundation, the Great Lakes Loons (2007-present). Mr. Stavropoulos is Chairman Emeritus of the Board of Directors of The Dow Chemical Company, where he previously served in numerous senior management positions, including President, CEO (1995-2000; 2002-2004), Chairman of the Executive Committee (2000-2006), and as a member of the Board of Directors (1990-2006). Currently, Mr. Stavropoulos is Chairman of the Board of Directors of Univar Inc. (global distributor of commodity and specialty chemicals), a Director of Teradata Corporation (data warehousing and technology solutions), and Maersk Inc. (industrial conglomerate), and a member of the Advisory Board for Metalmark Capital LLC (private equity investment, 2005-present). Mr. Stavropoulos is an operating advisor to Clayton, Dubilier & Rice, LLC (private equity investment). In addition, Mr. Stavropoulos is a member of the University of Notre Dame Advisory Council for the College of Science, a Trustee of the Rollin L. Gerstacker Foundation, and a Director of the Naples Philharmonic Center for the Arts. Previously, Mr. Stavropoulos served as a Director of Chemical Financial Corporation (bank holding company, 1993-2012) and Tyco International, Ltd. (multinational manufacturing and services, 2007-2012). |
David M. Thomas (1949) |
| Year of Election or Appointment: 2008 Previously, Mr. Thomas served as Executive Chairman (2005-2006) and Chairman and Chief Executive Officer (2000-2005) of IMS Health, Inc. (pharmaceutical and healthcare information solutions), and a Director of Fortune Brands, Inc. (consumer products, 2000-2011). In addition, Mr. Thomas serves as Non-Executive Chairman of the Board of Directors of Fortune Brands Home and Security (home and security products, 2011-present), and as a member of the Board of Directors of Interpublic Group of Companies, Inc. (marketing communication, 2004-present). |
+ The information above includes each Trustee's principal occupation during the last five years and other information relating to the experience, attributes, and skills relevant to each Trustee's qualifications to serve as a Trustee, which led to the conclusion that each Trustee should serve as a Trustee for the fund.
Annual Report
Trustees and Officers - continued
Advisory Board Member and Executive Officers:
Correspondence intended for each executive officer and Peter S. Lynch may be sent to Fidelity Investments, 245 Summer Street, Boston, Massachusetts 02210.
Name, Year of Birth; Principal Occupation |
Peter S. Lynch (1944) |
| Year of Election or Appointment: 2003 Member of the Advisory Board of Fidelity's Equity and High Income Funds. Mr. Lynch is Vice Chairman and a Director of FMR and FMR Co., Inc. In addition, Mr. Lynch serves as a Trustee of Boston College and as the Chairman of the Inner-City Scholarship Fund. Previously, Mr. Lynch served on the Special Olympics International Board of Directors (1997-2006). |
Kenneth B. Robins (1969) |
| Year of Election or Appointment: 2008 President and Treasurer of Fidelity's Equity and High Income Funds. Mr. Robins also serves as President and Treasurer (2008-present) and Assistant Treasurer (2009-present) of other Fidelity funds and is an employee of Fidelity Investments (2004-present). Mr. Robins serves as Executive Vice President of Fidelity Investments Money Management, Inc. (FIMM) (2013-present). Previously, Mr. Robins served as Deputy Treasurer of the Fidelity funds (2005-2008) and Treasurer and Chief Financial Officer of The North Carolina Capital Management Trust: Cash and Term Portfolios (2006-2008). |
Brian B. Hogan (1964) |
| Year of Election or Appointment: 2009 Vice President of Equity and High Income Funds. Mr. Hogan also serves as Vice President of other Fidelity funds (2009-present) and President of FMR's Equity Division (2009-present). Previously, Mr. Hogan served as Senior Vice President, Equity Research of FMR (2006-2009) and as a portfolio manager. |
Thomas C. Hense (1964) |
| Year of Election or Appointment: 2008 or 2010 Vice President of Fidelity's High Income (2008), Small Cap (2008), and Value (2010) Funds. Previously, Mr. Hense served as a portfolio manager for Fidelity's Institutional Money Management Group (Pyramis) (2003-2008). |
Scott C. Goebel (1968) |
| Year of Election or Appointment: 2008 Secretary and Chief Legal Officer (CLO) of the Fidelity funds. Mr. Goebel also serves as Secretary of Fidelity Investments Money Management, Inc. (FIMM) (2010-present) and Fidelity Research and Analysis Company (FRAC) (2010-present); Secretary and CLO of The North Carolina Capital Management Trust: Cash and Term Portfolios (2008-present); General Counsel, Secretary, and Senior Vice President of FMR (2008-present) and FMR Co., Inc. (2008-present); employed by FMR LLC or an affiliate (2001-present); Chief Legal Officer of Fidelity Management & Research (Hong Kong) Limited (2008-present) and Assistant Secretary of Fidelity Management & Research (Japan) Inc. (2008-present), and Fidelity Management & Research (U.K.) Inc. (2008-present). Previously, Mr. Goebel served as Assistant Secretary of FIMM (2008-2010), FRAC (2008-2010), and the Funds (2007-2008) and as Vice President and Secretary of Fidelity Distributors Corporation (FDC) (2005-2007). |
William C. Coffey (1969) |
| Year of Election or Appointment: 2009 Assistant Secretary of Fidelity's Equity and High Income Funds. Mr. Coffey also serves as Assistant Secretary of other Fidelity funds (2009-present), Senior Vice President and Deputy General Counsel of FMR LLC (2010-present), and is an employee of Fidelity Investments. Previously, Mr. Coffey served as Vice President and Associate General Counsel of FMR LLC (2005-2009). |
Elizabeth Paige Baumann (1968) |
| Year of Election or Appointment: 2012 Anti-Money Laundering (AML) Officer of the Fidelity funds. Ms. Baumann also serves as AML Officer of The North Carolina Capital Management Trust: Cash and Term Portfolios (2012-present), Chief AML Officer of FMR LLC (2012-present), and is an employee of Fidelity Investments. Previously, Ms. Baumann served as Vice President and Deputy Anti-Money Laundering Officer (2007-2012). |
Christine Reynolds (1958) |
| Year of Election or Appointment: 2008 Chief Financial Officer of the Fidelity funds. Ms. Reynolds became President of Fidelity Pricing and Cash Management Services (FPCMS) in August 2008. Ms. Reynolds served as Chief Operating Officer of FPCMS (2007-2008). Previously, Ms. Reynolds served as President, Treasurer, and Anti-Money Laundering officer of the Fidelity funds (2004-2007). |
Joseph A. Hanlon (1968) |
| Year of Election or Appointment: 2012 Chief Compliance Officer of Fidelity's Equity and High Income Funds. Mr. Hanlon also serves as Chief Compliance Officer of other Fidelity funds (2012-present). Mr. Hanlon serves as Compliance Officer of FMR, FMR Co., Inc., Fidelity Investments Money Management, Inc. (FIMM), Fidelity Research and Analysis Company (FRAC), and Fidelity Management & Research (Hong Kong) (2009-present), as Senior Vice President of the Fidelity Asset Management Division (2009-present), and is an employee of Fidelity Investments. Previously, Mr. Hanlon served as Compliance Officer of Fidelity Management & Research (Japan) Inc. (2009-2013), Strategic Advisers, Inc. (2009-2013), and Fidelity Management & Research (U.K.) Inc. (2009-2013). |
Joseph F. Zambello (1957) |
| Year of Election or Appointment: 2011 Deputy Treasurer of the Fidelity funds. Mr. Zambello is an employee of Fidelity Investments. Previously, Mr. Zambello served as Vice President of FMR's Program Management Group (2009-2011) and Vice President of the Transfer Agent Oversight Group (2005-2009). |
Adrien E. Deberghes (1967) |
| Year of Election or Appointment: 2008 Deputy Treasurer of Fidelity's Equity and High Income Funds. Mr. Deberghes also serves as Vice President (2011-present), Deputy Treasurer (2008-present), and Assistant Treasurer (2010-present) of other Fidelity funds, and is an employee of Fidelity Investments (2008-present). Previously, Mr. Deberghes served as Senior Vice President of Mutual Fund Administration at State Street Corporation (2007-2008), Senior Director of Mutual Fund Administration at Investors Bank & Trust (2005-2007), and Director of Finance for Dunkin' Brands (2000-2005). |
Stephen Sadoski (1971) |
| Year of Election or Appointment: 2012 Deputy Treasurer of Fidelity's Equity and High Income Funds. Mr. Sadoski also serves as Deputy Treasurer of other Fidelity funds (2012-present) and is an employee of Fidelity Investments (2012-present). Previously, Mr. Sadoski served as Assistant Treasurer of Fidelity's Fixed Income and Asset Allocation Funds (2012-2013), an assistant chief accountant in the Division of Investment Management of the Securities and Exchange Commission (SEC) (2009-2012) and as a senior manager at Deloitte & Touche LLP (1997-2009). |
Stacie M. Smith (1974) |
| Year of Election or Appointment: 2013 Deputy Treasurer of Fidelity's Equity and High Income Funds. Ms. Smith also serves as Deputy Treasurer of other Fidelity funds (2013-present) and is an employee of Fidelity Investments (2009-present). Previously, Ms. Smith served as Senior Audit Manager of Ernst & Young LLP (1996-2009). |
Stephanie J. Dorsey (1969) |
| Year of Election or Appointment: 2010 Assistant Treasurer of Fidelity's Equity and High Income Funds. Ms. Dorsey also serves as President and Treasurer (2013-present) and Assistant Treasurer (2010-present) of other Fidelity funds, Treasurer and Chief Financial Officer of The North Carolina Capital Management Trust: Cash and Term Portfolios (2013-present), and is an employee of Fidelity Investments (2008-present). Previously, Ms. Dorsey served as Deputy Treasurer of Fidelity's Fixed Income and Asset Allocation Funds (2008-2013), Treasurer (2004-2008) of the JPMorgan Mutual Funds and Vice President (2004-2008) of JPMorgan Chase Bank. |
Gary W. Ryan (1958) |
| Year of Election or Appointment: 2005 Assistant Treasurer of the Fidelity funds. Mr. Ryan is an employee of Fidelity Investments. Previously, Mr. Ryan served as Vice President of Fund Reporting in Fidelity Pricing and Cash Management Services (FPCMS) (1999-2005). |
Jonathan Davis (1968) |
| Year of Election or Appointment: 2010 Assistant Treasurer of the Fidelity funds. Mr. Davis is also Assistant Treasurer of Fidelity Rutland Square Trust II and Fidelity Commonwealth Trust II. Mr. Davis is an employee of Fidelity Investments. Previously, Mr. Davis served as Vice President and Associate General Counsel of FMR LLC (2003-2010). |
Annual Report
The Board of Trustees of Fidelity Small Cap Growth Fund voted to pay to shareholders of record at the opening of business, the following distributions per share derived from capital gains realized from sales of portfolio securities:
| Pay Date | Record Date | Capital Gains |
Class F | 09/16/13 | 09/13/13 | $2.259 |
Class F designates 100% of the dividends distributed during the fiscal year as qualifying for the dividends-received deduction for corporate shareholders.
Class F designates 100% of the dividends distributed during the fiscal year as amounts which may be taken into account as a dividend for the purposes of the maximum rate under section 1(h)(11) of the Internal Revenue Code.
The fund hereby designates as a capital gain dividend with respect to the taxable year ended July 31, 2013, $193,398,519, or, if subsequently determined to be different, the net capital gain of such year.
The fund will notify shareholders in January 2014 of amounts for use in preparing 2013 income tax returns.
Annual Report
Board Approval of Investment Advisory Contracts and Management Fees
Fidelity Small Cap Growth Fund
Each year, the Board of Trustees, including the Independent Trustees (together, the Board), votes on the renewal of the management contract and sub-advisory agreements (together, the Advisory Contracts) for the fund. The Board, assisted by the advice of fund counsel and Independent Trustees' counsel, requests and considers a broad range of information relevant to the renewal of the Advisory Contracts throughout the year.
The Board meets regularly and, at each of its meetings, covers an extensive agenda of topics and materials and considers factors that are relevant to its annual consideration of the renewal of the fund's Advisory Contracts, including the services and support provided to the fund and its shareholders. The Board has established various standing committees, each composed of and chaired by Independent Trustees with varying backgrounds, to which the Board has assigned specific subject matter responsibilities in order to enhance effective decision-making by the Board. The Board, acting directly and through its Committees, requests and receives information concerning the annual consideration of the renewal of the fund's Advisory Contracts. The Board also meets as needed to consider matters specifically related to the Board's annual consideration of the renewal of Advisory Contracts. Members of the Board may also meet with trustees of other Fidelity funds through ad hoc joint committees to discuss certain matters relevant to the Fidelity funds.
At its July 2013 meeting, the Board, including the Independent Trustees, unanimously determined to renew the fund's Advisory Contracts. In reaching its determination, the Board considered all factors it believed relevant, including (i) the nature, extent, and quality of the services to be provided to the fund and its shareholders (including the investment performance of the fund); (ii) the competitiveness of the fund's management fee and total expense ratio relative to peer funds; (iii) the total costs of the services to be provided by and the profits to be realized by Fidelity from its relationship with the fund; (iv) the extent to which economies of scale exist and would be realized as the fund grows; and (v) whether fee levels reflect these economies of scale, if any, for the benefit of fund shareholders.
In considering whether to renew the Advisory Contracts for the fund, the Board reached a determination, with the assistance of fund counsel and Independent Trustees' counsel and through the exercise of its business judgment, that the renewal of the Advisory Contracts was in the best interests of the fund and its shareholders and that the compensation payable under the Advisory Contracts was fair and reasonable. The Board's decision to renew the Advisory Contracts was not based on any single factor, but rather was based on a comprehensive consideration of all the information provided to the Board at its meetings throughout the year. The Board, in reaching its determination to renew the Advisory Contracts, was aware that shareholders in the fund have a broad range of investment choices available to them, including a wide choice among mutual funds offered by Fidelity's competitors, and that the fund's shareholders, who have the opportunity to review and weigh the disclosure provided by the fund in its prospectus and other public disclosures, have chosen to invest in this fund, which is a part of the Fidelity family of funds.
Annual Report
Board Approval of Investment Advisory Contracts and
Management Fees - continued
Nature, Extent, and Quality of Services Provided. The Board considered the staffing within the investment adviser, Fidelity Management & Research Company (FMR), and the sub-advisers (together, the Investment Advisers) as it relates to the fund, including the backgrounds of the fund's investment personnel, and also considered the fund's investment objective, strategies, and related investment philosophy. The Independent Trustees also had discussions with senior management of Fidelity's investment operations and investment groups. The Board considered the structure of the portfolio manager compensation program and whether this structure provides appropriate incentives to act in the best interests of the fund.
Resources Dedicated to Investment Management and Support Services. The Board and the Fund Oversight and Research Committees reviewed the general qualifications and capabilities of the Investment Advisers' investment staff, including its size, education, experience, and resources, as well as the Investment Advisers' approach to recruiting, training, managing, and compensating investment personnel. The Board noted that FMR has continued to increase the resources devoted to non-U.S. offices, including expansion of Fidelity's global investment organization. The Board also noted that Fidelity's analysts have extensive resources, tools and capabilities that allow them to conduct sophisticated quantitative and fundamental analysis, as well as credit analysis of issuers, counterparties and guarantors. Further, the Board believes that Fidelity's investment professionals have sufficient access to global information and data so as to provide competitive investment results over time, and that those professionals also have access to sophisticated tools that permit them to assess portfolio construction and risk and performance attribution characteristics continuously, as well as to transmit new information and research conclusions rapidly around the world. Additionally, in its deliberations, the Board considered the Investment Advisers' trading and risk management capabilities and resources, which are an integral part of the investment management process.
Shareholder and Administrative Services. The Board considered (i) the nature, extent, quality, and cost of advisory, administrative, and shareholder services performed by the Investment Advisers and their affiliates under the Advisory Contracts and under separate agreements covering transfer agency, pricing and bookkeeping, and securities lending services for the fund; (ii) the nature and extent of the supervision of third party service providers, principally custodians and subcustodians; and (iii) the resources devoted to, and the record of compliance with, the fund's compliance policies and procedures. The Board also reviewed the allocation of fund brokerage, including allocations to brokers affiliated with the Investment Advisers, the use of brokerage commissions to pay fund expenses, and the use of "soft" commission dollars to pay for research services.
Annual Report
The Board noted that the growth of fund assets over time across the complex allows Fidelity to reinvest in the development of services designed to enhance the value or convenience of the Fidelity funds as investment vehicles. These services include 24-hour access to account information and market information through telephone representatives and over the Internet, investor education materials and asset allocation tools, and the expanded availability of Fidelity Investor Centers.
Investment in a Large Fund Family. The Board considered the benefits to shareholders of investing in a Fidelity fund, including the benefits of investing in a fund that is part of a large family of funds offering a variety of investment disciplines and providing a large variety of mutual fund investor services. The Board noted that Fidelity had taken, or had made recommendations that resulted in the Fidelity funds taking, a number of actions over the previous year that benefited particular funds, including (i) continuing to dedicate additional resources to investment research and to the support of the senior management team that oversees asset management; (ii) persisting in efforts to enhance Fidelity's global research capabilities; (iii) launching new funds and making other enhancements to meet client needs for global and income-oriented solutions; (iv) continuing to launch dedicated lower cost underlying funds to meet portfolio construction needs related to expanding underlying fund options for Fidelity funds of funds, specifically for the Freedom Fund product lines; (v) rationalizing product lines and gaining increased efficiencies through the mergers of several funds into other funds; (vi) strengthening Fidelity's index fund offerings by reducing investment minimums and adopting or lowering existing expense caps for certain funds and classes; (vii) enhancing Global Asset Allocation product offerings by launching new funds and strategies, including "open architecture" target date funds that utilize affiliated and unaffiliated sub-advisers; (viii) modifying the eligibility criteria for Institutional Class shares of Advisor funds to increase their marketability to a portion of the defined contribution plan market; (ix) creating a new low-cost retirement share class for certain Advisor funds to appeal to large retirement plans; (x) transitioning the management of certain Fidelity commodity funds to Geode Capital Management LLC, a registered commodity pool operator, while retaining administrative responsibilities for the funds; (xi) reorganizing a number of funds; and (xii) taking steps toward establishing a new Fidelity adviser to manage sector-based funds and products.
Investment Performance. The Board considered whether the fund has operated in accordance with its investment objective, as well as its record of compliance with its investment restrictions and its performance history. The Board noted that there was a portfolio management change for the fund in November 2011.
Annual Report
Board Approval of Investment Advisory Contracts and
Management Fees - continued
The Board took into account discussions with the Investment Advisers about fund investment performance that occur at Board meetings throughout the year. In this regard the Board noted that as part of regularly scheduled fund reviews and other reports to the Board on fund performance, the Board periodically considers annualized return information for the fund, for different time periods, measured against a securities market index ("benchmark index") and a peer group of mutual funds with similar objectives ("peer group"). In its evaluation of fund investment performance, the Board gave particular attention to information indicating changes in performance of certain Fidelity funds for specific time periods and the Investment Advisers' explanations for any overperformance or underperformance.
In addition to reviewing absolute and relative fund performance, the Independent Trustees periodically consider the appropriateness of fund performance metrics in evaluating the results achieved. In general, the Independent Trustees believe that fund performance should be evaluated based on net performance (after fees and expenses) of both the highest performing and lowest performing classes, where applicable, compared to appropriate benchmark indices, over appropriate time periods which may include full market cycles, and compared to peer groups, as applicable, over the same periods, taking into account relevant factors including the following: general market conditions; issuer-specific information; tactical opportunities for investment; and fund cash flows and other factors.
The Independent Trustees recognize that shareholders evaluate performance on a net basis over their own holding periods, for which one-, three-, and five-year periods are used as a proxy. For this reason, the performance information reviewed by the Board also included net cumulative calendar year total return information for the fund and an appropriate benchmark index and peer group for the most recent one-, three-, and five-year periods, as shown below. Returns are shown compared to the 25th percentile (top of box) and 75th percentile (bottom of box) of the peer universe.
Annual Report
Fidelity Small Cap Growth Fund

The Board has discussed with FMR the fund's underperformance (based on the December 31, 2012 data presented herein) and has engaged with FMR to consider what steps might be taken to remediate the fund's underperformance. The Board noted that the fund's performance has improved for more recent periods.
The Board also considered that the fund's management fee is subject to upward or downward adjustment depending upon whether, and to what extent, the fund's investment performance for the performance period exceeds, or is exceeded by, a securities index, thus leading to a performance adjustment for the same period. The Board noted that the performance adjustment provides FMR with a strong economic incentive to seek to achieve superior performance for the fund's shareholders and helps to more closely align the interests of FMR and the fund's shareholders.
Based on its review, the Board concluded that the nature, extent, and quality of services provided to the fund under the Advisory Contracts should benefit the fund's shareholders.
Competitiveness of Management Fee and Total Expense Ratio. The Board considered the fund's management fee and total expense ratio compared to "mapped groups" of competitive funds and classes. Fidelity creates "mapped groups" by combining similar Lipper investment objective categories that have comparable management fee characteristics. Combining Lipper investment objective categories aids the Board's management fee and total expense ratio comparisons by broadening the competitive group used for comparison and by reducing the number of universes to which various Fidelity funds are compared.
Annual Report
Board Approval of Investment Advisory Contracts and
Management Fees - continued
Management Fee. The Board considered two proprietary management fee comparisons for the 12-month periods shown in the chart below. The group of Lipper funds used by the Board for management fee comparisons is referred to below as the "Total Mapped Group." The Total Mapped Group comparison focuses on a fund's standing in terms of gross management fees before expense reimbursements or caps, and without giving effect to the fund's performance adjustment, relative to the total universe of funds with comparable investment mandates, regardless of whether their management fee structures also are comparable. Funds with comparable investment mandates offer exposure to similar types of securities. Funds with comparable management fee structures have similar management fee contractual arrangements (e.g., flat rate charged for advisory services, all-inclusive fee rate, etc.). "TMG %" represents the percentage of funds in the Total Mapped Group that had management fees that were lower than the fund's. For example, a TMG % of 14% means that 86% of the funds in the Total Mapped Group had higher management fees than the fund. The "Asset-Size Peer Group" (ASPG) comparison focuses on a fund's standing relative to a subset of non-Fidelity funds within the Total Mapped Group that are similar in size and management fee structure. The ASPG represents at least 15% of the funds in the Total Mapped Group with comparable asset size and management fee structures, subject to a minimum of 50 funds (or all funds in the Total Mapped Group if fewer than 50). Additional information, such as the ASPG quartile in which the fund's management fee ranked and the impact of the fund's performance adjustment, is also included in the chart and considered by the Board.
Fidelity Small Cap Growth Fund

The Board noted that the fund's management fee ranked below the median of its Total Mapped Group and below the median of its ASPG for 2012. The Board also noted the effect of the fund's negative performance adjustment on the fund's management fee ranking.
Annual Report
Based on its review, the Board concluded that the fund's management fee is fair and reasonable in light of the services that the fund receives and the other factors considered.
Total Expense Ratio. In its review of each class's total expense ratio, the Board considered the fund's management fee as well as other fund or class expenses, as applicable, such as transfer agent fees, pricing and bookkeeping fees, fund-paid 12b-1 fees, and custodial, legal, and audit fees. The Board also noted the effects of any waivers and reimbursements on fees and expenses, as well as the impact of the fund's performance adjustment. As part of its review, the Board also considered the current and historical total expense ratios of each class of the fund compared to competitive fund median expenses. Each class of the fund is compared to those funds and classes in the Total Mapped Group (used by the Board for management fee comparisons) that have a similar sales load structure.
The Board noted that the total expense ratio of each of Class A, Class B, Class C, Institutional Class, the retail class, and Class F ranked below its competitive median for 2012 and the total expense ratio of Class T ranked above its competitive median for 2012. The Board considered that, in general, various factors can affect total expense ratios. The Board noted that the total expense ratio of Class T was above the competitive median primarily because of higher 12b-1 fees on Class T. Class T has a higher 12b-1 fee, but a lower front-end sales charge, than traditionally priced front-end sales charge classes. The Board considered that Class T is primarily sold load-waived in the retirement plan market where its 0.50% 12b-1 fee is comparable to competing no-load, higher 12b-1 fee classes designed specifically for retirement plans. The Board noted that the fund offers multiple classes, each of which has a different sales load and 12b-1 fee structure, and that the multiple structures are intended to offer a range of pricing options for the intermediary market. The Board also noted that the total expense ratios of the classes vary primarily by the level of their 12b-1 fees, although differences in transfer agent fees may also cause expenses to vary from class to class.
Fees Charged to Other Fidelity Clients. The Board also considered Fidelity fee structures and other information with respect to clients of FMR and its affiliates, such as other mutual funds advised or subadvised by FMR or its affiliates, pension plan clients, and other institutional clients. The Board noted the findings of the 2013 ad hoc joint committee (created with the board of other Fidelity funds), which reviewed and compared Fidelity's institutional investment advisory business with its business of providing services to the Fidelity funds, including the differences in services provided, fees charged, and costs incurred, as well as competition in their respective marketplaces.
Annual Report
Board Approval of Investment Advisory Contracts and
Management Fees - continued
Based on its review of total expense ratios and fees charged to other Fidelity clients, the Board concluded that the total expense ratio of each class of the fund was reasonable, although Class T was above the median of the universe presented for comparison, in light of the services that the fund and its shareholders receive and the other factors considered.
Costs of the Services and Profitability. The Board considered the revenues earned and the expenses incurred by Fidelity in conducting the business of developing, marketing, distributing, managing, administering and servicing the fund and servicing the fund's shareholders. The Board also considered the level of Fidelity's profits in respect of all the Fidelity funds.
On an annual basis, FMR presents to the Board Fidelity's profitability for the fund. Fidelity calculates the profitability for each fund, as well as aggregate profitability for groups of Fidelity funds and all Fidelity funds, using a series of detailed revenue and cost allocation methodologies which originate with the books and records of Fidelity on which Fidelity's audited financial statements are based. The Audit Committee of the Board reviews any significant changes from the prior year's methodologies.
PricewaterhouseCoopers LLP (PwC), independent registered public accounting firm and auditor to Fidelity and certain Fidelity funds, has been engaged annually by the Board as part of the Board's assessment of Fidelity's profitability analysis. PwC's engagement includes the review and assessment of the methodologies used by Fidelity in determining the revenues and expenses attributable to Fidelity's mutual fund business, and completion of agreed-upon procedures surrounding the mathematical accuracy of fund profitability and its conformity to allocation methodologies. After considering PwC's reports issued under the engagement and information provided by Fidelity, the Board concluded that while other allocation methods may also be reasonable, Fidelity's profitability methodologies are reasonable in all material respects.
The Board also reviewed Fidelity's non-fund businesses and fall-out benefits related to the mutual fund business as well as cases where Fidelity's affiliates may benefit from or be related to the fund's business.
The Board considered the costs of the services provided by and the profits realized by Fidelity in connection with the operation of the fund and was satisfied that the profitability was not excessive in the circumstances.
Economies of Scale. The Board considered whether there have been economies of scale in respect of the management of the Fidelity funds, whether the Fidelity funds (including the fund) have appropriately benefited from any such economies of scale, and whether there is potential for realization of any further economies of scale. The Board considered the extent to which the fund will benefit from economies of scale through increased services to the fund, through waivers or reimbursements, or through fee or expense reductions. The Board also noted that in 2009, it and the board of other Fidelity funds created an ad hoc committee (the Economies of Scale Committee) to analyze whether FMR attains economies of scale in respect of the management and servicing of the Fidelity funds, whether the Fidelity funds have appropriately benefited from such economies of scale, and whether there is potential for realization of any further economies of scale.
Annual Report
The Board recognized that the fund's management contract incorporates a "group fee" structure, which provides for lower group fee rates as total fund assets under FMR's management increase, and for higher group fee rates as total fund assets under FMR's management decrease. FMR calculates the group fee rates based on a tiered asset "breakpoint" schedule that varies based on asset class. The Board considered that the group fee is designed to deliver the benefits of economies of scale to fund shareholders when total Fidelity fund assets increase, even if assets of any particular fund are unchanged or have declined, because some portion of Fidelity's costs are attributable to services provided to all Fidelity funds, and all funds benefit if those costs can be allocated among more assets. The Board concluded that, given the group fee structure, fund shareholders will benefit from lower management fees as assets under FMR's management increase at the fund complex level, regardless of whether Fidelity achieves any such economies of scale.
The Board concluded, taking into account the analysis of the Economies of Scale Committee, that economies of scale, if any, are being appropriately shared between fund shareholders and Fidelity.
Amendment to Description of Group Fee Rate. At its July 2013 meeting, the Board voted to approve an amendment to the fund's management contract to modify the description of the "group fee rate" effective August 1, 2013. The Board noted that under the prior description in the contract, the group fee rate was based on the average net assets of all registered investment companies with which FMR has management contracts. Under the contract's tiered asset breakpoint schedule, the group fee rate is lower as total fund assets under FMR's management increase, and higher as total fund assets under FMR's management decrease. The Board considered that the prior description would have excluded the assets of 64 Fidelity sector funds from the group fee rate calculation once Fidelity SelectCo, LLC, an affiliate of FMR, assumed management responsibilities for those funds. The Board noted that modifying the description of the group fee rate to continue to include the assets of those 64 funds for purposes of determining group fee rate breakpoints would avoid an immediate adverse impact on the group fee rate for any fund.
Additional Information Requested by the Board. In order to develop fully the factual basis for consideration of the Fidelity funds' Advisory Contracts, the Board requested and received additional information on certain topics, including: (i) fund performance trends and Fidelity's long-term strategies for certain funds; (ii) the potential to further rationalize the Fidelity fund lineup with the possibility of achieving savings for the funds and Fidelity; (iii) the methodology with respect to competitive fund data and peer group classifications; (iv) the arrangements with, and performance of, certain sub-advisers on behalf of the Fidelity funds, as well as certain proposed participating affiliate arrangements; (v) the realization of fall-out benefits in certain Fidelity business units; (vi) Fidelity's group fee structures, including the rationale for the individual fee rates of certain categories of funds and the definition of group assets; (vii) trends regarding industry use of performance fee structures and the performance adjustment methodologies applicable to the Fidelity funds; (viii) additional competitive analysis regarding the total expenses for certain classes; and (ix) fund profitability methodology, including Fidelity's cost allocation methodology, and the impact of certain factors on fund profitability results.
Annual Report
Board Approval of Investment Advisory Contracts and
Management Fees - continued
Based on its evaluation of all of the conclusions noted above, and after considering all factors it believed relevant, the Board ultimately concluded that the advisory fee structures are fair and reasonable, and that the fund's Advisory Contracts should be renewed.
Annual Report
Investment Adviser
Fidelity Management & Research Company
Boston, MA
Investment Sub-Advisers
FMR Co., Inc.
Fidelity Management & Research
(U.K.) Inc.
Fidelity Management & Research
(Hong Kong) Limited
Fidelity Management & Research
(Japan) Inc.
General Distributor
Fidelity Distributors Corporation
Smithfield, RI
Transfer and Service Agents
Fidelity Investments Institutional
Operations Company, Inc.
Boston, MA
Fidelity Service Company, Inc.
Boston, MA
Custodian
Citibank, N.A.
New York, NY
(Fidelity Investment logo)(registered trademark)
Corporate Headquarters
245 Summer St., Boston, MA 02210
www.fidelity.com
SCP-F-ANN-0913
1.891906.104
Fidelity®
Small Cap Value
Fund
Annual Report
July 31, 2013
(Fidelity Cover Art)
Contents
Performance | (Click Here) | How the fund has done over time. |
Management's Discussion of Fund Performance | (Click Here) | The Portfolio Manager's review of fund performance and strategy. |
Shareholder Expense Example | (Click Here) | An example of shareholder expenses. |
Investment Changes | (Click Here) | A summary of major shifts in the fund's investments over the past six months. |
Investments | (Click Here) | A complete list of the fund's investments with their market values. |
Financial Statements | (Click Here) | Statements of assets and liabilities, operations, and changes in net assets, as well as financial highlights. |
Notes | (Click Here) | Notes to the financial statements. |
Report of Independent Registered Public Accounting Firm | (Click Here) | |
Trustees and Officers | (Click Here) | |
Distributions | (Click Here) | |
Board Approval of Investment Advisory Contracts and Management Fees | (Click Here) | |
To view a fund's proxy voting guidelines and proxy voting record for the 12-month period ended June 30, visit http://www.fidelity.com/proxyvotingresults or visit the Securities and Exchange Commission's (SEC) web site at http://www.sec.gov. You may also call 1-800-544-8544 to request a free copy of the proxy voting guidelines.
Standard & Poor's, S&P and S&P 500 are registered service marks of The McGraw-Hill Companies, Inc. and have been licensed for use by Fidelity Distributors Corporation.
Other third-party marks appearing herein are the property of their respective owners.
All other marks appearing herein are registered or unregistered trademarks or service marks of FMR LLC or an affiliated company. © 2013 FMR LLC. All rights reserved.
Annual Report
This report and the financial statements contained herein are submitted for the general information of the shareholders of the fund. This report is not authorized for distribution to prospective investors in the fund unless preceded or accompanied by an effective prospectus.
A fund files its complete schedule of portfolio holdings with the SEC for the first and third quarters of each fiscal year on Form N-Q. Forms N-Q are available on the SEC's web site at http://www.sec.gov. A fund's Forms N-Q may be reviewed and copied at the SEC's Public Reference Room in Washington, DC. Information regarding the operation of the SEC's Public Reference Room may be obtained by calling 1-800-SEC-0330. For a complete list of a fund's portfolio holdings, view the most recent holdings listing, semiannual report, or annual report on Fidelity's web site at http://www.fidelity.com, http://www.advisor.fidelity.com, or http://www.401k.com, as applicable.
NOT FDIC INSURED • MAY LOSE VALUE • NO BANK GUARANTEE
Neither the fund nor Fidelity Distributors Corporation is a bank.
Annual Report
Average annual total return reflects the change in the value of an investment, assuming reinvestment of the class' distributions from dividend income and capital gains (the profits earned upon the sale of securities that have grown in value, if any) and assuming a constant rate of performance each year. The $10,000 table and the fund's returns do not reflect the deduction of taxes that a shareholder would pay on fund distributions or the redemption of fund shares. During periods of reimbursement by Fidelity, a fund's total return will be greater than it would be had the reimbursement not occurred. How a fund did yesterday is no guarantee of how it will do tomorrow.
Average Annual Total Returns
Periods ended July 31, 2013 | Past 1
year | Past 5
years | Life of
fundA |
Fidelity® Small Cap Value Fund | 39.45% | 14.49% | 11.77% |
A From November 3, 2004.
$10,000 Over Life of Fund
Let's say hypothetically that $10,000 was invested in Fidelity® Small Cap Value Fund, a class of the fund, on November 3, 2004, when the fund started. The chart shows how the value of your investment would have changed, and also shows how the Russell 2000® Value Index performed over the same period.
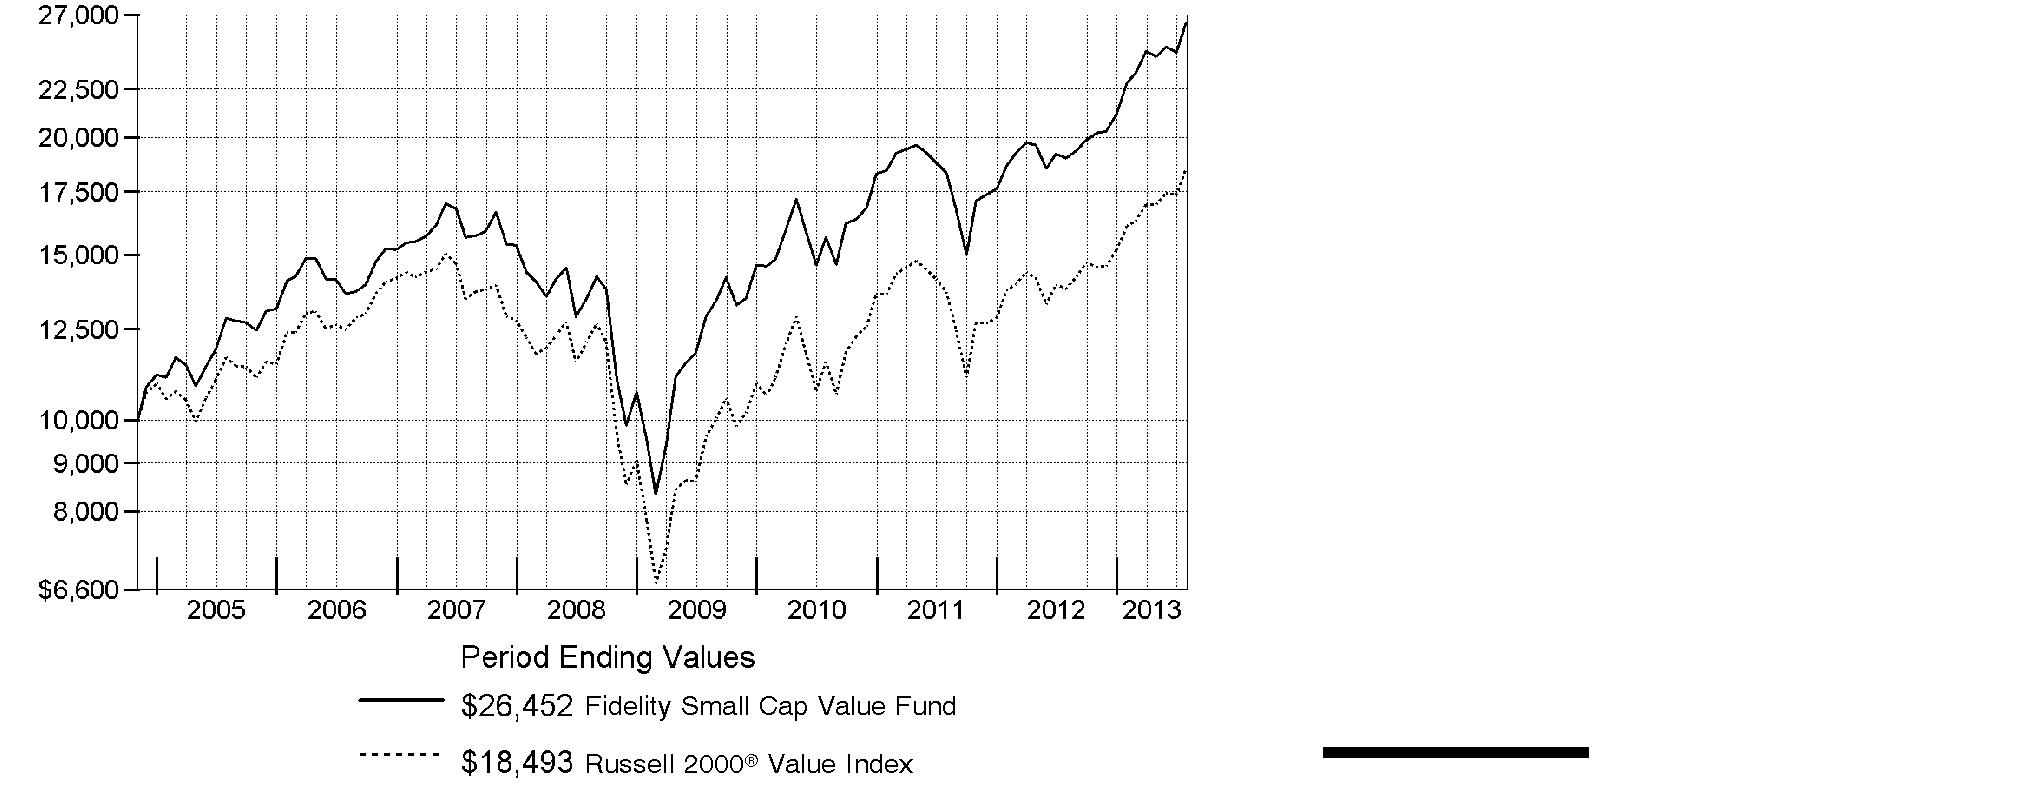
Annual Report
Market Recap: The bull run in U.S. stocks comfortably settled into a fifth year, as major equity benchmarks ripped through records during the 12 months ending July 31, 2013. Gains were fueled by a generally improving global economy and accommodative monetary policies worldwide. The tone was positive for most of the year, based largely on stronger U.S. economic data, including employment, housing and consumer sentiment. Setting a series of new highs along the way, the broad-based S&P 500® Index rose an impressive 25.00% for the 12 months, while the blue-chip-laden Dow Jones Industrial AverageSM also moved into record territory en route to a 22.36% gain. The growth-oriented Nasdaq Composite Index® had a similarly strong run, advancing 25.15%. During the year, markets were resilient amid intermittent volatility over debt woes in Europe, the 2012 U.S. presidential election and year-end Congressional gridlock over the federal budget. In mid-to-late June, concern arose about the U.S. Federal Reserve possibly tapering its sustaining bond-buying strategy - which prompted a brief, but steep, market sell-off. However, investors' continued quest for yield and the Fed's pledge to keep buying bonds until the economy showed significant improvement overpowered the uncertainty and helped equities climb notably higher in July to close the period on a strong note.
Comments from Charles Myers, who became Lead Portfolio Manager of Fidelity® Small Cap Value Fund on January 1, 2013: For the year, the fund's Retail Class shares gained 39.45%, versus 34.15% for the Russell 2000® Value Index. The biggest contribution, by far, came from the financials sector. Stock picking in consumer staples also added significant value, while industrials hurt. Our strategy emphasizes individual stock picking while striving to minimize the performance impact of other factors, including sector over- and underweightings. The fund's top individual contributor was apparel manufacturer Hanesbrands, whose business fundamentals continued to improve. Also helping was Japanese broker Monex Group - benefiting in part from investors' renewed interest in Japan - and CapitalSource, a small-business lender that, in late July, agreed to be acquired at a premium price. None of these contributors was in the benchmark, and Monex was sold from the fund in May. In contrast, the biggest detractor was market maker Knight Capital Group, whose shares plummeted last August after a software glitch cost the firm hundreds of millions of dollars. We sold the fund's stake soon after. GrafTech International, a maker of high-end graphite electrodes, also hurt results.
Note to shareholders: Derek Janssen became Co-Portfolio Manager of the fund on January 1, 2013.
The views expressed above reflect those of the portfolio manager(s) only through the end of the period as stated on the cover of this report and do not necessarily represent the views of Fidelity or any other person in the Fidelity organization. Any such views are subject to change at any time based upon market or other conditions and Fidelity disclaims any responsibility to update such views. These views may not be relied on as investment advice and, because investment decisions for a Fidelity fund are based on numerous factors, may not be relied on as an indication of trading intent on behalf of any Fidelity fund.
Annual Report
Shareholder Expense Example
As a shareholder of the Fund, you incur two types of costs: (1) transaction costs, including sales charges (loads) on purchase payments or redemption proceeds, redemption fees and (2) ongoing costs, including management fees, distribution and/or service (12b-1) fees and other Fund expenses. This Example is intended to help you understand your ongoing costs (in dollars) of investing in the Fund and to compare these costs with the ongoing costs of investing in other mutual funds.
The Example is based on an investment of $1,000 invested at the beginning of the period and held for the entire period (February 1, 2013 to July 31, 2013).
Actual Expenses
The first line of the accompanying table for each class of the Fund provides information about actual account values and actual expenses. You may use the information in this line, together with the amount you invested, to estimate the expenses that you paid over the period. Simply divide your account value by $1,000.00 (for example, an $8,600 account value divided by $1,000.00 = 8.6), then multiply the result by the number in the first line for a class of the Fund under the heading entitled "Expenses Paid During Period" to estimate the expenses you paid on your account during this period. A small balance maintenance fee of $12.00 that is charged once a year may apply for certain accounts with a value of less than $2,000. This fee is not included in the table below. If it was, the estimate of expenses you paid during the period would be higher, and your ending account value lower, by this amount. In addition, the Fund, as a shareholder in the underlying Fidelity Central Funds, will indirectly bear its pro-rata share of the fees and expenses incurred by the underlying Fidelity Central Funds. These fees and expenses are not included in the Fund's annualized expense ratio used to calculate the expense estimate in the table below.
Hypothetical Example for Comparison Purposes
The second line of the accompanying table for each class of the Fund provides information about hypothetical account values and hypothetical expenses based on a Class' actual expense ratio and an assumed rate of return of 5% per year before expenses, which is not the Class' actual return. The hypothetical account values and expenses may not be used to estimate the actual ending account balance or expenses you paid for the period. You may use this information to compare the ongoing costs of investing in the Fund and other funds. To do so, compare this 5% hypothetical example with the 5% hypothetical examples that appear in the shareholder reports of the other funds. A small balance maintenance fee of $12.00 that is charged once a year may apply for certain accounts with a value of less than $2,000. This fee is not included in the table below. If it was, the estimate of expenses you paid during the period would be higher, and your ending account value lower, by this amount. In addition, the Fund, as a shareholder in the underlying Fidelity Central Funds, will indirectly bear its pro-rata share of the fees and expenses incurred by the underlying Fidelity Central Funds. These fees and expenses are not included in the Fund's annualized expense ratio used to calculate the expense estimate in the table below.
Please note that the expenses shown in the table are meant to highlight your ongoing costs only and do not reflect any transaction costs. Therefore, the second line of the table is useful in comparing ongoing costs only, and will not help you determine the relative total costs of owning different funds. In addition, if these transactional costs were included, your costs would have been higher.
Annual Report
Shareholder Expense Example - continued
| Annualized
Expense Ratio B | Beginning
Account Value
February 1, 2013 | Ending
Account Value
July 31, 2013 | Expenses Paid
During Period*
February 1, 2013
to July 31, 2013 |
Class A | 1.37% | | | |
Actual | | $ 1,000.00 | $ 1,155.80 | $ 7.32 |
Hypothetical A | | $ 1,000.00 | $ 1,018.00 | $ 6.85 |
Class T | 1.61% | | | |
Actual | | $ 1,000.00 | $ 1,154.10 | $ 8.60 |
Hypothetical A | | $ 1,000.00 | $ 1,016.81 | $ 8.05 |
Class B | 2.17% | | | |
Actual | | $ 1,000.00 | $ 1,151.70 | $ 11.58 |
Hypothetical A | | $ 1,000.00 | $ 1,014.03 | $ 10.84 |
Class C | 2.13% | | | |
Actual | | $ 1,000.00 | $ 1,151.70 | $ 11.36 |
Hypothetical A | | $ 1,000.00 | $ 1,014.23 | $ 10.64 |
Small Cap Value | 1.08% | | | |
Actual | | $ 1,000.00 | $ 1,157.40 | $ 5.78 |
Hypothetical A | | $ 1,000.00 | $ 1,019.44 | $ 5.41 |
Class F | .86% | | | |
Actual | | $ 1,000.00 | $ 1,158.90 | $ 4.60 |
Hypothetical A | | $ 1,000.00 | $ 1,020.53 | $ 4.31 |
Institutional Class | 1.08% | | | |
Actual | | $ 1,000.00 | $ 1,157.30 | $ 5.78 |
Hypothetical A | | $ 1,000.00 | $ 1,019.44 | $ 5.41 |
A 5% return per year before expenses
B Annualized expense ratio reflects expenses net of applicable fee waivers.
* Expenses are equal to each Class' annualized expense ratio, multiplied by the average account value over the period, multiplied by 181/365 (to reflect the one-half year period).
Annual Report
Investment Changes (Unaudited)
Top Ten Stocks as of July 31, 2013 |
| % of fund's
net assets | % of fund's net assets
6 months ago |
Federated Investors, Inc. Class B (non-vtg.) | 3.2 | 0.6 |
Hanesbrands, Inc. | 3.2 | 2.5 |
TCF Financial Corp. | 2.8 | 2.9 |
Superior Energy Services, Inc. | 2.6 | 3.1 |
Tech Data Corp. | 2.3 | 2.2 |
CapitalSource, Inc. | 2.3 | 2.0 |
HNI Corp. | 2.3 | 2.5 |
j2 Global, Inc. | 2.2 | 1.3 |
DCT Industrial Trust, Inc. | 2.1 | 2.5 |
Berry Petroleum Co. Class A | 2.1 | 2.7 |
| 25.1 | |
Top Five Market Sectors as of July 31, 2013 |
| % of fund's
net assets | % of fund's net assets
6 months ago |
Financials | 37.7 | 36.2 |
Industrials | 14.7 | 14.6 |
Consumer Discretionary | 13.8 | 13.1 |
Information Technology | 13.6 | 11.7 |
Health Care | 5.2 | 6.0 |
Asset Allocation (% of fund's net assets) |
As of July 31, 2013* | As of January 31, 2013** |
 | Stocks 99.8% | | | Stocks 98.8% | |
 | Short-Term
Investments and
Net Other Assets (Liabilities) 0.2% | | | Short-Term
Investments and
Net Other Assets (Liabilities) 1.2% | |
* Foreign investments | 6.6% | | ** Foreign investments | 8.9% | |

Annual Report
Investments July 31, 2013
Showing Percentage of Net Assets
Common Stocks - 99.8% |
| Shares | | Value |
CONSUMER DISCRETIONARY - 13.8% |
Diversified Consumer Services - 1.3% |
Regis Corp. (e) | 3,316,000 | | $ 57,598,920 |
Household Durables - 1.7% |
Tempur-Pedic International, Inc. (a) | 1,800,000 | | 71,370,000 |
Media - 1.4% |
Valassis Communications, Inc. (d)(e) | 2,103,041 | | 60,210,064 |
Multiline Retail - 1.1% |
Big Lots, Inc. (a) | 1,250,000 | | 45,162,500 |
Specialty Retail - 5.0% |
Asbury Automotive Group, Inc. (a) | 1,070,000 | | 52,258,800 |
Genesco, Inc. (a) | 856,128 | | 60,254,289 |
Rent-A-Center, Inc. | 2,021,167 | | 80,826,468 |
Tsutsumi Jewelry Co. Ltd. | 795,800 | | 18,368,991 |
| | 211,708,548 |
Textiles, Apparel & Luxury Goods - 3.3% |
Hanesbrands, Inc. | 2,100,000 | | 133,266,000 |
Vera Bradley, Inc. (a)(d) | 231,000 | | 5,599,440 |
| | 138,865,440 |
TOTAL CONSUMER DISCRETIONARY | | 584,915,472 |
CONSUMER STAPLES - 1.6% |
Food Products - 1.6% |
Chiquita Brands International, Inc. (a) | 1,783,600 | | 21,545,888 |
Post Holdings, Inc. (a) | 984,700 | | 45,680,233 |
| | 67,226,121 |
Household Products - 0.0% |
Spectrum Brands Holdings, Inc. | 25,100 | | 1,416,142 |
TOTAL CONSUMER STAPLES | | 68,642,263 |
ENERGY - 4.8% |
Energy Equipment & Services - 2.7% |
ShawCor Ltd. | 100,900 | | 4,533,672 |
Superior Energy Services, Inc. (a) | 4,211,000 | | 107,885,820 |
| | 112,419,492 |
Common Stocks - continued |
| Shares | | Value |
ENERGY - continued |
Oil, Gas & Consumable Fuels - 2.1% |
Berry Petroleum Co. Class A | 2,156,970 | | $ 87,465,134 |
World Fuel Services Corp. | 56,000 | | 2,169,440 |
| | 89,634,574 |
TOTAL ENERGY | | 202,054,066 |
FINANCIALS - 37.7% |
Capital Markets - 4.7% |
Federated Investors, Inc. Class B (non-vtg.) (d) | 4,644,763 | | 134,837,471 |
Waddell & Reed Financial, Inc. Class A | 1,300,000 | | 66,378,000 |
| | 201,215,471 |
Commercial Banks - 12.8% |
Associated Banc-Corp. | 4,500,000 | | 76,230,000 |
CapitalSource, Inc. | 8,128,000 | | 98,348,800 |
City National Corp. | 1,200,000 | | 83,436,000 |
CVB Financial Corp. | 450,000 | | 5,890,500 |
First Citizen Bancshares, Inc. | 222,700 | | 46,655,650 |
National Penn Bancshares, Inc. | 4,400,000 | | 47,476,000 |
PacWest Bancorp | 1,900,000 | | 67,298,000 |
TCF Financial Corp. | 7,700,000 | | 117,348,000 |
| | 542,682,950 |
Consumer Finance - 2.5% |
Cash America International, Inc. (d) | 816,900 | | 34,309,800 |
EZCORP, Inc. (non-vtg.) Class A (a) | 1,779,788 | | 32,178,567 |
World Acceptance Corp. (a)(d) | 475,000 | | 39,558,000 |
| | 106,046,367 |
Insurance - 8.4% |
Aspen Insurance Holdings Ltd. | 2,300,000 | | 86,227,000 |
Endurance Specialty Holdings Ltd. | 1,486,000 | | 78,208,180 |
Platinum Underwriters Holdings Ltd. (e) | 1,466,099 | | 85,165,691 |
ProAssurance Corp. | 1,100,000 | | 58,883,000 |
StanCorp Financial Group, Inc. | 850,000 | | 45,126,500 |
| | 353,610,371 |
Real Estate Investment Trusts - 5.9% |
DCT Industrial Trust, Inc. | 11,980,586 | | 89,974,201 |
Franklin Street Properties Corp. | 4,800,000 | | 63,888,000 |
Common Stocks - continued |
| Shares | | Value |
FINANCIALS - continued |
Real Estate Investment Trusts - continued |
Highwoods Properties, Inc. (SBI) | 1,720,330 | | $ 62,413,572 |
National Retail Properties, Inc. | 900,000 | | 31,491,000 |
| | 247,766,773 |
Thrifts & Mortgage Finance - 3.4% |
Astoria Financial Corp. (e) | 5,199,999 | | 63,439,988 |
Washington Federal, Inc. | 3,652,100 | | 79,433,175 |
| | 142,873,163 |
TOTAL FINANCIALS | | 1,594,195,095 |
HEALTH CARE - 5.2% |
Health Care Equipment & Supplies - 1.9% |
Hill-Rom Holdings, Inc. | 1,060,000 | | 39,294,200 |
Integra LifeSciences Holdings Corp. (a) | 1,050,000 | | 41,359,500 |
| | 80,653,700 |
Health Care Providers & Services - 3.3% |
AmSurg Corp. (a) | 1,220,000 | | 47,714,200 |
Chemed Corp. | 490,700 | | 34,638,513 |
MEDNAX, Inc. (a) | 600,000 | | 58,452,000 |
| | 140,804,713 |
TOTAL HEALTH CARE | | 221,458,413 |
INDUSTRIALS - 14.7% |
Commercial Services & Supplies - 8.4% |
ACCO Brands Corp. (a)(e) | 10,630,885 | | 70,270,150 |
HNI Corp. (e) | 2,552,800 | | 97,287,208 |
Knoll, Inc. | 1,940,000 | | 32,048,800 |
Quad/Graphics, Inc. (d)(e) | 2,675,000 | | 75,007,000 |
United Stationers, Inc. | 1,980,800 | | 81,985,312 |
| | 356,598,470 |
Electrical Equipment - 2.7% |
EnerSys | 1,065,000 | | 56,359,800 |
GrafTech International Ltd. (a)(e) | 7,709,000 | | 57,971,680 |
| | 114,331,480 |
Common Stocks - continued |
| Shares | | Value |
INDUSTRIALS - continued |
Machinery - 1.5% |
Blount International, Inc. (a)(e) | 2,975,000 | | $ 39,210,500 |
Columbus McKinnon Corp. (NY Shares) (a)(e) | 1,050,000 | | 23,226,000 |
| | 62,436,500 |
Trading Companies & Distributors - 2.1% |
WESCO International, Inc. (a)(d) | 1,138,633 | | 86,285,609 |
TOTAL INDUSTRIALS | | 619,652,059 |
INFORMATION TECHNOLOGY - 13.6% |
Communications Equipment - 1.0% |
Polycom, Inc. (a) | 3,805,145 | | 36,377,186 |
ViaSat, Inc. (a) | 95,000 | | 6,345,050 |
| | 42,722,236 |
Electronic Equipment & Components - 5.3% |
Ingram Micro, Inc. Class A (a) | 3,435,000 | | 78,421,050 |
Ryoyo Electro Corp. | 1,110,600 | | 8,961,025 |
SYNNEX Corp. (a) | 790,000 | | 39,120,800 |
Tech Data Corp. (a)(e) | 1,923,707 | | 98,763,117 |
| | 225,265,992 |
Internet Software & Services - 2.2% |
j2 Global, Inc. (d) | 2,000,000 | | 91,540,000 |
IT Services - 2.0% |
CACI International, Inc. Class A (a)(d)(e) | 1,265,534 | | 84,031,458 |
Software - 3.1% |
Monotype Imaging Holdings, Inc. (e) | 2,499,731 | | 61,318,401 |
SS&C Technologies Holdings, Inc. (a) | 2,000,000 | | 71,560,000 |
| | 132,878,401 |
TOTAL INFORMATION TECHNOLOGY | | 576,438,087 |
MATERIALS - 4.5% |
Chemicals - 1.9% |
PolyOne Corp. | 2,800,000 | | 80,948,000 |
Metals & Mining - 2.6% |
Carpenter Technology Corp. | 438,880 | | 22,944,646 |
Common Stocks - continued |
| Shares | | Value |
MATERIALS - continued |
Metals & Mining - continued |
Haynes International, Inc. | 582,903 | | $ 28,037,634 |
RTI International Metals, Inc. (a)(e) | 1,880,000 | | 57,622,000 |
| | 108,604,280 |
TOTAL MATERIALS | | 189,552,280 |
UTILITIES - 3.9% |
Electric Utilities - 2.9% |
UIL Holdings Corp. | 1,550,000 | | 63,302,000 |
UNS Energy Corp. | 1,150,000 | | 58,477,500 |
| | 121,779,500 |
Gas Utilities - 1.0% |
Southwest Gas Corp. | 836,756 | | 41,536,568 |
TOTAL UTILITIES | | 163,316,068 |
TOTAL COMMON STOCKS (Cost $3,044,578,546) |
4,220,223,803
|
Money Market Funds - 2.0% |
| | | |
Fidelity Cash Central Fund, 0.11% (b) | 28,466,432 | | 28,466,432 |
Fidelity Securities Lending Cash Central Fund, 0.12% (b)(c) | 57,800,650 | | 57,800,650 |
TOTAL MONEY MARKET FUNDS (Cost $86,267,082) |
86,267,082
|
TOTAL INVESTMENT PORTFOLIO - 101.8% (Cost $3,130,845,628) | | 4,306,490,885 |
NET OTHER ASSETS (LIABILITIES) - (1.8)% | | (76,083,401) |
NET ASSETS - 100% | $ 4,230,407,484 |
Legend |
(a) Non-income producing |
(b) Affiliated fund that is generally available only to investment companies and other accounts managed by Fidelity Investments. The rate quoted is the annualized seven-day yield of the fund at period end. A complete unaudited listing of the fund's holdings as of its most recent quarter end is available upon request. In addition, each Fidelity Central Fund's financial statements, which are not covered by the Fund's Report of Independent Registered Public Accounting Firm, are available on the SEC's website or upon request. |
(c) Investment made with cash collateral received from securities on loan. |
(d) Security or a portion of the security is on loan at period end. |
(e) Affiliated company |
Affiliated Central Funds |
Information regarding fiscal year to date income earned by the Fund from investments in Fidelity Central Funds is as follows: |
Fund | Income earned |
Fidelity Cash Central Fund | $ 25,999 |
Fidelity Securities Lending Cash Central Fund | 546,053 |
Total | $ 572,052 |
Other Affiliated Issuers |
An affiliated company is a company in which the Fund has ownership of at least 5% of the voting securities. Fiscal year to date transactions with companies which are or were affiliates are as follows: |
Affiliate | Value, beginning of period | Purchases | Sales
Proceeds | Dividend Income | Value,
end of
period |
ACCO Brands Corp. | $ 18,634,000 | $ 60,186,015 | $ - | $ - | $ 70,270,150 |
Astoria Financial Corp. | 51,038,992 | - | 2,635,044 | 864,648 | 63,439,988 |
Blount International, Inc. | 37,039,161 | 4,861,737 | - | - | 39,210,500 |
CACI International, Inc. Class A | - | 70,903,692 | - | - | 84,031,458 |
Chiquita Brands International, Inc. | 17,482,500 | - | 18,750,066 | - | - |
Columbus McKinnon Corp. (NY Shares) | 15,414,197 | 33,512 | - | - | 23,226,000 |
Affiliate | Value, beginning of period | Purchases | Sales
Proceeds | Dividend Income | Value,
end of
period |
Forestar Group, Inc. | $ 22,724,438 | $ - | $ 37,180,120 | $ - | $ - |
Franklin Street Properties Corp. | 32,769,200 | 18,353,991 | - | 1,420,207 | - |
GrafTech International Ltd. | 62,334,250 | 15,596,640 | - | - | 57,971,680 |
HNI Corp. | 71,739,000 | - | 5,753,822 | 2,592,000 | 97,287,208 |
j2 Global, Inc. | 38,011,100 | 45,217,336 | 27,957,107 | 1,829,466 | - |
Miraial Co. Ltd. | 10,410,478 | - | 12,126,954 | 294,642 | - |
Monotype Imaging Holdings, Inc. | 38,936,219 | 295,917 | 4,511,476 | 533,522 | 61,318,401 |
PacWest Bancorp | 42,557,616 | 917,960 | - | 1,759,368 | - |
Platinum Underwriters Holdings Ltd. | 64,411,165 | - | 12,819,753 | 528,121 | 85,165,691 |
Quad/Graphics, Inc. | 28,908,484 | 12,835,355 | - | 8,161,250 | 75,007,000 |
Regis Corp. | 52,452,000 | 4,787,419 | 1,424,813 | 798,000 | 57,598,920 |
RTI International Metals, Inc. | 42,206,000 | - | - | - | 57,622,000 |
Ryoyo Electro Corp. | 20,552,790 | - | 7,311,306 | 462,475 | - |
Tech Data Corp. | 50,100,000 | 44,833,638 | - | - | 98,763,117 |
Valassis Communications, Inc. | 35,733,655 | 13,478,788 | - | 1,955,518 | 60,210,064 |
Western Liberty Bancorp | 2,879,407 | - | 3,071,972 | - | - |
Total | $ 756,334,652 | $ 292,302,000 | $ 133,542,433 | $ 21,199,217 | $ 931,122,177 |
Other Information |
All investments are categorized as Level 1 under the Fair Value Hierarchy. The inputs or methodology used for valuing securities may not be an indication of the risk associated with investing in those securities. For more information on valuation inputs, please refer to the Investment Valuation section in the accompanying Notes to Financial Statements. |
See accompanying notes which are an integral part of the financial statements.
Annual Report
Statement of Assets and Liabilities
| July 31, 2013 |
| | |
Assets | | |
Investment in securities, at value (including securities loaned of $56,776,323) - See accompanying schedule: Unaffiliated issuers (cost $2,332,604,982) | $ 3,289,101,626 | |
Fidelity Central Funds (cost $86,267,082) | 86,267,082 | |
Other affiliated issuers (cost $711,973,564) | 931,122,177 | |
Total Investments (cost $3,130,845,628) | | $ 4,306,490,885 |
Receivable for investments sold | | 4,040,206 |
Receivable for fund shares sold | | 4,754,743 |
Dividends receivable | | 2,311,882 |
Distributions receivable from Fidelity Central Funds | | 43,534 |
Other receivables | | 26,704 |
Total assets | | 4,317,667,954 |
| | |
Liabilities | | |
Payable for investments purchased | $ 4,404,382 | |
Payable for fund shares redeemed | 21,283,940 | |
Accrued management fee | 2,842,312 | |
Distribution and service plan fees payable | 168,389 | |
Other affiliated payables | 692,724 | |
Other payables and accrued expenses | 68,073 | |
Collateral on securities loaned, at value | 57,800,650 | |
Total liabilities | | 87,260,470 |
| | |
Net Assets | | $ 4,230,407,484 |
Net Assets consist of: | | |
Paid in capital | | $ 2,788,449,989 |
Undistributed net investment income | | 6,475,378 |
Accumulated undistributed net realized gain (loss) on investments and foreign currency transactions | | 259,835,177 |
Net unrealized appreciation (depreciation) on investments and assets and liabilities in foreign currencies | | 1,175,646,940 |
Net Assets | | $ 4,230,407,484 |
See accompanying notes which are an integral part of the financial statements.
Annual Report
Financial Statements - continued
Statement of Assets and Liabilities - continued
| July 31, 2013 |
| | |
Calculation of Maximum Offering Price Class A:
Net Asset Value and redemption price per share ($275,265,209 ÷ 13,787,655 shares) | | $ 19.96 |
| | |
Maximum offering price per share (100/94.25 of $19.96) | | $ 21.18 |
Class T:
Net Asset Value and redemption price per share ($107,443,503 ÷ 5,452,804 shares) | | $ 19.70 |
| | |
Maximum offering price per share (100/96.50 of $19.70) | | $ 20.41 |
Class B:
Net Asset Value and offering price per share ($7,052,013 ÷ 370,046 shares)A | | $ 19.06 |
| | |
Class C:
Net Asset Value and offering price per share ($76,018,400 ÷ 3,988,294 shares)A | | $ 19.06 |
| | |
Small Cap Value:
Net Asset Value, offering price and redemption price per share ($2,672,853,587 ÷ 132,174,679 shares) | | $ 20.22 |
| | |
Class F:
Net Asset Value, offering price and redemption price per share ($732,192,591 ÷ 36,098,957 shares) | | $ 20.28 |
| | |
Institutional Class:
Net Asset Value, offering price and redemption price per share ($359,582,181 ÷ 17,774,629 shares) | | $ 20.23 |
A Redemption price per share is equal to net asset value less any applicable contingent deferred sales charge.
See accompanying notes which are an integral part of the financial statements.
Annual Report
Statement of Operations
| Year ended July 31, 2013 |
| | |
Investment Income | | |
Dividends (including $21,199,217 earned from other affiliated issuers) | | $ 60,413,973 |
Interest | | 105 |
Income from Fidelity Central Funds | | 572,052 |
Total income | | 60,986,130 |
| | |
Expenses | | |
Management fee
Basic fee | $ 24,334,495 | |
Performance adjustment | 3,446,198 | |
Transfer agent fees | 6,387,168 | |
Distribution and service plan fees | 1,603,302 | |
Accounting and security lending fees | 964,201 | |
Custodian fees and expenses | 78,850 | |
Independent trustees' compensation | 20,817 | |
Registration fees | 179,627 | |
Audit | 69,056 | |
Legal | 9,520 | |
Interest | 508 | |
Miscellaneous | 27,296 | |
Total expenses before reductions | 37,121,038 | |
Expense reductions | (242,350) | 36,878,688 |
Net investment income (loss) | | 24,107,442 |
Realized and Unrealized Gain (Loss) Net realized gain (loss) on: | | |
Investment securities: | | |
Unaffiliated issuers | 283,388,788 | |
Other affiliated issuers | 17,171,945 | |
Foreign currency transactions | 124,131 | |
Total net realized gain (loss) | | 300,684,864 |
Change in net unrealized appreciation (depreciation) on: Investment securities | 820,353,456 | |
Assets and liabilities in foreign currencies | 1,060 | |
Total change in net unrealized appreciation (depreciation) | | 820,354,516 |
Net gain (loss) | | 1,121,039,380 |
Net increase (decrease) in net assets resulting from operations | | $ 1,145,146,822 |
See accompanying notes which are an integral part of the financial statements.
Annual Report
Financial Statements - continued
Statement of Changes in Net Assets
| Year ended
July 31,
2013 | Year ended
July 31,
2012 |
Increase (Decrease) in Net Assets | | |
Operations | | |
Net investment income (loss) | $ 24,107,442 | $ 9,490,811 |
Net realized gain (loss) | 300,684,864 | 99,657,152 |
Change in net unrealized appreciation (depreciation) | 820,354,516 | (37,724,900) |
Net increase (decrease) in net assets resulting
from operations | 1,145,146,822 | 71,423,063 |
Distributions to shareholders from net investment income | (21,412,021) | (3,813,704) |
Distributions to shareholders from net realized gain | (85,195,362) | (148,970,854) |
Total distributions | (106,607,383) | (152,784,558) |
Share transactions - net increase (decrease) | 507,448,391 | 230,904,084 |
Redemption fees | 726,904 | 569,163 |
Total increase (decrease) in net assets | 1,546,714,734 | 150,111,752 |
| | |
Net Assets | | |
Beginning of period | 2,683,692,750 | 2,533,580,998 |
End of period (including undistributed net investment income of $6,475,378 and undistributed net investment income of $4,596,351, respectively) | $ 4,230,407,484 | $ 2,683,692,750 |
See accompanying notes which are an integral part of the financial statements.
Annual Report
Financial Highlights - Class A
Years ended July 31, | 2013 | 2012 | 2011 | 2010 | 2009 |
Selected Per-Share Data | | | | | |
Net asset value, beginning of period | $ 14.86 | $ 15.48 | $ 13.45 | $ 11.13 | $ 11.82 |
Income from Investment Operations | | | | | |
Net investment income (loss) C | .07 | .01 | .01 F | .02 G | .08 |
Net realized and unrealized gain (loss) | 5.57 | .30 | 2.22 | 2.33 | (.60) |
Total from investment operations | 5.64 | .31 | 2.23 | 2.35 | (.52) |
Distributions from net investment income | (.07) | (.01) | (.08) | (.03) | (.06) |
Distributions from net realized gain | (.47) | (.93) | (.12) | - | (.11) |
Total distributions | (.54) | (.93) J | (.20) | (.03) | (.17) |
Redemption fees added to paid in capital C,I | - | - | - | - | - |
Net asset value, end of period | $ 19.96 | $ 14.86 | $ 15.48 | $ 13.45 | $ 11.13 |
Total Return A,B | 39.09% | 3.24% | 16.72% | 21.16% | (4.37)% |
Ratios to Average Net Assets D,H | | | | | |
Expenses before reductions | 1.36% | 1.44% | 1.44% | 1.47% | 1.45% |
Expenses net of fee waivers, if any | 1.36% | 1.44% | 1.43% | 1.40% | 1.40% |
Expenses net of all reductions | 1.36% | 1.44% | 1.43% | 1.39% | 1.40% |
Net investment income (loss) | .41% | .09% | .06% F | .17% G | .81% |
Supplemental Data | | | | | |
Net assets, end of period (000 omitted) | $ 275,265 | $ 150,285 | $ 140,707 | $ 96,994 | $ 55,029 |
Portfolio turnover rate E | 29% | 27% | 22% | 49% | 51% |
A Total returns would have been lower if certain expenses had not been reduced during the applicable periods shown.
B Total returns do not include the effect of the sales charges.
C Calculated based on average shares outstanding during the period.
D Fees and expenses of any underlying Fidelity Central Funds are not included in the Fund's expense ratio. The Fund indirectly bears its proportionate share of the expenses of any underlying Fidelity Central Funds.
E Amount does not include the portfolio activity of any underlying Fidelity Central Funds.
F Investment income per share reflects a large, non-recurring dividend which amounted to $.06 per share. Excluding this non-recurring dividend, the ratio of net investment income (loss) to average net assets would have been (.31)%.
G Investment income per share reflects a large, non-recurring dividend which amounted to $.03 per share. Excluding this non-recurring dividend, the ratio of net investment income (loss) to average net assets would have been (.10)%.
H Expense ratios reflect operating expenses of the class. Expenses before reductions do not reflect amounts reimbursed by the investment adviser or reductions from brokerage service arrangements or reductions from other expense offset arrangements and do not represent the amount paid by the class during periods when reimbursements or reductions occur. Expenses net of fee waivers reflect expenses after reimbursement by the investment adviser but prior to reductions from brokerage service arrangements or other expense offset arrangements. Expenses net of all reductions represent the net expenses paid by the class.
I Amount represents less than $.01 per share.
J Total distributions of $.93 per share is comprised of distributions from net investment income of $.006 and distributions from net realized gain of $.925 per share.
See accompanying notes which are an integral part of the financial statements.
Annual Report
Financial Highlights - Class T
Years ended July 31, | 2013 | 2012 | 2011 | 2010 | 2009 |
Selected Per-Share Data | | | | | |
Net asset value, beginning of period | $ 14.70 | $ 15.34 | $ 13.34 | $ 11.05 | $ 11.74 |
Income from Investment Operations | | | | | |
Net investment income (loss) C | .03 | (.02) | (.03) F | (.01) G | .05 |
Net realized and unrealized gain (loss) | 5.50 | .31 | 2.20 | 2.31 | (.59) |
Total from investment operations | 5.53 | .29 | 2.17 | 2.30 | (.54) |
Distributions from net investment income | (.06) | - | (.05) | (.01) | (.04) |
Distributions from net realized gain | (.47) | (.93) | (.12) | - | (.11) |
Total distributions | (.53) | (.93) | (.17) | (.01) | (.15) |
Redemption fees added to paid in capital C,I | - | - | - | - | - |
Net asset value, end of period | $ 19.70 | $ 14.70 | $ 15.34 | $ 13.34 | $ 11.05 |
Total Return A,B | 38.70% | 3.08% | 16.36% | 20.87% | (4.57)% |
Ratios to Average Net Assets D,H | | | | |
Expenses before reductions | 1.60% | 1.67% | 1.70% | 1.72% | 1.70% |
Expenses net of fee waivers, if any | 1.60% | 1.67% | 1.69% | 1.65% | 1.65% |
Expenses net of all reductions | 1.59% | �� 1.67% | 1.69% | 1.64% | 1.65% |
Net investment income (loss) | .18% | (.14)% | (.19)% F | (.08)% G | .56% |
Supplemental Data | | | | | |
Net assets, end of period (000 omitted) | $ 107,444 | $ 57,514 | $ 55,845 | $ 44,091 | $ 28,534 |
Portfolio turnover rate E | 29% | 27% | 22% | 49% | 51% |
A Total returns would have been lower if certain expenses had not been reduced during the applicable periods shown.
B Total returns do not include the effect of the sales charges.
C Calculated based on average shares outstanding during the period.
D Fees and expenses of any underlying Fidelity Central Funds are not included in the Fund's expense ratio. The Fund indirectly bears its proportionate share of the expenses of any underlying Fidelity Central Funds.
E Amount does not include the portfolio activity of any underlying Fidelity Central Funds.
F Investment income per share reflects a large, non-recurring dividend which amounted to $.06 per share. Excluding this non-recurring dividend, the ratio of net investment income (loss) to average net assets would have been (.57)%.
G Investment income per share reflects a large, non-recurring dividend which amounted to $.03 per share. Excluding this non-recurring dividend, the ratio of net investment income (loss) to average net assets would have been (.35)%.
H Expense ratios reflect operating expenses of the class. Expenses before reductions do not reflect amounts reimbursed by the investment adviser or reductions from brokerage service arrangements or reductions from other expense offset arrangements and do not represent the amount paid by the class during periods when reimbursements or reductions occur. Expenses net of fee waivers reflect expenses after reimbursement by the investment adviser but prior to reductions from brokerage service arrangements or other expense offset arrangements. Expenses net of all reductions represent the net expenses paid by the class.
I Amount represents less than $.01 per share.
See accompanying notes which are an integral part of the financial statements.
Annual Report
Financial Highlights - Class B
Years ended July 31, | 2013 | 2012 | 2011 | 2010 | 2009 |
Selected Per-Share Data | | | | | |
Net asset value, beginning of period | $ 14.27 | $ 15.00 | $ 13.08 | $ 10.88 | $ 11.60 |
Income from Investment Operations | | | | | |
Net investment income (loss) C | (.06) | (.09) | (.10) F | (.07) G | .01 |
Net realized and unrealized gain (loss) | 5.34 | .29 | 2.15 | 2.27 | (.59) |
Total from investment operations | 5.28 | .20 | 2.05 | 2.20 | (.58) |
Distributions from net investment income | (.02) | - | (.01) | - | (.03) |
Distributions from net realized gain | (.47) | (.93) | (.12) | - | (.11) |
Total distributions | (.49) | (.93) | (.13) | - | (.14) |
Redemption fees added to paid in capital C,I | - | - | - | - | - |
Net asset value, end of period | $ 19.06 | $ 14.27 | $ 15.00 | $ 13.08 | $ 10.88 |
Total Return A,B | 38.07% | 2.51% | 15.80% | 20.22% | (5.05)% |
Ratios to Average Net Assets D,H | | | | | |
Expenses before reductions | 2.15% | 2.19% | 2.20% | 2.22% | 2.20% |
Expenses net of fee waivers, if any | 2.15% | 2.19% | 2.19% | 2.15% | 2.15% |
Expenses net of all reductions | 2.14% | 2.19% | 2.19% | 2.14% | 2.15% |
Net investment income (loss) | (.37)% | (.66)% | (.69)% F | (.58)% G | .06% |
Supplemental Data | | | | | |
Net assets, end of period (000 omitted) | $ 7,052 | $ 6,675 | $ 8,549 | $ 9,747 | $ 7,153 |
Portfolio turnover rate E | 29% | 27% | 22% | 49% | 51% |
A Total returns would have been lower if certain expenses had not been reduced during the applicable periods shown.
B Total returns do not include the effect of the contingent deferred sales charge.
C Calculated based on average shares outstanding during the period.
D Fees and expenses of any underlying Fidelity Central Funds are not included in the Fund's expense ratio. The Fund indirectly bears its proportionate share of the expenses of any underlying Fidelity Central Funds.
E Amount does not include the portfolio activity of any underlying Fidelity Central Funds.
F Investment income per share reflects a large, non-recurring dividend which amounted to $.06 per share. Excluding this non-recurring dividend, the ratio of net investment income (loss) to average net assets would have been (1.07)%.
G Investment income per share reflects a large, non-recurring dividend which amounted to $.03 per share. Excluding this non-recurring dividend, the ratio of net investment income (loss) to average net assets would have been (.85)%.
H Expense ratios reflect operating expenses of the class. Expenses before reductions do not reflect amounts reimbursed by the investment adviser or reductions from brokerage service arrangements or reductions from other expense offset arrangements and do not represent the amount paid by the class during periods when reimbursements or reductions occur. Expenses net of fee waivers reflect expenses after reimbursement by the investment adviser but prior to reductions from brokerage service arrangements or other expense offset arrangements. Expenses net of all reductions represent the net expenses paid by the class.
I Amount represents less than $.01 per share.
See accompanying notes which are an integral part of the financial statements.
Annual Report
Financial Highlights - Class C
Years ended July 31, | 2013 | 2012 | 2011 | 2010 | 2009 |
Selected Per-Share Data | | | | | |
Net asset value, beginning of period | $ 14.28 | $ 15.01 | $ 13.08 | $ 10.89 | $ 11.60 |
Income from Investment Operations | | | | | |
Net investment income (loss) C | (.06) | (.09) | (.10) F | (.07) G | .01 |
Net realized and unrealized gain (loss) | 5.34 | .29 | 2.17 | 2.26 | (.58) |
Total from investment operations | 5.28 | .20 | 2.07 | 2.19 | (.57) |
Distributions from net investment income | (.03) | - | (.02) | - | (.03) |
Distributions from net realized gain | (.47) | (.93) | (.12) | - | (.11) |
Total distributions | (.50) | (.93) | (.14) | - | (.14) |
Redemption fees added to paid in capital C,I | - | - | - | - | - |
Net asset value, end of period | $ 19.06 | $ 14.28 | $ 15.01 | $ 13.08 | $ 10.89 |
Total Return A,B | 38.00% | 2.52% | 15.91% | 20.11% | (4.98)% |
Ratios to Average Net Assets D,H | | | | | |
Expenses before reductions | 2.13% | 2.19% | 2.18% | 2.22% | 2.20% |
Expenses net of fee waivers, if any | 2.13% | 2.19% | 2.18% | 2.15% | 2.15% |
Expenses net of all reductions | 2.12% | 2.19% | 2.18% | 2.14% | 2.15% |
Net investment income (loss) | (.35)% | (.66)% | (.68)% F | (.58)% G | .06% |
Supplemental Data | | | | | |
Net assets, end of period (000 omitted) | $ 76,018 | $ 47,265 | $ 47,457 | $ 37,346 | $ 21,345 |
Portfolio turnover rate E | 29% | 27% | 22% | 49% | 51% |
A Total returns would have been lower if certain expenses had not been reduced during the applicable periods shown.
B Total returns do not include the effect of the contingent deferred sales charge.
C Calculated based on average shares outstanding during the period.
D Fees and expenses of any underlying Fidelity Central Funds are not included in the Fund's expense ratio. The Fund indirectly bears its proportionate share of the expenses of any underlying Fidelity Central Funds.
E Amount does not include the portfolio activity of any underlying Fidelity Central Funds.
F Investment income per share reflects a large, non-recurring dividend which amounted to $.06 per share. Excluding this non-recurring dividend, the ratio of net investment income (loss) to average net assets would have been (1.06)%.
G Investment income per share reflects a large, non-recurring dividend which amounted to $.03 per share. Excluding this non-recurring dividend, the ratio of net investment income (loss) to average net assets would have been (.85)%.
H Expense ratios reflect operating expenses of the class. Expenses before reductions do not reflect amounts reimbursed by the investment adviser or reductions from brokerage service arrangements or reductions from other expense offset arrangements and do not represent the amount paid by the class during periods when reimbursements or reductions occur. Expenses net of fee waivers reflect expenses after reimbursement by the investment adviser but prior to reductions from brokerage service arrangements or other expense offset arrangements. Expenses net of all reductions represent the net expenses paid by the class.
I Amount represents less than $.01 per share.
See accompanying notes which are an integral part of the financial statements.
Annual Report
Financial Highlights - Small Cap Value
Years ended July 31, | 2013 | 2012 | 2011 | 2010 | 2009 |
Selected Per-Share Data | | | | | |
Net asset value, beginning of period | $ 15.05 | $ 15.62 | $ 13.56 | $ 11.22 | $ 11.91 |
Income from Investment Operations | | | | | |
Net investment income (loss) B | .12 | .06 | .06 E | .05 F | .10 |
Net realized and unrealized gain (loss) | 5.63 | .32 | 2.23 | 2.34 | (.60) |
Total from investment operations | 5.75 | .38 | 2.29 | 2.39 | (.50) |
Distributions from net investment income | (.11) | (.02) | (.10) | (.05) | (.08) |
Distributions from net realized gain | (.47) | (.93) | (.13) | - | (.11) |
Total distributions | (.58) | (.95) | (.23) | (.05) | (.19) |
Redemption fees added to paid in capital B,H | - | - | - | - | - |
Net asset value, end of period | $ 20.22 | $ 15.05 | $ 15.62 | $ 13.56 | $ 11.22 |
Total Return A | 39.45% | 3.67% | 17.03% | 21.32% | (4.15)% |
Ratios to Average Net Assets C,G | | | | |
Expenses before reductions | 1.07% | 1.13% | 1.13% | 1.18% | 1.20% |
Expenses net of fee waivers, if any | 1.07% | 1.13% | 1.13% | 1.18% | 1.20% |
Expenses net of all reductions | 1.06% | 1.13% | 1.13% | 1.17% | 1.20% |
Net investment income (loss) | .71% | .41% | .37% E | .39% F | 1.01% |
Supplemental Data | | | | | |
Net assets, end of period (000 omitted) | $ 2,672,854 | $ 1,756,962 | $ 1,899,805 | $ 1,770,675 | $ 1,488,736 |
Portfolio turnover rate D | 29% | 27% | 22% | 49% | 51% |
A Total returns would have been lower if certain expenses had not been reduced during the applicable periods shown.
B Calculated based on average shares outstanding during the period.
C Fees and expenses of any underlying Fidelity Central Funds are not included in the Fund's expense ratio. The Fund indirectly bears its proportionate share of the expenses of any underlying Fidelity Central Funds.
D Amount does not include the portfolio activity of any underlying Fidelity Central Funds.
E Investment income per share reflects a large, non-recurring dividend which amounted to $.06 per share. Excluding this non-recurring dividend, the ratio of net investment income (loss) to average net assets would have been (.01)%.
F Investment income per share reflects a large, non-recurring dividend which amounted to $.03 per share. Excluding this non-recurring dividend, the ratio of net investment income (loss) to average net assets would have been .12%.
G Expense ratios reflect operating expenses of the class. Expenses before reductions do not reflect amounts reimbursed by the investment adviser or reductions from brokerage service arrangements or reductions from other expense offset arrangements and do not represent the amount paid by the class during periods when reimbursements or reductions occur. Expenses net of fee waivers reflect expenses after reimbursement by the investment adviser but prior to reductions from brokerage service arrangements or other expense offset arrangements. Expenses net of all reductions represent the net expenses paid by the class.
H Amount represents less than $.01 per share.
See accompanying notes which are an integral part of the financial statements.
Annual Report
Financial Highlights - Class F
Years ended July 31, | 2013 | 2012 | 2011 | 2010 | 2009 I |
Selected Per-Share Data | | | | | |
Net asset value, beginning of period | $ 15.09 | $ 15.64 | $ 13.58 | $ 11.22 | $ 10.27 |
Income from Investment Operations | | | | |
Net investment income (loss) D | .16 | .09 | .09 G | .09 H | .01 |
Net realized and unrealized gain (loss) | 5.65 | .32 | 2.23 | 2.34 | .94 |
Total from investment operations | 5.81 | .41 | 2.32 | 2.43 | .95 |
Distributions from net investment income | (.15) | (.04) | (.14) | (.07) | - |
Distributions from net realized gain | (.47) | (.93) | (.13) | - | - |
Total distributions | (.62) | (.96) L | (.26) M | (.07) | - |
Redemption fees added to paid in capital D,K | - | - | - | - | - |
Net asset value, end of period | $ 20.28 | $ 15.09 | $ 15.64 | $ 13.58 | $ 11.22 |
Total Return B,C | 39.79% | 3.90% | 17.31% | 21.69% | 9.25% |
Ratios to Average Net Assets E,J | | | | | |
Expenses before reductions | .84% | .89% | .88% | .90% | .86% A |
Expenses net of fee waivers, if any | .84% | .89% | .88% | .90% | .86% A |
Expenses net of all reductions | .84% | .89% | .88% | .89% | .86% A |
Net investment income (loss) | .93% | .64% | .61% G | .67% H | .64% A |
Supplemental Data | | | | | |
Net assets, end of period (000 omitted) | $ 732,193 | $ 526,009 | $ 279,653 | $ 109,868 | $ 159 |
Portfolio turnover rate F | 29% | 27% | 22% | 49% | 51% |
A Annualized
B Total returns for periods of less than one year are not annualized.
C Total returns would have been lower if certain expenses had not been reduced during the applicable periods shown.
D Calculated based on average shares outstanding during the period.
E Fees and expenses of any underlying Fidelity Central Funds are not included in the Fund's expense ratio. The Fund indirectly bears its proportionate share of the expenses of any underlying Fidelity Central Funds.
F Amount does not include the portfolio activity of any underlying Fidelity Central Funds.
G Investment income per share reflects a large, non-recurring dividend which amounted to $.06 per share. Excluding this non-recurring dividend, the ratio of net investment income (loss) to average net assets would have been .24%.
H Investment income per share reflects a large, non-recurring dividend which amounted to $.03 per share. Excluding this non-recurring dividend, the ratio of net investment income (loss) to average net assets would have been .40%.
I For the period June 26, 2009 (commencement of sale of shares) to July 31, 2009.
J Expense ratios reflect operating expenses of the class. Expenses before reductions do not reflect amounts reimbursed by the investment adviser or reductions from brokerage service arrangements or reductions from other expense offset arrangements and do not represent the amount paid by the class during periods when reimbursements or reductions occur. Expense ratios before reductions for start-up periods may not be representative of longer-term operating periods. Expenses net of fee waivers reflect expenses after reimbursement by the investment adviser but prior to reductions from brokerage service arrangements or other expense offset arrangements. Expenses net of all reductions represent the net expenses paid by the class.
K Amount represents less than $.01 per share.
L Total distributions of $.96 per share is comprised of distributions from net investment income of $.036 and distributions from net realized gain of $.925 per share.
M Total distributions of $.26 per share is comprised of distributions from net investment income of $.138 and distributions from net realized gain of $.126 per share.
See accompanying notes which are an integral part of the financial statements.
Annual Report
Financial Highlights - Institutional Class
Years ended July 31, | 2013 | 2012 | 2011 | 2010 | 2009 |
Selected Per-Share Data | | | | | |
Net asset value, beginning of period | $ 15.05 | $ 15.63 | $ 13.58 | $ 11.24 | $ 11.91 |
Income from Investment Operations | | | | | |
Net investment income (loss) B | .12 | .06 | .06 E | .06 F | .10 |
Net realized and unrealized gain (loss) | 5.65 | .31 | 2.23 | 2.34 | (.59) |
Total from investment operations | 5.77 | .37 | 2.29 | 2.40 | (.49) |
Distributions from net investment income | (.12) | (.02) | (.11) | (.06) | (.07) |
Distributions from net realized gain | (.47) | (.93) | (.13) | - | (.11) |
Total distributions | (.59) | (.95) | (.24) | (.06) | (.18) |
Redemption fees added to paid in capital B,H | - | - | - | - | - |
Net asset value, end of period | $ 20.23 | $ 15.05 | $ 15.63 | $ 13.58 | $ 11.24 |
Total Return A | 39.54% | 3.59% | 17.02% | 21.42% | (4.04)% |
Ratios to Average Net Assets C,G | | | | | |
Expenses before reductions | 1.07% | 1.14% | 1.10% | 1.12% | 1.20% |
Expenses net of fee waivers, if any | 1.07% | 1.14% | 1.10% | 1.12% | 1.15% |
Expenses net of all reductions | 1.06% | 1.14% | 1.10% | 1.12% | 1.15% |
Net investment income (loss) | .70% | .39% | .39% E | .45% F | 1.06% |
Supplemental Data | | | | | |
Net assets, end of period (000 omitted) | $ 359,582 | $ 138,981 | $ 101,565 | $ 78,440 | $ 10,336 |
Portfolio turnover rate D | 29% | 27% | 22% | 49% | 51% |
A Total returns would have been lower if certain expenses had not been reduced during the applicable periods shown.
B Calculated based on average shares outstanding during the period.
C Fees and expenses of any underlying Fidelity Central Funds are not included in the Fund's expense ratio. The Fund indirectly bears its proportionate share of the expenses of any underlying Fidelity Central Funds.
D Amount does not include the portfolio activity of any underlying Fidelity Central Funds.
E Investment income per share reflects a large, non-recurring dividend which amounted to $.06 per share. Excluding this non-recurring dividend, the ratio of net investment income (loss) to average net assets would have been .01%.
F Investment income per share reflects a large, non-recurring dividend which amounted to $.03 per share. Excluding this non-recurring dividend, the ratio of net investment income (loss) to average net assets would have been .18%.
G Expense ratios reflect operating expenses of the class. Expenses before reductions do not reflect amounts reimbursed by the investment adviser or reductions from brokerage service arrangements or reductions from other expense offset arrangements and do not represent the amount paid by the class during periods when reimbursements or reductions occur. Expenses net of fee waivers reflect expenses after reimbursement by the investment adviser but prior to reductions from brokerage service arrangements or other expense offset arrangements. Expenses net of all reductions represent the net expenses paid by the class.
H Amount represents less than $.01 per share.
See accompanying notes which are an integral part of the financial statements.
Annual Report
Notes to Financial Statements
For the period ended July 31, 2013
1. Organization.
Fidelity Small Cap Value Fund (the Fund) is a fund of Fidelity Securities Fund (the Trust) and is authorized to issue an unlimited number of shares. The Trust is registered under the Investment Company Act of 1940, as amended (the 1940 Act), as an open-end management investment company organized as a Massachusetts business trust. The Fund offers Class A, Class T, Class C, Small Cap Value, Class F and Institutional Class shares, each of which, along with Class B shares, has equal rights as to assets and voting privileges. Class B shares are closed to new accounts and additional purchases, except for exchanges and reinvestments. Effective after the close of business on March 1, 2013, the Fund's other share classes were closed to new accounts with certain exceptions. Each class has exclusive voting rights with respect to matters that affect that class. Class F shares of the Fund are only available for purchase by mutual funds for which Fidelity Management & Research Company (FMR) or an affiliate serves as investment manager. Class B shares will automatically convert to Class A shares after a holding period of seven years from the initial date of purchase.
2. Investments in Fidelity Central Funds.
The Fund invests in Fidelity Central Funds, which are open-end investment companies generally available only to other investment companies and accounts managed by FMR and its affiliates. The Fund's Schedule of Investments lists each of the Fidelity Central Funds held as of period end, if any, as an investment of the Fund, but does not include the underlying holdings of each Fidelity Central Fund. As an Investing Fund, the Fund indirectly bears its proportionate share of the expenses of the underlying Fidelity Central Funds.
The Money Market Central Funds seek preservation of capital and current income and are managed by Fidelity Investments Money Management, Inc. (FIMM), an affiliate of FMR.
A complete unaudited list of holdings for each Fidelity Central Fund is available upon request or at the Securities and Exchange Commission (the SEC) website at www.sec.gov. In addition, the financial statements of the Fidelity Central Funds, which are not covered by the Fund's Report of Independent Registered Public Accounting Firm, are available on the SEC website or upon request.
3. Significant Accounting Policies.
The financial statements have been prepared in conformity with accounting principles generally accepted in the United States of America (GAAP), which require management to make certain estimates and assumptions at the date of the financial statements. Actual results could differ from those estimates. Subsequent events, if any, through the date that the financial statements were issued have been evaluated in the preparation of
Annual Report
Notes to Financial Statements - continued
3. Significant Accounting Policies - continued
the financial statements. The following summarizes the significant accounting policies of the Fund:
Investment Valuation. Investments are valued as of 4:00 p.m. Eastern time on the last calendar day of the period. In accordance with valuation policies and procedures approved by the Board of Trustees (the Board), the Fund attempts to obtain prices from one or more third party pricing vendors or brokers to value its investments. When current market prices, quotations or currency exchange rates are not readily available or reliable, investments will be fair valued in good faith by the FMR Fair Value Committee (the Committee), in accordance with procedures adopted by the Board. Factors used in determining fair value vary by investment type and may include market or investment specific events. The frequency with which these procedures are used cannot be predicted and they may be utilized to a significant extent. The Committee oversees the Fund's valuation policies and procedures and is responsible for approving and reporting to the Board all fair value determinations.
The Fund categorizes the inputs to valuation techniques used to value its investments into a disclosure hierarchy consisting of three levels as shown below:
Level 1 - quoted prices in active markets for identical investments
Level 2 - other significant observable inputs (including quoted prices for similar investments, interest rates, prepayment speeds, etc.)
Level 3 - unobservable inputs (including the Fund's own assumptions based on the best information available)
Valuation techniques used to value the Fund's investments by major category are as follows:
Equity securities, including restricted securities, for which market quotations are readily available, are valued at the last reported sale price or official closing price as reported by a third party pricing vendor on the primary market or exchange on which they are traded and are categorized as Level 1 in the hierarchy. In the event there were no sales during the day or closing prices are not available, securities are valued at the last quoted bid price or may be valued using the last available price and are generally categorized as Level 2 in the hierarchy. For foreign equity securities, when market or security specific events arise, comparisons to the valuation of American Depositary Receipts (ADRs), futures contracts, Exchange-Traded Funds (ETFs) and certain indexes as well as quoted prices for similar securities may be used and would be categorized as Level 2 in the hierarchy. Utilizing these techniques may result in transfers between Level 1 and Level 2.
Annual Report
3. Significant Accounting Policies - continued
Investment Valuation - continued
Investments in open-end mutual funds, including the Fidelity Central Funds, are valued at their closing net asset value (NAV) each business day and are categorized as Level 1 in the hierarchy.
Changes in valuation techniques may result in transfers in or out of an assigned level within the disclosure hierarchy.
Foreign Currency. The Fund may use foreign currency contracts to facilitate transactions in foreign-denominated securities. Gains and losses from these transactions may arise from changes in the value of the foreign currency or if the counterparties do not perform under the contracts' terms.
Foreign-denominated assets, including investment securities, and liabilities are translated into U.S. dollars at the exchange rates at period end. Purchases and sales of investment securities, income and dividends received and expenses denominated in foreign currencies are translated into U.S. dollars at the exchange rate in effect on the transaction date.
The effects of exchange rate fluctuations on investments are included with the net realized and unrealized gain (loss) on investment securities. Other foreign currency transactions resulting in realized and unrealized gain (loss) are disclosed separately.
Investment Transactions and Income. For financial reporting purposes, the Fund's investment holdings and NAV include trades executed through the end of the last business day of the period. The NAV per share for processing shareholder transactions is calculated as of the close of business of the New York Stock Exchange (NYSE), normally 4:00 p.m. Eastern time and includes trades executed through the end of the prior business day. Gains and losses on securities sold are determined on the basis of identified cost and may include proceeds received from litigation. Dividend income is recorded on the ex-dividend date, except for certain dividends from foreign securities where the ex-dividend date may have passed, which are recorded as soon as the Fund is informed of the ex-dividend date. Non-cash dividends included in dividend income, if any, are recorded at the fair market value of the securities received. Distributions received on securities that represent a return of capital or capital gain are recorded as a reduction of cost of investments and/or as a realized gain. Subsequent to ex-dividend date the Fund determines the components of these distributions, based upon receipt of tax filings or other correspondence relating to the underlying investment. Interest income and distributions from the Fidelity Central Funds are accrued as earned. Interest income includes coupon interest and amortization of premium and accretion of discount on debt securities. Investment income is recorded net of foreign taxes withheld where recovery of such taxes is uncertain.
Annual Report
Notes to Financial Statements - continued
3. Significant Accounting Policies - continued
Class Allocations and Expenses. Investment income, realized and unrealized capital gains and losses, common expenses of the Fund, and certain fund-level expense reductions, if any, are allocated on a pro-rata basis to each class based on the relative net assets of each class to the total net assets of the Fund. Each class differs with respect to transfer agent and distribution and service plan fees incurred. Certain expense reductions may also differ by class. Expenses directly attributable to a fund are charged to that fund. Expenses attributable to more than one fund are allocated among the respective funds on the basis of relative net assets or other appropriate methods. Expense estimates are accrued in the period to which they relate and adjustments are made when actual amounts are known.
Income Tax Information and Distributions to Shareholders. Each year, the Fund intends to qualify as a regulated investment company under Subchapter M of the Internal Revenue Code, including distributing substantially all of its taxable income and realized gains. As a result, no provision for income taxes is required. As of July 31, 2013, the Fund did not have any unrecognized tax benefits in the financial statements; nor is the Fund aware of any tax positions for which it is reasonably possible that the total amounts of unrecognized tax benefits will significantly change in the next twelve months. The Fund files a U.S. federal tax return, in addition to state and local tax returns as required. A fund's federal income tax returns are subject to examination by the Internal Revenue Service (IRS) for a period of three fiscal years after they are filed. State and local tax returns may be subject to examination for an additional fiscal year depending on the jurisdiction. Foreign taxes are provided for based on the Fund's understanding of the tax rules and rates that exist in the foreign markets in which it invests.
Distributions are declared and recorded on the ex-dividend date. Income dividends and capital gain distributions are declared separately for each class. Income and capital gain distributions are determined in accordance with income tax regulations, which may differ from GAAP. In addition, the Fund claimed a portion of the payment made to redeeming shareholders as a distribution for income tax purposes.
Capital accounts within the financial statements are adjusted for permanent book-tax differences. These adjustments have no impact on net assets or the results of operations. Temporary book-tax differences will reverse in a subsequent period.
Book-tax differences are primarily due to foreign currency transactions and losses deferred due to wash sales.
Annual Report
3. Significant Accounting Policies - continued
Income Tax Information and Distributions to Shareholders - continued
The federal tax cost of investment securities and unrealized appreciation (depreciation) as of period end were as follows:
Gross unrealized appreciation | $ 1,227,810,766 |
Gross unrealized depreciation | (53,133,128) |
Net unrealized appreciation (depreciation) on securities and other investments | $ 1,174,677,638 |
| |
Tax Cost | $ 3,131,813,247 |
The tax-based components of distributable earnings as of period end were as follows:
Undistributed ordinary income | $ 6,475,378 |
Undistributed long-term capital gain | $ 260,802,795 |
Net unrealized appreciation (depreciation) | $ 1,174,679,321 |
The tax character of distributions paid was as follows:
| July 31, 2013 | July 31, 2012 |
Ordinary Income | $ 21,412,021 | $ 3,813,704 |
Long-term Capital Gains | 85,195,362 | 148,970,854 |
Total | $ 106,607,383 | $ 152,784,558 |
Short-Term Trading (Redemption) Fees. Shares held by investors in the Fund less than 90 days may have been subject to a redemption fee equal to 1.50% of the net asset value of shares redeemed. All redemption fees, which reduce the proceeds of the shareholder redemption, are retained by the Fund and accounted for as an addition to paid in capital.
4. Purchases and Sales of Investments.
Purchases and sales of securities, other than short-term securities, aggregated $1,422,626,355 and $998,724,082, respectively.
5. Fees and Other Transactions with Affiliates.
Management Fee. FMR and its affiliates provide the Fund with investment management related services for which the Fund pays a monthly management fee. The management fee is the sum of an individual fund fee rate that is based on an annual rate of .45% of the Fund's average net assets and an annualized group fee rate that averaged .26% during the period. The group fee rate is based upon the average net assets of all the
Annual Report
Notes to Financial Statements - continued
5. Fees and Other Transactions with Affiliates - continued
Management Fee - continued
mutual funds advised by FMR. The group fee rate decreases as assets under management increase and increases as assets under management decrease. In addition, the management fee is subject to a performance adjustment (up to a maximum of ± .20% of the Fund's average net assets over a 36 month performance period). The upward or downward adjustment to the management fee is based on the relative investment performance of Small Cap Value as compared to an appropriate benchmark index. For the period, the total annual management fee rate, including the performance adjustment, was .81% of the Fund's average net assets.
Distribution and Service Plan Fees. In accordance with Rule 12b-1 of the 1940 Act, the Fund has adopted separate Distribution and Service Plans for each class of shares. Certain classes pay Fidelity Distributors Corporation (FDC), an affiliate of FMR, separate Distribution and Service Fees, each of which is based on an annual percentage of each class' average net assets. In addition, FDC may pay financial intermediaries for selling shares of the Fund and providing shareholder support services. For the period, the Distribution and Service Fee rates, total fees and amounts retained by FDC were as follows:
| Distribution
Fee | Service
Fee | Total Fees | Retained
by FDC |
Class A | -% | .25% | $ 521,981 | $ 17,754 |
Class T | .25% | .25% | 393,892 | 3,578 |
Class B | .75% | .25% | 69,430 | 52,493 |
Class C | .75% | .25% | 617,999 | 153,559 |
| | | $ 1,603,302 | $ 227,384 |
Sales Load. FDC may receive a front-end sales charge of up to 5.75% for selling Class A shares and 3.50% for selling Class T shares, some of which is paid to financial intermediaries for selling shares of the Fund. Depending on the holding period, FDC may receive contingent deferred sales charges levied on Class A, Class T, Class B and Class C redemptions. The deferred sales charges range from 5.00% to 1.00% for Class B shares, 1.00% for Class C shares, 1.00% for certain purchases of Class A shares and .25% for certain purchases of Class T shares.
Annual Report
5. Fees and Other Transactions with Affiliates - continued
Sales Load - continued
For the period, sales charge amounts retained by FDC were as follows:
| Retained
by FDC |
Class A | $ 49,310 |
Class T | 9,353 |
Class B* | 5,848 |
Class C* | 4,577 |
| $ 69,088 |
* When Class B and Class C shares are initially sold, FDC pays commissions from its own resources to financial intermediaries through which the sales are made.
Transfer Agent Fees. Fidelity Investments Institutional Operations Company, Inc., (FIIOC), an affiliate of FMR, is the transfer, dividend disbursing and shareholder servicing agent for each class of the Fund. FIIOC receives account fees and asset-based fees that vary according to the account size and type of account of the shareholders of the respective classes of the Fund, except for Class F. FIIOC receives no fees for providing transfer agency services to Class F. FIIOC pays for typesetting, printing and mailing of shareholder reports, except proxy statements. For the period, transfer agent fees for each class were as follows:
| Amount | % of
Average
Net Assets |
Class A | $ 563,024 | .27 |
Class T | 199,649 | .25 |
Class B | 20,848 | .30 |
Class C | 175,062 | .28 |
Small Cap Value | 4,868,907 | .22 |
Institutional Class | 559,678 | .23 |
| $ 6,387,168 | |
Accounting and Security Lending Fees. Fidelity Service Company, Inc. (FSC), an affiliate of FMR, maintains the Fund's accounting records. The accounting fee is based on the level of average net assets for each month. Under a separate contract, FSC administers the security lending program. The security lending fee is based on the number and duration of lending transactions.
Brokerage Commissions. The Fund placed a portion of its portfolio transactions with brokerage firms which are affiliates of the investment adviser. Brokerage commissions are included in net realized gain (loss) and change in net unrealized appreciation
Annual Report
Notes to Financial Statements - continued
5. Fees and Other Transactions with Affiliates - continued
Brokerage Commissions - continued
(depreciation) in the Statement of Operations. The commissions paid to these affiliated firms were $28,205 for the period.
Interfund Lending Program. Pursuant to an Exemptive Order issued by the SEC, the Fund, along with other registered investment companies having management contracts with FMR, may participate in an interfund lending program. This program provides an alternative credit facility allowing the funds to borrow from, or lend money to, other participating affiliated funds. At period end, there were no interfund loans outstanding. The Fund's activity in this program during the period for which loans were outstanding was as follows:
Borrower or Lender | Average Loan
Balance | Weighted Average Interest Rate | Interest
Expense |
Borrower | $ 5,199,400 | .35% | $ 508 |
6. Committed Line of Credit.
The Fund participates with other funds managed by FMR or an affiliate in a $4.25 billion credit facility (the "line of credit") to be utilized for temporary or emergency purposes to fund shareholder redemptions or for other short-term liquidity purposes. The Fund has agreed to pay commitment fees on its pro-rata portion of the line of credit, which amounted to $7,721 and is reflected in Miscellaneous expenses on the Statement of Operations. During the period, there were no borrowings on this line of credit.
7. Security Lending.
The Fund lends portfolio securities through a lending agent from time to time in order to earn additional income. For equity securities, a lending agent is used and may loan securities to certain qualified borrowers, including Fidelity Capital Markets (FCM), a broker-dealer affiliated with the Fund. On the settlement date of the loan, the Fund receives collateral (in the form of U.S. Treasury obligations, letters of credit and/or cash) against the loaned securities and maintains collateral in an amount not less than 100% of the market value of the loaned securities during the period of the loan. The market value of the loaned securities is determined at the close of business of the Fund and any additional required collateral is delivered to the Fund on the next business day. If the borrower defaults on its obligation to return the securities loaned because of insolvency or other reasons, the Fund may apply collateral received from the borrower against the obligation. The Fund may experience delays and costs in recovering the securities loaned. Any cash collateral received is invested in the Fidelity Securities Lending Cash Central Fund. The value of loaned securities and cash collateral at period end are
Annual Report
7. Security Lending - continued
disclosed on the Fund's Statement of Assets and Liabilities. The value of securities loaned to FCM at period end was $3,995,700. Security lending income represents the income earned on investing cash collateral, less rebates paid to borrowers and any lending agent fees associated with the loan, plus any premium payments received for lending certain types of securities. Security lending income is presented in the Statement of Operations as a component of income from Fidelity Central Funds. Total security lending income during the period amounted to $546,053, including $146,197 from securities loaned to FCM.
8. Expense Reductions.
Commissions paid to certain brokers with whom FMR places trades on behalf of the Fund include an amount in addition to trade execution, which is rebated back to the Fund to offset certain expenses. This amount totaled $235,596 for the period.
In addition, FMR reimbursed a portion of the Fund's operating expenses during the period in the amount of $6,754.
9. Distributions to Shareholders.
Distributions to shareholders of each class were as follows:
Years ended July 31, | 2013 | 2012 |
From net investment income | | |
Class A | $ 785,355 | $ 57,416 |
Class T | 231,402 | - |
Class B | 9,411 | - |
Class C | 90,526 | - |
Small Cap Value | 13,318,853 | 2,736,678 |
Class F | 5,669,081 | 858,633 |
Institutional Class | 1,307,393 | 160,977 |
Total | $ 21,412,021 | $ 3,813,704 |
From net realized gain | | |
Class A | $ 5,001,914 | $ 8,369,079 |
Class T | 1,871,336 | 3,332,444 |
Class B | 211,601 | 513,839 |
Class C | 1,589,582 | 2,835,863 |
Small Cap Value | 54,759,308 | 109,450,254 |
Class F | 17,097,966 | 18,207,376 |
Institutional Class | 4,663,655 | 6,261,999 |
Total | $ 85,195,362 | $ 148,970,854 |
Annual Report
Notes to Financial Statements - continued
10. Share Transactions.
Transactions for each class of shares were as follows:
| Shares | Dollars |
Years ended July 31, | 2013 | 2012 | 2013 | 2012 |
Class A | | | | |
Shares sold | 6,665,265 | 3,582,114 | $ 113,825,347 | $ 51,112,084 |
Reinvestment of distributions | 357,182 | 639,382 | 5,478,656 | 7,957,627 |
Shares redeemed | (3,345,663) | (3,203,028) | (56,976,312) | (45,298,282) |
Net increase (decrease) | 3,676,784 | 1,018,468 | $ 62,327,691 | $ 13,771,429 |
Class T | | | | |
Shares sold | 2,420,486 | 1,074,645 | $ 41,524,163 | $ 15,238,625 |
Reinvestment of distributions | 135,952 | 264,657 | 2,060,454 | 3,258,576 |
Shares redeemed | (1,017,057) | (1,066,289) | (17,196,752) | (14,773,000) |
Net increase (decrease) | 1,539,381 | 273,013 | $ 26,387,865 | $ 3,724,201 |
Class B | | | | |
Shares sold | 63,699 | 17,886 | $ 1,033,590 | $ 244,464 |
Reinvestment of distributions | 12,922 | 36,117 | 189,673 | 433,889 |
Shares redeemed | (174,192) | (156,185) | (2,861,489) | (2,129,294) |
Net increase (decrease) | (97,571) | (102,182) | $ (1,638,226) | $ (1,450,941) |
Class C | | | | |
Shares sold | 1,262,288 | 840,854 | $ 20,129,471 | $ 11,606,643 |
Reinvestment of distributions | 98,556 | 202,948 | 1,448,319 | 2,439,209 |
Shares redeemed | (683,043) | (895,789) | (11,003,236) | (12,102,998) |
Net increase (decrease) | 677,801 | 148,013 | $ 10,574,554 | $ 1,942,854 |
Small Cap Value | | | | |
Shares sold | 46,643,321 | 27,786,966 | $ 815,184,196 | $ 403,227,336 |
Reinvestment of distributions | 4,065,017 | 8,564,707 | 63,037,497 | 107,820,730 |
Shares redeemed | (35,306,999) | (41,177,942) | (618,245,939) | (579,334,071) |
Net increase (decrease) | 15,401,339 | (4,826,269) | $ 259,975,754 | $ (68,286,005) |
Class F | | | | |
Shares sold | 7,943,352 | 17,383,615 | $ 133,806,197 | $ 249,495,726 |
Reinvestment of distributions | 1,465,154 | 1,506,337 | 22,767,047 | 19,066,009 |
Shares redeemed | (8,168,596) | (1,906,027) | (151,555,822) | (26,618,099) |
Net increase (decrease) | 1,239,910 | 16,983,925 | $ 5,017,422 | $ 241,943,636 |
Institutional Class | | | | |
Shares sold | 11,988,758 | 4,662,732 | $ 206,274,907 | $ 67,294,175 |
Reinvestment of distributions | 337,968 | 445,761 | 5,246,517 | 5,619,794 |
Shares redeemed | (3,783,835) | (2,373,514) | (66,718,093) | (33,655,059) |
Net increase (decrease) | 8,542,891 | 2,734,979 | $ 144,803,331 | $ 39,258,910 |
Annual Report
11. Other.
The Fund's organizational documents provide former and current trustees and officers with a limited indemnification against liabilities arising in connection with the performance of their duties to the Fund. In the normal course of business, the Fund may also enter into contracts that provide general indemnifications. The Fund's maximum exposure under these arrangements is unknown as this would be dependent on future claims that may be made against the Fund. The risk of material loss from such claims is considered remote.
At the end of the period, Fidelity Freedom Funds and Fidelity Freedom K Funds were the owners of record, in the aggregate, of approximately 31% of the total outstanding shares of the Fund.
Annual Report
To the Trustees of Fidelity Securities Fund and the Shareholders of Fidelity Small Cap Value Fund:
In our opinion, the accompanying statement of assets and liabilities, including the schedule of investments, and the related statements of operations and of changes in net assets and the financial highlights present fairly, in all material respects, the financial position of Fidelity Small Cap Value Fund (a fund of Fidelity Securities Fund) at July 31, 2013, the results of its operations for the year then ended, the changes in its net assets for each of the two years in the period then ended and the financial highlights for each of the five years in the period then ended, in conformity with accounting principles generally accepted in the United States of America. These financial statements and financial highlights (hereafter referred to as "financial statements") are the responsibility of the Fidelity Small Cap Value Fund's management. Our responsibility is to express an opinion on these financial statements based on our audits. We conducted our audits of these financial statements in accordance with the standards of the Public Company Accounting Oversight Board (United States). Those standards require that we plan and perform the audit to obtain reasonable assurance about whether the financial statements are free of material misstatement. An audit includes examining, on a test basis, evidence supporting the amounts and disclosures in the financial statements, assessing the accounting principles used and significant estimates made by management, and evaluating the overall financial statement presentation. We believe that our audits, which included confirmation of securities at July 31, 2013 by correspondence with the custodian and brokers, provide a reasonable basis for our opinion.
PricewaterhouseCoopers LLP
Boston, Massachusetts
September 16, 2013
Annual Report
The Trustees, Member of the Advisory Board, and executive officers of the trust and fund, as applicable, are listed below. The Board of Trustees governs the fund and is responsible for protecting the interests of shareholders. The Trustees are experienced executives who meet periodically throughout the year to oversee the fund's activities, review contractual arrangements with companies that provide services to the fund, oversee management of the risks associated with such activities and contractual arrangements, and review the fund's performance. Except for James C. Curvey, Ned C. Lautenbach, Ronald P. O'Hanley, and William S. Stavropoulos, each of the Trustees oversees 166 Fidelity funds. Mr. Curvey oversees 387 Fidelity funds. Mr. Lautenbach, Mr. O'Hanley, and Mr. Stavropoulos each oversees 230 Fidelity funds.
The Trustees hold office without limit in time except that (a) any Trustee may resign; (b) any Trustee may be removed by written instrument, signed by at least two-thirds of the number of Trustees prior to such removal; (c) any Trustee who requests to be retired or who has become incapacitated by illness or injury may be retired by written instrument signed by a majority of the other Trustees; and (d) any Trustee may be removed at any special meeting of shareholders by a two-thirds vote of the outstanding voting securities of the trust. Each Trustee who is not an interested person of the trust and the fund (as defined in the 1940 Act) (Independent Trustee), shall retire not later than the last day of the calendar year in which his or her 75th birthday occurs. The Independent Trustees may waive this mandatory retirement age policy with respect to individual Trustees. The executive officers and Advisory Board Member hold office without limit in time, except that any officer and Advisory Board Member may resign or may be removed by a vote of a majority of the Trustees at any regular meeting or any special meeting of the Trustees. Except as indicated, each individual has held the office shown or other offices in the same company for the past five years.
Experience, Skills, Attributes, and Qualifications of the Fund's Trustees. The Governance and Nominating Committee has adopted a statement of policy that describes the experience, qualifications, attributes, and skills that are necessary and desirable for potential Independent Trustee candidates (Statement of Policy). The Board believes that each Trustee satisfied at the time he or she was initially elected or appointed a Trustee, and continues to satisfy, the standards contemplated by the Statement of Policy. The Governance and Nominating Committee also engages professional search firms to help identify potential Independent Trustee candidates who have the experience, qualifications, attributes, and skills consistent with the Statement of Policy. From time to time, additional criteria based on the composition and skills of the current Independent Trustees, as well as experience or skills that may be appropriate in light of future changes to board composition, business conditions, and regulatory or other developments, have also been considered by the professional search firms and the Governance and Nominating Committee. In addition, the Board takes into account the Trustees' commitment and participation in Board and committee meetings, as well as their leadership of standing and ad hoc committees throughout their tenure.
Annual Report
In determining that a particular Trustee was and continues to be qualified to serve as a Trustee, the Board has considered a variety of criteria, none of which, in isolation, was controlling. The Board believes that, collectively, the Trustees have balanced and diverse experience, qualifications, attributes, and skills, which allow the Board to operate effectively in governing the fund and protecting the interests of shareholders. Information about the specific experience, skills, attributes, and qualifications of each Trustee, which in each case led to the Board's conclusion that the Trustee should serve (or continue to serve) as a trustee of the fund, is provided below.
Board Structure and Oversight Function. James C. Curvey is an interested person (as defined in the 1940 Act) and currently serves as Chairman. The Trustees have determined that an interested Chairman is appropriate and benefits shareholders because an interested Chairman has a personal and professional stake in the quality and continuity of services provided to the fund. Independent Trustees exercise their informed business judgment to appoint an individual of their choosing to serve as Chairman, regardless of whether the Trustee happens to be independent or a member of management. The Independent Trustees have determined that they can act independently and effectively without having an Independent Trustee serve as Chairman and that a key structural component for assuring that they are in a position to do so is for the Independent Trustees to constitute a substantial majority for the Board. The Independent Trustees also regularly meet in executive session. Ned C. Lautenbach serves as Chairman of the Independent Trustees and as such (i) acts as a liaison between the Independent Trustees and management with respect to matters important to the Independent Trustees and (ii) with management prepares agendas for Board meetings.
Fidelity funds are overseen by different Boards of Trustees. The fund's Board oversees Fidelity's equity and high income funds and another Board oversees Fidelity's investment-grade bond, money market, and asset allocation funds. The asset allocation funds may invest in Fidelity funds overseen by the fund's Board. The use of separate Boards, each with its own committee structure, allows the Trustees of each group of Fidelity funds to focus on the unique issues of the funds they oversee, including common research, investment, and operational issues. On occasion, the separate Boards establish joint committees to address issues of overlapping consequences for the Fidelity funds overseen by each Board.
The Trustees operate using a system of committees to facilitate the timely and efficient consideration of all matters of importance to the Trustees, the fund, and fund shareholders and to facilitate compliance with legal and regulatory requirements and oversight of the fund's activities and associated risks. The Board, acting through its committees, has charged FMR and its affiliates with (i) identifying events or circumstances the occurrence of which could have demonstrably adverse effects on the fund's business and/or reputation; (ii) implementing processes and controls to lessen the possibility that such events or circumstances occur or to mitigate the effects of such events or circumstances if they do occur; and (iii) creating and maintaining a system designed to evaluate continuously business and market conditions in order to facilitate the identification and implementation processes described in (i) and (ii) above. Because the day-to-day operations and activities of the fund's are carried out by or through FMR, its affiliates and other service providers, the fund's exposure to risks is mitigated but not eliminated by the processes overseen by the Trustees. While each of the Board's committees has responsibility for overseeing different aspects of the fund's activities, oversight is exercised primarily through the Operations, Audit, and Compliance Committees. In addition, the Independent Trustees have worked with FMR to enhance the Board's oversight of investment and financial risks, legal and regulatory risks, technology risks, and operational risks, including the development of additional risk reporting to the Board. For example, a working group comprised of Independent Trustees and FMR has worked and continues to work to review the Fidelity funds' valuation-related activities, reporting and risk management. Appropriate personnel, including but not limited to the fund's Chief Compliance Officer (CCO), FMR's internal auditor, the independent accountants, the fund's Treasurer and portfolio management personnel, make periodic reports to the Board's committees, as appropriate, including an annual review of FMR's risk management program for the Fidelity funds. The responsibilities of each standing committee, including their oversight responsibilities, are described further under "Standing Committees of the Fund's Trustees."
Annual Report
Trustees and Officers - continued
The fund's Statement of Additional Information (SAI) includes more information about the Trustees. To request a free copy, call Fidelity at 1-800-544-8544.
Interested Trustees*:
Correspondence intended for each Trustee who is an interested person may be sent to Fidelity Investments, 245 Summer Street, Boston, Massachusetts 02210.
Name, Year of Birth; Principal Occupations and Other Relevant Experience+ |
James C. Curvey (1935) |
| Year of Election or Appointment: 2007 Mr. Curvey is Trustee and Chairman of the Board of Trustees of certain Trusts. Mr. Curvey also serves as Trustee (2007-present) of other investment companies advised by FMR. Mr. Curvey is a Director of Fidelity Investments Money Management, Inc. (2009-present), Director of Fidelity Research & Analysis Co. (2009-present) and Director of FMR and FMR Co., Inc. (2007-present). Mr. Curvey is also Vice Chairman (2007-present) and Director of FMR LLC. In addition, Mr. Curvey serves as an Overseer for the Boston Symphony Orchestra and a member of the Trustees of Villanova University. Previously, Mr. Curvey was the Vice Chairman (2006-2007) and Director (2000-2007) of FMR Corp. |
Ronald P. O'Hanley (1957) |
| Year of Election or Appointment: 2011 Mr. O'Hanley serves as a Trustee and Chairman of the Board of Trustees of other Fidelity funds (2013-present), and is Director of FMR Co., Inc. (2010-present), Director of Fidelity Investments Money Management, Inc. (2010-present), Director of Fidelity Research & Analysis Company (2010-present), President of Fidelity Asset Management and Corporate Services and a Member of Fidelity's Executive Committee (2010-present). Previously, Mr. O'Hanley served as President and Chief Executive Officer of BNY Mellon Asset Management (2007-2010). Mr. O'Hanley also served as Vice Chairman of Bank New York Mellon Corp. and a member of that firm's Executive Committee. Prior to the 2007 merger of The Bank of New York and Mellon Financial Corporation, he was Vice Chairman of Mellon Financial Corporation and President and Chief Executive Officer of Mellon Asset Management. He joined Mellon in February 1997. Mr. O'Hanley currently serves as Chairman of the Boston Public Library Foundation Board of Directors and sits on the Board of Directors of Beth Israel Deaconess Medical Center, the Board of Trustees of the Marine Biological Laboratory and the Advisory Board of the Maxwell School of Citizenship and Public Administration at Syracuse University. Mr. O'Hanley also chairs the Council on Asset Management for the Financial Services Roundtable and is a member of the Board of Directors of Institutional Investor's U.S. Institute. |
* Trustees have been determined to be "Interested Trustees" by virtue of, among other things, their affiliation with the trust or various entities under common control with FMR.
+ The information above includes each Trustee's principal occupation during the last five years and other information relating to the experience, attributes, and skills relevant to each Trustee's qualifications to serve as a Trustee, which led to the conclusion that each Trustee should serve as a Trustee for the fund.
Annual Report
Trustees and Officers - continued
Independent Trustees:
Correspondence intended for each Independent Trustee (that is, the Trustees other than the Interested Trustees) may be sent to Fidelity Investments, P.O. Box 55235, Boston, Massachusetts 02205-5235.
Name, Year of Birth; Principal Occupations and Other Relevant Experience+ |
Dennis J. Dirks (1948) |
| Year of Election or Appointment: 2005 Prior to his retirement in May 2003, Mr. Dirks was Chief Operating Officer and a member of the Board of The Depository Trust & Clearing Corporation (DTCC). He also served as President, Chief Operating Officer, and Board member of The Depository Trust Company (DTC) and President and Board member of the National Securities Clearing Corporation (NSCC). In addition, Mr. Dirks served as Chief Executive Officer and Board member of the Government Securities Clearing Corporation, Chief Executive Officer and Board member of the Mortgage-Backed Securities Clearing Corporation, as a Trustee and a member of the Finance Committee of Manhattan College (2005-2008), and as a Trustee and a member of the Finance Committee of AHRC of Nassau County (2006-2008). Mr. Dirks is a member of the Independent Directors Council (IDC) Governing Council (2010-present) and Board of Directors for The Brookville Center for Children's Services, Inc. (2009-present). |
Alan J. Lacy (1953) |
| Year of Election or Appointment: 2008 Mr. Lacy serves as Senior Adviser (2007-present) of Oak Hill Capital Partners, L.P. (private equity). Mr. Lacy also served as Chief Executive Officer (2000-2005) and Vice Chairman (2005-2006) of Sears Holdings Corporation and Sears, Roebuck and Co. (retail). In addition, Mr. Lacy serves as a member of the Board of Directors of Dave & Buster's Entertainment, Inc. (restaurant and entertainment complexes, 2010-present), Earth Fare, Inc. (retail grocery, 2012-present), The Hillman Companies, Inc. (hardware wholesalers, 2010-present), and Bristol-Myers Squibb Company (global pharmaceuticals, 2008-present). Mr. Lacy is a member of the Board of Trustees of The National Parks Conservation Association (2006-present). Previously, Mr. Lacy served as Chairman of the Board of Trustees of the National Parks Conservation Association (2008-2011) and as a member of the Board of Directors for the Western Union Company (global money transfer, 2006-2011). |
Ned C. Lautenbach (1944) |
| Year of Election or Appointment: 2000 Mr. Lautenbach is Chairman of the Independent Trustees of the Equity and High Income Funds (2006-present) and serves as a Trustee of other Fidelity funds (2013-present). Mr. Lautenbach currently serves as the Lead Director of the Eaton Corporation Board of Directors (diversified industrial, 1997-present). Mr. Lautenbach is Chairman of the Board of Directors of the Philharmonic Center for the Arts in Naples, Florida (2012-present) and a member of the Council on Foreign Relations (1994-present). Previously, Mr. Lautenbach was a Partner/Advisory Partner at Clayton, Dubilier & Rice, LLC (private equity investment, 1998-2010), as well as a Director of Sony Corporation (2006-2007). |
Joseph Mauriello (1944) |
| Year of Election or Appointment: 2008 Prior to his retirement in January 2006, Mr. Mauriello served in numerous senior management positions including Deputy Chairman and Chief Operating Officer (2004-2005), and Vice Chairman of Financial Services (2002-2004) of KPMG LLP US (professional services, 1965-2005). Mr. Mauriello currently serves as a member of the Board of Directors of XL Group plc. (global insurance and re-insurance, 2006-present). Previously, Mr. Mauriello served as a Director of the Hamilton Funds of the Bank of New York (2006-2007) and of Arcadia Resources Inc. (health care services and products, 2007-2012). |
Robert W. Selander (1950) |
| Year of Election or Appointment: 2011 Previously, Mr. Selander served as a Member of the Advisory Board of Fidelity's Equity and High Income Funds (2011), Executive Vice Chairman (2010), Chief Executive Officer (2009-2010), and President and Chief Executive Officer (1997-2009) of Mastercard, Inc. |
Cornelia M. Small (1944) |
| Year of Election or Appointment: 2005 Ms. Small is a member of the Board of Directors (2009-present) and Chair of the Investment Committee (2010-present) of the Teagle Foundation. Ms. Small also serves on the Investment Committee of the Berkshire Taconic Community Foundation (2008-present). Previously, Ms. Small served as Chairperson (2002-2008) and a member of the Investment Committee and Chairperson (2008-2012) and a member of the Board of Trustees of Smith College. In addition, Ms. Small served as Chief Investment Officer, Director of Global Equity Investments, and a member of the Board of Directors of Scudder, Stevens & Clark and Scudder Kemper Investments. |
William S. Stavropoulos (1939) |
| Year of Election or Appointment: 2002 Mr. Stavropoulos is Vice Chairman of the Independent Trustees of the Equity and High Income Funds (2006-present) and serves as a Trustee of other Fidelity funds (2013-present). Mr. Stavropoulos serves as President and Founder of the Michigan Baseball Foundation, the Great Lakes Loons (2007-present). Mr. Stavropoulos is Chairman Emeritus of the Board of Directors of The Dow Chemical Company, where he previously served in numerous senior management positions, including President, CEO (1995-2000; 2002-2004), Chairman of the Executive Committee (2000-2006), and as a member of the Board of Directors (1990-2006). Currently, Mr. Stavropoulos is Chairman of the Board of Directors of Univar Inc. (global distributor of commodity and specialty chemicals), a Director of Teradata Corporation (data warehousing and technology solutions), and Maersk Inc. (industrial conglomerate), and a member of the Advisory Board for Metalmark Capital LLC (private equity investment, 2005-present). Mr. Stavropoulos is an operating advisor to Clayton, Dubilier & Rice, LLC (private equity investment). In addition, Mr. Stavropoulos is a member of the University of Notre Dame Advisory Council for the College of Science, a Trustee of the Rollin L. Gerstacker Foundation, and a Director of the Naples Philharmonic Center for the Arts. Previously, Mr. Stavropoulos served as a Director of Chemical Financial Corporation (bank holding company, 1993-2012) and Tyco International, Ltd. (multinational manufacturing and services, 2007-2012). |
David M. Thomas (1949) |
| Year of Election or Appointment: 2008 Previously, Mr. Thomas served as Executive Chairman (2005-2006) and Chairman and Chief Executive Officer (2000-2005) of IMS Health, Inc. (pharmaceutical and healthcare information solutions), and a Director of Fortune Brands, Inc. (consumer products, 2000-2011). In addition, Mr. Thomas serves as Non-Executive Chairman of the Board of Directors of Fortune Brands Home and Security (home and security products, 2011-present), and as a member of the Board of Directors of Interpublic Group of Companies, Inc. (marketing communication, 2004-present). |
+ The information above includes each Trustee's principal occupation during the last five years and other information relating to the experience, attributes, and skills relevant to each Trustee's qualifications to serve as a Trustee, which led to the conclusion that each Trustee should serve as a Trustee for the fund.
Annual Report
Advisory Board Member and Executive Officers:
Correspondence intended for each executive officer and Peter S. Lynch may be sent to Fidelity Investments, 245 Summer Street, Boston, Massachusetts 02210.
Name, Year of Birth; Principal Occupation |
Peter S. Lynch (1944) |
| Year of Election or Appointment: 2003 Member of the Advisory Board of Fidelity's Equity and High Income Funds. Mr. Lynch is Vice Chairman and a Director of FMR and FMR Co., Inc. In addition, Mr. Lynch serves as a Trustee of Boston College and as the Chairman of the Inner-City Scholarship Fund. Previously, Mr. Lynch served on the Special Olympics International Board of Directors (1997-2006). |
Kenneth B. Robins (1969) |
| Year of Election or Appointment: 2008 President and Treasurer of Fidelity's Equity and High Income Funds. Mr. Robins also serves as President and Treasurer (2008-present) and Assistant Treasurer (2009-present) of other Fidelity funds and is an employee of Fidelity Investments (2004-present). Mr. Robins serves as Executive Vice President of Fidelity Investments Money Management, Inc. (FIMM) (2013-present). Previously, Mr. Robins served as Deputy Treasurer of the Fidelity funds (2005-2008) and Treasurer and Chief Financial Officer of The North Carolina Capital Management Trust: Cash and Term Portfolios (2006-2008). |
Brian B. Hogan (1964) |
| Year of Election or Appointment: 2009 Vice President of Equity and High Income Funds. Mr. Hogan also serves as Vice President of other Fidelity funds (2009-present) and President of FMR's Equity Division (2009-present). Previously, Mr. Hogan served as Senior Vice President, Equity Research of FMR (2006-2009) and as a portfolio manager. |
Thomas C. Hense (1964) |
| Year of Election or Appointment: 2008 or 2010 Vice President of Fidelity's High Income (2008), Small Cap (2008), and Value (2010) Funds. Previously, Mr. Hense served as a portfolio manager for Fidelity's Institutional Money Management Group (Pyramis) (2003-2008). |
Scott C. Goebel (1968) |
| Year of Election or Appointment: 2008 Secretary and Chief Legal Officer (CLO) of the Fidelity funds. Mr. Goebel also serves as Secretary of Fidelity Investments Money Management, Inc. (FIMM) (2010-present) and Fidelity Research and Analysis Company (FRAC) (2010-present); Secretary and CLO of The North Carolina Capital Management Trust: Cash and Term Portfolios (2008-present); General Counsel, Secretary, and Senior Vice President of FMR (2008-present) and FMR Co., Inc. (2008-present); employed by FMR LLC or an affiliate (2001-present); Chief Legal Officer of Fidelity Management & Research (Hong Kong) Limited (2008-present) and Assistant Secretary of Fidelity Management & Research (Japan) Inc. (2008-present), and Fidelity Management & Research (U.K.) Inc. (2008-present). Previously, Mr. Goebel served as Assistant Secretary of FIMM (2008-2010), FRAC (2008-2010), and the Funds (2007-2008) and as Vice President and Secretary of Fidelity Distributors Corporation (FDC) (2005-2007). |
William C. Coffey (1969) |
| Year of Election or Appointment: 2009 Assistant Secretary of Fidelity's Equity and High Income Funds. Mr. Coffey also serves as Assistant Secretary of other Fidelity funds (2009-present), Senior Vice President and Deputy General Counsel of FMR LLC (2010-present), and is an employee of Fidelity Investments. Previously, Mr. Coffey served as Vice President and Associate General Counsel of FMR LLC (2005-2009). |
Elizabeth Paige Baumann (1968) |
| Year of Election or Appointment: 2012 Anti-Money Laundering (AML) Officer of the Fidelity funds. Ms. Baumann also serves as AML Officer of The North Carolina Capital Management Trust: Cash and Term Portfolios (2012-present), Chief AML Officer of FMR LLC (2012-present), and is an employee of Fidelity Investments. Previously, Ms. Baumann served as Vice President and Deputy Anti-Money Laundering Officer (2007-2012). |
Christine Reynolds (1958) |
| Year of Election or Appointment: 2008 Chief Financial Officer of the Fidelity funds. Ms. Reynolds became President of Fidelity Pricing and Cash Management Services (FPCMS) in August 2008. Ms. Reynolds served as Chief Operating Officer of FPCMS (2007-2008). Previously, Ms. Reynolds served as President, Treasurer, and Anti-Money Laundering officer of the Fidelity funds (2004-2007). |
Joseph A. Hanlon (1968) |
| Year of Election or Appointment: 2012 Chief Compliance Officer of Fidelity's Equity and High Income Funds. Mr. Hanlon also serves as Chief Compliance Officer of other Fidelity funds (2012-present). Mr. Hanlon serves as Compliance Officer of FMR, FMR Co., Inc., Fidelity Investments Money Management, Inc. (FIMM), Fidelity Research and Analysis Company (FRAC), and Fidelity Management & Research (Hong Kong) (2009-present), as Senior Vice President of the Fidelity Asset Management Division (2009-present), and is an employee of Fidelity Investments. Previously, Mr. Hanlon served as Compliance Officer of Fidelity Management & Research (Japan) Inc. (2009-2013), Strategic Advisers, Inc. (2009-2013), and Fidelity Management & Research (U.K.) Inc. (2009-2013). |
Joseph F. Zambello (1957) |
| Year of Election or Appointment: 2011 Deputy Treasurer of the Fidelity funds. Mr. Zambello is an employee of Fidelity Investments. Previously, Mr. Zambello served as Vice President of FMR's Program Management Group (2009-2011) and Vice President of the Transfer Agent Oversight Group (2005-2009). |
Adrien E. Deberghes (1967) |
| Year of Election or Appointment: 2008 Deputy Treasurer of Fidelity's Equity and High Income Funds. Mr. Deberghes also serves as Vice President (2011-present), Deputy Treasurer (2008-present), and Assistant Treasurer (2010-present) of other Fidelity funds, and is an employee of Fidelity Investments (2008-present). Previously, Mr. Deberghes served as Senior Vice President of Mutual Fund Administration at State Street Corporation (2007-2008), Senior Director of Mutual Fund Administration at Investors Bank & Trust (2005-2007), and Director of Finance for Dunkin' Brands (2000-2005). |
Stephen Sadoski (1971) |
| Year of Election or Appointment: 2012 Deputy Treasurer of Fidelity's Equity and High Income Funds. Mr. Sadoski also serves as Deputy Treasurer of other Fidelity funds (2012-present) and is an employee of Fidelity Investments (2012-present). Previously, Mr. Sadoski served as Assistant Treasurer of Fidelity's Fixed Income and Asset Allocation Funds (2012-2013), an assistant chief accountant in the Division of Investment Management of the Securities and Exchange Commission (SEC) (2009-2012) and as a senior manager at Deloitte & Touche LLP (1997-2009). |
Stacie M. Smith (1974) |
| Year of Election or Appointment: 2013 Deputy Treasurer of Fidelity's Equity and High Income Funds. Ms. Smith also serves as Deputy Treasurer of other Fidelity funds (2013-present) and is an employee of Fidelity Investments (2009-present). Previously, Ms. Smith served as Senior Audit Manager of Ernst & Young LLP (1996-2009). |
Stephanie J. Dorsey (1969) |
| Year of Election or Appointment: 2010 Assistant Treasurer of Fidelity's Equity and High Income Funds. Ms. Dorsey also serves as President and Treasurer (2013-present) and Assistant Treasurer (2010-present) of other Fidelity funds, Treasurer and Chief Financial Officer of The North Carolina Capital Management Trust: Cash and Term Portfolios (2013-present), and is an employee of Fidelity Investments (2008-present). Previously, Ms. Dorsey served as Deputy Treasurer of Fidelity's Fixed Income and Asset Allocation Funds (2008-2013), Treasurer (2004-2008) of the JPMorgan Mutual Funds and Vice President (2004-2008) of JPMorgan Chase Bank. |
Gary W. Ryan (1958) |
| Year of Election or Appointment: 2005 Assistant Treasurer of the Fidelity funds. Mr. Ryan is an employee of Fidelity Investments. Previously, Mr. Ryan served as Vice President of Fund Reporting in Fidelity Pricing and Cash Management Services (FPCMS) (1999-2005). |
Jonathan Davis (1968) |
| Year of Election or Appointment: 2010 Assistant Treasurer of the Fidelity funds. Mr. Davis is also Assistant Treasurer of Fidelity Rutland Square Trust II and Fidelity Commonwealth Trust II. Mr. Davis is an employee of Fidelity Investments. Previously, Mr. Davis served as Vice President and Associate General Counsel of FMR LLC (2003-2010). |
Annual Report
The Board of Trustees of Fidelity Small Cap Value Fund voted to pay on September 16, 2013 to shareholders of record at the opening of business on September 13, 2013, a distribution of $1.252 per share derived from capital gains realized from sales of portfolio securities and a dividend of $0.032 per share from net investment income.
Small Cap Value Fund designates 100% of the dividends distributed during the fiscal year as qualifying for the dividends-received deduction for corporate shareholders.
Small Cap Value Fund designates 100% of the dividends distributed during the fiscal year as amounts which can be taken into account as a dividend for the purposes of the maximum rate under section 1(h)(11) of the Internal Revenue Code.
The fund hereby designates as a capital gain dividend with respect to the taxable year ended July 31, 2013, $300,428,923, or, if subsequently determined to be different, the net capital gain of such year.
The fund will notify shareholders in January 2014 of amounts for use in preparing 2013 income tax returns.
Annual Report
Board Approval of Investment Advisory Contracts and Management Fees
Fidelity Small Cap Value Fund
Each year, the Board of Trustees, including the Independent Trustees (together, the Board), votes on the renewal of the management contract and sub-advisory agreements (together, the Advisory Contracts) for the fund. The Board, assisted by the advice of fund counsel and Independent Trustees' counsel, requests and considers a broad range of information relevant to the renewal of the Advisory Contracts throughout the year.
The Board meets regularly and, at each of its meetings, covers an extensive agenda of topics and materials and considers factors that are relevant to its annual consideration of the renewal of the fund's Advisory Contracts, including the services and support provided to the fund and its shareholders. The Board has established various standing committees, each composed of and chaired by Independent Trustees with varying backgrounds, to which the Board has assigned specific subject matter responsibilities in order to enhance effective decision-making by the Board. The Board, acting directly and through its Committees, requests and receives information concerning the annual consideration of the renewal of the fund's Advisory Contracts. The Board also meets as needed to consider matters specifically related to the Board's annual consideration of the renewal of Advisory Contracts. Members of the Board may also meet with trustees of other Fidelity funds through ad hoc joint committees to discuss certain matters relevant to the Fidelity funds.
At its July 2013 meeting, the Board, including the Independent Trustees, unanimously determined to renew the fund's Advisory Contracts. In reaching its determination, the Board considered all factors it believed relevant, including (i) the nature, extent, and quality of the services to be provided to the fund and its shareholders (including the investment performance of the fund); (ii) the competitiveness of the fund's management fee and total expense ratio relative to peer funds; (iii) the total costs of the services to be provided by and the profits to be realized by Fidelity from its relationship with the fund; (iv) the extent to which economies of scale exist and would be realized as the fund grows; and (v) whether fee levels reflect these economies of scale, if any, for the benefit of fund shareholders.
In considering whether to renew the Advisory Contracts for the fund, the Board reached a determination, with the assistance of fund counsel and Independent Trustees' counsel and through the exercise of its business judgment, that the renewal of the Advisory Contracts was in the best interests of the fund and its shareholders and that the compensation payable under the Advisory Contracts was fair and reasonable. The Board's decision to renew the Advisory Contracts was not based on any single factor, but rather was based on a comprehensive consideration of all the information provided to the Board at its meetings throughout the year. The Board, in reaching its determination to renew the Advisory Contracts, was aware that shareholders in the fund have a broad range of investment choices available to them, including a wide choice among mutual funds offered by Fidelity's competitors, and that the fund's shareholders, who have the opportunity to review and weigh the disclosure provided by the fund in its prospectus and other public disclosures, have chosen to invest in this fund, which is a part of the Fidelity family of funds.
Annual Report
Nature, Extent, and Quality of Services Provided. The Board considered the staffing within the investment adviser, Fidelity Management & Research Company (FMR), and the sub-advisers (together, the Investment Advisers) as it relates to the fund, including the backgrounds of the fund's investment personnel, and also considered the fund's investment objective, strategies, and related investment philosophy. The Independent Trustees also had discussions with senior management of Fidelity's investment operations and investment groups. The Board considered the structure of the portfolio manager compensation program and whether this structure provides appropriate incentives to act in the best interests of the fund.
Resources Dedicated to Investment Management and Support Services. The Board and the Fund Oversight and Research Committees reviewed the general qualifications and capabilities of the Investment Advisers' investment staff, including its size, education, experience, and resources, as well as the Investment Advisers' approach to recruiting, training, managing, and compensating investment personnel. The Board noted that FMR has continued to increase the resources devoted to non-U.S. offices, including expansion of Fidelity's global investment organization. The Board also noted that Fidelity's analysts have extensive resources, tools and capabilities that allow them to conduct sophisticated quantitative and fundamental analysis, as well as credit analysis of issuers, counterparties and guarantors. Further, the Board believes that Fidelity's investment professionals have sufficient access to global information and data so as to provide competitive investment results over time, and that those professionals also have access to sophisticated tools that permit them to assess portfolio construction and risk and performance attribution characteristics continuously, as well as to transmit new information and research conclusions rapidly around the world. Additionally, in its deliberations, the Board considered the Investment Advisers' trading and risk management capabilities and resources, which are an integral part of the investment management process.
Shareholder and Administrative Services. The Board considered (i) the nature, extent, quality, and cost of advisory, administrative, and shareholder services performed by the Investment Advisers and their affiliates under the Advisory Contracts and under separate agreements covering transfer agency, pricing and bookkeeping, and securities lending services for the fund; (ii) the nature and extent of the supervision of third party service providers, principally custodians and subcustodians; and (iii) the resources devoted to, and the record of compliance with, the fund's compliance policies and procedures. The Board also reviewed the allocation of fund brokerage, including allocations to brokers affiliated with the Investment Advisers, the use of brokerage commissions to pay fund expenses, and the use of "soft" commission dollars to pay for research services.
Annual Report
Board Approval of Investment Advisory Contracts and
Management Fees - continued
The Board noted that the growth of fund assets over time across the complex allows Fidelity to reinvest in the development of services designed to enhance the value or convenience of the Fidelity funds as investment vehicles. These services include 24-hour access to account information and market information through telephone representatives and over the Internet, investor education materials and asset allocation tools, and the expanded availability of Fidelity Investor Centers.
Investment in a Large Fund Family. The Board considered the benefits to shareholders of investing in a Fidelity fund, including the benefits of investing in a fund that is part of a large family of funds offering a variety of investment disciplines and providing a large variety of mutual fund investor services. The Board noted that Fidelity had taken, or had made recommendations that resulted in the Fidelity funds taking, a number of actions over the previous year that benefited particular funds, including (i) continuing to dedicate additional resources to investment research and to the support of the senior management team that oversees asset management; (ii) persisting in efforts to enhance Fidelity's global research capabilities; (iii) launching new funds and making other enhancements to meet client needs for global and income-oriented solutions; (iv) continuing to launch dedicated lower cost underlying funds to meet portfolio construction needs related to expanding underlying fund options for Fidelity funds of funds, specifically for the Freedom Fund product lines; (v) rationalizing product lines and gaining increased efficiencies through the mergers of several funds into other funds; (vi) strengthening Fidelity's index fund offerings by reducing investment minimums and adopting or lowering existing expense caps for certain funds and classes; (vii) enhancing Global Asset Allocation product offerings by launching new funds and strategies, including "open architecture" target date funds that utilize affiliated and unaffiliated sub-advisers; (viii) modifying the eligibility criteria for Institutional Class shares of Advisor funds to increase their marketability to a portion of the defined contribution plan market; (ix) creating a new low-cost retirement share class for certain Advisor funds to appeal to large retirement plans; (x) transitioning the management of certain Fidelity commodity funds to Geode Capital Management LLC, a registered commodity pool operator, while retaining administrative responsibilities for the funds; (xi) reorganizing a number of funds; and (xii) taking steps toward establishing a new Fidelity adviser to manage sector-based funds and products.
Investment Performance. The Board considered whether the fund has operated in accordance with its investment objective, as well as its record of compliance with its investment restrictions and its performance history. The Board noted that there was a portfolio management change for the fund in January 2013.
Annual Report
The Board took into account discussions with the Investment Advisers about fund investment performance that occur at Board meetings throughout the year. In this regard the Board noted that as part of regularly scheduled fund reviews and other reports to the Board on fund performance, the Board periodically considers annualized return information for the fund, for different time periods, measured against a securities market index ("benchmark index") and a peer group of mutual funds with similar objectives ("peer group"). In its evaluation of fund investment performance, the Board gave particular attention to information indicating changes in performance of certain Fidelity funds for specific time periods and the Investment Advisers' explanations for any overperformance or underperformance.
In addition to reviewing absolute and relative fund performance, the Independent Trustees periodically consider the appropriateness of fund performance metrics in evaluating the results achieved. In general, the Independent Trustees believe that fund performance should be evaluated based on net performance (after fees and expenses) of both the highest performing and lowest performing classes, where applicable, compared to appropriate benchmark indices, over appropriate time periods which may include full market cycles, and compared to peer groups, as applicable, over the same periods, taking into account relevant factors including the following: general market conditions; issuer-specific information; tactical opportunities for investment; and fund cash flows and other factors.
The Independent Trustees recognize that shareholders evaluate performance on a net basis over their own holding periods, for which one-, three-, and five-year periods are used as a proxy. For this reason, the performance information reviewed by the Board also included net cumulative calendar year total return information for the fund and an appropriate benchmark index and peer group for the most recent one-, three-, and five-year periods, as shown below. Returns are shown compared to the 25th percentile (top of box) and 75th percentile (bottom of box) of the peer universe.
Annual Report
Board Approval of Investment Advisory Contracts and
Management Fees - continued
Fidelity Small Cap Value Fund

The Board also considered that the fund's management fee is subject to upward or downward adjustment depending upon whether, and to what extent, the fund's investment performance for the performance period exceeds, or is exceeded by, a securities index, thus leading to a performance adjustment for the same period. The Board noted that the performance adjustment provides FMR with a strong economic incentive to seek to achieve superior performance for the fund's shareholders and helps to more closely align the interests of FMR and the fund's shareholders.
Based on its review, the Board concluded that the nature, extent, and quality of services provided to the fund under the Advisory Contracts should benefit the fund's shareholders.
Competitiveness of Management Fee and Total Expense Ratio. The Board considered the fund's management fee and total expense ratio compared to "mapped groups" of competitive funds and classes. Fidelity creates "mapped groups" by combining similar Lipper investment objective categories that have comparable management fee characteristics. Combining Lipper investment objective categories aids the Board's management fee and total expense ratio comparisons by broadening the competitive group used for comparison and by reducing the number of universes to which various Fidelity funds are compared.
Management Fee. The Board considered two proprietary management fee comparisons for the 12-month periods shown in the chart below. The group of Lipper funds used by the Board for management fee comparisons is referred to below as the "Total Mapped Group." The Total Mapped Group comparison focuses on a fund's standing in terms of gross management fees before expense reimbursements or caps, and without giving effect to the fund's performance adjustment, relative to the total universe of funds with comparable investment mandates, regardless of whether their management fee structures also are comparable. Funds with comparable investment mandates offer exposure to similar types of securities. Funds with comparable management fee structures have similar management fee contractual arrangements (e.g., flat rate charged for advisory services, all-inclusive fee rate, etc.). "TMG %" represents the percentage of funds in the Total Mapped Group that had management fees that were lower than the fund's. For example, a TMG % of 14% means that 86% of the funds in the Total Mapped Group had higher management fees than the fund. The "Asset-Size Peer Group" (ASPG) comparison focuses on a fund's standing relative to a subset of non-Fidelity funds within the Total Mapped Group that are similar in size and management fee structure. The ASPG represents at least 15% of the funds in the Total Mapped Group with comparable asset size and management fee structures, subject to a minimum of 50 funds (or all funds in the Total Mapped Group if fewer than 50). Additional information, such as the ASPG quartile in which the fund's management fee ranked and the impact of the fund's performance adjustment, is also included in the chart and considered by the Board.
Annual Report
Fidelity Small Cap Value Fund

The Board noted that the fund's management fee ranked below the median of its Total Mapped Group and below the median of its ASPG for 2012. The Board also noted the effect of the fund's positive performance adjustment on the fund's management fee ranking.
Annual Report
Board Approval of Investment Advisory Contracts and
Management Fees - continued
Based on its review, the Board concluded that the fund's management fee is fair and reasonable in light of the services that the fund receives and the other factors considered.
Total Expense Ratio. In its review of each class's total expense ratio, the Board considered the fund's management fee as well as other fund or class expenses, as applicable, such as transfer agent fees, pricing and bookkeeping fees, fund-paid 12b-1 fees, and custodial, legal, and audit fees. The Board also noted the effects of any waivers and reimbursements on fees and expenses, as well as the impact of the fund's performance adjustment. As part of its review, the Board also considered the current and historical total expense ratios of each class of the fund compared to competitive fund median expenses. Each class of the fund is compared to those funds and classes in the Total Mapped Group (used by the Board for management fee comparisons) that have a similar sales load structure.
The Board noted that the total expense ratio of each of Institutional Class, the retail class and Class F ranked below its competitive median for 2012, the total expense ratio of Class A ranked equal to its competitive median for 2012, and the total expense ratio of each of Class T, Class B and Class C ranked above its competitive median for 2012. The Board considered that, in general, various factors can affect total expense ratios. The Board noted that the total expense ratio of Class T was above the competitive median primarily because of higher 12b-1 fees on Class T. Class T has a higher 12b-1 fee, but a lower front-end sales charge, than traditionally priced front-end sales charge classes. The Board considered that Class T is primarily sold load-waived in the retirement plan market where its 0.50% 12b-1 fee is comparable to competing no-load, higher 12b-1 fee classes designed specifically for retirement plans. The Board noted that the fund offers multiple classes, each of which has a different sales load and 12b-1 fee structure, and that the multiple structures are intended to offer a range of pricing options for the intermediary market. The Board also noted that the total expense ratios of the classes vary primarily by the level of their 12b-1 fees, although differences in transfer agent fees may also cause expenses to vary from class to class.
Fees Charged to Other Fidelity Clients. The Board also considered Fidelity fee structures and other information with respect to clients of FMR and its affiliates, such as other mutual funds advised or subadvised by FMR or its affiliates, pension plan clients, and other institutional clients. The Board noted the findings of the 2013 ad hoc joint committee (created with the board of other Fidelity funds), which reviewed and compared Fidelity's institutional investment advisory business with its business of providing services to the Fidelity funds, including the differences in services provided, fees charged, and costs incurred, as well as competition in their respective marketplaces.
Based on its review of total expense ratios and fees charged to other Fidelity clients, the Board concluded that the total expense ratio of each class of the fund was reasonable, although in some cases above the median of the universe presented for comparison, in light of the services that the fund and its shareholders receive and the other factors considered.
Annual Report
Costs of the Services and Profitability. The Board considered the revenues earned and the expenses incurred by Fidelity in conducting the business of developing, marketing, distributing, managing, administering and servicing the fund and servicing the fund's shareholders. The Board also considered the level of Fidelity's profits in respect of all the Fidelity funds.
On an annual basis, FMR presents to the Board Fidelity's profitability for the fund. Fidelity calculates the profitability for each fund, as well as aggregate profitability for groups of Fidelity funds and all Fidelity funds, using a series of detailed revenue and cost allocation methodologies which originate with the books and records of Fidelity on which Fidelity's audited financial statements are based. The Audit Committee of the Board reviews any significant changes from the prior year's methodologies.
PricewaterhouseCoopers LLP (PwC), independent registered public accounting firm and auditor to Fidelity and certain Fidelity funds, has been engaged annually by the Board as part of the Board's assessment of Fidelity's profitability analysis. PwC's engagement includes the review and assessment of the methodologies used by Fidelity in determining the revenues and expenses attributable to Fidelity's mutual fund business, and completion of agreed-upon procedures surrounding the mathematical accuracy of fund profitability and its conformity to allocation methodologies. After considering PwC's reports issued under the engagement and information provided by Fidelity, the Board concluded that while other allocation methods may also be reasonable, Fidelity's profitability methodologies are reasonable in all material respects.
The Board also reviewed Fidelity's non-fund businesses and fall-out benefits related to the mutual fund business as well as cases where Fidelity's affiliates may benefit from or be related to the fund's business.
The Board considered the costs of the services provided by and the profits realized by Fidelity in connection with the operation of the fund and was satisfied that the profitability was not excessive in the circumstances.
Economies of Scale. The Board considered whether there have been economies of scale in respect of the management of the Fidelity funds, whether the Fidelity funds (including the fund) have appropriately benefited from any such economies of scale, and whether there is potential for realization of any further economies of scale. The Board considered the extent to which the fund will benefit from economies of scale through increased services to the fund, through waivers or reimbursements, or through fee or expense reductions. The Board also noted that in 2009, it and the board of other Fidelity funds created an ad hoc committee (the Economies of Scale Committee) to analyze whether FMR attains economies of scale in respect of the management and servicing of the Fidelity funds, whether the Fidelity funds have appropriately benefited from such economies of scale, and whether there is potential for realization of any further economies of scale.
Annual Report
Board Approval of Investment Advisory Contracts and
Management Fees - continued
The Board recognized that the fund's management contract incorporates a "group fee" structure, which provides for lower group fee rates as total fund assets under FMR's management increase, and for higher group fee rates as total fund assets under FMR's management decrease. FMR calculates the group fee rates based on a tiered asset "breakpoint" schedule that varies based on asset class. The Board considered that the group fee is designed to deliver the benefits of economies of scale to fund shareholders when total Fidelity fund assets increase, even if assets of any particular fund are unchanged or have declined, because some portion of Fidelity's costs are attributable to services provided to all Fidelity funds, and all funds benefit if those costs can be allocated among more assets. The Board considered that although the fund is partially closed to new investors, it continues to incur investment management expenses, and marketing and distribution expenses related to the retention of existing shareholders and assets. The Board concluded that, given the group fee structure, fund shareholders will benefit from lower management fees as assets under FMR's management increase at the fund complex level, regardless of whether Fidelity achieves any such economies of scale.
The Board concluded, taking into account the analysis of the Economies of Scale Committee, that economies of scale, if any, are being appropriately shared between fund shareholders and Fidelity.
Amendment to Description of Group Fee Rate. At its July 2013 meeting, the Board voted to approve an amendment to the fund's management contract to modify the description of the "group fee rate" effective August 1, 2013. The Board noted that under the prior description in the contract, the group fee rate was based on the average net assets of all registered investment companies with which FMR has management contracts. Under the contract's tiered asset breakpoint schedule, the group fee rate is lower as total fund assets under FMR's management increase, and higher as total fund assets under FMR's management decrease. The Board considered that the prior description would have excluded the assets of 64 Fidelity sector funds from the group fee rate calculation once Fidelity SelectCo, LLC, an affiliate of FMR, assumed management responsibilities for those funds. The Board noted that modifying the description of the group fee rate to continue to include the assets of those 64 funds for purposes of determining group fee rate breakpoints would avoid an immediate adverse impact on the group fee rate for any fund.
Additional Information Requested by the Board. In order to develop fully the factual basis for consideration of the Fidelity funds' Advisory Contracts, the Board requested and received additional information on certain topics, including: (i) fund performance trends and Fidelity's long-term strategies for certain funds; (ii) the potential to further rationalize the Fidelity fund lineup with the possibility of achieving savings for the funds and Fidelity; (iii) the methodology with respect to competitive fund data and peer group classifications; (iv) the arrangements with, and performance of, certain sub-advisers on behalf of the Fidelity funds, as well as certain proposed participating affiliate arrangements; (v) the realization of fall-out benefits in certain Fidelity business units; (vi) Fidelity's group fee structures, including the rationale for the individual fee rates of certain categories of funds and the definition of group assets; (vii) trends regarding industry use of performance fee structures and the performance adjustment methodologies applicable to the Fidelity funds; (viii) additional competitive analysis regarding the total expenses for certain classes; and (ix) fund profitability methodology, including Fidelity's cost allocation methodology, and the impact of certain factors on fund profitability results.
Annual Report
Based on its evaluation of all of the conclusions noted above, and after considering all factors it believed relevant, the Board ultimately concluded that the advisory fee structures are fair and reasonable, and that the fund's Advisory Contracts should be renewed.
Annual Report
Investment Adviser
Fidelity Management & Research Company
Boston, MA
Investment Sub-Advisers
FMR Co., Inc.
Fidelity Management & Research
(U.K.) Inc.
Fidelity Management & Research
(Hong Kong) Limited
Fidelity Management & Research
(Japan) Inc.
General Distributor
Fidelity Distributors Corporation
Smithfield, RI
Transfer and Service Agents
Fidelity Investments Institutional
Operations Company, Inc.
Boston, MA
Fidelity Service Company, Inc.
Boston, MA
Custodian
Citibank, N.A.
New York, NY
The Fidelity Telephone Connection
Mutual Fund 24-Hour Service
Exchanges/Redemptions
and Account Assistance 1-800-544-6666
Product Information 1-800-544-6666
Retirement Accounts 1-800-544-4774
(8 a.m. - 9 p.m.)
TDD Service 1-800-544-0118
for the deaf and hearing impaired
(9 a.m. - 9 p.m. Eastern time)
Fidelity Automated Service
Telephone (FAST®)
1-800-544-5555
Automated line for quickest service
(Fidelity Investment logo)(registered trademark)
Corporate Headquarters
245 Summer St., Boston, MA 02210
www.fidelity.com
SCV-UANN-0913
1.803705.108
Fidelity®
Small Cap Value
Fund
Class F
Annual Report
July 31, 2013
(Fidelity Cover Art)
Contents
Performance | (Click Here) | How the fund has done over time. |
Management's Discussion of Fund Performance | (Click Here) | The Portfolio Manager's review of fund performance and strategy. |
Shareholder Expense Example | (Click Here) | An example of shareholder expenses. |
Investment Changes | (Click Here) | A summary of major shifts in the fund's investments over the past six months. |
Investments | (Click Here) | A complete list of the fund's investments with their market values. |
Financial Statements | (Click Here) | Statements of assets and liabilities, operations, and changes in net assets, as well as financial highlights. |
Notes | (Click Here) | Notes to the financial statements. |
Report of Independent Registered Public Accounting Firm | (Click Here) | |
Trustees and Officers | (Click Here) | |
Distributions | (Click Here) | |
Board Approval of Investment Advisory Contracts and Management Fees | (Click Here) | |
To view a fund's proxy voting guidelines and proxy voting record for the 12-month period ended June 30, visit http://www.fidelity.com/proxyvotingresults or visit the Securities and Exchange Commission's (SEC) web site at http://www.sec.gov. You may also call 1-800-835-5092 to request a free copy of the proxy voting guidelines.
Standard & Poor's, S&P and S&P 500 are registered service marks of The McGraw-Hill Companies, Inc. and have been licensed for use by Fidelity Distributors Corporation.
Other third-party marks appearing herein are the property of their respective owners.
All other marks appearing herein are registered or unregistered trademarks or service marks of FMR LLC or an affiliated company. © 2013 FMR LLC. All rights reserved.
Annual Report
This report and the financial statements contained herein are submitted for the general information of the shareholders of the fund. This report is not authorized for distribution to prospective investors in the fund unless preceded or accompanied by an effective prospectus.
A fund files its complete schedule of portfolio holdings with the SEC for the first and third quarters of each fiscal year on Form N-Q. Forms N-Q are available on the SEC's web site at http://www.sec.gov. A fund's Forms N-Q may be reviewed and copied at the SEC's Public Reference Room in Washington, DC. Information regarding the operation of the SEC's Public Reference Room may be obtained by calling 1-800-SEC-0330. For a complete list of a fund's portfolio holdings, view the most recent holdings listing, semiannual report, or annual report on Fidelity's web site at http://www.fidelity.com, http://www.advisor.fidelity.com, or http://www.401k.com, as applicable.
NOT FDIC INSURED • MAY LOSE VALUE • NO BANK GUARANTEE
Neither the fund nor Fidelity Distributors Corporation is a bank.
Annual Report
Average annual total return reflects the change in the value of an investment, assuming reinvestment of the class' distributions from dividend income and capital gains (the profits earned upon the sale of securities that have grown in value, if any) and assuming a constant rate of performance each year. The $10,000 table and the fund's returns do not reflect the deduction of taxes that a shareholder would pay on fund distributions or the redemption of fund shares. During periods of reimbursement by Fidelity, a fund's total return will be greater than it would be had the reimbursement not occurred. How a fund did yesterday is no guarantee of how it will do tomorrow.
Average Annual Total Returns
Periods ended July 31, 2013 | Past 1
year | Past 5
years | Life of fund A |
Class F B | 39.79% | 14.72% | 11.89% |
A From November 3, 2004.
B The initial offering of Class F shares took place on June 26, 2009. Returns prior to June 26, 2009 are those of Fidelity® Small Cap Value Fund, the original class of the fund.
$10,000 Over Life of Fund
Let's say hypothetically that $10,000 was invested in Fidelity® Small Cap Value Fund - Class F on November 3, 2004, when the fund started. The chart shows how the value of your investment would have changed, and also shows how the Russell 2000® Value Index performed over the same period. The initial offering of Class F took place on June 26, 2009. See above for additional information regarding the performance of Class F.
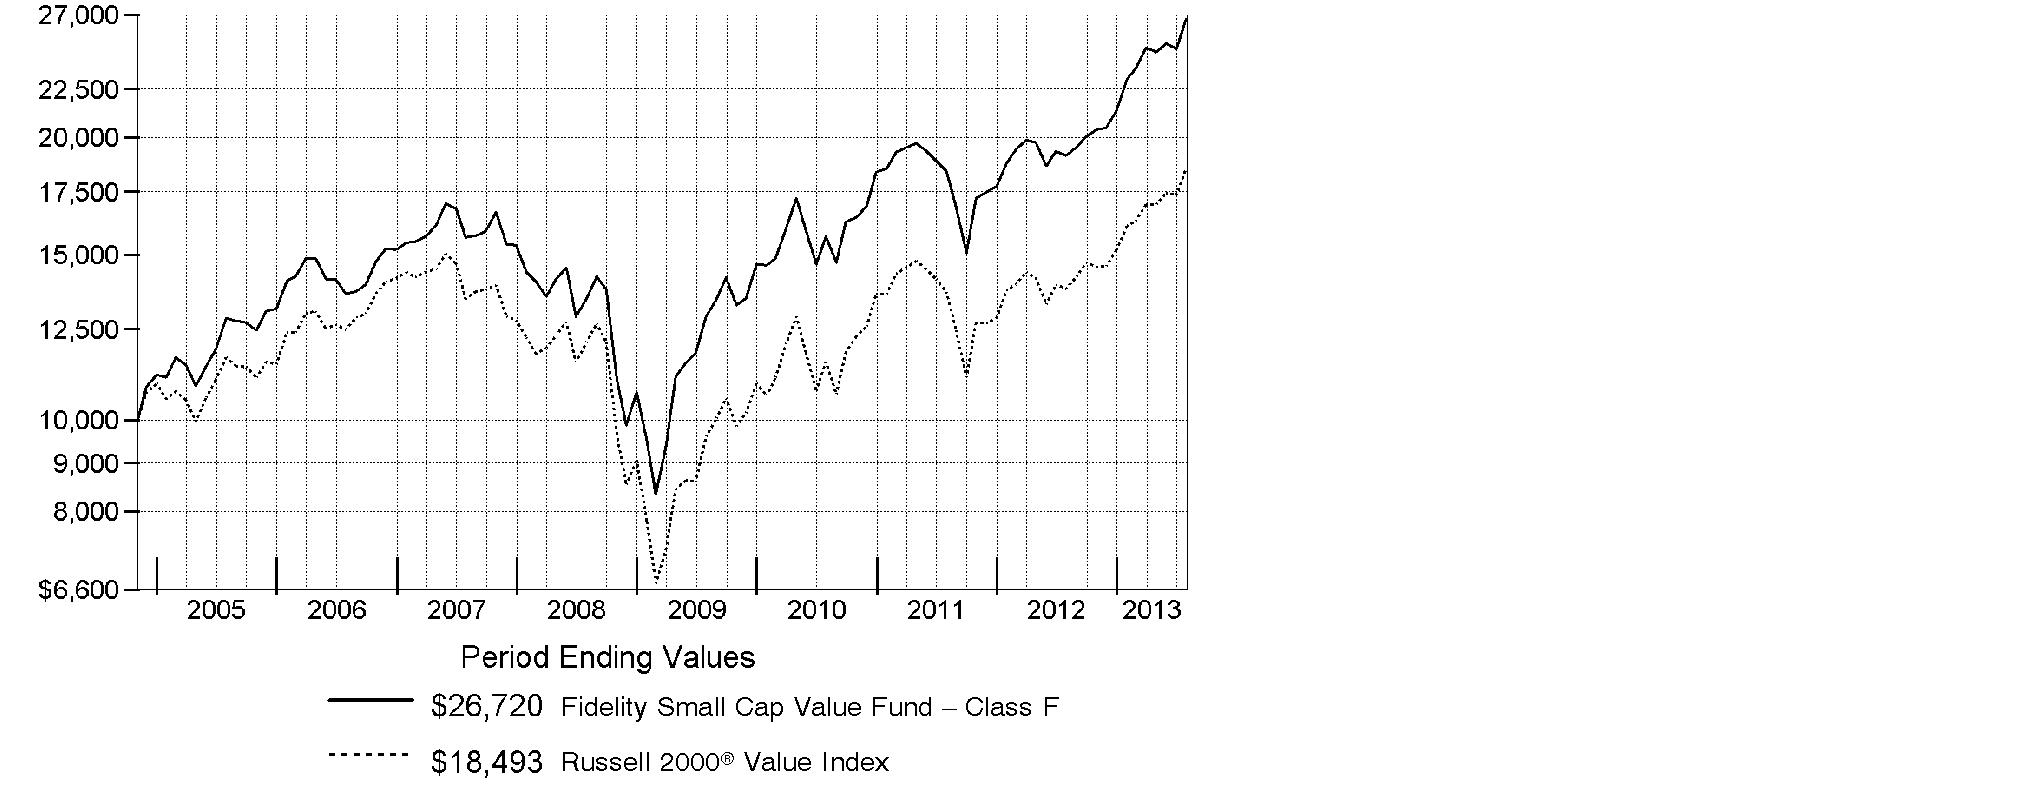
Annual Report
Market Recap: The bull run in U.S. stocks comfortably settled into a fifth year, as major equity benchmarks ripped through records during the 12 months ending July 31, 2013. Gains were fueled by a generally improving global economy and accommodative monetary policies worldwide. The tone was positive for most of the year, based largely on stronger U.S. economic data, including employment, housing and consumer sentiment. Setting a series of new highs along the way, the broad-based S&P 500® Index rose an impressive 25.00% for the 12 months, while the blue-chip-laden Dow Jones Industrial AverageSM also moved into record territory en route to a 22.36% gain. The growth-oriented Nasdaq Composite Index® had a similarly strong run, advancing 25.15%. During the year, markets were resilient amid intermittent volatility over debt woes in Europe, the 2012 U.S. presidential election and year-end Congressional gridlock over the federal budget. In mid-to-late June, concern arose about the U.S. Federal Reserve possibly tapering its sustaining bond-buying strategy - which prompted a brief, but steep, market sell-off. However, investors' continued quest for yield and the Fed's pledge to keep buying bonds until the economy showed significant improvement overpowered the uncertainty and helped equities climb notably higher in July to close the period on a strong note.
Comments from Charles Myers, who became Lead Portfolio Manager of Fidelity® Small Cap Value Fund on January 1, 2013: For the year, the fund's Class F shares gained 39.79%, versus 34.15% for the Russell 2000® Value Index. The biggest contribution, by far, came from the financials sector. Stock picking in consumer staples also added significant value, while the industrials sector hurt. Our strategy emphasizes individual stock picking while striving to minimize the performance impact of other factors, including sector over- and underweightings. The fund's top individual contributor was apparel manufacturer Hanesbrands, whose business fundamentals continued to improve. Also helping was Japanese broker Monex Group - benefiting in part from investors' renewed interest in Japan - and CapitalSource, a small-business lender that, in late July, agreed to be acquired at a premium price. None of these contributors was in the benchmark, and Monex was sold from the fund in May. In contrast, the biggest individual detractor was market maker Knight Capital Group, whose shares plummeted last August after a software glitch cost the firm hundreds of millions of dollars. We sold the fund's stake soon after. GrafTech International, a maker of high-end graphite electrodes used in steel production, also hurt results.
Note to shareholders: Derek Janssen became Co-Portfolio Manager of the fund on January 1, 2013.
The views expressed above reflect those of the portfolio manager(s) only through the end of the period as stated on the cover of this report and do not necessarily represent the views of Fidelity or any other person in the Fidelity organization. Any such views are subject to change at any time based upon market or other conditions and Fidelity disclaims any responsibility to update such views. These views may not be relied on as investment advice and, because investment decisions for a Fidelity fund are based on numerous factors, may not be relied on as an indication of trading intent on behalf of any Fidelity fund.
Annual Report
Shareholder Expense Example
As a shareholder of the Fund, you incur two types of costs: (1) transaction costs, including sales charges (loads) on purchase payments or redemption proceeds, redemption fees and (2) ongoing costs, including management fees, distribution and/or service (12b-1) fees and other Fund expenses. This Example is intended to help you understand your ongoing costs (in dollars) of investing in the Fund and to compare these costs with the ongoing costs of investing in other mutual funds.
The Example is based on an investment of $1,000 invested at the beginning of the period and held for the entire period (February 1, 2013 to July 31, 2013).
Actual Expenses
The first line of the accompanying table for each class of the Fund provides information about actual account values and actual expenses. You may use the information in this line, together with the amount you invested, to estimate the expenses that you paid over the period. Simply divide your account value by $1,000.00 (for example, an $8,600 account value divided by $1,000.00 = 8.6), then multiply the result by the number in the first line for a class of the Fund under the heading entitled "Expenses Paid During Period" to estimate the expenses you paid on your account during this period. A small balance maintenance fee of $12.00 that is charged once a year may apply for certain accounts with a value of less than $2,000. This fee is not included in the table below. If it was, the estimate of expenses you paid during the period would be higher, and your ending account value lower, by this amount. In addition, the Fund, as a shareholder in the underlying Fidelity Central Funds, will indirectly bear its pro-rata share of the fees and expenses incurred by the underlying Fidelity Central Funds. These fees and expenses are not included in the Fund's annualized expense ratio used to calculate the expense estimate in the table below.
Hypothetical Example for Comparison Purposes
The second line of the accompanying table for each class of the Fund provides information about hypothetical account values and hypothetical expenses based on a Class' actual expense ratio and an assumed rate of return of 5% per year before expenses, which is not the Class' actual return. The hypothetical account values and expenses may not be used to estimate the actual ending account balance or expenses you paid for the period. You may use this information to compare the ongoing costs of investing in the Fund and other funds. To do so, compare this 5% hypothetical example with the 5% hypothetical examples that appear in the shareholder reports of the other funds. A small balance maintenance fee of $12.00 that is charged once a year may apply for certain accounts with a value of less than $2,000. This fee is not included in the table below. If it was, the estimate of expenses you paid during the period would be higher, and your ending account value lower, by this amount. In addition, the Fund, as a shareholder in the underlying Fidelity Central Funds, will indirectly bear its pro-rata share of the fees and expenses incurred by the underlying Fidelity Central Funds. These fees and expenses are not included in the Fund's annualized expense ratio used to calculate the expense estimate in the table below.
Please note that the expenses shown in the table are meant to highlight your ongoing costs only and do not reflect any transaction costs. Therefore, the second line of the table is useful in comparing ongoing costs only, and will not help you determine the relative total costs of owning different funds. In addition, if these transactional costs were included, your costs would have been higher.
Annual Report
| Annualized
Expense Ratio B | Beginning
Account Value
February 1, 2013 | Ending
Account Value
July 31, 2013 | Expenses Paid
During Period*
February 1, 2013
to July 31, 2013 |
Class A | 1.37% | | | |
Actual | | $ 1,000.00 | $ 1,155.80 | $ 7.32 |
Hypothetical A | | $ 1,000.00 | $ 1,018.00 | $ 6.85 |
Class T | 1.61% | | | |
Actual | | $ 1,000.00 | $ 1,154.10 | $ 8.60 |
Hypothetical A | | $ 1,000.00 | $ 1,016.81 | $ 8.05 |
Class B | 2.17% | | | |
Actual | | $ 1,000.00 | $ 1,151.70 | $ 11.58 |
Hypothetical A | | $ 1,000.00 | $ 1,014.03 | $ 10.84 |
Class C | 2.13% | | | |
Actual | | $ 1,000.00 | $ 1,151.70 | $ 11.36 |
Hypothetical A | | $ 1,000.00 | $ 1,014.23 | $ 10.64 |
Small Cap Value | 1.08% | | | |
Actual | | $ 1,000.00 | $ 1,157.40 | $ 5.78 |
Hypothetical A | | $ 1,000.00 | $ 1,019.44 | $ 5.41 |
Class F | .86% | | | |
Actual | | $ 1,000.00 | $ 1,158.90 | $ 4.60 |
Hypothetical A | | $ 1,000.00 | $ 1,020.53 | $ 4.31 |
Institutional Class | 1.08% | | | |
Actual | | $ 1,000.00 | $ 1,157.30 | $ 5.78 |
Hypothetical A | | $ 1,000.00 | $ 1,019.44 | $ 5.41 |
A 5% return per year before expenses
B Annualized expense ratio reflects expenses net of applicable fee waivers.
* Expenses are equal to each Class' annualized expense ratio, multiplied by the average account value over the period, multiplied by 181/365 (to reflect the one-half year period).
Annual Report
Investment Changes (Unaudited)
Top Ten Stocks as of July 31, 2013 |
| % of fund's
net assets | % of fund's net assets
6 months ago |
Federated Investors, Inc. Class B (non-vtg.) | 3.2 | 0.6 |
Hanesbrands, Inc. | 3.2 | 2.5 |
TCF Financial Corp. | 2.8 | 2.9 |
Superior Energy Services, Inc. | 2.6 | 3.1 |
Tech Data Corp. | 2.3 | 2.2 |
CapitalSource, Inc. | 2.3 | 2.0 |
HNI Corp. | 2.3 | 2.5 |
j2 Global, Inc. | 2.2 | 1.3 |
DCT Industrial Trust, Inc. | 2.1 | 2.5 |
Berry Petroleum Co. Class A | 2.1 | 2.7 |
| 25.1 | |
Top Five Market Sectors as of July 31, 2013 |
| % of fund's
net assets | % of fund's net assets
6 months ago |
Financials | 37.7 | 36.2 |
Industrials | 14.7 | 14.6 |
Consumer Discretionary | 13.8 | 13.1 |
Information Technology | 13.6 | 11.7 |
Health Care | 5.2 | 6.0 |
Asset Allocation (% of fund's net assets) |
As of July 31, 2013* | As of January 31, 2013** |
| Stocks 99.8% | | | Stocks 98.8% | |
| Short-Term
Investments and
Net Other Assets (Liabilities) 0.2% | | | Short-Term
Investments and
Net Other Assets (Liabilities) 1.2% | |
* Foreign investments | 6.6% | | ** Foreign investments | 8.9% | |

Annual Report
Investments July 31, 2013
Showing Percentage of Net Assets
Common Stocks - 99.8% |
| Shares | | Value |
CONSUMER DISCRETIONARY - 13.8% |
Diversified Consumer Services - 1.3% |
Regis Corp. (e) | 3,316,000 | | $ 57,598,920 |
Household Durables - 1.7% |
Tempur-Pedic International, Inc. (a) | 1,800,000 | | 71,370,000 |
Media - 1.4% |
Valassis Communications, Inc. (d)(e) | 2,103,041 | | 60,210,064 |
Multiline Retail - 1.1% |
Big Lots, Inc. (a) | 1,250,000 | | 45,162,500 |
Specialty Retail - 5.0% |
Asbury Automotive Group, Inc. (a) | 1,070,000 | | 52,258,800 |
Genesco, Inc. (a) | 856,128 | | 60,254,289 |
Rent-A-Center, Inc. | 2,021,167 | | 80,826,468 |
Tsutsumi Jewelry Co. Ltd. | 795,800 | | 18,368,991 |
| | 211,708,548 |
Textiles, Apparel & Luxury Goods - 3.3% |
Hanesbrands, Inc. | 2,100,000 | | 133,266,000 |
Vera Bradley, Inc. (a)(d) | 231,000 | | 5,599,440 |
| | 138,865,440 |
TOTAL CONSUMER DISCRETIONARY | | 584,915,472 |
CONSUMER STAPLES - 1.6% |
Food Products - 1.6% |
Chiquita Brands International, Inc. (a) | 1,783,600 | | 21,545,888 |
Post Holdings, Inc. (a) | 984,700 | | 45,680,233 |
| | 67,226,121 |
Household Products - 0.0% |
Spectrum Brands Holdings, Inc. | 25,100 | | 1,416,142 |
TOTAL CONSUMER STAPLES | | 68,642,263 |
ENERGY - 4.8% |
Energy Equipment & Services - 2.7% |
ShawCor Ltd. | 100,900 | | 4,533,672 |
Superior Energy Services, Inc. (a) | 4,211,000 | | 107,885,820 |
| | 112,419,492 |
Common Stocks - continued |
| Shares | | Value |
ENERGY - continued |
Oil, Gas & Consumable Fuels - 2.1% |
Berry Petroleum Co. Class A | 2,156,970 | | $ 87,465,134 |
World Fuel Services Corp. | 56,000 | | 2,169,440 |
| | 89,634,574 |
TOTAL ENERGY | | 202,054,066 |
FINANCIALS - 37.7% |
Capital Markets - 4.7% |
Federated Investors, Inc. Class B (non-vtg.) (d) | 4,644,763 | | 134,837,471 |
Waddell & Reed Financial, Inc. Class A | 1,300,000 | | 66,378,000 |
| | 201,215,471 |
Commercial Banks - 12.8% |
Associated Banc-Corp. | 4,500,000 | | 76,230,000 |
CapitalSource, Inc. | 8,128,000 | | 98,348,800 |
City National Corp. | 1,200,000 | | 83,436,000 |
CVB Financial Corp. | 450,000 | | 5,890,500 |
First Citizen Bancshares, Inc. | 222,700 | | 46,655,650 |
National Penn Bancshares, Inc. | 4,400,000 | | 47,476,000 |
PacWest Bancorp | 1,900,000 | | 67,298,000 |
TCF Financial Corp. | 7,700,000 | | 117,348,000 |
| | 542,682,950 |
Consumer Finance - 2.5% |
Cash America International, Inc. (d) | 816,900 | | 34,309,800 |
EZCORP, Inc. (non-vtg.) Class A (a) | 1,779,788 | | 32,178,567 |
World Acceptance Corp. (a)(d) | 475,000 | | 39,558,000 |
| | 106,046,367 |
Insurance - 8.4% |
Aspen Insurance Holdings Ltd. | 2,300,000 | | 86,227,000 |
Endurance Specialty Holdings Ltd. | 1,486,000 | | 78,208,180 |
Platinum Underwriters Holdings Ltd. (e) | 1,466,099 | | 85,165,691 |
ProAssurance Corp. | 1,100,000 | | 58,883,000 |
StanCorp Financial Group, Inc. | 850,000 | | 45,126,500 |
| | 353,610,371 |
Real Estate Investment Trusts - 5.9% |
DCT Industrial Trust, Inc. | 11,980,586 | | 89,974,201 |
Franklin Street Properties Corp. | 4,800,000 | | 63,888,000 |
Common Stocks - continued |
| Shares | | Value |
FINANCIALS - continued |
Real Estate Investment Trusts - continued |
Highwoods Properties, Inc. (SBI) | 1,720,330 | | $ 62,413,572 |
National Retail Properties, Inc. | 900,000 | | 31,491,000 |
| | 247,766,773 |
Thrifts & Mortgage Finance - 3.4% |
Astoria Financial Corp. (e) | 5,199,999 | | 63,439,988 |
Washington Federal, Inc. | 3,652,100 | | 79,433,175 |
| | 142,873,163 |
TOTAL FINANCIALS | | 1,594,195,095 |
HEALTH CARE - 5.2% |
Health Care Equipment & Supplies - 1.9% |
Hill-Rom Holdings, Inc. | 1,060,000 | | 39,294,200 |
Integra LifeSciences Holdings Corp. (a) | 1,050,000 | | 41,359,500 |
| | 80,653,700 |
Health Care Providers & Services - 3.3% |
AmSurg Corp. (a) | 1,220,000 | | 47,714,200 |
Chemed Corp. | 490,700 | | 34,638,513 |
MEDNAX, Inc. (a) | 600,000 | | 58,452,000 |
| | 140,804,713 |
TOTAL HEALTH CARE | | 221,458,413 |
INDUSTRIALS - 14.7% |
Commercial Services & Supplies - 8.4% |
ACCO Brands Corp. (a)(e) | 10,630,885 | | 70,270,150 |
HNI Corp. (e) | 2,552,800 | | 97,287,208 |
Knoll, Inc. | 1,940,000 | | 32,048,800 |
Quad/Graphics, Inc. (d)(e) | 2,675,000 | | 75,007,000 |
United Stationers, Inc. | 1,980,800 | | 81,985,312 |
| | 356,598,470 |
Electrical Equipment - 2.7% |
EnerSys | 1,065,000 | | 56,359,800 |
GrafTech International Ltd. (a)(e) | 7,709,000 | | 57,971,680 |
| | 114,331,480 |
Common Stocks - continued |
| Shares | | Value |
INDUSTRIALS - continued |
Machinery - 1.5% |
Blount International, Inc. (a)(e) | 2,975,000 | | $ 39,210,500 |
Columbus McKinnon Corp. (NY Shares) (a)(e) | 1,050,000 | | 23,226,000 |
| | 62,436,500 |
Trading Companies & Distributors - 2.1% |
WESCO International, Inc. (a)(d) | 1,138,633 | | 86,285,609 |
TOTAL INDUSTRIALS | | 619,652,059 |
INFORMATION TECHNOLOGY - 13.6% |
Communications Equipment - 1.0% |
Polycom, Inc. (a) | 3,805,145 | | 36,377,186 |
ViaSat, Inc. (a) | 95,000 | | 6,345,050 |
| | 42,722,236 |
Electronic Equipment & Components - 5.3% |
Ingram Micro, Inc. Class A (a) | 3,435,000 | | 78,421,050 |
Ryoyo Electro Corp. | 1,110,600 | | 8,961,025 |
SYNNEX Corp. (a) | 790,000 | | 39,120,800 |
Tech Data Corp. (a)(e) | 1,923,707 | | 98,763,117 |
| | 225,265,992 |
Internet Software & Services - 2.2% |
j2 Global, Inc. (d) | 2,000,000 | | 91,540,000 |
IT Services - 2.0% |
CACI International, Inc. Class A (a)(d)(e) | 1,265,534 | | 84,031,458 |
Software - 3.1% |
Monotype Imaging Holdings, Inc. (e) | 2,499,731 | | 61,318,401 |
SS&C Technologies Holdings, Inc. (a) | 2,000,000 | | 71,560,000 |
| | 132,878,401 |
TOTAL INFORMATION TECHNOLOGY | | 576,438,087 |
MATERIALS - 4.5% |
Chemicals - 1.9% |
PolyOne Corp. | 2,800,000 | | 80,948,000 |
Metals & Mining - 2.6% |
Carpenter Technology Corp. | 438,880 | | 22,944,646 |
Common Stocks - continued |
| Shares | | Value |
MATERIALS - continued |
Metals & Mining - continued |
Haynes International, Inc. | 582,903 | | $ 28,037,634 |
RTI International Metals, Inc. (a)(e) | 1,880,000 | | 57,622,000 |
| | 108,604,280 |
TOTAL MATERIALS | | 189,552,280 |
UTILITIES - 3.9% |
Electric Utilities - 2.9% |
UIL Holdings Corp. | 1,550,000 | | 63,302,000 |
UNS Energy Corp. | 1,150,000 | | 58,477,500 |
| | 121,779,500 |
Gas Utilities - 1.0% |
Southwest Gas Corp. | 836,756 | | 41,536,568 |
TOTAL UTILITIES | | 163,316,068 |
TOTAL COMMON STOCKS (Cost $3,044,578,546) |
4,220,223,803
|
Money Market Funds - 2.0% |
| | | |
Fidelity Cash Central Fund, 0.11% (b) | 28,466,432 | | 28,466,432 |
Fidelity Securities Lending Cash Central Fund, 0.12% (b)(c) | 57,800,650 | | 57,800,650 |
TOTAL MONEY MARKET FUNDS (Cost $86,267,082) |
86,267,082
|
TOTAL INVESTMENT PORTFOLIO - 101.8% (Cost $3,130,845,628) | | 4,306,490,885 |
NET OTHER ASSETS (LIABILITIES) - (1.8)% | | (76,083,401) |
NET ASSETS - 100% | $ 4,230,407,484 |
Legend |
(a) Non-income producing |
(b) Affiliated fund that is generally available only to investment companies and other accounts managed by Fidelity Investments. The rate quoted is the annualized seven-day yield of the fund at period end. A complete unaudited listing of the fund's holdings as of its most recent quarter end is available upon request. In addition, each Fidelity Central Fund's financial statements, which are not covered by the Fund's Report of Independent Registered Public Accounting Firm, are available on the SEC's website or upon request. |
(c) Investment made with cash collateral received from securities on loan. |
(d) Security or a portion of the security is on loan at period end. |
(e) Affiliated company |
Affiliated Central Funds |
Information regarding fiscal year to date income earned by the Fund from investments in Fidelity Central Funds is as follows: |
Fund | Income earned |
Fidelity Cash Central Fund | $ 25,999 |
Fidelity Securities Lending Cash Central Fund | 546,053 |
Total | $ 572,052 |
Other Affiliated Issuers |
An affiliated company is a company in which the Fund has ownership of at least 5% of the voting securities. Fiscal year to date transactions with companies which are or were affiliates are as follows: |
Affiliate | Value, beginning of period | Purchases | Sales
Proceeds | Dividend Income | Value,
end of
period |
ACCO Brands Corp. | $ 18,634,000 | $ 60,186,015 | $ - | $ - | $ 70,270,150 |
Astoria Financial Corp. | 51,038,992 | - | 2,635,044 | 864,648 | 63,439,988 |
Blount International, Inc. | 37,039,161 | 4,861,737 | - | - | 39,210,500 |
CACI International, Inc. Class A | - | 70,903,692 | - | - | 84,031,458 |
Chiquita Brands International, Inc. | 17,482,500 | - | 18,750,066 | - | - |
Columbus McKinnon Corp. (NY Shares) | 15,414,197 | 33,512 | - | - | 23,226,000 |
Affiliate | Value, beginning of period | Purchases | Sales
Proceeds | Dividend Income | Value,
end of
period |
Forestar Group, Inc. | $ 22,724,438 | $ - | $ 37,180,120 | $ - | $ - |
Franklin Street Properties Corp. | 32,769,200 | 18,353,991 | - | 1,420,207 | - |
GrafTech International Ltd. | 62,334,250 | 15,596,640 | - | - | 57,971,680 |
HNI Corp. | 71,739,000 | - | 5,753,822 | 2,592,000 | 97,287,208 |
j2 Global, Inc. | 38,011,100 | 45,217,336 | 27,957,107 | 1,829,466 | - |
Miraial Co. Ltd. | 10,410,478 | - | 12,126,954 | 294,642 | - |
Monotype Imaging Holdings, Inc. | 38,936,219 | 295,917 | 4,511,476 | 533,522 | 61,318,401 |
PacWest Bancorp | 42,557,616 | 917,960 | - | 1,759,368 | - |
Platinum Underwriters Holdings Ltd. | 64,411,165 | - | 12,819,753 | 528,121 | 85,165,691 |
Quad/Graphics, Inc. | 28,908,484 | 12,835,355 | - | 8,161,250 | 75,007,000 |
Regis Corp. | 52,452,000 | 4,787,419 | 1,424,813 | 798,000 | 57,598,920 |
RTI International Metals, Inc. | 42,206,000 | - | - | - | 57,622,000 |
Ryoyo Electro Corp. | 20,552,790 | - | 7,311,306 | 462,475 | - |
Tech Data Corp. | 50,100,000 | 44,833,638 | - | - | 98,763,117 |
Valassis Communications, Inc. | 35,733,655 | 13,478,788 | - | 1,955,518 | 60,210,064 |
Western Liberty Bancorp | 2,879,407 | - | 3,071,972 | - | - |
Total | $ 756,334,652 | $ 292,302,000 | $ 133,542,433 | $ 21,199,217 | $ 931,122,177 |
Other Information |
All investments are categorized as Level 1 under the Fair Value Hierarchy. The inputs or methodology used for valuing securities may not be an indication of the risk associated with investing in those securities. For more information on valuation inputs, please refer to the Investment Valuation section in the accompanying Notes to Financial Statements. |
See accompanying notes which are an integral part of the financial statements.
Annual Report
Statement of Assets and Liabilities
| July 31, 2013 |
| | |
Assets | | |
Investment in securities, at value (including securities loaned of $56,776,323) - See accompanying schedule: Unaffiliated issuers (cost $2,332,604,982) | $ 3,289,101,626 | |
Fidelity Central Funds (cost $86,267,082) | 86,267,082 | |
Other affiliated issuers (cost $711,973,564) | 931,122,177 | |
Total Investments (cost $3,130,845,628) | | $ 4,306,490,885 |
Receivable for investments sold | | 4,040,206 |
Receivable for fund shares sold | | 4,754,743 |
Dividends receivable | | 2,311,882 |
Distributions receivable from Fidelity Central Funds | | 43,534 |
Other receivables | | 26,704 |
Total assets | | 4,317,667,954 |
| | |
Liabilities | | |
Payable for investments purchased | $ 4,404,382 | |
Payable for fund shares redeemed | 21,283,940 | |
Accrued management fee | 2,842,312 | |
Distribution and service plan fees payable | 168,389 | |
Other affiliated payables | 692,724 | |
Other payables and accrued expenses | 68,073 | |
Collateral on securities loaned, at value | 57,800,650 | |
Total liabilities | | 87,260,470 |
| | |
Net Assets | | $ 4,230,407,484 |
Net Assets consist of: | | |
Paid in capital | | $ 2,788,449,989 |
Undistributed net investment income | | 6,475,378 |
Accumulated undistributed net realized gain (loss) on investments and foreign currency transactions | | 259,835,177 |
Net unrealized appreciation (depreciation) on investments and assets and liabilities in foreign currencies | | 1,175,646,940 |
Net Assets | | $ 4,230,407,484 |
See accompanying notes which are an integral part of the financial statements.
Annual Report
Statement of Assets and Liabilities - continued
| July 31, 2013 |
| | |
Calculation of Maximum Offering Price Class A:
Net Asset Value and redemption price per share ($275,265,209 ÷ 13,787,655 shares) | | $ 19.96 |
| | |
Maximum offering price per share (100/94.25 of $19.96) | | $ 21.18 |
Class T:
Net Asset Value and redemption price per share ($107,443,503 ÷ 5,452,804 shares) | | $ 19.70 |
| | |
Maximum offering price per share (100/96.50 of $19.70) | | $ 20.41 |
Class B:
Net Asset Value and offering price per share ($7,052,013 ÷ 370,046 shares)A | | $ 19.06 |
| | |
Class C:
Net Asset Value and offering price per share ($76,018,400 ÷ 3,988,294 shares)A | | $ 19.06 |
| | |
Small Cap Value:
Net Asset Value, offering price and redemption price per share ($2,672,853,587 ÷ 132,174,679 shares) | | $ 20.22 |
| | |
Class F:
Net Asset Value, offering price and redemption price per share ($732,192,591 ÷ 36,098,957 shares) | | $ 20.28 |
| | |
Institutional Class:
Net Asset Value, offering price and redemption price per share ($359,582,181 ÷ 17,774,629 shares) | | $ 20.23 |
A Redemption price per share is equal to net asset value less any applicable contingent deferred sales charge.
See accompanying notes which are an integral part of the financial statements.
Annual Report
Financial Statements - continued
Statement of Operations
| Year ended July 31, 2013 |
| | |
Investment Income | | |
Dividends (including $21,199,217 earned from other affiliated issuers) | | $ 60,413,973 |
Interest | | 105 |
Income from Fidelity Central Funds | | 572,052 |
Total income | | 60,986,130 |
| | |
Expenses | | |
Management fee
Basic fee | $ 24,334,495 | |
Performance adjustment | 3,446,198 | |
Transfer agent fees | 6,387,168 | |
Distribution and service plan fees | 1,603,302 | |
Accounting and security lending fees | 964,201 | |
Custodian fees and expenses | 78,850 | |
Independent trustees' compensation | 20,817 | |
Registration fees | 179,627 | |
Audit | 69,056 | |
Legal | 9,520 | |
Interest | 508 | |
Miscellaneous | 27,296 | |
Total expenses before reductions | 37,121,038 | |
Expense reductions | (242,350) | 36,878,688 |
Net investment income (loss) | | 24,107,442 |
Realized and Unrealized Gain (Loss) Net realized gain (loss) on: | | |
Investment securities: | | |
Unaffiliated issuers | 283,388,788 | |
Other affiliated issuers | 17,171,945 | |
Foreign currency transactions | 124,131 | |
Total net realized gain (loss) | | 300,684,864 |
Change in net unrealized appreciation (depreciation) on: Investment securities | 820,353,456 | |
Assets and liabilities in foreign currencies | 1,060 | |
Total change in net unrealized appreciation (depreciation) | | 820,354,516 |
Net gain (loss) | | 1,121,039,380 |
Net increase (decrease) in net assets resulting from operations | | $ 1,145,146,822 |
See accompanying notes which are an integral part of the financial statements.
Annual Report
Statement of Changes in Net Assets
| Year ended
July 31,
2013 | Year ended
July 31,
2012 |
Increase (Decrease) in Net Assets | | |
Operations | | |
Net investment income (loss) | $ 24,107,442 | $ 9,490,811 |
Net realized gain (loss) | 300,684,864 | 99,657,152 |
Change in net unrealized appreciation (depreciation) | 820,354,516 | (37,724,900) |
Net increase (decrease) in net assets resulting
from operations | 1,145,146,822 | 71,423,063 |
Distributions to shareholders from net investment income | (21,412,021) | (3,813,704) |
Distributions to shareholders from net realized gain | (85,195,362) | (148,970,854) |
Total distributions | (106,607,383) | (152,784,558) |
Share transactions - net increase (decrease) | 507,448,391 | 230,904,084 |
Redemption fees | 726,904 | 569,163 |
Total increase (decrease) in net assets | 1,546,714,734 | 150,111,752 |
| | |
Net Assets | | |
Beginning of period | 2,683,692,750 | 2,533,580,998 |
End of period (including undistributed net investment income of $6,475,378 and undistributed net investment income of $4,596,351, respectively) | $ 4,230,407,484 | $ 2,683,692,750 |
See accompanying notes which are an integral part of the financial statements.
Annual Report
Financial Highlights - Class A
Years ended July 31, | 2013 | 2012 | 2011 | 2010 | 2009 |
Selected Per-Share Data | | | | | |
Net asset value, beginning of period | $ 14.86 | $ 15.48 | $ 13.45 | $ 11.13 | $ 11.82 |
Income from Investment Operations | | | | | |
Net investment income (loss) C | .07 | .01 | .01 F | .02 G | .08 |
Net realized and unrealized gain (loss) | 5.57 | .30 | 2.22 | 2.33 | (.60) |
Total from investment operations | 5.64 | .31 | 2.23 | 2.35 | (.52) |
Distributions from net investment income | (.07) | (.01) | (.08) | (.03) | (.06) |
Distributions from net realized gain | (.47) | (.93) | (.12) | - | (.11) |
Total distributions | (.54) | (.93) J | (.20) | (.03) | (.17) |
Redemption fees added to paid in capital C,I | - | - | - | - | - |
Net asset value, end of period | $ 19.96 | $ 14.86 | $ 15.48 | $ 13.45 | $ 11.13 |
Total Return A,B | 39.09% | 3.24% | 16.72% | 21.16% | (4.37)% |
Ratios to Average Net Assets D,H | | | | | |
Expenses before reductions | 1.36% | 1.44% | 1.44% | 1.47% | 1.45% |
Expenses net of fee waivers, if any | 1.36% | 1.44% | 1.43% | 1.40% | 1.40% |
Expenses net of all reductions | 1.36% | 1.44% | 1.43% | 1.39% | 1.40% |
Net investment income (loss) | .41% | .09% | .06% F | .17% G | .81% |
Supplemental Data | | | | | |
Net assets, end of period (000 omitted) | $ 275,265 | $ 150,285 | $ 140,707 | $ 96,994 | $ 55,029 |
Portfolio turnover rate E | 29% | 27% | 22% | 49% | 51% |
A Total returns would have been lower if certain expenses had not been reduced during the applicable periods shown.
B Total returns do not include the effect of the sales charges.
C Calculated based on average shares outstanding during the period.
D Fees and expenses of any underlying Fidelity Central Funds are not included in the Fund's expense ratio. The Fund indirectly bears its proportionate share of the expenses of any underlying Fidelity Central Funds.
E Amount does not include the portfolio activity of any underlying Fidelity Central Funds.
F Investment income per share reflects a large, non-recurring dividend which amounted to $.06 per share. Excluding this non-recurring dividend, the ratio of net investment income (loss) to average net assets would have been (.31)%.
G Investment income per share reflects a large, non-recurring dividend which amounted to $.03 per share. Excluding this non-recurring dividend, the ratio of net investment income (loss) to average net assets would have been (.10)%.
H Expense ratios reflect operating expenses of the class. Expenses before reductions do not reflect amounts reimbursed by the investment adviser or reductions from brokerage service arrangements or reductions from other expense offset arrangements and do not represent the amount paid by the class during periods when reimbursements or reductions occur. Expenses net of fee waivers reflect expenses after reimbursement by the investment adviser but prior to reductions from brokerage service arrangements or other expense offset arrangements. Expenses net of all reductions represent the net expenses paid by the class.
I Amount represents less than $.01 per share.
J Total distributions of $.93 per share is comprised of distributions from net investment income of $.006 and distributions from net realized gain of $.925 per share.
See accompanying notes which are an integral part of the financial statements.
Annual Report
Financial Highlights - Class T
Years ended July 31, | 2013 | 2012 | 2011 | 2010 | 2009 |
Selected Per-Share Data | | | | | |
Net asset value, beginning of period | $ 14.70 | $ 15.34 | $ 13.34 | $ 11.05 | $ 11.74 |
Income from Investment Operations | | | | | |
Net investment income (loss) C | .03 | (.02) | (.03) F | (.01) G | .05 |
Net realized and unrealized gain (loss) | 5.50 | .31 | 2.20 | 2.31 | (.59) |
Total from investment operations | 5.53 | .29 | 2.17 | 2.30 | (.54) |
Distributions from net investment income | (.06) | - | (.05) | (.01) | (.04) |
Distributions from net realized gain | (.47) | (.93) | (.12) | - | (.11) |
Total distributions | (.53) | (.93) | (.17) | (.01) | (.15) |
Redemption fees added to paid in capital C,I | - | - | - | - | - |
Net asset value, end of period | $ 19.70 | $ 14.70 | $ 15.34 | $ 13.34 | $ 11.05 |
Total Return A,B | 38.70% | 3.08% | 16.36% | 20.87% | (4.57)% |
Ratios to Average Net Assets D,H | | | | |
Expenses before reductions | 1.60% | 1.67% | 1.70% | 1.72% | 1.70% |
Expenses net of fee waivers, if any | 1.60% | 1.67% | 1.69% | 1.65% | 1.65% |
Expenses net of all reductions | 1.59% | 1.67% | 1.69% | 1.64% | 1.65% |
Net investment income (loss) | .18% | (.14)% | (.19)% F | (.08)% G | .56% |
Supplemental Data | | | | | |
Net assets, end of period (000 omitted) | $ 107,444 | $ 57,514 | $ 55,845 | $ 44,091 | $ 28,534 |
Portfolio turnover rate E | 29% | 27% | 22% | 49% | 51% |
A Total returns would have been lower if certain expenses had not been reduced during the applicable periods shown.
B Total returns do not include the effect of the sales charges.
C Calculated based on average shares outstanding during the period.
D Fees and expenses of any underlying Fidelity Central Funds are not included in the Fund's expense ratio. The Fund indirectly bears its proportionate share of the expenses of any underlying Fidelity Central Funds.
E Amount does not include the portfolio activity of any underlying Fidelity Central Funds.
F Investment income per share reflects a large, non-recurring dividend which amounted to $.06 per share. Excluding this non-recurring dividend, the ratio of net investment income (loss) to average net assets would have been (.57)%.
G Investment income per share reflects a large, non-recurring dividend which amounted to $.03 per share. Excluding this non-recurring dividend, the ratio of net investment income (loss) to average net assets would have been (.35)%.
H Expense ratios reflect operating expenses of the class. Expenses before reductions do not reflect amounts reimbursed by the investment adviser or reductions from brokerage service arrangements or reductions from other expense offset arrangements and do not represent the amount paid by the class during periods when reimbursements or reductions occur. Expenses net of fee waivers reflect expenses after reimbursement by the investment adviser but prior to reductions from brokerage service arrangements or other expense offset arrangements. Expenses net of all reductions represent the net expenses paid by the class.
I Amount represents less than $.01 per share.
See accompanying notes which are an integral part of the financial statements.
Annual Report
Financial Highlights - Class B
Years ended July 31, | 2013 | 2012 | 2011 | 2010 | 2009 |
Selected Per-Share Data | | | | | |
Net asset value, beginning of period | $ 14.27 | $ 15.00 | $ 13.08 | $ 10.88 | $ 11.60 |
Income from Investment Operations | | | | | |
Net investment income (loss) C | (.06) | (.09) | (.10) F | (.07) G | .01 |
Net realized and unrealized gain (loss) | 5.34 | .29 | 2.15 | 2.27 | (.59) |
Total from investment operations | 5.28 | .20 | 2.05 | 2.20 | (.58) |
Distributions from net investment income | (.02) | - | (.01) | - | (.03) |
Distributions from net realized gain | (.47) | (.93) | (.12) | - | (.11) |
Total distributions | (.49) | (.93) | (.13) | - | (.14) |
Redemption fees added to paid in capital C,I | - | - | - | - | - |
Net asset value, end of period | $ 19.06 | $ 14.27 | $ 15.00 | $ 13.08 | $ 10.88 |
Total Return A,B | 38.07% | 2.51% | 15.80% | 20.22% | (5.05)% |
Ratios to Average Net Assets D,H | | | | | |
Expenses before reductions | 2.15% | 2.19% | 2.20% | 2.22% | 2.20% |
Expenses net of fee waivers, if any | 2.15% | 2.19% | 2.19% | 2.15% | 2.15% |
Expenses net of all reductions | 2.14% | 2.19% | 2.19% | 2.14% | 2.15% |
Net investment income (loss) | (.37)% | (.66)% | (.69)% F | (.58)% G | .06% |
Supplemental Data | | | | | |
Net assets, end of period (000 omitted) | $ 7,052 | $ 6,675 | $ 8,549 | $ 9,747 | $ 7,153 |
Portfolio turnover rate E | 29% | 27% | 22% | 49% | 51% |
A Total returns would have been lower if certain expenses had not been reduced during the applicable periods shown.
B Total returns do not include the effect of the contingent deferred sales charge.
C Calculated based on average shares outstanding during the period.
D Fees and expenses of any underlying Fidelity Central Funds are not included in the Fund's expense ratio. The Fund indirectly bears its proportionate share of the expenses of any underlying Fidelity Central Funds.
E Amount does not include the portfolio activity of any underlying Fidelity Central Funds.
F Investment income per share reflects a large, non-recurring dividend which amounted to $.06 per share. Excluding this non-recurring dividend, the ratio of net investment income (loss) to average net assets would have been (1.07)%.
G Investment income per share reflects a large, non-recurring dividend which amounted to $.03 per share. Excluding this non-recurring dividend, the ratio of net investment income (loss) to average net assets would have been (.85)%.
H Expense ratios reflect operating expenses of the class. Expenses before reductions do not reflect amounts reimbursed by the investment adviser or reductions from brokerage service arrangements or reductions from other expense offset arrangements and do not represent the amount paid by the class during periods when reimbursements or reductions occur. Expenses net of fee waivers reflect expenses after reimbursement by the investment adviser but prior to reductions from brokerage service arrangements or other expense offset arrangements. Expenses net of all reductions represent the net expenses paid by the class.
I Amount represents less than $.01 per share.
See accompanying notes which are an integral part of the financial statements.
Annual Report
Financial Highlights - Class C
Years ended July 31, | 2013 | 2012 | 2011 | 2010 | 2009 |
Selected Per-Share Data | | | | | |
Net asset value, beginning of period | $ 14.28 | $ 15.01 | $ 13.08 | $ 10.89 | $ 11.60 |
Income from Investment Operations | | | | | |
Net investment income (loss) C | (.06) | (.09) | (.10) F | (.07) G | .01 |
Net realized and unrealized gain (loss) | 5.34 | .29 | 2.17 | 2.26 | (.58) |
Total from investment operations | 5.28 | .20 | 2.07 | 2.19 | (.57) |
Distributions from net investment income | (.03) | - | (.02) | - | (.03) |
Distributions from net realized gain | (.47) | (.93) | (.12) | - | (.11) |
Total distributions | (.50) | (.93) | (.14) | - | (.14) |
Redemption fees added to paid in capital C,I | - | - | - | - | - |
Net asset value, end of period | $ 19.06 | $ 14.28 | $ 15.01 | $ 13.08 | $ 10.89 |
Total Return A,B | 38.00% | 2.52% | 15.91% | 20.11% | (4.98)% |
Ratios to Average Net Assets D,H | | | | | |
Expenses before reductions | 2.13% | 2.19% | 2.18% | 2.22% | 2.20% |
Expenses net of fee waivers, if any | 2.13% | 2.19% | 2.18% | 2.15% | 2.15% |
Expenses net of all reductions | 2.12% | 2.19% | 2.18% | 2.14% | 2.15% |
Net investment income (loss) | (.35)% | (.66)% | (.68)% F | (.58)% G | .06% |
Supplemental Data | | | | | |
Net assets, end of period (000 omitted) | $ 76,018 | $ 47,265 | $ 47,457 | $ 37,346 | $ 21,345 |
Portfolio turnover rate E | 29% | 27% | 22% | 49% | 51% |
A Total returns would have been lower if certain expenses had not been reduced during the applicable periods shown.
B Total returns do not include the effect of the contingent deferred sales charge.
C Calculated based on average shares outstanding during the period.
D Fees and expenses of any underlying Fidelity Central Funds are not included in the Fund's expense ratio. The Fund indirectly bears its proportionate share of the expenses of any underlying Fidelity Central Funds.
E Amount does not include the portfolio activity of any underlying Fidelity Central Funds.
F Investment income per share reflects a large, non-recurring dividend which amounted to $.06 per share. Excluding this non-recurring dividend, the ratio of net investment income (loss) to average net assets would have been (1.06)%.
G Investment income per share reflects a large, non-recurring dividend which amounted to $.03 per share. Excluding this non-recurring dividend, the ratio of net investment income (loss) to average net assets would have been (.85)%.
H Expense ratios reflect operating expenses of the class. Expenses before reductions do not reflect amounts reimbursed by the investment adviser or reductions from brokerage service arrangements or reductions from other expense offset arrangements and do not represent the amount paid by the class during periods when reimbursements or reductions occur. Expenses net of fee waivers reflect expenses after reimbursement by the investment adviser but prior to reductions from brokerage service arrangements or other expense offset arrangements. Expenses net of all reductions represent the net expenses paid by the class.
I Amount represents less than $.01 per share.
See accompanying notes which are an integral part of the financial statements.
Annual Report
Financial Highlights - Small Cap Value
Years ended July 31, | 2013 | 2012 | 2011 | 2010 | 2009 |
Selected Per-Share Data | | | | | |
Net asset value, beginning of period | $ 15.05 | $ 15.62 | $ 13.56 | $ 11.22 | $ 11.91 |
Income from Investment Operations | | | | | |
Net investment income (loss) B | .12 | .06 | .06 E | .05 F | .10 |
Net realized and unrealized gain (loss) | 5.63 | .32 | 2.23 | 2.34 | (.60) |
Total from investment operations | 5.75 | .38 | 2.29 | 2.39 | (.50) |
Distributions from net investment income | (.11) | (.02) | (.10) | (.05) | (.08) |
Distributions from net realized gain | (.47) | (.93) | (.13) | - | (.11) |
Total distributions | (.58) | (.95) | (.23) | (.05) | (.19) |
Redemption fees added to paid in capital B,H | - | - | - | - | - |
Net asset value, end of period | $ 20.22 | $ 15.05 | $ 15.62 | $ 13.56 | $ 11.22 |
Total Return A | 39.45% | 3.67% | 17.03% | 21.32% | (4.15)% |
Ratios to Average Net Assets C,G | | | | |
Expenses before reductions | 1.07% | 1.13% | 1.13% | 1.18% | 1.20% |
Expenses net of fee waivers, if any | 1.07% | 1.13% | 1.13% | 1.18% | 1.20% |
Expenses net of all reductions | 1.06% | 1.13% | 1.13% | 1.17% | 1.20% |
Net investment income (loss) | .71% | .41% | .37% E | .39% F | 1.01% |
Supplemental Data | | | | | |
Net assets, end of period (000 omitted) | $ 2,672,854 | $ 1,756,962 | $ 1,899,805 | $ 1,770,675 | $ 1,488,736 |
Portfolio turnover rate D | 29% | 27% | 22% | 49% | 51% |
A Total returns would have been lower if certain expenses had not been reduced during the applicable periods shown.
B Calculated based on average shares outstanding during the period.
C Fees and expenses of any underlying Fidelity Central Funds are not included in the Fund's expense ratio. The Fund indirectly bears its proportionate share of the expenses of any underlying Fidelity Central Funds.
D Amount does not include the portfolio activity of any underlying Fidelity Central Funds.
E Investment income per share reflects a large, non-recurring dividend which amounted to $.06 per share. Excluding this non-recurring dividend, the ratio of net investment income (loss) to average net assets would have been (.01)%.
F Investment income per share reflects a large, non-recurring dividend which amounted to $.03 per share. Excluding this non-recurring dividend, the ratio of net investment income (loss) to average net assets would have been .12%.
G Expense ratios reflect operating expenses of the class. Expenses before reductions do not reflect amounts reimbursed by the investment adviser or reductions from brokerage service arrangements or reductions from other expense offset arrangements and do not represent the amount paid by the class during periods when reimbursements or reductions occur. Expenses net of fee waivers reflect expenses after reimbursement by the investment adviser but prior to reductions from brokerage service arrangements or other expense offset arrangements. Expenses net of all reductions represent the net expenses paid by the class.
H Amount represents less than $.01 per share.
See accompanying notes which are an integral part of the financial statements.
Annual Report
Financial Highlights - Class F
Years ended July 31, | 2013 | 2012 | 2011 | 2010 | 2009 I |
Selected Per-Share Data | | | | | |
Net asset value, beginning of period | $ 15.09 | $ 15.64 | $ 13.58 | $ 11.22 | $ 10.27 |
Income from Investment Operations | | | | |
Net investment income (loss) D | .16 | .09 | .09 G | .09 H | .01 |
Net realized and unrealized gain (loss) | 5.65 | .32 | 2.23 | 2.34 | .94 |
Total from investment operations | 5.81 | .41 | 2.32 | 2.43 | .95 |
Distributions from net investment income | (.15) | (.04) | (.14) | (.07) | - |
Distributions from net realized gain | (.47) | (.93) | (.13) | - | - |
Total distributions | (.62) | (.96) L | (.26) M | (.07) | - |
Redemption fees added to paid in capital D,K | - | - | - | - | - |
Net asset value, end of period | $ 20.28 | $ 15.09 | $ 15.64 | $ 13.58 | $ 11.22 |
Total Return B,C | 39.79% | 3.90% | 17.31% | 21.69% | 9.25% |
Ratios to Average Net Assets E,J | | | | | |
Expenses before reductions | .84% | .89% | .88% | .90% | .86% A |
Expenses net of fee waivers, if any | .84% | .89% | .88% | .90% | .86% A |
Expenses net of all reductions | .84% | .89% | .88% | .89% | .86% A |
Net investment income (loss) | .93% | .64% | .61% G | .67% H | .64% A |
Supplemental Data | | | | | |
Net assets, end of period (000 omitted) | $ 732,193 | $ 526,009 | $ 279,653 | $ 109,868 | $ 159 |
Portfolio turnover rate F | 29% | 27% | 22% | 49% | 51% |
A Annualized
B Total returns for periods of less than one year are not annualized.
C Total returns would have been lower if certain expenses had not been reduced during the applicable periods shown.
D Calculated based on average shares outstanding during the period.
E Fees and expenses of any underlying Fidelity Central Funds are not included in the Fund's expense ratio. The Fund indirectly bears its proportionate share of the expenses of any underlying Fidelity Central Funds.
F Amount does not include the portfolio activity of any underlying Fidelity Central Funds.
G Investment income per share reflects a large, non-recurring dividend which amounted to $.06 per share. Excluding this non-recurring dividend, the ratio of net investment income (loss) to average net assets would have been .24%.
H Investment income per share reflects a large, non-recurring dividend which amounted to $.03 per share. Excluding this non-recurring dividend, the ratio of net investment income (loss) to average net assets would have been .40%.
I For the period June 26, 2009 (commencement of sale of shares) to July 31, 2009.
J Expense ratios reflect operating expenses of the class. Expenses before reductions do not reflect amounts reimbursed by the investment adviser or reductions from brokerage service arrangements or reductions from other expense offset arrangements and do not represent the amount paid by the class during periods when reimbursements or reductions occur. Expense ratios before reductions for start-up periods may not be representative of longer-term operating periods. Expenses net of fee waivers reflect expenses after reimbursement by the investment adviser but prior to reductions from brokerage service arrangements or other expense offset arrangements. Expenses net of all reductions represent the net expenses paid by the class.
K Amount represents less than $.01 per share.
L Total distributions of $.96 per share is comprised of distributions from net investment income of $.036 and distributions from net realized gain of $.925 per share.
M Total distributions of $.26 per share is comprised of distributions from net investment income of $.138 and distributions from net realized gain of $.126 per share.
See accompanying notes which are an integral part of the financial statements.
Annual Report
Financial Highlights - Institutional Class
Years ended July 31, | 2013 | 2012 | 2011 | 2010 | 2009 |
Selected Per-Share Data | | | | | |
Net asset value, beginning of period | $ 15.05 | $ 15.63 | $ 13.58 | $ 11.24 | $ 11.91 |
Income from Investment Operations | | | | | |
Net investment income (loss) B | .12 | .06 | .06 E | .06 F | .10 |
Net realized and unrealized gain (loss) | 5.65 | .31 | 2.23 | 2.34 | (.59) |
Total from investment operations | 5.77 | .37 | 2.29 | 2.40 | (.49) |
Distributions from net investment income | (.12) | (.02) | (.11) | (.06) | (.07) |
Distributions from net realized gain | (.47) | (.93) | (.13) | - | (.11) |
Total distributions | (.59) | (.95) | (.24) | (.06) | (.18) |
Redemption fees added to paid in capital B,H | - | - | - | - | - |
Net asset value, end of period | $ 20.23 | $ 15.05 | $ 15.63 | $ 13.58 | $ 11.24 |
Total Return A | 39.54% | 3.59% | 17.02% | 21.42% | (4.04)% |
Ratios to Average Net Assets C,G | | | | | |
Expenses before reductions | 1.07% | 1.14% | 1.10% | 1.12% | 1.20% |
Expenses net of fee waivers, if any | 1.07% | 1.14% | 1.10% | 1.12% | 1.15% |
Expenses net of all reductions | 1.06% | 1.14% | 1.10% | 1.12% | 1.15% |
Net investment income (loss) | .70% | .39% | .39% E | .45% F | 1.06% |
Supplemental Data | | | | | |
Net assets, end of period (000 omitted) | $ 359,582 | $ 138,981 | $ 101,565 | $ 78,440 | $ 10,336 |
Portfolio turnover rate D | 29% | 27% | 22% | 49% | 51% |
A Total returns would have been lower if certain expenses had not been reduced during the applicable periods shown.
B Calculated based on average shares outstanding during the period.
C Fees and expenses of any underlying Fidelity Central Funds are not included in the Fund's expense ratio. The Fund indirectly bears its proportionate share of the expenses of any underlying Fidelity Central Funds.
D Amount does not include the portfolio activity of any underlying Fidelity Central Funds.
E Investment income per share reflects a large, non-recurring dividend which amounted to $.06 per share. Excluding this non-recurring dividend, the ratio of net investment income (loss) to average net assets would have been .01%.
F Investment income per share reflects a large, non-recurring dividend which amounted to $.03 per share. Excluding this non-recurring dividend, the ratio of net investment income (loss) to average net assets would have been .18%.
G Expense ratios reflect operating expenses of the class. Expenses before reductions do not reflect amounts reimbursed by the investment adviser or reductions from brokerage service arrangements or reductions from other expense offset arrangements and do not represent the amount paid by the class during periods when reimbursements or reductions occur. Expenses net of fee waivers reflect expenses after reimbursement by the investment adviser but prior to reductions from brokerage service arrangements or other expense offset arrangements. Expenses net of all reductions represent the net expenses paid by the class.
H Amount represents less than $.01 per share.
See accompanying notes which are an integral part of the financial statements.
Annual Report
Notes to Financial Statements
For the period ended July 31, 2013
1. Organization.
Fidelity Small Cap Value Fund (the Fund) is a fund of Fidelity Securities Fund (the Trust) and is authorized to issue an unlimited number of shares. The Trust is registered under the Investment Company Act of 1940, as amended (the 1940 Act), as an open-end management investment company organized as a Massachusetts business trust. The Fund offers Class A, Class T, Class C, Small Cap Value, Class F and Institutional Class shares, each of which, along with Class B shares, has equal rights as to assets and voting privileges. Class B shares are closed to new accounts and additional purchases, except for exchanges and reinvestments. Effective after the close of business on March 1, 2013, the Fund's other share classes were closed to new accounts with certain exceptions. Each class has exclusive voting rights with respect to matters that affect that class. Class F shares of the Fund are only available for purchase by mutual funds for which Fidelity Management & Research Company (FMR) or an affiliate serves as investment manager. Class B shares will automatically convert to Class A shares after a holding period of seven years from the initial date of purchase.
2. Investments in Fidelity Central Funds.
The Fund invests in Fidelity Central Funds, which are open-end investment companies generally available only to other investment companies and accounts managed by FMR and its affiliates. The Fund's Schedule of Investments lists each of the Fidelity Central Funds held as of period end, if any, as an investment of the Fund, but does not include the underlying holdings of each Fidelity Central Fund. As an Investing Fund, the Fund indirectly bears its proportionate share of the expenses of the underlying Fidelity Central Funds.
The Money Market Central Funds seek preservation of capital and current income and are managed by Fidelity Investments Money Management, Inc. (FIMM), an affiliate of FMR.
A complete unaudited list of holdings for each Fidelity Central Fund is available upon request or at the Securities and Exchange Commission (the SEC) website at www.sec.gov. In addition, the financial statements of the Fidelity Central Funds, which are not covered by the Fund's Report of Independent Registered Public Accounting Firm, are available on the SEC website or upon request.
3. Significant Accounting Policies.
The financial statements have been prepared in conformity with accounting principles generally accepted in the United States of America (GAAP), which require management to make certain estimates and assumptions at the date of the financial statements. Actual results could differ from those estimates. Subsequent events, if any, through the date that the financial statements were issued have been evaluated in the preparation of
Annual Report
Notes to Financial Statements - continued
3. Significant Accounting Policies - continued
the financial statements. The following summarizes the significant accounting policies of the Fund:
Investment Valuation. Investments are valued as of 4:00 p.m. Eastern time on the last calendar day of the period. In accordance with valuation policies and procedures approved by the Board of Trustees (the Board), the Fund attempts to obtain prices from one or more third party pricing vendors or brokers to value its investments. When current market prices, quotations or currency exchange rates are not readily available or reliable, investments will be fair valued in good faith by the FMR Fair Value Committee (the Committee), in accordance with procedures adopted by the Board. Factors used in determining fair value vary by investment type and may include market or investment specific events. The frequency with which these procedures are used cannot be predicted and they may be utilized to a significant extent. The Committee oversees the Fund's valuation policies and procedures and is responsible for approving and reporting to the Board all fair value determinations.
The Fund categorizes the inputs to valuation techniques used to value its investments into a disclosure hierarchy consisting of three levels as shown below:
Level 1 - quoted prices in active markets for identical investments
Level 2 - other significant observable inputs (including quoted prices for similar investments, interest rates, prepayment speeds, etc.)
Level 3 - unobservable inputs (including the Fund's own assumptions based on the best information available)
Valuation techniques used to value the Fund's investments by major category are as follows:
Equity securities, including restricted securities, for which market quotations are readily available, are valued at the last reported sale price or official closing price as reported by a third party pricing vendor on the primary market or exchange on which they are traded and are categorized as Level 1 in the hierarchy. In the event there were no sales during the day or closing prices are not available, securities are valued at the last quoted bid price or may be valued using the last available price and are generally categorized as Level 2 in the hierarchy. For foreign equity securities, when market or security specific events arise, comparisons to the valuation of American Depositary Receipts (ADRs), futures contracts, Exchange-Traded Funds (ETFs) and certain indexes as well as quoted prices for similar securities may be used and would be categorized as Level 2 in the hierarchy. Utilizing these techniques may result in transfers between Level 1 and Level 2.
Annual Report
3. Significant Accounting Policies - continued
Investment Valuation - continued
Investments in open-end mutual funds, including the Fidelity Central Funds, are valued at their closing net asset value (NAV) each business day and are categorized as Level 1 in the hierarchy.
Changes in valuation techniques may result in transfers in or out of an assigned level within the disclosure hierarchy.
Foreign Currency. The Fund may use foreign currency contracts to facilitate transactions in foreign-denominated securities. Gains and losses from these transactions may arise from changes in the value of the foreign currency or if the counterparties do not perform under the contracts' terms.
Foreign-denominated assets, including investment securities, and liabilities are translated into U.S. dollars at the exchange rates at period end. Purchases and sales of investment securities, income and dividends received and expenses denominated in foreign currencies are translated into U.S. dollars at the exchange rate in effect on the transaction date.
The effects of exchange rate fluctuations on investments are included with the net realized and unrealized gain (loss) on investment securities. Other foreign currency transactions resulting in realized and unrealized gain (loss) are disclosed separately.
Investment Transactions and Income. For financial reporting purposes, the Fund's investment holdings and NAV include trades executed through the end of the last business day of the period. The NAV per share for processing shareholder transactions is calculated as of the close of business of the New York Stock Exchange (NYSE), normally 4:00 p.m. Eastern time and includes trades executed through the end of the prior business day. Gains and losses on securities sold are determined on the basis of identified cost and may include proceeds received from litigation. Dividend income is recorded on the ex-dividend date, except for certain dividends from foreign securities where the ex-dividend date may have passed, which are recorded as soon as the Fund is informed of the ex-dividend date. Non-cash dividends included in dividend income, if any, are recorded at the fair market value of the securities received. Distributions received on securities that represent a return of capital or capital gain are recorded as a reduction of cost of investments and/or as a realized gain. Subsequent to ex-dividend date the Fund determines the components of these distributions, based upon receipt of tax filings or other correspondence relating to the underlying investment. Interest income and distributions from the Fidelity Central Funds are accrued as earned. Interest income includes coupon interest and amortization of premium and accretion of discount on debt securities. Investment income is recorded net of foreign taxes withheld where recovery of such taxes is uncertain.
Annual Report
Notes to Financial Statements - continued
3. Significant Accounting Policies - continued
Class Allocations and Expenses. Investment income, realized and unrealized capital gains and losses, common expenses of the Fund, and certain fund-level expense reductions, if any, are allocated on a pro-rata basis to each class based on the relative net assets of each class to the total net assets of the Fund. Each class differs with respect to transfer agent and distribution and service plan fees incurred. Certain expense reductions may also differ by class. Expenses directly attributable to a fund are charged to that fund. Expenses attributable to more than one fund are allocated among the respective funds on the basis of relative net assets or other appropriate methods. Expense estimates are accrued in the period to which they relate and adjustments are made when actual amounts are known.
Income Tax Information and Distributions to Shareholders. Each year, the Fund intends to qualify as a regulated investment company under Subchapter M of the Internal Revenue Code, including distributing substantially all of its taxable income and realized gains. As a result, no provision for income taxes is required. As of July 31, 2013, the Fund did not have any unrecognized tax benefits in the financial statements; nor is the Fund aware of any tax positions for which it is reasonably possible that the total amounts of unrecognized tax benefits will significantly change in the next twelve months. The Fund files a U.S. federal tax return, in addition to state and local tax returns as required. A fund's federal income tax returns are subject to examination by the Internal Revenue Service (IRS) for a period of three fiscal years after they are filed. State and local tax returns may be subject to examination for an additional fiscal year depending on the jurisdiction. Foreign taxes are provided for based on the Fund's understanding of the tax rules and rates that exist in the foreign markets in which it invests.
Distributions are declared and recorded on the ex-dividend date. Income dividends and capital gain distributions are declared separately for each class. Income and capital gain distributions are determined in accordance with income tax regulations, which may differ from GAAP. In addition, the Fund claimed a portion of the payment made to redeeming shareholders as a distribution for income tax purposes.
Capital accounts within the financial statements are adjusted for permanent book-tax differences. These adjustments have no impact on net assets or the results of operations. Temporary book-tax differences will reverse in a subsequent period.
Book-tax differences are primarily due to foreign currency transactions and losses deferred due to wash sales.
Annual Report
3. Significant Accounting Policies - continued
Income Tax Information and Distributions to Shareholders - continued
The federal tax cost of investment securities and unrealized appreciation (depreciation) as of period end were as follows:
Gross unrealized appreciation | $ 1,227,810,766 |
Gross unrealized depreciation | (53,133,128) |
Net unrealized appreciation (depreciation) on securities and other investments | $ 1,174,677,638 |
| |
Tax Cost | $ 3,131,813,247 |
The tax-based components of distributable earnings as of period end were as follows:
Undistributed ordinary income | $ 6,475,378 |
Undistributed long-term capital gain | $ 260,802,795 |
Net unrealized appreciation (depreciation) | $ 1,174,679,321 |
The tax character of distributions paid was as follows:
| July 31, 2013 | July 31, 2012 |
Ordinary Income | $ 21,412,021 | $ 3,813,704 |
Long-term Capital Gains | 85,195,362 | 148,970,854 |
Total | $ 106,607,383 | $ 152,784,558 |
Short-Term Trading (Redemption) Fees. Shares held by investors in the Fund less than 90 days may have been subject to a redemption fee equal to 1.50% of the net asset value of shares redeemed. All redemption fees, which reduce the proceeds of the shareholder redemption, are retained by the Fund and accounted for as an addition to paid in capital.
4. Purchases and Sales of Investments.
Purchases and sales of securities, other than short-term securities, aggregated $1,422,626,355 and $998,724,082, respectively.
5. Fees and Other Transactions with Affiliates.
Management Fee. FMR and its affiliates provide the Fund with investment management related services for which the Fund pays a monthly management fee. The management fee is the sum of an individual fund fee rate that is based on an annual rate of .45% of the Fund's average net assets and an annualized group fee rate that averaged .26% during the period. The group fee rate is based upon the average net assets of all the
Annual Report
Notes to Financial Statements - continued
5. Fees and Other Transactions with Affiliates - continued
Management Fee - continued
mutual funds advised by FMR. The group fee rate decreases as assets under management increase and increases as assets under management decrease. In addition, the management fee is subject to a performance adjustment (up to a maximum of ± .20% of the Fund's average net assets over a 36 month performance period). The upward or downward adjustment to the management fee is based on the relative investment performance of Small Cap Value as compared to an appropriate benchmark index. For the period, the total annual management fee rate, including the performance adjustment, was .81% of the Fund's average net assets.
Distribution and Service Plan Fees. In accordance with Rule 12b-1 of the 1940 Act, the Fund has adopted separate Distribution and Service Plans for each class of shares. Certain classes pay Fidelity Distributors Corporation (FDC), an affiliate of FMR, separate Distribution and Service Fees, each of which is based on an annual percentage of each class' average net assets. In addition, FDC may pay financial intermediaries for selling shares of the Fund and providing shareholder support services. For the period, the Distribution and Service Fee rates, total fees and amounts retained by FDC were as follows:
| Distribution
Fee | Service
Fee | Total Fees | Retained
by FDC |
Class A | -% | .25% | $ 521,981 | $ 17,754 |
Class T | .25% | .25% | 393,892 | 3,578 |
Class B | .75% | .25% | 69,430 | 52,493 |
Class C | .75% | .25% | 617,999 | 153,559 |
| | | $ 1,603,302 | $ 227,384 |
Sales Load. FDC may receive a front-end sales charge of up to 5.75% for selling Class A shares and 3.50% for selling Class T shares, some of which is paid to financial intermediaries for selling shares of the Fund. Depending on the holding period, FDC may receive contingent deferred sales charges levied on Class A, Class T, Class B and Class C redemptions. The deferred sales charges range from 5.00% to 1.00% for Class B shares, 1.00% for Class C shares, 1.00% for certain purchases of Class A shares and .25% for certain purchases of Class T shares.
Annual Report
5. Fees and Other Transactions with Affiliates - continued
Sales Load - continued
For the period, sales charge amounts retained by FDC were as follows:
| Retained
by FDC |
Class A | $ 49,310 |
Class T | 9,353 |
Class B* | 5,848 |
Class C* | 4,577 |
| $ 69,088 |
* When Class B and Class C shares are initially sold, FDC pays commissions from its own resources to financial intermediaries through which the sales are made.
Transfer Agent Fees. Fidelity Investments Institutional Operations Company, Inc., (FIIOC), an affiliate of FMR, is the transfer, dividend disbursing and shareholder servicing agent for each class of the Fund. FIIOC receives account fees and asset-based fees that vary according to the account size and type of account of the shareholders of the respective classes of the Fund, except for Class F. FIIOC receives no fees for providing transfer agency services to Class F. FIIOC pays for typesetting, printing and mailing of shareholder reports, except proxy statements. For the period, transfer agent fees for each class were as follows:
| Amount | % of
Average
Net Assets |
Class A | $ 563,024 | .27 |
Class T | 199,649 | .25 |
Class B | 20,848 | .30 |
Class C | 175,062 | .28 |
Small Cap Value | 4,868,907 | .22 |
Institutional Class | 559,678 | .23 |
| $ 6,387,168 | |
Accounting and Security Lending Fees. Fidelity Service Company, Inc. (FSC), an affiliate of FMR, maintains the Fund's accounting records. The accounting fee is based on the level of average net assets for each month. Under a separate contract, FSC administers the security lending program. The security lending fee is based on the number and duration of lending transactions.
Brokerage Commissions. The Fund placed a portion of its portfolio transactions with brokerage firms which are affiliates of the investment adviser. Brokerage commissions are included in net realized gain (loss) and change in net unrealized appreciation
Annual Report
Notes to Financial Statements - continued
5. Fees and Other Transactions with Affiliates - continued
Brokerage Commissions - continued
(depreciation) in the Statement of Operations. The commissions paid to these affiliated firms were $28,205 for the period.
Interfund Lending Program. Pursuant to an Exemptive Order issued by the SEC, the Fund, along with other registered investment companies having management contracts with FMR, may participate in an interfund lending program. This program provides an alternative credit facility allowing the funds to borrow from, or lend money to, other participating affiliated funds. At period end, there were no interfund loans outstanding. The Fund's activity in this program during the period for which loans were outstanding was as follows:
Borrower or Lender | Average Loan
Balance | Weighted Average Interest Rate | Interest
Expense |
Borrower | $ 5,199,400 | .35% | $ 508 |
6. Committed Line of Credit.
The Fund participates with other funds managed by FMR or an affiliate in a $4.25 billion credit facility (the "line of credit") to be utilized for temporary or emergency purposes to fund shareholder redemptions or for other short-term liquidity purposes. The Fund has agreed to pay commitment fees on its pro-rata portion of the line of credit, which amounted to $7,721 and is reflected in Miscellaneous expenses on the Statement of Operations. During the period, there were no borrowings on this line of credit.
7. Security Lending.
The Fund lends portfolio securities through a lending agent from time to time in order to earn additional income. For equity securities, a lending agent is used and may loan securities to certain qualified borrowers, including Fidelity Capital Markets (FCM), a broker-dealer affiliated with the Fund. On the settlement date of the loan, the Fund receives collateral (in the form of U.S. Treasury obligations, letters of credit and/or cash) against the loaned securities and maintains collateral in an amount not less than 100% of the market value of the loaned securities during the period of the loan. The market value of the loaned securities is determined at the close of business of the Fund and any additional required collateral is delivered to the Fund on the next business day. If the borrower defaults on its obligation to return the securities loaned because of insolvency or other reasons, the Fund may apply collateral received from the borrower against the obligation. The Fund may experience delays and costs in recovering the securities loaned. Any cash collateral received is invested in the Fidelity Securities Lending Cash Central Fund. The value of loaned securities and cash collateral at period end are
Annual Report
7. Security Lending - continued
disclosed on the Fund's Statement of Assets and Liabilities. The value of securities loaned to FCM at period end was $3,995,700. Security lending income represents the income earned on investing cash collateral, less rebates paid to borrowers and any lending agent fees associated with the loan, plus any premium payments received for lending certain types of securities. Security lending income is presented in the Statement of Operations as a component of income from Fidelity Central Funds. Total security lending income during the period amounted to $546,053, including $146,197 from securities loaned to FCM.
8. Expense Reductions.
Commissions paid to certain brokers with whom FMR places trades on behalf of the Fund include an amount in addition to trade execution, which is rebated back to the Fund to offset certain expenses. This amount totaled $235,596 for the period.
In addition, FMR reimbursed a portion of the Fund's operating expenses during the period in the amount of $6,754.
9. Distributions to Shareholders.
Distributions to shareholders of each class were as follows:
Years ended July 31, | 2013 | 2012 |
From net investment income | | |
Class A | $ 785,355 | $ 57,416 |
Class T | 231,402 | - |
Class B | 9,411 | - |
Class C | 90,526 | - |
Small Cap Value | 13,318,853 | 2,736,678 |
Class F | 5,669,081 | 858,633 |
Institutional Class | 1,307,393 | 160,977 |
Total | $ 21,412,021 | $ 3,813,704 |
From net realized gain | | |
Class A | $ 5,001,914 | $ 8,369,079 |
Class T | 1,871,336 | 3,332,444 |
Class B | 211,601 | 513,839 |
Class C | 1,589,582 | 2,835,863 |
Small Cap Value | 54,759,308 | 109,450,254 |
Class F | 17,097,966 | 18,207,376 |
Institutional Class | 4,663,655 | 6,261,999 |
Total | $ 85,195,362 | $ 148,970,854 |
Annual Report
Notes to Financial Statements - continued
10. Share Transactions.
Transactions for each class of shares were as follows:
| Shares | Dollars |
Years ended July 31, | 2013 | 2012 | 2013 | 2012 |
Class A | | | | |
Shares sold | 6,665,265 | 3,582,114 | $ 113,825,347 | $ 51,112,084 |
Reinvestment of distributions | 357,182 | 639,382 | 5,478,656 | 7,957,627 |
Shares redeemed | (3,345,663) | (3,203,028) | (56,976,312) | (45,298,282) |
Net increase (decrease) | 3,676,784 | 1,018,468 | $ 62,327,691 | $ 13,771,429 |
Class T | | | | |
Shares sold | 2,420,486 | 1,074,645 | $ 41,524,163 | $ 15,238,625 |
Reinvestment of distributions | 135,952 | 264,657 | 2,060,454 | 3,258,576 |
Shares redeemed | (1,017,057) | (1,066,289) | (17,196,752) | (14,773,000) |
Net increase (decrease) | 1,539,381 | 273,013 | $ 26,387,865 | $ 3,724,201 |
Class B | | | | |
Shares sold | 63,699 | 17,886 | $ 1,033,590 | $ 244,464 |
Reinvestment of distributions | 12,922 | 36,117 | 189,673 | 433,889 |
Shares redeemed | (174,192) | (156,185) | (2,861,489) | (2,129,294) |
Net increase (decrease) | (97,571) | (102,182) | $ (1,638,226) | $ (1,450,941) |
Class C | | | | |
Shares sold | 1,262,288 | 840,854 | $ 20,129,471 | $ 11,606,643 |
Reinvestment of distributions | 98,556 | 202,948 | 1,448,319 | 2,439,209 |
Shares redeemed | (683,043) | (895,789) | (11,003,236) | (12,102,998) |
Net increase (decrease) | 677,801 | 148,013 | $ 10,574,554 | $ 1,942,854 |
Small Cap Value | | | | |
Shares sold | 46,643,321 | 27,786,966 | $ 815,184,196 | $ 403,227,336 |
Reinvestment of distributions | 4,065,017 | 8,564,707 | 63,037,497 | 107,820,730 |
Shares redeemed | (35,306,999) | (41,177,942) | (618,245,939) | (579,334,071) |
Net increase (decrease) | 15,401,339 | (4,826,269) | $ 259,975,754 | $ (68,286,005) |
Class F | | | | |
Shares sold | 7,943,352 | 17,383,615 | $ 133,806,197 | $ 249,495,726 |
Reinvestment of distributions | 1,465,154 | 1,506,337 | 22,767,047 | 19,066,009 |
Shares redeemed | (8,168,596) | (1,906,027) | (151,555,822) | (26,618,099) |
Net increase (decrease) | 1,239,910 | 16,983,925 | $ 5,017,422 | $ 241,943,636 |
Institutional Class | | | | |
Shares sold | 11,988,758 | 4,662,732 | $ 206,274,907 | $ 67,294,175 |
Reinvestment of distributions | 337,968 | 445,761 | 5,246,517 | 5,619,794 |
Shares redeemed | (3,783,835) | (2,373,514) | (66,718,093) | (33,655,059) |
Net increase (decrease) | 8,542,891 | 2,734,979 | $ 144,803,331 | $ 39,258,910 |
Annual Report
11. Other.
The Fund's organizational documents provide former and current trustees and officers with a limited indemnification against liabilities arising in connection with the performance of their duties to the Fund. In the normal course of business, the Fund may also enter into contracts that provide general indemnifications. The Fund's maximum exposure under these arrangements is unknown as this would be dependent on future claims that may be made against the Fund. The risk of material loss from such claims is considered remote.
At the end of the period, Fidelity Freedom Funds and Fidelity Freedom K Funds were the owners of record, in the aggregate, of approximately 31% of the total outstanding shares of the Fund.
Annual Report
To the Trustees of Fidelity Securities Fund and the Shareholders of Fidelity Small Cap Value Fund:
In our opinion, the accompanying statement of assets and liabilities, including the schedule of investments, and the related statements of operations and of changes in net assets and the financial highlights present fairly, in all material respects, the financial position of Fidelity Small Cap Value Fund (a fund of Fidelity Securities Fund) at July 31, 2013, the results of its operations for the year then ended, the changes in its net assets for each of the two years in the period then ended and the financial highlights for each of the five years in the period then ended, in conformity with accounting principles generally accepted in the United States of America. These financial statements and financial highlights (hereafter referred to as "financial statements") are the responsibility of the Fidelity Small Cap Value Fund's management. Our responsibility is to express an opinion on these financial statements based on our audits. We conducted our audits of these financial statements in accordance with the standards of the Public Company Accounting Oversight Board (United States). Those standards require that we plan and perform the audit to obtain reasonable assurance about whether the financial statements are free of material misstatement. An audit includes examining, on a test basis, evidence supporting the amounts and disclosures in the financial statements, assessing the accounting principles used and significant estimates made by management, and evaluating the overall financial statement presentation. We believe that our audits, which included confirmation of securities at July 31, 2013 by correspondence with the custodian and brokers, provide a reasonable basis for our opinion.
PricewaterhouseCoopers LLP
Boston, Massachusetts
September 16, 2013
Annual Report
The Trustees, Member of the Advisory Board, and executive officers of the trust and fund, as applicable, are listed below. The Board of Trustees governs the fund and is responsible for protecting the interests of shareholders. The Trustees are experienced executives who meet periodically throughout the year to oversee the fund's activities, review contractual arrangements with companies that provide services to the fund, oversee management of the risks associated with such activities and contractual arrangements, and review the fund's performance. Except for James C. Curvey, Ned C. Lautenbach, Ronald P. O'Hanley, and William S. Stavropoulos, each of the Trustees oversees 166 Fidelity funds. Mr. Curvey oversees 387 Fidelity funds. Mr. Lautenbach, Mr. O'Hanley, and Mr. Stavropoulos each oversees 230 Fidelity funds.
The Trustees hold office without limit in time except that (a) any Trustee may resign; (b) any Trustee may be removed by written instrument, signed by at least two-thirds of the number of Trustees prior to such removal; (c) any Trustee who requests to be retired or who has become incapacitated by illness or injury may be retired by written instrument signed by a majority of the other Trustees; and (d) any Trustee may be removed at any special meeting of shareholders by a two-thirds vote of the outstanding voting securities of the trust. Each Trustee who is not an interested person of the trust and the fund (as defined in the 1940 Act) (Independent Trustee), shall retire not later than the last day of the calendar year in which his or her 75th birthday occurs. The Independent Trustees may waive this mandatory retirement age policy with respect to individual Trustees. The executive officers and Advisory Board Member hold office without limit in time, except that any officer and Advisory Board Member may resign or may be removed by a vote of a majority of the Trustees at any regular meeting or any special meeting of the Trustees. Except as indicated, each individual has held the office shown or other offices in the same company for the past five years.
Experience, Skills, Attributes, and Qualifications of the Fund's Trustees. The Governance and Nominating Committee has adopted a statement of policy that describes the experience, qualifications, attributes, and skills that are necessary and desirable for potential Independent Trustee candidates (Statement of Policy). The Board believes that each Trustee satisfied at the time he or she was initially elected or appointed a Trustee, and continues to satisfy, the standards contemplated by the Statement of Policy. The Governance and Nominating Committee also engages professional search firms to help identify potential Independent Trustee candidates who have the experience, qualifications, attributes, and skills consistent with the Statement of Policy. From time to time, additional criteria based on the composition and skills of the current Independent Trustees, as well as experience or skills that may be appropriate in light of future changes to board composition, business conditions, and regulatory or other developments, have also been considered by the professional search firms and the Governance and Nominating Committee. In addition, the Board takes into account the Trustees' commitment and participation in Board and committee meetings, as well as their leadership of standing and ad hoc committees throughout their tenure.
Annual Report
In determining that a particular Trustee was and continues to be qualified to serve as a Trustee, the Board has considered a variety of criteria, none of which, in isolation, was controlling. The Board believes that, collectively, the Trustees have balanced and diverse experience, qualifications, attributes, and skills, which allow the Board to operate effectively in governing the fund and protecting the interests of shareholders. Information about the specific experience, skills, attributes, and qualifications of each Trustee, which in each case led to the Board's conclusion that the Trustee should serve (or continue to serve) as a trustee of the fund, is provided below.
Board Structure and Oversight Function. James C. Curvey is an interested person (as defined in the 1940 Act) and currently serves as Chairman. The Trustees have determined that an interested Chairman is appropriate and benefits shareholders because an interested Chairman has a personal and professional stake in the quality and continuity of services provided to the fund. Independent Trustees exercise their informed business judgment to appoint an individual of their choosing to serve as Chairman, regardless of whether the Trustee happens to be independent or a member of management. The Independent Trustees have determined that they can act independently and effectively without having an Independent Trustee serve as Chairman and that a key structural component for assuring that they are in a position to do so is for the Independent Trustees to constitute a substantial majority for the Board. The Independent Trustees also regularly meet in executive session. Ned C. Lautenbach serves as Chairman of the Independent Trustees and as such (i) acts as a liaison between the Independent Trustees and management with respect to matters important to the Independent Trustees and (ii) with management prepares agendas for Board meetings.
Fidelity funds are overseen by different Boards of Trustees. The fund's Board oversees Fidelity's equity and high income funds and another Board oversees Fidelity's investment-grade bond, money market, and asset allocation funds. The asset allocation funds may invest in Fidelity funds overseen by the fund's Board. The use of separate Boards, each with its own committee structure, allows the Trustees of each group of Fidelity funds to focus on the unique issues of the funds they oversee, including common research, investment, and operational issues. On occasion, the separate Boards establish joint committees to address issues of overlapping consequences for the Fidelity funds overseen by each Board.
The Trustees operate using a system of committees to facilitate the timely and efficient consideration of all matters of importance to the Trustees, the fund, and fund shareholders and to facilitate compliance with legal and regulatory requirements and oversight of the fund's activities and associated risks. The Board, acting through its committees, has charged FMR and its affiliates with (i) identifying events or circumstances the occurrence of which could have demonstrably adverse effects on the fund's business and/or reputation; (ii) implementing processes and controls to lessen the possibility that such events or circumstances occur or to mitigate the effects of such events or circumstances if they do occur; and (iii) creating and maintaining a system designed to evaluate continuously business and market conditions in order to facilitate the identification and implementation processes described in (i) and (ii) above. Because the day-to-day operations and activities of the fund's are carried out by or through FMR, its affiliates and other service providers, the fund's exposure to risks is mitigated but not eliminated by the processes overseen by the Trustees. While each of the Board's committees has responsibility for overseeing different aspects of the fund's activities, oversight is exercised primarily through the Operations, Audit, and Compliance Committees. In addition, the Independent Trustees have worked with FMR to enhance the Board's oversight of investment and financial risks, legal and regulatory risks, technology risks, and operational risks, including the development of additional risk reporting to the Board. For example, a working group comprised of Independent Trustees and FMR has worked and continues to work to review the Fidelity funds' valuation-related activities, reporting and risk management. Appropriate personnel, including but not limited to the fund's Chief Compliance Officer (CCO), FMR's internal auditor, the independent accountants, the fund's Treasurer and portfolio management personnel, make periodic reports to the Board's committees, as appropriate, including an annual review of FMR's risk management program for the Fidelity funds. The responsibilities of each standing committee, including their oversight responsibilities, are described further under "Standing Committees of the Fund's Trustees."
Annual Report
Trustees and Officers - continued
The fund's Statement of Additional Information (SAI) includes more information about the Trustees. To request a free copy, call Fidelity at 1-800-835-5092.
Interested Trustees*:
Correspondence intended for each Trustee who is an interested person may be sent to Fidelity Investments, 245 Summer Street, Boston, Massachusetts 02210.
Name, Year of Birth; Principal Occupations and Other Relevant Experience+ |
James C. Curvey (1935) |
| Year of Election or Appointment: 2007 Mr. Curvey is Trustee and Chairman of the Board of Trustees of certain Trusts. Mr. Curvey also serves as Trustee (2007-present) of other investment companies advised by FMR. Mr. Curvey is a Director of Fidelity Investments Money Management, Inc. (2009-present), Director of Fidelity Research & Analysis Co. (2009-present) and Director of FMR and FMR Co., Inc. (2007-present). Mr. Curvey is also Vice Chairman (2007-present) and Director of FMR LLC. In addition, Mr. Curvey serves as an Overseer for the Boston Symphony Orchestra and a member of the Trustees of Villanova University. Previously, Mr. Curvey was the Vice Chairman (2006-2007) and Director (2000-2007) of FMR Corp. |
Ronald P. O'Hanley (1957) |
| Year of Election or Appointment: 2011 Mr. O'Hanley serves as a Trustee and Chairman of the Board of Trustees of other Fidelity funds (2013-present), and is Director of FMR Co., Inc. (2010-present), Director of Fidelity Investments Money Management, Inc. (2010-present), Director of Fidelity Research & Analysis Company (2010-present), President of Fidelity Asset Management and Corporate Services and a Member of Fidelity's Executive Committee (2010-present). Previously, Mr. O'Hanley served as President and Chief Executive Officer of BNY Mellon Asset Management (2007-2010). Mr. O'Hanley also served as Vice Chairman of Bank New York Mellon Corp. and a member of that firm's Executive Committee. Prior to the 2007 merger of The Bank of New York and Mellon Financial Corporation, he was Vice Chairman of Mellon Financial Corporation and President and Chief Executive Officer of Mellon Asset Management. He joined Mellon in February 1997. Mr. O'Hanley currently serves as Chairman of the Boston Public Library Foundation Board of Directors and sits on the Board of Directors of Beth Israel Deaconess Medical Center, the Board of Trustees of the Marine Biological Laboratory and the Advisory Board of the Maxwell School of Citizenship and Public Administration at Syracuse University. Mr. O'Hanley also chairs the Council on Asset Management for the Financial Services Roundtable and is a member of the Board of Directors of Institutional Investor's U.S. Institute. |
* Trustees have been determined to be "Interested Trustees" by virtue of, among other things, their affiliation with the trust or various entities under common control with FMR.
+ The information above includes each Trustee's principal occupation during the last five years and other information relating to the experience, attributes, and skills relevant to each Trustee's qualifications to serve as a Trustee, which led to the conclusion that each Trustee should serve as a Trustee for the fund.
Annual Report
Trustees and Officers - continued
Independent Trustees:
Correspondence intended for each Independent Trustee (that is, the Trustees other than the Interested Trustees) may be sent to Fidelity Investments, P.O. Box 55235, Boston, Massachusetts 02205-5235.
Name, Year of Birth; Principal Occupations and Other Relevant Experience+ |
Dennis J. Dirks (1948) |
| Year of Election or Appointment: 2005 Prior to his retirement in May 2003, Mr. Dirks was Chief Operating Officer and a member of the Board of The Depository Trust & Clearing Corporation (DTCC). He also served as President, Chief Operating Officer, and Board member of The Depository Trust Company (DTC) and President and Board member of the National Securities Clearing Corporation (NSCC). In addition, Mr. Dirks served as Chief Executive Officer and Board member of the Government Securities Clearing Corporation, Chief Executive Officer and Board member of the Mortgage-Backed Securities Clearing Corporation, as a Trustee and a member of the Finance Committee of Manhattan College (2005-2008), and as a Trustee and a member of the Finance Committee of AHRC of Nassau County (2006-2008). Mr. Dirks is a member of the Independent Directors Council (IDC) Governing Council (2010-present) and Board of Directors for The Brookville Center for Children's Services, Inc. (2009-present). |
Alan J. Lacy (1953) |
| Year of Election or Appointment: 2008 Mr. Lacy serves as Senior Adviser (2007-present) of Oak Hill Capital Partners, L.P. (private equity). Mr. Lacy also served as Chief Executive Officer (2000-2005) and Vice Chairman (2005-2006) of Sears Holdings Corporation and Sears, Roebuck and Co. (retail). In addition, Mr. Lacy serves as a member of the Board of Directors of Dave & Buster's Entertainment, Inc. (restaurant and entertainment complexes, 2010-present), Earth Fare, Inc. (retail grocery, 2012-present), The Hillman Companies, Inc. (hardware wholesalers, 2010-present), and Bristol-Myers Squibb Company (global pharmaceuticals, 2008-present). Mr. Lacy is a member of the Board of Trustees of The National Parks Conservation Association (2006-present). Previously, Mr. Lacy served as Chairman of the Board of Trustees of the National Parks Conservation Association (2008-2011) and as a member of the Board of Directors for the Western Union Company (global money transfer, 2006-2011). |
Ned C. Lautenbach (1944) |
| Year of Election or Appointment: 2000 Mr. Lautenbach is Chairman of the Independent Trustees of the Equity and High Income Funds (2006-present) and serves as a Trustee of other Fidelity funds (2013-present). Mr. Lautenbach currently serves as the Lead Director of the Eaton Corporation Board of Directors (diversified industrial, 1997-present). Mr. Lautenbach is Chairman of the Board of Directors of the Philharmonic Center for the Arts in Naples, Florida (2012-present) and a member of the Council on Foreign Relations (1994-present). Previously, Mr. Lautenbach was a Partner/Advisory Partner at Clayton, Dubilier & Rice, LLC (private equity investment, 1998-2010), as well as a Director of Sony Corporation (2006-2007). |
Joseph Mauriello (1944) |
| Year of Election or Appointment: 2008 Prior to his retirement in January 2006, Mr. Mauriello served in numerous senior management positions including Deputy Chairman and Chief Operating Officer (2004-2005), and Vice Chairman of Financial Services (2002-2004) of KPMG LLP US (professional services, 1965-2005). Mr. Mauriello currently serves as a member of the Board of Directors of XL Group plc. (global insurance and re-insurance, 2006-present). Previously, Mr. Mauriello served as a Director of the Hamilton Funds of the Bank of New York (2006-2007) and of Arcadia Resources Inc. (health care services and products, 2007-2012). |
Robert W. Selander (1950) |
| Year of Election or Appointment: 2011 Previously, Mr. Selander served as a Member of the Advisory Board of Fidelity's Equity and High Income Funds (2011), Executive Vice Chairman (2010), Chief Executive Officer (2009-2010), and President and Chief Executive Officer (1997-2009) of Mastercard, Inc. |
Cornelia M. Small (1944) |
| Year of Election or Appointment: 2005 Ms. Small is a member of the Board of Directors (2009-present) and Chair of the Investment Committee (2010-present) of the Teagle Foundation. Ms. Small also serves on the Investment Committee of the Berkshire Taconic Community Foundation (2008-present). Previously, Ms. Small served as Chairperson (2002-2008) and a member of the Investment Committee and Chairperson (2008-2012) and a member of the Board of Trustees of Smith College. In addition, Ms. Small served as Chief Investment Officer, Director of Global Equity Investments, and a member of the Board of Directors of Scudder, Stevens & Clark and Scudder Kemper Investments. |
William S. Stavropoulos (1939) |
| Year of Election or Appointment: 2002 Mr. Stavropoulos is Vice Chairman of the Independent Trustees of the Equity and High Income Funds (2006-present) and serves as a Trustee of other Fidelity funds (2013-present). Mr. Stavropoulos serves as President and Founder of the Michigan Baseball Foundation, the Great Lakes Loons (2007-present). Mr. Stavropoulos is Chairman Emeritus of the Board of Directors of The Dow Chemical Company, where he previously served in numerous senior management positions, including President, CEO (1995-2000; 2002-2004), Chairman of the Executive Committee (2000-2006), and as a member of the Board of Directors (1990-2006). Currently, Mr. Stavropoulos is Chairman of the Board of Directors of Univar Inc. (global distributor of commodity and specialty chemicals), a Director of Teradata Corporation (data warehousing and technology solutions), and Maersk Inc. (industrial conglomerate), and a member of the Advisory Board for Metalmark Capital LLC (private equity investment, 2005-present). Mr. Stavropoulos is an operating advisor to Clayton, Dubilier & Rice, LLC (private equity investment). In addition, Mr. Stavropoulos is a member of the University of Notre Dame Advisory Council for the College of Science, a Trustee of the Rollin L. Gerstacker Foundation, and a Director of the Naples Philharmonic Center for the Arts. Previously, Mr. Stavropoulos served as a Director of Chemical Financial Corporation (bank holding company, 1993-2012) and Tyco International, Ltd. (multinational manufacturing and services, 2007-2012). |
David M. Thomas (1949) |
| Year of Election or Appointment: 2008 Previously, Mr. Thomas served as Executive Chairman (2005-2006) and Chairman and Chief Executive Officer (2000-2005) of IMS Health, Inc. (pharmaceutical and healthcare information solutions), and a Director of Fortune Brands, Inc. (consumer products, 2000-2011). In addition, Mr. Thomas serves as Non-Executive Chairman of the Board of Directors of Fortune Brands Home and Security (home and security products, 2011-present), and as a member of the Board of Directors of Interpublic Group of Companies, Inc. (marketing communication, 2004-present). |
+ The information above includes each Trustee's principal occupation during the last five years and other information relating to the experience, attributes, and skills relevant to each Trustee's qualifications to serve as a Trustee, which led to the conclusion that each Trustee should serve as a Trustee for the fund.
Annual Report
Advisory Board Member and Executive Officers:
Correspondence intended for each executive officer and Peter S. Lynch may be sent to Fidelity Investments, 245 Summer Street, Boston, Massachusetts 02210.
Name, Year of Birth; Principal Occupation |
Peter S. Lynch (1944) |
| Year of Election or Appointment: 2003 Member of the Advisory Board of Fidelity's Equity and High Income Funds. Mr. Lynch is Vice Chairman and a Director of FMR and FMR Co., Inc. In addition, Mr. Lynch serves as a Trustee of Boston College and as the Chairman of the Inner-City Scholarship Fund. Previously, Mr. Lynch served on the Special Olympics International Board of Directors (1997-2006). |
Kenneth B. Robins (1969) |
| Year of Election or Appointment: 2008 President and Treasurer of Fidelity's Equity and High Income Funds. Mr. Robins also serves as President and Treasurer (2008-present) and Assistant Treasurer (2009-present) of other Fidelity funds and is an employee of Fidelity Investments (2004-present). Mr. Robins serves as Executive Vice President of Fidelity Investments Money Management, Inc. (FIMM) (2013-present). Previously, Mr. Robins served as Deputy Treasurer of the Fidelity funds (2005-2008) and Treasurer and Chief Financial Officer of The North Carolina Capital Management Trust: Cash and Term Portfolios (2006-2008). |
Brian B. Hogan (1964) |
| Year of Election or Appointment: 2009 Vice President of Equity and High Income Funds. Mr. Hogan also serves as Vice President of other Fidelity funds (2009-present) and President of FMR's Equity Division (2009-present). Previously, Mr. Hogan served as Senior Vice President, Equity Research of FMR (2006-2009) and as a portfolio manager. |
Thomas C. Hense (1964) |
| Year of Election or Appointment: 2008 or 2010 Vice President of Fidelity's High Income (2008), Small Cap (2008), and Value (2010) Funds. Previously, Mr. Hense served as a portfolio manager for Fidelity's Institutional Money Management Group (Pyramis) (2003-2008). |
Scott C. Goebel (1968) |
| Year of Election or Appointment: 2008 Secretary and Chief Legal Officer (CLO) of the Fidelity funds. Mr. Goebel also serves as Secretary of Fidelity Investments Money Management, Inc. (FIMM) (2010-present) and Fidelity Research and Analysis Company (FRAC) (2010-present); Secretary and CLO of The North Carolina Capital Management Trust: Cash and Term Portfolios (2008-present); General Counsel, Secretary, and Senior Vice President of FMR (2008-present) and FMR Co., Inc. (2008-present); employed by FMR LLC or an affiliate (2001-present); Chief Legal Officer of Fidelity Management & Research (Hong Kong) Limited (2008-present) and Assistant Secretary of Fidelity Management & Research (Japan) Inc. (2008-present), and Fidelity Management & Research (U.K.) Inc. (2008-present). Previously, Mr. Goebel served as Assistant Secretary of FIMM (2008-2010), FRAC (2008-2010), and the Funds (2007-2008) and as Vice President and Secretary of Fidelity Distributors Corporation (FDC) (2005-2007). |
William C. Coffey (1969) |
| Year of Election or Appointment: 2009 Assistant Secretary of Fidelity's Equity and High Income Funds. Mr. Coffey also serves as Assistant Secretary of other Fidelity funds (2009-present), Senior Vice President and Deputy General Counsel of FMR LLC (2010-present), and is an employee of Fidelity Investments. Previously, Mr. Coffey served as Vice President and Associate General Counsel of FMR LLC (2005-2009). |
Elizabeth Paige Baumann (1968) |
| Year of Election or Appointment: 2012 Anti-Money Laundering (AML) Officer of the Fidelity funds. Ms. Baumann also serves as AML Officer of The North Carolina Capital Management Trust: Cash and Term Portfolios (2012-present), Chief AML Officer of FMR LLC (2012-present), and is an employee of Fidelity Investments. Previously, Ms. Baumann served as Vice President and Deputy Anti-Money Laundering Officer (2007-2012). |
Christine Reynolds (1958) |
| Year of Election or Appointment: 2008 Chief Financial Officer of the Fidelity funds. Ms. Reynolds became President of Fidelity Pricing and Cash Management Services (FPCMS) in August 2008. Ms. Reynolds served as Chief Operating Officer of FPCMS (2007-2008). Previously, Ms. Reynolds served as President, Treasurer, and Anti-Money Laundering officer of the Fidelity funds (2004-2007). |
Joseph A. Hanlon (1968) |
| Year of Election or Appointment: 2012 Chief Compliance Officer of Fidelity's Equity and High Income Funds. Mr. Hanlon also serves as Chief Compliance Officer of other Fidelity funds (2012-present). Mr. Hanlon serves as Compliance Officer of FMR, FMR Co., Inc., Fidelity Investments Money Management, Inc. (FIMM), Fidelity Research and Analysis Company (FRAC), and Fidelity Management & Research (Hong Kong) (2009-present), as Senior Vice President of the Fidelity Asset Management Division (2009-present), and is an employee of Fidelity Investments. Previously, Mr. Hanlon served as Compliance Officer of Fidelity Management & Research (Japan) Inc. (2009-2013), Strategic Advisers, Inc. (2009-2013), and Fidelity Management & Research (U.K.) Inc. (2009-2013). |
Joseph F. Zambello (1957) |
| Year of Election or Appointment: 2011 Deputy Treasurer of the Fidelity funds. Mr. Zambello is an employee of Fidelity Investments. Previously, Mr. Zambello served as Vice President of FMR's Program Management Group (2009-2011) and Vice President of the Transfer Agent Oversight Group (2005-2009). |
Adrien E. Deberghes (1967) |
| Year of Election or Appointment: 2008 Deputy Treasurer of Fidelity's Equity and High Income Funds. Mr. Deberghes also serves as Vice President (2011-present), Deputy Treasurer (2008-present), and Assistant Treasurer (2010-present) of other Fidelity funds, and is an employee of Fidelity Investments (2008-present). Previously, Mr. Deberghes served as Senior Vice President of Mutual Fund Administration at State Street Corporation (2007-2008), Senior Director of Mutual Fund Administration at Investors Bank & Trust (2005-2007), and Director of Finance for Dunkin' Brands (2000-2005). |
Stephen Sadoski (1971) |
| Year of Election or Appointment: 2012 Deputy Treasurer of Fidelity's Equity and High Income Funds. Mr. Sadoski also serves as Deputy Treasurer of other Fidelity funds (2012-present) and is an employee of Fidelity Investments (2012-present). Previously, Mr. Sadoski served as Assistant Treasurer of Fidelity's Fixed Income and Asset Allocation Funds (2012-2013), an assistant chief accountant in the Division of Investment Management of the Securities and Exchange Commission (SEC) (2009-2012) and as a senior manager at Deloitte & Touche LLP (1997-2009). |
Stacie M. Smith (1974) |
| Year of Election or Appointment: 2013 Deputy Treasurer of Fidelity's Equity and High Income Funds. Ms. Smith also serves as Deputy Treasurer of other Fidelity funds (2013-present) and is an employee of Fidelity Investments (2009-present). Previously, Ms. Smith served as Senior Audit Manager of Ernst & Young LLP (1996-2009). |
Stephanie J. Dorsey (1969) |
| Year of Election or Appointment: 2010 Assistant Treasurer of Fidelity's Equity and High Income Funds. Ms. Dorsey also serves as President and Treasurer (2013-present) and Assistant Treasurer (2010-present) of other Fidelity funds, Treasurer and Chief Financial Officer of The North Carolina Capital Management Trust: Cash and Term Portfolios (2013-present), and is an employee of Fidelity Investments (2008-present). Previously, Ms. Dorsey served as Deputy Treasurer of Fidelity's Fixed Income and Asset Allocation Funds (2008-2013), Treasurer (2004-2008) of the JPMorgan Mutual Funds and Vice President (2004-2008) of JPMorgan Chase Bank. |
Gary W. Ryan (1958) |
| Year of Election or Appointment: 2005 Assistant Treasurer of the Fidelity funds. Mr. Ryan is an employee of Fidelity Investments. Previously, Mr. Ryan served as Vice President of Fund Reporting in Fidelity Pricing and Cash Management Services (FPCMS) (1999-2005). |
Jonathan Davis (1968) |
| Year of Election or Appointment: 2010 Assistant Treasurer of the Fidelity funds. Mr. Davis is also Assistant Treasurer of Fidelity Rutland Square Trust II and Fidelity Commonwealth Trust II. Mr. Davis is an employee of Fidelity Investments. Previously, Mr. Davis served as Vice President and Associate General Counsel of FMR LLC (2003-2010). |
Annual Report
The Board of Trustees of Fidelity Small Cap Value Fund voted to pay to shareholders of record at the opening of business, the following distributions per share derived from capital gains realized from sales of portfolio securities, and dividends derived from net investment income:
| Pay Date | Record Date | Dividends | Capital Gains |
Class F | 09/16/13 | 09/13/13 | $0.0560 | $1.252 |
The fund hereby designates as a capital gain dividend with respect to the taxable year ended July 31,2013, $300,428,923, or, if subsequently determined to be different, the net capital gain of such year.
Class F designates 100% of the dividends distributed during the fiscal year as qualifying for the dividends-received deduction for corporate shareholders.
Class F designates 100% of the dividends distributed during the fiscal year as amounts which can be taken into account as a dividend for the purposes of the maximum rate under section 1(h)(11) of the Internal Revenue Code.
The fund will notify shareholders in January 2014 of amounts for use in preparing 2013 income tax returns.
Annual Report
Board Approval of Investment Advisory Contracts and Management Fees
Fidelity Small Cap Value Fund
Each year, the Board of Trustees, including the Independent Trustees (together, the Board), votes on the renewal of the management contract and sub-advisory agreements (together, the Advisory Contracts) for the fund. The Board, assisted by the advice of fund counsel and Independent Trustees' counsel, requests and considers a broad range of information relevant to the renewal of the Advisory Contracts throughout the year.
The Board meets regularly and, at each of its meetings, covers an extensive agenda of topics and materials and considers factors that are relevant to its annual consideration of the renewal of the fund's Advisory Contracts, including the services and support provided to the fund and its shareholders. The Board has established various standing committees, each composed of and chaired by Independent Trustees with varying backgrounds, to which the Board has assigned specific subject matter responsibilities in order to enhance effective decision-making by the Board. The Board, acting directly and through its Committees, requests and receives information concerning the annual consideration of the renewal of the fund's Advisory Contracts. The Board also meets as needed to consider matters specifically related to the Board's annual consideration of the renewal of Advisory Contracts. Members of the Board may also meet with trustees of other Fidelity funds through ad hoc joint committees to discuss certain matters relevant to the Fidelity funds.
At its July 2013 meeting, the Board, including the Independent Trustees, unanimously determined to renew the fund's Advisory Contracts. In reaching its determination, the Board considered all factors it believed relevant, including (i) the nature, extent, and quality of the services to be provided to the fund and its shareholders (including the investment performance of the fund); (ii) the competitiveness of the fund's management fee and total expense ratio relative to peer funds; (iii) the total costs of the services to be provided by and the profits to be realized by Fidelity from its relationship with the fund; (iv) the extent to which economies of scale exist and would be realized as the fund grows; and (v) whether fee levels reflect these economies of scale, if any, for the benefit of fund shareholders.
In considering whether to renew the Advisory Contracts for the fund, the Board reached a determination, with the assistance of fund counsel and Independent Trustees' counsel and through the exercise of its business judgment, that the renewal of the Advisory Contracts was in the best interests of the fund and its shareholders and that the compensation payable under the Advisory Contracts was fair and reasonable. The Board's decision to renew the Advisory Contracts was not based on any single factor, but rather was based on a comprehensive consideration of all the information provided to the Board at its meetings throughout the year. The Board, in reaching its determination to renew the Advisory Contracts, was aware that shareholders in the fund have a broad range of investment choices available to them, including a wide choice among mutual funds offered by Fidelity's competitors, and that the fund's shareholders, who have the opportunity to review and weigh the disclosure provided by the fund in its prospectus and other public disclosures, have chosen to invest in this fund, which is a part of the Fidelity family of funds.
Annual Report
Nature, Extent, and Quality of Services Provided. The Board considered the staffing within the investment adviser, Fidelity Management & Research Company (FMR), and the sub-advisers (together, the Investment Advisers) as it relates to the fund, including the backgrounds of the fund's investment personnel, and also considered the fund's investment objective, strategies, and related investment philosophy. The Independent Trustees also had discussions with senior management of Fidelity's investment operations and investment groups. The Board considered the structure of the portfolio manager compensation program and whether this structure provides appropriate incentives to act in the best interests of the fund.
Resources Dedicated to Investment Management and Support Services. The Board and the Fund Oversight and Research Committees reviewed the general qualifications and capabilities of the Investment Advisers' investment staff, including its size, education, experience, and resources, as well as the Investment Advisers' approach to recruiting, training, managing, and compensating investment personnel. The Board noted that FMR has continued to increase the resources devoted to non-U.S. offices, including expansion of Fidelity's global investment organization. The Board also noted that Fidelity's analysts have extensive resources, tools and capabilities that allow them to conduct sophisticated quantitative and fundamental analysis, as well as credit analysis of issuers, counterparties and guarantors. Further, the Board believes that Fidelity's investment professionals have sufficient access to global information and data so as to provide competitive investment results over time, and that those professionals also have access to sophisticated tools that permit them to assess portfolio construction and risk and performance attribution characteristics continuously, as well as to transmit new information and research conclusions rapidly around the world. Additionally, in its deliberations, the Board considered the Investment Advisers' trading and risk management capabilities and resources, which are an integral part of the investment management process.
Shareholder and Administrative Services. The Board considered (i) the nature, extent, quality, and cost of advisory, administrative, and shareholder services performed by the Investment Advisers and their affiliates under the Advisory Contracts and under separate agreements covering transfer agency, pricing and bookkeeping, and securities lending services for the fund; (ii) the nature and extent of the supervision of third party service providers, principally custodians and subcustodians; and (iii) the resources devoted to, and the record of compliance with, the fund's compliance policies and procedures. The Board also reviewed the allocation of fund brokerage, including allocations to brokers affiliated with the Investment Advisers, the use of brokerage commissions to pay fund expenses, and the use of "soft" commission dollars to pay for research services.
Annual Report
Board Approval of Investment Advisory Contracts and
Management Fees - continued
The Board noted that the growth of fund assets over time across the complex allows Fidelity to reinvest in the development of services designed to enhance the value or convenience of the Fidelity funds as investment vehicles. These services include 24-hour access to account information and market information through telephone representatives and over the Internet, investor education materials and asset allocation tools, and the expanded availability of Fidelity Investor Centers.
Investment in a Large Fund Family. The Board considered the benefits to shareholders of investing in a Fidelity fund, including the benefits of investing in a fund that is part of a large family of funds offering a variety of investment disciplines and providing a large variety of mutual fund investor services. The Board noted that Fidelity had taken, or had made recommendations that resulted in the Fidelity funds taking, a number of actions over the previous year that benefited particular funds, including (i) continuing to dedicate additional resources to investment research and to the support of the senior management team that oversees asset management; (ii) persisting in efforts to enhance Fidelity's global research capabilities; (iii) launching new funds and making other enhancements to meet client needs for global and income-oriented solutions; (iv) continuing to launch dedicated lower cost underlying funds to meet portfolio construction needs related to expanding underlying fund options for Fidelity funds of funds, specifically for the Freedom Fund product lines; (v) rationalizing product lines and gaining increased efficiencies through the mergers of several funds into other funds; (vi) strengthening Fidelity's index fund offerings by reducing investment minimums and adopting or lowering existing expense caps for certain funds and classes; (vii) enhancing Global Asset Allocation product offerings by launching new funds and strategies, including "open architecture" target date funds that utilize affiliated and unaffiliated sub-advisers; (viii) modifying the eligibility criteria for Institutional Class shares of Advisor funds to increase their marketability to a portion of the defined contribution plan market; (ix) creating a new low-cost retirement share class for certain Advisor funds to appeal to large retirement plans; (x) transitioning the management of certain Fidelity commodity funds to Geode Capital Management LLC, a registered commodity pool operator, while retaining administrative responsibilities for the funds; (xi) reorganizing a number of funds; and (xii) taking steps toward establishing a new Fidelity adviser to manage sector-based funds and products.
Investment Performance. The Board considered whether the fund has operated in accordance with its investment objective, as well as its record of compliance with its investment restrictions and its performance history. The Board noted that there was a portfolio management change for the fund in January 2013.
Annual Report
The Board took into account discussions with the Investment Advisers about fund investment performance that occur at Board meetings throughout the year. In this regard the Board noted that as part of regularly scheduled fund reviews and other reports to the Board on fund performance, the Board periodically considers annualized return information for the fund, for different time periods, measured against a securities market index ("benchmark index") and a peer group of mutual funds with similar objectives ("peer group"). In its evaluation of fund investment performance, the Board gave particular attention to information indicating changes in performance of certain Fidelity funds for specific time periods and the Investment Advisers' explanations for any overperformance or underperformance.
In addition to reviewing absolute and relative fund performance, the Independent Trustees periodically consider the appropriateness of fund performance metrics in evaluating the results achieved. In general, the Independent Trustees believe that fund performance should be evaluated based on net performance (after fees and expenses) of both the highest performing and lowest performing classes, where applicable, compared to appropriate benchmark indices, over appropriate time periods which may include full market cycles, and compared to peer groups, as applicable, over the same periods, taking into account relevant factors including the following: general market conditions; issuer-specific information; tactical opportunities for investment; and fund cash flows and other factors.
The Independent Trustees recognize that shareholders evaluate performance on a net basis over their own holding periods, for which one-, three-, and five-year periods are used as a proxy. For this reason, the performance information reviewed by the Board also included net cumulative calendar year total return information for the fund and an appropriate benchmark index and peer group for the most recent one-, three-, and five-year periods, as shown below. Returns are shown compared to the 25th percentile (top of box) and 75th percentile (bottom of box) of the peer universe.
Annual Report
Board Approval of Investment Advisory Contracts and
Management Fees - continued
Fidelity Small Cap Value Fund
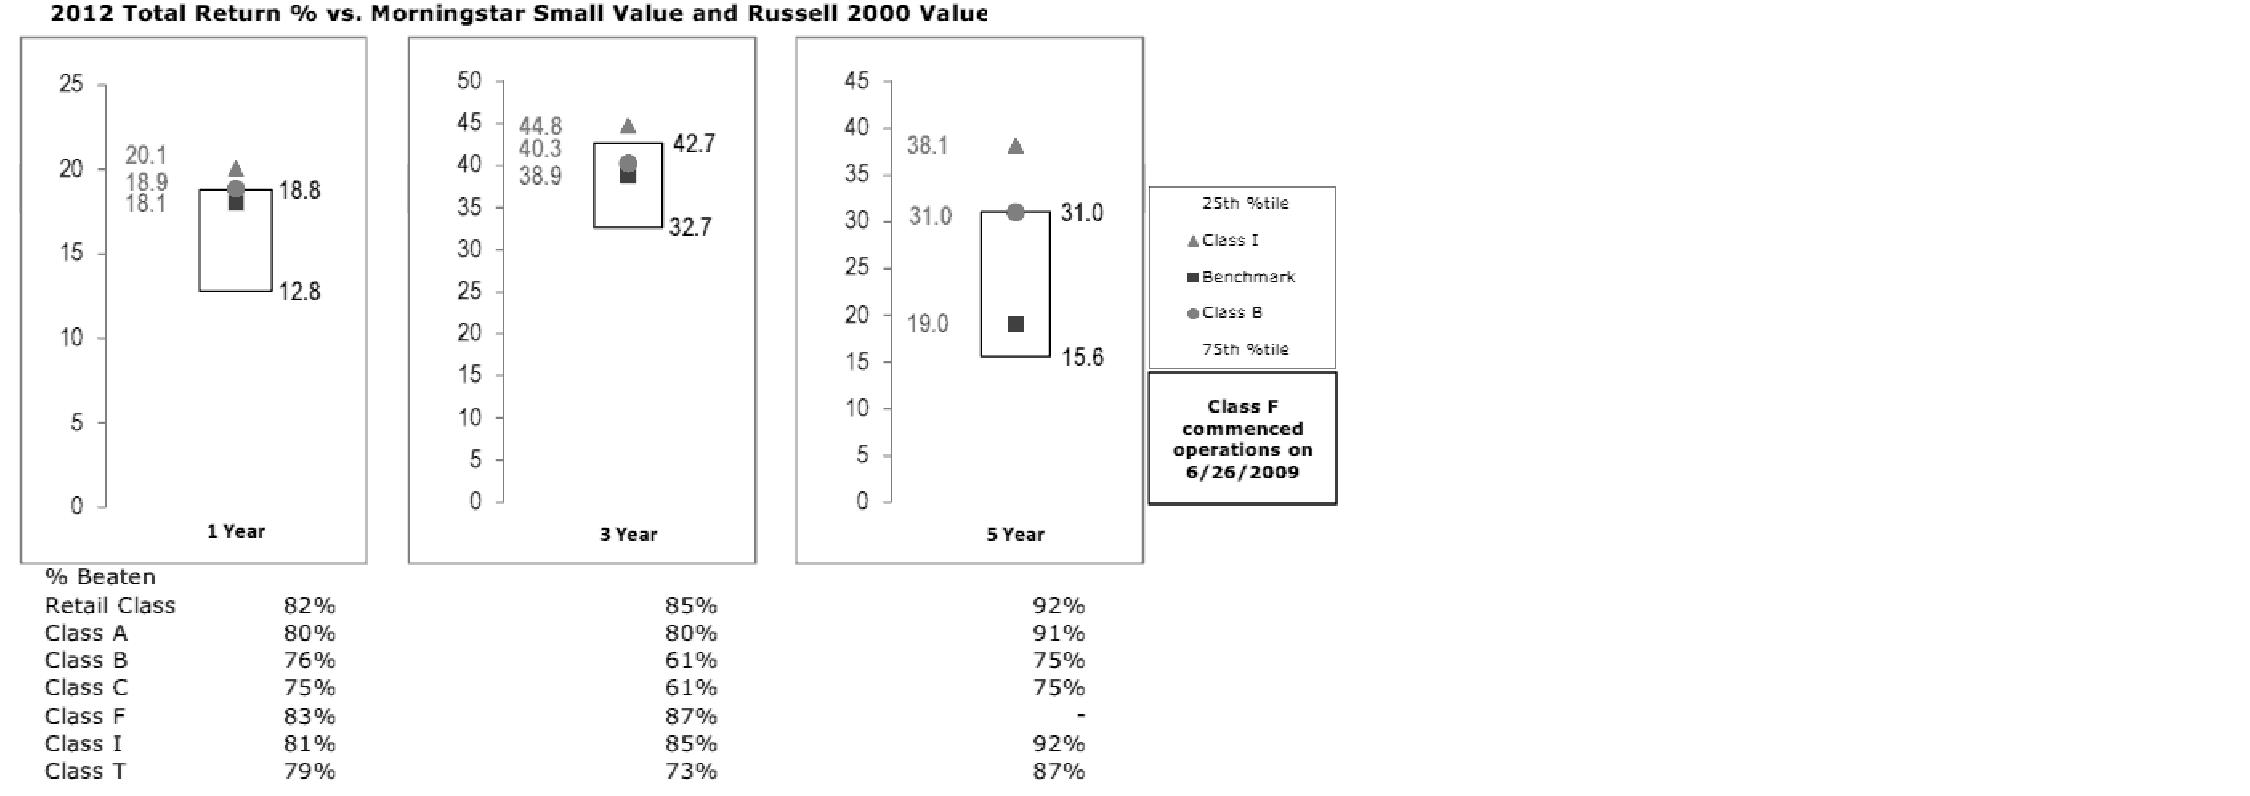
The Board also considered that the fund's management fee is subject to upward or downward adjustment depending upon whether, and to what extent, the fund's investment performance for the performance period exceeds, or is exceeded by, a securities index, thus leading to a performance adjustment for the same period. The Board noted that the performance adjustment provides FMR with a strong economic incentive to seek to achieve superior performance for the fund's shareholders and helps to more closely align the interests of FMR and the fund's shareholders.
Based on its review, the Board concluded that the nature, extent, and quality of services provided to the fund under the Advisory Contracts should benefit the fund's shareholders.
Competitiveness of Management Fee and Total Expense Ratio. The Board considered the fund's management fee and total expense ratio compared to "mapped groups" of competitive funds and classes. Fidelity creates "mapped groups" by combining similar Lipper investment objective categories that have comparable management fee characteristics. Combining Lipper investment objective categories aids the Board's management fee and total expense ratio comparisons by broadening the competitive group used for comparison and by reducing the number of universes to which various Fidelity funds are compared.
Management Fee. The Board considered two proprietary management fee comparisons for the 12-month periods shown in the chart below. The group of Lipper funds used by the Board for management fee comparisons is referred to below as the "Total Mapped Group." The Total Mapped Group comparison focuses on a fund's standing in terms of gross management fees before expense reimbursements or caps, and without giving effect to the fund's performance adjustment, relative to the total universe of funds with comparable investment mandates, regardless of whether their management fee structures also are comparable. Funds with comparable investment mandates offer exposure to similar types of securities. Funds with comparable management fee structures have similar management fee contractual arrangements (e.g., flat rate charged for advisory services, all-inclusive fee rate, etc.). "TMG %" represents the percentage of funds in the Total Mapped Group that had management fees that were lower than the fund's. For example, a TMG % of 14% means that 86% of the funds in the Total Mapped Group had higher management fees than the fund. The "Asset-Size Peer Group" (ASPG) comparison focuses on a fund's standing relative to a subset of non-Fidelity funds within the Total Mapped Group that are similar in size and management fee structure. The ASPG represents at least 15% of the funds in the Total Mapped Group with comparable asset size and management fee structures, subject to a minimum of 50 funds (or all funds in the Total Mapped Group if fewer than 50). Additional information, such as the ASPG quartile in which the fund's management fee ranked and the impact of the fund's performance adjustment, is also included in the chart and considered by the Board.
Annual Report
Fidelity Small Cap Value Fund

The Board noted that the fund's management fee ranked below the median of its Total Mapped Group and below the median of its ASPG for 2012. The Board also noted the effect of the fund's positive performance adjustment on the fund's management fee ranking.
Annual Report
Board Approval of Investment Advisory Contracts and
Management Fees - continued
Based on its review, the Board concluded that the fund's management fee is fair and reasonable in light of the services that the fund receives and the other factors considered.
Total Expense Ratio. In its review of each class's total expense ratio, the Board considered the fund's management fee as well as other fund or class expenses, as applicable, such as transfer agent fees, pricing and bookkeeping fees, fund-paid 12b-1 fees, and custodial, legal, and audit fees. The Board also noted the effects of any waivers and reimbursements on fees and expenses, as well as the impact of the fund's performance adjustment. As part of its review, the Board also considered the current and historical total expense ratios of each class of the fund compared to competitive fund median expenses. Each class of the fund is compared to those funds and classes in the Total Mapped Group (used by the Board for management fee comparisons) that have a similar sales load structure.
The Board noted that the total expense ratio of each of Institutional Class, the retail class and Class F ranked below its competitive median for 2012, the total expense ratio of Class A ranked equal to its competitive median for 2012, and the total expense ratio of each of Class T, Class B and Class C ranked above its competitive median for 2012. The Board considered that, in general, various factors can affect total expense ratios. The Board noted that the total expense ratio of Class T was above the competitive median primarily because of higher 12b-1 fees on Class T. Class T has a higher 12b-1 fee, but a lower front-end sales charge, than traditionally priced front-end sales charge classes. The Board considered that Class T is primarily sold load-waived in the retirement plan market where its 0.50% 12b-1 fee is comparable to competing no-load, higher 12b-1 fee classes designed specifically for retirement plans. The Board noted that the fund offers multiple classes, each of which has a different sales load and 12b-1 fee structure, and that the multiple structures are intended to offer a range of pricing options for the intermediary market. The Board also noted that the total expense ratios of the classes vary primarily by the level of their 12b-1 fees, although differences in transfer agent fees may also cause expenses to vary from class to class.
Fees Charged to Other Fidelity Clients. The Board also considered Fidelity fee structures and other information with respect to clients of FMR and its affiliates, such as other mutual funds advised or subadvised by FMR or its affiliates, pension plan clients, and other institutional clients. The Board noted the findings of the 2013 ad hoc joint committee (created with the board of other Fidelity funds), which reviewed and compared Fidelity's institutional investment advisory business with its business of providing services to the Fidelity funds, including the differences in services provided, fees charged, and costs incurred, as well as competition in their respective marketplaces.
Based on its review of total expense ratios and fees charged to other Fidelity clients, the Board concluded that the total expense ratio of each class of the fund was reasonable, although in some cases above the median of the universe presented for comparison, in light of the services that the fund and its shareholders receive and the other factors considered.
Annual Report
Costs of the Services and Profitability. The Board considered the revenues earned and the expenses incurred by Fidelity in conducting the business of developing, marketing, distributing, managing, administering and servicing the fund and servicing the fund's shareholders. The Board also considered the level of Fidelity's profits in respect of all the Fidelity funds.
On an annual basis, FMR presents to the Board Fidelity's profitability for the fund. Fidelity calculates the profitability for each fund, as well as aggregate profitability for groups of Fidelity funds and all Fidelity funds, using a series of detailed revenue and cost allocation methodologies which originate with the books and records of Fidelity on which Fidelity's audited financial statements are based. The Audit Committee of the Board reviews any significant changes from the prior year's methodologies.
PricewaterhouseCoopers LLP (PwC), independent registered public accounting firm and auditor to Fidelity and certain Fidelity funds, has been engaged annually by the Board as part of the Board's assessment of Fidelity's profitability analysis. PwC's engagement includes the review and assessment of the methodologies used by Fidelity in determining the revenues and expenses attributable to Fidelity's mutual fund business, and completion of agreed-upon procedures surrounding the mathematical accuracy of fund profitability and its conformity to allocation methodologies. After considering PwC's reports issued under the engagement and information provided by Fidelity, the Board concluded that while other allocation methods may also be reasonable, Fidelity's profitability methodologies are reasonable in all material respects.
The Board also reviewed Fidelity's non-fund businesses and fall-out benefits related to the mutual fund business as well as cases where Fidelity's affiliates may benefit from or be related to the fund's business.
The Board considered the costs of the services provided by and the profits realized by Fidelity in connection with the operation of the fund and was satisfied that the profitability was not excessive in the circumstances.
Economies of Scale. The Board considered whether there have been economies of scale in respect of the management of the Fidelity funds, whether the Fidelity funds (including the fund) have appropriately benefited from any such economies of scale, and whether there is potential for realization of any further economies of scale. The Board considered the extent to which the fund will benefit from economies of scale through increased services to the fund, through waivers or reimbursements, or through fee or expense reductions. The Board also noted that in 2009, it and the board of other Fidelity funds created an ad hoc committee (the Economies of Scale Committee) to analyze whether FMR attains economies of scale in respect of the management and servicing of the Fidelity funds, whether the Fidelity funds have appropriately benefited from such economies of scale, and whether there is potential for realization of any further economies of scale.
Annual Report
Board Approval of Investment Advisory Contracts and
Management Fees - continued
The Board recognized that the fund's management contract incorporates a "group fee" structure, which provides for lower group fee rates as total fund assets under FMR's management increase, and for higher group fee rates as total fund assets under FMR's management decrease. FMR calculates the group fee rates based on a tiered asset "breakpoint" schedule that varies based on asset class. The Board considered that the group fee is designed to deliver the benefits of economies of scale to fund shareholders when total Fidelity fund assets increase, even if assets of any particular fund are unchanged or have declined, because some portion of Fidelity's costs are attributable to services provided to all Fidelity funds, and all funds benefit if those costs can be allocated among more assets. The Board considered that although the fund is partially closed to new investors, it continues to incur investment management expenses, and marketing and distribution expenses related to the retention of existing shareholders and assets. The Board concluded that, given the group fee structure, fund shareholders will benefit from lower management fees as assets under FMR's management increase at the fund complex level, regardless of whether Fidelity achieves any such economies of scale.
The Board concluded, taking into account the analysis of the Economies of Scale Committee, that economies of scale, if any, are being appropriately shared between fund shareholders and Fidelity.
Amendment to Description of Group Fee Rate. At its July 2013 meeting, the Board voted to approve an amendment to the fund's management contract to modify the description of the "group fee rate" effective August 1, 2013. The Board noted that under the prior description in the contract, the group fee rate was based on the average net assets of all registered investment companies with which FMR has management contracts. Under the contract's tiered asset breakpoint schedule, the group fee rate is lower as total fund assets under FMR's management increase, and higher as total fund assets under FMR's management decrease. The Board considered that the prior description would have excluded the assets of 64 Fidelity sector funds from the group fee rate calculation once Fidelity SelectCo, LLC, an affiliate of FMR, assumed management responsibilities for those funds. The Board noted that modifying the description of the group fee rate to continue to include the assets of those 64 funds for purposes of determining group fee rate breakpoints would avoid an immediate adverse impact on the group fee rate for any fund.
Additional Information Requested by the Board. In order to develop fully the factual basis for consideration of the Fidelity funds' Advisory Contracts, the Board requested and received additional information on certain topics, including: (i) fund performance trends and Fidelity's long-term strategies for certain funds; (ii) the potential to further rationalize the Fidelity fund lineup with the possibility of achieving savings for the funds and Fidelity; (iii) the methodology with respect to competitive fund data and peer group classifications; (iv) the arrangements with, and performance of, certain sub-advisers on behalf of the Fidelity funds, as well as certain proposed participating affiliate arrangements; (v) the realization of fall-out benefits in certain Fidelity business units; (vi) Fidelity's group fee structures, including the rationale for the individual fee rates of certain categories of funds and the definition of group assets; (vii) trends regarding industry use of performance fee structures and the performance adjustment methodologies applicable to the Fidelity funds; (viii) additional competitive analysis regarding the total expenses for certain classes; and (ix) fund profitability methodology, including Fidelity's cost allocation methodology, and the impact of certain factors on fund profitability results.
Annual Report
Based on its evaluation of all of the conclusions noted above, and after considering all factors it believed relevant, the Board ultimately concluded that the advisory fee structures are fair and reasonable, and that the fund's Advisory Contracts should be renewed.
Annual Report
Investment Adviser
Fidelity Management & Research Company
Boston, MA
Investment Sub-Advisers
FMR Co., Inc.
Fidelity Management & Research
(U.K.) Inc.
Fidelity Management & Research
(Hong Kong) Limited
Fidelity Management & Research
(Japan) Inc.
General Distributor
Fidelity Distributors Corporation
Smithfield, RI
Transfer and Service Agents
Fidelity Investments Institutional
Operations Company, Inc.
Boston, MA
Fidelity Service Company, Inc.
Boston, MA
Custodian
Citibank, N.A.
New York, NY
(Fidelity Investment logo)(registered trademark)
Corporate Headquarters
245 Summer St., Boston, MA 02210
www.fidelity.com
SCV-F-ANN-0913
1.891896.104
Fidelity®
Series Real Estate Equity
Fund
Fidelity Series Real Estate Equity Fund
Class F
Annual Report
July 31, 2013
(Fidelity Cover Art)
Contents
Performance | (Click Here) | How the fund has done over time. |
Management's Discussion of Fund Performance | (Click Here) | The Portfolio Manager's review of fund performance and strategy. |
Shareholder Expense Example | (Click Here) | An example of shareholder expenses. |
Investment Changes | (Click Here) | A summary of major shifts in the fund's investments over the past six months. |
Investments | (Click Here) | A complete list of the fund's investments with their market values. |
Financial Statements | (Click Here) | Statements of assets and liabilities, operations, and changes in net assets, as well as financial highlights. |
Notes | (Click Here) | Notes to the financial statements. |
Report of Independent Registered Public Accounting Firm | (Click Here) | |
Trustees and Officers | (Click Here) | |
Distributions | (Click Here) | |
Board Approval of Investment Advisory Contracts and Management Fees | (Click Here) | |
To view a fund's proxy voting guidelines and proxy voting record for the 12-month period ended June 30, visit http://www.fidelity.com/proxyvotingresults or visit the Securities and Exchange Commission's (SEC) web site at http://www.sec.gov. You may also call 1-800-544-8544 for Fidelity® Series Real Estate Equity Fund or 1-800-835-5092 for Class F of the fund to request a free copy of the proxy voting guidelines.
Standard & Poor's, S&P and S&P 500 are registered service marks of The McGraw-Hill Companies, Inc. and have been licensed for use by Fidelity Distributors Corporation.
Other third-party marks appearing herein are the property of their respective owners.
All other marks appearing herein are registered or unregistered trademarks or service marks of FMR LLC or an affiliated company. © 2013 FMR LLC. All rights reserved.
Annual Report
This report and the financial statements contained herein are submitted for the general information of the shareholders of the fund. This report is not authorized for distribution to prospective investors in the fund unless preceded or accompanied by an effective prospectus.
A fund files its complete schedule of portfolio holdings with the SEC for the first and third quarters of each fiscal year on Form N-Q. Forms N-Q are available on the SEC's web site at http://www.sec.gov. A fund's Forms N-Q may be reviewed and copied at the SEC's Public Reference Room in Washington, DC. Information regarding the operation of the SEC's Public Reference Room may be obtained by calling 1-800-SEC-0330. For a complete list of a fund's portfolio holdings, view the most recent holdings listing, semiannual report, or annual report on Fidelity's web site at http://www.fidelity.com, http://www.advisor.fidelity.com, or http://www.401k.com, as applicable.
NOT FDIC INSURED • MAY LOSE VALUE • NO BANK GUARANTEE
Neither the fund nor Fidelity Distributors Corporation is a bank.
Annual Report
Average annual total return reflects the change in the value of an investment, assuming reinvestment of the class' distributions from dividend income and capital gains (the profits earned upon the sale of securities that have grown in value, if any) and assuming a constant rate of performance each year. The $10,000 table and the fund's returns do not reflect the deduction of taxes that a shareholder would pay on fund distributions or the redemption of fund shares. During periods of reimbursement by Fidelity, a fund's total return will be greater than it would be had the reimbursement not occurred. How a fund did yesterday is no guarantee of how it will do tomorrow.
Average Annual Total Returns
Periods ended July 30, 2013 | Past 1
year | Life of
fund A |
Fidelity® Series Real Estate Equity Fund | 8.06% | 18.41% |
Class F | 8.27% | 18.61% |
A From October 20, 2011.
$10,000 Over Life of Fund
Let's say hypothetically that $10,000 was invested in Fidelity® Series Real Estate Equity Fund, a class of the fund, on October 20, 2011, when the fund started. The chart shows how the value of your investment would have changed, and also shows how the S&P 500® Index performed over the same period.
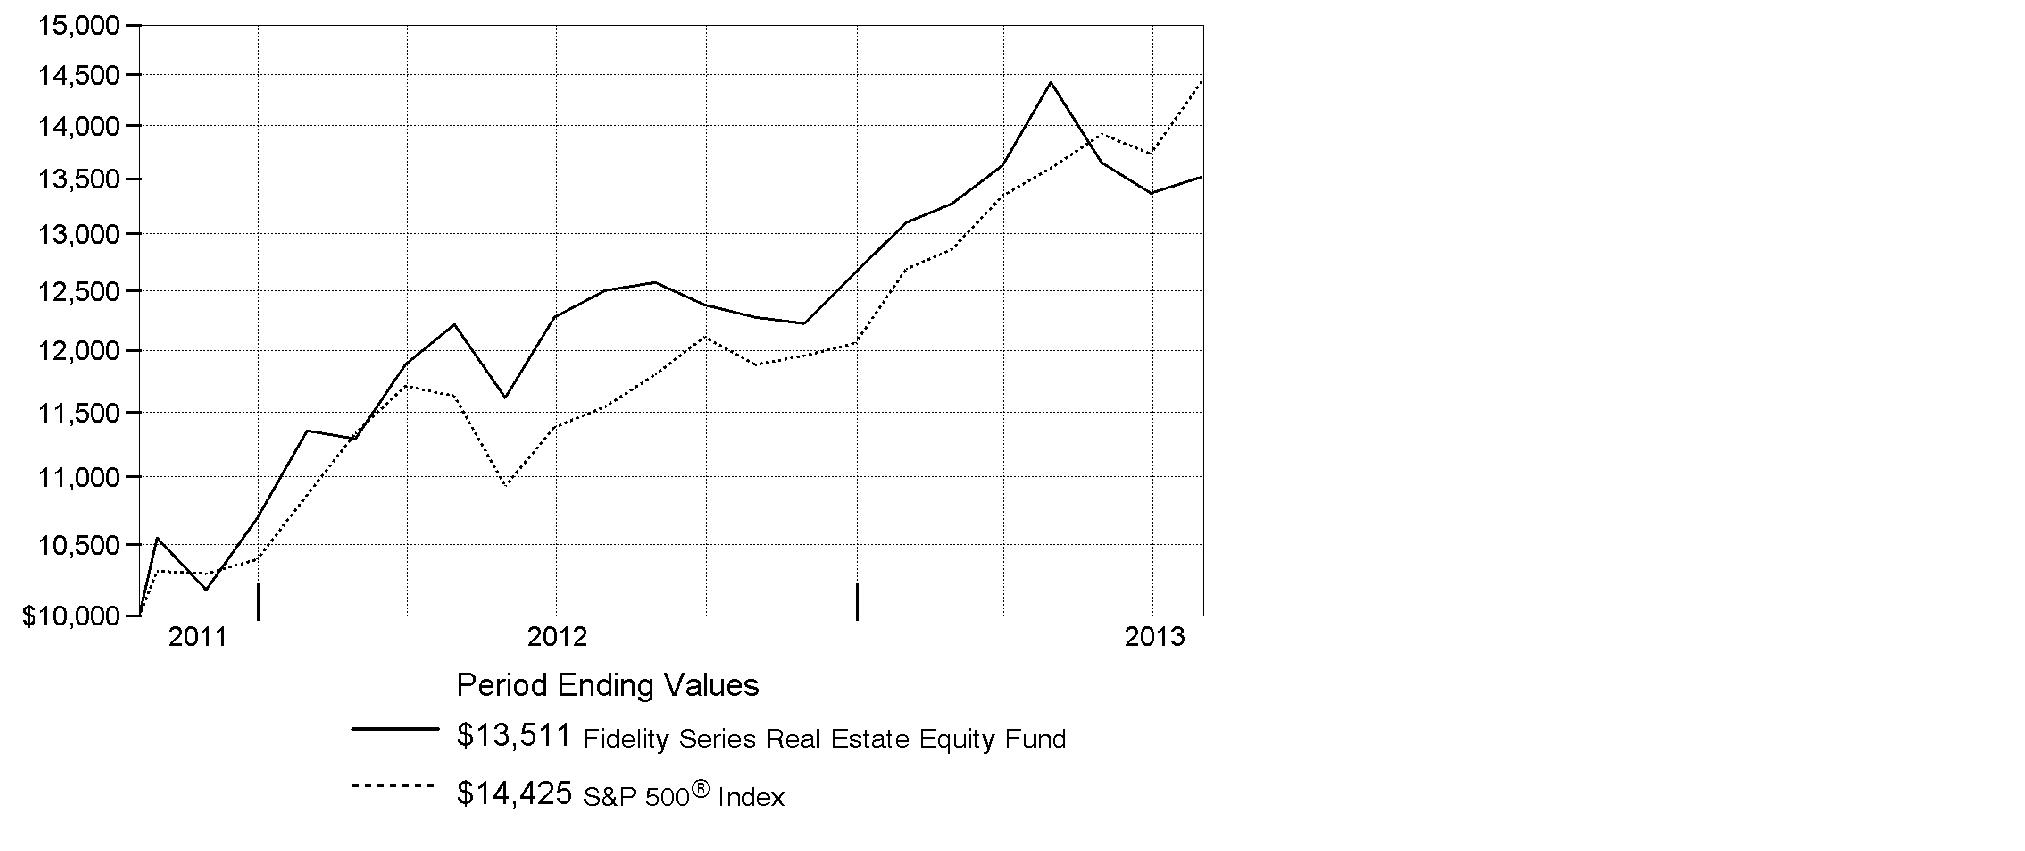
Annual Report
Market Recap: The bull run in U.S. stocks comfortably settled into a fifth year, as major equity benchmarks ripped through records during the 12 months ending July 31, 2013. Gains were fueled by a generally improving global economy and accommodative monetary policies worldwide. The tone was positive for most of the year, based largely on stronger U.S. economic data, including employment, housing and consumer sentiment. Setting a series of new highs along the way, the broad-based S&P 500® Index rose an impressive 25.00% for the 12 months, while the blue-chip-laden Dow Jones Industrial AverageSM also moved into record territory en route to a 22.36% gain. The growth-oriented Nasdaq Composite Index® had a similarly strong run, advancing 25.15%. During the year, markets were resilient amid intermittent volatility over debt woes in Europe, the 2012 U.S. presidential election and year-end Congressional gridlock over the federal budget. In mid-to-late June, concern arose about the U.S. Federal Reserve possibly tapering its sustaining bond-buying strategy - which prompted a brief, but steep, market sell-off. However, investors' continued quest for yield and the Fed's pledge to keep buying bonds until the economy showed significant improvement overpowered the uncertainty and helped equities climb notably higher in July to close the period on a strong note.
Comments from Samuel Wald, Portfolio Manager of Fidelity® Series Real Estate Equity Fund: For the year, the fund's Series Real Estate Equity and Class F shares gained 8.06% and 8.27%, respectively, outperforming the benchmark Dow Jones U.S. Select Real Estate Securities IndexSM, which rose 6.53%. REITs generally trended upward until May, when higher interest rates began weighing heavily on the market. My investment approach seeks to generate repeatable outperformance over time via individual security selection. Relative to the Dow Jones index, one notable source of strength was the fund's position in senior housing operators - such as Brookdale Senior Living, Sunrise Senior Living and Emeritus, all of which were out-of-benchmark names - whose valuation and appreciation potential struck me as more attractive than those offered by health care REITs. I added to the fund's Brookdale and Emeritus stakes, while I sold Sunrise in August. In contrast, the fund's biggest individual detractor was Education Realty Trust, an operator of student housing facilities that was hampered this period by poor industry supply/demand trends. A sizable underweighting, on average, in retail strip center REIT Kimco Realty also limited results. I sold Kimco from the portfolio in January.
The views expressed above reflect those of the portfolio manager(s) only through the end of the period as stated on the cover of this report and do not necessarily represent the views of Fidelity or any other person in the Fidelity organization. Any such views are subject to change at any time based upon market or other conditions and Fidelity disclaims any responsibility to update such views. These views may not be relied on as investment advice and, because investment decisions for a Fidelity fund are based on numerous factors, may not be relied on as an indication of trading intent on behalf of any Fidelity fund.
Annual Report
Shareholder Expense Example
As a shareholder of the Fund, you incur two types of costs: (1) transaction costs and (2) ongoing costs, including management fees and other Fund expenses. This Example is intended to help you understand your ongoing costs (in dollars) of investing in the Fund and to compare these costs with the ongoing costs of investing in other mutual funds.
The Example is based on an investment of $1,000 invested at the beginning of the period and held for the entire period (February 1, 2013 to July 31, 2013).
Actual Expenses
The first line of the accompanying table for each class of the Fund provides information about actual account values and actual expenses. You may use the information in this line, together with the amount you invested, to estimate the expenses that you paid over the period. Simply divide your account value by $1,000.00 (for example, an $8,600 account value divided by $1,000.00 = 8.6), then multiply the result by the number in the first line for a class of the Fund under the heading entitled "Expenses Paid During Period" to estimate the expenses you paid on your account during this period. In addition, the Fund, as a shareholder in the underlying Fidelity Central Funds, will indirectly bear its pro-rata share of the fees and expenses incurred by the underlying Fidelity Central Funds. These fees and expenses are not included in the Fund's annualized expense ratio used to calculate the expense estimate in the table below.
Hypothetical Example for Comparison Purposes
The second line of the accompanying table for each class of the Fund provides information about hypothetical account values and hypothetical expenses based on a Class' actual expense ratio and an assumed rate of return of 5% per year before expenses, which is not the Class' actual return. The hypothetical account values and expenses may not be used to estimate the actual ending account balance or expenses you paid for the period. You may use this information to compare the ongoing costs of investing in the Fund and other funds. To do so, compare this 5% hypothetical example with the 5% hypothetical examples that appear in the shareholder reports of the other funds. In addition, the Fund, as a shareholder in the underlying Fidelity Central Funds, will indirectly bear its pro-rata share of the fees and expenses incurred by the underlying Fidelity Central Funds. These fees and expenses are not included in the Fund's annualized expense ratio used to calculate the expense estimate in the table below.
Please note that the expenses shown in the table are meant to highlight your ongoing costs only and do not reflect any transaction costs. Therefore, the second line of the table is useful in comparing ongoing costs only, and will not help you determine the relative total costs of owning different funds.
Annual Report
| Annualized
Expense Ratio B | Beginning
Account Value
February 1, 2013 | Ending
Account Value
July 31, 2013 | Expenses Paid
During Period*
February 1, 2013
to July 31, 2013 |
Series Real Estate Equity | .78% | | | |
Actual | | $ 1,000.00 | $ 1,031.70 | $ 3.93 |
Hypothetical A | | $ 1,000.00 | $ 1,020.93 | $ 3.91 |
Class F | .60% | | | |
Actual | | $ 1,000.00 | $ 1,031.60 | $ 3.02 |
Hypothetical A | | $ 1,000.00 | $ 1,021.82 | $ 3.01 |
A 5% return per year before expenses
B Annualized expense ratio reflects expenses net of applicable fee waivers.
* Expenses are equal to each Class' annualized expense ratio, multiplied by the average account value over the period, multiplied by 181/365 (to reflect the one-half year period).
Annual Report
Investment Changes (Unaudited)
Top Ten Stocks as of July 31, 2013 |
| % of fund's
net assets | % of fund's net assets
6 months ago |
Simon Property Group, Inc. | 12.2 | 12.0 |
Public Storage | 7.1 | 7.8 |
Ventas, Inc. | 6.8 | 7.6 |
Prologis, Inc. | 6.1 | 6.8 |
SL Green Realty Corp. | 4.6 | 4.1 |
Boston Properties, Inc. | 4.4 | 3.5 |
Camden Property Trust (SBI) | 3.8 | 4.0 |
Essex Property Trust, Inc. | 3.5 | 3.3 |
HCP, Inc. | 2.9 | 3.6 |
Alexandria Real Estate Equities, Inc. | 2.8 | 1.1 |
| 54.2 | |
Top Five REIT Sectors as of July 31, 2013 |
| % of fund's
net assets | % of fund's net assets
6 months ago |
REITs - Office Buildings | 17.6 | 14.5 |
REITs - Apartments | 16.5 | 16.9 |
REITs - Industrial Buildings | 16.0 | 16.3 |
REITs - Malls | 15.6 | 16.6 |
REITs - Health Care Facilities | 11.9 | 13.2 |
Asset Allocation (% of fund's net assets) |
As of July 31, 2013 | As of January 31, 2013 |
 | Stocks 97.9% | | | Stocks 96.8% | |
 | Short-Term
Investments and
Net Other Assets
(Liabilities) 2.1% | | | Short-Term
Investments and
Net Other Assets
(Liabilities) 3.2% | |

Annual Report
Investments July 31, 2013
Showing Percentage of Net Assets
Common Stocks - 97.9% |
| Shares | | Value |
HEALTH CARE PROVIDERS & SERVICES - 2.7% |
Health Care Facilities - 2.7% |
Brookdale Senior Living, Inc. (a) | 513,566 | | $ 14,955,042 |
Emeritus Corp. (a) | 530,988 | | 12,313,612 |
TOTAL HEALTH CARE FACILITIES | | 27,268,654 |
REAL ESTATE INVESTMENT TRUSTS - 94.2% |
REITs - Apartments - 16.5% |
AvalonBay Communities, Inc. | 167,400 | | 22,655,916 |
Camden Property Trust (SBI) | 543,072 | | 38,308,299 |
Education Realty Trust, Inc. | 1,507,098 | | 14,211,934 |
Equity Residential (SBI) | 398,551 | | 22,318,856 |
Essex Property Trust, Inc. | 223,967 | | 36,123,637 |
Home Properties, Inc. | 406,197 | | 25,919,431 |
Mid-America Apartment Communities, Inc. | 140,328 | | 9,479,156 |
TOTAL REITS - APARTMENTS | | 169,017,229 |
REITs - Health Care Facilities - 11.9% |
HCP, Inc. | 682,359 | | 29,935,089 |
Health Care REIT, Inc. | 355,526 | | 22,927,872 |
Ventas, Inc. | 1,055,137 | | 69,364,706 |
TOTAL REITS - HEALTH CARE FACILITIES | | 122,227,667 |
REITs - Hotels - 5.5% |
Chesapeake Lodging Trust | 860,068 | | 19,704,158 |
Host Hotels & Resorts, Inc. | 1,255,600 | | 22,425,016 |
Sunstone Hotel Investors, Inc. | 1,071,766 | | 13,868,652 |
TOTAL REITS - HOTELS | | 55,997,826 |
REITs - Industrial Buildings - 16.0% |
DuPont Fabros Technology, Inc. (d) | 478,100 | | 10,953,271 |
First Industrial Realty Trust, Inc. | 655,925 | | 10,730,933 |
First Potomac Realty Trust | 333,960 | | 4,531,837 |
Prologis, Inc. | 1,635,726 | | 62,746,449 |
Public Storage | 459,550 | | 73,169,551 |
Terreno Realty Corp. | 91,400 | | 1,676,276 |
TOTAL REITS - INDUSTRIAL BUILDINGS | | 163,808,317 |
Common Stocks - continued |
| Shares | | Value |
REAL ESTATE INVESTMENT TRUSTS - CONTINUED |
REITs - Malls - 15.6% |
CBL & Associates Properties, Inc. | 342,549 | | $ 7,799,841 |
General Growth Properties, Inc. | 1,300,900 | | 26,980,666 |
Simon Property Group, Inc. | 778,468 | | 124,601,588 |
TOTAL REITS - MALLS | | 159,382,095 |
REITs - Management/Investment - 2.4% |
Coresite Realty Corp. | 260,681 | | 8,852,727 |
Digital Realty Trust, Inc. | 27,300 | | 1,509,417 |
Equity Lifestyle Properties, Inc. | 166,100 | | 6,393,189 |
Retail Properties America, Inc. | 489,462 | | 6,896,520 |
Weyerhaeuser Co. | 36,700 | | 1,042,280 |
TOTAL REITS - MANAGEMENT/INVESTMENT | | 24,694,133 |
REITs - Mobile Home Parks - 0.7% |
Sun Communities, Inc. | 147,823 | | 7,157,590 |
REITs - Office Buildings - 17.6% |
Alexandria Real Estate Equities, Inc. | 417,678 | | 28,610,943 |
Boston Properties, Inc. | 418,275 | | 44,734,511 |
Cousins Properties, Inc. | 2,199,531 | | 22,545,193 |
Douglas Emmett, Inc. | 795,600 | | 19,897,956 |
Highwoods Properties, Inc. (SBI) | 6,961 | | 252,545 |
Piedmont Office Realty Trust, Inc. Class A | 963,400 | | 17,427,906 |
SL Green Realty Corp. | 517,600 | | 46,920,440 |
TOTAL REITS - OFFICE BUILDINGS | | 180,389,494 |
REITs - Shopping Centers - 7.8% |
Acadia Realty Trust (SBI) | 418,100 | | 10,778,618 |
Cedar Shopping Centers, Inc. | 949,867 | | 5,262,263 |
Equity One, Inc. | 973,769 | | 22,533,015 |
Excel Trust, Inc. | 123,092 | | 1,597,734 |
Glimcher Realty Trust | 2,136,009 | | 24,008,741 |
Kite Realty Group Trust | 896,300 | | 5,171,651 |
Vornado Realty Trust | 130,400 | | 11,059,224 |
TOTAL REITS - SHOPPING CENTERS | | 80,411,246 |
Common Stocks - continued |
| Shares | | Value |
REAL ESTATE INVESTMENT TRUSTS - CONTINUED |
REITs - Storage - 0.2% |
Chambers Street Properties (d) | 221,568 | | $ 1,792,485 |
TOTAL REAL ESTATE INVESTMENT TRUSTS | | 964,878,082 |
REAL ESTATE MANAGEMENT & DEVELOPMENT - 1.0% |
Real Estate Operating Companies - 1.0% |
Forest City Enterprises, Inc. Class A (a) | 607,400 | | 10,641,648 |
TOTAL COMMON STOCKS (Cost $885,443,895) |
1,002,788,384
|
Money Market Funds - 2.7% |
| | | |
Fidelity Cash Central Fund, 0.11% (b) | 24,642,810 | | 24,642,810 |
Fidelity Securities Lending Cash Central Fund, 0.12% (b)(c) | 3,315,100 | | 3,315,100 |
TOTAL MONEY MARKET FUNDS (Cost $27,957,910) |
27,957,910
|
TOTAL INVESTMENT PORTFOLIO - 100.6% (Cost $913,401,805) | | 1,030,746,294 |
NET OTHER ASSETS (LIABILITIES) - (0.6)% | | (5,796,709) |
NET ASSETS - 100% | $ 1,024,949,585 |
Legend |
(a) Non-income producing |
(b) Affiliated fund that is generally available only to investment companies and other accounts managed by Fidelity Investments. The rate quoted is the annualized seven-day yield of the fund at period end. A complete unaudited listing of the fund's holdings as of its most recent quarter end is available upon request. In addition, each Fidelity Central Fund's financial statements, which are not covered by the Fund's Report of Independent Registered Public Accounting Firm, are available on the SEC's website or upon request. |
(c) Investment made with cash collateral received from securities on loan. |
(d) Security or a portion of the security is on loan at period end. |
Affiliated Central Funds |
Information regarding fiscal year to date income earned by the Fund from investments in Fidelity Central Funds is as follows: |
Fund | Income earned |
Fidelity Cash Central Fund | $ 41,011 |
Fidelity Securities Lending Cash Central Fund | 20,639 |
Total | $ 61,650 |
Other Information |
All investments are categorized as Level 1 under the Fair Value Hierarchy. The inputs or methodology used for valuing securities may not be an indication of the risk associated with investing in those securities. For more information on valuation inputs, please refer to the Investment Valuation section in the accompanying Notes to Financial Statements. |
See accompanying notes which are an integral part of the financial statements.
Annual Report
Statement of Assets and Liabilities
| July 31, 2013 |
| | |
Assets | | |
Investment in securities, at value (including securities loaned of $3,185,196) - See accompanying schedule: Unaffiliated issuers (cost $885,443,895) | $ 1,002,788,384 | |
Fidelity Central Funds (cost $27,957,910) | 27,957,910 | |
Total Investments (cost $913,401,805) | | $ 1,030,746,294 |
Receivable for investments sold | | 5,160,386 |
Receivable for fund shares sold | | 1,115,434 |
Dividends receivable | | 169,400 |
Distributions receivable from Fidelity Central Funds | | 16,445 |
Other receivables | | 10,079 |
Total assets | | 1,037,218,038 |
| | |
Liabilities | | |
Payable for investments purchased | $ 7,423,831 | |
Payable for fund shares redeemed | 889,451 | |
Accrued management fee | 481,809 | |
Other affiliated payables | 111,442 | |
Other payables and accrued expenses | 46,820 | |
Collateral on securities loaned, at value | 3,315,100 | |
Total liabilities | | 12,268,453 |
| | |
Net Assets | | $ 1,024,949,585 |
Net Assets consist of: | | |
Paid in capital | | $ 877,431,718 |
Undistributed net investment income | | 2,701,320 |
Accumulated undistributed net realized gain (loss) on investments | | 27,472,058 |
Net unrealized appreciation (depreciation) on investments | | 117,344,489 |
Net Assets | | $ 1,024,949,585 |
See accompanying notes which are an integral part of the financial statements.
Annual Report
Statement of Assets and Liabilities - continued
| July 31, 2013 |
| | |
Series Real Estate Equity:
Net Asset Value, offering price and redemption price per share ($531,188,375 ÷ 41,285,400 shares) | | $ 12.87 |
| | |
Class F:
Net Asset Value, offering price and redemption price per share ($493,761,210 ÷ 38,358,308 shares) | | $ 12.87 |
See accompanying notes which are an integral part of the financial statements.
Annual Report
Financial Statements - continued
Statement of Operations
| Year ended July 31, 2013 |
| | |
Investment Income | | |
Dividends | | $ 19,791,168 |
Income from Fidelity Central Funds | | 61,650 |
Total income | | 19,852,818 |
| | |
Expenses | | |
Management fee | $ 4,951,489 | |
Transfer agent fees | 945,730 | |
Accounting and security lending fees | 303,377 | |
Custodian fees and expenses | 30,973 | |
Independent trustees' compensation | 5,466 | |
Audit | 50,473 | |
Legal | 2,489 | |
Miscellaneous | 7,940 | |
Total expenses before reductions | 6,297,937 | |
Expense reductions | (57,211) | 6,240,726 |
Net investment income (loss) | | 13,612,092 |
Realized and Unrealized Gain (Loss) Net realized gain (loss) on: | | |
Investment securities: | | |
Unaffiliated issuers | | 39,712,522 |
Change in net unrealized appreciation (depreciation) on investment securities | | 8,545,406 |
Net gain (loss) | | 48,257,928 |
Net increase (decrease) in net assets resulting from operations | | $ 61,870,020 |
See accompanying notes which are an integral part of the financial statements.
Annual Report
Statement of Changes in Net Assets
| Year ended
July 31,
2013 | For the period
October 20, 2011 (commencement of operations) to
July 31, 2012 |
Increase (Decrease) in Net Assets | | |
Operations | | |
Net investment income (loss) | $ 13,612,092 | $ 6,063,365 |
Net realized gain (loss) | 39,712,522 | 8,922,512 |
Change in net unrealized appreciation (depreciation) | 8,545,406 | 108,799,083 |
Net increase (decrease) in net assets resulting
from operations | 61,870,020 | 123,784,960 |
Distributions to shareholders from net investment income | (12,676,438) | (4,149,221) |
Distributions to shareholders from net realized gain | (20,512,803) | (798,651) |
Total distributions | (33,189,241) | (4,947,872) |
Share transactions - net increase (decrease) | 197,354,537 | 680,077,181 |
Total increase (decrease) in net assets | 226,035,316 | 798,914,269 |
| | |
Net Assets | | |
Beginning of period | 798,914,269 | - |
End of period (including undistributed net investment income of $2,701,320 and undistributed net investment income of $1,911,471, respectively) | $ 1,024,949,585 | $ 798,914,269 |
See accompanying notes which are an integral part of the financial statements.
Annual Report
Financial Highlights - Series Real Estate Equity
Years ended July 31, | 2013 | 2012 G |
Selected Per-Share Data | | |
Net asset value, beginning of period | $ 12.39 | $ 10.00 |
Income from Investment Operations | | |
Net investment income (loss) D | .18 | .11 |
Net realized and unrealized gain (loss) | .78 | 2.38 |
Total from investment operations | .96 | 2.49 |
Distributions from net investment income | (.17) | (.08) |
Distributions from net realized gain | (.31) | (.02) |
Total distributions | (.48) | (.10) |
Net asset value, end of period | $ 12.87 | $ 12.39 |
Total Return B,C | 8.06% | 25.03% |
Ratios to Average Net Assets E,H | | |
Expenses before reductions | .79% | .81% A |
Expenses net of fee waivers, if any | .79% | .81% A |
Expenses net of all reductions | .78% | .81% A |
Net investment income (loss) | 1.44% | 1.27% A |
Supplemental Data | | |
Net assets, end of period (000 omitted) | $ 531,188 | $ 475,392 |
Portfolio turnover rate F | 48% | 40% A |
A Annualized
B Total returns for periods of less than one year are not annualized.
C Total returns would have been lower if certain expenses had not been reduced during the applicable periods shown.
D Calculated based on average shares outstanding during the period.
E Fees and expenses of any underlying Fidelity Central Funds are not included in the Fund's expense ratio. The Fund indirectly bears its proportionate share of the expenses of any underlying Fidelity Central Funds.
F Amount does not include the portfolio activity of any underlying Fidelity Central Funds.
G For the period October 20, 2011 (commencement of operations) to July 31, 2012.
H Expense ratios reflect operating expenses of the class. Expenses before reductions do not reflect amounts reimbursed by the investment adviser or reductions from brokerage service arrangements or reductions from other expense offset arrangements and do not represent the amount paid by the class during periods when reimbursements or reductions occur. Expense ratios before reductions for start-up periods may not be representative of longer-term operating periods. Expenses net of fee waivers reflect expenses after reimbursement by the investment adviser but prior to reductions from brokerage service arrangements or other expense offset arrangements. Expenses net of all reductions represent the net expenses paid by the class.
See accompanying notes which are an integral part of the financial statements.
Annual Report
Financial Highlights - Class F
Years ended July 31, | 2013 | 2012 G |
Selected Per-Share Data | | |
Net asset value, beginning of period | $ 12.39 | $ 10.00 |
Income from Investment Operations | | |
Net investment income (loss) D | .21 | .13 |
Net realized and unrealized gain (loss) | .78 | 2.37 |
Total from investment operations | .99 | 2.50 |
Distributions from net investment income | (.20) | (.09) |
Distributions from net realized gain | (.31) | (.02) |
Total distributions | (.51) | (.11) |
Net asset value, end of period | $ 12.87 | $ 12.39 |
Total Return B,C | 8.27% | 25.16% |
Ratios to Average Net Assets E,H | | |
Expenses before reductions | .60% | .61% A |
Expenses net of fee waivers, if any | .60% | .61% A |
Expenses net of all reductions | .59% | .61% A |
Net investment income (loss) | 1.63% | 1.47% A |
Supplemental Data | | |
Net assets, end of period (000 omitted) | $ 493,761 | $ 323,523 |
Portfolio turnover rate F | 48% | 40% A |
A Annualized
B Total returns for periods of less than one year are not annualized.
C Total returns would have been lower if certain expenses had not been reduced during the applicable periods shown.
D Calculated based on average shares outstanding during the period.
E Fees and expenses of any underlying Fidelity Central Funds are not included in the Fund's expense ratio. The Fund indirectly bears its proportionate share of the expenses of any underlying Fidelity Central Funds.
F Amount does not include the portfolio activity of any underlying Fidelity Central Funds.
G For the period October 20, 2011 (commencement of operations) to July 31, 2012.
H Expense ratios reflect operating expenses of the class. Expenses before reductions do not reflect amounts reimbursed by the investment adviser or reductions from brokerage service arrangements or reductions from other expense offset arrangements and do not represent the amount paid by the class during periods when reimbursements or reductions occur. Expense ratios before reductions for start-up periods may not be representative of longer-term operating periods. Expenses net of fee waivers reflect expenses after reimbursement by the investment adviser but prior to reductions from brokerage service arrangements or other expense offset arrangements. Expenses net of all reductions represent the net expenses paid by the class.
See accompanying notes which are an integral part of the financial statements.
Annual Report
Notes to Financial Statements
For the period ended July 31, 2013
1. Organization.
Fidelity Series Real Estate Equity Fund (the Fund) is a non-diversified fund of Fidelity Securities Fund (the Trust) and is authorized to issue an unlimited number of shares. The Trust is registered under the Investment Company Act of 1940, as amended (the 1940 Act), as an open-end management investment company organized as a Massachusetts business trust. The Fund offers Series Real Estate Equity and Class F shares, each of which has equal rights as to assets and voting privileges. Each class has exclusive voting rights with respect to matters that affect that class.
2. Investments in Fidelity Central Funds.
The Fund invests in Fidelity Central Funds, which are open-end investment companies generally available only to other investment companies and accounts managed by Fidelity Management & Research Company (FMR) and its affiliates. The Fund's Schedule of Investments lists each of the Fidelity Central Funds held as of period end, if any, as an investment of the Fund, but does not include the underlying holdings of each Fidelity Central Fund. As an Investing Fund, the Fund indirectly bears its proportionate share of the expenses of the underlying Fidelity Central Funds.
The Money Market Central Funds seek preservation of capital and current income and are managed by Fidelity Investments Money Management, Inc. (FIMM), an affiliate of FMR.
A complete unaudited list of holdings for each Fidelity Central Fund is available upon request or at the Securities and Exchange Commission (the SEC) website at www.sec.gov. In addition, the financial statements of the Fidelity Central Funds, which are not covered by the Fund's Report of Independent Registered Public Accounting Firm, are available on the SEC website or upon request.
3. Significant Accounting Policies.
The financial statements have been prepared in conformity with accounting principles generally accepted in the United States of America (GAAP), which require management to make certain estimates and assumptions at the date of the financial statements. Actual results could differ from those estimates. Subsequent events, if any, through the date that the financial statements were issued have been evaluated in the preparation of the financial statements. The following summarizes the significant accounting policies of the Fund:
Annual Report
3. Significant Accounting Policies - continued
Investment Valuation. Investments are valued as of 4:00 p.m. Eastern time on the last calendar day of the period. In accordance with valuation policies and procedures approved by the Board of Trustees (the Board), the Fund attempts to obtain prices from one or more third party pricing vendors or brokers to value its investments. When current market prices, quotations or currency exchange rates are not readily available or reliable, investments will be fair valued in good faith by the FMR Fair Value Committee (the Committee), in accordance with procedures adopted by the Board. Factors used in determining fair value vary by investment type and may include market or investment specific events. The frequency with which these procedures are used cannot be predicted and they may be utilized to a significant extent. The Committee oversees the Fund's valuation policies and procedures and is responsible for approving and reporting to the Board all fair value determinations.
The Fund categorizes the inputs to valuation techniques used to value its investments into a disclosure hierarchy consisting of three levels as shown below:
Level 1 - quoted prices in active markets for identical investments
Level 2 - other significant observable inputs (including quoted prices for similar investments, interest rates, prepayment speeds, etc.)
Level 3 - unobservable inputs (including the Fund's own assumptions based on the best information available)
Valuation techniques used to value the Fund's investments by major category are as follows:
Equity securities, including restricted securities, for which market quotations are readily available, are valued at the last reported sale price or official closing price as reported by a third party pricing vendor on the primary market or exchange on which they are traded and are categorized as Level 1 in the hierarchy. In the event there were no sales during the day or closing prices are not available, securities are valued at the last quoted bid price or may be valued using the last available price and are generally categorized as Level 2 in the hierarchy. For foreign equity securities, when market or security specific events arise, comparisons to the valuation of American Depositary Receipts (ADRs), futures contracts, Exchange-Traded Funds (ETFs) and certain indexes as well as quoted prices for similar securities may be used and would be categorized as Level 2 in the hierarchy. Utilizing these techniques may result in transfers between Level 1 and Level 2.
Investments in open-end mutual funds, including the Fidelity Central Funds, are valued at their closing net asset value (NAV) each business day and are categorized as Level 1 in the hierarchy.
Annual Report
Notes to Financial Statements - continued
3. Significant Accounting Policies - continued
Investment Valuation - continued
Changes in valuation techniques may result in transfers in or out of an assigned level within the disclosure hierarchy.
Investment Transactions and Income. For financial reporting purposes, the Fund's investment holdings and NAV include trades executed through the end of the last business day of the period. The NAV per share for processing shareholder transactions is calculated as of the close of business of the New York Stock Exchange (NYSE), normally 4:00 p.m. Eastern time and includes trades executed through the end of the prior business day. Gains and losses on securities sold are determined on the basis of identified cost. Dividend income is recorded on the ex-dividend date, except for certain dividends from foreign securities where the ex-dividend date may have passed, which are recorded as soon as the Fund is informed of the ex-dividend date. Non-cash dividends included in dividend income, if any, are recorded at the fair market value of the securities received. Distributions received on securities that represent a return of capital or capital gain are recorded as a reduction of cost of investments and/or as a realized gain. Subsequent to ex-dividend date the Fund determines the components of these distributions, based upon receipt of tax filings or other correspondence relating to the underlying investment. Interest income and distributions from the Fidelity Central Funds are accrued as earned.
Class Allocations and Expenses. Investment income, realized and unrealized capital gains and losses, common expenses of the Fund, and certain fund-level expense reductions, if any, are allocated on a pro-rata basis to each class based on the relative net assets of each class to the total net assets of the Fund. Each class differs with respect to transfer agent fees incurred. Certain expense reductions may also differ by class. Expenses directly attributable to a fund are charged to that fund. Expenses attributable to more than one fund are allocated among the respective funds on the basis of relative net assets or other appropriate methods. Expense estimates are accrued in the period to which they relate and adjustments are made when actual amounts are known.
Income Tax Information and Distributions to Shareholders. Each year, the Fund intends to qualify as a regulated investment company under Subchapter M of the Internal Revenue Code, including distributing substantially all of its taxable income and realized gains. As a result, no provision for income taxes is required. As of July 31, 2013, the Fund did not have any unrecognized tax benefits in the financial statements; nor is the Fund aware of any tax positions for which it is reasonably possible that the total amounts of unrecognized tax benefits will significantly change in the next twelve months. The Fund files a U.S. federal tax return, in addition to state and local tax returns as required. A fund's federal income tax returns are subject to examination by the Internal Revenue Service (IRS) for a period of three fiscal years after they are filed.
Annual Report
3. Significant Accounting Policies - continued
Income Tax Information and Distributions to Shareholders - continued
State and local tax returns may be subject to examination for an additional fiscal year depending on the jurisdiction.
Distributions are declared and recorded on the ex-dividend date. Income dividends and capital gain distributions are declared separately for each class. Income and capital gain distributions are determined in accordance with income tax regulations, which may differ from GAAP.
Capital accounts within the financial statements are adjusted for permanent book-tax differences. These adjustments have no impact on net assets or the results of operations. Temporary book-tax differences will reverse in a subsequent period.
Book-tax differences are primarily due to losses deferred due to wash sales.
The federal tax cost of investment securities and unrealized appreciation (depreciation) as of period end were as follows:
Gross unrealized appreciation | $ 128,199,019 |
Gross unrealized depreciation | (11,999,865) |
Net unrealized appreciation (depreciation) on securities and other investments | $ 116,199,154 |
| |
Tax Cost | $ 914,547,140 |
The tax-based components of distributable earnings as of period end were as follows:
Undistributed ordinary income | $ 8,803,885 |
Undistributed long-term capital gain | $ 22,514,827 |
Net unrealized appreciation (depreciation) | $ 116,199,154 |
The tax character of distributions paid was as follows:
| July 31, 2013 | July 31, 2012 |
Ordinary Income | $ 30,506,015 | $ 4,947,872 |
Long-term Capital Gains | 2,683,226 | - |
Total | $ 33,189,241 | $ 4,947,872 |
4. Purchases and Sales of Investments.
Purchases and sales of securities, other than short-term securities, aggregated $602,344,236 and $413,902,938, respectively.
Annual Report
Notes to Financial Statements - continued
5. Fees and Other Transactions with Affiliates.
Management Fee. FMR and its affiliates provide the Fund with investment management related services for which the Fund pays a monthly management fee. The management fee is the sum of an individual fund fee rate that is based on an annual rate of .30% of the Fund's average net assets and an annualized group fee rate that averaged .26% during the period. The group fee rate is based upon the average net assets of all the mutual funds advised by FMR. The group fee rate decreases as assets under management increase and increases as assets under management decrease. For the period, the total annual management fee rate was .55% of the Fund's average net assets.
Transfer Agent Fees. Fidelity Investments Institutional Operations Company, Inc., (FIIOC), an affiliate of FMR, is the transfer, dividend disbursing and shareholder servicing agent for each class of the Fund. FIIOC receives account fees and asset-based fees that vary according to the account size and type of account of the shareholders of Series Real Estate Equity. FIIOC receives no fees for providing transfer agency services to Class F. FIIOC pays for typesetting, printing and mailing of shareholder reports, except proxy statements. For the period, transfer agent fees for each class were as follows:
| Amount | % of
Average
Net Assets |
Series Real Estate Equity | $ 945,730 | .19 |
Accounting and Security Lending Fees. Fidelity Service Company, Inc. (FSC), an affiliate of FMR, maintains the Fund's accounting records. The accounting fee is based on the level of average net assets for each month. Under a separate contract, FSC administers the security lending program. The security lending fee is based on the number and duration of lending transactions.
Brokerage Commissions. The Fund placed a portion of its portfolio transactions with brokerage firms which are affiliates of the investment adviser. Brokerage commissions are included in net realized gain (loss) and change in net unrealized appreciation (depreciation) in the Statement of Operations. The commissions paid to these affiliated firms were $11,228 for the period.
6. Committed Line of Credit.
The Fund participates with other funds managed by FMR or an affiliate in a $4.25 billion credit facility (the "line of credit") to be utilized for temporary or emergency purposes to fund shareholder redemptions or for other short-term liquidity purposes. The Fund has agreed to pay commitment fees on its pro-rata portion of the line of credit, which amounted to $2,032 and is reflected in Miscellaneous expenses on the Statement of Operations. During the period, there were no borrowings on this line of credit.
Annual Report
7. Security Lending.
The Fund lends portfolio securities through a lending agent from time to time in order to earn additional income. For equity securities, a lending agent is used and may loan securities to certain qualified borrowers, including Fidelity Capital Markets (FCM), a broker-dealer affiliated with the Fund. On the settlement date of the loan, the Fund receives collateral (in the form of U.S. Treasury obligations, letters of credit and/or cash) against the loaned securities and maintains collateral in an amount not less than 100% of the market value of the loaned securities during the period of the loan. The market value of the loaned securities is determined at the close of business of the Fund and any additional required collateral is delivered to the Fund on the next business day. If the borrower defaults on its obligation to return the securities loaned because of insolvency or other reasons, the Fund may apply collateral received from the borrower against the obligation. The Fund may experience delays and costs in recovering the securities loaned. Any cash collateral received is invested the Fidelity Securities Lending Cash Central Fund. The value of loaned securities and cash collateral at period end are disclosed on the Fund's Statement of Assets and Liabilities. Security lending income represents the income earned on investing cash collateral, less rebates paid to borrowers and any lending agent fees associated with the loan, plus any premium payments received for lending certain types of securities. Security lending income is presented in the Statement of Operations as a component of income from Fidelity Central Funds. Total security lending income during the period amounted to $20,639. During the period, there were no securities loaned to FCM.
8. Expense Reductions.
Commissions paid to certain brokers with whom FMR places trades on behalf of the Fund include an amount in addition to trade execution, which is rebated back to the Fund to offset certain expenses. This amount totaled $57,177 for the period. In addition, through arrangements with the Fund's custodian, credits realized as a result of uninvested cash balances were used to reduce the Fund's expenses. During the period, these credits reduced the Fund's custody expenses by $34.
Annual Report
Notes to Financial Statements - continued
9. Distributions to Shareholders.
Distributions to shareholders of each class were as follows:
Years ended July 31, | 2013 | 2012 A |
From net investment income | | |
Series Real Estate Equity | $ 6,714,600 | $ 2,536,950 |
Class F | 5,961,838 | 1,612,271 |
Total | $ 12,676,438 | $ 4,149,221 |
From net realized gain | | |
Series Real Estate Equity | $ 11,925,873 | $ 550,380 |
Class F | 8,586,930 | 248,271 |
Total | $ 20,512,803 | $ 798,651 |
A For the period October 20, 2011 (commencement of operations) to July 31, 2012.
10. Share Transactions.
Transactions for each class of shares were as follows:
| Shares | Dollars |
Years ended July 31, | 2013 | 2012 A | 2013 | 2012 A |
Series Real Estate Equity | | | | |
Shares sold | 6,610,741 | 45,860,755 B | $ 86,029,893 | $ 478,790,709 B |
Reinvestment of distributions | 1,534,780 | 289,752 | 18,640,473 | 3,087,330 |
Shares redeemed | (5,238,476) | (7,772,152) | (65,738,689) | (82,058,496) |
Net increase (decrease) | 2,907,045 | 38,378,355 | $ 38,931,677 | $ 399,819,543 |
Class F | | | | |
Shares sold | 12,141,060 | 28,641,002 B | $ 157,366,547 | $ 306,842,724 B |
Reinvestment of distributions | 1,195,373 | 172,860 | 14,548,768 | 1,860,542 |
Shares redeemed | (1,083,592) | (2,708,395) | (13,492,455) | (28,445,628) |
Net increase (decrease) | 12,252,841 | 26,105,467 | $ 158,422,860 | $ 280,257,638 |
A For the period October 20, 2011 (commencement of operations) to July 31, 2012.
B Amount includes in-kind exchanges.
11. Other.
The Fund's organizational documents provide former and current trustees and officers with a limited indemnification against liabilities arising in connection with the performance of their duties to the Fund. In the normal course of business, the Fund may also enter into contracts that provide general indemnifications. The Fund's maximum exposure under these arrangements is unknown as this would be dependent on future claims that may be made against the Fund. The risk of material loss from such claims is considered remote.
Annual Report
11. Other - continued
At the end of the period, mutual funds managed by FMR or an FMR affiliate were the owners of record of all of the outstanding shares of the Fund.
Annual Report
To the Trustees of Fidelity Securities Fund and Shareholders of Fidelity Series Real Estate Equity Fund:
We have audited the accompanying statement of assets and liabilities of Fidelity Series Real Estate Equity Fund (the Fund), a fund of Fidelity Securities Fund, including the schedule of investments, as of July 31, 2013, and the related statement of operations for the year then ended, and the statement of changes in net assets and the financial highlights for the year then ended and for the period from October 20, 2011 (commencement of operations) to July 31, 2012. These financial statements and financial highlights are the responsibility of the Fund's management. Our responsibility is to express an opinion on these financial statements and financial highlights based on our audits.
We conducted our audits in accordance with the standards of the Public Company Accounting Oversight Board (United States). Those standards require that we plan and perform the audit to obtain reasonable assurance about whether the financial statements and financial highlights are free of material misstatement. The Fund is not required to have, nor were we engaged to perform, an audit of its internal control over financial reporting. Our audits included consideration of internal control over financial reporting as a basis for designing audit procedures that are appropriate in the circumstances, but not for the purpose of expressing an opinion on the effectiveness of the Fund's internal control over financial reporting. Accordingly, we express no such opinion. An audit also includes examining, on a test basis, evidence supporting the amounts and disclosures in the financial statements, assessing the accounting principles used and significant estimates made by management, as well as evaluating the overall financial statement presentation. Our procedures included confirmation of securities owned as of July 31, 2013, by correspondence with the custodians and brokers; where replies were not received from brokers, we performed other auditing procedures. We believe that our audits provide a reasonable basis for our opinion.
In our opinion, the financial statements and financial highlights referred to above present fairly, in all material respects, the financial position of Fidelity Series Real Estate Equity Fund as of July 31, 2013, the results of its operations for the year then ended, and the changes in its net assets and the financial highlights for the year then ended and for the period from October 20, 2011 (commencement of operations) to July 31, 2012, in conformity with accounting principles generally accepted in the United States of America.
DELOITTE & TOUCHE LLP
Boston, Massachusetts
September 13, 2013
Annual Report
The Trustees, Member of the Advisory Board, and executive officers of the trust and fund, as applicable, are listed below. The Board of Trustees governs the fund and is responsible for protecting the interests of shareholders. The Trustees are experienced executives who meet periodically throughout the year to oversee the fund's activities, review contractual arrangements with companies that provide services to the fund, oversee management of the risks associated with such activities and contractual arrangements, and review the fund's performance. Except for James C. Curvey, Ned C. Lautenbach, Ronald P. O'Hanley, and William S. Stavropoulos, each of the Trustees oversees 166 Fidelity funds. Mr. Curvey oversees 387 Fidelity funds. Mr. Lautenbach, Mr. O'Hanley, and Mr. Stavropoulos each oversees 230 Fidelity funds.
The Trustees hold office without limit in time except that (a) any Trustee may resign; (b) any Trustee may be removed by written instrument, signed by at least two-thirds of the number of Trustees prior to such removal; (c) any Trustee who requests to be retired or who has become incapacitated by illness or injury may be retired by written instrument signed by a majority of the other Trustees; and (d) any Trustee may be removed at any special meeting of shareholders by a two-thirds vote of the outstanding voting securities of the trust. Each Trustee who is not an interested person of the trust and the fund (as defined in the 1940 Act) (Independent Trustee), shall retire not later than the last day of the calendar year in which his or her 75th birthday occurs. The Independent Trustees may waive this mandatory retirement age policy with respect to individual Trustees. The executive officers and Advisory Board Member hold office without limit in time, except that any officer and Advisory Board Member may resign or may be removed by a vote of a majority of the Trustees at any regular meeting or any special meeting of the Trustees. Except as indicated, each individual has held the office shown or other offices in the same company for the past five years.
Experience, Skills, Attributes, and Qualifications of the Fund's Trustees. The Governance and Nominating Committee has adopted a statement of policy that describes the experience, qualifications, attributes, and skills that are necessary and desirable for potential Independent Trustee candidates (Statement of Policy). The Board believes that each Trustee satisfied at the time he or she was initially elected or appointed a Trustee, and continues to satisfy, the standards contemplated by the Statement of Policy. The Governance and Nominating Committee also engages professional search firms to help identify potential Independent Trustee candidates who have the experience, qualifications, attributes, and skills consistent with the Statement of Policy. From time to time, additional criteria based on the composition and skills of the current Independent Trustees, as well as experience or skills that may be appropriate in light of future changes to board composition, business conditions, and regulatory or other developments, have also been considered by the professional search firms and the Governance and Nominating Committee. In addition, the Board takes into account the Trustees' commitment and participation in Board and committee meetings, as well as their leadership of standing and ad hoc committees throughout their tenure.
Annual Report
In determining that a particular Trustee was and continues to be qualified to serve as a Trustee, the Board has considered a variety of criteria, none of which, in isolation, was controlling. The Board believes that, collectively, the Trustees have balanced and diverse experience, qualifications, attributes, and skills, which allow the Board to operate effectively in governing the fund and protecting the interests of shareholders. Information about the specific experience, skills, attributes, and qualifications of each Trustee, which in each case led to the Board's conclusion that the Trustee should serve (or continue to serve) as a trustee of the fund, is provided below.
Board Structure and Oversight Function. James C. Curvey is an interested person (as defined in the 1940 Act) and currently serves as Chairman. The Trustees have determined that an interested Chairman is appropriate and benefits shareholders because an interested Chairman has a personal and professional stake in the quality and continuity of services provided to the fund. Independent Trustees exercise their informed business judgment to appoint an individual of their choosing to serve as Chairman, regardless of whether the Trustee happens to be independent or a member of management. The Independent Trustees have determined that they can act independently and effectively without having an Independent Trustee serve as Chairman and that a key structural component for assuring that they are in a position to do so is for the Independent Trustees to constitute a substantial majority for the Board. The Independent Trustees also regularly meet in executive session. Ned C. Lautenbach serves as Chairman of the Independent Trustees and as such (i) acts as a liaison between the Independent Trustees and management with respect to matters important to the Independent Trustees and (ii) with management prepares agendas for Board meetings.
Fidelity funds are overseen by different Boards of Trustees. The fund's Board oversees Fidelity's equity and high income funds and another Board oversees Fidelity's investment-grade bond, money market, and asset allocation funds. The asset allocation funds may invest in Fidelity funds overseen by the fund's Board. The use of separate Boards, each with its own committee structure, allows the Trustees of each group of Fidelity funds to focus on the unique issues of the funds they oversee, including common research, investment, and operational issues. On occasion, the separate Boards establish joint committees to address issues of overlapping consequences for the Fidelity funds overseen by each Board.
The Trustees operate using a system of committees to facilitate the timely and efficient consideration of all matters of importance to the Trustees, the fund, and fund shareholders and to facilitate compliance with legal and regulatory requirements and oversight of the fund's activities and associated risks. The Board, acting through its committees, has charged FMR and its affiliates with (i) identifying events or circumstances the occurrence of which could have demonstrably adverse effects on the fund's business and/or reputation; (ii) implementing processes and controls to lessen the possibility that such events or circumstances occur or to mitigate the effects of such events or circumstances if they do occur; and (iii) creating and maintaining a system designed to evaluate continuously business and market conditions in order to facilitate the identification and implementation processes described in (i) and (ii) above. Because the day-to-day operations and activities of the fund are carried out by or through FMR, its affiliates and other service providers, the fund's exposure to risks is mitigated but not eliminated by the processes overseen by the Trustees. While each of the Board's committees has responsibility for overseeing different aspects of the fund's activities, oversight is exercised primarily through the Operations, Audit, and Compliance Committees. In addition, the Independent Trustees have worked with FMR to enhance the Board's oversight of investment and financial risks, legal and regulatory risks, technology risks, and operational risks, including the development of additional risk reporting to the Board. For example, a working group comprised of Independent Trustees and FMR has worked and continues to work to review the Fidelity funds' valuation-related activities, reporting and risk management. Appropriate personnel, including but not limited to the fund's Chief Compliance Officer (CCO), FMR's internal auditor, the independent accountants, the fund's Treasurer and portfolio management personnel, make periodic reports to the Board's committees, as appropriate, including an annual review of FMR's risk management program for the Fidelity funds. The responsibilities of each standing committee, including their oversight responsibilities, are described further under "Standing Committees of the Fund's Trustees."
Annual Report
Trustees and Officers - continued
The fund's Statement of Additional Information (SAI) includes more information about the Trustees. To request a free copy, call Fidelity at 1-800-544-8544 for Fidelity Series Real Estate Equity Fund or 1-800-835-5092 for Class F.
Interested Trustees*:
Correspondence intended for each Trustee who is an interested person may be sent to Fidelity Investments, 245 Summer Street, Boston, Massachusetts 02210.
Name, Year of Birth; Principal Occupations and Other Relevant Experience+ |
James C. Curvey (1935) |
| Year of Election or Appointment: 2007 Mr. Curvey is Trustee and Chairman of the Board of Trustees of certain Trusts. Mr. Curvey also serves as Trustee (2007-present) of other investment companies advised by FMR. Mr. Curvey is a Director of Fidelity Investments Money Management, Inc. (2009-present), Director of Fidelity Research & Analysis Co. (2009-present) and Director of FMR and FMR Co., Inc. (2007-present). Mr. Curvey is also Vice Chairman (2007-present) and Director of FMR LLC. In addition, Mr. Curvey serves as an Overseer for the Boston Symphony Orchestra and a member of the Trustees of Villanova University. Previously, Mr. Curvey was the Vice Chairman (2006-2007) and Director (2000-2007) of FMR Corp. |
Ronald P. O'Hanley (1957) |
| Year of Election or Appointment: 2011 Mr. O'Hanley serves as a Trustee and Chairman of the Board of Trustees of other Fidelity funds (2013-present), and is Director of FMR Co., Inc. (2010-present), Director of Fidelity Investments Money Management, Inc. (2010-present), Director of Fidelity Research & Analysis Company (2010-present), President of Fidelity Asset Management and Corporate Services and a Member of Fidelity's Executive Committee (2010-present). Previously, Mr. O'Hanley served as President and Chief Executive Officer of BNY Mellon Asset Management (2007-2010). Mr. O'Hanley also served as Vice Chairman of Bank New York Mellon Corp. and a member of that firm's Executive Committee. Prior to the 2007 merger of The Bank of New York and Mellon Financial Corporation, he was Vice Chairman of Mellon Financial Corporation and President and Chief Executive Officer of Mellon Asset Management. He joined Mellon in February 1997. Mr. O'Hanley currently serves as Chairman of the Boston Public Library Foundation Board of Directors and sits on the Board of Directors of Beth Israel Deaconess Medical Center, the Board of Trustees of the Marine Biological Laboratory and the Advisory Board of the Maxwell School of Citizenship and Public Administration at Syracuse University. Mr. O'Hanley also chairs the Council on Asset Management for the Financial Services Roundtable and is a member of the Board of Directors of Institutional Investor's U.S. Institute. |
* Trustees have been determined to be "Interested Trustees" by virtue of, among other things, their affiliation with the trust or various entities under common control with FMR.
+ The information above includes each Trustee's principal occupation during the last five years and other information relating to the experience, attributes, and skills relevant to each Trustee's qualifications to serve as a Trustee, which led to the conclusion that each Trustee should serve as a Trustee for the fund.
Annual Report
Trustees and Officers - continued
Independent Trustees:
Correspondence intended for each Independent Trustee (that is, the Trustees other than the Interested Trustees) may be sent to Fidelity Investments, P.O. Box 55235, Boston, Massachusetts 02205-5235.
Name, Year of Birth; Principal Occupations and Other Relevant Experience+ |
Dennis J. Dirks (1948) |
| Year of Election or Appointment: 2005 Prior to his retirement in May 2003, Mr. Dirks was Chief Operating Officer and a member of the Board of The Depository Trust & Clearing Corporation (DTCC). He also served as President, Chief Operating Officer, and Board member of The Depository Trust Company (DTC) and President and Board member of the National Securities Clearing Corporation (NSCC). In addition, Mr. Dirks served as Chief Executive Officer and Board member of the Government Securities Clearing Corporation, Chief Executive Officer and Board member of the Mortgage-Backed Securities Clearing Corporation, as a Trustee and a member of the Finance Committee of Manhattan College (2005-2008), and as a Trustee and a member of the Finance Committee of AHRC of Nassau County (2006-2008). Mr. Dirks is a member of the Independent Directors Council (IDC) Governing Council (2010-present) and Board of Directors for The Brookville Center for Children's Services, Inc. (2009-present). |
Alan J. Lacy (1953) |
| Year of Election or Appointment: 2008 Mr. Lacy serves as Senior Adviser (2007-present) of Oak Hill Capital Partners, L.P. (private equity). Mr. Lacy also served as Chief Executive Officer (2000-2005) and Vice Chairman (2005-2006) of Sears Holdings Corporation and Sears, Roebuck and Co. (retail). In addition, Mr. Lacy serves as a member of the Board of Directors of Dave & Buster's Entertainment, Inc. (restaurant and entertainment complexes, 2010-present), Earth Fare, Inc. (retail grocery, 2012-present), The Hillman Companies, Inc. (hardware wholesalers, 2010-present), and Bristol-Myers Squibb Company (global pharmaceuticals, 2008-present). Mr. Lacy is a member of the Board of Trustees of The National Parks Conservation Association (2006-present). Previously, Mr. Lacy served as Chairman of the Board of Trustees of the National Parks Conservation Association (2008-2011) and as a member of the Board of Directors for the Western Union Company (global money transfer, 2006-2011). |
Ned C. Lautenbach (1944) |
| Year of Election or Appointment: 2000 Mr. Lautenbach is Chairman of the Independent Trustees of the Equity and High Income Funds (2006-present) and serves as a Trustee of other Fidelity funds (2013-present). Mr. Lautenbach currently serves as the Lead Director of the Eaton Corporation Board of Directors (diversified industrial, 1997-present). Mr. Lautenbach is Chairman of the Board of Directors of the Philharmonic Center for the Arts in Naples, Florida (2012-present) and a member of the Council on Foreign Relations (1994-present). Previously, Mr. Lautenbach was a Partner/Advisory Partner at Clayton, Dubilier & Rice, LLC (private equity investment, 1998-2010), as well as a Director of Sony Corporation (2006-2007). |
Joseph Mauriello (1944) |
| Year of Election or Appointment: 2008 Prior to his retirement in January 2006, Mr. Mauriello served in numerous senior management positions including Deputy Chairman and Chief Operating Officer (2004-2005), and Vice Chairman of Financial Services (2002-2004) of KPMG LLP US (professional services, 1965-2005). Mr. Mauriello currently serves as a member of the Board of Directors of XL Group plc. (global insurance and re-insurance, 2006-present). Previously, Mr. Mauriello served as a Director of the Hamilton Funds of the Bank of New York (2006-2007) and of Arcadia Resources Inc. (health care services and products, 2007-2012). |
Robert W. Selander (1950) |
| Year of Election or Appointment: 2011 Previously, Mr. Selander served as a Member of the Advisory Board of Fidelity's Equity and High Income Funds (2011), Executive Vice Chairman (2010), Chief Executive Officer (2009-2010), and President and Chief Executive Officer (1997-2009) of Mastercard, Inc. |
Cornelia M. Small (1944) |
| Year of Election or Appointment: 2005 Ms. Small is a member of the Board of Directors (2009-present) and Chair of the Investment Committee (2010-present) of the Teagle Foundation. Ms. Small also serves on the Investment Committee of the Berkshire Taconic Community Foundation (2008-present). Previously, Ms. Small served as Chairperson (2002-2008) and a member of the Investment Committee and Chairperson (2008-2012) and a member of the Board of Trustees of Smith College. In addition, Ms. Small served as Chief Investment Officer, Director of Global Equity Investments, and a member of the Board of Directors of Scudder, Stevens & Clark and Scudder Kemper Investments. |
William S. Stavropoulos (1939) |
| Year of Election or Appointment: 2002 Mr. Stavropoulos is Vice Chairman of the Independent Trustees of the Equity and High Income Funds (2006-present) and serves as a Trustee of other Fidelity funds (2013-present). Mr. Stavropoulos serves as President and Founder of the Michigan Baseball Foundation, the Great Lakes Loons (2007-present). Mr. Stavropoulos is Chairman Emeritus of the Board of Directors of The Dow Chemical Company, where he previously served in numerous senior management positions, including President, CEO (1995-2000; 2002-2004), Chairman of the Executive Committee (2000-2006), and as a member of the Board of Directors (1990-2006). Currently, Mr. Stavropoulos is Chairman of the Board of Directors of Univar Inc. (global distributor of commodity and specialty chemicals), a Director of Teradata Corporation (data warehousing and technology solutions), and Maersk Inc. (industrial conglomerate), and a member of the Advisory Board for Metalmark Capital LLC (private equity investment, 2005-present). Mr. Stavropoulos is an operating advisor to Clayton, Dubilier & Rice, LLC (private equity investment). In addition, Mr. Stavropoulos is a member of the University of Notre Dame Advisory Council for the College of Science, a Trustee of the Rollin L. Gerstacker Foundation, and a Director of the Naples Philharmonic Center for the Arts. Previously, Mr. Stavropoulos served as a Director of Chemical Financial Corporation (bank holding company, 1993-2012) and Tyco International, Ltd. (multinational manufacturing and services, 2007-2012). |
David M. Thomas (1949) |
| Year of Election or Appointment: 2008 Previously, Mr. Thomas served as Executive Chairman (2005-2006) and Chairman and Chief Executive Officer (2000-2005) of IMS Health, Inc. (pharmaceutical and healthcare information solutions), and a Director of Fortune Brands, Inc. (consumer products, 2000-2011). In addition, Mr. Thomas serves as Non-Executive Chairman of the Board of Directors of Fortune Brands Home and Security (home and security products, 2011-present), and as a member of the Board of Directors of Interpublic Group of Companies, Inc. (marketing communication, 2004-present). |
+ The information above includes each Trustee's principal occupation during the last five years and other information relating to the experience, attributes, and skills relevant to each Trustee's qualifications to serve as a Trustee, which led to the conclusion that each Trustee should serve as a Trustee for the fund.
Annual Report
Advisory Board Member and Executive Officers:
Correspondence intended for each executive officer and Peter S. Lynch may be sent to Fidelity Investments, 245 Summer Street, Boston, Massachusetts 02210.
Name, Year of Birth; Principal Occupation |
Peter S. Lynch (1944) |
| Year of Election or Appointment: 2003 Member of the Advisory Board of Fidelity's Equity and High Income Funds. Mr. Lynch is Vice Chairman and a Director of FMR and FMR Co., Inc. In addition, Mr. Lynch serves as a Trustee of Boston College and as the Chairman of the Inner-City Scholarship Fund. Previously, Mr. Lynch served on the Special Olympics International Board of Directors (1997-2006). |
Kenneth B. Robins (1969) |
| Year of Election or Appointment: 2008 President and Treasurer of Fidelity's Equity and High Income Funds. Mr. Robins also serves as President and Treasurer (2008-present) and Assistant Treasurer (2009-present) of other Fidelity funds and is an employee of Fidelity Investments (2004-present). Mr. Robins serves as Executive Vice President of Fidelity Investments Money Management, Inc. (FIMM) (2013-present). Previously, Mr. Robins served as Deputy Treasurer of the Fidelity funds (2005-2008) and Treasurer and Chief Financial Officer of The North Carolina Capital Management Trust: Cash and Term Portfolios (2006-2008). |
Brian B. Hogan (1964) |
| Year of Election or Appointment: 2009 Vice President of Equity and High Income Funds. Mr. Hogan also serves as Vice President of other Fidelity funds (2009-present) and President of FMR's Equity Division (2009-present). Previously, Mr. Hogan served as Senior Vice President, Equity Research of FMR (2006-2009) and as a portfolio manager. |
Christopher S. Bartel (1971) |
| Year of Election or Appointment: 2009 Vice President of Fidelity's Sector and Real Estate Equity Funds. Mr. Bartel also serves as a Director, President, and Chief Executive Officer of Fidelity Management & Research (Japan) Inc. (2012-present), a Director of Fidelity Management & Research (Hong Kong) (2012-present), and Senior Vice President of Global Equity Research (2010-present). Previously, Mr. Bartel served as Senior Vice President of Equity Research (2009-2010), Managing Director of Research (2006-2009), and an analyst and portfolio manager (2000-2006). |
Scott C. Goebel (1968) |
| Year of Election or Appointment: 2008 Secretary and Chief Legal Officer (CLO) of the Fidelity funds. Mr. Goebel also serves as Secretary of Fidelity Investments Money Management, Inc. (FIMM) (2010-present) and Fidelity Research and Analysis Company (FRAC) (2010-present); Secretary and CLO of The North Carolina Capital Management Trust: Cash and Term Portfolios (2008-present); General Counsel, Secretary, and Senior Vice President of FMR (2008-present) and FMR Co., Inc. (2008-present); employed by FMR LLC or an affiliate (2001-present); Chief Legal Officer of Fidelity Management & Research (Hong Kong) Limited (2008-present) and Assistant Secretary of Fidelity Management & Research (Japan) Inc. (2008-present), and Fidelity Management & Research (U.K.) Inc. (2008-present). Previously, Mr. Goebel served as Assistant Secretary of FIMM (2008-2010), FRAC (2008-2010), and the Funds (2007-2008) and as Vice President and Secretary of Fidelity Distributors Corporation (FDC) (2005-2007). |
William C. Coffey (1969) |
| Year of Election or Appointment: 2009 Assistant Secretary of Fidelity's Equity and High Income Funds. Mr. Coffey also serves as Assistant Secretary of other Fidelity funds (2009-present), Senior Vice President and Deputy General Counsel of FMR LLC (2010-present), and is an employee of Fidelity Investments. Previously, Mr. Coffey served as Vice President and Associate General Counsel of FMR LLC (2005-2009). |
Elizabeth Paige Baumann (1968) |
| Year of Election or Appointment: 2012 Anti-Money Laundering (AML) Officer of the Fidelity funds. Ms. Baumann also serves as AML Officer of The North Carolina Capital Management Trust: Cash and Term Portfolios (2012-present), Chief AML Officer of FMR LLC (2012-present), and is an employee of Fidelity Investments. Previously, Ms. Baumann served as Vice President and Deputy Anti-Money Laundering Officer (2007-2012). |
Christine Reynolds (1958) |
| Year of Election or Appointment: 2008 Chief Financial Officer of the Fidelity funds. Ms. Reynolds became President of Fidelity Pricing and Cash Management Services (FPCMS) in August 2008. Ms. Reynolds served as Chief Operating Officer of FPCMS (2007-2008). Previously, Ms. Reynolds served as President, Treasurer, and Anti-Money Laundering officer of the Fidelity funds (2004-2007). |
Joseph A. Hanlon (1968) |
| Year of Election or Appointment: 2012 Chief Compliance Officer of Fidelity's Equity and High Income Funds. Mr. Hanlon also serves as Chief Compliance Officer of other Fidelity funds (2012-present). Mr. Hanlon serves as Compliance Officer of FMR, FMR Co., Inc., Fidelity Investments Money Management, Inc. (FIMM), Fidelity Research and Analysis Company (FRAC), and Fidelity Management & Research (Hong Kong) (2009-present), as Senior Vice President of the Fidelity Asset Management Division (2009-present), and is an employee of Fidelity Investments. Previously, Mr. Hanlon served as Compliance Officer of Fidelity Management & Research (Japan) Inc. (2009-2013), Strategic Advisers, Inc. (2009-2013), and Fidelity Management & Research (U.K.) Inc. (2009-2013). |
Joseph F. Zambello (1957) |
| Year of Election or Appointment: 2011 Deputy Treasurer of the Fidelity funds. Mr. Zambello is an employee of Fidelity Investments. Previously, Mr. Zambello served as Vice President of FMR's Program Management Group (2009-2011) and Vice President of the Transfer Agent Oversight Group (2005-2009). |
Adrien E. Deberghes (1967) |
| Year of Election or Appointment: 2008 Deputy Treasurer of Fidelity's Equity and High Income Funds. Mr. Deberghes also serves as Vice President (2011-present), Deputy Treasurer (2008-present), and Assistant Treasurer (2010-present) of other Fidelity funds, and is an employee of Fidelity Investments (2008-present). Previously, Mr. Deberghes served as Senior Vice President of Mutual Fund Administration at State Street Corporation (2007-2008), Senior Director of Mutual Fund Administration at Investors Bank & Trust (2005-2007), and Director of Finance for Dunkin' Brands (2000-2005). |
Stephen Sadoski (1971) |
| Year of Election or Appointment: 2012 Deputy Treasurer of Fidelity's Equity and High Income Funds. Mr. Sadoski also serves as Deputy Treasurer of other Fidelity funds (2012-present) and is an employee of Fidelity Investments (2012-present). Previously, Mr. Sadoski served as Assistant Treasurer of Fidelity's Fixed Income and Asset Allocation Funds (2012-2013), an assistant chief accountant in the Division of Investment Management of the Securities and Exchange Commission (SEC) (2009-2012) and as a senior manager at Deloitte & Touche LLP (1997-2009). |
Stacie M. Smith (1974) |
| Year of Election or Appointment: 2013 Deputy Treasurer of Fidelity's Equity and High Income Funds. Ms. Smith also serves as Deputy Treasurer of other Fidelity funds (2013-present) and is an employee of Fidelity Investments (2009-present). Previously, Ms. Smith served as Senior Audit Manager of Ernst & Young LLP (1996-2009). |
Stephanie J. Dorsey (1969) |
| Year of Election or Appointment: 2010 Assistant Treasurer of Fidelity's Equity and High Income Funds. Ms. Dorsey also serves as President and Treasurer (2013-present) and Assistant Treasurer (2010-present) of other Fidelity funds, Treasurer and Chief Financial Officer of The North Carolina Capital Management Trust: Cash and Term Portfolios (2013-present), and is an employee of Fidelity Investments (2008-present). Previously, Ms. Dorsey served as Deputy Treasurer of Fidelity's Fixed Income and Asset Allocation Funds (2008-2013), Treasurer (2004-2008) of the JPMorgan Mutual Funds and Vice President (2004-2008) of JPMorgan Chase Bank. |
Gary W. Ryan (1958) |
| Year of Election or Appointment: 2005 Assistant Treasurer of the Fidelity funds. Mr. Ryan is an employee of Fidelity Investments. Previously, Mr. Ryan served as Vice President of Fund Reporting in Fidelity Pricing and Cash Management Services (FPCMS) (1999-2005). |
Jonathan Davis (1968) |
| Year of Election or Appointment: 2010 Assistant Treasurer of the Fidelity funds. Mr. Davis is also Assistant Treasurer of Fidelity Rutland Square Trust II and Fidelity Commonwealth Trust II. Mr. Davis is an employee of Fidelity Investments. Previously, Mr. Davis served as Vice President and Associate General Counsel of FMR LLC (2003-2010). |
Annual Report
The Board of Trustees of Fidelity Series Real Estate Equity Fund voted to pay shareholders of record at the opening of business on record date, the following distributions per share derived from capital gains realized from sales of portfolio securities, and dividends derived from net investment income:
| Pay Date | Record Date | Dividends | Capital Gains |
Real Estate Equity | 09/09/13 | 09/06/13 | $0.042 | $0.339 |
Class F | 09/09/13 | 09/06/13 | $0.048 | $0.339 |
The fund hereby designates as a capital gain dividend with respect to the taxable year ended July 31, 2013, $23,418,373, or, if subsequently determined to be different, the net capital gain of such year.
A total of 0.05% of the dividends distributed during the fiscal year was derived from interest on U.S. Government securities which is generally exempt from state income tax.
The fund will notify shareholders in January 2014 of amounts for use in preparing 2013 income tax returns.
Annual Report
Board Approval of Investment Advisory Contracts and Management Fees
Fidelity Series Real Estate Equity Fund
Each year, the Board of Trustees, including the Independent Trustees (together, the Board), votes on the renewal of the management contract and sub-advisory agreements (together, the Advisory Contracts) for the fund. The Board, assisted by the advice of fund counsel and Independent Trustees' counsel, requests and considers a broad range of information relevant to the renewal of the Advisory Contracts throughout the year.
The Board meets regularly and, at each of its meetings, covers an extensive agenda of topics and materials and considers factors that are relevant to its annual consideration of the renewal of the fund's Advisory Contracts, including the services and support provided to the fund and its shareholders. The Board has established various standing committees, each composed of and chaired by Independent Trustees with varying backgrounds, to which the Board has assigned specific subject matter responsibilities in order to enhance effective decision-making by the Board. The Board, acting directly and through its Committees, requests and receives information concerning the annual consideration of the renewal of the fund's Advisory Contracts. The Board also meets as needed to consider matters specifically related to the Board's annual consideration of the renewal of Advisory Contracts. Members of the Board may also meet with trustees of other Fidelity funds through ad hoc joint committees to discuss certain matters relevant to the Fidelity funds.
At its July 2013 meeting, the Board, including the Independent Trustees, unanimously determined to renew the fund's Advisory Contracts. In reaching its determination, the Board considered all factors it believed relevant, including (i) the nature, extent, and quality of the services to be provided to the fund and its shareholders (including the investment performance of the fund); (ii) the competitiveness of the fund's management fee and total expense ratio relative to peer funds; (iii) the total costs of the services to be provided by and the profits to be realized by Fidelity from its relationship with the fund; (iv) the extent to which economies of scale exist and would be realized as the fund grows; and (v) whether fee levels reflect these economies of scale, if any, for the benefit of fund shareholders.
In considering whether to renew the Advisory Contracts for the fund, the Board reached a determination, with the assistance of fund counsel and Independent Trustees' counsel and through the exercise of its business judgment, that the renewal of the Advisory Contracts was in the best interests of the fund and its shareholders and that the compensation payable under the Advisory Contracts was fair and reasonable. The Board's decision to renew the Advisory Contracts was not based on any single factor, but rather was based on a comprehensive consideration of all the information provided to the Board at its meetings throughout the year. The Board, in reaching its determination to renew the Advisory Contracts, was aware that shareholders in the fund have a broad range of investment choices available to them, including a wide choice among mutual funds offered by Fidelity's competitors, and that the fund's shareholders, who have the opportunity to review and weigh the disclosure provided by the fund in its prospectus and other public disclosures, have chosen to invest in this fund, which is a part of the Fidelity family of funds.
Annual Report
Nature, Extent, and Quality of Services Provided. The Board considered the staffing within the investment adviser, Fidelity Management & Research Company (FMR), and the sub-advisers (together, the Investment Advisers) as it relates to the fund, including the backgrounds of the fund's investment personnel, and also considered the fund's investment objective, strategies, and related investment philosophy. The Independent Trustees also had discussions with senior management of Fidelity's investment operations and investment groups. The Board considered the structure of the portfolio manager compensation program and whether this structure provides appropriate incentives to act in the best interests of the fund.
Resources Dedicated to Investment Management and Support Services. The Board and the Fund Oversight and Research Committees reviewed the general qualifications and capabilities of the Investment Advisers' investment staff, including its size, education, experience, and resources, as well as the Investment Advisers' approach to recruiting, training, managing, and compensating investment personnel. The Board noted that FMR has continued to increase the resources devoted to non-U.S. offices, including expansion of Fidelity's global investment organization. The Board also noted that Fidelity's analysts have extensive resources, tools and capabilities that allow them to conduct sophisticated quantitative and fundamental analysis, as well as credit analysis of issuers, counterparties and guarantors. Further, the Board believes that Fidelity's investment professionals have sufficient access to global information and data so as to provide competitive investment results over time, and that those professionals also have access to sophisticated tools that permit them to assess portfolio construction and risk and performance attribution characteristics continuously, as well as to transmit new information and research conclusions rapidly around the world. Additionally, in its deliberations, the Board considered the Investment Advisers' trading and risk management capabilities and resources, which are an integral part of the investment management process.
Shareholder and Administrative Services. The Board considered (i) the nature, extent, quality, and cost of advisory, administrative, and shareholder services performed by the Investment Advisers and their affiliates under the Advisory Contracts and under separate agreements covering transfer agency, pricing and bookkeeping, and securities lending services for the fund; (ii) the nature and extent of the supervision of third party service providers, principally custodians and subcustodians; and (iii) the resources devoted to, and the record of compliance with, the fund's compliance policies and procedures. The Board also reviewed the allocation of fund brokerage, including allocations to brokers affiliated with the Investment Advisers, the use of brokerage commissions to pay fund expenses, and the use of "soft" commission dollars to pay for research services.
Annual Report
Board Approval of Investment Advisory Contracts and
Management Fees - continued
The Board noted that the growth of fund assets over time across the complex allows Fidelity to reinvest in the development of services designed to enhance the value or convenience of the Fidelity funds as investment vehicles. These services include 24-hour access to account information and market information through telephone representatives and over the Internet, investor education materials and asset allocation tools, and the expanded availability of Fidelity Investor Centers.
Investment in a Large Fund Family. The Board considered the benefits to shareholders of investing in a Fidelity fund, including the benefits of investing in a fund that is part of a large family of funds offering a variety of investment disciplines and providing a large variety of mutual fund investor services. The Board noted that Fidelity had taken, or had made recommendations that resulted in the Fidelity funds taking, a number of actions over the previous year that benefited particular funds, including (i) continuing to dedicate additional resources to investment research and to the support of the senior management team that oversees asset management; (ii) persisting in efforts to enhance Fidelity's global research capabilities; (iii) launching new funds and making other enhancements to meet client needs for global and income-oriented solutions; (iv) continuing to launch dedicated lower cost underlying funds to meet portfolio construction needs related to expanding underlying fund options for Fidelity funds of funds, specifically for the Freedom Fund product lines; (v) rationalizing product lines and gaining increased efficiencies through the mergers of several funds into other funds; (vi) strengthening Fidelity's index fund offerings by reducing investment minimums and adopting or lowering existing expense caps for certain funds and classes; (vii) enhancing Global Asset Allocation product offerings by launching new funds and strategies, including "open architecture" target date funds that utilize affiliated and unaffiliated sub-advisers; (viii) modifying the eligibility criteria for Institutional Class shares of Advisor funds to increase their marketability to a portion of the defined contribution plan market; (ix) creating a new low-cost retirement share class for certain Advisor funds to appeal to large retirement plans; (x) transitioning the management of certain Fidelity commodity funds to Geode Capital Management LLC, a registered commodity pool operator, while retaining administrative responsibilities for the funds; (xi) reorganizing a number of funds; and (xii) taking steps toward establishing a new Fidelity adviser to manage sector-based funds and products.
Investment Performance. The Board considered whether the fund has operated in accordance with its investment objective, as well as its record of compliance with its investment restrictions and its performance history.
The Board took into account discussions with the Investment Advisers about fund investment performance that occur at Board meetings throughout the year. In this regard the Board noted that as part of regularly scheduled fund reviews and other reports to the Board on fund performance, the Board periodically considers annualized return information for the fund, for different time periods, measured against a securities market index ("benchmark index") and a peer group of mutual funds with similar objectives ("peer group"). In its evaluation of fund investment performance, the Board gave particular attention to information indicating changes in performance of certain Fidelity funds for specific time periods and the Investment Advisers' explanations for any overperformance or underperformance.
Annual Report
In addition to reviewing absolute and relative fund performance, the Independent Trustees periodically consider the appropriateness of fund performance metrics in evaluating the results achieved. In general, the Independent Trustees believe that fund performance should be evaluated based on net performance (after fees and expenses) of both the highest performing and lowest performing classes, where applicable, compared to appropriate benchmark indices, over appropriate time periods which may include full market cycles, and compared to peer groups, as applicable, over the same periods, taking into account relevant factors including the following: general market conditions; issuer-specific information; tactical opportunities for investment; and fund cash flows and other factors.
The Independent Trustees recognize that shareholders evaluate performance on a net basis over their own holding periods, for which one-, three-, and five-year periods are used as a proxy. For this reason, the performance information reviewed by the Board also included net cumulative calendar year total return information for the fund and an appropriate benchmark index for the most recent one-year period, as shown below. Returns are shown compared to the 25th percentile (top of box) and 75th percentile (bottom of box) of the peer universe.
Annual Report
Board Approval of Investment Advisory Contracts and
Management Fees - continued
Fidelity Series Real Estate Equity Fund
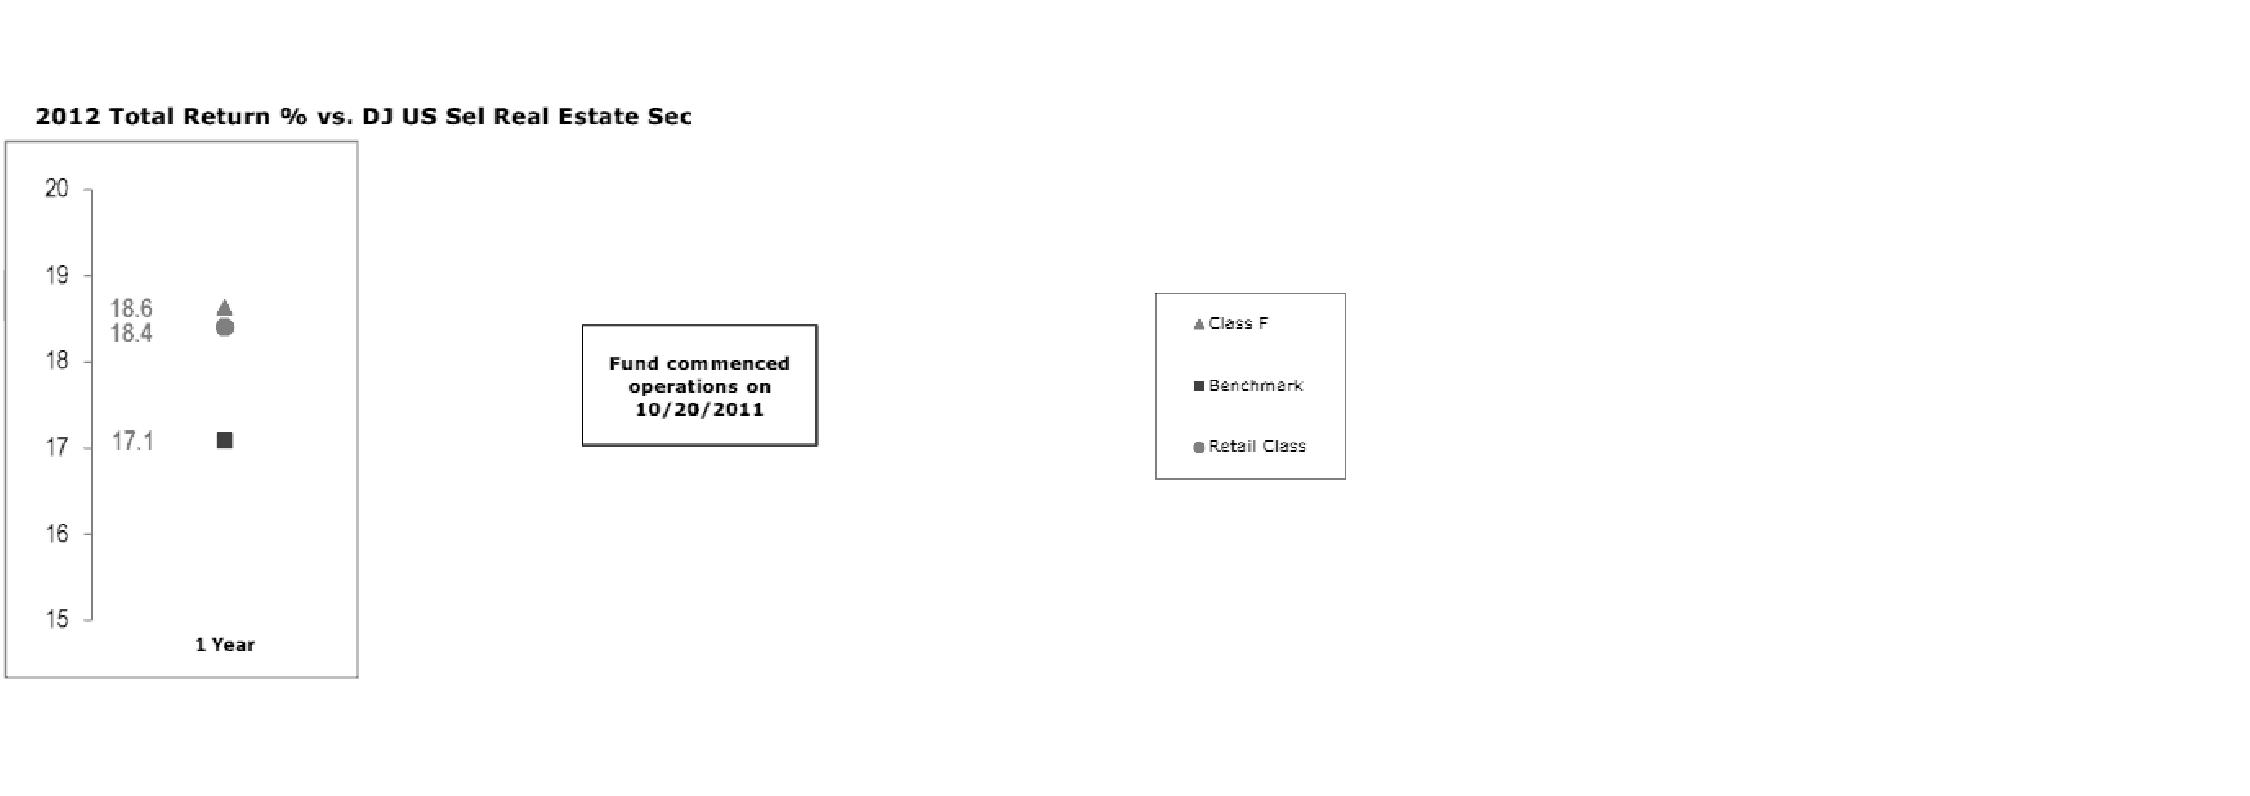
Based on its review, the Board concluded that the nature, extent, and quality of services provided to the fund under the Advisory Contracts should benefit the fund's shareholders.
Competitiveness of Management Fee and Total Expense Ratio. The Board considered the fund's management fee and total expense ratio compared to "mapped groups" of competitive funds and classes. Fidelity creates "mapped groups" by combining similar Lipper investment objective categories that have comparable management fee characteristics. Combining Lipper investment objective categories aids the Board's management fee and total expense ratio comparisons by broadening the competitive group used for comparison and by reducing the number of universes to which various Fidelity funds are compared.
Management Fee. The Board considered two proprietary management fee comparisons for the 12-month (or shorter) periods shown in the chart below. The group of Lipper funds used by the Board for management fee comparisons is referred to below as the "Total Mapped Group." The Total Mapped Group comparison focuses on a fund's standing in terms of gross management fees before expense reimbursements or caps relative to the total universe of funds with comparable investment mandates, regardless of whether their management fee structures also are comparable. Funds with comparable investment mandates offer exposure to similar types of securities. Funds with comparable management fee structures have similar management fee contractual arrangements (e.g., flat rate charged for advisory services, all-inclusive fee rate, etc.). "TMG %" represents the percentage of funds in the Total Mapped Group that had management fees that were lower than the fund's. For example, a TMG % of 7% means that 93% of the funds in the Total Mapped Group had higher management fees than the fund. The "Asset-Size Peer Group" (ASPG) comparison focuses on a fund's standing relative to a subset of non-Fidelity funds within the Total Mapped Group that are similar in size and management fee structure. The ASPG represents at least 15% of the funds in the Total Mapped Group with comparable asset size and management fee structures, subject to a minimum of 50 funds (or all funds in the Total Mapped Group if fewer than 50). Additional information, such as the ASPG quartile in which the fund's management fee ranked, is also included in the chart and considered by the Board.
Annual Report
Fidelity Series Real Estate Equity Fund
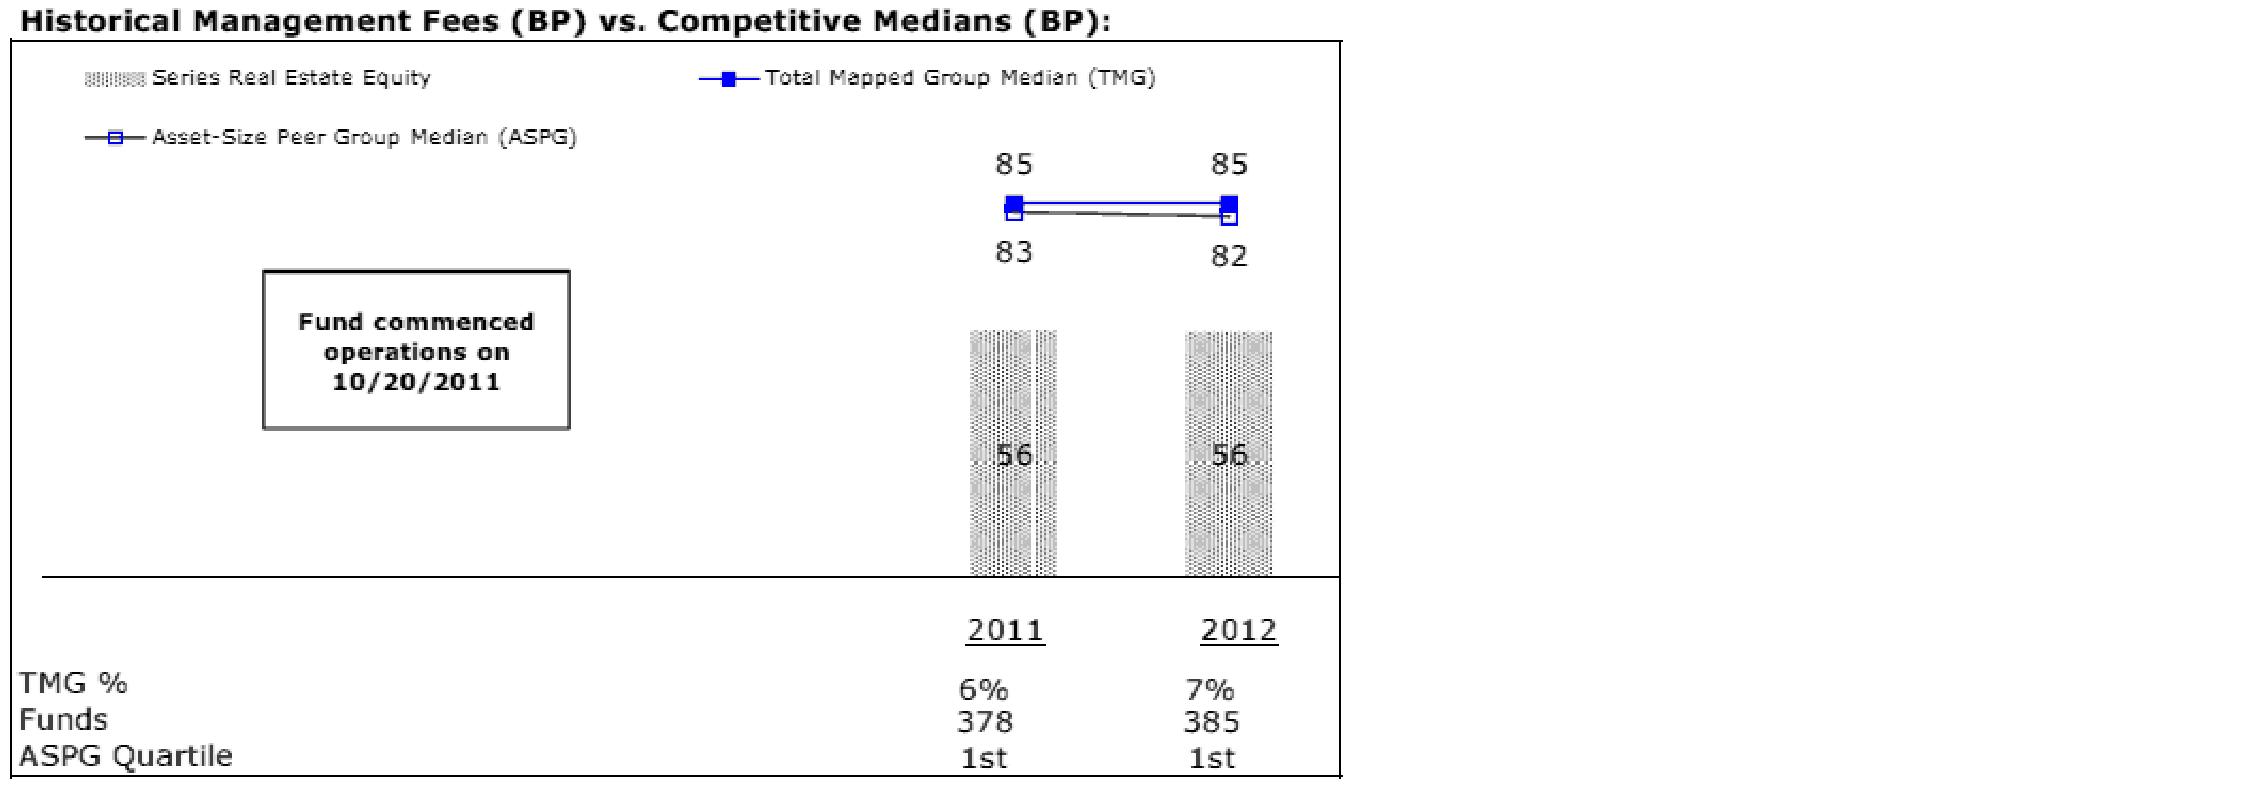
The Board noted that the fund's management fee ranked below the median of its Total Mapped Group and below the median of its ASPG for 2012.
Based on its review, the Board concluded that the fund's management fee is fair and reasonable in light of the services that the fund receives and the other factors considered.
Total Expense Ratio. In its review of each class's total expense ratio, the Board considered the fund's management fee as well as other fund or class expenses, as applicable, such as transfer agent fees, pricing and bookkeeping fees, and custodial, legal, and audit fees. The Board also noted the effects of any waivers and reimbursements on fees and expenses. As part of its review, the Board also considered the current and historical total expense ratios of each class of the fund compared to competitive fund median expenses. Each class of the fund is compared to those funds and classes in the Total Mapped Group (used by the Board for management fee comparisons) that have a similar sales load structure.
Annual Report
Board Approval of Investment Advisory Contracts and
Management Fees - continued
The Board noted that the total expense ratio of each class ranked below its competitive median for 2012.
Fees Charged to Other Fidelity Clients. The Board also considered Fidelity fee structures and other information with respect to clients of FMR and its affiliates, such as other mutual funds advised or subadvised by FMR or its affiliates, pension plan clients, and other institutional clients. The Board noted the findings of the 2013 ad hoc joint committee (created with the board of other Fidelity funds), which reviewed and compared Fidelity's institutional investment advisory business with its business of providing services to the Fidelity funds, including the differences in services provided, fees charged, and costs incurred, as well as competition in their respective marketplaces.
Based on its review of total expense ratios and fees charged to other Fidelity clients, the Board concluded that the total expense ratio of each class of the fund was reasonable in light of the services that the fund and its shareholders receive and the other factors considered.
Costs of the Services and Profitability. The Board considered the revenues earned and the expenses incurred by Fidelity in conducting the business of developing, marketing, distributing, managing, administering and servicing the fund and servicing the fund's shareholders. The Board also considered the level of Fidelity's profits in respect of all the Fidelity funds.
On an annual basis, FMR presents to the Board Fidelity's profitability for the fund. Fidelity calculates the profitability for each fund, as well as aggregate profitability for groups of Fidelity funds and all Fidelity funds, using a series of detailed revenue and cost allocation methodologies which originate with the books and records of Fidelity on which Fidelity's audited financial statements are based. The Audit Committee of the Board reviews any significant changes from the prior year's methodologies.
PricewaterhouseCoopers LLP (PwC), independent registered public accounting firm and auditor to Fidelity and certain Fidelity funds, has been engaged annually by the Board as part of the Board's assessment of Fidelity's profitability analysis. PwC's engagement includes the review and assessment of the methodologies used by Fidelity in determining the revenues and expenses attributable to Fidelity's mutual fund business, and completion of agreed-upon procedures surrounding the mathematical accuracy of fund profitability and its conformity to allocation methodologies. After considering PwC's reports issued under the engagement and information provided by Fidelity, the Board concluded that while other allocation methods may also be reasonable, Fidelity's profitability methodologies are reasonable in all material respects.
Annual Report
The Board also reviewed Fidelity's non-fund businesses and fall-out benefits related to the mutual fund business as well as cases where Fidelity's affiliates may benefit from or be related to the fund's business.
The Board considered the costs of the services provided by and the profits realized by Fidelity in connection with the operation of the fund and was satisfied that the profitability was not excessive in the circumstances.
Economies of Scale. The Board considered whether there have been economies of scale in respect of the management of the Fidelity funds, whether the Fidelity funds (including the fund) have appropriately benefited from any such economies of scale, and whether there is potential for realization of any further economies of scale. The Board considered the extent to which the fund will benefit from economies of scale through increased services to the fund, through waivers or reimbursements, or through fee or expense reductions. The Board also noted that in 2009, it and the board of other Fidelity funds created an ad hoc committee (the Economies of Scale Committee) to analyze whether FMR attains economies of scale in respect of the management and servicing of the Fidelity funds, whether the Fidelity funds have appropriately benefited from such economies of scale, and whether there is potential for realization of any further economies of scale.
The Board recognized that the fund's management contract incorporates a "group fee" structure, which provides for lower group fee rates as total fund assets under FMR's management increase, and for higher group fee rates as total fund assets under FMR's management decrease. FMR calculates the group fee rates based on a tiered asset "breakpoint" schedule that varies based on asset class. The Board considered that the group fee is designed to deliver the benefits of economies of scale to fund shareholders when total Fidelity fund assets increase, even if assets of any particular fund are unchanged or have declined, because some portion of Fidelity's costs are attributable to services provided to all Fidelity funds, and all funds benefit if those costs can be allocated among more assets. The Board also considered that although the fund is offered only to other funds advised by FMR or an affiliate, it continues to incur investment management expenses. The Board further noted that the fund may continue to realize benefits from the group fee structure, even though assets may not be expected to grow significantly at the fund level. The Board concluded that, given the group fee structure, fund shareholders will benefit from lower management fees as assets under FMR's management increase at the fund complex level, regardless of whether Fidelity achieves any such economies of scale.
The Board concluded, taking into account the analysis of the Economies of Scale Committee, that economies of scale, if any, are being appropriately shared between fund shareholders and Fidelity.
Annual Report
Board Approval of Investment Advisory Contracts and
Management Fees - continued
Amendment to Description of Group Fee Rate. At its July 2013 meeting, the Board voted to approve an amendment to the fund's management contract to modify the description of the "group fee rate" effective August 1, 2013. The Board noted that under the prior description in the contract, the group fee rate was based on the average net assets of all registered investment companies with which FMR has management contracts. Under the contract's tiered asset breakpoint schedule, the group fee rate is lower as total fund assets under FMR's management increase, and higher as total fund assets under FMR's management decrease. The Board considered that the prior description would have excluded the assets of 64 Fidelity sector funds from the group fee rate calculation once Fidelity SelectCo, LLC, an affiliate of FMR, assumed management responsibilities for those funds. The Board noted that modifying the description of the group fee rate to continue to include the assets of those 64 funds for purposes of determining group fee rate breakpoints would avoid an immediate adverse impact on the group fee rate for any fund.
Additional Information Requested by the Board. In order to develop fully the factual basis for consideration of the Fidelity funds' Advisory Contracts, the Board requested and received additional information on certain topics, including: (i) fund performance trends and Fidelity's long-term strategies for certain funds; (ii) the potential to further rationalize the Fidelity fund lineup with the possibility of achieving savings for the funds and Fidelity; (iii) the methodology with respect to competitive fund data and peer group classifications; (iv) the arrangements with, and performance of, certain sub-advisers on behalf of the Fidelity funds, as well as certain proposed participating affiliate arrangements; (v) the realization of fall-out benefits in certain Fidelity business units; (vi) Fidelity's group fee structures, including the rationale for the individual fee rates of certain categories of funds and the definition of group assets; (vii) trends regarding industry use of performance fee structures and the performance adjustment methodologies applicable to the Fidelity funds; (viii) additional competitive analysis regarding the total expenses for certain classes; and (ix) fund profitability methodology, including Fidelity's cost allocation methodology, and the impact of certain factors on fund profitability results.
Based on its evaluation of all of the conclusions noted above, and after considering all factors it believed relevant, the Board ultimately concluded that the advisory fee structures are fair and reasonable, and that the fund's Advisory Contracts should be renewed.
Annual Report
Investment Adviser
Fidelity Management & Research Company
Boston, MA
Investment Sub-Advisers
FMR Co., Inc.
Fidelity Management & Research (U.K.) Inc.
Fidelity Management & Research
(Hong Kong) Limited
Fidelity Management & Research
(Japan) Inc.
General Distributor
Fidelity Distributors Corporation
Smithfield, RI
Transfer and Service Agents
Fidelity Investments Institutional Operations Company, Inc.
Boston, MA
Fidelity Service Company, Inc.
Boston, MA
Custodian
State Street Bank and Trust Company
Quincy, MA
(Fidelity Investment logo)(registered trademark)
Corporate Headquarters
245 Summer St., Boston, MA 02210
www.fidelity.com
SLE-ANN-0913
1.930453.101
Fidelity®
Series Small Cap Opportunities
Fund
Fidelity Series Small Cap Opportunities Fund
Class F
Annual Report
July 31, 2013
(Fidelity Cover Art)
Contents
Performance | (Click Here) | How the fund has done over time. |
Management's Discussion of Fund Performance | (Click Here) | The Portfolio Managers' review of fund performance and strategy. |
Shareholder Expense Example | (Click Here) | An example of shareholder expenses. |
Investment Changes | (Click Here) | A summary of major shifts in the fund's investments over the past six months. |
Investments | (Click Here) | A complete list of the fund's investments with their market values. |
Financial Statements | (Click Here) | Statements of assets and liabilities, operations, and changes in net assets, as well as financial highlights. |
Notes | (Click Here) | Notes to the financial statements. |
Report of Independent Registered Public Accounting Firm | (Click Here) | |
Trustees and Officers | (Click Here) | |
Distributions | (Click Here) | |
Board Approval of Investment Advisory Contracts and Management Fees | (Click Here) | |
To view a fund's proxy voting guidelines and proxy voting record for the 12-month period ended June 30, visit http://www.fidelity.com/proxyvotingresults or visit the Securities and Exchange Commission's (SEC) web site at http://www.sec.gov. You may also call 1-800-544-8544 for Fidelity® Series Small Cap Opportunities Fund or 1-800-835-5092 for Class F of the fund to request a free copy of the proxy voting guidelines.
Standard & Poor's, S&P and S&P 500 are registered service marks of The McGraw-Hill Companies, Inc. and have been licensed for use by Fidelity Distributors Corporation.
Other third-party marks appearing herein are the property of their respective owners.
All other marks appearing herein are registered or unregistered trademarks or service marks of FMR LLC or an affiliated company. © 2013 FMR LLC. All rights reserved.
Annual Report
This report and the financial statements contained herein are submitted for the general information of the shareholders of the fund. This report is not authorized for distribution to prospective investors in the fund unless preceded or accompanied by an effective prospectus.
A fund files its complete schedule of portfolio holdings with the SEC for the first and third quarters of each fiscal year on Form N-Q. Forms N-Q are available on the SEC's web site at http://www.sec.gov. A fund's Forms N-Q may be reviewed and copied at the SEC's Public Reference Room in Washington, DC. Information regarding the operation of the SEC's Public Reference Room may be obtained by calling 1-800-SEC-0330. For a complete list of a fund's portfolio holdings, view the most recent holdings listing, semiannual report, or annual report on Fidelity's web site at http://www.fidelity.com, http://www.advisor.fidelity.com, or http://www.401k.com, as applicable.
NOT FDIC INSURED • MAY LOSE VALUE • NO BANK GUARANTEE
Neither the fund nor Fidelity Distributors Corporation is a bank.
Annual Report
Average annual total return reflects the change in the value of an investment, assuming reinvestment of the class' distributions from dividend income and capital gains (the profits earned upon the sale of securities that have grown in value, if any) and assuming a constant rate of performance each year. The $10,000 table and the fund's returns do not reflect the deduction of taxes that a shareholder would pay on fund distributions or the redemption of fund shares. During periods of reimbursement by Fidelity, a fund's total return will be greater than it would be had the reimbursement not occurred. How a fund did yesterday is no guarantee of how it will do tomorrow.
Average Annual Total Returns
Periods ended July 31, 2013 | Past 1
year | Past 5
years | Life of
fund A |
Fidelity ® Series Small Cap Opportunities Fund | 30.91% | 12.91% | 6.22% |
Class F B | 31.09% | 13.10% | 6.36% |
A From March 22, 2007.
B The initial offering of Class F shares took place on June 26, 2009. Returns prior to June 26, 2009 are those of Fidelity Series Small Cap Opportunities Fund, the original class of the fund.
$10,000 Over Life of Fund
Let's say hypothetically that $10,000 was invested in Fidelity Series Small Cap Opportunities Fund, a class of the fund, on March 22, 2007, when the fund started. The chart shows how the value of your investment would have changed, and also shows how the Russell 2000® Index performed over the same period.
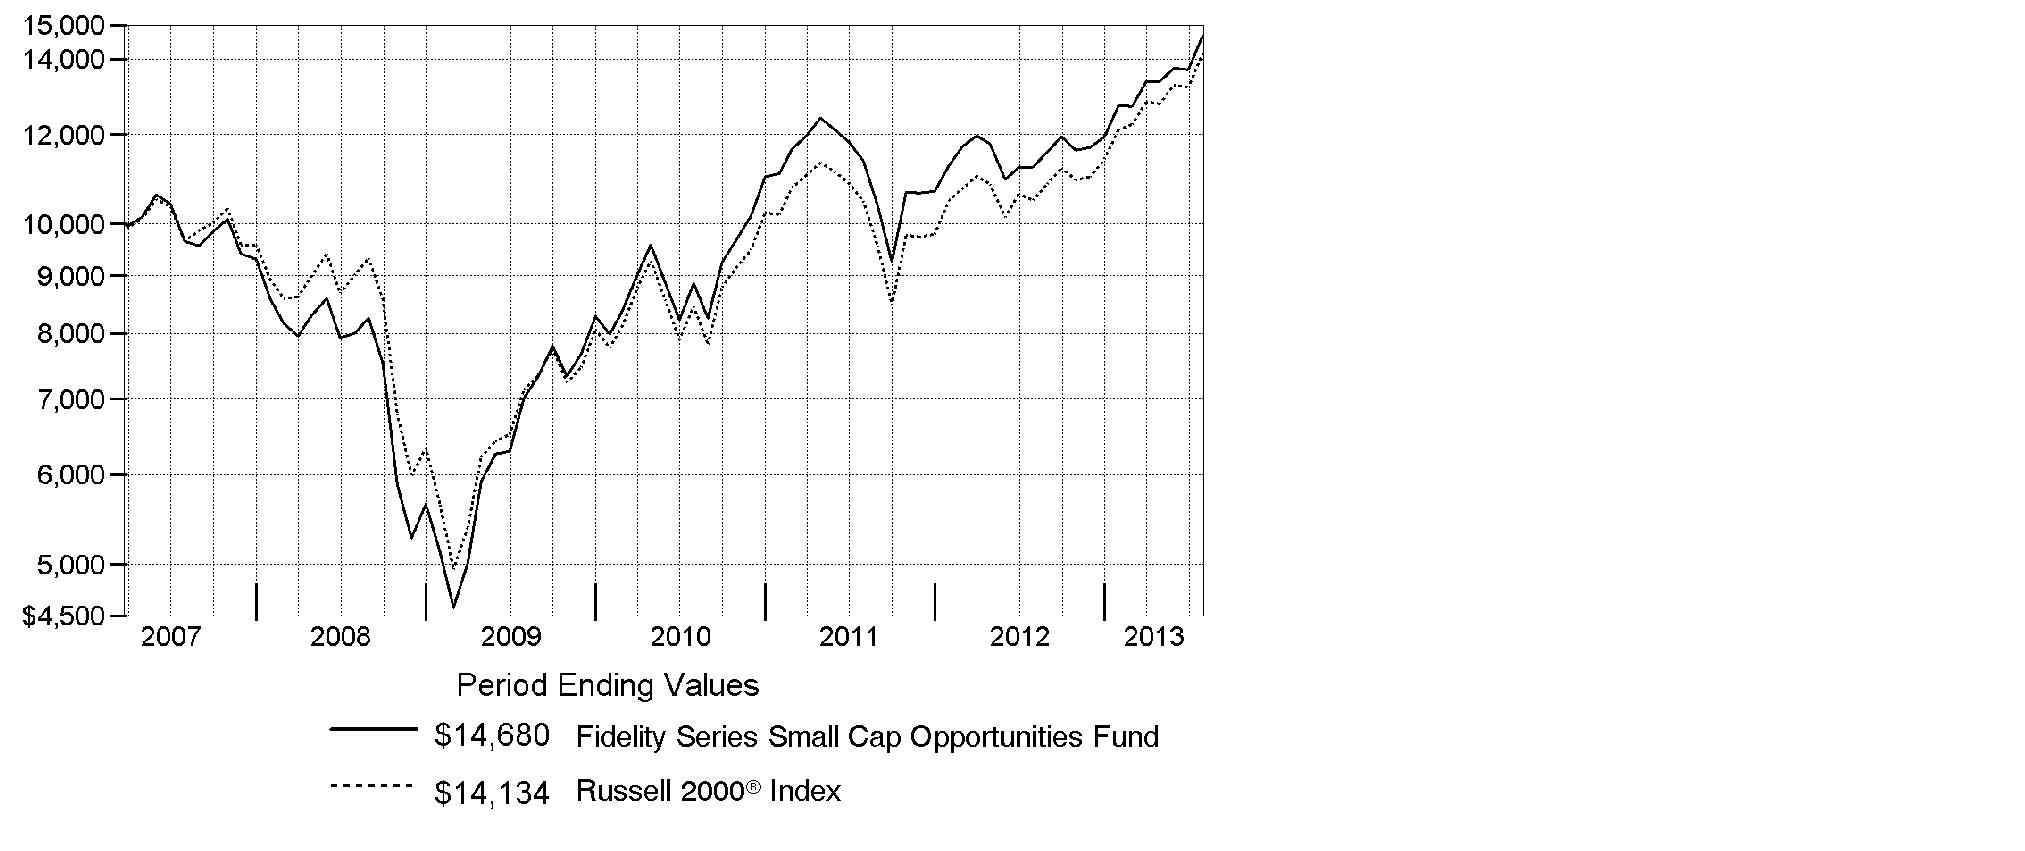
Annual Report
Market Recap: The bull run in U.S. stocks comfortably settled into a fifth year, as major equity benchmarks ripped through records during the 12 months ending July 31, 2013. Gains were fueled by a generally improving global economy and accommodative monetary policies worldwide. The tone was positive for most of the year, based largely on stronger U.S. economic data, including employment, housing and consumer sentiment. Setting a series of new highs along the way, the broad-based S&P 500® Index rose an impressive 25.00% for the 12 months, while the blue-chip-laden Dow Jones Industrial AverageSM also moved into record territory en route to a 22.36% gain. The growth-oriented Nasdaq Composite Index® had a similarly strong run, advancing 25.15%. During the year, markets were resilient amid intermittent volatility over debt woes in Europe, the 2012 U.S. presidential election and year-end Congressional gridlock over the federal budget. In mid-to-late June, concern arose about the U.S. Federal Reserve possibly tapering its sustaining bond-buying strategy - which prompted a brief, but steep, market sell-off. However, investors' continued quest for yield and the Fed's pledge to keep buying bonds until the economy showed significant improvement overpowered the uncertainty and helped equities climb notably higher in July to close the period on a strong note.
Comments from Richard Thompson, who became Lead Portfolio Manager of Fidelity® Series Small Cap Opportunities Fund on January 1, 2013, and Anmol Mehra, one of the fund's Co-Portfolio Managers: For the year, the fund's Series Small Cap Opportunities and Class F shares returned 30.91% and 31.09%, respectively, lagging the 34.76% gain of the Russell 2000® Index. Despite the relative underperformance this period, we remain confident that the fund's multi-manager approach and its emphasis on security selection with sector neutrality can support our goal of delivering consistent risk-adjusted returns over the long term. Versus the index, the fund's average cash stake of 3% took a big toll amid a strong market. Our largest individual detractor was a non-index stake in voice-activation software firm Nuance Communications, whose shares plummeted on weak financial results. It also was a miss to hold even a scant stake in Wall Street market maker Knight Capital Group, since a major glitch in the firm's software caused enormous trading losses and its stock to plummet. We felt this was a sign of poor risk management on the company's part and sold the stock. On the plus side, specialty furniture and electronics retailer Conn's helped, as the firm's shares climbed on strong sales and upbeat earnings guidance. We also found success with an out-of-benchmark position in wireless service provider Clearwire. Its shares were riding high after two competitive acquisition bids emerged early in the period, and we sold the stock in January to lock in profits.
The views expressed above reflect those of the portfolio manager(s) only through the end of the period as stated on the cover of this report and do not necessarily represent the views of Fidelity or any other person in the Fidelity organization. Any such views are subject to change at any time based upon market or other conditions and Fidelity disclaims any responsibility to update such views. These views may not be relied on as investment advice and, because investment decisions for a Fidelity fund are based on numerous factors, may not be relied on as an indication of trading intent on behalf of any Fidelity fund.
Annual Report
Shareholder Expense Example
As a shareholder of the Fund, you incur two types of costs: (1) transaction costs, and (2) ongoing costs, including management fees and other Fund expenses. This Example is intended to help you understand your ongoing costs (in dollars) of investing in the Fund and to compare these costs with the ongoing costs of investing in other mutual funds.
The Example is based on an investment of $1,000 invested at the beginning of the period and held for the entire period (February 1, 2013 to July 31, 2013).
Actual Expenses
The first line of the accompanying table for each class of the Fund provides information about actual account values and actual expenses. You may use the information in this line, together with the amount you invested, to estimate the expenses that you paid over the period. Simply divide your account value by $1,000.00 (for example, an $8,600 account value divided by $1,000.00 = 8.6), then multiply the result by the number in the first line for a class of the Fund under the heading entitled "Expenses Paid During Period" to estimate the expenses you paid on your account during this period. In addition, the Fund, as a shareholder in the underlying Fidelity Central Funds, will indirectly bear its pro-rata share of the fees and expenses incurred by the underlying Fidelity Central Funds. These fees and expenses are not included in the Fund's annualized expense ratio used to calculate the expense estimate in the table below.
Hypothetical Example for Comparison Purposes
The second line of the accompanying table for each class of the Fund provides information about hypothetical account values and hypothetical expenses based on a Class' actual expense ratio and an assumed rate of return of 5% per year before expenses, which is not the Class' actual return. The hypothetical account values and expenses may not be used to estimate the actual ending account balance or expenses you paid for the period. You may use this information to compare the ongoing costs of investing in the Fund and other funds. To do so, compare this 5% hypothetical example with the 5% hypothetical examples that appear in the shareholder reports of the other funds. In addition, the Fund, as a shareholder in the underlying Fidelity Central Funds, will indirectly bear its pro-rata share of the fees and expenses incurred by the underlying Fidelity Central Funds. These fees and expenses are not included in the Fund's annualized expense ratio used to calculate the expense estimate in the table below.
Please note that the expenses shown in the table are meant to highlight your ongoing costs only and do not reflect any transaction costs. Therefore, the second line of the table is useful in comparing ongoing costs only, and will not help you determine the relative total costs of owning different funds.
Annual Report
| Annualized
Expense Ratio B | Beginning
Account Value
February 1, 2013 | Ending
Account Value
July 31, 2013 | Expenses Paid
During Period*
February 1, 2013
to July 31, 2013 |
Series Small Cap Opportunities | .93% | | | |
Actual | | $ 1,000.00 | $ 1,154.20 | $ 4.97 |
HypotheticalA | | $ 1,000.00 | $ 1,020.18 | $ 4.66 |
Class F | .75% | | | |
Actual | | $ 1,000.00 | $ 1,154.20 | $ 4.01 |
HypotheticalA | | $ 1,000.00 | $ 1,021.08 | $ 3.76 |
A 5% return per year before expenses
B Annualized expense ratio reflects expenses net of applicable fee waivers.
* Expenses are equal to each Class' annualized expense ratio, multiplied by the average account value over the period, multiplied by 181/365 (to reflect the one-half year period).
Annual Report
Investment Changes (Unaudited)
Top Ten Stocks as of July 31, 2013 |
| % of fund's
net assets | % of fund's net assets
6 months ago |
PacWest Bancorp | 1.2 | 1.1 |
Banner Bank | 1.0 | 0.0 |
Waddell & Reed Financial, Inc. Class A | 1.0 | 1.0 |
MB Financial, Inc. | 1.0 | 0.7 |
Associated Banc-Corp. | 1.0 | 0.9 |
Conn's, Inc. | 1.0 | 0.7 |
Pennsylvania Real Estate Investment Trust (SBI) | 1.0 | 0.0 |
City National Corp. | 1.0 | 0.9 |
Allied World Assurance Co. Holdings Ltd. | 0.9 | 1.0 |
Fifth & Pacific Companies, Inc. | 0.9 | 0.0 |
| 10.0 | |
Top Five Market Sectors as of July 31, 2013 |
| % of fund's
net assets | % of fund's net assets
6 months ago |
Financials | 22.3 | 21.5 |
Information Technology | 18.1 | 18.1 |
Industrials | 14.1 | 14.7 |
Consumer Discretionary | 13.9 | 13.6 |
Health Care | 11.7 | 10.6 |
Asset Allocation (% of fund's net assets) |
As of July 31, 2013* | As of January 31, 2013** |
 | Stocks and
Equity Futures 97.7% | | | Stocks and
Equity Futures 96.9% | |
 | Convertible
Securities 0.0% | |  | Convertible
Securities 0.1% | |
 | Short-Term
Investments and
Net Other Assets
(Liabilities) 2.3% | | | Short-Term
Investments and
Net Other Assets
(Liabilities) 3.0% | |
* Foreign investments | 6.6% | | ** Foreign investments | 6.7% | |

Annual Report
Investments July 31, 2013
Showing Percentage of Net Assets
Common Stocks - 97.4% |
| Shares | | Value |
CONSUMER DISCRETIONARY - 13.9% |
Auto Components - 1.4% |
Dorman Products, Inc. | 401,649 | | $ 18,909,635 |
Tenneco, Inc. (a) | 437,486 | | 21,143,698 |
| | 40,053,333 |
Hotels, Restaurants & Leisure - 2.1% |
Del Frisco's Restaurant Group, Inc. (a) | 761,336 | | 16,018,509 |
Interval Leisure Group, Inc. | 965,192 | | 20,761,280 |
Life Time Fitness, Inc. (a) | 466,599 | | 24,865,061 |
| | 61,644,850 |
Household Durables - 0.6% |
KB Home (d) | 919,119 | | 16,314,362 |
Internet & Catalog Retail - 0.7% |
HSN, Inc. | 364,307 | | 21,880,278 |
Leisure Equipment & Products - 0.7% |
Brunswick Corp. | 559,990 | | 21,139,623 |
Media - 1.0% |
MDC Partners, Inc. Class A (sub. vtg.) | 653,000 | | 16,070,329 |
Nexstar Broadcasting Group, Inc. Class A | 345,407 | | 12,448,468 |
| | 28,518,797 |
Multiline Retail - 0.1% |
Dollarama, Inc. | 61,666 | | 4,450,687 |
Specialty Retail - 4.9% |
Ascena Retail Group, Inc. (a) | 956,845 | | 18,266,171 |
Conn's, Inc. (a)(d) | 451,873 | | 29,200,033 |
DSW, Inc. Class A | 103,154 | | 7,818,042 |
Francescas Holdings Corp. (a)(d) | 976,835 | | 24,284,118 |
GameStop Corp. Class A | 327,100 | | 16,047,526 |
Genesco, Inc. (a) | 359,125 | | 25,275,218 |
Rent-A-Center, Inc. | 576,319 | | 23,046,997 |
| | 143,938,105 |
Textiles, Apparel & Luxury Goods - 2.4% |
Fifth & Pacific Companies, Inc. (a) | 1,115,508 | | 26,571,401 |
Hanesbrands, Inc. | 312,948 | | 19,859,680 |
Steven Madden Ltd. (a) | 504,953 | | 25,964,683 |
| | 72,395,764 |
TOTAL CONSUMER DISCRETIONARY | | 410,335,799 |
Common Stocks - continued |
| Shares | | Value |
CONSUMER STAPLES - 3.5% |
Beverages - 0.2% |
Cott Corp. | 808,400 | | $ 6,760,935 |
Food & Staples Retailing - 1.7% |
Fresh Market, Inc. (a) | 231,422 | | 12,214,453 |
Susser Holdings Corp. (a) | 307,970 | | 15,928,208 |
United Natural Foods, Inc. (a) | 369,955 | | 21,679,363 |
| | 49,822,024 |
Food Products - 1.6% |
Calavo Growers, Inc. (d) | 461,226 | | 12,526,898 |
Fresh Del Monte Produce, Inc. | 596,113 | | 16,744,814 |
Post Holdings, Inc. (a) | 72,605 | | 3,368,146 |
WhiteWave Foods Co. (d) | 734,200 | | 13,722,198 |
| | 46,362,056 |
TOTAL CONSUMER STAPLES | | 102,945,015 |
ENERGY - 5.7% |
Energy Equipment & Services - 1.0% |
Atwood Oceanics, Inc. (a) | 302,500 | | 17,042,850 |
Total Energy Services, Inc. | 761,850 | | 11,296,831 |
| | 28,339,681 |
Oil, Gas & Consumable Fuels - 4.7% |
Atlas Pipeline Partners LP | 495,615 | | 18,783,809 |
Cloud Peak Energy, Inc. (a) | 835,000 | | 13,385,050 |
Energen Corp. | 86,138 | | 5,158,805 |
Genesis Energy LP | 168,746 | | 8,411,988 |
PDC Energy, Inc. (a) | 458,085 | | 25,263,388 |
Rosetta Resources, Inc. (a) | 563,942 | | 25,721,395 |
Stone Energy Corp. (a) | 979,312 | | 23,856,040 |
Targa Resources Corp. | 289,300 | | 19,721,581 |
| | 140,302,056 |
TOTAL ENERGY | | 168,641,737 |
FINANCIALS - 22.3% |
Capital Markets - 1.5% |
AURELIUS AG | 488,607 | | 14,622,162 |
Waddell & Reed Financial, Inc. Class A | 588,841 | | 30,066,221 |
| | 44,688,383 |
Common Stocks - continued |
| Shares | | Value |
FINANCIALS - continued |
Commercial Banks - 8.5% |
Associated Banc-Corp. | 1,770,428 | | $ 29,991,050 |
Bank of the Ozarks, Inc. | 481,987 | | 23,029,339 |
Banner Bank | 815,244 | | 30,229,248 |
BBCN Bancorp, Inc. | 1,610,410 | | 23,528,090 |
Bridge Capital Holdings (a) | 465,829 | | 7,681,520 |
Cathay General Bancorp | 846,324 | | 20,108,658 |
City National Corp. | 413,978 | | 28,783,890 |
MB Financial, Inc. | 1,043,849 | | 30,041,974 |
National Penn Bancshares, Inc. | 1,934,044 | | 20,868,335 |
PacWest Bancorp (d) | 1,038,025 | | 36,766,845 |
| | 251,028,949 |
Insurance - 3.9% |
Allied World Assurance Co. Holdings Ltd. | 281,800 | | 26,672,370 |
Amerisafe, Inc. | 685,035 | | 24,476,301 |
Aspen Insurance Holdings Ltd. | 490,400 | | 18,385,096 |
Primerica, Inc. | 584,391 | | 23,983,407 |
ProAssurance Corp. | 431,563 | | 23,101,567 |
| | 116,618,741 |
Real Estate Investment Trusts - 7.3% |
American Assets Trust, Inc. | 575,671 | | 18,651,740 |
Cousins Properties, Inc. | 2,252,320 | | 23,086,280 |
DCT Industrial Trust, Inc. | 3,300,500 | | 24,786,755 |
DuPont Fabros Technology, Inc. (d) | 781,530 | | 17,904,852 |
Glimcher Realty Trust | 1,500,359 | | 16,864,035 |
Home Properties, Inc. | 309,791 | | 19,767,764 |
National Retail Properties, Inc. (d) | 487,641 | | 17,062,559 |
Parkway Properties, Inc. | 1,268,446 | | 22,197,805 |
Pennsylvania Real Estate Investment Trust (SBI) | 1,409,602 | | 29,178,761 |
Ramco-Gershenson Properties Trust (SBI) | 1,648,250 | | 25,531,393 |
| | 215,031,944 |
Thrifts & Mortgage Finance - 1.1% |
Washington Federal, Inc. | 755,525 | | 16,432,669 |
WSFS Financial Corp. | 275,789 | | 16,417,719 |
| | 32,850,388 |
TOTAL FINANCIALS | | 660,218,405 |
Common Stocks - continued |
| Shares | | Value |
HEALTH CARE - 11.7% |
Biotechnology - 5.1% |
Achillion Pharmaceuticals, Inc. (a) | 1,054,153 | | $ 7,526,652 |
Agios Pharmaceuticals, Inc. | 22,400 | | 653,184 |
Agios Pharmaceuticals, Inc. | 128,706 | | 3,377,760 |
ARIAD Pharmaceuticals, Inc. (a) | 356,457 | | 6,622,971 |
Astex Pharmaceuticals, Inc. (a) | 1,203,358 | | 6,293,562 |
BioMarin Pharmaceutical, Inc. (a) | 100,444 | | 6,493,705 |
Bluebird Bio, Inc. | 18,500 | | 575,905 |
Coronado Biosciences, Inc. (a)(d) | 589,782 | | 4,617,993 |
Cubist Pharmaceuticals, Inc. (a) | 135,207 | | 8,427,452 |
Discovery Laboratories, Inc. (a)(d) | 2,240,998 | | 3,608,007 |
Hyperion Therapeutics, Inc. | 216,866 | | 5,432,493 |
Infinity Pharmaceuticals, Inc. (a) | 245,557 | | 5,200,897 |
Insmed, Inc. (a) | 664,002 | | 7,377,062 |
InterMune, Inc. (a) | 440,653 | | 6,834,528 |
Isis Pharmaceuticals, Inc. (a)(d) | 451,172 | | 13,016,312 |
Medivation, Inc. (a) | 117,214 | | 6,783,174 |
MEI Pharma, Inc. (a) | 774,823 | | 5,880,907 |
Merrimack Pharmaceuticals, Inc. (a)(d) | 1,128,665 | | 5,395,019 |
Neurocrine Biosciences, Inc. (a) | 649,300 | | 9,083,707 |
Novavax, Inc. (a)(d) | 2,913,791 | | 7,838,098 |
PTC Therapeutics, Inc. (a)(d) | 363,600 | | 5,693,976 |
Synageva BioPharma Corp. (a) | 161,013 | | 7,744,725 |
Theravance, Inc. (a) | 181,549 | | 7,000,529 |
Threshold Pharmaceuticals, Inc. (a) | 390,086 | | 2,114,266 |
XOMA Corp. (a) | 1,469,611 | | 7,979,988 |
| | 151,572,872 |
Health Care Equipment & Supplies - 2.3% |
Align Technology, Inc. (a) | 332,239 | | 14,299,567 |
Cerus Corp. (a)(d) | 2,564,040 | | 14,358,624 |
ICU Medical, Inc. (a) | 110,488 | | 7,920,885 |
Sirona Dental Systems, Inc. (a) | 80,457 | | 5,680,264 |
Steris Corp. | 392,557 | | 17,672,916 |
Teleflex, Inc. | 93,382 | | 7,417,332 |
| | 67,349,588 |
Health Care Providers & Services - 2.2% |
BioScrip, Inc. (a) | 824,016 | | 13,390,260 |
Brookdale Senior Living, Inc. (a) | 370,195 | | 10,780,078 |
MEDNAX, Inc. (a) | 80,145 | | 7,807,726 |
Common Stocks - continued |
| Shares | | Value |
HEALTH CARE - continued |
Health Care Providers & Services - continued |
Molina Healthcare, Inc. (a) | 478,567 | | $ 17,764,407 |
Team Health Holdings, Inc. (a) | 390,401 | | 15,701,928 |
| | 65,444,399 |
Health Care Technology - 0.6% |
HMS Holdings Corp. (a) | 198,300 | | 4,796,877 |
Medidata Solutions, Inc. (a) | 132,002 | | 12,214,145 |
| | 17,011,022 |
Life Sciences Tools & Services - 0.9% |
Bruker BioSciences Corp. (a) | 865,744 | | 15,514,132 |
PerkinElmer, Inc. | 277,285 | | 9,452,646 |
| | 24,966,778 |
Pharmaceuticals - 0.6% |
Biodelivery Sciences International, Inc. (a)(d) | 1,431,016 | | 6,181,989 |
ViroPharma, Inc. (a) | 367,734 | | 12,620,631 |
| | 18,802,620 |
TOTAL HEALTH CARE | | 345,147,279 |
INDUSTRIALS - 14.1% |
Aerospace & Defense - 1.1% |
AAR Corp. | 277,588 | | 6,728,733 |
Teledyne Technologies, Inc. (a) | 303,934 | | 24,366,389 |
| | 31,095,122 |
Air Freight & Logistics - 1.0% |
Hub Group, Inc. Class A (a) | 515,263 | | 19,708,810 |
UTI Worldwide, Inc. | 622,100 | | 10,264,650 |
| | 29,973,460 |
Commercial Services & Supplies - 1.8% |
Tetra Tech, Inc. (a) | 621,768 | | 14,673,725 |
United Stationers, Inc. | 456,800 | | 18,906,952 |
West Corp. | 945,623 | | 20,765,881 |
| | 54,346,558 |
Construction & Engineering - 1.2% |
MasTec, Inc. (a) | 617,710 | | 20,384,430 |
URS Corp. | 320,600 | | 14,907,900 |
| | 35,292,330 |
Common Stocks - continued |
| Shares | | Value |
INDUSTRIALS - continued |
Electrical Equipment - 1.2% |
General Cable Corp. | 710,110 | | $ 22,382,667 |
Polypore International, Inc. (a)(d) | 324,000 | | 13,604,760 |
| | 35,987,427 |
Industrial Conglomerates - 0.6% |
Carlisle Companies, Inc. | 247,500 | | 16,765,650 |
Machinery - 2.8% |
Actuant Corp. Class A | 598,431 | | 21,130,599 |
Harsco Corp. | 519,081 | | 13,371,527 |
Navistar International Corp. (a)(d) | 522,253 | | 17,834,940 |
TriMas Corp. (a) | 489,497 | | 18,126,074 |
Wabtec Corp. | 226,000 | | 13,121,560 |
| | 83,584,700 |
Marine - 0.2% |
DryShips, Inc. (a)(d) | 2,704,303 | | 5,192,262 |
Professional Services - 2.3% |
Dun & Bradstreet Corp. | 205,206 | | 21,265,498 |
Manpower, Inc. | 203,164 | | 13,585,577 |
Stantec, Inc. (d) | 441,700 | | 20,427,174 |
Towers Watson & Co. | 163,900 | | 13,805,297 |
| | 69,083,546 |
Trading Companies & Distributors - 1.9% |
DXP Enterprises, Inc. (a) | 232,420 | | 16,036,980 |
Kaman Corp. | 422,030 | | 15,978,056 |
Watsco, Inc. | 246,177 | | 22,980,623 |
| | 54,995,659 |
TOTAL INDUSTRIALS | | 416,316,714 |
INFORMATION TECHNOLOGY - 18.1% |
Communications Equipment - 2.4% |
Alcatel-Lucent SA sponsored ADR (a) | 1,073,800 | | 2,727,452 |
Aruba Networks, Inc. (a) | 1,433,367 | | 25,485,265 |
Brocade Communications Systems, Inc. (a) | 1,564,975 | | 10,422,734 |
Finisar Corp. (a) | 579,257 | | 11,197,038 |
Polycom, Inc. (a) | 1,206,426 | | 11,533,433 |
Riverbed Technology, Inc. (a) | 591,114 | | 9,245,023 |
Sonus Networks, Inc. (a) | 487,721 | | 1,668,006 |
| | 72,278,951 |
Common Stocks - continued |
| Shares | | Value |
INFORMATION TECHNOLOGY - continued |
Computers & Peripherals - 2.1% |
Cray, Inc. (a) | 493,607 | | $ 11,436,874 |
NCR Corp. (a) | 493,600 | | 17,769,600 |
Quantum Corp. (a) | 9,868,411 | | 15,789,458 |
Super Micro Computer, Inc. (a) | 1,405,512 | | 16,289,884 |
| | 61,285,816 |
Electronic Equipment & Components - 2.2% |
Fabrinet (a) | 396,841 | | 5,877,215 |
Insight Enterprises, Inc. (a) | 353,316 | | 7,557,429 |
InvenSense, Inc. (a)(d) | 697,084 | | 12,324,445 |
Jabil Circuit, Inc. | 1,129,413 | | 25,965,205 |
Neonode, Inc. (a) | 861,990 | | 6,714,902 |
TTM Technologies, Inc. (a) | 635,798 | | 5,874,774 |
| | 64,313,970 |
Internet Software & Services - 2.3% |
Bankrate, Inc. (a) | 1,130,687 | | 20,273,218 |
Demand Media, Inc. (a) | 837,123 | | 5,474,784 |
EarthLink, Inc. | 698,166 | | 4,377,501 |
LivePerson, Inc. (a) | 1,169,771 | | 10,808,684 |
Points International Ltd. (a) | 348,758 | | 7,568,049 |
Rackspace Hosting, Inc. (a) | 126,000 | | 5,706,540 |
Unwired Planet, Inc. (a) | 1,285,679 | | 2,609,928 |
Unwired Planet, Inc. rights (a) | 1,285,679 | | 38,751 |
Web.com Group, Inc. (a) | 437,319 | | 11,361,548 |
| | 68,219,003 |
IT Services - 3.7% |
Euronet Worldwide, Inc. (a) | 563,789 | | 20,753,073 |
ExlService Holdings, Inc. (a) | 693,962 | | 19,430,936 |
Genpact Ltd. | 736,168 | | 15,010,466 |
Heartland Payment Systems, Inc. (d) | 325,520 | | 12,145,151 |
Pactera Technology International Ltd. ADR | 931,336 | | 6,239,951 |
Sapient Corp. (a) | 1,842,553 | | 25,261,402 |
ServiceSource International, Inc. (a) | 1,054,832 | | 11,255,057 |
| | 110,096,036 |
Semiconductors & Semiconductor Equipment - 1.5% |
Atmel Corp. (a) | 983,997 | | 7,773,576 |
Entegris, Inc. (a) | 422,245 | | 4,023,995 |
Monolithic Power Systems, Inc. | 278,677 | | 7,295,764 |
Common Stocks - continued |
| Shares | | Value |
INFORMATION TECHNOLOGY - continued |
Semiconductors & Semiconductor Equipment - continued |
RF Micro Devices, Inc. (a) | 1,325,550 | | $ 6,879,605 |
Skyworks Solutions, Inc. (a) | 801,258 | | 19,246,217 |
| | 45,219,157 |
Software - 3.9% |
BroadSoft, Inc. (a) | 341,766 | | 10,198,297 |
Ellie Mae, Inc. (a) | 303,620 | | 7,150,251 |
MICROS Systems, Inc. (a)(d) | 431,307 | | 21,017,590 |
Nuance Communications, Inc. (a) | 1,152,117 | | 21,613,715 |
Parametric Technology Corp. (a) | 598,878 | | 16,217,616 |
Rovi Corp. (a) | 426,300 | | 9,604,539 |
Synchronoss Technologies, Inc. (a) | 662,131 | | 22,836,898 |
Verint Systems, Inc. (a) | 142,214 | | 5,088,417 |
| | 113,727,323 |
TOTAL INFORMATION TECHNOLOGY | | 535,140,256 |
MATERIALS - 4.8% |
Chemicals - 2.3% |
Axiall Corp. | 494,194 | | 21,784,072 |
Cabot Corp. | 447,294 | | 18,348,000 |
PolyOne Corp. | 541,101 | | 15,643,230 |
Zoltek Companies, Inc. (a)(d) | 849,000 | | 11,826,570 |
| | 67,601,872 |
Construction Materials - 0.4% |
Eagle Materials, Inc. | 171,666 | | 11,584,022 |
Containers & Packaging - 0.5% |
Silgan Holdings, Inc. | 310,633 | | 14,984,936 |
Metals & Mining - 1.3% |
Carpenter Technology Corp. | 251,441 | | 13,145,335 |
Worthington Industries, Inc. | 692,138 | | 24,757,776 |
| | 37,903,111 |
Paper & Forest Products - 0.3% |
Canfor Corp. (a) | 411,800 | | 8,688,254 |
TOTAL MATERIALS | | 140,762,195 |
TELECOMMUNICATION SERVICES - 0.5% |
Diversified Telecommunication Services - 0.5% |
Towerstream Corp. (a)(d)(e) | 5,045,286 | | 14,782,688 |
Common Stocks - continued |
| Shares | | Value |
UTILITIES - 2.8% |
Electric Utilities - 2.4% |
Cleco Corp. | 365,500 | | $ 17,730,405 |
El Paso Electric Co. | 281,680 | | 10,639,054 |
IDACORP, Inc. | 224,026 | | 11,821,852 |
PNM Resources, Inc. | 615,151 | | 14,443,745 |
Portland General Electric Co. | 489,482 | | 15,516,579 |
| | 70,151,635 |
Gas Utilities - 0.4% |
Atmos Energy Corp. | 294,776 | | 13,040,890 |
TOTAL UTILITIES | | 83,192,525 |
TOTAL COMMON STOCKS (Cost $2,227,053,703) |
2,877,482,613
|
U.S. Treasury Obligations - 0.0% |
| Principal Amount | | |
U.S. Treasury Bills, yield at date of purchase 0.02% to 0.03% 9/12/13 to 10/3/13 (f)
(Cost $694,975) | | $ 695,000 | |
694,971
|
Money Market Funds - 7.7% |
| Shares | | |
Fidelity Cash Central Fund, 0.11% (b) | 85,172,945 | | 85,172,945 |
Fidelity Securities Lending Cash Central Fund, 0.12% (b)(c) | 142,393,613 | | 142,393,613 |
TOTAL MONEY MARKET FUNDS (Cost $227,566,558) |
227,566,558
|
Cash Equivalents - 0.4% |
| Maturity Amount | | Value |
Investments in repurchase agreements in a joint trading account at 0.06%, dated 7/31/13 due 8/1/13 (Collateralized by U.S. Treasury Obligations) #
(Cost $10,552,000) | $ 10,552,019 | | $ 10,552,000 |
TOTAL INVESTMENT PORTFOLIO - 105.5% (Cost $2,465,867,236) | | 3,116,296,142 |
NET OTHER ASSETS (LIABILITIES) - (5.5)% | | (161,706,579) |
NET ASSETS - 100% | $ 2,954,589,563 |
Futures Contracts |
| Expiration
Date | | Underlying
Face Amount
at Value | | Unrealized
Appreciation/
(Depreciation) |
Purchased |
Equity Index Contracts |
92 NYFE Russell 2000 Mini Index Contracts | Sept. 2013 | | $ 9,594,680 | | $ 457,832 |
|
The face value of futures purchased as a percentage of net assets is 0.3% |
Legend |
(a) Non-income producing |
(b) Affiliated fund that is generally available only to investment companies and other accounts managed by Fidelity Investments. The rate quoted is the annualized seven-day yield of the fund at period end. A complete unaudited listing of the fund's holdings as of its most recent quarter end is available upon request. In addition, each Fidelity Central Fund's financial statements, which are not covered by the Fund's Report of Independent Registered Public Accounting Firm, are available on the SEC's website or upon request. |
(c) Investment made with cash collateral received from securities on loan. |
(d) Security or a portion of the security is on loan at period end. |
(e) Affiliated company |
(f) Security or a portion of the security was pledged to cover margin requirements for futures contracts. At period end, the value of securities pledged amounted to $489,978. |
# Additional information on each counterparty to the repurchase agreement is as follows: |
Repurchase Agreement / Counterparty | Value |
$10,552,000 due 8/01/13 at 0.06% |
Barclays Capital, Inc. | $ 2,947,535 |
Merrill Lynch, Pierce, Fenner & Smith, Inc. | 2,063,098 |
UBS Securities LLC | 5,541,367 |
| $ 10,552,000 |
Affiliated Central Funds |
Information regarding fiscal year to date income earned by the Fund from investments in Fidelity Central Funds is as follows: |
Fund | Income earned |
Fidelity Cash Central Fund | $ 148,184 |
Fidelity Securities Lending Cash Central Fund | 2,199,640 |
Total | $ 2,347,824 |
Other Affiliated Issuers |
An affiliated company is a company in which the Fund has ownership of at least 5% of the voting securities. Fiscal year to date transactions with companies which are or were affiliates are as follows: |
Affiliate | Value,
beginning of
period | Purchases | Sales
Proceeds | Dividend
Income | Value,
end of
period |
Biodelivery Sciences International, Inc. | $ 8,128,124 | $ 891,548 | $ 2,846,353 | $ - | $ - |
MEI Pharma, Inc. | - | 7,231,527 | 1,935,596 | - | - |
Towerstream Corp. | - | 17,068,284 | 1,129,437 | - | 14,782,688 |
Total | $ 8,128,124 | $ 25,191,359 | $ 5,911,386 | $ - | $ 14,782,688 |
Other Information |
The following is a summary of the inputs used, as of July 31, 2013, involving the Fund's assets and liabilities carried at fair value. The inputs or methodology used for valuing securities may not be an indication of the risk associated with investing in those securities. For more information on valuation inputs, and their aggregation into the levels used in the table below, please refer to the Investment Valuation section in the accompanying Notes to Financial Statements. |
Valuation Inputs at Reporting Date: |
Description | Total | Level 1 | Level 2 | Level 3 |
Investments in Securities: | | | | |
Equities: | | | | |
Consumer Discretionary | $ 410,335,799 | $ 410,335,799 | $ - | $ - |
Consumer Staples | 102,945,015 | 102,945,015 | - | - |
Energy | 168,641,737 | 168,641,737 | - | - |
Financials | 660,218,405 | 660,218,405 | - | - |
Health Care | 345,147,279 | 341,769,519 | 3,377,760 | - |
Industrials | 416,316,714 | 416,316,714 | - | - |
Information Technology | 535,140,256 | 535,101,505 | 38,751 | - |
Materials | 140,762,195 | 140,762,195 | - | - |
Telecommunication Services | 14,782,688 | 14,782,688 | - | - |
Utilities | 83,192,525 | 83,192,525 | - | - |
U.S. Government and Government Agency Obligations | 694,971 | - | 694,971 | - |
Money Market Funds | 227,566,558 | 227,566,558 | - | - |
Cash Equivalents | 10,552,000 | - | 10,552,000 | - |
Total Investments in Securities: | $ 3,116,296,142 | $ 3,101,632,660 | $ 14,663,482 | $ - |
Derivative Instruments: | | | | |
Assets | | | | |
Futures Contracts | $ 457,832 | $ 457,832 | $ - | $ - |
Value of Derivative Instruments |
The following table is a summary of the Fund's value of derivative instruments by primary risk exposure as of July 31, 2013. For additional information on derivative instruments, please refer to the Derivative Instruments section in the accompanying Notes to Financial Statements. |
Primary Risk Exposure /
Derivative Type | Value |
| Asset | Liability |
Equity Risk | | |
Futures Contracts (a) | $ 457,832 | $ - |
Total Value of Derivatives | $ 457,832 | $ - |
(a) Reflects gross cumulative appreciation/(depreciation) on futures contracts as presented in the Schedule of Investments. Only the period end variation margin is separately presented in the Statement of Assets and Liabilities and is included in the receivable/payable for daily variation margin for derivative instruments line-items. |
See accompanying notes which are an integral part of the financial statements.
Annual Report
Statement of Assets and Liabilities
| July 31, 2013 |
| | |
Assets | | |
Investment in securities, at value (including securities loaned of $140,133,976 and repurchase agreements of $10,552,000) - See accompanying schedule: Unaffiliated issuers (cost $2,222,537,712) | $ 2,873,946,896 | |
Fidelity Central Funds (cost $227,566,558) | 227,566,558 | |
Other affiliated issuers (cost $15,762,966) | 14,782,688 | |
Total Investments (cost $2,465,867,236) | | $ 3,116,296,142 |
Cash | | 32,240 |
Foreign currency held at value (cost $31,522) | | 31,522 |
Receivable for investments sold | | 42,074,019 |
Receivable for fund shares sold | | 1,237,725 |
Dividends receivable | | 1,223,699 |
Distributions receivable from Fidelity Central Funds | | 48,138 |
Other receivables | | 106,762 |
Total assets | | 3,161,050,247 |
| | |
Liabilities | | |
Payable for investments purchased | $ 23,984,282 | |
Payable for fund shares redeemed | 38,023,432 | |
Accrued management fee | 1,671,904 | |
Payable for daily variation margin for derivative instruments | 6,440 | |
Other affiliated payables | 313,601 | |
Other payables and accrued expenses | 67,412 | |
Collateral on securities loaned, at value | 142,393,613 | |
Total liabilities | | 206,460,684 |
| | |
Net Assets | | $ 2,954,589,563 |
Net Assets consist of: | | |
Paid in capital | | $ 2,091,257,209 |
Accumulated undistributed net realized gain (loss) on investments and foreign currency transactions | | 212,453,852 |
Net unrealized appreciation (depreciation) on investments and assets and liabilities in foreign currencies | | 650,878,502 |
Net Assets | | $ 2,954,589,563 |
See accompanying notes which are an integral part of the financial statements.
Annual Report
Financial Statements - continued
Statement of Assets and Liabilities - continued
| July 31, 2013 |
| | |
Series Small Cap Opportunities:
Net Asset Value, offering price and redemption price per share ($1,602,663,655 ÷ 118,310,689 shares) | | $ 13.55 |
| | |
Class F:
Net Asset Value, offering price and redemption price per share ($1,351,925,908 ÷ 99,242,455 shares) | | $ 13.62 |
See accompanying notes which are an integral part of the financial statements.
Annual Report
Statement of Operations
| Year ended July 31, 2013 |
| | |
Investment Income | | |
Dividends | | $ 30,747,889 |
Interest | | 1,408 |
Income from Fidelity Central Funds (including $2,199,640 from security lending) | | 2,347,824 |
Total income | | 33,097,121 |
| | |
Expenses | | |
Management fee
Basic fee | $ 18,500,478 | |
Performance adjustment | 1,203,306 | |
Transfer agent fees | 2,781,221 | |
Accounting and security lending fees | 791,478 | |
Custodian fees and expenses | 81,458 | |
Independent trustees' compensation | 16,098 | |
Audit | 64,386 | |
Legal | 7,921 | |
Miscellaneous | 22,846 | |
Total expenses before reductions | 23,469,192 | |
Expense reductions | (493,442) | 22,975,750 |
Net investment income (loss) | | 10,121,371 |
Realized and Unrealized Gain (Loss) Net realized gain (loss) on: | | |
Investment securities: | | |
Unaffiliated issuers | 244,636,500 | |
Other affiliated issuers | 421,198 | |
Foreign currency transactions | 21,264 | |
Futures contracts | 5,051,824 | |
Total net realized gain (loss) | | 250,130,786 |
Change in net unrealized appreciation (depreciation) on: Investment securities | 462,961,964 | |
Assets and liabilities in foreign currencies | (1,603) | |
Futures contracts | (449,533) | |
Total change in net unrealized appreciation (depreciation) | | 462,510,828 |
Net gain (loss) | | 712,641,614 |
Net increase (decrease) in net assets resulting from operations | | $ 722,762,985 |
See accompanying notes which are an integral part of the financial statements.
Annual Report
Financial Statements - continued
Statement of Changes in Net Assets
| Year ended
July 31,
2013 | Year ended
July 31,
2012 |
Increase (Decrease) in Net Assets | | |
Operations | | |
Net investment income (loss) | $ 10,121,371 | $ 2,155,575 |
Net realized gain (loss) | 250,130,786 | 87,039,240 |
Change in net unrealized appreciation (depreciation) | 462,510,828 | (119,534,053) |
Net increase (decrease) in net assets resulting
from operations | 722,762,985 | (30,339,238) |
Distributions to shareholders from net investment income | (11,718,166) | (1,018,413) |
Distributions to shareholders from net realized gain | (119,046,114) | (19,349,019) |
Total distributions | (130,764,280) | (20,367,432) |
Share transactions - net increase (decrease) | 109,169,036 | 409,737,421 |
Total increase (decrease) in net assets | 701,167,741 | 359,030,751 |
| | |
Net Assets | | |
Beginning of period | 2,253,421,822 | 1,894,391,071 |
End of period (including undistributed net investment income of $0 and undistributed net investment income of $1,385,864, respectively) | $ 2,954,589,563 | $ 2,253,421,822 |
See accompanying notes which are an integral part of the financial statements.
Annual Report
Financial Highlights - Series Small Cap Opportunities
Years ended July 31, | 2013 | 2012 | 2011 | 2010 | 2009 |
Selected Per-Share Data | | | | | |
Net asset value, beginning of period | $ 10.93 | $ 11.22 | $ 8.76 | $ 6.94 | $ 7.97 |
Income from Investment Operations | | | | |
Net investment income (loss) B | .04 | - I | - E, I | (.01) | .03 |
Net realized and unrealized gain (loss) | 3.20 | (.17) | 2.50 | 1.83 | (1.02) |
Total from investment operations | 3.24 | (.17) | 2.50 | 1.82 | (.99) |
Distributions from net investment income | (.05) | - I | - F | - | (.04) |
Distributions from net realized gain | (.57) | (.11) | (.04) F | - | - |
Total distributions | (.62) | (.12) J | (.04) | - | (.04) |
Redemption fees added to paid in capital H | - | - | - | - | - |
Net asset value, end of period | $ 13.55 | $ 10.93 | $ 11.22 | $ 8.76 | $ 6.94 |
Total Return A | 30.91% | (1.41)% | 28.50% | 26.22% | (12.34)% |
Ratios to Average Net Assets C, G | | | | |
Expenses before reductions | .98% | 1.12% | 1.10% | 1.02% | .93% |
Expenses net of fee waivers, if any | .98% | 1.12% | 1.10% | 1.02% | .93% |
Expenses net of all reductions | .96% | 1.11% | 1.09% | 1.01% | .93% |
Net investment income (loss) | .30% | .04% | (.04)% E | (.07)% | .49% |
Supplemental Data | | | | | |
Net assets, end of period (000 omitted) | $ 1,602,664 | $ 1,329,447 | $ 1,415,570 | $ 1,363,646 | $ 1,284,079 |
Portfolio turnover rate D | 77% | 66% | 73% | 104% | 167% |
A Total returns would have been lower if certain expenses had not been reduced during the applicable periods shown.
B Calculated based on average shares outstanding during the period.
C Fees and expenses of any underlying Fidelity Central Funds are not included in the Fund's expense ratio. The Fund indirectly bears its proportionate share of the expenses of any underlying Fidelity Central Funds.
D Amount does not include the portfolio activity of any underlying Fidelity Central Funds.
E Investment income per share reflects a large, non-recurring dividend which amounted to $.02 per share. Excluding this non-recurring dividend, the ratio of net investment income (loss) to average net assets would have been (.27)%.
F The amounts shown reflect certain reclassifications related to book to tax differences that were made in the year shown.
G Expense ratios reflect operating expenses of the class. Expenses before reductions do not reflect amounts reimbursed by the investment adviser or reductions from brokerage service arrangements or reductions from other expense offset arrangements and do not represent the amount paid by the class during periods when reimbursements or reductions occur. Expenses net of fee waivers reflect expenses after reimbursement by the investment adviser but prior to reductions from brokerage service arrangements or other expense offset arrangements. Expenses net of all reductions represent the net expenses paid by the class.
H The redemption fee was eliminated during the year ended July 31, 2009.
I Amount represents less than $.01 per share.
J Total distributions of $.12 per share is comprised of distributions from net investment income of $.003 and distributions from net realized gain of $.113 per share.
See accompanying notes which are an integral part of the financial statements.
Annual Report
Financial Highlights - Class F
Years ended July 31, | 2013 | 2012 | 2011 | 2010 | 2009 H |
Selected Per-Share Data | | | | | |
Net asset value, beginning of period | $ 10.99 | $ 11.27 | $ 8.79 | $ 6.94 | $ 6.24 |
Income from Investment Operations | | | | |
Net investment income (loss) D | .06 | .03 | .02 G | .01 | - K |
Net realized and unrealized gain (loss) | 3.21 | (.18) | 2.50 | 1.84 | .70 |
Total from investment operations | 3.27 | (.15) | 2.52 | 1.85 | .70 |
Distributions from net investment income | (.07) | (.01) | - I | - | - |
Distributions from net realized gain | (.57) | (.11) | (.04) I | - | - |
Total distributions | (.64) | (.13) L | (.04) | - | - |
Net asset value, end of period | $ 13.62 | $ 10.99 | $ 11.27 | $ 8.79 | $ 6.94 |
Total Return B, C | 31.09% | (1.23)% | 28.74% | 26.66% | 11.22% |
Ratios to Average Net Assets E, J | | | | |
Expenses before reductions | .79% | .91% | .89% | .78% | .68% A |
Expenses net of fee waivers, if any | .79% | .91% | .89% | .78% | .68% A |
Expenses net of all reductions | .77% | .91% | .88% | .77% | .68% A |
Net investment income (loss) | .49% | .24% | .17% G | .17% | .11% A |
Supplemental Data | | | | | |
Net assets, end of period (000 omitted) | $ 1,351,926 | $ 923,975 | $ 478,821 | $ 174,783 | $ 197 |
Portfolio turnover rate F | 77% | 66% | 73% | 104% | 167% |
A Annualized
B Total returns for periods of less than one year are not annualized.
C Total returns would have been lower if certain expenses had not been reduced during the applicable periods shown.
D Calculated based on average shares outstanding during the period.
E Fees and expenses of any underlying Fidelity Central Funds are not included in the Fund's expense ratio. The Fund indirectly bears its proportionate share of the expenses of any underlying Fidelity Central Funds.
F Amount does not include the portfolio activity of any underlying Fidelity Central Funds.
G Investment income per share reflects a large, non-recurring dividend which amounted to $.02 per share. Excluding this non-recurring dividend, the ratio of net investment income (loss) to average net assets would have been (.06)%.
H For the period June 26, 2009 (commencement of sale of shares) to July 31, 2009.
I The amounts shown reflect certain reclassifications related to book to tax differences that were made in the year shown.
J Expense ratios reflect operating expenses of the class. Expenses before reductions do not reflect amounts reimbursed by the investment adviser or reductions from brokerage service arrangements or reductions from other expense offset arrangements and do not represent the amount paid by the class during periods when reimbursements or reductions occur. Expense ratios before reductions for start-up periods may not be representative of longer-term operating periods. Expenses net of fee waivers reflect expenses after reimbursement by the investment adviser but prior to reductions from brokerage service arrangements or other expense offset arrangements. Expenses net of all reductions represent the net expenses paid by the class.
K Amount represents less than $.01 per share.
L Total distributions of $.13 per share is comprised of distributions from net investment income of $.012 and distributions from net realized gain of $.113 per share.
See accompanying notes which are an integral part of the financial statements.
Annual Report
Notes to Financial Statements
For the period ended July 31, 2013
1. Organization.
Fidelity Series Small Cap Opportunities Fund (the Fund) is a fund of Fidelity Securities Fund (the Trust) and is authorized to issue an unlimited number of shares. Shares of the Fund are only available for purchase by mutual funds for which Fidelity Management & Research Company (FMR) or an affiliate serves as an investment manager and, for shares of Series Small Cap Opportunities, FMR investment professionals. The Trust is registered under the Investment Company Act of 1940, as amended (the 1940 Act), as an open-end management investment company organized as a Massachusetts business trust. The Fund offers Series Small Cap Opportunities and Class F shares, each of which has equal rights as to assets and voting privileges. Each class has exclusive voting rights with respect to matters that affect that class.
2. Investments in Fidelity Central Funds.
The Fund invests in Fidelity Central Funds, which are open-end investment companies generally available only to other investment companies and accounts managed by FMR and its affiliates. The Fund's Schedule of Investments lists each of the Fidelity Central Funds held as of period end, if any, as an investment of the Fund, but does not include the underlying holdings of each Fidelity Central Fund. As an Investing Fund, the Fund indirectly bears its proportionate share of the expenses of the underlying Fidelity Central Funds.
The Money Market Central Funds seek preservation of capital and current income and are managed by Fidelity Investments Money Management, Inc. (FIMM), an affiliate of FMR.
A complete unaudited list of holdings for each Fidelity Central Fund is available upon request or at the Securities and Exchange Commission (the SEC) website at www.sec.gov. In addition, the financial statements of the Fidelity Central Funds, which are not covered by the Fund's Report of Independent Registered Public Accounting Firm, are available on the SEC website or upon request.
3. Significant Accounting Policies.
The financial statements have been prepared in conformity with accounting principles generally accepted in the United States of America (GAAP), which require management to make certain estimates and assumptions at the date of the financial statements. Actual results could differ from those estimates. Subsequent events, if any, through the date that the financial statements were issued have been evaluated in the preparation of the financial statements. The following summarizes the significant accounting policies of the Fund:
Annual Report
3. Significant Accounting Policies - continued
Investment Valuation. Investments are valued as of 4:00 p.m. Eastern time on the last calendar day of the period. In accordance with valuation policies and procedures approved by the Board of Trustees (the Board), the Fund attempts to obtain prices from one or more third party pricing vendors or brokers to value its investments. When current market prices, quotations or currency exchange rates are not readily available or reliable, investments will be fair valued in good faith by the FMR Fair Value Committee (the Committee), in accordance with procedures adopted by the Board. Factors used in determining fair value vary by investment type and may include market or investment specific events, changes in interest rates and credit quality. The frequency with which these procedures are used cannot be predicted and they may be utilized to a significant extent. The Committee oversees the Fund's valuation policies and procedures and is responsible for approving and reporting to the Board all fair value determinations.
The Fund categorizes the inputs to valuation techniques used to value its investments into a disclosure hierarchy consisting of three levels as shown below:
Level 1 - quoted prices in active markets for identical investments
Level 2 - other significant observable inputs (including quoted prices for similar investments, interest rates, prepayment speeds, etc.)
Level 3 - unobservable inputs (including the Fund's own assumptions based on the best information available)
Valuation techniques used to value the Fund's investments by major category are as follows:
Equity securities, including restricted securities, for which market quotations are readily available, are valued at the last reported sale price or official closing price as reported by a third party pricing vendor on the primary market or exchange on which they are traded and are categorized as Level 1 in the hierarchy. In the event there were no sales during the day or closing prices are not available, securities are valued at the last quoted bid price or may be valued using the last available price and are generally categorized as Level 2 in the hierarchy. For foreign equity securities, when market or security specific events arise, comparisons to the valuation of American Depositary Receipts (ADRs), futures contracts, Exchange-Traded Funds (ETFs) and certain indexes as well as quoted prices for similar securities may be used and would be categorized as Level 2 in the hierarchy. Utilizing these techniques may result in transfers between Level 1 and Level 2.
Debt securities, including restricted securities, are valued based on evaluated prices received from third party pricing vendors or from brokers who make markets in such securities. For U.S. government and government agency obligations, pricing vendors utilize matrix pricing which considers yield or price of bonds of comparable quality,
Annual Report
Notes to Financial Statements - continued
3. Significant Accounting Policies - continued
Investment Valuation - continued
coupon, maturity and type as well as broker-supplied prices. When independent prices are unavailable or unreliable, debt securities may be valued utilizing pricing methodologies which consider similar factors that would be used by third party pricing vendors. Debt securities are generally categorized as Level 2 in the hierarchy but may be Level 3 depending on the circumstances.
Futures contracts are valued at the settlement price established each day by the board of trade or exchange on which they are traded and are categorized as Level 1 in the hierarchy. Investments in open-end mutual funds, including the Fidelity Central Funds, are valued at their closing net asset value (NAV) each business day and are categorized as Level 1 in the hierarchy.
Changes in valuation techniques may result in transfers in or out of an assigned level within the disclosure hierarchy. The aggregate value of investments by input level, as of July 31, 2013 is included at the end of the Fund's Schedule of Investments.
Foreign Currency. The Fund may use foreign currency contracts to facilitate transactions in foreign-denominated securities. Gains and losses from these transactions may arise from changes in the value of the foreign currency or if the counterparties do not perform under the contracts' terms.
Foreign-denominated assets, including investment securities, and liabilities are translated into U.S. dollars at the exchange rates at period end. Purchases and sales of investment securities, income and dividends received and expenses denominated in foreign currencies are translated into U.S. dollars at the exchange rate in effect on the transaction date.
The effects of exchange rate fluctuations on investments are included with the net realized and unrealized gain (loss) on investment securities. Other foreign currency transactions resulting in realized and unrealized gain (loss) are disclosed separately.
Investment Transactions and Income. For financial reporting purposes, the Fund's investment holdings and NAV include trades executed through the end of the last business day of the period. The NAV per share for processing shareholder transactions is calculated as of the close of business of the New York Stock Exchange (NYSE), normally 4:00 p.m. Eastern time and includes trades executed through the end of the prior business day. Gains and losses on securities sold are determined on the basis of identified cost and may include proceeds received from litigation. Dividend income is recorded on the ex-dividend date, except for certain dividends from foreign securities where the ex-dividend date may have passed, which are recorded as soon as the Fund is informed of the ex-dividend date. Non-cash dividends included in dividend income, if any, are
Annual Report
3. Significant Accounting Policies - continued
Investment Transactions and Income - continued
recorded at the fair market value of the securities received. Distributions received on securities that represent a return of capital or capital gain are recorded as a reduction of cost of investments and/or as a realized gain. Subsequent to ex-dividend date the Fund determines the components of these distributions, based upon receipt of tax filings or other correspondence relating to the underlying investment. Interest income and distributions from the Fidelity Central Funds are accrued as earned. Interest income includes coupon interest and amortization of premium and accretion of discount on debt securities. Investment income is recorded net of foreign taxes withheld where recovery of such taxes is uncertain.
Class Allocations and Expenses. Investment income, realized and unrealized capital gains and losses, common expenses of the Fund, and certain fund-level expense reductions, if any, are allocated on a pro-rata basis to each class based on the relative net assets of each class to the total net assets of the Fund. Each class differs with respect to transfer agent fees incurred. Certain expense reductions may also differ by class. Expenses directly attributable to a fund are charged to that fund. Expenses attributable to more than one fund are allocated among the respective funds on the basis of relative net assets or other appropriate methods. Expense estimates are accrued in the period to which they relate and adjustments are made when actual amounts are known.
Income Tax Information and Distributions to Shareholders. Each year, the Fund intends to qualify as a regulated investment company under Subchapter M of the Internal Revenue Code, including distributing substantially all of its taxable income and realized gains. As a result, no provision for income taxes is required. As of July 31, 2013, the Fund did not have any unrecognized tax benefits in the financial statements; nor is the Fund aware of any tax positions for which it is reasonably possible that the total amounts of unrecognized tax benefits will significantly change in the next twelve months. The Fund files a U.S. federal tax return, in addition to state and local tax returns as required. A fund's federal income tax returns are subject to examination by the Internal Revenue Service (IRS) for a period of three fiscal years after they are filed. State and local tax returns may be subject to examination for an additional fiscal year depending on the jurisdiction. Foreign taxes are provided for based on the Fund's understanding of the tax rules and rates that exist in the foreign markets in which it invests.
Distributions are declared and recorded on the ex-dividend date. Income dividends and capital gain distributions are declared separately for each class. Income and capital gain distributions are determined in accordance with income tax regulations, which may differ from GAAP.
Annual Report
Notes to Financial Statements - continued
3. Significant Accounting Policies - continued
Income Tax Information and Distributions to Shareholders - continued
Capital accounts within the financial statements are adjusted for permanent book-tax differences. These adjustments have no impact on net assets or the results of operations. Temporary book-tax differences will reverse in a subsequent period.
Book-tax differences are primarily due to futures contracts, foreign currency transactions, market discount, partnerships, and losses deferred due to wash sales.
The federal tax cost of investment securities and unrealized appreciation (depreciation) as of period end were as follows:
Gross unrealized appreciation | $ 695,005,773 |
Gross unrealized depreciation | (49,028,493) |
Net unrealized appreciation (depreciation) on securities and other investments | $ 645,977,280 |
| |
Tax Cost | $ 2,470,318,862 |
The tax-based components of distributable earnings as of period end were as follows:
Undistributed ordinary income | $ 47,440,099 |
Undistributed long-term capital gain | $ 169,923,212 |
Net unrealized appreciation (depreciation) | $ 645,969,044 |
The tax character of distributions paid was as follows:
| July 31, 2013 | July 31, 2012 |
Ordinary Income | $ 11,718,166 | $ 1,018,413 |
Long-term Capital Gains | 119,046,114 | 19,349,019 |
Total | $ 130,764,280 | $ 20,367,432 |
Repurchase Agreements. FMR has received an Exemptive Order from the SEC which permits the Fund and other affiliated entities of FMR to transfer uninvested cash balances into joint trading accounts which are then invested in repurchase agreements. The Fund may also invest directly with institutions in repurchase agreements. Repurchase agreements may be collateralized by government or non-government securities. Upon settlement date, collateral is held in segregated accounts with custodian banks and may be obtained in the event of a default of the counterparty. The Fund monitors, on a daily basis, the value of the collateral to ensure it is at least equal to the principal amount of the repurchase agreement (including accrued interest). In the event of a default by
Annual Report
3. Significant Accounting Policies - continued
Repurchase Agreements - continued
the counterparty, realization of the collateral proceeds could be delayed, during which time the value of the collateral may decline.
New Accounting Pronouncement. The Financial Accounting Standards Board issued in December 2011, Accounting Standard Update No. 2011-11, Disclosures about Offsetting Assets and Liabilities, and in January 2013, Accounting Standards Update No. 2013-1 Clarifying the Scope of Disclosures about Offsetting Assets and Liabilities. These updates create new disclosure requirements requiring entities to disclose both gross and net information for derivatives and other financial instruments that are either offset in the Statement of Assets and Liabilities or subject to an enforceable master netting arrangement or similar agreement. The disclosure requirements are effective for annual reporting periods beginning on or after January 1, 2013, and interim periods within those annual periods. Management expects that the impact of the update's adoption will be limited to additional financial statement disclosures as applicable.
4. Derivative Instruments.
Risk Exposures and the Use of Derivative Instruments. The Fund's investment objective allows the Fund to enter into various types of derivative contracts, including futures contracts. Derivatives are investments whose value is primarily derived from underlying assets, indices or reference rates and may be transacted on an exchange or over-the-counter (OTC). Derivatives may involve a future commitment to buy or sell a specified asset based on specified terms, to exchange future cash flows at periodic intervals based on a notional principal amount, or for one party to make one or more payments upon the occurrence of specified events in exchange for periodic payments from the other party.
The Fund used derivatives to increase returns and to manage exposure to certain risks as defined below. The success of any strategy involving derivatives depends on analysis of numerous economic factors, and if the strategies for investment do not work as intended, the Fund may not achieve its objectives.
The Fund's use of derivatives increased or decreased its exposure to the following risk:
Equity Risk | Equity risk relates to the fluctuations in the value of financial instruments as a result of changes in market prices (other than those arising from interest rate risk or foreign exchange risk), whether caused by factors specific to an individual investment, its issuer, or all factors affecting all instruments traded in a market or market segment. |
Annual Report
Notes to Financial Statements - continued
4. Derivative Instruments - continued
Risk Exposures and the Use of Derivative Instruments - continued
The Fund is also exposed to additional risks from investing in derivatives, such as liquidity risk and counterparty credit risk. Liquidity risk is the risk that the Fund will be unable to close out the derivative in the open market in a timely manner. Counterparty credit risk is the risk that the counterparty will not be able to fulfill its obligation to the Fund. Counterparty credit risk related to exchange-traded futures contracts may be mitigated by the protection provided by the exchange on which they trade.
Investing in derivatives may involve greater risks than investing in the underlying assets directly and, to varying degrees, may involve risk of loss in excess of any initial investment and collateral received and amounts recognized in the Statement of Assets and Liabilities. In addition, there may be the risk that the change in value of the derivative contract does not correspond to the change in value of the underlying instrument.
Futures Contracts. A futures contract is an agreement between two parties to buy or sell a specified underlying instrument for a fixed price at a specified future date. The Fund used futures contracts to manage its exposure to the stock market.
Upon entering into a futures contract, a fund is required to deposit either cash or securities (initial margin) with a clearing broker in an amount equal to a certain percentage of the face value of the contract. Futures contracts are marked-to-market daily and subsequent daily payments (variation margin) are made or received by a fund depending on the daily fluctuations in the value of the futures contracts and are recorded as unrealized appreciation or (depreciation). This receivable and/or payable, if any, is included in daily variation margin for derivative instruments in the Statement of Assets and Liabilities. Realized gain or (loss) is recorded upon the expiration or closing of a futures contract.
Any open futures contracts at period end are presented in the Schedule of Investments under the caption "Futures Contracts." The underlying face amount at value reflects each contract's exposure to the underlying instrument or index at period end and is representative of activity for the period. Securities deposited to meet initial margin requirements are identified in the Schedule of Investments.
During the period the Fund recognized net realized gain (loss) of $5,051,824 and a change in net unrealized appreciation (depreciation) of $(449,533) related to its investment in futures contracts. These amounts are included in the Statement of Operations.
5. Purchases and Sales of Investments.
Purchases and sales of securities, other than short-term securities, aggregated $1,977,786,424 and $1,936,786,394, respectively.
Annual Report
6. Fees and Other Transactions with Affiliates.
Management Fee. FMR and its affiliates provide the Fund with investment management related services for which the Fund pays a monthly management fee. The management fee is the sum of an individual fund fee rate that is based on an annual rate of .45% of the Fund's average net assets and an annualized group fee rate that averaged .26% during the period. The group fee rate is based upon the average net assets of all the mutual funds advised by FMR. The group fee rate decreases as assets under management increase and increases as assets under management decrease. In addition, the management fee is subject to a performance adjustment (up to a maximum of ± .20% of the Fund's average net assets over a 36 month performance period). The upward or downward adjustment to the management fee is based on the relative investment performance of Series Small Cap Opportunities as compared to an appropriate benchmark index. For the period, the total annual management fee rate, including the performance adjustment, was .75% of the Fund's average net assets.
Transfer Agent Fees. Fidelity Investments Institutional Operations Company, Inc., (FIIOC), an affiliate of FMR, is the transfer, dividend disbursing and shareholder servicing agent for each class of the Fund. FIIOC receives account fees and asset-based fees that vary according to the account size and type of account of the shareholders of Series Small Cap Opportunities FIIOC receives no fees for providing transfer agency services to Class F. FIIOC pays for typesetting, printing and mailing of shareholder reports, except proxy statements. For the period, transfer agent fees for each applicable class were as follows:
| Amount | % of
Average
Net Assets |
Series Small Cap Opportunities | $ 2,781,221 | .19 |
Accounting and Security Lending Fees. Fidelity Service Company, Inc. (FSC), an affiliate of FMR, maintains the Fund's accounting records. The accounting fee is based on the level of average net assets for each month. Under a separate contract, FSC administers the security lending program. The security lending fee is based on the number and duration of lending transactions.
Brokerage Commissions. The Fund placed a portion of its portfolio transactions with brokerage firms which are affiliates of the investment adviser. Brokerage commissions are included in net realized gain (loss) and change in net unrealized appreciation (depreciation) in the Statement of Operations. The commissions paid to these affiliated firms were $71,548 for the period.
Annual Report
Notes to Financial Statements - continued
7. Committed Line of Credit.
The Fund participates with other funds managed by FMR or an affiliate in a $4.25 billion credit facility (the "line of credit") to be utilized for temporary or emergency purposes to fund shareholder redemptions or for other short-term liquidity purposes. The Fund has agreed to pay commitment fees on its pro-rata portion of the line of credit, which amounted to $6,010 and is reflected in Miscellaneous expenses on the Statement of Operations. During the period, there were no borrowings on this line of credit.
8. Security Lending.
The Fund lends portfolio securities through a lending agent from time to time in order to earn additional income. For equity securities, a lending agent is used and may loan securities to certain qualified borrowers, including Fidelity Capital Markets (FCM), a broker-dealer affiliated with the Fund. On the settlement date of the loan, the Fund receives collateral (in the form of U.S. Treasury obligations, letters of credit and/or cash) against the loaned securities and maintains collateral in an amount not less than 100% of the market value of the loaned securities during the period of the loan. The market value of the loaned securities is determined at the close of business of the Fund and any additional required collateral is delivered to the Fund on the next business day. If the borrower defaults on its obligation to return the securities loaned because of insolvency or other reasons, the Fund may apply collateral received from the borrower against the obligation. The Fund may experience delays and costs in recovering the securities loaned. Any cash collateral received is invested in the Fidelity Securities Lending Cash Central Fund. The value of loaned securities and cash collateral at period end are disclosed on the Fund's Statement of Assets and Liabilities. The value of securities loaned to FCM at period end was $3,723,300. Security lending income represents the income earned on investing cash collateral, less rebates paid to borrowers and any lending agent fees associated with the loan, plus any premium payments received for lending certain types of securities. Security lending income is presented in the Statement of Operations as a component of income from Fidelity Central Funds, and includes $208,421 from securities loaned to FCM.
9. Expense Reductions.
Commissions paid to certain brokers with whom FMR places trades on behalf of the Fund include an amount in addition to trade execution, which is rebated back to the Fund to offset certain expenses. This amount totaled $493,364 for the period. In addition, through arrangements with the Fund's custodian, credits realized as a result of uninvested cash balances were used to reduce the Fund's expenses. During the period, these credits reduced the Fund's custody expenses by $78.
Annual Report
10. Distributions to Shareholders.
Distributions to shareholders of each class were as follows:
Years ended July 31, | 2013 | 2012 |
From net investment income | | |
Series Small Cap Opportunities | $ 5,439,782 | $ 360,217 |
Class F | 6,278,384 | 658,196 |
Total | $ 11,718,166 | $ 1,018,413 |
From net realized gain | | |
Series Small Cap Opportunities | $ 68,495,319 | $ 14,087,548 |
Class F | 50,550,795 | 5,261,471 |
Total | $ 119,046,114 | $ 19,349,019 |
11. Share Transactions.
Transactions for each class of shares were as follows:
| Shares | Dollars |
Years ended July 31, | 2013 | 2012 | 2013 | 2012 |
Series Small Cap Opportunities | | | | |
Shares sold | 18,962,910 | 27,072,389 | $ 213,903,891 | $ 295,278,935 |
Reinvestment of distributions | 6,656,221 | 1,501,907 | 73,935,101 | 14,447,765 |
Shares redeemed | (28,900,880) | (33,133,824) | (343,341,551) | (348,573,500) |
Net increase (decrease) | (3,281,749) | (4,559,528) | $ (55,502,559) | $ (38,846,800) |
Class F | | | | |
Shares sold | 21,246,567 | 45,760,157 | $ 247,783,165 | $ 492,916,658 |
Reinvestment of distributions | 5,100,288 | 607,120 | 56,829,179 | 5,919,667 |
Shares redeemed | (11,157,740) | (4,808,984) | (139,940,749) | (50,252,104) |
Net increase (decrease) | 15,189,115 | 41,558,293 | $ 164,671,595 | $ 448,584,221 |
12. Other.
The Fund's organizational documents provide former and current trustees and officers with a limited indemnification against liabilities arising in connection with the performance of their duties to the Fund. In the normal course of business, the Fund may also enter into contracts that provide general indemnifications. The Fund's maximum exposure under these arrangements is unknown as this would be dependent on future claims that may be made against the Fund. The risk of material loss from such claims is considered remote.
At the end of the period, mutual funds managed by FMR or an FMR affiliate were the owners of record of all of the outstanding shares of the Fund.
Annual Report
To the Trustees of Fidelity Securities Fund and Shareholders of Fidelity Series Small Cap Opportunities Fund:
We have audited the accompanying statement of assets and liabilities of Fidelity Series Small Cap Opportunities Fund (the Fund), a fund of Fidelity Securities Fund, including the schedule of investments, as of July 31, 2013, and the related statement of operations for the year then ended, the statement of changes in net assets for each of the two years in the period then ended, and the financial highlights for each of the five years in the period then ended. These financial statements and financial highlights are the responsibility of the Fund's management. Our responsibility is to express an opinion on these financial statements and financial highlights based on our audits.
We conducted our audits in accordance with the standards of the Public Company Accounting Oversight Board (United States). Those standards require that we plan and perform the audit to obtain reasonable assurance about whether the financial statements and financial highlights are free of material misstatement. The Fund is not required to have, nor were we engaged to perform, an audit of their internal control over financial reporting. Our audits included consideration of internal control over financial reporting as a basis for designing audit procedures that are appropriate in the circumstances, but not for the purpose of expressing an opinion on the effectiveness of the Fund's internal control over financial reporting. Accordingly, we express no such opinion. An audit also includes examining, on a test basis, evidence supporting the amounts and disclosures in the financial statements, assessing the accounting principles used and significant estimates made by management, as well as evaluating the overall financial statement presentation. Our procedures included confirmation of securities owned as of July 31, 2013, by correspondence with the custodians and brokers; where replies were not received from brokers, we performed other auditing procedures. We believe that our audits provide a reasonable basis for our opinion.
In our opinion, the financial statements and financial highlights referred to above present fairly, in all material respects, the financial position of Fidelity Series Small Cap Opportunities Fund as of July 31, 2013, the results of its operations for the year then ended, the changes in its net assets for each of the two years in the period then ended, and the financial highlights for each of the five years in the period then ended, in conformity with accounting principles generally accepted in the United States of America.
DELOITTE & TOUCHE LLP
Boston, Massachusetts
September 16, 2013
Annual Report
The Trustees, Member of the Advisory Board, and executive officers of the trust and fund, as applicable, are listed below. The Board of Trustees governs the fund and is responsible for protecting the interests of shareholders. The Trustees are experienced executives who meet periodically throughout the year to oversee the fund's activities, review contractual arrangements with companies that provide services to the fund, oversee management of the risks associated with such activities and contractual arrangements, and review the fund's performance. Except for James C. Curvey, Ned C. Lautenbach, Ronald P. O'Hanley, and William S. Stavropoulos, each of the Trustees oversees 166 Fidelity funds. Mr. Curvey oversees 387 Fidelity funds. Mr. Lautenbach, Mr. O'Hanley, and Mr. Stavropoulos each oversees 230 Fidelity funds.
The Trustees hold office without limit in time except that (a) any Trustee may resign; (b) any Trustee may be removed by written instrument, signed by at least two-thirds of the number of Trustees prior to such removal; (c) any Trustee who requests to be retired or who has become incapacitated by illness or injury may be retired by written instrument signed by a majority of the other Trustees; and (d) any Trustee may be removed at any special meeting of shareholders by a two-thirds vote of the outstanding voting securities of the trust. Each Trustee who is not an interested person of the trust and the fund (as defined in the 1940 Act) (Independent Trustee), shall retire not later than the last day of the calendar year in which his or her 75th birthday occurs. The Independent Trustees may waive this mandatory retirement age policy with respect to individual Trustees. The executive officers and Advisory Board Member hold office without limit in time, except that any officer and Advisory Board Member may resign or may be removed by a vote of a majority of the Trustees at any regular meeting or any special meeting of the Trustees. Except as indicated, each individual has held the office shown or other offices in the same company for the past five years.
Experience, Skills, Attributes, and Qualifications of the Fund's Trustees. The Governance and Nominating Committee has adopted a statement of policy that describes the experience, qualifications, attributes, and skills that are necessary and desirable for potential Independent Trustee candidates (Statement of Policy). The Board believes that each Trustee satisfied at the time he or she was initially elected or appointed a Trustee, and continues to satisfy, the standards contemplated by the Statement of Policy. The Governance and Nominating Committee also engages professional search firms to help identify potential Independent Trustee candidates who have the experience, qualifications, attributes, and skills consistent with the Statement of Policy. From time to time, additional criteria based on the composition and skills of the current Independent Trustees, as well as experience or skills that may be appropriate in light of future changes to board composition, business conditions, and regulatory or other developments, have also been considered by the professional search firms and the Governance and Nominating Committee. In addition, the Board takes into account the Trustees' commitment and participation in Board and committee meetings, as well as their leadership of standing and ad hoc committees throughout their tenure.
Annual Report
In determining that a particular Trustee was and continues to be qualified to serve as a Trustee, the Board has considered a variety of criteria, none of which, in isolation, was controlling. The Board believes that, collectively, the Trustees have balanced and diverse experience, qualifications, attributes, and skills, which allow the Board to operate effectively in governing the fund and protecting the interests of shareholders. Information about the specific experience, skills, attributes, and qualifications of each Trustee, which in each case led to the Board's conclusion that the Trustee should serve (or continue to serve) as a trustee of the fund, is provided below.
Board Structure and Oversight Function. James C. Curvey is an interested person (as defined in the 1940 Act) and currently serves as Chairman. The Trustees have determined that an interested Chairman is appropriate and benefits shareholders because an interested Chairman has a personal and professional stake in the quality and continuity of services provided to the fund. Independent Trustees exercise their informed business judgment to appoint an individual of their choosing to serve as Chairman, regardless of whether the Trustee happens to be independent or a member of management. The Independent Trustees have determined that they can act independently and effectively without having an Independent Trustee serve as Chairman and that a key structural component for assuring that they are in a position to do so is for the Independent Trustees to constitute a substantial majority for the Board. The Independent Trustees also regularly meet in executive session. Ned C. Lautenbach serves as Chairman of the Independent Trustees and as such (i) acts as a liaison between the Independent Trustees and management with respect to matters important to the Independent Trustees and (ii) with management prepares agendas for Board meetings.
Fidelity funds are overseen by different Boards of Trustees. The fund's Board oversees Fidelity's equity and high income funds and another Board oversees Fidelity's investment-grade bond, money market, and asset allocation funds. The asset allocation funds may invest in Fidelity funds overseen by the fund's Board. The use of separate Boards, each with its own committee structure, allows the Trustees of each group of Fidelity funds to focus on the unique issues of the funds they oversee, including common research, investment, and operational issues. On occasion, the separate Boards establish joint committees to address issues of overlapping consequences for the Fidelity funds overseen by each Board.
The Trustees operate using a system of committees to facilitate the timely and efficient consideration of all matters of importance to the Trustees, the fund, and fund shareholders and to facilitate compliance with legal and regulatory requirements and oversight of the fund's activities and associated risks. The Board, acting through its committees, has charged FMR and its affiliates with (i) identifying events or circumstances the occurrence of which could have demonstrably adverse effects on the fund's business and/or reputation; (ii) implementing processes and controls to lessen the possibility that such events or circumstances occur or to mitigate the effects of such events or circumstances if they do occur; and (iii) creating and maintaining a system designed to evaluate continuously business and market conditions in order to facilitate the identification and implementation processes described in (i) and (ii) above. Because the day-to-day operations and activities of the fund are carried out by or through FMR, its affiliates and other service providers, the fund's exposure to risks is mitigated but not eliminated by the processes overseen by the Trustees. While each of the Board's committees has responsibility for overseeing different aspects of the fund's activities, oversight is exercised primarily through the Operations, Audit, and Compliance Committees. In addition, the Independent Trustees have worked with FMR to enhance the Board's oversight of investment and financial risks, legal and regulatory risks, technology risks, and operational risks, including the development of additional risk reporting to the Board. For example, a working group comprised of Independent Trustees and FMR has worked and continues to work to review the Fidelity funds' valuation-related activities, reporting and risk management. Appropriate personnel, including but not limited to the fund's Chief Compliance Officer (CCO), FMR's internal auditor, the independent accountants, the fund's Treasurer and portfolio management personnel, make periodic reports to the Board's committees, as appropriate, including an annual review of FMR's risk management program for the Fidelity funds. The responsibilities of each standing committee, including their oversight responsibilities, are described further under "Standing Committees of the Fund's Trustees."
Annual Report
Trustees and Officers - continued
The fund's Statement of Additional Information (SAI) includes more information about the Trustees. To request a free copy, call Fidelity at 1-800-544-8544 for Fidelity Series Small Cap Opportunities, or 1-800-835-5092 for Class F.
Interested Trustees*:
Correspondence intended for each Trustee who is an interested person may be sent to Fidelity Investments, 245 Summer Street, Boston, Massachusetts 02210.
Name, Year of Birth; Principal Occupations and Other Relevant Experience+ |
James C. Curvey (1935) |
| Year of Election or Appointment: 2007 Mr. Curvey is Trustee and Chairman of the Board of Trustees of certain Trusts. Mr. Curvey also serves as Trustee (2007-present) of other investment companies advised by FMR. Mr. Curvey is a Director of Fidelity Investments Money Management, Inc. (2009-present), Director of Fidelity Research & Analysis Co. (2009-present) and Director of FMR and FMR Co., Inc. (2007-present). Mr. Curvey is also Vice Chairman (2007-present) and Director of FMR LLC. In addition, Mr. Curvey serves as an Overseer for the Boston Symphony Orchestra and a member of the Trustees of Villanova University. Previously, Mr. Curvey was the Vice Chairman (2006-2007) and Director (2000-2007) of FMR Corp. |
Ronald P. O'Hanley (1957) |
| Year of Election or Appointment: 2011 Mr. O'Hanley serves as a Trustee and Chairman of the Board of Trustees of other Fidelity funds (2013-present), and is Director of FMR Co., Inc. (2010-present), Director of Fidelity Investments Money Management, Inc. (2010-present), Director of Fidelity Research & Analysis Company (2010-present), President of Fidelity Asset Management and Corporate Services and a Member of Fidelity's Executive Committee (2010-present). Previously, Mr. O'Hanley served as President and Chief Executive Officer of BNY Mellon Asset Management (2007-2010). Mr. O'Hanley also served as Vice Chairman of Bank New York Mellon Corp. and a member of that firm's Executive Committee. Prior to the 2007 merger of The Bank of New York and Mellon Financial Corporation, he was Vice Chairman of Mellon Financial Corporation and President and Chief Executive Officer of Mellon Asset Management. He joined Mellon in February 1997. Mr. O'Hanley currently serves as Chairman of the Boston Public Library Foundation Board of Directors and sits on the Board of Directors of Beth Israel Deaconess Medical Center, the Board of Trustees of the Marine Biological Laboratory and the Advisory Board of the Maxwell School of Citizenship and Public Administration at Syracuse University. Mr. O'Hanley also chairs the Council on Asset Management for the Financial Services Roundtable and is a member of the Board of Directors of Institutional Investor's U.S. Institute. |
* Trustees have been determined to be "Interested Trustees" by virtue of, among other things, their affiliation with the trust or various entities under common control with FMR.
+ The information above includes each Trustee's principal occupation during the last five years and other information relating to the experience, attributes, and skills relevant to each Trustee's qualifications to serve as a Trustee, which led to the conclusion that each Trustee should serve as a Trustee for the fund.
Annual Report
Trustees and Officers - continued
Independent Trustees:
Correspondence intended for each Independent Trustee (that is, the Trustees other than the Interested Trustees) may be sent to Fidelity Investments, P.O. Box 55235, Boston, Massachusetts 02205-5235.
Name, Year of Birth; Principal Occupations and Other Relevant Experience+ |
Dennis J. Dirks (1948) |
| Year of Election or Appointment: 2005 Prior to his retirement in May 2003, Mr. Dirks was Chief Operating Officer and a member of the Board of The Depository Trust & Clearing Corporation (DTCC). He also served as President, Chief Operating Officer, and Board member of The Depository Trust Company (DTC) and President and Board member of the National Securities Clearing Corporation (NSCC). In addition, Mr. Dirks served as Chief Executive Officer and Board member of the Government Securities Clearing Corporation, Chief Executive Officer and Board member of the Mortgage-Backed Securities Clearing Corporation, as a Trustee and a member of the Finance Committee of Manhattan College (2005-2008), and as a Trustee and a member of the Finance Committee of AHRC of Nassau County (2006-2008). Mr. Dirks is a member of the Independent Directors Council (IDC) Governing Council (2010-present) and Board of Directors for The Brookville Center for Children's Services, Inc. (2009-present). |
Alan J. Lacy (1953) |
| Year of Election or Appointment: 2008 Mr. Lacy serves as Senior Adviser (2007-present) of Oak Hill Capital Partners, L.P. (private equity). Mr. Lacy also served as Chief Executive Officer (2000-2005) and Vice Chairman (2005-2006) of Sears Holdings Corporation and Sears, Roebuck and Co. (retail). In addition, Mr. Lacy serves as a member of the Board of Directors of Dave & Buster's Entertainment, Inc. (restaurant and entertainment complexes, 2010-present), Earth Fare, Inc. (retail grocery, 2012-present), The Hillman Companies, Inc. (hardware wholesalers, 2010-present), and Bristol-Myers Squibb Company (global pharmaceuticals, 2008-present). Mr. Lacy is a member of the Board of Trustees of The National Parks Conservation Association (2006-present). Previously, Mr. Lacy served as Chairman of the Board of Trustees of the National Parks Conservation Association (2008-2011) and as a member of the Board of Directors for the Western Union Company (global money transfer, 2006-2011). |
Ned C. Lautenbach (1944) |
| Year of Election or Appointment: 2000 Mr. Lautenbach is Chairman of the Independent Trustees of the Equity and High Income Funds (2006-present) and serves as a Trustee of other Fidelity funds (2013-present). Mr. Lautenbach currently serves as the Lead Director of the Eaton Corporation Board of Directors (diversified industrial, 1997-present). Mr. Lautenbach is Chairman of the Board of Directors of the Philharmonic Center for the Arts in Naples, Florida (2012-present) and a member of the Council on Foreign Relations (1994-present). Previously, Mr. Lautenbach was a Partner/Advisory Partner at Clayton, Dubilier & Rice, LLC (private equity investment, 1998-2010), as well as a Director of Sony Corporation (2006-2007). |
Joseph Mauriello (1944) |
| Year of Election or Appointment: 2008 Prior to his retirement in January 2006, Mr. Mauriello served in numerous senior management positions including Deputy Chairman and Chief Operating Officer (2004-2005), and Vice Chairman of Financial Services (2002-2004) of KPMG LLP US (professional services, 1965-2005). Mr. Mauriello currently serves as a member of the Board of Directors of XL Group plc. (global insurance and re-insurance, 2006-present). Previously, Mr. Mauriello served as a Director of the Hamilton Funds of the Bank of New York (2006-2007) and of Arcadia Resources Inc. (health care services and products, 2007-2012). |
Robert W. Selander (1950) |
| Year of Election or Appointment: 2011 Previously, Mr. Selander served as a Member of the Advisory Board of Fidelity's Equity and High Income Funds (2011), Executive Vice Chairman (2010), Chief Executive Officer (2009-2010), and President and Chief Executive Officer (1997-2009) of Mastercard, Inc. |
Cornelia M. Small (1944) |
| Year of Election or Appointment: 2005 Ms. Small is a member of the Board of Directors (2009-present) and Chair of the Investment Committee (2010-present) of the Teagle Foundation. Ms. Small also serves on the Investment Committee of the Berkshire Taconic Community Foundation (2008-present). Previously, Ms. Small served as Chairperson (2002-2008) and a member of the Investment Committee and Chairperson (2008-2012) and a member of the Board of Trustees of Smith College. In addition, Ms. Small served as Chief Investment Officer, Director of Global Equity Investments, and a member of the Board of Directors of Scudder, Stevens & Clark and Scudder Kemper Investments. |
William S. Stavropoulos (1939) |
| Year of Election or Appointment: 2002 Mr. Stavropoulos is Vice Chairman of the Independent Trustees of the Equity and High Income Funds (2006-present) and serves as a Trustee of other Fidelity funds (2013-present). Mr. Stavropoulos serves as President and Founder of the Michigan Baseball Foundation, the Great Lakes Loons (2007-present). Mr. Stavropoulos is Chairman Emeritus of the Board of Directors of The Dow Chemical Company, where he previously served in numerous senior management positions, including President, CEO (1995-2000; 2002-2004), Chairman of the Executive Committee (2000-2006), and as a member of the Board of Directors (1990-2006). Currently, Mr. Stavropoulos is Chairman of the Board of Directors of Univar Inc. (global distributor of commodity and specialty chemicals), a Director of Teradata Corporation (data warehousing and technology solutions), and Maersk Inc. (industrial conglomerate), and a member of the Advisory Board for Metalmark Capital LLC (private equity investment, 2005-present). Mr. Stavropoulos is an operating advisor to Clayton, Dubilier & Rice, LLC (private equity investment). In addition, Mr. Stavropoulos is a member of the University of Notre Dame Advisory Council for the College of Science, a Trustee of the Rollin L. Gerstacker Foundation, and a Director of the Naples Philharmonic Center for the Arts. Previously, Mr. Stavropoulos served as a Director of Chemical Financial Corporation (bank holding company, 1993-2012) and Tyco International, Ltd. (multinational manufacturing and services, 2007-2012). |
David M. Thomas (1949) |
| Year of Election or Appointment: 2008 Previously, Mr. Thomas served as Executive Chairman (2005-2006) and Chairman and Chief Executive Officer (2000-2005) of IMS Health, Inc. (pharmaceutical and healthcare information solutions), and a Director of Fortune Brands, Inc. (consumer products, 2000-2011). In addition, Mr. Thomas serves as Non-Executive Chairman of the Board of Directors of Fortune Brands Home and Security (home and security products, 2011-present), and as a member of the Board of Directors of Interpublic Group of Companies, Inc. (marketing communication, 2004-present). |
+ The information above includes each Trustee's principal occupation during the last five years and other information relating to the experience, attributes, and skills relevant to each Trustee's qualifications to serve as a Trustee, which led to the conclusion that each Trustee should serve as a Trustee for the fund.
Annual Report
Advisory Board Member and Executive Officers:
Correspondence intended for each executive officer and Peter S. Lynch may be sent to Fidelity Investments, 245 Summer Street, Boston, Massachusetts 02210.
Name, Year of Birth; Principal Occupation |
Peter S. Lynch (1944) |
| Year of Election or Appointment: 2003 Member of the Advisory Board of Fidelity's Equity and High Income Funds. Mr. Lynch is Vice Chairman and a Director of FMR and FMR Co., Inc. In addition, Mr. Lynch serves as a Trustee of Boston College and as the Chairman of the Inner-City Scholarship Fund. Previously, Mr. Lynch served on the Special Olympics International Board of Directors (1997-2006). |
Kenneth B. Robins (1969) |
| Year of Election or Appointment: 2008 President and Treasurer of Fidelity's Equity and High Income Funds. Mr. Robins also serves as President and Treasurer (2008-present) and Assistant Treasurer (2009-present) of other Fidelity funds and is an employee of Fidelity Investments (2004-present). Mr. Robins serves as Executive Vice President of Fidelity Investments Money Management, Inc. (FIMM) (2013-present). Previously, Mr. Robins served as Deputy Treasurer of the Fidelity funds (2005-2008) and Treasurer and Chief Financial Officer of The North Carolina Capital Management Trust: Cash and Term Portfolios (2006-2008). |
Brian B. Hogan (1964) |
| Year of Election or Appointment: 2009 Vice President of Equity and High Income Funds. Mr. Hogan also serves as Vice President of other Fidelity funds (2009-present) and President of FMR's Equity Division (2009-present). Previously, Mr. Hogan served as Senior Vice President, Equity Research of FMR (2006-2009) and as a portfolio manager. |
Thomas C. Hense (1964) |
| Year of Election or Appointment: 2008 or 2010 Vice President of Fidelity's High Income (2008), Small Cap (2008), and Value (2010) Funds. Previously, Mr. Hense served as a portfolio manager for Fidelity's Institutional Money Management Group (Pyramis) (2003-2008). |
Scott C. Goebel (1968) |
| Year of Election or Appointment: 2008 Secretary and Chief Legal Officer (CLO) of the Fidelity funds. Mr. Goebel also serves as Secretary of Fidelity Investments Money Management, Inc. (FIMM) (2010-present) and Fidelity Research and Analysis Company (FRAC) (2010-present); Secretary and CLO of The North Carolina Capital Management Trust: Cash and Term Portfolios (2008-present); General Counsel, Secretary, and Senior Vice President of FMR (2008-present) and FMR Co., Inc. (2008-present); employed by FMR LLC or an affiliate (2001-present); Chief Legal Officer of Fidelity Management & Research (Hong Kong) Limited (2008-present) and Assistant Secretary of Fidelity Management & Research (Japan) Inc. (2008-present), and Fidelity Management & Research (U.K.) Inc. (2008-present). Previously, Mr. Goebel served as Assistant Secretary of FIMM (2008-2010), FRAC (2008-2010), and the Funds (2007-2008) and as Vice President and Secretary of Fidelity Distributors Corporation (FDC) (2005-2007). |
William C. Coffey (1969) |
| Year of Election or Appointment: 2009 Assistant Secretary of Fidelity's Equity and High Income Funds. Mr. Coffey also serves as Assistant Secretary of other Fidelity funds (2009-present), Senior Vice President and Deputy General Counsel of FMR LLC (2010-present), and is an employee of Fidelity Investments. Previously, Mr. Coffey served as Vice President and Associate General Counsel of FMR LLC (2005-2009). |
Elizabeth Paige Baumann (1968) |
| Year of Election or Appointment: 2012 Anti-Money Laundering (AML) Officer of the Fidelity funds. Ms. Baumann also serves as AML Officer of The North Carolina Capital Management Trust: Cash and Term Portfolios (2012-present), Chief AML Officer of FMR LLC (2012-present), and is an employee of Fidelity Investments. Previously, Ms. Baumann served as Vice President and Deputy Anti-Money Laundering Officer (2007-2012). |
Christine Reynolds (1958) |
| Year of Election or Appointment: 2008 Chief Financial Officer of the Fidelity funds. Ms. Reynolds became President of Fidelity Pricing and Cash Management Services (FPCMS) in August 2008. Ms. Reynolds served as Chief Operating Officer of FPCMS (2007-2008). Previously, Ms. Reynolds served as President, Treasurer, and Anti-Money Laundering officer of the Fidelity funds (2004-2007). |
Joseph A. Hanlon (1968) |
| Year of Election or Appointment: 2012 Chief Compliance Officer of Fidelity's Equity and High Income Funds. Mr. Hanlon also serves as Chief Compliance Officer of other Fidelity funds (2012-present). Mr. Hanlon serves as Compliance Officer of FMR, FMR Co., Inc., Fidelity Investments Money Management, Inc. (FIMM), Fidelity Research and Analysis Company (FRAC), and Fidelity Management & Research (Hong Kong) (2009-present), as Senior Vice President of the Fidelity Asset Management Division (2009-present), and is an employee of Fidelity Investments. Previously, Mr. Hanlon served as Compliance Officer of Fidelity Management & Research (Japan) Inc. (2009-2013), Strategic Advisers, Inc. (2009-2013), and Fidelity Management & Research (U.K.) Inc. (2009-2013). |
Joseph F. Zambello (1957) |
| Year of Election or Appointment: 2011 Deputy Treasurer of the Fidelity funds. Mr. Zambello is an employee of Fidelity Investments. Previously, Mr. Zambello served as Vice President of FMR's Program Management Group (2009-2011) and Vice President of the Transfer Agent Oversight Group (2005-2009). |
Adrien E. Deberghes (1967) |
| Year of Election or Appointment: 2008 Deputy Treasurer of Fidelity's Equity and High Income Funds. Mr. Deberghes also serves as Vice President (2011-present), Deputy Treasurer (2008-present), and Assistant Treasurer (2010-present) of other Fidelity funds, and is an employee of Fidelity Investments (2008-present). Previously, Mr. Deberghes served as Senior Vice President of Mutual Fund Administration at State Street Corporation (2007-2008), Senior Director of Mutual Fund Administration at Investors Bank & Trust (2005-2007), and Director of Finance for Dunkin' Brands (2000-2005). |
Stephen Sadoski (1971) |
| Year of Election or Appointment: 2012 Deputy Treasurer of Fidelity's Equity and High Income Funds. Mr. Sadoski also serves as Deputy Treasurer of other Fidelity funds (2012-present) and is an employee of Fidelity Investments (2012-present). Previously, Mr. Sadoski served as Assistant Treasurer of Fidelity's Fixed Income and Asset Allocation Funds (2012-2013), an assistant chief accountant in the Division of Investment Management of the Securities and Exchange Commission (SEC) (2009-2012) and as a senior manager at Deloitte & Touche LLP (1997-2009). |
Stacie M. Smith (1974) |
| Year of Election or Appointment: 2013 Deputy Treasurer of Fidelity's Equity and High Income Funds. Ms. Smith also serves as Deputy Treasurer of other Fidelity funds (2013-present) and is an employee of Fidelity Investments (2009-present). Previously, Ms. Smith served as Senior Audit Manager of Ernst & Young LLP (1996-2009). |
Stephanie J. Dorsey (1969) |
| Year of Election or Appointment: 2010 Assistant Treasurer of Fidelity's Equity and High Income Funds. Ms. Dorsey also serves as President and Treasurer (2013-present) and Assistant Treasurer (2010-present) of other Fidelity funds, Treasurer and Chief Financial Officer of The North Carolina Capital Management Trust: Cash and Term Portfolios (2013-present), and is an employee of Fidelity Investments (2008-present). Previously, Ms. Dorsey served as Deputy Treasurer of Fidelity's Fixed Income and Asset Allocation Funds (2008-2013), Treasurer (2004-2008) of the JPMorgan Mutual Funds and Vice President (2004-2008) of JPMorgan Chase Bank. |
Gary W. Ryan (1958) |
| Year of Election or Appointment: 2005 Assistant Treasurer of the Fidelity funds. Mr. Ryan is an employee of Fidelity Investments. Previously, Mr. Ryan served as Vice President of Fund Reporting in Fidelity Pricing and Cash Management Services (FPCMS) (1999-2005). |
Jonathan Davis (1968) |
| Year of Election or Appointment: 2010 Assistant Treasurer of the Fidelity funds. Mr. Davis is also Assistant Treasurer of Fidelity Rutland Square Trust II and Fidelity Commonwealth Trust II. Mr. Davis is an employee of Fidelity Investments. Previously, Mr. Davis served as Vice President and Associate General Counsel of FMR LLC (2003-2010). |
Annual Report
The Board of Trustees of Fidelity Series Small Cap Opportunities Fund voted to pay to shareholders of record at the opening of business on record date, the following distributions per share derived from capital gains realized from sales of portfolio securities:
| Pay Date | Record Date | Capital Gains |
Fidelity Series Small Cap Opportunities Fund | 09/16/13 | 09/13/13 | $1.004 |
|
Class F | 09/16/13 | 09/13/13 | $1.019 |
The fund hereby designates as a capital gain dividend with respect to the taxable year ended July 31, 2013, $198,146,455, or, if subsequently determined to be different, the net capital gain of such year.
Series Small Cap Opportunities and Class F designate 100% of the dividends distributed during the fiscal year as qualifying for the dividends-received deduction for corporate shareholders.
Series Small Cap Opportunities and Class F designate 100% of the dividends distributed during the fiscal year as amounts which may be taken into account as a dividend for purposes of the maximum rate under section 1(h)(11) of the Internal Revenue Code.
The fund will notify shareholders in January 2014 of amounts for use in preparing 2013 income tax returns.
Annual Report
Board Approval of Investment Advisory Contracts and Management Fees
Fidelity Series Small Cap Opportunities Fund
Each year, the Board of Trustees, including the Independent Trustees (together, the Board), votes on the renewal of the management contract and sub-advisory agreements (together, the Advisory Contracts) for the fund. The Board, assisted by the advice of fund counsel and Independent Trustees' counsel, requests and considers a broad range of information relevant to the renewal of the Advisory Contracts throughout the year.
The Board meets regularly and, at each of its meetings, covers an extensive agenda of topics and materials and considers factors that are relevant to its annual consideration of the renewal of the fund's Advisory Contracts, including the services and support provided to the fund and its shareholders. The Board has established various standing committees, each composed of and chaired by Independent Trustees with varying backgrounds, to which the Board has assigned specific subject matter responsibilities in order to enhance effective decision-making by the Board. The Board, acting directly and through its Committees, requests and receives information concerning the annual consideration of the renewal of the fund's Advisory Contracts. The Board also meets as needed to consider matters specifically related to the Board's annual consideration of the renewal of Advisory Contracts. Members of the Board may also meet with trustees of other Fidelity funds through ad hoc joint committees to discuss certain matters relevant to the Fidelity funds.
At its July 2013 meeting, the Board, including the Independent Trustees, unanimously determined to renew the fund's Advisory Contracts. In reaching its determination, the Board considered all factors it believed relevant, including (i) the nature, extent, and quality of the services to be provided to the fund and its shareholders (including the investment performance of the fund); (ii) the competitiveness of the fund's management fee and total expense ratio relative to peer funds; (iii) the total costs of the services to be provided by and the profits to be realized by Fidelity from its relationship with the fund; (iv) the extent to which economies of scale exist and would be realized as the fund grows; and (v) whether fee levels reflect these economies of scale, if any, for the benefit of fund shareholders.
In considering whether to renew the Advisory Contracts for the fund, the Board reached a determination, with the assistance of fund counsel and Independent Trustees' counsel and through the exercise of its business judgment, that the renewal of the Advisory Contracts was in the best interests of the fund and its shareholders and that the compensation payable under the Advisory Contracts was fair and reasonable. The Board's decision to renew the Advisory Contracts was not based on any single factor, but rather was based on a comprehensive consideration of all the information provided to the Board at its meetings throughout the year. The Board, in reaching its determination to renew the Advisory Contracts, was aware that shareholders in the fund have a broad range of investment choices available to them, including a wide choice among mutual funds offered by Fidelity's competitors, and that the fund's shareholders, who have the opportunity to review and weigh the disclosure provided by the fund in its prospectus and other public disclosures, have chosen to invest in this fund, which is a part of the Fidelity family of funds.
Annual Report
Nature, Extent, and Quality of Services Provided. The Board considered the staffing within the investment adviser, Fidelity Management & Research Company (FMR), and the sub-advisers (together, the Investment Advisers) as it relates to the fund, including the backgrounds of the fund's investment personnel, and also considered the fund's investment objective, strategies, and related investment philosophy. The Independent Trustees also had discussions with senior management of Fidelity's investment operations and investment groups. The Board considered the structure of the portfolio manager compensation program and whether this structure provides appropriate incentives to act in the best interests of the fund.
Resources Dedicated to Investment Management and Support Services. The Board and the Fund Oversight and Research Committees reviewed the general qualifications and capabilities of the Investment Advisers' investment staff, including its size, education, experience, and resources, as well as the Investment Advisers' approach to recruiting, training, managing, and compensating investment personnel. The Board noted that FMR has continued to increase the resources devoted to non-U.S. offices, including expansion of Fidelity's global investment organization. The Board also noted that Fidelity's analysts have extensive resources, tools and capabilities that allow them to conduct sophisticated quantitative and fundamental analysis, as well as credit analysis of issuers, counterparties and guarantors. Further, the Board believes that Fidelity's investment professionals have sufficient access to global information and data so as to provide competitive investment results over time, and that those professionals also have access to sophisticated tools that permit them to assess portfolio construction and risk and performance attribution characteristics continuously, as well as to transmit new information and research conclusions rapidly around the world. Additionally, in its deliberations, the Board considered the Investment Advisers' trading and risk management capabilities and resources, which are an integral part of the investment management process.
Shareholder and Administrative Services. The Board considered (i) the nature, extent, quality, and cost of advisory, administrative, and shareholder services performed by the Investment Advisers and their affiliates under the Advisory Contracts and under separate agreements covering transfer agency, pricing and bookkeeping, and securities lending services for the fund; (ii) the nature and extent of the supervision of third party service providers, principally custodians and subcustodians; and (iii) the resources devoted to, and the record of compliance with, the fund's compliance policies and procedures. The Board also reviewed the allocation of fund brokerage, including allocations to brokers affiliated with the Investment Advisers, the use of brokerage commissions to pay fund expenses, and the use of "soft" commission dollars to pay for research services.
Annual Report
Board Approval of Investment Advisory Contracts and
Management Fees - continued
The Board noted that the growth of fund assets over time across the complex allows Fidelity to reinvest in the development of services designed to enhance the value or convenience of the Fidelity funds as investment vehicles. These services include 24-hour access to account information and market information through telephone representatives and over the Internet, investor education materials and asset allocation tools, and the expanded availability of Fidelity Investor Centers.
Investment in a Large Fund Family. The Board considered the benefits to shareholders of investing in a Fidelity fund, including the benefits of investing in a fund that is part of a large family of funds offering a variety of investment disciplines and providing a large variety of mutual fund investor services. The Board noted that Fidelity had taken, or had made recommendations that resulted in the Fidelity funds taking, a number of actions over the previous year that benefited particular funds, including (i) continuing to dedicate additional resources to investment research and to the support of the senior management team that oversees asset management; (ii) persisting in efforts to enhance Fidelity's global research capabilities; (iii) launching new funds and making other enhancements to meet client needs for global and income-oriented solutions; (iv) continuing to launch dedicated lower cost underlying funds to meet portfolio construction needs related to expanding underlying fund options for Fidelity funds of funds, specifically for the Freedom Fund product lines; (v) rationalizing product lines and gaining increased efficiencies through the mergers of several funds into other funds; (vi) strengthening Fidelity's index fund offerings by reducing investment minimums and adopting or lowering existing expense caps for certain funds and classes; (vii) enhancing Global Asset Allocation product offerings by launching new funds and strategies, including "open architecture" target date funds that utilize affiliated and unaffiliated sub-advisers; (viii) modifying the eligibility criteria for Institutional Class shares of Advisor funds to increase their marketability to a portion of the defined contribution plan market; (ix) creating a new low-cost retirement share class for certain Advisor funds to appeal to large retirement plans; (x) transitioning the management of certain Fidelity commodity funds to Geode Capital Management LLC, a registered commodity pool operator, while retaining administrative responsibilities for the funds; (xi) reorganizing a number of funds; and (xii) taking steps toward establishing a new Fidelity adviser to manage sector-based funds and products.
Investment Performance. The Board considered whether the fund has operated in accordance with its investment objective, as well as its record of compliance with its investment restrictions and its performance history. The Board noted that there was a portfolio management change for a sleeve of the fund in March 2011.
Annual Report
The Board took into account discussions with the Investment Advisers about fund investment performance that occur at Board meetings throughout the year. In this regard the Board noted that as part of regularly scheduled fund reviews and other reports to the Board on fund performance, the Board periodically considers annualized return information for the fund, for different time periods, measured against a securities market index ("benchmark index") and a peer group of mutual funds with similar objectives ("peer group"). In its evaluation of fund investment performance, the Board gave particular attention to information indicating changes in performance of certain Fidelity funds for specific time periods and the Investment Advisers' explanations for any overperformance or underperformance.
In addition to reviewing absolute and relative fund performance, the Independent Trustees periodically consider the appropriateness of fund performance metrics in evaluating the results achieved. In general, the Independent Trustees believe that fund performance should be evaluated based on net performance (after fees and expenses) of both the highest performing and lowest performing classes, where applicable, compared to appropriate benchmark indices, over appropriate time periods which may include full market cycles, and compared to peer groups, as applicable, over the same periods, taking into account relevant factors including the following: general market conditions; issuer-specific information; tactical opportunities for investment; and fund cash flows and other factors.
The Independent Trustees recognize that shareholders evaluate performance on a net basis over their own holding periods, for which one-, three-, and five-year periods are used as a proxy. For this reason, the performance information reviewed by the Board also included net cumulative calendar year total return information for the fund and an appropriate benchmark index and peer group for the most recent one-, three-, and five-year periods, as shown below. Returns are shown compared to the 25th percentile (top of box) and 75th percentile (bottom of box) of the peer universe.
Annual Report
Board Approval of Investment Advisory Contracts and
Management Fees - continued
Fidelity Series Small Cap Opportunities Fund
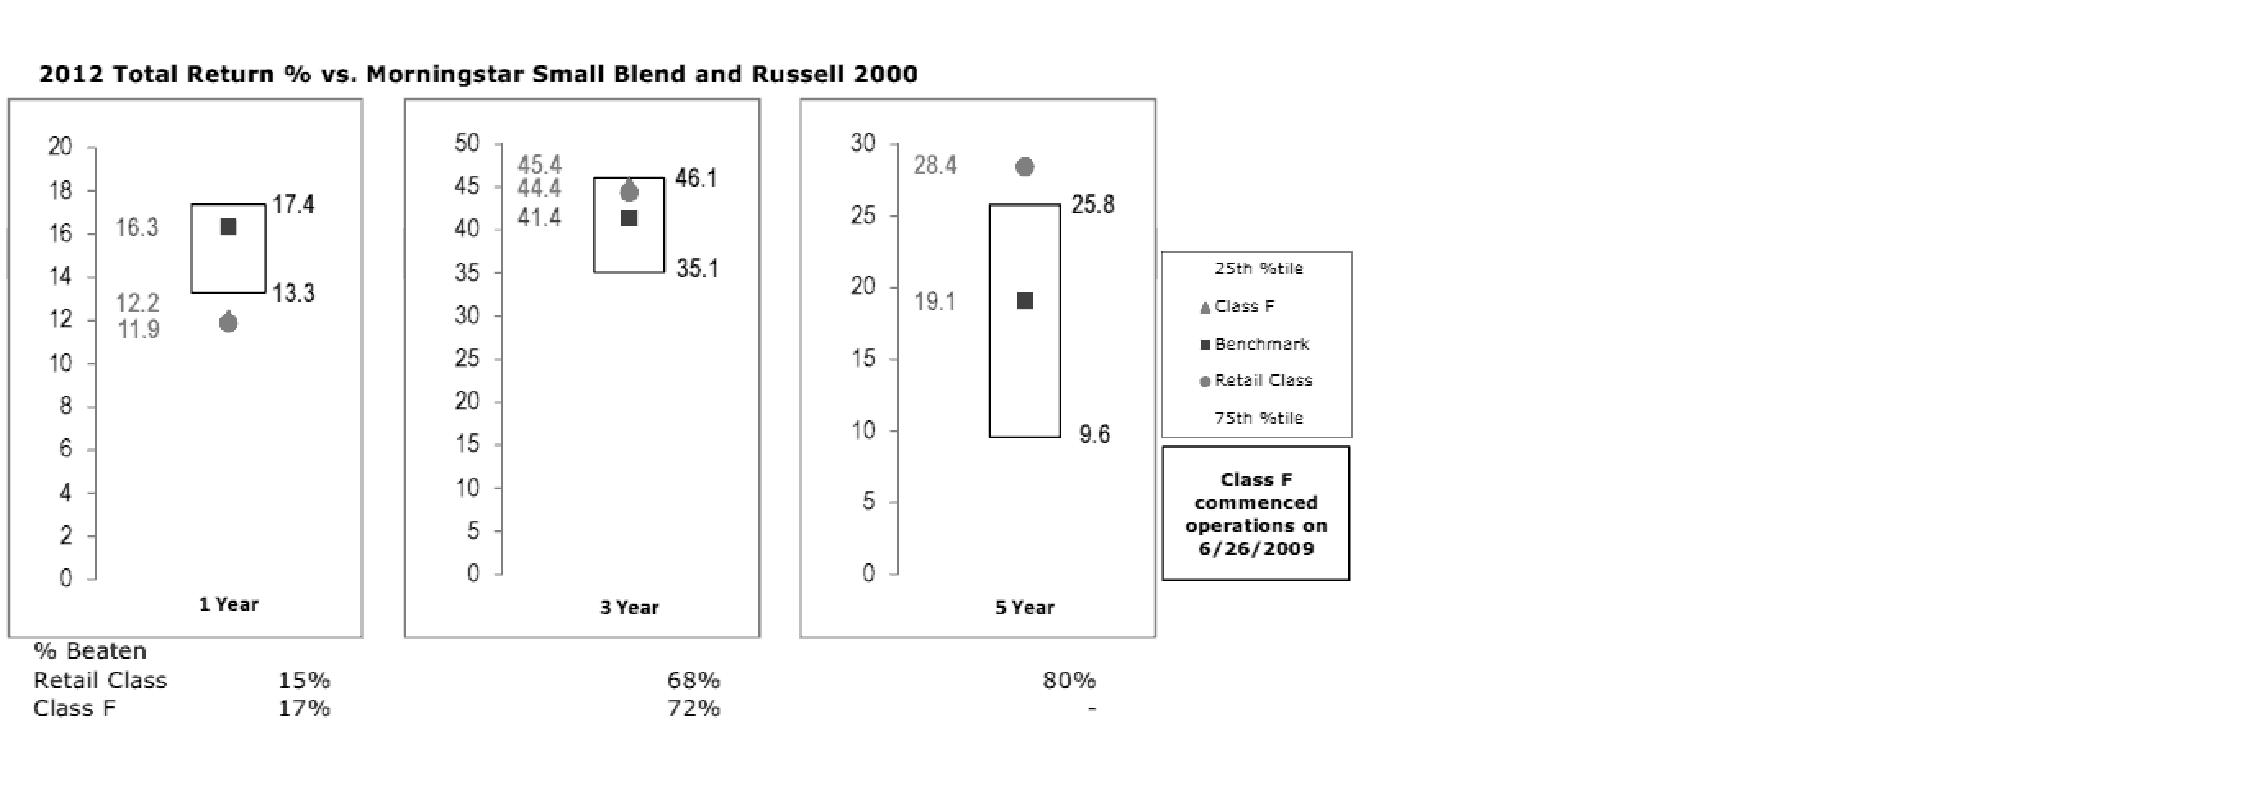
The Board also considered that the fund's management fee is subject to upward or downward adjustment depending upon whether, and to what extent, the fund's investment performance for the performance period exceeds, or is exceeded by, a securities index, thus leading to a performance adjustment for the same period. The Board noted that the performance adjustment provides FMR with a strong economic incentive to seek to achieve superior performance for the fund's shareholders and helps to more closely align the interests of FMR and the fund's shareholders.
Based on its review, the Board concluded that the nature, extent, and quality of services provided to the fund under the Advisory Contracts should benefit the fund's shareholders.
Competitiveness of Management Fee and Total Expense Ratio. The Board considered the fund's management fee and total expense ratio compared to "mapped groups" of competitive funds and classes. Fidelity creates "mapped groups" by combining similar Lipper investment objective categories that have comparable management fee characteristics. Combining Lipper investment objective categories aids the Board's management fee and total expense ratio comparisons by broadening the competitive group used for comparison and by reducing the number of universes to which various Fidelity funds are compared.
Management Fee. The Board considered two proprietary management fee comparisons for the 12-month periods shown in the chart below. The group of Lipper funds used by the Board for management fee comparisons is referred to below as the "Total Mapped Group." The Total Mapped Group comparison focuses on a fund's standing in terms of gross management fees before expense reimbursements or caps, and without giving effect to the fund's performance adjustment, relative to the total universe of funds with comparable investment mandates, regardless of whether their management fee structures also are comparable. Funds with comparable investment mandates offer exposure to similar types of securities. Funds with comparable management fee structures have similar management fee contractual arrangements (e.g., flat rate charged for advisory services, all-inclusive fee rate, etc.). "TMG %" represents the percentage of funds in the Total Mapped Group that had management fees that were lower than the fund's. For example, a TMG % of 14% means that 86% of the funds in the Total Mapped Group had higher management fees than the fund. The "Asset-Size Peer Group" (ASPG) comparison focuses on a fund's standing relative to a subset of non-Fidelity funds within the Total Mapped Group that are similar in size and management fee structure. The ASPG represents at least 15% of the funds in the Total Mapped Group with comparable asset size and management fee structures, subject to a minimum of 50 funds (or all funds in the Total Mapped Group if fewer than 50). Additional information, such as the ASPG quartile in which the fund's management fee ranked and the impact of the fund's performance adjustment, is also included in the chart and considered by the Board.
Annual Report
Fidelity Series Small Cap Opportunities Fund
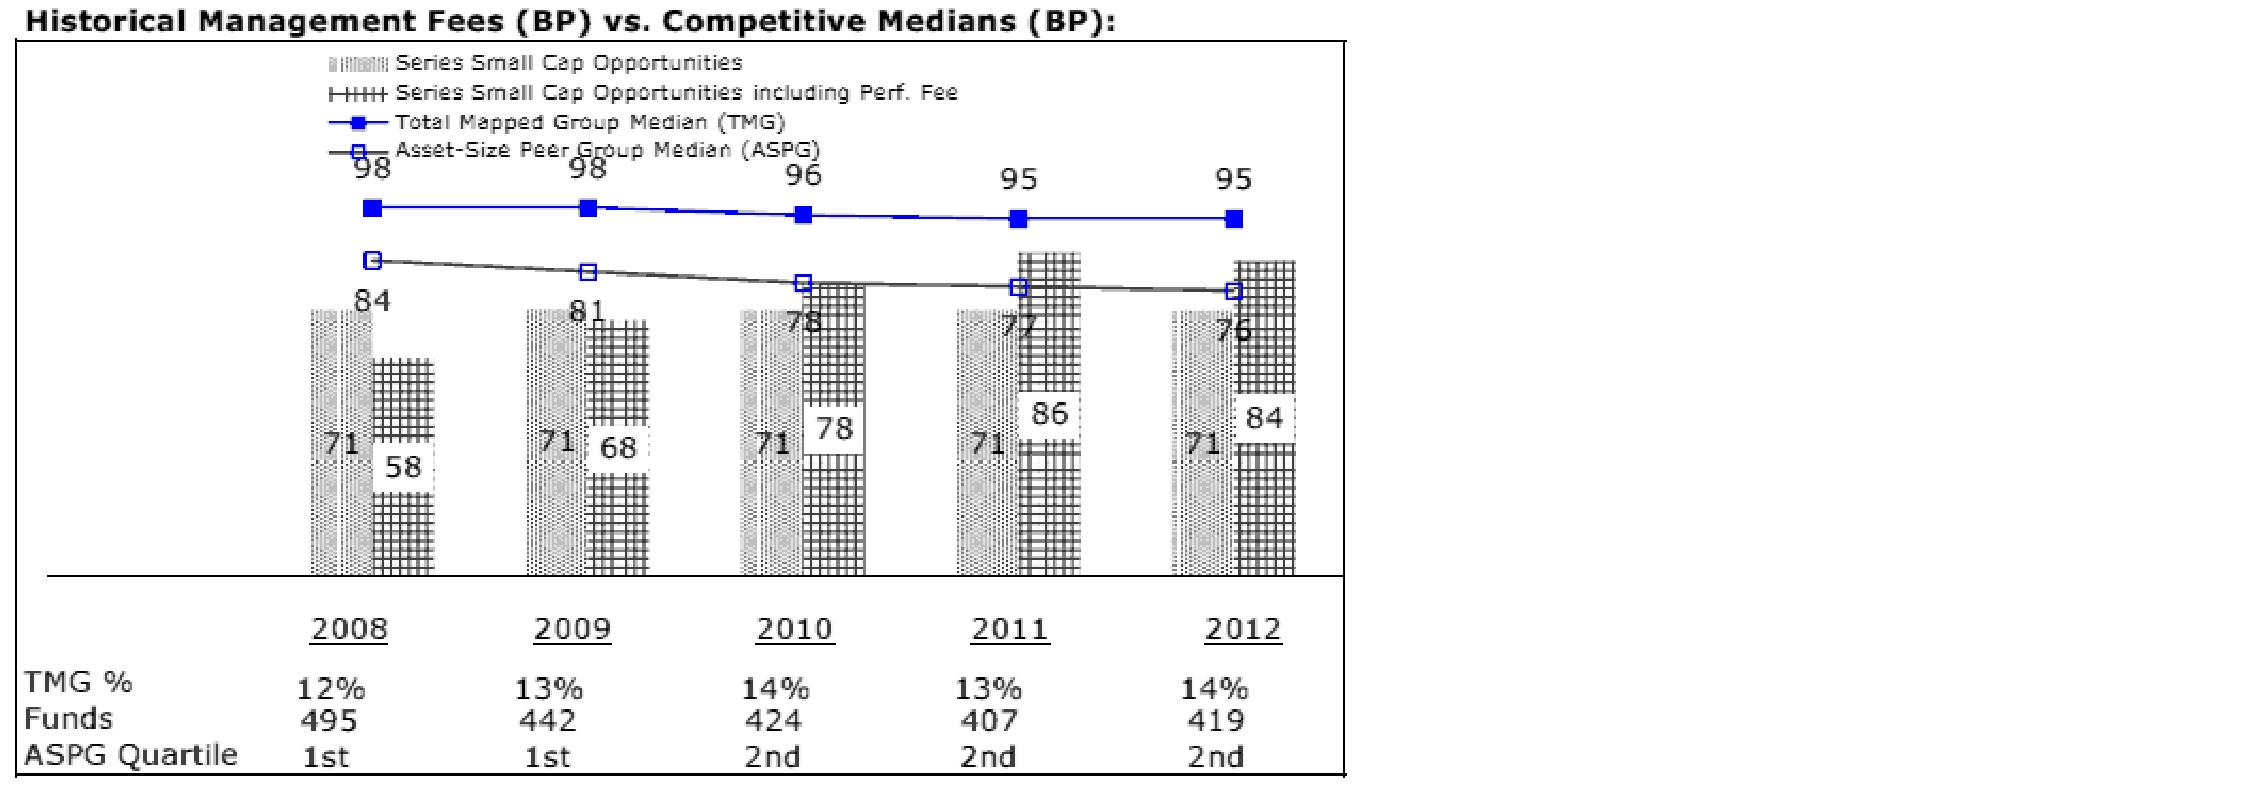
The Board noted that the fund's management fee ranked below the median of its Total Mapped Group and below the median of its ASPG for 2012. The Board also noted the effect of the fund's positive performance adjustment on the fund's management fee ranking.
Annual Report
Board Approval of Investment Advisory Contracts and
Management Fees - continued
Based on its review, the Board concluded that the fund's management fee is fair and reasonable in light of the services that the fund receives and the other factors considered.
Total Expense Ratio. In its review of each class's total expense ratio, the Board considered the fund's management fee as well as other fund or class expenses, as applicable, such as transfer agent fees, pricing and bookkeeping fees, and custodial, legal, and audit fees. The Board also noted the effects of any waivers and reimbursements on fees and expenses, as well as the impact of the fund's performance adjustment. As part of its review, the Board also considered the current and historical total expense ratios of each class of the fund compared to competitive fund median expenses. Each class of the fund is compared to those funds and classes in the Total Mapped Group (used by the Board for management fee comparisons) that have a similar sales load structure.
The Board noted that the total expense ratio of each class ranked below its competitive median for 2012.
Fees Charged to Other Fidelity Clients. The Board also considered Fidelity fee structures and other information with respect to clients of FMR and its affiliates, such as other mutual funds advised or subadvised by FMR or its affiliates, pension plan clients, and other institutional clients. The Board noted the findings of the 2013 ad hoc joint committee (created with the board of other Fidelity funds), which reviewed and compared Fidelity's institutional investment advisory business with its business of providing services to the Fidelity funds, including the differences in services provided, fees charged, and costs incurred, as well as competition in their respective marketplaces.
Based on its review of total expense ratios and fees charged to other Fidelity clients, the Board concluded that the total expense ratio of each class of the fund was reasonable in light of the services that the fund and its shareholders receive and the other factors considered.
Costs of the Services and Profitability. The Board considered the revenues earned and the expenses incurred by Fidelity in conducting the business of developing, marketing, distributing, managing, administering and servicing the fund and servicing the fund's shareholders. The Board also considered the level of Fidelity's profits in respect of all the Fidelity funds.
On an annual basis, FMR presents to the Board Fidelity's profitability for the fund. Fidelity calculates the profitability for each fund, as well as aggregate profitability for groups of Fidelity funds and all Fidelity funds, using a series of detailed revenue and cost allocation methodologies which originate with the books and records of Fidelity on which Fidelity's audited financial statements are based. The Audit Committee of the Board reviews any significant changes from the prior year's methodologies.
Annual Report
PricewaterhouseCoopers LLP (PwC), independent registered public accounting firm and auditor to Fidelity and certain Fidelity funds, has been engaged annually by the Board as part of the Board's assessment of Fidelity's profitability analysis. PwC's engagement includes the review and assessment of the methodologies used by Fidelity in determining the revenues and expenses attributable to Fidelity's mutual fund business, and completion of agreed-upon procedures surrounding the mathematical accuracy of fund profitability and its conformity to allocation methodologies. After considering PwC's reports issued under the engagement and information provided by Fidelity, the Board concluded that while other allocation methods may also be reasonable, Fidelity's profitability methodologies are reasonable in all material respects.
The Board also reviewed Fidelity's non-fund businesses and fall-out benefits related to the mutual fund business as well as cases where Fidelity's affiliates may benefit from or be related to the fund's business.
The Board considered the costs of the services provided by and the profits realized by Fidelity in connection with the operation of the fund and was satisfied that the profitability was not excessive in the circumstances.
Economies of Scale. The Board considered whether there have been economies of scale in respect of the management of the Fidelity funds, whether the Fidelity funds (including the fund) have appropriately benefited from any such economies of scale, and whether there is potential for realization of any further economies of scale. The Board considered the extent to which the fund will benefit from economies of scale through increased services to the fund, through waivers or reimbursements, or through fee or expense reductions. The Board also noted that in 2009, it and the board of other Fidelity funds created an ad hoc committee (the Economies of Scale Committee) to analyze whether FMR attains economies of scale in respect of the management and servicing of the Fidelity funds, whether the Fidelity funds have appropriately benefited from such economies of scale, and whether there is potential for realization of any further economies of scale.
The Board recognized that the fund's management contract incorporates a "group fee" structure, which provides for lower group fee rates as total fund assets under FMR's management increase, and for higher group fee rates as total fund assets under FMR's management decrease. FMR calculates the group fee rates based on a tiered asset "breakpoint" schedule that varies based on asset class. The Board considered that the group fee is designed to deliver the benefits of economies of scale to fund shareholders when total Fidelity fund assets increase, even if assets of any particular fund are unchanged or have declined, because some portion of Fidelity's costs are attributable to services provided to all Fidelity funds, and all funds benefit if those costs can be allocated among more assets. The Board also considered that although the fund is offered only to other funds advised by FMR or an affiliate, it continues to incur investment management expenses. The Board further noted that the fund may continue to realize benefits from the group fee structure, even though assets may not be expected to grow significantly at the fund level. The Board concluded that, given the group fee structure, fund shareholders will benefit from lower management fees as assets under FMR's management increase at the fund complex level, regardless of whether Fidelity achieves any such economies of scale.
Annual Report
Board Approval of Investment Advisory Contracts and
Management Fees - continued
The Board concluded, taking into account the analysis of the Economies of Scale Committee, that economies of scale, if any, are being appropriately shared between fund shareholders and Fidelity.
Amendment to Description of Group Fee Rate. At its July 2013 meeting, the Board voted to approve an amendment to the fund's management contract to modify the description of the "group fee rate" effective August 1, 2013. The Board noted that under the prior description in the contract, the group fee rate was based on the average net assets of all registered investment companies with which FMR has management contracts. Under the contract's tiered asset breakpoint schedule, the group fee rate is lower as total fund assets under FMR's management increase, and higher as total fund assets under FMR's management decrease. The Board considered that the prior description would have excluded the assets of 64 Fidelity sector funds from the group fee rate calculation once Fidelity SelectCo, LLC, an affiliate of FMR, assumed management responsibilities for those funds. The Board noted that modifying the description of the group fee rate to continue to include the assets of those 64 funds for purposes of determining group fee rate breakpoints would avoid an immediate adverse impact on the group fee rate for any fund.
Additional Information Requested by the Board. In order to develop fully the factual basis for consideration of the Fidelity funds' Advisory Contracts, the Board requested and received additional information on certain topics, including: (i) fund performance trends and Fidelity's long-term strategies for certain funds; (ii) the potential to further rationalize the Fidelity fund lineup with the possibility of achieving savings for the funds and Fidelity; (iii) the methodology with respect to competitive fund data and peer group classifications; (iv) the arrangements with, and performance of, certain sub-advisers on behalf of the Fidelity funds, as well as certain proposed participating affiliate arrangements; (v) the realization of fall-out benefits in certain Fidelity business units; (vi) Fidelity's group fee structures, including the rationale for the individual fee rates of certain categories of funds and the definition of group assets; (vii) trends regarding industry use of performance fee structures and the performance adjustment methodologies applicable to the Fidelity funds; (viii) additional competitive analysis regarding the total expenses for certain classes; and (ix) fund profitability methodology, including Fidelity's cost allocation methodology, and the impact of certain factors on fund profitability results.
Annual Report
Based on its evaluation of all of the conclusions noted above, and after considering all factors it believed relevant, the Board ultimately concluded that the advisory fee structures are fair and reasonable, and that the fund's Advisory Contracts should be renewed.
Annual Report
Investment Adviser
Fidelity Management & Research Company
Boston, MA
Investment Sub-Advisers
FMR Co., Inc.
Fidelity Management & Research (U.K.) Inc.
Fidelity Management & Research
(Hong Kong) Limited
Fidelity Management & Research
(Japan) Inc.
FIL Investments (Japan) Limited
FIL Investment Advisors
FIL Investment Advisors (UK) Limited
General Distributor
Fidelity Distributors Corporation
Smithfield, RI
Transfer and Service Agents
Fidelity Investments Institutional Operations Company, Inc.
Boston, MA
Fidelity Service Company, Inc.
Boston, MA
Custodian
Citibank, N.A.
New York, NY
(Fidelity Investment logo)(registered trademark)
Corporate Headquarters
245 Summer St., Boston, MA 02210
www.fidelity.com
SMO-ANN-0913
1.839807.106
Fidelity®
Series Real Estate Income
Fund
Fidelity Series Real Estate Income Fund
Class F
Annual Report
July 31, 2013
(Fidelity Cover Art)
Contents
Performance | (Click Here) | How the fund has done over time. |
Management's Discussion of Fund Performance | (Click Here) | The Portfolio Manager's review of fund performance and strategy. |
Shareholder Expense Example | (Click Here) | An example of shareholder expenses. |
Investment Changes | (Click Here) | A summary of major shifts in the fund's investments over the past six months. |
Investments | (Click Here) | A complete list of the fund's investments with their market values. |
Financial Statements | (Click Here) | Statements of assets and liabilities, operations, and changes in net assets, as well as financial highlights. |
Notes | (Click Here) | Notes to the financial statements. |
Report of Independent Registered Public Accounting Firm | (Click Here) | |
Trustees and Officers | (Click Here) | |
Distributions | (Click Here) | |
Board Approval of Investment Advisory Contracts and Management Fees | (Click Here) | |
To view a fund's proxy voting guidelines and proxy voting record for the 12-month period ended June 30, visit http://www.fidelity.com/proxyvotingresults or visit the Securities and Exchange Commission's (SEC) web site at http://www.sec.gov. You may also call 1-800-544-8544 for Fidelity® Series Real Estate Income Fund or 1-800-835-5092 for Class F of the fund to request a free copy of the proxy voting guidelines.
Standard & Poor's, S&P and S&P 500 are registered service marks of The McGraw-Hill Companies, Inc. and have been licensed for use by Fidelity Distributors Corporation.
Other third-party marks appearing herein are the property of their respective owners.
All other marks appearing herein are registered or unregistered trademarks or service marks of FMR LLC or an affiliated company. © 2013 FMR LLC. All rights reserved.
Annual Report
This report and the financial statements contained herein are submitted for the general information of the shareholders of the fund. This report is not authorized for distribution to prospective investors in the fund unless preceded or accompanied by an effective prospectus.
A fund files its complete schedule of portfolio holdings with the SEC for the first and third quarters of each fiscal year on Form N-Q. Forms N-Q are available on the SEC's web site at http://www.sec.gov. A fund's Forms N-Q may be reviewed and copied at the SEC's Public Reference Room in Washington, DC. Information regarding the operation of the SEC's Public Reference Room may be obtained by calling 1-800-SEC-0330. For a complete list of a fund's portfolio holdings, view the most recent holdings listing, semiannual report, or annual report on Fidelity's web site at http://www.fidelity.com, http://www.advisor.fidelity.com, or http://www.401k.com, as applicable.
NOT FDIC INSURED • MAY LOSE VALUE • NO BANK GUARANTEE
Neither the fund nor Fidelity Distributors Corporation is a bank.
Annual Report
Average annual total return reflects the change in the value of an investment, assuming reinvestment of the class' distributions from dividend income and capital gains (the profits earned upon the sale of securities that have grown in value, if any) and assuming a constant rate of performance each year. The $10,000 table and the fund's returns do not reflect the deduction of taxes that a shareholder would pay on fund distributions or the redemption of fund shares. During periods of reimbursement by Fidelity, a fund's total return will be greater than it would be had the reimbursement not occurred. How a fund did yesterday is no guarantee of how it will do tomorrow.
Average Annual Total Returns
Periods ended July 31, 2013 | Past 1
year | Life of
fund A |
Fidelity® Series Real Estate Income Fund | 10.50% | 14.21% |
Class F | 10.60% | 14.40% |
A From October 20, 2011.
$10,000 Over Life of Fund
Let's say hypothetically that $10,000 was invested in Fidelity Series Real Estate Income Fund, a class of the fund, on October 20, 2011, when the fund started. The chart shows how the value of your investment would have changed, and also shows how the S&P 500® Index performed over the same period.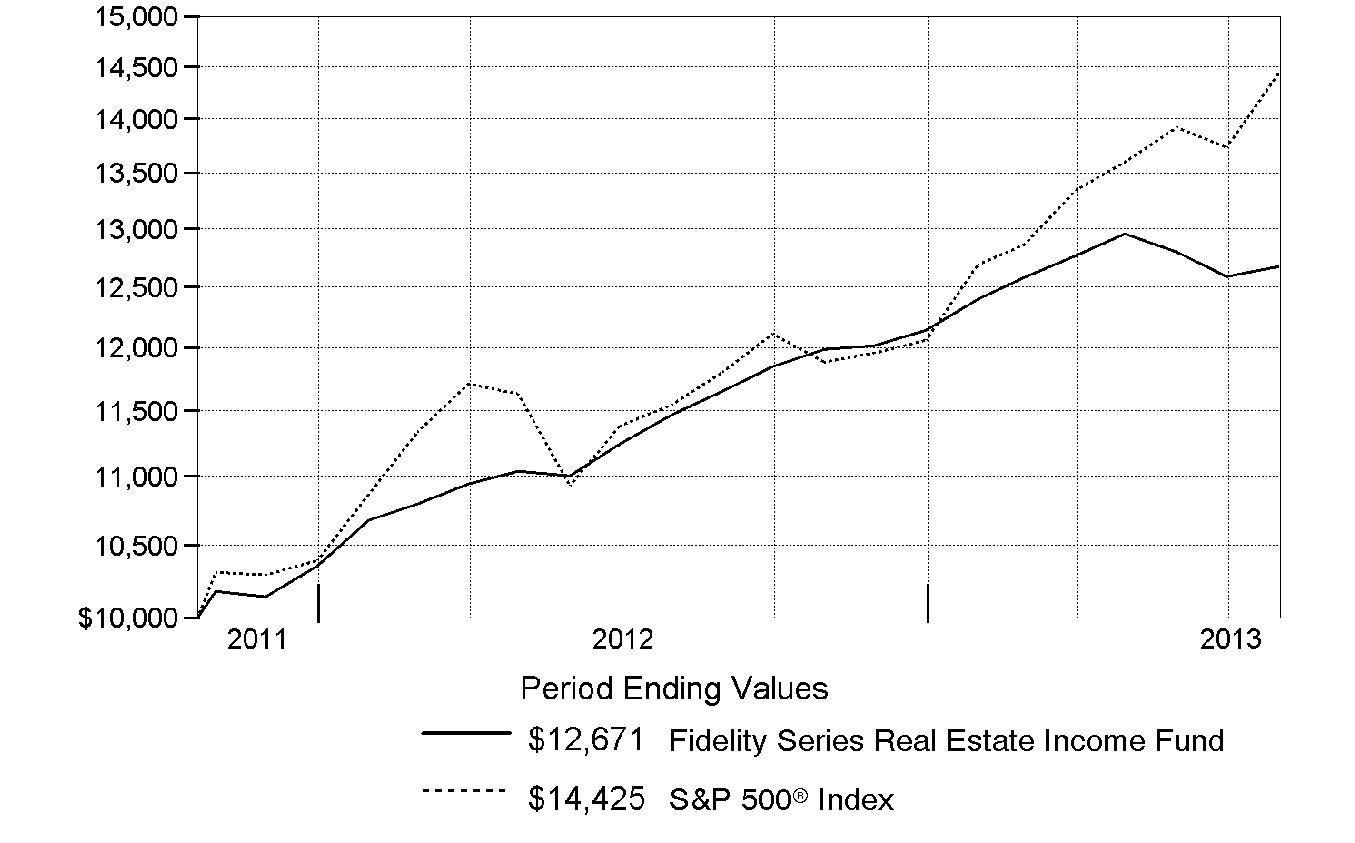
Annual Report
Market Recap: The fundamentals for commercial and residential property remained good throughout the 12-month period ending July 31, 2013. On the commercial side, demand continued to increase faster than the supply of new buildings, which, in turn, helped lift rental and occupancy rates. Meanwhile, single-family home prices continued to rise, boosting the slow-growing U.S. economy. For most of the period, real estate investment trust (REIT) common stocks performed well, although that situation abruptly reversed in May, when the Federal Reserve signaled its desire to bring its "quantitative easing" economic stimulus approach to a close. This caused a steep rise in interest rates, which weighed on the REIT market. Still, REIT stocks were positive performers for the 12 months, as the FTSE® NAREIT® All REITs Index gained 7.82%. Meanwhile, real estate bonds, reflected by The BofA Merrill LynchSM US Real Estate Index - a market-capitalization-weighted measure of the performance of investment-grade public debt of corporate issuers in the domestic real estate sector - rose 2.21%. The MSCI® REIT Preferred Index, which reflects the performance of real estate preferred stocks, returned 1.32%, while the broad U.S. equity market, as measured by the S&P 500® Index, generated a robust return of 25.00%.
Comments from Mark Snyderman, Portfolio Manager of Fidelity® Series Real Estate Income Fund: For the year, the fund's Series Real Estate Income and Class F shares gained 10.50% and 10.60%, respectively, versus 2.45% for the Fidelity Series Real Estate Income Composite IndexSM - a 40/50/10 blend of the MSCI index, the BofA Merrill Lynch index and the FTSE® NAREIT® index, respectively. My strategy involves thorough credit research to capitalize on inefficiencies in real estate securities markets. During the period, the fund's real estate investment trust (REIT) common stocks returned 22% - far ahead of the FTSE NAREIT index. Here, net-lease companies Lexington Corporate Properties Trust and CapLease each added value, as did the convertible bonds of real estate finance company NorthStar Realty Finance, a real estate finance company, and the common stock of senior housing operator Brookdale Senior Living. In contrast, mortgage REIT CYS Investments lagged my expectations, while student housing REIT American Campus Communities also detracted. Meanwhile, the fund's preferred real estate stocks were up 6%, outpacing the MSCI index, thanks to my focus on higher-yielding preferreds. On the fixed-income side, commercial mortgage-backed securities, high-yield real estate bonds and investment-grade real estate bonds all handily beat the BofA Merrill Lynch index. The fund especially benefited from an investment in the bonds of commercial finance REIT iStar Financial. The fund's average cash weighting of 5%, however, limited the fund's upside.
The views expressed above reflect those of the portfolio manager(s) only through the end of the period as stated on the cover of this report and do not necessarily represent the views of Fidelity or any other person in the Fidelity organization. Any such views are subject to change at any time based upon market or other conditions and Fidelity disclaims any responsibility to update such views. These views may not be relied on as investment advice and, because investment decisions for a Fidelity fund are based on numerous factors, may not be relied on as an indication of trading intent on behalf of any Fidelity fund.
Annual Report
Shareholder Expense Example
As a shareholder of the Fund, you incur two types of costs: (1) transaction costs, and (2) ongoing costs, including management fees and other Fund expenses. This Example is intended to help you understand your ongoing costs (in dollars) of investing in the Fund and to compare these costs with the ongoing costs of investing in other mutual funds.
The Example is based on an investment of $1,000 invested at the beginning of the period and held for the entire period (February 1, 2013 to July 31, 2013).
Actual Expenses
The first line of the accompanying table for each class of the Fund provides information about actual account values and actual expenses. You may use the information in this line, together with the amount you invested, to estimate the expenses that you paid over the period. Simply divide your account value by $1,000.00 (for example, an $8,600 account value divided by $1,000.00 = 8.6), then multiply the result by the number in the first line for a class of the Fund under the heading entitled "Expenses Paid During Period" to estimate the expenses you paid on your account during this period. In addition, the Fund, as a shareholder in the underlying Fidelity Central Funds, will indirectly bear its pro-rata share of the fees and expenses incurred by the underlying Fidelity Central Funds. These fees and expenses are not included in the Fund's annualized expense ratio used to calculate the expense estimate in the table below.
Hypothetical Example for Comparison Purposes
The second line of the accompanying table for each class of the Fund provides information about hypothetical account values and hypothetical expenses based on a Class' actual expense ratio and an assumed rate of return of 5% per year before expenses, which is not the Class' actual return. The hypothetical account values and expenses may not be used to estimate the actual ending account balance or expenses you paid for the period. You may use this information to compare the ongoing costs of investing in the Fund and other funds. To do so, compare this 5% hypothetical example with the 5% hypothetical examples that appear in the shareholder reports of the other funds. In addition, the Fund, as a shareholder in the underlying Fidelity Central Funds, will indirectly bear its pro-rata share of the fees and expenses incurred by the underlying Fidelity Central Funds. These fees and expenses are not included in the Fund's annualized expense ratio used to calculate the expense estimate in the table below.
Please note that the expenses shown in the table are meant to highlight your ongoing costs only and do not reflect any transaction costs. Therefore, the second line of the table is useful in comparing ongoing costs only, and will not help you determine the relative total costs of owning different funds.
Annual Report
Shareholder Expense Example - continued
| Annualized
Expense Ratio B | Beginning
Account Value
February 1, 2013 | Ending
Account Value
July 31, 2013 | Expenses Paid
During Period*
February 1, 2013
to July 31, 2013 |
Series Real Estate Income | .79% | | | |
Actual | | $ 1,000.00 | $ 1,022.20 | $ 3.96 |
HypotheticalA | | $ 1,000.00 | $ 1,020.88 | $ 3.96 |
Class F | .61% | | | |
Actual | | $ 1,000.00 | $ 1,023.00 | $ 3.06 |
HypotheticalA | | $ 1,000.00 | $ 1,021.77 | $ 3.06 |
A 5% return per year before expenses
B Annualized expense ratio reflects expenses net of applicable fee waivers.
* Expenses are equal to each Class' annualized expense ratio, multiplied by the average account value over the period, multiplied by 181/365 (to reflect the one-half year period).
Annual Report
Investment Changes (Unaudited)
Top Five Stocks as of July 31, 2013 |
| % of fund's
net assets | % of fund's net assets
6 months ago |
Ventas, Inc. | 1.4 | 1.4 |
Acadia Realty Trust (SBI) | 1.3 | 1.4 |
Equity Lifestyle Properties, Inc. | 1.3 | 1.3 |
MFA Financial, Inc. | 1.3 | 1.5 |
Excel Trust, Inc. Series B, 8.125% | 1.1 | 1.2 |
| 6.4 | |
Top 5 Bonds as of July 31, 2013 |
| % of fund's
net assets | % of fund's net assets
6 months ago |
Banc of America Large Loan Trust floater Series 2010-HLTN Class HLTN, 2.491% 11/15/15 | 3.1 | 3.3 |
Hilton Worldwide, Inc. Tranche C, term loan 3.692% 11/12/15 | 1.7 | 1.9 |
Hilton Worldwide, Inc. Tranche D, term loan 3.942% 11/12/15 | 1.4 | 1.6 |
Wachovia Ltd./Wachovia LLC Series 2006-1A Class A1B, 0.6028% 9/25/26 | 1.3 | 1.3 |
Standard Pacific Corp. 8.375% 5/15/18 | 1.1 | 1.2 |
| 8.6 | |
Top Five REIT Sectors as of July 31, 2013 |
| % of fund's
net assets | % of fund's net assets
6 months ago |
REITs - Mortgage | 14.3 | 13.5 |
REITs - Management/Investment | 6.6 | 6.2 |
REITs - Shopping Centers | 5.8 | 6.5 |
REITs - Health Care Facilities | 5.2 | 5.9 |
REITs - Industrial Buildings | 3.5 | 3.9 |
Asset Allocation (% of fund's net assets) |
As of July 31, 2013* | As of January 31, 2013** |
 | Common Stocks 18.3% | | | Common Stocks 16.6% | |
 | Preferred Stocks 16.9% | | | Preferred Stocks 18.6% | |
 | Bonds 45.2% | | | Bonds 49.5% | |
 | Convertible
Securities 4.2% | | | Convertible
Securities 4.0% | |
 | Other Investments 9.0% | | | Other Investments 7.7% | |
 | Short-Term
Investments and
Net Other Assets (Liabilities) 6.4% | | | Short-Term
Investments and
Net Other Assets (Liabilities) 3.6% | |
* Foreign investments | 5.0% | | ** Foreign investments | 4.5% | |

Annual Report
Investments July 31, 2013
Showing Percentage of Net Assets
Common Stocks - 18.3% |
| Shares | | Value |
CONSUMER DISCRETIONARY - 0.2% |
Hotels, Restaurants & Leisure - 0.2% |
Hyatt Hotels Corp. Class A (a) | 25,600 | | $ 1,158,400 |
Household Durables - 0.0% |
Standard Pacific Corp. (a)(e) | 36,100 | | 295,298 |
TOTAL CONSUMER DISCRETIONARY | | 1,453,698 |
FINANCIALS - 16.9% |
Real Estate Investment Trusts - 16.6% |
Acadia Realty Trust (SBI) | 420,200 | | 10,832,756 |
American Campus Communities, Inc. | 37,300 | | 1,432,693 |
American Residential Properties, Inc. (a)(f) | 119,000 | | 2,087,260 |
American Residential Properties, Inc. (a) | 19,500 | | 342,030 |
American Tower Corp. | 30,300 | | 2,144,937 |
Anworth Mortgage Asset Corp. | 271,800 | | 1,320,948 |
Apartment Investment & Management Co. Class A | 116,300 | | 3,416,894 |
Arbor Realty Trust, Inc. | 66,700 | | 502,918 |
Associated Estates Realty Corp. (e) | 76,800 | | 1,173,504 |
AvalonBay Communities, Inc. | 17,000 | | 2,300,780 |
BioMed Realty Trust, Inc. | 40,400 | | 834,664 |
Blackstone Mortgage Trust, Inc. | 34,500 | | 872,160 |
Boardwalk (REIT) | 8,900 | | 499,287 |
CapLease, Inc. | 340,700 | | 2,889,136 |
CBL & Associates Properties, Inc. | 171,300 | | 3,900,501 |
Chambers Street Properties (e) | 28,700 | | 232,183 |
Chartwell Retirement Residence (f) | 14,700 | | 139,830 |
Chesapeake Lodging Trust | 106,000 | | 2,428,460 |
CYS Investments, Inc. | 179,100 | | 1,486,530 |
DCT Industrial Trust, Inc. | 213,500 | | 1,603,385 |
DiamondRock Hospitality Co. | 63,700 | | 617,890 |
Douglas Emmett, Inc. | 70,800 | | 1,770,708 |
Dynex Capital, Inc. | 218,300 | | 2,097,863 |
EastGroup Properties, Inc. | 22,300 | | 1,379,478 |
Education Realty Trust, Inc. | 102,100 | | 962,803 |
Equity Lifestyle Properties, Inc. | 278,600 | | 10,723,314 |
Equity Residential (SBI) | 40,500 | | 2,268,000 |
Excel Trust, Inc. | 206,300 | | 2,677,774 |
Extra Space Storage, Inc. | 9,600 | | 403,680 |
First Potomac Realty Trust | 120,300 | | 1,632,471 |
Glimcher Realty Trust | 130,600 | | 1,467,944 |
Hatteras Financial Corp. | 47,600 | | 956,284 |
HCP, Inc. | 19,000 | | 833,530 |
Common Stocks - continued |
| Shares | | Value |
FINANCIALS - continued |
Real Estate Investment Trusts - continued |
Highwoods Properties, Inc. (SBI) | 23,100 | | $ 838,068 |
Lexington Corporate Properties Trust | 392,600 | | 4,923,204 |
LTC Properties, Inc. | 61,900 | | 2,393,673 |
MFA Financial, Inc. | 1,307,900 | | 10,437,042 |
Mid-America Apartment Communities, Inc. | 50,600 | | 3,418,030 |
Monmouth Real Estate Investment Corp. Class A | 34,000 | | 332,520 |
National Retail Properties, Inc. (e) | 27,900 | | 976,221 |
New Residential Investment Corp. | 77,300 | | 512,499 |
Newcastle Investment Corp. | 221,500 | | 1,284,700 |
NorthStar Realty Finance Corp. | 666,800 | | 6,534,640 |
Piedmont Office Realty Trust, Inc. Class A | 64,700 | | 1,170,423 |
Prologis, Inc. | 126,900 | | 4,867,884 |
Retail Properties America, Inc. | 96,900 | | 1,365,321 |
Select Income (REIT) | 42,500 | | 1,146,650 |
Senior Housing Properties Trust (SBI) | 93,300 | | 2,346,495 |
Simon Property Group, Inc. | 13,700 | | 2,192,822 |
Stag Industrial, Inc. | 131,700 | | 2,730,141 |
Summit Hotel Properties, Inc. | 74,500 | | 753,940 |
Terreno Realty Corp. | 115,061 | | 2,110,219 |
Two Harbors Investment Corp. | 147,500 | | 1,479,425 |
Ventas, Inc. | 167,000 | | 10,978,580 |
Washington (REIT) (SBI) | 43,000 | | 1,155,840 |
Weyerhaeuser Co. | 14,300 | | 406,120 |
WP Carey, Inc. (e) | 18,800 | | 1,327,656 |
| | 133,914,708 |
Real Estate Management & Development - 0.2% |
Kennedy-Wilson Holdings, Inc. | 74,800 | | 1,279,080 |
Thrifts & Mortgage Finance - 0.1% |
Home Loan Servicing Solutions Ltd. | 47,900 | | 1,198,937 |
TOTAL FINANCIALS | | 136,392,725 |
HEALTH CARE - 1.2% |
Health Care Providers & Services - 1.2% |
Brookdale Senior Living, Inc. (a) | 181,400 | | 5,282,368 |
Emeritus Corp. (a) | 186,600 | | 4,327,254 |
| | 9,609,622 |
TOTAL COMMON STOCKS (Cost $119,411,876) |
147,456,045
|
Preferred Stocks - 17.9% |
| Shares | | Value |
Convertible Preferred Stocks - 1.0% |
FINANCIALS - 1.0% |
Real Estate Investment Trusts - 1.0% |
CommonWealth REIT 6.50% | 127,200 | | $ 2,902,704 |
Health Care REIT, Inc. Series I, 6.50% | 16,200 | | 972,000 |
Lexington Corporate Properties Trust Series C, 6.50% | 58,800 | | 2,851,800 |
Weyerhaeuser Co. Series A, 6.375% (a) | 32,000 | | 1,663,040 |
| | 8,389,544 |
Nonconvertible Preferred Stocks - 16.9% |
CONSUMER DISCRETIONARY - 0.4% |
Hotels, Restaurants & Leisure - 0.4% |
Red Lion Hotels Capital Trust 9.50% | 111,950 | | 2,898,386 |
FINANCIALS - 16.5% |
Capital Markets - 0.1% |
Arlington Asset Investment Corp. 6.625% | 31,528 | | 741,223 |
Real Estate Investment Trusts - 15.7% |
AG Mortgage Investment Trust, Inc. 8.00% | 52,804 | | 1,247,759 |
American Capital Agency Corp. 8.00% | 120,000 | | 3,042,000 |
Annaly Capital Management, Inc.: | | | |
Series A, 7.875% | 150,300 | | 3,792,069 |
Series C, 7.625% | 9,839 | | 244,106 |
Series D, 7.50% | 55,213 | | 1,336,155 |
Anworth Mortgage Asset Corp. Series A, 8.625% | 178,800 | | 4,505,760 |
Apollo Commercial Real Estate Finance, Inc. Series A, 8.625% | 61,725 | | 1,594,974 |
Apollo Residential Mortgage, Inc. Series A, 8.00% | 49,077 | | 1,177,848 |
Arbor Realty Trust, Inc.: | | | |
Series A, 8.25% | 41,922 | | 1,052,661 |
Series B, 7.75% (a) | 20,000 | | 491,800 |
Armour Residential REIT, Inc. Series B, 7.875% | 25,701 | | 601,403 |
Ashford Hospitality Trust, Inc. Series E, 9.00% | 35,948 | | 949,027 |
Campus Crest Communities, Inc. Series A, 8.00% | 71,569 | | 1,872,961 |
CapLease, Inc.: | | | |
Series A, 8.125% | 11,772 | | 295,713 |
Series B, 8.375% | 190,234 | | 4,793,897 |
Capstead Mortgage Corp. Series E, 7.50% | 37,016 | | 884,682 |
CBL & Associates Properties, Inc.: | | | |
7.375% | 67,200 | | 1,686,048 |
Series E, 6.625% | 25,000 | | 608,000 |
Cedar Shopping Centers, Inc. Series B, 7.25% | 57,640 | | 1,446,764 |
Chesapeake Lodging Trust Series A, 7.75% | 64,034 | | 1,625,823 |
Preferred Stocks - continued |
| Shares | | Value |
Nonconvertible Preferred Stocks - continued |
FINANCIALS - continued |
Real Estate Investment Trusts - continued |
Colony Financial, Inc. Series A, 8.50% | 77,829 | | $ 2,022,776 |
CommonWealth REIT 7.50% | 24,923 | | 520,641 |
Coresite Realty Corp. Series A, 7.25% | 30,000 | | 752,100 |
Corporate Office Properties Trust Series L, 7.375% | 80,000 | | 2,099,200 |
Cousins Properties, Inc. Series B, 7.50% | 34,900 | | 879,131 |
CubeSmart Series A, 7.75% | 40,000 | | 1,056,000 |
CYS Investments, Inc.: | | | |
Series A, 7.75% | 10,014 | | 232,325 |
Series B, 7.50% (a) | 58,433 | | 1,327,013 |
DDR Corp.: | | | |
Series J, 6.50% | 30,181 | | 724,042 |
Series K, 6.25% | 25,489 | | 610,462 |
Digital Realty Trust, Inc.: | | | |
Series F, 6.625% | 20,000 | | 479,200 |
Series G, 5.875% | 28,270 | | 610,632 |
Duke Realty LP Series L, 6.60% | 4,300 | | 107,457 |
Dynex Capital, Inc.: | | | |
Series A, 8.50% | 96,313 | | 2,417,456 |
Series B, 7.625% | 47,335 | | 1,105,746 |
Equity Lifestyle Properties, Inc. Series C, 6.75% | 182,313 | | 4,594,288 |
Essex Property Trust, Inc. Series H, 7.125% | 8,100 | | 208,980 |
Excel Trust, Inc. Series B, 8.125% | 360,000 | | 9,244,800 |
First Potomac Realty Trust 7.75% | 107,746 | | 2,814,326 |
General Growth Properties, Inc. Series A, 6.375% | 7,367 | | 168,999 |
Gladstone Commercial Corp. Series C, 7.125% | 67,762 | | 1,751,648 |
Glimcher Realty Trust: | | | |
6.875% | 3,183 | | 78,079 |
Series G, 8.125% | 40,977 | | 1,037,947 |
Series H, 7.50% | 13,575 | | 345,891 |
Hatteras Financial Corp. Series A, 7.625% | 36,972 | | 886,219 |
Health Care REIT, Inc. Series J, 6.50% | 20,000 | | 506,000 |
Hersha Hospitality Trust Series B, 8.00% | 18,928 | | 487,396 |
Hospitality Properties Trust Series D, 7.125% | 40,200 | | 1,025,904 |
Hudson Pacific Properties, Inc. 8.375% | 84,787 | | 2,222,267 |
Inland Real Estate Corp. Series A, 8.125% | 200,000 | | 5,132,000 |
Invesco Mortgage Capital, Inc. Series A, 7.75% | 30,151 | | 720,307 |
Investors Real Estate Trust Series B, 7.95% | 33,428 | | 865,785 |
iStar Financial, Inc.: | | | |
Series E, 7.875% | 17,271 | | 414,849 |
Preferred Stocks - continued |
| Shares | | Value |
Nonconvertible Preferred Stocks - continued |
FINANCIALS - continued |
Real Estate Investment Trusts - continued |
iStar Financial, Inc.: - continued | | | |
Series F, 7.80% | 32,256 | | $ 769,951 |
Kilroy Realty Corp. Series G, 6.875% | 20,000 | | 489,800 |
Kite Realty Group Trust 8.25% | 4,100 | | 106,846 |
LaSalle Hotel Properties: | | | |
Series G, 7.25% | 26,100 | | 652,239 |
Series H, 7.50% | 7,192 | | 181,670 |
Series I, 6.375% | 16,639 | | 386,025 |
LBA Realty Fund II Series B, 7.625% | 118,900 | | 2,318,550 |
MFA Financial, Inc.: | | | |
8.00% | 108,747 | | 2,758,911 |
Series B, 7.50% (a) | 188,749 | | 4,482,789 |
Monmouth Real Estate Investment Corp. Series B, 7.875% | 30,000 | | 778,200 |
National Retail Properties, Inc.: | | | |
5.70% (a) | 14,624 | | 324,799 |
Series D, 6.625% | 17,563 | | 439,251 |
New York Mortgage Trust, Inc. Series B, 7.75% | 22,013 | | 517,085 |
NorthStar Realty Finance Corp.: | | | |
Series B, 8.25% | 16,301 | | 406,710 |
Series C, 8.875% | 50,295 | | 1,280,008 |
Series D, 8.50% | 31,413 | | 794,121 |
Pebblebrook Hotel Trust: | | | |
Series A, 7.875% | 49,000 | | 1,249,500 |
Series B, 8.00% | 37,400 | | 966,790 |
Series C, 6.50% | 26,082 | | 612,666 |
Pennsylvania (REIT) 7.375% | 19,408 | | 486,364 |
Prologis, Inc. Series Q, 8.54% | 15,800 | | 965,696 |
Regency Centers Corp. Series 6, 6.625% | 17,739 | | 443,652 |
Retail Properties America, Inc. 7.00% | 35,218 | | 855,797 |
Saul Centers, Inc.: | | | |
8.00% | 14,472 | | 367,734 |
Series C, 6.875% | 69,596 | | 1,753,819 |
Stag Industrial, Inc. Series A, 9.00% | 280,000 | | 7,560,000 |
Strategic Hotel & Resorts, Inc. Series A, 8.50% | 21,591 | | 518,184 |
Summit Hotel Properties, Inc. Series A, 9.25% | 173,700 | | 4,648,212 |
Sun Communities, Inc. Series A, 7.125% | 24,000 | | 604,800 |
Sunstone Hotel Investors, Inc. Series D, 8.00% | 20,200 | | 518,534 |
Taubman Centers, Inc. Series K, 6.25% | 19,561 | | 463,596 |
Terreno Realty Corp. Series A, 7.75% | 44,310 | | 1,145,414 |
Preferred Stocks - continued |
| Shares | | Value |
Nonconvertible Preferred Stocks - continued |
FINANCIALS - continued |
Real Estate Investment Trusts - continued |
UMH Properties, Inc. Series A, 8.25% | 96,000 | | $ 2,522,880 |
Urstadt Biddle Properties, Inc. Series F, 7.125% | 30,000 | | 766,200 |
Weingarten Realty Investors (SBI) Series F, 6.50% | 26,708 | | 673,576 |
Winthrop Realty Trust: | | | |
7.75% | 60,000 | | 1,533,000 |
Series D, 9.25% | 35,000 | | 945,700 |
| | 126,988,385 |
Real Estate Management & Development - 0.7% |
Forest City Enterprises, Inc. 7.375% | 180,500 | | 4,512,500 |
Kennedy-Wilson, Inc. 7.75% | 35,054 | | 883,711 |
| | 5,396,211 |
TOTAL FINANCIALS | | 133,125,819 |
TOTAL NONCONVERTIBLE PREFERRED STOCKS | | 136,024,205 |
TOTAL PREFERRED STOCKS (Cost $141,361,300) |
144,413,749
|
Corporate Bonds - 23.4% |
| Principal Amount | | |
Convertible Bonds - 3.2% |
CONSUMER DISCRETIONARY - 0.2% |
Hotels, Restaurants & Leisure - 0.2% |
Morgans Hotel Group Co. 2.375% 10/15/14 | | $ 1,365,000 | | 1,339,406 |
FINANCIALS - 3.0% |
Diversified Financial Services - 0.4% |
IAS Operating Partnership LP 5% 3/15/18 (f) | | 3,420,000 | | 3,154,950 |
Real Estate Investment Trusts - 2.3% |
Annaly Capital Management, Inc. 5% 5/15/15 | | 6,690,000 | | 6,769,444 |
Ares Commercial Real Estate Corp. 7% 12/15/15 (f) | | 2,300,000 | | 2,241,063 |
CapLease, Inc. 7.5% 10/1/27 (f) | | 4,458,000 | | 4,458,000 |
Northstar Realty Finance LP 5.375% 6/15/33 (f) | | 2,400,000 | | 2,529,600 |
Corporate Bonds - continued |
| Principal Amount | | Value |
Convertible Bonds - continued |
FINANCIALS - continued |
Real Estate Investment Trusts - continued |
Redwood Trust, Inc. 4.625% 4/15/18 | | $ 1,000,000 | | $ 992,500 |
Starwood Property Trust, Inc. 4% 1/15/19 | | 2,000,000 | | 2,108,750 |
| | 19,099,357 |
Real Estate Management & Development - 0.3% |
Forest City Enterprises, Inc. 3.625% 8/15/20 (f) | | 2,450,000 | | 2,405,594 |
Grubb & Ellis Co. 7.95% 5/1/15 (d)(f) | | 1,540,000 | | 3,080 |
| | 2,408,674 |
TOTAL FINANCIALS | | 24,662,981 |
TOTAL CONVERTIBLE BONDS | | 26,002,387 |
Nonconvertible Bonds - 20.2% |
CONSUMER DISCRETIONARY - 6.1% |
Hotels, Restaurants & Leisure - 0.7% |
CityCenter Holdings LLC/CityCenter Finance Corp. 7.625% 1/15/16 | | 440,000 | | 466,400 |
FelCor Lodging LP 6.75% 6/1/19 | | 1,375,000 | | 1,450,625 |
Times Square Hotel Trust 8.528% 8/1/26 (f) | | 2,713,113 | | 3,478,997 |
| | 5,396,022 |
Household Durables - 5.4% |
Brookfield Residential Properties, Inc./Brookfield Residential U.S. Corp. 6.125% 7/1/22 (f) | | 530,000 | | 541,925 |
Brookfield Residential Properties, Inc. 6.5% 12/15/20 (f) | | 395,000 | | 413,763 |
D.R. Horton, Inc.: | | | | |
5.75% 8/15/23 | | 490,000 | | 490,000 |
6.5% 4/15/16 | | 811,000 | | 888,045 |
KB Home: | | | | |
5.875% 1/15/15 | | 1,216,000 | | 1,264,640 |
7.25% 6/15/18 | | 2,110,000 | | 2,305,175 |
8% 3/15/20 | | 2,395,000 | | 2,670,425 |
9.1% 9/15/17 | | 3,230,000 | | 3,698,350 |
Lennar Corp.: | | | | |
4.125% 12/1/18 (f) | | 1,220,000 | | 1,177,300 |
5.6% 5/31/15 | | 1,216,000 | | 1,288,595 |
6.95% 6/1/18 | | 1,720,000 | | 1,892,000 |
M/I Homes, Inc. 8.625% 11/15/18 | | 6,764,000 | | 7,372,760 |
Corporate Bonds - continued |
| Principal Amount | | Value |
Nonconvertible Bonds - continued |
CONSUMER DISCRETIONARY - continued |
Household Durables - continued |
Meritage Homes Corp.: | | | | |
7% 4/1/22 | | $ 2,005,000 | | $ 2,185,450 |
7.15% 4/15/20 | | 440,000 | | 484,000 |
Ryland Group, Inc.: | | | | |
6.625% 5/1/20 | | 445,000 | | 470,588 |
8.4% 5/15/17 | | 1,446,000 | | 1,677,360 |
Standard Pacific Corp.: | | | | |
8.375% 5/15/18 | | 8,047,000 | | 9,314,403 |
10.75% 9/15/16 | | 3,284,000 | | 3,953,115 |
Toll Brothers Finance Corp. 5.875% 2/15/22 | | 450,000 | | 470,250 |
William Lyon Homes, Inc. 8.5% 11/15/20 | | 900,000 | | 985,500 |
| | 43,543,644 |
TOTAL CONSUMER DISCRETIONARY | | 48,939,666 |
FINANCIALS - 12.6% |
Diversified Financial Services - 0.8% |
Cantor Commercial Real Estate Co. LP/CCRE Finance Corp. 7.75% 2/15/18 (f) | | 1,025,000 | | 1,050,625 |
Icahn Enterprises LP/Icahn Enterprises Finance Corp.: | | | | |
6% 8/1/20 (f) | | 1,500,000 | | 1,501,875 |
7.75% 1/15/16 | | 2,172,000 | | 2,256,165 |
8% 1/15/18 | | 1,795,000 | | 1,895,969 |
| | 6,704,634 |
Real Estate Investment Trusts - 8.4% |
Camden Property Trust 5% 6/15/15 | | 1,135,000 | | 1,214,938 |
Commercial Net Lease Realty, Inc.: | | | | |
6.15% 12/15/15 | | 917,000 | | 1,017,506 |
6.25% 6/15/14 | | 949,000 | | 990,649 |
CubeSmart LP 4.8% 7/15/22 | | 1,000,000 | | 1,046,170 |
Developers Diversified Realty Corp.: | | | | |
7.5% 7/15/18 | | 2,407,000 | | 2,885,165 |
9.625% 3/15/16 | | 2,254,000 | | 2,695,879 |
Equity One, Inc.: | | | | |
5.375% 10/15/15 | | 405,000 | | 439,544 |
6% 9/15/16 | | 811,000 | | 911,154 |
6.25% 1/15/17 | | 811,000 | | 905,598 |
Corporate Bonds - continued |
| Principal Amount | | Value |
Nonconvertible Bonds - continued |
FINANCIALS - continued |
Real Estate Investment Trusts - continued |
Health Care Property Investors, Inc.: | | | | |
6% 6/15/14 | | $ 660,000 | | $ 688,140 |
6% 3/1/15 | | 1,216,000 | | 1,305,380 |
6.3% 9/15/16 | | 3,850,000 | | 4,391,549 |
7.072% 6/8/15 | | 405,000 | | 447,686 |
Health Care REIT, Inc. 4.125% 4/1/19 | | 1,000,000 | | 1,057,182 |
Healthcare Realty Trust, Inc.: | | | | |
3.75% 4/15/23 | | 801,000 | | 758,279 |
6.5% 1/17/17 | | 506,000 | | 570,146 |
Highwoods/Forsyth LP: | | | | |
3.625% 1/15/23 | | 393,000 | | 368,736 |
5.85% 3/15/17 | | 2,593,000 | | 2,858,876 |
Hospitality Properties Trust: | | | | |
5% 8/15/22 | | 823,000 | | 832,562 |
5.625% 3/15/17 | | 1,248,000 | | 1,357,879 |
6.7% 1/15/18 | | 811,000 | | 912,772 |
7.875% 8/15/14 | | 405,000 | | 419,149 |
HRPT Properties Trust 6.25% 8/15/16 | | 4,000,000 | | 4,254,584 |
iStar Financial, Inc.: | | | | |
3.875% 7/1/16 | | 525,000 | | 519,750 |
5.85% 3/15/17 | | 825,000 | | 849,750 |
5.875% 3/15/16 | | 8,610,000 | | 8,997,450 |
6.05% 4/15/15 | | 2,887,000 | | 3,002,480 |
7.125% 2/15/18 | | 1,010,000 | | 1,080,700 |
9% 6/1/17 | | 2,430,000 | | 2,745,900 |
Lexington Corporate Properties Trust 4.25% 6/15/23 (f) | | 2,500,000 | | 2,424,953 |
MPT Operating Partnership LP/MPT Finance Corp. 6.375% 2/15/22 | | 890,000 | | 936,725 |
National Retail Properties, Inc. 6.875% 10/15/17 | | 1,621,000 | | 1,895,914 |
Nationwide Health Properties, Inc. 6% 5/20/15 | | 1,540,000 | | 1,677,437 |
Omega Healthcare Investors, Inc. 7.5% 2/15/20 | | 811,000 | | 888,045 |
Pan Pacific Retail Properties, Inc. 5.95% 6/1/14 | | 1,378,000 | | 1,435,419 |
Potlatch Corp. 7.5% 11/1/19 | | 811,000 | | 932,650 |
ProLogis LP 7.625% 7/1/17 | | 1,268,000 | | 1,452,778 |
Reckson Operating Partnership LP/SL Green Realty Corp./SL Green Operating Partnership LP 7.75% 3/15/20 | | 811,000 | | 960,567 |
Senior Housing Properties Trust: | | | | |
6.75% 4/15/20 | | 576,000 | | 638,990 |
Corporate Bonds - continued |
| Principal Amount | | Value |
Nonconvertible Bonds - continued |
FINANCIALS - continued |
Real Estate Investment Trusts - continued |
Senior Housing Properties Trust: - continued | | | | |
6.75% 12/15/21 | | $ 2,000,000 | | $ 2,220,672 |
UDR, Inc. 5.5% 4/1/14 | | 1,000,000 | | 1,028,653 |
United Dominion Realty Trust, Inc.: | | | | |
5.25% 1/15/15 | | 405,000 | | 427,438 |
5.25% 1/15/16 | | 811,000 | | 877,753 |
| | 67,323,547 |
Real Estate Management & Development - 3.4% |
AMB Property LP 5.9% 8/15/13 | | 486,000 | | 486,665 |
Brandywine Operating Partnership LP: | | | | |
5.4% 11/1/14 | | 1,216,000 | | 1,278,395 |
6% 4/1/16 | | 811,000 | | 895,734 |
7.5% 5/15/15 | | 405,000 | | 447,740 |
CB Richard Ellis Services, Inc. 5% 3/15/23 | | 1,225,000 | | 1,176,000 |
Colonial Properties Trust 6.25% 6/15/14 | | 1,293,000 | | 1,351,466 |
Colonial Realty LP 6.05% 9/1/16 | | 1,216,000 | | 1,362,291 |
First Industrial LP 5.75% 1/15/16 | | 811,000 | | 863,260 |
Forest City Enterprises, Inc. 6.5% 2/1/17 | | 6,171,000 | | 6,184,576 |
Host Hotels & Resorts LP 6% 10/1/21 | | 485,000 | | 530,133 |
Kennedy-Wilson, Inc. 8.75% 4/1/19 | | 3,000,000 | | 3,255,000 |
Realogy Corp.: | | | | |
7.875% 2/15/19 (f) | | 1,450,000 | | 1,573,250 |
9% 1/15/20 (f) | | 560,000 | | 641,200 |
Regency Centers LP: | | | | |
5.25% 8/1/15 | | 3,250,000 | | 3,497,052 |
5.875% 6/15/17 | | 486,000 | | 542,550 |
Toys 'R' Us Property Co. I LLC 10.75% 7/15/17 | | 2,035,000 | | 2,152,033 |
Ventas Realty LP/Ventas Capital Corp.: | | | | |
3.125% 11/30/15 | | 552,000 | | 578,656 |
4% 4/30/19 | | 597,000 | | 626,018 |
| | 27,442,019 |
TOTAL FINANCIALS | | 101,470,200 |
HEALTH CARE - 1.2% |
Health Care Equipment & Supplies - 0.2% |
Aviv Healthcare Properties LP/Aviv Healthcare Capital Corp. 7.75% 2/15/19 | | 1,835,000 | | 1,972,625 |
Corporate Bonds - continued |
| Principal Amount | | Value |
Nonconvertible Bonds - continued |
HEALTH CARE - continued |
Health Care Providers & Services - 1.0% |
Health Management Associates, Inc. 7.375% 1/15/20 | | $ 385,000 | | $ 436,013 |
Sabra Health Care LP/Sabra Capital Corp.: | | | | |
5.375% 6/1/23 | | 1,500,000 | | 1,462,500 |
8.125% 11/1/18 | | 5,523,000 | | 5,937,225 |
| | 7,835,738 |
TOTAL HEALTH CARE | | 9,808,363 |
INDUSTRIALS - 0.1% |
Industrial Conglomerates - 0.1% |
Ladder Capital Finance Holdings LLLP/Ladder Capital Finance Corp. 7.375% 10/1/17 (f) | | 785,000 | | 810,513 |
MATERIALS - 0.2% |
Paper & Forest Products - 0.2% |
Plum Creek Timberlands LP 5.875% 11/15/15 | | 1,621,000 | | 1,774,095 |
TOTAL NONCONVERTIBLE BONDS | | 162,802,837 |
TOTAL CORPORATE BONDS (Cost $175,890,079) |
188,805,224
|
Asset-Backed Securities - 5.8% |
|
Anthracite CDO III Ltd./Anthracite CDO III Corp. Series 2004-1A Class A, 0.551% 3/23/19 (f)(g) | | 857,328 | | 842,325 |
Capital Trust RE CDO Ltd./Capital Trust RE CDO Corp. Series 2005-3A Class A2, 5.16% 6/25/35 (f) | | 540,906 | | 538,202 |
CapitalSource Real Estate Loan Trust Series 2006-1A Class A2A, 0.5186% 1/20/37 (f)(g) | | 590,149 | | 557,691 |
CBRE Realty Finance CDO LLC Series 2007-1A Class A1, 0.5209% 4/7/52 (f)(g) | | 1,204,032 | | 1,143,831 |
Conseco Finance Securitizations Corp.: | | | | |
Series 2002-1 Class M2, 9.546% 12/1/33 | | 1,216,000 | | 1,115,802 |
Series 2002-2 Class M2, 9.163% 3/1/33 (g) | | 2,026,000 | | 1,780,495 |
Deutsche Financial Capital Securitization LLC Series 1997-I Class M, 7.275% 9/15/27 | | 1,627,000 | | 1,555,332 |
Lehman ABS Manufactured Housing Contract Trust Series 2001-B Class M2, 7.17% 4/15/40 | | 3,648,880 | | 1,785,699 |
Asset-Backed Securities - continued |
| Principal Amount | | Value |
Mesa West Capital CDO Ltd.: | | | | |
Series 2007-1A Class A2, 0.48% 2/25/47 (f)(g) | | $ 3,820,000 | | $ 3,514,400 |
Series 2007-1A Class A1, 0.45% 2/25/47 (f)(g) | | 3,709,514 | | 3,561,133 |
N-Star Real Estate CDO Ltd. Series 1A Class B1, 1.9478% 8/28/38 (f)(g) | | 3,574,000 | | 3,475,715 |
Prima Capital Ltd. Series 2006-CR1A Class A2, 5.533% 12/28/48 (f) | | 2,125,271 | | 2,167,776 |
Residential Asset Securities Corp. Series 2003-KS10 Class MI3, 6.41% 12/25/33 | | 265,844 | | 110,845 |
Wachovia Ltd./Wachovia LLC: | | | | |
Series 2006-1A Class E, 1.0028% 9/25/26 (f)(g) | | 830,000 | | 742,850 |
Series 2006-1 Class 1ML, 0.9993% 9/25/26 (f)(g) | | 2,432,000 | | 1,507,840 |
Series 2006-1A: | | | | |
Class A1A, 0.5328% 9/25/26 (f)(g) | | 1,076,257 | | 1,062,803 |
Class A1B, 0.6028% 9/25/26 (f)(g) | | 11,266,000 | | 10,364,720 |
Class B, 0.6328% 9/25/26 (f)(g) | | 1,780,000 | | 1,686,550 |
Class C, 0.8028% 9/25/26 (f)(g) | | 3,250,000 | | 3,022,500 |
Class F, 1.4228% 9/25/26 (f)(g) | | 2,408,000 | | 2,107,000 |
Class G, 1.6228% 9/25/26 (f)(g) | | 1,343,000 | | 1,171,768 |
Class H, 1.9228% 9/25/26 (f)(g) | | 3,486,000 | | 3,024,105 |
TOTAL ASSET-BACKED SECURITIES (Cost $42,767,085) |
46,839,382
|
Collateralized Mortgage Obligations - 0.7% |
|
Private Sponsor - 0.7% |
COMM pass-thru certificates Series 2007-FL14 Class AJ, 0.371% 6/15/22 (f)(g) | | 1,147,305 | | 1,139,615 |
FREMF Mortgage Trust: | | | | |
Series 2010-K6 Class B, 5.5328% 12/25/46 (f)(g) | | 811,000 | | 850,256 |
Series 2010-K7 Class B, 5.6188% 4/25/20 (f)(g) | | 2,605,000 | | 2,741,354 |
Merrill Lynch Mortgage Investors Trust Series 1998-C3 Class F, 6% 12/15/30 (f) | | 658,757 | | 678,188 |
TOTAL COLLATERALIZED MORTGAGE OBLIGATIONS (Cost $4,932,039) |
5,409,413
|
Commercial Mortgage Securities - 18.5% |
|
Banc of America Commercial Mortgage Trust Series 2005-1 Class CJ, 5.4031% 11/10/42 (g) | | 1,175,000 | | 1,248,367 |
Banc of America Large Loan Trust floater Series 2010-HLTN Class HLTN, 2.491% 11/15/15 (f)(g) | | 25,301,294 | | 25,423,592 |
Commercial Mortgage Securities - continued |
| Principal Amount | | Value |
Banc of America Large Loan, Inc. floater Series 2005-MIB1 Class K, 2.191% 3/15/22 (f)(g) | | $ 387,059 | | $ 263,144 |
Banc of America REMIC Trust Series 2012-CLMZ Class A, 7.691% 8/15/17 (f)(g) | | 1,010,000 | | 1,050,400 |
Bear Stearns Commercial Mortgage Securities, Inc. Series 2006-PW11 Class AJ, 5.6112% 3/11/39 (g) | | 2,432,000 | | 2,526,693 |
CGBAM Commercial Mortgage Trust Series 2013-D Class D, 3.041% 5/15/30 (f)(g) | | 2,250,000 | | 2,250,000 |
Chase Commercial Mortgage Securities Corp. Series 1998-1 Class H, 6.34% 5/18/30 (f) | | 1,621,000 | | 1,467,887 |
COMM Mortgage Trust Series 2013-CR9 Class D, 4.403% 7/10/45 (f) | | 1,040,000 | | 819,325 |
COMM pass-thru certificates floater Series 2006-FL12 Class AJ, 0.321% 12/15/20 (f)(g) | | 523,538 | | 516,060 |
Commercial Mortgage Trust pass-thru certificates: | | | | |
Series 2005-C6 Class AJ, 5.209% 6/10/44 (g) | | 2,000,000 | | 2,095,336 |
Series 2012-CR1: | | | | |
Class C, 5.5468% 5/15/45 (g) | | 3,000,000 | | 3,035,799 |
Class D, 5.5468% 5/15/45 (f)(g) | | 1,350,000 | | 1,234,005 |
Series 2012-CR2 Class D, 5.02% 8/15/45 (f)(g) | | 500,000 | | 472,854 |
Series 2012-LC4: | | | | |
Class C, 5.8238% 12/10/44 (g) | | 780,000 | | 806,207 |
Class D, 5.8238% 12/10/44 (f)(g) | | 2,830,000 | | 2,657,231 |
Credit Suisse First Boston Mortgage Securities Corp. Series 1998-C2 Class F, 6.75% 11/15/30 (f) | | 811,000 | | 843,406 |
DBUBS Mortgage Trust Series 2011-LC1A Class E, 5.7284% 11/10/46 (f)(g) | | 2,450,000 | | 2,380,810 |
Deutsche Mortgage & Asset Receiving Corp. Series 1998-C1 Class J, 6.22% 6/15/31 | | 882,169 | | 881,577 |
DLJ Commercial Mortgage Corp. Series 1998-CG1 Class B4, 7.3882% 6/10/31 (f)(g) | | 175,288 | | 175,250 |
Extended Stay America Trust Series 2013-ESHM Class M, 7.625% 12/5/19 (f) | | 2,460,000 | | 2,512,706 |
Freddie Mac pass-thru certificates: | | | | |
Series K011 Class X3, 2.6621% 12/25/43 (g)(h) | | 4,947,000 | | 741,150 |
Series K012 Class X3, 2.3659% 1/25/41 (g)(h) | | 2,846,999 | | 381,116 |
Series K013 Class X3, 2.8848% 1/25/43 (g)(h) | | 4,806,000 | | 789,261 |
G-Force LLC sequential payer Series 2005-RRA Class A2, 4.83% 8/22/36 (f) | | 1,639,943 | | 1,648,143 |
GCCFC Commercial Mortgage Trust Series 2005-GG3 Class B, 4.894% 8/10/42 (g) | | 885,000 | | 908,754 |
GMAC Commercial Mortgage Securities, Inc.: | | | | |
Series 1997-C2 Class G, 6.75% 4/15/29 (g) | | 762,884 | | 848,374 |
Series 1999-C3 Class J, 6.974% 8/15/36 (f) | | 2,204,000 | | 2,294,045 |
Commercial Mortgage Securities - continued |
| Principal Amount | | Value |
GMAC Commercial Mortgage Securities, Inc.: - continued | | | | |
Series 2000-C1 Class K, 7% 3/15/33 | | $ 140,319 | | $ 103,512 |
Series 2003-C3 Class H, 5.9408% 4/10/40 (f)(g) | | 830,000 | | 834,609 |
GS Mortgage Securities Corp. II: | | | | |
floater Series 2007-EOP Class L, 5.4585% 3/6/20 (f)(g) | | 2,270,000 | | 2,267,887 |
Series 2012-GCJ7: | | | | |
Class C, 5.9064% 5/10/45 (g) | | 3,500,000 | | 3,662,925 |
Class D, 5.9064% 5/10/45 (f)(g) | | 2,500,000 | | 2,353,675 |
GS Mortgage Securities Corp. Trust Series 2011-ALF Class E, 4.953% 2/10/21 (f) | | 6,300,000 | | 6,317,640 |
GS Mortgage Securities Trust: | | | | |
Series 2010-C2 Class D, 5.4004% 12/10/43 (f)(g) | | 2,000,000 | | 1,904,592 |
Series 2012-GC6 Class C, 5.8263% 1/10/45 (f)(g) | | 2,400,000 | | 2,521,830 |
JP Morgan Chase Commercial Mortgage Securities Trust floater Series 2013-JWRZ Class E, 3.931% 4/15/30 (f)(g) | | 600,000 | | 597,419 |
JPMorgan Chase Commercial Mortgage Securities Corp.: | | | | |
Series 2003-C1 Class F, 6.1832% 1/12/37 (f)(g) | | 756,000 | | 756,000 |
Series 2009-IWST Class D, 7.6935% 12/5/27 (f)(g) | | 2,779,000 | | 3,136,057 |
Series 2010-CNTM Class MZ, 8.5% 8/5/20 (f) | | 2,620,000 | | 2,781,628 |
Series 2010-CNTR Class D, 6.3899% 8/5/32 (f)(g) | | 1,216,000 | | 1,327,269 |
Series 2012-CBX Class C, 5.3611% 6/16/45 (g) | | 1,240,000 | | 1,244,928 |
LB Commercial Conduit Mortgage Trust Series 1998-C4 Class G, 5.6% 10/15/35 (f) | | 294,366 | | 298,227 |
LB-UBS Commercial Mortgage Trust: | | | | |
sequential payer: | | | | |
Series 2005-C3 Class AJ, 4.843% 7/15/40 | | 3,760,000 | | 3,965,928 |
Series 2005-C7 Class AJ, 5.323% 11/15/40 (g) | | 1,240,000 | | 1,316,261 |
Series 2005-C1 Class E, 4.924% 2/15/40 | | 1,000,000 | | 1,018,822 |
Series 2006-C4 Class AJ, 6.0813% 6/15/38 (g) | | 2,511,000 | | 2,591,601 |
Lehman Brothers Floating Rate Commercial Mortgage Trust floater Series 2007-LLFA Class E, 1.091% 6/15/22 (f)(g) | | 1,770,000 | | 1,760,821 |
LStar Commercial Mortgage Trust: | | | | |
Series 2011-1 Class D, 5.5191% 6/25/43 (f)(g) | | 1,564,000 | | 1,539,618 |
Series 2011-1 Class B, 5.5191% 6/25/43 (f)(g) | | 1,897,000 | | 1,970,377 |
Mach One Trust LLC Series 2004-1A Class H, 6.3257% 5/28/40 (f)(g) | | 540,000 | | 548,775 |
Mezz Capital Commercial Mortgage Trust sequential payer Series 2004-C2 Class A, 5.318% 10/15/40 (f) | | 2,392,606 | | 2,093,531 |
Commercial Mortgage Securities - continued |
| Principal Amount | | Value |
Morgan Stanley Capital I Trust: | | | | |
sequential payer: | | | | |
Series 2012-C4 Class E, 5.71% 3/15/45 (f)(g) | | $ 1,250,000 | | $ 1,164,184 |
Series 2006-HQ10 Class AM, 5.36% 11/12/41 | | 3,769,000 | | 4,113,430 |
Series 1997-RR Class F, 7.4018% 4/30/39 (f)(g) | | 219,469 | | 219,469 |
Series 1998-CF1 Class G, 7.35% 7/15/32 (f) | | 1,798,677 | | 1,342,920 |
Series 2006-IQ12 Class AMFX, 5.37% 12/15/43 | | 3,242,000 | | 3,561,694 |
Series 2011-C1 Class C, 5.4199% 9/15/47 (f)(g) | | 2,000,000 | | 2,130,405 |
Series 2011-C2: | | | | |
Class D, 5.4934% 6/15/44 (f)(g) | | 1,532,000 | | 1,477,692 |
Class E, 5.4934% 6/15/44 (f)(g) | | 1,946,000 | | 1,831,050 |
Class F, 5.4934% 6/15/44 (f)(g) | | 1,467,000 | | 1,186,737 |
Class XB, 0.5389% 6/15/44 (f)(g)(h) | | 51,641,000 | | 1,746,240 |
Series 2011-C3 Class C, 5.3573% 7/15/49 (f)(g) | | 2,000,000 | | 2,045,002 |
Series 2012-C4 Class D, 5.71% 3/15/45 (f)(g) | | 1,640,000 | | 1,648,753 |
Providence Place Group Ltd. Partnership Series 2000-C1 Class A2, 7.75% 7/20/28 (f) | | 1,079,331 | | 1,381,435 |
RBSCF Trust Series 2010-MB1 Class D, 4.8386% 4/15/24 (f)(g) | | 2,687,000 | | 2,702,996 |
TimberStar Trust I Series 2006-1 Class F, 7.5296% 10/15/36 (f) | | 2,026,000 | | 2,071,964 |
UBS Commercial Mortgage Trust Series 2007-FL1 Class F, 0.766% 7/15/24 (f)(g) | | 1,459,000 | | 1,329,149 |
UBS-BAMLL Trust Series 12-WRM Class D, 4.3793% 6/10/30 (f)(g) | | 1,460,000 | | 1,255,064 |
Wachovia Bank Commercial Mortgage Trust: | | | | |
Series 2004-C10 Class E, 4.931% 2/15/41 | | 1,621,000 | | 1,636,711 |
Series 2004-C12 Class D, 5.4782% 7/15/41 (g) | | 1,824,000 | | 1,868,345 |
Series 2004-C14 Class B, 5.17% 8/15/41 | | 2,708,000 | | 2,792,105 |
WF-RBS Commercial Mortgage Trust: | | | | |
Series 2011-C3: | | | | |
Class C, 5.335% 3/15/44 (f) | | 2,100,000 | | 2,181,740 |
Class D, 5.7215% 3/15/44 (f)(g) | | 1,000,000 | | 961,854 |
Series 2011-C5 Class C, 5.8242% 11/15/44 (f)(g) | | 1,250,000 | | 1,323,506 |
Series 2012-C7 Class D, 5.0045% 6/15/45 (f)(g) | | 620,000 | | 591,327 |
TOTAL COMMERCIAL MORTGAGE SECURITIES (Cost $137,479,586) |
149,749,196
|
Floating Rate Loans - 9.0% |
| Principal Amount | | Value |
CONSUMER DISCRETIONARY - 4.2% |
Hotels, Restaurants & Leisure - 3.9% |
Cooper Hotel Group REL 12% 11/6/17 | | $ 2,336,274 | | $ 2,453,088 |
Extended Stay America, Inc. REL 9.625% 12/1/19 | | 2,000,000 | | 2,040,000 |
Four Seasons Holdings, Inc. Tranche 2LN, term loan 6.25% 12/27/20 (g) | | 100,000 | | 102,000 |
Hilton Worldwide, Inc.: | | | | |
Tranche C, term loan 3.692% 11/12/15 (g) | | 13,628,655 | | 13,475,333 |
Tranche D, term loan 3.942% 11/12/15 (g) | | 11,357,213 | | 11,229,444 |
La Quinta: | | | | |
Tranche A, term loan 11.375% 7/6/14 (g) | | 1,242,125 | | 1,265,477 |
Tranche B, term loan 11.375% 7/6/14 (g) | | 931,604 | | 949,118 |
| | 31,514,460 |
Multiline Retail - 0.1% |
JC Penney Corp., Inc. Tranche B, term loan 6% 5/21/18 (g) | | 1,070,000 | | 1,063,313 |
Specialty Retail - 0.2% |
The Pep Boys - Manny, Moe & Jack Tranche B, term loan 5% 10/11/18 (g) | | 1,353,200 | | 1,361,658 |
TOTAL CONSUMER DISCRETIONARY | | 33,939,431 |
FINANCIALS - 3.2% |
Diversified Financial Services - 1.3% |
Blackstone REL 10% 10/1/17 | | 7,495,041 | | 7,879,536 |
BRE Select Hotels Corp. REL 5.942% 5/9/18 (g) | | 2,260,845 | | 2,260,845 |
Pilot Travel Centers LLC Tranche B 2LN, term loan 4.25% 8/7/19 (g) | | 662,382 | | 662,382 |
| | 10,802,763 |
Real Estate Investment Trusts - 1.0% |
iStar Financial, Inc. Tranche B, term loan 4.5% 10/15/17 (g) | | 7,589,157 | | 7,608,130 |
Real Estate Management & Development - 0.9% |
CB Richard Ellis Services, Inc. Tranche B, term loan 2.9451% 3/28/21 (g) | | 887,775 | | 889,994 |
EOP Operating LP term loan 6.27% 2/1/14 (g) | | 1,700,000 | | 1,680,960 |
Equity Inns Reality LLC Tranche A, term loan 10.5% 11/4/13 (g) | | 2,195,829 | | 2,007,720 |
Realogy Corp.: | | | | |
Credit-Linked Deposit 3.1963% 10/10/13 (g) | | 195,806 | | 195,806 |
Floating Rate Loans - continued |
| Principal Amount | | Value |
FINANCIALS - continued |
Real Estate Management & Development - continued |
Realogy Corp.: - continued | | | | |
Credit-Linked Deposit 4.4463% 10/10/16 (g) | | $ 165,490 | | $ 165,490 |
Realogy Group LLC Tranche B, term loan 4.5% 3/5/20 (g) | | 2,573,550 | | 2,599,286 |
| | 7,539,256 |
Thrifts & Mortgage Finance - 0.0% |
Ocwen Loan Servicing, LLC Tranche B, term loan 5% 1/23/18 (g) | | 214,463 | | 218,216 |
TOTAL FINANCIALS | | 26,168,365 |
HEALTH CARE - 0.5% |
Health Care Providers & Services - 0.5% |
Community Health Systems, Inc. term loan 3.7728% 1/25/17 (g) | | 393,006 | | 395,953 |
Health Management Associates, Inc. Tranche B, term loan 3.5% 11/18/18 (g) | | 484,930 | | 486,143 |
Skilled Healthcare Group, Inc. term loan 6.7123% 4/9/16 (g) | | 3,153,281 | | 3,161,164 |
| | 4,043,260 |
INDUSTRIALS - 0.4% |
Construction & Engineering - 0.4% |
Drumm Investors LLC Tranche B, term loan 5% 5/4/18 (g) | | 3,588,173 | | 3,471,557 |
TELECOMMUNICATION SERVICES - 0.4% |
Wireless Telecommunication Services - 0.4% |
Crown Castle Operating Co.: | | | | |
Tranche A, term loan 2.69% 1/31/17 (g) | | 832,792 | | 832,792 |
Tranche B, term loan 3.25% 1/31/19 (g) | | 1,976,049 | | 1,976,049 |
| | 2,808,841 |
UTILITIES - 0.3% |
Electric Utilities - 0.3% |
La Frontera Generation, LLC Tranche B, term loan 4.5% 9/30/20 (g) | | 2,000,000 | | 2,012,600 |
TOTAL FLOATING RATE LOANS (Cost $71,071,114) |
72,444,054
|
Money Market Funds - 6.8% |
| Shares | | Value |
Fidelity Cash Central Fund, 0.11% (b) | 52,833,006 | | $ 52,833,006 |
Fidelity Securities Lending Cash Central Fund, 0.12% (b)(c) | 2,091,950 | | 2,091,950 |
TOTAL MONEY MARKET FUNDS (Cost $54,924,956) |
54,924,956
|
TOTAL INVESTMENT PORTFOLIO - 100.4% (Cost $747,838,035) | | 810,042,019 |
NET OTHER ASSETS (LIABILITIES) - (0.4)% | | (3,359,568) |
NET ASSETS - 100% | $ 806,682,451 |
Legend |
(a) Non-income producing |
(b) Affiliated fund that is generally available only to investment companies and other accounts managed by Fidelity Investments. The rate quoted is the annualized seven-day yield of the fund at period end. A complete unaudited listing of the fund's holdings as of its most recent quarter end is available upon request. In addition, each Fidelity Central Fund's financial statements, which are not covered by the Fund's Report of Independent Registered Public Accounting Firm, are available on the SEC's website or upon request. |
(c) Investment made with cash collateral received from securities on loan. |
(d) Non-income producing - Security is in default. |
(e) Security or a portion of the security is on loan at period end. |
(f) Security exempt from registration under Rule 144A of the Securities Act of 1933. These securities may be resold in transactions exempt from registration, normally to qualified institutional buyers. At the end of the period, the value of these securities amounted to $184,144,700 or 22.8% of net assets. |
(g) Coupon rates for floating and adjustable rate securities reflect the rates in effect at period end. |
(h) Security represents right to receive monthly interest payments on an underlying pool of mortgages or assets. Principal shown is the outstanding par amount of the pool as of the end of the period. |
Affiliated Central Funds |
Information regarding fiscal year to date income earned by the Fund from investments in Fidelity Central Funds is as follows: |
Fund | Income earned |
Fidelity Cash Central Fund | $ 50,742 |
Fidelity Securities Lending Cash Central Fund | 7,803 |
Total | $ 58,545 |
Other Information |
The following is a summary of the inputs used, as of July 31, 2013, involving the Fund's assets and liabilities carried at fair value. The inputs or methodology used for valuing securities may not be an indication of the risk associated with investing in those securities. For more information on valuation inputs, and their aggregation into the levels used in the tables below, please refer to the Investment Valuation section in the accompanying Notes to Financial Statements. |
Valuation Inputs at Reporting Date: |
Description | Total | Level 1 | Level 2 | Level 3 |
Investments in Securities: | | | | |
Equities: | | | | |
Consumer Discretionary | $ 4,352,084 | $ 4,352,084 | $ - | $ - |
Financials | 277,908,088 | 272,954,498 | 4,953,590 | - |
Health Care | 9,609,622 | 9,609,622 | - | - |
Corporate Bonds | 188,805,224 | - | 188,802,144 | 3,080 |
Asset-Backed Securities | 46,839,382 | - | 41,195,891 | 5,643,491 |
Collateralized Mortgage Obligations | 5,409,413 | - | 5,409,413 | - |
Commercial Mortgage Securities | 149,749,196 | - | 145,544,501 | 4,204,695 |
Floating Rate Loans | 72,444,054 | - | 53,915,030 | 18,529,024 |
Money Market Funds | 54,924,956 | 54,924,956 | - | - |
Total Investments in Securities: | $ 810,042,019 | $ 341,841,160 | $ 439,820,569 | $ 28,380,290 |
Valuation Inputs at Reporting Date: |
The following is a reconciliation of Investments in Securities for which Level 3 inputs were used in determining value: |
Investments in Securities: | |
Asset-Backed Securities | |
Beginning Balance | $ 15,625,880 |
Net Realized Gain (Loss) on Investment Securities | 1,173,556 |
Net Unrealized Gain (Loss) on Investment Securities | (617,099) |
Cost of Purchases | - |
Proceeds of Sales | (5,220,729) |
Amortization/Accretion | 22,947 |
Transfers into Level 3 | 2,518,600 |
Transfers out of Level 3 | (7,859,664) |
Ending Balance | $ 5,643,491 |
The change in unrealized gain (loss) for the period attributable to Level 3 securities held at July 31, 2013 | $ 350,953 |
Investments in Securities: | |
Commercial Mortgage Securities | |
Beginning Balance | $ 19,153,838 |
Net Realized Gain (Loss) on Investment Securities | 1,039,061 |
Net Unrealized Gain (Loss) on Investment Securities | (453,638) |
Cost of Purchases | 549,281 |
Proceeds of Sales | (6,914,070) |
Amortization/Accretion | 424,557 |
Transfers into Level 3 | - |
Transfers out of Level 3 | (9,594,334) |
Ending Balance | $ 4,204,695 |
The change in unrealized gain (loss) for the period attributable to Level 3 securities held at July 31, 2013 | $ 114,857 |
Floating Rate Loans | |
Beginning Balance | $ - |
Net Realized Gain (Loss) on Investment Securities | (184) |
Net Unrealized Gain (Loss) on Investment Securities | 280,594 |
Cost of Purchases | 18,234,089 |
Proceeds of Sales | (8,123) |
Amortization/Accretion | 22,648 |
Transfers into Level 3 | - |
Transfers out of Level 3 | - |
Ending Balance | $ 18,529,024 |
The change in unrealized gain (loss) for the period attributable to Level 3 securities held at July 31, 2013 | $ 280,594 |
Other investments in Securities | |
Beginning Balance | $ 3,470,000 |
Net Realized Gain (Loss) on Investment Securities | - |
Net Unrealized Gain (Loss) on Investment Securities | (4,620) |
Cost of Purchases | - |
Proceeds of Sales | (1,090,000) |
Amortization/Accretion | - |
Transfers into Level 3 | 7,700 |
Transfers out of Level 3 | (2,380,000) |
Ending Balance | $ 3,080 |
The change in unrealized gain (loss) for the period attributable to Level 3 securities held at July 31, 2013 | $ (4,620) |
The information used in the above reconciliations represents fiscal year to date activity for any Investments in Securities identified as using Level 3 inputs at either the beginning or the end of the current fiscal period. Transfers into Level 3 were attributable to a lack of observable market data resulting from decreases in market activity, decreases in liquidity, security restructurings or corporate actions. Transfers out of Level 3 were attributable to observable market data becoming available for those securities. Transfers in or out of Level 3 represent the beginning value of any Security or Instrument where a change in the pricing level occurred from the beginning to the end of the period. The cost of purchases and the proceeds of sales may include securities received or delivered through corporate actions or exchanges. Realized and unrealized gains (losses) disclosed in the reconciliation are included in Net Gain (Loss) on the Fund's Statement of Operations. |
Other Information |
The composition of credit quality ratings as a percentage of net assets is as follows (Unaudited): |
U.S. Government and U.S. Government Agency Obligations | 0.2% |
AAA,AA,A | 7.7% |
BBB | 13.8% |
BB | 6.3% |
B | 14.1% |
CCC,CC,C | 1.7% |
Not Rated | 13.6% |
Equities | 36.2% |
Short-Term Investments and Net Other Assets | 6.4% |
| 100.0% |
We have used ratings from Moody's Investors Service, Inc. Where Moody's® ratings are not available, we have used S&P® ratings. All ratings are as of the date indicated and do not reflect subsequent changes. |
See accompanying notes which are an integral part of the financial statements.
Annual Report
Statement of Assets and Liabilities
| July 31, 2013 |
| | |
Assets | | |
Investment in securities, at value (including securities loaned of $2,013,029) - See accompanying schedule: Unaffiliated issuers (cost $692,913,079) | $ 755,117,063 | |
Fidelity Central Funds (cost $54,924,956) | 54,924,956 | |
Total Investments (cost $747,838,035) | | $ 810,042,019 |
Cash | | 14,088 |
Receivable for investments sold | | 289,680 |
Receivable for fund shares sold | | 802,729 |
Dividends receivable | | 394,083 |
Interest receivable | | 4,484,645 |
Distributions receivable from Fidelity Central Funds | | 6,456 |
Other receivables | | 1,448 |
Total assets | | 816,035,148 |
| | |
Liabilities | | |
Payable for investments purchased | $ 6,029,703 | |
Payable for fund shares redeemed | 694,642 | |
Accrued management fee | 370,857 | |
Other affiliated payables | 90,682 | |
Other payables and accrued expenses | 74,863 | |
Collateral on securities loaned, at value | 2,091,950 | |
Total liabilities | | 9,352,697 |
| | |
Net Assets | | $ 806,682,451 |
Net Assets consist of: | | |
Paid in capital | | $ 723,449,065 |
Undistributed net investment income | | 9,002,217 |
Accumulated undistributed net realized gain (loss) on investments and foreign currency transactions | | 12,027,185 |
Net unrealized appreciation (depreciation) on investments | | 62,203,984 |
Net Assets | | $ 806,682,451 |
See accompanying notes which are an integral part of the financial statements.
Annual Report
Financial Statements - continued
Statement of Assets and Liabilities - continued
| July 31, 2013 |
| | |
Series Real Estate Income:
Net Asset Value, offering price and redemption price per share ($415,192,051 ÷ 36,403,474 shares) | | $ 11.41 |
| | |
Class F:
Net Asset Value, offering price and redemption price per share ($391,490,400 ÷ 34,315,475 shares) | | $ 11.41 |
See accompanying notes which are an integral part of the financial statements.
Annual Report
Statement of Operations
| Year ended July 31, 2013 |
| | |
Investment Income | | |
Dividends | | $ 15,147,777 |
Interest | | 36,199,593 |
Income from Fidelity Central Funds | | 58,545 |
Total income | | 51,405,915 |
| | |
Expenses | | |
Management fee | $ 4,300,092 | |
Transfer agent fees | 752,890 | |
Accounting and security lending fees | 343,492 | |
Custodian fees and expenses | 14,337 | |
Independent trustees' compensation | 4,818 | |
Audit | 86,358 | |
Legal | 2,307 | |
Miscellaneous | 7,130 | |
Total expenses before reductions | 5,511,424 | |
Expense reductions | (9,591) | 5,501,833 |
Net investment income (loss) | | 45,904,082 |
Realized and Unrealized Gain (Loss) Net realized gain (loss) on: | | |
Investment securities: | | |
Unaffiliated issuers | 16,875,858 | |
Foreign currency transactions | 155 | |
Total net realized gain (loss) | | 16,876,013 |
Change in net unrealized appreciation (depreciation) on: Investment securities | 12,483,058 | |
Assets and liabilities in foreign currencies | (4) | |
Total change in net unrealized appreciation (depreciation) | | 12,483,054 |
Net gain (loss) | | 29,359,067 |
Net increase (decrease) in net assets resulting from operations | | $ 75,263,149 |
See accompanying notes which are an integral part of the financial statements.
Annual Report
Financial Statements - continued
Statement of Changes in Net Assets
| Year ended
July 31,
2013 | For the period
October 20, 2011 (commencement of operations) to
July 31, 2012 |
Increase (Decrease) in Net Assets | | |
Operations | | |
Net investment income (loss) | $ 45,904,082 | $ 26,921,648 |
Net realized gain (loss) | 16,876,013 | 5,969,627 |
Change in net unrealized appreciation (depreciation) | 12,483,054 | 49,720,930 |
Net increase (decrease) in net assets resulting
from operations | 75,263,149 | 82,612,205 |
Distributions to shareholders from net investment income | (44,907,661) | (18,782,490) |
Distributions to shareholders from net realized gain | (10,435,441) | (516,375) |
Total distributions | (55,343,102) | (19,298,865) |
Share transactions - net increase (decrease) | 83,757,064 | 639,692,000 |
Total increase (decrease) in net assets | 103,677,111 | 703,005,340 |
| | |
Net Assets | | |
Beginning of period | 703,005,340 | - |
End of period (including undistributed net investment income of $9,002,217 and undistributed net investment income of $8,139,158, respectively) | $ 806,682,451 | $ 703,005,340 |
See accompanying notes which are an integral part of the financial statements.
Annual Report
Financial Highlights - Series Real Estate Income
| Year ended
July 31, | Period ended
July 31, |
| 2013 | 2012 G |
Selected Per-Share Data | | |
Net asset value, beginning of period | $ 11.10 | $ 10.00 |
Income from Investment Operations | | |
Net investment income (loss) D | .67 | .47 |
Net realized and unrealized gain (loss) | .46 | .97 |
Total from investment operations | 1.13 | 1.44 |
Distributions from net investment income | (.66) | (.33) |
Distributions from net realized gain | (.16) | (.01) |
Total distributions | (.82) | (.34) |
Net asset value, end of period | $ 11.41 | $ 11.10 |
Total Return B,C | 10.50% | 14.67% |
Ratios to Average Net Assets E,H | | |
Expenses before reductions | .79% | .80% A |
Expenses net of fee waivers, if any | .79% | .80% A |
Expenses net of all reductions | .79% | .80% A |
Net investment income (loss) | 5.85% | 5.70% A |
Supplemental Data | | |
Net assets, end of period (000 omitted) | $ 415,192 | $ 416,151 |
Portfolio turnover rate F | 25% | 29% A |
A Annualized
B Total returns for periods of less than one year are not annualized.
C Total returns would have been lower if certain expenses had not been reduced during the applicable periods shown.
D Calculated based on average shares outstanding during the period.
E Fees and expenses of any underlying Fidelity Central Funds are not included in the Fund's expense ratio. The Fund indirectly bears its proportionate share of the expenses of any underlying Fidelity Central Funds.
F Amount does not include the portfolio activity of any underlying Fidelity Central Funds.
G For the period October 20, 2011 (commencement of operations) to July 31, 2012.
H Expense ratios reflect operating expenses of the class. Expenses before reductions do not reflect amounts reimbursed by the investment adviser or reductions from brokerage service arrangements or reductions from other expense offset arrangements and do not represent the amount paid by the class during periods when reimbursements or reductions occur. Expense ratios before reductions for start-up periods may not be representative of longer-term operating periods. Expenses net of fee waivers reflect expenses after reimbursement by the investment adviser but prior to reductions from brokerage service arrangements or other expense offset arrangements. Expenses net of all reductions represent the net expenses paid by the class.
See accompanying notes which are an integral part of the financial statements.
Annual Report
Financial Highlights - Class F
| Year ended July 31, | Period ended
July 31, |
| 2013 | 2012 G |
Selected Per-Share Data | | |
Net asset value, beginning of period | $ 11.11 | $ 10.00 |
Income from Investment Operations | | |
Net investment income (loss) D | .69 | .48 |
Net realized and unrealized gain (loss) | .45 | .98 |
Total from investment operations | 1.14 | 1.46 |
Distributions from net investment income | (.68) | (.34) |
Distributions from net realized gain | (.16) | (.01) |
Total distributions | (.84) | (.35) |
Net asset value, end of period | $ 11.41 | $ 11.11 |
Total Return B,C | 10.60% | 14.89% |
Ratios to Average Net Assets E,H | | |
Expenses before reductions | .61% | .62% A |
Expenses net of fee waivers, if any | .61% | .62% A |
Expenses net of all reductions | .61% | .62% A |
Net investment income (loss) | 6.02% | 5.88% A |
Supplemental Data | | |
Net assets, end of period (000 omitted) | $ 391,490 | $ 286,854 |
Portfolio turnover rate F | 25% | 29% A |
A Annualized
B Total returns for periods of less than one year are not annualized.
C Total returns would have been lower if certain expenses had not been reduced during the applicable periods shown.
D Calculated based on average shares outstanding during the period.
E Fees and expenses of any underlying Fidelity Central Funds are not included in the Fund's expense ratio. The Fund indirectly bears its proportionate share of the expenses of any underlying Fidelity Central Funds.
F Amount does not include the portfolio activity of any underlying Fidelity Central Funds.
G For the period October 20, 2011 (commencement of operations) to July 31, 2012.
H Expense ratios reflect operating expenses of the class. Expenses before reductions do not reflect amounts reimbursed by the investment adviser or reductions from brokerage service arrangements or reductions from other expense offset arrangements and do not represent the amount paid by the class during periods when reimbursements or reductions occur. Expense ratios before reductions for start-up periods may not be representative of longer-term operating periods. Expenses net of fee waivers reflect expenses after reimbursement by the investment adviser but prior to reductions from brokerage service arrangements or other expense offset arrangements. Expenses net of all reductions represent the net expenses paid by the class.
See accompanying notes which are an integral part of the financial statements.
Annual Report
Notes to Financial Statements
For the period ended July 31, 2013
1. Organization.
Fidelity Series Real Estate Income Fund (the Fund) is a fund of Fidelity Securities Fund (the Trust) and is authorized to issue an unlimited number of shares. Shares of the Fund are only available for purchase by mutual funds for which Fidelity Management & Research Company (FMR) or an affiliate serves as an investment manager. The Trust is registered under the Investment Company Act of 1940, as amended (the 1940 Act), as an open-end management investment company organized as a Massachusetts business trust. The Fund offers Series Real Estate Equity and Class F shares, each of which has equal rights as to assets and voting privileges. Each class has exclusive voting rights with respect to matters that affect that class.
2. Investments in Fidelity Central Funds.
The Fund invests in Fidelity Central Funds, which are open-end investment companies generally available only to other investment companies and accounts managed by FMR and its affiliates. The Fund's Schedule of Investments lists each of the Fidelity Central Funds held as of period end, if any, as an investment of the Fund, but does not include the underlying holdings of each Fidelity Central Fund. As an Investing Fund, the Fund indirectly bears its proportionate share of the expenses of the underlying Fidelity Central Funds.
The Money Market Central Funds seek preservation of capital and current income and are managed by Fidelity Investments Money Management, Inc. (FIMM), an affiliate of FMR.
A complete unaudited list of holdings for each Fidelity Central Fund is available upon request or at the Securities and Exchange Commission (the SEC) website at www.sec.gov. In addition, the financial statements of the Fidelity Central Funds, which are not covered by the Fund's Report of Independent Registered Public Accounting Firm, are available on the SEC website or upon request.
3. Significant Accounting Policies.
The financial statements have been prepared in conformity with accounting principles generally accepted in the United States of America (GAAP), which require management to make certain estimates and assumptions at the date of the financial statements. Actual results could differ from those estimates. Subsequent events, if any, through the date that the financial statements were issued have been evaluated in the preparation of the financial statements. The following summarizes the significant accounting policies of the Fund:
Investment Valuation. Investments are valued as of 4:00 p.m. Eastern time on the last calendar day of the period. In accordance with valuation policies and procedures
Annual Report
3. Significant Accounting Policies - continued
Investment Valuation - continued
approved by the Board of Trustees (the Board), the Fund attempts to obtain prices from one or more third party pricing vendors or brokers to value its investments. When current market prices, quotations or currency exchange rates are not readily available or reliable, investments will be fair valued in good faith by the FMR Fair Value Committee (the Committee), in accordance with procedures adopted by the Board. Factors used in determining fair value vary by investment type and may include market or investment specific events, changes in interest rates and credit quality. The frequency with which these procedures are used cannot be predicted and they may be utilized to a significant extent. The Committee oversees the Fund's valuation policies and procedures and is responsible for approving and reporting to the Board all fair value determinations.
The Fund categorizes the inputs to valuation techniques used to value its investments into a disclosure hierarchy consisting of three levels as shown below:
Level 1 - quoted prices in active markets for identical investments
Level 2 - other significant observable inputs (including quoted prices for similar investments, interest rates, prepayment speeds, etc.)
Level 3 - unobservable inputs (including the Fund's own assumptions based on the best information available)
Valuation techniques used to value the Fund's investments by major category are as follows:
Equity securities, including restricted securities, for which market quotations are readily available, are valued at the last reported sale price or official closing price as reported by a third party pricing vendor on the primary market or exchange on which they are traded and are categorized as Level 1 in the hierarchy. In the event there were no sales during the day or closing prices are not available, securities are valued at the last quoted bid price or may be valued using the last available price and are generally categorized as Level 2 in the hierarchy. For foreign equity securities, when market or security specific events arise, comparisons to the valuation of American Depositary Receipts (ADRs), futures contracts, Exchange-Traded Funds (ETFs) and certain indexes as well as quoted prices for similar securities may be used and would be categorized as Level 2 in the hierarchy. Utilizing these techniques may result in transfers between Level 1 and Level 2.
Debt securities, including restricted securities, are valued based on evaluated prices received from third party pricing vendors or from brokers who make markets in such securities. For corporate bonds and floating rate loans, pricing vendors utilize matrix pricing which considers yield or price of bonds of comparable quality, coupon, maturity and type as well as broker-supplied prices. For asset backed securities, collateralized
Annual Report
Notes to Financial Statements - continued
3. Significant Accounting Policies - continued
Investment Valuation - continued
mortgage obligations and commercial mortgage securities, pricing vendors utilize matrix pricing which considers prepayment speed assumptions, attributes of the collateral, yield or price of bonds of comparable quality, coupon, maturity and type as well as broker-supplied prices. Independent prices obtained from a single source or broker are evaluated by management and may be categorized as Level 3 in the hierarchy. When independent prices are unavailable or unreliable, debt securities may be valued utilizing pricing methodologies which consider similar factors that would be used by third party pricing vendors. Debt securities are generally categorized as Level 2 in the hierarchy but may be Level 3 depending on the circumstances.
Investments in open-end mutual funds, including the Fidelity Central Funds, are valued at their closing net asset value (NAV) each business day and are categorized as Level 1 in the hierarchy.
Changes in valuation techniques may result in transfers in or out of an assigned level within the disclosure hierarchy. The aggregate value of investments by input level, as of July 31, 2013, as well as a roll forward of Level 3 investments, is included at the end of the Fund's Schedule of Investments.
Foreign Currency. The Fund may use foreign currency contracts to facilitate transactions in foreign-denominated securities. Gains and losses from these transactions may arise from changes in the value of the foreign currency or if the counterparties do not perform under the contracts' terms.
Foreign-denominated assets, including investment securities, and liabilities are translated into U.S. dollars at the exchange rates at period end. Purchases and sales of investment securities, income and dividends received and expenses denominated in foreign currencies are translated into U.S. dollars at the exchange rate in effect on the transaction date.
The effects of exchange rate fluctuations on investments are included with the net realized and unrealized gain (loss) on investment securities. Other foreign currency transactions resulting in realized and unrealized gain (loss) are disclosed separately.
Investment Transactions and Income. For financial reporting purposes, the Fund's investment holdings and NAV include trades executed through the end of the last business day of the period. The NAV per share for processing shareholder transactions is calculated as of the close of business of the New York Stock Exchange (NYSE), normally
Annual Report
3. Significant Accounting Policies - continued
Investment Transactions and Income - continued
4:00 p.m. Eastern time and includes trades executed through the end of the prior business day. Gains and losses on securities sold are determined on the basis of identified cost. Dividend income is recorded on the ex-dividend date except for certain dividends from foreign securities where the ex-dividend date may have passed, which are recorded as soon as the Fund is informed of the ex-dividend date. Non-cash dividends included in dividend income, if any, are recorded at the fair market value of the securities received. Distributions received on securities that represent a return of capital or capital gain are recorded as a reduction of cost of investments and/or as a realized gain. Subsequent to ex-dividend date the Fund determines the components of these distributions, based upon receipt of tax filings or other correspondence relating to the underlying investment. Interest income and distributions from the Fidelity Central Funds are accrued as earned. Interest income includes coupon interest and amortization of premium and accretion of discount on debt securities. Investment income is recorded net of foreign taxes withheld where recovery of such taxes is uncertain. Debt obligations may be placed on non-accrual status and related interest income may be reduced by ceasing current accruals and writing off interest receivables when the collection of all or a portion of interest has become doubtful based on consistently applied procedures. A debt obligation is removed from non-accrual status when the issuer resumes interest payments or when collectability of interest is reasonably assured. The Fund earns certain fees in connection with its floating rate loan purchasing activities. These fees are in addition to interest payments earned and may include amendment fees, consent fees and prepayment fees. These fees are recorded as Interest in the accompanying financial statements.
Class Allocations and Expenses. Investment income, realized and unrealized capital gains and losses, common expenses of the Fund, and certain fund-level expense reductions, if any, are allocated on a pro-rata basis to each class based on the relative net assets of each class to the total net assets of the Fund. Each class differs with respect to transfer agent fees incurred. Certain expense reductions may also differ by class. Expenses directly attributable to a fund are charged to that fund. Expenses attributable to more than one fund are allocated among the respective funds on the basis of relative net assets or other appropriate methods. Expense estimates are accrued in the period to which they relate and adjustments are made when actual amounts are known.
Income Tax Information and Distributions to Shareholders. Each year, the Fund intends to qualify as a regulated investment company under Subchapter M of the Internal Revenue Code, including distributing substantially all of its taxable income and realized gains. As a result, no provision for income taxes is required. As of July 31, 2013, the Fund did not have any unrecognized tax benefits in the financial statements; nor is the Fund aware of any tax positions for which it is reasonably possible that the total
Annual Report
Notes to Financial Statements - continued
3. Significant Accounting Policies - continued
Income Tax Information and Distributions to Shareholders - continued
amounts of unrecognized tax benefits will significantly change in the next twelve months. The Fund files a U.S. federal tax return, in addition to state and local tax returns as required. A fund's federal income tax returns are subject to examination by the Internal Revenue Service (IRS) for a period of three fiscal years after they are filed. State and local tax returns may be subject to examination for an additional fiscal year depending on the jurisdiction. Foreign taxes are provided for based on the Fund's understanding of the tax rules and rates that exist in the foreign markets in which it invests.
Distributions are declared and recorded on the ex-dividend date. Income dividends and capital gain distributions are declared separately for each class. Income and capital gain distributions are determined in accordance with income tax regulations, which may differ from GAAP.
Capital accounts within the financial statements are adjusted for permanent book-tax differences. These adjustments have no impact on net assets or the results of operations. Temporary book-tax differences will reverse in a subsequent period.
Book-tax differences are primarily due to foreign currency transactions, passive foreign investment companies (PFIC), equity-debt classifications and losses deferred due to wash sales.
The federal tax cost of investment securities and unrealized appreciation (depreciation) as of period end were as follows:
Gross unrealized appreciation | $ 67,771,604 |
Gross unrealized depreciation | (6,116,706) |
Net unrealized appreciation (depreciation) on securities and other investments | $ 61,654,898 |
| |
Tax Cost | $ 748,387,121 |
The tax-based components of distributable earnings as of period end were as follows:
Undistributed ordinary income | $ 13,485,972 |
Undistributed long-term capital gain | $ 8,166,743 |
Net unrealized appreciation (depreciation) | $ 61,654,898 |
Annual Report
3. Significant Accounting Policies - continued
Income Tax Information and Distributions to Shareholders - continued
The tax character of distributions paid was as follows:
| July 31, 2013 | July 31, 2012 |
Ordinary Income | $ 54,427,784 | $ 19,298,865 |
Long-term Capital Gains | 915,318 | - |
Total | $ 55,343,102 | $ 19,298,865 |
Restricted Securities. The Fund may invest in securities that are subject to legal or contractual restrictions on resale. These securities generally may be resold in transactions exempt from registration or to the public if the securities are registered. Disposal of these securities may involve time-consuming negotiations and expense, and prompt sale at an acceptable price may be difficult. Information regarding restricted securities is included at the end of the Fund's Schedule of Investments.
Loans and Other Direct Debt Instruments. The Fund invests in direct debt instruments which are interests in amounts owed to lenders by corporate or other borrowers. These instruments may be in the form of loans, trade claims or other receivables and may include standby financing commitments such as revolving credit facilities that obligate the Fund to supply additional cash to the borrower on demand. Loans may be acquired through assignment or participation, or may be made directly to a borrower. The Fund may be contractually obligated to receive approval from the agent bank and/or borrower prior to the sale of these loans. The Fund did not have any unfunded loan commitments, which are contractual obligations for future funding, at period end.
4. Purchases and Sales of Investments.
Purchases and sales of securities, other than short-term securities, aggregated $222,189,977 and $183,906,051, respectively.
5. Fees and Other Transactions with Affiliates.
Management Fee. FMR and its affiliates provide the Fund with investment management related services for which the Fund pays a monthly management fee. The management fee is the sum of an individual fund fee rate that is based on an annual rate of .30% of the Fund's average net assets and an annualized group fee rate that averaged .26% during the period. The group fee rate is based upon the average net assets of all the mutual funds advised by FMR. The group fee rate decreases as assets under management increase and increases as assets under management decrease. For the period, the total annual management fee rate was .56% of the Fund's average net assets.
Annual Report
Notes to Financial Statements - continued
5. Fees and Other Transactions with Affiliates - continued
Transfer Agent Fees. Fidelity Investments Institutional Operations Company, Inc., (FIIOC), an affiliate of FMR, is the transfer, dividend disbursing and shareholder servicing agent for each class of the Fund. FIIOC receives account fees and asset-based fees that vary according to the account size and type of account of the shareholders of Series Real Estate Income, except for Class F. FIIOC receives no fees for providing transfer agency services to Class F. FIIOC pays for typesetting, printing and mailing of shareholder reports, except proxy statements. For the period, transfer agent fees for each applicable class were as follows:
| Amount | % of
Average
Net Assets |
Series Real Estate Income | $ 752,890 | .17 |
Accounting and Security Lending Fees. Fidelity Service Company, Inc. (FSC), an affiliate of FMR, maintains the Fund's accounting records. The accounting fee is based on the level of average net assets for each month. Under a separate contract, FSC administers the security lending program. The security lending fee is based on the number and duration of lending transactions.
Brokerage Commissions. The Fund placed a portion of its portfolio transactions with brokerage firms which are affiliates of the investment adviser. Brokerage commissions are included in net realized gain (loss) and change in net unrealized appreciation (depreciation) in the Statement of Operations. The commissions paid to these affiliated firms were $2,780 for the period.
6. Committed Line of Credit.
The Fund participates with other funds managed by FMR or an affiliate in a $4.25 billion credit facility (the "line of credit") to be utilized for temporary or emergency purposes to fund shareholder redemptions or for other short-term liquidity purposes. The Fund has agreed to pay commitment fees on its pro-rata portion of the line of credit, which amounted to $1,804 and is reflected in Miscellaneous expenses on the Statement of Operations. During the period, there were no borrowings on this line of credit.
7. Security Lending.
The Fund lends portfolio securities through a lending agent from time to time in order to earn additional income. For equity securities, a lending agent is used and may loan securities to certain qualified borrowers, including Fidelity Capital Markets (FCM), a broker-dealer affiliated with the Fund. On the settlement date of the loan, the Fund
Annual Report
7. Security Lending - continued
receives collateral (in the form of U.S. Treasury obligations, letters of credit and/or cash) against the loaned securities and maintains collateral in an amount not less than 100% of the market value of the loaned securities during the period of the loan. The market value of the loaned securities is determined at the close of business of the Fund and any additional required collateral is delivered to the Fund on the next business day. If the borrower defaults on its obligation to return the securities loaned because of insolvency or other reasons, the Fund may apply collateral received from the borrower against the obligation. The Fund may experience delays and costs in recovering the securities loaned. Any cash collateral received is invested in the Fidelity Securities Lending Cash Central Fund. The value of loaned securities and cash collateral at period end are disclosed on the Fund's Statement of Assets and Liabilities. Security lending income represents the income earned on investing cash collateral, less rebates paid to borrowers and any lending agent fees associated with the loan, plus any premium payments received for lending certain types of securities. Security lending income is presented in the Statement of Operations as a component of income from Fidelity Central Funds. Total security lending income during the period amounted to $7,803. During the period, there were no securities loaned to FCM.
8. Expense Reductions.
Commissions paid to certain brokers with whom FMR places trades on behalf of the Fund include an amount in addition to trade execution, which is rebated back to the Fund to offset certain expenses. This amount totaled $7,902 for the period. In addition, through arrangements with the Fund's custodian, credits realized as a result of uninvested cash balances were used to reduce the Fund's expenses. During the period, these credits reduced the Fund's custody expenses by $1,689.
9. Distributions to Shareholders.
Distributions to shareholders of each class were as follows:
| Year ended
July 31,
2013 | Period ended
July 31,
2012 A |
From net investment income | | |
Series Real Estate Income | $ 24,942,481 | $ 12,027,607 |
Class F | 19,965,180 | 6,754,883 |
Total | $ 44,907,661 | $ 18,782,490 |
From net realized gain | | |
Series Real Estate Income | $ 6,141,225 | $ 360,160 |
Class F | 4,294,216 | 156,215 |
Total | $ 10,435,441 | $ 516,375 |
A For the period October 20, 2011 (commencement of operations) to July 31, 2012.
Annual Report
Notes to Financial Statements - continued
10. Share Transactions.
Transactions for each class of shares were as follows:
| Shares | Dollars |
| Year ended
July 31,
2013 | Period ended
July 31,
2012 A | Year ended
July 31,
2013 | Period ended
July 31,
2012 A |
Series Real Estate Income | | | | |
Shares sold | 7,016,602 | 37,244,380 B | $ 79,894,286 | $ 373,024,203 B |
Reinvestment of distributions | 2,775,858 | 1,190,173 | 31,083,706 | 12,387,767 |
Shares redeemed | (10,869,294) | (954,245) | (123,967,802) | (9,701,976) |
Net increase (decrease) | (1,076,834) | 37,480,308 | $ (12,989,810) | $ 375,709,994 |
Class F | | | | |
Shares sold | 9,486,077 | 25,373,246 B | $ 108,393,021 | $ 259,200,242 B |
Reinvestment of distributions | 2,161,262 | 661,737 | 24,259,396 | 6,911,098 |
Shares redeemed | (3,157,748) | (209,099) | (35,905,543) | (2,129,334) |
Net increase (decrease) | 8,489,591 | 25,825,884 | $ 96,746,874 | $ 263,982,006 |
A For the period October 20, 2011 (commencement of operations) to July 31, 2012.
B Amount includes in-kind exchanges
11. Other.
The Fund's organizational documents provide former and current trustees and officers with a limited indemnification against liabilities arising in connection with the performance of their duties to the Fund. In the normal course of business, the Fund may also enter into contracts that provide general indemnifications. The Fund's maximum exposure under these arrangements is unknown as this would be dependent on future claims that may be made against the Fund. The risk of material loss from such claims is considered remote.
At the end of the period, mutual funds managed by FMR or an FMR affiliate were the owners of record of all of the outstanding shares of the Fund.
Annual Report
To the Trustees of Fidelity Securities Fund and Shareholders of Fidelity Series Real Estate Income Fund:
We have audited the accompanying statement of assets and liabilities of Fidelity Series Real Estate Income Fund (the Fund), a fund of Fidelity Securities Fund, including the schedule of investments, as of July 31, 2013, and the related statement of operations for the year then ended, and the statement of changes in net assets, and the financial highlights for the year then ended and for the period from October 20, 2011 (commencement of operations) to July 31, 2012. These financial statements and financial highlights are the responsibility of the Fund's management. Our responsibility is to express an opinion on these financial statements and financial highlights based on our audit.
We conducted our audit in accordance with the standards of the Public Company Accounting Oversight Board (United States). Those standards require that we plan and perform the audit to obtain reasonable assurance about whether the financial statements and financial highlights are free of material misstatement. The Fund is not required to have, nor were we engaged to perform, an audit of its internal control over financial reporting. Our audit included consideration of internal control over financial reporting as a basis for designing audit procedures that are appropriate in the circumstances, but not for the purpose of expressing an opinion on the effectiveness of the Fund's internal control over financial reporting. Accordingly, we express no such opinion. An audit also includes examining, on a test basis, evidence supporting the amounts and disclosures in the financial statements, assessing the accounting principles used and significant estimates made by management, as well as evaluating the overall financial statement presentation. Our procedures included confirmation of securities owned as of July 31, 2013, by correspondence with the custodians, agent banks, and brokers; where replies were not received from brokers, we performed other auditing procedures. We believe that our audits provide a reasonable basis for our opinion.
In our opinion, the financial statements and financial highlights referred to above present fairly, in all material respects, the financial position of Fidelity Series Real Estate Income Fund as of July 31, 2013, the results of its operations for the year then ended, and the changes in its net assets, and the financial highlights for the year then ended and for the period from October 20, 2011 (commencement of operations) to July 31, 2012, in conformity with accounting principles generally accepted in the United States of America.
DELOITTE & TOUCHE LLP
Boston, Massachusetts
September 20, 2013
Annual Report
The Trustees, Member of the Advisory Board, and executive officers of the trust and fund, as applicable, are listed below. The Board of Trustees governs the fund and is responsible for protecting the interests of shareholders. The Trustees are experienced executives who meet periodically throughout the year to oversee the fund's activities, review contractual arrangements with companies that provide services to the fund, oversee management of the risks associated with such activities and contractual arrangements, and review the fund's performance. Except for James C. Curvey, Ned C. Lautenbach, Ronald P. O'Hanley, and William S. Stavropoulos, each of the Trustees oversees 166 Fidelity funds. Mr. Curvey oversees 387 Fidelity funds. Mr. Lautenbach, Mr. O'Hanley, and Mr. Stavropoulos each oversees 230 Fidelity funds.
The Trustees hold office without limit in time except that (a) any Trustee may resign; (b) any Trustee may be removed by written instrument, signed by at least two-thirds of the number of Trustees prior to such removal; (c) any Trustee who requests to be retired or who has become incapacitated by illness or injury may be retired by written instrument signed by a majority of the other Trustees; and (d) any Trustee may be removed at any special meeting of shareholders by a two-thirds vote of the outstanding voting securities of the trust. Each Trustee who is not an interested person of the trust and the fund (as defined in the 1940 Act) (Independent Trustee), shall retire not later than the last day of the calendar year in which his or her 75th birthday occurs. The Independent Trustees may waive this mandatory retirement age policy with respect to individual Trustees. The executive officers and Advisory Board Member hold office without limit in time, except that any officer and Advisory Board Member may resign or may be removed by a vote of a majority of the Trustees at any regular meeting or any special meeting of the Trustees. Except as indicated, each individual has held the office shown or other offices in the same company for the past five years.
Experience, Skills, Attributes, and Qualifications of the Fund's Trustees. The Governance and Nominating Committee has adopted a statement of policy that describes the experience, qualifications, attributes, and skills that are necessary and desirable for potential Independent Trustee candidates (Statement of Policy). The Board believes that each Trustee satisfied at the time he or she was initially elected or appointed a Trustee, and continues to satisfy, the standards contemplated by the Statement of Policy. The Governance and Nominating Committee also engages professional search firms to help identify potential Independent Trustee candidates who have the experience, qualifications, attributes, and skills consistent with the Statement of Policy. From time to time, additional criteria based on the composition and skills of the current Independent Trustees, as well as experience or skills that may be appropriate in light of future changes to board composition, business conditions, and regulatory or other developments, have also been considered by the professional search firms and the Governance and Nominating Committee. In addition, the Board takes into account the Trustees' commitment and participation in Board and committee meetings, as well as their leadership of standing and ad hoc committees throughout their tenure.
Annual Report
Trustees and Officers - continued
In determining that a particular Trustee was and continues to be qualified to serve as a Trustee, the Board has considered a variety of criteria, none of which, in isolation, was controlling. The Board believes that, collectively, the Trustees have balanced and diverse experience, qualifications, attributes, and skills, which allow the Board to operate effectively in governing the fund and protecting the interests of shareholders. Information about the specific experience, skills, attributes, and qualifications of each Trustee, which in each case led to the Board's conclusion that the Trustee should serve (or continue to serve) as a trustee of the fund, is provided below.
Board Structure and Oversight Function. James C. Curvey is an interested person (as defined in the 1940 Act) and currently serves as Chairman. The Trustees have determined that an interested Chairman is appropriate and benefits shareholders because an interested Chairman has a personal and professional stake in the quality and continuity of services provided to the fund. Independent Trustees exercise their informed business judgment to appoint an individual of their choosing to serve as Chairman, regardless of whether the Trustee happens to be independent or a member of management. The Independent Trustees have determined that they can act independently and effectively without having an Independent Trustee serve as Chairman and that a key structural component for assuring that they are in a position to do so is for the Independent Trustees to constitute a substantial majority for the Board. The Independent Trustees also regularly meet in executive session. Ned C. Lautenbach serves as Chairman of the Independent Trustees and as such (i) acts as a liaison between the Independent Trustees and management with respect to matters important to the Independent Trustees and (ii) with management prepares agendas for Board meetings.
Fidelity funds are overseen by different Boards of Trustees. The fund's Board oversees Fidelity's equity and high income funds and another Board oversees Fidelity's investment-grade bond, money market, and asset allocation funds. The asset allocation funds may invest in Fidelity funds overseen by the fund's Board. The use of separate Boards, each with its own committee structure, allows the Trustees of each group of Fidelity funds to focus on the unique issues of the funds they oversee, including common research, investment, and operational issues. On occasion, the separate Boards establish joint committees to address issues of overlapping consequences for the Fidelity funds overseen by each Board.
The Trustees operate using a system of committees to facilitate the timely and efficient consideration of all matters of importance to the Trustees, the fund, and fund shareholders and to facilitate compliance with legal and regulatory requirements and oversight of the fund's activities and associated risks. The Board, acting through its committees, has charged FMR and its affiliates with (i) identifying events or circumstances the occurrence of which could have demonstrably adverse effects on the fund's business and/or reputation; (ii) implementing processes and controls to lessen the possibility that such events or circumstances occur or to mitigate the effects of such events or circumstances if they do occur; and (iii) creating and maintaining a system designed to evaluate continuously business and market conditions in order to facilitate the identification and implementation processes described in (i) and (ii) above. Because the day-to-day operations and activities of the fund are carried out by or through FMR, its affiliates and other service providers, the fund's exposure to risks is mitigated but not eliminated by the processes overseen by the Trustees. While each of the Board's committees has responsibility for overseeing different aspects of the fund's activities, oversight is exercised primarily through the Operations, Audit, and Compliance Committees. In addition, the Independent Trustees have worked with FMR to enhance the Board's oversight of investment and financial risks, legal and regulatory risks, technology risks, and operational risks, including the development of additional risk reporting to the Board. For example, a working group comprised of Independent Trustees and FMR has worked and continues to work to review the Fidelity funds' valuation-related activities, reporting and risk management. Appropriate personnel, including but not limited to the fund's Chief Compliance Officer (CCO), FMR's internal auditor, the independent accountants, the fund's Treasurer and portfolio management personnel, make periodic reports to the Board's committees, as appropriate, including an annual review of FMR's risk management program for the Fidelity funds. The responsibilities of each standing committee, including their oversight responsibilities, are described further under "Standing Committees of the Fund's Trustees."
Annual Report
The fund's Statements of Additional Information (SAIs) include more information about the Trustees. To request a free copy, call Fidelity at 1-800-544-8544 for Fidelity Series Real Estate Income Fund or 1-800-835-5092 for Class F.
Interested Trustees*:
Correspondence intended for each Trustee who is an interested person may be sent to Fidelity Investments, 245 Summer Street, Boston, Massachusetts 02210.
Name, Year of Birth; Principal Occupations and Other Relevant Experience+ |
James C. Curvey (1935) |
| Year of Election or Appointment: 2007 Mr. Curvey is Trustee and Chairman of the Board of Trustees of certain Trusts. Mr. Curvey also serves as Trustee (2007-present) of other investment companies advised by FMR. Mr. Curvey is a Director of Fidelity Investments Money Management, Inc. (2009-present), Director of Fidelity Research & Analysis Co. (2009-present) and Director of FMR and FMR Co., Inc. (2007-present). Mr. Curvey is also Vice Chairman (2007-present) and Director of FMR LLC. In addition, Mr. Curvey serves as an Overseer for the Boston Symphony Orchestra and a member of the Trustees of Villanova University. Previously, Mr. Curvey was the Vice Chairman (2006-2007) and Director (2000-2007) of FMR Corp. |
Ronald P. O'Hanley (1957) |
| Year of Election or Appointment: 2011 Mr. O'Hanley serves as a Trustee and Chairman of the Board of Trustees of other Fidelity funds (2013-present), and is Director of FMR Co., Inc. (2010-present), Director of Fidelity Investments Money Management, Inc. (2010-present), Director of Fidelity Research & Analysis Company (2010-present), President of Fidelity Asset Management and Corporate Services and a Member of Fidelity's Executive Committee (2010-present). Previously, Mr. O'Hanley served as President and Chief Executive Officer of BNY Mellon Asset Management (2007-2010). Mr. O'Hanley also served as Vice Chairman of Bank New York Mellon Corp. and a member of that firm's Executive Committee. Prior to the 2007 merger of The Bank of New York and Mellon Financial Corporation, he was Vice Chairman of Mellon Financial Corporation and President and Chief Executive Officer of Mellon Asset Management. He joined Mellon in February 1997. Mr. O'Hanley currently serves as Chairman of the Boston Public Library Foundation Board of Directors and sits on the Board of Directors of Beth Israel Deaconess Medical Center, the Board of Trustees of the Marine Biological Laboratory and the Advisory Board of the Maxwell School of Citizenship and Public Administration at Syracuse University. Mr. O'Hanley also chairs the Council on Asset Management for the Financial Services Roundtable and is a member of the Board of Directors of Institutional Investor's U.S. Institute. |
* Trustees have been determined to be "Interested Trustees" by virtue of, among other things, their affiliation with the trust or various entities under common control with FMR.
+ The information above includes each Trustee's principal occupation during the last five years and other information relating to the experience, attributes, and skills relevant to each Trustee's qualifications to serve as a Trustee, which led to the conclusion that each Trustee should serve as a Trustee for the fund.
Annual Report
Independent Trustees:
Correspondence intended for each Independent Trustee (that is, the Trustees other than the Interested Trustees) may be sent to Fidelity Investments, P.O. Box 55235, Boston, Massachusetts 02205-5235.
Name, Year of Birth; Principal Occupations and Other Relevant Experience+ |
Dennis J. Dirks (1948) |
| Year of Election or Appointment: 2005 Prior to his retirement in May 2003, Mr. Dirks was Chief Operating Officer and a member of the Board of The Depository Trust & Clearing Corporation (DTCC). He also served as President, Chief Operating Officer, and Board member of The Depository Trust Company (DTC) and President and Board member of the National Securities Clearing Corporation (NSCC). In addition, Mr. Dirks served as Chief Executive Officer and Board member of the Government Securities Clearing Corporation, Chief Executive Officer and Board member of the Mortgage-Backed Securities Clearing Corporation, as a Trustee and a member of the Finance Committee of Manhattan College (2005-2008), and as a Trustee and a member of the Finance Committee of AHRC of Nassau County (2006-2008). Mr. Dirks is a member of the Independent Directors Council (IDC) Governing Council (2010-present) and Board of Directors for The Brookville Center for Children's Services, Inc. (2009-present). |
Alan J. Lacy (1953) |
| Year of Election or Appointment: 2008 Mr. Lacy serves as Senior Adviser (2007-present) of Oak Hill Capital Partners, L.P. (private equity). Mr. Lacy also served as Chief Executive Officer (2000-2005) and Vice Chairman (2005-2006) of Sears Holdings Corporation and Sears, Roebuck and Co. (retail). In addition, Mr. Lacy serves as a member of the Board of Directors of Dave & Buster's Entertainment, Inc. (restaurant and entertainment complexes, 2010-present), Earth Fare, Inc. (retail grocery, 2012-present), The Hillman Companies, Inc. (hardware wholesalers, 2010-present), and Bristol-Myers Squibb Company (global pharmaceuticals, 2008-present). Mr. Lacy is a member of the Board of Trustees of The National Parks Conservation Association (2006-present). Previously, Mr. Lacy served as Chairman of the Board of Trustees of the National Parks Conservation Association (2008-2011) and as a member of the Board of Directors for the Western Union Company (global money transfer, 2006-2011). |
Ned C. Lautenbach (1944) |
| Year of Election or Appointment: 2000 Mr. Lautenbach is Chairman of the Independent Trustees of the Equity and High Income Funds (2006-present) and serves as a Trustee of other Fidelity funds (2013-present). Mr. Lautenbach currently serves as the Lead Director of the Eaton Corporation Board of Directors (diversified industrial, 1997-present). Mr. Lautenbach is Chairman of the Board of Directors of the Philharmonic Center for the Arts in Naples, Florida (2012-present) and a member of the Council on Foreign Relations (1994-present). Previously, Mr. Lautenbach was a Partner/Advisory Partner at Clayton, Dubilier & Rice, LLC (private equity investment, 1998-2010), as well as a Director of Sony Corporation (2006-2007). |
Joseph Mauriello (1944) |
| Year of Election or Appointment: 2008 Prior to his retirement in January 2006, Mr. Mauriello served in numerous senior management positions including Deputy Chairman and Chief Operating Officer (2004-2005), and Vice Chairman of Financial Services (2002-2004) of KPMG LLP US (professional services, 1965-2005). Mr. Mauriello currently serves as a member of the Board of Directors of XL Group plc. (global insurance and re-insurance, 2006-present). Previously, Mr. Mauriello served as a Director of the Hamilton Funds of the Bank of New York (2006-2007) and of Arcadia Resources Inc. (health care services and products, 2007-2012). |
Robert W. Selander (1950) |
| Year of Election or Appointment: 2011 Previously, Mr. Selander served as a Member of the Advisory Board of Fidelity's Equity and High Income Funds (2011), Executive Vice Chairman (2010), Chief Executive Officer (2009-2010), and President and Chief Executive Officer (1997-2009) of Mastercard, Inc. |
Cornelia M. Small (1944) |
| Year of Election or Appointment: 2005 Ms. Small is a member of the Board of Directors (2009-present) and Chair of the Investment Committee (2010-present) of the Teagle Foundation. Ms. Small also serves on the Investment Committee of the Berkshire Taconic Community Foundation (2008-present). Previously, Ms. Small served as Chairperson (2002-2008) and a member of the Investment Committee and Chairperson (2008-2012) and a member of the Board of Trustees of Smith College. In addition, Ms. Small served as Chief Investment Officer, Director of Global Equity Investments, and a member of the Board of Directors of Scudder, Stevens & Clark and Scudder Kemper Investments. |
William S. Stavropoulos (1939) |
| Year of Election or Appointment: 2002 Mr. Stavropoulos is Vice Chairman of the Independent Trustees of the Equity and High Income Funds (2006-present) and serves as a Trustee of other Fidelity funds (2013-present). Mr. Stavropoulos serves as President and Founder of the Michigan Baseball Foundation, the Great Lakes Loons (2007-present). Mr. Stavropoulos is Chairman Emeritus of the Board of Directors of The Dow Chemical Company, where he previously served in numerous senior management positions, including President, CEO (1995-2000; 2002-2004), Chairman of the Executive Committee (2000-2006), and as a member of the Board of Directors (1990-2006). Currently, Mr. Stavropoulos is Chairman of the Board of Directors of Univar Inc. (global distributor of commodity and specialty chemicals), a Director of Teradata Corporation (data warehousing and technology solutions), and Maersk Inc. (industrial conglomerate), and a member of the Advisory Board for Metalmark Capital LLC (private equity investment, 2005-present). Mr. Stavropoulos is an operating advisor to Clayton, Dubilier & Rice, LLC (private equity investment). In addition, Mr. Stavropoulos is a member of the University of Notre Dame Advisory Council for the College of Science, a Trustee of the Rollin L. Gerstacker Foundation, and a Director of the Naples Philharmonic Center for the Arts. Previously, Mr. Stavropoulos served as a Director of Chemical Financial Corporation (bank holding company, 1993-2012) and Tyco International, Ltd. (multinational manufacturing and services, 2007-2012). |
David M. Thomas (1949) |
| Year of Election or Appointment: 2008 Previously, Mr. Thomas served as Executive Chairman (2005-2006) and Chairman and Chief Executive Officer (2000-2005) of IMS Health, Inc. (pharmaceutical and healthcare information solutions), and a Director of Fortune Brands, Inc. (consumer products, 2000-2011). In addition, Mr. Thomas serves as Non-Executive Chairman of the Board of Directors of Fortune Brands Home and Security (home and security products, 2011-present), and as a member of the Board of Directors of Interpublic Group of Companies, Inc. (marketing communication, 2004-present). |
+ The information above includes each Trustee's principal occupation during the last five years and other information relating to the experience, attributes, and skills relevant to each Trustee's qualifications to serve as a Trustee, which led to the conclusion that each Trustee should serve as a Trustee for the fund.
Annual Report
Trustees and Officers - continued
Advisory Board Member and Executive Officers:
Correspondence intended for each executive officer and Peter S. Lynch may be sent to Fidelity Investments, 245 Summer Street, Boston, Massachusetts 02210.
Name, Year of Birth; Principal Occupation |
Peter S. Lynch (1944) |
| Year of Election or Appointment: 2003 Member of the Advisory Board of Fidelity's Equity and High Income Funds. Mr. Lynch is Vice Chairman and a Director of FMR and FMR Co., Inc. In addition, Mr. Lynch serves as a Trustee of Boston College and as the Chairman of the Inner-City Scholarship Fund. Previously, Mr. Lynch served on the Special Olympics International Board of Directors (1997-2006). |
Kenneth B. Robins (1969) |
| Year of Election or Appointment: 2008 President and Treasurer of Fidelity's Equity and High Income Funds. Mr. Robins also serves as President and Treasurer (2008-present) and Assistant Treasurer (2009-present) of other Fidelity funds and is an employee of Fidelity Investments (2004-present). Mr. Robins serves as Executive Vice President of Fidelity Investments Money Management, Inc. (FIMM) (2013-present). Previously, Mr. Robins served as Deputy Treasurer of the Fidelity funds (2005-2008) and Treasurer and Chief Financial Officer of The North Carolina Capital Management Trust: Cash and Term Portfolios (2006-2008). |
Brian B. Hogan (1964) |
| Year of Election or Appointment: 2009 Vice President of Equity and High Income Funds. Mr. Hogan also serves as Vice President of other Fidelity funds (2009-present) and President of FMR's Equity Division (2009-present). Previously, Mr. Hogan served as Senior Vice President, Equity Research of FMR (2006-2009) and as a portfolio manager. |
Christopher S. Bartel (1971) |
| Year of Election or Appointment: 2009 Vice President of Fidelity's Sector and Real Estate Equity Funds. Mr. Bartel also serves as a Director, President, and Chief Executive Officer of Fidelity Management & Research (Japan) Inc. (2012-present), a Director of Fidelity Management & Research (Hong Kong) (2012-present), and Senior Vice President of Global Equity Research (2010-present). Previously, Mr. Bartel served as Senior Vice President of Equity Research (2009-2010), Managing Director of Research (2006-2009), and an analyst and portfolio manager (2000-2006). |
Scott C. Goebel (1968) |
| Year of Election or Appointment: 2008 Secretary and Chief Legal Officer (CLO) of the Fidelity funds. Mr. Goebel also serves as Secretary of Fidelity Investments Money Management, Inc. (FIMM) (2010-present) and Fidelity Research and Analysis Company (FRAC) (2010-present); Secretary and CLO of The North Carolina Capital Management Trust: Cash and Term Portfolios (2008-present); General Counsel, Secretary, and Senior Vice President of FMR (2008-present) and FMR Co., Inc. (2008-present); employed by FMR LLC or an affiliate (2001-present); Chief Legal Officer of Fidelity Management & Research (Hong Kong) Limited (2008-present) and Assistant Secretary of Fidelity Management & Research (Japan) Inc. (2008-present), and Fidelity Management & Research (U.K.) Inc. (2008-present). Previously, Mr. Goebel served as Assistant Secretary of FIMM (2008-2010), FRAC (2008-2010), and the Funds (2007-2008) and as Vice President and Secretary of Fidelity Distributors Corporation (FDC) (2005-2007). |
William C. Coffey (1969) |
| Year of Election or Appointment: 2009 Assistant Secretary of Fidelity's Equity and High Income Funds. Mr. Coffey also serves as Assistant Secretary of other Fidelity funds (2009-present), Senior Vice President and Deputy General Counsel of FMR LLC (2010-present), and is an employee of Fidelity Investments. Previously, Mr. Coffey served as Vice President and Associate General Counsel of FMR LLC (2005-2009). |
Elizabeth Paige Baumann (1968) |
| Year of Election or Appointment: 2012 Anti-Money Laundering (AML) Officer of the Fidelity funds. Ms. Baumann also serves as AML Officer of The North Carolina Capital Management Trust: Cash and Term Portfolios (2012-present), Chief AML Officer of FMR LLC (2012-present), and is an employee of Fidelity Investments. Previously, Ms. Baumann served as Vice President and Deputy Anti-Money Laundering Officer (2007-2012). |
Christine Reynolds (1958) |
| Year of Election or Appointment: 2008 Chief Financial Officer of the Fidelity funds. Ms. Reynolds became President of Fidelity Pricing and Cash Management Services (FPCMS) in August 2008. Ms. Reynolds served as Chief Operating Officer of FPCMS (2007-2008). Previously, Ms. Reynolds served as President, Treasurer, and Anti-Money Laundering officer of the Fidelity funds (2004-2007). |
Joseph A. Hanlon (1968) |
| Year of Election or Appointment: 2012 Chief Compliance Officer of Fidelity's Equity and High Income Funds. Mr. Hanlon also serves as Chief Compliance Officer of other Fidelity funds (2012-present). Mr. Hanlon serves as Compliance Officer of FMR, FMR Co., Inc., Fidelity Investments Money Management, Inc. (FIMM), Fidelity Research and Analysis Company (FRAC), and Fidelity Management & Research (Hong Kong) (2009-present), as Senior Vice President of the Fidelity Asset Management Division (2009-present), and is an employee of Fidelity Investments. Previously, Mr. Hanlon served as Compliance Officer of Fidelity Management & Research (Japan) Inc. (2009-2013), Strategic Advisers, Inc. (2009-2013), and Fidelity Management & Research (U.K.) Inc. (2009-2013). |
Joseph F. Zambello (1957) |
| Year of Election or Appointment: 2011 Deputy Treasurer of the Fidelity funds. Mr. Zambello is an employee of Fidelity Investments. Previously, Mr. Zambello served as Vice President of FMR's Program Management Group (2009-2011) and Vice President of the Transfer Agent Oversight Group (2005-2009). |
Adrien E. Deberghes (1967) |
| Year of Election or Appointment: 2008 Deputy Treasurer of Fidelity's Equity and High Income Funds. Mr. Deberghes also serves as Vice President (2011-present), Deputy Treasurer (2008-present), and Assistant Treasurer (2010-present) of other Fidelity funds, and is an employee of Fidelity Investments (2008-present). Previously, Mr. Deberghes served as Senior Vice President of Mutual Fund Administration at State Street Corporation (2007-2008), Senior Director of Mutual Fund Administration at Investors Bank & Trust (2005-2007), and Director of Finance for Dunkin' Brands (2000-2005). |
Stephen Sadoski (1971) |
| Year of Election or Appointment: 2012 Deputy Treasurer of Fidelity's Equity and High Income Funds. Mr. Sadoski also serves as Deputy Treasurer of other Fidelity funds (2012-present) and is an employee of Fidelity Investments (2012-present). Previously, Mr. Sadoski served as Assistant Treasurer of Fidelity's Fixed Income and Asset Allocation Funds (2012-2013), an assistant chief accountant in the Division of Investment Management of the Securities and Exchange Commission (SEC) (2009-2012) and as a senior manager at Deloitte & Touche LLP (1997-2009). |
Stacie M. Smith (1974) |
| Year of Election or Appointment: 2013 Deputy Treasurer of Fidelity's Equity and High Income Funds. Ms. Smith also serves as Deputy Treasurer of other Fidelity funds (2013-present) and is an employee of Fidelity Investments (2009-present). Previously, Ms. Smith served as Senior Audit Manager of Ernst & Young LLP (1996-2009). |
Stephanie J. Dorsey (1969) |
| Year of Election or Appointment: 2010 Assistant Treasurer of Fidelity's Equity and High Income Funds. Ms. Dorsey also serves as President and Treasurer (2013-present) and Assistant Treasurer (2010-present) of other Fidelity funds, Treasurer and Chief Financial Officer of The North Carolina Capital Management Trust: Cash and Term Portfolios (2013-present), and is an employee of Fidelity Investments (2008-present). Previously, Ms. Dorsey served as Deputy Treasurer of Fidelity's Fixed Income and Asset Allocation Funds (2008-2013), Treasurer (2004-2008) of the JPMorgan Mutual Funds and Vice President (2004-2008) of JPMorgan Chase Bank. |
Gary W. Ryan (1958) |
| Year of Election or Appointment: 2005 Assistant Treasurer of the Fidelity funds. Mr. Ryan is an employee of Fidelity Investments. Previously, Mr. Ryan served as Vice President of Fund Reporting in Fidelity Pricing and Cash Management Services (FPCMS) (1999-2005). |
Jonathan Davis (1968) |
| Year of Election or Appointment: 2010 Assistant Treasurer of the Fidelity funds. Mr. Davis is also Assistant Treasurer of Fidelity Rutland Square Trust II and Fidelity Commonwealth Trust II. Mr. Davis is an employee of Fidelity Investments. Previously, Mr. Davis served as Vice President and Associate General Counsel of FMR LLC (2003-2010). |
Annual Report
The Board of Trustees of Fidelity Series Real Estate Income Fund voted to pay shareholders of record at the opening of business on record date, the following distributions per share derived from capital gains realized from sales of portfolio securities, and dividends derived from net investment income:
| Pay Date | Record Date | Dividends | Capital Gains |
Real Estate Income | 09/09/13 | 09/06/13 | $0.164 | $0.177 |
Class F | 09/09/13 | 09/06/13 | $0.169 | $0.177 |
The fund hereby designates as a capital gain dividend with respect to the taxable year ended July 31, 2013, $8,298,073, or, if subsequently determined to be different, the net capital gain of such year.
A total of 0.03% of the dividends distributed during the fiscal year was derived from interest on U.S. Government securities which is generally exempt from state income tax.
The fund will notify shareholders in January 2014 of amounts for use in preparing 2013 income tax returns.
Annual Report
Board Approval of Investment Advisory Contracts and Management Fees
Fidelity Series Real Estate Income Fund
Each year, the Board of Trustees, including the Independent Trustees (together, the Board), votes on the renewal of the management contract and sub-advisory agreements (together, the Advisory Contracts) for the fund. The Board, assisted by the advice of fund counsel and Independent Trustees' counsel, requests and considers a broad range of information relevant to the renewal of the Advisory Contracts throughout the year.
The Board meets regularly and, at each of its meetings, covers an extensive agenda of topics and materials and considers factors that are relevant to its annual consideration of the renewal of the fund's Advisory Contracts, including the services and support provided to the fund and its shareholders. The Board has established various standing committees, each composed of and chaired by Independent Trustees with varying backgrounds, to which the Board has assigned specific subject matter responsibilities in order to enhance effective decision-making by the Board. The Board, acting directly and through its Committees, requests and receives information concerning the annual consideration of the renewal of the fund's Advisory Contracts. The Board also meets as needed to consider matters specifically related to the Board's annual consideration of the renewal of Advisory Contracts. Members of the Board may also meet with trustees of other Fidelity funds through ad hoc joint committees to discuss certain matters relevant to the Fidelity funds.
At its July 2013 meeting, the Board, including the Independent Trustees, unanimously determined to renew the fund's Advisory Contracts. In reaching its determination, the Board considered all factors it believed relevant, including (i) the nature, extent, and quality of the services to be provided to the fund and its shareholders (including the investment performance of the fund); (ii) the competitiveness of the fund's management fee and total expense ratio relative to peer funds; (iii) the total costs of the services to be provided by and the profits to be realized by Fidelity from its relationship with the fund; (iv) the extent to which economies of scale exist and would be realized as the fund grows; and (v) whether fee levels reflect these economies of scale, if any, for the benefit of fund shareholders.
In considering whether to renew the Advisory Contracts for the fund, the Board reached a determination, with the assistance of fund counsel and Independent Trustees' counsel and through the exercise of its business judgment, that the renewal of the Advisory Contracts was in the best interests of the fund and its shareholders and that the compensation payable under the Advisory Contracts was fair and reasonable. The Board's decision to renew the Advisory Contracts was not based on any single factor, but rather was based on a comprehensive consideration of all the information provided to the Board at its meetings throughout the year. The Board, in reaching its determination to renew the Advisory Contracts, was aware that shareholders in the fund have a broad range of investment choices available to them, including a wide choice among mutual funds offered by Fidelity's competitors, and that the fund's shareholders, who have the opportunity to review and weigh the disclosure provided by the fund in its prospectus and other public disclosures, have chosen to invest in this fund, which is a part of the Fidelity family of funds.
Annual Report
Board Approval of Investment Advisory Contracts and
Management Fees - continued
Nature, Extent, and Quality of Services Provided. The Board considered the staffing within the investment adviser, Fidelity Management & Research Company (FMR), and the sub-advisers (together, the Investment Advisers) as it relates to the fund, including the backgrounds of the fund's investment personnel, and also considered the fund's investment objective, strategies, and related investment philosophy. The Independent Trustees also had discussions with senior management of Fidelity's investment operations and investment groups. The Board considered the structure of the portfolio manager compensation program and whether this structure provides appropriate incentives to act in the best interests of the fund.
Resources Dedicated to Investment Management and Support Services. The Board and the Fund Oversight and Research Committees reviewed the general qualifications and capabilities of the Investment Advisers' investment staff, including its size, education, experience, and resources, as well as the Investment Advisers' approach to recruiting, training, managing, and compensating investment personnel. The Board noted that FMR has continued to increase the resources devoted to non-U.S. offices, including expansion of Fidelity's global investment organization. The Board also noted that Fidelity's analysts have extensive resources, tools and capabilities that allow them to conduct sophisticated quantitative and fundamental analysis, as well as credit analysis of issuers, counterparties and guarantors. Further, the Board believes that Fidelity's investment professionals have sufficient access to global information and data so as to provide competitive investment results over time, and that those professionals also have access to sophisticated tools that permit them to assess portfolio construction and risk and performance attribution characteristics continuously, as well as to transmit new information and research conclusions rapidly around the world. Additionally, in its deliberations, the Board considered the Investment Advisers' trading and risk management capabilities and resources, which are an integral part of the investment management process.
Shareholder and Administrative Services. The Board considered (i) the nature, extent, quality, and cost of advisory, administrative, and shareholder services performed by the Investment Advisers and their affiliates under the Advisory Contracts and under separate agreements covering transfer agency, pricing and bookkeeping, and securities lending services for the fund; (ii) the nature and extent of the supervision of third party service providers, principally custodians and subcustodians; and (iii) the resources devoted to, and the record of compliance with, the fund's compliance policies and procedures. The Board also reviewed the allocation of fund brokerage, including allocations to brokers affiliated with the Investment Advisers, the use of brokerage commissions to pay fund expenses, and the use of "soft" commission dollars to pay for research services.
Annual Report
The Board noted that the growth of fund assets over time across the complex allows Fidelity to reinvest in the development of services designed to enhance the value or convenience of the Fidelity funds as investment vehicles. These services include 24-hour access to account information and market information through telephone representatives and over the Internet, investor education materials and asset allocation tools, and the expanded availability of Fidelity Investor Centers.
Investment in a Large Fund Family. The Board considered the benefits to shareholders of investing in a Fidelity fund, including the benefits of investing in a fund that is part of a large family of funds offering a variety of investment disciplines and providing a large variety of mutual fund investor services. The Board noted that Fidelity had taken, or had made recommendations that resulted in the Fidelity funds taking, a number of actions over the previous year that benefited particular funds, including (i) continuing to dedicate additional resources to investment research and to the support of the senior management team that oversees asset management; (ii) persisting in efforts to enhance Fidelity's global research capabilities; (iii) launching new funds and making other enhancements to meet client needs for global and income-oriented solutions; (iv) continuing to launch dedicated lower cost underlying funds to meet portfolio construction needs related to expanding underlying fund options for Fidelity funds of funds, specifically for the Freedom Fund product lines; (v) rationalizing product lines and gaining increased efficiencies through the mergers of several funds into other funds; (vi) strengthening Fidelity's index fund offerings by reducing investment minimums and adopting or lowering existing expense caps for certain funds and classes; (vii) enhancing Global Asset Allocation product offerings by launching new funds and strategies, including "open architecture" target date funds that utilize affiliated and unaffiliated sub-advisers; (viii) modifying the eligibility criteria for Institutional Class shares of Advisor funds to increase their marketability to a portion of the defined contribution plan market; (ix) creating a new low-cost retirement share class for certain Advisor funds to appeal to large retirement plans; (x) transitioning the management of certain Fidelity commodity funds to Geode Capital Management LLC, a registered commodity pool operator, while retaining administrative responsibilities for the funds; (xi) reorganizing a number of funds; and (xii) taking steps toward establishing a new Fidelity adviser to manage sector-based funds and products.
Investment Performance. The Board considered whether the fund has operated in accordance with its investment objective, as well as its record of compliance with its investment restrictions and its performance history.
The Board took into account discussions with the Investment Advisers about fund investment performance that occur at Board meetings throughout the year. In this regard the Board noted that as part of regularly scheduled fund reviews and other reports to the Board on fund performance, the Board periodically considers annualized return information for the fund, for different time periods, measured against a securities market index ("benchmark index") and a peer group of mutual funds with similar objectives ("peer group"). In its evaluation of fund investment performance, the Board gave particular attention to information indicating changes in performance of certain Fidelity funds for specific time periods and the Investment Advisers' explanations for any overperformance or underperformance.
Annual Report
Board Approval of Investment Advisory Contracts and
Management Fees - continued
In addition to reviewing absolute and relative fund performance, the Independent Trustees periodically consider the appropriateness of fund performance metrics in evaluating the results achieved. In general, the Independent Trustees believe that fund performance should be evaluated based on net performance (after fees and expenses) of both the highest performing and lowest performing classes, where applicable, compared to appropriate benchmark indices, over appropriate time periods which may include full market cycles, and compared to peer groups, as applicable, over the same periods, taking into account relevant factors including the following: general market conditions; issuer-specific information; tactical opportunities for investment; and fund cash flows and other factors.
The Independent Trustees recognize that shareholders evaluate performance on a net basis over their own holding periods, for which one-, three-, and five-year periods are used as a proxy. For this reason, the performance information reviewed by the Board also included net cumulative calendar year total return information for the fund and an appropriate benchmark index and peer group for the most recent one-year period, as shown below. Returns are shown compared to the 25th percentile (top of box) and 75th percentile (bottom of box) of the peer universe.
Annual Report
Fidelity Series Real Estate Income Fund
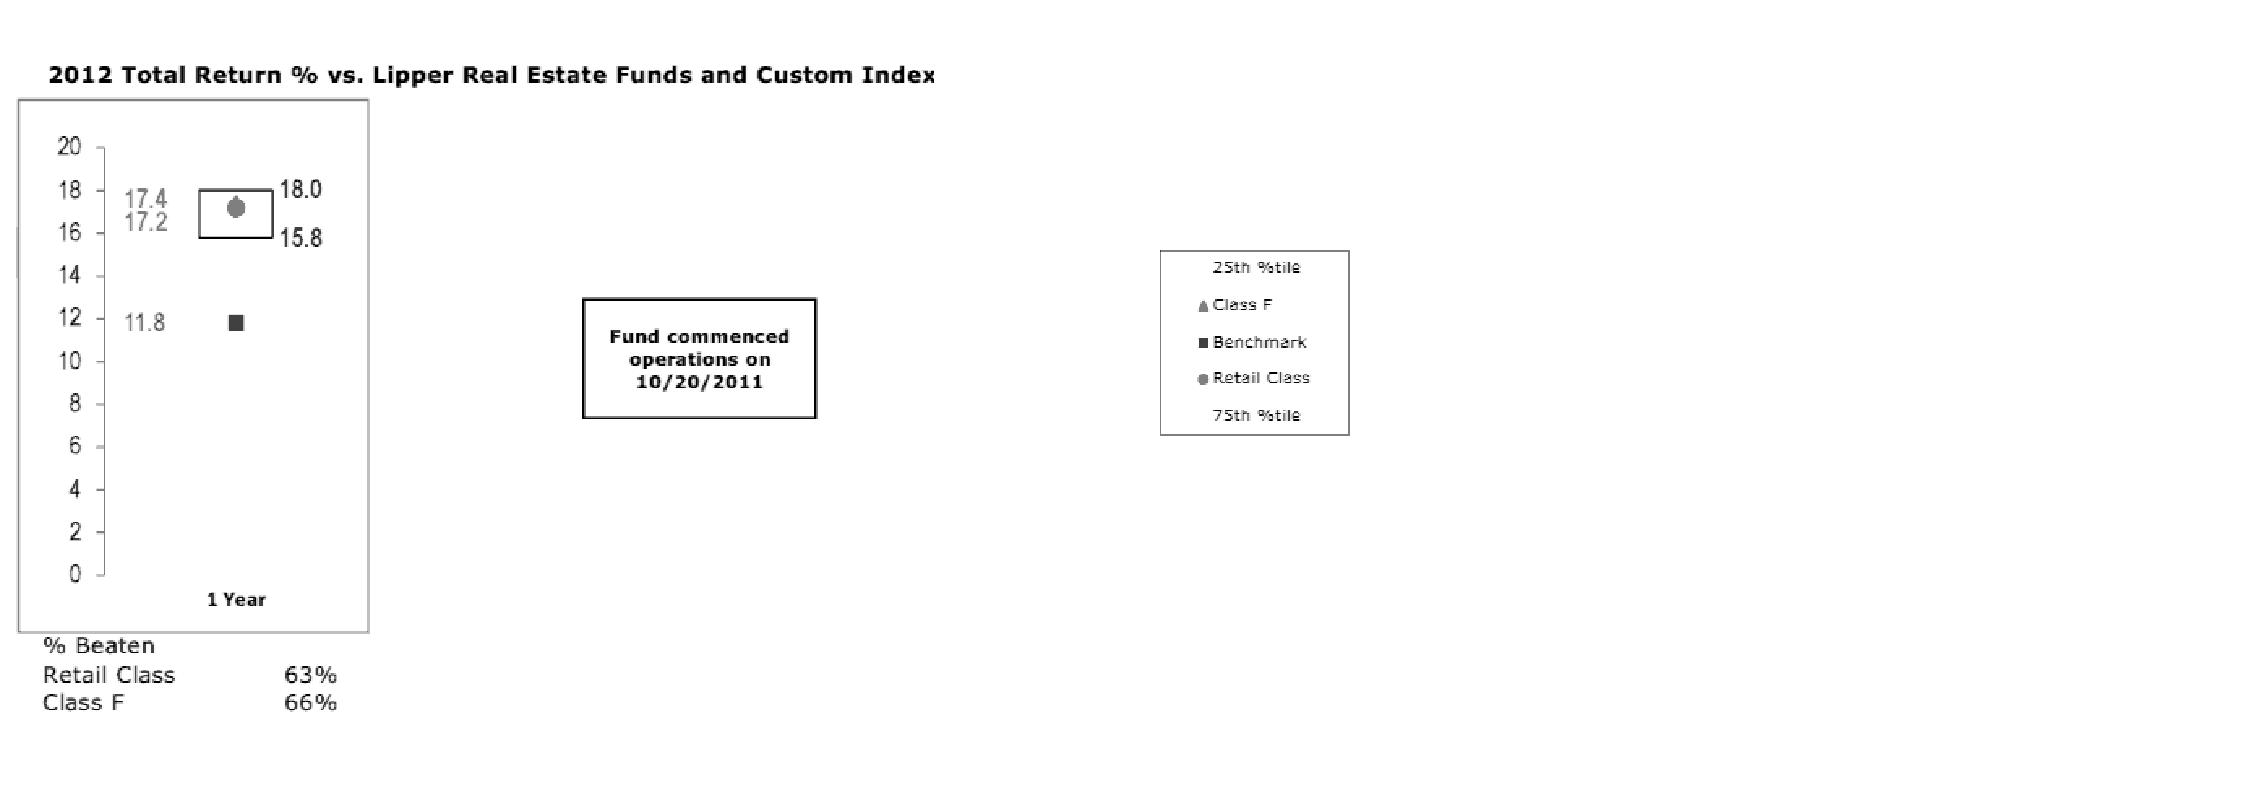
Based on its review, the Board concluded that the nature, extent, and quality of services provided to the fund under the Advisory Contracts should benefit the fund's shareholders.
Competitiveness of Management Fee and Total Expense Ratio. The Board considered the fund's management fee and total expense ratio compared to "mapped groups" of competitive funds and classes. Fidelity creates "mapped groups" by combining similar Lipper investment objective categories that have comparable management fee characteristics. Combining Lipper investment objective categories aids the Board's management fee and total expense ratio comparisons by broadening the competitive group used for comparison and by reducing the number of universes to which various Fidelity funds are compared.
Management Fee. The Board considered two proprietary management fee comparisons for the 12-month (or shorter) periods shown in the chart below. The group of Lipper funds used by the Board for management fee comparisons is referred to below as the "Total Mapped Group." The Total Mapped Group is broader than the Lipper peer group used by the Board for performance comparisons because the Total Mapped Group combines several Lipper investment objective categories while the Lipper peer group does not. The Total Mapped Group comparison focuses on a fund's standing in terms of gross management fees before expense reimbursements or caps relative to the total universe of funds with comparable investment mandates, regardless of whether their management fee structures also are comparable. Funds with comparable investment mandates offer exposure to similar types of securities. Funds with comparable management fee structures have similar management fee contractual arrangements (e.g., flat rate charged for advisory services, all-inclusive fee rate, etc.). "TMG %" represents the percentage of funds in the Total Mapped Group that had management fees that were lower than the fund's. For example, a TMG % of 7% means that 93% of the funds in the Total Mapped Group had higher management fees than the fund. The "Asset-Size Peer Group" (ASPG) comparison focuses on a fund's standing relative to a subset of non-Fidelity funds within the Total Mapped Group that are similar in size and management fee structure. The ASPG represents at least 15% of the funds in the Total Mapped Group with comparable asset size and management fee structures, subject to a minimum of 50 funds (or all funds in the Total Mapped Group if fewer than 50). Additional information, such as the ASPG quartile in which the fund's management fee ranked, is also included in the chart and considered by the Board.
Annual Report
Board Approval of Investment Advisory Contracts and
Management Fees - continued
Fidelity Series Real Estate Income Fund
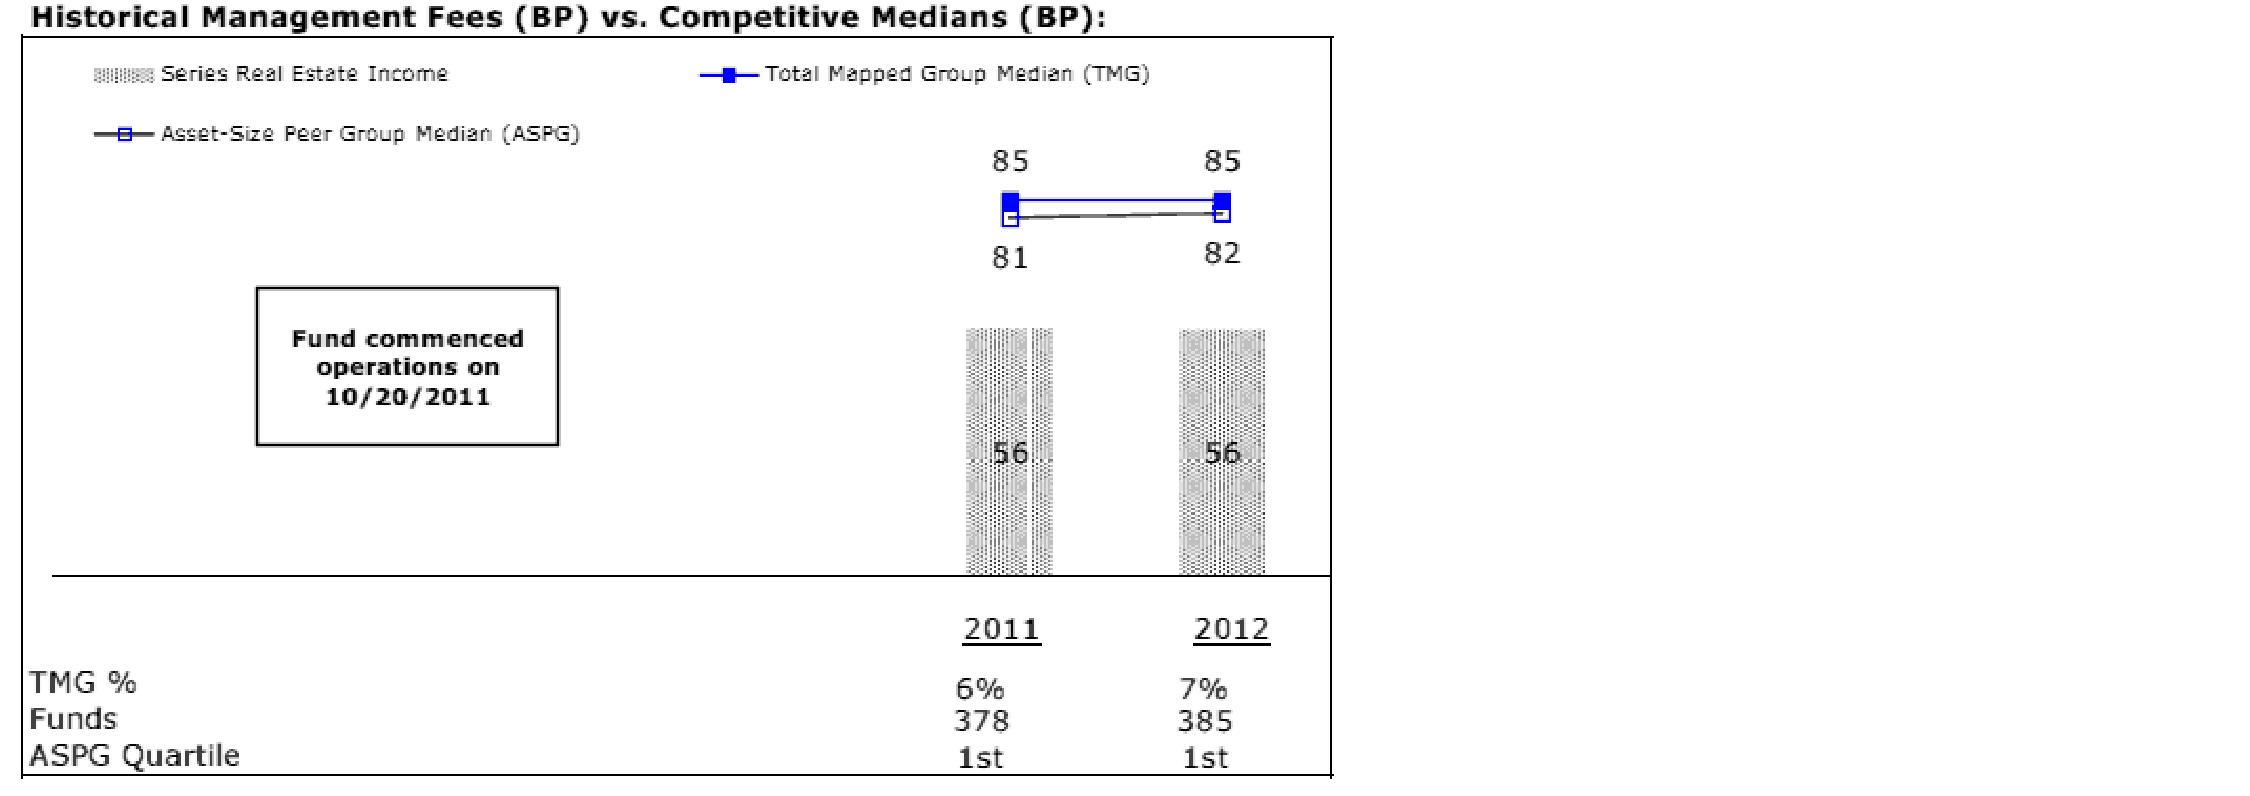
The Board noted that the fund's management fee ranked below the median of its Total Mapped Group and below the median of its ASPG for 2012.
Based on its review, the Board concluded that the fund's management fee is fair and reasonable in light of the services that the fund receives and the other factors considered.
Total Expense Ratio. In its review of each class's total expense ratio, the Board considered the fund's management fee as well as other fund or class expenses, as applicable, such as transfer agent fees, pricing and bookkeeping fees, and custodial, legal, and audit fees. The Board also noted the effects of any waivers and reimbursements on fees and expenses. As part of its review, the Board also considered the current and historical total expense ratios of each class of the fund compared to competitive fund median expenses. Each class of the fund is compared to those funds and classes in the Total Mapped Group (used by the Board for management fee comparisons) that have a similar sales load structure.
Annual Report
The Board noted that the total expense ratio of each class ranked below its competitive median for 2012.
Fees Charged to Other Fidelity Clients. The Board also considered Fidelity fee structures and other information with respect to clients of FMR and its affiliates, such as other mutual funds advised or subadvised by FMR or its affiliates, pension plan clients, and other institutional clients. The Board noted the findings of the 2013 ad hoc joint committee (created with the board of other Fidelity funds), which reviewed and compared Fidelity's institutional investment advisory business with its business of providing services to the Fidelity funds, including the differences in services provided, fees charged, and costs incurred, as well as competition in their respective marketplaces.
Based on its review of total expense ratios and fees charged to other Fidelity clients, the Board concluded that the total expense ratio of each class of the fund was reasonable in light of the services that the fund and its shareholders receive and the other factors considered.
Costs of the Services and Profitability. The Board considered the revenues earned and the expenses incurred by Fidelity in conducting the business of developing, marketing, distributing, managing, administering and servicing the fund and servicing the fund's shareholders. The Board also considered the level of Fidelity's profits in respect of all the Fidelity funds.
On an annual basis, FMR presents to the Board Fidelity's profitability for the fund. Fidelity calculates the profitability for each fund, as well as aggregate profitability for groups of Fidelity funds and all Fidelity funds, using a series of detailed revenue and cost allocation methodologies which originate with the books and records of Fidelity on which Fidelity's audited financial statements are based. The Audit Committee of the Board reviews any significant changes from the prior year's methodologies.
PricewaterhouseCoopers LLP (PwC), independent registered public accounting firm and auditor to Fidelity and certain Fidelity funds, has been engaged annually by the Board as part of the Board's assessment of Fidelity's profitability analysis. PwC's engagement includes the review and assessment of the methodologies used by Fidelity in determining the revenues and expenses attributable to Fidelity's mutual fund business, and completion of agreed-upon procedures surrounding the mathematical accuracy of fund profitability and its conformity to allocation methodologies. After considering PwC's reports issued under the engagement and information provided by Fidelity, the Board concluded that while other allocation methods may also be reasonable, Fidelity's profitability methodologies are reasonable in all material respects.
Annual Report
Board Approval of Investment Advisory Contracts and
Management Fees - continued
The Board also reviewed Fidelity's non-fund businesses and fall-out benefits related to the mutual fund business as well as cases where Fidelity's affiliates may benefit from or be related to the fund's business.
The Board considered the costs of the services provided by and the profits realized by Fidelity in connection with the operation of the fund and was satisfied that the profitability was not excessive in the circumstances.
Economies of Scale. The Board considered whether there have been economies of scale in respect of the management of the Fidelity funds, whether the Fidelity funds (including the fund) have appropriately benefited from any such economies of scale, and whether there is potential for realization of any further economies of scale. The Board considered the extent to which the fund will benefit from economies of scale through increased services to the fund, through waivers or reimbursements, or through fee or expense reductions. The Board also noted that in 2009, it and the board of other Fidelity funds created an ad hoc committee (the Economies of Scale Committee) to analyze whether FMR attains economies of scale in respect of the management and servicing of the Fidelity funds, whether the Fidelity funds have appropriately benefited from such economies of scale, and whether there is potential for realization of any further economies of scale.
The Board recognized that the fund's management contract incorporates a "group fee" structure, which provides for lower group fee rates as total fund assets under FMR's management increase, and for higher group fee rates as total fund assets under FMR's management decrease. FMR calculates the group fee rates based on a tiered asset "breakpoint" schedule that varies based on asset class. The Board considered that the group fee is designed to deliver the benefits of economies of scale to fund shareholders when total Fidelity fund assets increase, even if assets of any particular fund are unchanged or have declined, because some portion of Fidelity's costs are attributable to services provided to all Fidelity funds, and all funds benefit if those costs can be allocated among more assets. The Board also considered that although the fund is offered only to other funds advised by FMR or an affiliate, it continues to incur investment management expenses. The Board further noted that the fund may continue to realize benefits from the group fee structure, even though assets may not be expected to grow significantly at the fund level. The Board concluded that, given the group fee structure, fund shareholders will benefit from lower management fees as assets under FMR's management increase at the fund complex level, regardless of whether Fidelity achieves any such economies of scale.
Annual Report
The Board concluded, taking into account the analysis of the Economies of Scale Committee, that economies of scale, if any, are being appropriately shared between fund shareholders and Fidelity.
Amendment to Description of Group Fee Rate. At its July 2013 meeting, the Board voted to approve an amendment to the fund's management contract to modify the description of the "group fee rate" effective August 1, 2013. The Board noted that under the prior description in the contract, the group fee rate was based on the average net assets of all registered investment companies with which FMR has management contracts. Under the contract's tiered asset breakpoint schedule, the group fee rate is lower as total fund assets under FMR's management increase, and higher as total fund assets under FMR's management decrease. The Board considered that the prior description would have excluded the assets of 64 Fidelity sector funds from the group fee rate calculation once Fidelity SelectCo, LLC, an affiliate of FMR, assumed management responsibilities for those funds. The Board noted that modifying the description of the group fee rate to continue to include the assets of those 64 funds for purposes of determining group fee rate breakpoints would avoid an immediate adverse impact on the group fee rate for any fund.
Additional Information Requested by the Board. In order to develop fully the factual basis for consideration of the Fidelity funds' Advisory Contracts, the Board requested and received additional information on certain topics, including: (i) fund performance trends and Fidelity's long-term strategies for certain funds; (ii) the potential to further rationalize the Fidelity fund lineup with the possibility of achieving savings for the funds and Fidelity; (iii) the methodology with respect to competitive fund data and peer group classifications; (iv) the arrangements with, and performance of, certain sub-advisers on behalf of the Fidelity funds, as well as certain proposed participating affiliate arrangements; (v) the realization of fall-out benefits in certain Fidelity business units; (vi) Fidelity's group fee structures, including the rationale for the individual fee rates of certain categories of funds and the definition of group assets; (vii) trends regarding industry use of performance fee structures and the performance adjustment methodologies applicable to the Fidelity funds; (viii) additional competitive analysis regarding the total expenses for certain classes; and (ix) fund profitability methodology, including Fidelity's cost allocation methodology, and the impact of certain factors on fund profitability results.
Based on its evaluation of all of the conclusions noted above, and after considering all factors it believed relevant, the Board ultimately concluded that the advisory fee structures are fair and reasonable, and that the fund's Advisory Contracts should be renewed.
Annual Report
Investment Adviser
Fidelity Management & Research Company
Boston, MA
Investment Sub-Advisers
FMR Co., Inc.
Fidelity Management & Research (U.K.) Inc.
Fidelity Management & Research
(Hong Kong) Limited
Fidelity Management & Research
(Japan) Inc.
General Distributor
Fidelity Distributors Corporation
Smithfield, RI
Transfer and Service Agents
Fidelity Investments Institutional Operations Company, Inc.
Boston, MA
Fidelity Service Company, Inc.
Boston, MA
Custodian
The Northern Trust Company
Chicago, IL
(Fidelity Investment logo)(registered trademark)
Corporate Headquarters
245 Summer St., Boston, MA 02210
www.fidelity.com
SRE-ANN-0913
1.924310.101
Item 2. Code of Ethics
As of the end of the period, July 31, 2013, Fidelity Securities Fund (the trust) has adopted a code of ethics, as defined in Item 2 of Form N-CSR, that applies to its President and Treasurer and its Chief Financial Officer. A copy of the code of ethics is filed as an exhibit to this Form N-CSR.
Item 3. Audit Committee Financial Expert
The Board of Trustees of the trust has determined that Joseph Mauriello is an audit committee financial expert, as defined in Item 3 of Form N-CSR. Mr. Mauriello is independent for purposes of Item 3 of Form N-CSR.
Item 4. Principal Accountant Fees and Services
Fees and Services
The following table presents fees billed by Deloitte & Touche LLP, the member firms of Deloitte Touche Tohmatsu, and their respective affiliates (collectively, "Deloitte Entities") in each of the last two fiscal years for services rendered to Fidelity Blue Chip Growth Fund, Fidelity OTC Portfolio, Fidelity Real Estate Income Fund, Fidelity Series Real Estate Equity Fund, Fidelity Series Real Estate Income Fund, and Fidelity Series Small Cap Opportunities Fund (the "Funds"):
Services Billed by Deloitte Entities
July 31, 2013 FeesA
| Audit Fees | Audit-Related Fees | Tax Fees | All Other Fees |
Fidelity Blue Chip Growth Fund | $53,000 | $- | $4,800 | $3,300 |
Fidelity OTC Portfolio | $45,000 | $- | $5,800 | $1,700 |
Fidelity Real Estate Income Fund | $156,000 | $- | $7,500 | $1,000 |
Fidelity Series Real Estate Equity Fund | $38,000 | $- | $5,800 | $600 |
Fidelity Series Real Estate Income Fund | $74,000 | $- | $5,800 | $600 |
Fidelity Series Small Cap Opportunities Fund | $47,000 | $- | $4,800 | $900 |
July 31, 2012 FeesA, B
| Audit Fees | Audit-Related Fees | Tax Fees | All Other Fees |
Fidelity Blue Chip Growth Fund | $52,000 | $- | $4,900 | $2,300 |
Fidelity OTC Portfolio | $43,000 | $- | $5,700 | $1,400 |
Fidelity Real Estate Income Fund | $142,000 | $- | $7,400 | $600 |
Fidelity Series Real Estate Equity Fund | $32,000 | $- | $5,700 | $300 |
Fidelity Series Real Estate Income Fund | $60,000 | $- | $5,700 | $300 |
Fidelity Series Small Cap Opportunities Fund | $46,000 | $- | $4,800 | $600 |
A Amounts may reflect rounding.
B Fidelity Series Real Estate Equity Fund and Fidelity Series Real Estate Income Fund commenced operations on October 20, 2011.
The following table presents fees billed by PricewaterhouseCoopers LLP ("PwC") in each of the last two fiscal years for services rendered to Fidelity Blue Chip Value Fund, Fidelity Dividend Growth Fund, Fidelity Growth & Income Portfolio, Fidelity Leveraged Company Stock Fund, Fidelity Small Cap Growth Fund, and Fidelity Small Cap Value Fund (the "Funds"):
Services Billed by PwC
July 31, 2013 FeesA
| Audit Fees | Audit-Related Fees | Tax Fees | All Other Fees |
Fidelity Blue Chip Value Fund | $50,000 | $- | $3,500 | $1,600 |
Fidelity Dividend Growth Fund | $65,000 | $- | $3,500 | $4,400 |
Fidelity Growth & Income Portfolio | $71,000 | $- | $7,200 | $3,800 |
Fidelity Leveraged Company Stock Fund | $54,000 | $- | $4,600 | $3,100 |
Fidelity Small Cap Growth Fund | $51,000 | $- | $3,300 | $2,200 |
Fidelity Small Cap Value Fund | $54,000 | $- | $3,300 | $2,800 |
July 31, 2012 FeesA
| Audit Fees | Audit-Related Fees | Tax Fees | All Other Fees |
Fidelity Blue Chip Value Fund | $49,000 | $- | $3,300 | $1,700 |
Fidelity Dividend Growth Fund | $67,000 | $- | $3,300 | $5,100 |
Fidelity Growth & Income Portfolio | $70,000 | $- | $4,300 | $3,700 |
| | | | |
Fidelity Leveraged Company Stock Fund | $53,000 | $- | $4,300 | $3,100 |
Fidelity Small Cap Growth Fund | $50,000 | $- | $3,300 | $2,300 |
Fidelity Small Cap Value Fund | $52,000 | $- | $3,300 | $2,500 |
A Amounts may reflect rounding.
The following table presents fees billed by PwC and Deloitte Entities that were required to be approved by the Audit Committee for services that relate directly to the operations and financial reporting of the Funds and that are rendered on behalf of Fidelity Management & Research Company ("FMR") and entities controlling, controlled by, or under common control with FMR (not including any sub-adviser whose role is primarily portfolio management and is subcontracted with or overseen by another investment adviser) that provide ongoing services to the Funds ("Fund Service Providers"):
Services Billed by Deloitte Entities
| July 31, 2013A | July 31, 2012A, B |
Audit-Related Fees | $915,000 | $615,000 |
Tax Fees | $- | $- |
All Other Fees | $765,000 | $1,115,000 |
A Amounts may reflect rounding.
B May include amounts billed prior to the Fidelity Series Real Estate Equity Fund and Fidelity Series Real Estate Income Fund's commencement of operations.
Services Billed by PwC
| July 31, 2013A | July 31, 2012A |
Audit-Related Fees | $4,295,000 | $4,450,000 |
Tax Fees | $- | $- |
All Other Fees | $- | $- |
A Amounts may reflect rounding.
"Audit-Related Fees" represent fees billed for assurance and related services that are reasonably related to the performance of the fund audit or the review of the fund's financial statements and that are not reported under Audit Fees.
"Tax Fees" represent fees billed for tax compliance, tax advice or tax planning that relate directly to the operations and financial reporting of the fund.
"All Other Fees" represent fees billed for services provided to the fund or Fund Service Provider, a significant portion of which are assurance related, that relate directly to the operations and financial reporting of the fund, excluding those services that are reported under Audit Fees, Audit-Related Fees or Tax Fees.
Assurance services must be performed by an independent public accountant.
* * *
The aggregate non-audit fees billed by PwC and Deloitte Entities for services rendered to the Funds, FMR (not including any sub-adviser whose role is primarily portfolio management and is subcontracted with or overseen by another investment adviser), and any Fund Service Provider for each of the last two fiscal years of the Funds are as follows:
Billed By | July 31, 2013 A, B | July 31, 2012 A, B,C |
PwC | $5,105,000 | $5,690,000 |
Deloitte Entities | $1,820,000 | $1,860,000 |
A Amounts may reflect rounding.
B May include amounts billed prior to the Fidelity Series Real Estate Equity Fund and Fidelity Series Real Estate Income Fund's commencement of operations.
C Reflects current period presentation.
The trust's Audit Committee has considered non-audit services that were not pre-approved that were provided by PwC and Deloitte Entities to Fund Service Providers to be compatible with maintaining the independence of PwC and Deloitte Entities in their audits of the Funds, taking into account representations from PwC and Deloitte Entities, in accordance with Public Company Accounting Oversight Board rules, regarding their independence from the Funds and their related entities and FMR's review of the appropriateness and permissibility under applicable law of such non-audit services prior to their provision to the Fund Service Providers.
Audit Committee Pre-Approval Policies and Procedures
The trust's Audit Committee must pre-approve all audit and non-audit services provided by a fund's independent registered public accounting firm relating to the operations or financial reporting of the fund. Prior to the commencement of any audit or non-audit services to a fund, the Audit Committee reviews the services to determine whether they are appropriate and permissible under applicable law.
The Audit Committee has adopted policies and procedures to, among other purposes, provide a framework for the Committee's consideration of non-audit services by the audit firms that audit the Fidelity funds. The policies and procedures require that any non-audit service provided by a fund audit firm to a Fidelity fund and any non-audit service provided by a fund auditor to a Fund Service Provider that relates directly to the operations and financial reporting of a Fidelity fund ("Covered Service") are subject to approval by the Audit Committee before such service is provided.
All Covered Services must be approved in advance of provision of the service either: (i) by formal resolution of the Audit Committee, or (ii) by oral or written approval of the service by the Chair of the Audit Committee (or if the Chair is unavailable, such other member of the Audit Committee as may be designated by the Chair to act in the Chair's absence). The approval contemplated by (ii) above is permitted where the Treasurer determines that action on such an engagement is necessary before the next meeting of the Audit Committee.
Non-audit services provided by a fund audit firm to a Fund Service Provider that do not relate directly to the operations and financial reporting of a Fidelity fund are reported to the Audit Committee on a periodic basis.
Non-Audit Services Approved Pursuant to Rule 2-01(c)(7)(i)(C) and (ii) of Regulation S-X ("De Minimis Exception")
There were no non-audit services approved or required to be approved by the Audit Committee pursuant to the De Minimis Exception during the Funds' last two fiscal years relating to services provided to (i) the Funds or (ii) any Fund Service Provider that relate directly to the operations and financial reporting of the Funds.
Item 5. Audit Committee of Listed Registrants
Not applicable.
Item 6. Investments
(a) Not applicable.
(b) Not applicable
Item 7. Disclosure of Proxy Voting Policies and Procedures for Closed-End Management Investment Companies
Not applicable.
Item 8. Portfolio Managers of Closed-End Management Investment Companies
Not applicable.
Item 9. Purchase of Equity Securities by Closed-End Management Investment Company and Affiliated Purchasers
Not applicable.
Item 10. Submission of Matters to a Vote of Security Holders
There were no material changes to the procedures by which shareholders may recommend nominees to the trust's Board of Trustees.
Item 11. Controls and Procedures
(a)(i) The President and Treasurer and the Chief Financial Officer have concluded that the trust's disclosure controls and procedures (as defined in Rule 30a-3(c) under the Investment Company Act) provide reasonable assurances that material information relating to the trust is made known to them by the appropriate persons, based on their evaluation of these controls and procedures as of a date within 90 days of the filing date of this report.
(a)(ii) There was no change in the trust's internal control over financial reporting (as defined in Rule 30a-3(d) under the Investment Company Act) that occurred during the second fiscal quarter of the period covered by this report that has materially affected, or is reasonably likely to materially affect, the trust's internal control over financial reporting.
Item 12. Exhibits
(a) | (1) | Code of Ethics pursuant to Item 2 of Form N-CSR is filed and attached hereto as EX-99.CODE ETH. |
(a) | (2) | Certification pursuant to Rule 30a-2(a) under the Investment Company Act of 1940 (17 CFR 270.30a-2(a)) is filed and attached hereto as Exhibit 99.CERT. |
(a) | (3) | Not applicable. |
(b) | | Certification pursuant to Rule 30a-2(b) under the Investment Company Act of 1940 (17 CFR 270.30a-2(b)) is furnished and attached hereto as Exhibit 99.906CERT. |
SIGNATURES
Pursuant to the requirements of the Securities Exchange Act of 1934 and the Investment Company Act of 1940, the registrant has duly caused this report to be signed on its behalf by the undersigned, thereunto duly authorized.
Fidelity Securities Fund
By: | /s/Kenneth B. Robins |
| Kenneth B. Robins |
| President and Treasurer |
| |
Date: | September 26, 2013 |
Pursuant to the requirements of the Securities Exchange Act of 1934 and the Investment Company Act of 1940, this report has been signed below by the following persons on behalf of the registrant and in the capacities and on the dates indicated.
By: | /s/Kenneth B. Robins |
| Kenneth B. Robins |
| President and Treasurer |
| |
Date: | September 26, 2013 |
By: | /s/Christine Reynolds |
| Christine Reynolds |
| Chief Financial Officer |
| |
Date: | September 26, 2013 |