UNITED STATES
SECURITIES AND EXCHANGE COMMISSION
Washington, D.C. 20549
FORM N-CSR
CERTIFIED SHAREHOLDER REPORT OF REGISTERED
MANAGEMENT INVESTMENT COMPANIES
Investment Company Act file number 811-4118
Fidelity Securities Fund
(Exact name of registrant as specified in charter)
82 Devonshire St., Boston, Massachusetts 02109
(Address of principal executive offices) (Zip code)
Eric D. Roiter, Secretary
82 Devonshire St.
Boston, Massachusetts 02109
(Name and address of agent for service)
Registrant's telephone number, including area code: 617-563-7000
Date of fiscal year end: | July 31 |
| |
Date of reporting period: | January 31, 2006 |
Item 1. Reports to Stockholders
| | Fidelity®
Small Cap Growth
Fund
|
Semiannual Report
January 31, 2006
|


| Contents | | | | |
| |
| Chairman’s Message | | 3 | | Ned Johnson’s message to shareholders. |
| Shareholder Expense | | 4 | | An example of shareholder expenses. |
| Example | | | | |
| Investment Changes | | 6 | | A summary of major shifts in the fund’s |
| | | | | investments over the past six months. |
| Investments | | 7 | | A complete list of the fund’s investments |
| | | | | with their market values. |
| Financial Statements | | 14 | | Statements of assets and liabilities, |
| | | | | operations, and changes in net assets, |
| | | | | as well as financial highlights. |
| Notes | | 24 | | Notes to the financial statements. |
| Board Approval of | | 33 | | |
| Investment Advisory | | | | |
| Contracts and | | | | |
| Management Fees | | | | |
To view a fund’s proxy voting guidelines and proxy voting record for the 12 month period
ended June 30, visit www.fidelity.com/proxyvotingresults or visit the Securities and Exchange
Commission’s (SEC) web site at www.sec.gov. You may also call 1-800-544-8544 to request a free
copy of the proxy voting guidelines.
Standard & Poor’s, S&P and S&P 500 are registered service marks of The McGraw Hill Companies, Inc.
and have been licensed for use by Fidelity Distributors Corporation.
Other third party marks appearing herein are the property of their respective owners.
All other marks appearing herein are registered or unregistered trademarks or service marks
of FMR Corp. or an affiliated company.
|
| | This report and the financial statements contained herein are submitted for the general information
of the shareholders of the fund. This report is not authorized for distribution to prospective investors
in the fund unless preceded or accompanied by an effective prospectus.
A fund files its complete schedule of portfolio holdings with the SEC for the first and third quar
ters of each fiscal year on Form N Q. Forms N Q are available on the SEC’s web site at
http://www.sec.gov. A fund’s Forms N Q may be reviewed and copied at the SEC’s Public Refer
ence Room in Washington, DC. Information regarding the operation of the SEC’s Public Refer
ence Room may be obtained by calling 1-800-SEC-0330. For a complete list of a fund’s portfolio
holdings, view the fund’s most recent quarterly holdings report, semiannual report, or annual
report on Fidelity’s web site at http://www.fidelity.com/holdings.
NOT FDIC INSURED · MAY LOSE VALUE · NO BANK GUARANTEE
Neither the fund nor Fidelity Distributors Corporation is a bank.
|
Semiannual Report 2
Chairman’s Message
(photograph of Edward C. Johnson 3d)
Dear Shareholder:
During the past year or so, much has been reported about the mutual fund industry, and much of it has been more critical than I believe is warranted. Allegations that some companies have been less than forthright with their shareholders have cast a shadow on the entire industry. I continue to find these reports disturbing, and assert that they do not create an accurate picture of the industry overall. Therefore, I would like to remind every one where Fidelity stands on these issues. I will say two things specifically regarding allegations that some mutual fund companies were in violation of the Securities and Exchange Commission’s forward pricing rules or were involved in so called “market timing” activities.
First, Fidelity has no agreements that permit customers who buy fund shares after 4 p.m. to obtain the 4 p.m. price. This is not a new policy. This is not to say that some one could not deceive the company through fraudulent acts. However, we are extremely diligent in preventing fraud from occurring in this manner and in every other. But I underscore again that Fidelity has no so called “agreements” that sanction illegal practices.
Second, Fidelity continues to stand on record, as we have for years, in opposition to predatory short term trading that adversely affects shareholders in a mutual fund. Back in the 1980s, we initiated a fee which is returned to the fund and, therefore, to investors to discourage this activity. Further, we took the lead several years ago in developing a Fair Value Pricing Policy to prevent market timing on foreign securities in our funds. I am confident we will find other ways to make it more difficult for predatory traders to operate. However, this will only be achieved through close cooperation among regulators, legislators and the industry.
Yes, there have been unfortunate instances of unethical and illegal activity within the mutual fund industry from time to time. That is true of any industry. When this occurs, confessed or convicted offenders should be dealt with appropriately. But we are still concerned about the risk of over regulation and the quick application of simplistic solutions to intricate problems. Every system can be improved, and we support and applaud well thought out improvements by regulators, legislators and industry representatives that achieve the common goal of building and protecting the value of investors’ holdings.
For nearly 60 years, Fidelity has worked very hard to improve its products and service to justify your trust. When our family founded this company in 1946, we had only a few hundred customers. Today, we serve more than 18 million customers including individual investors and participants in retirement plans across America.
Let me close by saying that we do not take your trust in us for granted, and we realize that we must always work to improve all aspects of our service to you. In turn, we urge you to continue your active participation with your financial matters, so that your interests can be well served.
Best regards,
/s/ Edward C. Johnson 3d
Edward C. Johnson 3d
3 Semiannual Report
Shareholder Expense Example
As a shareholder of the Fund, you incur two types of costs: (1) transaction costs, including sales charges (loads) on purchase payments or redemption proceeds, redemption fees, and (2) ongoing costs, including management fees, distribution and/or service (12b 1) fees and other Fund expenses. This Example is intended to help you understand your ongoing costs (in dollars) of investing in the Fund and to compare these costs with the ongoing costs of investing in other mutual funds.
The Example is based on an investment of $1,000 invested at the beginning of the period and held for the entire period (August 1, 2005 to January 31, 2006).
The first line of the table below for each class of the Fund provides information about actual account values and actual expenses. You may use the information in this line, together with the amount you invested, to estimate the expenses that you paid over the period. Simply divide your account value by $1,000.00 (for example, an $8,600 account value divided by $1,000.00 = 8.6), then multiply the result by the number in the first line for a class of the Fund under the heading entitled “Expenses Paid During Period” to estimate the expenses you paid on your account during this period. A small balance maintenance fee of $12.00 that is charged once a year may apply for certain accounts with a value of less than $2,000. This fee is not included in the table below. If it was, the estimate of expenses you paid during the period would be higher, and your ending account value lower, by this amount.
Hypothetical Example for Comparison Purposes
The second line of the table below for each class of the Fund provides information about hypothetical account values and hypothetical expenses based on a Class’ actual expense ratio and an assumed rate of return of 5% per year before expenses, which is not the Class’ actual return. The hypothetical account values and expenses may not be used to estimate the actual ending account balance or expenses you paid for the period. You may use this informa tion to compare the ongoing costs of investing in the Fund and other funds. To do so, compare this 5% hypothetical example with the 5% hypothetical examples that appear in the shareholder reports of the other funds. A small balance maintenance fee of $12.00 that is charged once a year may apply for certain accounts with a value of less than $2,000. This fee is not included in the table below. If it was, the estimate of expenses you paid during the period would be higher, and your ending account value lower, by this amount.
Please note that the expenses shown in the table are meant to highlight your ongoing costs only and do not reflect any transaction costs. Therefore, the second line of the table is useful in comparing ongoing costs only, and will not help you determine the relative total costs of owning different funds. In addition, if these transactional costs were included, your costs would have been higher.
| | | | | | | | | | | Expenses Paid |
| | | | | Beginning | | Ending | | During Period* |
| | | | | Account Value | | Account Value | | August 1, 2005 to |
| | | | | August 1, 2005 | | January 31, 2006 | | January 31, 2006 |
| Class A | | | | | | | | | | | | |
| Actual | | | $ | 1,000.00 | | $ | | 1,086.80 | | $ | | 7.36 |
| HypotheticalA | | | $ | 1,000.00 | | $ | | 1,018.15 | | $ | | 7.12 |
| Class T | | | | | | | | | | | | |
| Actual | | | $ | 1,000.00 | | $ | | 1,085.30 | | $ | | 8.67 |
| HypotheticalA | | | $ | 1,000.00 | | $ | | 1,016.89 | | $ | | 8.39 |
| Class B | | | | | | | | | | | | |
| Actual | | | $ | 1,000.00 | | $ | | 1,083.40 | | $ | | 11.29 |
| HypotheticalA | | | $ | 1,000.00 | | $ | | 1,014.37 | | $ | | 10.92 |
| Class C | | | | | | | | | | | | |
| Actual | | | $ | 1,000.00 | | $ | | 1,082.90 | | $ | | 11.29 |
| HypotheticalA | | | $ | 1,000.00 | | $ | | 1,014.37 | | $ | | 10.92 |
| Small Cap Growth | | | | | | | | | | | | |
| Actual | | | $ | 1,000.00 | | $ | | 1,089.00 | | $ | | 5.69 |
| HypotheticalA | | | $ | 1,000.00 | | $ | | 1,019.76 | | $ | | 5.50 |
| Institutional Class | | | | | | | | | | | | |
| Actual | | | $ | 1,000.00 | | $ | | 1,088.70 | | $ | | 6.00 |
| HypotheticalA | | | $ | 1,000.00 | | $ | | 1,019.46 | | $ | | 5.80 |
| |
| A 5% return per year before expenses | | | | | | | | |
* Expenses are equal to each Class’ annualized expense ratio (shown in the table below); multiplied by the average account value over the period, multiplied by 184/365 (to reflect the one half year period).
| | | Annualized |
| | | Expense Ratio |
| Class A | | 1.40% |
| Class T | | 1.65% |
| Class B | | 2.15% |
| Class C | | 2.15% |
| Small Cap Growth | | 1.08% |
| Institutional Class | | 1.14% |
5 Semiannual Report
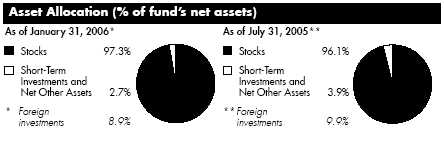
| Investment Changes | | | | |
| |
| |
| Top Ten Stocks as of January 31, 2006 | | | | |
| | | % of fund’s | | % of fund’s net assets |
| | | net assets | | 6 months ago |
| Lifetime Brands, Inc. | | 3.0 | | 0.9 |
| NBTY, Inc. | | 2.4 | | 1.8 |
| VistaCare, Inc. Class A | | 2.3 | | 0.0 |
| Pacific Sunwear of California, Inc. | | 2.2 | | 2.2 |
| Timberland Co. Class A | | 2.2 | | 0.0 |
| Omnicare, Inc. | | 2.1 | | 1.7 |
| Hilb Rogal & Hobbs Co. | | 2.1 | | 1.4 |
| American Medical Systems Holdings, Inc. | | 2.0 | | 0.0 |
| Abaxis, Inc. | | 1.9 | | 2.0 |
| Chemed Corp. | | 1.8 | | 0.0 |
| | | 22.0 | | |
Top Five Market Sectors as of January 31, 2006 | | |
| | | % of fund’s | | % of fund’s net assets |
| | | net assets | | 6 months ago |
| Information Technology | | 22.5 | | 24.1 |
| Health Care | | 19.9 | | 13.3 |
| Consumer Discretionary | | 18.7 | | 27.0 |
| Energy | | 11.1 | | 9.1 |
| Industrials | | 10.5 | | 10.0 |
Semiannual Report 6
| Investments January 31, 2006 (Unaudited) |
| Showing Percentage of Net Assets | | | | |
| |
| Common Stocks 97.3% | | | | |
| | | Shares | | Value (Note 1) |
| |
| CONSUMER DISCRETIONARY – 18.7% | | | | |
| Distributors – 0.5% | | | | |
| Prestige Brands Holdings, Inc. | | 145,000 | | $ 1,802,350 |
| Diversified Consumer Services – 1.1% | | | | |
| Education Management Corp. (a) | | 49,900 | | 1,527,938 |
| Matthews International Corp. Class A | | 72,060 | | 2,694,323 |
| | | | | 4,222,261 |
| Hotels, Restaurants & Leisure 3.3% | | | | |
| CEC Entertainment, Inc. (a) | | 195,800 | | 7,052,716 |
| Domino’s Pizza, Inc. | | 247,100 | | 6,155,261 |
| | | | | 13,207,977 |
| Household Durables – 4.7% | | | | |
| Helen of Troy Ltd. (a) | | 210,000 | | 4,023,600 |
| Lenox Group, Inc. (a) | | 203,300 | | 2,775,045 |
| Lifetime Brands, Inc. | | 548,977 | | 11,995,146 |
| | | | | 18,793,791 |
| Internet & Catalog Retail 0.6% | | | | |
| GSI Commerce, Inc. (a) | | 135,000 | | 2,277,450 |
| Specialty Retail – 4.9% | | | | |
| Big 5 Sporting Goods Corp. | | 102,300 | | 2,207,634 |
| Eddie Bauer Holdings, Inc. (a) | | 315,000 | | 4,725,000 |
| Finish Line, Inc. Class A | | 210,000 | | 3,769,500 |
| Pacific Sunwear of California, Inc. (a) | | 361,000 | | 8,848,110 |
| | | | | 19,550,244 |
| Textiles, Apparel & Luxury Goods – 3.6% | | | | |
| Fossil, Inc. (a) | | 239,468 | | 5,675,392 |
| Timberland Co. Class A (a) | | 250,000 | | 8,740,000 |
| | | | | 14,415,392 |
| |
| TOTAL CONSUMER DISCRETIONARY | | | | 74,269,465 |
| |
| CONSUMER STAPLES 2.4% | | | | |
| Personal Products 2.4% | | | | |
| NBTY, Inc. (a) | | 454,500 | | 9,403,605 |
| ENERGY 11.1% | | | | |
| Energy Equipment & Services – 4.4% | | | | |
| Basic Energy Services, Inc. | | 58,300 | | 1,635,315 |
| Hornbeck Offshore Services, Inc. (a) | | 101,000 | | 4,017,780 |
| Maverick Tube Corp. (a) | | 45,000 | | 2,153,250 |
| Oil States International, Inc. (a) | | 94,200 | | 3,852,780 |
| |
| See accompanying notes which are an integral part of the financial statements. | | |
| |
| 7 | | Semiannual Report |
| Investments (Unaudited) continued | | | | | | |
| |
| |
| Common Stocks continued | | | | | | |
| | | Shares | | Value (Note 1) |
| |
| ENERGY – continued | | | | | | |
| Energy Equipment & Services – continued | | | | | | |
| Pason Systems, Inc. | | 109,600 | | | | $ 3,374,750 |
| Superior Energy Services, Inc. (a) | | 98,000 | | | | 2,660,700 |
| | | | | | | 17,694,575 |
| Oil, Gas & Consumable Fuels – 6.7% | | | | | | |
| Comstock Resources, Inc. (a) | | 116,000 | | | | 3,712,000 |
| Forest Oil Corp. (a) | | 77,800 | | | | 4,006,700 |
| Frontier Oil Corp. | | 65,000 | | | | 3,080,350 |
| Holly Corp. | | 80,200 | | | | 5,902,720 |
| Mariner Energy, Inc. (a)(e) | | 75,000 | | | | 1,518,750 |
| OMI Corp. | | 182,500 | | | | 3,204,700 |
| Range Resources Corp. | | 168,150 | | | | 5,022,641 |
| | | | | | | 26,447,861 |
| |
| TOTAL ENERGY | | | | | | 44,142,436 |
| |
| FINANCIALS – 6.6% | | | | | | |
| Consumer Finance – 1.4% | | | | | | |
| World Acceptance Corp. (a) | | 193,500 | | | | 5,487,660 |
| Insurance – 5.2% | | | | | | |
| American Equity Investment Life Holding Co. | | 375,000 | | | | 5,268,750 |
| Aspen Insurance Holdings Ltd. | | 192,000 | | | | 4,450,560 |
| Hilb Rogal & Hobbs Co. | | 212,800 | | | | 8,273,664 |
| USI Holdings Corp. (a) | | 178,800 | | | | 2,517,504 |
| | | | | | | 20,510,478 |
| |
| TOTAL FINANCIALS | | | | | | 25,998,138 |
| |
| HEALTH CARE – 19.9% | | | | | | |
| Health Care Equipment & Supplies – 6.5% | | | | | | |
| Abaxis, Inc. (a) | | 370,000 | | | | 7,370,400 |
| American Medical Systems Holdings, Inc. (a) | | 354,300 | | | | 8,028,438 |
| Cholestech Corp. (a) | | 130,000 | | | | 1,405,300 |
| DJ Orthopedics, Inc. (a) | | 124,900 | | | | 4,100,467 |
| Regeneration Technologies, Inc. (a) | | 627,000 | | | | 4,953,300 |
| | | | | | | 25,857,905 |
| Health Care Providers & Services – 12.4% | | | | | | |
| America Service Group, Inc. (a) | | 253,500 | | | | 4,626,375 |
| American Dental Partners, Inc. (a) | | 25,649 | | | | 420,644 |
| AmSurg Corp. (a) | | 40,700 | | | | 882,783 |
| Chemed Corp. | | 134,000 | | | | 7,123,440 |
See accompanying notes which are an integral part of the financial statements.
| Common Stocks continued | | | | | | |
| | | Shares | | Value (Note 1) |
| |
| HEALTH CARE – continued | | | | | | |
| Health Care Providers & Services – continued | | | | | | |
| ICON PLC sponsored ADR (a) | | 63,995 | | | | $ 2,814,500 |
| Odyssey Healthcare, Inc. (a) | | 310,000 | | | | 6,317,800 |
| Omnicare, Inc. | | 170,500 | | | | 8,473,850 |
| Per-Se Technologies, Inc. (a) | | 281,400 | | | | 6,998,418 |
| VCA Antech, Inc. (a) | | 95,800 | | | | 2,650,786 |
| VistaCare, Inc. Class A (a) | | 653,400 | | | | 9,088,794 |
| | | | | | | 49,397,390 |
| Pharmaceuticals – 1.0% | | | | | | |
| Medicis Pharmaceutical Corp. Class A | | 124,500 | | | | 3,848,295 |
| |
| TOTAL HEALTH CARE | | | | | | 79,103,590 |
| |
| INDUSTRIALS – 10.5% | | | | | | |
| Aerospace & Defense – 0.8% | | | | | | |
| BE Aerospace, Inc. (a) | | 155,300 | | | | 3,264,406 |
| Building Products 0.6% | | | | | | |
| Quixote Corp. | | 119,050 | | | | 2,532,194 |
| Commercial Services & Supplies – 3.4% | | | | | | |
| CDI Corp. | | 70,000 | | | | 1,908,900 |
| McGrath RentCorp. | | 83,000 | | | | 2,694,180 |
| Navigant Consulting, Inc. (a) | | 125,700 | | | | 2,855,904 |
| PeopleSupport, Inc. (a) | | 236,100 | | | | 2,450,718 |
| Tele Atlas NV (a) | | 129,500 | | | | 3,528,490 |
| | | | | | | 13,438,192 |
| Construction & Engineering – 0.4% | | | | | | |
| Comfort Systems USA, Inc. | | 151,500 | | | | 1,592,265 |
| Electrical Equipment – 1.9% | | | | | | |
| C&D Technologies, Inc. | | 384,110 | | | | 3,188,113 |
| Genlyte Group, Inc. (a) | | 76,000 | | | | 4,395,840 |
| | | | | | | 7,583,953 |
| Industrial Conglomerates – 0.5% | | | | | | |
| Raven Industries, Inc. | | 60,000 | | | | 1,896,000 |
| Machinery – 1.6% | | | | | | |
| Greenbrier Companies, Inc. | | 100,000 | | | | 3,545,000 |
| Watts Water Technologies, Inc. Class A | | 86,600 | | | | 2,916,688 |
| | | | | | | 6,461,688 |
See accompanying notes which are an integral part of the financial statements.
| Investments (Unaudited) continued | | | | | | |
| |
| |
| Common Stocks continued | | | | | | | | |
| | | | | Shares | | Value (Note 1) |
| |
| INDUSTRIALS – continued | | | | | | | | |
| Trading Companies & Distributors – 1.3% | | | | | | |
| WESCO International, Inc. (a) | | | | 105,000 | | | | $ 5,032,650 |
| |
| TOTAL INDUSTRIALS | | | | | | | | 41,801,348 |
| |
| INFORMATION TECHNOLOGY – 22.5% | | | | | | | | |
| Communications Equipment – 3.5% | | | | | | | | |
| Avocent Corp. (a) | | | | 110,000 | | | | 3,659,700 |
| F5 Networks, Inc. (a) | | | | 28,000 | | | | 1,811,600 |
| Harris Corp. | | | | 112,000 | | | | 5,200,160 |
| Ixia (a) | | | | 181,800 | | | | 2,290,680 |
| MasTec, Inc. (a) | | | | 85,000 | | | | 1,024,250 |
| | | | | | | | | 13,986,390 |
| Computers & Peripherals – 1.6% | | | | | | | | |
| Avid Technology, Inc. (a) | | | | 72,500 | | | | 3,601,075 |
| Mobility Electronics, Inc. (a) | | | | 245,800 | | | | 2,575,984 |
| | | | | | | | | 6,177,059 |
| Electronic Equipment & Instruments – 3.9% | | | | | | |
| Cogent, Inc. (a) | | | | 137,000 | | | | 3,292,110 |
| FARO Technologies, Inc. (a) | | | | 135,393 | | | | 2,156,810 |
| ScanSource, Inc. (a) | | | | 46,200 | | | | 2,717,022 |
| Trimble Navigation Ltd. (a) | | | | 83,000 | | | | 3,321,660 |
| Xyratex Ltd. (a) | | | | 178,700 | | | | 4,033,259 |
| | | | | | | | | 15,520,861 |
| Internet Software & Services – 1.8% | | | | | | | | |
| Digital River, Inc. (a)(d) | | | | 98,600 | | | | 3,310,988 |
| j2 Global Communications, Inc. (a) | | | | 79,900 | | | | 3,815,225 |
| | | | | | | | | 7,126,213 |
| IT Services – 4.2% | | | | | | | | |
| CACI International, Inc. Class A (a) | | | | 42,700 | | | | 2,438,170 |
| Lionbridge Technologies, Inc. (a) | | | | 923,846 | | | | 7,048,945 |
| SI International, Inc. (a) | | | | 153,700 | | | | 4,674,017 |
| TALX Corp. | | | | 84,825 | | | | 2,658,416 |
| | | | | | | | | 16,819,548 |
| Office Electronics – 0.9% | | | | | | | | |
| Zebra Technologies Corp. Class A (a) | | | | 78,000 | | | | 3,512,340 |
| Semiconductors & Semiconductor Equipment – 3.3% | | | | | | |
| California Micro Devices Corp. (a) | | | | 204,000 | | | | 1,362,720 |
| Cascade Microtech, Inc. (a) | | | | 247,861 | | | | 3,507,233 |
| Entegris, Inc. (a) | | | | 255,000 | | | | 2,677,500 |
See accompanying notes which are an integral part of the financial statements.
| Common Stocks continued | | | | |
| | | Shares | | Value (Note 1) |
| |
| INFORMATION TECHNOLOGY – continued | | | | |
| Semiconductors & Semiconductor Equipment – continued | | | | |
| O2Micro International Ltd. sponsored ADR (a) | | 302,200 | | $ 3,287,936 |
| Silicon Laboratories, Inc. (a) | | 47,000 | | 2,313,810 |
| | | | | 13,149,199 |
| Software 3.3% | | | | |
| Blackbaud, Inc. | | 180,859 | | 3,108,966 |
| Bottomline Technologies, Inc. (a) | | 188,200 | | 2,168,064 |
| Cognos, Inc. (a) | | 65,000 | | 2,516,792 |
| DATATRAK International, Inc. (a)(f) | | 15,000 | | 136,500 |
| DATATRAK International, Inc. warrants 12/23/07 (a)(f) | | 2,250 | | 0 |
| Hyperion Solutions Corp. (a) | | 77,900 | | 2,680,539 |
| Moldflow Corp. (a) | | 157,200 | | 2,114,340 |
| NAVTEQ Corp. (a) | | 5,000 | | 224,550 |
| | | | | 12,949,751 |
| |
| TOTAL INFORMATION TECHNOLOGY | | | | 89,241,361 |
| |
| MATERIALS 4.2% | | | | |
| Chemicals – 0.8% | | | | |
| Chemtura Corp. | | 240,000 | | 3,016,800 |
| Containers & Packaging – 0.3% | | | | |
| Myers Industries, Inc. | | 95,000 | | 1,425,000 |
| Metals & Mining – 3.1% | | | | |
| Allegheny Technologies, Inc. | | 45,000 | | 2,333,250 |
| Apex Silver Mines Ltd. (a) | | 95,000 | | 1,522,850 |
| Carpenter Technology Corp. | | 25,000 | | 2,264,000 |
| Meridian Gold, Inc. (a) | | 118,100 | | 3,188,529 |
| Oregon Steel Mills, Inc. (a) | | 73,100 | | 3,009,527 |
| | | | | 12,318,156 |
| |
| TOTAL MATERIALS | | | | 16,759,956 |
| |
| TELECOMMUNICATION SERVICES – 0.5% | | | | |
| Diversified Telecommunication Services – 0.5% | | | | |
| FairPoint Communications, Inc. | | 184,000 | | 2,165,680 |
| |
| UTILITIES – 0.9% | | | | |
| Multi-Utilities – 0.9% | | | | |
| CMS Energy Corp. (a) | | 243,600 | | 3,524,892 |
| TOTAL COMMON STOCKS | | | | |
| (Cost $338,492,380) | | | | 386,410,471 |
See accompanying notes which are an integral part of the financial statements.
11 Semiannual Report
| Investments (Unaudited) continued | | | | | | |
| |
| Money Market Funds 4.3% | | | | | | | | |
| | | | | Shares | | | | Value (Note 1) |
| Fidelity Cash Central Fund, 4.46% (b) | | | | 16,270,904 | | | | $ 16,270,904 |
| Fidelity Securities Lending Cash Central Fund, 4.48% (b)(c) | | | | 630,000 | | | | 630,000 |
| TOTAL MONEY MARKET FUNDS | | | | | | | | |
| (Cost $16,900,904) | | | | | | | | 16,900,904 |
| TOTAL INVESTMENT PORTFOLIO 101.6% | | | | | | |
| (Cost $355,393,284) | | | | | | | | 403,311,375 |
| |
| NET OTHER ASSETS – (1.6)% | | | | | | | | (6,279,405) |
| NET ASSETS 100% | | | | | | | | $ 397,031,970 |
Legend
(a) Non-income producing
(b) Affiliated fund that is available only to
investment companies and other
accounts managed by Fidelity
Investments. The rate quoted is the
annualized seven-day yield of the fund
at period end. A complete unaudited
listing of the fund’s holdings as of its
most recent quarter end is available
upon request.
(c) Investment made with cash collateral
received from securities on loan.
(d) Security or a portion of the security is on
loan at period end.
(e) Security exempt from registration under
Rule 144A of the Securities Act of 1933.
These securities may be resold in
transactions exempt from registration,
normally to qualified institutional buyers.
At the period end, the value of these
securities amounted to $1,518,750 or
0.4% of net assets.
|
(f) Restricted securities – Investment in
securities not registered under the
Securities Act of 1933 (excluding 144A
issues). At the end of the period, the
value of restricted securities (excluding
144A issues) amounted to $136,500 or
0.0% of net assets.
|
Additional information on each holding is as follows:
| | | Acquisition | | | | Acquisition |
| Security | | Date | | | | Cost |
| DATATRAK | | | | | | |
| International, Inc. | | 12/27/04 | | | $ | 95,000 |
| DATATRAK | | | | | | |
| International, Inc. | | | | | | |
| warrants | | | | | | |
| 12/23/07 | | 12/27/04 | | | $ | 0 |
See accompanying notes which are an integral part of the financial statements.
Semiannual Report 12
Affiliated Central Funds
Information regarding fiscal year to date income received by the fund from the affiliated Central funds is as follows:
| Fund | | Income received |
| Fidelity Cash Central Fund | | $ | | 225,025 |
| Fidelity Securities Lending Cash Central Fund | | | | 12,921 |
| Total | | $ | | 237,946 |
See accompanying notes which are an integral part of the financial statements.
13 Semiannual Report
| Financial Statements | | | | | | |
| |
| |
| Statement of Assets and Liabilities | | | | | | |
| | | | | January 31, 2006 (Unaudited) |
| |
| Assets | | | | | | |
| Investment in securities, at value (including securities | | | | | | |
| loaned of $604,440) See accompanying schedule: | | | | | | |
| Unaffiliated issuers (cost $338,492,380) | | | $ | 386,410,471 | | |
| Affiliated Central Funds (cost $16,900,904) | | | | 16,900,904 | | |
| Total Investments (cost $355,393,284) | | | | | $ | 403,311,375 |
| Receivable for investments sold | | | | | | 2,190,200 |
| Receivable for fund shares sold | | | | | | 4,326,329 |
| Dividends receivable | | | | | | 11,353 |
| Interest receivable | | | | | | 61,021 |
| Prepaid expenses | | | | | | 827 |
| Receivable from investment adviser for expense | | | | | | |
| reductions | | | | | | 2,361 |
| Other affiliated receivables | | | | | | 377 |
| Other receivables | | | | | | 50,442 |
| Total assets | | | | | | 409,954,285 |
| |
| Liabilities | | | | | | |
| Payable for investments purchased | | | $ | 11,543,669 | | |
| Payable for fund shares redeemed | | | | 399,298 | | |
| Accrued management fee | | | | 247,387 | | |
| Distribution fees payable | | | | 19,161 | | |
| Other affiliated payables | | | | 61,939 | | |
| Other payables and accrued expenses | | | | 20,861 | | |
| Collateral on securities loaned, at value | | | | 630,000 | | |
| Total liabilities | | | | | | 12,922,315 |
| |
| Net Assets | | | | | $ | 397,031,970 |
| Net Assets consist of: | | | | | | |
| Paid in capital | | | | | $ | 348,795,652 |
| Accumulated net investment loss | | | | | | (567,617) |
| Accumulated undistributed net realized gain (loss) on | | | | | | |
| investments and foreign currency transactions | | | | | | 885,844 |
| Net unrealized appreciation (depreciation) on | | | | | | |
| investments | | | | | | 47,918,091 |
| Net Assets | | | | | $ | 397,031,970 |
See accompanying notes which are an integral part of the financial statements.
| Statement of Assets and Liabilities continued | | | | |
| | | January 31, 2006 (Unaudited) |
| |
| Calculation of Maximum Offering Price | | | | |
| Class A: | | | | |
| Net Asset Value and redemption price per share | | | | |
| ($11,765,393 ÷ 846,214 shares) | | $ | | 13.90 |
| Maximum offering price per share (100/94.25 of $13.90) | | $ | | 14.75 |
| Class T: | | | | |
| Net Asset Value and redemption price per share | | | | |
| ($11,926,676 ÷ 858,754 shares) | | $ | | 13.89 |
| Maximum offering price per share (100/96.50 of $13.89) | | $ | | 14.39 |
| Class B: | | | | |
| Net Asset Value and offering price per share | | | | |
| ($3,765,243 ÷ 271,911 shares)A | | $ | | 13.85 |
| Class C: | | | | |
| Net Asset Value and offering price per share | | | | |
| ($12,717,435 ÷ 918,993 shares)A | | $ | | 13.84 |
| Small Cap Growth: | | | | |
| Net Asset Value, offering price and redemption price per | | | | |
| share ($348,213,351 ÷ 24,986,050 shares) | | $ | | 13.94 |
| Institutional Class: | | | | |
| Net Asset Value, offering price and redemption price per | | | | |
| share ($8,643,872 ÷ 620,622 shares) | | $ | | 13.93 |
A Redemption price per share is equal to net asset value less any applicable contingent deferred sales charge. | | |
See accompanying notes which are an integral part of the financial statements.
15 Semiannual Report
| Financial Statements continued | | | | |
| |
| |
| Statement of Operations | | | | | | |
| | | Six months ended January 31, 2006 (Unaudited) |
| |
| Investment Income | | | | | | |
| Dividends | | | | | $ | 550,063 |
| Special dividends | | | | | | 241,463 |
| Interest | | | | | | 209 |
| Income from affiliated Central Funds | | | | | | 237,946 |
| Total income | | | | | | 1,029,681 |
| |
| Expenses | | | | | | |
| Management fee | | | | | | |
| Basic fee | | | $ | 1,057,561 | | |
| Performance adjustment | | | | 88,173 | | |
| Transfer agent fees | | | | 272,923 | | |
| Distribution fees | | | | 91,254 | | |
| Accounting and security lending fees | | | | 60,870 | | |
| Independent trustees’ compensation | | | | 565 | | |
| Custodian fees and expenses | | | | 9,885 | | |
| Registration fees | | | | 95,173 | | |
| Audit | | | | 19,163 | | |
| Legal | | | | 7,169 | | |
| Miscellaneous | | | | 692 | | |
| Total expenses before reductions | | | | 1,703,428 | | |
| Expense reductions | | | | (121,101) | | 1,582,327 |
| |
| Net investment income (loss) | | | | | | (552,646) |
| Realized and Unrealized Gain (Loss) | | | | |
| Net realized gain (loss) on: | | | | | | |
| Investment securities: | | | | | | |
| Unaffiliated issuers | | | | 2,019,029 | | |
| Foreign currency transactions | | | | (5,892) | | |
| Total net realized gain (loss) | | | | | | 2,013,137 |
| Change in net unrealized appreciation (depreciation) on: | | | | |
| Investment securities | | | | 28,330,105 | | |
| Assets and liabilities in foreign currencies | | 32 | | |
| Total change in net unrealized appreciation | | | | |
| (depreciation) | | | | | | 28,330,137 |
| Net gain (loss) | | | | | | 30,343,274 |
| Net increase (decrease) in net assets resulting from | | | | |
| operations | | | | | $ | 29,790,628 |
See accompanying notes which are an integral part of the financial statements.
| Statement of Changes in Net Assets | | | | | | | | |
| | | | | | | For the period |
| | | | | | | November 3, 2004 |
| | | Six months ended | | (commencement |
| | | January 31, 2006 | | of operations) to |
| | | (Unaudited) | | July 31, 2005 |
| Increase (Decrease) in Net Assets | | | | | | | | |
| Operations | | | | | | | | |
| Net investment income (loss) | | $ | | (552,646) | | $ | | (434,724) |
| Net realized gain (loss) | | | | 2,013,137 | | | | 3,381,102 |
| Change in net unrealized appreciation (depreciation) . | | | | 28,330,137 | | | | 19,587,954 |
| Net increase (decrease) in net assets resulting | | | | | | | | |
| from operations | | | | 29,790,628 | | | | 22,534,332 |
| Distributions to shareholders from net realized gain | | | | (3,779,480) | | | | — |
| Share transactions - net increase (decrease) | | | | 142,979,744 | | | | 205,303,288 |
| Redemption fees | | | | 96,708 | | | | 106,750 |
| Total increase (decrease) in net assets | | | | 169,087,600 | | | | 227,944,370 |
| |
| Net Assets | | | | | | | | |
| Beginning of period | | | | 227,944,370 | | | | — |
| End of period (including accumulated net investment | | | | | | | | |
| loss of $567,617 and accumulated net investment | | | | | | | | |
| loss of $14,971, respectively) | | $ | | 397,031,970 | | $ | | 227,944,370 |
See accompanying notes which are an integral part of the financial statements.
17 Semiannual Report
| Financial Highlights Class A | | | | | | | | |
| | | Six months ended | | Year ended |
| | | January 31, 2006 | | July 31, |
| | | (Unaudited) | | 2005G |
| Selected Per Share Data | | | | | | | | |
| Net asset value, beginning of period | | | | $ 12.95 | | | | $ 10.00 |
| Income from Investment Operations | | | | | | | | |
| Net investment income (loss)E | | | | (.04)F | | | | (.07) |
| Net realized and unrealized gain (loss) | | | | 1.15 | | | | 3.01 |
| Total from investment operations | | | | 1.11 | | | | 2.94 |
| Distributions from net realized gain | | | | (.16) | | | | — |
| Redemption fees added to paid in capitalE | | | | —I | | | | .01 |
| Net asset value, end of period | | | | $ 13.90 | | | | $ 12.95 |
| Total ReturnB,C,D | | | | 8.68% | | | | 29.50% |
| Ratios to Average Net AssetsH | | | | | | | | |
| Expenses before reductions | | | | 1.54%A | | | | 1.55%A |
| Expenses net of fee waivers, if any | | | | 1.40%A | | | | 1.45%A |
| Expenses net of all reductions | | | | 1.33%A | | | | 1.36%A |
| Net investment income (loss) | | | | (.63)%A,F | | | | (.78)%A |
| Supplemental Data | | | | | | | | |
| Net assets, end of period (000 omitted) | | | | $11,765 | | | | $ 4,719 |
| Portfolio turnover rate | | | | 90%A | | | | 93%A |
A Annualized
B Total returns for periods of less than one year are not annualized.
C Total returns would have been lower had certain expenses not been reduced during the periods shown.
D Total returns do not include the effect of the sales charges.
E Calculated based on average shares outstanding during the period.
F Investment income per share reflects a special dividend which amounted to $.01 per share. Excluding the special dividend, the ratio of net
investment income (loss) to average net assets would have been (.79)%.
G For the period November 3, 2004 (commencement of operations) to July 31, 2005.
H Expense ratios reflect operating expenses of the class. Expenses before reductions do not reflect amounts reimbursed by the investment adviser or
reductions from brokerage service arrangements or other expense offset arrangements and do not represent the amount paid by the class during
periods when reimbursements or reductions occur. Expense ratios before reductions for start up periods may not be representative of longer term
operating periods. Expenses net of fee waivers reflect expenses after reimbursement by the investment adviser but prior to reductions from
brokerage service arrangements or other expense offset arrangements. Expenses net of all reductions represent the net expenses paid by the
class.
I Amount represents less than $.01 per share.
|
See accompanying notes which are an integral part of the financial statements.
| Financial Highlights Class T | | | | | | | | |
| | | Six months ended | | Year ended |
| | | January 31, 2006 | | July 31, |
| | | (Unaudited) | | 2005G |
| Selected Per Share Data | | | | | | | | |
| Net asset value, beginning of period | | | | $ 12.93 | | | | $ 10.00 |
| Income from Investment Operations | | | | | | | | |
| Net investment income (loss)E | | | | (.06)F | | | | (.09) |
| Net realized and unrealized gain (loss) | | | | 1.15 | | | | 3.01 |
| Total from investment operations | | | | 1.09 | | | | 2.92 |
| Distributions from net realized gain | | | | (.13) | | | | — |
| Redemption fees added to paid in capitalE | | | | —I | | | | .01 |
| Net asset value, end of period | | | | $ 13.89 | | | | $ 12.93 |
| Total ReturnB,C,D | | | | 8.53% | | | | 29.30% |
| Ratios to Average Net AssetsH | | | | | | | | |
| Expenses before reductions | | | | 1.77%A | | | | 1.79%A |
| Expenses net of fee waivers, if any | | | | 1.65%A | | | | 1.70%A |
| Expenses net of all reductions | | | | 1.58%A | | | | 1.61%A |
| Net investment income (loss) | | | | (.88)%A,F | | | | (1.03)%A |
| Supplemental Data | | | | | | | | |
| Net assets, end of period (000 omitted) | | | | $11,927 | | | | $ 5,240 |
| Portfolio turnover rate | | | | 90%A | | | | 93%A |
A Annualized
B Total returns for periods of less than one year are not annualized.
C Total returns would have been lower had certain expenses not been reduced during the periods shown.
D Total returns do not include the effect of the sales charges.
E Calculated based on average shares outstanding during the period.
F Investment income per share reflects a special dividend which amounted to $.01 per share. Excluding the special dividend, the ratio of net
investment income (loss) to average net assets would have been (1.04)% .
G For the period November 3, 2004 (commencement of operations) to July 31, 2005.
H Expense ratios reflect operating expenses of the class. Expenses before reductions do not reflect amounts reimbursed by the investment adviser or
reductions from brokerage service arrangements or other expense offset arrangements and do not represent the amount paid by the class during
periods when reimbursements or reductions occur. Expense ratios before reductions for start up periods may not be representative of longer term
operating periods. Expenses net of fee waivers reflect expenses after reimbursement by the investment adviser but prior to reductions from
brokerage service arrangements or other expense offset arrangements. Expenses net of all reductions represent the net expenses paid by the
class.
I Amount represents less than $.01 per share.
|
See accompanying notes which are an integral part of the financial statements.
19 Semiannual Report
| Financial Highlights Class B | | | | | | | | |
| | | Six months ended | | Year ended |
| | | January 31, 2006 | | July 31, |
| | | (Unaudited) | | 2005G |
| Selected Per Share Data | | | | | | | | |
| Net asset value, beginning of period | | | | $ 12.87 | | | | $ 10.00 |
| Income from Investment Operations | | | | | | | | |
| Net investment income (loss)E | | | | (.09)F | | | | (.13) |
| Net realized and unrealized gain (loss) | | | | 1.16 | | | | 2.99 |
| Total from investment operations | | | | 1.07 | | | | 2.86 |
| Distributions from net realized gain | | | | (.09) | | | | — |
| Redemption fees added to paid in capitalE | | | | —I | | | | .01 |
| Net asset value, end of period | | | | $ 13.85 | | | | $ 12.87 |
| Total ReturnB,C,D | | | | 8.34% | | | | 28.70% |
| Ratios to Average Net AssetsH | | | | | | | | |
| Expenses before reductions | | | | 2.28%A | | | | 2.33%A |
| Expenses net of fee waivers, if any | | | | 2.15%A | | | | 2.20%A |
| Expenses net of all reductions | | | | 2.08%A | | | | 2.11%A |
| Net investment income (loss) | | | | (1.37)%A,F | | | | (1.53)%A |
| Supplemental Data | | | | | | | | |
| Net assets, end of period (000 omitted) | | | | $ 3,765 | | | | $ 2,055 |
| Portfolio turnover rate | | | | 90%A | | | | 93%A |
A Annualized
B Total returns for periods of less than one year are not annualized.
C Total returns would have been lower had certain expenses not been reduced during the periods shown.
D Total returns do not include the effect of the contingent deferred sales charge.
E Calculated based on average shares outstanding during the period.
F Investment income per share reflects a special dividend which amounted to $.01 per share. Excluding the special dividend, the ratio of net
investment income (loss) to average net assets would have been (1.54)% .
G For the period November 3, 2004 (commencement of operations) to July 31, 2005.
H Expense ratios reflect operating expenses of the class. Expenses before reductions do not reflect amounts reimbursed by the investment adviser or
reductions from brokerage service arrangements or other expense offset arrangements and do not represent the amount paid by the class during
periods when reimbursements or reductions occur. Expense ratios before reductions for start up periods may not be representative of longer term
operating periods. Expenses net of fee waivers reflect expenses after reimbursement by the investment adviser but prior to reductions from
brokerage service arrangements or other expense offset arrangements. Expenses net of all reductions represent the net expenses paid by the
class.
I Amount represents less than $.01 per share.
|
See accompanying notes which are an integral part of the financial statements.
| Financial Highlights Class C | | | | | | | | |
| | | Six months ended | | Year ended |
| | | January 31, 2006 | | July 31, |
| | | (Unaudited) | | 2005G |
| Selected Per Share Data | | | | | | | | |
| Net asset value, beginning of period | | | | $ 12.88 | | | | $ 10.00 |
| Income from Investment Operations | | | | | | | | |
| Net investment income (loss)E | | | | (.09)F | | | | (.13) |
| Net realized and unrealized gain (loss) | | | | 1.15 | | | | 3.00 |
| Total from investment operations | | | | 1.06 | | | | 2.87 |
| Distributions from net realized gain | | | | (.10) | | | | — |
| Redemption fees added to paid in capitalE | | | | —I | | | | .01 |
| Net asset value, end of period | | | | $ 13.84 | | | | $ 12.88 |
| Total ReturnB,C,D | | | | 8.29% | | | | 28.80% |
| Ratios to Average Net AssetsH | | | | | | | | |
| Expenses before reductions | | | | 2.24%A | | | | 2.24%A |
| Expenses net of fee waivers, if any | | | | 2.15%A | | | | 2.17%A |
| Expenses net of all reductions | | | | 2.08%A | | | | 2.09%A |
| Net investment income (loss) | | | | (1.38)%A,F | | | | (1.50)%A |
| Supplemental Data | | | | | | | | |
| Net assets, end of period (000 omitted) | | | | $12,717 | | | | $ 8,372 |
| |
| Portfolio turnover rate | | | | 90%A | | | | 93%A |
A Annualized
B Total returns for periods of less than one year are not annualized.
C Total returns would have been lower had certain expenses not been reduced during the periods shown.
D Total returns do not include the effect of the contingent deferred sales charge.
E Calculated based on average shares outstanding during the period.
F Investment income per share reflects a special dividend which amounted to $.01 per share. Excluding the special dividend, the ratio of net
investment income (loss) to average net assets would have been (1.54)% .
G For the period November 3, 2004 (commencement of operations) to July 31, 2005.
H Expense ratios reflect operating expenses of the class. Expenses before reductions do not reflect amounts reimbursed by the investment adviser or
reductions from brokerage service arrangements or other expense offset arrangements and do not represent the amount paid by the class during
periods when reimbursements or reductions occur. Expense ratios before reductions for start up periods may not be representative of longer term
operating periods. Expenses net of fee waivers reflect expenses after reimbursement by the investment adviser but prior to reductions from
brokerage service arrangements or other expense offset arrangements. Expenses net of all reductions represent the net expenses paid by the
class.
I Amount represents less than $.01 per share.
|
See accompanying notes which are an integral part of the financial statements.
21 Semiannual Report
| Financial Highlights Small Cap Growth | | | | | | | | |
| | | Six months ended | | Year ended |
| | | January 31, 2006 | | July 31, |
| | | (Unaudited) | | 2005F |
| Selected Per Share Data | | | | | | | | |
| Net asset value, beginning of period | | | | $ 12.98 | | | | $ 10.00 |
| Income from Investment Operations | | | | | | | | |
| Net investment income (loss)D | | | | (.02)E | | | | (.04) |
| Net realized and unrealized gain (loss) | | | | 1.16 | | | | 3.01 |
| Total from investment operations | | | | 1.14 | | | | 2.97 |
| Distributions from net realized gain | | | | (.18) | | | | — |
| Redemption fees added to paid in capitalD | | | | —H | | | | .01 |
| Net asset value, end of period | | | | $ 13.94 | | | | $ 12.98 |
| Total ReturnB,C | | | | 8.90% | | | | 29.80% |
| Ratios to Average Net AssetsG | | | | | | | | |
| Expenses before reductions | | | | 1.08%A | | | | 1.16%A |
| Expenses net of fee waivers, if any | | | | 1.08%A | | | | 1.16%A |
| Expenses net of all reductions | | | | 1.01%A | | | | 1.08%A |
| Net investment income (loss) | | | | (.31)%A,E | | | | (.49)%A |
| Supplemental Data | | | | | | | | |
| Net assets, end of period (000 omitted) | | | | $348,213 | | | | $205,652 |
| Portfolio turnover rate | | | | 90%A | | | | 93%A |
A Annualized
B Total returns for periods of less than one year are not annualized.
C Total returns would have been lower had certain expenses not been reduced during the periods shown.
D Calculated based on average shares outstanding during the period.
E Investment income per share reflects a special dividend which amounted to $.01 per share. Excluding the special dividend, the ratio of net
investment income (loss) to average net assets would have been (.47)%.
F For the period November 3, 2004 (commencement of operations) to July 31, 2005.
G Expense ratios reflect operating expenses of the class. Expenses before reductions do not reflect amounts reimbursed by the investment adviser or
reductions from brokerage service arrangements or other expense offset arrangements and do not represent the amount paid by the class during
periods when reimbursements or reductions occur. Expense ratios before reductions for start up periods may not be representative of longer term
operating periods. Expenses net of fee waivers reflect expenses after reimbursement by the investment adviser but prior to reductions from
brokerage service arrangements or other expense offset arrangements. Expenses net of all reductions represent the net expenses paid by the
class.
H Amount represents less than $.01 per share.
|
See accompanying notes which are an integral part of the financial statements.
| Financial Highlights Institutional Class | | | | | | | | |
| | | Six months ended | | Year ended |
| | | January 31, 2006 | | July 31, |
| | | (Unaudited) | | 2005F |
| Selected Per Share Data | | | | | | | | |
| Net asset value, beginning of period | | | | $ 12.97 | | | | $ 10.00 |
| Income from Investment Operations | | | | | | | | |
| Net investment income (loss)D | | | | (.02)E | | | | (.04) |
| Net realized and unrealized gain (loss) | | | | 1.16 | | | | 3.00 |
| Total from investment operations | | | | 1.14 | | | | 2.96 |
| Distributions from net realized gain | | | | (.18) | | | | — |
| Redemption fees added to paid in capitalD | | | | —H | | | | .01 |
| Net asset value, end of period | | | | $ 13.93 | | | | $ 12.97 |
| Total ReturnB,C | | | | 8.87% | | | | 29.70% |
| Ratios to Average Net AssetsG | | | | | | | | |
| Expenses before reductions | | | | 1.14%A | | | | 1.20%A |
| Expenses net of fee waivers, if any | | | | 1.14%A | | | | 1.18%A |
| Expenses net of all reductions | | | | 1.04%A | | | | 1.10%A |
| Net investment income (loss) | | | | (.34)%A,E | | | | (.51)%A |
| Supplemental Data | | | | | | | | |
| Net assets, end of period (000 omitted) | | | | $ 8,644 | | | | $ 1,906 |
| Portfolio turnover rate | | | | 90%A | | | | 93%A |
A Annualized
B Total returns for periods of less than one year are not annualized.
C Total returns would have been lower had certain expenses not been reduced during the periods shown.
D Calculated based on average shares outstanding during the period.
E Investment income per share reflects a special dividend which amounted to $.01 per share. Excluding the special dividend, the ratio of net
investment income (loss) to average net assets would have been (.50)%.
F For the period November 3, 2004 (commencement of operations) to July 31, 2005.
G Expense ratios reflect operating expenses of the class. Expenses before reductions do not reflect amounts reimbursed by the investment adviser or
reductions from brokerage service arrangements or other expense offset arrangements and do not represent the amount paid by the class during
periods when reimbursements or reductions occur. Expense ratios before reductions for start up periods may not be representative of longer term
operating periods. Expenses net of fee waivers reflect expenses after reimbursement by the investment adviser but prior to reductions from
brokerage service arrangements or other expense offset arrangements. Expenses net of all reductions represent the net expenses paid by the
class.
H Amount represents less than $.01 per share.
|
See accompanying notes which are an integral part of the financial statements.
23 Semiannual Report
Notes to Financial Statements
For the period ended January 31, 2006 (Unaudited)
1. Significant Accounting Policies.
Fidelity Small Cap Growth Fund (the fund) is a non diversified fund of Fidelity Securi ties Fund (the trust) and is authorized to issue an unlimited number of shares. The trust is registered under the Investment Company Act of 1940, as amended (the 1940 Act), as an open end management investment company organized as a Massachusetts business trust.
The fund offers Class A, Class T, Class B, Class C, Small Cap Growth, and Institutional Class shares, each of which has equal rights as to assets and voting privileges. Each class has exclusive voting rights with respect to matters that affect that class. Class B shares will automatically convert to Class A shares after a holding period of seven years from the initial date of purchase. Investment income, realized and unrealized capital gains and losses, the common expenses of the fund, and certain fund level expense reductions, if any, are allocated on a pro rata basis to each class based on the relative net assets of each class to the total net assets of the fund. Each class differs with respect to transfer agent and distribution and service plan fees incurred. Certain expense reductions also differ by class.
The fund may invest in affiliated money market central funds (Money Market Central Funds) which are open end investment companies available to investment companies and other accounts managed by Fidelity Management & Research Company (FMR) and its affiliates. The financial statements have been prepared in conformity with accounting principles generally accepted in the United States of America, which require manage ment to make certain estimates and assumptions at the date of the financial statements. The following summarizes the significant accounting policies of the fund:
Security Valuation. Investments are valued and net asset value (NAV) per share is calculated (NAV calculation) as of the close of business of the New York Stock Exchange (NYSE), normally 4:00 p.m. Eastern time. Wherever possible, the fund uses independent pricing services approved by the Board of Trustees to value its investments.
Equity securities, including restricted securities, for which market quotations are readily available, are valued at the last reported sale price or official closing price as reported by an independent pricing service on the primary market or exchange on which they are traded. In the event there were no sales during the day or closing prices are not available, securities are valued at the last quoted bid price. Investments in open end mutual funds, are valued at their closing net asset value each business day. Short term securities with remaining maturities of sixty days or less for which quotations are not readily available are valued at amortized cost, which approximates value.
When current market prices or quotations are not readily available or do not accurately reflect fair value, valuations may be determined in accordance with procedures adopted by the Board of Trustees. For example, when developments occur between the close of a
| 1. Significant Accounting Policies continued |
Security Valuation continued | | |
market and the close of the NYSE that may materially affect the value of some or all of the securities, or when trading in a security is halted, those securities may be fair valued. Factors used in the determination of fair value may include monitoring news to identify significant market or security specific events such as changes in the value of U.S. securi ties markets, reviewing developments in foreign markets and evaluating the perfor mance of ADRs, futures contracts and exchange traded funds. Because the fund’s utilization of fair value pricing depends on market activity, the frequency with which fair value pricing is used can not be predicted and may be utilized to a significant extent. The value of securities used for NAV calculation under fair value pricing may differ from published prices for the same securities.
Foreign Currency. The fund uses foreign currency contracts to facilitate transactions in foreign denominated securities. Losses from these transactions may arise from changes in the value of the foreign currency or if the counterparties do not perform under the contracts’ terms.
Foreign denominated assets, including investment securities, and liabilities are trans lated into U.S. dollars at the exchange rate at period end. Purchases and sales of invest ment securities, income and dividends received and expenses denominated in foreign currencies are translated into U.S. dollars at the exchange rate in effect on the transac tion date.
The effects of exchange rate fluctuations on investments are included with the net realized and unrealized gain (loss) on investment securities. Other foreign currency transactions resulting in realized and unrealized gain (loss) are disclosed separately.
Investment Transactions and Income. Security transactions are accounted for as of trade date. Gains and losses on securities sold are determined on the basis of identified cost. Dividend income is recorded on the ex dividend date, except for certain dividends from foreign securities where the ex dividend date may have passed, which are recorded as soon as the fund is informed of the ex dividend date. Non cash dividends included in dividend income, if any, are recorded at the fair market value of the securities received. Distributions received on securities that represent a return of capital or capital gain are recorded as a reduction of cost of investments and/or as a realized gain. The fund esti mates the components of distributions received that may be considered return of capital distributions or capital gain distributions. Large, non recurring dividends recognized by the fund are presented separately on the Statement of Operations as “Special Dividends” and the impact of these dividends is presented in the Financial Highlights. Interest income is accrued as earned. Interest income includes coupon interest and amortization of premium and accretion of discount on debt securities. Investment income is recorded net of foreign taxes withheld where recovery of such taxes is uncertain.
25 Semiannual Report
| Notes to Financial Statements (Unaudited) continued |
1. Significant Accounting Policies continued |
Expenses. Most expenses of the trust can be directly attributed to a fund. Expenses which cannot be directly attributed are apportioned among each fund in the trust.
Income Tax Information and Distributions to Shareholders. Each year, the fund intends to qualify as a regulated investment company by distributing all of its taxable income and realized gains under Subchapter M of the Internal Revenue Code. As a result, no provision for income taxes is required in the accompanying financial statements. Foreign taxes are provided for based on the fund’s understanding of the tax rules and rates that exist in the foreign markets in which it invests.
Distributions are recorded on the ex dividend date. Income dividends and capital gain distributions are declared separately for each class. Income and capital gain distribu tions are determined in accordance with income tax regulations, which may differ from generally accepted accounting principles. In addition, the fund claimed a portion of the payment made to redeeming shareholders as a distribution for income tax purposes.
Capital accounts within the financial statements are adjusted for permanent book tax differences. These adjustments have no impact on net assets or the results of operations. Temporary book tax differences will reverse in a subsequent period.
Book tax differences are primarily due to foreign currency transactions, passive foreign investment companies (PFIC) and losses deferred due to wash sales.
The federal tax cost of investments and unrealized appreciation (depreciation) as of period end were as follows:
| Unrealized appreciation | | | $ | 54,447,942 |
| Unrealized depreciation | | | | (7,058,875) |
| Net unrealized appreciation (depreciation) | | | $ | 47,389,067 |
| Cost for federal income tax purposes | | | $ | 355,922,308 |
Short Term Trading (Redemption) Fees. Shares held in the fund less than 90 days are subject to a redemption fee equal to 1.50% of the proceeds of the redeemed shares. All redemption fees, including any estimated redemption fees paid by FMR, are retained by the fund and accounted for as an addition to paid in capital.
Repurchase Agreements. FMR has received an Exemptive Order from the Securities and Exchange Commission (the SEC) which permits the fund and other affiliated entities of FMR to transfer uninvested cash balances into joint trading accounts which are then invested in repurchase agreements. The fund may also invest directly with institutions in repurchase agreements. Repurchase agreements are collateralized by government or non government securities. Collateral is held in segregated accounts with custodian banks and may be obtained in the event of a default of the counterparty. The fund monitors, on a daily basis, the value of the collateral to ensure it is at least equal to
2. Operating Policies continued
Repurchase Agreements continued
the principal amount of the repurchase agreement (including accrued interest). In the event of a default by the counterparty, realization of the collateral proceeds could be delayed, during which time the value of the collateral may decline.
Restricted Securities. The fund may invest in securities that are subject to legal or contractual restrictions on resale. These securities generally may be resold in transac tions exempt from registration or to the public if the securities are registered. Disposal of these securities may involve time consuming negotiations and expense, and prompt sale at an acceptable price may be difficult. Information regarding restricted securities is included at the end of the fund’s Schedule of Investments.
3. Purchases and Sales of Investments.
Purchases and sales of securities, other than short term securities and U.S. government securities, aggregated $266,055,748 and $128,949,824, respectively.
4. Fees and Other Transactions with Affiliates.
Management Fee. FMR and its affiliates provide the fund with investment manage ment related services for which the fund pays a monthly management fee. The manage ment fee is the sum of an individual fund fee rate that is based on an annual rate of .45% of the fund’s average net assets and a group fee rate that averaged .27% during the period. The group fee rate is based upon the average net assets of all the mutual funds advised by FMR. The group fee rate decreases as assets under management increase and increases as assets under management decrease. In addition, the management fee is subject to a performance adjustment (up to a maximum of .20% of the fund’s average net assets over a 36 month performance period). The upward or downward adjustment to the management fee is based on the investment performance of the asset weighted return of Small Cap Growth (the original class) as compared to an appropriate bench mark index. The fund’s performance adjustment took effect in November 2005. Subse quent months will be added until the performance period includes 36 months. For the period, the total annualized management fee rate, including the performance adjust ment, was .78% of the fund’s average net assets.
Distribution and Service Plan. In accordance with Rule 12b 1 of the 1940 Act, the fund has adopted separate Distribution and Service Plans for each class of shares. Certain classes pay Fidelity Distributors Corporation (FDC), an affiliate of FMR, separate Distribution and Service Fees, each of which is based on an annual percentage of each class’ average net assets. In addition, FDC may pay financial intermediaries for selling
27 Semiannual Report
| Notes to Financial Statements (Unaudited) continued |
| |
| 4. Fees and Other Transactions with Affiliates continued |
Distribution and Service Plan continued |
shares of the fund and providing shareholder support services. For the period, the Distribution and Service Fee rates and the total amounts paid to and retained by FDC were as follows:
| | | Distribution | | Service | | | | Paid to | | | | Retained |
| | | Fee | | Fee | | | | FDC | | | | by FDC |
| Class A | | 0% | | .25% | | | $ | 9,490 | | | $ | 728 |
| Class T | | 25% | | .25% | | | | 17,702 | | | | 2,098 |
| Class B | | 75% | | .25% | | | | 13,818 | | | | 11,261 |
| Class C | | 75% | | .25% | | | | 50,244 | | | | 20,167 |
| |
| | | | | | | | $ | 91,254 | | | $ | 34,254 |
Sales Load. FDC receives a front end sales charge of up to 5.75% for selling Class A shares, and 3.50% for selling Class T shares, some of which is paid to financial intermedi aries for selling shares of the fund. FDC receives the proceeds of contingent deferred sales charges levied on Class A, Class T, Class B, and Class C redemptions. These charges depend on the holding period. The deferred sales charges range from 5% to 1% for Class B, 1% for Class C, and ..25% for certain purchases of Class A and Class T shares.
For the period, sales charge amounts retained by FDC were as follows:
| | |
| | | | | Retained |
| | | | | by FDC |
| Class A | | | $ | 25,490 |
| Class T | | | | 4,084 |
| Class B* | | | | 889 |
| Class C* | | | | 1,015 |
| | | | $ | 31,478 |
* When Class B and Class C shares are initially sold, FDC pays commissions from its own resources to financial intermediaries through which the sales are made.
Transfer Agent Fees. Fidelity Investments Institutional Operations Company, Inc. (FIIOC), an affiliate of FMR, is the transfer, dividend disbursing and shareholder servic ing agent for each class of the fund, except for Small Cap Growth. Fidelity Service Company, Inc. (FSC), an affiliate of FMR, is the transfer agent for Small Cap Growth shares. FIIOC and FSC receive account fees and asset based fees that vary according to the account size and type of account of the shareholders of the respective classes of the fund. FIIOC and FSC pay for typesetting, printing and mailing of shareholder reports,
| 4. Fees and Other Transactions with Affiliates continued |
Transfer Agent Fees continued | | |
except proxy statements. For the period the total transfer agent fees paid by each class to FIIOC or FSC, were as follows:
| | | | | | | % of |
| | | | | | | Average |
| | | | | Amount | | Net Assets |
| Class A | | | $ | 13,833 | | .37* |
| Class T | | | | 12,451 | | .35* |
| Class B | | | | 4,929 | | .36* |
| Class C | | | | 16,009 | | .32* |
| Small Cap Growth | | | | 222,054 | | .17* |
| Institutional Class | | | | 3,647 | | .22* |
| | | | $ | 272,923 | | |
| * Annualized | | | | | | |
Accounting and Security Lending Fees. FSC maintains the fund’s accounting rec ords. The accounting fee is based on the level of average net assets for the month. Under a separate contract, FSC administers the security lending program. The security lending fee is based on the number and duration of lending transactions.
Affiliated Central Funds. The fund may invest in Money Market Central Funds which seek preservation of capital and current income and are managed by Fidelity Invest ments Money Management, Inc. (FIMM), an affiliate of FMR.
The Money Market Central Funds do not pay a management fee.
Brokerage Commissions. The fund placed a portion of its portfolio transactions with brokerage firms which are affiliates of the investment adviser. The commissions paid to these affiliated firms were $13,964 for the period.
5. Committed Line of Credit.
|
The fund participates with other funds managed by FMR in a $4.2 billion credit facility (the “line of credit”) to be utilized for temporary or emergency purposes to fund share holder redemptions or for other short term liquidity purposes. The fund has agreed to pay commitment fees on its pro rata portion of the line of credit. During the period, there were no borrowings on this line of credit.
29 Semiannual Report
| Notes to Financial Statements (Unaudited) continued |
6. Security Lending. | | |
The fund lends portfolio securities from time to time in order to earn additional income. On the settlement date of the loan, the fund receives collateral (in the form of U.S. Treasury obligations, letters of credit and/or cash) against the loaned securities and maintains collateral in an amount not less than 100% of the market value of the loaned securities during the period of the loan. The market value of the loaned securities is determined at the close of business of the fund and any additional required collateral is delivered to the fund on the next business day. If the borrower defaults on its obligation to return the securities loaned because of insolvency or other reasons, a fund could experience delays and costs in recovering the securities loaned or in gaining access to the collateral. Any cash collateral received is invested in the Fidelity Securities Lending Cash Central Fund. The value of loaned securities and cash collateral at period end are disclosed on the fund’s Statement of Assets and Liabilities. Security lending income represents the income earned on investing cash collateral, less fees and expenses associated with the loan, plus any premium payments that may be received on the loan of certain types of securities. Security lending income is presented in the Statement of Operations as a component of income from affiliated central funds. Net income from lending portfolio securities during the period amounted to $12,921.
FMR voluntarily agreed to reimburse each class to the extent annual operating expenses exceeded certain levels of average net assets as noted in the table below. Some expenses, for example interest expense, are excluded from this reimbursement.
The following classes were in reimbursement during the period:
| | | | |
| | | Expense | | | | Reimbursement |
| | | Limitations | | | | from adviser |
| Class A | | 1.40% | | | $ | 5,183 |
| Class T | | 1.65% | | | | 4,337 |
| Class B | | 2.15% | | | | 1,771 |
| Class C | | 2.15% | | | | 4,376 |
| | | | | | $ | 15,667 |
Many of the brokers with whom FMR places trades on behalf of the fund provided services to the fund in addition to trade execution. These services included payments of certain expenses on behalf of the fund totaling $103,072 for the period. In addition, through arrangements with the fund’s custodian and each class’ transfer agent, credits realized as a result of uninvested cash balances were used to reduce the fund’s expenses. During the period, these credits reduced the fund’s custody expenses by $1,801. During
7. Expense Reductions - continued
the period, credits reduced each class’ transfer agent expense as noted in the table below.
| | | Transfer Agent |
| | | expense reduction |
| Small Cap Growth | | $ | | 109 |
| Institutional Class | | | | 452 |
| | | $ | | 561 |
| |
| |
| 8. Other. | | | | |
The fund’s organizational documents provide former and current trustees and officers with a limited indemnification against liabilities arising in connection with the performance of their duties to the fund. In the normal course of business, the fund may also enter into contracts that provide general indemnifications. The fund’s maximum exposure under these arrangements is unknown as this would be dependent on future claims that may be made against the fund. The risk of material loss from such claims is considered remote.
| 9. Distributions to Shareholders. | | | | | | |
| |
Distributions to shareholders of each class were as follows:
| | | | | | |
| | | | | Six months ended | | | | Year ended | | |
| | | | | January 31, | | | | July 31, | | |
| | | | | 2006 | | | | 2005A | | |
| From net realized gain | | | | | | | | | | |
| Class A | | | $ | 79,075 | | | $ | | | — |
| Class T | | | | 63,628 | | | | | | — |
| Class B | | | | 16,296 | | | | | | — |
| Class C | | | | 71,642 | | | | | | — |
| Small Cap Growth | | | | 3,518,781 | | | | | | — |
| Institutional Class | | | | 30,058 | | | | | | — |
| Total | | | $ | 3,779,480 | | | $ | | | — |
A For the period November 3, 2004 (commencement of operations) to July 31, 2005. | | | | | | |
31 Semiannual Report
| Notes to Financial Statements (Unaudited) continued |
| |
| |
| 10. Share Transactions. | | | | | | | | | | |
| |
Transactions for each class of shares were as follows:
| | | | | | | | |
| | | Shares | | Dollars |
| | | Six months ended | | Year ended | | Six months ended | | | | Year ended |
| | | January 31, | | July 31, | | January 31, | | | | July 31, |
| | | 2006 | | 2005A | | 2006 | | | | 2005A |
| Class A | | | | | | | | | | | | |
| Shares sold | | 554,813 | | 377,650 | | | | $ 7,172,589 | | | | $ 4,304,515 |
| Reinvestment of distributions | | 5,381 | | — | | | | 70,352 | | | | — |
| Shares redeemed | | (78,430) | | (13,200) | | | | (1,015,894) | | | | (157,404) |
| Net increase (decrease) | | 481,764 | | 364,450 | | | | $ 6,227,047 | | | | $ 4,147,111 |
| Class T | | | | | | | | | | | | |
| Shares sold | | 558,733 | | 432,704 | | | | $ 7,321,338 | | | | $ 4,904,069 |
| Reinvestment of distributions | | 4,866 | | — | | | | 63,445 | | | | — |
| Shares redeemed | | (110,217) | | (27,332) | | | | (1,411,094) | | | | (327,972) |
| Net increase (decrease) | | 453,382 | | 405,372 | | | | $ 5,973,689 | | | | $ 4,576,097 |
| Class B | | | | | | | | | | | | |
| Shares sold | | 130,631 | | 169,626 | | | | $ 1,681,126 | | | | $ 1,864,130 |
| Reinvestment of distributions | | 1,204 | | — | | | | 15,610 | | | | — |
| Shares redeemed | | (19,547) | | (10,003) | | | | (252,382) | | | | (113,030) |
| Net increase (decrease) | | 112,288 | | 159,623 | | | | $ 1,444,354 | | | | $ 1,751,100 |
| Class C | | | | | | | | | | | | |
| Shares sold | | 378,699 | | 664,094 | | | | $ 4,874,538 | | | | $ 7,429,424 |
| Reinvestment of distributions | | 5,289 | | — | | | | 68,602 | | | | — |
| Shares redeemed | | (115,053) | | (14,036) | | | | (1,477,514) | | | | (166,606) |
| Net increase (decrease) | | 268,935 | | 650,058 | | | | $ 3,465,626 | | | | $ 7,262,818 |
| Small Cap Growth | | | | | | | | | | | | |
| Shares sold | | 12,356,450 | | 18,162,749 | | | | $160,594,584 | | | | $212,509,370 |
| Reinvestment of distributions | | 226,620 | | — | | | | 2,968,828 | | | | — |
| Shares redeemed | | (3,439,456) | | (2,320,313) | | (43,857,334) | | (26,565,039) |
| Net increase (decrease) | | 9,143,614 | | 15,842,436 | | | | $119,706,078 | | | | $185,944,331 |
| Institutional Class | | | | | | | | | | | | |
| Shares sold | | 507,176 | | 170,585 | | | | $ 6,598,183 | | | | $ 1,883,777 |
| Reinvestment of distributions | | 1,705 | | — | | | | 22,327 | | | | — |
| Shares redeemed | | (35,213) | | (23,631) | | | | (457,560) | | | | (261,946) |
| Net increase (decrease) | | 473,668 | | 146,954 | | | | $ 6,162,950 | | | | $ 1,621,831 |
A For the period November 3, 2004 (commencement of operations) to July 31, 2005. | | | | | | | | |
Board Approval of Investment Advisory Contracts and Management Fees
Fidelity Small Cap Growth Fund
On January 19, 2006, the Board of Trustees, including the Independent Trustees (together, the Board), voted to approve a general research services agreement (the Agreement) between FMR, FMR Co., Inc. (FMRC), Fidelity Investments Money Manage ment, Inc. (FIMM), and Fidelity Research & Analysis Company (FRAC) (together, the Investment Advisers) for the fund, effective January 20, 2006, pursuant to which FRAC may provide general research and investment advisory support services to FMRC and FIMM. The Board considered that it has approved previously various sub advisory agreements for the fund with affiliates of FMR that allow FMR to obtain research, non discretionary advice, or discretionary portfolio management at no additional expense to the fund. The Board, assisted by the advice of fund counsel and independent Trustees’ counsel, considered a broad range of information and determined that it would be beneficial for the fund to access the research and investment advisory support services supplied by FRAC at no additional expense to the fund.
The Board reached this determination in part because the new arrangement will involve no changes in (i) the contractual terms of and fees payable under the fund’s manage ment contract or sub advisory agreements; (ii) the investment process or strategies employed in the management of the fund’s assets; (iii) the nature or level of services provided under the fund’s management contract or sub advisory agreements; (iv) the day to day management of the fund or the persons primarily responsible for such man agement; or (v) the ultimate control or beneficial ownership of FMR, FMRC, or FIMM. The Board also considered that the establishment of the Agreement would not necessi tate prior shareholder approval of the Agreement or result in an assignment and termination of the fund’s management contract or sub advisory agreements under the Investment Company Act of 1940.
Because the Board was approving an arrangement with FRAC under which the fund will not bear any additional management fees or expenses and under which the fund’s portfolio manager would not change, it did not consider the fund’s investment perfor mance, competitiveness of management fee and total expenses, costs of services and profitability, or economies of scale to be significant factors in its decision.
In connection with its future renewal of the fund’s management contract and sub advisory agreements, the Board will consider: (i) the nature, extent, and quality of services provided to the fund, including shareholder and administrative services and investment performance; (ii) the competitiveness of the fund’s management fee and total expenses; (iii) the costs of the services and profitability, including the revenues earned and the expenses incurred by Fidelity in conducting the business of developing, marketing, distributing, managing, administering, and servicing the fund and its shareholders; and (iv) whether there have been economies of scale in respect of the management of the Fidelity funds, whether the Fidelity funds (including the fund) have
33 Semiannual Report
Board Approval of Investment Advisory Contracts and Management Fees continued
appropriately benefited from any such economies of scale, and whether there is potential for realization of any further economies.
Based on its evaluation of all of the conclusions noted above, and after considering all material factors, the Board ultimately concluded that the fund’s Agreement is fair and reasonable, and that the fund’s Agreement should be approved.
Managing Your Investments
Fidelity offers several ways to conveniently manage your personal investments via your telephone or PC. You can access your account information, conduct trades and research your investments 24 hours a day.
By Phone
Fidelity Automated Service Telephone provides a single toll free number to access account balances, positions, quotes and trading. It’s easy to navigate the service, and on your first call, the system will help you create a personal identification number (PIN) for security.


By PC
Fidelity’s web site on the Internet provides a wide range of information, including daily financial news, fund performance, interactive planning tools and news about Fidelity products and services.

* When you call the quotes line, please remember that a fund’s yield and return will vary and, except for money market funds, share price will also vary. This means that you may have a gain or loss when you sell your shares. There is no assurance that money market funds will be able to maintain a stable $1 share price; an investment in a money market fund is not insured or guar anteed by the U.S. government. Total returns are historical and include changes in share price, reinvestment of dividends and capital gains, and the effects of any sales charges.
35 Semiannual Report
To Visit Fidelity
For directions and hours,
please call 1-800-544-9797.
Arizona
7001 West Ray Road
Chandler, AZ
7373 N. Scottsdale Road
Scottsdale, AZ
California
815 East Birch Street
Brea, CA
1411 Chapin Avenue
Burlingame, CA
851 East Hamilton Avenue
Campbell, CA
19200 Von Karman Avenue
Irvine, CA
601 Larkspur Landing Circle
Larkspur, CA
10100 Santa Monica Blvd.
Los Angeles, CA
27101 Puerta Real
Mission Viejo, CA
73 575 El Paseo
Palm Desert, CA
251 University Avenue
Palo Alto, CA
123 South Lake Avenue
Pasadena, CA
16995 Bernardo Ctr. Drive
Rancho Bernardo, CA
1740 Arden Way
Sacramento, CA
7676 Hazard Center Drive
San Diego, CA
8 Montgomery Street
San Francisco, CA
3793 State Street
Santa Barbara, CA
21701 Hawthorne Boulevard
Torrance, CA
2001 North Main Street
Walnut Creek, CA
6300 Canoga Avenue
Woodland Hills, CA
|
Colorado
1625 Broadway
Denver, CO
9185 East Westview Road
Littleton, CO
Connecticut
48 West Putnam Avenue
Greenwich, CT
265 Church Street
New Haven, CT
300 Atlantic Street
Stamford, CT
29 South Main Street
West Hartford, CT
Delaware
222 Delaware Avenue
Wilmington, DE
Florida
4400 N. Federal Highway
Boca Raton, FL
121 Alhambra Plaza
Coral Gables, FL
2948 N. Federal Highway
Ft. Lauderdale, FL
1907 West State Road 434
Longwood, FL
8880 Tamiami Trail, North
Naples, FL
3550 Tamiami Trail, South
Sarasota, FL
1502 N. Westshore Blvd.
Tampa, FL
2465 State Road 7
Wellington, FL
3501 PGA Boulevard
West Palm Beach, FL
Georgia
3445 Peachtree Road, N.E.
Atlanta, GA
1000 Abernathy Road
Atlanta, GA
Illinois
One North LaSalle Street
Chicago, IL
875 North Michigan Ave.
Chicago, IL
1415 West 22nd Street
Oak Brook, IL
|
1700 East Golf Road
Schaumburg, IL
3232 Lake Avenue
Wilmette, IL
Indiana
4729 East 82nd Street
Indianapolis, IN
Kansas
5400 College Boulevard
Overland Park, KS
Maine
Three Canal Plaza
Portland, ME
Maryland
7315 Wisconsin Avenue
Bethesda, MD
One W. Pennsylvania Ave.
Towson, MD
Massachusetts
801 Boylston Street
Boston, MA
155 Congress Street
Boston, MA
300 Granite Street
Braintree, MA
44 Mall Road
Burlington, MA
405 Cochituate Road
Framingham, MA
416 Belmont Street
Worcester, MA
Michigan
500 E. Eisenhower Pkwy.
Ann Arbor, MI
280 Old N. Woodward Ave.
Birmingham, MI
43420 Grand River Avenue
Novi, MI
29155 Northwestern Hwy.
Southfield, MI
Minnesota
7600 France Avenue South
Edina, MN
Missouri
8885 Ladue Road
Ladue, MO
|
Semiannual Report 36
Nevada
2225 Village Walk Drive
Henderson, NV
New Jersey
150 Essex Street
Millburn, NJ
56 South Street
Morristown, NJ
396 Route 17, North
Paramus, NJ
3518 Route 1 North
Princeton, NJ
530 Highway 35
Shrewsbury, NJ
New York
1055 Franklin Avenue
Garden City, NY
37 West Jericho Turnpike
Huntington Station, NY
1271 Avenue of the Americas
New York, NY
61 Broadway
New York, NY
350 Park Avenue
New York, NY
200 Fifth Avenue
New York, NY
733 Third Avenue
New York, NY
11 Penn Plaza
New York, NY
2070 Broadway
New York, NY
1075 Northern Blvd.
Roslyn, NY
North Carolina
4611 Sharon Road
Charlotte, NC
Ohio
3805 Edwards Road
Cincinnati, OH
1324 Polaris Parkway
Columbus, OH
28699 Chagrin Boulevard
Woodmere Village, OH
Oregon
16850 SW 72nd Avenue
Tigard, OR
|
Pennsylvania
600 West DeKalb Pike
King of Prussia, PA
1735 Market Street
Philadelphia, PA
12001 Perry Highway
Wexford, PA
Rhode Island
47 Providence Place
Providence, RI
Tennessee
6150 Poplar Avenue
Memphis, TN
Texas
10000 Research Boulevard
Austin, TX
4001 Northwest Parkway
Dallas, TX
12532 Memorial Drive
Houston, TX
2701 Drexel Drive
Houston, TX
6500 N. MacArthur Blvd.
Irving, TX
6005 West Park Boulevard
Plano, TX
14100 San Pedro
San Antonio, TX
1576 East Southlake Blvd.
Southlake, TX
19740 IH 45 North
Spring, TX
Utah
215 South State Street
Salt Lake City, UT
Virginia
1861 International Drive
McLean, VA
Washington
411 108th Avenue, N.E.
Bellevue, WA
1518 6th Avenue
Seattle, WA
Washington, DC
1900 K Street, N.W.
Washington, DC
Wisconsin
595 North Barker Road
Brookfield, WI
|
Fidelity Brokerage Services, Inc., 100 Summer St., Boston, MA 02110 Member NYSE/SIPC
37 Semiannual Report
37
To Write Fidelity
We’ll give your correspondence immediate attention and send you written confirmation upon completion of your request.

(such as changing name, address, bank, etc.)
Fidelity Investments
P.O. Box 770001
Cincinnati, OH 45277-0002
|

| | Buying shares
Fidelity Investments
P.O. Box 770001
Cincinnati, OH 45277-0003
Overnight Express
Fidelity Investments
Attn: Distribution Services
100 Crosby Parkway KC1H
Covington, KY 41015
Selling shares
Fidelity Investments
P.O. Box 770001
Cincinnati, OH 45277-0035
Overnight Express
Fidelity Investments
Attn: Distribution Services
100 Crosby Parkway KC1H
Covington, KY 41015
General Correspondence
Fidelity Investments
P.O. Box 500
Merrimack, NH 03054-0500
|

| | Buying shares
Fidelity Investments
P.O. Box 770001
Cincinnati, OH 45277-0003
Selling shares
Fidelity Investments
P.O. Box 770001
Cincinnati, OH 45277-0035
Overnight Express
Fidelity Investments
Attn: Distribution Services
100 Crosby Parkway KC1H
Covington, KY 41015
General Correspondence
Fidelity Investments
P.O. Box 500
Merrimack, NH 03054-0500
|
Semiannual Report 38
39 Semiannual Report
Investment Adviser
Fidelity Management & Research Company
Boston, MA
Investment Sub Advisers
FMR Co., Inc.
Fidelity Research & Analysis Company
(formerly Fidelity Management &
Research (Far East) Inc.)
Fidelity Management & Research
(U.K.) Inc.
Fidelity Investments Japan Limited
Fidelity International Investment
Advisors
Fidelity International Investment
Advisors (U.K.) Limited
General Distributor
Fidelity Distributors Corporation
Boston, MA
Transfer and Service Agent
Fidelity Service Company, Inc.
Boston, MA
Custodian
Citibank, N.A.
New York, NY
|
| The Fidelity Telephone Connection |
| Mutual Fund 24-Hour Service |
| Exchanges/Redemptions | | |
| and Account Assistance | | 1-800-544-6666 |
| Product Information | | 1-800-544-6666 |
| Retirement Accounts | | 1-800-544-4774 |
| (8 a.m. - 9 p.m.) | | |
| TDD Service | | 1-800-544-0118 |
| for the deaf and hearing impaired |
| (9 a.m. - 9 p.m. Eastern time) |
| Fidelity Automated Service | | |
| Telephone (FAST®) (automated phone logo) | | 1-800-544-5555 |
| (automated phone logo) Automated line for quickest service |
SCP-USAN-0306
1.803699.101
|


Fidelity Advisor
Small Cap Growth
Fund - Class A, Class T,
Class B and Class C
|
| | Semiannual Report
January 31, 2006
|

Class A, Class T, Class B, and Class C are classes of Fidelity® Small Cap Growth Fund
| Contents | | | | |
| |
| Chairman’s Message | | 3 | | Ned Johnson’s message to shareholders. |
| Shareholder Expense | | 4 | | An example of shareholder expenses. |
| Example | | | | |
| Investment Changes | | 6 | | A summary of the fund’s investments. |
| Investments | | 7 | | A complete list of the fund’s investments |
| | | | | with their market values. |
| Financial Statements | | 14 | | Statements of assets and liabilities, |
| | | | | operations, and changes in net assets, |
| | | | | as well as financial highlights. |
| Notes | | 24 | | Notes to the financial statements. |
| Board Approval of | | 33 | | |
| Investment Advisory | | | | |
| Contracts and | | | | |
| Management Fees | | | | |
To view a fund’s proxy voting guidelines and proxy voting record for the 12 month period ended
June 30, visit www.fidelity.com/proxyvotingresults or visit the Securities and Exchange Commis
sion’s (SEC) web site at www.sec.gov. You may also call 1-877-208-0098 to request a free copy of
the proxy voting guidelines.
Standard & Poor’s, S&P and S&P 500 are registered service marks of The McGraw Hill Companies,
Inc. and have been licensed for use by Fidelity Distributors Corporation.
Other third party marks appearing herein are the property of their respective owners.
All other marks appearing herein are registered or unregistered trademarks or service marks
of FMR Corp. or an affiliated company.
|
| | This report and the financial statements contained herein are submitted for the general information
of the shareholders of the fund. This report is not authorized for distribution to prospective investors
in the fund unless preceded or accompanied by an effective prospectus.
A fund files its complete schedule of portfolio holdings with the SEC for the first and third
quarters of each fiscal year on Form N Q. Forms N Q are available on the SEC’s web site at
http://www.sec.gov. A fund’s Forms N Q may be reviewed and copied at the SEC’s Public Reference
Room in Washington, DC. Information regarding the operation of the SEC’s Public Reference
Room may be obtained by calling 1-800-SEC-0330. For a complete list of a fund’s portfolio hold
ings, view the most recent quarterly holdings report, semiannual report, or annual report on
Fidelity’s web site at http://www.advisor.fidelity.com.
NOT FDIC INSURED · MAY LOSE VALUE · NO BANK GUARANTEE
Neither the fund nor Fidelity Distributors Corporation is a bank.
|
Chairman’s Message
(photograph of Edward C. Johnson 3d)
Dear Shareholder:
During the past year or so, much has been reported about the mutual fund industry, and much of it has been more critical than I believe is warranted. Allegations that some companies have been less than forthright with their shareholders have cast a shadow on the entire industry. I continue to find these reports disturbing, and assert that they do not create an accurate picture of the industry overall. Therefore, I would like to remind every one where Fidelity stands on these issues. I will say two things specifically regarding allegations that some mutual fund companies were in violation of the Securities and Exchange Commission’s forward pricing rules or were involved in so called “market timing” activities.
First, Fidelity has no agreements that permit customers who buy fund shares after 4 p.m. to obtain the 4 p.m. price. This is not a new policy. This is not to say that some one could not deceive the company through fraudulent acts. However, we are extremely diligent in preventing fraud from occurring in this manner and in every other. But I underscore again that Fidelity has no so called “agreements” that sanction illegal practices.
Second, Fidelity continues to stand on record, as we have for years, in opposition to predatory short term trading that adversely affects shareholders in a mutual fund. Back in the 1980s, we initiated a fee which is returned to the fund and, therefore, to investors to discourage this activity. Further, we took the lead several years ago in developing a Fair Value Pricing Policy to prevent market timing on foreign securities in our funds. I am confident we will find other ways to make it more difficult for predatory traders to operate. However, this will only be achieved through close cooperation among regulators, legislators and the industry.
Yes, there have been unfortunate instances of unethical and illegal activity within the mutual fund industry from time to time. That is true of any industry. When this occurs, confessed or convicted offenders should be dealt with appropriately. But we are still concerned about the risk of over regulation and the quick application of simplistic solutions to intricate problems. Every system can be improved, and we support and applaud well thought out improvements by regulators, legislators and industry representatives that achieve the common goal of building and protecting the value of investors’ holdings.
For nearly 60 years, Fidelity has worked very hard to improve its products and service to justify your trust. When our family founded this company in 1946, we had only a few hundred customers. Today, we serve more than 18 million customers including individual investors and participants in retirement plans across America.
Let me close by saying that we do not take your trust in us for granted, and we realize that we must always work to improve all aspects of our service to you. In turn, we urge you to continue your active participation with your financial matters, so that your interests can be well served.
Best regards,
/s/ Edward C. Johnson 3d
Edward C. Johnson 3d
3 Semiannual Report
Shareholder Expense Example
As a shareholder of the Fund, you incur two types of costs: (1) transaction costs, including sales charges (loads) on purchase payments or redemption proceeds, redemption fees, and (2) ongoing costs, including management fees, distribution and/or service (12b 1) fees and other Fund expenses. This Example is intended to help you understand your ongoing costs (in dollars) of investing in the Fund and to compare these costs with the ongoing costs of investing in other mutual funds.
The Example is based on an investment of $1,000 invested at the beginning of the period and held for the entire period (August 1, 2005 to January 31, 2006).
The first line of the table below for each class of the Fund provides information about actual account values and actual expenses. You may use the information in this line, together with the amount you invested, to estimate the expenses that you paid over the period. Simply divide your account value by $1,000.00 (for example, an $8,600 account value divided by $1,000.00 = 8.6), then multiply the result by the number in the first line for a class of the Fund under the heading entitled “Expenses Paid During Period” to estimate the expenses you paid on your account during this period. A small balance maintenance fee of $12.00 that is charged once a year may apply for certain accounts with a value of less than $2,000. This fee is not included in the table below. If it was, the estimate of expenses you paid during the period would be higher, and your ending account value lower, by this amount.
Hypothetical Example for Comparison Purposes
The second line of the table below for each class of the Fund provides information about hypothetical account values and hypothetical expenses based on a Class’ actual expense ratio and an assumed rate of return of 5% per year before expenses, which is not the Class’ actual return. The hypothetical account values and expenses may not be used to estimate the actual ending account balance or expenses you paid for the period. You may use this informa tion to compare the ongoing costs of investing in the Fund and other funds. To do so, compare this 5% hypothetical example with the 5% hypothetical examples that appear in the shareholder reports of the other funds. A small balance maintenance fee of $12.00 that is charged once a year may apply for certain accounts with a value of less than $2,000. This fee is not included in the table below. If it was, the estimate of expenses you paid during the period would be higher, and your ending account value lower, by this amount.
Please note that the expenses shown in the table are meant to highlight your ongoing costs only and do not reflect any transaction costs. Therefore, the second line of the table is useful in comparing ongoing costs only, and will not help you determine the relative total costs of owning different funds. In addition, if these transactional costs were included, your costs would have been higher.
| | | | | | | | | | | Expenses Paid |
| | | | | Beginning | | Ending | | During Period* |
| | | | | Account Value | | Account Value | | August 1, 2005 to |
| | | | | August 1, 2005 | | January 31, 2006 | | January 31, 2006 |
| Class A | | | | | | | | | | | | |
| Actual | | | $ | 1,000.00 | | $ | | 1,086.80 | | $ | | 7.36 |
| HypotheticalA | | | $ | 1,000.00 | | $ | | 1,018.15 | | $ | | 7.12 |
| Class T | | | | | | | | | | | | |
| Actual | | | $ | 1,000.00 | | $ | | 1,085.30 | | $ | | 8.67 |
| HypotheticalA | | | $ | 1,000.00 | | $ | | 1,016.89 | | $ | | 8.39 |
| Class B | | | | | | | | | | | | |
| Actual | | | $ | 1,000.00 | | $ | | 1,083.40 | | $ | | 11.29 |
| HypotheticalA | | | $ | 1,000.00 | | $ | | 1,014.37 | | $ | | 10.92 |
| Class C | | | | | | | | | | | | |
| Actual | | | $ | 1,000.00 | | $ | | 1,082.90 | | $ | | 11.29 |
| HypotheticalA | | | $ | 1,000.00 | | $ | | 1,014.37 | | $ | | 10.92 |
| Small Cap Growth | | | | | | | | | | | | |
| Actual | | | $ | 1,000.00 | | $ | | 1,089.00 | | $ | | 5.69 |
| HypotheticalA | | | $ | 1,000.00 | | $ | | 1,019.76 | | $ | | 5.50 |
| Institutional Class | | | | | | | | | | | | |
| Actual | | | $ | 1,000.00 | | $ | | 1,088.70 | | $ | | 6.00 |
| HypotheticalA | | | $ | 1,000.00 | | $ | | 1,019.46 | | $ | | 5.80 |
| |
| A 5% return per year before expenses | | | | | | | | |
* Expenses are equal to each Class’ annualized expense ratio (shown in the table below); multiplied by the average account value over the period, multiplied by 184/365 (to reflect the one half year period).
| | | Annualized |
| | | Expense Ratio |
| Class A | | 1.40% |
| Class T | | 1.65% |
| Class B | | 2.15% |
| Class C | | 2.15% |
| Small Cap Growth | | 1.08% |
| Institutional Class | | 1.14% |
5 Semiannual Report
| Investment Changes | | | | |
| |
| |
| Top Ten Stocks as of January 31, 2006 | | | | |
| | | % of fund’s | | % of fund’s net assets |
| | | net assets | | 6 months ago |
| Lifetime Brands, Inc. | | 3.0 | | 0.9 |
| NBTY, Inc. | | 2.4 | | 1.8 |
| VistaCare, Inc. Class A | | 2.3 | | 0.0 |
| Pacific Sunwear of California, Inc. | | 2.2 | | 2.2 |
| Timberland Co. Class A | | 2.2 | | 0.0 |
| Omnicare, Inc. | | 2.1 | | 1.7 |
| Hilb Rogal & Hobbs Co. | | 2.1 | | 1.4 |
| American Medical Systems Holdings, Inc. | | 2.0 | | 0.0 |
| Abaxis, Inc. | | 1.9 | | 2.0 |
| Chemed Corp. | | 1.8 | | 0.0 |
| | | 22.0 | | |
Top Five Market Sectors as of January 31, 2006 | | |
| | | % of fund’s | | % of fund’s net assets |
| | | net assets | | 6 months ago |
| Information Technology | | 22.5 | | 24.1 |
| Health Care | | 19.9 | | 13.3 |
| Consumer Discretionary | | 18.7 | | 27.0 |
| Energy | | 11.1 | | 9.1 |
| Industrials | | 10.5 | | 10.0 |
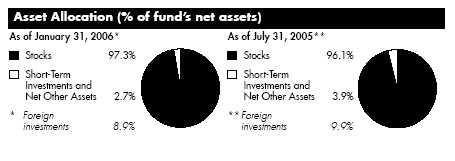
Semiannual Report 6
| Investments January 31, 2006 (Unaudited) |
| Showing Percentage of Net Assets | | | | |
| |
| Common Stocks 97.3% | | | | |
| | | Shares | | Value (Note 1) |
| |
| CONSUMER DISCRETIONARY – 18.7% | | | | |
| Distributors – 0.5% | | | | |
| Prestige Brands Holdings, Inc. | | 145,000 | | $ 1,802,350 |
| Diversified Consumer Services – 1.1% | | | | |
| Education Management Corp. (a) | | 49,900 | | 1,527,938 |
| Matthews International Corp. Class A | | 72,060 | | 2,694,323 |
| | | | | 4,222,261 |
| Hotels, Restaurants & Leisure 3.3% | | | | |
| CEC Entertainment, Inc. (a) | | 195,800 | | 7,052,716 |
| Domino’s Pizza, Inc. | | 247,100 | | 6,155,261 |
| | | | | 13,207,977 |
| Household Durables – 4.7% | | | | |
| Helen of Troy Ltd. (a) | | 210,000 | | 4,023,600 |
| Lenox Group, Inc. (a) | | 203,300 | | 2,775,045 |
| Lifetime Brands, Inc. | | 548,977 | | 11,995,146 |
| | | | | 18,793,791 |
| Internet & Catalog Retail 0.6% | | | | |
| GSI Commerce, Inc. (a) | | 135,000 | | 2,277,450 |
| Specialty Retail – 4.9% | | | | |
| Big 5 Sporting Goods Corp. | | 102,300 | | 2,207,634 |
| Eddie Bauer Holdings, Inc. (a) | | 315,000 | | 4,725,000 |
| Finish Line, Inc. Class A | | 210,000 | | 3,769,500 |
| Pacific Sunwear of California, Inc. (a) | | 361,000 | | 8,848,110 |
| | | | | 19,550,244 |
| Textiles, Apparel & Luxury Goods – 3.6% | | | | |
| Fossil, Inc. (a) | | 239,468 | | 5,675,392 |
| Timberland Co. Class A (a) | | 250,000 | | 8,740,000 |
| | | | | 14,415,392 |
| |
| TOTAL CONSUMER DISCRETIONARY | | | | 74,269,465 |
| |
| CONSUMER STAPLES 2.4% | | | | |
| Personal Products 2.4% | | | | |
| NBTY, Inc. (a) | | 454,500 | | 9,403,605 |
| ENERGY 11.1% | | | | |
| Energy Equipment & Services – 4.4% | | | | |
| Basic Energy Services, Inc. | | 58,300 | | 1,635,315 |
| Hornbeck Offshore Services, Inc. (a) | | 101,000 | | 4,017,780 |
| Maverick Tube Corp. (a) | | 45,000 | | 2,153,250 |
| Oil States International, Inc. (a) | | 94,200 | | 3,852,780 |
| |
| See accompanying notes which are an integral part of the financial statements. | | |
| |
| 7 | | Semiannual Report |
| Investments (Unaudited) continued | | | | | | |
| |
| |
| Common Stocks continued | | | | | | |
| | | Shares | | Value (Note 1) |
| |
| ENERGY – continued | | | | | | |
| Energy Equipment & Services – continued | | | | | | |
| Pason Systems, Inc. | | 109,600 | | $ | | 3,374,750 |
| Superior Energy Services, Inc. (a) | | 98,000 | | | | 2,660,700 |
| | | | | | | 17,694,575 |
| Oil, Gas & Consumable Fuels – 6.7% | | | | | | |
| Comstock Resources, Inc. (a) | | 116,000 | | | | 3,712,000 |
| Forest Oil Corp. (a) | | 77,800 | | | | 4,006,700 |
| Frontier Oil Corp. | | 65,000 | | | | 3,080,350 |
| Holly Corp. | | 80,200 | | | | 5,902,720 |
| Mariner Energy, Inc. (a)(e) | | 75,000 | | | | 1,518,750 |
| OMI Corp. | | 182,500 | | | | 3,204,700 |
| Range Resources Corp. | | 168,150 | | | | 5,022,641 |
| | | | | | | 26,447,861 |
| |
| TOTAL ENERGY | | | | | | 44,142,436 |
| |
| FINANCIALS – 6.6% | | | | | | |
| Consumer Finance – 1.4% | | | | | | |
| World Acceptance Corp. (a) | | 193,500 | | | | 5,487,660 |
| Insurance – 5.2% | | | | | | |
| American Equity Investment Life Holding Co. | | 375,000 | | | | 5,268,750 |
| Aspen Insurance Holdings Ltd. | | 192,000 | | | | 4,450,560 |
| Hilb Rogal & Hobbs Co. | | 212,800 | | | | 8,273,664 |
| USI Holdings Corp. (a) | | 178,800 | | | | 2,517,504 |
| | | | | | | 20,510,478 |
| |
| TOTAL FINANCIALS | | | | | | 25,998,138 |
| |
| HEALTH CARE – 19.9% | | | | | | |
| Health Care Equipment & Supplies – 6.5% | | | | | | |
| Abaxis, Inc. (a) | | 370,000 | | | | 7,370,400 |
| American Medical Systems Holdings, Inc. (a) | | 354,300 | | | | 8,028,438 |
| Cholestech Corp. (a) | | 130,000 | | | | 1,405,300 |
| DJ Orthopedics, Inc. (a) | | 124,900 | | | | 4,100,467 |
| Regeneration Technologies, Inc. (a) | | 627,000 | | | | 4,953,300 |
| | | | | | | 25,857,905 |
| Health Care Providers & Services – 12.4% | | | | | | |
| America Service Group, Inc. (a) | | 253,500 | | | | 4,626,375 |
| American Dental Partners, Inc. (a) | | 25,649 | | | | 420,644 |
| AmSurg Corp. (a) | | 40,700 | | | | 882,783 |
| Chemed Corp. | | 134,000 | | | | 7,123,440 |
See accompanying notes which are an integral part of the financial statements.
| Common Stocks continued | | | | | | |
| | | Shares | | Value (Note 1) |
| |
| HEALTH CARE – continued | | | | | | |
| Health Care Providers & Services – continued | | | | | | |
| ICON PLC sponsored ADR (a) | | 63,995 | | | | $ 2,814,500 |
| Odyssey Healthcare, Inc. (a) | | 310,000 | | | | 6,317,800 |
| Omnicare, Inc. | | 170,500 | | | | 8,473,850 |
| Per-Se Technologies, Inc. (a) | | 281,400 | | | | 6,998,418 |
| VCA Antech, Inc. (a) | | 95,800 | | | | 2,650,786 |
| VistaCare, Inc. Class A (a) | | 653,400 | | | | 9,088,794 |
| | | | | | | 49,397,390 |
| Pharmaceuticals – 1.0% | | | | | | |
| Medicis Pharmaceutical Corp. Class A | | 124,500 | | | | 3,848,295 |
| |
| TOTAL HEALTH CARE | | | | | | 79,103,590 |
| |
| INDUSTRIALS – 10.5% | | | | | | |
| Aerospace & Defense – 0.8% | | | | | | |
| BE Aerospace, Inc. (a) | | 155,300 | | | | 3,264,406 |
| Building Products 0.6% | | | | | | |
| Quixote Corp. | | 119,050 | | | | 2,532,194 |
| Commercial Services & Supplies – 3.4% | | | | | | |
| CDI Corp. | | 70,000 | | | | 1,908,900 |
| McGrath RentCorp. | | 83,000 | | | | 2,694,180 |
| Navigant Consulting, Inc. (a) | | 125,700 | | | | 2,855,904 |
| PeopleSupport, Inc. (a) | | 236,100 | | | | 2,450,718 |
| Tele Atlas NV (a) | | 129,500 | | | | 3,528,490 |
| | | | | | | 13,438,192 |
| Construction & Engineering – 0.4% | | | | | | |
| Comfort Systems USA, Inc. | | 151,500 | | | | 1,592,265 |
| Electrical Equipment – 1.9% | | | | | | |
| C&D Technologies, Inc. | | 384,110 | | | | 3,188,113 |
| Genlyte Group, Inc. (a) | | 76,000 | | | | 4,395,840 |
| | | | | | | 7,583,953 |
| Industrial Conglomerates – 0.5% | | | | | | |
| Raven Industries, Inc. | | 60,000 | | | | 1,896,000 |
| Machinery – 1.6% | | | | | | |
| Greenbrier Companies, Inc. | | 100,000 | | | | 3,545,000 |
| Watts Water Technologies, Inc. Class A | | 86,600 | | | | 2,916,688 |
| | | | | | | 6,461,688 |
See accompanying notes which are an integral part of the financial statements.
| Investments (Unaudited) continued | | | | | | |
| |
| |
| Common Stocks continued | | | | | | | | |
| | | | | Shares | | Value (Note 1) |
| |
| INDUSTRIALS – continued | | | | | | | | |
| Trading Companies & Distributors – 1.3% | | | | | | |
| WESCO International, Inc. (a) | | | | 105,000 | | | | $ 5,032,650 |
| |
| TOTAL INDUSTRIALS | | | | | | | | 41,801,348 |
| |
| INFORMATION TECHNOLOGY – 22.5% | | | | | | | | |
| Communications Equipment – 3.5% | | | | | | | | |
| Avocent Corp. (a) | | | | 110,000 | | | | 3,659,700 |
| F5 Networks, Inc. (a) | | | | 28,000 | | | | 1,811,600 |
| Harris Corp. | | | | 112,000 | | | | 5,200,160 |
| Ixia (a) | | | | 181,800 | | | | 2,290,680 |
| MasTec, Inc. (a) | | | | 85,000 | | | | 1,024,250 |
| | | | | | | | | 13,986,390 |
| Computers & Peripherals – 1.6% | | | | | | | | |
| Avid Technology, Inc. (a) | | | | 72,500 | | | | 3,601,075 |
| Mobility Electronics, Inc. (a) | | | | 245,800 | | | | 2,575,984 |
| | | | | | | | | 6,177,059 |
| Electronic Equipment & Instruments – 3.9% | | | | | | |
| Cogent, Inc. (a) | | | | 137,000 | | | | 3,292,110 |
| FARO Technologies, Inc. (a) | | | | 135,393 | | | | 2,156,810 |
| ScanSource, Inc. (a) | | | | 46,200 | | | | 2,717,022 |
| Trimble Navigation Ltd. (a) | | | | 83,000 | | | | 3,321,660 |
| Xyratex Ltd. (a) | | | | 178,700 | | | | 4,033,259 |
| | | | | | | | | 15,520,861 |
| Internet Software & Services – 1.8% | | | | | | | | |
| Digital River, Inc. (a)(d) | | | | 98,600 | | | | 3,310,988 |
| j2 Global Communications, Inc. (a) | | | | 79,900 | | | | 3,815,225 |
| | | | | | | | | 7,126,213 |
| IT Services – 4.2% | | | | | | | | |
| CACI International, Inc. Class A (a) | | | | 42,700 | | | | 2,438,170 |
| Lionbridge Technologies, Inc. (a) | | | | 923,846 | | | | 7,048,945 |
| SI International, Inc. (a) | | | | 153,700 | | | | 4,674,017 |
| TALX Corp. | | | | 84,825 | | | | 2,658,416 |
| | | | | | | | | 16,819,548 |
| Office Electronics – 0.9% | | | | | | | | |
| Zebra Technologies Corp. Class A (a) | | | | 78,000 | | | | 3,512,340 |
| Semiconductors & Semiconductor Equipment – 3.3% | | | | | | |
| California Micro Devices Corp. (a) | | | | 204,000 | | | | 1,362,720 |
| Cascade Microtech, Inc. (a) | | | | 247,861 | | | | 3,507,233 |
| Entegris, Inc. (a) | | | | 255,000 | | | | 2,677,500 |
See accompanying notes which are an integral part of the financial statements.
| Common Stocks continued | | | | |
| | | Shares | | Value (Note 1) |
| |
| INFORMATION TECHNOLOGY – continued | | | | |
| Semiconductors & Semiconductor Equipment – continued | | | | |
| O2Micro International Ltd. sponsored ADR (a) | | 302,200 | | $ 3,287,936 |
| Silicon Laboratories, Inc. (a) | | 47,000 | | 2,313,810 |
| | | | | 13,149,199 |
| Software 3.3% | | | | |
| Blackbaud, Inc. | | 180,859 | | 3,108,966 |
| Bottomline Technologies, Inc. (a) | | 188,200 | | 2,168,064 |
| Cognos, Inc. (a) | | 65,000 | | 2,516,792 |
| DATATRAK International, Inc. (a)(f) | | 15,000 | | 136,500 |
| DATATRAK International, Inc. warrants 12/23/07 (a)(f) | | 2,250 | | 0 |
| Hyperion Solutions Corp. (a) | | 77,900 | | 2,680,539 |
| Moldflow Corp. (a) | | 157,200 | | 2,114,340 |
| NAVTEQ Corp. (a) | | 5,000 | | 224,550 |
| | | | | 12,949,751 |
| |
| TOTAL INFORMATION TECHNOLOGY | | | | 89,241,361 |
| |
| MATERIALS 4.2% | | | | |
| Chemicals – 0.8% | | | | |
| Chemtura Corp. | | 240,000 | | 3,016,800 |
| Containers & Packaging – 0.3% | | | | |
| Myers Industries, Inc. | | 95,000 | | 1,425,000 |
| Metals & Mining – 3.1% | | | | |
| Allegheny Technologies, Inc. | | 45,000 | | 2,333,250 |
| Apex Silver Mines Ltd. (a) | | 95,000 | | 1,522,850 |
| Carpenter Technology Corp. | | 25,000 | | 2,264,000 |
| Meridian Gold, Inc. (a) | | 118,100 | | 3,188,529 |
| Oregon Steel Mills, Inc. (a) | | 73,100 | | 3,009,527 |
| | | | | 12,318,156 |
| |
| TOTAL MATERIALS | | | | 16,759,956 |
| |
| TELECOMMUNICATION SERVICES – 0.5% | | | | |
| Diversified Telecommunication Services – 0.5% | | | | |
| FairPoint Communications, Inc. | | 184,000 | | 2,165,680 |
| |
| UTILITIES – 0.9% | | | | |
| Multi-Utilities – 0.9% | | | | |
| CMS Energy Corp. (a) | | 243,600 | | 3,524,892 |
| TOTAL COMMON STOCKS | | | | |
| (Cost $338,492,380) | | | | 386,410,471 |
See accompanying notes which are an integral part of the financial statements.
11 Semiannual Report
| Investments (Unaudited) continued | | | | | | |
| |
| Money Market Funds 4.3% | | | | | | | | |
| | | | | Shares | | | | Value (Note 1) |
| Fidelity Cash Central Fund, 4.46% (b) | | | | 16,270,904 | | | | $ 16,270,904 |
| Fidelity Securities Lending Cash Central Fund, 4.48% (b)(c) | | | | 630,000 | | | | 630,000 |
| TOTAL MONEY MARKET FUNDS | | | | | | | | |
| (Cost $16,900,904) | | | | | | | | 16,900,904 |
| TOTAL INVESTMENT PORTFOLIO 101.6% | | | | | | |
| (Cost $355,393,284) | | | | | | | | 403,311,375 |
| |
| NET OTHER ASSETS – (1.6)% | | | | | | | | (6,279,405) |
| NET ASSETS 100% | | | | | | | | $ 397,031,970 |
Legend
(a) Non-income producing
(b) Affiliated fund that is available only to
investment companies and other
accounts managed by Fidelity
Investments. The rate quoted is the
annualized seven-day yield of the fund
at period end. A complete unaudited
listing of the fund’s holdings as of its
most recent quarter end is available
upon request.
(c) Investment made with cash collateral
received from securities on loan.
(d) Security or a portion of the security is on
loan at period end.
(e) Security exempt from registration under
Rule 144A of the Securities Act of 1933.
These securities may be resold in
transactions exempt from registration,
normally to qualified institutional buyers.
At the period end, the value of these
securities amounted to $1,518,750 or
0.4% of net assets.
|
(f) Restricted securities – Investment in
securities not registered under the
Securities Act of 1933 (excluding 144A
issues). At the end of the period, the
value of restricted securities (excluding
144A issues) amounted to $136,500 or
0.0% of net assets.
|
Additional information on each holding is as follows:
| | | Acquisition | | | | Acquisition |
| Security | | Date | | | | Cost |
| DATATRAK | | | | | | |
| International, Inc. | | 12/27/04 | | | $ | 95,000 |
| DATATRAK | | | | | | |
| International, Inc. | | | | | | |
| warrants | | | | | | |
| 12/23/07 | | 12/27/04 | | | $ | 0 |
See accompanying notes which are an integral part of the financial statements.
Semiannual Report 12
Affiliated Central Funds
Information regarding fiscal year to date income received by the fund from the affiliated Central funds is as follows:
| Fund | | Income received |
| Fidelity Cash Central Fund | | $ | | 225,025 |
| Fidelity Securities Lending Cash Central Fund | | | | 12,921 |
| Total | | $ | | 237,946 |
See accompanying notes which are an integral part of the financial statements.
13 Semiannual Report
| Financial Statements | | | | | | |
| |
| |
| Statement of Assets and Liabilities | | | | | | |
| | | | | January 31, 2006 (Unaudited) |
| |
| Assets | | | | | | |
| Investment in securities, at value (including securities | | | | | | |
| loaned of $604,440) See accompanying schedule: | | | | | | |
| Unaffiliated issuers (cost $338,492,380) | | | $ | 386,410,471 | | |
| Affiliated Central Funds (cost $16,900,904) | | | | 16,900,904 | | |
| Total Investments (cost $355,393,284) | | | | | $ | 403,311,375 |
| Receivable for investments sold | | | | | | 2,190,200 |
| Receivable for fund shares sold | | | | | | 4,326,329 |
| Dividends receivable | | | | | | 11,353 |
| Interest receivable | | | | | | 61,021 |
| Prepaid expenses | | | | | | 827 |
| Receivable from investment adviser for expense | | | | | | |
| reductions | | | | | | 2,361 |
| Other affiliated receivables | | | | | | 377 |
| Other receivables | | | | | | 50,442 |
| Total assets | | | | | | 409,954,285 |
| |
| Liabilities | | | | | | |
| Payable for investments purchased | | | $ | 11,543,669 | | |
| Payable for fund shares redeemed | | | | 399,298 | | |
| Accrued management fee | | | | 247,387 | | |
| Distribution fees payable | | | | 19,161 | | |
| Other affiliated payables | | | | 61,939 | | |
| Other payables and accrued expenses | | | | 20,861 | | |
| Collateral on securities loaned, at value | | | | 630,000 | | |
| Total liabilities | | | | | | 12,922,315 |
| |
| Net Assets | | | | | $ | 397,031,970 |
| Net Assets consist of: | | | | | | |
| Paid in capital | | | | | $ | 348,795,652 |
| Accumulated net investment loss | | | | | | (567,617) |
| Accumulated undistributed net realized gain (loss) on | | | | | | |
| investments and foreign currency transactions | | | | | | 885,844 |
| Net unrealized appreciation (depreciation) on | | | | | | |
| investments | | | | | | 47,918,091 |
| Net Assets | | | | | $ | 397,031,970 |
See accompanying notes which are an integral part of the financial statements.
| Statement of Assets and Liabilities continued | | | | |
| | | January 31, 2006 (Unaudited) |
| |
| Calculation of Maximum Offering Price | | | | |
| Class A: | | | | |
| Net Asset Value and redemption price per share | | | | |
| ($11,765,393 ÷ 846,214 shares) | | $ | | 13.90 |
| Maximum offering price per share (100/94.25 of $13.90) | | $ | | 14.75 |
| Class T: | | | | |
| Net Asset Value and redemption price per share | | | | |
| ($11,926,676 ÷ 858,754 shares) | | $ | | 13.89 |
| Maximum offering price per share (100/96.50 of $13.89) | | $ | | 14.39 |
| Class B: | | | | |
| Net Asset Value and offering price per share | | | | |
| ($3,765,243 ÷ 271,911 shares)A | | $ | | 13.85 |
| Class C: | | | | |
| Net Asset Value and offering price per share | | | | |
| ($12,717,435 ÷ 918,993 shares)A | | $ | | 13.84 |
| Small Cap Growth: | | | | |
| Net Asset Value, offering price and redemption price per | | | | |
| share ($348,213,351 ÷ 24,986,050 shares) | | $ | | 13.94 |
| Institutional Class: | | | | |
| Net Asset Value, offering price and redemption price per | | | | |
| share ($8,643,872 ÷ 620,622 shares) | | $ | | 13.93 |
A Redemption price per share is equal to net asset value less any applicable contingent deferred sales charge. | | |
See accompanying notes which are an integral part of the financial statements.
15 Semiannual Report
| Financial Statements continued | | | | |
| |
| |
| Statement of Operations | | | | | | |
| | | Six months ended January 31, 2006 (Unaudited) |
| |
| Investment Income | | | | | | |
| Dividends | | | | | $ | 550,063 |
| Special dividends | | | | | | 241,463 |
| Interest | | | | | | 209 |
| Income from affiliated Central Funds | | | | | | 237,946 |
| Total income | | | | | | 1,029,681 |
| |
| Expenses | | | | | | |
| Management fee | | | | | | |
| Basic fee | | | $ | 1,057,561 | | |
| Performance adjustment | | | | 88,173 | | |
| Transfer agent fees | | | | 272,923 | | |
| Distribution fees | | | | 91,254 | | |
| Accounting and security lending fees | | | | 60,870 | | |
| Independent trustees’ compensation | | | | 565 | | |
| Custodian fees and expenses | | | | 9,885 | | |
| Registration fees | | | | 95,173 | | |
| Audit | | | | 19,163 | | |
| Legal | | | | 7,169 | | |
| Miscellaneous | | | | 692 | | |
| Total expenses before reductions | | | | 1,703,428 | | |
| Expense reductions | | | | (121,101) | | 1,582,327 |
| |
| Net investment income (loss) | | | | | | (552,646) |
| Realized and Unrealized Gain (Loss) | | | | |
| Net realized gain (loss) on: | | | | | | |
| Investment securities: | | | | | | |
| Unaffiliated issuers | | | | 2,019,029 | | |
| Foreign currency transactions | | | | (5,892) | | |
| Total net realized gain (loss) | | | | | | 2,013,137 |
| Change in net unrealized appreciation (depreciation) on: | | | | |
| Investment securities | | | | 28,330,105 | | |
| Assets and liabilities in foreign currencies | | 32 | | |
| Total change in net unrealized appreciation | | | | |
| (depreciation) | | | | | | 28,330,137 |
| Net gain (loss) | | | | | | 30,343,274 |
| Net increase (decrease) in net assets resulting from | | | | |
| operations | | | | | $ | 29,790,628 |
See accompanying notes which are an integral part of the financial statements.
| Statement of Changes in Net Assets | | | | | | | | |
| | | | | | | For the period |
| | | | | | | November 3, 2004 |
| | | Six months ended | | (commencement |
| | | January 31, 2006 | | of operations) to |
| | | (Unaudited) | | July 31, 2005 |
| Increase (Decrease) in Net Assets | | | | | | | | |
| Operations | | | | | | | | |
| Net investment income (loss) | | $ | | (552,646) | | $ | | (434,724) |
| Net realized gain (loss) | | | | 2,013,137 | | | | 3,381,102 |
| Change in net unrealized appreciation (depreciation) . | | | | 28,330,137 | | | | 19,587,954 |
| Net increase (decrease) in net assets resulting | | | | | | | | |
| from operations | | | | 29,790,628 | | | | 22,534,332 |
| Distributions to shareholders from net realized gain | | | | (3,779,480) | | | | — |
| Share transactions - net increase (decrease) | | | | 142,979,744 | | | | 205,303,288 |
| Redemption fees | | | | 96,708 | | | | 106,750 |
| Total increase (decrease) in net assets | | | | 169,087,600 | | | | 227,944,370 |
| |
| Net Assets | | | | | | | | |
| Beginning of period | | | | 227,944,370 | | | | — |
| End of period (including accumulated net investment | | | | | | | | |
| loss of $567,617 and accumulated net investment | | | | | | | | |
| loss of $14,971, respectively) | | $ | | 397,031,970 | | $ | | 227,944,370 |
See accompanying notes which are an integral part of the financial statements.
17 Semiannual Report
| Financial Highlights Class A | | | | | | | | |
| | | Six months ended | | Year ended |
| | | January 31, 2006 | | July 31, |
| | | (Unaudited) | | 2005G |
| Selected Per Share Data | | | | | | | | |
| Net asset value, beginning of period | | | | $ 12.95 | | | | $ 10.00 |
| Income from Investment Operations | | | | | | | | |
| Net investment income (loss)E | | | | (.04)F | | | | (.07) |
| Net realized and unrealized gain (loss) | | | | 1.15 | | | | 3.01 |
| Total from investment operations | | | | 1.11 | | | | 2.94 |
| Distributions from net realized gain | | | | (.16) | | | | — |
| Redemption fees added to paid in capitalE | | | | —I | | | | .01 |
| Net asset value, end of period | | | | $ 13.90 | | | | $ 12.95 |
| Total ReturnB,C,D | | | | 8.68% | | | | 29.50% |
| Ratios to Average Net AssetsH | | | | | | | | |
| Expenses before reductions | | | | 1.54%A | | | | 1.55%A |
| Expenses net of fee waivers, if any | | | | 1.40%A | | | | 1.45%A |
| Expenses net of all reductions | | | | 1.33%A | | | | 1.36%A |
| Net investment income (loss) | | | | (.63)%A,F | | | | (.78)%A |
| Supplemental Data | | | | | | | | |
| Net assets, end of period (000 omitted) | | | | $11,765 | | | | $ 4,719 |
| Portfolio turnover rate | | | | 90%A | | | | 93%A |
A Annualized
B Total returns for periods of less than one year are not annualized.
C Total returns would have been lower had certain expenses not been reduced during the periods shown.
D Total returns do not include the effect of the sales charges.
E Calculated based on average shares outstanding during the period.
F Investment income per share reflects a special dividend which amounted to $.01 per share. Excluding the special dividend, the ratio of net
investment income (loss) to average net assets would have been (.79)%.
G For the period November 3, 2004 (commencement of operations) to July 31, 2005.
H Expense ratios reflect operating expenses of the class. Expenses before reductions do not reflect amounts reimbursed by the investment adviser or
reductions from brokerage service arrangements or other expense offset arrangements and do not represent the amount paid by the class during
periods when reimbursements or reductions occur. Expense ratios before reductions for start up periods may not be representative of longer term
operating periods. Expenses net of fee waivers reflect expenses after reimbursement by the investment adviser but prior to reductions from
brokerage service arrangements or other expense offset arrangements. Expenses net of all reductions represent the net expenses paid by the
class.
I Amount represents less than $.01 per share.
|
See accompanying notes which are an integral part of the financial statements.
| Financial Highlights Class T | | | | | | | | |
| | | Six months ended | | Year ended |
| | | January 31, 2006 | | July 31, |
| | | (Unaudited) | | 2005G |
| Selected Per Share Data | | | | | | | | |
| Net asset value, beginning of period | | | | $ 12.93 | | | | $ 10.00 |
| Income from Investment Operations | | | | | | | | |
| Net investment income (loss)E | | | | (.06)F | | | | (.09) |
| Net realized and unrealized gain (loss) | | | | 1.15 | | | | 3.01 |
| Total from investment operations | | | | 1.09 | | | | 2.92 |
| Distributions from net realized gain | | | | (.13) | | | | — |
| Redemption fees added to paid in capitalE | | | | —I | | | | .01 |
| Net asset value, end of period | | | | $ 13.89 | | | | $ 12.93 |
| Total ReturnB,C,D | | | | 8.53% | | | | 29.30% |
| Ratios to Average Net AssetsH | | | | | | | | |
| Expenses before reductions | | | | 1.77%A | | | | 1.79%A |
| Expenses net of fee waivers, if any | | | | 1.65%A | | | | 1.70%A |
| Expenses net of all reductions | | | | 1.58%A | | | | 1.61%A |
| Net investment income (loss) | | | | (.88)%A,F | | | | (1.03)%A |
| Supplemental Data | | | | | | | | |
| Net assets, end of period (000 omitted) | | | | $11,927 | | | | $ 5,240 |
| Portfolio turnover rate | | | | 90%A | | | | 93%A |
A Annualized
B Total returns for periods of less than one year are not annualized.
C Total returns would have been lower had certain expenses not been reduced during the periods shown.
D Total returns do not include the effect of the sales charges.
E Calculated based on average shares outstanding during the period.
F Investment income per share reflects a special dividend which amounted to $.01 per share. Excluding the special dividend, the ratio of net
investment income (loss) to average net assets would have been (1.04)% .
G For the period November 3, 2004 (commencement of operations) to July 31, 2005.
H Expense ratios reflect operating expenses of the class. Expenses before reductions do not reflect amounts reimbursed by the investment adviser or
reductions from brokerage service arrangements or other expense offset arrangements and do not represent the amount paid by the class during
periods when reimbursements or reductions occur. Expense ratios before reductions for start up periods may not be representative of longer term
operating periods. Expenses net of fee waivers reflect expenses after reimbursement by the investment adviser but prior to reductions from
brokerage service arrangements or other expense offset arrangements. Expenses net of all reductions represent the net expenses paid by the
class.
I Amount represents less than $.01 per share.
|
See accompanying notes which are an integral part of the financial statements.
19 Semiannual Report
| Financial Highlights Class B | | | | | | | | |
| | | Six months ended | | Year ended |
| | | January 31, 2006 | | July 31, |
| | | (Unaudited) | | 2005G |
| Selected Per Share Data | | | | | | | | |
| Net asset value, beginning of period | | | | $ 12.87 | | | | $ 10.00 |
| Income from Investment Operations | | | | | | | | |
| Net investment income (loss)E | | | | (.09)F | | | | (.13) |
| Net realized and unrealized gain (loss) | | | | 1.16 | | | | 2.99 |
| Total from investment operations | | | | 1.07 | | | | 2.86 |
| Distributions from net realized gain | | | | (.09) | | | | — |
| Redemption fees added to paid in capitalE | | | | —I | | | | .01 |
| Net asset value, end of period | | | | $ 13.85 | | | | $ 12.87 |
| Total ReturnB,C,D | | | | 8.34% | | | | 28.70% |
| Ratios to Average Net AssetsH | | | | | | | | |
| Expenses before reductions | | | | 2.28%A | | | | 2.33%A |
| Expenses net of fee waivers, if any | | | | 2.15%A | | | | 2.20%A |
| Expenses net of all reductions | | | | 2.08%A | | | | 2.11%A |
| Net investment income (loss) | | | | (1.37)%A,F | | | | (1.53)%A |
| Supplemental Data | | | | | | | | |
| Net assets, end of period (000 omitted) | | | | $ 3,765 | | | | $ 2,055 |
| Portfolio turnover rate | | | | 90%A | | | | 93%A |
A Annualized
B Total returns for periods of less than one year are not annualized.
C Total returns would have been lower had certain expenses not been reduced during the periods shown.
D Total returns do not include the effect of the contingent deferred sales charge.
E Calculated based on average shares outstanding during the period.
F Investment income per share reflects a special dividend which amounted to $.01 per share. Excluding the special dividend, the ratio of net
investment income (loss) to average net assets would have been (1.54)% .
G For the period November 3, 2004 (commencement of operations) to July 31, 2005.
H Expense ratios reflect operating expenses of the class. Expenses before reductions do not reflect amounts reimbursed by the investment adviser or
reductions from brokerage service arrangements or other expense offset arrangements and do not represent the amount paid by the class during
periods when reimbursements or reductions occur. Expense ratios before reductions for start up periods may not be representative of longer term
operating periods. Expenses net of fee waivers reflect expenses after reimbursement by the investment adviser but prior to reductions from
brokerage service arrangements or other expense offset arrangements. Expenses net of all reductions represent the net expenses paid by the
class.
I Amount represents less than $.01 per share.
|
See accompanying notes which are an integral part of the financial statements.
| Financial Highlights Class C | | | | | | | | |
| | | Six months ended | | Year ended |
| | | January 31, 2006 | | July 31, |
| | | (Unaudited) | | 2005G |
| Selected Per Share Data | | | | | | | | |
| Net asset value, beginning of period | | | | $ 12.88 | | | | $ 10.00 |
| Income from Investment Operations | | | | | | | | |
| Net investment income (loss)E | | | | (.09)F | | | | (.13) |
| Net realized and unrealized gain (loss) | | | | 1.15 | | | | 3.00 |
| Total from investment operations | | | | 1.06 | | | | 2.87 |
| Distributions from net realized gain | | | | (.10) | | | | — |
| Redemption fees added to paid in capitalE | | | | —I | | | | .01 |
| Net asset value, end of period | | | | $ 13.84 | | | | $ 12.88 |
| Total ReturnB,C,D | | | | 8.29% | | | | 28.80% |
| Ratios to Average Net AssetsH | | | | | | | | |
| Expenses before reductions | | | | 2.24%A | | | | 2.24%A |
| Expenses net of fee waivers, if any | | | | 2.15%A | | | | 2.17%A |
| Expenses net of all reductions | | | | 2.08%A | | | | 2.09%A |
| Net investment income (loss) | | | | (1.38)%A,F | | | | (1.50)%A |
| Supplemental Data | | | | | | | | |
| Net assets, end of period (000 omitted) | | | | $12,717 | | | | $ 8,372 |
| |
| Portfolio turnover rate | | | | 90%A | | | | 93%A |
A Annualized
B Total returns for periods of less than one year are not annualized.
C Total returns would have been lower had certain expenses not been reduced during the periods shown.
D Total returns do not include the effect of the contingent deferred sales charge.
E Calculated based on average shares outstanding during the period.
F Investment income per share reflects a special dividend which amounted to $.01 per share. Excluding the special dividend, the ratio of net
investment income (loss) to average net assets would have been (1.54)% .
G For the period November 3, 2004 (commencement of operations) to July 31, 2005.
H Expense ratios reflect operating expenses of the class. Expenses before reductions do not reflect amounts reimbursed by the investment adviser or
reductions from brokerage service arrangements or other expense offset arrangements and do not represent the amount paid by the class during
periods when reimbursements or reductions occur. Expense ratios before reductions for start up periods may not be representative of longer term
operating periods. Expenses net of fee waivers reflect expenses after reimbursement by the investment adviser but prior to reductions from
brokerage service arrangements or other expense offset arrangements. Expenses net of all reductions represent the net expenses paid by the
class.
I Amount represents less than $.01 per share.
|
See accompanying notes which are an integral part of the financial statements.
21 Semiannual Report
| Financial Highlights Small Cap Growth | | | | | | | | |
| | | Six months ended | | Year ended |
| | | January 31, 2006 | | July 31, |
| | | (Unaudited) | | 2005F |
| Selected Per Share Data | | | | | | | | |
| Net asset value, beginning of period | | | | $ 12.98 | | | | $ 10.00 |
| Income from Investment Operations | | | | | | | | |
| Net investment income (loss)D | | | | (.02)E | | | | (.04) |
| Net realized and unrealized gain (loss) | | | | 1.16 | | | | 3.01 |
| Total from investment operations | | | | 1.14 | | | | 2.97 |
| Distributions from net realized gain | | | | (.18) | | | | — |
| Redemption fees added to paid in capitalD | | | | —H | | | | .01 |
| Net asset value, end of period | | | | $ 13.94 | | | | $ 12.98 |
| Total ReturnB,C | | | | 8.90% | | | | 29.80% |
| Ratios to Average Net AssetsG | | | | | | | | |
| Expenses before reductions | | | | 1.08%A | | | | 1.16%A |
| Expenses net of fee waivers, if any | | | | 1.08%A | | | | 1.16%A |
| Expenses net of all reductions | | | | 1.01%A | | | | 1.08%A |
| Net investment income (loss) | | | | (.31)%A,E | | | | (.49)%A |
| Supplemental Data | | | | | | | | |
| Net assets, end of period (000 omitted) | | �� | | $348,213 | | | | $205,652 |
| Portfolio turnover rate | | | | 90%A | | | | 93%A |
A Annualized
B Total returns for periods of less than one year are not annualized.
C Total returns would have been lower had certain expenses not been reduced during the periods shown.
D Calculated based on average shares outstanding during the period.
E Investment income per share reflects a special dividend which amounted to $.01 per share. Excluding the special dividend, the ratio of net
investment income (loss) to average net assets would have been (.47)%.
F For the period November 3, 2004 (commencement of operations) to July 31, 2005.
G Expense ratios reflect operating expenses of the class. Expenses before reductions do not reflect amounts reimbursed by the investment adviser or
reductions from brokerage service arrangements or other expense offset arrangements and do not represent the amount paid by the class during
periods when reimbursements or reductions occur. Expense ratios before reductions for start up periods may not be representative of longer term
operating periods. Expenses net of fee waivers reflect expenses after reimbursement by the investment adviser but prior to reductions from
brokerage service arrangements or other expense offset arrangements. Expenses net of all reductions represent the net expenses paid by the
class.
H Amount represents less than $.01 per share.
|
See accompanying notes which are an integral part of the financial statements.
| Financial Highlights Institutional Class | | | | | | | | |
| | | Six months ended | | Year ended |
| | | January 31, 2006 | | July 31, |
| | | (Unaudited) | | 2005F |
| Selected Per Share Data | | | | | | | | |
| Net asset value, beginning of period | | | | $ 12.97 | | | | $ 10.00 |
| Income from Investment Operations | | | | | | | | |
| Net investment income (loss)D | | | | (.02)E | | | | (.04) |
| Net realized and unrealized gain (loss) | | | | 1.16 | | | | 3.00 |
| Total from investment operations | | | | 1.14 | | | | 2.96 |
| Distributions from net realized gain | | | | (.18) | | | | — |
| Redemption fees added to paid in capitalD | | | | —H | | | | .01 |
| Net asset value, end of period | | | | $ 13.93 | | | | $ 12.97 |
| Total ReturnB,C | | | | 8.87% | | | | 29.70% |
| Ratios to Average Net AssetsG | | | | | | | | |
| Expenses before reductions | | | | 1.14%A | | | | 1.20%A |
| Expenses net of fee waivers, if any | | | | 1.14%A | | | | 1.18%A |
| Expenses net of all reductions | | | | 1.04%A | | | | 1.10%A |
| Net investment income (loss) | | | | (.34)%A,E | | | | (.51)%A |
| Supplemental Data | | | | | | | | |
| Net assets, end of period (000 omitted) | | | | $ 8,644 | | $ | | $ 1,906 |
| Portfolio turnover rate | | | | 90%A | | | | 93%A |
A Annualized
B Total returns for periods of less than one year are not annualized.
C Total returns would have been lower had certain expenses not been reduced during the periods shown.
D Calculated based on average shares outstanding during the period.
E Investment income per share reflects a special dividend which amounted to $.01 per share. Excluding the special dividend, the ratio of net
investment income (loss) to average net assets would have been (.50)%.
F For the period November 3, 2004 (commencement of operations) to July 31, 2005.
G Expense ratios reflect operating expenses of the class. Expenses before reductions do not reflect amounts reimbursed by the investment adviser or
reductions from brokerage service arrangements or other expense offset arrangements and do not represent the amount paid by the class during
periods when reimbursements or reductions occur. Expense ratios before reductions for start up periods may not be representative of longer term
operating periods. Expenses net of fee waivers reflect expenses after reimbursement by the investment adviser but prior to reductions from
brokerage service arrangements or other expense offset arrangements. Expenses net of all reductions represent the net expenses paid by the
class.
H Amount represents less than $.01 per share.
|
See accompanying notes which are an integral part of the financial statements.
23 Semiannual Report
Notes to Financial Statements
For the period ended January 31, 2006 (Unaudited)
1. Significant Accounting Policies.
Fidelity Small Cap Growth Fund (the fund) is a non diversified fund of Fidelity Securi ties Fund (the trust) and is authorized to issue an unlimited number of shares. The trust is registered under the Investment Company Act of 1940, as amended (the 1940 Act), as an open end management investment company organized as a Massachusetts business trust.
The fund offers Class A, Class T, Class B, Class C, Small Cap Growth, and Institutional Class shares, each of which has equal rights as to assets and voting privileges. Each class has exclusive voting rights with respect to matters that affect that class. Class B shares will automatically convert to Class A shares after a holding period of seven years from the initial date of purchase. Investment income, realized and unrealized capital gains and losses, the common expenses of the fund, and certain fund level expense reductions, if any, are allocated on a pro rata basis to each class based on the relative net assets of each class to the total net assets of the fund. Each class differs with respect to transfer agent and distribution and service plan fees incurred. Certain expense reductions also differ by class.
The fund may invest in affiliated money market central funds (Money Market Central Funds) which are open end investment companies available to investment companies and other accounts managed by Fidelity Management & Research Company (FMR) and its affiliates. The financial statements have been prepared in conformity with accounting principles generally accepted in the United States of America, which require manage ment to make certain estimates and assumptions at the date of the financial statements. The following summarizes the significant accounting policies of the fund:
Security Valuation. Investments are valued and net asset value (NAV) per share is calculated (NAV calculation) as of the close of business of the New York Stock Exchange (NYSE), normally 4:00 p.m. Eastern time. Wherever possible, the fund uses independent pricing services approved by the Board of Trustees to value its investments.
Equity securities, including restricted securities, for which market quotations are readily available, are valued at the last reported sale price or official closing price as reported by an independent pricing service on the primary market or exchange on which they are traded. In the event there were no sales during the day or closing prices are not available, securities are valued at the last quoted bid price. Investments in open end mutual funds, are valued at their closing net asset value each business day. Short term securities with remaining maturities of sixty days or less for which quotations are not readily available are valued at amortized cost, which approximates value.
When current market prices or quotations are not readily available or do not accurately reflect fair value, valuations may be determined in accordance with procedures adopted by the Board of Trustees. For example, when developments occur between the close of a
| 1. Significant Accounting Policies continued |
Security Valuation continued | | |
market and the close of the NYSE that may materially affect the value of some or all of the securities, or when trading in a security is halted, those securities may be fair valued. Factors used in the determination of fair value may include monitoring news to identify significant market or security specific events such as changes in the value of U.S. securi ties markets, reviewing developments in foreign markets and evaluating the perfor mance of ADRs, futures contracts and exchange traded funds. Because the fund’s utilization of fair value pricing depends on market activity, the frequency with which fair value pricing is used can not be predicted and may be utilized to a significant extent. The value of securities used for NAV calculation under fair value pricing may differ from published prices for the same securities.
Foreign Currency. The fund uses foreign currency contracts to facilitate transactions in foreign denominated securities. Losses from these transactions may arise from changes in the value of the foreign currency or if the counterparties do not perform under the contracts’ terms.
Foreign denominated assets, including investment securities, and liabilities are translated into U.S. dollars at the exchange rate at period end. Purchases and sales of invest ment securities, income and dividends received and expenses denominated in foreign currencies are translated into U.S. dollars at the exchange rate in effect on the transaction date.
The effects of exchange rate fluctuations on investments are included with the net realized and unrealized gain (loss) on investment securities. Other foreign currency transactions resulting in realized and unrealized gain (loss) are disclosed separately.
Investment Transactions and Income. Security transactions are accounted for as of trade date. Gains and losses on securities sold are determined on the basis of identified cost. Dividend income is recorded on the ex dividend date, except for certain dividends from foreign securities where the ex dividend date may have passed, which are recorded as soon as the fund is informed of the ex dividend date. Non cash dividends included in dividend income, if any, are recorded at the fair market value of the securities received. Distributions received on securities that represent a return of capital or capital gain are recorded as a reduction of cost of investments and/or as a realized gain. The fund esti mates the components of distributions received that may be considered return of capital distributions or capital gain distributions. Large, non recurring dividends recognized by the fund are presented separately on the Statement of Operations as “Special Dividends” and the impact of these dividends is presented in the Financial Highlights. Interest income is accrued as earned. Interest income includes coupon interest and amortization of premium and accretion of discount on debt securities. Investment income is recorded net of foreign taxes withheld where recovery of such taxes is uncertain.
25 Semiannual Report
| Notes to Financial Statements (Unaudited) continued |
1. Significant Accounting Policies continued |
Expenses. Most expenses of the trust can be directly attributed to a fund. Expenses which cannot be directly attributed are apportioned among each fund in the trust.
Income Tax Information and Distributions to Shareholders. Each year, the fund intends to qualify as a regulated investment company by distributing all of its taxable income and realized gains under Subchapter M of the Internal Revenue Code. As a result, no provision for income taxes is required in the accompanying financial statements. Foreign taxes are provided for based on the fund’s understanding of the tax rules and rates that exist in the foreign markets in which it invests.
Distributions are recorded on the ex dividend date. Income dividends and capital gain distributions are declared separately for each class. Income and capital gain distribu tions are determined in accordance with income tax regulations, which may differ from generally accepted accounting principles. In addition, the fund claimed a portion of the payment made to redeeming shareholders as a distribution for income tax purposes.
Capital accounts within the financial statements are adjusted for permanent book tax differences. These adjustments have no impact on net assets or the results of operations. Temporary book tax differences will reverse in a subsequent period.
Book tax differences are primarily due to foreign currency transactions, passive foreign investment companies (PFIC) and losses deferred due to wash sales.
The federal tax cost of investments and unrealized appreciation (depreciation) as of period end were as follows:
| Unrealized appreciation | | | $ | 54,447,942 |
| Unrealized depreciation | | | | (7,058,875) |
| Net unrealized appreciation (depreciation) | | | $ | 47,389,067 |
| Cost for federal income tax purposes | | | $ | 355,922,308 |
Short Term Trading (Redemption) Fees. Shares held in the fund less than 90 days are subject to a redemption fee equal to 1.50% of the proceeds of the redeemed shares. All redemption fees, including any estimated redemption fees paid by FMR, are retained by the fund and accounted for as an addition to paid in capital.
Repurchase Agreements. FMR has received an Exemptive Order from the Securities and Exchange Commission (the SEC) which permits the fund and other affiliated entities of FMR to transfer uninvested cash balances into joint trading accounts which are then invested in repurchase agreements. The fund may also invest directly with institutions in repurchase agreements. Repurchase agreements are collateralized by government or non government securities. Collateral is held in segregated accounts with custodian banks and may be obtained in the event of a default of the counterparty. The fund monitors, on a daily basis, the value of the collateral to ensure it is at least equal to
2. Operating Policies continued
Repurchase Agreements continued
the principal amount of the repurchase agreement (including accrued interest). In the event of a default by the counterparty, realization of the collateral proceeds could be delayed, during which time the value of the collateral may decline.
Restricted Securities. The fund may invest in securities that are subject to legal or contractual restrictions on resale. These securities generally may be resold in transac tions exempt from registration or to the public if the securities are registered. Disposal of these securities may involve time consuming negotiations and expense, and prompt sale at an acceptable price may be difficult. Information regarding restricted securities is included at the end of the fund’s Schedule of Investments.
3. Purchases and Sales of Investments.
Purchases and sales of securities, other than short term securities and U.S. government securities, aggregated $266,055,748 and $128,949,824, respectively.
4. Fees and Other Transactions with Affiliates.
Management Fee. FMR and its affiliates provide the fund with investment manage ment related services for which the fund pays a monthly management fee. The manage ment fee is the sum of an individual fund fee rate that is based on an annual rate of .45% of the fund’s average net assets and a group fee rate that averaged .27% during the period. The group fee rate is based upon the average net assets of all the mutual funds advised by FMR. The group fee rate decreases as assets under management increase and increases as assets under management decrease. In addition, the management fee is subject to a performance adjustment (up to a maximum of .20% of the fund’s average net assets over a 36 month performance period). The upward or downward adjustment to the management fee is based on the investment performance of the asset weighted return of Small Cap Growth (the original class) as compared to an appropriate bench mark index. The fund’s performance adjustment took effect in November 2005. Subse quent months will be added until the performance period includes 36 months. For the period, the total annualized management fee rate, including the performance adjust ment, was .78% of the fund’s average net assets.
Distribution and Service Plan. In accordance with Rule 12b 1 of the 1940 Act, the fund has adopted separate Distribution and Service Plans for each class of shares. Certain classes pay Fidelity Distributors Corporation (FDC), an affiliate of FMR, separate Distribution and Service Fees, each of which is based on an annual percentage of each class’ average net assets. In addition, FDC may pay financial intermediaries for selling
27 Semiannual Report
| Notes to Financial Statements (Unaudited) continued |
| |
| 4. Fees and Other Transactions with Affiliates continued |
Distribution and Service Plan continued |
shares of the fund and providing shareholder support services. For the period, the Distribution and Service Fee rates and the total amounts paid to and retained by FDC were as follows:
| | | Distribution | | Service | | | | Paid to | | | | Retained |
| | | Fee | | Fee | | | | FDC | | | | by FDC |
| Class A | | 0% | | .25% | | | $ | 9,490 | | | $ | 728 |
| Class T | | 25% | | .25% | | | | 17,702 | | | | 2,098 |
| Class B | | 75% | | .25% | | | | 13,818 | | | | 11,261 |
| Class C | | 75% | | .25% | | | | 50,244 | | | | 20,167 |
| |
| | | | | | | | $ | 91,254 | | | $ | 34,254 |
Sales Load. FDC receives a front end sales charge of up to 5.75% for selling Class A shares, and 3.50% for selling Class T shares, some of which is paid to financial intermedi aries for selling shares of the fund. FDC receives the proceeds of contingent deferred sales charges levied on Class A, Class T, Class B, and Class C redemptions. These charges depend on the holding period. The deferred sales charges range from 5% to 1% for Class B, 1% for Class C, and ..25% for certain purchases of Class A and Class T shares.
For the period, sales charge amounts retained by FDC were as follows:
| | |
| | | | | Retained |
| | | | | by FDC |
| Class A | | | $ | 25,490 |
| Class T | | | | 4,084 |
| Class B* | | | | 889 |
| Class C* | | | | 1,015 |
| | | | $ | 31,478 |
* When Class B and Class C shares are initially sold, FDC pays commissions from its own resources to financial intermediaries through which the sales are made.
Transfer Agent Fees. Fidelity Investments Institutional Operations Company, Inc. (FIIOC), an affiliate of FMR, is the transfer, dividend disbursing and shareholder servic ing agent for each class of the fund, except for Small Cap Growth. Fidelity Service Company, Inc. (FSC), an affiliate of FMR, is the transfer agent for Small Cap Growth shares. FIIOC and FSC receive account fees and asset based fees that vary according to the account size and type of account of the shareholders of the respective classes of the fund. FIIOC and FSC pay for typesetting, printing and mailing of shareholder reports,
| 4. Fees and Other Transactions with Affiliates continued |
Transfer Agent Fees continued | | |
except proxy statements. For the period the total transfer agent fees paid by each class to FIIOC or FSC, were as follows:
| | | | | | | % of |
| | | | | | | Average |
| | | | | Amount | | Net Assets |
| Class A | | | $ | 13,833 | | .37* |
| Class T | | | | 12,451 | | .35* |
| Class B | | | | 4,929 | | .36* |
| Class C | | | | 16,009 | | .32* |
| Small Cap Growth | | | | 222,054 | | .17* |
| Institutional Class | | | | 3,647 | | .22* |
| | | | $ | 272,923 | | |
| * Annualized | | | | | | |
Accounting and Security Lending Fees. FSC maintains the fund’s accounting records. The accounting fee is based on the level of average net assets for the month. Under a separate contract, FSC administers the security lending program. The security lending fee is based on the number and duration of lending transactions.
Affiliated Central Funds. The fund may invest in Money Market Central Funds which seek preservation of capital and current income and are managed by Fidelity Invest ments Money Management, Inc. (FIMM), an affiliate of FMR.
The Money Market Central Funds do not pay a management fee.
Brokerage Commissions. The fund placed a portion of its portfolio transactions with brokerage firms which are affiliates of the investment adviser. The commissions paid to these affiliated firms were $13,964 for the period.
5. Committed Line of Credit.
|
The fund participates with other funds managed by FMR in a $4.2 billion credit facility (the “line of credit”) to be utilized for temporary or emergency purposes to fund share holder redemptions or for other short term liquidity purposes. The fund has agreed to pay commitment fees on its pro rata portion of the line of credit. During the period, there were no borrowings on this line of credit.
29 Semiannual Report
| Notes to Financial Statements (Unaudited) continued |
6. Security Lending. | | |
The fund lends portfolio securities from time to time in order to earn additional income. On the settlement date of the loan, the fund receives collateral (in the form of U.S. Treasury obligations, letters of credit and/or cash) against the loaned securities and maintains collateral in an amount not less than 100% of the market value of the loaned securities during the period of the loan. The market value of the loaned securities is determined at the close of business of the fund and any additional required collateral is delivered to the fund on the next business day. If the borrower defaults on its obligation to return the securities loaned because of insolvency or other reasons, a fund could experience delays and costs in recovering the securities loaned or in gaining access to the collateral. Any cash collateral received is invested in the Fidelity Securities Lending Cash Central Fund. The value of loaned securities and cash collateral at period end are disclosed on the fund’s Statement of Assets and Liabilities. Security lending income represents the income earned on investing cash collateral, less fees and expenses associated with the loan, plus any premium payments that may be received on the loan of certain types of securities. Security lending income is presented in the Statement of Operations as a component of income from affiliated central funds. Net income from lending portfolio securities during the period amounted to $12,921.
FMR voluntarily agreed to reimburse each class to the extent annual operating expenses exceeded certain levels of average net assets as noted in the table below. Some expenses, for example interest expense, are excluded from this reimbursement.
The following classes were in reimbursement during the period:
| | | | |
| | | Expense | | | | Reimbursement |
| | | Limitations | | | | from adviser |
| Class A | | 1.40% | | | $ | 5,183 |
| Class T | | 1.65% | | | | 4,337 |
| Class B | | 2.15% | | | | 1,771 |
| Class C | | 2.15% | | | | 4,376 |
| | | | | | $ | 15,667 |
Many of the brokers with whom FMR places trades on behalf of the fund provided services to the fund in addition to trade execution. These services included payments of certain expenses on behalf of the fund totaling $103,072 for the period. In addition, through arrangements with the fund’s custodian and each class’ transfer agent, credits realized as a result of uninvested cash balances were used to reduce the fund’s expenses. During the period, these credits reduced the fund’s custody expenses by $1,801. During
7. Expense Reductions - continued
the period, credits reduced each class’ transfer agent expense as noted in the table below.
| | | Transfer Agent |
| | | expense reduction |
| Small Cap Growth | | $ | | 109 |
| Institutional Class | | | | 452 |
| | | $ | | 561 |
| |
| |
| 8. Other. | | | | |
The fund’s organizational documents provide former and current trustees and officers with a limited indemnification against liabilities arising in connection with the performance of their duties to the fund. In the normal course of business, the fund may also enter into contracts that provide general indemnifications. The fund’s maximum exposure under these arrangements is unknown as this would be dependent on future claims that may be made against the fund. The risk of material loss from such claims is consid ered remote.
| 9. Distributions to Shareholders. | | | | | | |
| |
Distributions to shareholders of each class were as follows:
| | | | | | |
| | | | | Six months ended | | | | Year ended | | |
| | | | | January 31, | | | | July 31, | | |
| | | | | 2006 | | | | 2005A | | |
| From net realized gain | | | | | | | | | | |
| Class A | | | $ | 79,075 | | | $ | | | — |
| Class T | | | | 63,628 | | | | | | — |
| Class B | | | | 16,296 | | | | | | — |
| Class C | | | | 71,642 | | | | | | — |
| Small Cap Growth | | | | 3,518,781 | | | | | | — |
| Institutional Class | | | | 30,058 | | | | | | — |
| Total | | | $ | 3,779,480 | | | $ | | | — |
A For the period November 3, 2004 (commencement of operations) to July 31, 2005. | | | | | | |
31 Semiannual Report
| Notes to Financial Statements (Unaudited) continued |
| |
| |
| 10. Share Transactions. | | | | | | | | | | |
| |
Transactions for each class of shares were as follows:
| | | | | | | | |
| | | Shares | | Dollars |
| | | Six months ended | | Year ended | | Six months ended | | | | Year ended |
| | | January 31, | | July 31, | | January 31, | | | | July 31, |
| | | 2006 | | 2005A | | 2006 | | | | 2005A |
| Class A | | | | | | | | | | | | |
| Shares sold | | 554,813 | | 377,650 | | | | $ 7,172,589 | | | | $ 4,304,515 |
| Reinvestment of distributions | | 5,381 | | — | | | | 70,352 | | | | — |
| Shares redeemed | | (78,430) | | (13,200) | | | | (1,015,894) | | | | (157,404) |
| Net increase (decrease) | | 481,764 | | 364,450 | | | | $ 6,227,047 | | | | $ 4,147,111 |
| Class T | | | | | | | | | | | | |
| Shares sold | | 558,733 | | 432,704 | | | | $ 7,321,338 | | | | $ 4,904,069 |
| Reinvestment of distributions | | 4,866 | | — | | | | 63,445 | | | | — |
| Shares redeemed | | (110,217) | | (27,332) | | | | (1,411,094) | | | | (327,972) |
| Net increase (decrease) | | 453,382 | | 405,372 | | | | $ 5,973,689 | | | | $ 4,576,097 |
| Class B | | | | | | | | | | | | |
| Shares sold | | 130,631 | | 169,626 | | | | $ 1,681,126 | | | | $ 1,864,130 |
| Reinvestment of distributions | | 1,204 | | — | | | | 15,610 | | | | — |
| Shares redeemed | | (19,547) | | (10,003) | | | | (252,382) | | | | (113,030) |
| Net increase (decrease) | | 112,288 | | 159,623 | | | | $ 1,444,354 | | | | $ 1,751,100 |
| Class C | | | | | | | | | | | | |
| Shares sold | | 378,699 | | 664,094 | | | | $ 4,874,538 | | | | $ 7,429,424 |
| Reinvestment of distributions | | 5,289 | | — | | | | 68,602 | | | | — |
| Shares redeemed | | (115,053) | | (14,036) | | | | (1,477,514) | | | | (166,606) |
| Net increase (decrease) | | 268,935 | | 650,058 | | | | $ 3,465,626 | | | | $ 7,262,818 |
| Small Cap Growth | | | | | | | | | | | | |
| Shares sold | | 12,356,450 | | 18,162,749 | | | | $160,594,584 | | | | | | $212,509,370 |
| Reinvestment of distributions | | 226,620 | | — | | | | 2,968,828 | | | | — |
| Shares redeemed | | (3,439,456) | | (2,320,313) | | | | (43,857,334) | | | | | | (26,565,039) |
| Net increase (decrease) | | 9,143,614 | | 15,842,436 | | | | $119,706,078 | | | | | | | | $185,944,331 |
| Institutional Class | | | | | | | | | | | | |
| Shares sold | | 507,176 | | 170,585 | | | | $ 6,598,183 | | | | $ 1,883,777 |
| Reinvestment of distributions | | 1,705 | | — | | | | 22,327 | | | | — |
| Shares redeemed | | (35,213) | | (23,631) | | | | (457,560) | | | | (261,946) |
| Net increase (decrease) | | 473,668 | | 146,954 | | | | $ 6,162,950 | | | | $ 1,621,831 |
A For the period November 3, 2004 (commencement of operations) to July 31, 2005. | | | | | | | | |
Board Approval of Investment Advisory Contracts and Management Fees
Fidelity Small Cap Growth Fund
On January 19, 2006, the Board of Trustees, including the Independent Trustees (together, the Board), voted to approve a general research services agreement (the Agreement) between FMR, FMR Co., Inc. (FMRC), Fidelity Investments Money Manage ment, Inc. (FIMM), and Fidelity Research & Analysis Company (FRAC) (together, the Investment Advisers) for the fund, effective January 20, 2006, pursuant to which FRAC may provide general research and investment advisory support services to FMRC and FIMM. The Board considered that it has approved previously various sub advisory agreements for the fund with affiliates of FMR that allow FMR to obtain research, non discretionary advice, or discretionary portfolio management at no additional expense to the fund. The Board, assisted by the advice of fund counsel and independent Trustees’ counsel, considered a broad range of information and determined that it would be beneficial for the fund to access the research and investment advisory support services supplied by FRAC at no additional expense to the fund.
The Board reached this determination in part because the new arrangement will involve no changes in (i) the contractual terms of and fees payable under the fund’s manage ment contract or sub advisory agreements; (ii) the investment process or strategies employed in the management of the fund’s assets; (iii) the nature or level of services provided under the fund’s management contract or sub advisory agreements; (iv) the day to day management of the fund or the persons primarily responsible for such man agement; or (v) the ultimate control or beneficial ownership of FMR, FMRC, or FIMM. The Board also considered that the establishment of the Agreement would not necessi tate prior shareholder approval of the Agreement or result in an assignment and termination of the fund’s management contract or sub advisory agreements under the Investment Company Act of 1940.
Because the Board was approving an arrangement with FRAC under which the fund will not bear any additional management fees or expenses and under which the fund’s portfolio manager would not change, it did not consider the fund’s investment perfor mance, competitiveness of management fee and total expenses, costs of services and profitability, or economies of scale to be significant factors in its decision.
In connection with its future renewal of the fund’s management contract and sub advisory agreements, the Board will consider: (i) the nature, extent, and quality of services provided to the fund, including shareholder and administrative services and investment performance; (ii) the competitiveness of the fund’s management fee and total expenses; (iii) the costs of the services and profitability, including the revenues earned and the expenses incurred by Fidelity in conducting the business of developing, marketing, distributing, managing, administering, and servicing the fund and its shareholders; and (iv) whether there have been economies of scale in respect of the management of the Fidelity funds, whether the Fidelity funds (including the fund) have
33 Semiannual Report
Board Approval of Investment Advisory Contracts and Management Fees continued
appropriately benefited from any such economies of scale, and whether there is potential for realization of any further economies.
Based on its evaluation of all of the conclusions noted above, and after considering all material factors, the Board ultimately concluded that the fund’s Agreement is fair and reasonable, and that the fund’s Agreement should be approved.
35 Semiannual Report
37 Semiannual Report
Investment Adviser
Fidelity Management & Research Company
Boston, MA
Investment Sub Advisers
FMR Co., Inc.
Fidelity Management & Research
(U.K.) Inc.
Fidelity Research & Analysis Company
(formerly Fidelity Management & Research
(Far East) Inc.)
Fidelity International Investment Advisors
Fidelity Investments Japan Limited
Fidelity International Investment Advisors (U.K.) Limited
General Distributor
Fidelity Distributors Corporation
Boston, MA
Transfer and Service Agents
Fidelity Investments Institutional
Operations Company, Inc.
Boston, MA
Fidelity Service Company, Inc.
Boston, MA
Custodian
Citibank, N.A.
New York, NY
|
ASCP-USAN-0306
1.803716.101
|


| | Fidelity Advisor
Small Cap Growth
Fund - Institutional Class
|
| | Semiannual Report
January 31, 2006
|

Institutional Class is a class of Fidelity® Small Cap Growth Fund
| Contents | | | | |
| |
| Chairman’s Message | | 3 | | Ned Johnson’s message to shareholders. |
| Shareholder Expense | | 4 | | An example of shareholder expenses. |
| Example | | | | |
| Investment Changes | | 6 | | A summary of the fund’s investments. |
| Investments | | 7 | | A complete list of the fund’s investments |
| | | | | with their market values. |
| Financial Statements | | 14 | | Statements of assets and liabilities, |
| | | | | operations, and changes in net assets, |
| | | | | as well as financial highlights. |
| Notes | | 24 | | Notes to the financial statements. |
| Board Approval of | | 33 | | |
| Investment Advisory | | | | |
| Contracts and | | | | |
| Management Fees | | | | |
To view a fund’s proxy voting guidelines and proxy voting record for the 12 month period ended
June 30, visit www.fidelity.com/proxyvotingresults or visit the Securities and Exchange Commis
sion’s (SEC) web site at www.sec.gov. You may also call 1-877-208-0098 to request a free copy of
the proxy voting guidelines.
Standard & Poor’s, S&P and S&P 500 are registered service marks of The McGraw Hill Companies,
Inc. and have been licensed for use by Fidelity Distributors Corporation.
Other third party marks appearing herein are the property of their respective owners.
All other marks appearing herein are registered or unregistered trademarks or service marks
of FMR Corp. or an affiliated company.
|
| | This report and the financial statements contained herein are submitted for the general information
of the shareholders of the fund. This report is not authorized for distribution to prospective investors
in the fund unless preceded or accompanied by an effective prospectus.
A fund files its complete schedule of portfolio holdings with the SEC for the first and third
quarters of each fiscal year on Form N Q. Forms N Q are available on the SEC’s web site at
http://www.sec.gov. A fund’s Forms N Q may be reviewed and copied at the SEC’s Public Reference
Room in Washington, DC. Information regarding the operation of the SEC’s Public Reference
Room may be obtained by calling 1-800-SEC-0330. For a complete list of a fund’s portfolio hold
ings, view the most recent quarterly holdings report, semiannual report, or annual report on
Fidelity’s web site at http://www.advisor.fidelity.com.
NOT FDIC INSURED · MAY LOSE VALUE · NO BANK GUARANTEE
Neither the fund nor Fidelity Distributors Corporation is a bank.
|
Chairman’s Message
(photograph of Edward C. Johnson 3d)
Dear Shareholder:
During the past year or so, much has been reported about the mutual fund industry, and much of it has been more critical than I believe is warranted. Allegations that some companies have been less than forthright with their shareholders have cast a shadow on the entire industry. I continue to find these reports disturbing, and assert that they do not create an accurate picture of the industry overall. Therefore, I would like to remind every one where Fidelity stands on these issues. I will say two things specifically regarding allegations that some mutual fund companies were in violation of the Securities and Exchange Commission’s forward pricing rules or were involved in so called “market timing” activities.
First, Fidelity has no agreements that permit customers who buy fund shares after 4 p.m. to obtain the 4 p.m. price. This is not a new policy. This is not to say that some one could not deceive the company through fraudulent acts. However, we are extremely diligent in preventing fraud from occurring in this manner and in every other. But I underscore again that Fidelity has no so called “agreements” that sanction illegal practices.
Second, Fidelity continues to stand on record, as we have for years, in opposition to predatory short term trading that adversely affects shareholders in a mutual fund. Back in the 1980s, we initiated a fee which is returned to the fund and, therefore, to investors to discourage this activity. Further, we took the lead several years ago in developing a Fair Value Pricing Policy to prevent market timing on foreign securities in our funds. I am confident we will find other ways to make it more difficult for predatory traders to operate. However, this will only be achieved through close cooperation among regulators, legislators and the industry.
Yes, there have been unfortunate instances of unethical and illegal activity within the mutual fund industry from time to time. That is true of any industry. When this occurs, confessed or convicted offenders should be dealt with appropriately. But we are still concerned about the risk of over regulation and the quick application of simplistic solutions to intricate problems. Every system can be improved, and we support and applaud well thought out improvements by regulators, legislators and industry representatives that achieve the common goal of building and protecting the value of investors’ holdings.
For nearly 60 years, Fidelity has worked very hard to improve its products and service to justify your trust. When our family founded this company in 1946, we had only a few hundred customers. Today, we serve more than 18 million customers including individual investors and participants in retirement plans across America.
Let me close by saying that we do not take your trust in us for granted, and we realize that we must always work to improve all aspects of our service to you. In turn, we urge you to continue your active participation with your financial matters, so that your interests can be well served.
Best regards,
/s/ Edward C. Johnson 3d
Edward C. Johnson 3d
3 Semiannual Report
Shareholder Expense Example
As a shareholder of the Fund, you incur two types of costs: (1) transaction costs, including sales charges (loads) on purchase payments or redemption proceeds, redemption fees, and (2) ongoing costs, including management fees, distribution and/or service (12b 1) fees and other Fund expenses. This Example is intended to help you understand your ongoing costs (in dollars) of investing in the Fund and to compare these costs with the ongoing costs of investing in other mutual funds.
The Example is based on an investment of $1,000 invested at the beginning of the period and held for the entire period (August 1, 2005 to January 31, 2006).
The first line of the table below for each class of the Fund provides information about actual account values and actual expenses. You may use the information in this line, together with the amount you invested, to estimate the expenses that you paid over the period. Simply divide your account value by $1,000.00 (for example, an $8,600 account value divided by $1,000.00 = 8.6), then multiply the result by the number in the first line for a class of the Fund under the heading entitled “Expenses Paid During Period” to estimate the expenses you paid on your account during this period. A small balance maintenance fee of $12.00 that is charged once a year may apply for certain accounts with a value of less than $2,000. This fee is not included in the table below. If it was, the estimate of expenses you paid during the period would be higher, and your ending account value lower, by this amount.
Hypothetical Example for Comparison Purposes
The second line of the table below for each class of the Fund provides information about hypothetical account values and hypothetical expenses based on a Class’ actual expense ratio and an assumed rate of return of 5% per year before expenses, which is not the Class’ actual return. The hypothetical account values and expenses may not be used to estimate the actual ending account balance or expenses you paid for the period. You may use this informa tion to compare the ongoing costs of investing in the Fund and other funds. To do so, compare this 5% hypothetical example with the 5% hypothetical examples that appear in the shareholder reports of the other funds. A small balance maintenance fee of $12.00 that is charged once a year may apply for certain accounts with a value of less than $2,000. This fee is not included in the table below. If it was, the estimate of expenses you paid during the period would be higher, and your ending account value lower, by this amount.
Please note that the expenses shown in the table are meant to highlight your ongoing costs only and do not reflect any transaction costs. Therefore, the second line of the table is useful in comparing ongoing costs only, and will not help you determine the relative total costs of owning different funds. In addition, if these transactional costs were included, your costs would have been higher.
| | | | | | | | | | | Expenses Paid |
| | | | | Beginning | | Ending | | During Period* |
| | | | | Account Value | | Account Value | | August 1, 2005 to |
| | | | | August 1, 2005 | | January 31, 2006 | | January 31, 2006 |
| Class A | | | | | | | | | | | | |
| Actual | | | $ | 1,000.00 | | $ | | 1,086.80 | | $ | | 7.36 |
| HypotheticalA | | | $ | 1,000.00 | | $ | | 1,018.15 | | $ | | 7.12 |
| Class T | | | | | | | | | | | | |
| Actual | | | $ | 1,000.00 | | $ | | 1,085.30 | | $ | | 8.67 |
| HypotheticalA | | | $ | 1,000.00 | | $ | | 1,016.89 | | $ | | 8.39 |
| Class B | | | | | | | | | | | | |
| Actual | | | $ | 1,000.00 | | $ | | 1,083.40 | | $ | | 11.29 |
| HypotheticalA | | | $ | 1,000.00 | | $ | | 1,014.37 | | $ | | 10.92 |
| Class C | | | | | | | | | | | | |
| Actual | | | $ | 1,000.00 | | $ | | 1,082.90 | | $ | | 11.29 |
| HypotheticalA | | | $ | 1,000.00 | | $ | | 1,014.37 | | $ | | 10.92 |
| Small Cap Growth | | | | | | | | | | | | |
| Actual | | | $ | 1,000.00 | | $ | | 1,089.00 | | $ | | 5.69 |
| HypotheticalA | | | $ | 1,000.00 | | $ | | 1,019.76 | | $ | | 5.50 |
| Institutional Class | | | | | | | | | | | | |
| Actual | | | $ | 1,000.00 | | $ | | 1,088.70 | | $ | | 6.00 |
| HypotheticalA | | | $ | 1,000.00 | | $ | | 1,019.46 | | $ | | 5.80 |
| |
| A 5% return per year before expenses | | | | | | | | |
* Expenses are equal to each Class’ annualized expense ratio (shown in the table below); multiplied by the average account value over the period, multiplied by 184/365 (to reflect the one half year period).
| | | Annualized |
| | | Expense Ratio |
| Class A | | 1.40% |
| Class T | | 1.65% |
| Class B | | 2.15% |
| Class C | | 2.15% |
| Small Cap Growth | | 1.08% |
| Institutional Class | | 1.14% |
5 Semiannual Report
| Investment Changes | | | | |
| |
| |
| Top Ten Stocks as of January 31, 2006 | | | | |
| | | % of fund’s | | % of fund’s net assets |
| | | net assets | | 6 months ago |
| Lifetime Brands, Inc. | | 3.0 | | 0.9 |
| NBTY, Inc. | | 2.4 | | 1.8 |
| VistaCare, Inc. Class A | | 2.3 | | 0.0 |
| Pacific Sunwear of California, Inc. | | 2.2 | | 2.2 |
| Timberland Co. Class A | | 2.2 | | 0.0 |
| Omnicare, Inc. | | 2.1 | | 1.7 |
| Hilb Rogal & Hobbs Co. | | 2.1 | | 1.4 |
| American Medical Systems Holdings, Inc. | | 2.0 | | 0.0 |
| Abaxis, Inc. | | 1.9 | | 2.0 |
| Chemed Corp. | | 1.8 | | 0.0 |
| | | 22.0 | | |
| Top Five Market Sectors as of January 31, 2006 | | |
| | | % of fund’s | | % of fund’s net assets |
| | | net assets | | 6 months ago |
| Information Technology | | 22.5 | | 24.1 |
| Health Care | | 19.9 | | 13.3 |
| Consumer Discretionary | | 18.7 | | 27.0 |
| Energy | | 11.1 | | 9.1 |
| Industrials | | 10.5 | | 10.0 |
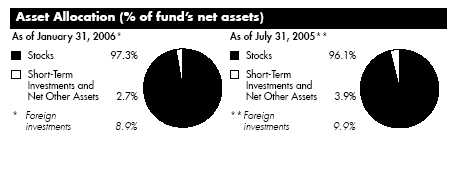
Semiannual Report 6
| Investments January 31, 2006 (Unaudited) |
| Showing Percentage of Net Assets | | | | |
| |
| Common Stocks 97.3% | | | | |
| | | Shares | | Value (Note 1) |
| |
| CONSUMER DISCRETIONARY – 18.7% | | | | |
| Distributors – 0.5% | | | | |
| Prestige Brands Holdings, Inc. | | 145,000 | | $ 1,802,350 |
| Diversified Consumer Services – 1.1% | | | | |
| Education Management Corp. (a) | | 49,900 | | 1,527,938 |
| Matthews International Corp. Class A | | 72,060 | | 2,694,323 |
| | | | | 4,222,261 |
| Hotels, Restaurants & Leisure 3.3% | | | | |
| CEC Entertainment, Inc. (a) | | 195,800 | | 7,052,716 |
| Domino’s Pizza, Inc. | | 247,100 | | 6,155,261 |
| | | | | 13,207,977 |
| Household Durables – 4.7% | | | | |
| Helen of Troy Ltd. (a) | | 210,000 | | 4,023,600 |
| Lenox Group, Inc. (a) | | 203,300 | | 2,775,045 |
| Lifetime Brands, Inc. | | 548,977 | | 11,995,146 |
| | | | | 18,793,791 |
| Internet & Catalog Retail 0.6% | | | | |
| GSI Commerce, Inc. (a) | | 135,000 | | 2,277,450 |
| Specialty Retail – 4.9% | | | | |
| Big 5 Sporting Goods Corp. | | 102,300 | | 2,207,634 |
| Eddie Bauer Holdings, Inc. (a) | | 315,000 | | 4,725,000 |
| Finish Line, Inc. Class A | | 210,000 | | 3,769,500 |
| Pacific Sunwear of California, Inc. (a) | | 361,000 | | 8,848,110 |
| | | | | 19,550,244 |
| Textiles, Apparel & Luxury Goods – 3.6% | | | | |
| Fossil, Inc. (a) | | 239,468 | | 5,675,392 |
| Timberland Co. Class A (a) | | 250,000 | | 8,740,000 |
| | | | | 14,415,392 |
| |
| TOTAL CONSUMER DISCRETIONARY | | | | 74,269,465 |
| |
| CONSUMER STAPLES 2.4% | | | | |
| Personal Products 2.4% | | | | |
| NBTY, Inc. (a) | | 454,500 | | 9,403,605 |
| ENERGY 11.1% | | | | |
| Energy Equipment & Services – 4.4% | | | | |
| Basic Energy Services, Inc. | | 58,300 | | 1,635,315 |
| Hornbeck Offshore Services, Inc. (a) | | 101,000 | | 4,017,780 |
| Maverick Tube Corp. (a) | | 45,000 | | 2,153,250 |
| Oil States International, Inc. (a) | | 94,200 | | 3,852,780 |
| |
| See accompanying notes which are an integral part of the financial statements. | | |
| |
| 7 | | Semiannual Report |
| Investments (Unaudited) continued | | | | | | |
| |
| |
| Common Stocks continued | | | | | | |
| | | Shares | | Value (Note 1) |
| |
| ENERGY – continued | | | | | | |
| Energy Equipment & Services – continued | | | | | | |
| Pason Systems, Inc. | | 109,600 | | | | $ 3,374,750 |
| Superior Energy Services, Inc. (a) | | 98,000 | | | | 2,660,700 |
| | | | | | | 17,694,575 |
| Oil, Gas & Consumable Fuels – 6.7% | | | | | | |
| Comstock Resources, Inc. (a) | | 116,000 | | | | 3,712,000 |
| Forest Oil Corp. (a) | | 77,800 | | | | 4,006,700 |
| Frontier Oil Corp. | | 65,000 | | | | 3,080,350 |
| Holly Corp. | | 80,200 | | | | 5,902,720 |
| Mariner Energy, Inc. (a)(e) | | 75,000 | | | | 1,518,750 |
| OMI Corp. | | 182,500 | | | | 3,204,700 |
| Range Resources Corp. | | 168,150 | | | | 5,022,641 |
| | | | | | | 26,447,861 |
| |
| TOTAL ENERGY | | | | | | 44,142,436 |
| |
| FINANCIALS – 6.6% | | | | | | |
| Consumer Finance – 1.4% | | | | | | |
| World Acceptance Corp. (a) | | 193,500 | | | | 5,487,660 |
| Insurance – 5.2% | | | | | | |
| American Equity Investment Life Holding Co. | | 375,000 | | | | 5,268,750 |
| Aspen Insurance Holdings Ltd. | | 192,000 | | | | 4,450,560 |
| Hilb Rogal & Hobbs Co. | | 212,800 | | | | 8,273,664 |
| USI Holdings Corp. (a) | | 178,800 | | | | 2,517,504 |
| | | | | | | 20,510,478 |
| |
| TOTAL FINANCIALS | | | | | | 25,998,138 |
| |
| HEALTH CARE – 19.9% | | | | | | |
| Health Care Equipment & Supplies – 6.5% | | | | | | |
| Abaxis, Inc. (a) | | 370,000 | | | | 7,370,400 |
| American Medical Systems Holdings, Inc. (a) | | 354,300 | | | | 8,028,438 |
| Cholestech Corp. (a) | | 130,000 | | | | 1,405,300 |
| DJ Orthopedics, Inc. (a) | | 124,900 | | | | 4,100,467 |
| Regeneration Technologies, Inc. (a) | | 627,000 | | | | 4,953,300 |
| | | | | | | 25,857,905 |
| Health Care Providers & Services – 12.4% | | | | | | |
| America Service Group, Inc. (a) | | 253,500 | | | | 4,626,375 |
| American Dental Partners, Inc. (a) | | 25,649 | | | | 420,644 |
| AmSurg Corp. (a) | | 40,700 | | | | 882,783 |
| Chemed Corp. | | 134,000 | | | | 7,123,440 |
See accompanying notes which are an integral part of the financial statements.
| Common Stocks continued | | | | | | |
| | | Shares | | Value (Note 1) |
| |
| HEALTH CARE – continued | | | | | | |
| Health Care Providers & Services – continued | | | | | | |
| ICON PLC sponsored ADR (a) | | 63,995 | | | | $ 2,814,500 |
| Odyssey Healthcare, Inc. (a) | | 310,000 | | | | 6,317,800 |
| Omnicare, Inc. | | 170,500 | | | | 8,473,850 |
| Per-Se Technologies, Inc. (a) | | 281,400 | | | | 6,998,418 |
| VCA Antech, Inc. (a) | | 95,800 | | | | 2,650,786 |
| VistaCare, Inc. Class A (a) | | 653,400 | | | | 9,088,794 |
| | | | | | | 49,397,390 |
| Pharmaceuticals – 1.0% | | | | | | |
| Medicis Pharmaceutical Corp. Class A | | 124,500 | | | | 3,848,295 |
| |
| TOTAL HEALTH CARE | | | | | | 79,103,590 |
| |
| INDUSTRIALS – 10.5% | | | | | | |
| Aerospace & Defense – 0.8% | | | | | | |
| BE Aerospace, Inc. (a) | | 155,300 | | | | 3,264,406 |
| Building Products 0.6% | | | | | | |
| Quixote Corp. | | 119,050 | | | | 2,532,194 |
| Commercial Services & Supplies – 3.4% | | | | | | |
| CDI Corp. | | 70,000 | | | | 1,908,900 |
| McGrath RentCorp. | | 83,000 | | | | 2,694,180 |
| Navigant Consulting, Inc. (a) | | 125,700 | | | | 2,855,904 |
| PeopleSupport, Inc. (a) | | 236,100 | | | | 2,450,718 |
| Tele Atlas NV (a) | | 129,500 | | | | 3,528,490 |
| | | | | | | 13,438,192 |
| Construction & Engineering – 0.4% | | | | | | |
| Comfort Systems USA, Inc. | | 151,500 | | | | 1,592,265 |
| Electrical Equipment – 1.9% | | | | | | |
| C&D Technologies, Inc. | | 384,110 | | | | 3,188,113 |
| Genlyte Group, Inc. (a) | | 76,000 | | | | 4,395,840 |
| | | | | | | 7,583,953 |
| Industrial Conglomerates – 0.5% | | | | | | |
| Raven Industries, Inc. | | 60,000 | | | | 1,896,000 |
| Machinery – 1.6% | | | | | | |
| Greenbrier Companies, Inc. | | 100,000 | | | | 3,545,000 |
| Watts Water Technologies, Inc. Class A | | 86,600 | | | | 2,916,688 |
| | | | | | | 6,461,688 |
See accompanying notes which are an integral part of the financial statements.
| Investments (Unaudited) continued | | | | | | |
| |
| |
| Common Stocks continued | | | | | | | | |
| | | | | Shares | | Value (Note 1) |
| |
| INDUSTRIALS – continued | | | | | | | | |
| Trading Companies & Distributors – 1.3% | | | | | | |
| WESCO International, Inc. (a) | | | | 105,000 | | | | $ 5,032,650 |
| |
| TOTAL INDUSTRIALS | | | | | | | | 41,801,348 |
| |
| INFORMATION TECHNOLOGY – 22.5% | | | | | | | | |
| Communications Equipment – 3.5% | | | | | | | | |
| Avocent Corp. (a) | | | | 110,000 | | | | 3,659,700 |
| F5 Networks, Inc. (a) | | | | 28,000 | | | | 1,811,600 |
| Harris Corp. | | | | 112,000 | | | | 5,200,160 |
| Ixia (a) | | | | 181,800 | | | | 2,290,680 |
| MasTec, Inc. (a) | | | | 85,000 | | | | 1,024,250 |
| | | | | | | | | 13,986,390 |
| Computers & Peripherals – 1.6% | | | | | | | | |
| Avid Technology, Inc. (a) | | | | 72,500 | | | | 3,601,075 |
| Mobility Electronics, Inc. (a) | | | | 245,800 | | | | 2,575,984 |
| | | | | | | | | 6,177,059 |
| Electronic Equipment & Instruments – 3.9% | | | | | | |
| Cogent, Inc. (a) | | | | 137,000 | | | | 3,292,110 |
| FARO Technologies, Inc. (a) | | | | 135,393 | | | | 2,156,810 |
| ScanSource, Inc. (a) | | | | 46,200 | | | | 2,717,022 |
| Trimble Navigation Ltd. (a) | | | | 83,000 | | | | 3,321,660 |
| Xyratex Ltd. (a) | | | | 178,700 | | | | 4,033,259 |
| | | | | | | | | 15,520,861 |
| Internet Software & Services – 1.8% | | | | | | | | |
| Digital River, Inc. (a)(d) | | | | 98,600 | | | | 3,310,988 |
| j2 Global Communications, Inc. (a) | | | | 79,900 | | | | 3,815,225 |
| | | | | | | | | 7,126,213 |
| IT Services – 4.2% | | | | | | | | |
| CACI International, Inc. Class A (a) | | | | 42,700 | | | | 2,438,170 |
| Lionbridge Technologies, Inc. (a) | | | | 923,846 | | | | 7,048,945 |
| SI International, Inc. (a) | | | | 153,700 | | | | 4,674,017 |
| TALX Corp. | | | | 84,825 | | | | 2,658,416 |
| | | | | | | | | 16,819,548 |
| Office Electronics – 0.9% | | | | | | | | |
| Zebra Technologies Corp. Class A (a) | | | | 78,000 | | | | 3,512,340 |
| Semiconductors & Semiconductor Equipment – 3.3% | | | | | | |
| California Micro Devices Corp. (a) | | | | 204,000 | | | | 1,362,720 |
| Cascade Microtech, Inc. (a) | | | | 247,861 | | | | 3,507,233 |
| Entegris, Inc. (a) | | | | 255,000 | | | | 2,677,500 |
See accompanying notes which are an integral part of the financial statements.
| Common Stocks continued | | | | |
| | | Shares | | Value (Note 1) |
| |
| INFORMATION TECHNOLOGY – continued | | | | |
| Semiconductors & Semiconductor Equipment – continued | | | | |
| O2Micro International Ltd. sponsored ADR (a) | | 302,200 | | $ 3,287,936 |
| Silicon Laboratories, Inc. (a) | | 47,000 | | 2,313,810 |
| | | | | 13,149,199 |
| Software 3.3% | | | | |
| Blackbaud, Inc. | | 180,859 | | 3,108,966 |
| Bottomline Technologies, Inc. (a) | | 188,200 | | 2,168,064 |
| Cognos, Inc. (a) | | 65,000 | | 2,516,792 |
| DATATRAK International, Inc. (a)(f) | | 15,000 | | 136,500 |
| DATATRAK International, Inc. warrants 12/23/07 (a)(f) | | 2,250 | | 0 |
| Hyperion Solutions Corp. (a) | | 77,900 | | 2,680,539 |
| Moldflow Corp. (a) | | 157,200 | | 2,114,340 |
| NAVTEQ Corp. (a) | | 5,000 | | 224,550 |
| | | | | 12,949,751 |
| |
| TOTAL INFORMATION TECHNOLOGY | | | | 89,241,361 |
| |
| MATERIALS 4.2% | | | | |
| Chemicals – 0.8% | | | | |
| Chemtura Corp. | | 240,000 | | 3,016,800 |
| Containers & Packaging – 0.3% | | | | |
| Myers Industries, Inc. | | 95,000 | | 1,425,000 |
| Metals & Mining – 3.1% | | | | |
| Allegheny Technologies, Inc. | | 45,000 | | 2,333,250 |
| Apex Silver Mines Ltd. (a) | | 95,000 | | 1,522,850 |
| Carpenter Technology Corp. | | 25,000 | | 2,264,000 |
| Meridian Gold, Inc. (a) | | 118,100 | | 3,188,529 |
| Oregon Steel Mills, Inc. (a) | | 73,100 | | 3,009,527 |
| | | | | 12,318,156 |
| |
| TOTAL MATERIALS | | | | 16,759,956 |
| |
| TELECOMMUNICATION SERVICES – 0.5% | | | | |
| Diversified Telecommunication Services – 0.5% | | | | |
| FairPoint Communications, Inc. | | 184,000 | | 2,165,680 |
| |
| UTILITIES – 0.9% | | | | |
| Multi-Utilities – 0.9% | | | | |
| CMS Energy Corp. (a) | | 243,600 | | 3,524,892 |
| TOTAL COMMON STOCKS | | | | |
| (Cost $338,492,380) | | | | 386,410,471 |
See accompanying notes which are an integral part of the financial statements.
11 Semiannual Report
| Investments (Unaudited) continued | | | | | | |
| |
| Money Market Funds 4.3% | | | | | | | | |
| | | | | Shares | | | | Value (Note 1) |
| Fidelity Cash Central Fund, 4.46% (b) | | | | 16,270,904 | | | | $ 16,270,904 |
| Fidelity Securities Lending Cash Central Fund, 4.48% (b)(c) | | | | 630,000 | | | | 630,000 |
| TOTAL MONEY MARKET FUNDS | | | | | | | | |
| (Cost $16,900,904) | | | | | | | | 16,900,904 |
| TOTAL INVESTMENT PORTFOLIO 101.6% | | | | | | |
| (Cost $355,393,284) | | | | | | | | 403,311,375 |
| |
| NET OTHER ASSETS – (1.6)% | | | | | | | | (6,279,405) |
| NET ASSETS 100% | | | | | | $ | | $ 397,031,970 |
Legend
(a) Non-income producing
(b) Affiliated fund that is available only to
investment companies and other
accounts managed by Fidelity
Investments. The rate quoted is the
annualized seven-day yield of the fund
at period end. A complete unaudited
listing of the fund’s holdings as of its
most recent quarter end is available
upon request.
(c) Investment made with cash collateral
received from securities on loan.
(d) Security or a portion of the security is on
loan at period end.
(e) Security exempt from registration under
Rule 144A of the Securities Act of 1933.
These securities may be resold in
transactions exempt from registration,
normally to qualified institutional buyers.
At the period end, the value of these
securities amounted to $1,518,750 or
0.4% of net assets.
|
(f) Restricted securities – Investment in
securities not registered under the
Securities Act of 1933 (excluding 144A
issues). At the end of the period, the
value of restricted securities (excluding
144A issues) amounted to $136,500 or
0.0% of net assets.
|
Additional information on each holding is as follows:
| | | Acquisition | | | | Acquisition |
| Security | | Date | | | | Cost |
| DATATRAK | | | | | | |
| International, Inc. | | 12/27/04 | | | $ | 95,000 |
| DATATRAK | | | | | | |
| International, Inc. | | | | | | |
| warrants | | | | | | |
| 12/23/07 | | 12/27/04 | | | $ | 0 |
See accompanying notes which are an integral part of the financial statements.
Semiannual Report 12
Affiliated Central Funds
Information regarding fiscal year to date income received by the fund from the affiliated Central funds is as follows:
| Fund | | Income received |
| Fidelity Cash Central Fund | | $ | | 225,025 |
| Fidelity Securities Lending Cash Central Fund | | | | 12,921 |
| Total | | $ | | 237,946 |
See accompanying notes which are an integral part of the financial statements.
13 Semiannual Report
| Financial Statements | | | | | | |
| |
| |
| Statement of Assets and Liabilities | | | | | | |
| | | | | January 31, 2006 (Unaudited) |
| |
| Assets | | | | | | |
| Investment in securities, at value (including securities | | | | | | |
| loaned of $604,440) See accompanying schedule: | | | | | | |
| Unaffiliated issuers (cost $338,492,380) | | | $ | 386,410,471 | | |
| Affiliated Central Funds (cost $16,900,904) | | | | 16,900,904 | | |
| Total Investments (cost $355,393,284) | | | | | $ | 403,311,375 |
| Receivable for investments sold | | | | | | 2,190,200 |
| Receivable for fund shares sold | | | | | | 4,326,329 |
| Dividends receivable | | | | | | 11,353 |
| Interest receivable | | | | | | 61,021 |
| Prepaid expenses | | | | | | 827 |
| Receivable from investment adviser for expense | | | | | | |
| reductions | | | | | | 2,361 |
| Other affiliated receivables | | | | | | 377 |
| Other receivables | | | | | | 50,442 |
| Total assets | | | | | | 409,954,285 |
| |
| Liabilities | | | | | | |
| Payable for investments purchased | | | $ | 11,543,669 | | |
| Payable for fund shares redeemed | | | | 399,298 | | |
| Accrued management fee | | | | 247,387 | | |
| Distribution fees payable | | | | 19,161 | | |
| Other affiliated payables | | | | 61,939 | | |
| Other payables and accrued expenses | | | | 20,861 | | |
| Collateral on securities loaned, at value | | | | 630,000 | | |
| Total liabilities | | | | | | 12,922,315 |
| |
| Net Assets | | | | | $ | 397,031,970 |
| Net Assets consist of: | | | | | | |
| Paid in capital | | | | | $ | 348,795,652 |
| Accumulated net investment loss | | | | | | (567,617) |
| Accumulated undistributed net realized gain (loss) on | | | | | | |
| investments and foreign currency transactions | | | | | | 885,844 |
| Net unrealized appreciation (depreciation) on | | | | | | |
| investments | | | | | | 47,918,091 |
| Net Assets | | | | | $ | 397,031,970 |
See accompanying notes which are an integral part of the financial statements.
| Statement of Assets and Liabilities continued | | | | |
| | | January 31, 2006 (Unaudited) |
| |
| Calculation of Maximum Offering Price | | | | |
| Class A: | | | | |
| Net Asset Value and redemption price per share | | | | |
| ($11,765,393 ÷ 846,214 shares) | | $ | | 13.90 |
| Maximum offering price per share (100/94.25 of $13.90) | | $ | | 14.75 |
| Class T: | | | | |
| Net Asset Value and redemption price per share | | | | |
| ($11,926,676 ÷ 858,754 shares) | | $ | | 13.89 |
| Maximum offering price per share (100/96.50 of $13.89) | | $ | | 14.39 |
| Class B: | | | | |
| Net Asset Value and offering price per share | | | | |
| ($3,765,243 ÷ 271,911 shares)A | | $ | | 13.85 |
| Class C: | | | | |
| Net Asset Value and offering price per share | | | | |
| ($12,717,435 ÷ 918,993 shares)A | | $ | | 13.84 |
| Small Cap Growth: | | | | |
| Net Asset Value, offering price and redemption price per | | | | |
| share ($348,213,351 ÷ 24,986,050 shares) | | $ | | 13.94 |
| Institutional Class: | | | | |
| Net Asset Value, offering price and redemption price per | | | | |
| share ($8,643,872 ÷ 620,622 shares) | | $ | | 13.93 |
A Redemption price per share is equal to net asset value less any applicable contingent deferred sales charge. | | |
See accompanying notes which are an integral part of the financial statements.
15 Semiannual Report
| Financial Statements continued | | | | |
| |
| |
| Statement of Operations | | | | | | |
| | | Six months ended January 31, 2006 (Unaudited) |
| |
| Investment Income | | | | | | |
| Dividends | | | | | $ | 550,063 |
| Special dividends | | | | | | 241,463 |
| Interest | | | | | | 209 |
| Income from affiliated Central Funds | | | | | | 237,946 |
| Total income | | | | | | 1,029,681 |
| |
| Expenses | | | | | | |
| Management fee | | | | | | |
| Basic fee | | | $ | 1,057,561 | | |
| Performance adjustment | | | | 88,173 | | |
| Transfer agent fees | | | | 272,923 | | |
| Distribution fees | | | | 91,254 | | |
| Accounting and security lending fees | | | | 60,870 | | |
| Independent trustees’ compensation | | | | 565 | | |
| Custodian fees and expenses | | | | 9,885 | | |
| Registration fees | | | | 95,173 | | |
| Audit | | | | 19,163 | | |
| Legal | | | | 7,169 | | |
| Miscellaneous | | | | 692 | | |
| Total expenses before reductions | | | | 1,703,428 | | |
| Expense reductions | | | | (121,101) | | 1,582,327 |
| |
| Net investment income (loss) | | | | | | (552,646) |
| Realized and Unrealized Gain (Loss) | | | | |
| Net realized gain (loss) on: | | | | | | |
| Investment securities: | | | | | | |
| Unaffiliated issuers | | | | 2,019,029 | | |
| Foreign currency transactions | | | | (5,892) | | |
| Total net realized gain (loss) | | | | | | 2,013,137 |
| Change in net unrealized appreciation (depreciation) on: | | | | |
| Investment securities | | | | 28,330,105 | | |
| Assets and liabilities in foreign currencies | | 32 | | |
| Total change in net unrealized appreciation | | | | |
| (depreciation) | | | | | | 28,330,137 |
| Net gain (loss) | | | | | | 30,343,274 |
| Net increase (decrease) in net assets resulting from | | | | |
| operations | | | | | $ | 29,790,628 |
See accompanying notes which are an integral part of the financial statements.
| Statement of Changes in Net Assets | | | | | | | | |
| | | | | | | For the period |
| | | | | | | November 3, 2004 |
| | | Six months ended | | (commencement |
| | | January 31, 2006 | | of operations) to |
| | | (Unaudited) | | July 31, 2005 |
| Increase (Decrease) in Net Assets | | | | | | | | |
| Operations | | | | | | | | |
| Net investment income (loss) | | $ | | (552,646) | | $ | | (434,724) |
| Net realized gain (loss) | | | | 2,013,137 | | | | 3,381,102 |
| Change in net unrealized appreciation (depreciation) . | | | | 28,330,137 | | | | 19,587,954 |
| Net increase (decrease) in net assets resulting | | | | | | | | |
| from operations | | | | 29,790,628 | | | | 22,534,332 |
| Distributions to shareholders from net realized gain | | | | (3,779,480) | | | | — |
| Share transactions - net increase (decrease) | | | | 142,979,744 | | | | 205,303,288 |
| Redemption fees | | | | 96,708 | | | | 106,750 |
| Total increase (decrease) in net assets | | | | 169,087,600 | | | | 227,944,370 |
| |
| Net Assets | | | | | | | | |
| Beginning of period | | | | 227,944,370 | | | | — |
| End of period (including accumulated net investment | | | | | | | | |
| loss of $567,617 and accumulated net investment | | | | | | | | |
| loss of $14,971, respectively) | | $ | | 397,031,970 | | $ | | 227,944,370 |
See accompanying notes which are an integral part of the financial statements.
17 Semiannual Report
| Financial Highlights Class A | | | | | | | | |
| | | Six months ended | | Year ended |
| | | January 31, 2006 | | July 31, |
| | | (Unaudited) | | 2005G |
| Selected Per Share Data | | | | | | | | |
| Net asset value, beginning of period | | | | $ 12.95 | | | | $ 10.00 |
| Income from Investment Operations | | | | | | | | |
| Net investment income (loss)E | | | | (.04)F | | | | (.07) |
| Net realized and unrealized gain (loss) | | | | 1.15 | | | | 3.01 |
| Total from investment operations | | | | 1.11 | | | | 2.94 |
| Distributions from net realized gain | | | | (.16) | | | | — |
| Redemption fees added to paid in capitalE | | | | —I | | | | .01 |
| Net asset value, end of period | | | | $ 13.90 | | | | $ 12.95 |
| Total ReturnB,C,D | | | | 8.68% | | | | 29.50% |
| Ratios to Average Net AssetsH | | | | | | | | |
| Expenses before reductions | | | | 1.54%A | | | | 1.55%A |
| Expenses net of fee waivers, if any | | | | 1.40%A | | | | 1.45%A |
| Expenses net of all reductions | | | | 1.33%A | | | | 1.36%A |
| Net investment income (loss) | | | | (.63)%A,F | | | | (.78)%A |
| Supplemental Data | | | | | | | | |
| Net assets, end of period (000 omitted) | | | | $11,765 | | | | $ 4,719 |
| Portfolio turnover rate | | | | 90%A | | | | 93%A |
A Annualized
B Total returns for periods of less than one year are not annualized.
C Total returns would have been lower had certain expenses not been reduced during the periods shown.
D Total returns do not include the effect of the sales charges.
E Calculated based on average shares outstanding during the period.
F Investment income per share reflects a special dividend which amounted to $.01 per share. Excluding the special dividend, the ratio of net
investment income (loss) to average net assets would have been (.79)%.
G For the period November 3, 2004 (commencement of operations) to July 31, 2005.
H Expense ratios reflect operating expenses of the class. Expenses before reductions do not reflect amounts reimbursed by the investment adviser or
reductions from brokerage service arrangements or other expense offset arrangements and do not represent the amount paid by the class during
periods when reimbursements or reductions occur. Expense ratios before reductions for start up periods may not be representative of longer term
operating periods. Expenses net of fee waivers reflect expenses after reimbursement by the investment adviser but prior to reductions from
brokerage service arrangements or other expense offset arrangements. Expenses net of all reductions represent the net expenses paid by the
class.
I Amount represents less than $.01 per share.
|
See accompanying notes which are an integral part of the financial statements.
| Financial Highlights Class T | | | | | | | | |
| | | Six months ended | | Year ended |
| | | January 31, 2006 | | July 31, |
| | | (Unaudited) | | 2005G |
| Selected Per Share Data | | | | | | | | |
| Net asset value, beginning of period | | | | $ 12.93 | | | | $ 10.00 |
| Income from Investment Operations | | | | | | | | |
| Net investment income (loss)E | | | | (.06)F | | | | (.09) |
| Net realized and unrealized gain (loss) | | | | 1.15 | | | | 3.01 |
| Total from investment operations | | | | 1.09 | | | | 2.92 |
| Distributions from net realized gain | | | | (.13) | | | | — |
| Redemption fees added to paid in capitalE | | | | —I | | | | .01 |
| Net asset value, end of period | | | | $ 13.89 | | | | $ 12.93 |
| Total ReturnB,C,D | | | | 8.53% | | | | 29.30% |
| Ratios to Average Net AssetsH | | | | | | | | |
| Expenses before reductions | | | | 1.77%A | | | | 1.79%A |
| Expenses net of fee waivers, if any | | | | 1.65%A | | | | 1.70%A |
| Expenses net of all reductions | | | | 1.58%A | | | | 1.61%A |
| Net investment income (loss) | | | | (.88)%A,F | | | | (1.03)%A |
| Supplemental Data | | | | | | | | |
| Net assets, end of period (000 omitted) | | | | $11,927 | | | | $ 5,240 |
| Portfolio turnover rate | | | | 90%A | | | | 93%A |
A Annualized
B Total returns for periods of less than one year are not annualized.
C Total returns would have been lower had certain expenses not been reduced during the periods shown.
D Total returns do not include the effect of the sales charges.
E Calculated based on average shares outstanding during the period.
F Investment income per share reflects a special dividend which amounted to $.01 per share. Excluding the special dividend, the ratio of net
investment income (loss) to average net assets would have been (1.04)% .
G For the period November 3, 2004 (commencement of operations) to July 31, 2005.
H Expense ratios reflect operating expenses of the class. Expenses before reductions do not reflect amounts reimbursed by the investment adviser or
reductions from brokerage service arrangements or other expense offset arrangements and do not represent the amount paid by the class during
periods when reimbursements or reductions occur. Expense ratios before reductions for start up periods may not be representative of longer term
operating periods. Expenses net of fee waivers reflect expenses after reimbursement by the investment adviser but prior to reductions from
brokerage service arrangements or other expense offset arrangements. Expenses net of all reductions represent the net expenses paid by the
class.
I Amount represents less than $.01 per share.
|
See accompanying notes which are an integral part of the financial statements.
19 Semiannual Report
| Financial Highlights Class B | | | | | | | | |
| | | Six months ended | | Year ended |
| | | January 31, 2006 | | July 31, |
| | | (Unaudited) | | 2005G |
| Selected Per Share Data | | | | | | | | |
| Net asset value, beginning of period | | | | $ 12.87 | | | | $ 10.00 |
| Income from Investment Operations | | | | | | | | |
| Net investment income (loss)E | | | | (.09)F | | | | (.13) |
| Net realized and unrealized gain (loss) | | | | 1.16 | | | | 2.99 |
| Total from investment operations | | | | 1.07 | | | | 2.86 |
| Distributions from net realized gain | | | | (.09) | | | | — |
| Redemption fees added to paid in capitalE | | | | —I | | | | .01 |
| Net asset value, end of period | | | | $ 13.85 | | | | $ 12.87 |
| Total ReturnB,C,D | | | | 8.34% | | | | 28.70% |
| Ratios to Average Net AssetsH | | | | | | | | |
| Expenses before reductions | | | | 2.28%A | | | | 2.33%A |
| Expenses net of fee waivers, if any | | | | 2.15%A | | | | 2.20%A |
| Expenses net of all reductions | | | | 2.08%A | | | | 2.11%A |
| Net investment income (loss) | | | | (1.37)%A,F | | | | (1.53)%A |
| Supplemental Data | | | | | | | | |
| Net assets, end of period (000 omitted) | | | | $ 3,765 | | | | $ 2,055 |
| Portfolio turnover rate | | | | 90%A | | | | 93%A |
A Annualized
B Total returns for periods of less than one year are not annualized.
C Total returns would have been lower had certain expenses not been reduced during the periods shown.
D Total returns do not include the effect of the contingent deferred sales charge.
E Calculated based on average shares outstanding during the period.
F Investment income per share reflects a special dividend which amounted to $.01 per share. Excluding the special dividend, the ratio of net
investment income (loss) to average net assets would have been (1.54)% .
G For the period November 3, 2004 (commencement of operations) to July 31, 2005.
H Expense ratios reflect operating expenses of the class. Expenses before reductions do not reflect amounts reimbursed by the investment adviser or
reductions from brokerage service arrangements or other expense offset arrangements and do not represent the amount paid by the class during
periods when reimbursements or reductions occur. Expense ratios before reductions for start up periods may not be representative of longer term
operating periods. Expenses net of fee waivers reflect expenses after reimbursement by the investment adviser but prior to reductions from
brokerage service arrangements or other expense offset arrangements. Expenses net of all reductions represent the net expenses paid by the
class.
I Amount represents less than $.01 per share.
|
See accompanying notes which are an integral part of the financial statements.
| Financial Highlights Class C | | | | | | | | |
| | | Six months ended | | Year ended |
| | | January 31, 2006 | | July 31, |
| | | (Unaudited) | | 2005G |
| Selected Per Share Data | | | | | | | | |
| Net asset value, beginning of period | | | | $ 12.88 | | | | $ 10.00 |
| Income from Investment Operations | | | | | | | | |
| Net investment income (loss)E | | | | (.09)F | | | | (.13) |
| Net realized and unrealized gain (loss) | | | | 1.15 | | | | 3.00 |
| Total from investment operations | | | | 1.06 | | | | 2.87 |
| Distributions from net realized gain | | | | (.10) | | | | — |
| Redemption fees added to paid in capitalE | | | | —I | | | | .01 |
| Net asset value, end of period | | | | $ 13.84 | | | | $ 12.88 |
| Total ReturnB,C,D | | | | 8.29% | | | | 28.80% |
| Ratios to Average Net AssetsH | | | | | | | | |
| Expenses before reductions | | | | 2.24%A | | | | 2.24%A |
| Expenses net of fee waivers, if any | | | | 2.15%A | | | | 2.17%A |
| Expenses net of all reductions | | | | 2.08%A | | | | 2.09%A |
| Net investment income (loss) | | | | (1.38)%A,F | | | | (1.50)%A |
| Supplemental Data | | | | | | | | |
| Net assets, end of period (000 omitted) | | | | $12,717 | | | | $ 8,372 |
| |
| Portfolio turnover rate | | | | 90%A | | | | 93%A |
A Annualized
B Total returns for periods of less than one year are not annualized.
C Total returns would have been lower had certain expenses not been reduced during the periods shown.
D Total returns do not include the effect of the contingent deferred sales charge.
E Calculated based on average shares outstanding during the period.
F Investment income per share reflects a special dividend which amounted to $.01 per share. Excluding the special dividend, the ratio of net
investment income (loss) to average net assets would have been (1.54)% .
G For the period November 3, 2004 (commencement of operations) to July 31, 2005.
H Expense ratios reflect operating expenses of the class. Expenses before reductions do not reflect amounts reimbursed by the investment adviser or
reductions from brokerage service arrangements or other expense offset arrangements and do not represent the amount paid by the class during
periods when reimbursements or reductions occur. Expense ratios before reductions for start up periods may not be representative of longer term
operating periods. Expenses net of fee waivers reflect expenses after reimbursement by the investment adviser but prior to reductions from
brokerage service arrangements or other expense offset arrangements. Expenses net of all reductions represent the net expenses paid by the
class.
I Amount represents less than $.01 per share.
|
See accompanying notes which are an integral part of the financial statements.
21 Semiannual Report
| Financial Highlights Small Cap Growth | | | | | | | | |
| | | Six months ended | | Year ended |
| | | January 31, 2006 | | July 31, |
| | | (Unaudited) | | 2005F |
| Selected Per Share Data | | | | | | | | |
| Net asset value, beginning of period | | | | $ 12.98 | | | | $ 10.00 |
| Income from Investment Operations | | | | | | | | |
| Net investment income (loss)D | | | | (.02)E | | | | (.04) |
| Net realized and unrealized gain (loss) | | | | 1.16 | | | | 3.01 |
| Total from investment operations | | | | 1.14 | | | | 2.97 |
| Distributions from net realized gain | | | | (.18) | | | | — |
| Redemption fees added to paid in capitalD | | | | —H | | | | .01 |
| Net asset value, end of period | | | | $ 13.94 | | | | $ 12.98 |
| Total ReturnB,C | | | | 8.90% | | | | 29.80% |
| Ratios to Average Net AssetsG | | | | | | | | |
| Expenses before reductions | | | | 1.08%A | | | | 1.16%A |
| Expenses net of fee waivers, if any | | | | 1.08%A | | | | 1.16%A |
| Expenses net of all reductions | | | | 1.01%A | | | | 1.08%A |
| Net investment income (loss) | | | | (.31)%A,E | | | | (.49)%A |
| Supplemental Data | | | | | | | | |
| Net assets, end of period (000 omitted) | | | | $348,213 | | | | $205,652 |
| Portfolio turnover rate | | | | 90%A | | | | 93%A |
A Annualized
B Total returns for periods of less than one year are not annualized.
C Total returns would have been lower had certain expenses not been reduced during the periods shown.
D Calculated based on average shares outstanding during the period.
E Investment income per share reflects a special dividend which amounted to $.01 per share. Excluding the special dividend, the ratio of net
investment income (loss) to average net assets would have been (.47)%.
F For the period November 3, 2004 (commencement of operations) to July 31, 2005.
G Expense ratios reflect operating expenses of the class. Expenses before reductions do not reflect amounts reimbursed by the investment adviser or
reductions from brokerage service arrangements or other expense offset arrangements and do not represent the amount paid by the class during
periods when reimbursements or reductions occur. Expense ratios before reductions for start up periods may not be representative of longer term
operating periods. Expenses net of fee waivers reflect expenses after reimbursement by the investment adviser but prior to reductions from
brokerage service arrangements or other expense offset arrangements. Expenses net of all reductions represent the net expenses paid by the
class.
H Amount represents less than $.01 per share.
|
See accompanying notes which are an integral part of the financial statements.
| Financial Highlights Institutional Class | | | | | | | | |
| | | Six months ended | | Year ended |
| | | January 31, 2006 | | July 31, |
| | | (Unaudited) | | 2005F |
| Selected Per Share Data | | | | | | | | |
| Net asset value, beginning of period | | | | $ 12.97 | | | | $ 10.00 |
| Income from Investment Operations | | | | | | | | |
| Net investment income (loss)D | | | | (.02)E | | | | (.04) |
| Net realized and unrealized gain (loss) | | | | 1.16 | | | | 3.00 |
| Total from investment operations | | | | 1.14 | | | | 2.96 |
| Distributions from net realized gain | | | | (.18) | | | | — |
| Redemption fees added to paid in capitalD | | | | —H | | | | .01 |
| Net asset value, end of period | | | | $ 13.93 | | | | $ 12.97 |
| Total ReturnB,C | | | | 8.87% | | | | 29.70% |
| Ratios to Average Net AssetsG | | | | | | | | |
| Expenses before reductions | | | | 1.14%A | | | | 1.20%A |
| Expenses net of fee waivers, if any | | | | 1.14%A | | | | 1.18%A |
| Expenses net of all reductions | | | | 1.04%A | | | | 1.10%A |
| Net investment income (loss) | | | | (.34)%A,E | | | | (.51)%A |
| Supplemental Data | | | | | | | | |
| Net assets, end of period (000 omitted) | | | | $ 8,644 | | | | $ 1,906 |
| Portfolio turnover rate | | | | 90%A | | | | 93%A |
A Annualized
B Total returns for periods of less than one year are not annualized.
C Total returns would have been lower had certain expenses not been reduced during the periods shown.
D Calculated based on average shares outstanding during the period.
E Investment income per share reflects a special dividend which amounted to $.01 per share. Excluding the special dividend, the ratio of net
investment income (loss) to average net assets would have been (.50)%.
F For the period November 3, 2004 (commencement of operations) to July 31, 2005.
G Expense ratios reflect operating expenses of the class. Expenses before reductions do not reflect amounts reimbursed by the investment adviser or
reductions from brokerage service arrangements or other expense offset arrangements and do not represent the amount paid by the class during
periods when reimbursements or reductions occur. Expense ratios before reductions for start up periods may not be representative of longer term
operating periods. Expenses net of fee waivers reflect expenses after reimbursement by the investment adviser but prior to reductions from
brokerage service arrangements or other expense offset arrangements. Expenses net of all reductions represent the net expenses paid by the
class.
H Amount represents less than $.01 per share.
|
See accompanying notes which are an integral part of the financial statements.
23 Semiannual Report
Notes to Financial Statements
For the period ended January 31, 2006 (Unaudited)
1. Significant Accounting Policies.
Fidelity Small Cap Growth Fund (the fund) is a non diversified fund of Fidelity Securi ties Fund (the trust) and is authorized to issue an unlimited number of shares. The trust is registered under the Investment Company Act of 1940, as amended (the 1940 Act), as an open end management investment company organized as a Massachusetts business trust.
The fund offers Class A, Class T, Class B, Class C, Small Cap Growth, and Institutional Class shares, each of which has equal rights as to assets and voting privileges. Each class has exclusive voting rights with respect to matters that affect that class. Class B shares will automatically convert to Class A shares after a holding period of seven years from the initial date of purchase. Investment income, realized and unrealized capital gains and losses, the common expenses of the fund, and certain fund level expense reductions, if any, are allocated on a pro rata basis to each class based on the relative net assets of each class to the total net assets of the fund. Each class differs with respect to transfer agent and distribution and service plan fees incurred. Certain expense reductions also differ by class.
The fund may invest in affiliated money market central funds (Money Market Central Funds) which are open end investment companies available to investment companies and other accounts managed by Fidelity Management & Research Company (FMR) and its affiliates. The financial statements have been prepared in conformity with accounting principles generally accepted in the United States of America, which require manage ment to make certain estimates and assumptions at the date of the financial statements. The following summarizes the significant accounting policies of the fund:
Security Valuation. Investments are valued and net asset value (NAV) per share is calculated (NAV calculation) as of the close of business of the New York Stock Exchange (NYSE), normally 4:00 p.m. Eastern time. Wherever possible, the fund uses independent pricing services approved by the Board of Trustees to value its investments.
Equity securities, including restricted securities, for which market quotations are readily available, are valued at the last reported sale price or official closing price as reported by an independent pricing service on the primary market or exchange on which they are traded. In the event there were no sales during the day or closing prices are not available, securities are valued at the last quoted bid price. Investments in open end mutual funds, are valued at their closing net asset value each business day. Short term securities with remaining maturities of sixty days or less for which quotations are not readily available are valued at amortized cost, which approximates value.
When current market prices or quotations are not readily available or do not accurately reflect fair value, valuations may be determined in accordance with procedures adopted by the Board of Trustees. For example, when developments occur between the close of a
| 1. Significant Accounting Policies continued |
Security Valuation continued | | |
market and the close of the NYSE that may materially affect the value of some or all of the securities, or when trading in a security is halted, those securities may be fair valued. Factors used in the determination of fair value may include monitoring news to identify significant market or security specific events such as changes in the value of U.S. securi ties markets, reviewing developments in foreign markets and evaluating the perfor mance of ADRs, futures contracts and exchange traded funds. Because the fund’s utilization of fair value pricing depends on market activity, the frequency with which fair value pricing is used can not be predicted and may be utilized to a significant extent. The value of securities used for NAV calculation under fair value pricing may differ from published prices for the same securities.
Foreign Currency. The fund uses foreign currency contracts to facilitate transactions in foreign denominated securities. Losses from these transactions may arise from changes in the value of the foreign currency or if the counterparties do not perform under the contracts’ terms.
Foreign denominated assets, including investment securities, and liabilities are trans lated into U.S. dollars at the exchange rate at period end. Purchases and sales of invest ment securities, income and dividends received and expenses denominated in foreign currencies are translated into U.S. dollars at the exchange rate in effect on the transac tion date.
The effects of exchange rate fluctuations on investments are included with the net realized and unrealized gain (loss) on investment securities. Other foreign currency transactions resulting in realized and unrealized gain (loss) are disclosed separately.
Investment Transactions and Income. Security transactions are accounted for as of trade date. Gains and losses on securities sold are determined on the basis of identified cost. Dividend income is recorded on the ex dividend date, except for certain dividends from foreign securities where the ex dividend date may have passed, which are recorded as soon as the fund is informed of the ex dividend date. Non cash dividends included in dividend income, if any, are recorded at the fair market value of the securities received. Distributions received on securities that represent a return of capital or capital gain are recorded as a reduction of cost of investments and/or as a realized gain. The fund esti mates the components of distributions received that may be considered return of capital distributions or capital gain distributions. Large, non recurring dividends recognized by the fund are presented separately on the Statement of Operations as “Special Dividends” and the impact of these dividends is presented in the Financial Highlights. Interest income is accrued as earned. Interest income includes coupon interest and amortization of premium and accretion of discount on debt securities. Investment income is recorded net of foreign taxes withheld where recovery of such taxes is uncertain.
25 Semiannual Report
| Notes to Financial Statements (Unaudited) continued |
1. Significant Accounting Policies continued |
Expenses. Most expenses of the trust can be directly attributed to a fund. Expenses which cannot be directly attributed are apportioned among each fund in the trust.
Income Tax Information and Distributions to Shareholders. Each year, the fund intends to qualify as a regulated investment company by distributing all of its taxable income and realized gains under Subchapter M of the Internal Revenue Code. As a result, no provision for income taxes is required in the accompanying financial statements. Foreign taxes are provided for based on the fund’s understanding of the tax rules and rates that exist in the foreign markets in which it invests.
Distributions are recorded on the ex dividend date. Income dividends and capital gain distributions are declared separately for each class. Income and capital gain distribu tions are determined in accordance with income tax regulations, which may differ from generally accepted accounting principles. In addition, the fund claimed a portion of the payment made to redeeming shareholders as a distribution for income tax purposes.
Capital accounts within the financial statements are adjusted for permanent book tax differences. These adjustments have no impact on net assets or the results of operations. Temporary book tax differences will reverse in a subsequent period.
Book tax differences are primarily due to foreign currency transactions, passive foreign investment companies (PFIC) and losses deferred due to wash sales.
The federal tax cost of investments and unrealized appreciation (depreciation) as of period end were as follows:
| Unrealized appreciation | | | $ | 54,447,942 |
| Unrealized depreciation | | | | (7,058,875) |
| Net unrealized appreciation (depreciation) | | | $ | 47,389,067 |
| Cost for federal income tax purposes | | | $ | 355,922,308 |
Short Term Trading (Redemption) Fees. Shares held in the fund less than 90 days are subject to a redemption fee equal to 1.50% of the proceeds of the redeemed shares. All redemption fees, including any estimated redemption fees paid by FMR, are retained by the fund and accounted for as an addition to paid in capital.
Repurchase Agreements. FMR has received an Exemptive Order from the Securities and Exchange Commission (the SEC) which permits the fund and other affiliated entities of FMR to transfer uninvested cash balances into joint trading accounts which are then invested in repurchase agreements. The fund may also invest directly with institutions in repurchase agreements. Repurchase agreements are collateralized by government or non government securities. Collateral is held in segregated accounts with custodian banks and may be obtained in the event of a default of the counterparty. The fund monitors, on a daily basis, the value of the collateral to ensure it is at least equal to
2. Operating Policies continued
Repurchase Agreements continued
the principal amount of the repurchase agreement (including accrued interest). In the event of a default by the counterparty, realization of the collateral proceeds could be delayed, during which time the value of the collateral may decline.
Restricted Securities. The fund may invest in securities that are subject to legal or contractual restrictions on resale. These securities generally may be resold in transac tions exempt from registration or to the public if the securities are registered. Disposal of these securities may involve time consuming negotiations and expense, and prompt sale at an acceptable price may be difficult. Information regarding restricted securities is included at the end of the fund’s Schedule of Investments.
3. Purchases and Sales of Investments.
Purchases and sales of securities, other than short term securities and U.S. government securities, aggregated $266,055,748 and $128,949,824, respectively.
4. Fees and Other Transactions with Affiliates.
Management Fee. FMR and its affiliates provide the fund with investment manage ment related services for which the fund pays a monthly management fee. The manage ment fee is the sum of an individual fund fee rate that is based on an annual rate of .45% of the fund’s average net assets and a group fee rate that averaged .27% during the period. The group fee rate is based upon the average net assets of all the mutual funds advised by FMR. The group fee rate decreases as assets under management increase and increases as assets under management decrease. In addition, the management fee is subject to a performance adjustment (up to a maximum of .20% of the fund’s average net assets over a 36 month performance period). The upward or downward adjustment to the management fee is based on the investment performance of the asset weighted return of Small Cap Growth (the original class) as compared to an appropriate bench mark index. The fund’s performance adjustment took effect in November 2005. Subse quent months will be added until the performance period includes 36 months. For the period, the total annualized management fee rate, including the performance adjust ment, was .78% of the fund’s average net assets.
Distribution and Service Plan. In accordance with Rule 12b 1 of the 1940 Act, the fund has adopted separate Distribution and Service Plans for each class of shares. Certain classes pay Fidelity Distributors Corporation (FDC), an affiliate of FMR, separate Distribution and Service Fees, each of which is based on an annual percentage of each class’ average net assets. In addition, FDC may pay financial intermediaries for selling
27 Semiannual Report
| Notes to Financial Statements (Unaudited) continued |
| |
| 4. Fees and Other Transactions with Affiliates continued |
Distribution and Service Plan continued |
shares of the fund and providing shareholder support services. For the period, the Distribution and Service Fee rates and the total amounts paid to and retained by FDC were as follows:
| | | Distribution | | Service | | | | Paid to | | | | Retained |
| | | Fee | | Fee | | | | FDC | | | | by FDC |
| Class A | | 0% | | .25% | | | $ | 9,490 | | | $ | 728 |
| Class T | | 25% | | .25% | | | | 17,702 | | | | 2,098 |
| Class B | | 75% | | .25% | | | | 13,818 | | | | 11,261 |
| Class C | | 75% | | .25% | | | | 50,244 | | | | 20,167 |
| |
| | | | | | | | $ | 91,254 | | | $ | 34,254 |
Sales Load. FDC receives a front end sales charge of up to 5.75% for selling Class A shares, and 3.50% for selling Class T shares, some of which is paid to financial intermedi aries for selling shares of the fund. FDC receives the proceeds of contingent deferred sales charges levied on Class A, Class T, Class B, and Class C redemptions. These charges depend on the holding period. The deferred sales charges range from 5% to 1% for Class B, 1% for Class C, and ..25% for certain purchases of Class A and Class T shares.
For the period, sales charge amounts retained by FDC were as follows:
| | |
| | | | | Retained |
| | | | | by FDC |
| Class A | | | $ | 25,490 |
| Class T | | | | 4,084 |
| Class B* | | | | 889 |
| Class C* | | | | 1,015 |
| | | | $ | 31,478 |
* When Class B and Class C shares are initially sold, FDC pays commissions from its own resources to financial intermediaries through which the sales are made.
Transfer Agent Fees. Fidelity Investments Institutional Operations Company, Inc. (FIIOC), an affiliate of FMR, is the transfer, dividend disbursing and shareholder servic ing agent for each class of the fund, except for Small Cap Growth. Fidelity Service Company, Inc. (FSC), an affiliate of FMR, is the transfer agent for Small Cap Growth shares. FIIOC and FSC receive account fees and asset based fees that vary according to the account size and type of account of the shareholders of the respective classes of the fund. FIIOC and FSC pay for typesetting, printing and mailing of shareholder reports,
| 4. Fees and Other Transactions with Affiliates continued |
Transfer Agent Fees continued | | |
except proxy statements. For the period the total transfer agent fees paid by each class to FIIOC or FSC, were as follows:
| | | | | | | % of |
| | | | | | | Average |
| | | | | Amount | | Net Assets |
| Class A | | | $ | 13,833 | | .37* |
| Class T | | | | 12,451 | | .35* |
| Class B | | | | 4,929 | | .36* |
| Class C | | | | 16,009 | | .32* |
| Small Cap Growth | | | | 222,054 | | .17* |
| Institutional Class | | | | 3,647 | | .22* |
| | | | $ | 272,923 | | |
| * Annualized | | | | | | |
Accounting and Security Lending Fees. FSC maintains the fund’s accounting rec ords. The accounting fee is based on the level of average net assets for the month. Under a separate contract, FSC administers the security lending program. The security lending fee is based on the number and duration of lending transactions.
Affiliated Central Funds. The fund may invest in Money Market Central Funds which seek preservation of capital and current income and are managed by Fidelity Invest ments Money Management, Inc. (FIMM), an affiliate of FMR.
The Money Market Central Funds do not pay a management fee.
Brokerage Commissions. The fund placed a portion of its portfolio transactions with brokerage firms which are affiliates of the investment adviser. The commissions paid to these affiliated firms were $13,964 for the period.
5. Committed Line of Credit.
|
The fund participates with other funds managed by FMR in a $4.2 billion credit facility (the “line of credit”) to be utilized for temporary or emergency purposes to fund share holder redemptions or for other short term liquidity purposes. The fund has agreed to pay commitment fees on its pro rata portion of the line of credit. During the period, there were no borrowings on this line of credit.
29 Semiannual Report
| Notes to Financial Statements (Unaudited) continued |
6. Security Lending. | | |
The fund lends portfolio securities from time to time in order to earn additional income. On the settlement date of the loan, the fund receives collateral (in the form of U.S. Treasury obligations, letters of credit and/or cash) against the loaned securities and maintains collateral in an amount not less than 100% of the market value of the loaned securities during the period of the loan. The market value of the loaned securities is determined at the close of business of the fund and any additional required collateral is delivered to the fund on the next business day. If the borrower defaults on its obligation to return the securities loaned because of insolvency or other reasons, a fund could experience delays and costs in recovering the securities loaned or in gaining access to the collateral. Any cash collateral received is invested in the Fidelity Securities Lending Cash Central Fund. The value of loaned securities and cash collateral at period end are disclosed on the fund’s Statement of Assets and Liabilities. Security lending income represents the income earned on investing cash collateral, less fees and expenses associated with the loan, plus any premium payments that may be received on the loan of certain types of securities. Security lending income is presented in the Statement of Operations as a component of income from affiliated central funds. Net income from lending portfolio securities during the period amounted to $12,921.
FMR voluntarily agreed to reimburse each class to the extent annual operating expenses exceeded certain levels of average net assets as noted in the table below. Some expenses, for example interest expense, are excluded from this reimbursement.
The following classes were in reimbursement during the period:
| | | | |
| | | Expense | | | | Reimbursement |
| | | Limitations | | | | from adviser |
| Class A | | 1.40% | | | $ | 5,183 |
| Class T | | 1.65% | | | | 4,337 |
| Class B | | 2.15% | | | | 1,771 |
| Class C | | 2.15% | | | | 4,376 |
| | | | | | $ | 15,667 |
Many of the brokers with whom FMR places trades on behalf of the fund provided services to the fund in addition to trade execution. These services included payments of certain expenses on behalf of the fund totaling $103,072 for the period. In addition, through arrangements with the fund’s custodian and each class’ transfer agent, credits realized as a result of uninvested cash balances were used to reduce the fund’s expenses. During the period, these credits reduced the fund’s custody expenses by $1,801. During
7. Expense Reductions - continued
the period, credits reduced each class’ transfer agent expense as noted in the table below.
| | | Transfer Agent |
| | | expense reduction |
| Small Cap Growth | | $ | | 109 |
| Institutional Class | | | | 452 |
| | | $ | | 561 |
| |
| |
| 8. Other. | | | | |
The fund’s organizational documents provide former and current trustees and officers with a limited indemnification against liabilities arising in connection with the performance of their duties to the fund. In the normal course of business, the fund may also enter into contracts that provide general indemnifications. The fund’s maximum exposure under these arrangements is unknown as this would be dependent on future claims that may be made against the fund. The risk of material loss from such claims is considered remote.
| 9. Distributions to Shareholders. | | | | | | |
| |
Distributions to shareholders of each class were as follows:
| | | | | | |
| | | | | Six months ended | | | | Year ended | | |
| | | | | January 31, | | | | July 31, | | |
| | | | | 2006 | | | | 2005A | | |
| From net realized gain | | | | | | | | | | |
| Class A | | | $ | 79,075 | | | $ | | | — |
| Class T | | | | 63,628 | | | | | | — |
| Class B | | | | 16,296 | | | | | | — |
| Class C | | | | 71,642 | | | | | | — |
| Small Cap Growth | | | | 3,518,781 | | | | | | — |
| Institutional Class | | | | 30,058 | | | | | | — |
| Total | | | $ | 3,779,480 | | | $ | | | — |
A For the period November 3, 2004 (commencement of operations) to July 31, 2005. | | | | | | |
31 Semiannual Report
| Notes to Financial Statements (Unaudited) continued |
| |
| |
| 10. Share Transactions. | | | | | | | | | | |
| |
Transactions for each class of shares were as follows:
| | | | | | | | |
| | | Shares | | Dollars |
| | | Six months ended | | Year ended | | Six months ended | | | | Year ended |
| | | January 31, | | July 31, | | January 31, | | | | July 31, |
| | | 2006 | | 2005A | | 2006 | | | | 2005A |
| Class A | | | | | | | | | | | | |
| Shares sold | | 554,813 | | 377,650 | | | | $ 7,172,589 | | | | $ 4,304,515 |
| Reinvestment of distributions | | 5,381 | | — | | | | 70,352 | | | | — |
| Shares redeemed | | (78,430) | | (13,200) | | | | (1,015,894) | | | | (157,404) |
| Net increase (decrease) | | 481,764 | | 364,450 | | | | $ 6,227,047 | | | | $ 4,147,111 |
| Class T | | | | | | | | | | | | |
| Shares sold | | 558,733 | | 432,704 | | | | $ 7,321,338 | | | | $ 4,904,069 |
| Reinvestment of distributions | | 4,866 | | — | | | | 63,445 | | | | — |
| Shares redeemed | | (110,217) | | (27,332) | | | | (1,411,094) | | | | (327,972) |
| Net increase (decrease) | | 453,382 | | 405,372 | | | | $ 5,973,689 | | | | $ 4,576,097 |
| Class B | | | | | | | | | | | | |
| Shares sold | | 130,631 | | 169,626 | | | | $ 1,681,126 | | | | $ 1,864,130 |
| Reinvestment of distributions | | 1,204 | | — | | | | 15,610 | | | | — |
| Shares redeemed | | (19,547) | | (10,003) | | | | (252,382) | | | | (113,030) |
| Net increase (decrease) | | 112,288 | | 159,623 | | | | $ 1,444,354 | | | | $ 1,751,100 |
| Class C | | | | | | | | | | | | |
| Shares sold | | 378,699 | | 664,094 | | | | $ 4,874,538 | | | | $ 7,429,424 |
| Reinvestment of distributions | | 5,289 | | — | | | | 68,602 | | | | — |
| Shares redeemed | | (115,053) | | (14,036) | | | | (1,477,514) | | | | (166,606) |
| Net increase (decrease) | | 268,935 | | 650,058 | | | | $ 3,465,626 | | | | $ 7,262,818 |
| Small Cap Growth | | | | | | | | | | | | |
| Shares sold | | 12,356,450 | | 18,162,749 | | | | $160,594,584 | | | | $212,509,370 |
| Reinvestment of distributions | | 226,620 | | — | | | | 2,968,828 | | | | — |
| Shares redeemed | | (3,439,456) | | (2,320,313) | | (43,857,334) | | (26,565,039) |
| Net increase (decrease) | | 9,143,614 | | 15,842,436 | | | | $119,706,078 | | | | $185,944,331 |
| Institutional Class | | | | | | | | | | | | |
| Shares sold | | 507,176 | | 170,585 | | | | $ 6,598,183 | | | | $ 1,883,777 |
| Reinvestment of distributions | | 1,705 | | — | | | | 22,327 | | | | — |
| Shares redeemed | | (35,213) | | (23,631) | | | | (457,560) | | | | (261,946) |
| Net increase (decrease) | | 473,668 | | 146,954 | | | | $ 6,162,950 | | | | $ 1,621,831 |
A For the period November 3, 2004 (commencement of operations) to July 31, 2005. | | | | | | | | |
Board Approval of Investment Advisory Contracts and Management Fees
Fidelity Small Cap Growth Fund
On January 19, 2006, the Board of Trustees, including the Independent Trustees (together, the Board), voted to approve a general research services agreement (the Agreement) between FMR, FMR Co., Inc. (FMRC), Fidelity Investments Money Manage ment, Inc. (FIMM), and Fidelity Research & Analysis Company (FRAC) (together, the Investment Advisers) for the fund, effective January 20, 2006, pursuant to which FRAC may provide general research and investment advisory support services to FMRC and FIMM. The Board considered that it has approved previously various sub advisory agreements for the fund with affiliates of FMR that allow FMR to obtain research, non discretionary advice, or discretionary portfolio management at no additional expense to the fund. The Board, assisted by the advice of fund counsel and independent Trustees’ counsel, considered a broad range of information and determined that it would be beneficial for the fund to access the research and investment advisory support services supplied by FRAC at no additional expense to the fund.
The Board reached this determination in part because the new arrangement will involve no changes in (i) the contractual terms of and fees payable under the fund’s manage ment contract or sub advisory agreements; (ii) the investment process or strategies employed in the management of the fund’s assets; (iii) the nature or level of services provided under the fund’s management contract or sub advisory agreements; (iv) the day to day management of the fund or the persons primarily responsible for such man agement; or (v) the ultimate control or beneficial ownership of FMR, FMRC, or FIMM. The Board also considered that the establishment of the Agreement would not necessi tate prior shareholder approval of the Agreement or result in an assignment and termination of the fund’s management contract or sub advisory agreements under the Investment Company Act of 1940.
Because the Board was approving an arrangement with FRAC under which the fund will not bear any additional management fees or expenses and under which the fund’s portfolio manager would not change, it did not consider the fund’s investment perfor mance, competitiveness of management fee and total expenses, costs of services and profitability, or economies of scale to be significant factors in its decision.
In connection with its future renewal of the fund’s management contract and sub advisory agreements, the Board will consider: (i) the nature, extent, and quality of services provided to the fund, including shareholder and administrative services and investment performance; (ii) the competitiveness of the fund’s management fee and total expenses; (iii) the costs of the services and profitability, including the revenues earned and the expenses incurred by Fidelity in conducting the business of developing, marketing, distributing, managing, administering, and servicing the fund and its shareholders; and (iv) whether there have been economies of scale in respect of the management of the Fidelity funds, whether the Fidelity funds (including the fund) have
33 Semiannual Report
Board Approval of Investment Advisory Contracts and Management Fees continued
appropriately benefited from any such economies of scale, and whether there is potential for realization of any further economies.
Based on its evaluation of all of the conclusions noted above, and after considering all material factors, the Board ultimately concluded that the fund’s Agreement is fair and reasonable, and that the fund’s Agreement should be approved.
35 Semiannual Report
37 Semiannual Report
39 Semiannual Report
Investment Adviser
Fidelity Management & Research Company
Boston, MA
Investment Sub Advisers
FMR Co., Inc.
Fidelity Management & Research
(U.K.) Inc.
Fidelity Research & Analysis Company
(formerly Fidelity Management & Research
(Far East) Inc.)
Fidelity International Investment Advisors
Fidelity Investments Japan Limited
Fidelity International Investment Advisors (U.K.) Limited
General Distributor
Fidelity Distributors Corporation
Boston, MA
Transfer and Service Agents
Fidelity Investments Institutional
Operations Company, Inc.
Boston, MA
Fidelity Service Company, Inc.
Boston, MA
Custodian
Citibank, N.A.
New York, NY
|
ASCPI-USAN-0306
1.803724.101
|

Item 2. Code of Ethics
Not applicable.
Item 3. Audit Committee Financial Expert
Not applicable.
Item 4. Principal Accountant Fees and Services
Not applicable.
Item 5. Audit Committee of Listed Registrants
Not applicable.
Item 6. Schedule of Investments
Not applicable.
Item 7. Disclosure of Proxy Voting Policies and Procedures for Closed-End Management Investment Companies
Not applicable.
Item 8. Portfolio Managers of Closed-End Management Investment Companies
Not applicable.
Item 9. Purchase of Equity Securities by Closed-End Management Investment Company and Affiliated Purchasers
Not applicable.
Item 10. Submission of Matters to a Vote of Security Holders
There were no material changes to the procedures by which shareholders may recommend nominees to the Fidelity Securities Fund: Fidelity Small Cap Growth Fund's Board of Trustees.
Item 11. Controls and Procedures
(a)(i) The President and Treasurer and the Chief Financial Officer have concluded that the Fidelity Securities Fund: Fidelity Small Cap Growth Fund's (the "Fund") disclosure controls and procedures (as defined in Rule 30a-3(c) under the Investment Company Act) provide reasonable assurances that material information relating to the Fund is made known to them by the appropriate persons, based on their evaluation of these controls and procedures as of a date within 90 days of the filing date of this report.
(a)(ii) There was no change in the Fund's internal control over financial reporting (as defined in Rule 30a-3(d) under the Investment Company Act) that occurred during the second fiscal quarter of the period covered by this report that has materially affected, or is reasonably likely to materially affect, the Fund's internal control over financial reporting.
Item 12. Exhibits
(a) | (1) | Not applicable. |
(a) | (2) | Certification pursuant to Rule 30a-2(a) under the Investment Company Act of 1940 (17 CFR 270.30a-2(a)) is filed and attached hereto as Exhibit 99.CERT. |
(a) | (3) | Not applicable. |
(b) | | Certification pursuant to Rule 30a-2(b) under the Investment Company Act of 1940 (17 CFR 270.30a-2(b)) is furnished and attached hereto as Exhibit 99.906CERT. |
SIGNATURES
Pursuant to the requirements of the Securities Exchange Act of 1934 and the Investment Company Act of 1940, the registrant has duly caused this report to be signed on its behalf by the undersigned, thereunto duly authorized.
Fidelity Securities Fund
By: | /s/Christine Reynolds |
| Christine Reynolds |
| President and Treasurer |
| |
Date: | March 17, 2006 |
Pursuant to the requirements of the Securities Exchange Act of 1934 and the Investment Company Act of 1940, this report has been signed below by the following persons on behalf of the registrant and in the capacities and on the dates indicated.
By: | /s/Christine Reynolds |
| Christine Reynolds |
| President and Treasurer |
| |
Date: | March 17, 2006 |
By: | /s/Paul M. Murphy |
| Paul M. Murphy |
| Chief Financial Officer |
| |
Date: | March 17, 2006 |