UNITED STATES
SECURITIES AND EXCHANGE COMMISSION
Washington, D.C. 20549
FORM N-CSR
CERTIFIED SHAREHOLDER REPORT OF REGISTERED
MANAGEMENT INVESTMENT COMPANIES
Investment Company Act file number 811-4118
Fidelity Securities Fund
(Exact name of registrant as specified in charter)
245 Summer St., Boston, Massachusetts 02210
(Address of principal executive offices) (Zip code)
Marc Bryant, Secretary
245 Summer St.
Boston, Massachusetts 02210
(Name and address of agent for service)
Registrant's telephone number, including area code: 617-563-7000
Date of fiscal year end: | July 31 |
| |
Date of reporting period: | July 31, 2015 |
Item 1. Reports to Stockholders
ContentsPerformance: The Bottom LineManagement's Discussion of Fund PerformanceShareholder Expense ExampleInvestment Changes (Unaudited)Investments July 31, 2015Financial StatementsNotes to Financial StatementsReport of Independent Registered Public Accounting FirmTrustees and OfficersDistributions (Unaudited)Board Approval of Investment Advisory Contracts and Management FeesContentsPerformance: The Bottom LineManagement's Discussion of Fund PerformanceShareholder Expense ExampleInvestment Changes (Unaudited)Investments July 31, 2015Financial StatementsNotes to Financial StatementsReport of Independent Registered Public Accounting FirmTrustees and OfficersDistributions (Unaudited)Board Approval of Investment Advisory Contracts and Management FeesContentsPerformance: The Bottom LineManagement's Discussion of Fund PerformanceShareholder Expense ExampleInvestment Changes (Unaudited)Investments July 31, 2015Financial StatementsNotes to Financial StatementsReport of Independent Registered Public Accounting FirmTrustees and OfficersDistributions (Unaudited)Board Approval of Investment Advisory Contracts and Management FeesContentsPerformance: The Bottom LineManagement's Discussion of Fund PerformanceShareholder Expense ExampleInvestment Changes (Unaudited)Investments July 31, 2015Financial StatementsNotes to Financial StatementsReport of Independent Registered Public Accounting FirmTrustees and OfficersDistributions (Unaudited)Board Approval of Investment Advisory Contracts and Management FeesContentsPerformance: The Bottom LineManagement's Discussion of Fund PerformanceShareholder Expense ExampleInvestment Changes (Unaudited)Investments July 31, 2015Financial StatementsNotes to Financial StatementsReport of Independent Registered Public Accounting FirmTrustees and OfficersDistributions (Unaudited)Board Approval of Investment Advisory Contracts and Management Fees
Fidelity®
Small Cap Growth
Fund
Annual Report
July 31, 2015
(Fidelity Cover Art)
Contents
Performance | (Click Here) | How the fund has done over time. |
Management's Discussion of Fund Performance | (Click Here) | The Portfolio Manager's review of fund performance and strategy. |
Shareholder Expense Example | (Click Here) | An example of shareholder expenses. |
Investment Changes | (Click Here) | A summary of major shifts in the fund's investments over the past six months. |
Investments | (Click Here) | A complete list of the fund's investments with their market values. |
Financial Statements | (Click Here) | Statements of assets and liabilities, operations, and changes in net assets, as well as financial highlights. |
Notes | (Click Here) | Notes to the financial statements. |
Report of Independent Registered Public Accounting Firm | (Click Here) | |
Trustees and Officers | (Click Here) | |
Distributions | (Click Here) | |
Board Approval of Investment Advisory Contracts and Management Fees | (Click Here) | |
To view a fund's proxy voting guidelines and proxy voting record for the 12-month period ended June 30, visit http://www.fidelity.com/proxyvotingresults or visit the Securities and Exchange Commission's (SEC) web site at http://www.sec.gov. You may also call 1-800-544-8544 to request a free copy of the proxy voting guidelines.
Standard & Poor's, S&P and S&P 500 are registered service marks of The McGraw-Hill Companies, Inc. and have been licensed for use by Fidelity Distributors Corporation.
Other third-party marks appearing herein are the property of their respective owners.
All other marks appearing herein are registered or unregistered trademarks or service marks of FMR LLC or an affiliated company. © 2015 FMR LLC. All rights reserved.
Annual Report
This report and the financial statements contained herein are submitted for the general information of the shareholders of the fund. This report is not authorized for distribution to prospective investors in the fund unless preceded or accompanied by an effective prospectus.
A fund files its complete schedule of portfolio holdings with the SEC for the first and third quarters of each fiscal year on Form N-Q. Forms N-Q are available on the SEC's web site at http://www.sec.gov. A fund's Forms N-Q may be reviewed and copied at the SEC's Public Reference Room in Washington, DC. Information regarding the operation of the SEC's Public Reference Room may be obtained by calling 1-800-SEC-0330. For a complete list of a fund's portfolio holdings, view the most recent holdings listing, semiannual report, or annual report on Fidelity's web site at http://www.fidelity.com, http://www.advisor.fidelity.com, or http://www.401k.com, as applicable.
NOT FDIC INSURED • MAY LOSE VALUE • NO BANK GUARANTEE
Neither the fund nor Fidelity Distributors Corporation is a bank.
Annual Report
Average annual total return reflects the change in the value of an investment, assuming reinvestment of the class' distributions from dividend income and capital gains (the profits earned upon the sale of securities that have grown in value, if any) and assuming a constant rate of performance each year. The $10,000 table and the fund's returns do not reflect the deduction of taxes that a shareholder would pay on fund distributions or the redemption of fund shares. During periods of reimbursement by Fidelity, a fund's total return will be greater than it would be had the reimbursement not occurred. How a fund did yesterday is no guarantee of how it will do tomorrow.
Average Annual Total Returns
Periods ended July 31, 2015 | Past 1
year | Past 5
years | Past 10
years |
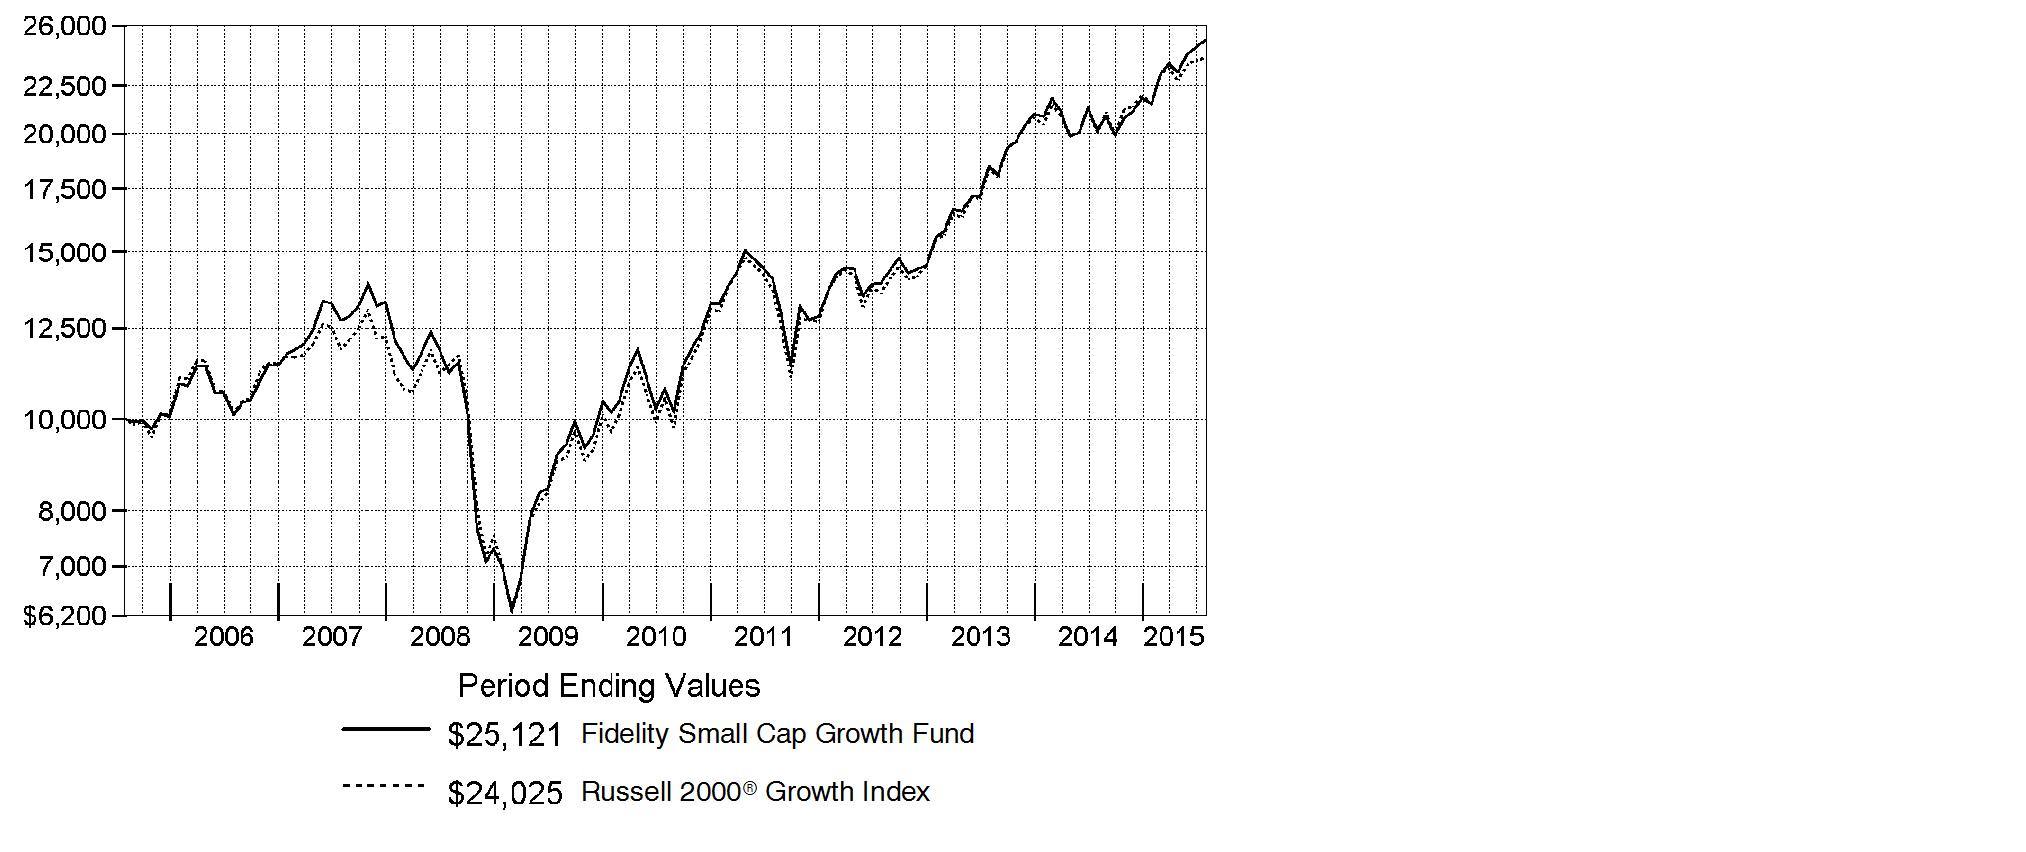
Fidelity® Small Cap Growth Fund | 24.91% | 18.43% | 9.65% |
$10,000 Over 10 Years
Let's say hypothetically that $10,000 was invested in Fidelity® Small Cap Growth Fund, a class of the fund, on July 31, 2005. The chart shows how the value of your investment would have changed, and also shows how the Russell 2000® Growth Index performed over the same period.
Annual Report
Market Recap: The U.S. equity market gained strongly for the 12 months ending July 31, 2015, as stocks recovered from volatility in late 2014 and early 2015, supported by a still-positive economic backdrop. The S&P 500® Index returned 11.21%, with growth stocks in the index far outpacing value-oriented names on prospects for continued U.S. economic growth. Consequently, the growth-oriented Nasdaq Composite Index® rose 18.71%, outpacing the broader S&P 500®, as well as the 12.03% advance of the smaller-cap Russell 2000® Index. Within the S&P 500®, seven of 10 sectors notched a gain, with significant performance variation. Health care (+27%) led the way, aided by merger activity. Consumer discretionary (+24%) benefited from spending linked to a seven-year low in unemployment. Strong first halves for the consumer staples sector and the real estate segment of financials yielded above-market returns (19% and 12%, respectively) for the full-year period. Conversely, energy (-26%) significantly lagged, due to a roughly 55% decline for U.S. crude-oil prices. Materials (-4%) also lost ground. At period end, investors remained focused on the slowing rate of U.S. earnings growth, the possible effect of a relatively stronger U.S. dollar on exports and inflation, and whether an economic slowdown in China would create ripples for the global economy.
Comments from Portfolio Manager Patrick Venanzi: For the year, the fund's share classes easily outperformed the 20.07% return of the benchmark Russell 2000® Growth Index. (For specific class-level results, please see the Performance section of this report.) Security selection was the main driver behind relative results. Picks within consumer discretionary and information technology helped. The top individual contributor was an overweighting in 2U, which provides cloud-based online campuses and learning platforms for nonprofit colleges and universities. The company had consecutive quarters of good earnings results, with the stock jumping in March when Yale University announced it would partner with 2U on building an online degree program. Shares rose again in May after the firm announced first-quarter financial results that beat expectations, and increased guidance for full-year 2015 results. Conversely, we were hurt by a non-index stake in Accretive Health, a provider of revenue cycle management solutions for hospitals. First, shares tumbled in December 2014 after the firm released disappointing 2013 financial results. Then in July, key client Ascension Health offered to buy the firm below its current value. Accretive reported it was searching for "strategic alternatives" and that it would not renew its contract with Ascension - a major source of the firm's 2014 revenue. The stock subsequently plunged.
The views expressed above reflect those of the portfolio manager(s) only through the end of the period as stated on the cover of this report and do not necessarily represent the views of Fidelity or any other person in the Fidelity organization. Any such views are subject to change at any time based upon market or other conditions and Fidelity disclaims any responsibility to update such views. These views may not be relied on as investment advice and, because investment decisions for a Fidelity fund are based on numerous factors, may not be relied on as an indication of trading intent on behalf of any Fidelity fund.
Annual Report
Shareholder Expense Example
As a shareholder of the Fund, you incur two types of costs: (1) transaction costs, including sales charges (loads) on purchase payments or redemption proceeds, redemption fees and (2) ongoing costs, including management fees, distribution and/or service (12b-1) fees and other Fund expenses. This Example is intended to help you understand your ongoing costs (in dollars) of investing in the Fund and to compare these costs with the ongoing costs of investing in other mutual funds.
The Example is based on an investment of $1,000 invested at the beginning of the period and held for the entire period (February 1, 2015 to July 31, 2015).
Actual Expenses
The first line of the accompanying table for each class of the Fund provides information about actual account values and actual expenses. You may use the information in this line, together with the amount you invested, to estimate the expenses that you paid over the period. Simply divide your account value by $1,000.00 (for example, an $8,600 account value divided by $1,000.00 = 8.6), then multiply the result by the number in the first line for a class of the Fund under the heading entitled "Expenses Paid During Period" to estimate the expenses you paid on your account during this period. A small balance maintenance fee of $12.00 that is charged once a year may apply for certain accounts with a value of less than $2,000. This fee is not included in the table below. If it was, the estimate of expenses you paid during the period would be higher, and your ending account value lower, by this amount. In addition, the Fund, as a shareholder in the underlying Fidelity Central Funds, will indirectly bear its pro-rata share of the fees and expenses incurred by the underlying Fidelity Central Funds. These fees and expenses are not included in the Fund's annualized expense ratio used to calculate the expense estimate in the table below.
Hypothetical Example for Comparison Purposes
The second line of the accompanying table for each class of the Fund provides information about hypothetical account values and hypothetical expenses based on a Class' actual expense ratio and an assumed rate of return of 5% per year before expenses, which is not the Class' actual return. The hypothetical account values and expenses may not be used to estimate the actual ending account balance or expenses you paid for the period. You may use this information to compare the ongoing costs of investing in the Fund and other funds. To do so, compare this 5% hypothetical example with the 5% hypothetical examples that appear in the shareholder reports of the other funds. A small balance maintenance fee of $12.00 that is charged once a year may apply for certain accounts with a value of less than $2,000. This fee is not included in the table below. If it was, the estimate of expenses you paid during the period would be higher, and your ending account value lower, by this amount. In addition, the Fund, as a shareholder in the underlying Fidelity Central Funds, will indirectly bear its pro-rata share of the fees and expenses incurred by the underlying Fidelity Central Funds. These fees and expenses are not included in the Fund's annualized expense ratio used to calculate the expense estimate in the table below.
Please note that the expenses shown in the table are meant to highlight your ongoing costs only and do not reflect any transaction costs. Therefore, the second line of the table is useful in comparing ongoing costs only, and will not help you determine the relative total costs of owning different funds. In addition, if these transactional costs were included, your costs would have been higher.
Annual Report
Shareholder Expense Example - continued
| Annualized
Expense Ratio B | Beginning
Account Value
February 1, 2015 | Ending
Account Value
July 31, 2015 | Expenses Paid
During Period*
February 1, 2015
to July 31, 2015 |
Class A | 1.26% | | | |
Actual | | $ 1,000.00 | $ 1,165.60 | $ 6.77 |
Hypothetical A | | $ 1,000.00 | $ 1,018.55 | $ 6.31 |
Class T | 1.54% | | | |
Actual | | $ 1,000.00 | $ 1,164.10 | $ 8.26 |
HypotheticalA | | $ 1,000.00 | $ 1,017.16 | $ 7.70 |
Class B | 2.09% | | | |
Actual | | $ 1,000.00 | $ 1,161.50 | $ 11.20 |
Hypothetical A | | $ 1,000.00 | $ 1,014.43 | $ 10.44 |
Class C | 2.05% | | | |
Actual | | $ 1,000.00 | $ 1,161.60 | $ 10.99 |
Hypothetical A | | $ 1,000.00 | $ 1,014.63 | $ 10.24 |
Small Cap Growth | .97% | | | |
Actual | | $ 1,000.00 | $ 1,168.00 | $ 5.21 |
HypotheticalA | | $ 1,000.00 | $ 1,019.98 | $ 4.86 |
Class I | .97% | | | |
Actual | | $ 1,000.00 | $ 1,167.70 | $ 5.21 |
HypotheticalA | | $ 1,000.00 | $ 1,019.98 | $ 4.86 |
A 5% return per year before expenses
B Annualized expense ratio reflects expenses net of applicable fee waivers.
* Expenses are equal to each Class' annualized expense ratio, multiplied by the average account value over the period, multiplied by 181/365 (to reflect the one-half year period).
Annual Report
Investment Changes (Unaudited)
Top Ten Stocks as of July 31, 2015 |
| % of fund's
net assets | % of fund's net assets
6 months ago |
2U, Inc. | 2.4 | 1.3 |
Global Payments, Inc. | 1.4 | 1.8 |
Huron Consulting Group, Inc. | 1.4 | 1.7 |
G-III Apparel Group Ltd. | 1.3 | 1.6 |
Vail Resorts, Inc. | 1.2 | 1.4 |
Gartner, Inc. Class A | 1.2 | 1.6 |
Mentor Graphics Corp. | 1.2 | 0.0 |
Starz Series A | 1.2 | 0.0 |
Deluxe Corp. | 1.2 | 0.0 |
Universal Electronics | 1.1 | 1.2 |
| 13.6 | |
Top Five Market Sectors as of July 31, 2015 |
| % of fund's
net assets | % of fund's net assets
6 months ago |
Health Care | 29.2 | 26.3 |
Information Technology | 24.4 | 26.3 |
Consumer Discretionary | 17.3 | 17.5 |
Industrials | 14.5 | 14.0 |
Financials | 5.3 | 7.3 |
Asset Allocation (% of fund's net assets) |
As of July 31, 2015* | As of January 31, 2015** |
 | Stocks 96.0% | |  | Stocks 97.5% | |
 | Other Investments 1.9% | |  | Other Investments 1.2% | |
 | Short-Term
Investments and
Net Other Assets (Liabilities) 2.1% | |  | Short-Term
Investments and
Net Other Assets (Liabilities) 1.3% | |
* Foreign investments | 3.6% | | ** Foreign investments | 3.1% | |

Annual Report
Investments July 31, 2015
Showing Percentage of Net Assets
Common Stocks - 96.0% |
| Shares | | Value |
CONSUMER DISCRETIONARY - 17.3% |
Auto Components - 0.7% |
Tenneco, Inc. (a) | 145,400 | | $ 7,242,374 |
Visteon Corp. (a) | 54,100 | | 5,384,573 |
| | 12,626,947 |
Diversified Consumer Services - 3.2% |
2U, Inc. (a)(d) | 1,274,330 | | 40,893,251 |
Service Corp. International | 429,100 | | 13,091,841 |
| | 53,985,092 |
Hotels, Restaurants & Leisure - 3.1% |
Churchill Downs, Inc. | 22,055 | | 2,978,748 |
DineEquity, Inc. | 110,000 | | 11,441,100 |
Domino's Pizza, Inc. | 80,000 | | 9,107,200 |
Vail Resorts, Inc. | 190,800 | | 20,928,852 |
Wingstop, Inc. (d) | 230,800 | | 7,911,824 |
| | 52,367,724 |
Household Durables - 2.3% |
Libbey, Inc. | 124,998 | | 4,651,176 |
Tempur Sealy International, Inc. (a) | 210,000 | | 15,865,500 |
Universal Electronics, Inc. (a) | 364,209 | | 18,880,595 |
| | 39,397,271 |
Internet & Catalog Retail - 0.4% |
HSN, Inc. | 85,615 | | 6,293,559 |
Leisure Products - 0.7% |
Malibu Boats, Inc. Class A (a) | 369,100 | | 7,127,321 |
Vista Outdoor, Inc. (a) | 90,000 | | 4,245,300 |
| | 11,372,621 |
Media - 4.7% |
AMC Networks, Inc. Class A (a) | 175,019 | | 14,740,100 |
Crown Media Holdings, Inc. Class A (a) | 7,275 | | 32,519 |
Gray Television, Inc. (a) | 250,000 | | 4,222,500 |
IMAX Corp. (a) | 310,000 | | 11,597,100 |
Live Nation Entertainment, Inc. (a) | 455,200 | | 11,935,344 |
Nexstar Broadcasting Group, Inc. Class A | 280,000 | | 16,060,800 |
Starz Series A (a) | 493,945 | | 19,980,075 |
| | 78,568,438 |
Specialty Retail - 0.5% |
Asbury Automotive Group, Inc. (a) | 90,000 | | 7,947,000 |
Common Stocks - continued |
| Shares | | Value |
CONSUMER DISCRETIONARY - continued |
Textiles, Apparel & Luxury Goods - 1.7% |
G-III Apparel Group Ltd. (a) | 301,800 | | $ 21,799,014 |
Unifi, Inc. (a) | 200,000 | | 6,172,000 |
| | 27,971,014 |
TOTAL CONSUMER DISCRETIONARY | | 290,529,666 |
CONSUMER STAPLES - 1.5% |
Food Products - 0.9% |
Pinnacle Foods, Inc. | 330,000 | | 14,833,500 |
Household Products - 0.6% |
Spectrum Brands Holdings, Inc. | 95,000 | | 10,065,250 |
TOTAL CONSUMER STAPLES | | 24,898,750 |
ENERGY - 0.8% |
Energy Equipment & Services - 0.5% |
Dril-Quip, Inc. (a) | 83,900 | | 4,900,599 |
Superior Drilling Products, Inc. (a)(e) | 1,168,655 | | 1,928,281 |
Xtreme Drilling & Coil Services Corp. (a) | 1,289,000 | | 2,552,670 |
| | 9,381,550 |
Oil, Gas & Consumable Fuels - 0.3% |
StealthGas, Inc. (a) | 890,400 | | 5,012,952 |
TOTAL ENERGY | | 14,394,502 |
FINANCIALS - 5.3% |
Banks - 1.7% |
Investors Bancorp, Inc. | 1,000,000 | | 12,180,000 |
Pacific Premier Bancorp, Inc. (a) | 899,977 | | 17,108,563 |
| | 29,288,563 |
Capital Markets - 0.4% |
E*TRADE Financial Corp. (a) | 250,200 | | 7,110,684 |
Consumer Finance - 0.5% |
PRA Group, Inc. (a)(d) | 120,493 | | 7,657,330 |
Insurance - 1.3% |
AmTrust Financial Services, Inc. | 100,000 | | 6,951,000 |
First American Financial Corp. | 370,000 | | 15,014,600 |
| | 21,965,600 |
Common Stocks - continued |
| Shares | | Value |
FINANCIALS - continued |
Real Estate Investment Trusts - 0.5% |
Colony Financial, Inc. | 380,000 | | $ 8,633,600 |
Thrifts & Mortgage Finance - 0.9% |
Meridian Bancorp, Inc. (a) | 1,094,070 | | 14,266,673 |
TOTAL FINANCIALS | | 88,922,450 |
HEALTH CARE - 29.2% |
Biotechnology - 11.8% |
Alder Biopharmaceuticals, Inc. (a) | 100,000 | | 4,642,000 |
Amicus Therapeutics, Inc. (a) | 520,000 | | 8,938,800 |
Anacor Pharmaceuticals, Inc. (a) | 105,000 | | 15,664,950 |
BioCryst Pharmaceuticals, Inc. (a) | 250,000 | | 3,870,000 |
Cara Therapeutics, Inc. (a) | 102,517 | | 2,184,637 |
Celldex Therapeutics, Inc. (a)(d) | 293,400 | | 6,909,570 |
Cellectis SA sponsored ADR | 104,100 | | 3,696,591 |
Cepheid, Inc. (a) | 56,938 | | 3,165,183 |
Chimerix, Inc. (a) | 210,100 | | 11,290,774 |
Clovis Oncology, Inc. (a) | 80,000 | | 6,754,400 |
Coherus BioSciences, Inc. | 48,424 | | 1,698,714 |
Curis, Inc. (a) | 1,007,700 | | 3,164,178 |
DBV Technologies SA sponsored ADR (a) | 129,022 | | 5,624,069 |
Dyax Corp. (a) | 440,400 | | 10,838,244 |
Dynavax Technologies Corp. (a) | 160,000 | | 4,705,600 |
Halozyme Therapeutics, Inc. (a) | 285,137 | | 6,655,098 |
Heron Therapeutics, Inc. (a) | 175,000 | | 5,659,500 |
Insmed, Inc. (a) | 223,400 | | 6,054,140 |
Intercept Pharmaceuticals, Inc. (a) | 31,600 | | 8,336,396 |
La Jolla Pharmaceutical Co. (a)(d) | 152,622 | | 4,639,709 |
Lion Biotechnologies, Inc. (a)(d) | 410,000 | | 3,509,600 |
Mirati Therapeutics, Inc. (a) | 169,700 | | 4,855,117 |
Novavax, Inc. (a) | 1,239,903 | | 14,953,230 |
Otonomy, Inc. | 135,500 | | 3,491,835 |
Portola Pharmaceuticals, Inc. (a) | 140,000 | | 6,921,600 |
ProNai Therapeutics, Inc. | 7,331 | | 200,869 |
Receptos, Inc. (a) | 50,100 | | 11,415,786 |
Repligen Corp. (a) | 148,489 | | 5,198,600 |
TESARO, Inc. (a) | 110,000 | | 6,380,000 |
Threshold Pharmaceuticals, Inc. (a)(d) | 669,900 | | 2,893,968 |
Ultragenyx Pharmaceutical, Inc. (a) | 110,000 | | 13,302,300 |
XOMA Corp. (a)(d) | 570,634 | | 416,905 |
| | 198,032,363 |
Common Stocks - continued |
| Shares | | Value |
HEALTH CARE - continued |
Health Care Equipment & Supplies - 7.2% |
Align Technology, Inc. (a) | 100,000 | | $ 6,270,000 |
Atricure, Inc. (a) | 310,000 | | 8,614,900 |
CONMED Corp. | 150,000 | | 8,508,000 |
Cyberonics, Inc. (a) | 151,122 | | 9,278,891 |
Entellus Medical, Inc. | 124,976 | | 2,811,960 |
Globus Medical, Inc. (a) | 250,000 | | 7,015,000 |
Hologic, Inc. (a) | 245,000 | | 10,206,700 |
ICU Medical, Inc. (a) | 100,008 | | 9,992,799 |
Inogen, Inc. (a) | 160,000 | | 7,113,600 |
LDR Holding Corp. (a) | 133,755 | | 6,080,502 |
Nevro Corp. | 216,200 | | 10,976,474 |
NxStage Medical, Inc. (a) | 650,300 | | 9,286,284 |
Teleflex, Inc. | 75,000 | | 10,049,250 |
Wright Medical Group, Inc. (a) | 575,000 | | 14,858,000 |
| | 121,062,360 |
Health Care Providers & Services - 6.9% |
Aceto Corp. | 300,000 | | 7,029,000 |
AMN Healthcare Services, Inc. (a) | 410,300 | | 12,075,129 |
BioTelemetry, Inc. (a) | 192,018 | | 2,348,380 |
Civitas Solutions, Inc. | 303,757 | | 6,831,495 |
HealthEquity, Inc. (a) | 200,000 | | 6,732,000 |
HealthSouth Corp. | 380,000 | | 17,366,000 |
LHC Group, Inc. (a) | 150,000 | | 6,043,500 |
Molina Healthcare, Inc. (a) | 125,000 | | 9,428,750 |
Surgical Care Affiliates, Inc. (a) | 410,000 | | 15,588,200 |
Team Health Holdings, Inc. (a) | 244,200 | | 16,461,522 |
Teladoc, Inc. (a) | 145,000 | | 4,577,650 |
VCA, Inc. (a) | 190,000 | | 11,690,700 |
| | 116,172,326 |
Health Care Technology - 1.4% |
athenahealth, Inc. (a)(d) | 110,557 | | 15,473,558 |
Omnicell, Inc. (a) | 60,478 | | 2,208,657 |
Press Ganey Holdings, Inc. | 177,059 | | 5,543,717 |
| | 23,225,932 |
Life Sciences Tools & Services - 0.7% |
Bruker Corp. (a) | 521,500 | | 10,977,575 |
Fluidigm Corp. (a) | 90,000 | | 1,802,700 |
| | 12,780,275 |
Common Stocks - continued |
| Shares | | Value |
HEALTH CARE - continued |
Pharmaceuticals - 1.2% |
Aratana Therapeutics, Inc. (a) | 360,000 | | $ 6,343,200 |
Cardiome Pharma Corp. (a) | 248,819 | | 2,256,788 |
Ocular Therapeutix, Inc. | 132,500 | | 3,059,425 |
Prestige Brands Holdings, Inc. (a) | 100,000 | | 4,762,000 |
SCYNEXIS, Inc. (a) | 400,000 | | 3,180,000 |
| | 19,601,413 |
TOTAL HEALTH CARE | | 490,874,669 |
INDUSTRIALS - 14.5% |
Aerospace & Defense - 1.7% |
Aerojet Rocketdyne Holdings, Inc. (a) | 367,491 | | 8,602,964 |
Huntington Ingalls Industries, Inc. | 65,000 | | 7,631,650 |
Teledyne Technologies, Inc. (a) | 123,000 | | 12,751,410 |
| | 28,986,024 |
Building Products - 1.2% |
A.O. Smith Corp. | 130,000 | | 9,336,600 |
Universal Forest Products, Inc. | 170,000 | | 10,795,000 |
| | 20,131,600 |
Commercial Services & Supplies - 4.6% |
Deluxe Corp. | 310,000 | | 19,973,300 |
KAR Auction Services, Inc. | 300,000 | | 11,679,000 |
Knoll, Inc. | 687,500 | | 16,637,500 |
Matthews International Corp. Class A | 160,018 | | 8,616,969 |
Multi-Color Corp. | 161,900 | | 10,338,934 |
West Corp. | 365,000 | | 10,530,250 |
| | 77,775,953 |
Electrical Equipment - 1.3% |
AZZ, Inc. | 175,000 | | 9,056,250 |
Babcock & Wilcox Enterprises, Inc. (a) | 9,500 | | 187,340 |
BWX Technologies, Inc. | 531,000 | | 13,041,360 |
| | 22,284,950 |
Machinery - 1.1% |
Hillenbrand, Inc. | 260,000 | | 7,373,600 |
Mueller Industries, Inc. | 343,400 | | 11,115,858 |
| | 18,489,458 |
Professional Services - 4.0% |
Advisory Board Co. (a) | 150,000 | | 8,985,000 |
CBIZ, Inc. (a) | 1,316,100 | | 12,897,780 |
Common Stocks - continued |
| Shares | | Value |
INDUSTRIALS - continued |
Professional Services - continued |
Exponent, Inc. | 255,000 | | $ 11,344,950 |
GP Strategies Corp. (a) | 350,557 | | 10,057,480 |
Huron Consulting Group, Inc. (a) | 301,200 | | 23,032,764 |
| | 66,317,974 |
Road & Rail - 0.6% |
Swift Transporation Co. (a) | 400,000 | | 9,528,000 |
TOTAL INDUSTRIALS | | 243,513,959 |
INFORMATION TECHNOLOGY - 24.4% |
Communications Equipment - 1.2% |
CommScope Holding Co., Inc. (a) | 340,000 | | 10,665,800 |
Infinera Corp. (a) | 358,377 | | 8,579,545 |
| | 19,245,345 |
Electronic Equipment & Components - 1.3% |
IPG Photonics Corp. (a)(d) | 47,300 | | 4,362,006 |
Jabil Circuit, Inc. | 150,000 | | 3,037,500 |
RealD, Inc. (a) | 1,092,300 | | 13,708,365 |
| | 21,107,871 |
Internet Software & Services - 3.2% |
comScore, Inc. (a) | 130,551 | | 7,637,234 |
Cvent, Inc. (a)(d) | 426,960 | | 11,493,763 |
Demandware, Inc. (a) | 120,000 | | 9,067,200 |
Gogo, Inc. (a)(d) | 350,488 | | 6,389,396 |
Q2 Holdings, Inc. (a) | 200,000 | | 5,438,000 |
Stamps.com, Inc. (a) | 208,711 | | 14,317,575 |
| | 54,343,168 |
IT Services - 6.8% |
Broadridge Financial Solutions, Inc. | 160,100 | | 8,688,627 |
CACI International, Inc. Class A (a) | 80,000 | | 6,570,400 |
Euronet Worldwide, Inc. (a) | 160,000 | | 10,960,000 |
Gartner, Inc. Class A (a) | 232,130 | | 20,559,754 |
Genpact Ltd. (a) | 430,000 | | 9,550,300 |
Global Payments, Inc. | 210,500 | | 23,594,945 |
Mattersight Corp. (a)(e) | 1,854,975 | | 12,150,086 |
Maximus, Inc. | 220,000 | | 15,006,200 |
Virtusa Corp. (a) | 150,000 | | 7,191,000 |
| | 114,271,312 |
Common Stocks - continued |
| Shares | | Value |
INFORMATION TECHNOLOGY - continued |
Semiconductors & Semiconductor Equipment - 2.0% |
Cavium, Inc. (a) | 58,210 | | $ 3,946,638 |
Cirrus Logic, Inc. (a) | 450,000 | | 14,854,500 |
MKS Instruments, Inc. | 123,264 | | 4,375,872 |
Monolithic Power Systems, Inc. | 190,000 | | 9,824,900 |
| | 33,001,910 |
Software - 9.5% |
AVG Technologies NV (a) | 280,000 | | 8,047,200 |
Blackbaud, Inc. | 260,000 | | 15,901,600 |
Cadence Design Systems, Inc. (a)(d) | 796,200 | | 16,696,314 |
Digimarc Corp. (a)(d) | 36,300 | | 1,442,562 |
Ebix, Inc. (d) | 124,017 | | 3,843,287 |
Fleetmatics Group PLC (a) | 195,000 | | 9,334,650 |
HubSpot, Inc. | 210,500 | | 11,356,475 |
Imperva, Inc. (a) | 100,000 | | 6,570,000 |
Manhattan Associates, Inc. (a) | 183,400 | | 11,887,988 |
Mentor Graphics Corp. | 780,000 | | 20,350,200 |
Paylocity Holding Corp. (a)(d) | 170,000 | | 6,106,400 |
Progress Software Corp. (a) | 483,700 | | 14,356,216 |
Qlik Technologies, Inc. (a) | 460,000 | | 18,611,600 |
Verint Systems, Inc. (a) | 255,200 | | 14,857,744 |
| | 159,362,236 |
Technology Hardware, Storage & Peripherals - 0.4% |
Nimble Storage, Inc. (a)(d) | 265,937 | | 7,345,180 |
TOTAL INFORMATION TECHNOLOGY | | 408,677,022 |
MATERIALS - 2.1% |
Chemicals - 0.5% |
Cytec Industries, Inc. | 110,000 | | 8,165,300 |
Containers & Packaging - 1.4% |
Avery Dennison Corp. | 100,000 | | 6,085,000 |
Graphic Packaging Holding Co. | 1,200,200 | | 18,123,020 |
| | 24,208,020 |
Paper & Forest Products - 0.2% |
TFS Corp. Ltd. (d) | 2,400,000 | | 2,578,792 |
TOTAL MATERIALS | | 34,952,112 |
Common Stocks - continued |
| Shares | | Value |
TELECOMMUNICATION SERVICES - 0.9% |
Diversified Telecommunication Services - 0.9% |
inContact, Inc. (a) | 1,214,000 | | $ 11,265,920 |
Vonage Holdings Corp. (a) | 505,436 | | 3,229,736 |
| | 14,495,656 |
TOTAL COMMON STOCKS (Cost $1,363,452,109) |
1,611,258,786
|
Money Market Funds - 8.2% |
| | | |
Fidelity Cash Central Fund, 0.17% (b) | 64,469,445 | | 64,469,445 |
Fidelity Securities Lending Cash Central Fund, 0.18% (b)(c) | 72,538,290 | | 72,538,290 |
TOTAL MONEY MARKET FUNDS (Cost $137,007,735) |
137,007,735
|
Equity Funds - 1.9% |
| | | |
Small Growth Funds - 1.9% |
iShares Russell 2000 Growth Index ETF (d)
(Cost $31,405,658) | 200,000 | |
30,990,000
|
TOTAL INVESTMENT PORTFOLIO - 106.1% (Cost $1,531,865,502) | | 1,779,256,521 |
NET OTHER ASSETS (LIABILITIES) - (6.1)% | | (101,610,380) |
NET ASSETS - 100% | $ 1,677,646,141 |
Security Type Abbreviations |
ETF | - | Exchange Traded Fund |
Legend |
(a) Non-income producing |
(b) Affiliated fund that is generally available only to investment companies and other accounts managed by Fidelity Investments. The rate quoted is the annualized seven-day yield of the fund at period end. A complete unaudited listing of the fund's holdings as of its most recent quarter end is available upon request. In addition, each Fidelity Central Fund's financial statements, which are not covered by the Fund's Report of Independent Registered Public Accounting Firm, are available on the SEC's website or upon request. |
(c) Investment made with cash collateral received from securities on loan. |
(d) Security or a portion of the security is on loan at period end. |
(e) Affiliated company |
Affiliated Central Funds |
Information regarding fiscal year to date income earned by the Fund from investments in Fidelity Central Funds is as follows: |
Fund | Income earned |
Fidelity Cash Central Fund | $ 43,708 |
Fidelity Securities Lending Cash Central Fund | 664,654 |
Total | $ 708,362 |
Other Affiliated Issuers |
An affiliated company is a company in which the Fund has ownership of at least 5% of the voting securities. Fiscal year to date transactions with companies which are or were affiliates are as follows: |
Affiliate | Value, beginning of period | Purchases | Sales Proceeds | Dividend Income | Value,
end of
period |
Mattersight Corp. | $ - | $ 11,000,002 | $ - | $ - | $ 12,150,086 |
Superior Drilling Products, Inc. | 8,049,395 | 212,441 | 408,453 | - | 1,928,281 |
Total | $ 8,049,395 | $ 11,212,443 | $ 408,453 | $ - | $ 14,078,367 |
Other Information |
All investments are categorized as Level 1 under the Fair Value Hierarchy. The inputs or methodology used for valuing securities may not be an indication of the risk associated with investing in those securities. For more information on valuation inputs, please refer to the Investment Valuation section in the accompanying Notes to Financial Statements. |
See accompanying notes which are an integral part of the financial statements.
Annual Report
Statement of Assets and Liabilities
| | July 31, 2015 |
| | |
Assets | | |
Investment in securities, at value (including securities loaned of $71,636,998) - See accompanying schedule: Unaffiliated issuers (cost $1,379,096,390) | $ 1,628,170,419 | |
Fidelity Central Funds (cost $137,007,735) | 137,007,735 | |
Other affiliated issuers (cost $15,761,377) | 14,078,367 | |
Total Investments (cost $1,531,865,502) | | $ 1,779,256,521 |
Cash | | 786,138 |
Receivable for investments sold | | 19,073,092 |
Receivable for fund shares sold | | 8,384,535 |
Dividends receivable | | 87,629 |
Distributions receivable from Fidelity Central Funds | | 55,876 |
Other receivables | | 54,301 |
Total assets | | 1,807,698,092 |
| | |
Liabilities | | |
Payable for investments purchased | $ 55,000,596 | |
Payable for fund shares redeemed | 1,049,146 | |
Accrued management fee | 1,014,913 | |
Distribution and service plan fees payable | 91,566 | |
Other affiliated payables | 296,642 | |
Other payables and accrued expenses | 60,798 | |
Collateral on securities loaned, at value | 72,538,290 | |
Total liabilities | | 130,051,951 |
| | |
Net Assets | | $ 1,677,646,141 |
Net Assets consist of: | | |
Paid in capital | | $ 1,364,084,364 |
Accumulated undistributed net realized gain (loss) on investments and foreign currency transactions | | 66,183,697 |
Net unrealized appreciation (depreciation) on investments and assets and liabilities in foreign currencies | | 247,378,080 |
Net Assets | | $ 1,677,646,141 |
See accompanying notes which are an integral part of the financial statements.
Annual Report
Statement of Assets and Liabilities - continued
| | July 31, 2015 |
| | |
Calculation of Maximum Offering Price | | |
Class A:
Net Asset Value and redemption price per share ($123,369,546 ÷ 6,002,419 shares) | | $ 20.55 |
| | |
Maximum offering price per share (100/94.25 of $20.55) | | $ 21.80 |
Class T:
Net Asset Value and redemption price per share ($52,667,039 ÷ 2,622,233 shares) | | $ 20.08 |
| | |
Maximum offering price per share (100/96.50 of $20.08) | | $ 20.81 |
Class B:
Net Asset Value and offering price per share ($2,357,028 ÷ 124,107 shares) | | $ 18.99 |
| | |
Class C:
Net Asset Value and offering price per share ($55,671,491 ÷ 2,946,209 shares) | | $ 18.90 |
| | |
Small Cap Growth:
Net Asset Value, offering price and redemption price per share ($1,345,684,071 ÷ 63,486,022 shares) | | $ 21.20 |
| | |
Class I:
Net Asset Value, offering price and redemption price per share ($97,896,966 ÷ 4,609,963 shares) | | $ 21.24 |
A Redemption price per share is equal to net asset value less any applicable contingent deferred sales charge.
See accompanying notes which are an integral part of the financial statements.
Annual Report
Financial Statements - continued
Statement of Operations
| Year ended July 31, 2015 |
| | |
Investment Income | | |
Dividends | | $ 5,957,242 |
Income from Fidelity Central Funds (including $664,654 from security lending) | | 708,362 |
Total income | | 6,665,604 |
| | |
Expenses | | |
Management fee | | |
Basic fee | $ 8,851,814 | |
Performance adjustment | (551,250) | |
Transfer agent fees | 2,715,918 | |
Distribution and service plan fees | 913,847 | |
Accounting and security lending fees | 423,000 | |
Custodian fees and expenses | 46,646 | |
Independent trustees' compensation | 5,261 | |
Registration fees | 139,484 | |
Audit | 62,075 | |
Legal | 3,043 | |
Interest | 4,117 | |
Miscellaneous | 9,013 | |
Total expenses before reductions | 12,622,968 | |
Expense reductions | (173,323) | 12,449,645 |
Net investment income (loss) | | (5,784,041) |
Realized and Unrealized Gain (Loss) Net realized gain (loss) on: | | |
Investment securities: | | |
Unaffiliated issuers | 109,364,383 | |
Other affiliated issuers | (615,913) | |
Foreign currency transactions | 6,149 | |
Total net realized gain (loss) | | 108,754,619 |
Change in net unrealized appreciation (depreciation) on: Investment securities | 166,441,450 | |
Assets and liabilities in foreign currencies | (9,237) | |
Total change in net unrealized appreciation (depreciation) | | 166,432,213 |
Net gain (loss) | | 275,186,832 |
Net increase (decrease) in net assets resulting from operations | | $ 269,402,791 |
See accompanying notes which are an integral part of the financial statements.
Annual Report
Statement of Changes in Net Assets
| Year ended
July 31,
2015 | Year ended
July 31,
2014 |
Increase (Decrease) in Net Assets | | |
Operations | | |
Net investment income (loss) | $ (5,784,041) | $ (5,539,870) |
Net realized gain (loss) | 108,754,619 | 529,975,803 |
Change in net unrealized appreciation (depreciation) | 166,432,213 | (344,219,184) |
Net increase (decrease) in net assets resulting from operations | 269,402,791 | 180,216,749 |
Distributions to shareholders from net realized gain | (103,188,484) | (306,246,236) |
Share transactions - net increase (decrease) | 214,155,809 | (817,676,738) |
Redemption fees | 177,411 | 398,744 |
Total increase (decrease) in net assets | 380,547,527 | (943,307,481) |
| | |
Net Assets | | |
Beginning of period | 1,297,098,614 | 2,240,406,095 |
End of period (including accumulated net investment loss of $0 and accumulated net investment loss of $4,082,221, respectively) | $ 1,677,646,141 | $ 1,297,098,614 |
See accompanying notes which are an integral part of the financial statements.
Annual Report
Financial Highlights - Class A
Years ended July 31, | 2015 | 2014 | 2013 | 2012 | 2011 |
Selected Per-Share Data | | | | | |
Net asset value, beginning of period | $ 17.99 | $ 19.66 | $ 15.87 | $ 16.42 | $ 12.66 |
Income from Investment Operations | | | | | |
Net investment income (loss) C | (.13) | (.12) | (.04) | (.07) F | (.07) G |
Net realized and unrealized gain (loss) | 4.23 | 1.69 | 4.87 | (.16) | 3.84 |
Total from investment operations | 4.10 | 1.57 | 4.83 | (.23) | 3.77 |
Distributions from net realized gain | (1.54) | (3.24) | (1.04) | (.32) | (.01) K |
Redemption fees added to paid in capital C, I | - | - | - | - | - |
Net asset value, end of period | $ 20.55 | $ 17.99 | $ 19.66 | $ 15.87 | $ 16.42 |
Total ReturnA, B | 24.46% | 8.58% | 32.20% | (1.14)% | 29.78% |
Ratios to Average Net Assets D, H | | | | | |
Expenses before reductions | 1.21% | 1.22% | 1.24% | 1.35% | 1.25% |
Expenses net of fee waivers, if any | 1.21% | 1.22% | 1.24% | 1.35% | 1.25% |
Expenses net of all reductions | 1.20% | 1.22% | 1.22% | 1.34% | 1.23% |
Net investment income (loss) | (.67)% | (.62)% | (.26)% | (.49)%F | (.47)%G |
Supplemental Data | | | | | |
Net assets, end of period (000 omitted) | $ 123,370 | $ 88,822 | $ 74,978 | $ 59,684 | $ 67,272 |
Portfolio turnover rate E | 156% | 148% J | 142% | 150% | 106% |
A Total returns would have been lower if certain expenses had not been reduced during the applicable periods shown.
B Total returns do not include the effect of the sales charges.
C Calculated based on average shares outstanding during the period.
D Fees and expenses of any underlying Fidelity Central Funds are not included in the Fund's expense ratio. The Fund indirectly bears its proportionate share of the expenses of any underlying Fidelity Central Funds.
E Amount does not include the portfolio activity of any underlying Fidelity Central Funds.
F Investment income per share reflects a large, non-recurring dividend which amounted to $.01 per share. Excluding this non-recurring dividend, the ratio of net investment income (loss) to average net assets would have been (.57)%.
G Investment income per share reflects a large, non-recurring dividend which amounted to $.02 per share. Excluding this non-recurring dividend, the ratio of net investment income (loss) to average net assets would have been (.61)%.
H Expense ratios reflect operating expenses of the class. Expenses before reductions do not reflect amounts reimbursed by the investment adviser or reductions from brokerage service arrangements or reductions from other expense offset arrangements and do not represent the amount paid by the class during periods when reimbursements or reductions occur. Expenses net of fee waivers reflect expenses after reimbursement by the investment adviser but prior to reductions from brokerage service arrangements or other expense offset arrangements. Expenses net of all reductions represent the net expenses paid by the class.
I Amount represents less than $.01 per share.
J Portfolio turnover rate excludes securities received or delivered in-kind.
K The amounts shown reflect certain reclassifications related to book to tax differences that were made in the year shown.
See accompanying notes which are an integral part of the financial statements.
Annual Report
Financial Highlights - Class T
Years ended July 31, | 2015 | 2014 | 2013 | 2012 | 2011 |
Selected Per-Share Data | | | | | |
Net asset value, beginning of period | $ 17.66 | $ 19.38 | $ 15.68 | $ 16.27 | $ 12.57 |
Income from Investment Operations | | | | | |
Net investment income (loss) C | (.17) | (.16) | (.09) | (.11) F | (.11) G |
Net realized and unrealized gain (loss) | 4.13 | 1.66 | 4.82 | (.16) | 3.81 |
Total from investment operations | 3.96 | 1.50 | 4.73 | (.27) | 3.70 |
Distributions from net realized gain | (1.54) | (3.22) | (1.03) | (.32) | - |
Redemption fees added to paid in capital C, I | - | - | - | - | - |
Net asset value, end of period | $ 20.08 | $ 17.66 | $ 19.38 | $ 15.68 | $ 16.27 |
Total ReturnA, B | 24.10% | 8.30% | 31.87% | (1.41)% | 29.44% |
Ratios to Average Net Assets D, H | | | | | |
Expenses before reductions | 1.49% | 1.50% | 1.49% | 1.61% | 1.50% |
Expenses net of fee waivers, if any | 1.48% | 1.50% | 1.49% | 1.61% | 1.50% |
Expenses net of all reductions | 1.47% | 1.49% | 1.48% | 1.60% | 1.49% |
Net investment income (loss) | (.95)% | (.90)% | (.52)% | (.74)%F | (.73)%G |
Supplemental Data | | | | | |
Net assets, end of period (000 omitted) | $ 52,667 | $ 42,586 | $ 34,686 | $ 27,658 | $ 30,764 |
Portfolio turnover rate E | 156% | 148% J | 142% | 150% | 106% |
A Total returns would have been lower if certain expenses had not been reduced during the applicable periods shown.
B Total returns do not include the effect of the sales charges.
C Calculated based on average shares outstanding during the period.
D Fees and expenses of any underlying Fidelity Central Funds are not included in the Fund's expense ratio. The Fund indirectly bears its proportionate share of the expenses of any underlying Fidelity Central Funds.
E Amount does not include the portfolio activity of any underlying Fidelity Central Funds.
F Investment income per share reflects a large, non-recurring dividend which amounted to $.01 per share. Excluding this non-recurring dividend, the ratio of net investment income (loss) to average net assets would have been (.83)%.
G Investment income per share reflects a large, non-recurring dividend which amounted to $.02 per share. Excluding this non-recurring dividend, the ratio of net investment income (loss) to average net assets would have been (.86)%.
H Expense ratios reflect operating expenses of the class. Expenses before reductions do not reflect amounts reimbursed by the investment adviser or reductions from brokerage service arrangements or reductions from other expense offset arrangements and do not represent the amount paid by the class during periods when reimbursements or reductions occur. Expenses net of fee waivers reflect expenses after reimbursement by the investment adviser but prior to reductions from brokerage service arrangements or other expense offset arrangements. Expenses net of all reductions represent the net expenses paid by the class.
I Amount represents less than $.01 per share.
J Portfolio turnover rate excludes securities received or delivered in-kind.
See accompanying notes which are an integral part of the financial statements.
Annual Report
Financial Highlights - Class B
Years ended July 31, | 2015 | 2014 | 2013 | 2012 | 2011 |
Selected Per-Share Data | | | | | |
Net asset value, beginning of period | $ 16.86 | $ 18.65 | $ 15.19 | $ 15.86 | $ 12.30 |
Income from Investment Operations | | | | | |
Net investment income (loss) C | (.25) | (.25) | (.16) | (.18) F | (.18) G |
Net realized and unrealized gain (loss) | 3.92 | 1.60 | 4.64 | (.17) | 3.74 |
Total from investment operations | 3.67 | 1.35 | 4.48 | (.35) | 3.56 |
Distributions from net realized gain | (1.54) | (3.14) | (1.02) | (.32) | - |
Redemption fees added to paid in capital C, I | - | - | - | - | - |
Net asset value, end of period | $ 18.99 | $ 16.86 | $ 18.65 | $ 15.19 | $ 15.86 |
Total ReturnA, B | 23.48% | 7.73% | 31.25% | (1.96)% | 28.94% |
Ratios to Average Net Assets D, H | | | | | |
Expenses before reductions | 2.01% | 2.01% | 1.99% | 2.10% | 2.00% |
Expenses net of fee waivers, if any | 2.01% | 2.01% | 1.99% | 2.10% | 2.00% |
Expenses net of all reductions | 2.00% | 2.01% | 1.97% | 2.09% | 1.98% |
Net investment income (loss) | (1.47)% | (1.41)% | (1.01)% | (1.23)%F | (1.22)%G |
Supplemental Data | | | | | |
Net assets, end of period (000 omitted) | $ 2,357 | $ 2,764 | $ 3,486 | $ 4,123 | $ 5,295 |
Portfolio turnover rate E | 156% | 148% J | 142% | 150% | 106% |
A Total returns would have been lower if certain expenses had not been reduced during the applicable periods shown.
B Total returns do not include the effect of the contingent deferred sales charge.
C Calculated based on average shares outstanding during the period.
D Fees and expenses of any underlying Fidelity Central Funds are not included in the Fund's expense ratio. The Fund indirectly bears its proportionate share of the expenses of any underlying Fidelity Central Funds.
E Amount does not include the portfolio activity of any underlying Fidelity Central Funds.
F Investment income per share reflects a large, non-recurring dividend which amounted to $.01 per share. Excluding this non-recurring dividend, the ratio of net investment income (loss) to average net assets would have been (1.32)%.
G Investment income per share reflects a large, non-recurring dividend which amounted to $.02 per share. Excluding this non-recurring dividend, the ratio of net investment income (loss) to average net assets would have been (1.36)%.
H Expense ratios reflect operating expenses of the class. Expenses before reductions do not reflect amounts reimbursed by the investment adviser or reductions from brokerage service arrangements or reductions from other expense offset arrangements and do not represent the amount paid by the class during periods when reimbursements or reductions occur. Expenses net of fee waivers reflect expenses after reimbursement by the investment adviser but prior to reductions from brokerage service arrangements or other expense offset arrangements. Expenses net of all reductions represent the net expenses paid by the class.
I Amount represents less than $.01 per share.
J Portfolio turnover rate excludes securities received or delivered in-kind.
See accompanying notes which are an integral part of the financial statements.
Annual Report
Financial Highlights - Class C
Years ended July 31, | 2015 | 2014 | 2013 | 2012 | 2011 |
Selected Per-Share Data | | | | | |
Net asset value, beginning of period | $ 16.78 | $ 18.62 | $ 15.16 | $ 15.83 | $ 12.28 |
Income from Investment Operations | | | | | |
Net investment income (loss) C | (.25) | (.25) | (.16) | (.18) F | (.18) G |
Net realized and unrealized gain (loss) | 3.91 | 1.59 | 4.64 | (.17) | 3.73 |
Total from investment operations | 3.66 | 1.34 | 4.48 | (.35) | 3.55 |
Distributions from net realized gain | (1.54) | (3.18) | (1.02) | (.32) | - |
Redemption fees added to paid in capital C, I | - | - | - | - | - |
Net asset value, end of period | $ 18.90 | $ 16.78 | $ 18.62 | $ 15.16 | $ 15.83 |
Total ReturnA, B | 23.53% | 7.70% | 31.32% | (1.96)% | 28.91% |
Ratios to Average Net Assets D, H | | | | | |
Expenses before reductions | 2.00% | 2.01% | 1.99% | 2.10% | 2.00% |
Expenses net of fee waivers, if any | 2.00% | 2.00% | 1.99% | 2.10% | 2.00% |
Expenses net of all reductions | 1.99% | 2.00% | 1.97% | 2.09% | 1.98% |
Net investment income (loss) | (1.46)% | (1.41)% | (1.01)% | (1.24)%F | (1.22)%G |
Supplemental Data | | | | | |
Net assets, end of period (000 omitted) | $ 55,671 | $ 42,215 | $ 32,756 | $ 24,683 | $ 24,914 |
Portfolio turnover rate E | 156% | 148% J | 142% | 150% | 106% |
A Total returns would have been lower if certain expenses had not been reduced during the applicable periods shown.
B Total returns do not include the effect of the contingent deferred sales charge.
C Calculated based on average shares outstanding during the period.
D Fees and expenses of any underlying Fidelity Central Funds are not included in the Fund's expense ratio. The Fund indirectly bears its proportionate share of the expenses of any underlying Fidelity Central Funds.
E Amount does not include the portfolio activity of any underlying Fidelity Central Funds.
F Investment income per share reflects a large, non-recurring dividend which amounted to $.01 per share. Excluding this non-recurring dividend, the ratio of net investment income (loss) to average net assets would have been (1.32)%.
G Investment income per share reflects a large, non-recurring dividend which amounted to $.02 per share. Excluding this non-recurring dividend, the ratio of net investment income (loss) to average net assets would have been (1.36)%.
H Expense ratios reflect operating expenses of the class. Expenses before reductions do not reflect amounts reimbursed by the investment adviser or reductions from brokerage service arrangements or reductions from other expense offset arrangements and do not represent the amount paid by the class during periods when reimbursements or reductions occur. Expenses net of fee waivers reflect expenses after reimbursement by the investment adviser but prior to reductions from brokerage service arrangements or other expense offset arrangements. Expenses net of all reductions represent the net expenses paid by the class.
I Amount represents less than $.01 per share.
J Portfolio turnover rate excludes securities received or delivered in-kind.
See accompanying notes which are an integral part of the financial statements.
Annual Report
Financial Highlights - Small Cap Growth
Years ended July 31, | 2015 | 2014 | 2013 | 2012 | 2011 |
Selected Per-Share Data | | | | | |
Net asset value, beginning of period | $ 18.45 | $ 20.07 | $ 16.14 | $ 16.65 | $ 12.81 |
Income from Investment Operations | | | | | |
Net investment income (loss) B | (.07) | (.06) | .01 | (.03) E | (.03) F |
Net realized and unrealized gain (loss) | 4.36 | 1.71 | 4.98 | (.16) | 3.90 |
Total from investment operations | 4.29 | 1.65 | 4.99 | (.19) | 3.87 |
Distributions from net realized gain | (1.54) | (3.27) | (1.06) | (.32) | (.03) J |
Redemption fees added to paid in capital B, H | - | - | - | - | - |
Net asset value, end of period | $ 21.20 | $ 18.45 | $ 20.07 | $ 16.14 | $ 16.65 |
Total Return A | 24.91% | 8.87% | 32.74% | (.88)% | 30.20% |
Ratios to Average Net Assets C, G | | | | |
Expenses before reductions | .91% | .91% | .90% | 1.03% | .95% |
Expenses net of fee waivers, if any | .91% | .90% | .90% | 1.03% | .95% |
Expenses net of all reductions | .90% | .90% | .88% | 1.02% | .93% |
Net investment income (loss) | (.37)% | (.31)% | .08% | (.16)%E | (.17)%F |
Supplemental Data | | | | | |
Net assets, end of period (000 omitted) | $ 1,345,684 | $ 1,069,105 | $ 1,315,659 | $ 1,166,101 | $ 1,382,688 |
Portfolio turnover rate D | 156% | 148% I | 142% | 150% | 106% |
A Total returns would have been lower if certain expenses had not been reduced during the applicable periods shown.
B Calculated based on average shares outstanding during the period.
C Fees and expenses of any underlying Fidelity Central Funds are not included in the Fund's expense ratio. The Fund indirectly bears its proportionate share of the expenses of any underlying Fidelity Central Funds.
D Amount does not include the portfolio activity of any underlying Fidelity Central Funds.
E Investment income per share reflects a large, non-recurring dividend which amounted to $.01 per share. Excluding this non-recurring dividend, the ratio of net investment income (loss) to average net assets would have been (.25)%.
F Investment income per share reflects a large, non-recurring dividend which amounted to $.02 per share. Excluding this non-recurring dividend, the ratio of net investment income (loss) to average net assets would have been (.31)%.
G Expense ratios reflect operating expenses of the class. Expenses before reductions do not reflect amounts reimbursed by the investment adviser or reductions from brokerage service arrangements or reductions from other expense offset arrangements and do not represent the amount paid by the class during periods when reimbursements or reductions occur. Expenses net of fee waivers reflect expenses after reimbursement by the investment adviser but prior to reductions from brokerage service arrangements or other expense offset arrangements. Expenses net of all reductions represent the net expenses paid by the class.
H Amount represents less than $.01 per share.
I Portfolio turnover rate excludes securities received or delivered in-kind.
J The amounts shown reflect certain reclassifications related to book to tax differences that were made in the year shown.
See accompanying notes which are an integral part of the financial statements.
Annual Report
Financial Highlights - Class I
Years ended July 31, | 2015 | 2014 | 2013 | 2012 | 2011 |
Selected Per-Share Data | | | | | |
Net asset value, beginning of period | $ 18.49 | $ 20.10 | $ 16.17 | $ 16.68 | $ 12.83 |
Income from Investment Operations | | | | | |
Net investment income (loss) B | (.07) | (.06) | .01 | (.03) E | (.03) F |
Net realized and unrealized gain (loss) | 4.36 | 1.72 | 4.98 | (.16) | 3.91 |
Total from investment operations | 4.29 | 1.66 | 4.99 | (.19) | 3.88 |
Distributions from net realized gain | (1.54) | (3.27) | (1.06) | (.32) | (.03) J |
Redemption fees added to paid in capital B, H | - | - | - | - | - |
Net asset value, end of period | $ 21.24 | $ 18.49 | $ 20.10 | $ 16.17 | $ 16.68 |
Total Return A | 24.85% | 8.89% | 32.65% | (.88)% | 30.24% |
Ratios to Average Net Assets C, G | | | | | |
Expenses before reductions | .93% | .92% | .92% | 1.06% | .94% |
Expenses net of fee waivers, if any | .93% | .92% | .92% | 1.06% | .94% |
Expenses net of all reductions | .91% | .92% | .91% | 1.05% | .93% |
Net investment income (loss) | (.39)% | (.32)% | .06% | (.19)%E | (.17)%F |
Supplemental Data | | | | | |
Net assets, end of period (000 omitted) | $ 97,897 | $ 51,607 | $ 51,158 | $ 36,694 | $ 41,440 |
Portfolio turnover rate D | 156% | 148% I | 142% | 150% | 106% |
A Total returns would have been lower if certain expenses had not been reduced during the applicable periods shown.
B Calculated based on average shares outstanding during the period.
C Fees and expenses of any underlying Fidelity Central Funds are not included in the Fund's expense ratio. The Fund indirectly bears its proportionate share of the expenses of any underlying Fidelity Central Funds.
D Amount does not include the portfolio activity of any underlying Fidelity Central Funds.
E Investment income per share reflects a large, non-recurring dividend which amounted to $.01 per share. Excluding this non-recurring dividend, the ratio of net investment income (loss) to average net assets would have been (.28)%.
F Investment income per share reflects a large, non-recurring dividend which amounted to $.02 per share. Excluding this non-recurring dividend, the ratio of net investment income (loss) to average net assets would have been (.30)%.
G Expense ratios reflect operating expenses of the class. Expenses before reductions do not reflect amounts reimbursed by the investment adviser or reductions from brokerage service arrangements or reductions from other expense offset arrangements and do not represent the amount paid by the class during periods when reimbursements or reductions occur. Expenses net of fee waivers reflect expenses after reimbursement by the investment adviser but prior to reductions from brokerage service arrangements or other expense offset arrangements. Expenses net of all reductions represent the net expenses paid by the class.
H Amount represents less than $.01 per share.
I Portfolio turnover rate excludes securities received or delivered in-kind.
J The amounts shown reflect certain reclassifications related to book to tax differences that were made in the year shown.
See accompanying notes which are an integral part of the financial statements.
Annual Report
For the period ended July 31, 2015
1. Organization.
Fidelity Small Cap Growth Fund (the Fund) is a fund of Fidelity Securities Fund (the Trust) and is authorized to issue an unlimited number of shares. The Trust is registered under the Investment Company Act of 1940, as amended (the 1940 Act), as an open-end management investment company organized as a Massachusetts business trust. The Fund offers Class A, Class T, Class C, Small Cap Growth and Class I (formerly Institutional Class) shares, each of which, along with Class B shares, has equal rights as to assets and voting privileges. Class B shares are closed to new accounts and additional purchases, except for exchanges and reinvestments. The Fund offered Class F shares during the period June 26, 2009 through November 15, 2013 and all outstanding shares were redeemed by November 15, 2013. Each class has exclusive voting rights with respect to matters that affect that class. Class B shares will automatically convert to Class A shares after a holding period of seven years from the initial date of purchase.
2. Investments in Fidelity Central Funds.
The Fund invests in Fidelity Central Funds, which are open-end investment companies generally available only to other investment companies and accounts managed by the investment adviser and its affiliates. The Fund's Schedule of Investments lists each of the Fidelity Central Funds held as of period end, if any, as an investment of the Fund, but does not include the underlying holdings of each Fidelity Central Fund. As an Investing Fund, the Fund indirectly bears its proportionate share of the expenses of the underlying Fidelity Central Funds.
The Money Market Central Funds seek preservation of capital and current income and are managed by Fidelity Investments Money Management, Inc. (FIMM), an affiliate of the investment adviser. Annualized expenses of the Money Market Central Funds as of their most recent shareholder report date are less than .01%.
A complete unaudited list of holdings for each Fidelity Central Fund is available upon request or at the Securities and Exchange Commission (the SEC) website at www.sec.gov. In addition, the financial statements of the Fidelity Central Funds, which are not covered by the Fund's Report of Independent Registered Public Accounting Firm, are available on the SEC website or upon request.
3. Significant Accounting Policies.
The financial statements have been prepared in conformity with accounting principles generally accepted in the United States of America (GAAP), which require management to make certain estimates and assumptions at the date of the financial statements. Actual results could differ from those estimates. Subsequent events, if any, through the date that the financial statements were issued have been evaluated in the preparation of
Annual Report
3. Significant Accounting Policies - continued
the financial statements. The following summarizes the significant accounting policies of the Fund:
Investment Valuation. Investments are valued as of 4:00 p.m. Eastern time on the last calendar day of the period. The Board of Trustees (the Board) has delegated the day to day responsibility for the valuation of the Fund's investments to the Fidelity Management & Research Company (FMR) Fair Value Committee (the Committee). In accordance with valuation policies and procedures approved by the Board, the Fund attempts to obtain prices from one or more third party pricing vendors or brokers to value its investments. When current market prices, quotations or currency exchange rates are not readily available or reliable, investments will be fair valued in good faith by the Committee, in accordance with procedures adopted by the Board. Factors used in determining fair value vary by investment type and may include market or investment specific events. The frequency with which these procedures are used cannot be predicted and they may be utilized to a significant extent. The Committee oversees the Fund's valuation policies and procedures and reports to the Board on the Committee's activities and fair value determinations. The Board monitors the appropriateness of the procedures used in valuing the Fund's investments and ratifies the fair value determinations of the Committee.
The Fund categorizes the inputs to valuation techniques used to value its investments into a disclosure hierarchy consisting of three levels as shown below:
Level 1 - quoted prices in active markets for identical investments
Level 2 - other significant observable inputs (including quoted prices for similar investments, interest rates, prepayment speeds, etc.)
Level 3 - unobservable inputs (including the Fund's own assumptions based on the best information available)
Valuation techniques used to value the Fund's investments by major category are as follows:
Equity securities, including restricted securities, for which market quotations are readily available, are valued at the last reported sale price or official closing price as reported by a third party pricing vendor on the primary market or exchange on which they are traded and are categorized as Level 1 in the hierarchy. In the event there were no sales during the day or closing prices are not available, securities are valued at the last quoted bid price or may be valued using the last available price and are generally categorized as Level 2 in the hierarchy. For foreign equity securities, when market or security specific events arise, comparisons to the valuation of American Depositary Receipts (ADRs),
Annual Report
Notes to Financial Statements - continued
3. Significant Accounting Policies - continued
Investment Valuation - continued
futures contracts, Exchange-Traded Funds (ETFs) and certain indexes as well as quoted prices for similar securities may be used and would be categorized as Level 2 in the hierarchy. Utilizing these techniques may result in transfers between Level 1 and Level 2. For equity securities, including restricted securities, where observable inputs are limited, assumptions about market activity and risk are used and these securities may be categorized as Level 3 in the hierarchy.
Exchange-Traded Funds (ETFs) are valued at their last sale price or official closing price as reported by a third party pricing vendor on the primary market or exchange on which they are traded and are categorized as Level 1 in the hierarchy. In the event there were no sales during the day but the exchange reports a closing bid level, ETFs are valued at the closing bid and would be categorized as Level 1 in the hierarchy. In the event there was no closing bid, ETFs may be valued by another method that the Board believes reflects fair value in accordance with the Board's fair value pricing policies and may be categorized as Level 2 in the hierarchy.
Investments in open-end mutual funds, including the Fidelity Central Funds, are valued at their closing net asset value (NAV) each business day and are categorized as Level 1 in the hierarchy.
Changes in valuation techniques may result in transfers in or out of an assigned level within the disclosure hierarchy.
Foreign Currency. The Fund may use foreign currency contracts to facilitate transactions in foreign-denominated securities. Gains and losses from these transactions may arise from changes in the value of the foreign currency or if the counterparties do not perform under the contracts' terms.
Foreign-denominated assets, including investment securities, and liabilities are translated into U.S. dollars at the exchange rates at period end. Purchases and sales of investment securities, income and dividends received and expenses denominated in foreign currencies are translated into U.S. dollars at the exchange rate in effect on the transaction date.
The effects of exchange rate fluctuations on investments are included with the net realized and unrealized gain (loss) on investment securities. Other foreign currency transactions resulting in realized and unrealized gain (loss) are disclosed separately.
Investment Transactions and Income. For financial reporting purposes, the Fund's investment holdings and NAV include trades executed through the end of the last business day of the period. The NAV per share for processing shareholder transactions is calculated as of the close of business of the New York Stock Exchange (NYSE), normally
Annual Report
3. Significant Accounting Policies - continued
Investment Transactions and Income - continued
4:00 p.m. Eastern time and includes trades executed through the end of the prior business day. Gains and losses on securities sold are determined on the basis of identified cost and may include proceeds received from litigation. Dividend income is recorded on the ex-dividend date, except for certain dividends from foreign securities where the ex-dividend date may have passed, which are recorded as soon as the Fund is informed of the ex-dividend date. Non-cash dividends included in dividend income, if any, are recorded at the fair market value of the securities received. Income and capital gain distributions from Fidelity Central Funds, if any, are recorded on the ex-dividend date. Distributions received on securities that represent a return of capital or capital gain are recorded as a reduction of cost of investments and/or as a realized gain. Subsequent to ex-dividend date the Fund determines the components of these distributions, based upon receipt of tax filings or other correspondence relating to the underlying investment. Interest income is accrued as earned and includes coupon interest and amortization of premium and accretion of discount on debt securities as applicable. Investment income is recorded net of foreign taxes withheld where recovery of such taxes is uncertain.
Class Allocations and Expenses. Investment income, realized and unrealized capital gains and losses, common expenses of the Fund, and certain fund-level expense reductions, if any, are allocated daily on a pro-rata basis to each class based on the relative net assets of each class to the total net assets of the Fund. Each class differs with respect to transfer agent and distribution and service plan fees incurred. Certain expense reductions may also differ by class. For the reporting period, the allocated portion of income and expenses to each class as a percent of its average net assets may vary due to the timing of recording these transactions in relation to fluctuating net assets of the classes. Expenses directly attributable to a fund are charged to that fund. Expenses attributable to more than one fund are allocated among the respective funds on the basis of relative net assets or other appropriate methods. Expense estimates are accrued in the period to which they relate and adjustments are made when actual amounts are known.
Income Tax Information and Distributions to Shareholders. Each year, the Fund intends to qualify as a regulated investment company under Subchapter M of the Internal Revenue Code, including distributing substantially all of its taxable income and realized gains. As a result, no provision for U.S. Federal income taxes is required. As of July 31, 2015, the Fund did not have any unrecognized tax benefits in the financial statements; nor is the Fund aware of any tax positions for which it is reasonably possible that the total amounts of unrecognized tax benefits will significantly change in the next twelve months. The Fund files a U.S. federal tax return, in addition to state and local tax returns as required. The Fund's federal income tax returns are subject to examination by the Internal Revenue Service (IRS) for a period of three fiscal years after they are filed.
Annual Report
Notes to Financial Statements - continued
3. Significant Accounting Policies - continued
Income Tax Information and Distributions to Shareholders - continued
State and local tax returns may be subject to examination for an additional fiscal year depending on the jurisdiction. Foreign taxes are provided for based on the Fund's understanding of the tax rules and rates that exist in the foreign markets in which it invests.
Distributions are declared and recorded on the ex-dividend date. Income dividends and capital gain distributions are declared separately for each class. Income and capital gain distributions are determined in accordance with income tax regulations, which may differ from GAAP. In addition, the Fund claimed a portion of the payment made to redeeming shareholders as a distribution for income tax purposes.
Capital accounts within the financial statements are adjusted for permanent book-tax differences. These adjustments have no impact on net assets or the results of operations. Capital accounts are not adjusted for temporary book-tax differences which will reverse in a subsequent period.
Book-tax differences are primarily due to foreign currency transactions, partnerships and losses deferred due to wash sales and excise tax regulations.
The federal tax cost of investment securities and unrealized appreciation (depreciation) as of period end were as follows:
Gross unrealized appreciation | $ 284,169,323 |
Gross unrealized depreciation | (39,468,707) |
Net unrealized appreciation (depreciation) on securities | $ 244,700,616 |
| |
Tax Cost | $ 1,534,555,905 |
The tax-based components of distributable earnings as of period end were as follows:
Undistributed ordinary income | $ 18,130,712 |
Undistributed long-term capital gain | $ 50,743,387 |
Net unrealized appreciation (depreciation) on securities and other investments | $ 244,687,677 |
Annual Report
3. Significant Accounting Policies - continued
Income Tax Information and Distributions to Shareholders - continued
The tax character of distributions paid was as follows:
| July 31, 2015 | July 31, 2014 |
Ordinary Income | $ - | $ 106,613,332 |
Long-term Capital Gains | 103,188,484 | 199,632,904 |
Total | $ 103,188,484 | $ 306,246,236 |
Short-Term Trading (Redemption) Fees. Shares held by investors in the Fund less than 90 days may have been subject to a redemption fee equal to 1.50% of the NAV of shares redeemed. All redemption fees, which reduce the proceeds of the shareholder redemption, are retained by the Fund and accounted for as an addition to paid in capital.
4. Purchases and Sales of Investments.
Purchases and sales of securities, other than short-term securities, aggregated $2,044,918,249 and $1,947,551,562, respectively.
5. Fees and Other Transactions with Affiliates.
Management Fee. Fidelity Management & Research Company (the investment adviser) and its affiliates provide the Fund with investment management related services for which the Fund pays a monthly management fee. The management fee is the sum of an individual fund fee rate that is based on an annual rate of .45% of the Fund's average net assets and an annualized group fee rate that averaged .25% during the period. The group fee rate is based upon the average net assets of all the mutual funds advised by the investment adviser, including any mutual funds previously advised by the investment adviser that are currently advised by Fidelity SelectCo, LLC, an affiliate of the investment adviser. The group fee rate decreases as assets under management increase and increases as assets under management decrease. In addition, the management fee is subject to a performance adjustment (up to a maximum of ± .20% of the Fund's average net assets over a 36 month performance period). The upward or downward adjustment to the management fee is based on the relative investment performance of Small Cap Growth as compared to its benchmark index, the Russell 2000 Growth Index, over the same 36 month performance period. For the reporting period, the total annual management fee rate, including the performance adjustment, was .65% of the Fund's average net assets. The performance adjustment included in the management fee rate may be higher or lower than the maximum performance adjustment rate due to the difference between the average net assets for the reporting and performance periods.
Annual Report
Notes to Financial Statements - continued
5. Fees and Other Transactions with Affiliates - continued
Distribution and Service Plan Fees. In accordance with Rule 12b-1 of the 1940 Act, the Fund has adopted separate Distribution and Service Plans for each class of shares. Certain classes pay Fidelity Distributors Corporation (FDC), an affiliate of the investment adviser, separate Distribution and Service Fees, each of which is based on an annual percentage of each class' average net assets. In addition, FDC may pay financial intermediaries for selling shares of the Fund and providing shareholder support services. For the period, the Distribution and Service Fee rates, total fees and amounts retained by FDC were as follows:
| Distribution
Fee | Service
Fee | Total Fees | Retained
by FDC |
Class A | -% | .25% | $ 235,371 | $ 4,756 |
Class T | .25% | .25% | 224,894 | - |
Class B | .75% | .25% | 25,039 | 18,886 |
Class C | .75% | .25% | 428,543 | 68,843 |
| | | $ 913,847 | $ 92,485 |
Sales Load. FDC may receive a front-end sales charge of up to 5.75% for selling Class A shares and 3.50% for selling Class T shares, some of which is paid to financial intermediaries for selling shares of the Fund. Depending on the holding period, FDC may receive contingent deferred sales charges levied on Class A, Class T, Class B, and Class C redemptions. The deferred sales charges range from 5.00% to 1.00% for Class B shares, 1.00% for Class C shares, 1.00% for certain purchases of Class A shares and .25% for certain purchases of Class T shares.
For the period, sales charge amounts retained by FDC were as follows:
| Retained
by FDC |
Class A | $ 64,422 |
Class T | 11,332 |
Class B* | 1,032 |
Class C* | 6,916 |
| $ 83,702 |
* When Class B and Class C shares are initially sold, FDC pays commissions from its own resources to financial intermediaries through which the sales are made.
Transfer Agent Fees. Fidelity Investments Institutional Operations Company, Inc., (FIIOC), an affiliate of the investment adviser, is the transfer, dividend disbursing and shareholder servicing agent for each class of the Fund. FIIOC receives account fees and asset-based fees that vary according to the account size and type of account of the
Annual Report
5. Fees and Other Transactions with Affiliates - continued
Transfer Agent Fees - continued
shareholders of the respective classes of the Fund. FIIOC pays for typesetting, printing and mailing of shareholder reports, except proxy statements.
For the period, transfer agent fees for each class were as follows:
| Amount | % of
Class-Level Average
Net Assets |
Class A | $ 240,180 | .25 |
Class T | 124,717 | .28 |
Class B | 7,532 | .30 |
Class C | 125,384 | .29 |
Small Cap Growth | 2,079,578 | .20 |
Class I | 138,527 | .22 |
| $ 2,715,918 | |
Accounting and Security Lending Fees. Fidelity Service Company, Inc. (FSC), an affiliate of the investment adviser, maintains the Fund's accounting records. The accounting fee is based on the level of average net assets for each month. Under a separate contract, FSC administers the security lending program. The security lending fee is based on the number and duration of lending transactions.
Brokerage Commissions. The Fund placed a portion of its portfolio transactions with brokerage firms which are affiliates of the investment adviser. Brokerage commissions are included in net realized gain (loss) and change in net unrealized appreciation (depreciation) in the Statement of Operations. The commissions paid to these affiliated firms were $80,251 for the period.
Interfund Lending Program. Pursuant to an Exemptive Order issued by the SEC, the Fund, along with other registered investment companies having management contracts with FMR or other affiliated entities of FMR, may participate in an interfund lending program. This program provides an alternative credit facility allowing the funds to borrow from, or lend money to, other participating affiliated funds. At period end, there were no interfund loans outstanding. The Fund's activity in this program during the period for which loans were outstanding was as follows:
Borrower or Lender | Average Loan
Balance | Weighted Average Interest Rate | Interest Expense |
Borrower | $ 66,799,000 | .32% | $ 4,117 |
Annual Report
Notes to Financial Statements - continued
6. Committed Line of Credit.
The Fund participates with other funds managed by the investment adviser or an affiliate in a $4.25 billion credit facility (the "line of credit") to be utilized for temporary or emergency purposes to fund shareholder redemptions or for other short-term liquidity purposes. The Fund has agreed to pay commitment fees on its pro-rata portion of the line of credit, which amounted to $1,790 and is reflected in Miscellaneous expenses on the Statement of Operations. During the period, the Fund did not borrow on this line of credit.
7. Security Lending.
The Fund lends portfolio securities through a lending agent from time to time in order to earn additional income. For equity securities, a lending agent is used and may loan securities to certain qualified borrowers, including Fidelity Capital Markets (FCM), a broker-dealer affiliated with the Fund. On the settlement date of the loan, the Fund receives collateral (in the form of U.S. Treasury obligations, letters of credit and/or cash) against the loaned securities and maintains collateral in an amount not less than 100% of the market value of the loaned securities during the period of the loan. The market value of the loaned securities is determined at the close of business of the Fund and any additional required collateral is delivered to the Fund on the next business day. If the borrower defaults on its obligation to return the securities loaned because of insolvency or other reasons, the Fund may apply collateral received from the borrower against the obligation. The Fund may experience delays and costs in recovering the securities loaned. Any cash collateral received is invested in the Fidelity Securities Lending Cash Central Fund. The value of loaned securities and cash collateral at period end are disclosed on the Fund's Statement of Assets and Liabilities. Security lending income represents the income earned on investing cash collateral, less rebates paid to borrowers and any lending agent fees associated with the loan, plus any premium payments received for lending certain types of securities. Security lending income is presented in the Statement of Operations as a component of income from Fidelity Central Funds, and includes $53,294 from securities loaned to FCM.
8. Expense Reductions.
Commissions paid to certain brokers with whom the investment adviser, or its affiliates, places trades on behalf of the Fund include an amount in addition to trade execution, which may be rebated back to the Fund to offset certain expenses. This amount totaled $134,401 for the period. In addition, through arrangements with the Fund's custodian, credits realized as a result of uninvested cash balances were used to reduce the Fund's expenses. During the period, these credits reduced the Fund's custody expenses by $211.
Annual Report
8. Expense Reductions - continued
In addition, during the period the investment adviser reimbursed/waived a portion of fund-level operating expenses in the amount of $5,837 and a portion of class-level operating expenses as follows:
| Amount |
Class A | $ 1,650 |
Class T | 799 |
Class B | 5 |
Class C | 651 |
Small Cap Growth | 28,551 |
Class I | 1,218 |
| $ 32,874 |
9. Distributions to Shareholders.
Distributions to shareholders of each class were as follows:
Years ended July 31, | 2015 | 2014 A |
From net realized gain | | |
Class A | $ 7,463,655 | $ 13,043,180 |
Class T | 3,715,268 | 6,310,012 |
Class B | 242,938 | 574,582 |
Class C | 3,707,592 | 6,249,863 |
Small Cap Growth | 83,762,458 | 191,545,684 |
Class F | - | 80,609,253 |
Class I | 4,296,573 | 7,913,662 |
Total | $ 103,188,484 | $ 306,246,236 |
A All Class F Shares were redeemed on November 15, 2013.
10. Share Transactions.
Share transactions for each class were as follows and may contain automatic conversions between classes or exchanges between funds:
| Shares | Dollars |
Years ended July 31, | 2015 | 2014 A | 2015 | 2014 A |
Class A | | | | |
Shares sold | 2,167,593 | 1,706,264 | $ 41,925,439 | $ 32,017,468 |
Reinvestment of distributions | 412,446 | 685,582 | 7,203,479 | 12,377,436 |
Shares redeemed | (1,515,208) | (1,267,150) | (27,623,856) | (23,663,751) |
Net increase (decrease) | 1,064,831 | 1,124,696 | $ 21,505,062 | $ 20,731,153 |
Annual Report
Notes to Financial Statements - continued
10. Share Transactions - continued
| Shares | Dollars |
Years ended July 31, | 2015 | 2014 A | 2015 | 2014 A |
Class T | | | | |
Shares sold | 659,898 | 787,491 | $ 12,282,234 | $ 14,539,628 |
Reinvestment of distributions | 211,200 | 341,036 | 3,613,802 | 6,061,090 |
Shares redeemed | (660,724) | (506,140) | (11,765,139) | (9,192,820) |
Net increase (decrease) | 210,374 | 622,387 | $ 4,130,897 | $ 11,407,898 |
Class B | | | | |
Shares sold | 11,802 | 11,205 | $ 209,809 | $ 198,217 |
Reinvestment of distributions | 14,482 | 32,147 | 235,501 | 548,598 |
Shares redeemed | (66,110) | (66,282) | (1,127,352) | (1,168,208) |
Net increase (decrease) | (39,826) | (22,930) | $ (682,042) | $ (421,393) |
Class C | | | | |
Shares sold | 992,298 | 918,904 | $ 17,729,436 | $ 16,220,240 |
Reinvestment of distributions | 216,825 | 347,970 | 3,508,500 | 5,911,022 |
Shares redeemed | (778,826) | (510,512) | (13,034,787) | (8,883,388) |
Net increase (decrease) | 430,297 | 756,362 | $ 8,203,149 | $ 13,247,874 |
Small Cap Growth | | | | |
Shares sold | 23,816,242 | 30,614,664 | $ 475,203,336 | $ 589,831,022 |
Reinvestment of distributions | 4,527,816 | 10,184,956 | 81,276,349 | 187,557,177 |
Shares redeemed | (22,793,867) | (48,426,256)B | (412,013,233) | (934,113,968)B |
Net increase (decrease) | 5,550,191 | (7,626,636) | $ 144,466,452 | $ (156,725,769) |
Class F | | | | |
Shares sold | - | 768,083 | $ - | $ 15,293,461 |
Reinvestment of distributions | - | 4,357,257 | - | 80,609,253 |
Shares redeemed | - | (41,060,113)B | - | (806,457,595)B |
Net increase (decrease) | - | (35,934,773) | $ - | $ (710,554,881) |
Class I | | | | |
Shares sold | 2,387,318 | 933,934 | $ 47,676,724 | $ 18,129,031 |
Reinvestment of distributions | 220,272 | 381,830 | 3,963,647 | 7,062,159 |
Shares redeemed | (789,017) | (1,069,577) | (15,108,080) | (20,552,810) |
Net increase (decrease) | 1,818,573 | 246,187 | $ 36,532,291 | $ 4,638,380 |
A All Class F Shares were redeemed on November 15, 2013.
B Amount includes in-kind redemptions.
Annual Report
11. Other.
The Fund's organizational documents provide former and current trustees and officers with a limited indemnification against liabilities arising in connection with the performance of their duties to the Fund. In the normal course of business, the Fund may also enter into contracts that provide general indemnifications. The Fund's maximum exposure under these arrangements is unknown as this would be dependent on future claims that may be made against the Fund. The risk of material loss from such claims is considered remote.
Annual Report
To the Trustees of Fidelity Securities Fund and the Shareholders of Fidelity Small Cap Growth Fund:
In our opinion, the accompanying statement of assets and liabilities, including the schedule of investments, and the related statements of operations and of changes in net assets and the financial highlights present fairly, in all material respects, the financial position of Fidelity Small Cap Growth Fund (a fund of Fidelity Securities Fund) at July 31, 2015, the results of its operations for the year then ended, the changes in its net assets for each of the two years in the period then ended and the financial highlights for each of the five years in the period then ended, in conformity with accounting principles generally accepted in the United States of America. These financial statements and financial highlights (hereafter referred to as "financial statements") are the responsibility of the Fidelity Small Cap Growth Fund's management. Our responsibility is to express an opinion on these financial statements based on our audits. We conducted our audits of these financial statements in accordance with the standards of the Public Company Accounting Oversight Board (United States). Those standards require that we plan and perform the audit to obtain reasonable assurance about whether the financial statements are free of material misstatement. An audit includes examining, on a test basis, evidence supporting the amounts and disclosures in the financial statements, assessing the accounting principles used and significant estimates made by management, and evaluating the overall financial statement presentation. We believe that our audits, which included confirmation of securities at July 31, 2015 by correspondence with the custodian and brokers, provide a reasonable basis for our opinion.
PricewaterhouseCoopers LLP
Boston, Massachusetts
September 16, 2015
Annual Report
The Trustees, Member of the Advisory Board, and officers of the trust and fund, as applicable, are listed below. The Board of Trustees governs the fund and is responsible for protecting the interests of shareholders. The Trustees are experienced executives who meet periodically throughout the year to oversee the fund's activities, review contractual arrangements with companies that provide services to the fund, oversee management of the risks associated with such activities and contractual arrangements, and review the fund's performance. Each of the Trustees oversees 170 funds.
The Trustees hold office without limit in time except that (a) any Trustee may resign; (b) any Trustee may be removed by written instrument, signed by at least two-thirds of the number of Trustees prior to such removal; (c) any Trustee who requests to be retired or who has become incapacitated by illness or injury may be retired by written instrument signed by a majority of the other Trustees; and (d) any Trustee may be removed at any special meeting of shareholders by a two-thirds vote of the outstanding voting securities of the trust. Each Trustee who is not an interested person (as defined in the 1940 Act) of the trust and the fund (Independent Trustee), shall retire not later than the last day of the calendar year in which his or her 75th birthday occurs. The Independent Trustees may waive this mandatory retirement age policy with respect to individual Trustees. The officers and Advisory Board Member hold office without limit in time, except that any officer and Advisory Board Member may resign or may be removed by a vote of a majority of the Trustees at any regular meeting or any special meeting of the Trustees. Except as indicated, each individual has held the office shown or other offices in the same company for the past five years.
Experience, Skills, Attributes, and Qualifications of the Fund's Trustees. The Governance and Nominating Committee has adopted a statement of policy that describes the experience, qualifications, attributes, and skills that are necessary and desirable for potential Independent Trustee candidates (Statement of Policy). The Board believes that each Trustee satisfied at the time he or she was initially elected or appointed a Trustee, and continues to satisfy, the standards contemplated by the Statement of Policy. The Governance and Nominating Committee also engages professional search firms to help identify potential Independent Trustee candidates who have the experience, qualifications, attributes, and skills consistent with the Statement of Policy. From time to time, additional criteria based on the composition and skills of the current Independent Trustees, as well as experience or skills that may be appropriate in light of future changes to board composition, business conditions, and regulatory or other developments, have also been considered by the professional search firms and the Governance and Nominating Committee. In addition, the Board takes into account the Trustees' commitment and participation in Board and committee meetings, as well as their leadership of standing and ad hoc committees throughout their tenure.
In determining that a particular Trustee was and continues to be qualified to serve as a Trustee, the Board has considered a variety of criteria, none of which, in isolation, was controlling. The Board believes that, collectively, the Trustees have balanced and diverse experience, qualifications, attributes, and skills, which allow the Board to operate effectively in governing the fund and protecting the interests of shareholders. Information about the specific experience, skills, attributes, and qualifications of each Trustee, which in each case led to the Board's conclusion that the Trustee should serve (or continue to serve) as a trustee of the fund, is provided below.
Annual Report
Trustees and Officers - continued
Board Structure and Oversight Function. James C. Curvey is an interested person (as defined in the 1940 Act) and currently serves as Chairman. The Trustees have determined that an interested Chairman is appropriate and benefits shareholders because an interested Chairman has a personal and professional stake in the quality and continuity of services provided to the fund. Independent Trustees exercise their informed business judgment to appoint an individual of their choosing to serve as Chairman, regardless of whether the Trustee happens to be independent or a member of management. The Independent Trustees have determined that they can act independently and effectively without having an Independent Trustee serve as Chairman and that a key structural component for assuring that they are in a position to do so is for the Independent Trustees to constitute a substantial majority for the Board. The Independent Trustees also regularly meet in executive session. Ned C. Lautenbach serves as Chairman of the Independent Trustees and as such (i) acts as a liaison between the Independent Trustees and management with respect to matters important to the Independent Trustees and (ii) with management prepares agendas for Board meetings.
Fidelity funds are overseen by different Boards of Trustees. The funds' Board oversees Fidelity's high income and certain equity funds and other Boards oversee Fidelity's investment-grade bond, money market, asset allocation, and sector funds. The asset allocation funds may invest in Fidelity funds overseen by the funds' Board. The use of separate Boards, each with its own committee structure, allows the Trustees of each group of Fidelity funds to focus on the unique issues of the funds they oversee, including common research, investment, and operational issues. On occasion, the separate Boards establish joint committees to address issues of overlapping consequences for the Fidelity funds overseen by each Board.
The Trustees operate using a system of committees to facilitate the timely and efficient consideration of all matters of importance to the Trustees, the fund, and fund shareholders and to facilitate compliance with legal and regulatory requirements and oversight of the fund's activities and associated risks. The Board, acting through its committees, has charged FMR and its affiliates with (i) identifying events or circumstances the occurrence of which could have demonstrably adverse effects on the fund's business and/or reputation; (ii) implementing processes and controls to lessen the possibility that such events or circumstances occur or to mitigate the effects of such events or circumstances if they do occur; and (iii) creating and maintaining a system designed to evaluate continuously business and market conditions in order to facilitate the identification and implementation processes described in (i) and (ii) above. Because the day-to-day operations and activities of the fund are carried out by or through FMR, its affiliates and other service providers, the fund's exposure to risks is mitigated but not eliminated by the processes overseen by the Trustees. While each of the Board's committees has responsibility for overseeing different aspects of the fund's activities, oversight is exercised primarily through the Operations, Audit, and Compliance Committees. In addition, the Independent Trustees have worked with FMR to enhance the Board's oversight of investment and financial risks, legal and regulatory risks, technology risks, and operational risks, including the development of additional risk reporting to the Board. For example, a working group comprised of Independent Trustees and FMR has worked and continues to work to review the Fidelity fund's valuation-related activities, reporting and risk management. Appropriate personnel, including but not limited to the fund's Chief Compliance Officer (CCO), FMR's internal auditor, the independent accountants, the fund's Treasurer and portfolio management personnel, make periodic reports to the Board's committees, as appropriate, including an annual review of FMR's risk management program for the Fidelity funds. The responsibilities of each standing committee, including their oversight responsibilities, are described further under "Standing Committees of the Fund's Trustees."
Annual Report
The fund's Statement of Additional Information (SAI) includes more information about the Trustees. To request a free copy, call Fidelity at 1-800-544-8544.
Interested Trustees*:
Correspondence intended for each Trustee who is an interested person may be sent to Fidelity Investments, 245 Summer Street, Boston, Massachusetts 02210.
Name, Year of Birth; Principal Occupations and Other Relevant Experience+ |
James C. Curvey (1935) |
Year of Election or Appointment: 2007 Trustee Chairman of the Board of Trustees |
| Mr. Curvey also serves as Trustee of other Fidelity funds. Mr. Curvey is a Director of Fidelity Research & Analysis Co. (investment adviser firm, 2009-present), and Vice Chairman (2007-present) and Director of FMR LLC (diversified financial services company). In addition, Mr. Curvey serves as an Overseer for the Boston Symphony Orchestra and a member of the board of Artis-Naples, Naples, Florida, and as a Trustee for Brewster Academy, Wolfeboro, New Hampshire. Previously, Mr. Curvey served as a Director of Fidelity Investments Money Management, Inc. (investment adviser firm, 2009-2014), a Director of FMR (investment adviser firm, 2007-2014), and a Director of FMR Co., Inc. (investment adviser firm, 2007-2014). |
Charles S. Morrison (1960) |
Year of Election or Appointment: 2014 Trustee |
| Mr. Morrison also serves as Trustee of other funds. He serves as a Director of Fidelity Investments Money Management, Inc. (FIMM) (investment adviser firm, 2014-present), Director of Fidelity SelectCo, LLC (investment adviser firm, 2014-present), President, Asset Management (2014-present), and is an employee of Fidelity Investments. Previously, Mr. Morrison served as Vice President of Fidelity's Fixed Income and Asset Allocation Funds (2012-2014), President, Fixed Income (2011-2014), Vice President of Fidelity's Money Market Funds (2005-2009), President, Money Market Group Leader of FMR (investment adviser firm, 2009), and Senior Vice President, Money Market Group of FMR (2004-2009). Mr. Morrison also served as Vice President of Fidelity's Bond Funds (2002-2005), certain Balanced Funds (2002-2005), and certain Asset Allocation Funds (2002-2007), and as Senior Vice President (2002-2005) of Fidelity's Bond Division. |
* Trustees have been determined to be "Interested Trustees" by virtue of, among other things, their affiliation with the trust or various entities under common control with FMR.
+ The information above includes each Trustee's principal occupation during the last five years and other information relating to the experience, attributes, and skills relevant to each Trustee's qualifications to serve as a Trustee, which led to the conclusion that each Trustee should serve as a Trustee for the fund.
Annual Report
Independent Trustees:
Correspondence intended for each Independent Trustee (that is, the Trustees other than the Interested Trustees) may be sent to Fidelity Investments, P.O. Box 55235, Boston, Massachusetts 02205-5235.
Name, Year of Birth; Principal Occupations and Other Relevant Experience+ |
Dennis J. Dirks (1948) |
Year of Election or Appointment: 2005 Trustee |
| Mr. Dirks also serves as Trustee of other Fidelity funds. Prior to his retirement in May 2003, Mr. Dirks was Chief Operating Officer and a member of the Board of The Depository Trust & Clearing Corporation (DTCC). He also served as President, Chief Operating Officer, and Board member of The Depository Trust Company (DTC) and President and Board member of the National Securities Clearing Corporation (NSCC). In addition, Mr. Dirks served as Chief Executive Officer and Board member of the Government Securities Clearing Corporation, Chief Executive Officer and Board member of the Mortgage-Backed Securities Clearing Corporation, as a Trustee and a member of the Finance Committee of Manhattan College (2005-2008), and as a Trustee and a member of the Finance Committee of AHRC of Nassau County (2006-2008). Mr. Dirks is a member of the Independent Directors Council (IDC) Governing Council (2010-present) and Board of Directors for The Brookville Center for Children's Services, Inc. (2009-present). |
Alan J. Lacy (1953) |
Year of Election or Appointment: 2008 Trustee |
| Mr. Lacy also serves as Trustee of other Fidelity funds. Mr. Lacy serves as a member of the Board of Directors of Dave & Buster's Entertainment, Inc. (restaurant and entertainment complexes, 2010-present) and Bristol-Myers Squibb Company (global pharmaceuticals, 2008-present). In addition, Mr. Lacy served as Senior Adviser (2007-2014) of Oak Hill Capital Partners, L.P. (private equity) and also served as Chief Executive Officer (2000-2005) and Vice Chairman (2005-2006) of Sears Holdings Corporation and Sears, Roebuck and Co. (retail). Mr. Lacy is a member of the Board of Trustees of The National Parks Conservation Association (2006-present). Previously, Mr. Lacy served as Chairman of the Board of Trustees of the National Parks Conservation Association (2008-2011) and as a member of the Board of Directors for The Western Union Company (global money transfer, 2006-2011), The Hillman Companies, Inc. (hardware wholesalers, 2010-2014), and Earth Fare, Inc. (retail grocery, 2010-2014). |
Ned C. Lautenbach (1944) |
Year of Election or Appointment: 2000 Trustee Chairman of the Independent Trustees |
| Mr. Lautenbach also serves as Trustee of other Fidelity funds. Mr. Lautenbach currently serves as the Lead Director of the Eaton Corporation Board of Directors (diversified industrial, 1997-present). Mr. Lautenbach is Chairman of the Board of Directors of Artis-Naples in Naples, Florida (2012-present), a member of the Council on Foreign Relations (1994-present), and a member of the Board of Governors, State University System of Florida (2013-present). Previously, Mr. Lautenbach was a Partner/Advisory Partner at Clayton, Dubilier & Rice, LLC (private equity investment, 1998-2010), as well as a Director of Sony Corporation (2006-2007). |
Joseph Mauriello (1944) |
Year of Election or Appointment: 2008 Trustee |
| Mr. Mauriello also serves as Trustee of other Fidelity funds. Prior to his retirement in January 2006, Mr. Mauriello served in numerous senior management positions including Deputy Chairman and Chief Operating Officer (2004-2005), and Vice Chairman of Financial Services (2002-2004) of KPMG LLP US (professional services, 1965-2005). Mr. Mauriello currently serves as a member of the Board of Directors of XL Group plc. (global insurance and re-insurance, 2006-present). Previously, Mr. Mauriello served as a Director of the Hamilton Funds of the Bank of New York (2006-2007) and of Arcadia Resources Inc. (health care services and products, 2007-2012). |
Robert W. Selander (1950) |
Year of Election or Appointment: 2011 Trustee |
| Mr. Selander also serves as Trustee of other Fidelity funds. Mr. Selander serves as a Director of The Western Union Company (global money transfer, 2014-present). Previously, Mr. Selander served as a Member of the Advisory Board of other Fidelity funds (2011), and Executive Vice Chairman (2010), Chief Executive Officer (2009-2010), and President and Chief Executive Officer (1997-2009) of Mastercard, Inc. |
Cornelia M. Small (1944) |
Year of Election or Appointment: 2005 Trustee |
| Ms. Small also serves as Trustee of other Fidelity funds. Ms. Small is a member of the Board of Directors (2009-present) and Chair of the Investment Committee (2010-present) of the Teagle Foundation. Ms. Small also serves on the Investment Committee of the Berkshire Taconic Community Foundation (2008-present). Previously, Ms. Small served as Chairperson (2002-2008) and a member of the Investment Committee and Chairperson (2008-2012) and a member of the Board of Trustees of Smith College. In addition, Ms. Small served as Chief Investment Officer, Director of Global Equity Investments, and a member of the Board of Directors of Scudder, Stevens & Clark and Scudder Kemper Investments. |
William S. Stavropoulos (1939) |
Year of Election or Appointment: 2002 Trustee Vice Chairman of the Independent Trustees |
| Mr. Stavropoulos also serves as Trustee of other Fidelity funds. Mr. Stavropoulos serves as President and Founder of the Michigan Baseball Foundation, the Great Lakes Loons (2007-present). Mr. Stavropoulos is Chairman Emeritus of the Board of Directors of The Dow Chemical Company, where he previously served in numerous senior management positions, including President, CEO (1995-2000; 2002-2004), Chairman of the Executive Committee (2000-2006), and as a member of the Board of Directors (1990-2006). Currently, Mr. Stavropoulos is Chairman of the Board of Directors of Univar Inc. (global distributor of commodity and specialty chemicals), a Director of Teradata Corporation (data warehousing and technology solutions), and Maersk Inc. (industrial conglomerate), and a member of the Advisory Board for Metalmark Capital LLC (private equity investment, 2005-present). Mr. Stavropoulos is an operating advisor to Clayton, Dubilier & Rice, LLC (private equity investment). In addition, Mr. Stavropoulos is a member of the University of Notre Dame Advisory Council for the College of Science, a Trustee of the Rollin L. Gerstacker Foundation, and a Director of the Naples Philharmonic Center for the Arts. Previously, Mr. Stavropoulos served as a Director of Chemical Financial Corporation (bank holding company, 1993-2012) and Tyco International, Ltd. (multinational manufacturing and services, 2007-2012). |
David M. Thomas (1949) |
Year of Election or Appointment: 2008 Trustee |
| Mr. Thomas also serves as Trustee of other Fidelity funds. Mr. Thomas serves as Non-Executive Chairman of the Board of Directors of Fortune Brands Home and Security (home and security products, 2011-present), as a member of the Board of Directors (2004-present) and Presiding Director (2013-present) of Interpublic Group of Companies, Inc. (marketing communication), and as a member of the Board of Trustees of the University of Florida (2013-present). Previously, Mr. Thomas served as Executive Chairman (2005-2006) and Chairman and Chief Executive Officer (2000-2005) of IMS Health, Inc. (pharmaceutical and healthcare information solutions), and a Director of Fortune Brands, Inc. (consumer products, 2000-2011). |
+ The information above includes each Trustee's principal occupation during the last five years and other information relating to the experience, attributes, and skills relevant to each Trustee's qualifications to serve as a Trustee, which led to the conclusion that each Trustee should serve as a Trustee for the fund.
Advisory Board Member and Officers:
Correspondence intended for each officer and Peter S. Lynch may be sent to Fidelity Investments, 245 Summer Street, Boston, Massachusetts 02210. Officers appear below in alphabetical order.
Name, Year of Birth; Principal Occupation |
Peter S. Lynch (1944) |
Year of Election or Appointment: 2003 Member of the Advisory Board |
| Mr. Lynch also serves as Member of the Advisory Board of other Fidelity funds. Mr. Lynch is Vice Chairman and a Director of FMR (investment adviser firm) and FMR Co., Inc. (investment adviser firm). In addition, Mr. Lynch serves as a Trustee of Boston College and as the Chairman of the Inner-City Scholarship Fund. Previously, Mr. Lynch served on the Special Olympics International Board of Directors (1997-2006). |
Elizabeth Paige Baumann (1968) |
Year of Election or Appointment: 2012 Anti-Money Laundering (AML) Officer |
| Ms. Baumann also serves as AML Officer of other funds. She is Chief AML Officer of FMR LLC (diversified financial services company, 2012-present) and is an employee of Fidelity Investments. Previously, Ms. Baumann served as Vice President and Deputy Anti-Money Laundering Officer (2007-2012). |
Marc Bryant (1966) |
Year of Election or Appointment: 2015 Secretary and Chief Legal Officer (CLO) |
| Mr. Bryant also serves as Secretary and Chief Legal Officer (CLO) of other funds. He is Senior Vice President and Deputy General Counsel of FMR LLC (diversified financial services company). Previously, Mr. Bryant served as Secretary and Chief Legal Officer of Fidelity Rutland Square Trust II (2010-2014) and Assistant Secretary of Fidelity's Fixed Income and Asset Allocation Fund (2013-2015). Prior to joining Fidelity Investments, Mr. Bryant served as a Senior Vice President and the Head of Global Retail Legal for AllianceBernstein L.P. (2006-2010), and as the General Counsel for ProFund Advisors LLC (2001-2006). |
William C. Coffey (1969) |
Year of Election or Appointment: 2009 Assistant Secretary |
| Mr. Coffey also serves as Assistant Secretary of other funds. He is Senior Vice President and Deputy General Counsel of FMR LLC (diversified financial services company, 2010-present), and is an employee of Fidelity Investments. Previously, Mr. Coffey served as Vice President and Associate General Counsel of FMR LLC (2005-2009). |
Jonathan Davis (1968) |
Year of Election or Appointment: 2010 Assistant Treasurer |
| Mr. Davis also serves as Assistant Treasurer of other funds. Mr. Davis is an employee of Fidelity Investments. Previously, Mr. Davis served as Vice President and Associate General Counsel of FMR LLC (diversified financial services company, 2003-2010). |
Adrien E. Deberghes (1967) |
Year of Election or Appointment: 2008 Deputy Treasurer |
| Mr. Deberghes also serves as an officer of other funds. He is an employee of Fidelity Investments (2008-present). Prior to joining Fidelity Investments, Mr. Deberghes was Senior Vice President of Mutual Fund Administration at State Street Corporation (2007-2008), Senior Director of Mutual Fund Administration at Investors Bank & Trust (2005-2007), and Director of Finance for Dunkin' Brands (2000-2005). |
Stephanie J. Dorsey (1969) |
Year of Election or Appointment: 2010 Assistant Treasurer |
| Ms. Dorsey also serves as an officer of other funds. She is an employee of Fidelity Investments (2008-present) and has served in other fund officer roles. Prior to joining Fidelity Investments, Ms. Dorsey served as Treasurer (2004-2008) of the JPMorgan Mutual Funds and Vice President (2004-2008) of JPMorgan Chase Bank. |
Howard J. Galligan III (1966) |
Year of Election or Appointment: 2014 Chief Financial Officer |
| Mr. Galligan also serves as Chief Financial Officer of other funds. Mr. Galligan serves as President of Fidelity Pricing and Cash Management Services (FPCMS) (2014-present) and as a Director of Strategic Advisers, Inc. (investment adviser firm, 2008-present). Previously, Mr. Galligan served as Chief Administrative Officer of Asset Management (2011-2014) and Chief Operating Officer and Senior Vice President of Investment Support for Strategic Advisers, Inc. (2003-2011). |
Scott C. Goebel (1968) |
Year of Election or Appointment: 2015 Vice President |
| Mr. Goebel serves as an officer of other funds. Mr. Goebel also serves as Secretary of Fidelity SelectCo, LLC (investment adviser firm, 2013-present), Fidelity Investments Money Management, Inc. (FIMM) (investment adviser firm, 2010-present) and Fidelity Research and Analysis Company (FRAC) (investment adviser firm, 2010-present); General Counsel, Secretary, and Senior Vice President of FMR (investment adviser firm, 2008-present) and FMR Co., Inc. (investment adviser firm, 2008-present); Chief Legal Officer of Fidelity Management & Research (Hong Kong) Limited (investment adviser firm, 2008-present); and Assistant Secretary of Fidelity Management & Research (Japan) Limited (investment adviser firm, 2008-present) and FMR Investment Management (U.K.) Limited (investment adviser firm, 2008-present). Previously, Mr. Goebel served as Secretary and CLO of certain Fidelity funds (2008-2015), Assistant Secretary of FIMM (2008-2010), FRAC (2008-2010), and certain funds (2007-2008); and as Vice President and Secretary of Fidelity Distributors Corporation (FDC) (2005-2007). Mr. Goebel has been employed by FMR LLC (diversified financial services company) or an affiliate since 2001. |
Thomas C. Hense (1964) |
Year of Election or Appointment: 2008/2010/2015 Vice President |
| Mr. Hense serves as Vice President of Fidelity Advisor Multi-Asset Income Fund (2015) and other funds (High Income (2008), Small Cap (2008), and Value (2010) funds). Previously, Mr. Hense served as a portfolio manager for Fidelity's Institutional Money Management Group (Pyramis) (2003-2008). |
Brian B. Hogan (1964) |
Year of Election or Appointment: 2009 Vice President |
| Mr. Hogan also serves as Trustee or Vice President of other funds. Mr. Hogan serves as a Director of Fidelity SelectCo, LLC (investment adviser firm, 2014-present) and President of the Equity Division of FMR (investment adviser firm, 2009-present). Previously, Mr. Hogan served as Senior Vice President, Equity Research of FMR (2006-2009) and as a portfolio manager. |
Chris Maher (1972) |
Year of Election or Appointment: 2013 Assistant Treasurer |
| Mr. Maher serves as Assistant Treasurer of other funds. Mr. Maher is Vice President of Valuation Oversight and is an employee of Fidelity Investments. Previously, Mr. Maher served as Vice President of Asset Management Compliance (2013), Vice President of the Program Management Group of FMR (investment adviser firm, 2010-2013), and Vice President of Valuation Oversight (2008-2010). |
Kenneth B. Robins (1969) |
Year of Election or Appointment: 2008 President and Treasurer |
| Mr. Robins also serves as an officer of other funds. Mr. Robins serves as Executive Vice President of Fidelity Investments Money Management, Inc. (FIMM) (investment adviser firm, 2013-present) and is an employee of Fidelity Investments (2004-present). Previously, Mr. Robins served in other fund officer roles. |
Stephen Sadoski (1971) |
Year of Election or Appointment: 2012 Deputy Treasurer |
| Mr. Sadoski also serves as Deputy Treasurer of other funds. He is an employee of Fidelity Investments (2012-present) and has served in another fund officer role. Prior to joining Fidelity Investments, Mr. Sadoski served as an assistant chief accountant in the Division of Investment Management of the Securities and Exchange Commission (SEC) (2009-2012) and as a senior manager at Deloitte & Touche LLP (1997-2009). |
Stacie M. Smith (1974) |
Year of Election or Appointment: 2013 Deputy Treasurer |
| Ms. Smith also serves as an officer of other funds. She is an employee of Fidelity Investments (2009-present) and has served in other fund officer roles. Prior to joining Fidelity Investments, Ms. Smith served as Senior Audit Manager of Ernst & Young LLP (1996-2009). |
Renee Stagnone (1975) |
Year of Election or Appointment: 2013 Deputy Treasurer |
| Ms. Stagnone also serves as Deputy Treasurer of other funds. Ms. Stagnone is an employee of Fidelity Investments. |
Linda J. Wondrack (1964) |
Year of Election or Appointment: 2014 Chief Compliance Officer |
| Ms. Wondrack also serves as Chief Compliance Officer of other funds. Ms. Wondrack is Executive Vice President and head of the Ethics Office and Asset Management Compliance for Fidelity Investments (2012-present). Ms. Wondrack also serves as Chief Compliance Officer of Fidelity SelectCo, LLC (investment adviser firm, 2014-present); Chief Compliance Officer of Impresa Management LLC (2013-present); and Chief Compliance Officer of FMR Co., Inc. (investment adviser firm), Fidelity Investments Money Management, Inc. (investment adviser firm), Fidelity Management & Research (Japan) Limited (investment adviser firm), FMR Investment Management (U.K.) Limited (investment adviser firm), Fidelity Management & Research (Hong Kong) (investment adviser firm), Fidelity Management & Research Company (investment adviser firm), Pyramis Global Advisors, LLC (investment adviser firm), and Strategic Advisers, Inc. (investment adviser firm), Ballyrock Investment Advisors LLC, and Northern Neck Investors LLC (2012-present). Previously, Ms. Wondrack served as Senior Vice President and Chief Compliance Officer for Columbia Management Investment Advisers, LLC (2005-2012); Chief Compliance Officer for certain funds within the Columbia Family of Funds (2007-2012); and Senior Vice President of Compliance Risk Management at Bank of America (2005-2010). |
Joseph F. Zambello (1957) |
Year of Election or Appointment: 2011 Deputy Treasurer |
| Mr. Zambello also serves as Deputy Treasurer of other funds. Mr. Zambello is an employee of Fidelity Investments. Previously, Mr. Zambello served as Vice President of the Program Management Group of FMR (investment adviser firm, 2009-2011) and Vice President of the Transfer Agent Oversight Group (2005-2009). |
Annual Report
The Board of Trustees of Fidelity Small Cap Growth Fund voted to pay on September 14, 2015, to shareholders of record at the opening of business on September 11, 2015, a distribution of $0.785 per share derived from capital gains realized from sales of portfolio securities.
The fund hereby designates as a capital gain dividend with respect to the taxable year ended July 31, 2015, $75,767,806, or, if subsequently determined to be different, the net capital gain of such year.
The fund will notify shareholders in January 2016 of amounts for use in preparing 2015 income tax returns.
Annual Report
Fidelity Small Cap Growth Fund
Each year, the Board of Trustees, including the Independent Trustees (together, the Board), votes on the renewal of the management contract with Fidelity Management & Research Company (FMR) and the sub-advisory agreements (together, the Advisory Contracts) for the fund. The Board, assisted by the advice of fund counsel and Independent Trustees' counsel, requests and considers a broad range of information relevant to the renewal of the Advisory Contracts throughout the year.
The Board meets regularly and, at each of its meetings, covers an extensive agenda of topics and materials and considers factors that are relevant to its annual consideration of the renewal of the fund's Advisory Contracts, including the services and support provided to the fund and its shareholders. The Board has established various standing committees (Committees), each composed of and chaired by Independent Trustees with varying backgrounds, to which the Board has assigned specific subject matter responsibilities in order to enhance effective decision-making by the Board. The Board, acting directly and through its Committees, requests and receives information concerning the annual consideration of the renewal of the fund's Advisory Contracts. The Board also meets as needed to consider matters specifically related to the Board's annual consideration of the renewal of the Advisory Contracts. Members of the Board may also meet with trustees of other Fidelity funds through ad hoc joint committees to discuss certain matters relevant to all of the Fidelity funds.
At its July 2015 meeting, the Board unanimously determined to renew the fund's Advisory Contracts. In reaching its determination, the Board considered all factors it believed relevant, including (i) the nature, extent, and quality of the services to be provided to the fund and its shareholders (including the investment performance of the fund); (ii) the competitiveness of the fund's management fee and total expense ratio relative to peer funds; (iii) the total costs of the services to be provided by and the profits to be realized by Fidelity from its relationship with the fund; and (iv) the extent to which (if any) economies of scale exist and would be realized as the fund grows, and whether any economies of scale are appropriately shared with fund shareholders.
In considering whether to renew the Advisory Contracts for the fund, the Board reached a determination, with the assistance of fund counsel and Independent Trustees' counsel and through the exercise of its business judgment, that the renewal of the Advisory Contracts was in the best interests of the fund and its shareholders and that the compensation payable under the Advisory Contracts was fair and reasonable. The Board's decision to renew the Advisory Contracts was not based on any single factor, but rather was based on a comprehensive consideration of all the information provided to the Board at its meetings throughout the year. The Board, in reaching its determination to renew the Advisory Contracts, was aware that shareholders of the fund have a broad range of investment choices available to them, including a wide choice among funds offered by Fidelity's competitors, and that the fund's shareholders, who have the opportunity to review and weigh the disclosure provided by the fund in its prospectus and other public disclosures, have chosen to invest in this fund, which is part of the Fidelity family of funds.
Annual Report
Board Approval of Investment Advisory Contracts and
Management Fees - continued
Nature, Extent, and Quality of Services Provided. The Board considered Fidelity's staffing as it relates to the fund, including the backgrounds of investment personnel of Fidelity, and also considered the fund's investment objective, strategies, and related investment philosophy. The Independent Trustees also had discussions with senior management of Fidelity's investment operations and investment groups. The Board considered the structure of the portfolio manager compensation program and whether this structure provides appropriate incentives to act in the best interests of the fund. Additionally, the Board considered the portfolio managers' investments, if any, in the funds that they manage.
Resources Dedicated to Investment Management and Support Services. The Board and the Fund Oversight and Research Committees reviewed the general qualifications and capabilities of Fidelity's investment staff, including its size, education, experience, and resources, as well as Fidelity's approach to recruiting, training, managing, and compensating investment personnel. The Board noted that Fidelity has continued to increase the resources devoted to non-U.S. offices, including expansion of Fidelity's global investment organization. The Board also noted that Fidelity's analysts have extensive resources, tools and capabilities that allow them to conduct sophisticated quantitative and fundamental analysis, as well as credit analysis of issuers, counterparties and guarantors. Further, the Board considered that Fidelity's investment professionals have sufficient access to global information and data so as to provide competitive investment results over time, and that those professionals also have access to sophisticated tools that permit them to assess portfolio construction and risk and performance attribution characteristics continuously, as well as to transmit new information and research conclusions rapidly around the world. Additionally, in its deliberations, the Board considered Fidelity's trading, risk management, and compliance capabilities and resources, which are integral parts of the investment management process.
Shareholder and Administrative Services. The Board considered (i) the nature, extent, quality, and cost of advisory, administrative, and shareholder services performed by FMR, the sub-advisers (together with FMR, the Investment Advisers), and their affiliates under the Advisory Contracts and under separate agreements covering transfer agency, pricing and bookkeeping, and securities lending services for the fund; (ii) the nature and extent of the supervision of third party service providers, principally custodians and subcustodians; and (iii) the resources devoted to, and the record of compliance with, the fund's compliance policies and procedures. The Board also reviewed the allocation of fund brokerage, including allocations to brokers affiliated with the Investment Advisers, the use of brokerage commissions to pay fund expenses, and the use of "soft" commission dollars to pay for research services.
Annual Report
The Board noted that the growth of fund assets over time across the complex allows Fidelity to reinvest in the development of services designed to enhance the value or convenience of the Fidelity funds as investment vehicles. These services include 24-hour access to account information and market information through telephone representatives and over the Internet, investor education materials and asset allocation tools, and the expanded availability of Fidelity Investor Centers.
In 2014, the Board formed an ad hoc Committee on Transfer Agency Fees to review the variety of transfer agency fee structures throughout the industry and Fidelity's competitive positioning with respect to industry participants.
Investment in a Large Fund Family. The Board considered the benefits to shareholders of investing in a Fidelity fund, including the benefits of investing in a fund that is part of a large family of funds offering a variety of investment disciplines and providing a large variety of mutual fund investor services. The Board noted that Fidelity had taken, or had made recommendations that resulted in the Fidelity funds taking, a number of actions over the previous year that benefited particular funds, including (i) continuing to dedicate additional resources to investment research and to the support of the senior management team that oversees asset management; (ii) continuing efforts to enhance Fidelity's global research capabilities; (iii) launching new funds and making other enhancements to meet client needs; (iv) reducing management fees and total expenses for certain index funds and diversified international funds; (v) continuing to launch dedicated lower cost underlying funds to meet portfolio construction needs related to expanding underlying fund options for Fidelity funds of funds, specifically for the Freedom Fund product lines; (vi) rationalizing product lines and gaining increased efficiencies through fund mergers; (vii) launching active fixed-income exchange-traded funds; (viii) continuing to develop, acquire and implement systems and technology to improve services to the funds and information security and to increase efficiency; (ix) implementing investment enhancements to further strengthen Fidelity's target date product line to increase investors' probability of success in achieving their goals; (x) modifying the eligibility criteria for certain share classes to accommodate roll-over assets from employer-sponsored retirement plans; (xi) launching a new Class W of the Freedom Index Funds to attract and retain Fidelity record-kept retirement plan assets; and (xii) implementing changes to Fidelity's money market product line in response to recent money market regulatory reforms.
Investment Performance. The Board considered whether the fund has operated in accordance with its investment objective, as well as its record of compliance with its investment restrictions and its performance history.
Annual Report
Board Approval of Investment Advisory Contracts and
Management Fees - continued
The Board took into account discussions with representatives of the Investment Advisers about fund investment performance that occur at Board meetings throughout the year. In this regard the Board noted that as part of regularly scheduled fund reviews and other reports to the Board on fund performance, the Board considers annualized return information for the fund, for different time periods, measured against a securities market index ("benchmark index") and a peer group of funds with similar objectives ("peer group"), if any. In its evaluation of fund investment performance, the Board gave particular attention to information indicating changes in performance of certain Fidelity funds for specific time periods and discussed with the Investment Advisers the reasons for any overperformance or underperformance.
In addition to reviewing absolute and relative fund performance, the Independent Trustees periodically consider the appropriateness of fund performance metrics in evaluating the results achieved. In general, the Independent Trustees believe that fund performance should be evaluated based on net performance (after fees and expenses) of both the highest performing and lowest performing fund share classes, where applicable, compared to appropriate benchmark indices, over appropriate time periods that may include full market cycles, and compared to peer groups, as applicable, over the same periods, taking into account relevant factors including the following: general market conditions; issuer-specific information; and fund cash flows and other factors.
The Independent Trustees recognize that shareholders evaluate performance on a net basis over their own holding periods, for which one-, three-, and five-year periods are often used as a proxy. For this reason, the performance information reviewed by the Board also included net cumulative calendar year total return information for the fund and an appropriate benchmark index and peer group for the most recent one-, three-, and five-year periods, as shown below. Returns are shown compared to the 25th percentile (top of box, 75% beaten) and 75th percentile (bottom of box, 25% beaten) of the peer universe.
Annual Report
Fidelity Small Cap Growth Fund

The Board also considered that the fund's management fee is subject to upward or downward adjustment depending upon whether, and to what extent, the fund's investment performance for the performance period exceeds, or is exceeded by, a securities index, thus leading to a performance adjustment for the same period. The Board noted that the performance adjustment provides FMR with a strong economic incentive to seek to achieve superior performance for the fund's shareholders and helps to more closely align the interests of FMR and the shareholders of the fund.
Based on its review, the Board concluded that the nature, extent, and quality of services provided to the fund under the Advisory Contracts should benefit the shareholders of the fund.
Competitiveness of Management Fee and Total Expense Ratio. The Board considered the fund's management fee and total expense ratio compared to "mapped groups" of competitive funds and classes created for the purpose of facilitating the Trustees' competitive analysis of management fees and total expenses. Fidelity creates "mapped groups" by combining similar Lipper investment objective categories that have comparable investment mandates. Combining Lipper investment objective categories aids the Board's management fee and total expense ratio comparisons by broadening the competitive group used for comparison.
Management Fee. The Board considered two proprietary management fee comparisons for the 12-month periods shown in basis points (BP) in the chart below. The group of Lipper funds used by the Board for management fee comparisons is referred to below as the "Total Mapped Group." The Total Mapped Group comparison focuses on a fund's standing in terms of gross management fees before expense reimbursements or caps, and without giving effect to the fund's performance adjustment, relative to the total universe of funds with comparable investment mandates, regardless of whether their management fee structures also are comparable. Funds with comparable investment mandates offer exposure to similar types of securities. Funds with comparable management fee structures have similar management fee contractual arrangements (e.g., flat rate charged for advisory services, all-inclusive fee rate, etc.). "TMG %" represents the percentage of funds in the Total Mapped Group that had management fees that were lower than the fund's. For example, a hypothetical TMG % of 20% would mean that 80% of the funds in the Total Mapped Group had higher, and 20% had lower, management fees than the fund. The fund's actual TMG %s and the number of funds in the Total Mapped Group are in the chart below. The "Asset-Size Peer Group" (ASPG) comparison focuses on a fund's standing relative to a subset of non-Fidelity funds within the Total Mapped Group that are similar in size and management fee structure without taking into account performance adjustments, if any. For example, if a fund is in the first quartile of the ASPG, the fund's management fee ranks in the least expensive or lowest 25% of funds in the ASPG. The ASPG represents at least 15% of the funds in the Total Mapped Group with comparable asset size and management fee structures, subject to a minimum of 50 funds (or all funds in the Total Mapped Group if fewer than 50). Additional information, such as the ASPG quartile in which the fund's management fee rate ranked and the impact of the fund's performance adjustment, is also included in the chart and considered by the Board.
Annual Report
Board Approval of Investment Advisory Contracts and
Management Fees - continued
Fidelity Small Cap Growth Fund

Annual Report
The Board noted that the fund's management fee rate ranked below the median of its Total Mapped Group and below the median of its ASPG for 2014. The Board also noted the effect of the fund's performance adjustment, if any, on the fund's management fee ranking.
The Board noted that, in 2014, the ad hoc Committee on Group Fee was formed by it and other Fidelity fund boards to conduct an in-depth review of the "group fee" component of the management fee of funds with such management fee structures. Committee focus included the mechanics of the group fee, the competitive landscape of group fee structures, Fidelity funds with no group fee component and investment products not included in group fee assets. The Board also considered that, for funds subject to the group fee, FMR agreed to voluntarily waive fees over a specified period of time in amounts designed to account for assets converted from certain funds to certain collective investment trusts.
The Board also noted that, in 2013, the ad hoc Committee on Management Fees was formed to conduct an in-depth review of the management fee rates of Fidelity's active equity mutual funds. The Committee focused on the following areas: (i) standard fee structures; (ii) research consumption and trading evolution; (iii) management fee competitiveness/profitability by category; and (iv) factors that drive institutional pricing.
Based on its review, the Board concluded that the fund's management fee is fair and reasonable in light of the services that the fund receives and the other factors considered.
Total Expense Ratio. In its review of each class's total expense ratio, the Board considered the fund's management fee as well as other fund or class expenses, as applicable, such as transfer agent fees, pricing and bookkeeping fees, fund-paid 12b-1 fees, and custodial, legal, and audit fees. The Board noted the impact of the fund's performance adjustment. The Board also noted that Fidelity may agree to waive fees and expenses from time to time, and the extent to which, if any, it has done so for the fund. As part of its review, the Board also considered the current and historical total expense ratios of each class of the fund compared to competitive fund median expenses. Each class of the fund is compared to those funds and classes in the Total Mapped Group (used by the Board for management fee comparisons) that have a similar sales load structure.
The Board noted that the total expense ratio of each of Class A, Class B, Class C, Class I, and the retail class ranked below its competitive median for 2014 and the total expense ratio of Class T ranked above its competitive median for 2014. The Board considered that, in general, various factors can affect total expense ratios. The Board noted that the total expense ratio of Class T was above the competitive median primarily because of higher 12b-1 fees on Class T as compared to most competitor funds. Class T has a higher 12b-1 fee, but a lower front-end sales charge, than traditionally priced front-end sales charge classes. The Board considered that Class T is primarily sold load-waived in the retirement plan market where its 0.50% 12b-1 fee is comparable to competing no-load, higher 12b-1 fee classes designed specifically for retirement plans. The Board noted that the fund offers multiple classes, each of which has a different sales load and 12b-1 fee structure, and that the multiple structures are intended to offer a range of pricing options for the intermediary market. The Board also noted that the total expense ratios of the classes vary primarily by the level of their 12b-1 fees, although differences in transfer agent fees may also cause expenses to vary from class to class.
Annual Report
Board Approval of Investment Advisory Contracts and
Management Fees - continued
Fees Charged to Other Fidelity Clients. The Board also considered Fidelity fee structures and other information with respect to clients of Fidelity, such as other funds advised or subadvised by Fidelity, pension plan clients, and other institutional clients with similar mandates. The Board noted the findings of the 2013 ad hoc joint committee (created with the board of other Fidelity funds), which reviewed and compared Fidelity's institutional investment advisory business with its business of providing services to the Fidelity funds, including the differences in services provided, fees charged, and costs incurred, as well as competition in their respective marketplaces.
Based on its review of total expense ratios and fees charged to other Fidelity clients, the Board concluded that, although Class T was above the median of the universe presented for comparison, the total expense ratio of each class of the fund was reasonable in light of the services that the fund and its shareholders receive and the other factors considered.
Costs of the Services and Profitability. The Board considered the revenues earned and the expenses incurred by Fidelity in conducting the business of developing, marketing, distributing, managing, administering and servicing the fund and servicing the fund's shareholders. The Board also considered the level of Fidelity's profits in respect of all the Fidelity funds.
On an annual basis, Fidelity presents to the Board information about the profitability of its relationship with the fund. Fidelity calculates profitability information for each fund, as well as aggregate profitability information for groups of Fidelity funds and all Fidelity funds, using a series of detailed revenue and cost allocation methodologies which originate with the books and records of Fidelity on which Fidelity's audited financial statements are based. The Audit Committee of the Board reviews any significant changes from the prior year's methodologies.
PricewaterhouseCoopers LLP (PwC), independent registered public accounting firm and auditor to Fidelity and certain Fidelity funds, has been engaged annually by the Board as part of the Board's assessment of Fidelity's profitability analysis. PwC's engagement includes the review and assessment of the methodologies used by Fidelity in determining the revenues and expenses attributable to Fidelity's mutual fund business, and completion of agreed-upon procedures in respect of the mathematical accuracy of fund profitability and its conformity to established allocation methodologies. After considering PwC's reports issued under the engagement and information provided by Fidelity, the Board concluded that while other allocation methods may also be reasonable, Fidelity's profitability methodologies are reasonable in all material respects.
Annual Report
The Board also reviewed Fidelity's non-fund businesses and fall-out benefits related to the mutual fund business as well as cases where Fidelity's affiliates may benefit from or be related to the fund's business.
The Board considered the costs of the services provided by and the profits realized by Fidelity in connection with the operation of the fund and was satisfied that the profitability was not excessive.
Economies of Scale. The Board considered whether there have been economies of scale in respect of the management of the Fidelity funds, whether the Fidelity funds (including the fund) have appropriately benefited from any such economies of scale, and whether there is potential for realization of any further economies of scale. The Board considered the extent to which the fund will benefit from economies of scale as assets grow through increased services to the fund, through waivers or reimbursements, or through fee or expense ratio reductions. The Board also noted that in 2013, it and the boards of other Fidelity funds created an ad hoc committee (the Economies of Scale Committee) to analyze whether Fidelity attains economies of scale in respect of the management and servicing of the Fidelity funds, whether the Fidelity funds have appropriately benefited from such economies of scale, and whether there is potential for realization of any further economies of scale.
The Board recognized that the fund's management contract incorporates a "group fee" structure, which provides for lower group fee rates as total group assets increase, and for higher group fee rates as total group assets decrease (with "group assets" defined to include fund assets under FMR's management plus sector fund assets previously under FMR's management and currently managed by Fidelity SelectCo, LLC). FMR calculates the group fee rates based on a tiered asset "breakpoint" schedule that varies based on asset class. The Board considered that the group fee is designed to deliver the benefits of economies of scale to fund shareholders when total Fidelity fund assets increase, even if assets of any particular fund are unchanged or have declined, because some portion of Fidelity's costs are attributable to services provided to all Fidelity funds, and all funds benefit if those costs can be allocated among more assets. The Board concluded that, given the group fee structure, fund shareholders will benefit from lower management fees as group assets increase at the fund complex level, regardless of whether Fidelity achieves any such economies of scale.
The Board concluded, taking into account the analysis of the Economies of Scale Committee, that economies of scale, if any, are being appropriately shared between fund shareholders and Fidelity.
Annual Report
Board Approval of Investment Advisory Contracts and
Management Fees - continued
Additional Information Requested by the Board. In order to develop fully the factual basis for consideration of the Fidelity funds' Advisory Contracts, the Board requested and received additional information on certain topics, including: (i) fund performance trends and Fidelity's long-term strategies for certain funds; (ii) the various share classes employed by Fidelity and the attributes of each class, together with similar information on the distribution and servicing payments made by Fidelity or the funds to third-party participants in the distribution channels; (iii) fund profitability, and fund performance in relation to fund profitability; (iv) the methodology with respect to evaluating competitive fund data and peer group classifications and fee comparisons; (v) annual fund profitability margins, with particular focus on certain funds with negative margins; (vi) the realization of fall-out benefits in certain Fidelity business units; (vii) economies of scale and the way in which they are shared with fund shareholders; (viii) Fidelity's group fee structures, including the group fee schedule of breakpoints; (ix) the impact of cost containment measures on the funds; and (x) the transfer agent fee structure.
Based on its evaluation of all of the conclusions noted above, and after considering all factors it believed relevant, the Board concluded that the advisory fee structures are fair and reasonable, and that the fund's Advisory Contracts should be renewed.
Annual Report
Investment Adviser
Fidelity Management & Research Company
Boston, MA
Investment Sub-Advisers
FMR Co., Inc.
FMR Investment Management
(U.K.) Limited
Fidelity Management & Research
(Hong Kong) Limited
Fidelity Management & Research
(Japan) Limited
General Distributor
Fidelity Distributors Corporation
Smithfield, RI
Transfer and Service Agents
Fidelity Investments Institutional
Operations Company, Inc.
Boston, MA
Fidelity Service Company, Inc.
Boston, MA
Custodian
Brown Brothers Harriman
Boston, MA
The Fidelity Telephone Connection
Mutual Fund 24-Hour Service
Exchanges/Redemptions
and Account Assistance 1-800-544-6666
Product Information 1-800-544-6666
Retirement Accounts 1-800-544-4774
(8 a.m. - 9 p.m.)
TDD Service 1-800-544-0118
for the deaf and hearing impaired
(9 a.m. - 9 p.m. Eastern time)
Fidelity Automated Service
Telephone (FAST®)
1-800-544-5555

Automated line for quickest service
(Fidelity Investment logo)(registered trademark)
Corporate Headquarters
245 Summer St., Boston, MA 02210
www.fidelity.com
SCP-UANN-0915
1.803694.110
(Fidelity Investment logo)(registered trademark)
Fidelity Advisor®
Small Cap Growth
Fund - Class A, Class T,
Class B and Class C
Annual Report
July 31, 2015
(Fidelity Cover Art)
Class A, Class T, Class B,
and Class C are classes
of Fidelity® Small Cap
Growth Fund
Contents
Performance | (Click Here) | How the fund has done over time. |
Management's Discussion of Fund Performance | (Click Here) | The Portfolio Manager's review of fund performance and strategy. |
Shareholder Expense Example | (Click Here) | An example of shareholder expenses. |
Investment Changes | (Click Here) | A summary of major shifts in the fund's investments over the past six months. |
Investments | (Click Here) | A complete list of the fund's investments with their market values. |
Financial Statements | (Click Here) | Statements of assets and liabilities, operations, and changes in net assets, as well as financial highlights. |
Notes | (Click Here) | Notes to the financial statements. |
Report of Independent Registered Public Accounting Firm | (Click Here) | |
Trustees and Officers | (Click Here) | |
Distributions | (Click Here) | |
Board Approval of Investment Advisory Contracts and Management Fees | (Click Here) | |
To view a fund's proxy voting guidelines and proxy voting record for the 12-month period ended June 30, visit http://www.fidelity.com/proxyvotingresults or visit the Securities and Exchange Commission's (SEC) web site at http://www.sec.gov. You may also call 1-877-208-0098 to request a free copy of the proxy voting guidelines.
Standard & Poor's, S&P and S&P 500 are registered service marks of The McGraw-Hill Companies, Inc. and have been licensed for use by Fidelity Distributors Corporation.
Other third-party marks appearing herein are the property of their respective owners.
All other marks appearing herein are registered or unregistered trademarks or service marks of FMR LLC or an affiliated company. © 2015 FMR LLC. All rights reserved.
Annual Report
This report and the financial statements contained herein are submitted for the general information of the shareholders of the fund. This report is not authorized for distribution to prospective investors in the fund unless preceded or accompanied by an effective prospectus.
A fund files its complete schedule of portfolio holdings with the SEC for the first and third quarters of each fiscal year on Form N-Q. Forms N-Q are available on the SEC's web site at http://www.sec.gov. A fund's Forms N-Q may be reviewed and copied at the SEC's Public Reference Room in Washington, DC. Information regarding the operation of the SEC's Public Reference Room may be obtained by calling 1-800-SEC-0330. For a complete list of a fund's portfolio holdings, view the most recent holdings listing, semiannual report, or annual report on Fidelity's web site at http://www.fidelity.com, http://www.advisor.fidelity.com, or http://www.401k.com, as applicable.
NOT FDIC INSURED • MAY LOSE VALUE • NO BANK GUARANTEE
Neither the fund nor Fidelity Distributors Corporation is a bank.
Annual Report
Average annual total return reflects the change in the value of an investment, assuming reinvestment of the class' distributions from dividend income and capital gains (the profits earned upon the sale of securities that have grown in value, if any) and assuming a constant rate of performance each year. The $10,000 table and the fund's returns do not reflect the deduction of taxes that a shareholder would pay on fund distributions or the redemption of fund shares. During periods of reimbursement by Fidelity, a fund's total return will be greater than it would be had the reimbursement not occurred. How a fund did yesterday is no guarantee of how it will do tomorrow. Returns reflect the conversion of Class B shares to Class A shares after a maximum of seven years.
Average Annual Total Returns
Periods ended July 31, 2015 | Past 1
year | Past 5
years | Past 10
years |
Class A (incl. 5.75% sales charge) | 17.30% | 16.66% | 8.68% |
Class T (incl. 3.50% sales charge) | 19.76% | 16.89% | 8.65% |
Class B (incl. contingent deferred sales charge) A | 18.48% | 16.94% | 8.74% |
Class C (incl. contingent deferred sales charge) B | 22.53% | 17.17% | 8.50% |
A Class B shares' contingent deferred sales charges included in the past one year, past five years, and past ten years total return figures are 5%, 2%, and 0%, respectively.
B Class C shares' contingent deferred sales charges included in the past one year, past five years, and past ten years total return figures are 1%, 0%, and 0%, respectively.
Annual Report
$10,000 Over 10 Years
Let's say hypothetically that $10,000 was invested in Fidelity Advisor® Small Cap Growth Fund - Class A on July 31, 2005, when the fund started, and the current 5.75% sales charge was paid. The chart shows how the value of your investment would have changed, and also shows how the Russell 2000® Growth Index performed over the same period.
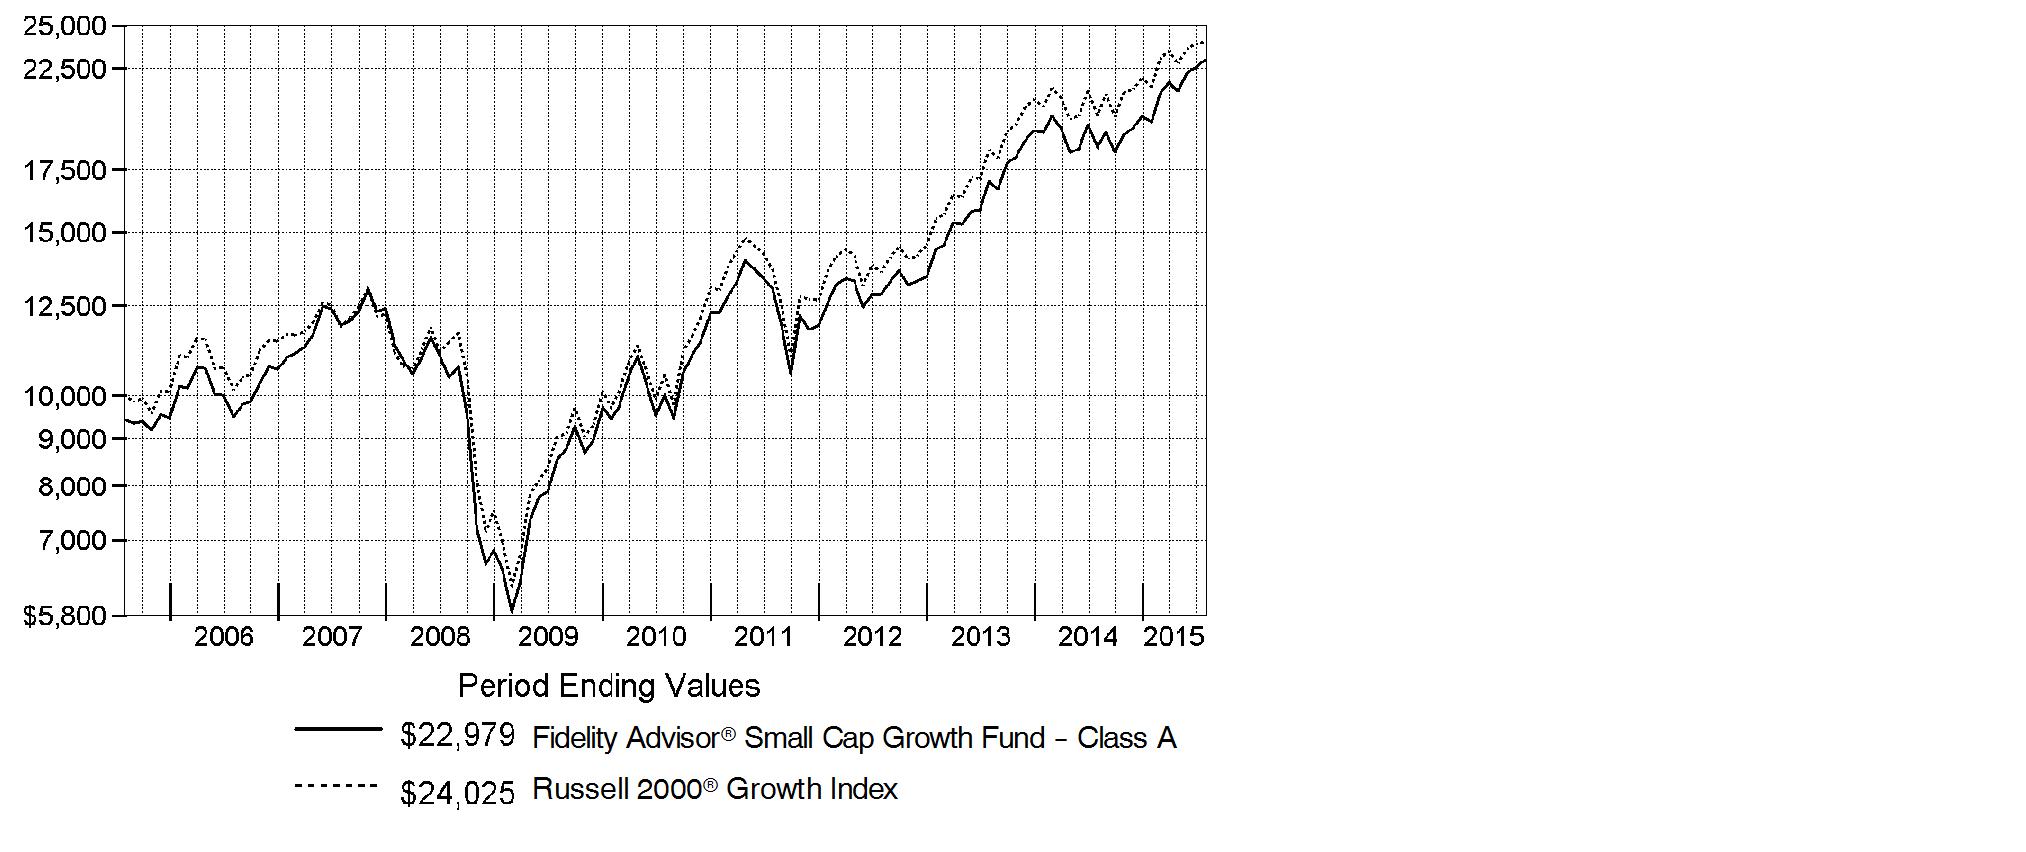
Annual Report
Market Recap: The U.S. equity market gained strongly for the 12 months ending July 31, 2015, as stocks recovered from volatility in late 2014 and early 2015, supported by a still-positive economic backdrop. The S&P 500® Index returned 11.21%, with growth stocks in the index far outpacing value-oriented names on prospects for continued U.S. economic growth. Consequently, the growth-oriented Nasdaq Composite Index® rose 18.71%, outpacing the broader S&P 500®, as well as the 12.03% advance of the smaller-cap Russell 2000® Index. Within the S&P 500®, seven of 10 sectors notched a gain, with significant performance variation. Health care (+27%) led the way, aided by merger activity. Consumer discretionary (+24%) benefited from spending linked to a seven-year low in unemployment. Strong first halves for the consumer staples sector and the real estate segment of financials yielded above-market returns (19% and 12%, respectively) for the full-year period. Conversely, energy (-26%) significantly lagged, due to a roughly 55% decline for U.S. crude-oil prices. Materials (-4%) also lost ground. At period end, investors remained focused on the slowing rate of U.S. earnings growth, the possible effect of a relatively stronger U.S. dollar on exports and inflation, and whether an economic slowdown in China would create ripples for the global economy.
Comments from Portfolio Manager Patrick Venanzi: For the year, the fund's share classes easily outperformed the 20.07% return of the benchmark Russell 2000® Growth Index. (For specific class-level results, please see the Performance section of this report.) Security selection was the main driver behind relative results. Picks within consumer discretionary and information technology helped. The top individual contributor was an overweighting in 2U, which provides cloud-based online campuses and learning platforms for nonprofit colleges and universities. The company had consecutive quarters of good earnings results, with the stock jumping in March when Yale University announced it would partner with 2U on building an online degree program. Shares rose again in May after the firm announced first-quarter financial results that beat expectations, and increased guidance for full-year 2015 results. Conversely, we were hurt by a non-index stake in Accretive Health, a provider of revenue cycle management solutions for hospitals. First, shares tumbled in December 2014 after the firm released disappointing 2013 financial results. Then in July, key client Ascension Health offered to buy the firm below its current value. Accretive reported it was searching for "strategic alternatives" and that it would not renew its contract with Ascension - a major source of the firm's 2014 revenue. The stock subsequently plunged.
The views expressed above reflect those of the portfolio manager(s) only through the end of the period as stated on the cover of this report and do not necessarily represent the views of Fidelity or any other person in the Fidelity organization. Any such views are subject to change at any time based upon market or other conditions and Fidelity disclaims any responsibility to update such views. These views may not be relied on as investment advice and, because investment decisions for a Fidelity fund are based on numerous factors, may not be relied on as an indication of trading intent on behalf of any Fidelity fund.
Annual Report
Shareholder Expense Example
As a shareholder of the Fund, you incur two types of costs: (1) transaction costs, including sales charges (loads) on purchase payments or redemption proceeds, redemption fees and (2) ongoing costs, including management fees, distribution and/or service (12b-1) fees and other Fund expenses. This Example is intended to help you understand your ongoing costs (in dollars) of investing in the Fund and to compare these costs with the ongoing costs of investing in other mutual funds.
The Example is based on an investment of $1,000 invested at the beginning of the period and held for the entire period (February 1, 2015 to July 31, 2015).
Actual Expenses
The first line of the accompanying table for each class of the Fund provides information about actual account values and actual expenses. You may use the information in this line, together with the amount you invested, to estimate the expenses that you paid over the period. Simply divide your account value by $1,000.00 (for example, an $8,600 account value divided by $1,000.00 = 8.6), then multiply the result by the number in the first line for a class of the Fund under the heading entitled "Expenses Paid During Period" to estimate the expenses you paid on your account during this period. A small balance maintenance fee of $12.00 that is charged once a year may apply for certain accounts with a value of less than $2,000. This fee is not included in the table below. If it was, the estimate of expenses you paid during the period would be higher, and your ending account value lower, by this amount. In addition, the Fund, as a shareholder in the underlying Fidelity Central Funds, will indirectly bear its pro-rata share of the fees and expenses incurred by the underlying Fidelity Central Funds. These fees and expenses are not included in the Fund's annualized expense ratio used to calculate the expense estimate in the table below.
Hypothetical Example for Comparison Purposes
The second line of the accompanying table for each class of the Fund provides information about hypothetical account values and hypothetical expenses based on a Class' actual expense ratio and an assumed rate of return of 5% per year before expenses, which is not the Class' actual return. The hypothetical account values and expenses may not be used to estimate the actual ending account balance or expenses you paid for the period. You may use this information to compare the ongoing costs of investing in the Fund and other funds. To do so, compare this 5% hypothetical example with the 5% hypothetical examples that appear in the shareholder reports of the other funds. A small balance maintenance fee of $12.00 that is charged once a year may apply for certain accounts with a value of less than $2,000. This fee is not included in the table below. If it was, the estimate of expenses you paid during the period would be higher, and your ending account value lower, by this amount. In addition, the Fund, as a shareholder in the underlying Fidelity Central Funds, will indirectly bear its pro-rata share of the fees and expenses incurred by the underlying Fidelity Central Funds. These fees and expenses are not included in the Fund's annualized expense ratio used to calculate the expense estimate in the table below.
Please note that the expenses shown in the table are meant to highlight your ongoing costs only and do not reflect any transaction costs. Therefore, the second line of the table is useful in comparing ongoing costs only, and will not help you determine the relative total costs of owning different funds. In addition, if these transactional costs were included, your costs would have been higher.
Annual Report
| Annualized
Expense Ratio B | Beginning
Account Value
February 1, 2015 | Ending
Account Value
July 31, 2015 | Expenses Paid
During Period*
February 1, 2015
to July 31, 2015 |
Class A | 1.26% | | | |
Actual | | $ 1,000.00 | $ 1,165.60 | $ 6.77 |
Hypothetical A | | $ 1,000.00 | $ 1,018.55 | $ 6.31 |
Class T | 1.54% | | | |
Actual | | $ 1,000.00 | $ 1,164.10 | $ 8.26 |
HypotheticalA | | $ 1,000.00 | $ 1,017.16 | $ 7.70 |
Class B | 2.09% | | | |
Actual | | $ 1,000.00 | $ 1,161.50 | $ 11.20 |
Hypothetical A | | $ 1,000.00 | $ 1,014.43 | $ 10.44 |
Class C | 2.05% | | | |
Actual | | $ 1,000.00 | $ 1,161.60 | $ 10.99 |
Hypothetical A | | $ 1,000.00 | $ 1,014.63 | $ 10.24 |
Small Cap Growth | .97% | | | |
Actual | | $ 1,000.00 | $ 1,168.00 | $ 5.21 |
HypotheticalA | | $ 1,000.00 | $ 1,019.98 | $ 4.86 |
Class I | .97% | | | |
Actual | | $ 1,000.00 | $ 1,167.70 | $ 5.21 |
HypotheticalA | | $ 1,000.00 | $ 1,019.98 | $ 4.86 |
A 5% return per year before expenses
B Annualized expense ratio reflects expenses net of applicable fee waivers.
* Expenses are equal to each Class' annualized expense ratio, multiplied by the average account value over the period, multiplied by 181/365 (to reflect the one-half year period).
Annual Report
Investment Changes (Unaudited)
Top Ten Stocks as of July 31, 2015 |
| % of fund's
net assets | % of fund's net assets
6 months ago |
2U, Inc. | 2.4 | 1.3 |
Global Payments, Inc. | 1.4 | 1.8 |
Huron Consulting Group, Inc. | 1.4 | 1.7 |
G-III Apparel Group Ltd. | 1.3 | 1.6 |
Vail Resorts, Inc. | 1.2 | 1.4 |
Gartner, Inc. Class A | 1.2 | 1.6 |
Mentor Graphics Corp. | 1.2 | 0.0 |
Starz Series A | 1.2 | 0.0 |
Deluxe Corp. | 1.2 | 0.0 |
Universal Electronics | 1.1 | 1.2 |
| 13.6 | |
Top Five Market Sectors as of July 31, 2015 |
| % of fund's
net assets | % of fund's net assets
6 months ago |
Health Care | 29.2 | 26.3 |
Information Technology | 24.4 | 26.3 |
Consumer Discretionary | 17.3 | 17.5 |
Industrials | 14.5 | 14.0 |
Financials | 5.3 | 7.3 |
Asset Allocation (% of fund's net assets) |
As of July 31, 2015* | As of January 31, 2015** |
 | Stocks 96.0% | |  | Stocks 97.5% | |
 | Other Investments 1.9% | |  | Other Investments 1.2% | |
 | Short-Term
Investments and
Net Other Assets (Liabilities) 2.1% | |  | Short-Term
Investments and
Net Other Assets (Liabilities) 1.3% | |
* Foreign investments | 3.6% | | ** Foreign investments | 3.1% | |

Annual Report
Investments July 31, 2015
Showing Percentage of Net Assets
Common Stocks - 96.0% |
| Shares | | Value |
CONSUMER DISCRETIONARY - 17.3% |
Auto Components - 0.7% |
Tenneco, Inc. (a) | 145,400 | | $ 7,242,374 |
Visteon Corp. (a) | 54,100 | | 5,384,573 |
| | 12,626,947 |
Diversified Consumer Services - 3.2% |
2U, Inc. (a)(d) | 1,274,330 | | 40,893,251 |
Service Corp. International | 429,100 | | 13,091,841 |
| | 53,985,092 |
Hotels, Restaurants & Leisure - 3.1% |
Churchill Downs, Inc. | 22,055 | | 2,978,748 |
DineEquity, Inc. | 110,000 | | 11,441,100 |
Domino's Pizza, Inc. | 80,000 | | 9,107,200 |
Vail Resorts, Inc. | 190,800 | | 20,928,852 |
Wingstop, Inc. (d) | 230,800 | | 7,911,824 |
| | 52,367,724 |
Household Durables - 2.3% |
Libbey, Inc. | 124,998 | | 4,651,176 |
Tempur Sealy International, Inc. (a) | 210,000 | | 15,865,500 |
Universal Electronics, Inc. (a) | 364,209 | | 18,880,595 |
| | 39,397,271 |
Internet & Catalog Retail - 0.4% |
HSN, Inc. | 85,615 | | 6,293,559 |
Leisure Products - 0.7% |
Malibu Boats, Inc. Class A (a) | 369,100 | | 7,127,321 |
Vista Outdoor, Inc. (a) | 90,000 | | 4,245,300 |
| | 11,372,621 |
Media - 4.7% |
AMC Networks, Inc. Class A (a) | 175,019 | | 14,740,100 |
Crown Media Holdings, Inc. Class A (a) | 7,275 | | 32,519 |
Gray Television, Inc. (a) | 250,000 | | 4,222,500 |
IMAX Corp. (a) | 310,000 | | 11,597,100 |
Live Nation Entertainment, Inc. (a) | 455,200 | | 11,935,344 |
Nexstar Broadcasting Group, Inc. Class A | 280,000 | | 16,060,800 |
Starz Series A (a) | 493,945 | | 19,980,075 |
| | 78,568,438 |
Specialty Retail - 0.5% |
Asbury Automotive Group, Inc. (a) | 90,000 | | 7,947,000 |
Common Stocks - continued |
| Shares | | Value |
CONSUMER DISCRETIONARY - continued |
Textiles, Apparel & Luxury Goods - 1.7% |
G-III Apparel Group Ltd. (a) | 301,800 | | $ 21,799,014 |
Unifi, Inc. (a) | 200,000 | | 6,172,000 |
| | 27,971,014 |
TOTAL CONSUMER DISCRETIONARY | | 290,529,666 |
CONSUMER STAPLES - 1.5% |
Food Products - 0.9% |
Pinnacle Foods, Inc. | 330,000 | | 14,833,500 |
Household Products - 0.6% |
Spectrum Brands Holdings, Inc. | 95,000 | | 10,065,250 |
TOTAL CONSUMER STAPLES | | 24,898,750 |
ENERGY - 0.8% |
Energy Equipment & Services - 0.5% |
Dril-Quip, Inc. (a) | 83,900 | | 4,900,599 |
Superior Drilling Products, Inc. (a)(e) | 1,168,655 | | 1,928,281 |
Xtreme Drilling & Coil Services Corp. (a) | 1,289,000 | | 2,552,670 |
| | 9,381,550 |
Oil, Gas & Consumable Fuels - 0.3% |
StealthGas, Inc. (a) | 890,400 | | 5,012,952 |
TOTAL ENERGY | | 14,394,502 |
FINANCIALS - 5.3% |
Banks - 1.7% |
Investors Bancorp, Inc. | 1,000,000 | | 12,180,000 |
Pacific Premier Bancorp, Inc. (a) | 899,977 | | 17,108,563 |
| | 29,288,563 |
Capital Markets - 0.4% |
E*TRADE Financial Corp. (a) | 250,200 | | 7,110,684 |
Consumer Finance - 0.5% |
PRA Group, Inc. (a)(d) | 120,493 | | 7,657,330 |
Insurance - 1.3% |
AmTrust Financial Services, Inc. | 100,000 | | 6,951,000 |
First American Financial Corp. | 370,000 | | 15,014,600 |
| | 21,965,600 |
Common Stocks - continued |
| Shares | | Value |
FINANCIALS - continued |
Real Estate Investment Trusts - 0.5% |
Colony Financial, Inc. | 380,000 | | $ 8,633,600 |
Thrifts & Mortgage Finance - 0.9% |
Meridian Bancorp, Inc. (a) | 1,094,070 | | 14,266,673 |
TOTAL FINANCIALS | | 88,922,450 |
HEALTH CARE - 29.2% |
Biotechnology - 11.8% |
Alder Biopharmaceuticals, Inc. (a) | 100,000 | | 4,642,000 |
Amicus Therapeutics, Inc. (a) | 520,000 | | 8,938,800 |
Anacor Pharmaceuticals, Inc. (a) | 105,000 | | 15,664,950 |
BioCryst Pharmaceuticals, Inc. (a) | 250,000 | | 3,870,000 |
Cara Therapeutics, Inc. (a) | 102,517 | | 2,184,637 |
Celldex Therapeutics, Inc. (a)(d) | 293,400 | | 6,909,570 |
Cellectis SA sponsored ADR | 104,100 | | 3,696,591 |
Cepheid, Inc. (a) | 56,938 | | 3,165,183 |
Chimerix, Inc. (a) | 210,100 | | 11,290,774 |
Clovis Oncology, Inc. (a) | 80,000 | | 6,754,400 |
Coherus BioSciences, Inc. | 48,424 | | 1,698,714 |
Curis, Inc. (a) | 1,007,700 | | 3,164,178 |
DBV Technologies SA sponsored ADR (a) | 129,022 | | 5,624,069 |
Dyax Corp. (a) | 440,400 | | 10,838,244 |
Dynavax Technologies Corp. (a) | 160,000 | | 4,705,600 |
Halozyme Therapeutics, Inc. (a) | 285,137 | | 6,655,098 |
Heron Therapeutics, Inc. (a) | 175,000 | | 5,659,500 |
Insmed, Inc. (a) | 223,400 | | 6,054,140 |
Intercept Pharmaceuticals, Inc. (a) | 31,600 | | 8,336,396 |
La Jolla Pharmaceutical Co. (a)(d) | 152,622 | | 4,639,709 |
Lion Biotechnologies, Inc. (a)(d) | 410,000 | | 3,509,600 |
Mirati Therapeutics, Inc. (a) | 169,700 | | 4,855,117 |
Novavax, Inc. (a) | 1,239,903 | | 14,953,230 |
Otonomy, Inc. | 135,500 | | 3,491,835 |
Portola Pharmaceuticals, Inc. (a) | 140,000 | | 6,921,600 |
ProNai Therapeutics, Inc. | 7,331 | | 200,869 |
Receptos, Inc. (a) | 50,100 | | 11,415,786 |
Repligen Corp. (a) | 148,489 | | 5,198,600 |
TESARO, Inc. (a) | 110,000 | | 6,380,000 |
Threshold Pharmaceuticals, Inc. (a)(d) | 669,900 | | 2,893,968 |
Ultragenyx Pharmaceutical, Inc. (a) | 110,000 | | 13,302,300 |
XOMA Corp. (a)(d) | 570,634 | | 416,905 |
| | 198,032,363 |
Common Stocks - continued |
| Shares | | Value |
HEALTH CARE - continued |
Health Care Equipment & Supplies - 7.2% |
Align Technology, Inc. (a) | 100,000 | | $ 6,270,000 |
Atricure, Inc. (a) | 310,000 | | 8,614,900 |
CONMED Corp. | 150,000 | | 8,508,000 |
Cyberonics, Inc. (a) | 151,122 | | 9,278,891 |
Entellus Medical, Inc. | 124,976 | | 2,811,960 |
Globus Medical, Inc. (a) | 250,000 | | 7,015,000 |
Hologic, Inc. (a) | 245,000 | | 10,206,700 |
ICU Medical, Inc. (a) | 100,008 | | 9,992,799 |
Inogen, Inc. (a) | 160,000 | | 7,113,600 |
LDR Holding Corp. (a) | 133,755 | | 6,080,502 |
Nevro Corp. | 216,200 | | 10,976,474 |
NxStage Medical, Inc. (a) | 650,300 | | 9,286,284 |
Teleflex, Inc. | 75,000 | | 10,049,250 |
Wright Medical Group, Inc. (a) | 575,000 | | 14,858,000 |
| | 121,062,360 |
Health Care Providers & Services - 6.9% |
Aceto Corp. | 300,000 | | 7,029,000 |
AMN Healthcare Services, Inc. (a) | 410,300 | | 12,075,129 |
BioTelemetry, Inc. (a) | 192,018 | | 2,348,380 |
Civitas Solutions, Inc. | 303,757 | | 6,831,495 |
HealthEquity, Inc. (a) | 200,000 | | 6,732,000 |
HealthSouth Corp. | 380,000 | | 17,366,000 |
LHC Group, Inc. (a) | 150,000 | | 6,043,500 |
Molina Healthcare, Inc. (a) | 125,000 | | 9,428,750 |
Surgical Care Affiliates, Inc. (a) | 410,000 | | 15,588,200 |
Team Health Holdings, Inc. (a) | 244,200 | | 16,461,522 |
Teladoc, Inc. (a) | 145,000 | | 4,577,650 |
VCA, Inc. (a) | 190,000 | | 11,690,700 |
| | 116,172,326 |
Health Care Technology - 1.4% |
athenahealth, Inc. (a)(d) | 110,557 | | 15,473,558 |
Omnicell, Inc. (a) | 60,478 | | 2,208,657 |
Press Ganey Holdings, Inc. | 177,059 | | 5,543,717 |
| | 23,225,932 |
Life Sciences Tools & Services - 0.7% |
Bruker Corp. (a) | 521,500 | | 10,977,575 |
Fluidigm Corp. (a) | 90,000 | | 1,802,700 |
| | 12,780,275 |
Common Stocks - continued |
| Shares | | Value |
HEALTH CARE - continued |
Pharmaceuticals - 1.2% |
Aratana Therapeutics, Inc. (a) | 360,000 | | $ 6,343,200 |
Cardiome Pharma Corp. (a) | 248,819 | | 2,256,788 |
Ocular Therapeutix, Inc. | 132,500 | | 3,059,425 |
Prestige Brands Holdings, Inc. (a) | 100,000 | | 4,762,000 |
SCYNEXIS, Inc. (a) | 400,000 | | 3,180,000 |
| | 19,601,413 |
TOTAL HEALTH CARE | | 490,874,669 |
INDUSTRIALS - 14.5% |
Aerospace & Defense - 1.7% |
Aerojet Rocketdyne Holdings, Inc. (a) | 367,491 | | 8,602,964 |
Huntington Ingalls Industries, Inc. | 65,000 | | 7,631,650 |
Teledyne Technologies, Inc. (a) | 123,000 | | 12,751,410 |
| | 28,986,024 |
Building Products - 1.2% |
A.O. Smith Corp. | 130,000 | | 9,336,600 |
Universal Forest Products, Inc. | 170,000 | | 10,795,000 |
| | 20,131,600 |
Commercial Services & Supplies - 4.6% |
Deluxe Corp. | 310,000 | | 19,973,300 |
KAR Auction Services, Inc. | 300,000 | | 11,679,000 |
Knoll, Inc. | 687,500 | | 16,637,500 |
Matthews International Corp. Class A | 160,018 | | 8,616,969 |
Multi-Color Corp. | 161,900 | | 10,338,934 |
West Corp. | 365,000 | | 10,530,250 |
| | 77,775,953 |
Electrical Equipment - 1.3% |
AZZ, Inc. | 175,000 | | 9,056,250 |
Babcock & Wilcox Enterprises, Inc. (a) | 9,500 | | 187,340 |
BWX Technologies, Inc. | 531,000 | | 13,041,360 |
| | 22,284,950 |
Machinery - 1.1% |
Hillenbrand, Inc. | 260,000 | | 7,373,600 |
Mueller Industries, Inc. | 343,400 | | 11,115,858 |
| | 18,489,458 |
Professional Services - 4.0% |
Advisory Board Co. (a) | 150,000 | | 8,985,000 |
CBIZ, Inc. (a) | 1,316,100 | | 12,897,780 |
Common Stocks - continued |
| Shares | | Value |
INDUSTRIALS - continued |
Professional Services - continued |
Exponent, Inc. | 255,000 | | $ 11,344,950 |
GP Strategies Corp. (a) | 350,557 | | 10,057,480 |
Huron Consulting Group, Inc. (a) | 301,200 | | 23,032,764 |
| | 66,317,974 |
Road & Rail - 0.6% |
Swift Transporation Co. (a) | 400,000 | | 9,528,000 |
TOTAL INDUSTRIALS | | 243,513,959 |
INFORMATION TECHNOLOGY - 24.4% |
Communications Equipment - 1.2% |
CommScope Holding Co., Inc. (a) | 340,000 | | 10,665,800 |
Infinera Corp. (a) | 358,377 | | 8,579,545 |
| | 19,245,345 |
Electronic Equipment & Components - 1.3% |
IPG Photonics Corp. (a)(d) | 47,300 | | 4,362,006 |
Jabil Circuit, Inc. | 150,000 | | 3,037,500 |
RealD, Inc. (a) | 1,092,300 | | 13,708,365 |
| | 21,107,871 |
Internet Software & Services - 3.2% |
comScore, Inc. (a) | 130,551 | | 7,637,234 |
Cvent, Inc. (a)(d) | 426,960 | | 11,493,763 |
Demandware, Inc. (a) | 120,000 | | 9,067,200 |
Gogo, Inc. (a)(d) | 350,488 | | 6,389,396 |
Q2 Holdings, Inc. (a) | 200,000 | | 5,438,000 |
Stamps.com, Inc. (a) | 208,711 | | 14,317,575 |
| | 54,343,168 |
IT Services - 6.8% |
Broadridge Financial Solutions, Inc. | 160,100 | | 8,688,627 |
CACI International, Inc. Class A (a) | 80,000 | | 6,570,400 |
Euronet Worldwide, Inc. (a) | 160,000 | | 10,960,000 |
Gartner, Inc. Class A (a) | 232,130 | | 20,559,754 |
Genpact Ltd. (a) | 430,000 | | 9,550,300 |
Global Payments, Inc. | 210,500 | | 23,594,945 |
Mattersight Corp. (a)(e) | 1,854,975 | | 12,150,086 |
Maximus, Inc. | 220,000 | | 15,006,200 |
Virtusa Corp. (a) | 150,000 | | 7,191,000 |
| | 114,271,312 |
Common Stocks - continued |
| Shares | | Value |
INFORMATION TECHNOLOGY - continued |
Semiconductors & Semiconductor Equipment - 2.0% |
Cavium, Inc. (a) | 58,210 | | $ 3,946,638 |
Cirrus Logic, Inc. (a) | 450,000 | | 14,854,500 |
MKS Instruments, Inc. | 123,264 | | 4,375,872 |
Monolithic Power Systems, Inc. | 190,000 | | 9,824,900 |
| | 33,001,910 |
Software - 9.5% |
AVG Technologies NV (a) | 280,000 | | 8,047,200 |
Blackbaud, Inc. | 260,000 | | 15,901,600 |
Cadence Design Systems, Inc. (a)(d) | 796,200 | | 16,696,314 |
Digimarc Corp. (a)(d) | 36,300 | | 1,442,562 |
Ebix, Inc. (d) | 124,017 | | 3,843,287 |
Fleetmatics Group PLC (a) | 195,000 | | 9,334,650 |
HubSpot, Inc. | 210,500 | | 11,356,475 |
Imperva, Inc. (a) | 100,000 | | 6,570,000 |
Manhattan Associates, Inc. (a) | 183,400 | | 11,887,988 |
Mentor Graphics Corp. | 780,000 | | 20,350,200 |
Paylocity Holding Corp. (a)(d) | 170,000 | | 6,106,400 |
Progress Software Corp. (a) | 483,700 | | 14,356,216 |
Qlik Technologies, Inc. (a) | 460,000 | | 18,611,600 |
Verint Systems, Inc. (a) | 255,200 | | 14,857,744 |
| | 159,362,236 |
Technology Hardware, Storage & Peripherals - 0.4% |
Nimble Storage, Inc. (a)(d) | 265,937 | | 7,345,180 |
TOTAL INFORMATION TECHNOLOGY | | 408,677,022 |
MATERIALS - 2.1% |
Chemicals - 0.5% |
Cytec Industries, Inc. | 110,000 | | 8,165,300 |
Containers & Packaging - 1.4% |
Avery Dennison Corp. | 100,000 | | 6,085,000 |
Graphic Packaging Holding Co. | 1,200,200 | | 18,123,020 |
| | 24,208,020 |
Paper & Forest Products - 0.2% |
TFS Corp. Ltd. (d) | 2,400,000 | | 2,578,792 |
TOTAL MATERIALS | | 34,952,112 |
Common Stocks - continued |
| Shares | | Value |
TELECOMMUNICATION SERVICES - 0.9% |
Diversified Telecommunication Services - 0.9% |
inContact, Inc. (a) | 1,214,000 | | $ 11,265,920 |
Vonage Holdings Corp. (a) | 505,436 | | 3,229,736 |
| | 14,495,656 |
TOTAL COMMON STOCKS (Cost $1,363,452,109) |
1,611,258,786
|
Money Market Funds - 8.2% |
| | | |
Fidelity Cash Central Fund, 0.17% (b) | 64,469,445 | | 64,469,445 |
Fidelity Securities Lending Cash Central Fund, 0.18% (b)(c) | 72,538,290 | | 72,538,290 |
TOTAL MONEY MARKET FUNDS (Cost $137,007,735) |
137,007,735
|
Equity Funds - 1.9% |
| | | |
Small Growth Funds - 1.9% |
iShares Russell 2000 Growth Index ETF (d)
(Cost $31,405,658) | 200,000 | |
30,990,000
|
TOTAL INVESTMENT PORTFOLIO - 106.1% (Cost $1,531,865,502) | | 1,779,256,521 |
NET OTHER ASSETS (LIABILITIES) - (6.1)% | | (101,610,380) |
NET ASSETS - 100% | $ 1,677,646,141 |
Security Type Abbreviations |
ETF | - | Exchange Traded Fund |
Legend |
(a) Non-income producing |
(b) Affiliated fund that is generally available only to investment companies and other accounts managed by Fidelity Investments. The rate quoted is the annualized seven-day yield of the fund at period end. A complete unaudited listing of the fund's holdings as of its most recent quarter end is available upon request. In addition, each Fidelity Central Fund's financial statements, which are not covered by the Fund's Report of Independent Registered Public Accounting Firm, are available on the SEC's website or upon request. |
(c) Investment made with cash collateral received from securities on loan. |
(d) Security or a portion of the security is on loan at period end. |
(e) Affiliated company |
Affiliated Central Funds |
Information regarding fiscal year to date income earned by the Fund from investments in Fidelity Central Funds is as follows: |
Fund | Income earned |
Fidelity Cash Central Fund | $ 43,708 |
Fidelity Securities Lending Cash Central Fund | 664,654 |
Total | $ 708,362 |
Other Affiliated Issuers |
An affiliated company is a company in which the Fund has ownership of at least 5% of the voting securities. Fiscal year to date transactions with companies which are or were affiliates are as follows: |
Affiliate | Value, beginning of period | Purchases | Sales Proceeds | Dividend Income | Value,
end of
period |
Mattersight Corp. | $ - | $ 11,000,002 | $ - | $ - | $ 12,150,086 |
Superior Drilling Products, Inc. | 8,049,395 | 212,441 | 408,453 | - | 1,928,281 |
Total | $ 8,049,395 | $ 11,212,443 | $ 408,453 | $ - | $ 14,078,367 |
Other Information |
All investments are categorized as Level 1 under the Fair Value Hierarchy. The inputs or methodology used for valuing securities may not be an indication of the risk associated with investing in those securities. For more information on valuation inputs, please refer to the Investment Valuation section in the accompanying Notes to Financial Statements. |
See accompanying notes which are an integral part of the financial statements.
Annual Report
Statement of Assets and Liabilities
| | July 31, 2015 |
| | |
Assets | | |
Investment in securities, at value (including securities loaned of $71,636,998) - See accompanying schedule: Unaffiliated issuers (cost $1,379,096,390) | $ 1,628,170,419 | |
Fidelity Central Funds (cost $137,007,735) | 137,007,735 | |
Other affiliated issuers (cost $15,761,377) | 14,078,367 | |
Total Investments (cost $1,531,865,502) | | $ 1,779,256,521 |
Cash | | 786,138 |
Receivable for investments sold | | 19,073,092 |
Receivable for fund shares sold | | 8,384,535 |
Dividends receivable | | 87,629 |
Distributions receivable from Fidelity Central Funds | | 55,876 |
Other receivables | | 54,301 |
Total assets | | 1,807,698,092 |
| | |
Liabilities | | |
Payable for investments purchased | $ 55,000,596 | |
Payable for fund shares redeemed | 1,049,146 | |
Accrued management fee | 1,014,913 | |
Distribution and service plan fees payable | 91,566 | |
Other affiliated payables | 296,642 | |
Other payables and accrued expenses | 60,798 | |
Collateral on securities loaned, at value | 72,538,290 | |
Total liabilities | | 130,051,951 |
| | |
Net Assets | | $ 1,677,646,141 |
Net Assets consist of: | | |
Paid in capital | | $ 1,364,084,364 |
Accumulated undistributed net realized gain (loss) on investments and foreign currency transactions | | 66,183,697 |
Net unrealized appreciation (depreciation) on investments and assets and liabilities in foreign currencies | | 247,378,080 |
Net Assets | | $ 1,677,646,141 |
See accompanying notes which are an integral part of the financial statements.
Annual Report
Financial Statements - continued
Statement of Assets and Liabilities - continued
| | July 31, 2015 |
| | |
Calculation of Maximum Offering Price | | |
Class A:
Net Asset Value and redemption price per share ($123,369,546 ÷ 6,002,419 shares) | | $ 20.55 |
| | |
Maximum offering price per share (100/94.25 of $20.55) | | $ 21.80 |
Class T:
Net Asset Value and redemption price per share ($52,667,039 ÷ 2,622,233 shares) | | $ 20.08 |
| | |
Maximum offering price per share (100/96.50 of $20.08) | | $ 20.81 |
Class B:
Net Asset Value and offering price per share ($2,357,028 ÷ 124,107 shares) | | $ 18.99 |
| | |
Class C:
Net Asset Value and offering price per share ($55,671,491 ÷ 2,946,209 shares) | | $ 18.90 |
| | |
Small Cap Growth:
Net Asset Value, offering price and redemption price per share ($1,345,684,071 ÷ 63,486,022 shares) | | $ 21.20 |
| | |
Class I:
Net Asset Value, offering price and redemption price per share ($97,896,966 ÷ 4,609,963 shares) | | $ 21.24 |
A Redemption price per share is equal to net asset value less any applicable contingent deferred sales charge.
See accompanying notes which are an integral part of the financial statements.
Annual Report
Statement of Operations
| Year ended July 31, 2015 |
| | |
Investment Income | | |
Dividends | | $ 5,957,242 |
Income from Fidelity Central Funds (including $664,654 from security lending) | | 708,362 |
Total income | | 6,665,604 |
| | |
Expenses | | |
Management fee | | |
Basic fee | $ 8,851,814 | |
Performance adjustment | (551,250) | |
Transfer agent fees | 2,715,918 | |
Distribution and service plan fees | 913,847 | |
Accounting and security lending fees | 423,000 | |
Custodian fees and expenses | 46,646 | |
Independent trustees' compensation | 5,261 | |
Registration fees | 139,484 | |
Audit | 62,075 | |
Legal | 3,043 | |
Interest | 4,117 | |
Miscellaneous | 9,013 | |
Total expenses before reductions | 12,622,968 | |
Expense reductions | (173,323) | 12,449,645 |
Net investment income (loss) | | (5,784,041) |
Realized and Unrealized Gain (Loss) Net realized gain (loss) on: | | |
Investment securities: | | |
Unaffiliated issuers | 109,364,383 | |
Other affiliated issuers | (615,913) | |
Foreign currency transactions | 6,149 | |
Total net realized gain (loss) | | 108,754,619 |
Change in net unrealized appreciation (depreciation) on: Investment securities | 166,441,450 | |
Assets and liabilities in foreign currencies | (9,237) | |
Total change in net unrealized appreciation (depreciation) | | 166,432,213 |
Net gain (loss) | | 275,186,832 |
Net increase (decrease) in net assets resulting from operations | | $ 269,402,791 |
See accompanying notes which are an integral part of the financial statements.
Annual Report
Financial Statements - continued
Statement of Changes in Net Assets
| Year ended
July 31,
2015 | Year ended
July 31,
2014 |
Increase (Decrease) in Net Assets | | |
Operations | | |
Net investment income (loss) | $ (5,784,041) | $ (5,539,870) |
Net realized gain (loss) | 108,754,619 | 529,975,803 |
Change in net unrealized appreciation (depreciation) | 166,432,213 | (344,219,184) |
Net increase (decrease) in net assets resulting from operations | 269,402,791 | 180,216,749 |
Distributions to shareholders from net realized gain | (103,188,484) | (306,246,236) |
Share transactions - net increase (decrease) | 214,155,809 | (817,676,738) |
Redemption fees | 177,411 | 398,744 |
Total increase (decrease) in net assets | 380,547,527 | (943,307,481) |
| | |
Net Assets | | |
Beginning of period | 1,297,098,614 | 2,240,406,095 |
End of period (including accumulated net investment loss of $0 and accumulated net investment loss of $4,082,221, respectively) | $ 1,677,646,141 | $ 1,297,098,614 |
See accompanying notes which are an integral part of the financial statements.
Annual Report
Financial Highlights - Class A
Years ended July 31, | 2015 | 2014 | 2013 | 2012 | 2011 |
Selected Per-Share Data | | | | | |
Net asset value, beginning of period | $ 17.99 | $ 19.66 | $ 15.87 | $ 16.42 | $ 12.66 |
Income from Investment Operations | | | | | |
Net investment income (loss) C | (.13) | (.12) | (.04) | (.07) F | (.07) G |
Net realized and unrealized gain (loss) | 4.23 | 1.69 | 4.87 | (.16) | 3.84 |
Total from investment operations | 4.10 | 1.57 | 4.83 | (.23) | 3.77 |
Distributions from net realized gain | (1.54) | (3.24) | (1.04) | (.32) | (.01) K |
Redemption fees added to paid in capital C, I | - | - | - | - | - |
Net asset value, end of period | $ 20.55 | $ 17.99 | $ 19.66 | $ 15.87 | $ 16.42 |
Total ReturnA, B | 24.46% | 8.58% | 32.20% | (1.14)% | 29.78% |
Ratios to Average Net Assets D, H | | | | | |
Expenses before reductions | 1.21% | 1.22% | 1.24% | 1.35% | 1.25% |
Expenses net of fee waivers, if any | 1.21% | 1.22% | 1.24% | 1.35% | 1.25% |
Expenses net of all reductions | 1.20% | 1.22% | 1.22% | 1.34% | 1.23% |
Net investment income (loss) | (.67)% | (.62)% | (.26)% | (.49)%F | (.47)%G |
Supplemental Data | | | | | |
Net assets, end of period (000 omitted) | $ 123,370 | $ 88,822 | $ 74,978 | $ 59,684 | $ 67,272 |
Portfolio turnover rate E | 156% | 148% J | 142% | 150% | 106% |
A Total returns would have been lower if certain expenses had not been reduced during the applicable periods shown.
B Total returns do not include the effect of the sales charges.
C Calculated based on average shares outstanding during the period.
D Fees and expenses of any underlying Fidelity Central Funds are not included in the Fund's expense ratio. The Fund indirectly bears its proportionate share of the expenses of any underlying Fidelity Central Funds.
E Amount does not include the portfolio activity of any underlying Fidelity Central Funds.
F Investment income per share reflects a large, non-recurring dividend which amounted to $.01 per share. Excluding this non-recurring dividend, the ratio of net investment income (loss) to average net assets would have been (.57)%.
G Investment income per share reflects a large, non-recurring dividend which amounted to $.02 per share. Excluding this non-recurring dividend, the ratio of net investment income (loss) to average net assets would have been (.61)%.
H Expense ratios reflect operating expenses of the class. Expenses before reductions do not reflect amounts reimbursed by the investment adviser or reductions from brokerage service arrangements or reductions from other expense offset arrangements and do not represent the amount paid by the class during periods when reimbursements or reductions occur. Expenses net of fee waivers reflect expenses after reimbursement by the investment adviser but prior to reductions from brokerage service arrangements or other expense offset arrangements. Expenses net of all reductions represent the net expenses paid by the class.
I Amount represents less than $.01 per share.
J Portfolio turnover rate excludes securities received or delivered in-kind.
K The amounts shown reflect certain reclassifications related to book to tax differences that were made in the year shown.
See accompanying notes which are an integral part of the financial statements.
Annual Report
Financial Highlights - Class T
Years ended July 31, | 2015 | 2014 | 2013 | 2012 | 2011 |
Selected Per-Share Data | | | | | |
Net asset value, beginning of period | $ 17.66 | $ 19.38 | $ 15.68 | $ 16.27 | $ 12.57 |
Income from Investment Operations | | | | | |
Net investment income (loss) C | (.17) | (.16) | (.09) | (.11) F | (.11) G |
Net realized and unrealized gain (loss) | 4.13 | 1.66 | 4.82 | (.16) | 3.81 |
Total from investment operations | 3.96 | 1.50 | 4.73 | (.27) | 3.70 |
Distributions from net realized gain | (1.54) | (3.22) | (1.03) | (.32) | - |
Redemption fees added to paid in capital C, I | - | - | - | - | - |
Net asset value, end of period | $ 20.08 | $ 17.66 | $ 19.38 | $ 15.68 | $ 16.27 |
Total ReturnA, B | 24.10% | 8.30% | 31.87% | (1.41)% | 29.44% |
Ratios to Average Net Assets D, H | | | | | |
Expenses before reductions | 1.49% | 1.50% | 1.49% | 1.61% | 1.50% |
Expenses net of fee waivers, if any | 1.48% | 1.50% | 1.49% | 1.61% | 1.50% |
Expenses net of all reductions | 1.47% | 1.49% | 1.48% | 1.60% | 1.49% |
Net investment income (loss) | (.95)% | (.90)% | (.52)% | (.74)%F | (.73)%G |
Supplemental Data | | | | | |
Net assets, end of period (000 omitted) | $ 52,667 | $ 42,586 | $ 34,686 | $ 27,658 | $ 30,764 |
Portfolio turnover rate E | 156% | 148% J | 142% | 150% | 106% |
A Total returns would have been lower if certain expenses had not been reduced during the applicable periods shown.
B Total returns do not include the effect of the sales charges.
C Calculated based on average shares outstanding during the period.
D Fees and expenses of any underlying Fidelity Central Funds are not included in the Fund's expense ratio. The Fund indirectly bears its proportionate share of the expenses of any underlying Fidelity Central Funds.
E Amount does not include the portfolio activity of any underlying Fidelity Central Funds.
F Investment income per share reflects a large, non-recurring dividend which amounted to $.01 per share. Excluding this non-recurring dividend, the ratio of net investment income (loss) to average net assets would have been (.83)%.
G Investment income per share reflects a large, non-recurring dividend which amounted to $.02 per share. Excluding this non-recurring dividend, the ratio of net investment income (loss) to average net assets would have been (.86)%.
H Expense ratios reflect operating expenses of the class. Expenses before reductions do not reflect amounts reimbursed by the investment adviser or reductions from brokerage service arrangements or reductions from other expense offset arrangements and do not represent the amount paid by the class during periods when reimbursements or reductions occur. Expenses net of fee waivers reflect expenses after reimbursement by the investment adviser but prior to reductions from brokerage service arrangements or other expense offset arrangements. Expenses net of all reductions represent the net expenses paid by the class.
I Amount represents less than $.01 per share.
J Portfolio turnover rate excludes securities received or delivered in-kind.
See accompanying notes which are an integral part of the financial statements.
Annual Report
Financial Highlights - Class B
Years ended July 31, | 2015 | 2014 | 2013 | 2012 | 2011 |
Selected Per-Share Data | | | | | |
Net asset value, beginning of period | $ 16.86 | $ 18.65 | $ 15.19 | $ 15.86 | $ 12.30 |
Income from Investment Operations | | | | | |
Net investment income (loss) C | (.25) | (.25) | (.16) | (.18) F | (.18) G |
Net realized and unrealized gain (loss) | 3.92 | 1.60 | 4.64 | (.17) | 3.74 |
Total from investment operations | 3.67 | 1.35 | 4.48 | (.35) | 3.56 |
Distributions from net realized gain | (1.54) | (3.14) | (1.02) | (.32) | - |
Redemption fees added to paid in capital C, I | - | - | - | - | - |
Net asset value, end of period | $ 18.99 | $ 16.86 | $ 18.65 | $ 15.19 | $ 15.86 |
Total ReturnA, B | 23.48% | 7.73% | 31.25% | (1.96)% | 28.94% |
Ratios to Average Net Assets D, H | | | | | |
Expenses before reductions | 2.01% | 2.01% | 1.99% | 2.10% | 2.00% |
Expenses net of fee waivers, if any | 2.01% | 2.01% | 1.99% | 2.10% | 2.00% |
Expenses net of all reductions | 2.00% | 2.01% | 1.97% | 2.09% | 1.98% |
Net investment income (loss) | (1.47)% | (1.41)% | (1.01)% | (1.23)%F | (1.22)%G |
Supplemental Data | | | | | |
Net assets, end of period (000 omitted) | $ 2,357 | $ 2,764 | $ 3,486 | $ 4,123 | $ 5,295 |
Portfolio turnover rate E | 156% | 148% J | 142% | 150% | 106% |
A Total returns would have been lower if certain expenses had not been reduced during the applicable periods shown.
B Total returns do not include the effect of the contingent deferred sales charge.
C Calculated based on average shares outstanding during the period.
D Fees and expenses of any underlying Fidelity Central Funds are not included in the Fund's expense ratio. The Fund indirectly bears its proportionate share of the expenses of any underlying Fidelity Central Funds.
E Amount does not include the portfolio activity of any underlying Fidelity Central Funds.
F Investment income per share reflects a large, non-recurring dividend which amounted to $.01 per share. Excluding this non-recurring dividend, the ratio of net investment income (loss) to average net assets would have been (1.32)%.
G Investment income per share reflects a large, non-recurring dividend which amounted to $.02 per share. Excluding this non-recurring dividend, the ratio of net investment income (loss) to average net assets would have been (1.36)%.
H Expense ratios reflect operating expenses of the class. Expenses before reductions do not reflect amounts reimbursed by the investment adviser or reductions from brokerage service arrangements or reductions from other expense offset arrangements and do not represent the amount paid by the class during periods when reimbursements or reductions occur. Expenses net of fee waivers reflect expenses after reimbursement by the investment adviser but prior to reductions from brokerage service arrangements or other expense offset arrangements. Expenses net of all reductions represent the net expenses paid by the class.
I Amount represents less than $.01 per share.
J Portfolio turnover rate excludes securities received or delivered in-kind.
See accompanying notes which are an integral part of the financial statements.
Annual Report
Financial Highlights - Class C
Years ended July 31, | 2015 | 2014 | 2013 | 2012 | 2011 |
Selected Per-Share Data | | | | | |
Net asset value, beginning of period | $ 16.78 | $ 18.62 | $ 15.16 | $ 15.83 | $ 12.28 |
Income from Investment Operations | | | | | |
Net investment income (loss) C | (.25) | (.25) | (.16) | (.18) F | (.18) G |
Net realized and unrealized gain (loss) | 3.91 | 1.59 | 4.64 | (.17) | 3.73 |
Total from investment operations | 3.66 | 1.34 | 4.48 | (.35) | 3.55 |
Distributions from net realized gain | (1.54) | (3.18) | (1.02) | (.32) | - |
Redemption fees added to paid in capital C, I | - | - | - | - | - |
Net asset value, end of period | $ 18.90 | $ 16.78 | $ 18.62 | $ 15.16 | $ 15.83 |
Total ReturnA, B | 23.53% | 7.70% | 31.32% | (1.96)% | 28.91% |
Ratios to Average Net Assets D, H | | | | | |
Expenses before reductions | 2.00% | 2.01% | 1.99% | 2.10% | 2.00% |
Expenses net of fee waivers, if any | 2.00% | 2.00% | 1.99% | 2.10% | 2.00% |
Expenses net of all reductions | 1.99% | 2.00% | 1.97% | 2.09% | 1.98% |
Net investment income (loss) | (1.46)% | (1.41)% | (1.01)% | (1.24)%F | (1.22)%G |
Supplemental Data | | | | | |
Net assets, end of period (000 omitted) | $ 55,671 | $ 42,215 | $ 32,756 | $ 24,683 | $ 24,914 |
Portfolio turnover rate E | 156% | 148% J | 142% | 150% | 106% |
A Total returns would have been lower if certain expenses had not been reduced during the applicable periods shown.
B Total returns do not include the effect of the contingent deferred sales charge.
C Calculated based on average shares outstanding during the period.
D Fees and expenses of any underlying Fidelity Central Funds are not included in the Fund's expense ratio. The Fund indirectly bears its proportionate share of the expenses of any underlying Fidelity Central Funds.
E Amount does not include the portfolio activity of any underlying Fidelity Central Funds.
F Investment income per share reflects a large, non-recurring dividend which amounted to $.01 per share. Excluding this non-recurring dividend, the ratio of net investment income (loss) to average net assets would have been (1.32)%.
G Investment income per share reflects a large, non-recurring dividend which amounted to $.02 per share. Excluding this non-recurring dividend, the ratio of net investment income (loss) to average net assets would have been (1.36)%.
H Expense ratios reflect operating expenses of the class. Expenses before reductions do not reflect amounts reimbursed by the investment adviser or reductions from brokerage service arrangements or reductions from other expense offset arrangements and do not represent the amount paid by the class during periods when reimbursements or reductions occur. Expenses net of fee waivers reflect expenses after reimbursement by the investment adviser but prior to reductions from brokerage service arrangements or other expense offset arrangements. Expenses net of all reductions represent the net expenses paid by the class.
I Amount represents less than $.01 per share.
J Portfolio turnover rate excludes securities received or delivered in-kind.
See accompanying notes which are an integral part of the financial statements.
Annual Report
Financial Highlights - Small Cap Growth
Years ended July 31, | 2015 | 2014 | 2013 | 2012 | 2011 |
Selected Per-Share Data | | | | | |
Net asset value, beginning of period | $ 18.45 | $ 20.07 | $ 16.14 | $ 16.65 | $ 12.81 |
Income from Investment Operations | | | | | |
Net investment income (loss) B | (.07) | (.06) | .01 | (.03) E | (.03) F |
Net realized and unrealized gain (loss) | 4.36 | 1.71 | 4.98 | (.16) | 3.90 |
Total from investment operations | 4.29 | 1.65 | 4.99 | (.19) | 3.87 |
Distributions from net realized gain | (1.54) | (3.27) | (1.06) | (.32) | (.03) J |
Redemption fees added to paid in capital B, H | - | - | - | - | - |
Net asset value, end of period | $ 21.20 | $ 18.45 | $ 20.07 | $ 16.14 | $ 16.65 |
Total Return A | 24.91% | 8.87% | 32.74% | (.88)% | 30.20% |
Ratios to Average Net Assets C, G | | | | |
Expenses before reductions | .91% | .91% | .90% | 1.03% | .95% |
Expenses net of fee waivers, if any | .91% | .90% | .90% | 1.03% | .95% |
Expenses net of all reductions | .90% | .90% | .88% | 1.02% | .93% |
Net investment income (loss) | (.37)% | (.31)% | .08% | (.16)%E | (.17)%F |
Supplemental Data | | | | | |
Net assets, end of period (000 omitted) | $ 1,345,684 | $ 1,069,105 | $ 1,315,659 | $ 1,166,101 | $ 1,382,688 |
Portfolio turnover rate D | 156% | 148% I | 142% | 150% | 106% |
A Total returns would have been lower if certain expenses had not been reduced during the applicable periods shown.
B Calculated based on average shares outstanding during the period.
C Fees and expenses of any underlying Fidelity Central Funds are not included in the Fund's expense ratio. The Fund indirectly bears its proportionate share of the expenses of any underlying Fidelity Central Funds.
D Amount does not include the portfolio activity of any underlying Fidelity Central Funds.
E Investment income per share reflects a large, non-recurring dividend which amounted to $.01 per share. Excluding this non-recurring dividend, the ratio of net investment income (loss) to average net assets would have been (.25)%.
F Investment income per share reflects a large, non-recurring dividend which amounted to $.02 per share. Excluding this non-recurring dividend, the ratio of net investment income (loss) to average net assets would have been (.31)%.
G Expense ratios reflect operating expenses of the class. Expenses before reductions do not reflect amounts reimbursed by the investment adviser or reductions from brokerage service arrangements or reductions from other expense offset arrangements and do not represent the amount paid by the class during periods when reimbursements or reductions occur. Expenses net of fee waivers reflect expenses after reimbursement by the investment adviser but prior to reductions from brokerage service arrangements or other expense offset arrangements. Expenses net of all reductions represent the net expenses paid by the class.
H Amount represents less than $.01 per share.
I Portfolio turnover rate excludes securities received or delivered in-kind.
J The amounts shown reflect certain reclassifications related to book to tax differences that were made in the year shown.
See accompanying notes which are an integral part of the financial statements.
Annual Report
Financial Highlights - Class I
Years ended July 31, | 2015 | 2014 | 2013 | 2012 | 2011 |
Selected Per-Share Data | | | | | |
Net asset value, beginning of period | $ 18.49 | $ 20.10 | $ 16.17 | $ 16.68 | $ 12.83 |
Income from Investment Operations | | | | | |
Net investment income (loss) B | (.07) | (.06) | .01 | (.03) E | (.03) F |
Net realized and unrealized gain (loss) | 4.36 | 1.72 | 4.98 | (.16) | 3.91 |
Total from investment operations | 4.29 | 1.66 | 4.99 | (.19) | 3.88 |
Distributions from net realized gain | (1.54) | (3.27) | (1.06) | (.32) | (.03) J |
Redemption fees added to paid in capital B, H | - | - | - | - | - |
Net asset value, end of period | $ 21.24 | $ 18.49 | $ 20.10 | $ 16.17 | $ 16.68 |
Total Return A | 24.85% | 8.89% | 32.65% | (.88)% | 30.24% |
Ratios to Average Net Assets C, G | | | | | |
Expenses before reductions | .93% | .92% | .92% | 1.06% | .94% |
Expenses net of fee waivers, if any | .93% | .92% | .92% | 1.06% | .94% |
Expenses net of all reductions | .91% | .92% | .91% | 1.05% | .93% |
Net investment income (loss) | (.39)% | (.32)% | .06% | (.19)%E | (.17)%F |
Supplemental Data | | | | | |
Net assets, end of period (000 omitted) | $ 97,897 | $ 51,607 | $ 51,158 | $ 36,694 | $ 41,440 |
Portfolio turnover rate D | 156% | 148% I | 142% | 150% | 106% |
A Total returns would have been lower if certain expenses had not been reduced during the applicable periods shown.
B Calculated based on average shares outstanding during the period.
C Fees and expenses of any underlying Fidelity Central Funds are not included in the Fund's expense ratio. The Fund indirectly bears its proportionate share of the expenses of any underlying Fidelity Central Funds.
D Amount does not include the portfolio activity of any underlying Fidelity Central Funds.
E Investment income per share reflects a large, non-recurring dividend which amounted to $.01 per share. Excluding this non-recurring dividend, the ratio of net investment income (loss) to average net assets would have been (.28)%.
F Investment income per share reflects a large, non-recurring dividend which amounted to $.02 per share. Excluding this non-recurring dividend, the ratio of net investment income (loss) to average net assets would have been (.30)%.
G Expense ratios reflect operating expenses of the class. Expenses before reductions do not reflect amounts reimbursed by the investment adviser or reductions from brokerage service arrangements or reductions from other expense offset arrangements and do not represent the amount paid by the class during periods when reimbursements or reductions occur. Expenses net of fee waivers reflect expenses after reimbursement by the investment adviser but prior to reductions from brokerage service arrangements or other expense offset arrangements. Expenses net of all reductions represent the net expenses paid by the class.
H Amount represents less than $.01 per share.
I Portfolio turnover rate excludes securities received or delivered in-kind.
J The amounts shown reflect certain reclassifications related to book to tax differences that were made in the year shown.
See accompanying notes which are an integral part of the financial statements.
Annual Report
For the period ended July 31, 2015
1. Organization.
Fidelity Small Cap Growth Fund (the Fund) is a fund of Fidelity Securities Fund (the Trust) and is authorized to issue an unlimited number of shares. The Trust is registered under the Investment Company Act of 1940, as amended (the 1940 Act), as an open-end management investment company organized as a Massachusetts business trust. The Fund offers Class A, Class T, Class C, Small Cap Growth and Class I (formerly Institutional Class) shares, each of which, along with Class B shares, has equal rights as to assets and voting privileges. Class B shares are closed to new accounts and additional purchases, except for exchanges and reinvestments. The Fund offered Class F shares during the period June 26, 2009 through November 15, 2013 and all outstanding shares were redeemed by November 15, 2013. Each class has exclusive voting rights with respect to matters that affect that class. Class B shares will automatically convert to Class A shares after a holding period of seven years from the initial date of purchase.
2. Investments in Fidelity Central Funds.
The Fund invests in Fidelity Central Funds, which are open-end investment companies generally available only to other investment companies and accounts managed by the investment adviser and its affiliates. The Fund's Schedule of Investments lists each of the Fidelity Central Funds held as of period end, if any, as an investment of the Fund, but does not include the underlying holdings of each Fidelity Central Fund. As an Investing Fund, the Fund indirectly bears its proportionate share of the expenses of the underlying Fidelity Central Funds.
The Money Market Central Funds seek preservation of capital and current income and are managed by Fidelity Investments Money Management, Inc. (FIMM), an affiliate of the investment adviser. Annualized expenses of the Money Market Central Funds as of their most recent shareholder report date are less than .01%.
A complete unaudited list of holdings for each Fidelity Central Fund is available upon request or at the Securities and Exchange Commission (the SEC) website at www.sec.gov. In addition, the financial statements of the Fidelity Central Funds, which are not covered by the Fund's Report of Independent Registered Public Accounting Firm, are available on the SEC website or upon request.
3. Significant Accounting Policies.
The financial statements have been prepared in conformity with accounting principles generally accepted in the United States of America (GAAP), which require management to make certain estimates and assumptions at the date of the financial statements. Actual results could differ from those estimates. Subsequent events, if any, through the date that the financial statements were issued have been evaluated in the preparation of
Annual Report
3. Significant Accounting Policies - continued
the financial statements. The following summarizes the significant accounting policies of the Fund:
Investment Valuation. Investments are valued as of 4:00 p.m. Eastern time on the last calendar day of the period. The Board of Trustees (the Board) has delegated the day to day responsibility for the valuation of the Fund's investments to the Fidelity Management & Research Company (FMR) Fair Value Committee (the Committee). In accordance with valuation policies and procedures approved by the Board, the Fund attempts to obtain prices from one or more third party pricing vendors or brokers to value its investments. When current market prices, quotations or currency exchange rates are not readily available or reliable, investments will be fair valued in good faith by the Committee, in accordance with procedures adopted by the Board. Factors used in determining fair value vary by investment type and may include market or investment specific events. The frequency with which these procedures are used cannot be predicted and they may be utilized to a significant extent. The Committee oversees the Fund's valuation policies and procedures and reports to the Board on the Committee's activities and fair value determinations. The Board monitors the appropriateness of the procedures used in valuing the Fund's investments and ratifies the fair value determinations of the Committee.
The Fund categorizes the inputs to valuation techniques used to value its investments into a disclosure hierarchy consisting of three levels as shown below:
Level 1 - quoted prices in active markets for identical investments
Level 2 - other significant observable inputs (including quoted prices for similar investments, interest rates, prepayment speeds, etc.)
Level 3 - unobservable inputs (including the Fund's own assumptions based on the best information available)
Valuation techniques used to value the Fund's investments by major category are as follows:
Equity securities, including restricted securities, for which market quotations are readily available, are valued at the last reported sale price or official closing price as reported by a third party pricing vendor on the primary market or exchange on which they are traded and are categorized as Level 1 in the hierarchy. In the event there were no sales during the day or closing prices are not available, securities are valued at the last quoted bid price or may be valued using the last available price and are generally categorized as Level 2 in the hierarchy. For foreign equity securities, when market or security specific events arise, comparisons to the valuation of American Depositary Receipts (ADRs),
Annual Report
Notes to Financial Statements - continued
3. Significant Accounting Policies - continued
Investment Valuation - continued
futures contracts, Exchange-Traded Funds (ETFs) and certain indexes as well as quoted prices for similar securities may be used and would be categorized as Level 2 in the hierarchy. Utilizing these techniques may result in transfers between Level 1 and Level 2. For equity securities, including restricted securities, where observable inputs are limited, assumptions about market activity and risk are used and these securities may be categorized as Level 3 in the hierarchy.
Exchange-Traded Funds (ETFs) are valued at their last sale price or official closing price as reported by a third party pricing vendor on the primary market or exchange on which they are traded and are categorized as Level 1 in the hierarchy. In the event there were no sales during the day but the exchange reports a closing bid level, ETFs are valued at the closing bid and would be categorized as Level 1 in the hierarchy. In the event there was no closing bid, ETFs may be valued by another method that the Board believes reflects fair value in accordance with the Board's fair value pricing policies and may be categorized as Level 2 in the hierarchy.
Investments in open-end mutual funds, including the Fidelity Central Funds, are valued at their closing net asset value (NAV) each business day and are categorized as Level 1 in the hierarchy.
Changes in valuation techniques may result in transfers in or out of an assigned level within the disclosure hierarchy.
Foreign Currency. The Fund may use foreign currency contracts to facilitate transactions in foreign-denominated securities. Gains and losses from these transactions may arise from changes in the value of the foreign currency or if the counterparties do not perform under the contracts' terms.
Foreign-denominated assets, including investment securities, and liabilities are translated into U.S. dollars at the exchange rates at period end. Purchases and sales of investment securities, income and dividends received and expenses denominated in foreign currencies are translated into U.S. dollars at the exchange rate in effect on the transaction date.
The effects of exchange rate fluctuations on investments are included with the net realized and unrealized gain (loss) on investment securities. Other foreign currency transactions resulting in realized and unrealized gain (loss) are disclosed separately.
Investment Transactions and Income. For financial reporting purposes, the Fund's investment holdings and NAV include trades executed through the end of the last business day of the period. The NAV per share for processing shareholder transactions is calculated as of the close of business of the New York Stock Exchange (NYSE), normally
Annual Report
3. Significant Accounting Policies - continued
Investment Transactions and Income - continued
4:00 p.m. Eastern time and includes trades executed through the end of the prior business day. Gains and losses on securities sold are determined on the basis of identified cost and may include proceeds received from litigation. Dividend income is recorded on the ex-dividend date, except for certain dividends from foreign securities where the ex-dividend date may have passed, which are recorded as soon as the Fund is informed of the ex-dividend date. Non-cash dividends included in dividend income, if any, are recorded at the fair market value of the securities received. Income and capital gain distributions from Fidelity Central Funds, if any, are recorded on the ex-dividend date. Distributions received on securities that represent a return of capital or capital gain are recorded as a reduction of cost of investments and/or as a realized gain. Subsequent to ex-dividend date the Fund determines the components of these distributions, based upon receipt of tax filings or other correspondence relating to the underlying investment. Interest income is accrued as earned and includes coupon interest and amortization of premium and accretion of discount on debt securities as applicable. Investment income is recorded net of foreign taxes withheld where recovery of such taxes is uncertain.
Class Allocations and Expenses. Investment income, realized and unrealized capital gains and losses, common expenses of the Fund, and certain fund-level expense reductions, if any, are allocated daily on a pro-rata basis to each class based on the relative net assets of each class to the total net assets of the Fund. Each class differs with respect to transfer agent and distribution and service plan fees incurred. Certain expense reductions may also differ by class. For the reporting period, the allocated portion of income and expenses to each class as a percent of its average net assets may vary due to the timing of recording these transactions in relation to fluctuating net assets of the classes. Expenses directly attributable to a fund are charged to that fund. Expenses attributable to more than one fund are allocated among the respective funds on the basis of relative net assets or other appropriate methods. Expense estimates are accrued in the period to which they relate and adjustments are made when actual amounts are known.
Income Tax Information and Distributions to Shareholders. Each year, the Fund intends to qualify as a regulated investment company under Subchapter M of the Internal Revenue Code, including distributing substantially all of its taxable income and realized gains. As a result, no provision for U.S. Federal income taxes is required. As of July 31, 2015, the Fund did not have any unrecognized tax benefits in the financial statements; nor is the Fund aware of any tax positions for which it is reasonably possible that the total amounts of unrecognized tax benefits will significantly change in the next twelve months. The Fund files a U.S. federal tax return, in addition to state and local tax returns as required. The Fund's federal income tax returns are subject to examination by the Internal Revenue Service (IRS) for a period of three fiscal years after they are filed.
Annual Report
Notes to Financial Statements - continued
3. Significant Accounting Policies - continued
Income Tax Information and Distributions to Shareholders - continued
State and local tax returns may be subject to examination for an additional fiscal year depending on the jurisdiction. Foreign taxes are provided for based on the Fund's understanding of the tax rules and rates that exist in the foreign markets in which it invests.
Distributions are declared and recorded on the ex-dividend date. Income dividends and capital gain distributions are declared separately for each class. Income and capital gain distributions are determined in accordance with income tax regulations, which may differ from GAAP. In addition, the Fund claimed a portion of the payment made to redeeming shareholders as a distribution for income tax purposes.
Capital accounts within the financial statements are adjusted for permanent book-tax differences. These adjustments have no impact on net assets or the results of operations. Capital accounts are not adjusted for temporary book-tax differences which will reverse in a subsequent period.
Book-tax differences are primarily due to foreign currency transactions, partnerships and losses deferred due to wash sales and excise tax regulations.
The federal tax cost of investment securities and unrealized appreciation (depreciation) as of period end were as follows:
Gross unrealized appreciation | $ 284,169,323 |
Gross unrealized depreciation | (39,468,707) |
Net unrealized appreciation (depreciation) on securities | $ 244,700,616 |
| |
Tax Cost | $ 1,534,555,905 |
The tax-based components of distributable earnings as of period end were as follows:
Undistributed ordinary income | $ 18,130,712 |
Undistributed long-term capital gain | $ 50,743,387 |
Net unrealized appreciation (depreciation) on securities and other investments | $ 244,687,677 |
Annual Report
3. Significant Accounting Policies - continued
Income Tax Information and Distributions to Shareholders - continued
The tax character of distributions paid was as follows:
| July 31, 2015 | July 31, 2014 |
Ordinary Income | $ - | $ 106,613,332 |
Long-term Capital Gains | 103,188,484 | 199,632,904 |
Total | $ 103,188,484 | $ 306,246,236 |
Short-Term Trading (Redemption) Fees. Shares held by investors in the Fund less than 90 days may have been subject to a redemption fee equal to 1.50% of the NAV of shares redeemed. All redemption fees, which reduce the proceeds of the shareholder redemption, are retained by the Fund and accounted for as an addition to paid in capital.
4. Purchases and Sales of Investments.
Purchases and sales of securities, other than short-term securities, aggregated $2,044,918,249 and $1,947,551,562, respectively.
5. Fees and Other Transactions with Affiliates.
Management Fee. Fidelity Management & Research Company (the investment adviser) and its affiliates provide the Fund with investment management related services for which the Fund pays a monthly management fee. The management fee is the sum of an individual fund fee rate that is based on an annual rate of .45% of the Fund's average net assets and an annualized group fee rate that averaged .25% during the period. The group fee rate is based upon the average net assets of all the mutual funds advised by the investment adviser, including any mutual funds previously advised by the investment adviser that are currently advised by Fidelity SelectCo, LLC, an affiliate of the investment adviser. The group fee rate decreases as assets under management increase and increases as assets under management decrease. In addition, the management fee is subject to a performance adjustment (up to a maximum of ± .20% of the Fund's average net assets over a 36 month performance period). The upward or downward adjustment to the management fee is based on the relative investment performance of Small Cap Growth as compared to its benchmark index, the Russell 2000 Growth Index, over the same 36 month performance period. For the reporting period, the total annual management fee rate, including the performance adjustment, was .65% of the Fund's average net assets. The performance adjustment included in the management fee rate may be higher or lower than the maximum performance adjustment rate due to the difference between the average net assets for the reporting and performance periods.
Annual Report
Notes to Financial Statements - continued
5. Fees and Other Transactions with Affiliates - continued
Distribution and Service Plan Fees. In accordance with Rule 12b-1 of the 1940 Act, the Fund has adopted separate Distribution and Service Plans for each class of shares. Certain classes pay Fidelity Distributors Corporation (FDC), an affiliate of the investment adviser, separate Distribution and Service Fees, each of which is based on an annual percentage of each class' average net assets. In addition, FDC may pay financial intermediaries for selling shares of the Fund and providing shareholder support services. For the period, the Distribution and Service Fee rates, total fees and amounts retained by FDC were as follows:
| Distribution
Fee | Service
Fee | Total Fees | Retained
by FDC |
Class A | -% | .25% | $ 235,371 | $ 4,756 |
Class T | .25% | .25% | 224,894 | - |
Class B | .75% | .25% | 25,039 | 18,886 |
Class C | .75% | .25% | 428,543 | 68,843 |
| | | $ 913,847 | $ 92,485 |
Sales Load. FDC may receive a front-end sales charge of up to 5.75% for selling Class A shares and 3.50% for selling Class T shares, some of which is paid to financial intermediaries for selling shares of the Fund. Depending on the holding period, FDC may receive contingent deferred sales charges levied on Class A, Class T, Class B, and Class C redemptions. The deferred sales charges range from 5.00% to 1.00% for Class B shares, 1.00% for Class C shares, 1.00% for certain purchases of Class A shares and .25% for certain purchases of Class T shares.
For the period, sales charge amounts retained by FDC were as follows:
| Retained
by FDC |
Class A | $ 64,422 |
Class T | 11,332 |
Class B* | 1,032 |
Class C* | 6,916 |
| $ 83,702 |
* When Class B and Class C shares are initially sold, FDC pays commissions from its own resources to financial intermediaries through which the sales are made.
Transfer Agent Fees. Fidelity Investments Institutional Operations Company, Inc., (FIIOC), an affiliate of the investment adviser, is the transfer, dividend disbursing and shareholder servicing agent for each class of the Fund. FIIOC receives account fees and asset-based fees that vary according to the account size and type of account of the
Annual Report
5. Fees and Other Transactions with Affiliates - continued
Transfer Agent Fees - continued
shareholders of the respective classes of the Fund. FIIOC pays for typesetting, printing and mailing of shareholder reports, except proxy statements.
For the period, transfer agent fees for each class were as follows:
| Amount | % of
Class-Level Average
Net Assets |
Class A | $ 240,180 | .25 |
Class T | 124,717 | .28 |
Class B | 7,532 | .30 |
Class C | 125,384 | .29 |
Small Cap Growth | 2,079,578 | .20 |
Class I | 138,527 | .22 |
| $ 2,715,918 | |
Accounting and Security Lending Fees. Fidelity Service Company, Inc. (FSC), an affiliate of the investment adviser, maintains the Fund's accounting records. The accounting fee is based on the level of average net assets for each month. Under a separate contract, FSC administers the security lending program. The security lending fee is based on the number and duration of lending transactions.
Brokerage Commissions. The Fund placed a portion of its portfolio transactions with brokerage firms which are affiliates of the investment adviser. Brokerage commissions are included in net realized gain (loss) and change in net unrealized appreciation (depreciation) in the Statement of Operations. The commissions paid to these affiliated firms were $80,251 for the period.
Interfund Lending Program. Pursuant to an Exemptive Order issued by the SEC, the Fund, along with other registered investment companies having management contracts with FMR or other affiliated entities of FMR, may participate in an interfund lending program. This program provides an alternative credit facility allowing the funds to borrow from, or lend money to, other participating affiliated funds. At period end, there were no interfund loans outstanding. The Fund's activity in this program during the period for which loans were outstanding was as follows:
Borrower or Lender | Average Loan
Balance | Weighted Average Interest Rate | Interest Expense |
Borrower | $ 66,799,000 | .32% | $ 4,117 |
Annual Report
Notes to Financial Statements - continued
6. Committed Line of Credit.
The Fund participates with other funds managed by the investment adviser or an affiliate in a $4.25 billion credit facility (the "line of credit") to be utilized for temporary or emergency purposes to fund shareholder redemptions or for other short-term liquidity purposes. The Fund has agreed to pay commitment fees on its pro-rata portion of the line of credit, which amounted to $1,790 and is reflected in Miscellaneous expenses on the Statement of Operations. During the period, the Fund did not borrow on this line of credit.
7. Security Lending.
The Fund lends portfolio securities through a lending agent from time to time in order to earn additional income. For equity securities, a lending agent is used and may loan securities to certain qualified borrowers, including Fidelity Capital Markets (FCM), a broker-dealer affiliated with the Fund. On the settlement date of the loan, the Fund receives collateral (in the form of U.S. Treasury obligations, letters of credit and/or cash) against the loaned securities and maintains collateral in an amount not less than 100% of the market value of the loaned securities during the period of the loan. The market value of the loaned securities is determined at the close of business of the Fund and any additional required collateral is delivered to the Fund on the next business day. If the borrower defaults on its obligation to return the securities loaned because of insolvency or other reasons, the Fund may apply collateral received from the borrower against the obligation. The Fund may experience delays and costs in recovering the securities loaned. Any cash collateral received is invested in the Fidelity Securities Lending Cash Central Fund. The value of loaned securities and cash collateral at period end are disclosed on the Fund's Statement of Assets and Liabilities. Security lending income represents the income earned on investing cash collateral, less rebates paid to borrowers and any lending agent fees associated with the loan, plus any premium payments received for lending certain types of securities. Security lending income is presented in the Statement of Operations as a component of income from Fidelity Central Funds, and includes $53,294 from securities loaned to FCM.
8. Expense Reductions.
Commissions paid to certain brokers with whom the investment adviser, or its affiliates, places trades on behalf of the Fund include an amount in addition to trade execution, which may be rebated back to the Fund to offset certain expenses. This amount totaled $134,401 for the period. In addition, through arrangements with the Fund's custodian, credits realized as a result of uninvested cash balances were used to reduce the Fund's expenses. During the period, these credits reduced the Fund's custody expenses by $211.
Annual Report
8. Expense Reductions - continued
In addition, during the period the investment adviser reimbursed/waived a portion of fund-level operating expenses in the amount of $5,837 and a portion of class-level operating expenses as follows:
| Amount |
Class A | $ 1,650 |
Class T | 799 |
Class B | 5 |
Class C | 651 |
Small Cap Growth | 28,551 |
Class I | 1,218 |
| $ 32,874 |
9. Distributions to Shareholders.
Distributions to shareholders of each class were as follows:
Years ended July 31, | 2015 | 2014 A |
From net realized gain | | |
Class A | $ 7,463,655 | $ 13,043,180 |
Class T | 3,715,268 | 6,310,012 |
Class B | 242,938 | 574,582 |
Class C | 3,707,592 | 6,249,863 |
Small Cap Growth | 83,762,458 | 191,545,684 |
Class F | - | 80,609,253 |
Class I | 4,296,573 | 7,913,662 |
Total | $ 103,188,484 | $ 306,246,236 |
A All Class F Shares were redeemed on November 15, 2013.
10. Share Transactions.
Share transactions for each class were as follows and may contain automatic conversions between classes or exchanges between funds:
| Shares | Dollars |
Years ended July 31, | 2015 | 2014 A | 2015 | 2014 A |
Class A | | | | |
Shares sold | 2,167,593 | 1,706,264 | $ 41,925,439 | $ 32,017,468 |
Reinvestment of distributions | 412,446 | 685,582 | 7,203,479 | 12,377,436 |
Shares redeemed | (1,515,208) | (1,267,150) | (27,623,856) | (23,663,751) |
Net increase (decrease) | 1,064,831 | 1,124,696 | $ 21,505,062 | $ 20,731,153 |
Annual Report
Notes to Financial Statements - continued
10. Share Transactions - continued
| Shares | Dollars |
Years ended July 31, | 2015 | 2014 A | 2015 | 2014 A |
Class T | | | | |
Shares sold | 659,898 | 787,491 | $ 12,282,234 | $ 14,539,628 |
Reinvestment of distributions | 211,200 | 341,036 | 3,613,802 | 6,061,090 |
Shares redeemed | (660,724) | (506,140) | (11,765,139) | (9,192,820) |
Net increase (decrease) | 210,374 | 622,387 | $ 4,130,897 | $ 11,407,898 |
Class B | | | | |
Shares sold | 11,802 | 11,205 | $ 209,809 | $ 198,217 |
Reinvestment of distributions | 14,482 | 32,147 | 235,501 | 548,598 |
Shares redeemed | (66,110) | (66,282) | (1,127,352) | (1,168,208) |
Net increase (decrease) | (39,826) | (22,930) | $ (682,042) | $ (421,393) |
Class C | | | | |
Shares sold | 992,298 | 918,904 | $ 17,729,436 | $ 16,220,240 |
Reinvestment of distributions | 216,825 | 347,970 | 3,508,500 | 5,911,022 |
Shares redeemed | (778,826) | (510,512) | (13,034,787) | (8,883,388) |
Net increase (decrease) | 430,297 | 756,362 | $ 8,203,149 | $ 13,247,874 |
Small Cap Growth | | | | |
Shares sold | 23,816,242 | 30,614,664 | $ 475,203,336 | $ 589,831,022 |
Reinvestment of distributions | 4,527,816 | 10,184,956 | 81,276,349 | 187,557,177 |
Shares redeemed | (22,793,867) | (48,426,256)B | (412,013,233) | (934,113,968)B |
Net increase (decrease) | 5,550,191 | (7,626,636) | $ 144,466,452 | $ (156,725,769) |
Class F | | | | |
Shares sold | - | 768,083 | $ - | $ 15,293,461 |
Reinvestment of distributions | - | 4,357,257 | - | 80,609,253 |
Shares redeemed | - | (41,060,113)B | - | (806,457,595)B |
Net increase (decrease) | - | (35,934,773) | $ - | $ (710,554,881) |
Class I | | | | |
Shares sold | 2,387,318 | 933,934 | $ 47,676,724 | $ 18,129,031 |
Reinvestment of distributions | 220,272 | 381,830 | 3,963,647 | 7,062,159 |
Shares redeemed | (789,017) | (1,069,577) | (15,108,080) | (20,552,810) |
Net increase (decrease) | 1,818,573 | 246,187 | $ 36,532,291 | $ 4,638,380 |
A All Class F Shares were redeemed on November 15, 2013.
B Amount includes in-kind redemptions.
Annual Report
11. Other.
The Fund's organizational documents provide former and current trustees and officers with a limited indemnification against liabilities arising in connection with the performance of their duties to the Fund. In the normal course of business, the Fund may also enter into contracts that provide general indemnifications. The Fund's maximum exposure under these arrangements is unknown as this would be dependent on future claims that may be made against the Fund. The risk of material loss from such claims is considered remote.
Annual Report
To the Trustees of Fidelity Securities Fund and the Shareholders of Fidelity Small Cap Growth Fund:
In our opinion, the accompanying statement of assets and liabilities, including the schedule of investments, and the related statements of operations and of changes in net assets and the financial highlights present fairly, in all material respects, the financial position of Fidelity Small Cap Growth Fund (a fund of Fidelity Securities Fund) at July 31, 2015, the results of its operations for the year then ended, the changes in its net assets for each of the two years in the period then ended and the financial highlights for each of the five years in the period then ended, in conformity with accounting principles generally accepted in the United States of America. These financial statements and financial highlights (hereafter referred to as "financial statements") are the responsibility of the Fidelity Small Cap Growth Fund's management. Our responsibility is to express an opinion on these financial statements based on our audits. We conducted our audits of these financial statements in accordance with the standards of the Public Company Accounting Oversight Board (United States). Those standards require that we plan and perform the audit to obtain reasonable assurance about whether the financial statements are free of material misstatement. An audit includes examining, on a test basis, evidence supporting the amounts and disclosures in the financial statements, assessing the accounting principles used and significant estimates made by management, and evaluating the overall financial statement presentation. We believe that our audits, which included confirmation of securities at July 31, 2015 by correspondence with the custodian and brokers, provide a reasonable basis for our opinion.
PricewaterhouseCoopers LLP
Boston, Massachusetts
September 16, 2015
Annual Report
The Trustees, Member of the Advisory Board, and officers of the trust and fund, as applicable, are listed below. The Board of Trustees governs each fund and is responsible for protecting the interests of shareholders. The Trustees are experienced executives who meet periodically throughout the year to oversee each fund's activities, review contractual arrangements with companies that provide services to each fund, oversee management of the risks associated with such activities and contractual arrangements, and review each fund's performance. Each of the Trustees oversees 170 funds.
The Trustees hold office without limit in time except that (a) any Trustee may resign; (b) any Trustee may be removed by written instrument, signed by at least two-thirds of the number of Trustees prior to such removal; (c) any Trustee who requests to be retired or who has become incapacitated by illness or injury may be retired by written instrument signed by a majority of the other Trustees; and (d) any Trustee may be removed at any special meeting of shareholders by a two-thirds vote of the outstanding voting securities of the trust. Each Trustee who is not an interested person (as defined in the 1940 Act) of the trust and the funds (Independent Trustee), shall retire not later than the last day of the calendar year in which his or her 75th birthday occurs. The Independent Trustees may waive this mandatory retirement age policy with respect to individual Trustees. The officers and Advisory Board Member hold office without limit in time, except that any officer and Advisory Board Member may resign or may be removed by a vote of a majority of the Trustees at any regular meeting or any special meeting of the Trustees. Except as indicated, each individual has held the office shown or other offices in the same company for the past five years.
Experience, Skills, Attributes, and Qualifications of the Fund's Trustees. The Governance and Nominating Committee has adopted a statement of policy that describes the experience, qualifications, attributes, and skills that are necessary and desirable for potential Independent Trustee candidates (Statement of Policy). The Board believes that each Trustee satisfied at the time he or she was initially elected or appointed a Trustee, and continues to satisfy, the standards contemplated by the Statement of Policy. The Governance and Nominating Committee also engages professional search firms to help identify potential Independent Trustee candidates who have the experience, qualifications, attributes, and skills consistent with the Statement of Policy. From time to time, additional criteria based on the composition and skills of the current Independent Trustees, as well as experience or skills that may be appropriate in light of future changes to board composition, business conditions, and regulatory or other developments, have also been considered by the professional search firms and the Governance and Nominating Committee. In addition, the Board takes into account the Trustees' commitment and participation in Board and committee meetings, as well as their leadership of standing and ad hoc committees throughout their tenure.
In determining that a particular Trustee was and continues to be qualified to serve as a Trustee, the Board has considered a variety of criteria, none of which, in isolation, was controlling. The Board believes that, collectively, the Trustees have balanced and diverse experience, qualifications, attributes, and skills, which allow the Board to operate effectively in governing each fund and protecting the interests of shareholders. Information about the specific experience, skills, attributes, and qualifications of each Trustee, which in each case led to the Board's conclusion that the Trustee should serve (or continue to serve) as a trustee of the fund, is provided below.
Annual Report
Trustees and Officers - continued
Board Structure and Oversight Function. James C. Curvey is an interested person (as defined in the 1940 Act) and currently serves as Chairman. The Trustees have determined that an interested Chairman is appropriate and benefits shareholders because an interested Chairman has a personal and professional stake in the quality and continuity of services provided to the fund. Independent Trustees exercise their informed business judgment to appoint an individual of their choosing to serve as Chairman, regardless of whether the Trustee happens to be independent or a member of management. The Independent Trustees have determined that they can act independently and effectively without having an Independent Trustee serve as Chairman and that a key structural component for assuring that they are in a position to do so is for the Independent Trustees to constitute a substantial majority for the Board. The Independent Trustees also regularly meet in executive session. Ned C. Lautenbach serves as Chairman of the Independent Trustees and as such (i) acts as a liaison between the Independent Trustees and management with respect to matters important to the Independent Trustees and (ii) with management prepares agendas for Board meetings.
Fidelity funds are overseen by different Boards of Trustees. The fund's Board oversees Fidelity's high income and certain equity funds and other Boards oversee Fidelity's investment-grade bond, money market, asset allocation, and sector funds. The asset allocation funds may invest in Fidelity funds overseen by the fund's Board. The use of separate Boards, each with its own committee structure, allows the Trustees of each group of Fidelity funds to focus on the unique issues of the funds they oversee, including common research, investment, and operational issues. On occasion, the separate Boards establish joint committees to address issues of overlapping consequences for the Fidelity funds overseen by each Board.
The Trustees operate using a system of committees to facilitate the timely and efficient consideration of all matters of importance to the Trustees, each fund, and fund shareholders and to facilitate compliance with legal and regulatory requirements and oversight of the fund's activities and associated risks. The Board, acting through its committees, has charged FMR and its affiliates with (i) identifying events or circumstances the occurrence of which could have demonstrably adverse effects on the fund's business and/or reputation; (ii) implementing processes and controls to lessen the possibility that such events or circumstances occur or to mitigate the effects of such events or circumstances if they do occur; and (iii) creating and maintaining a system designed to evaluate continuously business and market conditions in order to facilitate the identification and implementation processes described in (i) and (ii) above. Because the day-to-day operations and activities of the fund are carried out by or through FMR, its affiliates and other service providers, the fund's exposure to risks is mitigated but not eliminated by the processes overseen by the Trustees. While each of the Board's committees has responsibility for overseeing different aspects of the fund's activities, oversight is exercised primarily through the Operations, Audit, and Compliance Committees. In addition, the Independent Trustees have worked with FMR to enhance the Board's oversight of investment and financial risks, legal and regulatory risks, technology risks, and operational risks, including the development of additional risk reporting to the Board. For example, a working group comprised of Independent Trustees and FMR has worked and continues to work to review the Fidelity funds' valuation-related activities, reporting and risk management. Appropriate personnel, including but not limited to the fund's Chief Compliance Officer (CCO), FMR's internal auditor, the independent accountants, the fund's Treasurer and portfolio management personnel, make periodic reports to the Board's committees, as appropriate, including an annual review of FMR's risk management program for the Fidelity funds. The responsibilities of each standing committee, including their oversight responsibilities, are described further under "Standing Committees of the Fund's Trustees."
Annual Report
The fund's Statement of Additional Information (SAI) includes more information about the Trustees. To request a free copy, call Fidelity at 1-877-208-0098.
Interested Trustees*:
Correspondence intended for each Trustee who is an interested person may be sent to Fidelity Investments, 245 Summer Street, Boston, Massachusetts 02210.
Name, Year of Birth; Principal Occupations and Other Relevant Experience+ |
James C. Curvey (1935) |
Year of Election or Appointment: 2007 Trustee Chairman of the Board of Trustees |
| Mr. Curvey also serves as Trustee of other Fidelity funds. Mr. Curvey is a Director of Fidelity Research & Analysis Co. (investment adviser firm, 2009-present), and Vice Chairman (2007-present) and Director of FMR LLC (diversified financial services company). In addition, Mr. Curvey serves as an Overseer for the Boston Symphony Orchestra and a member of the board of Artis-Naples, Naples, Florida, and as a Trustee for Brewster Academy, Wolfeboro, New Hampshire. Previously, Mr. Curvey served as a Director of Fidelity Investments Money Management, Inc. (investment adviser firm, 2009-2014), a Director of FMR (investment adviser firm, 2007-2014), and a Director of FMR Co., Inc. (investment adviser firm, 2007-2014). |
Charles S. Morrison (1960) |
Year of Election or Appointment: 2014 Trustee |
| Mr. Morrison also serves as Trustee of other funds. He serves as a Director of Fidelity Investments Money Management, Inc. (FIMM) (investment adviser firm, 2014-present), Director of Fidelity SelectCo, LLC (investment adviser firm, 2014-present), President, Asset Management (2014-present), and is an employee of Fidelity Investments. Previously, Mr. Morrison served as Vice President of Fidelity's Fixed Income and Asset Allocation Funds (2012-2014), President, Fixed Income (2011-2014), Vice President of Fidelity's Money Market Funds (2005-2009), President, Money Market Group Leader of FMR (investment adviser firm, 2009), and Senior Vice President, Money Market Group of FMR (2004-2009). Mr. Morrison also served as Vice President of Fidelity's Bond Funds (2002-2005), certain Balanced Funds (2002-2005), and certain Asset Allocation Funds (2002-2007), and as Senior Vice President (2002-2005) of Fidelity's Bond Division. |
* Trustees have been determined to be "Interested Trustees" by virtue of, among other things, their affiliation with the trust or various entities under common control with FMR.
+ The information above includes each Trustee's principal occupation during the last five years and other information relating to the experience, attributes, and skills relevant to each Trustee's qualifications to serve as a Trustee, which led to the conclusion that each Trustee should serve as a Trustee for each fund.
Annual Report
Independent Trustees:
Correspondence intended for each Independent Trustee (that is, the Trustees other than the Interested Trustees) may be sent to Fidelity Investments, P.O. Box 55235, Boston, Massachusetts 02205-5235.
Name, Year of Birth; Principal Occupations and Other Relevant Experience+ |
Dennis J. Dirks (1948) |
Year of Election or Appointment: 2005 Trustee |
| Mr. Dirks also serves as Trustee of other Fidelity funds. Prior to his retirement in May 2003, Mr. Dirks was Chief Operating Officer and a member of the Board of The Depository Trust & Clearing Corporation (DTCC). He also served as President, Chief Operating Officer, and Board member of The Depository Trust Company (DTC) and President and Board member of the National Securities Clearing Corporation (NSCC). In addition, Mr. Dirks served as Chief Executive Officer and Board member of the Government Securities Clearing Corporation, Chief Executive Officer and Board member of the Mortgage-Backed Securities Clearing Corporation, as a Trustee and a member of the Finance Committee of Manhattan College (2005-2008), and as a Trustee and a member of the Finance Committee of AHRC of Nassau County (2006-2008). Mr. Dirks is a member of the Independent Directors Council (IDC) Governing Council (2010-present) and Board of Directors for The Brookville Center for Children's Services, Inc. (2009-present). |
Alan J. Lacy (1953) |
Year of Election or Appointment: 2008 Trustee |
| Mr. Lacy also serves as Trustee of other Fidelity funds. Mr. Lacy serves as a member of the Board of Directors of Dave & Buster's Entertainment, Inc. (restaurant and entertainment complexes, 2010-present) and Bristol-Myers Squibb Company (global pharmaceuticals, 2008-present). In addition, Mr. Lacy served as Senior Adviser (2007-2014) of Oak Hill Capital Partners, L.P. (private equity) and also served as Chief Executive Officer (2000-2005) and Vice Chairman (2005-2006) of Sears Holdings Corporation and Sears, Roebuck and Co. (retail). Mr. Lacy is a member of the Board of Trustees of The National Parks Conservation Association (2006-present). Previously, Mr. Lacy served as Chairman of the Board of Trustees of the National Parks Conservation Association (2008-2011) and as a member of the Board of Directors for The Western Union Company (global money transfer, 2006-2011), The Hillman Companies, Inc. (hardware wholesalers, 2010-2014), and Earth Fare, Inc. (retail grocery, 2010-2014). |
Ned C. Lautenbach (1944) |
Year of Election or Appointment: 2000 Trustee Chairman of the Independent Trustees |
| Mr. Lautenbach also serves as Trustee of other Fidelity funds. Mr. Lautenbach currently serves as the Lead Director of the Eaton Corporation Board of Directors (diversified industrial, 1997-present). Mr. Lautenbach is Chairman of the Board of Directors of Artis-Naples in Naples, Florida (2012-present), a member of the Council on Foreign Relations (1994-present), and a member of the Board of Governors, State University System of Florida (2013-present). Previously, Mr. Lautenbach was a Partner/Advisory Partner at Clayton, Dubilier & Rice, LLC (private equity investment, 1998-2010), as well as a Director of Sony Corporation (2006-2007). |
Joseph Mauriello (1944) |
Year of Election or Appointment: 2008 Trustee |
| Mr. Mauriello also serves as Trustee of other Fidelity funds. Prior to his retirement in January 2006, Mr. Mauriello served in numerous senior management positions including Deputy Chairman and Chief Operating Officer (2004-2005), and Vice Chairman of Financial Services (2002-2004) of KPMG LLP US (professional services, 1965-2005). Mr. Mauriello currently serves as a member of the Board of Directors of XL Group plc. (global insurance and re-insurance, 2006-present). Previously, Mr. Mauriello served as a Director of the Hamilton Funds of the Bank of New York (2006-2007) and of Arcadia Resources Inc. (health care services and products, 2007-2012). |
Robert W. Selander (1950) |
Year of Election or Appointment: 2011 Trustee |
| Mr. Selander also serves as Trustee of other Fidelity funds. Mr. Selander serves as a Director of The Western Union Company (global money transfer, 2014-present). Previously, Mr. Selander served as a Member of the Advisory Board of other Fidelity funds (2011), and Executive Vice Chairman (2010), Chief Executive Officer (2009-2010), and President and Chief Executive Officer (1997-2009) of Mastercard, Inc. |
Cornelia M. Small (1944) |
Year of Election or Appointment: 2005 Trustee |
| Ms. Small also serves as Trustee of other Fidelity funds. Ms. Small is a member of the Board of Directors (2009-present) and Chair of the Investment Committee (2010-present) of the Teagle Foundation. Ms. Small also serves on the Investment Committee of the Berkshire Taconic Community Foundation (2008-present). Previously, Ms. Small served as Chairperson (2002-2008) and a member of the Investment Committee and Chairperson (2008-2012) and a member of the Board of Trustees of Smith College. In addition, Ms. Small served as Chief Investment Officer, Director of Global Equity Investments, and a member of the Board of Directors of Scudder, Stevens & Clark and Scudder Kemper Investments. |
William S. Stavropoulos (1939) |
Year of Election or Appointment: 2002 Trustee Vice Chairman of the Independent Trustees |
| Mr. Stavropoulos also serves as Trustee of other Fidelity funds. Mr. Stavropoulos serves as President and Founder of the Michigan Baseball Foundation, the Great Lakes Loons (2007-present). Mr. Stavropoulos is Chairman Emeritus of the Board of Directors of The Dow Chemical Company, where he previously served in numerous senior management positions, including President, CEO (1995-2000; 2002-2004), Chairman of the Executive Committee (2000-2006), and as a member of the Board of Directors (1990-2006). Currently, Mr. Stavropoulos is Chairman of the Board of Directors of Univar Inc. (global distributor of commodity and specialty chemicals), a Director of Teradata Corporation (data warehousing and technology solutions), and Maersk Inc. (industrial conglomerate), and a member of the Advisory Board for Metalmark Capital LLC (private equity investment, 2005-present). Mr. Stavropoulos is an operating advisor to Clayton, Dubilier & Rice, LLC (private equity investment). In addition, Mr. Stavropoulos is a member of the University of Notre Dame Advisory Council for the College of Science, a Trustee of the Rollin L. Gerstacker Foundation, and a Director of the Naples Philharmonic Center for the Arts. Previously, Mr. Stavropoulos served as a Director of Chemical Financial Corporation (bank holding company, 1993-2012) and Tyco International, Ltd. (multinational manufacturing and services, 2007-2012). |
David M. Thomas (1949) |
Year of Election or Appointment: 2008 Trustee |
| Mr. Thomas also serves as Trustee of other Fidelity funds. Mr. Thomas serves as Non-Executive Chairman of the Board of Directors of Fortune Brands Home and Security (home and security products, 2011-present), as a member of the Board of Directors (2004-present) and Presiding Director (2013-present) of Interpublic Group of Companies, Inc. (marketing communication), and as a member of the Board of Trustees of the University of Florida (2013-present). Previously, Mr. Thomas served as Executive Chairman (2005-2006) and Chairman and Chief Executive Officer (2000-2005) of IMS Health, Inc. (pharmaceutical and healthcare information solutions), and a Director of Fortune Brands, Inc. (consumer products, 2000-2011). |
+ The information above includes each Trustee's principal occupation during the last five years and other information relating to the experience, attributes, and skills relevant to each Trustee's qualifications to serve as a Trustee, which led to the conclusion that each Trustee should serve as a Trustee for each fund.
Advisory Board Member and Officers:
Correspondence intended for each officer and Peter S. Lynch may be sent to Fidelity Investments, 245 Summer Street, Boston, Massachusetts 02210. Officers appear below in alphabetical order.
Name, Year of Birth; Principal Occupation |
Peter S. Lynch (1944) |
Year of Election or Appointment: 2003 Member of the Advisory Board |
| Mr. Lynch also serves as Member of the Advisory Board of other Fidelity funds. Mr. Lynch is Vice Chairman and a Director of FMR (investment adviser firm) and FMR Co., Inc. (investment adviser firm). In addition, Mr. Lynch serves as a Trustee of Boston College and as the Chairman of the Inner-City Scholarship Fund. Previously, Mr. Lynch served on the Special Olympics International Board of Directors (1997-2006). |
Elizabeth Paige Baumann (1968) |
Year of Election or Appointment: 2012 Anti-Money Laundering (AML) Officer |
| Ms. Baumann also serves as AML Officer of other funds. She is Chief AML Officer of FMR LLC (diversified financial services company, 2012-present) and is an employee of Fidelity Investments. Previously, Ms. Baumann served as Vice President and Deputy Anti-Money Laundering Officer (2007-2012). |
Marc Bryant (1966) |
Year of Election or Appointment: 2015 Secretary and Chief Legal Officer (CLO) |
| Mr. Bryant also serves as Secretary and Chief Legal Officer (CLO) of other funds. He is Senior Vice President and Deputy General Counsel of FMR LLC (diversified financial services company), Previously, Mr. Bryant served as Secretary and Chief Legal Officer of Fidelity Rutland Square Trust II (2010-2014) and Assistant Secretary of Fidelity's Fixed Income and Asset Allocation Funds (2013-2015). Prior to joining Fidelity Investments, Mr. Bryant served as a Senior Vice President and the Head of Global Retail Legal for Alliance Bernstein L.P. (2006-2010), and as the General Counsel for ProFund Advisors LLC (2001-2006). |
William C. Coffey (1969) |
Year of Election or Appointment: 2009 Assistant Secretary |
| Mr. Coffey also serves as Assistant Secretary of other funds. He is Senior Vice President and Deputy General Counsel of FMR LLC (diversified financial services company, 2010-present), and is an employee of Fidelity Investments. Previously, Mr. Coffey served as Vice President and Associate General Counsel of FMR LLC (2005-2009). |
Jonathan Davis (1968) |
Year of Election or Appointment: 2010 Assistant Treasurer |
| Mr. Davis also serves as Assistant Treasurer of other funds. Mr. Davis is an employee of Fidelity Investments. Previously, Mr. Davis served as Vice President and Associate General Counsel of FMR LLC (diversified financial services company, 2003-2010). |
Adrien E. Deberghes (1967) |
Year of Election or Appointment: 2008 Deputy Treasurer |
| Mr. Deberghes also serves as an officer of other funds. He is an employee of Fidelity Investments (2008-present). Prior to joining Fidelity Investments, Mr. Deberghes was Senior Vice President of Mutual Fund Administration at State Street Corporation (2007-2008), Senior Director of Mutual Fund Administration at Investors Bank & Trust (2005-2007), and Director of Finance for Dunkin' Brands (2000-2005). |
Stephanie J. Dorsey (1969) |
Year of Election or Appointment: 2010 Assistant Treasurer |
| Ms. Dorsey also serves as an officer of other funds. She is an employee of Fidelity Investments (2008-present) and has served in other fund officer roles. Prior to joining Fidelity Investments, Ms. Dorsey served as Treasurer (2004-2008) of the JPMorgan Mutual Funds and Vice President (2004-2008) of JPMorgan Chase Bank. |
Howard J. Galligan III (1966) |
Year of Election or Appointment: 2014 Chief Financial Officer |
| Mr. Galligan also serves as Chief Financial Officer of other funds. Mr. Galligan serves as President of Fidelity Pricing and Cash Management Services (FPCMS) (2014-present) and as a Director of Strategic Advisers, Inc. (investment adviser firm, 2008-present). Previously, Mr. Galligan served as Chief Administrative Officer of Asset Management (2011-2014) and Chief Operating Officer and Senior Vice President of Investment Support for Strategic Advisers, Inc. (2003-2011). |
Scott C. Goebel (1968) |
Year of Election or Appointment: 2015 Vice President |
| Mr. Goebel serves as an officer of other funds. Mr. Goebel also serves as Secretary of Fidelity SelectCo, LLC (investment adviser firm, 2013-present), Fidelity Investments Money Management, Inc. (FIMM) (investment adviser firm, 2010-present) and Fidelity Research and Analysis Company (FRAC) (investment adviser firm, 2010-present); General Counsel, Secretary, and Senior Vice President of FMR (investment adviser firm, 2008-present) and FMR Co., Inc. (investment adviser firm, 2008-present); Chief Legal Officer of Fidelity Management & Research (Hong Kong) Limited (investment adviser firm, 2008-present); and Assistant Secretary of Fidelity Management & Research (Japan) Limited (investment adviser firm, 2008-present) and FMR Investment Management (U.K.) Limited (investment adviser firm, 2008-present). Previously, Mr. Goebel served as Secretary and CLO of certain Fidelity funds (2008-2015), Assistant Secretary of FIMM (2008-2010), FRAC (2008-2010), and certain funds (2007-2008); and as Vice President and Secretary of Fidelity Distributors Corporation (FDC) (2005-2007). Mr. Goebel has been employed by FMR LLC (diversified financial services company) or an affiliate since 2001. |
Thomas C. Hense (1964) |
Year of Election or Appointment: 2008/2010/2015 Vice President |
| Mr. Hense serves as Vice President of Fidelity Advisor Multi-Asset Income Fund (2015) and other funds (High Income (2008), Small Cap (2008), and Value (2010) funds). Previously, Mr. Hense served as a portfolio manager for Fidelity's Institutional Money Management Group (Pyramis) (2003-2008). |
Brian B. Hogan (1964) |
Year of Election or Appointment: 2009 Vice President |
| Mr. Hogan also serves as Trustee or Vice President of other funds. Mr. Hogan serves as a Director of Fidelity SelectCo, LLC (investment adviser firm, 2014-present) and President of the Equity Division of FMR (investment adviser firm, 2009-present). Previously, Mr. Hogan served as Senior Vice President, Equity Research of FMR (2006-2009) and as a portfolio manager. |
Chris Maher (1972) |
Year of Election or Appointment: 2013 Assistant Treasurer |
| Mr. Maher serves as Assistant Treasurer of other funds. Mr. Maher is Vice President of Valuation Oversight and is an employee of Fidelity Investments. Previously, Mr. Maher served as Vice President of Asset Management Compliance (2013), Vice President of the Program Management Group of FMR (investment adviser firm, 2010-2013), and Vice President of Valuation Oversight (2008-2010). |
Kenneth B. Robins (1969) |
Year of Election or Appointment: 2008 President and Treasurer |
| Mr. Robins also serves as an officer of other funds. Mr. Robins serves as Executive Vice President of Fidelity Investments Money Management, Inc. (FIMM) (investment adviser firm, 2013-present) and is an employee of Fidelity Investments (2004-present). Previously, Mr. Robins served in other fund officer roles. |
Stephen Sadoski (1971) |
Year of Election or Appointment: 2012 Deputy Treasurer |
| Mr. Sadoski also serves as Deputy Treasurer of other funds. He is an employee of Fidelity Investments (2012-present) and has served in another fund officer role. Prior to joining Fidelity Investments, Mr. Sadoski served as an assistant chief accountant in the Division of Investment Management of the Securities and Exchange Commission (SEC) (2009-2012) and as a senior manager at Deloitte & Touche LLP (1997-2009). |
Stacie M. Smith (1974) |
Year of Election or Appointment: 2013 Deputy Treasurer |
| Ms. Smith also serves as an officer of other funds. She is an employee of Fidelity Investments (2009-present) and has served in other fund officer roles. Prior to joining Fidelity Investments, Ms. Smith served as Senior Audit Manager of Ernst & Young LLP (1996-2009). |
Renee Stagnone (1975) |
Year of Election or Appointment: 2013 Deputy Treasurer |
| Ms. Stagnone also serves as Deputy Treasurer of other funds. Ms. Stagnone is an employee of Fidelity Investments. |
Linda J. Wondrack (1964) |
Year of Election or Appointment: 2014 Chief Compliance Officer |
| Ms. Wondrack also serves as Chief Compliance Officer of other funds. Ms. Wondrack is Executive Vice President and head of the Ethics Office and Asset Management Compliance for Fidelity Investments (2012-present). Ms. Wondrack also serves as Chief Compliance Officer of Fidelity SelectCo, LLC (investment adviser firm, 2014-present); Chief Compliance Officer of Impresa Management LLC (2013-present); and Chief Compliance Officer of FMR Co., Inc. (investment adviser firm), Fidelity Investments Money Management, Inc. (investment adviser firm), Fidelity Management & Research (Japan) Limited (investment adviser firm), FMR Investment Management (U.K.) Limited (investment adviser firm), Fidelity Management & Research (Hong Kong) (investment adviser firm), Fidelity Management & Research Company (investment adviser firm), Pyramis Global Advisors, LLC (investment adviser firm), and Strategic Advisers, Inc. (investment adviser firm), Ballyrock Investment Advisors LLC, and Northern Neck Investors LLC (2012-present). Previously, Ms. Wondrack served as Senior Vice President and Chief Compliance Officer for Columbia Management Investment Advisers, LLC (2005-2012); Chief Compliance Officer for certain funds within the Columbia Family of Funds (2007-2012); and Senior Vice President of Compliance Risk Management at Bank of America (2005-2010). |
Joseph F. Zambello (1957) |
Year of Election or Appointment: 2011 Deputy Treasurer |
| Mr. Zambello also serves as Deputy Treasurer of other funds. Mr. Zambello is an employee of Fidelity Investments. Previously, Mr. Zambello served as Vice President of the Program Management Group of FMR (investment adviser firm, 2009-2011) and Vice President of the Transfer Agent Oversight Group (2005-2009). |
Annual Report
The Board of Trustees of Fidelity Small Cap Growth Fund voted to pay to shareholders of record at the opening of business, the following distributions per share derived from capital gains realized from sales of portfolio securities:
| Pay Date | Record Date | Capital Gains |
Class A | 09/14/2015 | 09/11/2015 | $0.759 |
Class T | 09/14/2015 | 09/11/2015 | $0.726 |
Class B | 09/14/2015 | 09/11/2015 | $0.647 |
Class C | 09/14/2015 | 09/11/2015 | $0.662 |
The fund hereby designates as a capital gain dividend with respect to the taxable year ended July 31, 2015, $75,767,806, or, if subsequently determined to be different, the net capital gain of such year.
The fund will notify shareholders in January 2016 of amounts for use in preparing 2015 income tax returns.
Annual Report
Fidelity Small Cap Growth Fund
Each year, the Board of Trustees, including the Independent Trustees (together, the Board), votes on the renewal of the management contract with Fidelity Management & Research Company (FMR) and the sub-advisory agreements (together, the Advisory Contracts) for the fund. The Board, assisted by the advice of fund counsel and Independent Trustees' counsel, requests and considers a broad range of information relevant to the renewal of the Advisory Contracts throughout the year.
The Board meets regularly and, at each of its meetings, covers an extensive agenda of topics and materials and considers factors that are relevant to its annual consideration of the renewal of the fund's Advisory Contracts, including the services and support provided to the fund and its shareholders. The Board has established various standing committees (Committees), each composed of and chaired by Independent Trustees with varying backgrounds, to which the Board has assigned specific subject matter responsibilities in order to enhance effective decision-making by the Board. The Board, acting directly and through its Committees, requests and receives information concerning the annual consideration of the renewal of the fund's Advisory Contracts. The Board also meets as needed to consider matters specifically related to the Board's annual consideration of the renewal of the Advisory Contracts. Members of the Board may also meet with trustees of other Fidelity funds through ad hoc joint committees to discuss certain matters relevant to all of the Fidelity funds.
At its July 2015 meeting, the Board unanimously determined to renew the fund's Advisory Contracts. In reaching its determination, the Board considered all factors it believed relevant, including (i) the nature, extent, and quality of the services to be provided to the fund and its shareholders (including the investment performance of the fund); (ii) the competitiveness of the fund's management fee and total expense ratio relative to peer funds; (iii) the total costs of the services to be provided by and the profits to be realized by Fidelity from its relationship with the fund; and (iv) the extent to which (if any) economies of scale exist and would be realized as the fund grows, and whether any economies of scale are appropriately shared with fund shareholders.
In considering whether to renew the Advisory Contracts for the fund, the Board reached a determination, with the assistance of fund counsel and Independent Trustees' counsel and through the exercise of its business judgment, that the renewal of the Advisory Contracts was in the best interests of the fund and its shareholders and that the compensation payable under the Advisory Contracts was fair and reasonable. The Board's decision to renew the Advisory Contracts was not based on any single factor, but rather was based on a comprehensive consideration of all the information provided to the Board at its meetings throughout the year. The Board, in reaching its determination to renew the Advisory Contracts, was aware that shareholders of the fund have a broad range of investment choices available to them, including a wide choice among funds offered by Fidelity's competitors, and that the fund's shareholders, who have the opportunity to review and weigh the disclosure provided by the fund in its prospectus and other public disclosures, have chosen to invest in this fund, which is part of the Fidelity family of funds.
Annual Report
Board Approval of Investment Advisory Contracts and
Management Fees - continued
Nature, Extent, and Quality of Services Provided. The Board considered Fidelity's staffing as it relates to the fund, including the backgrounds of investment personnel of Fidelity, and also considered the fund's investment objective, strategies, and related investment philosophy. The Independent Trustees also had discussions with senior management of Fidelity's investment operations and investment groups. The Board considered the structure of the portfolio manager compensation program and whether this structure provides appropriate incentives to act in the best interests of the fund. Additionally, the Board considered the portfolio managers' investments, if any, in the funds that they manage.
Resources Dedicated to Investment Management and Support Services. The Board and the Fund Oversight and Research Committees reviewed the general qualifications and capabilities of Fidelity's investment staff, including its size, education, experience, and resources, as well as Fidelity's approach to recruiting, training, managing, and compensating investment personnel. The Board noted that Fidelity has continued to increase the resources devoted to non-U.S. offices, including expansion of Fidelity's global investment organization. The Board also noted that Fidelity's analysts have extensive resources, tools and capabilities that allow them to conduct sophisticated quantitative and fundamental analysis, as well as credit analysis of issuers, counterparties and guarantors. Further, the Board considered that Fidelity's investment professionals have sufficient access to global information and data so as to provide competitive investment results over time, and that those professionals also have access to sophisticated tools that permit them to assess portfolio construction and risk and performance attribution characteristics continuously, as well as to transmit new information and research conclusions rapidly around the world. Additionally, in its deliberations, the Board considered Fidelity's trading, risk management, and compliance capabilities and resources, which are integral parts of the investment management process.
Shareholder and Administrative Services. The Board considered (i) the nature, extent, quality, and cost of advisory, administrative, and shareholder services performed by FMR, the sub-advisers (together with FMR, the Investment Advisers), and their affiliates under the Advisory Contracts and under separate agreements covering transfer agency, pricing and bookkeeping, and securities lending services for the fund; (ii) the nature and extent of the supervision of third party service providers, principally custodians and subcustodians; and (iii) the resources devoted to, and the record of compliance with, the fund's compliance policies and procedures. The Board also reviewed the allocation of fund brokerage, including allocations to brokers affiliated with the Investment Advisers, the use of brokerage commissions to pay fund expenses, and the use of "soft" commission dollars to pay for research services.
Annual Report
The Board noted that the growth of fund assets over time across the complex allows Fidelity to reinvest in the development of services designed to enhance the value or convenience of the Fidelity funds as investment vehicles. These services include 24-hour access to account information and market information through telephone representatives and over the Internet, investor education materials and asset allocation tools, and the expanded availability of Fidelity Investor Centers.
In 2014, the Board formed an ad hoc Committee on Transfer Agency Fees to review the variety of transfer agency fee structures throughout the industry and Fidelity's competitive positioning with respect to industry participants.
Investment in a Large Fund Family. The Board considered the benefits to shareholders of investing in a Fidelity fund, including the benefits of investing in a fund that is part of a large family of funds offering a variety of investment disciplines and providing a large variety of mutual fund investor services. The Board noted that Fidelity had taken, or had made recommendations that resulted in the Fidelity funds taking, a number of actions over the previous year that benefited particular funds, including (i) continuing to dedicate additional resources to investment research and to the support of the senior management team that oversees asset management; (ii) continuing efforts to enhance Fidelity's global research capabilities; (iii) launching new funds and making other enhancements to meet client needs; (iv) reducing management fees and total expenses for certain index funds and diversified international funds; (v) continuing to launch dedicated lower cost underlying funds to meet portfolio construction needs related to expanding underlying fund options for Fidelity funds of funds, specifically for the Freedom Fund product lines; (vi) rationalizing product lines and gaining increased efficiencies through fund mergers; (vii) launching active fixed-income exchange-traded funds; (viii) continuing to develop, acquire and implement systems and technology to improve services to the funds and information security and to increase efficiency; (ix) implementing investment enhancements to further strengthen Fidelity's target date product line to increase investors' probability of success in achieving their goals; (x) modifying the eligibility criteria for certain share classes to accommodate roll-over assets from employer-sponsored retirement plans; (xi) launching a new Class W of the Freedom Index Funds to attract and retain Fidelity record-kept retirement plan assets; and (xii) implementing changes to Fidelity's money market product line in response to recent money market regulatory reforms.
Investment Performance. The Board considered whether the fund has operated in accordance with its investment objective, as well as its record of compliance with its investment restrictions and its performance history.
Annual Report
Board Approval of Investment Advisory Contracts and
Management Fees - continued
The Board took into account discussions with representatives of the Investment Advisers about fund investment performance that occur at Board meetings throughout the year. In this regard the Board noted that as part of regularly scheduled fund reviews and other reports to the Board on fund performance, the Board considers annualized return information for the fund, for different time periods, measured against a securities market index ("benchmark index") and a peer group of funds with similar objectives ("peer group"), if any. In its evaluation of fund investment performance, the Board gave particular attention to information indicating changes in performance of certain Fidelity funds for specific time periods and discussed with the Investment Advisers the reasons for any overperformance or underperformance.
In addition to reviewing absolute and relative fund performance, the Independent Trustees periodically consider the appropriateness of fund performance metrics in evaluating the results achieved. In general, the Independent Trustees believe that fund performance should be evaluated based on net performance (after fees and expenses) of both the highest performing and lowest performing fund share classes, where applicable, compared to appropriate benchmark indices, over appropriate time periods that may include full market cycles, and compared to peer groups, as applicable, over the same periods, taking into account relevant factors including the following: general market conditions; issuer-specific information; and fund cash flows and other factors.
The Independent Trustees recognize that shareholders evaluate performance on a net basis over their own holding periods, for which one-, three-, and five-year periods are often used as a proxy. For this reason, the performance information reviewed by the Board also included net cumulative calendar year total return information for the fund and an appropriate benchmark index and peer group for the most recent one-, three-, and five-year periods, as shown below. Returns are shown compared to the 25th percentile (top of box, 75% beaten) and 75th percentile (bottom of box, 25% beaten) of the peer universe.
Annual Report
Fidelity Small Cap Growth Fund
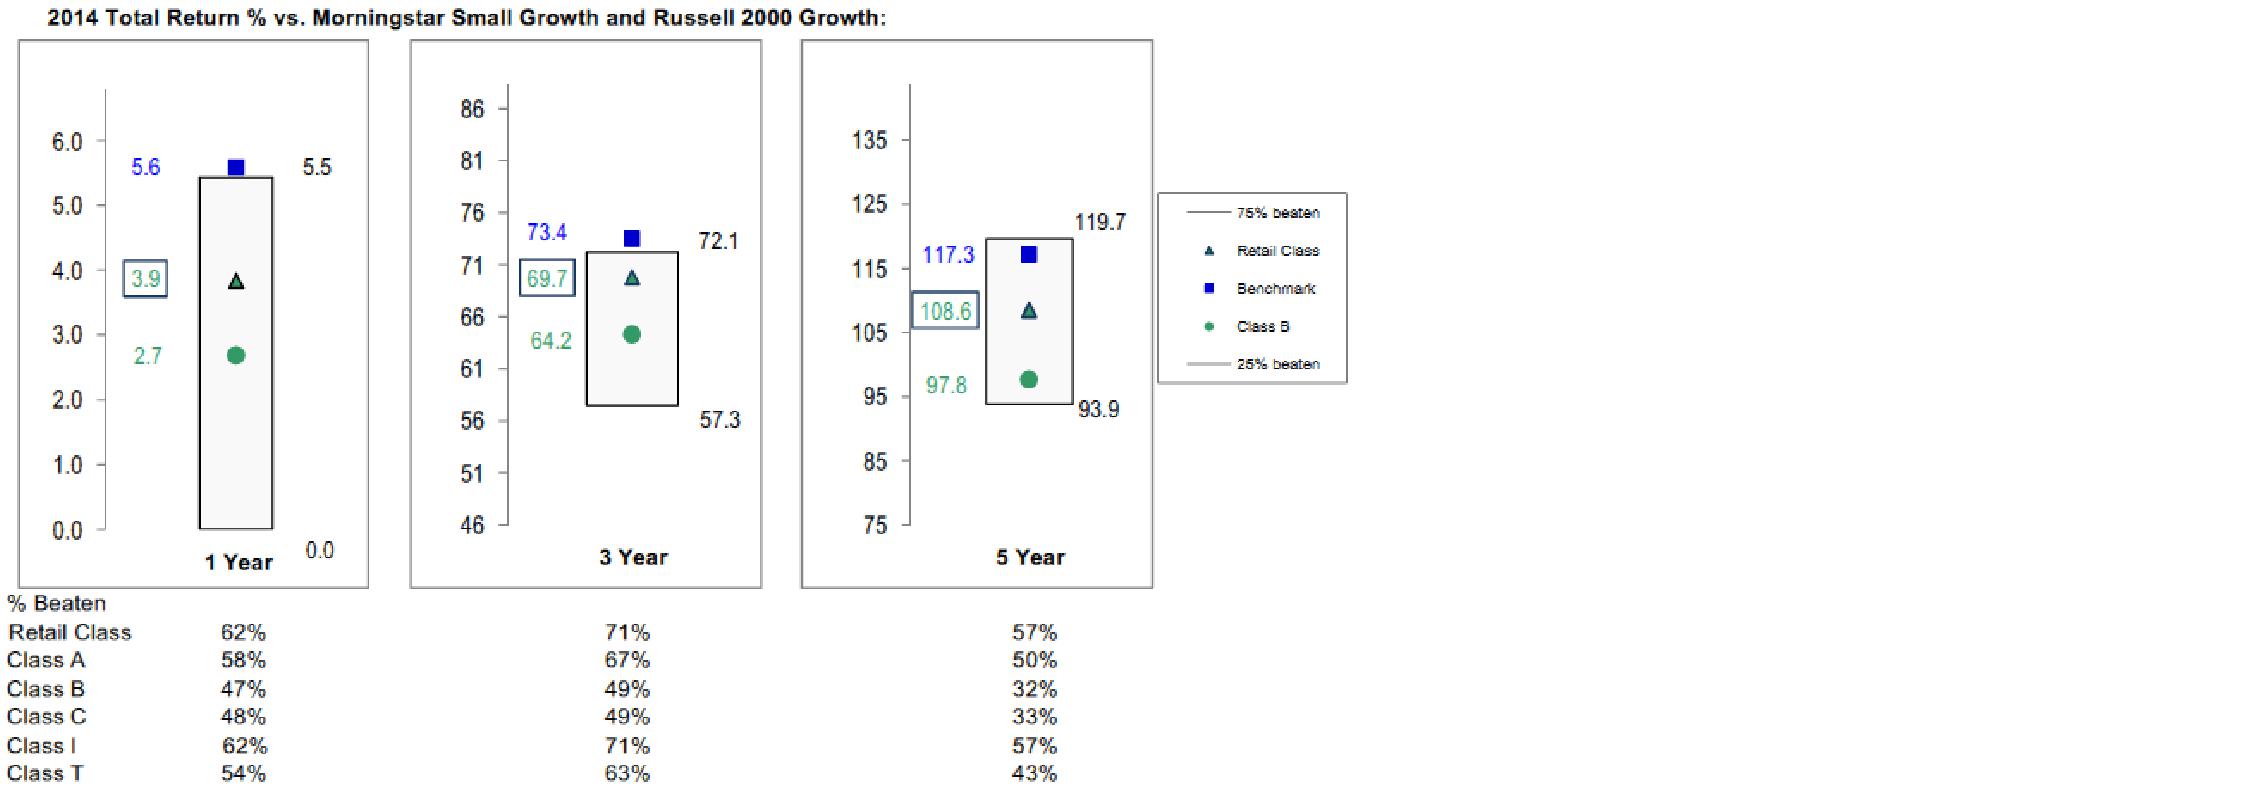
The Board also considered that the fund's management fee is subject to upward or downward adjustment depending upon whether, and to what extent, the fund's investment performance for the performance period exceeds, or is exceeded by, a securities index, thus leading to a performance adjustment for the same period. The Board noted that the performance adjustment provides FMR with a strong economic incentive to seek to achieve superior performance for the fund's shareholders and helps to more closely align the interests of FMR and the shareholders of the fund.
Based on its review, the Board concluded that the nature, extent, and quality of services provided to the fund under the Advisory Contracts should benefit the shareholders of the fund.
Competitiveness of Management Fee and Total Expense Ratio. The Board considered the fund's management fee and total expense ratio compared to "mapped groups" of competitive funds and classes created for the purpose of facilitating the Trustees' competitive analysis of management fees and total expenses. Fidelity creates "mapped groups" by combining similar Lipper investment objective categories that have comparable investment mandates. Combining Lipper investment objective categories aids the Board's management fee and total expense ratio comparisons by broadening the competitive group used for comparison.
Management Fee. The Board considered two proprietary management fee comparisons for the 12-month periods shown in basis points (BP) in the chart below. The group of Lipper funds used by the Board for management fee comparisons is referred to below as the "Total Mapped Group." The Total Mapped Group comparison focuses on a fund's standing in terms of gross management fees before expense reimbursements or caps, and without giving effect to the fund's performance adjustment, relative to the total universe of funds with comparable investment mandates, regardless of whether their management fee structures also are comparable. Funds with comparable investment mandates offer exposure to similar types of securities. Funds with comparable management fee structures have similar management fee contractual arrangements (e.g., flat rate charged for advisory services, all-inclusive fee rate, etc.). "TMG %" represents the percentage of funds in the Total Mapped Group that had management fees that were lower than the fund's. For example, a hypothetical TMG % of 20% would mean that 80% of the funds in the Total Mapped Group had higher, and 20% had lower, management fees than the fund. The fund's actual TMG %s and the number of funds in the Total Mapped Group are in the chart below. The "Asset-Size Peer Group" (ASPG) comparison focuses on a fund's standing relative to a subset of non-Fidelity funds within the Total Mapped Group that are similar in size and management fee structure without taking into account performance adjustments, if any. For example, if a fund is in the first quartile of the ASPG, the fund's management fee ranks in the least expensive or lowest 25% of funds in the ASPG. The ASPG represents at least 15% of the funds in the Total Mapped Group with comparable asset size and management fee structures, subject to a minimum of 50 funds (or all funds in the Total Mapped Group if fewer than 50). Additional information, such as the ASPG quartile in which the fund's management fee rate ranked and the impact of the fund's performance adjustment, is also included in the chart and considered by the Board.
Annual Report
Board Approval of Investment Advisory Contracts and
Management Fees - continued
Fidelity Small Cap Growth Fund
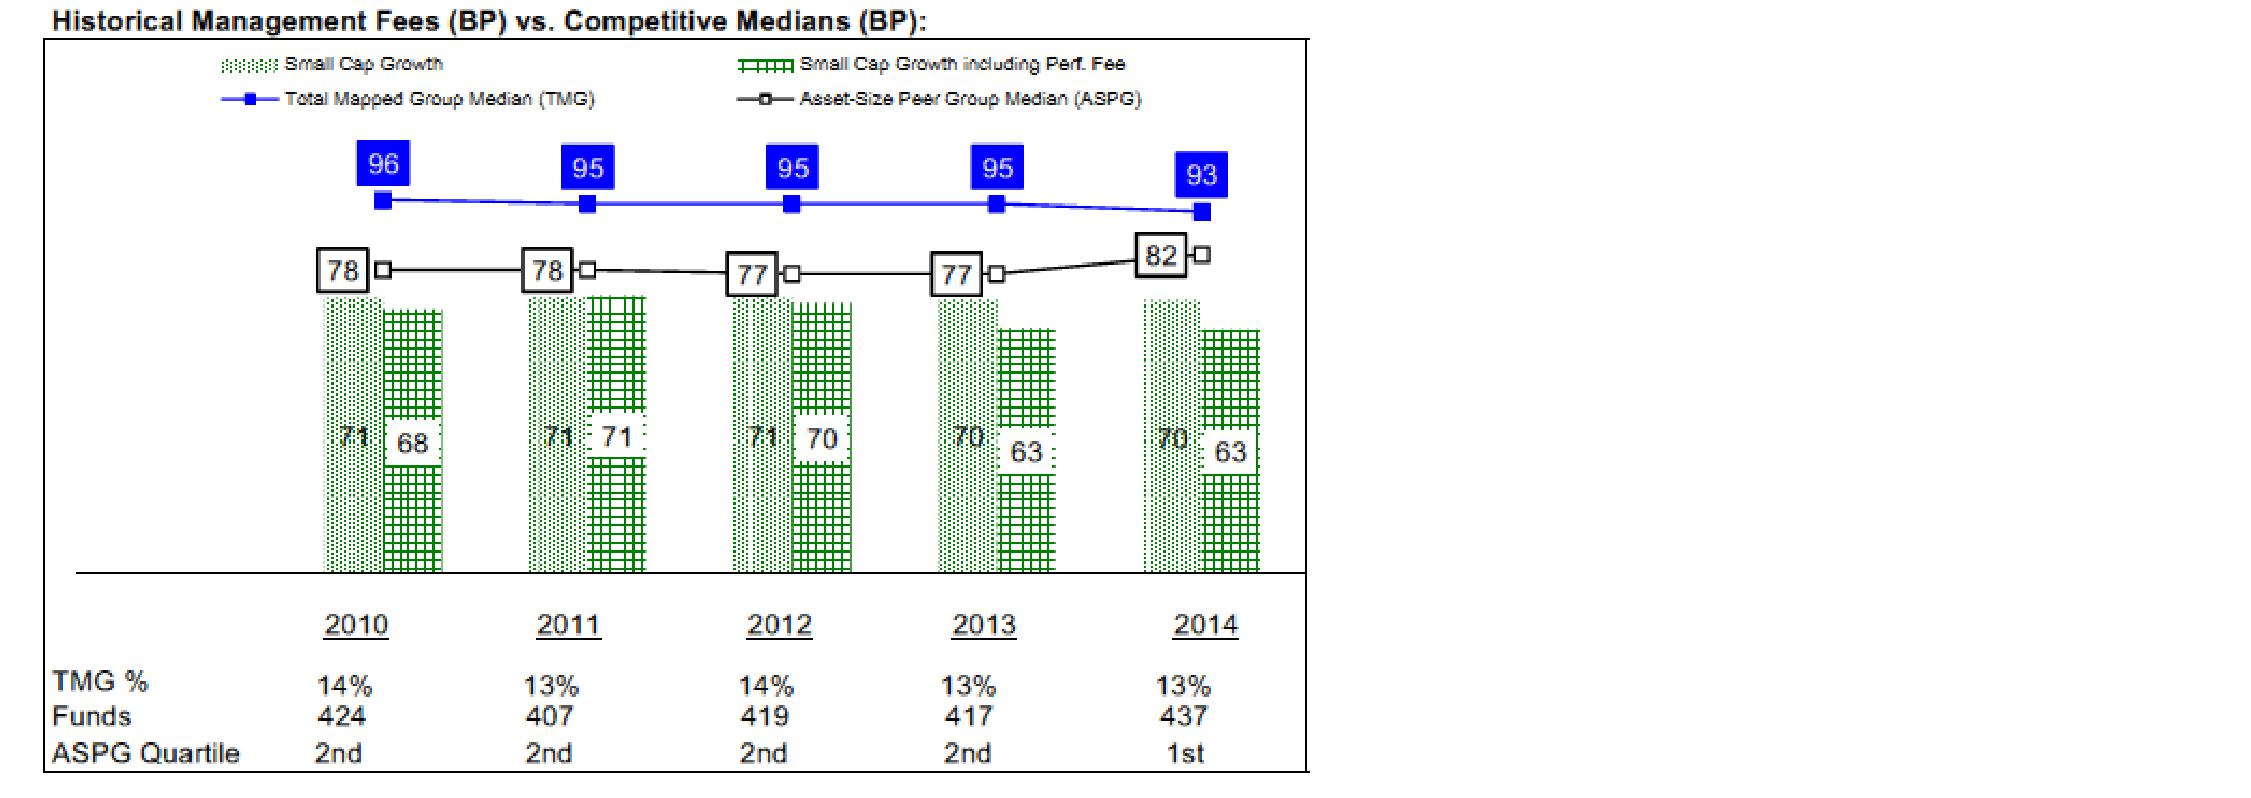
Annual Report
The Board noted that the fund's management fee rate ranked below the median of its Total Mapped Group and below the median of its ASPG for 2014. The Board also noted the effect of the fund's performance adjustment, if any, on the fund's management fee ranking.
The Board noted that, in 2014, the ad hoc Committee on Group Fee was formed by it and other Fidelity fund boards to conduct an in-depth review of the "group fee" component of the management fee of funds with such management fee structures. Committee focus included the mechanics of the group fee, the competitive landscape of group fee structures, Fidelity funds with no group fee component and investment products not included in group fee assets. The Board also considered that, for funds subject to the group fee, FMR agreed to voluntarily waive fees over a specified period of time in amounts designed to account for assets converted from certain funds to certain collective investment trusts.
The Board also noted that, in 2013, the ad hoc Committee on Management Fees was formed to conduct an in-depth review of the management fee rates of Fidelity's active equity mutual funds. The Committee focused on the following areas: (i) standard fee structures; (ii) research consumption and trading evolution; (iii) management fee competitiveness/profitability by category; and (iv) factors that drive institutional pricing.
Based on its review, the Board concluded that the fund's management fee is fair and reasonable in light of the services that the fund receives and the other factors considered.
Total Expense Ratio. In its review of each class's total expense ratio, the Board considered the fund's management fee as well as other fund or class expenses, as applicable, such as transfer agent fees, pricing and bookkeeping fees, fund-paid 12b-1 fees, and custodial, legal, and audit fees. The Board noted the impact of the fund's performance adjustment. The Board also noted that Fidelity may agree to waive fees and expenses from time to time, and the extent to which, if any, it has done so for the fund. As part of its review, the Board also considered the current and historical total expense ratios of each class of the fund compared to competitive fund median expenses. Each class of the fund is compared to those funds and classes in the Total Mapped Group (used by the Board for management fee comparisons) that have a similar sales load structure.
The Board noted that the total expense ratio of each of Class A, Class B, Class C, Class I, and the retail class ranked below its competitive median for 2014 and the total expense ratio of Class T ranked above its competitive median for 2014. The Board considered that, in general, various factors can affect total expense ratios. The Board noted that the total expense ratio of Class T was above the competitive median primarily because of higher 12b-1 fees on Class T as compared to most competitor funds. Class T has a higher 12b-1 fee, but a lower front-end sales charge, than traditionally priced front-end sales charge classes. The Board considered that Class T is primarily sold load-waived in the retirement plan market where its 0.50% 12b-1 fee is comparable to competing no-load, higher 12b-1 fee classes designed specifically for retirement plans. The Board noted that the fund offers multiple classes, each of which has a different sales load and 12b-1 fee structure, and that the multiple structures are intended to offer a range of pricing options for the intermediary market. The Board also noted that the total expense ratios of the classes vary primarily by the level of their 12b-1 fees, although differences in transfer agent fees may also cause expenses to vary from class to class.
Annual Report
Board Approval of Investment Advisory Contracts and
Management Fees - continued
Fees Charged to Other Fidelity Clients. The Board also considered Fidelity fee structures and other information with respect to clients of Fidelity, such as other funds advised or subadvised by Fidelity, pension plan clients, and other institutional clients with similar mandates. The Board noted the findings of the 2013 ad hoc joint committee (created with the board of other Fidelity funds), which reviewed and compared Fidelity's institutional investment advisory business with its business of providing services to the Fidelity funds, including the differences in services provided, fees charged, and costs incurred, as well as competition in their respective marketplaces.
Based on its review of total expense ratios and fees charged to other Fidelity clients, the Board concluded that, although Class T was above the median of the universe presented for comparison, the total expense ratio of each class of the fund was reasonable in light of the services that the fund and its shareholders receive and the other factors considered.
Costs of the Services and Profitability. The Board considered the revenues earned and the expenses incurred by Fidelity in conducting the business of developing, marketing, distributing, managing, administering and servicing the fund and servicing the fund's shareholders. The Board also considered the level of Fidelity's profits in respect of all the Fidelity funds.
On an annual basis, Fidelity presents to the Board information about the profitability of its relationship with the fund. Fidelity calculates profitability information for each fund, as well as aggregate profitability information for groups of Fidelity funds and all Fidelity funds, using a series of detailed revenue and cost allocation methodologies which originate with the books and records of Fidelity on which Fidelity's audited financial statements are based. The Audit Committee of the Board reviews any significant changes from the prior year's methodologies.
PricewaterhouseCoopers LLP (PwC), independent registered public accounting firm and auditor to Fidelity and certain Fidelity funds, has been engaged annually by the Board as part of the Board's assessment of Fidelity's profitability analysis. PwC's engagement includes the review and assessment of the methodologies used by Fidelity in determining the revenues and expenses attributable to Fidelity's mutual fund business, and completion of agreed-upon procedures in respect of the mathematical accuracy of fund profitability and its conformity to established allocation methodologies. After considering PwC's reports issued under the engagement and information provided by Fidelity, the Board concluded that while other allocation methods may also be reasonable, Fidelity's profitability methodologies are reasonable in all material respects.
Annual Report
The Board also reviewed Fidelity's non-fund businesses and fall-out benefits related to the mutual fund business as well as cases where Fidelity's affiliates may benefit from or be related to the fund's business.
The Board considered the costs of the services provided by and the profits realized by Fidelity in connection with the operation of the fund and was satisfied that the profitability was not excessive.
Economies of Scale. The Board considered whether there have been economies of scale in respect of the management of the Fidelity funds, whether the Fidelity funds (including the fund) have appropriately benefited from any such economies of scale, and whether there is potential for realization of any further economies of scale. The Board considered the extent to which the fund will benefit from economies of scale as assets grow through increased services to the fund, through waivers or reimbursements, or through fee or expense ratio reductions. The Board also noted that in 2013, it and the boards of other Fidelity funds created an ad hoc committee (the Economies of Scale Committee) to analyze whether Fidelity attains economies of scale in respect of the management and servicing of the Fidelity funds, whether the Fidelity funds have appropriately benefited from such economies of scale, and whether there is potential for realization of any further economies of scale.
The Board recognized that the fund's management contract incorporates a "group fee" structure, which provides for lower group fee rates as total group assets increase, and for higher group fee rates as total group assets decrease (with "group assets" defined to include fund assets under FMR's management plus sector fund assets previously under FMR's management and currently managed by Fidelity SelectCo, LLC). FMR calculates the group fee rates based on a tiered asset "breakpoint" schedule that varies based on asset class. The Board considered that the group fee is designed to deliver the benefits of economies of scale to fund shareholders when total Fidelity fund assets increase, even if assets of any particular fund are unchanged or have declined, because some portion of Fidelity's costs are attributable to services provided to all Fidelity funds, and all funds benefit if those costs can be allocated among more assets. The Board concluded that, given the group fee structure, fund shareholders will benefit from lower management fees as group assets increase at the fund complex level, regardless of whether Fidelity achieves any such economies of scale.
The Board concluded, taking into account the analysis of the Economies of Scale Committee, that economies of scale, if any, are being appropriately shared between fund shareholders and Fidelity.
Annual Report
Board Approval of Investment Advisory Contracts and
Management Fees - continued
Additional Information Requested by the Board. In order to develop fully the factual basis for consideration of the Fidelity funds' Advisory Contracts, the Board requested and received additional information on certain topics, including: (i) fund performance trends and Fidelity's long-term strategies for certain funds; (ii) the various share classes employed by Fidelity and the attributes of each class, together with similar information on the distribution and servicing payments made by Fidelity or the funds to third-party participants in the distribution channels; (iii) fund profitability, and fund performance in relation to fund profitability; (iv) the methodology with respect to evaluating competitive fund data and peer group classifications and fee comparisons; (v) annual fund profitability margins, with particular focus on certain funds with negative margins; (vi) the realization of fall-out benefits in certain Fidelity business units; (vii) economies of scale and the way in which they are shared with fund shareholders; (viii) Fidelity's group fee structures, including the group fee schedule of breakpoints; (ix) the impact of cost containment measures on the funds; and (x) the transfer agent fee structure.
Based on its evaluation of all of the conclusions noted above, and after considering all factors it believed relevant, the Board concluded that the advisory fee structures are fair and reasonable, and that the fund's Advisory Contracts should be renewed.
Annual Report
Investment Adviser
Fidelity Management & Research Company
Boston, MA
Investment Sub-Advisers
FMR Co., Inc.
FMR Investment Management
(U.K.) Limited
Fidelity Management & Research
(Hong Kong) Limited
Fidelity Management & Research
(Japan) Limited
General Distributor
Fidelity Distributors Corporation
Smithfield, RI
Transfer and Service Agents
Fidelity Investments Institutional
Operations Company, Inc.
Boston, MA
Fidelity Service Company, Inc.
Boston, MA
Custodian
Brown Brothers Harriman & Co.
Boston, MA
(Fidelity Investment logo)(registered trademark)
ASCP-UANN-0915
1.803713.110
(Fidelity Investment logo)(registered trademark)
Fidelity Advisor®
Small Cap Growth
Fund - Class I
(formerly Institutional Class)
Annual Report
July 31, 2015
(Fidelity Cover Art)
Class I
is a class of Fidelity®
Small Cap Growth
Fund
Contents
Performance | (Click Here) | How the fund has done over time. |
Management's Discussion of Fund Performance | (Click Here) | The Portfolio Manager's review of fund performance and strategy. |
Shareholder Expense Example | (Click Here) | An example of shareholder expenses. |
Investment Changes | (Click Here) | A summary of major shifts in the fund's investments over the past six months. |
Investments | (Click Here) | A complete list of the fund's investments with their market values. |
Financial Statements | (Click Here) | Statements of assets and liabilities, operations, and changes in net assets, as well as financial highlights. |
Notes | (Click Here) | Notes to the financial statements. |
Report of Independent Registered Public Accounting Firm | (Click Here) | |
Trustees and Officers | (Click Here) | |
Distributions | (Click Here) | |
Board Approval of Investment Advisory Contracts and Management Fees | (Click Here) | |
To view a fund's proxy voting guidelines and proxy voting record for the 12-month period ended June 30, visit http://www.fidelity.com/proxyvotingresults or visit the Securities and Exchange Commission's (SEC) web site at http://www.sec.gov. You may also call 1-877-208-0098 to request a free copy of the proxy voting guidelines.
Standard & Poor's, S&P and S&P 500 are registered service marks of The McGraw-Hill Companies, Inc. and have been licensed for use by Fidelity Distributors Corporation.
Other third-party marks appearing herein are the property of their respective owners.
All other marks appearing herein are registered or unregistered trademarks or service marks of FMR LLC or an affiliated company. © 2015 FMR LLC. All rights reserved.
Annual Report
This report and the financial statements contained herein are submitted for the general information of the shareholders of the fund. This report is not authorized for distribution to prospective investors in the fund unless preceded or accompanied by an effective prospectus.
A fund files its complete schedule of portfolio holdings with the SEC for the first and third quarters of each fiscal year on Form N-Q. Forms N-Q are available on the SEC's web site at http://www.sec.gov. A fund's Forms N-Q may be reviewed and copied at the SEC's Public Reference Room in Washington, DC. Information regarding the operation of the SEC's Public Reference Room may be obtained by calling 1-800-SEC-0330. For a complete list of a fund's portfolio holdings, view the most recent holdings listing, semiannual report, or annual report on Fidelity's web site at http://www.fidelity.com, http://www.advisor.fidelity.com, or http://www.401k.com, as applicable.
NOT FDIC INSURED • MAY LOSE VALUE • NO BANK GUARANTEE
Neither the fund nor Fidelity Distributors Corporation is a bank.
Annual Report
Average annual total return reflects the change in the value of an investment, assuming reinvestment of the class' distributions from dividend income and capital gains (the profits earned upon the sale of securities that have grown in value, if any) and assuming a constant rate of performance each year. The $10,000 table and the fund's returns do not reflect the deduction of taxes that a shareholder would pay on fund distributions or the redemption of fund shares. During periods of reimbursement by Fidelity, a fund's total return will be greater than it would be had the reimbursement not occurred. How a fund did yesterday is no guarantee of how it will do tomorrow.
Average Annual Total Returns
Periods ended July 31, 2015 | Past 1
year | Past 5
years | Past 10
Years |
Class I | 24.85% | 18.41% | 9.67% |
$10,000 Over 10 Years
Let's say hypothetically that $10,000 was invested in Fidelity Advisor® Small Cap Growth Fund - Class I on July 31, 2005. The chart shows how the value of your investment would have changed, and also shows how the Russell 2000® Growth Index performed over the same period.
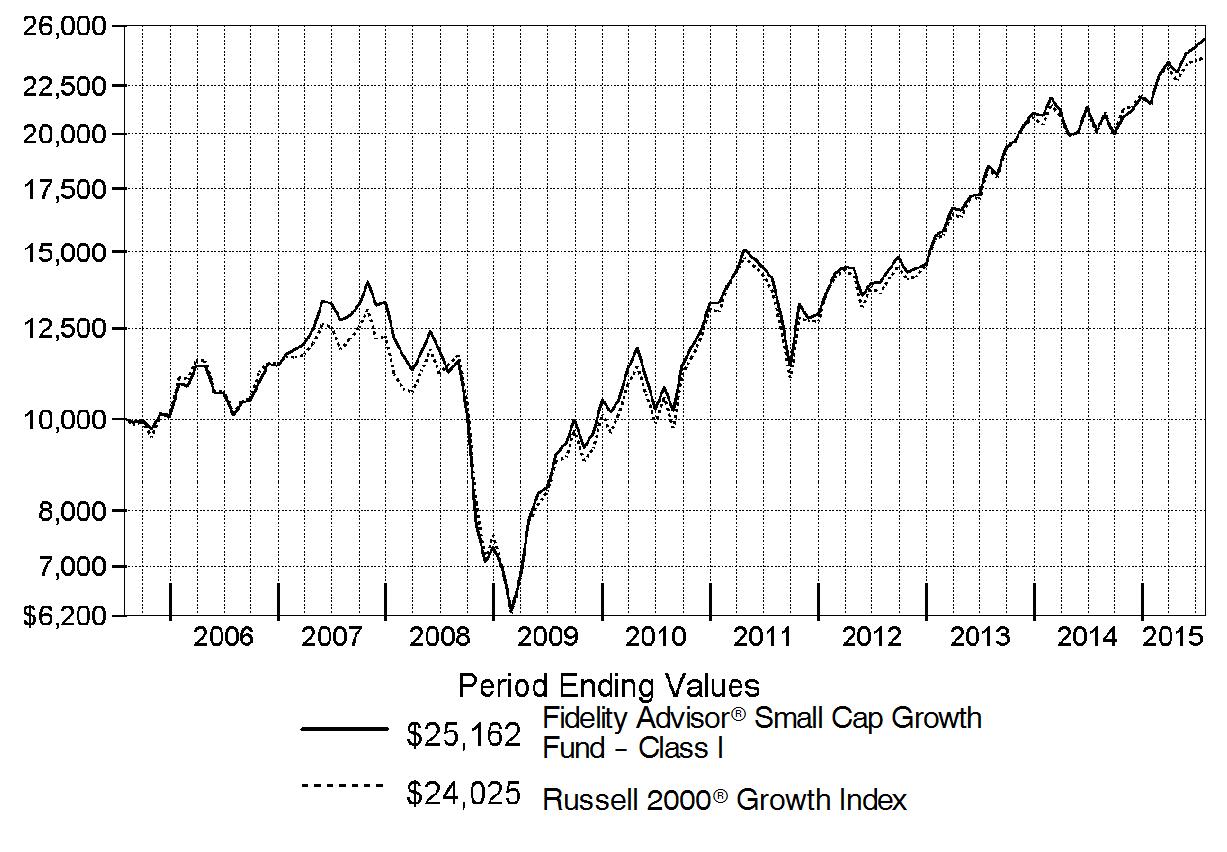
Annual Report
Market Recap: The U.S. equity market gained strongly for the 12 months ending July 31, 2015, as stocks recovered from volatility in late 2014 and early 2015, supported by a still-positive economic backdrop. The S&P 500® Index returned 11.21%, with growth stocks in the index far outpacing value-oriented names on prospects for continued U.S. economic growth. Consequently, the growth-oriented Nasdaq Composite Index® rose 18.71%, outpacing the broader S&P 500®, as well as the 12.03% advance of the smaller-cap Russell 2000® Index. Within the S&P 500®, seven of 10 sectors notched a gain, with significant performance variation. Health care (+27%) led the way, aided by merger activity. Consumer discretionary (+24%) benefited from spending linked to a seven-year low in unemployment. Strong first halves for the consumer staples sector and the real estate segment of financials yielded above-market returns (19% and 12%, respectively) for the full-year period. Conversely, energy (-26%) significantly lagged, due to a roughly 55% decline for U.S. crude-oil prices. Materials (-4%) also lost ground. At period end, investors remained focused on the slowing rate of U.S. earnings growth, the possible effect of a relatively stronger U.S. dollar on exports and inflation, and whether an economic slowdown in China would create ripples for the global economy.
Comments from Portfolio Manager Patrick Venanzi: For the year, the fund's share classes easily outperformed the 20.07% return of the benchmark Russell 2000® Growth Index. (For specific class-level results, please see the Performance section of this report.) Security selection was the main driver behind relative results. Picks within consumer discretionary and information technology helped. The top individual contributor was an overweighting in 2U, which provides cloud-based online campuses and learning platforms for nonprofit colleges and universities. The company had consecutive quarters of good earnings results, with the stock jumping in March when Yale University announced it would partner with 2U on building an online degree program. Shares rose again in May after the firm announced first-quarter financial results that beat expectations, and increased guidance for full-year 2015 results. Conversely, we were hurt by a non-index stake in Accretive Health, a provider of revenue cycle management solutions for hospitals. First, shares tumbled in December 2014 after the firm released disappointing 2013 financial results. Then in July, key client Ascension Health offered to buy the firm below its current value. Accretive reported it was searching for "strategic alternatives" and that it would not renew its contract with Ascension - a major source of the firm's 2014 revenue. The stock subsequently plunged.
The views expressed above reflect those of the portfolio manager(s) only through the end of the period as stated on the cover of this report and do not necessarily represent the views of Fidelity or any other person in the Fidelity organization. Any such views are subject to change at any time based upon market or other conditions and Fidelity disclaims any responsibility to update such views. These views may not be relied on as investment advice and, because investment decisions for a Fidelity fund are based on numerous factors, may not be relied on as an indication of trading intent on behalf of any Fidelity fund.
Annual Report
Shareholder Expense Example
As a shareholder of the Fund, you incur two types of costs: (1) transaction costs, including sales charges (loads) on purchase payments or redemption proceeds, redemption fees and (2) ongoing costs, including management fees, distribution and/or service (12b-1) fees and other Fund expenses. This Example is intended to help you understand your ongoing costs (in dollars) of investing in the Fund and to compare these costs with the ongoing costs of investing in other mutual funds.
The Example is based on an investment of $1,000 invested at the beginning of the period and held for the entire period (February 1, 2015 to July 31, 2015).
Actual Expenses
The first line of the accompanying table for each class of the Fund provides information about actual account values and actual expenses. You may use the information in this line, together with the amount you invested, to estimate the expenses that you paid over the period. Simply divide your account value by $1,000.00 (for example, an $8,600 account value divided by $1,000.00 = 8.6), then multiply the result by the number in the first line for a class of the Fund under the heading entitled "Expenses Paid During Period" to estimate the expenses you paid on your account during this period. A small balance maintenance fee of $12.00 that is charged once a year may apply for certain accounts with a value of less than $2,000. This fee is not included in the table below. If it was, the estimate of expenses you paid during the period would be higher, and your ending account value lower, by this amount. In addition, the Fund, as a shareholder in the underlying Fidelity Central Funds, will indirectly bear its pro-rata share of the fees and expenses incurred by the underlying Fidelity Central Funds. These fees and expenses are not included in the Fund's annualized expense ratio used to calculate the expense estimate in the table below.
Hypothetical Example for Comparison Purposes
The second line of the accompanying table for each class of the Fund provides information about hypothetical account values and hypothetical expenses based on a Class' actual expense ratio and an assumed rate of return of 5% per year before expenses, which is not the Class' actual return. The hypothetical account values and expenses may not be used to estimate the actual ending account balance or expenses you paid for the period. You may use this information to compare the ongoing costs of investing in the Fund and other funds. To do so, compare this 5% hypothetical example with the 5% hypothetical examples that appear in the shareholder reports of the other funds. A small balance maintenance fee of $12.00 that is charged once a year may apply for certain accounts with a value of less than $2,000. This fee is not included in the table below. If it was, the estimate of expenses you paid during the period would be higher, and your ending account value lower, by this amount. In addition, the Fund, as a shareholder in the underlying Fidelity Central Funds, will indirectly bear its pro-rata share of the fees and expenses incurred by the underlying Fidelity Central Funds. These fees and expenses are not included in the Fund's annualized expense ratio used to calculate the expense estimate in the table below.
Please note that the expenses shown in the table are meant to highlight your ongoing costs only and do not reflect any transaction costs. Therefore, the second line of the table is useful in comparing ongoing costs only, and will not help you determine the relative total costs of owning different funds. In addition, if these transactional costs were included, your costs would have been higher.
Annual Report
Shareholder Expense Example - continued
| Annualized
Expense Ratio B | Beginning
Account Value
February 1, 2015 | Ending
Account Value
July 31, 2015 | Expenses Paid
During Period*
February 1, 2015
to July 31, 2015 |
Class A | 1.26% | | | |
Actual | | $ 1,000.00 | $ 1,165.60 | $ 6.77 |
Hypothetical A | | $ 1,000.00 | $ 1,018.55 | $ 6.31 |
Class T | 1.54% | | | |
Actual | | $ 1,000.00 | $ 1,164.10 | $ 8.26 |
HypotheticalA | | $ 1,000.00 | $ 1,017.16 | $ 7.70 |
Class B | 2.09% | | | |
Actual | | $ 1,000.00 | $ 1,161.50 | $ 11.20 |
Hypothetical A | | $ 1,000.00 | $ 1,014.43 | $ 10.44 |
Class C | 2.05% | | | |
Actual | | $ 1,000.00 | $ 1,161.60 | $ 10.99 |
Hypothetical A | | $ 1,000.00 | $ 1,014.63 | $ 10.24 |
Small Cap Growth | .97% | | | |
Actual | | $ 1,000.00 | $ 1,168.00 | $ 5.21 |
HypotheticalA | | $ 1,000.00 | $ 1,019.98 | $ 4.86 |
Class I | .97% | | | |
Actual | | $ 1,000.00 | $ 1,167.70 | $ 5.21 |
HypotheticalA | | $ 1,000.00 | $ 1,019.98 | $ 4.86 |
A 5% return per year before expenses
B Annualized expense ratio reflects expenses net of applicable fee waivers.
* Expenses are equal to each Class' annualized expense ratio, multiplied by the average account value over the period, multiplied by 181/365 (to reflect the one-half year period).
Annual Report
Investment Changes (Unaudited)
Top Ten Stocks as of July 31, 2015 |
| % of fund's
net assets | % of fund's net assets
6 months ago |
2U, Inc. | 2.4 | 1.3 |
Global Payments, Inc. | 1.4 | 1.8 |
Huron Consulting Group, Inc. | 1.4 | 1.7 |
G-III Apparel Group Ltd. | 1.3 | 1.6 |
Vail Resorts, Inc. | 1.2 | 1.4 |
Gartner, Inc. Class A | 1.2 | 1.6 |
Mentor Graphics Corp. | 1.2 | 0.0 |
Starz Series A | 1.2 | 0.0 |
Deluxe Corp. | 1.2 | 0.0 |
Universal Electronics | 1.1 | 1.2 |
| 13.6 | |
Top Five Market Sectors as of July 31, 2015 |
| % of fund's
net assets | % of fund's net assets
6 months ago |
Health Care | 29.2 | 26.3 |
Information Technology | 24.4 | 26.3 |
Consumer Discretionary | 17.3 | 17.5 |
Industrials | 14.5 | 14.0 |
Financials | 5.3 | 7.3 |
Asset Allocation (% of fund's net assets) |
As of July 31, 2015* | As of January 31, 2015** |
 | Stocks 96.0% | |  | Stocks 97.5% | |
 | Other Investments 1.9% | |  | Other Investments 1.2% | |
 | Short-Term
Investments and
Net Other Assets (Liabilities) 2.1% | |  | Short-Term
Investments and
Net Other Assets (Liabilities) 1.3% | |
* Foreign investments | 3.6% | | ** Foreign investments | 3.1% | |

Annual Report
Investments July 31, 2015
Showing Percentage of Net Assets
Common Stocks - 96.0% |
| Shares | | Value |
CONSUMER DISCRETIONARY - 17.3% |
Auto Components - 0.7% |
Tenneco, Inc. (a) | 145,400 | | $ 7,242,374 |
Visteon Corp. (a) | 54,100 | | 5,384,573 |
| | 12,626,947 |
Diversified Consumer Services - 3.2% |
2U, Inc. (a)(d) | 1,274,330 | | 40,893,251 |
Service Corp. International | 429,100 | | 13,091,841 |
| | 53,985,092 |
Hotels, Restaurants & Leisure - 3.1% |
Churchill Downs, Inc. | 22,055 | | 2,978,748 |
DineEquity, Inc. | 110,000 | | 11,441,100 |
Domino's Pizza, Inc. | 80,000 | | 9,107,200 |
Vail Resorts, Inc. | 190,800 | | 20,928,852 |
Wingstop, Inc. (d) | 230,800 | | 7,911,824 |
| | 52,367,724 |
Household Durables - 2.3% |
Libbey, Inc. | 124,998 | | 4,651,176 |
Tempur Sealy International, Inc. (a) | 210,000 | | 15,865,500 |
Universal Electronics, Inc. (a) | 364,209 | | 18,880,595 |
| | 39,397,271 |
Internet & Catalog Retail - 0.4% |
HSN, Inc. | 85,615 | | 6,293,559 |
Leisure Products - 0.7% |
Malibu Boats, Inc. Class A (a) | 369,100 | | 7,127,321 |
Vista Outdoor, Inc. (a) | 90,000 | | 4,245,300 |
| | 11,372,621 |
Media - 4.7% |
AMC Networks, Inc. Class A (a) | 175,019 | | 14,740,100 |
Crown Media Holdings, Inc. Class A (a) | 7,275 | | 32,519 |
Gray Television, Inc. (a) | 250,000 | | 4,222,500 |
IMAX Corp. (a) | 310,000 | | 11,597,100 |
Live Nation Entertainment, Inc. (a) | 455,200 | | 11,935,344 |
Nexstar Broadcasting Group, Inc. Class A | 280,000 | | 16,060,800 |
Starz Series A (a) | 493,945 | | 19,980,075 |
| | 78,568,438 |
Specialty Retail - 0.5% |
Asbury Automotive Group, Inc. (a) | 90,000 | | 7,947,000 |
Common Stocks - continued |
| Shares | | Value |
CONSUMER DISCRETIONARY - continued |
Textiles, Apparel & Luxury Goods - 1.7% |
G-III Apparel Group Ltd. (a) | 301,800 | | $ 21,799,014 |
Unifi, Inc. (a) | 200,000 | | 6,172,000 |
| | 27,971,014 |
TOTAL CONSUMER DISCRETIONARY | | 290,529,666 |
CONSUMER STAPLES - 1.5% |
Food Products - 0.9% |
Pinnacle Foods, Inc. | 330,000 | | 14,833,500 |
Household Products - 0.6% |
Spectrum Brands Holdings, Inc. | 95,000 | | 10,065,250 |
TOTAL CONSUMER STAPLES | | 24,898,750 |
ENERGY - 0.8% |
Energy Equipment & Services - 0.5% |
Dril-Quip, Inc. (a) | 83,900 | | 4,900,599 |
Superior Drilling Products, Inc. (a)(e) | 1,168,655 | | 1,928,281 |
Xtreme Drilling & Coil Services Corp. (a) | 1,289,000 | | 2,552,670 |
| | 9,381,550 |
Oil, Gas & Consumable Fuels - 0.3% |
StealthGas, Inc. (a) | 890,400 | | 5,012,952 |
TOTAL ENERGY | | 14,394,502 |
FINANCIALS - 5.3% |
Banks - 1.7% |
Investors Bancorp, Inc. | 1,000,000 | | 12,180,000 |
Pacific Premier Bancorp, Inc. (a) | 899,977 | | 17,108,563 |
| | 29,288,563 |
Capital Markets - 0.4% |
E*TRADE Financial Corp. (a) | 250,200 | | 7,110,684 |
Consumer Finance - 0.5% |
PRA Group, Inc. (a)(d) | 120,493 | | 7,657,330 |
Insurance - 1.3% |
AmTrust Financial Services, Inc. | 100,000 | | 6,951,000 |
First American Financial Corp. | 370,000 | | 15,014,600 |
| | 21,965,600 |
Common Stocks - continued |
| Shares | | Value |
FINANCIALS - continued |
Real Estate Investment Trusts - 0.5% |
Colony Financial, Inc. | 380,000 | | $ 8,633,600 |
Thrifts & Mortgage Finance - 0.9% |
Meridian Bancorp, Inc. (a) | 1,094,070 | | 14,266,673 |
TOTAL FINANCIALS | | 88,922,450 |
HEALTH CARE - 29.2% |
Biotechnology - 11.8% |
Alder Biopharmaceuticals, Inc. (a) | 100,000 | | 4,642,000 |
Amicus Therapeutics, Inc. (a) | 520,000 | | 8,938,800 |
Anacor Pharmaceuticals, Inc. (a) | 105,000 | | 15,664,950 |
BioCryst Pharmaceuticals, Inc. (a) | 250,000 | | 3,870,000 |
Cara Therapeutics, Inc. (a) | 102,517 | | 2,184,637 |
Celldex Therapeutics, Inc. (a)(d) | 293,400 | | 6,909,570 |
Cellectis SA sponsored ADR | 104,100 | | 3,696,591 |
Cepheid, Inc. (a) | 56,938 | | 3,165,183 |
Chimerix, Inc. (a) | 210,100 | | 11,290,774 |
Clovis Oncology, Inc. (a) | 80,000 | | 6,754,400 |
Coherus BioSciences, Inc. | 48,424 | | 1,698,714 |
Curis, Inc. (a) | 1,007,700 | | 3,164,178 |
DBV Technologies SA sponsored ADR (a) | 129,022 | | 5,624,069 |
Dyax Corp. (a) | 440,400 | | 10,838,244 |
Dynavax Technologies Corp. (a) | 160,000 | | 4,705,600 |
Halozyme Therapeutics, Inc. (a) | 285,137 | | 6,655,098 |
Heron Therapeutics, Inc. (a) | 175,000 | | 5,659,500 |
Insmed, Inc. (a) | 223,400 | | 6,054,140 |
Intercept Pharmaceuticals, Inc. (a) | 31,600 | | 8,336,396 |
La Jolla Pharmaceutical Co. (a)(d) | 152,622 | | 4,639,709 |
Lion Biotechnologies, Inc. (a)(d) | 410,000 | | 3,509,600 |
Mirati Therapeutics, Inc. (a) | 169,700 | | 4,855,117 |
Novavax, Inc. (a) | 1,239,903 | | 14,953,230 |
Otonomy, Inc. | 135,500 | | 3,491,835 |
Portola Pharmaceuticals, Inc. (a) | 140,000 | | 6,921,600 |
ProNai Therapeutics, Inc. | 7,331 | | 200,869 |
Receptos, Inc. (a) | 50,100 | | 11,415,786 |
Repligen Corp. (a) | 148,489 | | 5,198,600 |
TESARO, Inc. (a) | 110,000 | | 6,380,000 |
Threshold Pharmaceuticals, Inc. (a)(d) | 669,900 | | 2,893,968 |
Ultragenyx Pharmaceutical, Inc. (a) | 110,000 | | 13,302,300 |
XOMA Corp. (a)(d) | 570,634 | | 416,905 |
| | 198,032,363 |
Common Stocks - continued |
| Shares | | Value |
HEALTH CARE - continued |
Health Care Equipment & Supplies - 7.2% |
Align Technology, Inc. (a) | 100,000 | | $ 6,270,000 |
Atricure, Inc. (a) | 310,000 | | 8,614,900 |
CONMED Corp. | 150,000 | | 8,508,000 |
Cyberonics, Inc. (a) | 151,122 | | 9,278,891 |
Entellus Medical, Inc. | 124,976 | | 2,811,960 |
Globus Medical, Inc. (a) | 250,000 | | 7,015,000 |
Hologic, Inc. (a) | 245,000 | | 10,206,700 |
ICU Medical, Inc. (a) | 100,008 | | 9,992,799 |
Inogen, Inc. (a) | 160,000 | | 7,113,600 |
LDR Holding Corp. (a) | 133,755 | | 6,080,502 |
Nevro Corp. | 216,200 | | 10,976,474 |
NxStage Medical, Inc. (a) | 650,300 | | 9,286,284 |
Teleflex, Inc. | 75,000 | | 10,049,250 |
Wright Medical Group, Inc. (a) | 575,000 | | 14,858,000 |
| | 121,062,360 |
Health Care Providers & Services - 6.9% |
Aceto Corp. | 300,000 | | 7,029,000 |
AMN Healthcare Services, Inc. (a) | 410,300 | | 12,075,129 |
BioTelemetry, Inc. (a) | 192,018 | | 2,348,380 |
Civitas Solutions, Inc. | 303,757 | | 6,831,495 |
HealthEquity, Inc. (a) | 200,000 | | 6,732,000 |
HealthSouth Corp. | 380,000 | | 17,366,000 |
LHC Group, Inc. (a) | 150,000 | | 6,043,500 |
Molina Healthcare, Inc. (a) | 125,000 | | 9,428,750 |
Surgical Care Affiliates, Inc. (a) | 410,000 | | 15,588,200 |
Team Health Holdings, Inc. (a) | 244,200 | | 16,461,522 |
Teladoc, Inc. (a) | 145,000 | | 4,577,650 |
VCA, Inc. (a) | 190,000 | | 11,690,700 |
| | 116,172,326 |
Health Care Technology - 1.4% |
athenahealth, Inc. (a)(d) | 110,557 | | 15,473,558 |
Omnicell, Inc. (a) | 60,478 | | 2,208,657 |
Press Ganey Holdings, Inc. | 177,059 | | 5,543,717 |
| | 23,225,932 |
Life Sciences Tools & Services - 0.7% |
Bruker Corp. (a) | 521,500 | | 10,977,575 |
Fluidigm Corp. (a) | 90,000 | | 1,802,700 |
| | 12,780,275 |
Common Stocks - continued |
| Shares | | Value |
HEALTH CARE - continued |
Pharmaceuticals - 1.2% |
Aratana Therapeutics, Inc. (a) | 360,000 | | $ 6,343,200 |
Cardiome Pharma Corp. (a) | 248,819 | | 2,256,788 |
Ocular Therapeutix, Inc. | 132,500 | | 3,059,425 |
Prestige Brands Holdings, Inc. (a) | 100,000 | | 4,762,000 |
SCYNEXIS, Inc. (a) | 400,000 | | 3,180,000 |
| | 19,601,413 |
TOTAL HEALTH CARE | | 490,874,669 |
INDUSTRIALS - 14.5% |
Aerospace & Defense - 1.7% |
Aerojet Rocketdyne Holdings, Inc. (a) | 367,491 | | 8,602,964 |
Huntington Ingalls Industries, Inc. | 65,000 | | 7,631,650 |
Teledyne Technologies, Inc. (a) | 123,000 | | 12,751,410 |
| | 28,986,024 |
Building Products - 1.2% |
A.O. Smith Corp. | 130,000 | | 9,336,600 |
Universal Forest Products, Inc. | 170,000 | | 10,795,000 |
| | 20,131,600 |
Commercial Services & Supplies - 4.6% |
Deluxe Corp. | 310,000 | | 19,973,300 |
KAR Auction Services, Inc. | 300,000 | | 11,679,000 |
Knoll, Inc. | 687,500 | | 16,637,500 |
Matthews International Corp. Class A | 160,018 | | 8,616,969 |
Multi-Color Corp. | 161,900 | | 10,338,934 |
West Corp. | 365,000 | | 10,530,250 |
| | 77,775,953 |
Electrical Equipment - 1.3% |
AZZ, Inc. | 175,000 | | 9,056,250 |
Babcock & Wilcox Enterprises, Inc. (a) | 9,500 | | 187,340 |
BWX Technologies, Inc. | 531,000 | | 13,041,360 |
| | 22,284,950 |
Machinery - 1.1% |
Hillenbrand, Inc. | 260,000 | | 7,373,600 |
Mueller Industries, Inc. | 343,400 | | 11,115,858 |
| | 18,489,458 |
Professional Services - 4.0% |
Advisory Board Co. (a) | 150,000 | | 8,985,000 |
CBIZ, Inc. (a) | 1,316,100 | | 12,897,780 |
Common Stocks - continued |
| Shares | | Value |
INDUSTRIALS - continued |
Professional Services - continued |
Exponent, Inc. | 255,000 | | $ 11,344,950 |
GP Strategies Corp. (a) | 350,557 | | 10,057,480 |
Huron Consulting Group, Inc. (a) | 301,200 | | 23,032,764 |
| | 66,317,974 |
Road & Rail - 0.6% |
Swift Transporation Co. (a) | 400,000 | | 9,528,000 |
TOTAL INDUSTRIALS | | 243,513,959 |
INFORMATION TECHNOLOGY - 24.4% |
Communications Equipment - 1.2% |
CommScope Holding Co., Inc. (a) | 340,000 | | 10,665,800 |
Infinera Corp. (a) | 358,377 | | 8,579,545 |
| | 19,245,345 |
Electronic Equipment & Components - 1.3% |
IPG Photonics Corp. (a)(d) | 47,300 | | 4,362,006 |
Jabil Circuit, Inc. | 150,000 | | 3,037,500 |
RealD, Inc. (a) | 1,092,300 | | 13,708,365 |
| | 21,107,871 |
Internet Software & Services - 3.2% |
comScore, Inc. (a) | 130,551 | | 7,637,234 |
Cvent, Inc. (a)(d) | 426,960 | | 11,493,763 |
Demandware, Inc. (a) | 120,000 | | 9,067,200 |
Gogo, Inc. (a)(d) | 350,488 | | 6,389,396 |
Q2 Holdings, Inc. (a) | 200,000 | | 5,438,000 |
Stamps.com, Inc. (a) | 208,711 | | 14,317,575 |
| | 54,343,168 |
IT Services - 6.8% |
Broadridge Financial Solutions, Inc. | 160,100 | | 8,688,627 |
CACI International, Inc. Class A (a) | 80,000 | | 6,570,400 |
Euronet Worldwide, Inc. (a) | 160,000 | | 10,960,000 |
Gartner, Inc. Class A (a) | 232,130 | | 20,559,754 |
Genpact Ltd. (a) | 430,000 | | 9,550,300 |
Global Payments, Inc. | 210,500 | | 23,594,945 |
Mattersight Corp. (a)(e) | 1,854,975 | | 12,150,086 |
Maximus, Inc. | 220,000 | | 15,006,200 |
Virtusa Corp. (a) | 150,000 | | 7,191,000 |
| | 114,271,312 |
Common Stocks - continued |
| Shares | | Value |
INFORMATION TECHNOLOGY - continued |
Semiconductors & Semiconductor Equipment - 2.0% |
Cavium, Inc. (a) | 58,210 | | $ 3,946,638 |
Cirrus Logic, Inc. (a) | 450,000 | | 14,854,500 |
MKS Instruments, Inc. | 123,264 | | 4,375,872 |
Monolithic Power Systems, Inc. | 190,000 | | 9,824,900 |
| | 33,001,910 |
Software - 9.5% |
AVG Technologies NV (a) | 280,000 | | 8,047,200 |
Blackbaud, Inc. | 260,000 | | 15,901,600 |
Cadence Design Systems, Inc. (a)(d) | 796,200 | | 16,696,314 |
Digimarc Corp. (a)(d) | 36,300 | | 1,442,562 |
Ebix, Inc. (d) | 124,017 | | 3,843,287 |
Fleetmatics Group PLC (a) | 195,000 | | 9,334,650 |
HubSpot, Inc. | 210,500 | | 11,356,475 |
Imperva, Inc. (a) | 100,000 | | 6,570,000 |
Manhattan Associates, Inc. (a) | 183,400 | | 11,887,988 |
Mentor Graphics Corp. | 780,000 | | 20,350,200 |
Paylocity Holding Corp. (a)(d) | 170,000 | | 6,106,400 |
Progress Software Corp. (a) | 483,700 | | 14,356,216 |
Qlik Technologies, Inc. (a) | 460,000 | | 18,611,600 |
Verint Systems, Inc. (a) | 255,200 | | 14,857,744 |
| | 159,362,236 |
Technology Hardware, Storage & Peripherals - 0.4% |
Nimble Storage, Inc. (a)(d) | 265,937 | | 7,345,180 |
TOTAL INFORMATION TECHNOLOGY | | 408,677,022 |
MATERIALS - 2.1% |
Chemicals - 0.5% |
Cytec Industries, Inc. | 110,000 | | 8,165,300 |
Containers & Packaging - 1.4% |
Avery Dennison Corp. | 100,000 | | 6,085,000 |
Graphic Packaging Holding Co. | 1,200,200 | | 18,123,020 |
| | 24,208,020 |
Paper & Forest Products - 0.2% |
TFS Corp. Ltd. (d) | 2,400,000 | | 2,578,792 |
TOTAL MATERIALS | | 34,952,112 |
Common Stocks - continued |
| Shares | | Value |
TELECOMMUNICATION SERVICES - 0.9% |
Diversified Telecommunication Services - 0.9% |
inContact, Inc. (a) | 1,214,000 | | $ 11,265,920 |
Vonage Holdings Corp. (a) | 505,436 | | 3,229,736 |
| | 14,495,656 |
TOTAL COMMON STOCKS (Cost $1,363,452,109) |
1,611,258,786
|
Money Market Funds - 8.2% |
| | | |
Fidelity Cash Central Fund, 0.17% (b) | 64,469,445 | | 64,469,445 |
Fidelity Securities Lending Cash Central Fund, 0.18% (b)(c) | 72,538,290 | | 72,538,290 |
TOTAL MONEY MARKET FUNDS (Cost $137,007,735) |
137,007,735
|
Equity Funds - 1.9% |
| | | |
Small Growth Funds - 1.9% |
iShares Russell 2000 Growth Index ETF (d)
(Cost $31,405,658) | 200,000 | |
30,990,000
|
TOTAL INVESTMENT PORTFOLIO - 106.1% (Cost $1,531,865,502) | | 1,779,256,521 |
NET OTHER ASSETS (LIABILITIES) - (6.1)% | | (101,610,380) |
NET ASSETS - 100% | $ 1,677,646,141 |
Security Type Abbreviations |
ETF | - | Exchange Traded Fund |
Legend |
(a) Non-income producing |
(b) Affiliated fund that is generally available only to investment companies and other accounts managed by Fidelity Investments. The rate quoted is the annualized seven-day yield of the fund at period end. A complete unaudited listing of the fund's holdings as of its most recent quarter end is available upon request. In addition, each Fidelity Central Fund's financial statements, which are not covered by the Fund's Report of Independent Registered Public Accounting Firm, are available on the SEC's website or upon request. |
(c) Investment made with cash collateral received from securities on loan. |
(d) Security or a portion of the security is on loan at period end. |
(e) Affiliated company |
Affiliated Central Funds |
Information regarding fiscal year to date income earned by the Fund from investments in Fidelity Central Funds is as follows: |
Fund | Income earned |
Fidelity Cash Central Fund | $ 43,708 |
Fidelity Securities Lending Cash Central Fund | 664,654 |
Total | $ 708,362 |
Other Affiliated Issuers |
An affiliated company is a company in which the Fund has ownership of at least 5% of the voting securities. Fiscal year to date transactions with companies which are or were affiliates are as follows: |
Affiliate | Value, beginning of period | Purchases | Sales Proceeds | Dividend Income | Value,
end of
period |
Mattersight Corp. | $ - | $ 11,000,002 | $ - | $ - | $ 12,150,086 |
Superior Drilling Products, Inc. | 8,049,395 | 212,441 | 408,453 | - | 1,928,281 |
Total | $ 8,049,395 | $ 11,212,443 | $ 408,453 | $ - | $ 14,078,367 |
Other Information |
All investments are categorized as Level 1 under the Fair Value Hierarchy. The inputs or methodology used for valuing securities may not be an indication of the risk associated with investing in those securities. For more information on valuation inputs, please refer to the Investment Valuation section in the accompanying Notes to Financial Statements. |
See accompanying notes which are an integral part of the financial statements.
Annual Report
Statement of Assets and Liabilities
| | July 31, 2015 |
| | |
Assets | | |
Investment in securities, at value (including securities loaned of $71,636,998) - See accompanying schedule: Unaffiliated issuers (cost $1,379,096,390) | $ 1,628,170,419 | |
Fidelity Central Funds (cost $137,007,735) | 137,007,735 | |
Other affiliated issuers (cost $15,761,377) | 14,078,367 | |
Total Investments (cost $1,531,865,502) | | $ 1,779,256,521 |
Cash | | 786,138 |
Receivable for investments sold | | 19,073,092 |
Receivable for fund shares sold | | 8,384,535 |
Dividends receivable | | 87,629 |
Distributions receivable from Fidelity Central Funds | | 55,876 |
Other receivables | | 54,301 |
Total assets | | 1,807,698,092 |
| | |
Liabilities | | |
Payable for investments purchased | $ 55,000,596 | |
Payable for fund shares redeemed | 1,049,146 | |
Accrued management fee | 1,014,913 | |
Distribution and service plan fees payable | 91,566 | |
Other affiliated payables | 296,642 | |
Other payables and accrued expenses | 60,798 | |
Collateral on securities loaned, at value | 72,538,290 | |
Total liabilities | | 130,051,951 |
| | |
Net Assets | | $ 1,677,646,141 |
Net Assets consist of: | | |
Paid in capital | | $ 1,364,084,364 |
Accumulated undistributed net realized gain (loss) on investments and foreign currency transactions | | 66,183,697 |
Net unrealized appreciation (depreciation) on investments and assets and liabilities in foreign currencies | | 247,378,080 |
Net Assets | | $ 1,677,646,141 |
See accompanying notes which are an integral part of the financial statements.
Annual Report
Statement of Assets and Liabilities - continued
| | July 31, 2015 |
| | |
Calculation of Maximum Offering Price | | |
Class A:
Net Asset Value and redemption price per share ($123,369,546 ÷ 6,002,419 shares) | | $ 20.55 |
| | |
Maximum offering price per share (100/94.25 of $20.55) | | $ 21.80 |
Class T:
Net Asset Value and redemption price per share ($52,667,039 ÷ 2,622,233 shares) | | $ 20.08 |
| | |
Maximum offering price per share (100/96.50 of $20.08) | | $ 20.81 |
Class B:
Net Asset Value and offering price per share ($2,357,028 ÷ 124,107 shares) | | $ 18.99 |
| | |
Class C:
Net Asset Value and offering price per share ($55,671,491 ÷ 2,946,209 shares) | | $ 18.90 |
| | |
Small Cap Growth:
Net Asset Value, offering price and redemption price per share ($1,345,684,071 ÷ 63,486,022 shares) | | $ 21.20 |
| | |
Class I:
Net Asset Value, offering price and redemption price per share ($97,896,966 ÷ 4,609,963 shares) | | $ 21.24 |
A Redemption price per share is equal to net asset value less any applicable contingent deferred sales charge.
See accompanying notes which are an integral part of the financial statements.
Annual Report
Financial Statements - continued
Statement of Operations
| Year ended July 31, 2015 |
| | |
Investment Income | | |
Dividends | | $ 5,957,242 |
Income from Fidelity Central Funds (including $664,654 from security lending) | | 708,362 |
Total income | | 6,665,604 |
| | |
Expenses | | |
Management fee | | |
Basic fee | $ 8,851,814 | |
Performance adjustment | (551,250) | |
Transfer agent fees | 2,715,918 | |
Distribution and service plan fees | 913,847 | |
Accounting and security lending fees | 423,000 | |
Custodian fees and expenses | 46,646 | |
Independent trustees' compensation | 5,261 | |
Registration fees | 139,484 | |
Audit | 62,075 | |
Legal | 3,043 | |
Interest | 4,117 | |
Miscellaneous | 9,013 | |
Total expenses before reductions | 12,622,968 | |
Expense reductions | (173,323) | 12,449,645 |
Net investment income (loss) | | (5,784,041) |
Realized and Unrealized Gain (Loss) Net realized gain (loss) on: | | |
Investment securities: | | |
Unaffiliated issuers | 109,364,383 | |
Other affiliated issuers | (615,913) | |
Foreign currency transactions | 6,149 | |
Total net realized gain (loss) | | 108,754,619 |
Change in net unrealized appreciation (depreciation) on: Investment securities | 166,441,450 | |
Assets and liabilities in foreign currencies | (9,237) | |
Total change in net unrealized appreciation (depreciation) | | 166,432,213 |
Net gain (loss) | | 275,186,832 |
Net increase (decrease) in net assets resulting from operations | | $ 269,402,791 |
See accompanying notes which are an integral part of the financial statements.
Annual Report
Statement of Changes in Net Assets
| Year ended
July 31,
2015 | Year ended
July 31,
2014 |
Increase (Decrease) in Net Assets | | |
Operations | | |
Net investment income (loss) | $ (5,784,041) | $ (5,539,870) |
Net realized gain (loss) | 108,754,619 | 529,975,803 |
Change in net unrealized appreciation (depreciation) | 166,432,213 | (344,219,184) |
Net increase (decrease) in net assets resulting from operations | 269,402,791 | 180,216,749 |
Distributions to shareholders from net realized gain | (103,188,484) | (306,246,236) |
Share transactions - net increase (decrease) | 214,155,809 | (817,676,738) |
Redemption fees | 177,411 | 398,744 |
Total increase (decrease) in net assets | 380,547,527 | (943,307,481) |
| | |
Net Assets | | |
Beginning of period | 1,297,098,614 | 2,240,406,095 |
End of period (including accumulated net investment loss of $0 and accumulated net investment loss of $4,082,221, respectively) | $ 1,677,646,141 | $ 1,297,098,614 |
See accompanying notes which are an integral part of the financial statements.
Annual Report
Financial Highlights - Class A
Years ended July 31, | 2015 | 2014 | 2013 | 2012 | 2011 |
Selected Per-Share Data | | | | | |
Net asset value, beginning of period | $ 17.99 | $ 19.66 | $ 15.87 | $ 16.42 | $ 12.66 |
Income from Investment Operations | | | | | |
Net investment income (loss) C | (.13) | (.12) | (.04) | (.07) F | (.07) G |
Net realized and unrealized gain (loss) | 4.23 | 1.69 | 4.87 | (.16) | 3.84 |
Total from investment operations | 4.10 | 1.57 | 4.83 | (.23) | 3.77 |
Distributions from net realized gain | (1.54) | (3.24) | (1.04) | (.32) | (.01) K |
Redemption fees added to paid in capital C, I | - | - | - | - | - |
Net asset value, end of period | $ 20.55 | $ 17.99 | $ 19.66 | $ 15.87 | $ 16.42 |
Total ReturnA, B | 24.46% | 8.58% | 32.20% | (1.14)% | 29.78% |
Ratios to Average Net Assets D, H | | | | | |
Expenses before reductions | 1.21% | 1.22% | 1.24% | 1.35% | 1.25% |
Expenses net of fee waivers, if any | 1.21% | 1.22% | 1.24% | 1.35% | 1.25% |
Expenses net of all reductions | 1.20% | 1.22% | 1.22% | 1.34% | 1.23% |
Net investment income (loss) | (.67)% | (.62)% | (.26)% | (.49)%F | (.47)%G |
Supplemental Data | | | | | |
Net assets, end of period (000 omitted) | $ 123,370 | $ 88,822 | $ 74,978 | $ 59,684 | $ 67,272 |
Portfolio turnover rate E | 156% | 148% J | 142% | 150% | 106% |
A Total returns would have been lower if certain expenses had not been reduced during the applicable periods shown.
B Total returns do not include the effect of the sales charges.
C Calculated based on average shares outstanding during the period.
D Fees and expenses of any underlying Fidelity Central Funds are not included in the Fund's expense ratio. The Fund indirectly bears its proportionate share of the expenses of any underlying Fidelity Central Funds.
E Amount does not include the portfolio activity of any underlying Fidelity Central Funds.
F Investment income per share reflects a large, non-recurring dividend which amounted to $.01 per share. Excluding this non-recurring dividend, the ratio of net investment income (loss) to average net assets would have been (.57)%.
G Investment income per share reflects a large, non-recurring dividend which amounted to $.02 per share. Excluding this non-recurring dividend, the ratio of net investment income (loss) to average net assets would have been (.61)%.
H Expense ratios reflect operating expenses of the class. Expenses before reductions do not reflect amounts reimbursed by the investment adviser or reductions from brokerage service arrangements or reductions from other expense offset arrangements and do not represent the amount paid by the class during periods when reimbursements or reductions occur. Expenses net of fee waivers reflect expenses after reimbursement by the investment adviser but prior to reductions from brokerage service arrangements or other expense offset arrangements. Expenses net of all reductions represent the net expenses paid by the class.
I Amount represents less than $.01 per share.
J Portfolio turnover rate excludes securities received or delivered in-kind.
K The amounts shown reflect certain reclassifications related to book to tax differences that were made in the year shown.
See accompanying notes which are an integral part of the financial statements.
Annual Report
Financial Highlights - Class T
Years ended July 31, | 2015 | 2014 | 2013 | 2012 | 2011 |
Selected Per-Share Data | | | | | |
Net asset value, beginning of period | $ 17.66 | $ 19.38 | $ 15.68 | $ 16.27 | $ 12.57 |
Income from Investment Operations | | | | | |
Net investment income (loss) C | (.17) | (.16) | (.09) | (.11) F | (.11) G |
Net realized and unrealized gain (loss) | 4.13 | 1.66 | 4.82 | (.16) | 3.81 |
Total from investment operations | 3.96 | 1.50 | 4.73 | (.27) | 3.70 |
Distributions from net realized gain | (1.54) | (3.22) | (1.03) | (.32) | - |
Redemption fees added to paid in capital C, I | - | - | - | - | - |
Net asset value, end of period | $ 20.08 | $ 17.66 | $ 19.38 | $ 15.68 | $ 16.27 |
Total ReturnA, B | 24.10% | 8.30% | 31.87% | (1.41)% | 29.44% |
Ratios to Average Net Assets D, H | | | | | |
Expenses before reductions | 1.49% | 1.50% | 1.49% | 1.61% | 1.50% |
Expenses net of fee waivers, if any | 1.48% | 1.50% | 1.49% | 1.61% | 1.50% |
Expenses net of all reductions | 1.47% | 1.49% | 1.48% | 1.60% | 1.49% |
Net investment income (loss) | (.95)% | (.90)% | (.52)% | (.74)%F | (.73)%G |
Supplemental Data | | | | | |
Net assets, end of period (000 omitted) | $ 52,667 | $ 42,586 | $ 34,686 | $ 27,658 | $ 30,764 |
Portfolio turnover rate E | 156% | 148% J | 142% | 150% | 106% |
A Total returns would have been lower if certain expenses had not been reduced during the applicable periods shown.
B Total returns do not include the effect of the sales charges.
C Calculated based on average shares outstanding during the period.
D Fees and expenses of any underlying Fidelity Central Funds are not included in the Fund's expense ratio. The Fund indirectly bears its proportionate share of the expenses of any underlying Fidelity Central Funds.
E Amount does not include the portfolio activity of any underlying Fidelity Central Funds.
F Investment income per share reflects a large, non-recurring dividend which amounted to $.01 per share. Excluding this non-recurring dividend, the ratio of net investment income (loss) to average net assets would have been (.83)%.
G Investment income per share reflects a large, non-recurring dividend which amounted to $.02 per share. Excluding this non-recurring dividend, the ratio of net investment income (loss) to average net assets would have been (.86)%.
H Expense ratios reflect operating expenses of the class. Expenses before reductions do not reflect amounts reimbursed by the investment adviser or reductions from brokerage service arrangements or reductions from other expense offset arrangements and do not represent the amount paid by the class during periods when reimbursements or reductions occur. Expenses net of fee waivers reflect expenses after reimbursement by the investment adviser but prior to reductions from brokerage service arrangements or other expense offset arrangements. Expenses net of all reductions represent the net expenses paid by the class.
I Amount represents less than $.01 per share.
J Portfolio turnover rate excludes securities received or delivered in-kind.
See accompanying notes which are an integral part of the financial statements.
Annual Report
Financial Highlights - Class B
Years ended July 31, | 2015 | 2014 | 2013 | 2012 | 2011 |
Selected Per-Share Data | | | | | |
Net asset value, beginning of period | $ 16.86 | $ 18.65 | $ 15.19 | $ 15.86 | $ 12.30 |
Income from Investment Operations | | | | | |
Net investment income (loss) C | (.25) | (.25) | (.16) | (.18) F | (.18) G |
Net realized and unrealized gain (loss) | 3.92 | 1.60 | 4.64 | (.17) | 3.74 |
Total from investment operations | 3.67 | 1.35 | 4.48 | (.35) | 3.56 |
Distributions from net realized gain | (1.54) | (3.14) | (1.02) | (.32) | - |
Redemption fees added to paid in capital C, I | - | - | - | - | - |
Net asset value, end of period | $ 18.99 | $ 16.86 | $ 18.65 | $ 15.19 | $ 15.86 |
Total ReturnA, B | 23.48% | 7.73% | 31.25% | (1.96)% | 28.94% |
Ratios to Average Net Assets D, H | | | | | |
Expenses before reductions | 2.01% | 2.01% | 1.99% | 2.10% | 2.00% |
Expenses net of fee waivers, if any | 2.01% | 2.01% | 1.99% | 2.10% | 2.00% |
Expenses net of all reductions | 2.00% | 2.01% | 1.97% | 2.09% | 1.98% |
Net investment income (loss) | (1.47)% | (1.41)% | (1.01)% | (1.23)%F | (1.22)%G |
Supplemental Data | | | | | |
Net assets, end of period (000 omitted) | $ 2,357 | $ 2,764 | $ 3,486 | $ 4,123 | $ 5,295 |
Portfolio turnover rate E | 156% | 148% J | 142% | 150% | 106% |
A Total returns would have been lower if certain expenses had not been reduced during the applicable periods shown.
B Total returns do not include the effect of the contingent deferred sales charge.
C Calculated based on average shares outstanding during the period.
D Fees and expenses of any underlying Fidelity Central Funds are not included in the Fund's expense ratio. The Fund indirectly bears its proportionate share of the expenses of any underlying Fidelity Central Funds.
E Amount does not include the portfolio activity of any underlying Fidelity Central Funds.
F Investment income per share reflects a large, non-recurring dividend which amounted to $.01 per share. Excluding this non-recurring dividend, the ratio of net investment income (loss) to average net assets would have been (1.32)%.
G Investment income per share reflects a large, non-recurring dividend which amounted to $.02 per share. Excluding this non-recurring dividend, the ratio of net investment income (loss) to average net assets would have been (1.36)%.
H Expense ratios reflect operating expenses of the class. Expenses before reductions do not reflect amounts reimbursed by the investment adviser or reductions from brokerage service arrangements or reductions from other expense offset arrangements and do not represent the amount paid by the class during periods when reimbursements or reductions occur. Expenses net of fee waivers reflect expenses after reimbursement by the investment adviser but prior to reductions from brokerage service arrangements or other expense offset arrangements. Expenses net of all reductions represent the net expenses paid by the class.
I Amount represents less than $.01 per share.
J Portfolio turnover rate excludes securities received or delivered in-kind.
See accompanying notes which are an integral part of the financial statements.
Annual Report
Financial Highlights - Class C
Years ended July 31, | 2015 | 2014 | 2013 | 2012 | 2011 |
Selected Per-Share Data | | | | | |
Net asset value, beginning of period | $ 16.78 | $ 18.62 | $ 15.16 | $ 15.83 | $ 12.28 |
Income from Investment Operations | | | | | |
Net investment income (loss) C | (.25) | (.25) | (.16) | (.18) F | (.18) G |
Net realized and unrealized gain (loss) | 3.91 | 1.59 | 4.64 | (.17) | 3.73 |
Total from investment operations | 3.66 | 1.34 | 4.48 | (.35) | 3.55 |
Distributions from net realized gain | (1.54) | (3.18) | (1.02) | (.32) | - |
Redemption fees added to paid in capital C, I | - | - | - | - | - |
Net asset value, end of period | $ 18.90 | $ 16.78 | $ 18.62 | $ 15.16 | $ 15.83 |
Total ReturnA, B | 23.53% | 7.70% | 31.32% | (1.96)% | 28.91% |
Ratios to Average Net Assets D, H | | | | | |
Expenses before reductions | 2.00% | 2.01% | 1.99% | 2.10% | 2.00% |
Expenses net of fee waivers, if any | 2.00% | 2.00% | 1.99% | 2.10% | 2.00% |
Expenses net of all reductions | 1.99% | 2.00% | 1.97% | 2.09% | 1.98% |
Net investment income (loss) | (1.46)% | (1.41)% | (1.01)% | (1.24)%F | (1.22)%G |
Supplemental Data | | | | | |
Net assets, end of period (000 omitted) | $ 55,671 | $ 42,215 | $ 32,756 | $ 24,683 | $ 24,914 |
Portfolio turnover rate E | 156% | 148% J | 142% | 150% | 106% |
A Total returns would have been lower if certain expenses had not been reduced during the applicable periods shown.
B Total returns do not include the effect of the contingent deferred sales charge.
C Calculated based on average shares outstanding during the period.
D Fees and expenses of any underlying Fidelity Central Funds are not included in the Fund's expense ratio. The Fund indirectly bears its proportionate share of the expenses of any underlying Fidelity Central Funds.
E Amount does not include the portfolio activity of any underlying Fidelity Central Funds.
F Investment income per share reflects a large, non-recurring dividend which amounted to $.01 per share. Excluding this non-recurring dividend, the ratio of net investment income (loss) to average net assets would have been (1.32)%.
G Investment income per share reflects a large, non-recurring dividend which amounted to $.02 per share. Excluding this non-recurring dividend, the ratio of net investment income (loss) to average net assets would have been (1.36)%.
H Expense ratios reflect operating expenses of the class. Expenses before reductions do not reflect amounts reimbursed by the investment adviser or reductions from brokerage service arrangements or reductions from other expense offset arrangements and do not represent the amount paid by the class during periods when reimbursements or reductions occur. Expenses net of fee waivers reflect expenses after reimbursement by the investment adviser but prior to reductions from brokerage service arrangements or other expense offset arrangements. Expenses net of all reductions represent the net expenses paid by the class.
I Amount represents less than $.01 per share.
J Portfolio turnover rate excludes securities received or delivered in-kind.
See accompanying notes which are an integral part of the financial statements.
Annual Report
Financial Highlights - Small Cap Growth
Years ended July 31, | 2015 | 2014 | 2013 | 2012 | 2011 |
Selected Per-Share Data | | | | | |
Net asset value, beginning of period | $ 18.45 | $ 20.07 | $ 16.14 | $ 16.65 | $ 12.81 |
Income from Investment Operations | | | | | |
Net investment income (loss) B | (.07) | (.06) | .01 | (.03) E | (.03) F |
Net realized and unrealized gain (loss) | 4.36 | 1.71 | 4.98 | (.16) | 3.90 |
Total from investment operations | 4.29 | 1.65 | 4.99 | (.19) | 3.87 |
Distributions from net realized gain | (1.54) | (3.27) | (1.06) | (.32) | (.03) J |
Redemption fees added to paid in capital B, H | - | - | - | - | - |
Net asset value, end of period | $ 21.20 | $ 18.45 | $ 20.07 | $ 16.14 | $ 16.65 |
Total Return A | 24.91% | 8.87% | 32.74% | (.88)% | 30.20% |
Ratios to Average Net Assets C, G | | | | |
Expenses before reductions | .91% | .91% | .90% | 1.03% | .95% |
Expenses net of fee waivers, if any | .91% | .90% | .90% | 1.03% | .95% |
Expenses net of all reductions | .90% | .90% | .88% | 1.02% | .93% |
Net investment income (loss) | (.37)% | (.31)% | .08% | (.16)%E | (.17)%F |
Supplemental Data | | | | | |
Net assets, end of period (000 omitted) | $ 1,345,684 | $ 1,069,105 | $ 1,315,659 | $ 1,166,101 | $ 1,382,688 |
Portfolio turnover rate D | 156% | 148% I | 142% | 150% | 106% |
A Total returns would have been lower if certain expenses had not been reduced during the applicable periods shown.
B Calculated based on average shares outstanding during the period.
C Fees and expenses of any underlying Fidelity Central Funds are not included in the Fund's expense ratio. The Fund indirectly bears its proportionate share of the expenses of any underlying Fidelity Central Funds.
D Amount does not include the portfolio activity of any underlying Fidelity Central Funds.
E Investment income per share reflects a large, non-recurring dividend which amounted to $.01 per share. Excluding this non-recurring dividend, the ratio of net investment income (loss) to average net assets would have been (.25)%.
F Investment income per share reflects a large, non-recurring dividend which amounted to $.02 per share. Excluding this non-recurring dividend, the ratio of net investment income (loss) to average net assets would have been (.31)%.
G Expense ratios reflect operating expenses of the class. Expenses before reductions do not reflect amounts reimbursed by the investment adviser or reductions from brokerage service arrangements or reductions from other expense offset arrangements and do not represent the amount paid by the class during periods when reimbursements or reductions occur. Expenses net of fee waivers reflect expenses after reimbursement by the investment adviser but prior to reductions from brokerage service arrangements or other expense offset arrangements. Expenses net of all reductions represent the net expenses paid by the class.
H Amount represents less than $.01 per share.
I Portfolio turnover rate excludes securities received or delivered in-kind.
J The amounts shown reflect certain reclassifications related to book to tax differences that were made in the year shown.
See accompanying notes which are an integral part of the financial statements.
Annual Report
Financial Highlights - Class I
Years ended July 31, | 2015 | 2014 | 2013 | 2012 | 2011 |
Selected Per-Share Data | | | | | |
Net asset value, beginning of period | $ 18.49 | $ 20.10 | $ 16.17 | $ 16.68 | $ 12.83 |
Income from Investment Operations | | | | | |
Net investment income (loss) B | (.07) | (.06) | .01 | (.03) E | (.03) F |
Net realized and unrealized gain (loss) | 4.36 | 1.72 | 4.98 | (.16) | 3.91 |
Total from investment operations | 4.29 | 1.66 | 4.99 | (.19) | 3.88 |
Distributions from net realized gain | (1.54) | (3.27) | (1.06) | (.32) | (.03) J |
Redemption fees added to paid in capital B, H | - | - | - | - | - |
Net asset value, end of period | $ 21.24 | $ 18.49 | $ 20.10 | $ 16.17 | $ 16.68 |
Total Return A | 24.85% | 8.89% | 32.65% | (.88)% | 30.24% |
Ratios to Average Net Assets C, G | | | | | |
Expenses before reductions | .93% | .92% | .92% | 1.06% | .94% |
Expenses net of fee waivers, if any | .93% | .92% | .92% | 1.06% | .94% |
Expenses net of all reductions | .91% | .92% | .91% | 1.05% | .93% |
Net investment income (loss) | (.39)% | (.32)% | .06% | (.19)%E | (.17)%F |
Supplemental Data | | | | | |
Net assets, end of period (000 omitted) | $ 97,897 | $ 51,607 | $ 51,158 | $ 36,694 | $ 41,440 |
Portfolio turnover rate D | 156% | 148% I | 142% | 150% | 106% |
A Total returns would have been lower if certain expenses had not been reduced during the applicable periods shown.
B Calculated based on average shares outstanding during the period.
C Fees and expenses of any underlying Fidelity Central Funds are not included in the Fund's expense ratio. The Fund indirectly bears its proportionate share of the expenses of any underlying Fidelity Central Funds.
D Amount does not include the portfolio activity of any underlying Fidelity Central Funds.
E Investment income per share reflects a large, non-recurring dividend which amounted to $.01 per share. Excluding this non-recurring dividend, the ratio of net investment income (loss) to average net assets would have been (.28)%.
F Investment income per share reflects a large, non-recurring dividend which amounted to $.02 per share. Excluding this non-recurring dividend, the ratio of net investment income (loss) to average net assets would have been (.30)%.
G Expense ratios reflect operating expenses of the class. Expenses before reductions do not reflect amounts reimbursed by the investment adviser or reductions from brokerage service arrangements or reductions from other expense offset arrangements and do not represent the amount paid by the class during periods when reimbursements or reductions occur. Expenses net of fee waivers reflect expenses after reimbursement by the investment adviser but prior to reductions from brokerage service arrangements or other expense offset arrangements. Expenses net of all reductions represent the net expenses paid by the class.
H Amount represents less than $.01 per share.
I Portfolio turnover rate excludes securities received or delivered in-kind.
J The amounts shown reflect certain reclassifications related to book to tax differences that were made in the year shown.
See accompanying notes which are an integral part of the financial statements.
Annual Report
For the period ended July 31, 2015
1. Organization.
Fidelity Small Cap Growth Fund (the Fund) is a fund of Fidelity Securities Fund (the Trust) and is authorized to issue an unlimited number of shares. The Trust is registered under the Investment Company Act of 1940, as amended (the 1940 Act), as an open-end management investment company organized as a Massachusetts business trust. The Fund offers Class A, Class T, Class C, Small Cap Growth and Class I (formerly Institutional Class) shares, each of which, along with Class B shares, has equal rights as to assets and voting privileges. Class B shares are closed to new accounts and additional purchases, except for exchanges and reinvestments. The Fund offered Class F shares during the period June 26, 2009 through November 15, 2013 and all outstanding shares were redeemed by November 15, 2013. Each class has exclusive voting rights with respect to matters that affect that class. Class B shares will automatically convert to Class A shares after a holding period of seven years from the initial date of purchase.
2. Investments in Fidelity Central Funds.
The Fund invests in Fidelity Central Funds, which are open-end investment companies generally available only to other investment companies and accounts managed by the investment adviser and its affiliates. The Fund's Schedule of Investments lists each of the Fidelity Central Funds held as of period end, if any, as an investment of the Fund, but does not include the underlying holdings of each Fidelity Central Fund. As an Investing Fund, the Fund indirectly bears its proportionate share of the expenses of the underlying Fidelity Central Funds.
The Money Market Central Funds seek preservation of capital and current income and are managed by Fidelity Investments Money Management, Inc. (FIMM), an affiliate of the investment adviser. Annualized expenses of the Money Market Central Funds as of their most recent shareholder report date are less than .01%.
A complete unaudited list of holdings for each Fidelity Central Fund is available upon request or at the Securities and Exchange Commission (the SEC) website at www.sec.gov. In addition, the financial statements of the Fidelity Central Funds, which are not covered by the Fund's Report of Independent Registered Public Accounting Firm, are available on the SEC website or upon request.
3. Significant Accounting Policies.
The financial statements have been prepared in conformity with accounting principles generally accepted in the United States of America (GAAP), which require management to make certain estimates and assumptions at the date of the financial statements. Actual results could differ from those estimates. Subsequent events, if any, through the date that the financial statements were issued have been evaluated in the preparation of
Annual Report
3. Significant Accounting Policies - continued
the financial statements. The following summarizes the significant accounting policies of the Fund:
Investment Valuation. Investments are valued as of 4:00 p.m. Eastern time on the last calendar day of the period. The Board of Trustees (the Board) has delegated the day to day responsibility for the valuation of the Fund's investments to the Fidelity Management & Research Company (FMR) Fair Value Committee (the Committee). In accordance with valuation policies and procedures approved by the Board, the Fund attempts to obtain prices from one or more third party pricing vendors or brokers to value its investments. When current market prices, quotations or currency exchange rates are not readily available or reliable, investments will be fair valued in good faith by the Committee, in accordance with procedures adopted by the Board. Factors used in determining fair value vary by investment type and may include market or investment specific events. The frequency with which these procedures are used cannot be predicted and they may be utilized to a significant extent. The Committee oversees the Fund's valuation policies and procedures and reports to the Board on the Committee's activities and fair value determinations. The Board monitors the appropriateness of the procedures used in valuing the Fund's investments and ratifies the fair value determinations of the Committee.
The Fund categorizes the inputs to valuation techniques used to value its investments into a disclosure hierarchy consisting of three levels as shown below:
Level 1 - quoted prices in active markets for identical investments
Level 2 - other significant observable inputs (including quoted prices for similar investments, interest rates, prepayment speeds, etc.)
Level 3 - unobservable inputs (including the Fund's own assumptions based on the best information available)
Valuation techniques used to value the Fund's investments by major category are as follows:
Equity securities, including restricted securities, for which market quotations are readily available, are valued at the last reported sale price or official closing price as reported by a third party pricing vendor on the primary market or exchange on which they are traded and are categorized as Level 1 in the hierarchy. In the event there were no sales during the day or closing prices are not available, securities are valued at the last quoted bid price or may be valued using the last available price and are generally categorized as Level 2 in the hierarchy. For foreign equity securities, when market or security specific events arise, comparisons to the valuation of American Depositary Receipts (ADRs),
Annual Report
Notes to Financial Statements - continued
3. Significant Accounting Policies - continued
Investment Valuation - continued
futures contracts, Exchange-Traded Funds (ETFs) and certain indexes as well as quoted prices for similar securities may be used and would be categorized as Level 2 in the hierarchy. Utilizing these techniques may result in transfers between Level 1 and Level 2. For equity securities, including restricted securities, where observable inputs are limited, assumptions about market activity and risk are used and these securities may be categorized as Level 3 in the hierarchy.
Exchange-Traded Funds (ETFs) are valued at their last sale price or official closing price as reported by a third party pricing vendor on the primary market or exchange on which they are traded and are categorized as Level 1 in the hierarchy. In the event there were no sales during the day but the exchange reports a closing bid level, ETFs are valued at the closing bid and would be categorized as Level 1 in the hierarchy. In the event there was no closing bid, ETFs may be valued by another method that the Board believes reflects fair value in accordance with the Board's fair value pricing policies and may be categorized as Level 2 in the hierarchy.
Investments in open-end mutual funds, including the Fidelity Central Funds, are valued at their closing net asset value (NAV) each business day and are categorized as Level 1 in the hierarchy.
Changes in valuation techniques may result in transfers in or out of an assigned level within the disclosure hierarchy.
Foreign Currency. The Fund may use foreign currency contracts to facilitate transactions in foreign-denominated securities. Gains and losses from these transactions may arise from changes in the value of the foreign currency or if the counterparties do not perform under the contracts' terms.
Foreign-denominated assets, including investment securities, and liabilities are translated into U.S. dollars at the exchange rates at period end. Purchases and sales of investment securities, income and dividends received and expenses denominated in foreign currencies are translated into U.S. dollars at the exchange rate in effect on the transaction date.
The effects of exchange rate fluctuations on investments are included with the net realized and unrealized gain (loss) on investment securities. Other foreign currency transactions resulting in realized and unrealized gain (loss) are disclosed separately.
Investment Transactions and Income. For financial reporting purposes, the Fund's investment holdings and NAV include trades executed through the end of the last business day of the period. The NAV per share for processing shareholder transactions is calculated as of the close of business of the New York Stock Exchange (NYSE), normally
Annual Report
3. Significant Accounting Policies - continued
Investment Transactions and Income - continued
4:00 p.m. Eastern time and includes trades executed through the end of the prior business day. Gains and losses on securities sold are determined on the basis of identified cost and may include proceeds received from litigation. Dividend income is recorded on the ex-dividend date, except for certain dividends from foreign securities where the ex-dividend date may have passed, which are recorded as soon as the Fund is informed of the ex-dividend date. Non-cash dividends included in dividend income, if any, are recorded at the fair market value of the securities received. Income and capital gain distributions from Fidelity Central Funds, if any, are recorded on the ex-dividend date. Distributions received on securities that represent a return of capital or capital gain are recorded as a reduction of cost of investments and/or as a realized gain. Subsequent to ex-dividend date the Fund determines the components of these distributions, based upon receipt of tax filings or other correspondence relating to the underlying investment. Interest income is accrued as earned and includes coupon interest and amortization of premium and accretion of discount on debt securities as applicable. Investment income is recorded net of foreign taxes withheld where recovery of such taxes is uncertain.
Class Allocations and Expenses. Investment income, realized and unrealized capital gains and losses, common expenses of the Fund, and certain fund-level expense reductions, if any, are allocated daily on a pro-rata basis to each class based on the relative net assets of each class to the total net assets of the Fund. Each class differs with respect to transfer agent and distribution and service plan fees incurred. Certain expense reductions may also differ by class. For the reporting period, the allocated portion of income and expenses to each class as a percent of its average net assets may vary due to the timing of recording these transactions in relation to fluctuating net assets of the classes. Expenses directly attributable to a fund are charged to that fund. Expenses attributable to more than one fund are allocated among the respective funds on the basis of relative net assets or other appropriate methods. Expense estimates are accrued in the period to which they relate and adjustments are made when actual amounts are known.
Income Tax Information and Distributions to Shareholders. Each year, the Fund intends to qualify as a regulated investment company under Subchapter M of the Internal Revenue Code, including distributing substantially all of its taxable income and realized gains. As a result, no provision for U.S. Federal income taxes is required. As of July 31, 2015, the Fund did not have any unrecognized tax benefits in the financial statements; nor is the Fund aware of any tax positions for which it is reasonably possible that the total amounts of unrecognized tax benefits will significantly change in the next twelve months. The Fund files a U.S. federal tax return, in addition to state and local tax returns as required. The Fund's federal income tax returns are subject to examination by the Internal Revenue Service (IRS) for a period of three fiscal years after they are filed.
Annual Report
Notes to Financial Statements - continued
3. Significant Accounting Policies - continued
Income Tax Information and Distributions to Shareholders - continued
State and local tax returns may be subject to examination for an additional fiscal year depending on the jurisdiction. Foreign taxes are provided for based on the Fund's understanding of the tax rules and rates that exist in the foreign markets in which it invests.
Distributions are declared and recorded on the ex-dividend date. Income dividends and capital gain distributions are declared separately for each class. Income and capital gain distributions are determined in accordance with income tax regulations, which may differ from GAAP. In addition, the Fund claimed a portion of the payment made to redeeming shareholders as a distribution for income tax purposes.
Capital accounts within the financial statements are adjusted for permanent book-tax differences. These adjustments have no impact on net assets or the results of operations. Capital accounts are not adjusted for temporary book-tax differences which will reverse in a subsequent period.
Book-tax differences are primarily due to foreign currency transactions, partnerships and losses deferred due to wash sales and excise tax regulations.
The federal tax cost of investment securities and unrealized appreciation (depreciation) as of period end were as follows:
Gross unrealized appreciation | $ 284,169,323 |
Gross unrealized depreciation | (39,468,707) |
Net unrealized appreciation (depreciation) on securities | $ 244,700,616 |
| |
Tax Cost | $ 1,534,555,905 |
The tax-based components of distributable earnings as of period end were as follows:
Undistributed ordinary income | $ 18,130,712 |
Undistributed long-term capital gain | $ 50,743,387 |
Net unrealized appreciation (depreciation) on securities and other investments | $ 244,687,677 |
Annual Report
3. Significant Accounting Policies - continued
Income Tax Information and Distributions to Shareholders - continued
The tax character of distributions paid was as follows:
| July 31, 2015 | July 31, 2014 |
Ordinary Income | $ - | $ 106,613,332 |
Long-term Capital Gains | 103,188,484 | 199,632,904 |
Total | $ 103,188,484 | $ 306,246,236 |
Short-Term Trading (Redemption) Fees. Shares held by investors in the Fund less than 90 days may have been subject to a redemption fee equal to 1.50% of the NAV of shares redeemed. All redemption fees, which reduce the proceeds of the shareholder redemption, are retained by the Fund and accounted for as an addition to paid in capital.
4. Purchases and Sales of Investments.
Purchases and sales of securities, other than short-term securities, aggregated $2,044,918,249 and $1,947,551,562, respectively.
5. Fees and Other Transactions with Affiliates.
Management Fee. Fidelity Management & Research Company (the investment adviser) and its affiliates provide the Fund with investment management related services for which the Fund pays a monthly management fee. The management fee is the sum of an individual fund fee rate that is based on an annual rate of .45% of the Fund's average net assets and an annualized group fee rate that averaged .25% during the period. The group fee rate is based upon the average net assets of all the mutual funds advised by the investment adviser, including any mutual funds previously advised by the investment adviser that are currently advised by Fidelity SelectCo, LLC, an affiliate of the investment adviser. The group fee rate decreases as assets under management increase and increases as assets under management decrease. In addition, the management fee is subject to a performance adjustment (up to a maximum of ± .20% of the Fund's average net assets over a 36 month performance period). The upward or downward adjustment to the management fee is based on the relative investment performance of Small Cap Growth as compared to its benchmark index, the Russell 2000 Growth Index, over the same 36 month performance period. For the reporting period, the total annual management fee rate, including the performance adjustment, was .65% of the Fund's average net assets. The performance adjustment included in the management fee rate may be higher or lower than the maximum performance adjustment rate due to the difference between the average net assets for the reporting and performance periods.
Annual Report
Notes to Financial Statements - continued
5. Fees and Other Transactions with Affiliates - continued
Distribution and Service Plan Fees. In accordance with Rule 12b-1 of the 1940 Act, the Fund has adopted separate Distribution and Service Plans for each class of shares. Certain classes pay Fidelity Distributors Corporation (FDC), an affiliate of the investment adviser, separate Distribution and Service Fees, each of which is based on an annual percentage of each class' average net assets. In addition, FDC may pay financial intermediaries for selling shares of the Fund and providing shareholder support services. For the period, the Distribution and Service Fee rates, total fees and amounts retained by FDC were as follows:
| Distribution
Fee | Service
Fee | Total Fees | Retained
by FDC |
Class A | -% | .25% | $ 235,371 | $ 4,756 |
Class T | .25% | .25% | 224,894 | - |
Class B | .75% | .25% | 25,039 | 18,886 |
Class C | .75% | .25% | 428,543 | 68,843 |
| | | $ 913,847 | $ 92,485 |
Sales Load. FDC may receive a front-end sales charge of up to 5.75% for selling Class A shares and 3.50% for selling Class T shares, some of which is paid to financial intermediaries for selling shares of the Fund. Depending on the holding period, FDC may receive contingent deferred sales charges levied on Class A, Class T, Class B, and Class C redemptions. The deferred sales charges range from 5.00% to 1.00% for Class B shares, 1.00% for Class C shares, 1.00% for certain purchases of Class A shares and .25% for certain purchases of Class T shares.
For the period, sales charge amounts retained by FDC were as follows:
| Retained
by FDC |
Class A | $ 64,422 |
Class T | 11,332 |
Class B* | 1,032 |
Class C* | 6,916 |
| $ 83,702 |
* When Class B and Class C shares are initially sold, FDC pays commissions from its own resources to financial intermediaries through which the sales are made.
Transfer Agent Fees. Fidelity Investments Institutional Operations Company, Inc., (FIIOC), an affiliate of the investment adviser, is the transfer, dividend disbursing and shareholder servicing agent for each class of the Fund. FIIOC receives account fees and asset-based fees that vary according to the account size and type of account of the
Annual Report
5. Fees and Other Transactions with Affiliates - continued
Transfer Agent Fees - continued
shareholders of the respective classes of the Fund. FIIOC pays for typesetting, printing and mailing of shareholder reports, except proxy statements.
For the period, transfer agent fees for each class were as follows:
| Amount | % of
Class-Level Average
Net Assets |
Class A | $ 240,180 | .25 |
Class T | 124,717 | .28 |
Class B | 7,532 | .30 |
Class C | 125,384 | .29 |
Small Cap Growth | 2,079,578 | .20 |
Class I | 138,527 | .22 |
| $ 2,715,918 | |
Accounting and Security Lending Fees. Fidelity Service Company, Inc. (FSC), an affiliate of the investment adviser, maintains the Fund's accounting records. The accounting fee is based on the level of average net assets for each month. Under a separate contract, FSC administers the security lending program. The security lending fee is based on the number and duration of lending transactions.
Brokerage Commissions. The Fund placed a portion of its portfolio transactions with brokerage firms which are affiliates of the investment adviser. Brokerage commissions are included in net realized gain (loss) and change in net unrealized appreciation (depreciation) in the Statement of Operations. The commissions paid to these affiliated firms were $80,251 for the period.
Interfund Lending Program. Pursuant to an Exemptive Order issued by the SEC, the Fund, along with other registered investment companies having management contracts with FMR or other affiliated entities of FMR, may participate in an interfund lending program. This program provides an alternative credit facility allowing the funds to borrow from, or lend money to, other participating affiliated funds. At period end, there were no interfund loans outstanding. The Fund's activity in this program during the period for which loans were outstanding was as follows:
Borrower or Lender | Average Loan
Balance | Weighted Average Interest Rate | Interest Expense |
Borrower | $ 66,799,000 | .32% | $ 4,117 |
Annual Report
Notes to Financial Statements - continued
6. Committed Line of Credit.
The Fund participates with other funds managed by the investment adviser or an affiliate in a $4.25 billion credit facility (the "line of credit") to be utilized for temporary or emergency purposes to fund shareholder redemptions or for other short-term liquidity purposes. The Fund has agreed to pay commitment fees on its pro-rata portion of the line of credit, which amounted to $1,790 and is reflected in Miscellaneous expenses on the Statement of Operations. During the period, the Fund did not borrow on this line of credit.
7. Security Lending.
The Fund lends portfolio securities through a lending agent from time to time in order to earn additional income. For equity securities, a lending agent is used and may loan securities to certain qualified borrowers, including Fidelity Capital Markets (FCM), a broker-dealer affiliated with the Fund. On the settlement date of the loan, the Fund receives collateral (in the form of U.S. Treasury obligations, letters of credit and/or cash) against the loaned securities and maintains collateral in an amount not less than 100% of the market value of the loaned securities during the period of the loan. The market value of the loaned securities is determined at the close of business of the Fund and any additional required collateral is delivered to the Fund on the next business day. If the borrower defaults on its obligation to return the securities loaned because of insolvency or other reasons, the Fund may apply collateral received from the borrower against the obligation. The Fund may experience delays and costs in recovering the securities loaned. Any cash collateral received is invested in the Fidelity Securities Lending Cash Central Fund. The value of loaned securities and cash collateral at period end are disclosed on the Fund's Statement of Assets and Liabilities. Security lending income represents the income earned on investing cash collateral, less rebates paid to borrowers and any lending agent fees associated with the loan, plus any premium payments received for lending certain types of securities. Security lending income is presented in the Statement of Operations as a component of income from Fidelity Central Funds, and includes $53,294 from securities loaned to FCM.
8. Expense Reductions.
Commissions paid to certain brokers with whom the investment adviser, or its affiliates, places trades on behalf of the Fund include an amount in addition to trade execution, which may be rebated back to the Fund to offset certain expenses. This amount totaled $134,401 for the period. In addition, through arrangements with the Fund's custodian, credits realized as a result of uninvested cash balances were used to reduce the Fund's expenses. During the period, these credits reduced the Fund's custody expenses by $211.
Annual Report
8. Expense Reductions - continued
In addition, during the period the investment adviser reimbursed/waived a portion of fund-level operating expenses in the amount of $5,837 and a portion of class-level operating expenses as follows:
| Amount |
Class A | $ 1,650 |
Class T | 799 |
Class B | 5 |
Class C | 651 |
Small Cap Growth | 28,551 |
Class I | 1,218 |
| $ 32,874 |
9. Distributions to Shareholders.
Distributions to shareholders of each class were as follows:
Years ended July 31, | 2015 | 2014 A |
From net realized gain | | |
Class A | $ 7,463,655 | $ 13,043,180 |
Class T | 3,715,268 | 6,310,012 |
Class B | 242,938 | 574,582 |
Class C | 3,707,592 | 6,249,863 |
Small Cap Growth | 83,762,458 | 191,545,684 |
Class F | - | 80,609,253 |
Class I | 4,296,573 | 7,913,662 |
Total | $ 103,188,484 | $ 306,246,236 |
A All Class F Shares were redeemed on November 15, 2013.
10. Share Transactions.
Share transactions for each class were as follows and may contain automatic conversions between classes or exchanges between funds:
| Shares | Dollars |
Years ended July 31, | 2015 | 2014 A | 2015 | 2014 A |
Class A | | | | |
Shares sold | 2,167,593 | 1,706,264 | $ 41,925,439 | $ 32,017,468 |
Reinvestment of distributions | 412,446 | 685,582 | 7,203,479 | 12,377,436 |
Shares redeemed | (1,515,208) | (1,267,150) | (27,623,856) | (23,663,751) |
Net increase (decrease) | 1,064,831 | 1,124,696 | $ 21,505,062 | $ 20,731,153 |
Annual Report
Notes to Financial Statements - continued
10. Share Transactions - continued
| Shares | Dollars |
Years ended July 31, | 2015 | 2014 A | 2015 | 2014 A |
Class T | | | | |
Shares sold | 659,898 | 787,491 | $ 12,282,234 | $ 14,539,628 |
Reinvestment of distributions | 211,200 | 341,036 | 3,613,802 | 6,061,090 |
Shares redeemed | (660,724) | (506,140) | (11,765,139) | (9,192,820) |
Net increase (decrease) | 210,374 | 622,387 | $ 4,130,897 | $ 11,407,898 |
Class B | | | | |
Shares sold | 11,802 | 11,205 | $ 209,809 | $ 198,217 |
Reinvestment of distributions | 14,482 | 32,147 | 235,501 | 548,598 |
Shares redeemed | (66,110) | (66,282) | (1,127,352) | (1,168,208) |
Net increase (decrease) | (39,826) | (22,930) | $ (682,042) | $ (421,393) |
Class C | | | | |
Shares sold | 992,298 | 918,904 | $ 17,729,436 | $ 16,220,240 |
Reinvestment of distributions | 216,825 | 347,970 | 3,508,500 | 5,911,022 |
Shares redeemed | (778,826) | (510,512) | (13,034,787) | (8,883,388) |
Net increase (decrease) | 430,297 | 756,362 | $ 8,203,149 | $ 13,247,874 |
Small Cap Growth | | | | |
Shares sold | 23,816,242 | 30,614,664 | $ 475,203,336 | $ 589,831,022 |
Reinvestment of distributions | 4,527,816 | 10,184,956 | 81,276,349 | 187,557,177 |
Shares redeemed | (22,793,867) | (48,426,256)B | (412,013,233) | (934,113,968)B |
Net increase (decrease) | 5,550,191 | (7,626,636) | $ 144,466,452 | $ (156,725,769) |
Class F | | | | |
Shares sold | - | 768,083 | $ - | $ 15,293,461 |
Reinvestment of distributions | - | 4,357,257 | - | 80,609,253 |
Shares redeemed | - | (41,060,113)B | - | (806,457,595)B |
Net increase (decrease) | - | (35,934,773) | $ - | $ (710,554,881) |
Class I | | | | |
Shares sold | 2,387,318 | 933,934 | $ 47,676,724 | $ 18,129,031 |
Reinvestment of distributions | 220,272 | 381,830 | 3,963,647 | 7,062,159 |
Shares redeemed | (789,017) | (1,069,577) | (15,108,080) | (20,552,810) |
Net increase (decrease) | 1,818,573 | 246,187 | $ 36,532,291 | $ 4,638,380 |
A All Class F Shares were redeemed on November 15, 2013.
B Amount includes in-kind redemptions.
Annual Report
11. Other.
The Fund's organizational documents provide former and current trustees and officers with a limited indemnification against liabilities arising in connection with the performance of their duties to the Fund. In the normal course of business, the Fund may also enter into contracts that provide general indemnifications. The Fund's maximum exposure under these arrangements is unknown as this would be dependent on future claims that may be made against the Fund. The risk of material loss from such claims is considered remote.
Annual Report
To the Trustees of Fidelity Securities Fund and the Shareholders of Fidelity Small Cap Growth Fund:
In our opinion, the accompanying statement of assets and liabilities, including the schedule of investments, and the related statements of operations and of changes in net assets and the financial highlights present fairly, in all material respects, the financial position of Fidelity Small Cap Growth Fund (a fund of Fidelity Securities Fund) at July 31, 2015, the results of its operations for the year then ended, the changes in its net assets for each of the two years in the period then ended and the financial highlights for each of the five years in the period then ended, in conformity with accounting principles generally accepted in the United States of America. These financial statements and financial highlights (hereafter referred to as "financial statements") are the responsibility of the Fidelity Small Cap Growth Fund's management. Our responsibility is to express an opinion on these financial statements based on our audits. We conducted our audits of these financial statements in accordance with the standards of the Public Company Accounting Oversight Board (United States). Those standards require that we plan and perform the audit to obtain reasonable assurance about whether the financial statements are free of material misstatement. An audit includes examining, on a test basis, evidence supporting the amounts and disclosures in the financial statements, assessing the accounting principles used and significant estimates made by management, and evaluating the overall financial statement presentation. We believe that our audits, which included confirmation of securities at July 31, 2015 by correspondence with the custodian and brokers, provide a reasonable basis for our opinion.
PricewaterhouseCoopers LLP
Boston, Massachusetts
September 16, 2015
Annual Report
The Trustees, Member of the Advisory Board, and officers of the trust and fund, as applicable, are listed below. The Board of Trustees governs each fund and is responsible for protecting the interests of shareholders. The Trustees are experienced executives who meet periodically throughout the year to oversee each fund's activities, review contractual arrangements with companies that provide services to each fund, oversee management of the risks associated with such activities and contractual arrangements, and review each fund's performance. Each of the Trustees oversees 170 funds.
The Trustees hold office without limit in time except that (a) any Trustee may resign; (b) any Trustee may be removed by written instrument, signed by at least two-thirds of the number of Trustees prior to such removal; (c) any Trustee who requests to be retired or who has become incapacitated by illness or injury may be retired by written instrument signed by a majority of the other Trustees; and (d) any Trustee may be removed at any special meeting of shareholders by a two-thirds vote of the outstanding voting securities of the trust. Each Trustee who is not an interested person (as defined in the 1940 Act) of the trust and the funds (Independent Trustee), shall retire not later than the last day of the calendar year in which his or her 75th birthday occurs. The Independent Trustees may waive this mandatory retirement age policy with respect to individual Trustees. The officers and Advisory Board Member hold office without limit in time, except that any officer and Advisory Board Member may resign or may be removed by a vote of a majority of the Trustees at any regular meeting or any special meeting of the Trustees. Except as indicated, each individual has held the office shown or other offices in the same company for the past five years.
Experience, Skills, Attributes, and Qualifications of the Fund's Trustees. The Governance and Nominating Committee has adopted a statement of policy that describes the experience, qualifications, attributes, and skills that are necessary and desirable for potential Independent Trustee candidates (Statement of Policy). The Board believes that each Trustee satisfied at the time he or she was initially elected or appointed a Trustee, and continues to satisfy, the standards contemplated by the Statement of Policy. The Governance and Nominating Committee also engages professional search firms to help identify potential Independent Trustee candidates who have the experience, qualifications, attributes, and skills consistent with the Statement of Policy. From time to time, additional criteria based on the composition and skills of the current Independent Trustees, as well as experience or skills that may be appropriate in light of future changes to board composition, business conditions, and regulatory or other developments, have also been considered by the professional search firms and the Governance and Nominating Committee. In addition, the Board takes into account the Trustees' commitment and participation in Board and committee meetings, as well as their leadership of standing and ad hoc committees throughout their tenure.
In determining that a particular Trustee was and continues to be qualified to serve as a Trustee, the Board has considered a variety of criteria, none of which, in isolation, was controlling. The Board believes that, collectively, the Trustees have balanced and diverse experience, qualifications, attributes, and skills, which allow the Board to operate effectively in governing each fund and protecting the interests of shareholders. Information about the specific experience, skills, attributes, and qualifications of each Trustee, which in each case led to the Board's conclusion that the Trustee should serve (or continue to serve) as a trustee of the fund, is provided below.
Annual Report
Trustees and Officers - continued
Board Structure and Oversight Function. James C. Curvey is an interested person (as defined in the 1940 Act) and currently serves as Chairman. The Trustees have determined that an interested Chairman is appropriate and benefits shareholders because an interested Chairman has a personal and professional stake in the quality and continuity of services provided to the fund. Independent Trustees exercise their informed business judgment to appoint an individual of their choosing to serve as Chairman, regardless of whether the Trustee happens to be independent or a member of management. The Independent Trustees have determined that they can act independently and effectively without having an Independent Trustee serve as Chairman and that a key structural component for assuring that they are in a position to do so is for the Independent Trustees to constitute a substantial majority for the Board. The Independent Trustees also regularly meet in executive session. Ned C. Lautenbach serves as Chairman of the Independent Trustees and as such (i) acts as a liaison between the Independent Trustees and management with respect to matters important to the Independent Trustees and (ii) with management prepares agendas for Board meetings.
Fidelity funds are overseen by different Boards of Trustees. The fund's Board oversees Fidelity's high income and certain equity funds and other Boards oversee Fidelity's investment-grade bond, money market, asset allocation, and sector funds. The asset allocation funds may invest in Fidelity funds overseen by the fund's Board. The use of separate Boards, each with its own committee structure, allows the Trustees of each group of Fidelity funds to focus on the unique issues of the funds they oversee, including common research, investment, and operational issues. On occasion, the separate Boards establish joint committees to address issues of overlapping consequences for the Fidelity funds overseen by each Board.
The Trustees operate using a system of committees to facilitate the timely and efficient consideration of all matters of importance to the Trustees, each fund, and fund shareholders and to facilitate compliance with legal and regulatory requirements and oversight of the fund's activities and associated risks. The Board, acting through its committees, has charged FMR and its affiliates with (i) identifying events or circumstances the occurrence of which could have demonstrably adverse effects on the fund's business and/or reputation; (ii) implementing processes and controls to lessen the possibility that such events or circumstances occur or to mitigate the effects of such events or circumstances if they do occur; and (iii) creating and maintaining a system designed to evaluate continuously business and market conditions in order to facilitate the identification and implementation processes described in (i) and (ii) above. Because the day-to-day operations and activities of the fund are carried out by or through FMR, its affiliates and other service providers, the fund's exposure to risks is mitigated but not eliminated by the processes overseen by the Trustees. While each of the Board's committees has responsibility for overseeing different aspects of the fund's activities, oversight is exercised primarily through the Operations, Audit, and Compliance Committees. In addition, the Independent Trustees have worked with FMR to enhance the Board's oversight of investment and financial risks, legal and regulatory risks, technology risks, and operational risks, including the development of additional risk reporting to the Board. For example, a working group comprised of Independent Trustees and FMR has worked and continues to work to review the Fidelity funds' valuation-related activities, reporting and risk management. Appropriate personnel, including but not limited to the fund's Chief Compliance Officer (CCO), FMR's internal auditor, the independent accountants, the fund's Treasurer and portfolio management personnel, make periodic reports to the Board's committees, as appropriate, including an annual review of FMR's risk management program for the Fidelity funds. The responsibilities of each standing committee, including their oversight responsibilities, are described further under "Standing Committees of the Fund's Trustees."
Annual Report
The fund's Statement of Additional Information (SAI) includes more information about the Trustees. To request a free copy, call Fidelity at 1-877-208-0098.
Interested Trustees*:
Correspondence intended for each Trustee who is an interested person may be sent to Fidelity Investments, 245 Summer Street, Boston, Massachusetts 02210.
Name, Year of Birth; Principal Occupations and Other Relevant Experience+ |
James C. Curvey (1935) |
Year of Election or Appointment: 2007 Trustee Chairman of the Board of Trustees |
| Mr. Curvey also serves as Trustee of other Fidelity funds. Mr. Curvey is a Director of Fidelity Research & Analysis Co. (investment adviser firm, 2009-present), and Vice Chairman (2007-present) and Director of FMR LLC (diversified financial services company). In addition, Mr. Curvey serves as an Overseer for the Boston Symphony Orchestra and a member of the board of Artis-Naples, Naples, Florida, and as a Trustee for Brewster Academy, Wolfeboro, New Hampshire. Previously, Mr. Curvey served as a Director of Fidelity Investments Money Management, Inc. (investment adviser firm, 2009-2014), a Director of FMR (investment adviser firm, 2007-2014), and a Director of FMR Co., Inc. (investment adviser firm, 2007-2014). |
Charles S. Morrison (1960) |
Year of Election or Appointment: 2014 Trustee |
| Mr. Morrison also serves as Trustee of other funds. He serves as a Director of Fidelity Investments Money Management, Inc. (FIMM) (investment adviser firm, 2014-present), Director of Fidelity SelectCo, LLC (investment adviser firm, 2014-present), President, Asset Management (2014-present), and is an employee of Fidelity Investments. Previously, Mr. Morrison served as Vice President of Fidelity's Fixed Income and Asset Allocation Funds (2012-2014), President, Fixed Income (2011-2014), Vice President of Fidelity's Money Market Funds (2005-2009), President, Money Market Group Leader of FMR (investment adviser firm, 2009), and Senior Vice President, Money Market Group of FMR (2004-2009). Mr. Morrison also served as Vice President of Fidelity's Bond Funds (2002-2005), certain Balanced Funds (2002-2005), and certain Asset Allocation Funds (2002-2007), and as Senior Vice President (2002-2005) of Fidelity's Bond Division. |
* Trustees have been determined to be "Interested Trustees" by virtue of, among other things, their affiliation with the trust or various entities under common control with FMR.
+ The information above includes each Trustee's principal occupation during the last five years and other information relating to the experience, attributes, and skills relevant to each Trustee's qualifications to serve as a Trustee, which led to the conclusion that each Trustee should serve as a Trustee for each fund.
Annual Report
Independent Trustees:
Correspondence intended for each Independent Trustee (that is, the Trustees other than the Interested Trustees) may be sent to Fidelity Investments, P.O. Box 55235, Boston, Massachusetts 02205-5235.
Name, Year of Birth; Principal Occupations and Other Relevant Experience+ |
Dennis J. Dirks (1948) |
Year of Election or Appointment: 2005 Trustee |
| Mr. Dirks also serves as Trustee of other Fidelity funds. Prior to his retirement in May 2003, Mr. Dirks was Chief Operating Officer and a member of the Board of The Depository Trust & Clearing Corporation (DTCC). He also served as President, Chief Operating Officer, and Board member of The Depository Trust Company (DTC) and President and Board member of the National Securities Clearing Corporation (NSCC). In addition, Mr. Dirks served as Chief Executive Officer and Board member of the Government Securities Clearing Corporation, Chief Executive Officer and Board member of the Mortgage-Backed Securities Clearing Corporation, as a Trustee and a member of the Finance Committee of Manhattan College (2005-2008), and as a Trustee and a member of the Finance Committee of AHRC of Nassau County (2006-2008). Mr. Dirks is a member of the Independent Directors Council (IDC) Governing Council (2010-present) and Board of Directors for The Brookville Center for Children's Services, Inc. (2009-present). |
Alan J. Lacy (1953) |
Year of Election or Appointment: 2008 Trustee |
| Mr. Lacy also serves as Trustee of other Fidelity funds. Mr. Lacy serves as a member of the Board of Directors of Dave & Buster's Entertainment, Inc. (restaurant and entertainment complexes, 2010-present) and Bristol-Myers Squibb Company (global pharmaceuticals, 2008-present). In addition, Mr. Lacy served as Senior Adviser (2007-2014) of Oak Hill Capital Partners, L.P. (private equity) and also served as Chief Executive Officer (2000-2005) and Vice Chairman (2005-2006) of Sears Holdings Corporation and Sears, Roebuck and Co. (retail). Mr. Lacy is a member of the Board of Trustees of The National Parks Conservation Association (2006-present). Previously, Mr. Lacy served as Chairman of the Board of Trustees of the National Parks Conservation Association (2008-2011) and as a member of the Board of Directors for The Western Union Company (global money transfer, 2006-2011), The Hillman Companies, Inc. (hardware wholesalers, 2010-2014), and Earth Fare, Inc. (retail grocery, 2010-2014). |
Ned C. Lautenbach (1944) |
Year of Election or Appointment: 2000 Trustee Chairman of the Independent Trustees |
| Mr. Lautenbach also serves as Trustee of other Fidelity funds. Mr. Lautenbach currently serves as the Lead Director of the Eaton Corporation Board of Directors (diversified industrial, 1997-present). Mr. Lautenbach is Chairman of the Board of Directors of Artis-Naples in Naples, Florida (2012-present), a member of the Council on Foreign Relations (1994-present), and a member of the Board of Governors, State University System of Florida (2013-present). Previously, Mr. Lautenbach was a Partner/Advisory Partner at Clayton, Dubilier & Rice, LLC (private equity investment, 1998-2010), as well as a Director of Sony Corporation (2006-2007). |
Joseph Mauriello (1944) |
Year of Election or Appointment: 2008 Trustee |
| Mr. Mauriello also serves as Trustee of other Fidelity funds. Prior to his retirement in January 2006, Mr. Mauriello served in numerous senior management positions including Deputy Chairman and Chief Operating Officer (2004-2005), and Vice Chairman of Financial Services (2002-2004) of KPMG LLP US (professional services, 1965-2005). Mr. Mauriello currently serves as a member of the Board of Directors of XL Group plc. (global insurance and re-insurance, 2006-present). Previously, Mr. Mauriello served as a Director of the Hamilton Funds of the Bank of New York (2006-2007) and of Arcadia Resources Inc. (health care services and products, 2007-2012). |
Robert W. Selander (1950) |
Year of Election or Appointment: 2011 Trustee |
| Mr. Selander also serves as Trustee of other Fidelity funds. Mr. Selander serves as a Director of The Western Union Company (global money transfer, 2014-present). Previously, Mr. Selander served as a Member of the Advisory Board of other Fidelity funds (2011), and Executive Vice Chairman (2010), Chief Executive Officer (2009-2010), and President and Chief Executive Officer (1997-2009) of Mastercard, Inc. |
Cornelia M. Small (1944) |
Year of Election or Appointment: 2005 Trustee |
| Ms. Small also serves as Trustee of other Fidelity funds. Ms. Small is a member of the Board of Directors (2009-present) and Chair of the Investment Committee (2010-present) of the Teagle Foundation. Ms. Small also serves on the Investment Committee of the Berkshire Taconic Community Foundation (2008-present). Previously, Ms. Small served as Chairperson (2002-2008) and a member of the Investment Committee and Chairperson (2008-2012) and a member of the Board of Trustees of Smith College. In addition, Ms. Small served as Chief Investment Officer, Director of Global Equity Investments, and a member of the Board of Directors of Scudder, Stevens & Clark and Scudder Kemper Investments. |
William S. Stavropoulos (1939) |
Year of Election or Appointment: 2002 Trustee Vice Chairman of the Independent Trustees |
| Mr. Stavropoulos also serves as Trustee of other Fidelity funds. Mr. Stavropoulos serves as President and Founder of the Michigan Baseball Foundation, the Great Lakes Loons (2007-present). Mr. Stavropoulos is Chairman Emeritus of the Board of Directors of The Dow Chemical Company, where he previously served in numerous senior management positions, including President, CEO (1995-2000; 2002-2004), Chairman of the Executive Committee (2000-2006), and as a member of the Board of Directors (1990-2006). Currently, Mr. Stavropoulos is Chairman of the Board of Directors of Univar Inc. (global distributor of commodity and specialty chemicals), a Director of Teradata Corporation (data warehousing and technology solutions), and Maersk Inc. (industrial conglomerate), and a member of the Advisory Board for Metalmark Capital LLC (private equity investment, 2005-present). Mr. Stavropoulos is an operating advisor to Clayton, Dubilier & Rice, LLC (private equity investment). In addition, Mr. Stavropoulos is a member of the University of Notre Dame Advisory Council for the College of Science, a Trustee of the Rollin L. Gerstacker Foundation, and a Director of the Naples Philharmonic Center for the Arts. Previously, Mr. Stavropoulos served as a Director of Chemical Financial Corporation (bank holding company, 1993-2012) and Tyco International, Ltd. (multinational manufacturing and services, 2007-2012). |
David M. Thomas (1949) |
Year of Election or Appointment: 2008 Trustee |
| Mr. Thomas also serves as Trustee of other Fidelity funds. Mr. Thomas serves as Non-Executive Chairman of the Board of Directors of Fortune Brands Home and Security (home and security products, 2011-present), as a member of the Board of Directors (2004-present) and Presiding Director (2013-present) of Interpublic Group of Companies, Inc. (marketing communication), and as a member of the Board of Trustees of the University of Florida (2013-present). Previously, Mr. Thomas served as Executive Chairman (2005-2006) and Chairman and Chief Executive Officer (2000-2005) of IMS Health, Inc. (pharmaceutical and healthcare information solutions), and a Director of Fortune Brands, Inc. (consumer products, 2000-2011). |
+ The information above includes each Trustee's principal occupation during the last five years and other information relating to the experience, attributes, and skills relevant to each Trustee's qualifications to serve as a Trustee, which led to the conclusion that each Trustee should serve as a Trustee for each fund.
Advisory Board Member and Officers:
Correspondence intended for each officer and Peter S. Lynch may be sent to Fidelity Investments, 245 Summer Street, Boston, Massachusetts 02210. Officers appear below in alphabetical order.
Name, Year of Birth; Principal Occupation |
Peter S. Lynch (1944) |
Year of Election or Appointment: 2003 Member of the Advisory Board |
| Mr. Lynch also serves as Member of the Advisory Board of other Fidelity funds. Mr. Lynch is Vice Chairman and a Director of FMR (investment adviser firm) and FMR Co., Inc. (investment adviser firm). In addition, Mr. Lynch serves as a Trustee of Boston College and as the Chairman of the Inner-City Scholarship Fund. Previously, Mr. Lynch served on the Special Olympics International Board of Directors (1997-2006). |
Elizabeth Paige Baumann (1968) |
Year of Election or Appointment: 2012 Anti-Money Laundering (AML) Officer |
| Ms. Baumann also serves as AML Officer of other funds. She is Chief AML Officer of FMR LLC (diversified financial services company, 2012-present) and is an employee of Fidelity Investments. Previously, Ms. Baumann served as Vice President and Deputy Anti-Money Laundering Officer (2007-2012). |
Marc Bryant (1966) |
Year of Election or Appointment: 2015 Secretary and Chief Legal Officer (CLO) |
| Mr. Bryant also serves as Secretary and Chief Legal Officer (CLO) of other funds. He is Senior Vice President and Deputy General Counsel of FMR LLC (diversified financial services company), Previously, Mr. Bryant served as Secretary and Chief Legal Officer of Fidelity Rutland Square Trust II (2010-2014) and Assistant Secretary of Fidelity's Fixed Income and Asset Allocation Funds (2013-2015). Prior to joining Fidelity Investments, Mr. Bryant served as a Senior Vice President and the Head of Global Retail Legal for Alliance Bernstein L.P. (2006-2010), and as the General Counsel for ProFund Advisors LLC (2001-2006). |
William C. Coffey (1969) |
Year of Election or Appointment: 2009 Assistant Secretary |
| Mr. Coffey also serves as Assistant Secretary of other funds. He is Senior Vice President and Deputy General Counsel of FMR LLC (diversified financial services company, 2010-present), and is an employee of Fidelity Investments. Previously, Mr. Coffey served as Vice President and Associate General Counsel of FMR LLC (2005-2009). |
Jonathan Davis (1968) |
Year of Election or Appointment: 2010 Assistant Treasurer |
| Mr. Davis also serves as Assistant Treasurer of other funds. Mr. Davis is an employee of Fidelity Investments. Previously, Mr. Davis served as Vice President and Associate General Counsel of FMR LLC (diversified financial services company, 2003-2010). |
Adrien E. Deberghes (1967) |
Year of Election or Appointment: 2008 Deputy Treasurer |
| Mr. Deberghes also serves as an officer of other funds. He is an employee of Fidelity Investments (2008-present). Prior to joining Fidelity Investments, Mr. Deberghes was Senior Vice President of Mutual Fund Administration at State Street Corporation (2007-2008), Senior Director of Mutual Fund Administration at Investors Bank & Trust (2005-2007), and Director of Finance for Dunkin' Brands (2000-2005). |
Stephanie J. Dorsey (1969) |
Year of Election or Appointment: 2010 Assistant Treasurer |
| Ms. Dorsey also serves as an officer of other funds. She is an employee of Fidelity Investments (2008-present) and has served in other fund officer roles. Prior to joining Fidelity Investments, Ms. Dorsey served as Treasurer (2004-2008) of the JPMorgan Mutual Funds and Vice President (2004-2008) of JPMorgan Chase Bank. |
Howard J. Galligan III (1966) |
Year of Election or Appointment: 2014 Chief Financial Officer |
| Mr. Galligan also serves as Chief Financial Officer of other funds. Mr. Galligan serves as President of Fidelity Pricing and Cash Management Services (FPCMS) (2014-present) and as a Director of Strategic Advisers, Inc. (investment adviser firm, 2008-present). Previously, Mr. Galligan served as Chief Administrative Officer of Asset Management (2011-2014) and Chief Operating Officer and Senior Vice President of Investment Support for Strategic Advisers, Inc. (2003-2011). |
Scott C. Goebel (1968) |
Year of Election or Appointment: 2015 Vice President |
| Mr. Goebel serves as an officer of other funds. Mr. Goebel also serves as Secretary of Fidelity SelectCo, LLC (investment adviser firm, 2013-present), Fidelity Investments Money Management, Inc. (FIMM) (investment adviser firm, 2010-present) and Fidelity Research and Analysis Company (FRAC) (investment adviser firm, 2010-present); General Counsel, Secretary, and Senior Vice President of FMR (investment adviser firm, 2008-present) and FMR Co., Inc. (investment adviser firm, 2008-present); Chief Legal Officer of Fidelity Management & Research (Hong Kong) Limited (investment adviser firm, 2008-present); and Assistant Secretary of Fidelity Management & Research (Japan) Limited (investment adviser firm, 2008-present) and FMR Investment Management (U.K.) Limited (investment adviser firm, 2008-present). Previously, Mr. Goebel served as Secretary and CLO of certain Fidelity funds (2008-2015), Assistant Secretary of FIMM (2008-2010), FRAC (2008-2010), and certain funds (2007-2008); and as Vice President and Secretary of Fidelity Distributors Corporation (FDC) (2005-2007). Mr. Goebel has been employed by FMR LLC (diversified financial services company) or an affiliate since 2001. |
Thomas C. Hense (1964) |
Year of Election or Appointment: 2008/2010/2015 Vice President |
| Mr. Hense serves as Vice President of Fidelity Advisor Multi-Asset Income Fund (2015) and other funds (High Income (2008), Small Cap (2008), and Value (2010) funds). Previously, Mr. Hense served as a portfolio manager for Fidelity's Institutional Money Management Group (Pyramis) (2003-2008). |
Brian B. Hogan (1964) |
Year of Election or Appointment: 2009 Vice President |
| Mr. Hogan also serves as Trustee or Vice President of other funds. Mr. Hogan serves as a Director of Fidelity SelectCo, LLC (investment adviser firm, 2014-present) and President of the Equity Division of FMR (investment adviser firm, 2009-present). Previously, Mr. Hogan served as Senior Vice President, Equity Research of FMR (2006-2009) and as a portfolio manager. |
Chris Maher (1972) |
Year of Election or Appointment: 2013 Assistant Treasurer |
| Mr. Maher serves as Assistant Treasurer of other funds. Mr. Maher is Vice President of Valuation Oversight and is an employee of Fidelity Investments. Previously, Mr. Maher served as Vice President of Asset Management Compliance (2013), Vice President of the Program Management Group of FMR (investment adviser firm, 2010-2013), and Vice President of Valuation Oversight (2008-2010). |
Kenneth B. Robins (1969) |
Year of Election or Appointment: 2008 President and Treasurer |
| Mr. Robins also serves as an officer of other funds. Mr. Robins serves as Executive Vice President of Fidelity Investments Money Management, Inc. (FIMM) (investment adviser firm, 2013-present) and is an employee of Fidelity Investments (2004-present). Previously, Mr. Robins served in other fund officer roles. |
Stephen Sadoski (1971) |
Year of Election or Appointment: 2012 Deputy Treasurer |
| Mr. Sadoski also serves as Deputy Treasurer of other funds. He is an employee of Fidelity Investments (2012-present) and has served in another fund officer role. Prior to joining Fidelity Investments, Mr. Sadoski served as an assistant chief accountant in the Division of Investment Management of the Securities and Exchange Commission (SEC) (2009-2012) and as a senior manager at Deloitte & Touche LLP (1997-2009). |
Stacie M. Smith (1974) |
Year of Election or Appointment: 2013 Deputy Treasurer |
| Ms. Smith also serves as an officer of other funds. She is an employee of Fidelity Investments (2009-present) and has served in other fund officer roles. Prior to joining Fidelity Investments, Ms. Smith served as Senior Audit Manager of Ernst & Young LLP (1996-2009). |
Renee Stagnone (1975) |
Year of Election or Appointment: 2013 Deputy Treasurer |
| Ms. Stagnone also serves as Deputy Treasurer of other funds. Ms. Stagnone is an employee of Fidelity Investments. |
Linda J. Wondrack (1964) |
Year of Election or Appointment: 2014 Chief Compliance Officer |
| Ms. Wondrack also serves as Chief Compliance Officer of other funds. Ms. Wondrack is Executive Vice President and head of the Ethics Office and Asset Management Compliance for Fidelity Investments (2012-present). Ms. Wondrack also serves as Chief Compliance Officer of Fidelity SelectCo, LLC (investment adviser firm, 2014-present); Chief Compliance Officer of Impresa Management LLC (2013-present); and Chief Compliance Officer of FMR Co., Inc. (investment adviser firm), Fidelity Investments Money Management, Inc. (investment adviser firm), Fidelity Management & Research (Japan) Limited (investment adviser firm), FMR Investment Management (U.K.) Limited (investment adviser firm), Fidelity Management & Research (Hong Kong) (investment adviser firm), Fidelity Management & Research Company (investment adviser firm), Pyramis Global Advisors, LLC (investment adviser firm), and Strategic Advisers, Inc. (investment adviser firm), Ballyrock Investment Advisors LLC, and Northern Neck Investors LLC (2012-present). Previously, Ms. Wondrack served as Senior Vice President and Chief Compliance Officer for Columbia Management Investment Advisers, LLC (2005-2012); Chief Compliance Officer for certain funds within the Columbia Family of Funds (2007-2012); and Senior Vice President of Compliance Risk Management at Bank of America (2005-2010). |
Joseph F. Zambello (1957) |
Year of Election or Appointment: 2011 Deputy Treasurer |
| Mr. Zambello also serves as Deputy Treasurer of other funds. Mr. Zambello is an employee of Fidelity Investments. Previously, Mr. Zambello served as Vice President of the Program Management Group of FMR (investment adviser firm, 2009-2011) and Vice President of the Transfer Agent Oversight Group (2005-2009). |
Annual Report
The Board of Trustees of Fidelity Small Cap Growth Fund voted to pay to shareholders of record at the opening of business, the following distributions per share derived from capital gains realized from sales of portfolio securities:
| Pay Date | Record Date | Capital Gains |
Class I | 09/14/2015 | 09/11/2015 | $0.786 |
The fund hereby designates as a capital gain dividend with respect to the taxable year ended July 31, 2015, $75,767,806, or, if subsequently determined to be different, the net capital gain of such year.
The fund will notify shareholders in January 2016 of amounts for use in preparing 2015 income tax returns.
Annual Report
Fidelity Small Cap Growth Fund
Each year, the Board of Trustees, including the Independent Trustees (together, the Board), votes on the renewal of the management contract with Fidelity Management & Research Company (FMR) and the sub-advisory agreements (together, the Advisory Contracts) for the fund. The Board, assisted by the advice of fund counsel and Independent Trustees' counsel, requests and considers a broad range of information relevant to the renewal of the Advisory Contracts throughout the year.
The Board meets regularly and, at each of its meetings, covers an extensive agenda of topics and materials and considers factors that are relevant to its annual consideration of the renewal of the fund's Advisory Contracts, including the services and support provided to the fund and its shareholders. The Board has established various standing committees (Committees), each composed of and chaired by Independent Trustees with varying backgrounds, to which the Board has assigned specific subject matter responsibilities in order to enhance effective decision-making by the Board. The Board, acting directly and through its Committees, requests and receives information concerning the annual consideration of the renewal of the fund's Advisory Contracts. The Board also meets as needed to consider matters specifically related to the Board's annual consideration of the renewal of the Advisory Contracts. Members of the Board may also meet with trustees of other Fidelity funds through ad hoc joint committees to discuss certain matters relevant to all of the Fidelity funds.
At its July 2015 meeting, the Board unanimously determined to renew the fund's Advisory Contracts. In reaching its determination, the Board considered all factors it believed relevant, including (i) the nature, extent, and quality of the services to be provided to the fund and its shareholders (including the investment performance of the fund); (ii) the competitiveness of the fund's management fee and total expense ratio relative to peer funds; (iii) the total costs of the services to be provided by and the profits to be realized by Fidelity from its relationship with the fund; and (iv) the extent to which (if any) economies of scale exist and would be realized as the fund grows, and whether any economies of scale are appropriately shared with fund shareholders.
In considering whether to renew the Advisory Contracts for the fund, the Board reached a determination, with the assistance of fund counsel and Independent Trustees' counsel and through the exercise of its business judgment, that the renewal of the Advisory Contracts was in the best interests of the fund and its shareholders and that the compensation payable under the Advisory Contracts was fair and reasonable. The Board's decision to renew the Advisory Contracts was not based on any single factor, but rather was based on a comprehensive consideration of all the information provided to the Board at its meetings throughout the year. The Board, in reaching its determination to renew the Advisory Contracts, was aware that shareholders of the fund have a broad range of investment choices available to them, including a wide choice among funds offered by Fidelity's competitors, and that the fund's shareholders, who have the opportunity to review and weigh the disclosure provided by the fund in its prospectus and other public disclosures, have chosen to invest in this fund, which is part of the Fidelity family of funds.
Annual Report
Board Approval of Investment Advisory Contracts and
Management Fees - continued
Nature, Extent, and Quality of Services Provided. The Board considered Fidelity's staffing as it relates to the fund, including the backgrounds of investment personnel of Fidelity, and also considered the fund's investment objective, strategies, and related investment philosophy. The Independent Trustees also had discussions with senior management of Fidelity's investment operations and investment groups. The Board considered the structure of the portfolio manager compensation program and whether this structure provides appropriate incentives to act in the best interests of the fund. Additionally, the Board considered the portfolio managers' investments, if any, in the funds that they manage.
Resources Dedicated to Investment Management and Support Services. The Board and the Fund Oversight and Research Committees reviewed the general qualifications and capabilities of Fidelity's investment staff, including its size, education, experience, and resources, as well as Fidelity's approach to recruiting, training, managing, and compensating investment personnel. The Board noted that Fidelity has continued to increase the resources devoted to non-U.S. offices, including expansion of Fidelity's global investment organization. The Board also noted that Fidelity's analysts have extensive resources, tools and capabilities that allow them to conduct sophisticated quantitative and fundamental analysis, as well as credit analysis of issuers, counterparties and guarantors. Further, the Board considered that Fidelity's investment professionals have sufficient access to global information and data so as to provide competitive investment results over time, and that those professionals also have access to sophisticated tools that permit them to assess portfolio construction and risk and performance attribution characteristics continuously, as well as to transmit new information and research conclusions rapidly around the world. Additionally, in its deliberations, the Board considered Fidelity's trading, risk management, and compliance capabilities and resources, which are integral parts of the investment management process.
Shareholder and Administrative Services. The Board considered (i) the nature, extent, quality, and cost of advisory, administrative, and shareholder services performed by FMR, the sub-advisers (together with FMR, the Investment Advisers), and their affiliates under the Advisory Contracts and under separate agreements covering transfer agency, pricing and bookkeeping, and securities lending services for the fund; (ii) the nature and extent of the supervision of third party service providers, principally custodians and subcustodians; and (iii) the resources devoted to, and the record of compliance with, the fund's compliance policies and procedures. The Board also reviewed the allocation of fund brokerage, including allocations to brokers affiliated with the Investment Advisers, the use of brokerage commissions to pay fund expenses, and the use of "soft" commission dollars to pay for research services.
Annual Report
The Board noted that the growth of fund assets over time across the complex allows Fidelity to reinvest in the development of services designed to enhance the value or convenience of the Fidelity funds as investment vehicles. These services include 24-hour access to account information and market information through telephone representatives and over the Internet, investor education materials and asset allocation tools, and the expanded availability of Fidelity Investor Centers.
In 2014, the Board formed an ad hoc Committee on Transfer Agency Fees to review the variety of transfer agency fee structures throughout the industry and Fidelity's competitive positioning with respect to industry participants.
Investment in a Large Fund Family. The Board considered the benefits to shareholders of investing in a Fidelity fund, including the benefits of investing in a fund that is part of a large family of funds offering a variety of investment disciplines and providing a large variety of mutual fund investor services. The Board noted that Fidelity had taken, or had made recommendations that resulted in the Fidelity funds taking, a number of actions over the previous year that benefited particular funds, including (i) continuing to dedicate additional resources to investment research and to the support of the senior management team that oversees asset management; (ii) continuing efforts to enhance Fidelity's global research capabilities; (iii) launching new funds and making other enhancements to meet client needs; (iv) reducing management fees and total expenses for certain index funds and diversified international funds; (v) continuing to launch dedicated lower cost underlying funds to meet portfolio construction needs related to expanding underlying fund options for Fidelity funds of funds, specifically for the Freedom Fund product lines; (vi) rationalizing product lines and gaining increased efficiencies through fund mergers; (vii) launching active fixed-income exchange-traded funds; (viii) continuing to develop, acquire and implement systems and technology to improve services to the funds and information security and to increase efficiency; (ix) implementing investment enhancements to further strengthen Fidelity's target date product line to increase investors' probability of success in achieving their goals; (x) modifying the eligibility criteria for certain share classes to accommodate roll-over assets from employer-sponsored retirement plans; (xi) launching a new Class W of the Freedom Index Funds to attract and retain Fidelity record-kept retirement plan assets; and (xii) implementing changes to Fidelity's money market product line in response to recent money market regulatory reforms.
Investment Performance. The Board considered whether the fund has operated in accordance with its investment objective, as well as its record of compliance with its investment restrictions and its performance history.
Annual Report
Board Approval of Investment Advisory Contracts and
Management Fees - continued
The Board took into account discussions with representatives of the Investment Advisers about fund investment performance that occur at Board meetings throughout the year. In this regard the Board noted that as part of regularly scheduled fund reviews and other reports to the Board on fund performance, the Board considers annualized return information for the fund, for different time periods, measured against a securities market index ("benchmark index") and a peer group of funds with similar objectives ("peer group"), if any. In its evaluation of fund investment performance, the Board gave particular attention to information indicating changes in performance of certain Fidelity funds for specific time periods and discussed with the Investment Advisers the reasons for any overperformance or underperformance.
In addition to reviewing absolute and relative fund performance, the Independent Trustees periodically consider the appropriateness of fund performance metrics in evaluating the results achieved. In general, the Independent Trustees believe that fund performance should be evaluated based on net performance (after fees and expenses) of both the highest performing and lowest performing fund share classes, where applicable, compared to appropriate benchmark indices, over appropriate time periods that may include full market cycles, and compared to peer groups, as applicable, over the same periods, taking into account relevant factors including the following: general market conditions; issuer-specific information; and fund cash flows and other factors.
The Independent Trustees recognize that shareholders evaluate performance on a net basis over their own holding periods, for which one-, three-, and five-year periods are often used as a proxy. For this reason, the performance information reviewed by the Board also included net cumulative calendar year total return information for the fund and an appropriate benchmark index and peer group for the most recent one-, three-, and five-year periods, as shown below. Returns are shown compared to the 25th percentile (top of box, 75% beaten) and 75th percentile (bottom of box, 25% beaten) of the peer universe.
Annual Report
Fidelity Small Cap Growth Fund

The Board also considered that the fund's management fee is subject to upward or downward adjustment depending upon whether, and to what extent, the fund's investment performance for the performance period exceeds, or is exceeded by, a securities index, thus leading to a performance adjustment for the same period. The Board noted that the performance adjustment provides FMR with a strong economic incentive to seek to achieve superior performance for the fund's shareholders and helps to more closely align the interests of FMR and the shareholders of the fund.
Based on its review, the Board concluded that the nature, extent, and quality of services provided to the fund under the Advisory Contracts should benefit the shareholders of the fund.
Competitiveness of Management Fee and Total Expense Ratio. The Board considered the fund's management fee and total expense ratio compared to "mapped groups" of competitive funds and classes created for the purpose of facilitating the Trustees' competitive analysis of management fees and total expenses. Fidelity creates "mapped groups" by combining similar Lipper investment objective categories that have comparable investment mandates. Combining Lipper investment objective categories aids the Board's management fee and total expense ratio comparisons by broadening the competitive group used for comparison.
Management Fee. The Board considered two proprietary management fee comparisons for the 12-month periods shown in basis points (BP) in the chart below. The group of Lipper funds used by the Board for management fee comparisons is referred to below as the "Total Mapped Group." The Total Mapped Group comparison focuses on a fund's standing in terms of gross management fees before expense reimbursements or caps, and without giving effect to the fund's performance adjustment, relative to the total universe of funds with comparable investment mandates, regardless of whether their management fee structures also are comparable. Funds with comparable investment mandates offer exposure to similar types of securities. Funds with comparable management fee structures have similar management fee contractual arrangements (e.g., flat rate charged for advisory services, all-inclusive fee rate, etc.). "TMG %" represents the percentage of funds in the Total Mapped Group that had management fees that were lower than the fund's. For example, a hypothetical TMG % of 20% would mean that 80% of the funds in the Total Mapped Group had higher, and 20% had lower, management fees than the fund. The fund's actual TMG %s and the number of funds in the Total Mapped Group are in the chart below. The "Asset-Size Peer Group" (ASPG) comparison focuses on a fund's standing relative to a subset of non-Fidelity funds within the Total Mapped Group that are similar in size and management fee structure without taking into account performance adjustments, if any. For example, if a fund is in the first quartile of the ASPG, the fund's management fee ranks in the least expensive or lowest 25% of funds in the ASPG. The ASPG represents at least 15% of the funds in the Total Mapped Group with comparable asset size and management fee structures, subject to a minimum of 50 funds (or all funds in the Total Mapped Group if fewer than 50). Additional information, such as the ASPG quartile in which the fund's management fee rate ranked and the impact of the fund's performance adjustment, is also included in the chart and considered by the Board.
Annual Report
Board Approval of Investment Advisory Contracts and
Management Fees - continued
Fidelity Small Cap Growth Fund

Annual Report
The Board noted that the fund's management fee rate ranked below the median of its Total Mapped Group and below the median of its ASPG for 2014. The Board also noted the effect of the fund's performance adjustment, if any, on the fund's management fee ranking.
The Board noted that, in 2014, the ad hoc Committee on Group Fee was formed by it and other Fidelity fund boards to conduct an in-depth review of the "group fee" component of the management fee of funds with such management fee structures. Committee focus included the mechanics of the group fee, the competitive landscape of group fee structures, Fidelity funds with no group fee component and investment products not included in group fee assets. The Board also considered that, for funds subject to the group fee, FMR agreed to voluntarily waive fees over a specified period of time in amounts designed to account for assets converted from certain funds to certain collective investment trusts.
The Board also noted that, in 2013, the ad hoc Committee on Management Fees was formed to conduct an in-depth review of the management fee rates of Fidelity's active equity mutual funds. The Committee focused on the following areas: (i) standard fee structures; (ii) research consumption and trading evolution; (iii) management fee competitiveness/profitability by category; and (iv) factors that drive institutional pricing.
Based on its review, the Board concluded that the fund's management fee is fair and reasonable in light of the services that the fund receives and the other factors considered.
Total Expense Ratio. In its review of each class's total expense ratio, the Board considered the fund's management fee as well as other fund or class expenses, as applicable, such as transfer agent fees, pricing and bookkeeping fees, fund-paid 12b-1 fees, and custodial, legal, and audit fees. The Board noted the impact of the fund's performance adjustment. The Board also noted that Fidelity may agree to waive fees and expenses from time to time, and the extent to which, if any, it has done so for the fund. As part of its review, the Board also considered the current and historical total expense ratios of each class of the fund compared to competitive fund median expenses. Each class of the fund is compared to those funds and classes in the Total Mapped Group (used by the Board for management fee comparisons) that have a similar sales load structure.
The Board noted that the total expense ratio of each of Class A, Class B, Class C, Class I, and the retail class ranked below its competitive median for 2014 and the total expense ratio of Class T ranked above its competitive median for 2014. The Board considered that, in general, various factors can affect total expense ratios. The Board noted that the total expense ratio of Class T was above the competitive median primarily because of higher 12b-1 fees on Class T as compared to most competitor funds. Class T has a higher 12b-1 fee, but a lower front-end sales charge, than traditionally priced front-end sales charge classes. The Board considered that Class T is primarily sold load-waived in the retirement plan market where its 0.50% 12b-1 fee is comparable to competing no-load, higher 12b-1 fee classes designed specifically for retirement plans. The Board noted that the fund offers multiple classes, each of which has a different sales load and 12b-1 fee structure, and that the multiple structures are intended to offer a range of pricing options for the intermediary market. The Board also noted that the total expense ratios of the classes vary primarily by the level of their 12b-1 fees, although differences in transfer agent fees may also cause expenses to vary from class to class.
Annual Report
Board Approval of Investment Advisory Contracts and
Management Fees - continued
Fees Charged to Other Fidelity Clients. The Board also considered Fidelity fee structures and other information with respect to clients of Fidelity, such as other funds advised or subadvised by Fidelity, pension plan clients, and other institutional clients with similar mandates. The Board noted the findings of the 2013 ad hoc joint committee (created with the board of other Fidelity funds), which reviewed and compared Fidelity's institutional investment advisory business with its business of providing services to the Fidelity funds, including the differences in services provided, fees charged, and costs incurred, as well as competition in their respective marketplaces.
Based on its review of total expense ratios and fees charged to other Fidelity clients, the Board concluded that, although Class T was above the median of the universe presented for comparison, the total expense ratio of each class of the fund was reasonable in light of the services that the fund and its shareholders receive and the other factors considered.
Costs of the Services and Profitability. The Board considered the revenues earned and the expenses incurred by Fidelity in conducting the business of developing, marketing, distributing, managing, administering and servicing the fund and servicing the fund's shareholders. The Board also considered the level of Fidelity's profits in respect of all the Fidelity funds.
On an annual basis, Fidelity presents to the Board information about the profitability of its relationship with the fund. Fidelity calculates profitability information for each fund, as well as aggregate profitability information for groups of Fidelity funds and all Fidelity funds, using a series of detailed revenue and cost allocation methodologies which originate with the books and records of Fidelity on which Fidelity's audited financial statements are based. The Audit Committee of the Board reviews any significant changes from the prior year's methodologies.
PricewaterhouseCoopers LLP (PwC), independent registered public accounting firm and auditor to Fidelity and certain Fidelity funds, has been engaged annually by the Board as part of the Board's assessment of Fidelity's profitability analysis. PwC's engagement includes the review and assessment of the methodologies used by Fidelity in determining the revenues and expenses attributable to Fidelity's mutual fund business, and completion of agreed-upon procedures in respect of the mathematical accuracy of fund profitability and its conformity to established allocation methodologies. After considering PwC's reports issued under the engagement and information provided by Fidelity, the Board concluded that while other allocation methods may also be reasonable, Fidelity's profitability methodologies are reasonable in all material respects.
Annual Report
The Board also reviewed Fidelity's non-fund businesses and fall-out benefits related to the mutual fund business as well as cases where Fidelity's affiliates may benefit from or be related to the fund's business.
The Board considered the costs of the services provided by and the profits realized by Fidelity in connection with the operation of the fund and was satisfied that the profitability was not excessive.
Economies of Scale. The Board considered whether there have been economies of scale in respect of the management of the Fidelity funds, whether the Fidelity funds (including the fund) have appropriately benefited from any such economies of scale, and whether there is potential for realization of any further economies of scale. The Board considered the extent to which the fund will benefit from economies of scale as assets grow through increased services to the fund, through waivers or reimbursements, or through fee or expense ratio reductions. The Board also noted that in 2013, it and the boards of other Fidelity funds created an ad hoc committee (the Economies of Scale Committee) to analyze whether Fidelity attains economies of scale in respect of the management and servicing of the Fidelity funds, whether the Fidelity funds have appropriately benefited from such economies of scale, and whether there is potential for realization of any further economies of scale.
The Board recognized that the fund's management contract incorporates a "group fee" structure, which provides for lower group fee rates as total group assets increase, and for higher group fee rates as total group assets decrease (with "group assets" defined to include fund assets under FMR's management plus sector fund assets previously under FMR's management and currently managed by Fidelity SelectCo, LLC). FMR calculates the group fee rates based on a tiered asset "breakpoint" schedule that varies based on asset class. The Board considered that the group fee is designed to deliver the benefits of economies of scale to fund shareholders when total Fidelity fund assets increase, even if assets of any particular fund are unchanged or have declined, because some portion of Fidelity's costs are attributable to services provided to all Fidelity funds, and all funds benefit if those costs can be allocated among more assets. The Board concluded that, given the group fee structure, fund shareholders will benefit from lower management fees as group assets increase at the fund complex level, regardless of whether Fidelity achieves any such economies of scale.
The Board concluded, taking into account the analysis of the Economies of Scale Committee, that economies of scale, if any, are being appropriately shared between fund shareholders and Fidelity.
Annual Report
Board Approval of Investment Advisory Contracts and
Management Fees - continued
Additional Information Requested by the Board. In order to develop fully the factual basis for consideration of the Fidelity funds' Advisory Contracts, the Board requested and received additional information on certain topics, including: (i) fund performance trends and Fidelity's long-term strategies for certain funds; (ii) the various share classes employed by Fidelity and the attributes of each class, together with similar information on the distribution and servicing payments made by Fidelity or the funds to third-party participants in the distribution channels; (iii) fund profitability, and fund performance in relation to fund profitability; (iv) the methodology with respect to evaluating competitive fund data and peer group classifications and fee comparisons; (v) annual fund profitability margins, with particular focus on certain funds with negative margins; (vi) the realization of fall-out benefits in certain Fidelity business units; (vii) economies of scale and the way in which they are shared with fund shareholders; (viii) Fidelity's group fee structures, including the group fee schedule of breakpoints; (ix) the impact of cost containment measures on the funds; and (x) the transfer agent fee structure.
Based on its evaluation of all of the conclusions noted above, and after considering all factors it believed relevant, the Board concluded that the advisory fee structures are fair and reasonable, and that the fund's Advisory Contracts should be renewed.
Annual Report
Investment Adviser
Fidelity Management & Research Company
Boston, MA
Investment Sub-Advisers
FMR Co., Inc.
FMR Investment Management
(U.K.) Limited
Fidelity Management & Research
(Hong Kong) Limited
Fidelity Management & Research
(Japan) Limited
General Distributor
Fidelity Distributors Corporation
Smithfield, RI
Transfer and Service Agents
Fidelity Investments Institutional
Operations Company, Inc.
Boston, MA
Fidelity Service Company, Inc.
Boston, MA
Custodian
Brown Brothers Harriman & Co.
Boston, MA
(Fidelity Investment logo)(registered trademark)
ASCPI-UANN-0915
1.803721.110
Fidelity®
Growth & Income
Portfolio
Annual Report
July 31, 2015
(Fidelity Cover Art)
Contents
Performance | (Click Here) | How the fund has done over time. |
Management's Discussion of Fund Performance | (Click Here) | The Portfolio Manager's review of fund performance and strategy. |
Shareholder Expense Example | (Click Here) | An example of shareholder expenses. |
Investment Changes | (Click Here) | A summary of major shifts in the fund's investments over the past six months. |
Investments | (Click Here) | A complete list of the fund's investments with their market values. |
Financial Statements | (Click Here) | Statements of assets and liabilities, operations, and changes in net assets, as well as financial highlights. |
Notes | (Click Here) | Notes to the financial statements. |
Report of Independent Registered Public Accounting Firm | (Click Here) | |
Trustees and Officers | (Click Here) | |
Distributions | (Click Here) | |
Board Approval of Investment Advisory Contracts and Management Fees | (Click Here) | |
To view a fund's proxy voting guidelines and proxy voting record for the 12-month period ended June 30, visit http://www.fidelity.com/proxyvotingresults or visit the Securities and Exchange Commission's (SEC) web site at http://www.sec.gov. You may also call 1-800-544-8544 to request a free copy of the proxy voting guidelines.
Standard & Poor's, S&P and S&P 500 are registered service marks of The McGraw-Hill Companies, Inc. and have been licensed for use by Fidelity Distributors Corporation.
Other third-party marks appearing herein are the property of their respective owners.
All other marks appearing herein are registered or unregistered trademarks or service marks of FMR LLC or an affiliated company. © 2015 FMR LLC. All rights reserved.
Annual Report
This report and the financial statements contained herein are submitted for the general information of the shareholders of the fund. This report is not authorized for distribution to prospective investors in the fund unless preceded or accompanied by an effective prospectus.
A fund files its complete schedule of portfolio holdings with the SEC for the first and third quarters of each fiscal year on Form N-Q. Forms N-Q are available on the SEC's web site at http://www.sec.gov. A fund's Forms N-Q may be reviewed and copied at the SEC's Public Reference Room in Washington, DC. Information regarding the operation of the SEC's Public Reference Room may be obtained by calling 1-800-SEC-0330. For a complete list of a fund's portfolio holdings, view the most recent holdings listing, semiannual report, or annual report on Fidelity's web site at http://www.fidelity.com, http://www.advisor.fidelity.com, or http://www.401k.com, as applicable.
NOT FDIC INSURED • MAY LOSE VALUE • NO BANK GUARANTEE
Neither the fund nor Fidelity Distributors Corporation is a bank.
Annual Report
Average annual total return reflects the change in the value of an investment, assuming reinvestment of the class' distributions from dividend income and capital gains (the profits earned upon the sale of securities that have grown in value, if any) and assuming a constant rate of performance each year. The $10,000 table and the fund's returns do not reflect the deduction of taxes that a shareholder would pay on fund distributions or the redemption of fund shares. During periods of reimbursement by Fidelity, a fund's total return will be greater than it would be had the reimbursement not occurred. How a fund did yesterday is no guarantee of how it will do tomorrow.
Average Annual Total Returns
Periods ended July 31, 2015 | Past 1
year | Past 5
years | Past 10
years |
Fidelity® Growth & Income Portfolio | 8.23% | 16.38% | 3.68% |
$10,000 Over 10 Years
Let's say hypothetically that $10,000 was invested in Fidelity® Growth & Income Portfolio, a class of the fund, on July 31, 2005. The chart shows how the value of your investment would have changed, and also shows how the S&P 500® Index performed over the same period.
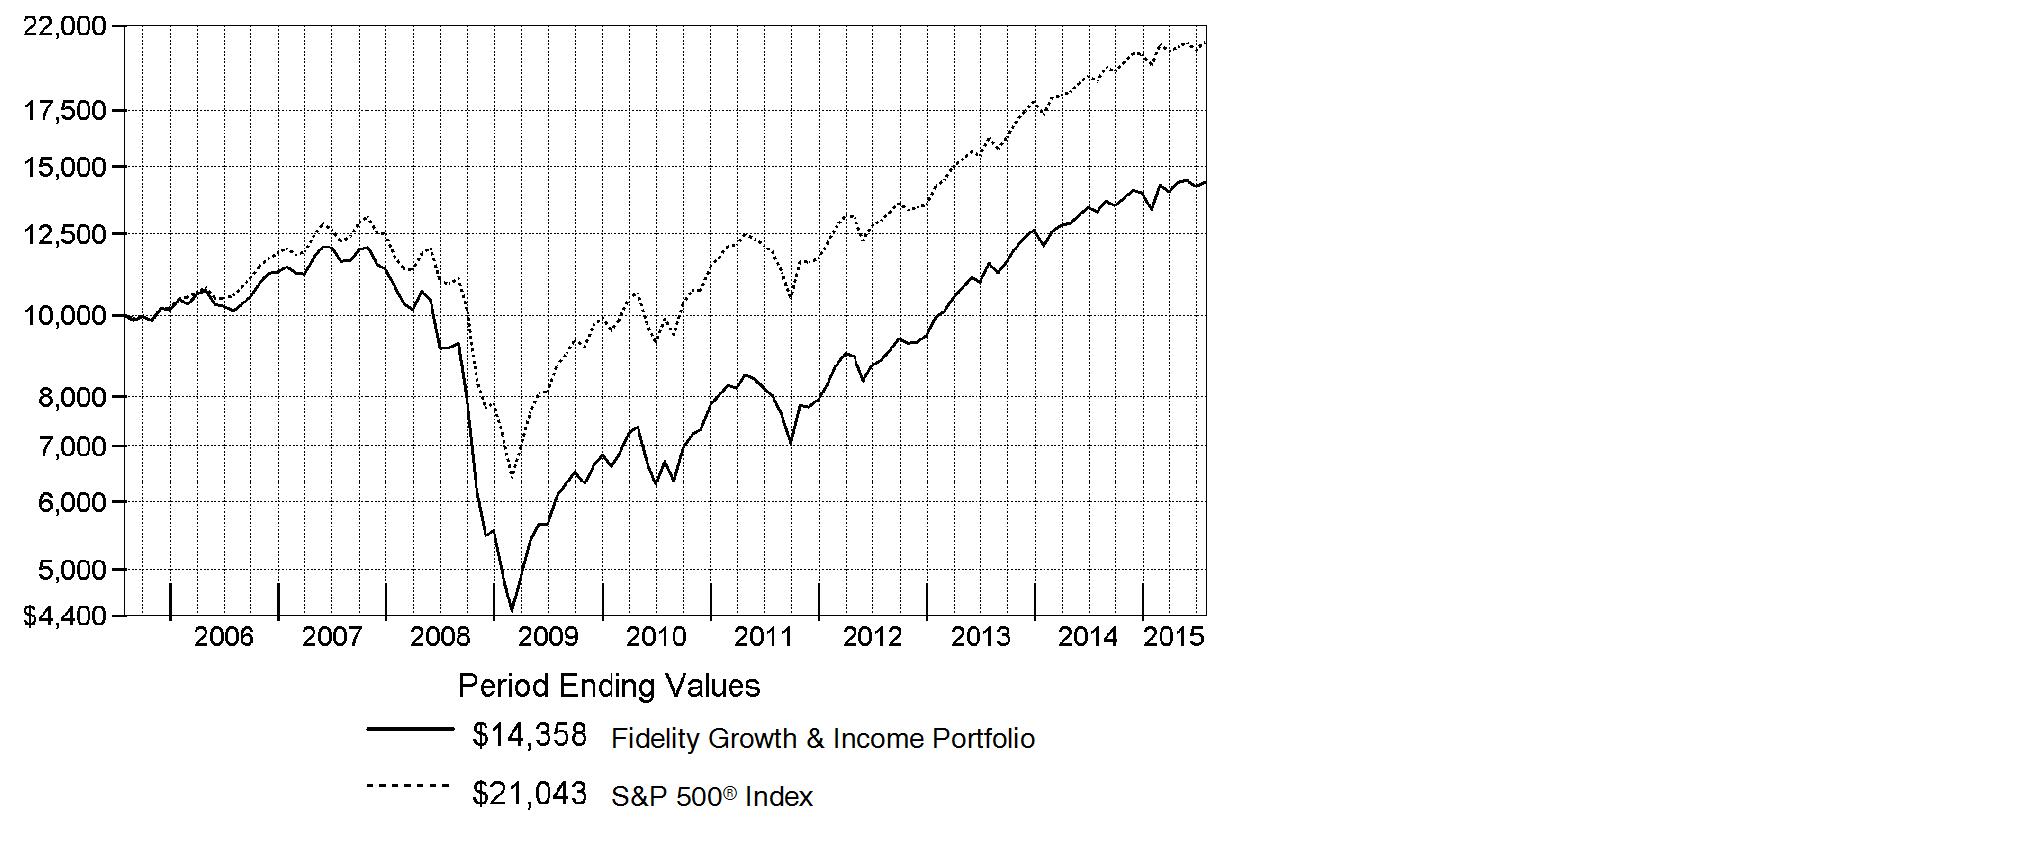
Annual Report
Market Recap: The U.S. equity market gained strongly for the 12 months ending July 31, 2015, as stocks recovered from volatility in late 2014 and early 2015, supported by a still-positive economic backdrop. The S&P 500® Index returned 11.21%, with growth stocks in the index far outpacing value-oriented names on prospects for continued U.S. economic growth. Consequently, the growth-oriented Nasdaq Composite Index® rose 18.71%, outpacing the broader S&P 500®, as well as the 12.03% advance of the smaller-cap Russell 2000® Index. Within the S&P 500®, seven of 10 sectors notched a gain, with significant performance variation. Health care (+27%) led the way, aided by merger activity. Consumer discretionary (+24%) benefited from spending linked to a seven-year low in unemployment. Strong first halves for the consumer staples sector and the real estate segment of financials yielded above-market returns (19% and 12%, respectively) for the full-year period. Conversely, energy (-26%) significantly lagged, due to a roughly 55% decline for U.S. crude-oil prices. Materials (-4%) also lost ground. At period end, investors remained focused on the slowing rate of U.S. earnings growth, the possible effect of a relatively stronger U.S. dollar on exports and inflation, and whether an economic slowdown in China would create ripples for the global economy.
Comments from Portfolio Manager Matthew Fruhan: For the year, the fund's share classes lagged the benchmark S&P 500® Index. (For specific class-level results, please see the Performance section of this report.) Versus the benchmark, the biggest negative was our unhelpful underweighting and subpar stock picking in the market-leading health care sector. Positioning in energy also hurt the relative result, as did currency effects. Conversely, the fund benefited from stock selections in the information technology and financials sectors. On the negative side, most stocks with significant correlation to the price of oil struggled, including Canada's Suncor Energy, a non-benchmark holding that also was hurt by the rising value of the U.S. dollar versus the Canadian dollar. Other energy laggards included Chevron and Apache. However, largely avoiding energy giant Exxon Mobil, a high-quality company whose valuation I found less attractive than its competitors, contributed meaningfully to the fund's relative result. In the consumer discretionary sector, the fund was hurt most by not owning Internet retailer Amazon.com, an index constituent whose shares rose about 71% the past year. Meanwhile, within financials, JPMorgan Chase, our largest individual position and biggest overweighting, added to performance. The company provided what I considered a compelling risk/reward tradeoff. In consumer discretionary, retailers Target and Lowe's also added value.
The views expressed above reflect those of the portfolio manager(s) only through the end of the period as stated on the cover of this report and do not necessarily represent the views of Fidelity or any other person in the Fidelity organization. Any such views are subject to change at any time based upon market or other conditions and Fidelity disclaims any responsibility to update such views. These views may not be relied on as investment advice and, because investment decisions for a Fidelity fund are based on numerous factors, may not be relied on as an indication of trading intent on behalf of any Fidelity fund.
Annual Report
Shareholder Expense Example
As a shareholder of the Fund, you incur two types of costs: (1) transaction costs and (2) ongoing costs, including management fees and other Fund expenses. This Example is intended to help you understand your ongoing costs (in dollars) of investing in the Fund and to compare these costs with the ongoing costs of investing in other mutual funds.
The Example is based on an investment of $1,000 invested at the beginning of the period and held for the entire period (February 1, 2015 to July 31, 2015).
Actual Expenses
The first line of the accompanying table for each class of the Fund provides information about actual account values and actual expenses. You may use the information in this line, together with the amount you invested, to estimate the expenses that you paid over the period. Simply divide your account value by $1,000.00 (for example, an $8,600 account value divided by $1,000.00 = 8.6), then multiply the result by the number in the first line for a class of the Fund under the heading entitled "Expenses Paid During Period" to estimate the expenses you paid on your account during this period. A small balance maintenance fee of $12.00 that is charged once a year may apply for certain accounts with a value of less than $2,000. This fee is not included in the table below. If it was, the estimate of expenses you paid during the period would be higher, and your ending account value lower, by this amount. In addition, the Fund, as a shareholder in the underlying Fidelity Central Funds, will indirectly bear its pro-rata share of the fees and expenses incurred by the underlying Fidelity Central Funds. These fees and expenses are not included in the Fund's annualized expense ratio used to calculate the expense estimate in the table below.
Hypothetical Example for Comparison Purposes
The second line of the accompanying table for each class of the Fund provides information about hypothetical account values and hypothetical expenses based on a Class' actual expense ratio and an assumed rate of return of 5% per year before expenses, which is not the Class' actual return. The hypothetical account values and expenses may not be used to estimate the actual ending account balance or expenses you paid for the period. You may use this information to compare the ongoing costs of investing in the Fund and other funds. To do so, compare this 5% hypothetical example with the 5% hypothetical examples that appear in the shareholder reports of the other funds. A small balance maintenance fee of $12.00 that is charged once a year may apply for certain accounts with a value of less than $2,000. This fee is not included in the table below. If it was, the estimate of expenses you paid during the period would be higher, and your ending account value lower, by this amount. In addition, the Fund, as a shareholder in the underlying Fidelity Central Funds, will indirectly bear its pro-rata share of the fees and expenses incurred by the underlying Fidelity Central Funds. These fees and expenses are not included in the Fund's annualized expense ratio used to calculate the expense estimate in the table below.
Please note that the expenses shown in the table are meant to highlight your ongoing costs only and do not reflect any transaction costs. Therefore, the second line of the table is useful in comparing ongoing costs only, and will not help you determine the relative total costs of owning different funds.
Annual Report
Shareholder Expense Example - continued
| Annualized
Expense Ratio B | Beginning
Account Value
February 1, 2015 | Ending
Account Value
July 31, 2015 | Expenses Paid
During Period*
February 1, 2015
to July 31, 2015 |
Growth and Income | .63% | | | |
Actual | | $ 1,000.00 | $ 1,078.40 | $ 3.25 |
Hypothetical A | | $ 1,000.00 | $ 1,021.67 | $ 3.16 |
Class K | .52% | | | |
Actual | | $ 1,000.00 | $ 1,078.50 | $ 2.68 |
Hypothetical A | | $ 1,000.00 | $ 1,022.22 | $ 2.61 |
A 5% return per year before expenses
B Annualized expense ratio reflects expenses net of applicable fee waivers
* Expenses are equal to each Class' annualized expense ratio, multiplied by the average account value over the period, multiplied by 181/365 (to reflect the one-half year period).
Annual Report
Investment Changes (Unaudited)
Top Ten Stocks as of July 31, 2015 |
| % of fund's
net assets | % of fund's net assets
6 months ago |
JPMorgan Chase & Co. | 4.4 | 3.9 |
Apple, Inc. | 3.5 | 3.9 |
General Electric Co. | 3.3 | 3.1 |
Microsoft Corp. | 2.9 | 2.9 |
Citigroup, Inc. | 2.8 | 2.2 |
Bank of America Corp. | 2.7 | 2.1 |
Target Corp. | 2.2 | 2.4 |
Procter & Gamble Co. | 2.0 | 2.1 |
Comcast Corp. Class A | 2.0 | 1.9 |
Chevron Corp. | 1.8 | 2.3 |
| 27.6 | |
Top Five Market Sectors as of July 31, 2015 |
| % of fund's
net assets | % of fund's net assets
6 months ago |
Financials | 22.9 | 20.5 |
Information Technology | 21.8 | 20.0 |
Industrials | 12.7 | 13.1 |
Health Care | 10.8 | 9.9 |
Consumer Discretionary | 9.5 | 10.6 |
Asset Allocation (% of fund's net assets) |
As of July 31, 2015* | As of January 31, 2015** |
 | Stocks 98.8% | |  | Stocks 98.9% | |
 | Convertible
Securities 1.0% | |  | Convertible
Securities 1.0% | |
 | Other Investments 0.1% | |  | Other Investments 0.1% | |
 | Short-Term
Investments and
Net Other Assets (Liabilities) 0.1% | |  | Short-Term
Investments and
Net Other Assets (Liabilities) 0.0% | |
* Foreign investments | 11.9% | | ** Foreign investments | 12.5% | |

Annual Report
Investments July 31, 2015
Showing Percentage of Net Assets
Common Stocks - 98.8% |
| Shares | | Value (000s) |
CONSUMER DISCRETIONARY - 9.5% |
Automobiles - 0.2% |
Harley-Davidson, Inc. | 206,700 | | $ 12,051 |
Diversified Consumer Services - 0.4% |
H&R Block, Inc. | 762,607 | | 25,387 |
Hotels, Restaurants & Leisure - 1.1% |
Las Vegas Sands Corp. | 442,000 | | 24,770 |
Yum! Brands, Inc. | 633,744 | | 55,617 |
| | 80,387 |
Household Durables - 0.2% |
Tupperware Brands Corp. | 276,800 | | 16,184 |
Leisure Products - 0.1% |
Mattel, Inc. | 367,800 | | 8,537 |
Media - 4.2% |
Comcast Corp. Class A | 2,304,700 | | 143,836 |
Scripps Networks Interactive, Inc. Class A (e) | 348,489 | | 21,808 |
Sinclair Broadcast Group, Inc. Class A (e) | 733,661 | | 21,291 |
Time Warner, Inc. | 1,039,017 | | 91,475 |
Viacom, Inc. Class B (non-vtg.) | 554,000 | | 31,578 |
| | 309,988 |
Multiline Retail - 2.2% |
Dillard's, Inc. Class A | 42,500 | | 4,330 |
Target Corp. | 1,971,675 | | 161,382 |
| | 165,712 |
Specialty Retail - 1.1% |
Lowe's Companies, Inc. | 1,213,879 | | 84,195 |
TOTAL CONSUMER DISCRETIONARY | | 702,441 |
CONSUMER STAPLES - 8.8% |
Beverages - 3.0% |
Diageo PLC | 1,403,746 | | 39,351 |
Molson Coors Brewing Co. Class B | 116,700 | | 8,302 |
PepsiCo, Inc. | 454,114 | | 43,754 |
SABMiller PLC | 464,448 | | 24,403 |
The Coca-Cola Co. | 2,569,703 | | 105,563 |
| | 221,373 |
Food & Staples Retailing - 1.1% |
CVS Health Corp. | 508,304 | | 57,169 |
Walgreens Boots Alliance, Inc. | 295,084 | | 28,514 |
| | 85,683 |
Common Stocks - continued |
| Shares | | Value (000s) |
CONSUMER STAPLES - continued |
Food Products - 0.0% |
The J.M. Smucker Co. | 20,100 | | $ 2,245 |
Household Products - 2.0% |
Procter & Gamble Co. | 1,916,515 | | 146,997 |
Tobacco - 2.7% |
British American Tobacco PLC sponsored ADR | 715,523 | | 85,147 |
Imperial Tobacco Group PLC | 228,799 | | 12,023 |
Philip Morris International, Inc. | 914,371 | | 78,206 |
Reynolds American, Inc. | 300,300 | | 25,763 |
| | 201,139 |
TOTAL CONSUMER STAPLES | | 657,437 |
ENERGY - 8.4% |
Energy Equipment & Services - 1.0% |
Ensco PLC Class A | 1,532,823 | | 25,414 |
Oceaneering International, Inc. | 644,000 | | 25,773 |
Schlumberger Ltd. | 247,232 | | 20,476 |
| | 71,663 |
Oil, Gas & Consumable Fuels - 7.4% |
Apache Corp. | 926,168 | | 42,474 |
Chevron Corp. | 1,531,796 | | 135,533 |
ConocoPhillips Co. | 713,200 | | 35,902 |
EQT Midstream Partners LP | 144,100 | | 11,352 |
Foresight Energy LP | 197,562 | | 1,644 |
Golar LNG Ltd. | 559,200 | | 24,085 |
Imperial Oil Ltd. | 1,392,700 | | 51,529 |
Kinder Morgan, Inc. | 506,000 | | 17,528 |
Legacy Reserves LP | 936,300 | | 7,313 |
Markwest Energy Partners LP | 915,654 | | 59,920 |
PrairieSky Royalty Ltd. (e) | 548,700 | | 11,265 |
Suncor Energy, Inc. | 3,668,350 | | 103,331 |
The Williams Companies, Inc. | 810,772 | | 42,549 |
Williams Partners LP | 105,985 | | 4,889 |
| | 549,314 |
TOTAL ENERGY | | 620,977 |
FINANCIALS - 22.8% |
Banks - 15.3% |
Bank of America Corp. | 11,173,256 | | 199,778 |
Common Stocks - continued |
| Shares | | Value (000s) |
FINANCIALS - continued |
Banks - continued |
Citigroup, Inc. | 3,519,330 | | $ 205,740 |
Comerica, Inc. | 435,500 | | 20,656 |
Commerce Bancshares, Inc. | 221,000 | | 10,407 |
Fifth Third Bancorp | 813,700 | | 17,145 |
First Republic Bank | 64,900 | | 4,140 |
FirstMerit Corp. | 456,200 | | 8,549 |
JPMorgan Chase & Co. | 4,731,692 | | 324,265 |
Lloyds Banking Group PLC | 3,108,300 | | 4,048 |
M&T Bank Corp. | 186,200 | | 24,420 |
PNC Financial Services Group, Inc. | 436,054 | | 42,812 |
Regions Financial Corp. | 2,839,400 | | 29,501 |
Standard Chartered PLC (United Kingdom) | 2,586,563 | | 39,593 |
SunTrust Banks, Inc. | 1,630,466 | | 72,295 |
U.S. Bancorp | 1,760,973 | | 79,614 |
UMB Financial Corp. | 170,200 | | 9,330 |
Wells Fargo & Co. | 796,641 | | 46,102 |
| | 1,138,395 |
Capital Markets - 5.1% |
Charles Schwab Corp. | 1,305,943 | | 45,551 |
Invesco Ltd. | 106,900 | | 4,126 |
KKR & Co. LP | 2,044,543 | | 48,865 |
Morgan Stanley | 1,270,397 | | 49,342 |
Northern Trust Corp. | 699,364 | | 53,494 |
Oaktree Capital Group LLC Class A | 240,200 | | 13,257 |
State Street Corp. | 1,562,327 | | 119,612 |
The Blackstone Group LP | 761,000 | | 29,869 |
TPG Specialty Lending, Inc. | 1,017,845 | | 18,118 |
| | 382,234 |
Insurance - 1.6% |
ACE Ltd. | 20,600 | | 2,241 |
Brown & Brown, Inc. | 147,700 | | 4,941 |
Marsh & McLennan Companies, Inc. | 302,846 | | 17,547 |
MetLife, Inc. | 1,136,440 | | 63,345 |
Principal Financial Group, Inc. | 497,900 | | 27,638 |
| | 115,712 |
Real Estate Investment Trusts - 0.5% |
American Tower Corp. | 59,000 | | 5,611 |
First Potomac Realty Trust | 183,418 | | 2,082 |
Lamar Advertising Co. Class A | 62,600 | | 3,759 |
Sabra Health Care REIT, Inc. | 223,000 | | 6,099 |
Common Stocks - continued |
| Shares | | Value (000s) |
FINANCIALS - continued |
Real Estate Investment Trusts - continued |
Ventas, Inc. | 139,700 | | $ 9,372 |
WP Carey, Inc. | 129,800 | | 7,942 |
| | 34,865 |
Thrifts & Mortgage Finance - 0.3% |
Radian Group, Inc. | 1,051,368 | | 19,408 |
TOTAL FINANCIALS | | 1,690,614 |
HEALTH CARE - 10.0% |
Biotechnology - 1.8% |
Amgen, Inc. | 466,303 | | 82,344 |
Baxalta, Inc. | 46,700 | | 1,533 |
Biogen, Inc. (a) | 123,900 | | 39,497 |
Intercept Pharmaceuticals, Inc. (a) | 38,926 | | 10,269 |
| | 133,643 |
Health Care Equipment & Supplies - 1.4% |
Abbott Laboratories | 428,404 | | 21,716 |
Ansell Ltd. | 266,311 | | 4,878 |
Medtronic PLC | 484,330 | | 37,967 |
St. Jude Medical, Inc. | 155,200 | | 11,457 |
Zimmer Biomet Holdings, Inc. | 297,810 | | 30,993 |
| | 107,011 |
Health Care Providers & Services - 1.6% |
Cardinal Health, Inc. | 160,900 | | 13,673 |
Express Scripts Holding Co. (a) | 209,200 | | 18,843 |
McKesson Corp. | 302,387 | | 66,698 |
Patterson Companies, Inc. | 366,270 | | 18,372 |
| | 117,586 |
Pharmaceuticals - 5.2% |
AbbVie, Inc. | 183,900 | | 12,875 |
Astellas Pharma, Inc. | 775,300 | | 11,679 |
GlaxoSmithKline PLC sponsored ADR | 2,086,722 | | 90,647 |
Johnson & Johnson | 1,342,669 | | 134,549 |
Novartis AG sponsored ADR | 227,144 | | 23,566 |
Teva Pharmaceutical Industries Ltd. sponsored ADR | 1,477,020 | | 101,944 |
Theravance, Inc. (e) | 858,600 | | 13,154 |
| | 388,414 |
TOTAL HEALTH CARE | | 746,654 |
Common Stocks - continued |
| Shares | | Value (000s) |
INDUSTRIALS - 12.7% |
Aerospace & Defense - 2.2% |
Meggitt PLC | 3,191,000 | | $ 23,147 |
Rolls-Royce Group PLC | 156,700 | | 1,943 |
The Boeing Co. | 660,089 | | 95,165 |
United Technologies Corp. | 447,082 | | 44,847 |
| | 165,102 |
Air Freight & Logistics - 1.8% |
C.H. Robinson Worldwide, Inc. | 65,900 | | 4,623 |
FedEx Corp. | 46,000 | | 7,885 |
PostNL NV (a) | 4,575,900 | | 19,660 |
United Parcel Service, Inc. Class B | 1,012,004 | | 103,589 |
| | 135,757 |
Airlines - 0.2% |
Copa Holdings SA Class A | 219,700 | | 16,594 |
Building Products - 0.2% |
Lennox International, Inc. | 121,300 | | 14,322 |
Commercial Services & Supplies - 0.7% |
ADT Corp. (e) | 982,810 | | 33,936 |
KAR Auction Services, Inc. | 527,100 | | 20,520 |
| | 54,456 |
Electrical Equipment - 0.8% |
Emerson Electric Co. | 551,600 | | 28,545 |
Hubbell, Inc. Class B | 260,639 | | 27,213 |
| | 55,758 |
Industrial Conglomerates - 3.3% |
General Electric Co. | 9,426,180 | | 246,023 |
Machinery - 0.8% |
Deere & Co. | 245,800 | | 23,245 |
Donaldson Co., Inc. | 230,200 | | 7,735 |
IMI PLC | 398,000 | | 6,595 |
Joy Global, Inc. | 156,000 | | 4,120 |
Pentair PLC | 114,800 | | 6,981 |
Valmont Industries, Inc. | 43,000 | | 4,783 |
Xylem, Inc. | 74,400 | | 2,569 |
| | 56,028 |
Professional Services - 0.1% |
Acacia Research Corp. | 415,902 | | 3,914 |
Road & Rail - 2.1% |
CSX Corp. | 2,045,320 | | 63,978 |
J.B. Hunt Transport Services, Inc. | 570,540 | | 47,994 |
Common Stocks - continued |
| Shares | | Value (000s) |
INDUSTRIALS - continued |
Road & Rail - continued |
Kansas City Southern | 229,200 | | $ 22,734 |
Norfolk Southern Corp. | 253,899 | | 21,411 |
| | 156,117 |
Trading Companies & Distributors - 0.5% |
W.W. Grainger, Inc. | 11,500 | | 2,630 |
Watsco, Inc. | 287,892 | | 36,919 |
| | 39,549 |
TOTAL INDUSTRIALS | | 943,620 |
INFORMATION TECHNOLOGY - 21.7% |
Communications Equipment - 3.2% |
Cisco Systems, Inc. | 3,830,752 | | 108,870 |
QUALCOMM, Inc. | 1,977,146 | | 127,308 |
| | 236,178 |
Internet Software & Services - 3.4% |
Google, Inc.: | | | |
Class A (a) | 185,007 | | 121,642 |
Class C | 163,146 | | 102,066 |
Yahoo!, Inc. (a) | 651,595 | | 23,894 |
| | 247,602 |
IT Services - 5.9% |
Cognizant Technology Solutions Corp. Class A (a) | 456,172 | | 28,784 |
Fidelity National Information Services, Inc. | 237,736 | | 15,555 |
IBM Corp. | 534,204 | | 86,536 |
Leidos Holdings, Inc. | 57,200 | | 2,334 |
MasterCard, Inc. Class A | 931,800 | | 90,757 |
Paychex, Inc. | 1,735,657 | | 80,534 |
The Western Union Co. | 921,480 | | 18,651 |
Unisys Corp. (a) | 885,200 | | 14,048 |
Visa, Inc. Class A | 1,352,184 | | 101,874 |
| | 439,073 |
Semiconductors & Semiconductor Equipment - 0.6% |
Analog Devices, Inc. | 75,300 | | 4,392 |
Broadcom Corp. Class A | 269,582 | | 13,644 |
Marvell Technology Group Ltd. | 951,500 | | 11,837 |
Maxim Integrated Products, Inc. | 464,200 | | 15,801 |
| | 45,674 |
Common Stocks - continued |
| Shares | | Value (000s) |
INFORMATION TECHNOLOGY - continued |
Software - 3.6% |
Microsoft Corp. | 4,643,599 | | $ 216,856 |
Oracle Corp. | 1,281,653 | | 51,189 |
| | 268,045 |
Technology Hardware, Storage & Peripherals - 5.0% |
Apple, Inc. | 2,126,394 | | 257,932 |
EMC Corp. | 2,861,300 | | 76,940 |
First Data Holdings, Inc. Class B (a)(h) | 5,155,476 | | 25,520 |
Western Digital Corp. | 147,900 | | 12,728 |
| | 373,120 |
TOTAL INFORMATION TECHNOLOGY | | 1,609,692 |
MATERIALS - 3.3% |
Chemicals - 2.8% |
Airgas, Inc. | 400,206 | | 40,829 |
E.I. du Pont de Nemours & Co. | 335,446 | | 18,704 |
Eastman Chemical Co. | 7,500 | | 588 |
LyondellBasell Industries NV Class A | 62,500 | | 5,864 |
Monsanto Co. | 708,415 | | 72,180 |
Potash Corp. of Saskatchewan, Inc. | 759,200 | | 20,654 |
Syngenta AG (Switzerland) | 108,585 | | 44,734 |
The Chemours Co. LLC | 132,309 | | 1,445 |
Tronox Ltd. Class A | 356,700 | | 3,917 |
| | 208,915 |
Containers & Packaging - 0.2% |
Packaging Corp. of America | 105,300 | | 7,454 |
WestRock Co. | 162,100 | | 10,222 |
| | 17,676 |
Metals & Mining - 0.2% |
Freeport-McMoRan, Inc. | 1,278,500 | | 15,022 |
Paper & Forest Products - 0.1% |
Domtar Corp. | 91,900 | | 3,737 |
International Paper Co. | 46,700 | | 2,236 |
| | 5,973 |
TOTAL MATERIALS | | 247,586 |
Common Stocks - continued |
| Shares | | Value (000s) |
TELECOMMUNICATION SERVICES - 1.4% |
Diversified Telecommunication Services - 1.4% |
TDC A/S | 593,200 | | $ 4,474 |
Verizon Communications, Inc. | 2,058,974 | | 96,339 |
| | 100,813 |
UTILITIES - 0.2% |
Electric Utilities - 0.2% |
PPL Corp. | 156,700 | | 4,985 |
Southern Co. | 260,900 | | 11,670 |
| | 16,655 |
TOTAL COMMON STOCKS (Cost $6,165,027) |
7,336,489
|
Convertible Preferred Stocks - 0.8% |
| | | |
CONSUMER DISCRETIONARY - 0.0% |
Leisure Products - 0.0% |
NJOY, Inc. Series D (a)(h) | 68,794 | | 34 |
HEALTH CARE - 0.8% |
Health Care Equipment & Supplies - 0.8% |
Alere, Inc. 3.00% | 185,143 | | 61,416 |
TOTAL CONVERTIBLE PREFERRED STOCKS (Cost $46,947) |
61,450
|
Convertible Bonds - 0.2% |
| Principal Amount
(000s) (d) | | |
CONSUMER DISCRETIONARY - 0.0% |
Automobiles - 0.0% |
Tesla Motors, Inc. 1.25% 3/1/21 | | $ 3,470 | | 3,388 |
ENERGY - 0.1% |
Oil, Gas & Consumable Fuels - 0.1% |
Amyris, Inc.: | | | | |
3% 2/27/17 | | 5,615 | | 4,982 |
5% 10/15/18 (h) | | 3,018 | | 2,501 |
Peabody Energy Corp. 4.75% 12/15/41 | | 7,660 | | 847 |
| | 8,330 |
Convertible Bonds - continued |
| Principal Amount
(000s) (d) | | Value (000s) |
INFORMATION TECHNOLOGY - 0.1% |
Internet Software & Services - 0.1% |
Twitter, Inc. 0.25% 9/15/19 (f) | | $ 5,840 | | $ 5,139 |
TOTAL CONVERTIBLE BONDS (Cost $22,706) |
16,857
|
Preferred Securities - 0.1% |
|
FINANCIALS - 0.1% |
Diversified Financial Services - 0.1% |
Baggot Securities Ltd. 10.24% (f)(g) (Cost $4,623) | EUR | 3,010 | |
3,559
|
Money Market Funds - 0.6% |
| Shares | | |
Fidelity Securities Lending Cash Central Fund, 0.18% (b)(c)
(Cost $42,660) | 42,659,669 | |
42,660
|
TOTAL INVESTMENT PORTFOLIO - 100.5% (Cost $6,281,963) | | 7,461,015 |
NET OTHER ASSETS (LIABILITIES) - (0.5)% | | (36,820) |
NET ASSETS - 100% | $ 7,424,195 |
Currency Abbreviations |
EUR | - | European Monetary Unit |
Legend |
(a) Non-income producing |
(b) Affiliated fund that is generally available only to investment companies and other accounts managed by Fidelity Investments. The rate quoted is the annualized seven-day yield of the fund at period end. A complete unaudited listing of the fund's holdings as of its most recent quarter end is available upon request. In addition, each Fidelity Central Fund's financial statements, which are not covered by the Fund's Report of Independent Registered Public Accounting Firm, are available on the SEC's website or upon request. |
(c) Investment made with cash collateral received from securities on loan. |
(d) Amount is stated in United States dollars unless otherwise noted. |
(e) Security or a portion of the security is on loan at period end. |
(f) Security exempt from registration under Rule 144A of the Securities Act of 1933. These securities may be resold in transactions exempt from registration, normally to qualified institutional buyers. At the end of the period, the value of these securities amounted to $8,698,000 or 0.1% of net assets. |
(g) Security is perpetual in nature with no stated maturity date. |
(h) Restricted securities - Investment in securities not registered under the Securities Act of 1933 (excluding 144A issues). At the end of the period, the value of restricted securities (excluding 144A issues) amounted to $28,055,000 or 0.4% of net assets. |
Additional information on each restricted holding is as follows: |
Security | Acquisition Date | Acquisition Cost (000s) |
Amyris, Inc. 5% 10/15/18 | 10/16/13 | $ 2,800 |
First Data Holdings, Inc. Class B | 6/26/14 | $ 20,622 |
NJOY, Inc.
Series D | 2/14/14 | $ 1,164 |
Affiliated Central Funds |
Information regarding fiscal year to date income earned by the Fund from investments in Fidelity Central Funds is as follows: |
Fund | Income earned
(Amounts in thousands) |
Fidelity Cash Central Fund | $ 11 |
Fidelity Securities Lending Cash Central Fund | 735 |
Total | $ 746 |
Other Information |
The following is a summary of the inputs used, as of July 31, 2015, involving the Fund's assets and liabilities carried at fair value. The inputs or methodology used for valuing securities may not be an indication of the risk associated with investing in those securities. For more information on valuation inputs, and their aggregation into the levels used in the table below, please refer to the Investment Valuation section in the accompanying Notes to Financial Statements. |
Valuation Inputs at Reporting Date: |
Description
(Amounts in thousands) | Total | Level 1 | Level 2 | Level 3 |
Investments in Securities: | | | | |
Equities: | | | | |
Consumer Discretionary | $ 702,475 | $ 702,441 | $ - | $ 34 |
Consumer Staples | 657,437 | 618,086 | 39,351 | - |
Energy | 620,977 | 620,977 | - | - |
Financials | 1,690,614 | 1,686,566 | 4,048 | - |
Health Care | 808,070 | 808,070 | - | - |
Industrials | 943,620 | 943,620 | - | - |
Information Technology | 1,609,692 | 1,584,172 | - | 25,520 |
Materials | 247,586 | 202,852 | 44,734 | - |
Telecommunication Services | 100,813 | 100,813 | - | - |
Utilities | 16,655 | 16,655 | - | - |
Corporate Bonds | 16,857 | - | 16,857 | - |
Preferred Securities | 3,559 | - | 3,559 | - |
Money Market Funds | 42,660 | 42,660 | - | - |
Total Investments in Securities: | $ 7,461,015 | $ 7,326,912 | $ 108,549 | $ 25,554 |
Distribution of investments by country or territory of incorporation, as a percentage of total net assets, is as follows (Unaudited): |
United States of America | 88.1% |
United Kingdom | 4.6% |
Canada | 2.5% |
Israel | 1.4% |
Others (Individually Less Than 1%) | 3.4% |
| 100.0% |
See accompanying notes which are an integral part of the financial statements.
Annual Report
Statement of Assets and Liabilities
Amounts in thousands (except per-share amounts) | | July 31, 2015 |
| | |
Assets | | |
Investment in securities, at value (including securities loaned of $42,222) - See accompanying schedule: Unaffiliated issuers (cost $6,239,303) | $ 7,418,355 | |
Fidelity Central Funds (cost $42,660) | 42,660 | |
Total Investments (cost $6,281,963) | | $ 7,461,015 |
Foreign currency held at value (cost $242) | | 243 |
Receivable for investments sold | | 43,373 |
Receivable for fund shares sold | | 6,259 |
Dividends receivable | | 9,373 |
Interest receivable | | 187 |
Distributions receivable from Fidelity Central Funds | | 49 |
Other receivables | | 767 |
Total assets | | 7,521,266 |
| | |
Liabilities | | |
Payable for investments purchased | $ 38,409 | |
Payable for fund shares redeemed | 4,261 | |
Accrued management fee | 2,777 | |
Notes payable to affiliates | 7,108 | |
Other affiliated payables | 1,041 | |
Other payables and accrued expenses | 815 | |
Collateral on securities loaned, at value | 42,660 | |
Total liabilities | | 97,071 |
| | |
Net Assets | | $ 7,424,195 |
Net Assets consist of: | | |
Paid in capital | | $ 8,922,704 |
Distributions in excess of net investment income | | (722) |
Accumulated undistributed net realized gain (loss) on investments and foreign currency transactions | | (2,676,809) |
Net unrealized appreciation (depreciation) on investments and assets and liabilities in foreign currencies | | 1,179,022 |
Net Assets | | $ 7,424,195 |
See accompanying notes which are an integral part of the financial statements.
Annual Report
Statement of Assets and Liabilities - continued
Amounts in thousands (except per-share amounts) | | July 31, 2015 |
| | |
Growth and Income:
Net Asset Value, offering price and redemption price per share ($6,562,578 ÷ 212,744 shares) | | $ 30.85 |
| | |
Class K:
Net Asset Value, offering price and redemption price per share ($861,617 ÷ 27,953 shares) | | $ 30.82 |
See accompanying notes which are an integral part of the financial statements.
Annual Report
Financial Statements - continued
Statement of Operations
Amounts in thousands | Year ended July 31, 2015 |
| | |
Investment Income | | |
Dividends | | $ 185,479 |
Interest | | 887 |
Income from Fidelity Central Funds | | 746 |
Total income | | 187,112 |
| | |
Expenses | | |
Management fee | $ 34,114 | |
Transfer agent fees | 11,401 | |
Accounting and security lending fees | 1,203 | |
Custodian fees and expenses | 181 | |
Independent trustees' compensation | 36 | |
Registration fees | 82 | |
Audit | 101 | |
Legal | 45 | |
Interest | 6 | |
Miscellaneous | 51 | |
Total expenses before reductions | 47,220 | |
Expense reductions | (268) | 46,952 |
Net investment income (loss) | | 140,160 |
Realized and Unrealized Gain (Loss) Net realized gain (loss) on: | | |
Investment securities: | | |
Unaffiliated issuers | 743,232 | |
Foreign currency transactions | 28 | |
Total net realized gain (loss) | | 743,260 |
Change in net unrealized appreciation (depreciation) on: Investment securities | (281,491) | |
Assets and liabilities in foreign currencies | (28) | |
Total change in net unrealized appreciation (depreciation) | | (281,519) |
Net gain (loss) | | 461,741 |
Net increase (decrease) in net assets resulting from operations | | $ 601,901 |
See accompanying notes which are an integral part of the financial statements.
Annual Report
Statement of Changes in Net Assets
Amounts in thousands | Year ended
July 31,
2015 | Year ended
July 31,
2014 |
Increase (Decrease) in Net Assets | | |
Operations | | |
Net investment income (loss) | $ 140,160 | $ 138,369 |
Net realized gain (loss) | 743,260 | 863,680 |
Change in net unrealized appreciation (depreciation) | (281,519) | 38,912 |
Net increase (decrease) in net assets resulting from operations | 601,901 | 1,040,961 |
Distributions to shareholders from net investment income | (135,475) | (133,552) |
Distributions to shareholders from net realized gain | - | (1,626) |
Total distributions | (135,475) | (135,178) |
Share transactions - net increase (decrease) | (551,906) | (472,170) |
Total increase (decrease) in net assets | (85,480) | 433,613 |
| | |
Net Assets | | |
Beginning of period | 7,509,675 | 7,076,062 |
End of period (including distributions in excess of net investment income of $722 and undistributed net investment income of $3,054, respectively) | $ 7,424,195 | $ 7,509,675 |
See accompanying notes which are an integral part of the financial statements.
Annual Report
Financial Highlights - Growth & Income
Years ended July 31, | 2015 | 2014 | 2013 | 2012 | 2011 |
Selected Per-Share Data | | | | | |
Net asset value, beginning of period | $ 29.02 | $ 25.66 | $ 20.13 | $ 18.58 | $ 15.75 |
Income from Investment Operations | | | | | |
Net investment income (loss) B | .55 | .51 | .46 | .36 | .20 |
Net realized and unrealized gain (loss) | 1.82 H | 3.35 | 5.54 | 1.55 | 2.82 |
Total from investment operations | 2.37 | 3.86 | 6.00 | 1.91 | 3.02 |
Distributions from net investment income | (.54) | (.50) | (.44) | (.35) | (.19) |
Distributions from net realized gain | - | (.01) | (.03) | (.01) | - |
Total distributions | (.54) | (.50) G | (.47) | (.36) | (.19) |
Net asset value, end of period | $ 30.85 | $ 29.02 | $ 25.66 | $ 20.13 | $ 18.58 |
Total Return A | 8.23% H | 15.16% | 30.15% | 10.45% | 19.16% |
Ratios to Average Net Assets C, E | | | | | |
Expenses before reductions | .64% | .65% | .68% | .71% | .72% |
Expenses net of fee waivers, if any | .63% | .65% | .68% | .71% | .72% |
Expenses net of all reductions | .63% | .65% | .67% | .71% | .71% |
Net investment income (loss) | 1.83% | 1.86% | 2.04% | 1.95% | 1.09% |
Supplemental Data | | | | | |
Net assets, end of period (in millions) | $ 6,563 | $ 6,550 | $ 6,060 | $ 4,863 | $ 5,052 |
Portfolio turnover rate D | 35% | 41% F | 49% | 62% | 129% |
A Total returns would have been lower if certain expenses had not been reduced during the applicable periods shown.
B Calculated based on average shares outstanding during the period.
C Fees and expenses of any underlying Fidelity Central Funds are not included in the Fund's expense ratio. The Fund indirectly bears its proportionate share of the expenses of any underlying Fidelity Central Funds.
D Amount does not include the portfolio activity of any underlying Fidelity Central Funds.
E Expense ratios reflect operating expenses of the class. Expenses before reductions do not reflect amounts reimbursed by the investment adviser or reductions from brokerage service arrangements or reductions from other expense offset arrangements and do not represent the amount paid by the class during periods when reimbursements or reductions occur. Expenses net of fee waivers reflect expenses after reimbursement by the investment adviser but prior to reductions from brokerage service arrangements or other expense offset arrangements. Expenses net of all reductions represent the net expenses paid by the class.
F Portfolio turnover rate excludes securities received or delivered in-kind.
G Total distributions of $.50 per share is comprised of distributions from net investment income of $.495 and distributions from net realized gain of $.006 per share.
H Net realized and unrealized gain (loss) per share reflects proceeds received from litigation which amounted to $.06 per share. Excluding these litigation proceeds, the total return would have been 8.03%.
See accompanying notes which are an integral part of the financial statements.
Annual Report
Financial Highlights - Class K
Years ended July 31, | 2015 | 2014 | 2013 | 2012 | 2011 |
Selected Per-Share Data | | | | | |
Net asset value, beginning of period | $ 29.00 | $ 25.64 | $ 20.12 | $ 18.57 | $ 15.74 |
Income from Investment Operations | | | | | |
Net investment income (loss) B | .59 | .54 | .50 | .40 | .23 |
Net realized and unrealized gain (loss) | 1.81 G | 3.36 | 5.52 | 1.54 | 2.82 |
Total from investment operations | 2.40 | 3.90 | 6.02 | 1.94 | 3.05 |
Distributions from net investment income | (.58) | (.53) | (.47) | (.38) | (.22) |
Distributions from net realized gain | - | (.01) | (.03) | (.01) | - |
Total distributions | (.58) | (.54) | (.50) | (.39) | (.22) |
Net asset value, end of period | $ 30.82 | $ 29.00 | $ 25.64 | $ 20.12 | $ 18.57 |
Total Return A | 8.34% G | 15.32% | 30.28% | 10.66% | 19.40% |
Ratios to Average Net Assets C, E | | | | | |
Expenses before reductions | .52% | .52% | .53% | .54% | .54% |
Expenses net of fee waivers, if any | .52% | .52% | .53% | .54% | .54% |
Expenses net of all reductions | .52% | .52% | .52% | .54% | .53% |
Net investment income (loss) | 1.95% | 1.99% | 2.19% | 2.13% | 1.27% |
Supplemental Data | | | | | |
Net assets, end of period (in millions) | $ 862 | $ 960 | $ 1,016 | $ 752 | $ 403 |
Portfolio turnover rate D | 35% | 41% F | 49% | 62% | 129% |
A Total returns would have been lower if certain expenses had not been reduced during the applicable periods shown.
B Calculated based on average shares outstanding during the period.
C Fees and expenses of any underlying Fidelity Central Funds are not included in the Fund's expense ratio. The Fund indirectly bears its proportionate share of the expenses of any underlying Fidelity Central Funds.
D Amount does not include the portfolio activity of any underlying Fidelity Central Funds.
E Expense ratios reflect operating expenses of the class. Expenses before reductions do not reflect amounts reimbursed by the investment adviser or reductions from brokerage service arrangements or reductions from other expense offset arrangements and do not represent the amount paid by the class during periods when reimbursements or reductions occur. Expenses net of fee waivers reflect expenses after reimbursement by the investment adviser but prior to reductions from brokerage service arrangements or other expense offset arrangements. Expenses net of all reductions represent the net expenses paid by the class.
F Portfolio turnover rate excludes securities received or delivered in-kind.
G Net realized and unrealized gain (loss) per share reflects proceeds received from litigation which amounted to $.06 per share. Excluding these litigation proceeds, the total return would have been 8.14%.
See accompanying notes which are an integral part of the financial statements.
Annual Report
For the period ended July 31, 2015
(Amounts in thousands except percentages)
1. Organization.
Fidelity Growth & Income Portfolio (the Fund) is a fund of Fidelity Securities Fund (the Trust) and is authorized to issue an unlimited number of shares. The Trust is registered under the Investment Company Act of 1940, as amended (the 1940 Act), as an open-end management investment company organized as a Massachusetts business trust. The Fund offers Growth & Income and Class K, each of which has equal rights as to assets and voting privileges. Each class has exclusive voting rights with respect to matters that affect that class.
2. Investments in Fidelity Central Funds.
The Fund invests in Fidelity Central Funds, which are open-end investment companies generally available only to other investment companies and accounts managed by the investment adviser and its affiliates. The Fund's Schedule of Investments lists each of the Fidelity Central Funds held as of period end, if any, as an investment of the Fund, but does not include the underlying holdings of each Fidelity Central Fund. As an Investing Fund, the Fund indirectly bears its proportionate share of the expenses of the underlying Fidelity Central Funds.
The Money Market Central Funds seek preservation of capital and current income and are managed by Fidelity Investments Money Management, Inc. (FIMM), an affiliate of the investment adviser. Annualized expenses of the Money Market Central Funds as of their most recent shareholder report date are less than .01%.
A complete unaudited list of holdings for each Fidelity Central Fund is available upon request or at the Securities and Exchange Commission (the SEC) website at www.sec.gov. In addition, the financial statements of the Fidelity Central Funds, which are not covered by the Fund's Report of Independent Registered Public Accounting Firm, are available on the SEC website or upon request.
3. Significant Accounting Policies.
The financial statements have been prepared in conformity with accounting principles generally accepted in the United States of America (GAAP), which require management to make certain estimates and assumptions at the date of the financial statements. Actual results could differ from those estimates. Subsequent events, if any, through the date that the financial statements were issued have been evaluated in the preparation of the financial statements. The following summarizes the significant accounting policies of the Fund:
Investment Valuation. Investments are valued as of 4:00 p.m. Eastern time on the last calendar day of the period. The Board of Trustees (the Board) has delegated the day to day responsibility for the valuation of the Fund's investments to the Fidelity Management & Research Company (FMR) Fair Value Committee (the Committee). In accordance
Annual Report
Notes to Financial Statements - continued
(Amounts in thousands except percentages)
3. Significant Accounting Policies - continued
Investment Valuation - continued
with valuation policies and procedures approved by the Board, the Fund attempts to obtain prices from one or more third party pricing vendors or brokers to value its investments. When current market prices, quotations or currency exchange rates are not readily available or reliable, investments will be fair valued in good faith by the Committee, in accordance with procedures adopted by the Board. Factors used in determining fair value vary by investment type and may include market or investment specific events, changes in interest rates and credit quality. The frequency with which these procedures are used cannot be predicted and they may be utilized to a significant extent. The Committee oversees the Fund's valuation policies and procedures and reports to the Board on the Committee's activities and fair value determinations. The Board monitors the appropriateness of the procedures used in valuing the Fund's investments and ratifies the fair value determinations of the Committee.
The Fund categorizes the inputs to valuation techniques used to value its investments into a disclosure hierarchy consisting of three levels as shown below:
Level 1 - quoted prices in active markets for identical investments
Level 2 - other significant observable inputs (including quoted prices for similar investments, interest rates, prepayment speeds, etc.)
Level 3 - unobservable inputs (including the Fund's own assumptions based on the best information available)
Valuation techniques used to value the Fund's investments by major category are as follows:
Equity securities, including restricted securities, for which market quotations are readily available, are valued at the last reported sale price or official closing price as reported by a third party pricing vendor on the primary market or exchange on which they are traded and are categorized as Level 1 in the hierarchy. In the event there were no sales during the day or closing prices are not available, securities are valued at the last quoted bid price or may be valued using the last available price and are generally categorized as Level 2 in the hierarchy. For foreign equity securities, when market or security specific events arise, comparisons to the valuation of American Depositary Receipts (ADRs), futures contracts, Exchange-Traded Funds (ETFs) and certain indexes as well as quoted prices for similar securities may be used and would be categorized as Level 2 in the hierarchy. Utilizing these techniques may result in transfers between Level 1 and Level 2. For equity securities, including restricted securities, where observable inputs are limited, assumptions about market activity and risk are used and these securities may be categorized as Level 3 in the hierarchy.
Annual Report
3. Significant Accounting Policies - continued
Investment Valuation - continued
Debt securities, including restricted securities, are valued based on evaluated prices received from third party pricing vendors or from brokers who make markets in such securities. Corporate bonds and preferred securities are valued by pricing vendors who utilize matrix pricing which considers yield or price of bonds of comparable quality, coupon, maturity and type or by broker-supplied prices. When independent prices are unavailable or unreliable, debt securities may be valued utilizing pricing methodologies which consider similar factors that would be used by third party pricing vendors. Debt securities are generally categorized as Level 2 in the hierarchy but may be Level 3 depending on the circumstances.
Investments in open-end mutual funds ,including the Fidelity Central Funds, are valued at their closing net asset value (NAV) each business day and are categorized as Level 1 in the hierarchy.
Changes in valuation techniques may result in transfers in or out of an assigned level within the disclosure hierarchy. The aggregate value of investments by input level as of July 31, 2015, is included at the end of the Fund's Schedule of Investments.
Foreign Currency. The Fund may use foreign currency contracts to facilitate transactions in foreign-denominated securities. Gains and losses from these transactions may arise from changes in the value of the foreign currency or if the counterparties do not perform under the contracts' terms.
Foreign-denominated assets, including investment securities, and liabilities are translated into U.S. dollars at the exchange rates at period end. Purchases and sales of investment securities, income and dividends received and expenses denominated in foreign currencies are translated into U.S. dollars at the exchange rate in effect on the transaction date.
The effects of exchange rate fluctuations on investments are included with the net realized and unrealized gain (loss) on investment securities. Other foreign currency transactions resulting in realized and unrealized gain (loss) are disclosed separately.
Investment Transactions and Income. For financial reporting purposes, the Fund's investment holdings and NAV include trades executed through the end of the last business day of the period. The NAV per share for processing shareholder transactions is calculated as of the close of business of the New York Stock Exchange (NYSE), normally 4:00 p.m. Eastern time and includes trades executed through the end of the prior business day. Gains and losses on securities sold are determined on the basis of identified cost and may include proceeds received from litigation. Dividend income is recorded on the ex-dividend date, except for certain dividends from foreign securities where the
Annual Report
Notes to Financial Statements - continued
(Amounts in thousands except percentages)
3. Significant Accounting Policies - continued
Investment Transactions and Income - continued
ex-dividend date may have passed, which are recorded as soon as the Fund is informed of the ex-dividend date. Non-cash dividends included in dividend income, if any, are recorded at the fair market value of the securities received. Income and capital gain distributions from Fidelity Central Funds, if any, are recorded on the ex-dividend date. Distributions received on securities that represent a return of capital or capital gain are recorded as a reduction of cost of investments and/or as a realized gain. Subsequent to ex-dividend date the Fund determines the components of these distributions, based upon receipt of tax filings or other correspondence relating to the underlying investment. Interest income is accrued as earned and includes coupon interest and amortization of premium and accretion of discount on debt securities as applicable. Investment income is recorded net of foreign taxes withheld where recovery of such taxes is uncertain.
Class Allocations and Expenses. Investment income, realized and unrealized capital gains and losses, common expenses of the Fund, and certain fund-level expense reductions, if any, are allocated daily on a pro-rata basis to each class based on the relative net assets of each class to the total net assets of the Fund. Each class differs with respect to transfer agent fees incurred. Certain expense reductions may also differ by class. For the reporting period, the allocated portion of income and expenses to each class as a percent of its average net assets may vary due to the timing of recording these transactions in relation to fluctuating net assets of the classes. Expenses directly attributable to a fund are charged to that fund. Expenses attributable to more than one fund are allocated among the respective funds on the basis of relative net assets or other appropriate methods. Expense estimates are accrued in the period to which they relate and adjustments are made when actual amounts are known.
Deferred Trustee Compensation. Under a Deferred Compensation Plan (the Plan), independent Trustees may elect to defer receipt of a portion of their annual compensation. Deferred amounts are invested in a cross-section of Fidelity funds, are marked-to-market and remain in the Fund until distributed in accordance with the Plan. The investment of deferred amounts and the offsetting payable to the Trustees are included in the accompanying Statement of Assets and Liabilities.
Income Tax Information and Distributions to Shareholders. Each year, the Fund intends to qualify as a regulated investment company under Subchapter M of the Internal Revenue Code, including distributing substantially all of its taxable income and realized gains. As a result, no provision for U.S. Federal income taxes is required. As of July 31, 2015, the Fund did not have any unrecognized tax benefits in the financial statements; nor is the Fund aware of any tax positions for which it is reasonably possible that the total amounts of unrecognized tax benefits will significantly change in the next twelve months. The Fund files a U.S. federal tax return, in addition to state and local tax
Annual Report
3. Significant Accounting Policies - continued
Income Tax Information and Distributions to Shareholders - continued
returns as required. The Fund's federal income tax returns are subject to examination by the Internal Revenue Service (IRS) for a period of three fiscal years after they are filed. State and local tax returns may be subject to examination for an additional fiscal year depending on the jurisdiction. Foreign taxes are provided for based on the Fund's understanding of the tax rules and rates that exist in the foreign markets in which it invests.
Distributions are declared and recorded on the ex-dividend date. Income dividends and capital gain distributions are declared separately for each class. Income and capital gain distributions are determined in accordance with income tax regulations, which may differ from GAAP.
Capital accounts within the financial statements are adjusted for permanent book-tax differences. These adjustments have no impact on net assets or the results of operations. Capital accounts are not adjusted for temporary book-tax differences which will reverse in a subsequent period.
Book-tax differences are primarily due to foreign currency transactions, market discount, partnerships, deferred trustees compensation, certain conversion ratio adjustments, capital loss carryforwards and losses deferred due to wash sales.
The federal tax cost of investment securities and unrealized appreciation (depreciation) as of period end were as follows:
Gross unrealized appreciation | $ 1,529,111 |
Gross unrealized depreciation | (346,487) |
Net unrealized appreciation (depreciation) on securities | $ 1,182,624 |
| |
Tax Cost | $ 6,278,391 |
The tax-based components of distributable earnings as of period end were as follows:
Undistributed ordinary income | $ 13,948 |
Capital loss carryforward | $ (2,680,247) |
Net unrealized appreciation (depreciation) on securities and other investments | $ 1,182,615 |
Annual Report
Notes to Financial Statements - continued
(Amounts in thousands except percentages)
3. Significant Accounting Policies - continued
Income Tax Information and Distributions to Shareholders - continued
Capital loss carryforwards are only available to offset future capital gains of the Fund to the extent provided by regulations and may be limited. Under the Regulated Investment Company Modernization Act of 2010 (the Act), the Fund is permitted to carry forward capital losses incurred in taxable years beginning after December 22, 2010 for an unlimited period and such capital losses are required to be used prior to any losses that expire. The capital loss carryforward information presented below, including any applicable limitation, is estimated as of fiscal period end and is subject to adjustment.
Fiscal year of expiration | |
2018 | $ (2,680,247) |
The tax character of distributions paid was as follows:
| July 31, 2015 | July 31,2014 |
Ordinary Income | $ 135,475 | $ 135,178 |
Restricted Securities. The Fund may invest in securities that are subject to legal or contractual restrictions on resale. These securities generally may be resold in transactions exempt from registration or to the public if the securities are registered. Disposal of these securities may involve time-consuming negotiations and expense, and prompt sale at an acceptable price may be difficult. Information regarding restricted securities is included at the end of the Fund's Schedule of Investments.
4. Purchases and Sales of Investments.
Purchases and sales of securities, other than short-term securities, aggregated $2,631,955 and $3,154,898, respectively.
5. Fees and Other Transactions with Affiliates.
Management Fee. Fidelity Management & Research Company (the investment adviser) and its affiliates provide the Fund with investment management related services for which the Fund pays a monthly management fee. The management fee is the sum of an individual fund fee rate that is based on an annual rate of .20% of the Fund's average net assets and an annualized group fee rate that averaged .25% during the period. The group fee rate is based upon the average net assets of all the mutual funds advised by the investment adviser, including any mutual funds previously advised by the investment adviser that are currently advised by Fidelity SelectCo, LLC, an affiliate of the investment adviser. The group fee rate decreases as assets under management increase and increases as assets under management decrease. For the reporting period, the total annual management fee rate was .45% of the Fund's average net assets.
Annual Report
5. Fees and Other Transactions with Affiliates - continued
Transfer Agent Fees. Fidelity Investments Institutional Operations Company, Inc., (FIIOC), an affiliate of the investment adviser, is the transfer, dividend disbursing and shareholder servicing agent for each class of the Fund. FIIOC receives account fees and asset-based fees that vary according to the account size and type of account of the shareholders of Growth & Income. FIIOC receives an asset-based fee of Class K's average net assets. FIIOC pays for typesetting, printing and mailing of shareholder reports, except proxy statements.
For the period, transfer agent fees for each class were as follows:
| Amount | % of
Class-Level Average
Net Assets |
Growth and Income | $ 10,952 | .16 |
Class K | 449 | .05 |
| $ 11,401 | |
Accounting and Security Lending Fees. Fidelity Service Company, Inc. (FSC), an affiliate of the investment adviser, maintains the Fund's accounting records. The accounting fee is based on the level of average net assets for each month. Under a separate contract, FSC administers the security lending program. The security lending fee is based on the number and duration of lending transactions.
Brokerage Commissions. The Fund placed a portion of its portfolio transactions with brokerage firms which are affiliates of the investment adviser. Brokerage commissions are included in net realized gain (loss) and change in net unrealized appreciation (depreciation) in the Statement of Operations. The commissions paid to these affiliated firms were $47 for the period.
Interfund Lending Program. Pursuant to an Exemptive Order issued by the SEC, the Fund, along with other registered investment companies having management contracts with FMR or other affiliated entities of FMR, may participate in an interfund lending program. This program provides an alternative credit facility allowing the funds to borrow from, or lend money to, other participating affiliated funds. Any open loans, including accrued interest, at period end are presented under the caption "Notes payable to affiliates" in the Fund's Statement of Assets and Liabilities. The Fund's activity in this program during the period for which loans were outstanding was as follows:
Borrower or Lender | Average Loan
Balance | Weighted Average Interest Rate | Interest Expense |
Borrower | $ 7,770 | .34% | $ 5 |
Annual Report
Notes to Financial Statements - continued
(Amounts in thousands except percentages)
6. Committed Line of Credit.
The Fund participates with other funds managed by the investment adviser or an affiliate in a $4.25 billion credit facility (the "line of credit") to be utilized for temporary or emergency purposes to fund shareholder redemptions or for other short-term liquidity purposes. The Fund has agreed to pay commitment fees on its pro-rata portion of the line of credit, which amounted to $11 and is reflected in Miscellaneous expenses on the Statement of Operations. During the period, the Fund did not borrow on this line of credit.
7. Security Lending.
The Fund lends portfolio securities through a lending agent from time to time in order to earn additional income. For equity securities, a lending agent is used and may loan securities to certain qualified borrowers, including Fidelity Capital Markets (FCM), a broker-dealer affiliated with the Fund. On the settlement date of the loan, the Fund receives collateral (in the form of U.S. Treasury obligations, letters of credit and/or cash) against the loaned securities and maintains collateral in an amount not less than 100% of the market value of the loaned securities during the period of the loan. The market value of the loaned securities is determined at the close of business of the Fund and any additional required collateral is delivered to the Fund on the next business day. If the borrower defaults on its obligation to return the securities loaned because of insolvency or other reasons, the Fund may apply collateral received from the borrower against the obligation. The Fund may experience delays and costs in recovering the securities loaned. Any cash collateral received is invested in the Fidelity Securities Lending Cash Central Fund. The value of loaned securities and cash collateral at period end are disclosed on the Fund's Statement of Assets and Liabilities. At period end, there were no security loans outstanding with FCM. Security lending income represents the income earned on investing cash collateral, less rebates paid to borrowers and any lending agent fees associated with the loan, plus any premium payments received for lending certain types of securities. Security lending income is presented in the Statement of Operations as a component of income from Fidelity Central Funds. Total security lending income during the period amounted to $735, including $4 from securities loaned to FCM.
Annual Report
8. Bank Borrowings.
The Fund is permitted to have bank borrowings for temporary or emergency purposes to fund shareholder redemptions or for other short-term liquidity requirements. The Fund has established borrowing arrangements with certain banks. The interest rate on the borrowings is the bank's base rate, as revised from time to time. The average loan balance during the period for which loans were outstanding amounted to $3,862. The weighted average interest rate was .62%. The interest expense amounted to four hundred sixty four dollars under the bank borrowing program. At period end, there were no bank borrowings outstanding.
9. Expense Reductions.
Commissions paid to certain brokers with whom the investment adviser, or its affiliates, places trades on behalf of the Fund include an amount in addition to trade execution, which may be rebated back to the Fund to offset certain expenses. This amount totaled $91 for the period.
In addition, during the period the investment adviser reimbursed/waived a portion of fund-level operating expenses in the amount of $30, and a portion of class-level operating expenses as follows:
| Amount |
Growth and Income | $ 147 |
10. Distributions to Shareholders.
Distributions to shareholders of each class were as follows:
Years ended July 31, | 2015 | 2014 |
From net investment income | | |
Growth and Income | $ 117,218 | $ 113,973 |
Class K | 18,257 | 19,579 |
Total | $ 135,475 | $ 133,552 |
From net realized gain | | |
Growth and Income | $ - | $ 1,391 |
Class K | - | 235 |
Total | $ - | $ 1,626 |
Annual Report
Notes to Financial Statements - continued
(Amounts in thousands except percentages)
11. Share Transactions.
Share transactions for each class were as follows and may contain automatic conversions between classes or exchanges between funds:
| Shares | Dollars |
Years ended July 31, | 2015 | 2014 | 2015 | 2014 |
Growth and Income | | | | |
Shares sold | 12,118 | 21,786 | $ 365,420 | $ 598,816 |
Reinvestment of distributions | 3,750 | 3,998 | 111,890 | 110,063 |
Shares redeemed | (28,824) | (36,289) A | (872,624) | (997,570) A |
Net increase (decrease) | (12,956) | (10,505) | $ (395,314) | $ (288,691) |
Class K | | | | |
Shares sold | 4,866 | 7,113 | $ 146,512 | $ 195,462 |
Reinvestment of distributions | 612 | 722 | 18,257 | 19,814 |
Shares redeemed | (10,609) | (14,384) | (321,361) | (398,755) |
Net increase (decrease) | (5,131) | (6,549) | $ (156,592) | $ (183,479) |
A Amount includes in-kind redemptions.
12. Other.
The Fund's organizational documents provide former and current trustees and officers with a limited indemnification against liabilities arising in connection with the performance of their duties to the Fund. In the normal course of business, the Fund may also enter into contracts that provide general indemnifications. The Fund's maximum exposure under these arrangements is unknown as this would be dependent on future claims that may be made against the Fund. The risk of material loss from such claims is considered remote.
Annual Report
To the Trustees of Fidelity Securities Fund and the Shareholders of Fidelity Growth & Income Portfolio:
In our opinion, the accompanying statement of assets and liabilities, including the schedule of investments, and the related statements of operations and of changes in net assets and the financial highlights present fairly, in all material respects, the financial position of Fidelity Growth & Income Portfolio (a fund of Fidelity Securities Fund) at July 31, 2015, the results of its operations for the year then ended, the changes in its net assets for each of the two years in the period then ended and the financial highlights for each of the five years in the period then ended, in conformity with accounting principles generally accepted in the United States of America. These financial statements and financial highlights (hereafter referred to as "financial statements") are the responsibility of the Fidelity Growth & Income Portfolio's management. Our responsibility is to express an opinion on these financial statements based on our audits. We conducted our audits of these financial statements in accordance with the standards of the Public Company Accounting Oversight Board (United States). Those standards require that we plan and perform the audit to obtain reasonable assurance about whether the financial statements are free of material misstatement. An audit includes examining, on a test basis, evidence supporting the amounts and disclosures in the financial statements, assessing the accounting principles used and significant estimates made by management, and evaluating the overall financial statement presentation. We believe that our audits, which included confirmation of securities at July 31, 2015 by correspondence with the custodian and brokers, provide a reasonable basis for our opinion.
PricewaterhouseCoopers LLP
Boston, Massachusetts
September 16, 2015
Annual Report
The Trustees, Member of the Advisory Board, and officers of the trust and fund, as applicable, are listed below. The Board of Trustees governs the fund and is responsible for protecting the interests of shareholders. The Trustees are experienced executives who meet periodically throughout the year to oversee the fund's activities, review contractual arrangements with companies that provide services to the fund, oversee management of the risks associated with such activities and contractual arrangements, and review the fund's performance. Each of the Trustees oversees 170 funds.
The Trustees hold office without limit in time except that (a) any Trustee may resign; (b) any Trustee may be removed by written instrument, signed by at least two-thirds of the number of Trustees prior to such removal; (c) any Trustee who requests to be retired or who has become incapacitated by illness or injury may be retired by written instrument signed by a majority of the other Trustees; and (d) any Trustee may be removed at any special meeting of shareholders by a two-thirds vote of the outstanding voting securities of the trust. Each Trustee who is not an interested person (as defined in the 1940 Act) of the trust and the fund (Independent Trustee), shall retire not later than the last day of the calendar year in which his or her 75th birthday occurs. The Independent Trustees may waive this mandatory retirement age policy with respect to individual Trustees. The officers and Advisory Board Member hold office without limit in time, except that any officer and Advisory Board Member may resign or may be removed by a vote of a majority of the Trustees at any regular meeting or any special meeting of the Trustees. Except as indicated, each individual has held the office shown or other offices in the same company for the past five years.
Experience, Skills, Attributes, and Qualifications of the Fund's Trustees. The Governance and Nominating Committee has adopted a statement of policy that describes the experience, qualifications, attributes, and skills that are necessary and desirable for potential Independent Trustee candidates (Statement of Policy). The Board believes that each Trustee satisfied at the time he or she was initially elected or appointed a Trustee, and continues to satisfy, the standards contemplated by the Statement of Policy. The Governance and Nominating Committee also engages professional search firms to help identify potential Independent Trustee candidates who have the experience, qualifications, attributes, and skills consistent with the Statement of Policy. From time to time, additional criteria based on the composition and skills of the current Independent Trustees, as well as experience or skills that may be appropriate in light of future changes to board composition, business conditions, and regulatory or other developments, have also been considered by the professional search firms and the Governance and Nominating Committee. In addition, the Board takes into account the Trustees' commitment and participation in Board and committee meetings, as well as their leadership of standing and ad hoc committees throughout their tenure.
In determining that a particular Trustee was and continues to be qualified to serve as a Trustee, the Board has considered a variety of criteria, none of which, in isolation, was controlling. The Board believes that, collectively, the Trustees have balanced and diverse experience, qualifications, attributes, and skills, which allow the Board to operate effectively in governing the fund and protecting the interests of shareholders. Information about the specific experience, skills, attributes, and qualifications of each Trustee, which in each case led to the Board's conclusion that the Trustee should serve (or continue to serve) as a trustee of the fund, is provided below.
Annual Report
Trustees and Officers - continued
Board Structure and Oversight Function. James C. Curvey is an interested person (as defined in the 1940 Act) and currently serves as Chairman. The Trustees have determined that an interested Chairman is appropriate and benefits shareholders because an interested Chairman has a personal and professional stake in the quality and continuity of services provided to the fund. Independent Trustees exercise their informed business judgment to appoint an individual of their choosing to serve as Chairman, regardless of whether the Trustee happens to be independent or a member of management. The Independent Trustees have determined that they can act independently and effectively without having an Independent Trustee serve as Chairman and that a key structural component for assuring that they are in a position to do so is for the Independent Trustees to constitute a substantial majority for the Board. The Independent Trustees also regularly meet in executive session. Ned C. Lautenbach serves as Chairman of the Independent Trustees and as such (i) acts as a liaison between the Independent Trustees and management with respect to matters important to the Independent Trustees and (ii) with management prepares agendas for Board meetings.
Fidelity funds are overseen by different Boards of Trustees. The fund's Board oversees Fidelity's high income and certain equity funds and other Boards oversee Fidelity's investment-grade bond, money market, asset allocation, and sector funds. The asset allocation funds may invest in Fidelity funds overseen by the fund's Board. The use of separate Boards, each with its own committee structure, allows the Trustees of each group of Fidelity funds to focus on the unique issues of the funds they oversee, including common research, investment, and operational issues. On occasion, the separate Boards establish joint committees to address issues of overlapping consequences for the Fidelity funds overseen by each Board.
The Trustees operate using a system of committees to facilitate the timely and efficient consideration of all matters of importance to the Trustees, the fund, and fund shareholders and to facilitate compliance with legal and regulatory requirements and oversight of the fund's activities and associated risks. The Board, acting through its committees, has charged FMR and its affiliates with (i) identifying events or circumstances the occurrence of which could have demonstrably adverse effects on the fund's business and/or reputation; (ii) implementing processes and controls to lessen the possibility that such events or circumstances occur or to mitigate the effects of such events or circumstances if they do occur; and (iii) creating and maintaining a system designed to evaluate continuously business and market conditions in order to facilitate the identification and implementation processes described in (i) and (ii) above. Because the day-to-day operations and activities of the fund are carried out by or through FMR, its affiliates and other service providers, the fund's exposure to risks is mitigated but not eliminated by the processes overseen by the Trustees. While each of the Board's committees has responsibility for overseeing different aspects of the fund's activities, oversight is exercised primarily through the Operations, Audit, and Compliance Committees. In addition, the Independent Trustees have worked with FMR to enhance the Board's oversight of investment and financial risks, legal and regulatory risks, technology risks, and operational risks, including the development of additional risk reporting to the Board. For example, a working group comprised of Independent Trustees and FMR has worked and continues to work to review the Fidelity funds' valuation-related activities, reporting and risk management. Appropriate personnel, including but not limited to the fund's Chief Compliance Officer (CCO), FMR's internal auditor, the independent accountants, the fund's Treasurer and portfolio management personnel, make periodic reports to the Board's committees, as appropriate, including an annual review of FMR's risk management program for the Fidelity funds. The responsibilities of each standing committee, including their oversight responsibilities, are described further under "Standing Committees of the Fund's Trustees."
Annual Report
The fund's Statement of Additional Information (SAI) includes more information about the Trustees. To request a free copy, call Fidelity at 1-800-544-8544.
Interested Trustees*:
Correspondence intended for each Trustee who is an interested person may be sent to Fidelity Investments, 245 Summer Street, Boston, Massachusetts 02210.
Name, Year of Birth; Principal Occupations and Other Relevant Experience+ |
James C. Curvey (1935) |
Year of Election or Appointment: 2007 Trustee Chairman of the Board of Trustees |
| Mr. Curvey also serves as Trustee of other Fidelity funds. Mr. Curvey is a Director of Fidelity Research & Analysis Co. (investment adviser firm, 2009-present), and Vice Chairman (2007-present) and Director of FMR LLC (diversified financial services company). In addition, Mr. Curvey serves as an Overseer for the Boston Symphony Orchestra and a member of the board of Artis-Naples, Naples, Florida, and as a Trustee for Brewster Academy, Wolfeboro, New Hampshire. Previously, Mr. Curvey served as a Director of Fidelity Investments Money Management, Inc. (investment adviser firm, 2009-2014), a Director of FMR (investment adviser firm, 2007-2014), and a Director of FMR Co., Inc. (investment adviser firm, 2007-2014). |
Charles S. Morrison (1960) |
Year of Election or Appointment: 2014 Trustee |
| Mr. Morrison also serves as Trustee of other funds. He serves as a Director of Fidelity Investments Money Management, Inc. (FIMM) (investment adviser firm, 2014-present), Director of Fidelity SelectCo, LLC (investment adviser firm, 2014-present), President, Asset Management (2014-present), and is an employee of Fidelity Investments. Previously, Mr. Morrison served as Vice President of Fidelity's Fixed Income and Asset Allocation Funds (2012-2014), President, Fixed Income (2011-2014), Vice President of Fidelity's Money Market Funds (2005-2009), President, Money Market Group Leader of FMR (investment adviser firm, 2009), and Senior Vice President, Money Market Group of FMR (2004-2009). Mr. Morrison also served as Vice President of Fidelity's Bond Funds (2002-2005), certain Balanced Funds (2002-2005), and certain Asset Allocation Funds (2002-2007), and as Senior Vice President (2002-2005) of Fidelity's Bond Division. |
* Trustees have been determined to be "Interested Trustees" by virtue of, among other things, their affiliation with the trust or various entities under common control with FMR.
+ The information above includes each Trustee's principal occupation during the last five years and other information relating to the experience, attributes, and skills relevant to each Trustee's qualifications to serve as a Trustee, which led to the conclusion that each Trustee should serve as a Trustee for the fund.
Annual Report
Independent Trustees:
Correspondence intended for each Independent Trustee (that is, the Trustees other than the Interested Trustees) may be sent to Fidelity Investments, P.O. Box 55235, Boston, Massachusetts 02205-5235.
Name, Year of Birth; Principal Occupations and Other Relevant Experience+ |
Dennis J. Dirks (1948) |
Year of Election or Appointment: 2005 Trustee |
| Mr. Dirks also serves as Trustee of other Fidelity funds. Prior to his retirement in May 2003, Mr. Dirks was Chief Operating Officer and a member of the Board of The Depository Trust & Clearing Corporation (DTCC). He also served as President, Chief Operating Officer, and Board member of The Depository Trust Company (DTC) and President and Board member of the National Securities Clearing Corporation (NSCC). In addition, Mr. Dirks served as Chief Executive Officer and Board member of the Government Securities Clearing Corporation, Chief Executive Officer and Board member of the Mortgage-Backed Securities Clearing Corporation, as a Trustee and a member of the Finance Committee of Manhattan College (2005-2008), and as a Trustee and a member of the Finance Committee of AHRC of Nassau County (2006-2008). Mr. Dirks is a member of the Independent Directors Council (IDC) Governing Council (2010-present) and Board of Directors for The Brookville Center for Children's Services, Inc. (2009-present). |
Alan J. Lacy (1953) |
Year of Election or Appointment: 2008 Trustee |
| Mr. Lacy also serves as Trustee of other Fidelity funds. Mr. Lacy serves as a member of the Board of Directors of Dave & Buster's Entertainment, Inc. (restaurant and entertainment complexes, 2010-present) and Bristol-Myers Squibb Company (global pharmaceuticals, 2008-present). In addition, Mr. Lacy served as Senior Adviser (2007-2014) of Oak Hill Capital Partners, L.P. (private equity) and also served as Chief Executive Officer (2000-2005) and Vice Chairman (2005-2006) of Sears Holdings Corporation and Sears, Roebuck and Co. (retail). Mr. Lacy is a member of the Board of Trustees of The National Parks Conservation Association (2006-present). Previously, Mr. Lacy served as Chairman of the Board of Trustees of the National Parks Conservation Association (2008-2011) and as a member of the Board of Directors for The Western Union Company (global money transfer, 2006-2011), The Hillman Companies, Inc. (hardware wholesalers, 2010-2014), and Earth Fare, Inc. (retail grocery, 2010-2014). |
Ned C. Lautenbach (1944) |
Year of Election or Appointment: 2000 Trustee Chairman of the Independent Trustees |
| Mr. Lautenbach also serves as Trustee of other Fidelity funds. Mr. Lautenbach currently serves as the Lead Director of the Eaton Corporation Board of Directors (diversified industrial, 1997-present). Mr. Lautenbach is Chairman of the Board of Directors of Artis-Naples in Naples, Florida (2012-present), a member of the Council on Foreign Relations (1994-present), and a member of the Board of Governors, State University System of Florida (2013-present). Previously, Mr. Lautenbach was a Partner/Advisory Partner at Clayton, Dubilier & Rice, LLC (private equity investment, 1998-2010), as well as a Director of Sony Corporation (2006-2007). |
Joseph Mauriello (1944) |
Year of Election or Appointment: 2008 Trustee |
| Mr. Mauriello also serves as Trustee of other Fidelity funds. Prior to his retirement in January 2006, Mr. Mauriello served in numerous senior management positions including Deputy Chairman and Chief Operating Officer (2004-2005), and Vice Chairman of Financial Services (2002-2004) of KPMG LLP US (professional services, 1965-2005). Mr. Mauriello currently serves as a member of the Board of Directors of XL Group plc. (global insurance and re-insurance, 2006-present). Previously, Mr. Mauriello served as a Director of the Hamilton Funds of the Bank of New York (2006-2007) and of Arcadia Resources Inc. (health care services and products, 2007-2012). |
Robert W. Selander (1950) |
Year of Election or Appointment: 2011 Trustee |
| Mr. Selander also serves as Trustee of other Fidelity funds. Mr. Selander serves as a Director of The Western Union Company (global money transfer, 2014-present). Previously, Mr. Selander served as a Member of the Advisory Board of other Fidelity funds (2011), and Executive Vice Chairman (2010), Chief Executive Officer (2009-2010), and President and Chief Executive Officer (1997-2009) of Mastercard, Inc. |
Cornelia M. Small (1944) |
Year of Election or Appointment: 2005 Trustee |
| Ms. Small also serves as Trustee of other Fidelity funds. Ms. Small is a member of the Board of Directors (2009-present) and Chair of the Investment Committee (2010-present) of the Teagle Foundation. Ms. Small also serves on the Investment Committee of the Berkshire Taconic Community Foundation (2008-present). Previously, Ms. Small served as Chairperson (2002-2008) and a member of the Investment Committee and Chairperson (2008-2012) and a member of the Board of Trustees of Smith College. In addition, Ms. Small served as Chief Investment Officer, Director of Global Equity Investments, and a member of the Board of Directors of Scudder, Stevens & Clark and Scudder Kemper Investments. |
William S. Stavropoulos (1939) |
Year of Election or Appointment: 2002 Trustee Vice Chairman of the Independent Trustees |
| Mr. Stavropoulos also serves as Trustee of other Fidelity funds. Mr. Stavropoulos serves as President and Founder of the Michigan Baseball Foundation, the Great Lakes Loons (2007-present). Mr. Stavropoulos is Chairman Emeritus of the Board of Directors of The Dow Chemical Company, where he previously served in numerous senior management positions, including President, CEO (1995-2000; 2002-2004), Chairman of the Executive Committee (2000-2006), and as a member of the Board of Directors (1990-2006). Currently, Mr. Stavropoulos is Chairman of the Board of Directors of Univar Inc. (global distributor of commodity and specialty chemicals), a Director of Teradata Corporation (data warehousing and technology solutions), and Maersk Inc. (industrial conglomerate), and a member of the Advisory Board for Metalmark Capital LLC (private equity investment, 2005-present). Mr. Stavropoulos is an operating advisor to Clayton, Dubilier & Rice, LLC (private equity investment). In addition, Mr. Stavropoulos is a member of the University of Notre Dame Advisory Council for the College of Science, a Trustee of the Rollin L. Gerstacker Foundation, and a Director of the Naples Philharmonic Center for the Arts. Previously, Mr. Stavropoulos served as a Director of Chemical Financial Corporation (bank holding company, 1993-2012) and Tyco International, Ltd. (multinational manufacturing and services, 2007-2012). |
David M. Thomas (1949) |
Year of Election or Appointment: 2008 Trustee |
| Mr. Thomas also serves as Trustee of other Fidelity funds. Mr. Thomas serves as Non-Executive Chairman of the Board of Directors of Fortune Brands Home and Security (home and security products, 2011-present), as a member of the Board of Directors (2004-present) and Presiding Director (2013-present) of Interpublic Group of Companies, Inc. (marketing communication), and as a member of the Board of Trustees of the University of Florida (2013-present). Previously, Mr. Thomas served as Executive Chairman (2005-2006) and Chairman and Chief Executive Officer (2000-2005) of IMS Health, Inc. (pharmaceutical and healthcare information solutions), and a Director of Fortune Brands, Inc. (consumer products, 2000-2011). |
+ The information above includes each Trustee's principal occupation during the last five years and other information relating to the experience, attributes, and skills relevant to each Trustee's qualifications to serve as a Trustee, which led to the conclusion that each Trustee should serve as a Trustee for the fund.
Advisory Board Member and Officers:
Correspondence intended for each officer and Peter S. Lynch may be sent to Fidelity Investments, 245 Summer Street, Boston, Massachusetts 02210. Officers appear below in alphabetical order.
Name, Year of Birth; Principal Occupation |
Peter S. Lynch (1944) |
Year of Election or Appointment: 2003 Member of the Advisory Board |
| Mr. Lynch also serves as Member of the Advisory Board of other Fidelity funds. Mr. Lynch is Vice Chairman and a Director of FMR (investment adviser firm) and FMR Co., Inc. (investment adviser firm). In addition, Mr. Lynch serves as a Trustee of Boston College and as the Chairman of the Inner-City Scholarship Fund. Previously, Mr. Lynch served on the Special Olympics International Board of Directors (1997-2006). |
Elizabeth Paige Baumann (1968) |
Year of Election or Appointment: 2012 Anti-Money Laundering (AML) Officer |
| Ms. Baumann also serves as AML Officer of other funds. She is Chief AML Officer of FMR LLC (diversified financial services company, 2012-present) and is an employee of Fidelity Investments. Previously, Ms. Baumann served as Vice President and Deputy Anti-Money Laundering Officer (2007-2012). |
Marc Bryant (1966) |
Year of Election or Appointment: 2015 Secretary and Chief Legal Officer (CLO) |
| Mr. Bryant also serves as Secretary and Chief Legal Officer (CLO) of other funds. He is Senior Vice President and Deputy General Counsel of FMR LLC (diversified financial services company). Previously, Mr. Bryant served as Secretary and Chief Legal Officer of Fidelity Rutland Square Trust II (2010-2014) and Assistant Secretary of Fidelity's Fixed Income and Asset Allocation Funds (2013-2015). Prior to joining Fidelity Investments, Mr. Bryant served as a Senior Vice President and the Head of Global Retail Legal for AllianceBernstein L.P. (2006-2010), and as the General Counsel for ProFund Advisors LLC (2001-2006). |
William C. Coffey (1969) |
Year of Election or Appointment: 2009 Assistant Secretary |
| Mr. Coffey also serves as Assistant Secretary of other funds. He is Senior Vice President and Deputy General Counsel of FMR LLC (diversified financial services company, 2010-present), and is an employee of Fidelity Investments. Previously, Mr. Coffey served as Vice President and Associate General Counsel of FMR LLC (2005-2009). |
Jonathan Davis (1968) |
Year of Election or Appointment: 2010 Assistant Treasurer |
| Mr. Davis also serves as Assistant Treasurer of other funds. Mr. Davis is an employee of Fidelity Investments. Previously, Mr. Davis served as Vice President and Associate General Counsel of FMR LLC (diversified financial services company, 2003-2010). |
Adrien E. Deberghes (1967) |
Year of Election or Appointment: 2008 Deputy Treasurer |
| Mr. Deberghes also serves as an officer of other funds. He is an employee of Fidelity Investments (2008-present). Prior to joining Fidelity Investments, Mr. Deberghes was Senior Vice President of Mutual Fund Administration at State Street Corporation (2007-2008), Senior Director of Mutual Fund Administration at Investors Bank & Trust (2005-2007), and Director of Finance for Dunkin' Brands (2000-2005). |
Stephanie J. Dorsey (1969) |
Year of Election or Appointment: 2010 Assistant Treasurer |
| Ms. Dorsey also serves as an officer of other funds. She is an employee of Fidelity Investments (2008-present) and has served in other fund officer roles. Prior to joining Fidelity Investments, Ms. Dorsey served as Treasurer (2004-2008) of the JPMorgan Mutual Funds and Vice President (2004-2008) of JPMorgan Chase Bank. |
Howard J. Galligan III (1966) |
Year of Election or Appointment: 2014 Chief Financial Officer |
| Mr. Galligan also serves as Chief Financial Officer of other funds. Mr. Galligan serves as President of Fidelity Pricing and Cash Management Services (FPCMS) (2014-present) and as a Director of Strategic Advisers, Inc. (investment adviser firm, 2008-present). Previously, Mr. Galligan served as Chief Administrative Officer of Asset Management (2011-2014) and Chief Operating Officer and Senior Vice President of Investment Support for Strategic Advisers, Inc. (2003-2011). |
Scott C. Goebel (1968) |
Year of Election or Appointment: 2015 Vice President |
| Mr. Goebel serves as an officer of other funds. Mr. Goebel also serves as Secretary of Fidelity SelectCo, LLC (investment adviser firm, 2013-present), Fidelity Investments Money Management, Inc. (FIMM) (investment adviser firm, 2010-present) and Fidelity Research and Analysis Company (FRAC) (investment adviser firm, 2010-present); General Counsel, Secretary, and Senior Vice President of FMR (investment adviser firm, 2008-present) and FMR Co., Inc. (investment adviser firm, 2008-present); Chief Legal Officer of Fidelity Management & Research (Hong Kong) Limited (investment adviser firm, 2008-present); and Assistant Secretary of Fidelity Management & Research (Japan) Limited (investment adviser firm, 2008-present) and FMR Investment Management (U.K.) Limited (investment adviser firm, 2008-present). Previously, Mr. Goebel served as Secretary and CLO of certain Fidelity funds (2008-2015), Assistant Secretary of FIMM (2008-2010), FRAC (2008-2010), and certain funds (2007-2008); and as Vice President and Secretary of Fidelity Distributors Corporation (FDC) (2005-2007). Mr. Goebel has been employed by FMR LLC (diversified financial services company) or an affiliate since 2001. |
Brian B. Hogan (1964) |
Year of Election or Appointment: 2009 Vice President |
| Mr. Hogan also serves as Trustee or Vice President of other funds. Mr. Hogan serves as a Director of Fidelity SelectCo, LLC (investment adviser firm, 2014-present) and President of the Equity Division of FMR (investment adviser firm, 2009-present). Previously, Mr. Hogan served as Senior Vice President, Equity Research of FMR (2006-2009) and as a portfolio manager. |
Chris Maher (1972) |
Year of Election or Appointment: 2013 Assistant Treasurer |
| Mr. Maher serves as Assistant Treasurer of other funds. Mr. Maher is Vice President of Valuation Oversight and is an employee of Fidelity Investments. Previously, Mr. Maher served as Vice President of Asset Management Compliance (2013), Vice President of the Program Management Group of FMR (investment adviser firm, 2010-2013), and Vice President of Valuation Oversight (2008-2010). |
Melissa M. Reilly (1971) |
Year of Election or Appointment: 2014 Vice President of certain Equity Funds |
| Ms. Reilly also serves as Vice President of other funds. Ms. Reilly is an employee of Fidelity Investments (2004-present). |
Kenneth B. Robins (1969) |
Year of Election or Appointment: 2008 President and Treasurer |
| Mr. Robins also serves as an officer of other funds. Mr. Robins serves as Executive Vice President of Fidelity Investments Money Management, Inc. (FIMM) (investment adviser firm, 2013-present) and is an employee of Fidelity Investments (2004-present). Previously, Mr. Robins served in other fund officer roles. |
Stephen Sadoski (1971) |
Year of Election or Appointment: 2012 Deputy Treasurer |
| Mr. Sadoski also serves as Deputy Treasurer of other funds. He is an employee of Fidelity Investments (2012-present) and has served in another fund officer role. Prior to joining Fidelity Investments, Mr. Sadoski served as an assistant chief accountant in the Division of Investment Management of the Securities and Exchange Commission (SEC) (2009-2012) and as a senior manager at Deloitte & Touche LLP (1997-2009). |
Stacie M. Smith (1974) |
Year of Election or Appointment: 2013 Deputy Treasurer |
| Ms. Smith also serves as an officer of other funds. She is an employee of Fidelity Investments (2009-present) and has served in other fund officer roles. Prior to joining Fidelity Investments, Ms. Smith served as Senior Audit Manager of Ernst & Young LLP (1996-2009). |
Renee Stagnone (1975) |
Year of Election or Appointment: 2013 Deputy Treasurer |
| Ms. Stagnone also serves as Deputy Treasurer of other funds. Ms. Stagnone is an employee of Fidelity Investments. |
Linda J. Wondrack (1964) |
Year of Election or Appointment: 2014 Chief Compliance Officer |
| Ms. Wondrack also serves as Chief Compliance Officer of other funds. Ms. Wondrack is Executive Vice President and head of the Ethics Office and Asset Management Compliance for Fidelity Investments (2012-present). Ms. Wondrack also serves as Chief Compliance Officer of Fidelity SelectCo, LLC (investment adviser firm, 2014-present); Chief Compliance Officer of Impresa Management LLC (2013-present); and Chief Compliance Officer of FMR Co., Inc. (investment adviser firm), Fidelity Investments Money Management, Inc. (investment adviser firm), Fidelity Management & Research (Japan) Limited (investment adviser firm), FMR Investment Management (U.K.) Limited (investment adviser firm), Fidelity Management & Research (Hong Kong) (investment adviser firm), Fidelity Management & Research Company (investment adviser firm), Pyramis Global Advisors, LLC (investment adviser firm), and Strategic Advisers, Inc. (investment adviser firm), Ballyrock Investment Advisors LLC, and Northern Neck Investors LLC (2012-present). Previously, Ms. Wondrack served as Senior Vice President and Chief Compliance Officer for Columbia Management Investment Advisers, LLC (2005-2012); Chief Compliance Officer for certain funds within the Columbia Family of Funds (2007-2012); and Senior Vice President of Compliance Risk Management at Bank of America (2005-2010). |
Joseph F. Zambello (1957) |
Year of Election or Appointment: 2011 Deputy Treasurer |
| Mr. Zambello also serves as Deputy Treasurer of other funds. Mr. Zambello is an employee of Fidelity Investments. Previously, Mr. Zambello served as Vice President of the Program Management Group of FMR (investment adviser firm, 2009-2011) and Vice President of the Transfer Agent Oversight Group (2005-2009). |
Annual Report
Growth & Income designates 100% during the fiscal year as qualifying for the dividends-received deduction for corporate shareholders.
Growth & Income designates 100% of the dividends distributed during the fiscal year as amounts which may be taken into account as a dividend for the purposes of the maximum rate under section 1(h)(11) of the Internal Revenue Code.
The fund will notify shareholders in January 2016 of amounts for use in preparing 2015 income tax returns.
Annual Report
Fidelity Growth & Income Portfolio
Each year, the Board of Trustees, including the Independent Trustees (together, the Board), votes on the renewal of the management contract with Fidelity Management & Research Company (FMR) and the sub-advisory agreements (together, the Advisory Contracts) for the fund. The Board, assisted by the advice of fund counsel and Independent Trustees' counsel, requests and considers a broad range of information relevant to the renewal of the Advisory Contracts throughout the year.
The Board meets regularly and, at each of its meetings, covers an extensive agenda of topics and materials and considers factors that are relevant to its annual consideration of the renewal of the fund's Advisory Contracts, including the services and support provided to the fund and its shareholders. The Board has established various standing committees (Committees), each composed of and chaired by Independent Trustees with varying backgrounds, to which the Board has assigned specific subject matter responsibilities in order to enhance effective decision-making by the Board. The Board, acting directly and through its Committees, requests and receives information concerning the annual consideration of the renewal of the fund's Advisory Contracts. The Board also meets as needed to consider matters specifically related to the Board's annual consideration of the renewal of the Advisory Contracts. Members of the Board may also meet with trustees of other Fidelity funds through ad hoc joint committees to discuss certain matters relevant to all of the Fidelity funds.
At its July 2015 meeting, the Board unanimously determined to renew the fund's Advisory Contracts. In reaching its determination, the Board considered all factors it believed relevant, including (i) the nature, extent, and quality of the services to be provided to the fund and its shareholders (including the investment performance of the fund); (ii) the competitiveness of the fund's management fee and total expense ratio relative to peer funds; (iii) the total costs of the services to be provided by and the profits to be realized by Fidelity from its relationship with the fund; and (iv) the extent to which (if any) economies of scale exist and would be realized as the fund grows, and whether any economies of scale are appropriately shared with fund shareholders.
In considering whether to renew the Advisory Contracts for the fund, the Board reached a determination, with the assistance of fund counsel and Independent Trustees' counsel and through the exercise of its business judgment, that the renewal of the Advisory Contracts was in the best interests of the fund and its shareholders and that the compensation payable under the Advisory Contracts was fair and reasonable. The Board's decision to renew the Advisory Contracts was not based on any single factor, but rather was based on a comprehensive consideration of all the information provided to the Board at its meetings throughout the year. The Board, in reaching its determination to renew the Advisory Contracts, was aware that shareholders of the fund have a broad range of investment choices available to them, including a wide choice among funds offered by Fidelity's competitors, and that the fund's shareholders, who have the opportunity to review and weigh the disclosure provided by the fund in its prospectus and other public disclosures, have chosen to invest in this fund, which is part of the Fidelity family of funds.
Annual Report
Board Approval of Investment Advisory Contracts and
Management Fees - continued
Nature, Extent, and Quality of Services Provided. The Board considered Fidelity's staffing as it relates to the fund, including the backgrounds of investment personnel of Fidelity, and also considered the fund's investment objective, strategies, and related investment philosophy. The Independent Trustees also had discussions with senior management of Fidelity's investment operations and investment groups. The Board considered the structure of the portfolio manager compensation program and whether this structure provides appropriate incentives to act in the best interests of the fund. Additionally, the Board considered the portfolio managers' investments, if any, in the funds that they manage.
Resources Dedicated to Investment Management and Support Services. The Board and the Fund Oversight and Research Committees reviewed the general qualifications and capabilities of Fidelity's investment staff, including its size, education, experience, and resources, as well as Fidelity's approach to recruiting, training, managing, and compensating investment personnel. The Board noted that Fidelity has continued to increase the resources devoted to non-U.S. offices, including expansion of Fidelity's global investment organization. The Board also noted that Fidelity's analysts have extensive resources, tools and capabilities that allow them to conduct sophisticated quantitative and fundamental analysis, as well as credit analysis of issuers, counterparties and guarantors. Further, the Board considered that Fidelity's investment professionals have sufficient access to global information and data so as to provide competitive investment results over time, and that those professionals also have access to sophisticated tools that permit them to assess portfolio construction and risk and performance attribution characteristics continuously, as well as to transmit new information and research conclusions rapidly around the world. Additionally, in its deliberations, the Board considered Fidelity's trading, risk management, and compliance capabilities and resources, which are integral parts of the investment management process.
Shareholder and Administrative Services. The Board considered (i) the nature, extent, quality, and cost of advisory, administrative, and shareholder services performed by FMR, the sub-advisers (together with FMR, the Investment Advisers), and their affiliates under the Advisory Contracts and under separate agreements covering transfer agency, pricing and bookkeeping, and securities lending services for the fund; (ii) the nature and extent of the supervision of third party service providers, principally custodians and subcustodians; and (iii) the resources devoted to, and the record of compliance with, the fund's compliance policies and procedures. The Board also reviewed the allocation of fund brokerage, including allocations to brokers affiliated with the Investment Advisers, the use of brokerage commissions to pay fund expenses, and the use of "soft" commission dollars to pay for research services.
Annual Report
The Board noted that the growth of fund assets over time across the complex allows Fidelity to reinvest in the development of services designed to enhance the value or convenience of the Fidelity funds as investment vehicles. These services include 24-hour access to account information and market information through telephone representatives and over the Internet, investor education materials and asset allocation tools, and the expanded availability of Fidelity Investor Centers.
In 2014, the Board formed an ad hoc Committee on Transfer Agency Fees to review the variety of transfer agency fee structures throughout the industry and Fidelity's competitive positioning with respect to industry participants.
Investment in a Large Fund Family. The Board considered the benefits to shareholders of investing in a Fidelity fund, including the benefits of investing in a fund that is part of a large family of funds offering a variety of investment disciplines and providing a large variety of mutual fund investor services. The Board noted that Fidelity had taken, or had made recommendations that resulted in the Fidelity funds taking, a number of actions over the previous year that benefited particular funds, including (i) continuing to dedicate additional resources to investment research and to the support of the senior management team that oversees asset management; (ii) continuing efforts to enhance Fidelity's global research capabilities; (iii) launching new funds and making other enhancements to meet client needs; (iv) reducing management fees and total expenses for certain index funds and diversified international funds; (v) continuing to launch dedicated lower cost underlying funds to meet portfolio construction needs related to expanding underlying fund options for Fidelity funds of funds, specifically for the Freedom Fund product lines; (vi) rationalizing product lines and gaining increased efficiencies through fund mergers; (vii) launching active fixed-income exchange-traded funds; (viii) continuing to develop, acquire and implement systems and technology to improve services to the funds and information security and to increase efficiency; (ix) implementing investment enhancements to further strengthen Fidelity's target date product line to increase investors' probability of success in achieving their goals; (x) modifying the eligibility criteria for certain share classes to accommodate roll-over assets from employer-sponsored retirement plans; (xi) launching a new Class W of the Freedom Index Funds to attract and retain Fidelity record-kept retirement plan assets; and (xii) implementing changes to Fidelity's money market product line in response to recent money market regulatory reforms.
Investment Performance. The Board considered whether the fund has operated in accordance with its investment objective, as well as its record of compliance with its investment restrictions and its performance history.
Annual Report
Board Approval of Investment Advisory Contracts and
Management Fees - continued
The Board took into account discussions with representatives of the Investment Advisers about fund investment performance that occur at Board meetings throughout the year. In this regard the Board noted that as part of regularly scheduled fund reviews and other reports to the Board on fund performance, the Board considers annualized return information for the fund, for different time periods, measured against a securities market index ("benchmark index") and a peer group of funds with similar objectives ("peer group"), if any. In its evaluation of fund investment performance, the Board gave particular attention to information indicating changes in performance of certain Fidelity funds for specific time periods and discussed with the Investment Advisers the reasons for any overperformance or underperformance.
In addition to reviewing absolute and relative fund performance, the Independent Trustees periodically consider the appropriateness of fund performance metrics in evaluating the results achieved. In general, the Independent Trustees believe that fund performance should be evaluated based on net performance (after fees and expenses) of both the highest performing and lowest performing fund share classes, where applicable, compared to appropriate benchmark indices, over appropriate time periods that may include full market cycles, and compared to peer groups, as applicable, over the same periods, taking into account relevant factors including the following: general market conditions; issuer-specific information; and fund cash flows and other factors.
The Independent Trustees recognize that shareholders evaluate performance on a net basis over their own holding periods, for which one-, three-, and five-year periods are often used as a proxy. For this reason, the performance information reviewed by the Board also included net cumulative calendar year total return information for the fund and an appropriate benchmark index and peer group for the most recent one-, three-, and five-year periods, as shown below. Returns are shown compared to the 25th percentile (top of box, 75% beaten) and 75th percentile (bottom of box, 25% beaten) of the peer universe.
Annual Report
Fidelity Growth & Income Portfolio

Based on its review, the Board concluded that the nature, extent, and quality of services provided to the fund under the Advisory Contracts should benefit the shareholders of the fund.
Competitiveness of Management Fee and Total Expense Ratio. The Board considered the fund's management fee and total expense ratio compared to "mapped groups" of competitive funds and classes created for the purpose of facilitating the Trustees' competitive analysis of management fees and total expenses. Fidelity creates "mapped groups" by combining similar Lipper investment objective categories that have comparable investment mandates. Combining Lipper investment objective categories aids the Board's management fee and total expense ratio comparisons by broadening the competitive group used for comparison.
Management Fee. The Board considered two proprietary management fee comparisons for the 12-month periods shown in basis points (BP) in the chart below. The group of Lipper funds used by the Board for management fee comparisons is referred to below as the "Total Mapped Group." The Total Mapped Group comparison focuses on a fund's standing in terms of gross management fees before expense reimbursements or caps relative to the total universe of funds with comparable investment mandates, regardless of whether their management fee structures also are comparable. Funds with comparable investment mandates offer exposure to similar types of securities. Funds with comparable management fee structures have similar management fee contractual arrangements (e.g., flat rate charged for advisory services, all-inclusive fee rate, etc.). "TMG %" represents the percentage of funds in the Total Mapped Group that had management fees that were lower than the fund's. For example, a hypothetical TMG % of 20% would mean that 80% of the funds in the Total Mapped Group had higher, and 20% had lower, management fees than the fund. The fund's actual TMG %s and the number of funds in the Total Mapped Group are in the chart below. The "Asset-Size Peer Group" (ASPG) comparison focuses on a fund's standing relative to a subset of non-Fidelity funds within the Total Mapped Group that are similar in size and management fee structure without taking into account performance adjustments, if any. For example, if a fund is in the first quartile of the ASPG, the fund's management fee ranks in the least expensive or lowest 25% of funds in the ASPG. The ASPG represents at least 15% of the funds in the Total Mapped Group with comparable asset size and management fee structures, subject to a minimum of 50 funds (or all funds in the Total Mapped Group if fewer than 50). Additional information, such as the ASPG quartile in which the fund's management fee rate ranked, is also included in the chart and considered by the Board.
Annual Report
Board Approval of Investment Advisory Contracts and
Management Fees - continued
Fidelity Growth & Income Portfolio

The Board noted that the fund's management fee rate ranked below the median of its Total Mapped Group and below the median of its ASPG for 2014.
The Board noted that, in 2014, the ad hoc Committee on Group Fee was formed by it and other Fidelity fund boards to conduct an in-depth review of the "group fee" component of the management fee of funds with such management fee structures. Committee focus included the mechanics of the group fee, the competitive landscape of group fee structures, Fidelity funds with no group fee component and investment products not included in group fee assets. The Board also considered that, for funds subject to the group fee,
Annual Report
FMR agreed to voluntarily waive fees over a specified period of time in amounts designed to account for assets converted from certain funds to certain collective investment trusts.
The Board also noted that, in 2013, the ad hoc Committee on Management Fees was formed to conduct an in-depth review of the management fee rates of Fidelity's active equity mutual funds. The Committee focused on the following areas: (i) standard fee structures; (ii) research consumption and trading evolution; (iii) management fee competitiveness/profitability by category; and (iv) factors that drive institutional pricing.
Based on its review, the Board concluded that the fund's management fee is fair and reasonable in light of the services that the fund receives and the other factors considered.
Total Expense Ratio. In its review of each class's total expense ratio, the Board considered the fund's management fee as well as other fund or class expenses, as applicable, such as transfer agent fees, pricing and bookkeeping fees, and custodial, legal, and audit fees. The Board also noted that Fidelity may agree to waive fees and expenses from time to time, and the extent to which, if any, it has done so for the fund. As part of its review, the Board also considered the current and historical total expense ratios of each class of the fund compared to competitive fund median expenses. Each class of the fund is compared to those funds and classes in the Total Mapped Group (used by the Board for management fee comparisons) that have a similar sales load structure.
The Board noted that the total expense ratio of each class ranked below its competitive median for 2014.
Fees Charged to Other Fidelity Clients. The Board also considered Fidelity fee structures and other information with respect to clients of Fidelity, such as other funds advised or subadvised by Fidelity, pension plan clients, and other institutional clients with similar mandates. The Board noted the findings of the 2013 ad hoc joint committee (created with the board of other Fidelity funds), which reviewed and compared Fidelity's institutional investment advisory business with its business of providing services to the Fidelity funds, including the differences in services provided, fees charged, and costs incurred, as well as competition in their respective marketplaces.
Based on its review of total expense ratios and fees charged to other Fidelity clients, the Board concluded that the total expense ratio of each class of the fund was reasonable in light of the services that the fund and its shareholders receive and the other factors considered.
Costs of the Services and Profitability. The Board considered the revenues earned and the expenses incurred by Fidelity in conducting the business of developing, marketing, distributing, managing, administering and servicing the fund and servicing the fund's shareholders. The Board also considered the level of Fidelity's profits in respect of all the Fidelity funds.
Annual Report
Board Approval of Investment Advisory Contracts and
Management Fees - continued
On an annual basis, Fidelity presents to the Board information about the profitability of its relationship with the fund. Fidelity calculates profitability information for each fund, as well as aggregate profitability information for groups of Fidelity funds and all Fidelity funds, using a series of detailed revenue and cost allocation methodologies which originate with the books and records of Fidelity on which Fidelity's audited financial statements are based. The Audit Committee of the Board reviews any significant changes from the prior year's methodologies.
PricewaterhouseCoopers LLP (PwC), independent registered public accounting firm and auditor to Fidelity and certain Fidelity funds, has been engaged annually by the Board as part of the Board's assessment of Fidelity's profitability analysis. PwC's engagement includes the review and assessment of the methodologies used by Fidelity in determining the revenues and expenses attributable to Fidelity's mutual fund business, and completion of agreed-upon procedures in respect of the mathematical accuracy of fund profitability and its conformity to established allocation methodologies. After considering PwC's reports issued under the engagement and information provided by Fidelity, the Board concluded that while other allocation methods may also be reasonable, Fidelity's profitability methodologies are reasonable in all material respects.
The Board also reviewed Fidelity's non-fund businesses and fall-out benefits related to the mutual fund business as well as cases where Fidelity's affiliates may benefit from or be related to the fund's business.
The Board considered the costs of the services provided by and the profits realized by Fidelity in connection with the operation of the fund and was satisfied that the profitability was not excessive.
Economies of Scale. The Board considered whether there have been economies of scale in respect of the management of the Fidelity funds, whether the Fidelity funds (including the fund) have appropriately benefited from any such economies of scale, and whether there is potential for realization of any further economies of scale. The Board considered the extent to which the fund will benefit from economies of scale as assets grow through increased services to the fund, through waivers or reimbursements, or through fee or expense ratio reductions. The Board also noted that in 2013, it and the boards of other Fidelity funds created an ad hoc committee (the Economies of Scale Committee) to analyze whether Fidelity attains economies of scale in respect of the management and servicing of the Fidelity funds, whether the Fidelity funds have appropriately benefited from such economies of scale, and whether there is potential for realization of any further economies of scale.
The Board recognized that the fund's management contract incorporates a "group fee" structure, which provides for lower group fee rates as total group assets increase, and for higher group fee rates as total group assets decrease (with "group assets" defined to include fund assets under FMR's management plus sector fund assets previously under FMR's management and currently managed by Fidelity SelectCo, LLC). FMR calculates the group fee rates based on a tiered asset "breakpoint" schedule that varies based on asset class. The Board considered that the group fee is designed to deliver the benefits of economies of scale to fund shareholders when total Fidelity fund assets increase, even if assets of any particular fund are unchanged or have declined, because some portion of Fidelity's costs are attributable to services provided to all Fidelity funds, and all funds benefit if those costs can be allocated among more assets. The Board concluded that, given the group fee structure, fund shareholders will benefit from lower management fees as group assets increase at the fund complex level, regardless of whether Fidelity achieves any such economies of scale.
Annual Report
The Board concluded, taking into account the analysis of the Economies of Scale Committee, that economies of scale, if any, are being appropriately shared between fund shareholders and Fidelity.
Additional Information Requested by the Board. In order to develop fully the factual basis for consideration of the Fidelity funds' Advisory Contracts, the Board requested and received additional information on certain topics, including: (i) fund performance trends and Fidelity's long-term strategies for certain funds; (ii) the various share classes employed by Fidelity and the attributes of each class, together with similar information on the distribution and servicing payments made by Fidelity or the funds to third-party participants in the distribution channels; (iii) fund profitability, and fund performance in relation to fund profitability; (iv) the methodology with respect to evaluating competitive fund data and peer group classifications and fee comparisons; (v) annual fund profitability margins, with particular focus on certain funds with negative margins; (vi) the realization of fall-out benefits in certain Fidelity business units; (vii) economies of scale and the way in which they are shared with fund shareholders; (viii) Fidelity's group fee structures, including the group fee schedule of breakpoints; (ix) the impact of cost containment measures on the funds; and (x) the transfer agent fee structure.
Based on its evaluation of all of the conclusions noted above, and after considering all factors it believed relevant, the Board concluded that the advisory fee structures are fair and reasonable, and that the fund's Advisory Contracts should be renewed.
Annual Report
Investment Adviser
Fidelity Management & Research Company
Boston, MA
Investment Sub-Advisers
FMR Co., Inc.
FMR Investment Management
(U.K.) Limited
Fidelity Management & Research
(Japan) Limited
Fidelity Management & Research
(Hong Kong) Limited
General Distributor
Fidelity Distributors Corporation
Smithfield, RI
Transfer and Service Agents
Fidelity Investments Institutional
Operations Company, Inc.
Boston, MA
Fidelity Service Company, Inc.
Boston, MA
Custodian
Northern Trust Company
Chicago, IL
The Fidelity Telephone Connection
Mutual Fund 24-Hour Service
Exchanges/Redemptions
and Account Assistance 1-800-544-6666
Product Information 1-800-544-6666
Retirement Accounts 1-800-544-4774
(8 a.m. - 9 p.m.)
TDD Service 1-800-544-0118
for the deaf and hearing impaired
(9 a.m. - 9 p.m. Eastern time)
Fidelity Automated Service
Telephone (FAST ®)
1-800-544-8544

Automated line for quickest service
(Fidelity Investment logo)(registered trademark)
Corporate Headquarters
245 Summer St., Boston, MA 02210
www.fidelity.com
GAI-UANN-0915
1.874515.107
Fidelity®
Growth & Income
Portfolio -
Class K
Annual Report
July 31, 2015
(Fidelity Cover Art)
Contents
Performance | (Click Here) | How the fund has done over time. |
Management's Discussion of Fund Performance | (Click Here) | The Portfolio Manager's review of fund performance and strategy. |
Shareholder Expense Example | (Click Here) | An example of shareholder expenses. |
Investment Changes | (Click Here) | A summary of major shifts in the fund's investments over the past six months. |
Investments | (Click Here) | A complete list of the fund's investments with their market values. |
Financial Statements | (Click Here) | Statements of assets and liabilities, operations, and changes in net assets, as well as financial highlights. |
Notes | (Click Here) | Notes to the financial statements. |
Report of Independent Registered Public Accounting Firm | (Click Here) | |
Trustees and Officers | (Click Here) | |
Distributions | (Click Here) | |
Board Approval of Investment Advisory Contracts and Management Fees | (Click Here) | |
To view a fund's proxy voting guidelines and proxy voting record for the 12-month period ended June 30, visit http://www.fidelity.com/proxyvotingresults or visit the Securities and Exchange Commission's (SEC) web site at http://www.sec.gov. You may also call 1-800-835-5092 to request a free copy of the proxy voting guidelines.
Standard & Poor's, S&P and S&P 500 are registered service marks of The McGraw-Hill Companies, Inc. and have been licensed for use by Fidelity Distributors Corporation.
Other third-party marks appearing herein are the property of their respective owners.
All other marks appearing herein are registered or unregistered trademarks or service marks of FMR LLC or an affiliated company. © 2015 FMR LLC. All rights reserved.
Annual Report
This report and the financial statements contained herein are submitted for the general information of the shareholders of the fund. This report is not authorized for distribution to prospective investors in the fund unless preceded or accompanied by an effective prospectus.
A fund files its complete schedule of portfolio holdings with the SEC for the first and third quarters of each fiscal year on Form N-Q. Forms N-Q are available on the SEC's web site at http://www.sec.gov. A fund's Forms N-Q may be reviewed and copied at the SEC's Public Reference Room in Washington, DC. Information regarding the operation of the SEC's Public Reference Room may be obtained by calling 1-800-SEC-0330. For a complete list of a fund's portfolio holdings, view the most recent holdings listing, semiannual report, or annual report on Fidelity's web site at http://www.fidelity.com, http://www.advisor.fidelity.com, or http://www.401k.com, as applicable.
NOT FDIC INSURED • MAY LOSE VALUE • NO BANK GUARANTEE
Neither the fund nor Fidelity Distributors Corporation is a bank.
Annual Report
Average annual total return reflects the change in the value of an investment, assuming reinvestment of the class' distributions from dividend income and capital gains (the profits earned upon the sale of securities that have grown in value, if any) and assuming a constant rate of performance each year. The $10,000 table and the fund's returns do not reflect the deduction of taxes that a shareholder would pay on fund distributions or the redemption of fund shares. During periods of reimbursement by Fidelity, a fund's total return will be greater than it would be had the reimbursement not occurred. How a fund did yesterday is no guarantee of how it will do tomorrow.
Average Annual Total Returns
Periods ended July 31, 2015 | Past 1
year | Past 5
years | Past 10
years |
Class K A | 8.34% | 16.55% | 3.81% |
A The initial offering of Class K shares took place on May 9, 2008. Returns prior to May 9, 2008, are those of Fidelity® Growth & Income Portfolio, the original class of the fund.
$10,000 Over 10 Years
Let's say hypothetically that $10,000 was invested in Fidelity® Growth & Income Portfolio - Class K on July 31, 2005. The chart shows how the value of your investment would have changed, and also shows how the S&P 500® Index performed over the same period. See footnote A above for additional information regarding the performance of Class K.
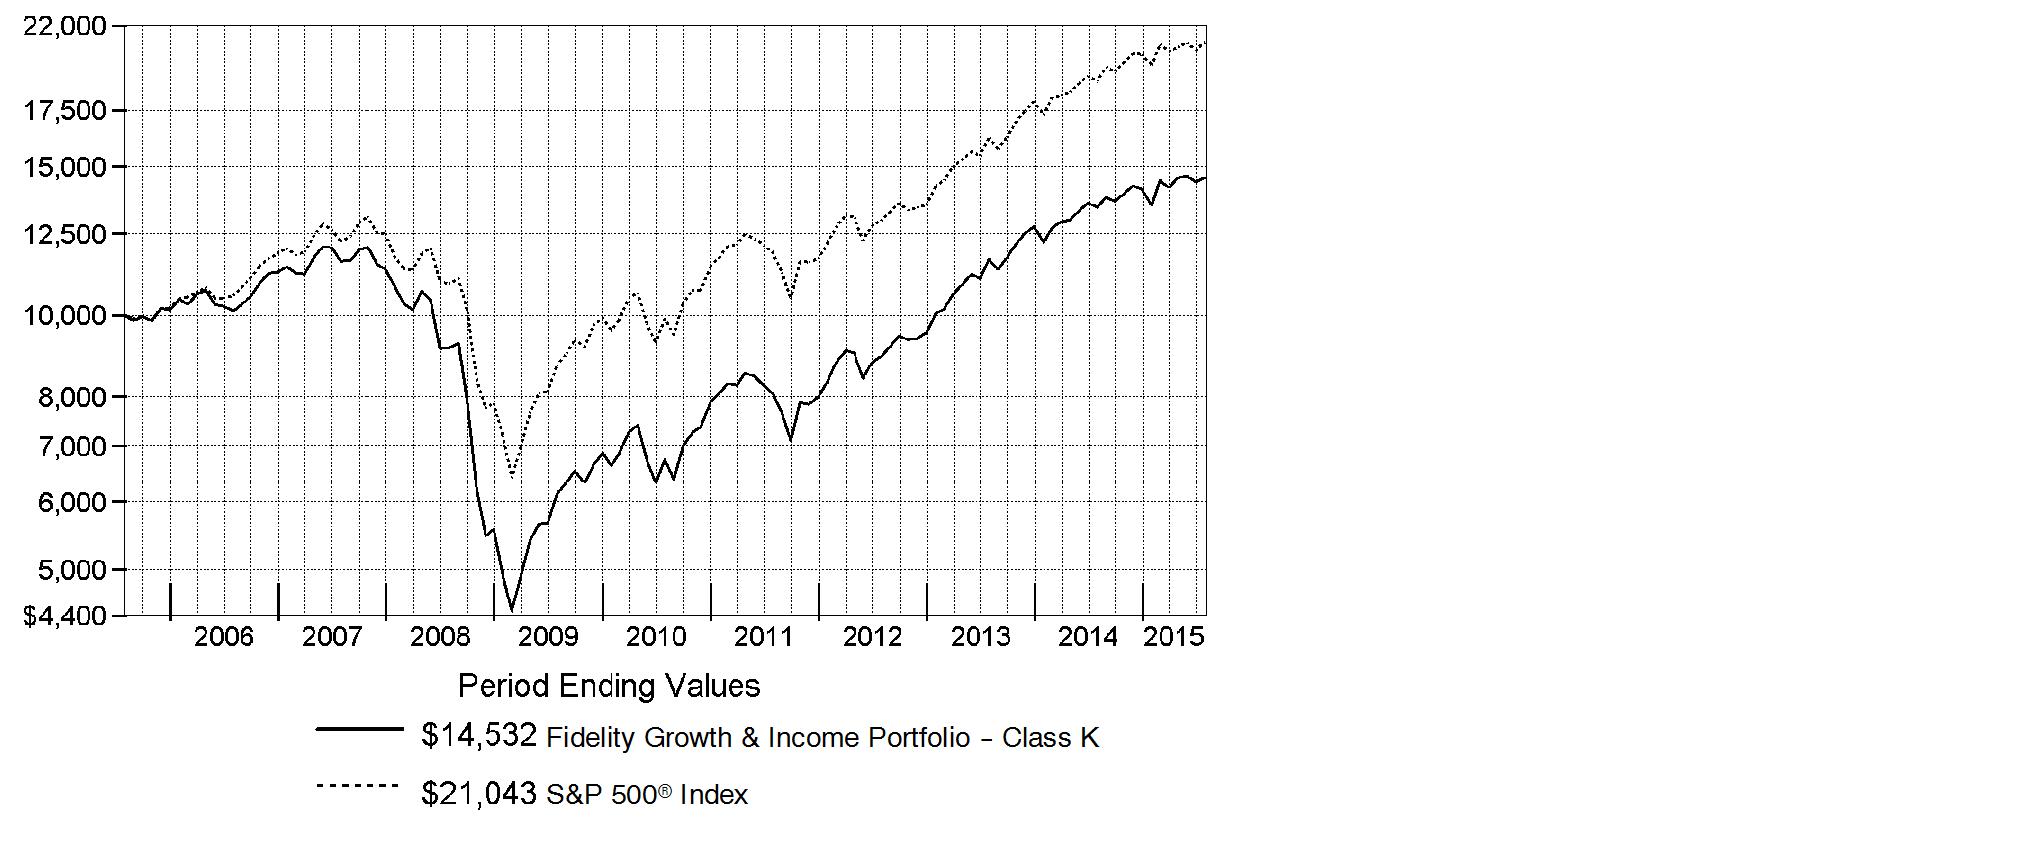
Annual Report
Market Recap: The U.S. equity market gained strongly for the 12 months ending July 31, 2015, as stocks recovered from volatility in late 2014 and early 2015, supported by a still-positive economic backdrop. The S&P 500® Index returned 11.21%, with growth stocks in the index far outpacing value-oriented names on prospects for continued U.S. economic growth. Consequently, the growth-oriented Nasdaq Composite Index® rose 18.71%, outpacing the broader S&P 500®, as well as the 12.03% advance of the smaller-cap Russell 2000® Index. Within the S&P 500®, seven of 10 sectors notched a gain, with significant performance variation. Health care (+27%) led the way, aided by merger activity. Consumer discretionary (+24%) benefited from spending linked to a seven-year low in unemployment. Strong first halves for the consumer staples sector and the real estate segment of financials yielded above-market returns (19% and 12%, respectively) for the full-year period. Conversely, energy (-26%) significantly lagged, due to a roughly 55% decline for U.S. crude-oil prices. Materials (-4%) also lost ground. At period end, investors remained focused on the slowing rate of U.S. earnings growth, the possible effect of a relatively stronger U.S. dollar on exports and inflation, and whether an economic slowdown in China would create ripples for the global economy.
Comments from Portfolio Manager Matthew Fruhan: For the year, the fund's share classes lagged the benchmark S&P 500® Index. (For specific class-level results, please see the Performance section of this report.) Versus the benchmark, the biggest negative was our unhelpful underweighting and subpar stock picking in the market-leading health care sector. Positioning in energy also hurt the relative result, as did currency effects. Conversely, the fund benefited from stock selections in the information technology and financials sectors. On the negative side, most stocks with significant correlation to the price of oil struggled, including Canada's Suncor Energy, a non-benchmark holding that also was hurt by the rising value of the U.S. dollar versus the Canadian dollar. Other energy laggards included Chevron and Apache. However, largely avoiding energy giant Exxon Mobil, a high-quality company whose valuation I found less attractive than its competitors, contributed meaningfully to the fund's relative result. In the consumer discretionary sector, the fund was hurt most by not owning Internet retailer Amazon.com, an index constituent whose shares rose about 71% the past year. Meanwhile, within financials, JPMorgan Chase, our largest individual position and biggest overweighting, added to performance. The company provided what I considered a compelling risk/reward tradeoff. In consumer discretionary, retailers Target and Lowe's also added value.
The views expressed above reflect those of the portfolio manager(s) only through the end of the period as stated on the cover of this report and do not necessarily represent the views of Fidelity or any other person in the Fidelity organization. Any such views are subject to change at any time based upon market or other conditions and Fidelity disclaims any responsibility to update such views. These views may not be relied on as investment advice and, because investment decisions for a Fidelity fund are based on numerous factors, may not be relied on as an indication of trading intent on behalf of any Fidelity fund.
Annual Report
Shareholder Expense Example
As a shareholder of the Fund, you incur two types of costs: (1) transaction costs and (2) ongoing costs, including management fees and other Fund expenses. This Example is intended to help you understand your ongoing costs (in dollars) of investing in the Fund and to compare these costs with the ongoing costs of investing in other mutual funds.
The Example is based on an investment of $1,000 invested at the beginning of the period and held for the entire period (February 1, 2015 to July 31, 2015).
Actual Expenses
The first line of the accompanying table for each class of the Fund provides information about actual account values and actual expenses. You may use the information in this line, together with the amount you invested, to estimate the expenses that you paid over the period. Simply divide your account value by $1,000.00 (for example, an $8,600 account value divided by $1,000.00 = 8.6), then multiply the result by the number in the first line for a class of the Fund under the heading entitled "Expenses Paid During Period" to estimate the expenses you paid on your account during this period. A small balance maintenance fee of $12.00 that is charged once a year may apply for certain accounts with a value of less than $2,000. This fee is not included in the table below. If it was, the estimate of expenses you paid during the period would be higher, and your ending account value lower, by this amount. In addition, the Fund, as a shareholder in the underlying Fidelity Central Funds, will indirectly bear its pro-rata share of the fees and expenses incurred by the underlying Fidelity Central Funds. These fees and expenses are not included in the Fund's annualized expense ratio used to calculate the expense estimate in the table below.
Hypothetical Example for Comparison Purposes
The second line of the accompanying table for each class of the Fund provides information about hypothetical account values and hypothetical expenses based on a Class' actual expense ratio and an assumed rate of return of 5% per year before expenses, which is not the Class' actual return. The hypothetical account values and expenses may not be used to estimate the actual ending account balance or expenses you paid for the period. You may use this information to compare the ongoing costs of investing in the Fund and other funds. To do so, compare this 5% hypothetical example with the 5% hypothetical examples that appear in the shareholder reports of the other funds. A small balance maintenance fee of $12.00 that is charged once a year may apply for certain accounts with a value of less than $2,000. This fee is not included in the table below. If it was, the estimate of expenses you paid during the period would be higher, and your ending account value lower, by this amount. In addition, the Fund, as a shareholder in the underlying Fidelity Central Funds, will indirectly bear its pro-rata share of the fees and expenses incurred by the underlying Fidelity Central Funds. These fees and expenses are not included in the Fund's annualized expense ratio used to calculate the expense estimate in the table below.
Please note that the expenses shown in the table are meant to highlight your ongoing costs only and do not reflect any transaction costs. Therefore, the second line of the table is useful in comparing ongoing costs only, and will not help you determine the relative total costs of owning different funds.
Annual Report
| Annualized
Expense Ratio B | Beginning
Account Value
February 1, 2015 | Ending
Account Value
July 31, 2015 | Expenses Paid
During Period*
February 1, 2015
to July 31, 2015 |
Growth and Income | .63% | | | |
Actual | | $ 1,000.00 | $ 1,078.40 | $ 3.25 |
Hypothetical A | | $ 1,000.00 | $ 1,021.67 | $ 3.16 |
Class K | .52% | | | |
Actual | | $ 1,000.00 | $ 1,078.50 | $ 2.68 |
Hypothetical A | | $ 1,000.00 | $ 1,022.22 | $ 2.61 |
A 5% return per year before expenses
B Annualized expense ratio reflects expenses net of applicable fee waivers
* Expenses are equal to each Class' annualized expense ratio, multiplied by the average account value over the period, multiplied by 181/365 (to reflect the one-half year period).
Annual Report
Investment Changes (Unaudited)
Top Ten Stocks as of July 31, 2015 |
| % of fund's
net assets | % of fund's net assets
6 months ago |
JPMorgan Chase & Co. | 4.4 | 3.9 |
Apple, Inc. | 3.5 | 3.9 |
General Electric Co. | 3.3 | 3.1 |
Microsoft Corp. | 2.9 | 2.9 |
Citigroup, Inc. | 2.8 | 2.2 |
Bank of America Corp. | 2.7 | 2.1 |
Target Corp. | 2.2 | 2.4 |
Procter & Gamble Co. | 2.0 | 2.1 |
Comcast Corp. Class A | 2.0 | 1.9 |
Chevron Corp. | 1.8 | 2.3 |
| 27.6 | |
Top Five Market Sectors as of July 31, 2015 |
| % of fund's
net assets | % of fund's net assets
6 months ago |
Financials | 22.9 | 20.5 |
Information Technology | 21.8 | 20.0 |
Industrials | 12.7 | 13.1 |
Health Care | 10.8 | 9.9 |
Consumer Discretionary | 9.5 | 10.6 |
Asset Allocation (% of fund's net assets) |
As of July 31, 2015* | As of January 31, 2015** |
 | Stocks 98.8% | |  | Stocks 98.9% | |
 | Convertible
Securities 1.0% | |  | Convertible
Securities 1.0% | |
 | Other Investments 0.1% | |  | Other Investments 0.1% | |
 | Short-Term
Investments and
Net Other Assets (Liabilities) 0.1% | |  | Short-Term
Investments and
Net Other Assets (Liabilities) 0.0% | |
* Foreign investments | 11.9% | | ** Foreign investments | 12.5% | |

Annual Report
Investments July 31, 2015
Showing Percentage of Net Assets
Common Stocks - 98.8% |
| Shares | | Value (000s) |
CONSUMER DISCRETIONARY - 9.5% |
Automobiles - 0.2% |
Harley-Davidson, Inc. | 206,700 | | $ 12,051 |
Diversified Consumer Services - 0.4% |
H&R Block, Inc. | 762,607 | | 25,387 |
Hotels, Restaurants & Leisure - 1.1% |
Las Vegas Sands Corp. | 442,000 | | 24,770 |
Yum! Brands, Inc. | 633,744 | | 55,617 |
| | 80,387 |
Household Durables - 0.2% |
Tupperware Brands Corp. | 276,800 | | 16,184 |
Leisure Products - 0.1% |
Mattel, Inc. | 367,800 | | 8,537 |
Media - 4.2% |
Comcast Corp. Class A | 2,304,700 | | 143,836 |
Scripps Networks Interactive, Inc. Class A (e) | 348,489 | | 21,808 |
Sinclair Broadcast Group, Inc. Class A (e) | 733,661 | | 21,291 |
Time Warner, Inc. | 1,039,017 | | 91,475 |
Viacom, Inc. Class B (non-vtg.) | 554,000 | | 31,578 |
| | 309,988 |
Multiline Retail - 2.2% |
Dillard's, Inc. Class A | 42,500 | | 4,330 |
Target Corp. | 1,971,675 | | 161,382 |
| | 165,712 |
Specialty Retail - 1.1% |
Lowe's Companies, Inc. | 1,213,879 | | 84,195 |
TOTAL CONSUMER DISCRETIONARY | | 702,441 |
CONSUMER STAPLES - 8.8% |
Beverages - 3.0% |
Diageo PLC | 1,403,746 | | 39,351 |
Molson Coors Brewing Co. Class B | 116,700 | | 8,302 |
PepsiCo, Inc. | 454,114 | | 43,754 |
SABMiller PLC | 464,448 | | 24,403 |
The Coca-Cola Co. | 2,569,703 | | 105,563 |
| | 221,373 |
Food & Staples Retailing - 1.1% |
CVS Health Corp. | 508,304 | | 57,169 |
Walgreens Boots Alliance, Inc. | 295,084 | | 28,514 |
| | 85,683 |
Common Stocks - continued |
| Shares | | Value (000s) |
CONSUMER STAPLES - continued |
Food Products - 0.0% |
The J.M. Smucker Co. | 20,100 | | $ 2,245 |
Household Products - 2.0% |
Procter & Gamble Co. | 1,916,515 | | 146,997 |
Tobacco - 2.7% |
British American Tobacco PLC sponsored ADR | 715,523 | | 85,147 |
Imperial Tobacco Group PLC | 228,799 | | 12,023 |
Philip Morris International, Inc. | 914,371 | | 78,206 |
Reynolds American, Inc. | 300,300 | | 25,763 |
| | 201,139 |
TOTAL CONSUMER STAPLES | | 657,437 |
ENERGY - 8.4% |
Energy Equipment & Services - 1.0% |
Ensco PLC Class A | 1,532,823 | | 25,414 |
Oceaneering International, Inc. | 644,000 | | 25,773 |
Schlumberger Ltd. | 247,232 | | 20,476 |
| | 71,663 |
Oil, Gas & Consumable Fuels - 7.4% |
Apache Corp. | 926,168 | | 42,474 |
Chevron Corp. | 1,531,796 | | 135,533 |
ConocoPhillips Co. | 713,200 | | 35,902 |
EQT Midstream Partners LP | 144,100 | | 11,352 |
Foresight Energy LP | 197,562 | | 1,644 |
Golar LNG Ltd. | 559,200 | | 24,085 |
Imperial Oil Ltd. | 1,392,700 | | 51,529 |
Kinder Morgan, Inc. | 506,000 | | 17,528 |
Legacy Reserves LP | 936,300 | | 7,313 |
Markwest Energy Partners LP | 915,654 | | 59,920 |
PrairieSky Royalty Ltd. (e) | 548,700 | | 11,265 |
Suncor Energy, Inc. | 3,668,350 | | 103,331 |
The Williams Companies, Inc. | 810,772 | | 42,549 |
Williams Partners LP | 105,985 | | 4,889 |
| | 549,314 |
TOTAL ENERGY | | 620,977 |
FINANCIALS - 22.8% |
Banks - 15.3% |
Bank of America Corp. | 11,173,256 | | 199,778 |
Common Stocks - continued |
| Shares | | Value (000s) |
FINANCIALS - continued |
Banks - continued |
Citigroup, Inc. | 3,519,330 | | $ 205,740 |
Comerica, Inc. | 435,500 | | 20,656 |
Commerce Bancshares, Inc. | 221,000 | | 10,407 |
Fifth Third Bancorp | 813,700 | | 17,145 |
First Republic Bank | 64,900 | | 4,140 |
FirstMerit Corp. | 456,200 | | 8,549 |
JPMorgan Chase & Co. | 4,731,692 | | 324,265 |
Lloyds Banking Group PLC | 3,108,300 | | 4,048 |
M&T Bank Corp. | 186,200 | | 24,420 |
PNC Financial Services Group, Inc. | 436,054 | | 42,812 |
Regions Financial Corp. | 2,839,400 | | 29,501 |
Standard Chartered PLC (United Kingdom) | 2,586,563 | | 39,593 |
SunTrust Banks, Inc. | 1,630,466 | | 72,295 |
U.S. Bancorp | 1,760,973 | | 79,614 |
UMB Financial Corp. | 170,200 | | 9,330 |
Wells Fargo & Co. | 796,641 | | 46,102 |
| | 1,138,395 |
Capital Markets - 5.1% |
Charles Schwab Corp. | 1,305,943 | | 45,551 |
Invesco Ltd. | 106,900 | | 4,126 |
KKR & Co. LP | 2,044,543 | | 48,865 |
Morgan Stanley | 1,270,397 | | 49,342 |
Northern Trust Corp. | 699,364 | | 53,494 |
Oaktree Capital Group LLC Class A | 240,200 | | 13,257 |
State Street Corp. | 1,562,327 | | 119,612 |
The Blackstone Group LP | 761,000 | | 29,869 |
TPG Specialty Lending, Inc. | 1,017,845 | | 18,118 |
| | 382,234 |
Insurance - 1.6% |
ACE Ltd. | 20,600 | | 2,241 |
Brown & Brown, Inc. | 147,700 | | 4,941 |
Marsh & McLennan Companies, Inc. | 302,846 | | 17,547 |
MetLife, Inc. | 1,136,440 | | 63,345 |
Principal Financial Group, Inc. | 497,900 | | 27,638 |
| | 115,712 |
Real Estate Investment Trusts - 0.5% |
American Tower Corp. | 59,000 | | 5,611 |
First Potomac Realty Trust | 183,418 | | 2,082 |
Lamar Advertising Co. Class A | 62,600 | | 3,759 |
Sabra Health Care REIT, Inc. | 223,000 | | 6,099 |
Common Stocks - continued |
| Shares | | Value (000s) |
FINANCIALS - continued |
Real Estate Investment Trusts - continued |
Ventas, Inc. | 139,700 | | $ 9,372 |
WP Carey, Inc. | 129,800 | | 7,942 |
| | 34,865 |
Thrifts & Mortgage Finance - 0.3% |
Radian Group, Inc. | 1,051,368 | | 19,408 |
TOTAL FINANCIALS | | 1,690,614 |
HEALTH CARE - 10.0% |
Biotechnology - 1.8% |
Amgen, Inc. | 466,303 | | 82,344 |
Baxalta, Inc. | 46,700 | | 1,533 |
Biogen, Inc. (a) | 123,900 | | 39,497 |
Intercept Pharmaceuticals, Inc. (a) | 38,926 | | 10,269 |
| | 133,643 |
Health Care Equipment & Supplies - 1.4% |
Abbott Laboratories | 428,404 | | 21,716 |
Ansell Ltd. | 266,311 | | 4,878 |
Medtronic PLC | 484,330 | | 37,967 |
St. Jude Medical, Inc. | 155,200 | | 11,457 |
Zimmer Biomet Holdings, Inc. | 297,810 | | 30,993 |
| | 107,011 |
Health Care Providers & Services - 1.6% |
Cardinal Health, Inc. | 160,900 | | 13,673 |
Express Scripts Holding Co. (a) | 209,200 | | 18,843 |
McKesson Corp. | 302,387 | | 66,698 |
Patterson Companies, Inc. | 366,270 | | 18,372 |
| | 117,586 |
Pharmaceuticals - 5.2% |
AbbVie, Inc. | 183,900 | | 12,875 |
Astellas Pharma, Inc. | 775,300 | | 11,679 |
GlaxoSmithKline PLC sponsored ADR | 2,086,722 | | 90,647 |
Johnson & Johnson | 1,342,669 | | 134,549 |
Novartis AG sponsored ADR | 227,144 | | 23,566 |
Teva Pharmaceutical Industries Ltd. sponsored ADR | 1,477,020 | | 101,944 |
Theravance, Inc. (e) | 858,600 | | 13,154 |
| | 388,414 |
TOTAL HEALTH CARE | | 746,654 |
Common Stocks - continued |
| Shares | | Value (000s) |
INDUSTRIALS - 12.7% |
Aerospace & Defense - 2.2% |
Meggitt PLC | 3,191,000 | | $ 23,147 |
Rolls-Royce Group PLC | 156,700 | | 1,943 |
The Boeing Co. | 660,089 | | 95,165 |
United Technologies Corp. | 447,082 | | 44,847 |
| | 165,102 |
Air Freight & Logistics - 1.8% |
C.H. Robinson Worldwide, Inc. | 65,900 | | 4,623 |
FedEx Corp. | 46,000 | | 7,885 |
PostNL NV (a) | 4,575,900 | | 19,660 |
United Parcel Service, Inc. Class B | 1,012,004 | | 103,589 |
| | 135,757 |
Airlines - 0.2% |
Copa Holdings SA Class A | 219,700 | | 16,594 |
Building Products - 0.2% |
Lennox International, Inc. | 121,300 | | 14,322 |
Commercial Services & Supplies - 0.7% |
ADT Corp. (e) | 982,810 | | 33,936 |
KAR Auction Services, Inc. | 527,100 | | 20,520 |
| | 54,456 |
Electrical Equipment - 0.8% |
Emerson Electric Co. | 551,600 | | 28,545 |
Hubbell, Inc. Class B | 260,639 | | 27,213 |
| | 55,758 |
Industrial Conglomerates - 3.3% |
General Electric Co. | 9,426,180 | | 246,023 |
Machinery - 0.8% |
Deere & Co. | 245,800 | | 23,245 |
Donaldson Co., Inc. | 230,200 | | 7,735 |
IMI PLC | 398,000 | | 6,595 |
Joy Global, Inc. | 156,000 | | 4,120 |
Pentair PLC | 114,800 | | 6,981 |
Valmont Industries, Inc. | 43,000 | | 4,783 |
Xylem, Inc. | 74,400 | | 2,569 |
| | 56,028 |
Professional Services - 0.1% |
Acacia Research Corp. | 415,902 | | 3,914 |
Road & Rail - 2.1% |
CSX Corp. | 2,045,320 | | 63,978 |
J.B. Hunt Transport Services, Inc. | 570,540 | | 47,994 |
Common Stocks - continued |
| Shares | | Value (000s) |
INDUSTRIALS - continued |
Road & Rail - continued |
Kansas City Southern | 229,200 | | $ 22,734 |
Norfolk Southern Corp. | 253,899 | | 21,411 |
| | 156,117 |
Trading Companies & Distributors - 0.5% |
W.W. Grainger, Inc. | 11,500 | | 2,630 |
Watsco, Inc. | 287,892 | | 36,919 |
| | 39,549 |
TOTAL INDUSTRIALS | | 943,620 |
INFORMATION TECHNOLOGY - 21.7% |
Communications Equipment - 3.2% |
Cisco Systems, Inc. | 3,830,752 | | 108,870 |
QUALCOMM, Inc. | 1,977,146 | | 127,308 |
| | 236,178 |
Internet Software & Services - 3.4% |
Google, Inc.: | | | |
Class A (a) | 185,007 | | 121,642 |
Class C | 163,146 | | 102,066 |
Yahoo!, Inc. (a) | 651,595 | | 23,894 |
| | 247,602 |
IT Services - 5.9% |
Cognizant Technology Solutions Corp. Class A (a) | 456,172 | | 28,784 |
Fidelity National Information Services, Inc. | 237,736 | | 15,555 |
IBM Corp. | 534,204 | | 86,536 |
Leidos Holdings, Inc. | 57,200 | | 2,334 |
MasterCard, Inc. Class A | 931,800 | | 90,757 |
Paychex, Inc. | 1,735,657 | | 80,534 |
The Western Union Co. | 921,480 | | 18,651 |
Unisys Corp. (a) | 885,200 | | 14,048 |
Visa, Inc. Class A | 1,352,184 | | 101,874 |
| | 439,073 |
Semiconductors & Semiconductor Equipment - 0.6% |
Analog Devices, Inc. | 75,300 | | 4,392 |
Broadcom Corp. Class A | 269,582 | | 13,644 |
Marvell Technology Group Ltd. | 951,500 | | 11,837 |
Maxim Integrated Products, Inc. | 464,200 | | 15,801 |
| | 45,674 |
Common Stocks - continued |
| Shares | | Value (000s) |
INFORMATION TECHNOLOGY - continued |
Software - 3.6% |
Microsoft Corp. | 4,643,599 | | $ 216,856 |
Oracle Corp. | 1,281,653 | | 51,189 |
| | 268,045 |
Technology Hardware, Storage & Peripherals - 5.0% |
Apple, Inc. | 2,126,394 | | 257,932 |
EMC Corp. | 2,861,300 | | 76,940 |
First Data Holdings, Inc. Class B (a)(h) | 5,155,476 | | 25,520 |
Western Digital Corp. | 147,900 | | 12,728 |
| | 373,120 |
TOTAL INFORMATION TECHNOLOGY | | 1,609,692 |
MATERIALS - 3.3% |
Chemicals - 2.8% |
Airgas, Inc. | 400,206 | | 40,829 |
E.I. du Pont de Nemours & Co. | 335,446 | | 18,704 |
Eastman Chemical Co. | 7,500 | | 588 |
LyondellBasell Industries NV Class A | 62,500 | | 5,864 |
Monsanto Co. | 708,415 | | 72,180 |
Potash Corp. of Saskatchewan, Inc. | 759,200 | | 20,654 |
Syngenta AG (Switzerland) | 108,585 | | 44,734 |
The Chemours Co. LLC | 132,309 | | 1,445 |
Tronox Ltd. Class A | 356,700 | | 3,917 |
| | 208,915 |
Containers & Packaging - 0.2% |
Packaging Corp. of America | 105,300 | | 7,454 |
WestRock Co. | 162,100 | | 10,222 |
| | 17,676 |
Metals & Mining - 0.2% |
Freeport-McMoRan, Inc. | 1,278,500 | | 15,022 |
Paper & Forest Products - 0.1% |
Domtar Corp. | 91,900 | | 3,737 |
International Paper Co. | 46,700 | | 2,236 |
| | 5,973 |
TOTAL MATERIALS | | 247,586 |
Common Stocks - continued |
| Shares | | Value (000s) |
TELECOMMUNICATION SERVICES - 1.4% |
Diversified Telecommunication Services - 1.4% |
TDC A/S | 593,200 | | $ 4,474 |
Verizon Communications, Inc. | 2,058,974 | | 96,339 |
| | 100,813 |
UTILITIES - 0.2% |
Electric Utilities - 0.2% |
PPL Corp. | 156,700 | | 4,985 |
Southern Co. | 260,900 | | 11,670 |
| | 16,655 |
TOTAL COMMON STOCKS (Cost $6,165,027) |
7,336,489
|
Convertible Preferred Stocks - 0.8% |
| | | |
CONSUMER DISCRETIONARY - 0.0% |
Leisure Products - 0.0% |
NJOY, Inc. Series D (a)(h) | 68,794 | | 34 |
HEALTH CARE - 0.8% |
Health Care Equipment & Supplies - 0.8% |
Alere, Inc. 3.00% | 185,143 | | 61,416 |
TOTAL CONVERTIBLE PREFERRED STOCKS (Cost $46,947) |
61,450
|
Convertible Bonds - 0.2% |
| Principal Amount
(000s) (d) | | |
CONSUMER DISCRETIONARY - 0.0% |
Automobiles - 0.0% |
Tesla Motors, Inc. 1.25% 3/1/21 | | $ 3,470 | | 3,388 |
ENERGY - 0.1% |
Oil, Gas & Consumable Fuels - 0.1% |
Amyris, Inc.: | | | | |
3% 2/27/17 | | 5,615 | | 4,982 |
5% 10/15/18 (h) | | 3,018 | | 2,501 |
Peabody Energy Corp. 4.75% 12/15/41 | | 7,660 | | 847 |
| | 8,330 |
Convertible Bonds - continued |
| Principal Amount
(000s) (d) | | Value (000s) |
INFORMATION TECHNOLOGY - 0.1% |
Internet Software & Services - 0.1% |
Twitter, Inc. 0.25% 9/15/19 (f) | | $ 5,840 | | $ 5,139 |
TOTAL CONVERTIBLE BONDS (Cost $22,706) |
16,857
|
Preferred Securities - 0.1% |
|
FINANCIALS - 0.1% |
Diversified Financial Services - 0.1% |
Baggot Securities Ltd. 10.24% (f)(g) (Cost $4,623) | EUR | 3,010 | |
3,559
|
Money Market Funds - 0.6% |
| Shares | | |
Fidelity Securities Lending Cash Central Fund, 0.18% (b)(c)
(Cost $42,660) | 42,659,669 | |
42,660
|
TOTAL INVESTMENT PORTFOLIO - 100.5% (Cost $6,281,963) | | 7,461,015 |
NET OTHER ASSETS (LIABILITIES) - (0.5)% | | (36,820) |
NET ASSETS - 100% | $ 7,424,195 |
Currency Abbreviations |
EUR | - | European Monetary Unit |
Legend |
(a) Non-income producing |
(b) Affiliated fund that is generally available only to investment companies and other accounts managed by Fidelity Investments. The rate quoted is the annualized seven-day yield of the fund at period end. A complete unaudited listing of the fund's holdings as of its most recent quarter end is available upon request. In addition, each Fidelity Central Fund's financial statements, which are not covered by the Fund's Report of Independent Registered Public Accounting Firm, are available on the SEC's website or upon request. |
(c) Investment made with cash collateral received from securities on loan. |
(d) Amount is stated in United States dollars unless otherwise noted. |
(e) Security or a portion of the security is on loan at period end. |
(f) Security exempt from registration under Rule 144A of the Securities Act of 1933. These securities may be resold in transactions exempt from registration, normally to qualified institutional buyers. At the end of the period, the value of these securities amounted to $8,698,000 or 0.1% of net assets. |
(g) Security is perpetual in nature with no stated maturity date. |
(h) Restricted securities - Investment in securities not registered under the Securities Act of 1933 (excluding 144A issues). At the end of the period, the value of restricted securities (excluding 144A issues) amounted to $28,055,000 or 0.4% of net assets. |
Additional information on each restricted holding is as follows: |
Security | Acquisition Date | Acquisition Cost (000s) |
Amyris, Inc. 5% 10/15/18 | 10/16/13 | $ 2,800 |
First Data Holdings, Inc. Class B | 6/26/14 | $ 20,622 |
NJOY, Inc.
Series D | 2/14/14 | $ 1,164 |
Affiliated Central Funds |
Information regarding fiscal year to date income earned by the Fund from investments in Fidelity Central Funds is as follows: |
Fund | Income earned
(Amounts in thousands) |
Fidelity Cash Central Fund | $ 11 |
Fidelity Securities Lending Cash Central Fund | 735 |
Total | $ 746 |
Other Information |
The following is a summary of the inputs used, as of July 31, 2015, involving the Fund's assets and liabilities carried at fair value. The inputs or methodology used for valuing securities may not be an indication of the risk associated with investing in those securities. For more information on valuation inputs, and their aggregation into the levels used in the table below, please refer to the Investment Valuation section in the accompanying Notes to Financial Statements. |
Valuation Inputs at Reporting Date: |
Description
(Amounts in thousands) | Total | Level 1 | Level 2 | Level 3 |
Investments in Securities: | | | | |
Equities: | | | | |
Consumer Discretionary | $ 702,475 | $ 702,441 | $ - | $ 34 |
Consumer Staples | 657,437 | 618,086 | 39,351 | - |
Energy | 620,977 | 620,977 | - | - |
Financials | 1,690,614 | 1,686,566 | 4,048 | - |
Health Care | 808,070 | 808,070 | - | - |
Industrials | 943,620 | 943,620 | - | - |
Information Technology | 1,609,692 | 1,584,172 | - | 25,520 |
Materials | 247,586 | 202,852 | 44,734 | - |
Telecommunication Services | 100,813 | 100,813 | - | - |
Utilities | 16,655 | 16,655 | - | - |
Corporate Bonds | 16,857 | - | 16,857 | - |
Preferred Securities | 3,559 | - | 3,559 | - |
Money Market Funds | 42,660 | 42,660 | - | - |
Total Investments in Securities: | $ 7,461,015 | $ 7,326,912 | $ 108,549 | $ 25,554 |
Distribution of investments by country or territory of incorporation, as a percentage of total net assets, is as follows (Unaudited): |
United States of America | 88.1% |
United Kingdom | 4.6% |
Canada | 2.5% |
Israel | 1.4% |
Others (Individually Less Than 1%) | 3.4% |
| 100.0% |
See accompanying notes which are an integral part of the financial statements.
Annual Report
Statement of Assets and Liabilities
Amounts in thousands (except per-share amounts) | | July 31, 2015 |
| | |
Assets | | |
Investment in securities, at value (including securities loaned of $42,222) - See accompanying schedule: Unaffiliated issuers (cost $6,239,303) | $ 7,418,355 | |
Fidelity Central Funds (cost $42,660) | 42,660 | |
Total Investments (cost $6,281,963) | | $ 7,461,015 |
Foreign currency held at value (cost $242) | | 243 |
Receivable for investments sold | | 43,373 |
Receivable for fund shares sold | | 6,259 |
Dividends receivable | | 9,373 |
Interest receivable | | 187 |
Distributions receivable from Fidelity Central Funds | | 49 |
Other receivables | | 767 |
Total assets | | 7,521,266 |
| | |
Liabilities | | |
Payable for investments purchased | $ 38,409 | |
Payable for fund shares redeemed | 4,261 | |
Accrued management fee | 2,777 | |
Notes payable to affiliates | 7,108 | |
Other affiliated payables | 1,041 | |
Other payables and accrued expenses | 815 | |
Collateral on securities loaned, at value | 42,660 | |
Total liabilities | | 97,071 |
| | |
Net Assets | | $ 7,424,195 |
Net Assets consist of: | | |
Paid in capital | | $ 8,922,704 |
Distributions in excess of net investment income | | (722) |
Accumulated undistributed net realized gain (loss) on investments and foreign currency transactions | | (2,676,809) |
Net unrealized appreciation (depreciation) on investments and assets and liabilities in foreign currencies | | 1,179,022 |
Net Assets | | $ 7,424,195 |
See accompanying notes which are an integral part of the financial statements.
Annual Report
Financial Statements - continued
Statement of Assets and Liabilities - continued
Amounts in thousands (except per-share amounts) | | July 31, 2015 |
| | |
Growth and Income:
Net Asset Value, offering price and redemption price per share ($6,562,578 ÷ 212,744 shares) | | $ 30.85 |
| | |
Class K:
Net Asset Value, offering price and redemption price per share ($861,617 ÷ 27,953 shares) | | $ 30.82 |
See accompanying notes which are an integral part of the financial statements.
Annual Report
Statement of Operations
Amounts in thousands | Year ended July 31, 2015 |
| | |
Investment Income | | |
Dividends | | $ 185,479 |
Interest | | 887 |
Income from Fidelity Central Funds | | 746 |
Total income | | 187,112 |
| | |
Expenses | | |
Management fee | $ 34,114 | |
Transfer agent fees | 11,401 | |
Accounting and security lending fees | 1,203 | |
Custodian fees and expenses | 181 | |
Independent trustees' compensation | 36 | |
Registration fees | 82 | |
Audit | 101 | |
Legal | 45 | |
Interest | 6 | |
Miscellaneous | 51 | |
Total expenses before reductions | 47,220 | |
Expense reductions | (268) | 46,952 |
Net investment income (loss) | | 140,160 |
Realized and Unrealized Gain (Loss) Net realized gain (loss) on: | | |
Investment securities: | | |
Unaffiliated issuers | 743,232 | |
Foreign currency transactions | 28 | |
Total net realized gain (loss) | | 743,260 |
Change in net unrealized appreciation (depreciation) on: Investment securities | (281,491) | |
Assets and liabilities in foreign currencies | (28) | |
Total change in net unrealized appreciation (depreciation) | | (281,519) |
Net gain (loss) | | 461,741 |
Net increase (decrease) in net assets resulting from operations | | $ 601,901 |
See accompanying notes which are an integral part of the financial statements.
Annual Report
Financial Statements - continued
Statement of Changes in Net Assets
Amounts in thousands | Year ended
July 31,
2015 | Year ended
July 31,
2014 |
Increase (Decrease) in Net Assets | | |
Operations | | |
Net investment income (loss) | $ 140,160 | $ 138,369 |
Net realized gain (loss) | 743,260 | 863,680 |
Change in net unrealized appreciation (depreciation) | (281,519) | 38,912 |
Net increase (decrease) in net assets resulting from operations | 601,901 | 1,040,961 |
Distributions to shareholders from net investment income | (135,475) | (133,552) |
Distributions to shareholders from net realized gain | - | (1,626) |
Total distributions | (135,475) | (135,178) |
Share transactions - net increase (decrease) | (551,906) | (472,170) |
Total increase (decrease) in net assets | (85,480) | 433,613 |
| | |
Net Assets | | |
Beginning of period | 7,509,675 | 7,076,062 |
End of period (including distributions in excess of net investment income of $722 and undistributed net investment income of $3,054, respectively) | $ 7,424,195 | $ 7,509,675 |
See accompanying notes which are an integral part of the financial statements.
Annual Report
Financial Highlights - Growth & Income
Years ended July 31, | 2015 | 2014 | 2013 | 2012 | 2011 |
Selected Per-Share Data | | | | | |
Net asset value, beginning of period | $ 29.02 | $ 25.66 | $ 20.13 | $ 18.58 | $ 15.75 |
Income from Investment Operations | | | | | |
Net investment income (loss) B | .55 | .51 | .46 | .36 | .20 |
Net realized and unrealized gain (loss) | 1.82 H | 3.35 | 5.54 | 1.55 | 2.82 |
Total from investment operations | 2.37 | 3.86 | 6.00 | 1.91 | 3.02 |
Distributions from net investment income | (.54) | (.50) | (.44) | (.35) | (.19) |
Distributions from net realized gain | - | (.01) | (.03) | (.01) | - |
Total distributions | (.54) | (.50) G | (.47) | (.36) | (.19) |
Net asset value, end of period | $ 30.85 | $ 29.02 | $ 25.66 | $ 20.13 | $ 18.58 |
Total Return A | 8.23% H | 15.16% | 30.15% | 10.45% | 19.16% |
Ratios to Average Net Assets C, E | | | | | |
Expenses before reductions | .64% | .65% | .68% | .71% | .72% |
Expenses net of fee waivers, if any | .63% | .65% | .68% | .71% | .72% |
Expenses net of all reductions | .63% | .65% | .67% | .71% | .71% |
Net investment income (loss) | 1.83% | 1.86% | 2.04% | 1.95% | 1.09% |
Supplemental Data | | | | | |
Net assets, end of period (in millions) | $ 6,563 | $ 6,550 | $ 6,060 | $ 4,863 | $ 5,052 |
Portfolio turnover rate D | 35% | 41% F | 49% | 62% | 129% |
A Total returns would have been lower if certain expenses had not been reduced during the applicable periods shown.
B Calculated based on average shares outstanding during the period.
C Fees and expenses of any underlying Fidelity Central Funds are not included in the Fund's expense ratio. The Fund indirectly bears its proportionate share of the expenses of any underlying Fidelity Central Funds.
D Amount does not include the portfolio activity of any underlying Fidelity Central Funds.
E Expense ratios reflect operating expenses of the class. Expenses before reductions do not reflect amounts reimbursed by the investment adviser or reductions from brokerage service arrangements or reductions from other expense offset arrangements and do not represent the amount paid by the class during periods when reimbursements or reductions occur. Expenses net of fee waivers reflect expenses after reimbursement by the investment adviser but prior to reductions from brokerage service arrangements or other expense offset arrangements. Expenses net of all reductions represent the net expenses paid by the class.
F Portfolio turnover rate excludes securities received or delivered in-kind.
G Total distributions of $.50 per share is comprised of distributions from net investment income of $.495 and distributions from net realized gain of $.006 per share.
H Net realized and unrealized gain (loss) per share reflects proceeds received from litigation which amounted to $.06 per share. Excluding these litigation proceeds, the total return would have been 8.03%.
See accompanying notes which are an integral part of the financial statements.
Annual Report
Financial Highlights - Class K
Years ended July 31, | 2015 | 2014 | 2013 | 2012 | 2011 |
Selected Per-Share Data | | | | | |
Net asset value, beginning of period | $ 29.00 | $ 25.64 | $ 20.12 | $ 18.57 | $ 15.74 |
Income from Investment Operations | | | | | |
Net investment income (loss) B | .59 | .54 | .50 | .40 | .23 |
Net realized and unrealized gain (loss) | 1.81 G | 3.36 | 5.52 | 1.54 | 2.82 |
Total from investment operations | 2.40 | 3.90 | 6.02 | 1.94 | 3.05 |
Distributions from net investment income | (.58) | (.53) | (.47) | (.38) | (.22) |
Distributions from net realized gain | - | (.01) | (.03) | (.01) | - |
Total distributions | (.58) | (.54) | (.50) | (.39) | (.22) |
Net asset value, end of period | $ 30.82 | $ 29.00 | $ 25.64 | $ 20.12 | $ 18.57 |
Total Return A | 8.34% G | 15.32% | 30.28% | 10.66% | 19.40% |
Ratios to Average Net Assets C, E | | | | | |
Expenses before reductions | .52% | .52% | .53% | .54% | .54% |
Expenses net of fee waivers, if any | .52% | .52% | .53% | .54% | .54% |
Expenses net of all reductions | .52% | .52% | .52% | .54% | .53% |
Net investment income (loss) | 1.95% | 1.99% | 2.19% | 2.13% | 1.27% |
Supplemental Data | | | | | |
Net assets, end of period (in millions) | $ 862 | $ 960 | $ 1,016 | $ 752 | $ 403 |
Portfolio turnover rate D | 35% | 41% F | 49% | 62% | 129% |
A Total returns would have been lower if certain expenses had not been reduced during the applicable periods shown.
B Calculated based on average shares outstanding during the period.
C Fees and expenses of any underlying Fidelity Central Funds are not included in the Fund's expense ratio. The Fund indirectly bears its proportionate share of the expenses of any underlying Fidelity Central Funds.
D Amount does not include the portfolio activity of any underlying Fidelity Central Funds.
E Expense ratios reflect operating expenses of the class. Expenses before reductions do not reflect amounts reimbursed by the investment adviser or reductions from brokerage service arrangements or reductions from other expense offset arrangements and do not represent the amount paid by the class during periods when reimbursements or reductions occur. Expenses net of fee waivers reflect expenses after reimbursement by the investment adviser but prior to reductions from brokerage service arrangements or other expense offset arrangements. Expenses net of all reductions represent the net expenses paid by the class.
F Portfolio turnover rate excludes securities received or delivered in-kind.
G Net realized and unrealized gain (loss) per share reflects proceeds received from litigation which amounted to $.06 per share. Excluding these litigation proceeds, the total return would have been 8.14%.
See accompanying notes which are an integral part of the financial statements.
Annual Report
For the period ended July 31, 2015
(Amounts in thousands except percentages)
1. Organization.
Fidelity Growth & Income Portfolio (the Fund) is a fund of Fidelity Securities Fund (the Trust) and is authorized to issue an unlimited number of shares. The Trust is registered under the Investment Company Act of 1940, as amended (the 1940 Act), as an open-end management investment company organized as a Massachusetts business trust. The Fund offers Growth & Income and Class K, each of which has equal rights as to assets and voting privileges. Each class has exclusive voting rights with respect to matters that affect that class.
2. Investments in Fidelity Central Funds.
The Fund invests in Fidelity Central Funds, which are open-end investment companies generally available only to other investment companies and accounts managed by the investment adviser and its affiliates. The Fund's Schedule of Investments lists each of the Fidelity Central Funds held as of period end, if any, as an investment of the Fund, but does not include the underlying holdings of each Fidelity Central Fund. As an Investing Fund, the Fund indirectly bears its proportionate share of the expenses of the underlying Fidelity Central Funds.
The Money Market Central Funds seek preservation of capital and current income and are managed by Fidelity Investments Money Management, Inc. (FIMM), an affiliate of the investment adviser. Annualized expenses of the Money Market Central Funds as of their most recent shareholder report date are less than .01%.
A complete unaudited list of holdings for each Fidelity Central Fund is available upon request or at the Securities and Exchange Commission (the SEC) website at www.sec.gov. In addition, the financial statements of the Fidelity Central Funds, which are not covered by the Fund's Report of Independent Registered Public Accounting Firm, are available on the SEC website or upon request.
3. Significant Accounting Policies.
The financial statements have been prepared in conformity with accounting principles generally accepted in the United States of America (GAAP), which require management to make certain estimates and assumptions at the date of the financial statements. Actual results could differ from those estimates. Subsequent events, if any, through the date that the financial statements were issued have been evaluated in the preparation of the financial statements. The following summarizes the significant accounting policies of the Fund:
Investment Valuation. Investments are valued as of 4:00 p.m. Eastern time on the last calendar day of the period. The Board of Trustees (the Board) has delegated the day to day responsibility for the valuation of the Fund's investments to the Fidelity Management & Research Company (FMR) Fair Value Committee (the Committee). In accordance
Annual Report
3. Significant Accounting Policies - continued
Investment Valuation - continued
with valuation policies and procedures approved by the Board, the Fund attempts to obtain prices from one or more third party pricing vendors or brokers to value its investments. When current market prices, quotations or currency exchange rates are not readily available or reliable, investments will be fair valued in good faith by the Committee, in accordance with procedures adopted by the Board. Factors used in determining fair value vary by investment type and may include market or investment specific events, changes in interest rates and credit quality. The frequency with which these procedures are used cannot be predicted and they may be utilized to a significant extent. The Committee oversees the Fund's valuation policies and procedures and reports to the Board on the Committee's activities and fair value determinations. The Board monitors the appropriateness of the procedures used in valuing the Fund's investments and ratifies the fair value determinations of the Committee.
The Fund categorizes the inputs to valuation techniques used to value its investments into a disclosure hierarchy consisting of three levels as shown below:
Level 1 - quoted prices in active markets for identical investments
Level 2 - other significant observable inputs (including quoted prices for similar investments, interest rates, prepayment speeds, etc.)
Level 3 - unobservable inputs (including the Fund's own assumptions based on the best information available)
Valuation techniques used to value the Fund's investments by major category are as follows:
Equity securities, including restricted securities, for which market quotations are readily available, are valued at the last reported sale price or official closing price as reported by a third party pricing vendor on the primary market or exchange on which they are traded and are categorized as Level 1 in the hierarchy. In the event there were no sales during the day or closing prices are not available, securities are valued at the last quoted bid price or may be valued using the last available price and are generally categorized as Level 2 in the hierarchy. For foreign equity securities, when market or security specific events arise, comparisons to the valuation of American Depositary Receipts (ADRs), futures contracts, Exchange-Traded Funds (ETFs) and certain indexes as well as quoted prices for similar securities may be used and would be categorized as Level 2 in the hierarchy. Utilizing these techniques may result in transfers between Level 1 and Level 2. For equity securities, including restricted securities, where observable inputs are limited, assumptions about market activity and risk are used and these securities may be categorized as Level 3 in the hierarchy.
Annual Report
Notes to Financial Statements - continued
(Amounts in thousands except percentages)
3. Significant Accounting Policies - continued
Investment Valuation - continued
Debt securities, including restricted securities, are valued based on evaluated prices received from third party pricing vendors or from brokers who make markets in such securities. Corporate bonds and preferred securities are valued by pricing vendors who utilize matrix pricing which considers yield or price of bonds of comparable quality, coupon, maturity and type or by broker-supplied prices. When independent prices are unavailable or unreliable, debt securities may be valued utilizing pricing methodologies which consider similar factors that would be used by third party pricing vendors. Debt securities are generally categorized as Level 2 in the hierarchy but may be Level 3 depending on the circumstances.
Investments in open-end mutual funds ,including the Fidelity Central Funds, are valued at their closing net asset value (NAV) each business day and are categorized as Level 1 in the hierarchy.
Changes in valuation techniques may result in transfers in or out of an assigned level within the disclosure hierarchy. The aggregate value of investments by input level as of July 31, 2015, is included at the end of the Fund's Schedule of Investments.
Foreign Currency. The Fund may use foreign currency contracts to facilitate transactions in foreign-denominated securities. Gains and losses from these transactions may arise from changes in the value of the foreign currency or if the counterparties do not perform under the contracts' terms.
Foreign-denominated assets, including investment securities, and liabilities are translated into U.S. dollars at the exchange rates at period end. Purchases and sales of investment securities, income and dividends received and expenses denominated in foreign currencies are translated into U.S. dollars at the exchange rate in effect on the transaction date.
The effects of exchange rate fluctuations on investments are included with the net realized and unrealized gain (loss) on investment securities. Other foreign currency transactions resulting in realized and unrealized gain (loss) are disclosed separately.
Investment Transactions and Income. For financial reporting purposes, the Fund's investment holdings and NAV include trades executed through the end of the last business day of the period. The NAV per share for processing shareholder transactions is calculated as of the close of business of the New York Stock Exchange (NYSE), normally 4:00 p.m. Eastern time and includes trades executed through the end of the prior business day. Gains and losses on securities sold are determined on the basis of identified cost and may include proceeds received from litigation. Dividend income is recorded on the ex-dividend date, except for certain dividends from foreign securities where the
Annual Report
3. Significant Accounting Policies - continued
Investment Transactions and Income - continued
ex-dividend date may have passed, which are recorded as soon as the Fund is informed of the ex-dividend date. Non-cash dividends included in dividend income, if any, are recorded at the fair market value of the securities received. Income and capital gain distributions from Fidelity Central Funds, if any, are recorded on the ex-dividend date. Distributions received on securities that represent a return of capital or capital gain are recorded as a reduction of cost of investments and/or as a realized gain. Subsequent to ex-dividend date the Fund determines the components of these distributions, based upon receipt of tax filings or other correspondence relating to the underlying investment. Interest income is accrued as earned and includes coupon interest and amortization of premium and accretion of discount on debt securities as applicable. Investment income is recorded net of foreign taxes withheld where recovery of such taxes is uncertain.
Class Allocations and Expenses. Investment income, realized and unrealized capital gains and losses, common expenses of the Fund, and certain fund-level expense reductions, if any, are allocated daily on a pro-rata basis to each class based on the relative net assets of each class to the total net assets of the Fund. Each class differs with respect to transfer agent fees incurred. Certain expense reductions may also differ by class. For the reporting period, the allocated portion of income and expenses to each class as a percent of its average net assets may vary due to the timing of recording these transactions in relation to fluctuating net assets of the classes. Expenses directly attributable to a fund are charged to that fund. Expenses attributable to more than one fund are allocated among the respective funds on the basis of relative net assets or other appropriate methods. Expense estimates are accrued in the period to which they relate and adjustments are made when actual amounts are known.
Deferred Trustee Compensation. Under a Deferred Compensation Plan (the Plan), independent Trustees may elect to defer receipt of a portion of their annual compensation. Deferred amounts are invested in a cross-section of Fidelity funds, are marked-to-market and remain in the Fund until distributed in accordance with the Plan. The investment of deferred amounts and the offsetting payable to the Trustees are included in the accompanying Statement of Assets and Liabilities.
Income Tax Information and Distributions to Shareholders. Each year, the Fund intends to qualify as a regulated investment company under Subchapter M of the Internal Revenue Code, including distributing substantially all of its taxable income and realized gains. As a result, no provision for U.S. Federal income taxes is required. As of July 31, 2015, the Fund did not have any unrecognized tax benefits in the financial statements; nor is the Fund aware of any tax positions for which it is reasonably possible that the total amounts of unrecognized tax benefits will significantly change in the next twelve months. The Fund files a U.S. federal tax return, in addition to state and local tax
Annual Report
Notes to Financial Statements - continued
(Amounts in thousands except percentages)
3. Significant Accounting Policies - continued
Income Tax Information and Distributions to Shareholders - continued
returns as required. The Fund's federal income tax returns are subject to examination by the Internal Revenue Service (IRS) for a period of three fiscal years after they are filed. State and local tax returns may be subject to examination for an additional fiscal year depending on the jurisdiction. Foreign taxes are provided for based on the Fund's understanding of the tax rules and rates that exist in the foreign markets in which it invests.
Distributions are declared and recorded on the ex-dividend date. Income dividends and capital gain distributions are declared separately for each class. Income and capital gain distributions are determined in accordance with income tax regulations, which may differ from GAAP.
Capital accounts within the financial statements are adjusted for permanent book-tax differences. These adjustments have no impact on net assets or the results of operations. Capital accounts are not adjusted for temporary book-tax differences which will reverse in a subsequent period.
Book-tax differences are primarily due to foreign currency transactions, market discount, partnerships, deferred trustees compensation, certain conversion ratio adjustments, capital loss carryforwards and losses deferred due to wash sales.
The federal tax cost of investment securities and unrealized appreciation (depreciation) as of period end were as follows:
Gross unrealized appreciation | $ 1,529,111 |
Gross unrealized depreciation | (346,487) |
Net unrealized appreciation (depreciation) on securities | $ 1,182,624 |
| |
Tax Cost | $ 6,278,391 |
The tax-based components of distributable earnings as of period end were as follows:
Undistributed ordinary income | $ 13,948 |
Capital loss carryforward | $ (2,680,247) |
Net unrealized appreciation (depreciation) on securities and other investments | $ 1,182,615 |
Annual Report
3. Significant Accounting Policies - continued
Income Tax Information and Distributions to Shareholders - continued
Capital loss carryforwards are only available to offset future capital gains of the Fund to the extent provided by regulations and may be limited. Under the Regulated Investment Company Modernization Act of 2010 (the Act), the Fund is permitted to carry forward capital losses incurred in taxable years beginning after December 22, 2010 for an unlimited period and such capital losses are required to be used prior to any losses that expire. The capital loss carryforward information presented below, including any applicable limitation, is estimated as of fiscal period end and is subject to adjustment.
Fiscal year of expiration | |
2018 | $ (2,680,247) |
The tax character of distributions paid was as follows:
| July 31, 2015 | July 31,2014 |
Ordinary Income | $ 135,475 | $ 135,178 |
Restricted Securities. The Fund may invest in securities that are subject to legal or contractual restrictions on resale. These securities generally may be resold in transactions exempt from registration or to the public if the securities are registered. Disposal of these securities may involve time-consuming negotiations and expense, and prompt sale at an acceptable price may be difficult. Information regarding restricted securities is included at the end of the Fund's Schedule of Investments.
4. Purchases and Sales of Investments.
Purchases and sales of securities, other than short-term securities, aggregated $2,631,955 and $3,154,898, respectively.
5. Fees and Other Transactions with Affiliates.
Management Fee. Fidelity Management & Research Company (the investment adviser) and its affiliates provide the Fund with investment management related services for which the Fund pays a monthly management fee. The management fee is the sum of an individual fund fee rate that is based on an annual rate of .20% of the Fund's average net assets and an annualized group fee rate that averaged .25% during the period. The group fee rate is based upon the average net assets of all the mutual funds advised by the investment adviser, including any mutual funds previously advised by the investment adviser that are currently advised by Fidelity SelectCo, LLC, an affiliate of the investment adviser. The group fee rate decreases as assets under management increase and increases as assets under management decrease. For the reporting period, the total annual management fee rate was .45% of the Fund's average net assets.
Annual Report
Notes to Financial Statements - continued
(Amounts in thousands except percentages)
5. Fees and Other Transactions with Affiliates - continued
Transfer Agent Fees. Fidelity Investments Institutional Operations Company, Inc., (FIIOC), an affiliate of the investment adviser, is the transfer, dividend disbursing and shareholder servicing agent for each class of the Fund. FIIOC receives account fees and asset-based fees that vary according to the account size and type of account of the shareholders of Growth & Income. FIIOC receives an asset-based fee of Class K's average net assets. FIIOC pays for typesetting, printing and mailing of shareholder reports, except proxy statements.
For the period, transfer agent fees for each class were as follows:
| Amount | % of
Class-Level Average
Net Assets |
Growth and Income | $ 10,952 | .16 |
Class K | 449 | .05 |
| $ 11,401 | |
Accounting and Security Lending Fees. Fidelity Service Company, Inc. (FSC), an affiliate of the investment adviser, maintains the Fund's accounting records. The accounting fee is based on the level of average net assets for each month. Under a separate contract, FSC administers the security lending program. The security lending fee is based on the number and duration of lending transactions.
Brokerage Commissions. The Fund placed a portion of its portfolio transactions with brokerage firms which are affiliates of the investment adviser. Brokerage commissions are included in net realized gain (loss) and change in net unrealized appreciation (depreciation) in the Statement of Operations. The commissions paid to these affiliated firms were $47 for the period.
Interfund Lending Program. Pursuant to an Exemptive Order issued by the SEC, the Fund, along with other registered investment companies having management contracts with FMR or other affiliated entities of FMR, may participate in an interfund lending program. This program provides an alternative credit facility allowing the funds to borrow from, or lend money to, other participating affiliated funds. Any open loans, including accrued interest, at period end are presented under the caption "Notes payable to affiliates" in the Fund's Statement of Assets and Liabilities. The Fund's activity in this program during the period for which loans were outstanding was as follows:
Borrower or Lender | Average Loan
Balance | Weighted Average Interest Rate | Interest Expense |
Borrower | $ 7,770 | .34% | $ 5 |
Annual Report
6. Committed Line of Credit.
The Fund participates with other funds managed by the investment adviser or an affiliate in a $4.25 billion credit facility (the "line of credit") to be utilized for temporary or emergency purposes to fund shareholder redemptions or for other short-term liquidity purposes. The Fund has agreed to pay commitment fees on its pro-rata portion of the line of credit, which amounted to $11 and is reflected in Miscellaneous expenses on the Statement of Operations. During the period, the Fund did not borrow on this line of credit.
7. Security Lending.
The Fund lends portfolio securities through a lending agent from time to time in order to earn additional income. For equity securities, a lending agent is used and may loan securities to certain qualified borrowers, including Fidelity Capital Markets (FCM), a broker-dealer affiliated with the Fund. On the settlement date of the loan, the Fund receives collateral (in the form of U.S. Treasury obligations, letters of credit and/or cash) against the loaned securities and maintains collateral in an amount not less than 100% of the market value of the loaned securities during the period of the loan. The market value of the loaned securities is determined at the close of business of the Fund and any additional required collateral is delivered to the Fund on the next business day. If the borrower defaults on its obligation to return the securities loaned because of insolvency or other reasons, the Fund may apply collateral received from the borrower against the obligation. The Fund may experience delays and costs in recovering the securities loaned. Any cash collateral received is invested in the Fidelity Securities Lending Cash Central Fund. The value of loaned securities and cash collateral at period end are disclosed on the Fund's Statement of Assets and Liabilities. At period end, there were no security loans outstanding with FCM. Security lending income represents the income earned on investing cash collateral, less rebates paid to borrowers and any lending agent fees associated with the loan, plus any premium payments received for lending certain types of securities. Security lending income is presented in the Statement of Operations as a component of income from Fidelity Central Funds. Total security lending income during the period amounted to $735, including $4 from securities loaned to FCM.
Annual Report
Notes to Financial Statements - continued
(Amounts in thousands except percentages)
8. Bank Borrowings.
The Fund is permitted to have bank borrowings for temporary or emergency purposes to fund shareholder redemptions or for other short-term liquidity requirements. The Fund has established borrowing arrangements with certain banks. The interest rate on the borrowings is the bank's base rate, as revised from time to time. The average loan balance during the period for which loans were outstanding amounted to $3,862. The weighted average interest rate was .62%. The interest expense amounted to four hundred sixty four dollars under the bank borrowing program. At period end, there were no bank borrowings outstanding.
9. Expense Reductions.
Commissions paid to certain brokers with whom the investment adviser, or its affiliates, places trades on behalf of the Fund include an amount in addition to trade execution, which may be rebated back to the Fund to offset certain expenses. This amount totaled $91 for the period.
In addition, during the period the investment adviser reimbursed/waived a portion of fund-level operating expenses in the amount of $30, and a portion of class-level operating expenses as follows:
| Amount |
Growth and Income | $ 147 |
10. Distributions to Shareholders.
Distributions to shareholders of each class were as follows:
Years ended July 31, | 2015 | 2014 |
From net investment income | | |
Growth and Income | $ 117,218 | $ 113,973 |
Class K | 18,257 | 19,579 |
Total | $ 135,475 | $ 133,552 |
From net realized gain | | |
Growth and Income | $ - | $ 1,391 |
Class K | - | 235 |
Total | $ - | $ 1,626 |
Annual Report
11. Share Transactions.
Share transactions for each class were as follows and may contain automatic conversions between classes or exchanges between funds:
| Shares | Dollars |
Years ended July 31, | 2015 | 2014 | 2015 | 2014 |
Growth and Income | | | | |
Shares sold | 12,118 | 21,786 | $ 365,420 | $ 598,816 |
Reinvestment of distributions | 3,750 | 3,998 | 111,890 | 110,063 |
Shares redeemed | (28,824) | (36,289) A | (872,624) | (997,570) A |
Net increase (decrease) | (12,956) | (10,505) | $ (395,314) | $ (288,691) |
Class K | | | | |
Shares sold | 4,866 | 7,113 | $ 146,512 | $ 195,462 |
Reinvestment of distributions | 612 | 722 | 18,257 | 19,814 |
Shares redeemed | (10,609) | (14,384) | (321,361) | (398,755) |
Net increase (decrease) | (5,131) | (6,549) | $ (156,592) | $ (183,479) |
A Amount includes in-kind redemptions.
12. Other.
The Fund's organizational documents provide former and current trustees and officers with a limited indemnification against liabilities arising in connection with the performance of their duties to the Fund. In the normal course of business, the Fund may also enter into contracts that provide general indemnifications. The Fund's maximum exposure under these arrangements is unknown as this would be dependent on future claims that may be made against the Fund. The risk of material loss from such claims is considered remote.
Annual Report
To the Trustees of Fidelity Securities Fund and the Shareholders of Fidelity Growth & Income Portfolio:
In our opinion, the accompanying statement of assets and liabilities, including the schedule of investments, and the related statements of operations and of changes in net assets and the financial highlights present fairly, in all material respects, the financial position of Fidelity Growth & Income Portfolio (a fund of Fidelity Securities Fund) at July 31, 2015, the results of its operations for the year then ended, the changes in its net assets for each of the two years in the period then ended and the financial highlights for each of the five years in the period then ended, in conformity with accounting principles generally accepted in the United States of America. These financial statements and financial highlights (hereafter referred to as "financial statements") are the responsibility of the Fidelity Growth & Income Portfolio's management. Our responsibility is to express an opinion on these financial statements based on our audits. We conducted our audits of these financial statements in accordance with the standards of the Public Company Accounting Oversight Board (United States). Those standards require that we plan and perform the audit to obtain reasonable assurance about whether the financial statements are free of material misstatement. An audit includes examining, on a test basis, evidence supporting the amounts and disclosures in the financial statements, assessing the accounting principles used and significant estimates made by management, and evaluating the overall financial statement presentation. We believe that our audits, which included confirmation of securities at July 31, 2015 by correspondence with the custodian and brokers, provide a reasonable basis for our opinion.
PricewaterhouseCoopers LLP
Boston, Massachusetts
September 16, 2015
Annual Report
The Trustees, Member of the Advisory Board, and officers of the trust and fund, as applicable, are listed below. The Board of Trustees governs the fund and is responsible for protecting the interests of shareholders. The Trustees are experienced executives who meet periodically throughout the year to oversee the fund's activities, review contractual arrangements with companies that provide services to the fund, oversee management of the risks associated with such activities and contractual arrangements, and review the fund's performance. Each of the Trustees oversees 170 funds.
The Trustees hold office without limit in time except that (a) any Trustee may resign; (b) any Trustee may be removed by written instrument, signed by at least two-thirds of the number of Trustees prior to such removal; (c) any Trustee who requests to be retired or who has become incapacitated by illness or injury may be retired by written instrument signed by a majority of the other Trustees; and (d) any Trustee may be removed at any special meeting of shareholders by a two-thirds vote of the outstanding voting securities of the trust. Each Trustee who is not an interested person (as defined in the 1940 Act) of the trust and the fund (Independent Trustee), shall retire not later than the last day of the calendar year in which his or her 75th birthday occurs. The Independent Trustees may waive this mandatory retirement age policy with respect to individual Trustees. The officers and Advisory Board Member hold office without limit in time, except that any officer and Advisory Board Member may resign or may be removed by a vote of a majority of the Trustees at any regular meeting or any special meeting of the Trustees. Except as indicated, each individual has held the office shown or other offices in the same company for the past five years.
Experience, Skills, Attributes, and Qualifications of the Fund's Trustees. The Governance and Nominating Committee has adopted a statement of policy that describes the experience, qualifications, attributes, and skills that are necessary and desirable for potential Independent Trustee candidates (Statement of Policy). The Board believes that each Trustee satisfied at the time he or she was initially elected or appointed a Trustee, and continues to satisfy, the standards contemplated by the Statement of Policy. The Governance and Nominating Committee also engages professional search firms to help identify potential Independent Trustee candidates who have the experience, qualifications, attributes, and skills consistent with the Statement of Policy. From time to time, additional criteria based on the composition and skills of the current Independent Trustees, as well as experience or skills that may be appropriate in light of future changes to board composition, business conditions, and regulatory or other developments, have also been considered by the professional search firms and the Governance and Nominating Committee. In addition, the Board takes into account the Trustees' commitment and participation in Board and committee meetings, as well as their leadership of standing and ad hoc committees throughout their tenure.
In determining that a particular Trustee was and continues to be qualified to serve as a Trustee, the Board has considered a variety of criteria, none of which, in isolation, was controlling. The Board believes that, collectively, the Trustees have balanced and diverse experience, qualifications, attributes, and skills, which allow the Board to operate effectively in governing the fund and protecting the interests of shareholders. Information about the specific experience, skills, attributes, and qualifications of each Trustee, which in each case led to the Board's conclusion that the Trustee should serve (or continue to serve) as a trustee of the fund, is provided below.
Annual Report
Board Structure and Oversight Function. James C. Curvey is an interested person (as defined in the 1940 Act) and currently serves as Chairman. The Trustees have determined that an interested Chairman is appropriate and benefits shareholders because an interested Chairman has a personal and professional stake in the quality and continuity of services provided to the fund. Independent Trustees exercise their informed business judgment to appoint an individual of their choosing to serve as Chairman, regardless of whether the Trustee happens to be independent or a member of management. The Independent Trustees have determined that they can act independently and effectively without having an Independent Trustee serve as Chairman and that a key structural component for assuring that they are in a position to do so is for the Independent Trustees to constitute a substantial majority for the Board. The Independent Trustees also regularly meet in executive session. Ned C. Lautenbach serves as Chairman of the Independent Trustees and as such (i) acts as a liaison between the Independent Trustees and management with respect to matters important to the Independent Trustees and (ii) with management prepares agendas for Board meetings.
Fidelity funds are overseen by different Boards of Trustees. The fund's Board oversees Fidelity's high income and certain equity funds and other Boards oversee Fidelity's investment-grade bond, money market, asset allocation, and sector funds. The asset allocation funds may invest in Fidelity funds overseen by the fund's Board. The use of separate Boards, each with its own committee structure, allows the Trustees of each group of Fidelity funds to focus on the unique issues of the funds they oversee, including common research, investment, and operational issues. On occasion, the separate Boards establish joint committees to address issues of overlapping consequences for the Fidelity funds overseen by each Board.
The Trustees operate using a system of committees to facilitate the timely and efficient consideration of all matters of importance to the Trustees, the fund, and fund shareholders and to facilitate compliance with legal and regulatory requirements and oversight of the fund's activities and associated risks. The Board, acting through its committees, has charged FMR and its affiliates with (i) identifying events or circumstances the occurrence of which could have demonstrably adverse effects on the fund's business and/or reputation; (ii) implementing processes and controls to lessen the possibility that such events or circumstances occur or to mitigate the effects of such events or circumstances if they do occur; and (iii) creating and maintaining a system designed to evaluate continuously business and market conditions in order to facilitate the identification and implementation processes described in (i) and (ii) above. Because the day-to-day operations and activities of the fund are carried out by or through FMR, its affiliates and other service providers, the fund's exposure to risks is mitigated but not eliminated by the processes overseen by the Trustees. While each of the Board's committees has responsibility for overseeing different aspects of the fund's activities, oversight is exercised primarily through the Operations, Audit, and Compliance Committees. In addition, the Independent Trustees have worked with FMR to enhance the Board's oversight of investment and financial risks, legal and regulatory risks, technology risks, and operational risks, including the development of additional risk reporting to the Board. For example, a working group comprised of Independent Trustees and FMR has worked and continues to work to review the Fidelity funds' valuation-related activities, reporting and risk management. Appropriate personnel, including but not limited to the fund's Chief Compliance Officer (CCO), FMR's internal auditor, the independent accountants, the fund's Treasurer and portfolio management personnel, make periodic reports to the Board's committees, as appropriate, including an annual review of FMR's risk management program for the Fidelity funds. The responsibilities of each standing committee, including their oversight responsibilities, are described further under "Standing Committees of the Fund's Trustees."
Annual Report
Trustees and Officers - continued
The fund's Statement of Additional Information (SAI) includes more information about the Trustees. To request a free copy, call Fidelity at 1-800-835-5092.
Interested Trustees*:
Correspondence intended for each Trustee who is an interested person may be sent to Fidelity Investments, 245 Summer Street, Boston, Massachusetts 02210.
Name, Year of Birth; Principal Occupations and Other Relevant Experience+ |
James C. Curvey (1935) |
Year of Election or Appointment: 2007 Trustee Chairman of the Board of Trustees |
| Mr. Curvey also serves as Trustee of other Fidelity funds. Mr. Curvey is a Director of Fidelity Research & Analysis Co. (investment adviser firm, 2009-present), and Vice Chairman (2007-present) and Director of FMR LLC (diversified financial services company). In addition, Mr. Curvey serves as an Overseer for the Boston Symphony Orchestra and a member of the board of Artis-Naples, Naples, Florida, and as a Trustee for Brewster Academy, Wolfeboro, New Hampshire. Previously, Mr. Curvey served as a Director of Fidelity Investments Money Management, Inc. (investment adviser firm, 2009-2014), a Director of FMR (investment adviser firm, 2007-2014), and a Director of FMR Co., Inc. (investment adviser firm, 2007-2014). |
Charles S. Morrison (1960) |
Year of Election or Appointment: 2014 Trustee |
| Mr. Morrison also serves as Trustee of other funds. He serves as a Director of Fidelity Investments Money Management, Inc. (FIMM) (investment adviser firm, 2014-present), Director of Fidelity SelectCo, LLC (investment adviser firm, 2014-present), President, Asset Management (2014-present), and is an employee of Fidelity Investments. Previously, Mr. Morrison served as Vice President of Fidelity's Fixed Income and Asset Allocation Funds (2012-2014), President, Fixed Income (2011-2014), Vice President of Fidelity's Money Market Funds (2005-2009), President, Money Market Group Leader of FMR (investment adviser firm, 2009), and Senior Vice President, Money Market Group of FMR (2004-2009). Mr. Morrison also served as Vice President of Fidelity's Bond Funds (2002-2005), certain Balanced Funds (2002-2005), and certain Asset Allocation Funds (2002-2007), and as Senior Vice President (2002-2005) of Fidelity's Bond Division. |
* Trustees have been determined to be "Interested Trustees" by virtue of, among other things, their affiliation with the trust or various entities under common control with FMR.
+ The information above includes each Trustee's principal occupation during the last five years and other information relating to the experience, attributes, and skills relevant to each Trustee's qualifications to serve as a Trustee, which led to the conclusion that each Trustee should serve as a Trustee for the fund.
Annual Report
Trustees and Officers - continued
Independent Trustees:
Correspondence intended for each Independent Trustee (that is, the Trustees other than the Interested Trustees) may be sent to Fidelity Investments, P.O. Box 55235, Boston, Massachusetts 02205-5235.
Name, Year of Birth; Principal Occupations and Other Relevant Experience+ |
Dennis J. Dirks (1948) |
Year of Election or Appointment: 2005 Trustee |
| Mr. Dirks also serves as Trustee of other Fidelity funds. Prior to his retirement in May 2003, Mr. Dirks was Chief Operating Officer and a member of the Board of The Depository Trust & Clearing Corporation (DTCC). He also served as President, Chief Operating Officer, and Board member of The Depository Trust Company (DTC) and President and Board member of the National Securities Clearing Corporation (NSCC). In addition, Mr. Dirks served as Chief Executive Officer and Board member of the Government Securities Clearing Corporation, Chief Executive Officer and Board member of the Mortgage-Backed Securities Clearing Corporation, as a Trustee and a member of the Finance Committee of Manhattan College (2005-2008), and as a Trustee and a member of the Finance Committee of AHRC of Nassau County (2006-2008). Mr. Dirks is a member of the Independent Directors Council (IDC) Governing Council (2010-present) and Board of Directors for The Brookville Center for Children's Services, Inc. (2009-present). |
Alan J. Lacy (1953) |
Year of Election or Appointment: 2008 Trustee |
| Mr. Lacy also serves as Trustee of other Fidelity funds. Mr. Lacy serves as a member of the Board of Directors of Dave & Buster's Entertainment, Inc. (restaurant and entertainment complexes, 2010-present) and Bristol-Myers Squibb Company (global pharmaceuticals, 2008-present). In addition, Mr. Lacy served as Senior Adviser (2007-2014) of Oak Hill Capital Partners, L.P. (private equity) and also served as Chief Executive Officer (2000-2005) and Vice Chairman (2005-2006) of Sears Holdings Corporation and Sears, Roebuck and Co. (retail). Mr. Lacy is a member of the Board of Trustees of The National Parks Conservation Association (2006-present). Previously, Mr. Lacy served as Chairman of the Board of Trustees of the National Parks Conservation Association (2008-2011) and as a member of the Board of Directors for The Western Union Company (global money transfer, 2006-2011), The Hillman Companies, Inc. (hardware wholesalers, 2010-2014), and Earth Fare, Inc. (retail grocery, 2010-2014). |
Ned C. Lautenbach (1944) |
Year of Election or Appointment: 2000 Trustee Chairman of the Independent Trustees |
| Mr. Lautenbach also serves as Trustee of other Fidelity funds. Mr. Lautenbach currently serves as the Lead Director of the Eaton Corporation Board of Directors (diversified industrial, 1997-present). Mr. Lautenbach is Chairman of the Board of Directors of Artis-Naples in Naples, Florida (2012-present), a member of the Council on Foreign Relations (1994-present), and a member of the Board of Governors, State University System of Florida (2013-present). Previously, Mr. Lautenbach was a Partner/Advisory Partner at Clayton, Dubilier & Rice, LLC (private equity investment, 1998-2010), as well as a Director of Sony Corporation (2006-2007). |
Joseph Mauriello (1944) |
Year of Election or Appointment: 2008 Trustee |
| Mr. Mauriello also serves as Trustee of other Fidelity funds. Prior to his retirement in January 2006, Mr. Mauriello served in numerous senior management positions including Deputy Chairman and Chief Operating Officer (2004-2005), and Vice Chairman of Financial Services (2002-2004) of KPMG LLP US (professional services, 1965-2005). Mr. Mauriello currently serves as a member of the Board of Directors of XL Group plc. (global insurance and re-insurance, 2006-present). Previously, Mr. Mauriello served as a Director of the Hamilton Funds of the Bank of New York (2006-2007) and of Arcadia Resources Inc. (health care services and products, 2007-2012). |
Robert W. Selander (1950) |
Year of Election or Appointment: 2011 Trustee |
| Mr. Selander also serves as Trustee of other Fidelity funds. Mr. Selander serves as a Director of The Western Union Company (global money transfer, 2014-present). Previously, Mr. Selander served as a Member of the Advisory Board of other Fidelity funds (2011), and Executive Vice Chairman (2010), Chief Executive Officer (2009-2010), and President and Chief Executive Officer (1997-2009) of Mastercard, Inc. |
Cornelia M. Small (1944) |
Year of Election or Appointment: 2005 Trustee |
| Ms. Small also serves as Trustee of other Fidelity funds. Ms. Small is a member of the Board of Directors (2009-present) and Chair of the Investment Committee (2010-present) of the Teagle Foundation. Ms. Small also serves on the Investment Committee of the Berkshire Taconic Community Foundation (2008-present). Previously, Ms. Small served as Chairperson (2002-2008) and a member of the Investment Committee and Chairperson (2008-2012) and a member of the Board of Trustees of Smith College. In addition, Ms. Small served as Chief Investment Officer, Director of Global Equity Investments, and a member of the Board of Directors of Scudder, Stevens & Clark and Scudder Kemper Investments. |
William S. Stavropoulos (1939) |
Year of Election or Appointment: 2002 Trustee Vice Chairman of the Independent Trustees |
| Mr. Stavropoulos also serves as Trustee of other Fidelity funds. Mr. Stavropoulos serves as President and Founder of the Michigan Baseball Foundation, the Great Lakes Loons (2007-present). Mr. Stavropoulos is Chairman Emeritus of the Board of Directors of The Dow Chemical Company, where he previously served in numerous senior management positions, including President, CEO (1995-2000; 2002-2004), Chairman of the Executive Committee (2000-2006), and as a member of the Board of Directors (1990-2006). Currently, Mr. Stavropoulos is Chairman of the Board of Directors of Univar Inc. (global distributor of commodity and specialty chemicals), a Director of Teradata Corporation (data warehousing and technology solutions), and Maersk Inc. (industrial conglomerate), and a member of the Advisory Board for Metalmark Capital LLC (private equity investment, 2005-present). Mr. Stavropoulos is an operating advisor to Clayton, Dubilier & Rice, LLC (private equity investment). In addition, Mr. Stavropoulos is a member of the University of Notre Dame Advisory Council for the College of Science, a Trustee of the Rollin L. Gerstacker Foundation, and a Director of the Naples Philharmonic Center for the Arts. Previously, Mr. Stavropoulos served as a Director of Chemical Financial Corporation (bank holding company, 1993-2012) and Tyco International, Ltd. (multinational manufacturing and services, 2007-2012). |
David M. Thomas (1949) |
Year of Election or Appointment: 2008 Trustee |
| Mr. Thomas also serves as Trustee of other Fidelity funds. Mr. Thomas serves as Non-Executive Chairman of the Board of Directors of Fortune Brands Home and Security (home and security products, 2011-present), as a member of the Board of Directors (2004-present) and Presiding Director (2013-present) of Interpublic Group of Companies, Inc. (marketing communication), and as a member of the Board of Trustees of the University of Florida (2013-present). Previously, Mr. Thomas served as Executive Chairman (2005-2006) and Chairman and Chief Executive Officer (2000-2005) of IMS Health, Inc. (pharmaceutical and healthcare information solutions), and a Director of Fortune Brands, Inc. (consumer products, 2000-2011). |
+ The information above includes each Trustee's principal occupation during the last five years and other information relating to the experience, attributes, and skills relevant to each Trustee's qualifications to serve as a Trustee, which led to the conclusion that each Trustee should serve as a Trustee for the fund.
Advisory Board Member and Officers:
Correspondence intended for each officer and Peter S. Lynch may be sent to Fidelity Investments, 245 Summer Street, Boston, Massachusetts 02210. Officers appear below in alphabetical order.
Name, Year of Birth; Principal Occupation |
Peter S. Lynch (1944) |
Year of Election or Appointment: 2003 Member of the Advisory Board |
| Mr. Lynch also serves as Member of the Advisory Board of other Fidelity funds. Mr. Lynch is Vice Chairman and a Director of FMR (investment adviser firm) and FMR Co., Inc. (investment adviser firm). In addition, Mr. Lynch serves as a Trustee of Boston College and as the Chairman of the Inner-City Scholarship Fund. Previously, Mr. Lynch served on the Special Olympics International Board of Directors (1997-2006). |
Elizabeth Paige Baumann (1968) |
Year of Election or Appointment: 2012 Anti-Money Laundering (AML) Officer |
| Ms. Baumann also serves as AML Officer of other funds. She is Chief AML Officer of FMR LLC (diversified financial services company, 2012-present) and is an employee of Fidelity Investments. Previously, Ms. Baumann served as Vice President and Deputy Anti-Money Laundering Officer (2007-2012). |
Marc Bryant (1966) |
Year of Election or Appointment: 2015 Secretary and Chief Legal Officer (CLO) |
| Mr. Bryant also serves as Secretary and Chief Legal Officer (CLO) of other funds. He is Senior Vice President and Deputy General Counsel of FMR LLC (diversified financial services company). Previously, Mr. Bryant served as Secretary and Chief Legal Officer of Fidelity Rutland Square Trust II (2010-2014) and Assistant Secretary of Fidelity's Fixed Income and Asset Allocation Funds (2013-2015). Prior to joining Fidelity Investments, Mr. Bryant served as a Senior Vice President and the Head of Global Retail Legal for AllianceBernstein L.P. (2006-2010), and as the General Counsel for ProFund Advisors LLC (2001-2006). |
William C. Coffey (1969) |
Year of Election or Appointment: 2009 Assistant Secretary |
| Mr. Coffey also serves as Assistant Secretary of other funds. He is Senior Vice President and Deputy General Counsel of FMR LLC (diversified financial services company, 2010-present), and is an employee of Fidelity Investments. Previously, Mr. Coffey served as Vice President and Associate General Counsel of FMR LLC (2005-2009). |
Jonathan Davis (1968) |
Year of Election or Appointment: 2010 Assistant Treasurer |
| Mr. Davis also serves as Assistant Treasurer of other funds. Mr. Davis is an employee of Fidelity Investments. Previously, Mr. Davis served as Vice President and Associate General Counsel of FMR LLC (diversified financial services company, 2003-2010). |
Adrien E. Deberghes (1967) |
Year of Election or Appointment: 2008 Deputy Treasurer |
| Mr. Deberghes also serves as an officer of other funds. He is an employee of Fidelity Investments (2008-present). Prior to joining Fidelity Investments, Mr. Deberghes was Senior Vice President of Mutual Fund Administration at State Street Corporation (2007-2008), Senior Director of Mutual Fund Administration at Investors Bank & Trust (2005-2007), and Director of Finance for Dunkin' Brands (2000-2005). |
Stephanie J. Dorsey (1969) |
Year of Election or Appointment: 2010 Assistant Treasurer |
| Ms. Dorsey also serves as an officer of other funds. She is an employee of Fidelity Investments (2008-present) and has served in other fund officer roles. Prior to joining Fidelity Investments, Ms. Dorsey served as Treasurer (2004-2008) of the JPMorgan Mutual Funds and Vice President (2004-2008) of JPMorgan Chase Bank. |
Howard J. Galligan III (1966) |
Year of Election or Appointment: 2014 Chief Financial Officer |
| Mr. Galligan also serves as Chief Financial Officer of other funds. Mr. Galligan serves as President of Fidelity Pricing and Cash Management Services (FPCMS) (2014-present) and as a Director of Strategic Advisers, Inc. (investment adviser firm, 2008-present). Previously, Mr. Galligan served as Chief Administrative Officer of Asset Management (2011-2014) and Chief Operating Officer and Senior Vice President of Investment Support for Strategic Advisers, Inc. (2003-2011). |
Scott C. Goebel (1968) |
Year of Election or Appointment: 2015 Vice President |
| Mr. Goebel serves as an officer of other funds. Mr. Goebel also serves as Secretary of Fidelity SelectCo, LLC (investment adviser firm, 2013-present), Fidelity Investments Money Management, Inc. (FIMM) (investment adviser firm, 2010-present) and Fidelity Research and Analysis Company (FRAC) (investment adviser firm, 2010-present); General Counsel, Secretary, and Senior Vice President of FMR (investment adviser firm, 2008-present) and FMR Co., Inc. (investment adviser firm, 2008-present); Chief Legal Officer of Fidelity Management & Research (Hong Kong) Limited (investment adviser firm, 2008-present); and Assistant Secretary of Fidelity Management & Research (Japan) Limited (investment adviser firm, 2008-present) and FMR Investment Management (U.K.) Limited (investment adviser firm, 2008-present). Previously, Mr. Goebel served as Secretary and CLO of certain Fidelity funds (2008-2015), Assistant Secretary of FIMM (2008-2010), FRAC (2008-2010), and certain funds (2007-2008); and as Vice President and Secretary of Fidelity Distributors Corporation (FDC) (2005-2007). Mr. Goebel has been employed by FMR LLC (diversified financial services company) or an affiliate since 2001. |
Brian B. Hogan (1964) |
Year of Election or Appointment: 2009 Vice President |
| Mr. Hogan also serves as Trustee or Vice President of other funds. Mr. Hogan serves as a Director of Fidelity SelectCo, LLC (investment adviser firm, 2014-present) and President of the Equity Division of FMR (investment adviser firm, 2009-present). Previously, Mr. Hogan served as Senior Vice President, Equity Research of FMR (2006-2009) and as a portfolio manager. |
Chris Maher (1972) |
Year of Election or Appointment: 2013 Assistant Treasurer |
| Mr. Maher serves as Assistant Treasurer of other funds. Mr. Maher is Vice President of Valuation Oversight and is an employee of Fidelity Investments. Previously, Mr. Maher served as Vice President of Asset Management Compliance (2013), Vice President of the Program Management Group of FMR (investment adviser firm, 2010-2013), and Vice President of Valuation Oversight (2008-2010). |
Melissa M. Reilly (1971) |
Year of Election or Appointment: 2014 Vice President of certain Equity Funds |
| Ms. Reilly also serves as Vice President of other funds. Ms. Reilly is an employee of Fidelity Investments (2004-present). |
Kenneth B. Robins (1969) |
Year of Election or Appointment: 2008 President and Treasurer |
| Mr. Robins also serves as an officer of other funds. Mr. Robins serves as Executive Vice President of Fidelity Investments Money Management, Inc. (FIMM) (investment adviser firm, 2013-present) and is an employee of Fidelity Investments (2004-present). Previously, Mr. Robins served in other fund officer roles. |
Stephen Sadoski (1971) |
Year of Election or Appointment: 2012 Deputy Treasurer |
| Mr. Sadoski also serves as Deputy Treasurer of other funds. He is an employee of Fidelity Investments (2012-present) and has served in another fund officer role. Prior to joining Fidelity Investments, Mr. Sadoski served as an assistant chief accountant in the Division of Investment Management of the Securities and Exchange Commission (SEC) (2009-2012) and as a senior manager at Deloitte & Touche LLP (1997-2009). |
Stacie M. Smith (1974) |
Year of Election or Appointment: 2013 Deputy Treasurer |
| Ms. Smith also serves as an officer of other funds. She is an employee of Fidelity Investments (2009-present) and has served in other fund officer roles. Prior to joining Fidelity Investments, Ms. Smith served as Senior Audit Manager of Ernst & Young LLP (1996-2009). |
Renee Stagnone (1975) |
Year of Election or Appointment: 2013 Deputy Treasurer |
| Ms. Stagnone also serves as Deputy Treasurer of other funds. Ms. Stagnone is an employee of Fidelity Investments. |
Linda J. Wondrack (1964) |
Year of Election or Appointment: 2014 Chief Compliance Officer |
| Ms. Wondrack also serves as Chief Compliance Officer of other funds. Ms. Wondrack is Executive Vice President and head of the Ethics Office and Asset Management Compliance for Fidelity Investments (2012-present). Ms. Wondrack also serves as Chief Compliance Officer of Fidelity SelectCo, LLC (investment adviser firm, 2014-present); Chief Compliance Officer of Impresa Management LLC (2013-present); and Chief Compliance Officer of FMR Co., Inc. (investment adviser firm), Fidelity Investments Money Management, Inc. (investment adviser firm), Fidelity Management & Research (Japan) Limited (investment adviser firm), FMR Investment Management (U.K.) Limited (investment adviser firm), Fidelity Management & Research (Hong Kong) (investment adviser firm), Fidelity Management & Research Company (investment adviser firm), Pyramis Global Advisors, LLC (investment adviser firm), and Strategic Advisers, Inc. (investment adviser firm), Ballyrock Investment Advisors LLC, and Northern Neck Investors LLC (2012-present). Previously, Ms. Wondrack served as Senior Vice President and Chief Compliance Officer for Columbia Management Investment Advisers, LLC (2005-2012); Chief Compliance Officer for certain funds within the Columbia Family of Funds (2007-2012); and Senior Vice President of Compliance Risk Management at Bank of America (2005-2010). |
Joseph F. Zambello (1957) |
Year of Election or Appointment: 2011 Deputy Treasurer |
| Mr. Zambello also serves as Deputy Treasurer of other funds. Mr. Zambello is an employee of Fidelity Investments. Previously, Mr. Zambello served as Vice President of the Program Management Group of FMR (investment adviser firm, 2009-2011) and Vice President of the Transfer Agent Oversight Group (2005-2009). |
Annual Report
Class K designates 100% during the fiscal year as qualifying for the dividends-received deduction for corporate shareholders.
Class K designates 100% of the dividends distributed during the fiscal year as amounts which may be taken into account as a dividend for the purposes of the maximum rate under section 1(h)(11) of the Internal Revenue Code.
The fund will notify shareholders in January 2016 of amounts for use in preparing 2015 income tax returns.
Annual Report
Fidelity Growth & Income Portfolio
Each year, the Board of Trustees, including the Independent Trustees (together, the Board), votes on the renewal of the management contract with Fidelity Management & Research Company (FMR) and the sub-advisory agreements (together, the Advisory Contracts) for the fund. The Board, assisted by the advice of fund counsel and Independent Trustees' counsel, requests and considers a broad range of information relevant to the renewal of the Advisory Contracts throughout the year.
The Board meets regularly and, at each of its meetings, covers an extensive agenda of topics and materials and considers factors that are relevant to its annual consideration of the renewal of the fund's Advisory Contracts, including the services and support provided to the fund and its shareholders. The Board has established various standing committees (Committees), each composed of and chaired by Independent Trustees with varying backgrounds, to which the Board has assigned specific subject matter responsibilities in order to enhance effective decision-making by the Board. The Board, acting directly and through its Committees, requests and receives information concerning the annual consideration of the renewal of the fund's Advisory Contracts. The Board also meets as needed to consider matters specifically related to the Board's annual consideration of the renewal of the Advisory Contracts. Members of the Board may also meet with trustees of other Fidelity funds through ad hoc joint committees to discuss certain matters relevant to all of the Fidelity funds.
At its July 2015 meeting, the Board unanimously determined to renew the fund's Advisory Contracts. In reaching its determination, the Board considered all factors it believed relevant, including (i) the nature, extent, and quality of the services to be provided to the fund and its shareholders (including the investment performance of the fund); (ii) the competitiveness of the fund's management fee and total expense ratio relative to peer funds; (iii) the total costs of the services to be provided by and the profits to be realized by Fidelity from its relationship with the fund; and (iv) the extent to which (if any) economies of scale exist and would be realized as the fund grows, and whether any economies of scale are appropriately shared with fund shareholders.
In considering whether to renew the Advisory Contracts for the fund, the Board reached a determination, with the assistance of fund counsel and Independent Trustees' counsel and through the exercise of its business judgment, that the renewal of the Advisory Contracts was in the best interests of the fund and its shareholders and that the compensation payable under the Advisory Contracts was fair and reasonable. The Board's decision to renew the Advisory Contracts was not based on any single factor, but rather was based on a comprehensive consideration of all the information provided to the Board at its meetings throughout the year. The Board, in reaching its determination to renew the Advisory Contracts, was aware that shareholders of the fund have a broad range of investment choices available to them, including a wide choice among funds offered by Fidelity's competitors, and that the fund's shareholders, who have the opportunity to review and weigh the disclosure provided by the fund in its prospectus and other public disclosures, have chosen to invest in this fund, which is part of the Fidelity family of funds.
Annual Report
Nature, Extent, and Quality of Services Provided. The Board considered Fidelity's staffing as it relates to the fund, including the backgrounds of investment personnel of Fidelity, and also considered the fund's investment objective, strategies, and related investment philosophy. The Independent Trustees also had discussions with senior management of Fidelity's investment operations and investment groups. The Board considered the structure of the portfolio manager compensation program and whether this structure provides appropriate incentives to act in the best interests of the fund. Additionally, the Board considered the portfolio managers' investments, if any, in the funds that they manage.
Resources Dedicated to Investment Management and Support Services. The Board and the Fund Oversight and Research Committees reviewed the general qualifications and capabilities of Fidelity's investment staff, including its size, education, experience, and resources, as well as Fidelity's approach to recruiting, training, managing, and compensating investment personnel. The Board noted that Fidelity has continued to increase the resources devoted to non-U.S. offices, including expansion of Fidelity's global investment organization. The Board also noted that Fidelity's analysts have extensive resources, tools and capabilities that allow them to conduct sophisticated quantitative and fundamental analysis, as well as credit analysis of issuers, counterparties and guarantors. Further, the Board considered that Fidelity's investment professionals have sufficient access to global information and data so as to provide competitive investment results over time, and that those professionals also have access to sophisticated tools that permit them to assess portfolio construction and risk and performance attribution characteristics continuously, as well as to transmit new information and research conclusions rapidly around the world. Additionally, in its deliberations, the Board considered Fidelity's trading, risk management, and compliance capabilities and resources, which are integral parts of the investment management process.
Shareholder and Administrative Services. The Board considered (i) the nature, extent, quality, and cost of advisory, administrative, and shareholder services performed by FMR, the sub-advisers (together with FMR, the Investment Advisers), and their affiliates under the Advisory Contracts and under separate agreements covering transfer agency, pricing and bookkeeping, and securities lending services for the fund; (ii) the nature and extent of the supervision of third party service providers, principally custodians and subcustodians; and (iii) the resources devoted to, and the record of compliance with, the fund's compliance policies and procedures. The Board also reviewed the allocation of fund brokerage, including allocations to brokers affiliated with the Investment Advisers, the use of brokerage commissions to pay fund expenses, and the use of "soft" commission dollars to pay for research services.
Annual Report
Board Approval of Investment Advisory Contracts and
Management Fees - continued
The Board noted that the growth of fund assets over time across the complex allows Fidelity to reinvest in the development of services designed to enhance the value or convenience of the Fidelity funds as investment vehicles. These services include 24-hour access to account information and market information through telephone representatives and over the Internet, investor education materials and asset allocation tools, and the expanded availability of Fidelity Investor Centers.
In 2014, the Board formed an ad hoc Committee on Transfer Agency Fees to review the variety of transfer agency fee structures throughout the industry and Fidelity's competitive positioning with respect to industry participants.
Investment in a Large Fund Family. The Board considered the benefits to shareholders of investing in a Fidelity fund, including the benefits of investing in a fund that is part of a large family of funds offering a variety of investment disciplines and providing a large variety of mutual fund investor services. The Board noted that Fidelity had taken, or had made recommendations that resulted in the Fidelity funds taking, a number of actions over the previous year that benefited particular funds, including (i) continuing to dedicate additional resources to investment research and to the support of the senior management team that oversees asset management; (ii) continuing efforts to enhance Fidelity's global research capabilities; (iii) launching new funds and making other enhancements to meet client needs; (iv) reducing management fees and total expenses for certain index funds and diversified international funds; (v) continuing to launch dedicated lower cost underlying funds to meet portfolio construction needs related to expanding underlying fund options for Fidelity funds of funds, specifically for the Freedom Fund product lines; (vi) rationalizing product lines and gaining increased efficiencies through fund mergers; (vii) launching active fixed-income exchange-traded funds; (viii) continuing to develop, acquire and implement systems and technology to improve services to the funds and information security and to increase efficiency; (ix) implementing investment enhancements to further strengthen Fidelity's target date product line to increase investors' probability of success in achieving their goals; (x) modifying the eligibility criteria for certain share classes to accommodate roll-over assets from employer-sponsored retirement plans; (xi) launching a new Class W of the Freedom Index Funds to attract and retain Fidelity record-kept retirement plan assets; and (xii) implementing changes to Fidelity's money market product line in response to recent money market regulatory reforms.
Investment Performance. The Board considered whether the fund has operated in accordance with its investment objective, as well as its record of compliance with its investment restrictions and its performance history.
Annual Report
The Board took into account discussions with representatives of the Investment Advisers about fund investment performance that occur at Board meetings throughout the year. In this regard the Board noted that as part of regularly scheduled fund reviews and other reports to the Board on fund performance, the Board considers annualized return information for the fund, for different time periods, measured against a securities market index ("benchmark index") and a peer group of funds with similar objectives ("peer group"), if any. In its evaluation of fund investment performance, the Board gave particular attention to information indicating changes in performance of certain Fidelity funds for specific time periods and discussed with the Investment Advisers the reasons for any overperformance or underperformance.
In addition to reviewing absolute and relative fund performance, the Independent Trustees periodically consider the appropriateness of fund performance metrics in evaluating the results achieved. In general, the Independent Trustees believe that fund performance should be evaluated based on net performance (after fees and expenses) of both the highest performing and lowest performing fund share classes, where applicable, compared to appropriate benchmark indices, over appropriate time periods that may include full market cycles, and compared to peer groups, as applicable, over the same periods, taking into account relevant factors including the following: general market conditions; issuer-specific information; and fund cash flows and other factors.
The Independent Trustees recognize that shareholders evaluate performance on a net basis over their own holding periods, for which one-, three-, and five-year periods are often used as a proxy. For this reason, the performance information reviewed by the Board also included net cumulative calendar year total return information for the fund and an appropriate benchmark index and peer group for the most recent one-, three-, and five-year periods, as shown below. Returns are shown compared to the 25th percentile (top of box, 75% beaten) and 75th percentile (bottom of box, 25% beaten) of the peer universe.
Annual Report
Board Approval of Investment Advisory Contracts and
Management Fees - continued
Fidelity Growth & Income Portfolio
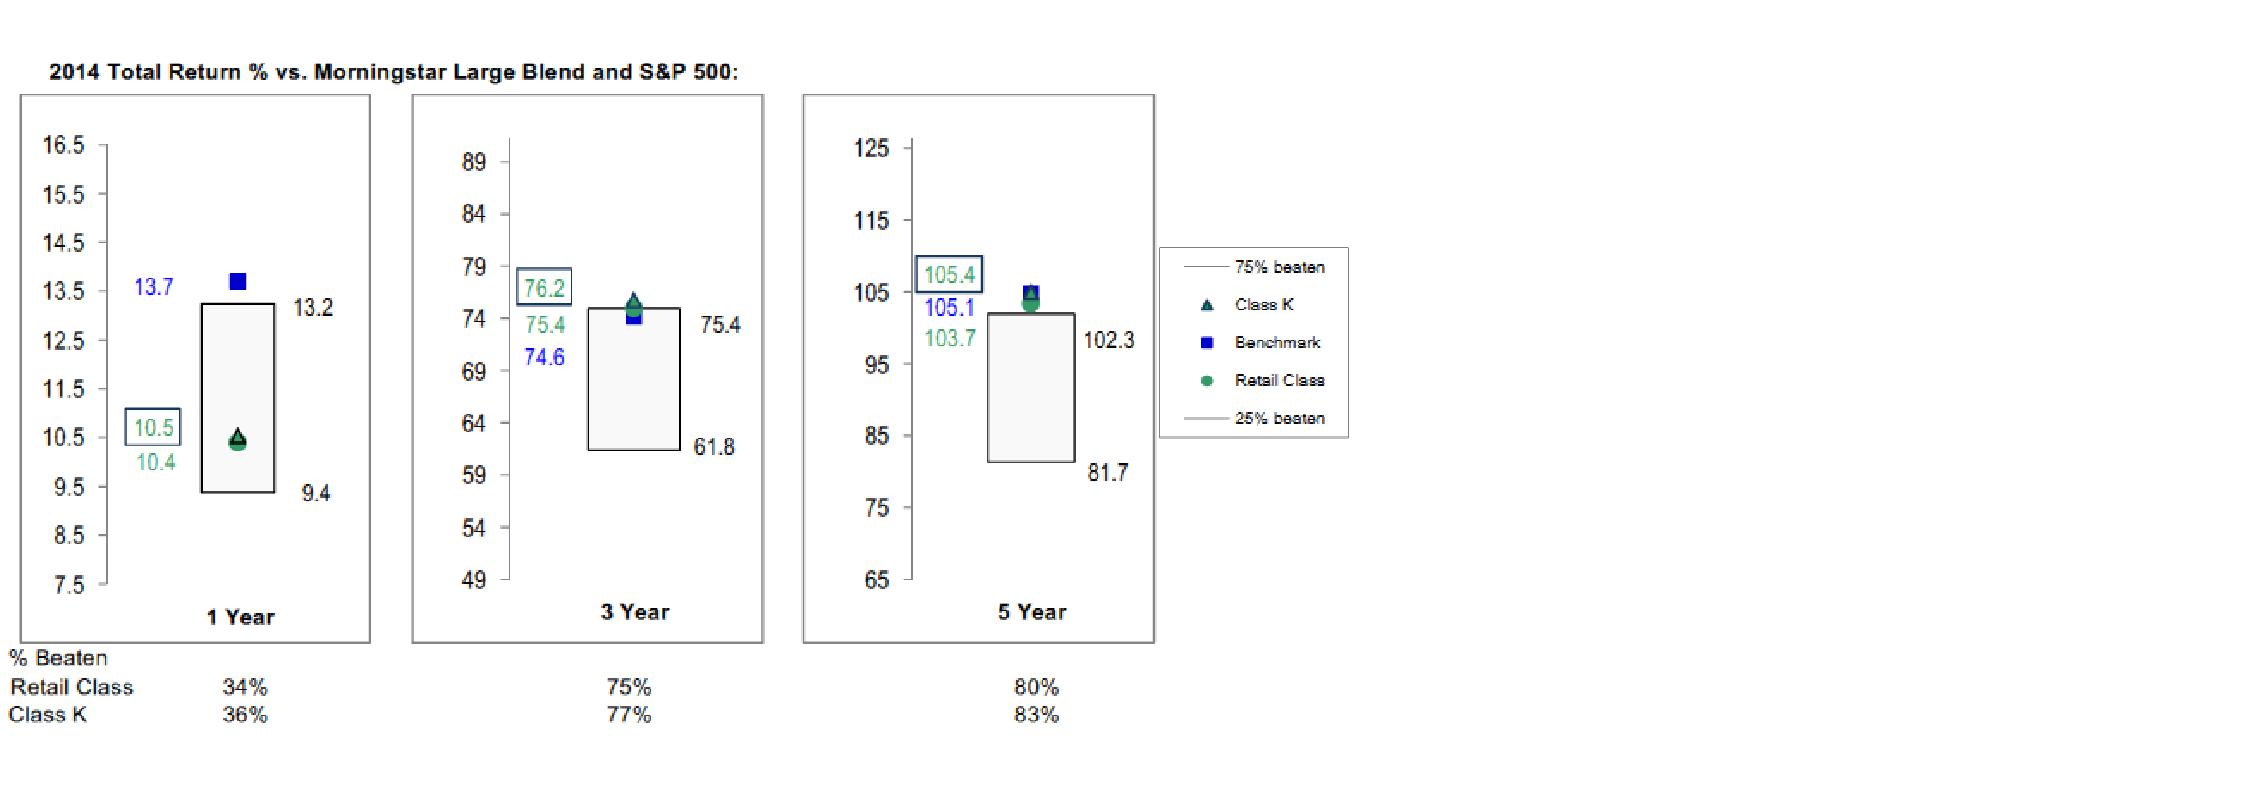
Based on its review, the Board concluded that the nature, extent, and quality of services provided to the fund under the Advisory Contracts should benefit the shareholders of the fund.
Competitiveness of Management Fee and Total Expense Ratio. The Board considered the fund's management fee and total expense ratio compared to "mapped groups" of competitive funds and classes created for the purpose of facilitating the Trustees' competitive analysis of management fees and total expenses. Fidelity creates "mapped groups" by combining similar Lipper investment objective categories that have comparable investment mandates. Combining Lipper investment objective categories aids the Board's management fee and total expense ratio comparisons by broadening the competitive group used for comparison.
Management Fee. The Board considered two proprietary management fee comparisons for the 12-month periods shown in basis points (BP) in the chart below. The group of Lipper funds used by the Board for management fee comparisons is referred to below as the "Total Mapped Group." The Total Mapped Group comparison focuses on a fund's standing in terms of gross management fees before expense reimbursements or caps relative to the total universe of funds with comparable investment mandates, regardless of whether their management fee structures also are comparable. Funds with comparable investment mandates offer exposure to similar types of securities. Funds with comparable management fee structures have similar management fee contractual arrangements (e.g., flat rate charged for advisory services, all-inclusive fee rate, etc.). "TMG %" represents the percentage of funds in the Total Mapped Group that had management fees that were lower than the fund's. For example, a hypothetical TMG % of 20% would mean that 80% of the funds in the Total Mapped Group had higher, and 20% had lower, management fees than the fund. The fund's actual TMG %s and the number of funds in the Total Mapped Group are in the chart below. The "Asset-Size Peer Group" (ASPG) comparison focuses on a fund's standing relative to a subset of non-Fidelity funds within the Total Mapped Group that are similar in size and management fee structure without taking into account performance adjustments, if any. For example, if a fund is in the first quartile of the ASPG, the fund's management fee ranks in the least expensive or lowest 25% of funds in the ASPG. The ASPG represents at least 15% of the funds in the Total Mapped Group with comparable asset size and management fee structures, subject to a minimum of 50 funds (or all funds in the Total Mapped Group if fewer than 50). Additional information, such as the ASPG quartile in which the fund's management fee rate ranked, is also included in the chart and considered by the Board.
Annual Report
Fidelity Growth & Income Portfolio
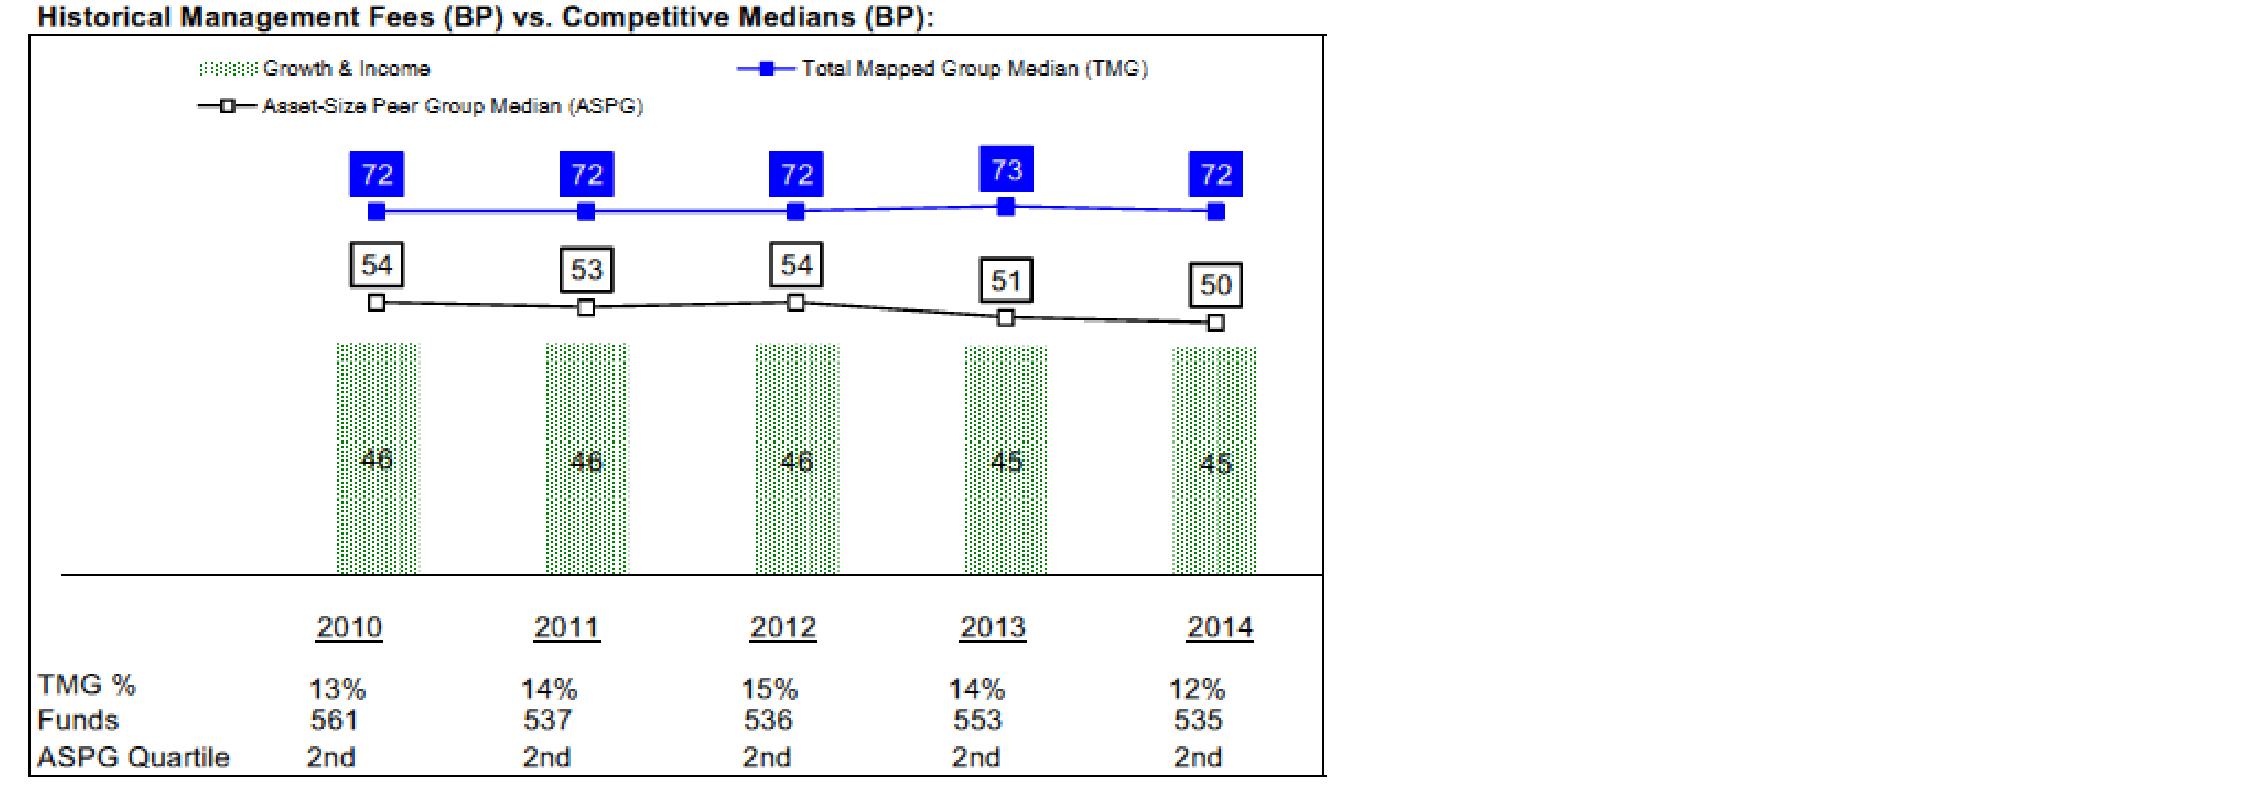
The Board noted that the fund's management fee rate ranked below the median of its Total Mapped Group and below the median of its ASPG for 2014.
The Board noted that, in 2014, the ad hoc Committee on Group Fee was formed by it and other Fidelity fund boards to conduct an in-depth review of the "group fee" component of the management fee of funds with such management fee structures. Committee focus included the mechanics of the group fee, the competitive landscape of group fee structures, Fidelity funds with no group fee component and investment products not included in group fee assets. The Board also considered that, for funds subject to the group fee,
Annual Report
Board Approval of Investment Advisory Contracts and
Management Fees - continued
FMR agreed to voluntarily waive fees over a specified period of time in amounts designed to account for assets converted from certain funds to certain collective investment trusts.
The Board also noted that, in 2013, the ad hoc Committee on Management Fees was formed to conduct an in-depth review of the management fee rates of Fidelity's active equity mutual funds. The Committee focused on the following areas: (i) standard fee structures; (ii) research consumption and trading evolution; (iii) management fee competitiveness/profitability by category; and (iv) factors that drive institutional pricing.
Based on its review, the Board concluded that the fund's management fee is fair and reasonable in light of the services that the fund receives and the other factors considered.
Total Expense Ratio. In its review of each class's total expense ratio, the Board considered the fund's management fee as well as other fund or class expenses, as applicable, such as transfer agent fees, pricing and bookkeeping fees, and custodial, legal, and audit fees. The Board also noted that Fidelity may agree to waive fees and expenses from time to time, and the extent to which, if any, it has done so for the fund. As part of its review, the Board also considered the current and historical total expense ratios of each class of the fund compared to competitive fund median expenses. Each class of the fund is compared to those funds and classes in the Total Mapped Group (used by the Board for management fee comparisons) that have a similar sales load structure.
The Board noted that the total expense ratio of each class ranked below its competitive median for 2014.
Fees Charged to Other Fidelity Clients. The Board also considered Fidelity fee structures and other information with respect to clients of Fidelity, such as other funds advised or subadvised by Fidelity, pension plan clients, and other institutional clients with similar mandates. The Board noted the findings of the 2013 ad hoc joint committee (created with the board of other Fidelity funds), which reviewed and compared Fidelity's institutional investment advisory business with its business of providing services to the Fidelity funds, including the differences in services provided, fees charged, and costs incurred, as well as competition in their respective marketplaces.
Based on its review of total expense ratios and fees charged to other Fidelity clients, the Board concluded that the total expense ratio of each class of the fund was reasonable in light of the services that the fund and its shareholders receive and the other factors considered.
Costs of the Services and Profitability. The Board considered the revenues earned and the expenses incurred by Fidelity in conducting the business of developing, marketing, distributing, managing, administering and servicing the fund and servicing the fund's shareholders. The Board also considered the level of Fidelity's profits in respect of all the Fidelity funds.
Annual Report
On an annual basis, Fidelity presents to the Board information about the profitability of its relationship with the fund. Fidelity calculates profitability information for each fund, as well as aggregate profitability information for groups of Fidelity funds and all Fidelity funds, using a series of detailed revenue and cost allocation methodologies which originate with the books and records of Fidelity on which Fidelity's audited financial statements are based. The Audit Committee of the Board reviews any significant changes from the prior year's methodologies.
PricewaterhouseCoopers LLP (PwC), independent registered public accounting firm and auditor to Fidelity and certain Fidelity funds, has been engaged annually by the Board as part of the Board's assessment of Fidelity's profitability analysis. PwC's engagement includes the review and assessment of the methodologies used by Fidelity in determining the revenues and expenses attributable to Fidelity's mutual fund business, and completion of agreed-upon procedures in respect of the mathematical accuracy of fund profitability and its conformity to established allocation methodologies. After considering PwC's reports issued under the engagement and information provided by Fidelity, the Board concluded that while other allocation methods may also be reasonable, Fidelity's profitability methodologies are reasonable in all material respects.
The Board also reviewed Fidelity's non-fund businesses and fall-out benefits related to the mutual fund business as well as cases where Fidelity's affiliates may benefit from or be related to the fund's business.
The Board considered the costs of the services provided by and the profits realized by Fidelity in connection with the operation of the fund and was satisfied that the profitability was not excessive.
Economies of Scale. The Board considered whether there have been economies of scale in respect of the management of the Fidelity funds, whether the Fidelity funds (including the fund) have appropriately benefited from any such economies of scale, and whether there is potential for realization of any further economies of scale. The Board considered the extent to which the fund will benefit from economies of scale as assets grow through increased services to the fund, through waivers or reimbursements, or through fee or expense ratio reductions. The Board also noted that in 2013, it and the boards of other Fidelity funds created an ad hoc committee (the Economies of Scale Committee) to analyze whether Fidelity attains economies of scale in respect of the management and servicing of the Fidelity funds, whether the Fidelity funds have appropriately benefited from such economies of scale, and whether there is potential for realization of any further economies of scale.
The Board recognized that the fund's management contract incorporates a "group fee" structure, which provides for lower group fee rates as total group assets increase, and for higher group fee rates as total group assets decrease (with "group assets" defined to include fund assets under FMR's management plus sector fund assets previously under FMR's management and currently managed by Fidelity SelectCo, LLC). FMR calculates the group fee rates based on a tiered asset "breakpoint" schedule that varies based on asset class. The Board considered that the group fee is designed to deliver the benefits of economies of scale to fund shareholders when total Fidelity fund assets increase, even if assets of any particular fund are unchanged or have declined, because some portion of Fidelity's costs are attributable to services provided to all Fidelity funds, and all funds benefit if those costs can be allocated among more assets. The Board concluded that, given the group fee structure, fund shareholders will benefit from lower management fees as group assets increase at the fund complex level, regardless of whether Fidelity achieves any such economies of scale.
Annual Report
Board Approval of Investment Advisory Contracts and
Management Fees - continued
The Board concluded, taking into account the analysis of the Economies of Scale Committee, that economies of scale, if any, are being appropriately shared between fund shareholders and Fidelity.
Additional Information Requested by the Board. In order to develop fully the factual basis for consideration of the Fidelity funds' Advisory Contracts, the Board requested and received additional information on certain topics, including: (i) fund performance trends and Fidelity's long-term strategies for certain funds; (ii) the various share classes employed by Fidelity and the attributes of each class, together with similar information on the distribution and servicing payments made by Fidelity or the funds to third-party participants in the distribution channels; (iii) fund profitability, and fund performance in relation to fund profitability; (iv) the methodology with respect to evaluating competitive fund data and peer group classifications and fee comparisons; (v) annual fund profitability margins, with particular focus on certain funds with negative margins; (vi) the realization of fall-out benefits in certain Fidelity business units; (vii) economies of scale and the way in which they are shared with fund shareholders; (viii) Fidelity's group fee structures, including the group fee schedule of breakpoints; (ix) the impact of cost containment measures on the funds; and (x) the transfer agent fee structure.
Based on its evaluation of all of the conclusions noted above, and after considering all factors it believed relevant, the Board concluded that the advisory fee structures are fair and reasonable, and that the fund's Advisory Contracts should be renewed.
Annual Report
Investment Adviser
Fidelity Management & Research Company
Boston, MA
Investment Sub-Advisers
FMR Co., Inc.
FMR Investment Management
(U.K.) Limited
Fidelity Management & Research
(Japan) Limited
Fidelity Management & Research
(Hong Kong) Limited
General Distributor
Fidelity Distributors Corporation
Smithfield, RI
Transfer and Service Agents
Fidelity Investments Institutional
Operations Company, Inc.
Boston, MA
Fidelity Service Company, Inc.
Boston, MA
Custodian
Northern Trust Company
Chicago, IL
(Fidelity Investment logo)(registered trademark)
Corporate Headquarters
245 Summer St., Boston, MA 02210
www.fidelity.com
GAI-K-UANN-0915
1.863229.106
Fidelity®
Small Cap Value
Fund
Annual Report
July 31, 2015
(Fidelity Cover Art)
Contents
Performance | (Click Here) | How the fund has done over time. |
Management's Discussion of Fund Performance | (Click Here) | The Portfolio Manager's review of fund performance and strategy. |
Shareholder Expense Example | (Click Here) | An example of shareholder expenses. |
Investment Changes | (Click Here) | A summary of major shifts in the fund's investments over the past six months. |
Investments | (Click Here) | A complete list of the fund's investments with their market values. |
Financial Statements | (Click Here) | Statements of assets and liabilities, operations, and changes in net assets, as well as financial highlights. |
Notes | (Click Here) | Notes to the financial statements. |
Report of Independent Registered Public Accounting Firm | (Click Here) | |
Trustees and Officers | (Click Here) | |
Distributions | (Click Here) | |
Board Approval of Investment Advisory Contracts and Management Fees | (Click Here) | |
To view a fund's proxy voting guidelines and proxy voting record for the 12-month period ended June 30, visit http://www.fidelity.com/proxyvotingresults or visit the Securities and Exchange Commission's (SEC) web site at http://www.sec.gov. You may also call 1-800-544-8544 to request a free copy of the proxy voting guidelines.
Standard & Poor's, S&P and S&P 500 are registered service marks of The McGraw-Hill Companies, Inc. and have been licensed for use by Fidelity Distributors Corporation.
Other third-party marks appearing herein are the property of their respective owners.
All other marks appearing herein are registered or unregistered trademarks or service marks of FMR LLC or an affiliated company. © 2015 FMR LLC. All rights reserved.
Annual Report
This report and the financial statements contained herein are submitted for the general information of the shareholders of the fund. This report is not authorized for distribution to prospective investors in the fund unless preceded or accompanied by an effective prospectus.
A fund files its complete schedule of portfolio holdings with the SEC for the first and third quarters of each fiscal year on Form N-Q. Forms N-Q are available on the SEC's web site at http://www.sec.gov. A fund's Forms N-Q may be reviewed and copied at the SEC's Public Reference Room in Washington, DC. Information regarding the operation of the SEC's Public Reference Room may be obtained by calling 1-800-SEC-0330. For a complete list of a fund's portfolio holdings, view the most recent holdings listing, semiannual report, or annual report on Fidelity's web site at http://www.fidelity.com, http://www.advisor.fidelity.com, or http://www.401k.com, as applicable.
NOT FDIC INSURED • MAY LOSE VALUE • NO BANK GUARANTEE
Neither the fund nor Fidelity Distributors Corporation is a bank.
Annual Report
Average annual total return reflects the change in the value of an investment, assuming reinvestment of the class' distributions from dividend income and capital gains (the profits earned upon the sale of securities that have grown in value, if any) and assuming a constant rate of performance each year. The $10,000 table and the fund's returns do not reflect the deduction of taxes that a shareholder would pay on fund distributions or the redemption of fund shares. During periods of reimbursement by Fidelity, a fund's total return will be greater than it would be had the reimbursement not occurred. How a fund did yesterday is no guarantee of how it will do tomorrow.
Average Annual Total Returns
Periods ended July 31, 2015 | Past 1
year | Past 5
years | Past 10
years |
Fidelity® Small Cap Value Fund | 12.18% | 15.25% | 9.49% |
$10,000 Over 10 years
Let's say hypothetically that $10,000 was invested in Fidelity® Small Cap Value Fund, a class of the fund, on July 31, 2005. The chart shows how the value of your investment would have changed, and also shows how the Russell 2000® Value Index performed over the same period.
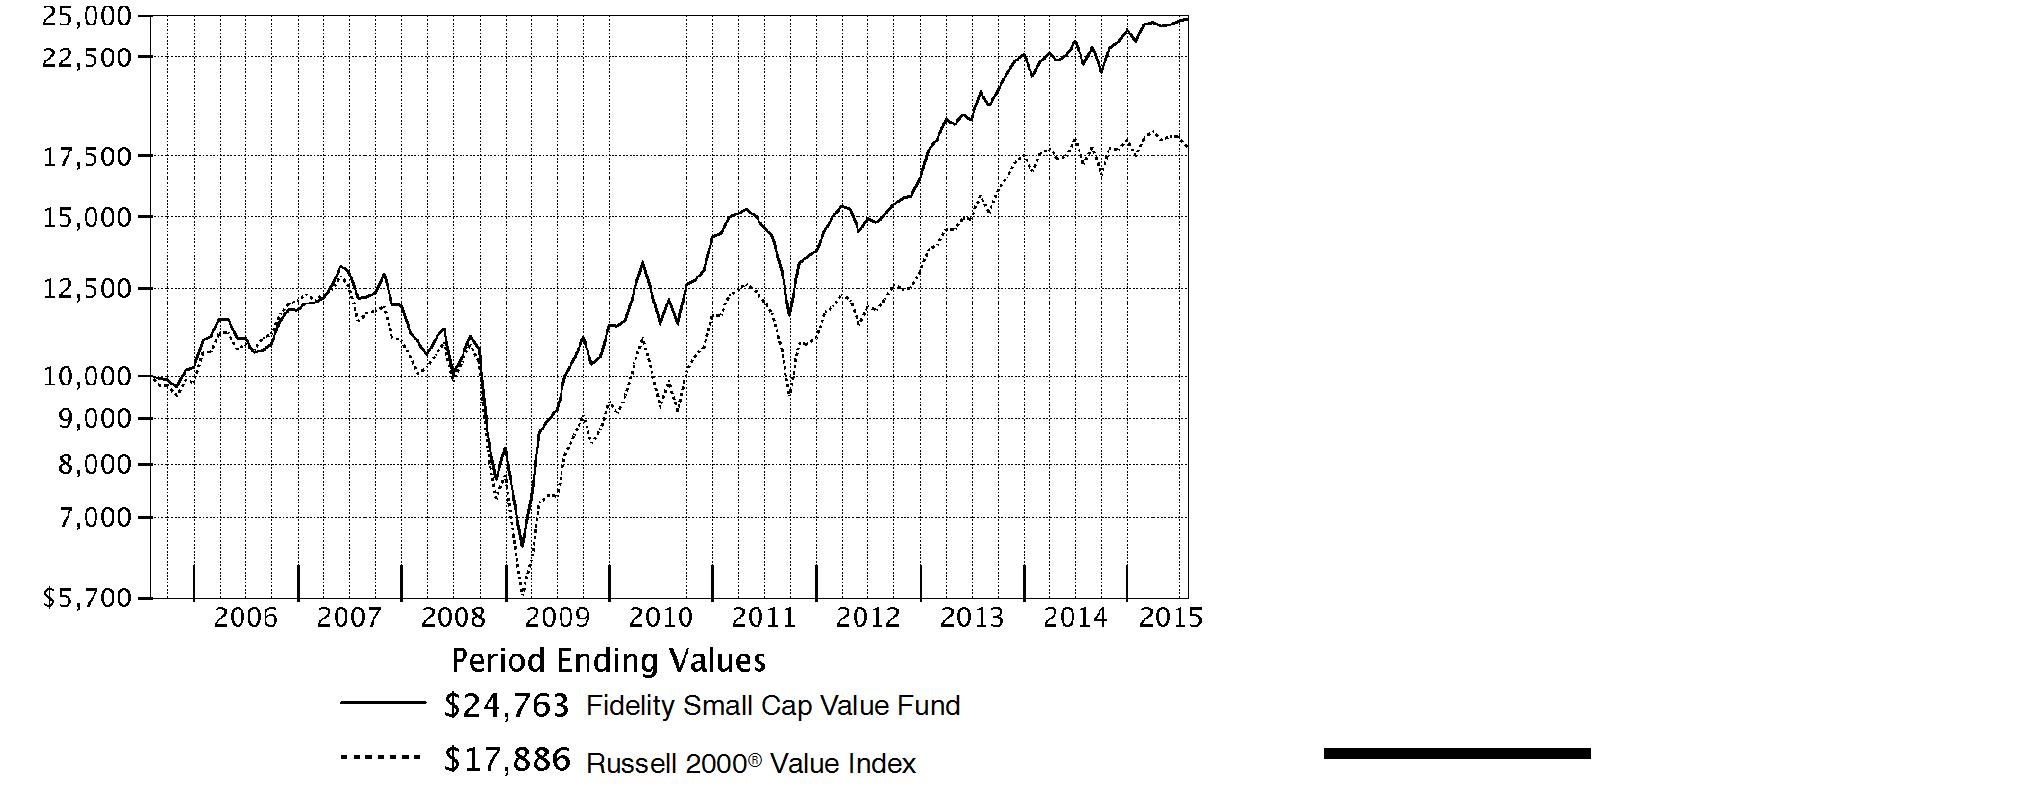
Annual Report
Market Recap: The U.S. equity market gained strongly for the 12 months ending July 31, 2015, as stocks recovered from volatility in late 2014 and early 2015, supported by a still-positive economic backdrop. The S&P 500® Index returned 11.21%, with growth stocks in the index far outpacing value-oriented names on prospects for continued U.S. economic growth. Consequently, the growth-oriented Nasdaq Composite Index® rose 18.71%, outpacing the broader S&P 500®, as well as the 12.03% advance of the smaller-cap Russell 2000® Index. Within the S&P 500®, seven of 10 sectors notched a gain, with significant performance variation. Health care (+27%) led the way, aided by merger activity. Consumer discretionary (+24%) benefited from spending linked to a seven-year low in unemployment. Strong first halves for the consumer staples sector and the real estate segment of financials yielded above-market returns (19% and 12%, respectively) for the full-year period. Conversely, energy (-26%) significantly lagged, due to a roughly 55% decline for U.S. crude-oil prices. Materials (-4%) also lost ground. At period end, investors remained focused on the slowing rate of U.S. earnings growth, the possible effect of a relatively stronger U.S. dollar on exports and inflation, and whether an economic slowdown in China would create ripples for the global economy.
Comments from Lead Portfolio Manager Derek Janssen: For the year, the fund significantly outpaced the 4.30% return of the benchmark Russell 2000® Value Index. (For specific results, please see the Performance section of this report.) Compared with the index, security selection was positive in nearly every sector of the market, especially financials, energy and information technology. The fund also benefited from an overweighting in the health care sector, by far the market's strongest-performing group. That favorable impact, however, was modestly tempered by subpar stock picking in the category. Our goal of managing potential damage from big losses was a plus. This was most evident in the beleaguered energy sector. Although we, too, experienced some struggles - most notably with ShawCor and Northern Oil and Gas - our aggregate energy holdings did vastly better than the sector as a whole. In financials, StanCorp Financial Group, a provider of group disability insurance, led the way on the positive side. Late in the period, the company agreed to be acquired, triggering a sharp rise in its share price. Meanwhile, in information technology, an out-of-index position for software company SS&C Technologies Holdings was a standout contributor. Elsewhere, a position in GrafTech International, which develops graphite electrodes and other carbon-based products, hurt results. In search of other opportunities, we sold the fund's shares in late 2014.
The views expressed above reflect those of the portfolio manager(s) only through the end of the period as stated on the cover of this report and do not necessarily represent the views of Fidelity or any other person in the Fidelity organization. Any such views are subject to change at any time based upon market or other conditions and Fidelity disclaims any responsibility to update such views. These views may not be relied on as investment advice and, because investment decisions for a Fidelity fund are based on numerous factors, may not be relied on as an indication of trading intent on behalf of any Fidelity fund.
Annual Report
Shareholder Expense Example
As a shareholder of the Fund, you incur two types of costs: (1) transaction costs, including sales charges (loads) on purchase payments or redemption proceeds, redemption fees and (2) ongoing costs, including management fees, distribution and/or service (12b-1) fees and other Fund expenses. This Example is intended to help you understand your ongoing costs (in dollars) of investing in the Fund and to compare these costs with the ongoing costs of investing in other mutual funds.
The Example is based on an investment of $1,000 invested at the beginning of the period and held for the entire period (February 1, 2015 to July 31, 2015).
Actual Expenses
The first line of the accompanying table for each class of the Fund provides information about actual account values and actual expenses. You may use the information in this line, together with the amount you invested, to estimate the expenses that you paid over the period. Simply divide your account value by $1,000.00 (for example, an $8,600 account value divided by $1,000.00 = 8.6), then multiply the result by the number in the first line for a class of the Fund under the heading entitled "Expenses Paid During Period" to estimate the expenses you paid on your account during this period. A small balance maintenance fee of $12.00 that is charged once a year may apply for certain accounts with a value of less than $2,000. This fee is not included in the table below. If it was, the estimate of expenses you paid during the period would be higher, and your ending account value lower, by this amount. In addition, the Fund, as a shareholder in the underlying Fidelity Central Funds, will indirectly bear its pro-rata share of the fees and expenses incurred by the underlying Fidelity Central Funds. These fees and expenses are not included in the Fund's annualized expense ratio used to calculate the expense estimate in the table below.
Hypothetical Example for Comparison Purposes
The second line of the accompanying table for each class of the Fund provides information about hypothetical account values and hypothetical expenses based on a Class' actual expense ratio and an assumed rate of return of 5% per year before expenses, which is not the Class' actual return. The hypothetical account values and expenses may not be used to estimate the actual ending account balance or expenses you paid for the period. You may use this information to compare the ongoing costs of investing in the Fund and other funds. To do so, compare this 5% hypothetical example with the 5% hypothetical examples that appear in the shareholder reports of the other funds. A small balance maintenance fee of $12.00 that is charged once a year may apply for certain accounts with a value of less than $2,000. This fee is not included in the table below. If it was, the estimate of expenses you paid during the period would be higher, and your ending account value lower, by this amount. In addition, the Fund, as a shareholder in the underlying Fidelity Central Funds, will indirectly bear its pro-rata share of the fees and expenses incurred by the underlying Fidelity Central Funds. These fees and expenses are not included in the Fund's annualized expense ratio used to calculate the expense estimate in the table below.
Please note that the expenses shown in the table are meant to highlight your ongoing costs only and do not reflect any transaction costs. Therefore, the second line of the table is useful in comparing ongoing costs only, and will not help you determine the relative total costs of owning different funds. In addition, if these transactional costs were included, your costs would have been higher.
Annual Report
Shareholder Expense Example - continued
| Annualized
Expense RatioB | Beginning
Account Value
February 1, 2015 | Ending
Account Value
July 31, 2015 | Expenses Paid
During Period*
February 1, 2015 to July 31, 2015 |
Class A | 1.35% | | | |
Actual | | $ 1,000.00 | $ 1,057.50 | $ 6.89 |
HypotheticalA | | $ 1,000.00 | $ 1,018.10 | $ 6.76 |
Class T | 1.60% | | | |
Actual | | $ 1,000.00 | $ 1,056.20 | $ 8.16 |
HypotheticalA | | $ 1,000.00 | $ 1,016.86 | $ 8.00 |
Class B | 2.19% | | | |
Actual | | $ 1,000.00 | $ 1,053.30 | $ 11.15 |
HypotheticalA | | $ 1,000.00 | $ 1,013.93 | $ 10.94 |
Class C | 2.12% | | | |
Actual | | $ 1,000.00 | $ 1,053.20 | $ 10.79 |
HypotheticalA | | $ 1,000.00 | $ 1,014.28 | $ 10.59 |
Small Cap Value | 1.09% | | | |
Actual | | $ 1,000.00 | $ 1,058.80 | $ 5.56 |
HypotheticalA | | $ 1,000.00 | $ 1,019.39 | $ 5.46 |
Class I | 1.09% | | | |
Actual | | $ 1,000.00 | $ 1,058.80 | $ 5.56 |
HypotheticalA | | $ 1,000.00 | $ 1,019.39 | $ 5.46 |
A 5% return per year before expenses
B Annualized expense ratio reflects expenses net of applicable fee waivers.
* Expenses are equal to each Class' annualized expense ratio, multiplied by the average account value over the period, multiplied by 181/365 (to reflect the one-half year period).
Annual Report
Investment Changes (Unaudited)
Top Ten Stocks as of July 31, 2015 |
| % of fund's
net assets | % of fund's net assets
6 months ago |
Aarons, Inc. Class A | 3.0 | 2.6 |
Aspen Insurance Holdings Ltd. | 2.7 | 2.5 |
Rouse Properties, Inc. | 2.7 | 2.9 |
Tech Data Corp. | 2.7 | 2.4 |
Federated Investors, Inc. Class B (non-vtg.) | 2.7 | 2.9 |
Store Capital Corp. | 2.6 | 0.0 |
Silgan Holdings, Inc. | 2.6 | 2.3 |
CVB Financial Corp. | 2.5 | 1.7 |
Universal Corp. | 2.4 | 1.7 |
DineEquity, Inc. | 2.4 | 1.4 |
| 26.3 | |
Top Five Market Sectors as of July 31, 2015 |
| % of fund's
net assets | % of fund's net assets
6 months ago |
Financials | 41.0 | 40.5 |
Industrials | 13.2 | 13.0 |
Information Technology | 12.9 | 12.8 |
Consumer Discretionary | 9.3 | 11.6 |
Health Care | 6.8 | 6.7 |
Asset Allocation (% of fund's net assets) |
As of July 31, 2015 * | As of January 31, 2015 ** |
 | Stocks 99.2% | |  | Stocks 99.2% | |
 | Short-Term
Investments and
Net Other Assets (Liabilities) 0.8% | |  | Short-Term
Investments and
Net Other Assets (Liabilities) 0.8% | |
* Foreign investments | 11.2% | | ** Foreign investments | 11.9% | |

Annual Report
Investments July 31, 2015
Showing Percentage of Net Assets
Common Stocks - 99.2% |
| Shares | | Value |
CONSUMER DISCRETIONARY - 9.3% |
Auto Components - 1.5% |
Standard Motor Products, Inc. (e) | 1,183,301 | | $ 43,273,318 |
Hotels, Restaurants & Leisure - 2.4% |
DineEquity, Inc. | 660,000 | | 68,646,600 |
Specialty Retail - 5.1% |
Aarons, Inc. Class A | 2,295,100 | | 84,872,798 |
Genesco, Inc. (a) | 616,728 | | 39,896,134 |
Hibbett Sports, Inc. (a) | 249,000 | | 11,341,950 |
Murphy U.S.A., Inc. (a) | 72,506 | | 3,970,429 |
| | 140,081,311 |
Textiles, Apparel & Luxury Goods - 0.3% |
Vera Bradley, Inc. (a) | 831,000 | | 9,024,660 |
TOTAL CONSUMER DISCRETIONARY | | 261,025,889 |
CONSUMER STAPLES - 4.2% |
Food Products - 1.8% |
Post Holdings, Inc. (a) | 931,300 | | 50,048,062 |
Tobacco - 2.4% |
Universal Corp. (d)(e) | 1,208,239 | | 68,930,035 |
TOTAL CONSUMER STAPLES | | 118,978,097 |
ENERGY - 4.3% |
Energy Equipment & Services - 1.8% |
Hornbeck Offshore Services, Inc. (a)(d) | 1,600,000 | | 29,120,000 |
ShawCor Ltd. Class A | 871,000 | | 20,472,180 |
| | 49,592,180 |
Oil, Gas & Consumable Fuels - 2.5% |
Northern Oil & Gas, Inc. (a)(d) | 1,958,249 | | 9,321,265 |
World Fuel Services Corp. | 1,537,200 | | 62,487,180 |
| | 71,808,445 |
TOTAL ENERGY | | 121,400,625 |
FINANCIALS - 41.0% |
Banks - 9.7% |
Associated Banc-Corp. | 2,890,335 | | 56,968,503 |
CVB Financial Corp. | 3,999,988 | | 70,839,787 |
First Citizen Bancshares, Inc. Class A (a) | 180,954 | | 46,385,748 |
Common Stocks - continued |
| Shares | | Value |
FINANCIALS - continued |
Banks - continued |
First Citizen Bancshares, Inc. Class A | 140,370 | | $ 35,982,446 |
First Niagara Financial Group, Inc. | 6,500,000 | | 63,115,000 |
| | 273,291,484 |
Capital Markets - 6.1% |
Federated Investors, Inc. Class B (non-vtg.) | 2,199,963 | | 74,160,753 |
OM Asset Management Ltd. | 2,232,001 | | 39,439,458 |
Waddell & Reed Financial, Inc. Class A | 1,264,100 | | 56,770,731 |
| | 170,370,942 |
Insurance - 11.5% |
Aspen Insurance Holdings Ltd. | 1,599,400 | | 76,915,146 |
Endurance Specialty Holdings Ltd. | 902,400 | | 62,707,776 |
First American Financial Corp. | 1,270,287 | | 51,548,246 |
ProAssurance Corp. | 1,368,200 | | 66,070,378 |
StanCorp Financial Group, Inc. | 581,300 | | 66,279,826 |
| | 323,521,372 |
Real Estate Investment Trusts - 8.2% |
National Retail Properties, Inc. (d) | 683,400 | | 25,401,978 |
Rouse Properties, Inc. (d)(e) | 4,350,000 | | 76,560,000 |
Sabra Health Care REIT, Inc. | 2,042,700 | | 55,867,845 |
Store Capital Corp. | 3,500,000 | | 73,500,000 |
| | 231,329,823 |
Real Estate Management & Development - 1.7% |
Kennedy Wilson Europe Real Estate PLC | 2,659,540 | | 47,554,949 |
Thrifts & Mortgage Finance - 3.8% |
Astoria Financial Corp. | 3,403,499 | | 51,460,905 |
Washington Federal, Inc. | 2,368,300 | | 55,134,024 |
| | 106,594,929 |
TOTAL FINANCIALS | | 1,152,663,499 |
HEALTH CARE - 6.8% |
Health Care Equipment & Supplies - 1.6% |
Integra LifeSciences Holdings Corp. (a) | 709,200 | | 45,480,996 |
Health Care Providers & Services - 2.7% |
AmSurg Corp. (a) | 148,800 | | 10,674,912 |
Civitas Solutions, Inc. (e) | 2,940,700 | | 66,136,343 |
| | 76,811,255 |
Common Stocks - continued |
| Shares | | Value |
HEALTH CARE - continued |
Health Care Technology - 1.1% |
Cegedim SA (a) | 670,247 | | $ 29,436,590 |
Pharmaceuticals - 1.4% |
Theravance, Inc. (d) | 2,594,553 | | 39,748,552 |
TOTAL HEALTH CARE | | 191,477,393 |
INDUSTRIALS - 13.2% |
Aerospace & Defense - 1.6% |
Moog, Inc. Class A (a) | 650,000 | | 43,459,000 |
Commercial Services & Supplies - 2.8% |
Essendant, Inc. | 1,273,798 | | 46,901,242 |
Knoll, Inc. | 1,269,800 | | 30,729,160 |
| | 77,630,402 |
Electrical Equipment - 3.3% |
AZZ, Inc. | 770,000 | | 39,847,500 |
EnerSys | 843,700 | | 52,689,065 |
| | 92,536,565 |
Machinery - 3.8% |
Columbus McKinnon Corp. (NY Shares) | 776,000 | | 18,204,960 |
Mueller Industries, Inc. | 1,600,400 | | 51,804,948 |
Valmont Industries, Inc. (d) | 340,000 | | 37,818,200 |
| | 107,828,108 |
Trading Companies & Distributors - 1.7% |
WESCO International, Inc. (a)(d) | 777,933 | | 47,733,969 |
TOTAL INDUSTRIALS | | 369,188,044 |
INFORMATION TECHNOLOGY - 12.9% |
Electronic Equipment & Components - 6.1% |
Ingram Micro, Inc. Class A | 2,048,300 | | 55,775,209 |
SYNNEX Corp. | 527,200 | | 39,872,136 |
Tech Data Corp. (a) | 1,286,373 | | 75,034,137 |
| | 170,681,482 |
Internet Software & Services - 2.8% |
Cimpress NV (a) | 600,000 | | 38,718,000 |
j2 Global, Inc. | 574,300 | | 40,430,720 |
| | 79,148,720 |
IT Services - 1.7% |
CACI International, Inc. Class A (a) | 578,334 | | 47,498,571 |
Common Stocks - continued |
| Shares | | Value |
INFORMATION TECHNOLOGY - continued |
Software - 2.3% |
SS&C Technologies Holdings, Inc. | 963,900 | | $ 65,574,117 |
TOTAL INFORMATION TECHNOLOGY | | 362,902,890 |
MATERIALS - 2.9% |
Containers & Packaging - 2.6% |
Silgan Holdings, Inc. | 1,350,000 | | 72,184,500 |
Metals & Mining - 0.3% |
Haynes International, Inc. | 186,142 | | 7,924,065 |
TOTAL MATERIALS | | 80,108,565 |
UTILITIES - 4.6% |
Electric Utilities - 3.8% |
El Paso Electric Co. | 1,524,121 | | 55,523,728 |
IDACORP, Inc. | 822,000 | | 51,054,420 |
| | 106,578,148 |
Gas Utilities - 0.8% |
Southwest Gas Corp. | 372,656 | | 20,995,439 |
TOTAL UTILITIES | | 127,573,587 |
TOTAL COMMON STOCKS (Cost $2,263,907,733) |
2,785,318,589
|
Money Market Funds - 3.4% |
| Shares | | Value |
Fidelity Cash Central Fund, 0.17% (b) | 17,732,670 | | $ 17,732,670 |
Fidelity Securities Lending Cash Central Fund, 0.18% (b)(c) | 78,652,275 | | 78,652,275 |
TOTAL MONEY MARKET FUNDS (Cost $96,384,945) |
96,384,945
|
TOTAL INVESTMENT PORTFOLIO - 102.6% (Cost $2,360,292,678) | 2,881,703,534 |
NET OTHER ASSETS (LIABILITIES) - (2.6)% | (72,769,368) |
NET ASSETS - 100% | $ 2,808,934,166 |
Legend |
(a) Non-income producing |
(b) Affiliated fund that is generally available only to investment companies and other accounts managed by Fidelity Investments. The rate quoted is the annualized seven-day yield of the fund at period end. A complete unaudited listing of the fund's holdings as of its most recent quarter end is available upon request. In addition, each Fidelity Central Fund's financial statements, which are not covered by the Fund's Report of Independent Registered Public Accounting Firm, are available on the SEC's website or upon request. |
(c) Investment made with cash collateral received from securities on loan. |
(d) Security or a portion of the security is on loan at period end. |
(e) Affiliated company |
Affiliated Central Funds |
Information regarding fiscal year to date income earned by the Fund from investments in Fidelity Central Funds is as follows: |
Fund | Income earned |
Fidelity Cash Central Fund | $ 32,820 |
Fidelity Securities Lending Cash Central Fund | 2,526,958 |
Total | $ 2,559,778 |
Other Affiliated Issuers |
An affiliated company is a company in which the Fund has ownership of at least 5% of the voting securities. Fiscal year to date transactions with companies which are or were affiliates are as follows: |
Affiliate | Value, beginning of period | Purchases | Sales Proceeds | Dividend Income | Value,
end of
period |
ACCO Brands Corp. | $ 50,386,144 | $ - | $ 54,199,221 | $ - | $ - |
Civitas Solutions, Inc. | - | 49,470,245 | - | - | 66,136,343 |
Rouse Properties, Inc. | 61,020,000 | 12,779,885 | - | 1,241,110 | 76,560,000 |
Standard Motor Products, Inc. | 5,166,001 | 37,876,193 | - | 350,548 | 43,273,318 |
Universal Corp. | 34,273,800 | 23,621,771 | - | 2,242,369 | 68,930,035 |
Total | $ 150,845,945 | $ 123,748,094 | $ 54,199,221 | $ 3,834,027 | $ 254,899,696 |
Other Information |
All investments are categorized as Level 1 under the Fair Value Hierarchy. The inputs or methodology used for valuing securities may not be an indication of the risk associated with investing in those securities. For more information on valuation inputs, please refer to the Investment Valuation section in the accompanying Notes to Financial Statements. |
Distribution of investments by country or territory of incorporation, as a percentage of total net assets, is as follows (Unaudited): |
United States of America | 88.8% |
Bermuda | 4.9% |
Bailiwick of Jersey | 1.7% |
United Kingdom | 1.4% |
Netherlands | 1.4% |
France | 1.1% |
Others (Individually Less Than 1%) | 0.7% |
| 100.0% |
See accompanying notes which are an integral part of the financial statements.
Annual Report
Statement of Assets and Liabilities
| | July 31, 2015 |
| | |
Assets | | |
Investment in securities, at value (including securities loaned of $78,959,780) - See accompanying schedule: Unaffiliated issuers (cost $2,038,966,810) | $ 2,530,418,893 | |
Fidelity Central Funds (cost $96,384,945) | 96,384,945 | |
Other affiliated issuers (cost $224,940,923) | 254,899,696 | |
Total Investments (cost $2,360,292,678) | | $ 2,881,703,534 |
Cash | | 734,073 |
Receivable for investments sold | | 15,532,470 |
Receivable for fund shares sold | | 1,661,236 |
Dividends receivable | | 1,471,580 |
Distributions receivable from Fidelity Central Funds | | 173,728 |
Other receivables | | 47,404 |
Total assets | | 2,901,324,025 |
| | |
Liabilities | | |
Payable for investments purchased | $ 8,089,386 | |
Payable for fund shares redeemed | 2,726,578 | |
Accrued management fee | 2,167,127 | |
Distribution and service plan fees payable | 144,360 | |
Other affiliated payables | 547,440 | |
Other payables and accrued expenses | 62,693 | |
Collateral on securities loaned, at value | 78,652,275 | |
Total liabilities | | 92,389,859 |
| | |
Net Assets | | $ 2,808,934,166 |
Net Assets consist of: | | |
Paid in capital | | $ 2,052,777,532 |
Undistributed net investment income | | 15,098,491 |
Accumulated undistributed net realized gain (loss) on investments and foreign currency transactions | | 219,647,286 |
Net unrealized appreciation (depreciation) on investments and assets and liabilities in foreign currencies | | 521,410,857 |
Net Assets | | $ 2,808,934,166 |
See accompanying notes which are an integral part of the financial statements.
Annual Report
Financial Statements - continued
Statement of Assets and Liabilities - continued
| | July 31, 2015 |
Calculation of Maximum Offering Price | | |
Class A: | | |
Net Asset Value and redemption price per share ($235,843,693 ÷ 12,321,881 shares) | | $ 19.14 |
| | |
Maximum offering price per share (100/94.25 of $19.14) | | $ 20.31 |
Class T: | | |
Net Asset Value and redemption price per share ($91,716,035 ÷ 4,884,772 shares) | | $ 18.78 |
| | |
Maximum offering price per share (100/96.50 of $18.78) | | $ 19.46 |
Class B: | | |
Net Asset Value and offering price per share ($3,472,809 ÷ 195,257 shares) | | $ 17.79 |
| | |
Class C: | | |
Net Asset Value and offering price per share ($64,928,190 ÷ 3,644,329 shares) | | $ 17.82 |
| | |
Small Cap Value: | | |
Net Asset Value, offering price and redemption price per share ($2,036,156,515 ÷ 104,710,600 shares) | | $ 19.45 |
| | |
Class I: | | |
Net Asset Value, offering price and redemption price per share ($376,816,924 ÷ 19,373,883 shares) | | $ 19.45 |
A Redemption price per share is equal to net asset value less any applicable contingent deferred sales charge.
See accompanying notes which are an integral part of the financial statements.
Annual Report
Statement of Operations
| Year ended July 31, 2015 |
| | |
Investment Income | | |
Dividends (including $3,834,027 earned from other affiliated issuers) | | $ 43,839,929 |
Special dividends | | 7,304,990 |
Interest | | 13 |
Income from Fidelity Central Funds | | 2,559,778 |
Total income | | 53,704,710 |
| | |
Expenses | | |
Management fee | | |
Basic fee | $ 19,717,517 | |
Performance adjustment | 5,968,836 | |
Transfer agent fees | 5,735,976 | |
Distribution and service plan fees | 1,818,820 | |
Accounting and security lending fees | 861,187 | |
Custodian fees and expenses | 49,188 | |
Independent trustees' compensation | 11,943 | |
Registration fees | 112,249 | |
Audit | 66,269 | |
Legal | 6,901 | |
Interest | 136 | |
Miscellaneous | 18,831 | |
Total expenses before reductions | 34,367,853 | |
Expense reductions | (889,045) | 33,478,808 |
Net investment income (loss) | | 20,225,902 |
Realized and Unrealized Gain (Loss) Net realized gain (loss) on: | | |
Investment securities: | | |
Unaffiliated issuers | 288,163,783 | |
Other affiliated issuers | (2,940,192) | |
Foreign currency transactions | 293,006 | |
Total net realized gain (loss) | | 285,516,597 |
Change in net unrealized appreciation (depreciation) on: Investment securities | 14,012,996 | |
Assets and liabilities in foreign currencies | 1 | |
Total change in net unrealized appreciation (depreciation) | | 14,012,997 |
Net gain (loss) | | 299,529,594 |
Net increase (decrease) in net assets resulting from operations | | $ 319,755,496 |
See accompanying notes which are an integral part of the financial statements.
Annual Report
Financial Statements - continued
Statement of Changes in Net Assets
| Year ended
July 31,
2015 | Year ended
July 31,
2014 |
Increase (Decrease) in Net Assets | | |
Operations | | |
Net investment income (loss) | $ 20,225,902 | $ 11,952,766 |
Net realized gain (loss) | 285,516,597 | 925,842,288 |
Change in net unrealized appreciation (depreciation) | 14,012,997 | (668,249,080) |
Net increase (decrease) in net assets resulting from operations | 319,755,496 | 269,545,974 |
Distributions to shareholders from net investment income | (9,146,893) | (10,662,065) |
Distributions to shareholders from net realized gain | (322,480,172) | (362,625,477) |
Total distributions | (331,627,065) | (373,287,542) |
Share transactions - net increase (decrease) | (16,898,248) | (1,289,647,794) |
Redemption fees | 149,785 | 536,076 |
Total increase (decrease) in net assets | (28,620,032) | (1,392,853,286) |
| | |
Net Assets | | |
Beginning of period | 2,837,554,198 | 4,230,407,484 |
End of period (including undistributed net investment income of $15,098,491 and undistributed net investment income of $5,856,882, respectively) | $ 2,808,934,166 | $ 2,837,554,198 |
See accompanying notes which are an integral part of the financial statements.
Annual Report
Financial Highlights - Class A
Years ended July 31, | 2015 | 2014 | 2013 | 2012 | 2011 |
Selected Per-Share Data | | | | | |
Net asset value, beginning of period | $ 19.29 | $ 19.96 | $ 14.86 | $ 15.48 | $ 13.45 |
Income from Investment Operations | | | | | |
Net investment income (loss) C | .10 L | .03 | .07 | .01 | .01F |
Net realized and unrealized gain (loss) | 2.01 | 1.24 | 5.57 | .30 | 2.22 |
Total from investment operations | 2.11 | 1.27 | 5.64 | .31 | 2.23 |
Distributions from net investment income | (.02) | (.01) | (.07) | (.01) | (.08) |
Distributions from net realized gain | (2.25) | (1.93) | (.47) | (.93) | (.12) |
Total distributions | (2.26)K | (1.94) | (.54) | (.93)J | (.20) |
Redemption fees added to paid in capitalC,H | - | - | - | - | - |
Net asset value, end of period | $ 19.14 | $ 19.29 | $ 19.96 | $ 14.86 | $ 15.48 |
Total ReturnA, B | 11.86% | 6.83% | 39.09% | 3.24% | 16.72% |
Ratios to Average Net Assets D, G | | | | | |
Expenses before reductions | 1.42% | 1.36% | 1.36% | 1.44% | 1.44% |
Expenses net of fee waivers, if any | 1.39% | 1.35% | 1.36% | 1.44% | 1.43% |
Expenses net of all reductions | 1.39% | 1.34% | 1.36% | 1.44% | 1.43% |
Net investment income (loss) | .52% L | .13% | .41% | .09% | .06%F |
Supplemental Data | | | | | |
Net assets, end of period
(000 omitted) | $ 235,844 | $ 258,183 | $ 275,265 | $ 150,285 | $ 140,707 |
Portfolio turnover rateE | 34% | 26%I | 29% | 27% | 22% |
A Total returns would have been lower if certain expenses had not been reduced during the applicable periods shown.
B Total returns do not include the effect of the sales charges.
C Calculated based on average shares outstanding during the period.
D Fees and expenses of any underlying Fidelity Central Funds are not included in the Fund's expense ratio. The Fund indirectly bears its proportionate share of the expenses of any underlying Fidelity Central Funds.
E Amount does not include the portfolio activity of any underlying Fidelity Central Funds.
F Investment income per share reflects a large, non-recurring dividend which amounted to $.06 per share. Excluding this non-recurring dividend, the ratio of net investment income (loss) to average net assets would have been (.31)%.
G Expense ratios reflect operating expenses of the class. Expenses before reductions do not reflect amounts reimbursed by the investment adviser or reductions from brokerage service arrangements or reductions from other expense offset arrangements and do not represent the amount paid by the class during periods when reimbursements or reductions occur. Expenses net of fee waivers reflect expenses after reimbursement by the investment adviser but prior to reductions from brokerage service arrangements or other expense offset arrangements. Expenses net of all reductions represent the net expenses paid by the class.
H Amount represents less than $.01 per share.
I Portfolio turnover rate excludes securities received or delivered in-kind.
J Total distributions of $.93 per share is comprised of distributions from net investment income of $.006 and distributions from net realized gain of $.925 per share.
K Total distributions of $2.26 per share is comprised of distributions from net investment income of $.016 and distributions from net realized gain of $2.248 per share.
L Investment income per share reflects a large, non-recurring dividend which amounted to $.05 per share. Excluding this non-recurring dividend, the ratio of net investment income (loss) to average net assets would have been .26%.
See accompanying notes which are an integral part of the financial statements.
Annual Report
Financial Highlights - Class T
Years ended July 31, | 2015 | 2014 | 2013 | 2012 | 2011 |
Selected Per-Share Data | | | | | |
Net asset value, beginning of period | $ 18.98 | $ 19.70 | $ 14.70 | $ 15.34 | $ 13.34 |
Income from Investment Operations | | | | | |
Net investment income (loss) C | .05J | (.02) | .03 | (.02) | (.03) F |
Net realized and unrealized gain (loss) | 1.98 | 1.23 | 5.50 | .31 | 2.20 |
Total from investment operations | 2.03 | 1.21 | 5.53 | .29 | 2.17 |
Distributions from net investment income | - | - | (.06) | - | (.05) |
Distributions from net realized gain | (2.23) | (1.93) | (.47) | (.93) | (.12) |
Total distributions | (2.23) | (1.93) | (.53) | (.93) | (.17) |
Redemption fees added to paid in capital C,H | - | - | - | - | - |
Net asset value, end of period | $ 18.78 | $ 18.98 | $ 19.70 | $ 14.70 | $ 15.34 |
Total ReturnA, B | 11.58% | 6.58% | 38.70% | 3.08% | 16.36% |
Ratios to Average Net Assets D, G | | | | | |
Expenses before reductions | 1.67% | 1.61% | 1.60% | 1.67% | 1.70% |
Expenses net of fee waivers, if any | 1.64% | 1.59% | 1.60% | 1.67% | 1.69% |
Expenses net of all reductions | 1.63% | 1.59% | 1.59% | 1.67% | 1.69% |
Net investment income (loss) | .27%J | (.11)% | .18% | (.14)% | (.19)% F |
Supplemental Data | | | | | |
Net assets, end of period
(000 omitted) | $ 91,716 | $ 100,975 | $ 107,444 | $ 57,514 | $ 55,845 |
Portfolio turnover rateE | 34% | 26% I | 29% | 27% | 22% |
A Total returns would have been lower if certain expenses had not been reduced during the applicable periods shown.
B Total returns do not include the effect of the sales charges.
C Calculated based on average shares outstanding during the period.
D Fees and expenses of any underlying Fidelity Central Funds are not included in the Fund's expense ratio. The Fund indirectly bears its proportionate share of the expenses of any underlying Fidelity Central Funds.
E Amount does not include the portfolio activity of any underlying Fidelity Central Funds.
F Investment income per share reflects a large, non-recurring dividend which amounted to $.06 per share. Excluding this non-recurring dividend, the ratio of net investment income (loss) to average net assets would have been (.57)%.
G Expense ratios reflect operating expenses of the class. Expenses before reductions do not reflect amounts reimbursed by the investment adviser or reductions from brokerage service arrangements or reductions from other expense offset arrangements and do not represent the amount paid by the class during periods when reimbursements or reductions occur. Expenses net of fee waivers reflect expenses after reimbursement by the investment adviser but prior to reductions from brokerage service arrangements or other expense offset arrangements. Expenses net of all reductions represent the net expenses paid by the class.
H Amount represents less than $.01 per share.
I Portfolio turnover rate excludes securities received or delivered in-kind.
J Investment income per share reflects a large, non-recurring dividend which amounted to $.05 per share. Excluding this non-recurring dividend, the ratio of net investment income (loss) to average net assets would have been .01%.
See accompanying notes which are an integral part of the financial statements.
Annual Report
Financial Highlights - Class B
Years ended July 31, | 2015 | 2014 | 2013 | 2012 | 2011 |
Selected Per-Share Data | | | | | |
Net asset value, beginning of period | $ 18.18 | $ 19.06 | $ 14.27 | $ 15.00 | $ 13.08 |
Income from Investment Operations | | | | | |
Net investment income (loss) C | (.06)J | (.13) | (.06) | (.09) | (.10) F |
Net realized and unrealized gain (loss) | 1.90 | 1.18 | 5.34 | .29 | 2.15 |
Total from investment operations | 1.84 | 1.05 | 5.28 | .20 | 2.05 |
Distributions from net investment income | - | - | (.02) | - | (.01) |
Distributions from net realized gain | (2.23) | (1.93) | (.47) | (.93) | (.12) |
Total distributions | (2.23) | (1.93) | (.49) | (.93) | (.13) |
Redemption fees added to paid in capitalC,H | - | - | - | - | - |
Net asset value, end of period | $ 17.79 | $ 18.18 | $ 19.06 | $ 14.27 | $ 15.00 |
Total ReturnA, B | 10.94% | 5.92% | 38.07% | 2.51% | 15.80% |
Ratios to Average Net Assets D, G | | | | | |
Expenses before reductions | 2.25% | 2.18% | 2.15% | 2.19% | 2.20% |
Expenses net of fee waivers, if any | 2.23% | 2.17% | 2.15% | 2.19% | 2.19% |
Expenses net of all reductions | 2.22% | 2.16% | 2.14% | 2.19% | 2.19% |
Net investment income (loss) | (.32)%J | (.69)% | (.37)% | (.66)% | (.69)%F |
Supplemental Data | | | | | |
Net assets, end of period (000 omitted) | $ 3,473 | $ 4,808 | $ 7,052 | $ 6,675 | $ 8,549 |
Portfolio turnover rateE | 34% | 26%I | 29% | 27% | 22% |
A Total returns would have been lower if certain expenses had not been reduced during the applicable periods shown.
B Total returns do not include the effect of the contingent deferred sales charge.
C Calculated based on average shares outstanding during the period.
D Fees and expenses of any underlying Fidelity Central Funds are not included in the Fund's expense ratio. The Fund indirectly bears its proportionate share of the expenses of any underlying Fidelity Central Funds.
E Amount does not include the portfolio activity of any underlying Fidelity Central Funds.
F Investment income per share reflects a large, non-recurring dividend which amounted to $.06 per share. Excluding this non-recurring dividend, the ratio of net investment income (loss) to average net assets would have been (1.07)%.
G Expense ratios reflect operating expenses of the class. Expenses before reductions do not reflect amounts reimbursed by the investment adviser or reductions from brokerage service arrangements or reductions from other expense offset arrangements and do not represent the amount paid by the class during periods when reimbursements or reductions occur. Expenses net of fee waivers reflect expenses after reimbursement by the investment adviser but prior to reductions from brokerage service arrangements or other expense offset arrangements. Expenses net of all reductions represent the net expenses paid by the class.
H Amount represents less than $.01 per share.
I Portfolio turnover rate excludes securities received or delivered in-kind.
J Investment income per share reflects a large, non-recurring dividend which amounted to $.05 per share. Excluding this non-recurring dividend, the ratio of net investment income (loss) to average net assets would have been (.58)%.
See accompanying notes which are an integral part of the financial statements.
Annual Report
Financial Highlights - Class C
Years ended July 31, | 2015 | 2014 | 2013 | 2012 | 2011 |
Selected Per-Share Data | | | | | |
Net asset value, beginning of period | $ 18.19 | $ 19.06 | $ 14.28 | $ 15.01 | $ 13.08 |
Income from Investment Operations | | | | | |
Net investment income (loss) C | (.04) J | (.12) | (.06) | (.09) | (.10) F |
Net realized and unrealized gain (loss) | 1.90 | 1.18 | 5.34 | .29 | 2.17 |
Total from investment operations | 1.86 | 1.06 | 5.28 | .20 | 2.07 |
Distributions from net investment income | - | - | (.03) | - | (.02) |
Distributions from net realized gain | (2.23) | (1.93) | (.47) | (.93) | (.12) |
Total distributions | (2.23) | (1.93) | (.50) | (.93) | (.14) |
Redemption fees added to paid in capital C,H | - | - | - | - | - |
Net asset value, end of period | $ 17.82 | $ 18.19 | $ 19.06 | $ 14.28 | $ 15.01 |
Total ReturnA, B | 11.05% | 5.97% | 38.00% | 2.52% | 15.91% |
Ratios to Average Net Assets D, G | | | | | |
Expenses before reductions | 2.19% | 2.12% | 2.13% | 2.19% | 2.18% |
Expenses net of fee waivers, if any | 2.16% | 2.11% | 2.13% | 2.19% | 2.18% |
Expenses net of all reductions | 2.15% | 2.10% | 2.12% | 2.19% | 2.18% |
Net investment income (loss) | (.25)% J | (.63)% | (.35)% | (.66)% | (.68)% F |
Supplemental Data | | | | | |
Net assets, end of period (000 omitted) | $ 64,928 | $ 70,541 | $ 76,018 | $ 47,265 | $ 47,457 |
Portfolio turnover rateE | 34% | 26% I | 29% | 27% | 22% |
A Total returns would have been lower if certain expenses had not been reduced during the applicable periods shown.
B Total returns do not include the effect of the contingent deferred sales charge.
C Calculated based on average shares outstanding during the period.
D Fees and expenses of any underlying Fidelity Central Funds are not included in the Fund's expense ratio. The Fund indirectly bears its proportionate share of the expenses of any underlying Fidelity Central Funds.
E Amount does not include the portfolio activity of any underlying Fidelity Central Funds.
F Investment income per share reflects a large, non-recurring dividend which amounted to $.06 per share. Excluding this non-recurring dividend, the ratio of net investment income (loss) to average net assets would have been (1.06)%.
G Expense ratios reflect operating expenses of the class. Expenses before reductions do not reflect amounts reimbursed by the investment adviser or reductions from brokerage service arrangements or reductions from other expense offset arrangements and do not represent the amount paid by the class during periods when reimbursements or reductions occur. Expenses net of fee waivers reflect expenses after reimbursement by the investment adviser but prior to reductions from brokerage service arrangements or other expense offset arrangements. Expenses net of all reductions represent the net expenses paid by the class.
H Amount represents less than $.01 per share.
I Portfolio turnover rate excludes securities received or delivered in-kind.
J Investment income per share reflects a large, non-recurring dividend which amounted to $.05 per share. Excluding this non-recurring dividend, the ratio of net investment income (loss) to average net assets would have been (.51)%.
See accompanying notes which are an integral part of the financial statements.
Annual Report
Financial Highlights - Small Cap Value
Years ended July 31, | 2015 | 2014 | 2013 | 2012 | 2011 |
Selected Per-Share Data | | | | | |
Net asset value, beginning of period | $ 19.57 | $ 20.22 | $ 15.05 | $ 15.62 | $ 13.56 |
Income from Investment Operations | | | | | |
Net investment income (loss) B | .15 I | .08 | .12 | .06 | .06E |
Net realized and unrealized gain (loss) | 2.05 | 1.26 | 5.63 | .32 | 2.23 |
Total from investment operations | 2.20 | 1.34 | 5.75 | .38 | 2.29 |
Distributions from net investment income | (.07) | (.06) | (.11) | (.02) | (.10) |
Distributions from net realized gain | (2.25) | (1.93) | (.47) | (.93) | (.13) |
Total distributions | (2.32) | (1.99) | (.58) | (.95) | (.23) |
Redemption fees added to paid in capitalB,G | - | - | - | - | - |
Net asset value, end of period | $ 19.45 | $ 19.57 | $ 20.22 | $ 15.05 | $ 15.62 |
Total ReturnA | 12.18% | 7.12% | 39.45% | 3.67% | 17.03% |
Ratios to Average Net Assets C, F | | | | | |
Expenses before reductions | 1.15% | 1.08% | 1.07% | 1.13% | 1.13% |
Expenses net of fee waivers, if any | 1.12% | 1.06% | 1.07% | 1.13% | 1.13% |
Expenses net of all reductions | 1.12% | 1.06% | 1.06% | 1.13% | 1.13% |
Net investment income (loss) | .78% I | .41% | .71% | .41% | .37%E |
Supplemental Data | | | | | |
Net assets, end of period
(000 omitted) | $ 2,036,157 | $ 2,060,546 | $ 2,672,854 | $ 1,756,962 | $ 1,899,805 |
Portfolio turnover rateD | 34% | 26%H | 29% | 27% | 22% |
A Total returns would have been lower if certain expenses had not been reduced during the applicable periods shown.
B Calculated based on average shares outstanding during the period.
C Fees and expenses of any underlying Fidelity Central Funds are not included in the Fund's expense ratio. The Fund indirectly bears its proportionate share of the expenses of any underlying Fidelity Central Funds.
D Amount does not include the portfolio activity of any underlying Fidelity Central Funds.
E Investment income per share reflects a large, non-recurring dividend which amounted to $.06 per share. Excluding this non-recurring dividend, the ratio of net investment income (loss) to average net assets would have been (.01)%.
F Expense ratios reflect operating expenses of the class. Expenses before reductions do not reflect amounts reimbursed by the investment adviser or reductions from brokerage service arrangements or reductions from other expense offset arrangements and do not represent the amount paid by the class during periods when reimbursements or reductions occur. Expenses net of fee waivers reflect expenses after reimbursement by the investment adviser but prior to reductions from brokerage service arrangements or other expense offset arrangements. Expenses net of all reductions represent the net expenses paid by the class.
G Amount represents less than $.01 per share.
H Portfolio turnover rate excludes securities received or delivered in-kind.
I Investment income per share reflects a large, non-recurring dividend which amounted to $.05 per share. Excluding this non-recurring dividend, the ratio of net investment income (loss) to average net assets would have been .53%.
See accompanying notes which are an integral part of the financial statements.
Annual Report
Financial Highlights - Class I
Years ended July 31, | 2015 | 2014 | 2013 | 2012 | 2011 |
Selected Per-Share Data | | | | | |
Net asset value, beginning of period | $ 19.57 | $ 20.23 | $ 15.05 | $ 15.63 | $ 13.58 |
Income from Investment Operations | | | | | |
Net investment income (loss) B | .15 I | .08 | .12 | .06 | .06E |
Net realized and unrealized gain (loss) | 2.05 | 1.25 | 5.65 | .31 | 2.23 |
Total from investment operations | 2.20 | 1.33 | 5.77 | .37 | 2.29 |
Distributions from net investment income | (.07) | (.06) | (.12) | (.02) | (.11) |
Distributions from net realized gain | (2.25) | (1.93) | (.47) | (.93) | (.13) |
Total distributions | (2.32) | (1.99) | (.59) | (.95) | (.24) |
Redemption fees added to paid in capital B,G | - | - | - | - | - |
Net asset value, end of period | $ 19.45 | $ 19.57 | $ 20.23 | $ 15.05 | $ 15.63 |
Total ReturnA | 12.17% | 7.08% | 39.54% | 3.59% | 17.02% |
Ratios to Average Net Assets C, F | | | | | |
Expenses before reductions | 1.15% | 1.09% | 1.07% | 1.14% | 1.10% |
Expenses net of fee waivers, if any | 1.12% | 1.07% | 1.07% | 1.14% | 1.10% |
Expenses net of all reductions | 1.12% | 1.07% | 1.06% | 1.14% | 1.10% |
Net investment income (loss) | .79%I | .40% | .70% | .39% | .39%E |
Supplemental Data | | | | | |
Net assets, end of period
(000 omitted) | $ 376,817 | $ 342,500 | $ 359,582 | $ 138,981 | $ 101,565 |
Portfolio turnover rateD | 34% | 26% H | 29% | 27% | 22% |
A Total returns would have been lower if certain expenses had not been reduced during the applicable periods shown.
B Calculated based on average shares outstanding during the period.
C Fees and expenses of any underlying Fidelity Central Funds are not included in the Fund's expense ratio. The Fund indirectly bears its proportionate share of the expenses of any underlying Fidelity Central Funds.
D Amount does not include the portfolio activity of any underlying Fidelity Central Funds.
E Investment income per share reflects a large, non-recurring dividend which amounted to $.06 per share. Excluding this non-recurring dividend, the ratio of net investment income (loss) to average net assets would have been .01%.
F Expense ratios reflect operating expenses of the class. Expenses before reductions do not reflect amounts reimbursed by the investment adviser or reductions from brokerage service arrangements or reductions from other expense offset arrangements and do not represent the amount paid by the class during periods when reimbursements or reductions occur. Expenses net of fee waivers reflect expenses after reimbursement by the investment adviser but prior to reductions from brokerage service arrangements or other expense offset arrangements. Expenses net of all reductions represent the net expenses paid by the class.
G Amount represents less than $.01 per share.
H Portfolio turnover rate excludes securities received or delivered in-kind.
I Investment income per share reflects a large, non-recurring dividend which amounted to $.05 per share. Excluding this non-recurring dividend, the ratio of net investment income (loss) to average net assets would have been .53%.
See accompanying notes which are an integral part of the financial statements.
Annual Report
For the period ended July 31, 2015
1. Organization.
Fidelity® Small Cap Value Fund (the Fund) is a fund of Fidelity Securities Fund (the Trust) and is authorized to issue an unlimited number of shares. The Trust is registered under the Investment Company Act of 1940, as amended (the 1940 Act), as an open-end management investment company organized as a Massachusetts business trust. The Fund offers Class A, Class T, Class C, Small Cap Value and Class I (formerly Institutional Class) shares, each of which, along with Class B shares, has equal rights as to assets and voting privileges. Class B shares are closed to new accounts and additional purchases, except for exchanges and reinvestments. The Fund's other share classes are also closed to new accounts with certain exceptions. The Fund offered Class F shares during the period June 26, 2009 through November 19, 2013 and all outstanding shares were redeemed by November 19, 2013. Each class has exclusive voting rights with respect to matters that affect that class. Class B shares will automatically convert to Class A shares after a holding period of seven years from the initial date of purchase.
2. Investments in Fidelity Central Funds.
The Fund invests in Fidelity Central Funds, which are open-end investment companies generally available only to other investment companies and accounts managed by the investment adviser and its affiliates. The Fund's Schedule of Investments lists each of the Fidelity Central Funds held as of period end, if any, as an investment of the Fund, but does not include the underlying holdings of each Fidelity Central Fund. As an Investing Fund, the Fund indirectly bears its proportionate share of the expenses of the underlying Fidelity Central Funds.
The Money Market Central Funds seek preservation of capital and current income and are managed by Fidelity Investments Money Management, Inc. (FIMM), an affiliate of the investment adviser. Annualized expenses of the Money Market Central Funds as of their most recent shareholder report date are less than .01%.
A complete unaudited list of holdings for each Fidelity Central Fund is available upon request or at the Securities and Exchange Commission (the SEC) website at www.sec.gov. In addition, the financial statements of the Fidelity Central Funds, which are not covered by the Fund's Report of Independent Registered Public Accounting Firm, are available on the SEC website or upon request.
Annual Report
3. Significant Accounting Policies.
The financial statements have been prepared in conformity with accounting principles generally accepted in the United States of America (GAAP), which require management to make certain estimates and assumptions at the date of the financial statements. Actual results could differ from those estimates. Subsequent events, if any, through the date that the financial statements were issued have been evaluated in the preparation of the financial statements. The following summarizes the significant accounting policies of the Fund:
Investment Valuation. Investments are valued as of 4:00 p.m. Eastern time on the last calendar day of the period. The Board of Trustees (the Board) has delegated the day to day responsibility for the valuation of the Fund's investments to the Fidelity Management & Research Company (FMR) Fair Value Committee (the Committee). In accordance with valuation policies and procedures approved by the Board, the Fund attempts to obtain prices from one or more third party pricing vendors or brokers to value its investments. When current market prices, quotations or currency exchange rates are not readily available or reliable, investments will be fair valued in good faith by the Committee, in accordance with procedures adopted by the Board. Factors used in determining fair value vary by investment type and may include market or investment specific events. The frequency with which these procedures are used cannot be predicted and they may be utilized to a significant extent. The Committee oversees the Fund's valuation policies and procedures and reports to the Board on the Committee's activities and fair value determinations. The Board monitors the appropriateness of the procedures used in valuing the Fund's investments and ratifies the fair value determinations of the Committee.
The Fund categorizes the inputs to valuation techniques used to value its investments into a disclosure hierarchy consisting of three levels as shown below:
Level 1 - quoted prices in active markets for identical investments
Level 2 - other significant observable inputs (including quoted prices for similar investments, interest rates, prepayment speeds, etc.)
Level 3 - unobservable inputs (including the Fund's own assumptions based on the best information available)
Annual Report
Notes to Financial Statements - continued
3. Significant Accounting Policies - continued
Investment Valuation - continued
Valuation techniques used to value the Fund's investments by major category are as follows:
Equity securities, including restricted securities, for which market quotations are readily available, are valued at the last reported sale price or official closing price as reported by a third party pricing vendor on the primary market or exchange on which they are traded and are categorized as Level 1 in the hierarchy. In the event there were no sales during the day or closing prices are not available, securities are valued at the last quoted bid price or may be valued using the last available price and are generally categorized as Level 2 in the hierarchy. For foreign equity securities, when market or security specific events arise, comparisons to the valuation of American Depositary Receipts (ADRs), futures contracts, Exchange-Traded Funds (ETFs) and certain indexes as well as quoted prices for similar securities may be used and would be categorized as Level 2 in the hierarchy. Utilizing these techniques may result in transfers between Level 1 and Level 2. For equity securities, including restricted securities, where observable inputs are limited, assumptions about market activity and risk are used and these securities may be categorized as Level 3 in the hierarchy.
Investments in open-end mutual funds, including the Fidelity Central Funds, are valued at their closing net asset value (NAV) each business day and are categorized as Level 1 in the hierarchy.
Changes in valuation techniques may result in transfers in or out of an assigned level within the disclosure hierarchy.
Foreign Currency. The Fund may use foreign currency contracts to facilitate transactions in foreign-denominated securities. Gains and losses from these transactions may arise from changes in the value of the foreign currency or if the counterparties do not perform under the contracts' terms.
Foreign-denominated assets, including investment securities, and liabilities are translated into U.S. dollars at the exchange rates at period end. Purchases and sales of investment securities, income and dividends received and expenses denominated in foreign currencies are translated into U.S. dollars at the exchange rate in effect on the transaction date.
The effects of exchange rate fluctuations on investments are included with the net realized and unrealized gain (loss) on investment securities. Other foreign currency transactions resulting in realized and unrealized gain (loss) are disclosed separately.
Annual Report
3. Significant Accounting Policies - continued
Investment Transactions and Income. For financial reporting purposes, the Fund's investment holdings and NAV include trades executed through the end of the last business day of the period. The NAV per share for processing shareholder transactions is calculated as of the close of business of the New York Stock Exchange (NYSE), normally 4:00 p.m. Eastern time and includes trades executed through the end of the prior business day. Gains and losses on securities sold are determined on the basis of identified cost and may include proceeds received from litigation. Dividend income is recorded on the ex-dividend date, except for certain dividends from foreign securities where the ex-dividend date may have passed, which are recorded as soon as the Fund is informed of the ex-dividend date. Non-cash dividends included in dividend income, if any, are recorded at the fair market value of the securities received. Income and capital gain distributions from Fidelity Central Funds, if any, are recorded on the ex-dividend date. Distributions received on securities that represent a return of capital or capital gain are recorded as a reduction of cost of investments and/or as a realized gain. Subsequent to ex-dividend date the Fund determines the components of these distributions, based upon receipt of tax filings or other correspondence relating to the underlying investment. Large, non-recurring dividends recognized by the Fund are presented separately on the Statement of Operations as "Special Dividends" and the impact of these dividends is presented in the Financial Highlights. Interest income is accrued as earned and includes coupon interest and amortization of premium and accretion of discount on debt securities as applicable. Investment income is recorded net of foreign taxes withheld where recovery of such taxes is uncertain.
Class Allocations and Expenses. Investment income, realized and unrealized capital gains and losses, common expenses of the Fund, and certain fund-level expense reductions, if any, are allocated daily on a pro-rata basis to each class based on the relative net assets of each class to the total net assets of the Fund. Each class differs with respect to transfer agent and distribution and service plan fees incurred. Certain expense reductions may also differ by class. For the reporting period, the allocated portion of income and expenses to each class as a percent of its average net assets may vary due to the timing of recording these transactions in relation to fluctuating net assets of the classes. Expenses directly attributable to a fund are charged to that fund. Expenses attributable to more than one fund are allocated among the respective funds on the basis of relative net assets or other appropriate methods. Expense estimates are accrued in the period to which they relate and adjustments are made when actual amounts are known.
Income Tax Information and Distributions to Shareholders. Each year, the Fund intends to qualify as a regulated investment company under Subchapter M of the Internal Revenue Code, including distributing substantially all of its taxable income and realized gains. As a result, no provision for U.S. Federal income taxes is required. As of July 31, 2015, the Fund did not have any unrecognized tax benefits in the financial
Annual Report
Notes to Financial Statements - continued
3. Significant Accounting Policies - continued
Income Tax Information and Distributions to Shareholders - continued
statements; nor is the Fund aware of any tax positions for which it is reasonably possible that the total amounts of unrecognized tax benefits will significantly change in the next twelve months. The Fund files a U.S. federal tax return, in addition to state and local tax returns as required. The Fund's federal income tax returns are subject to examination by the Internal Revenue Service (IRS) for a period of three fiscal years after they are filed. State and local tax returns may be subject to examination for an additional fiscal year depending on the jurisdiction. Foreign taxes are provided for based on the Fund's understanding of the tax rules and rates that exist in the foreign markets in which it invests.
Distributions are declared and recorded on the ex-dividend date. Income dividends and capital gain distributions are declared separately for each class. Income and capital gain distributions are determined in accordance with income tax regulations, which may differ from GAAP. In addition, the Fund claimed a portion of the payment made to redeeming shareholders as a distribution for income tax purposes.
Capital accounts within the financial statements are adjusted for permanent book-tax differences. These adjustments have no impact on net assets or the results of operations. Capital accounts are not adjusted for temporary book-tax differences which will reverse in a subsequent period.
Book-tax differences are primarily due to foreign currency transactions, passive foreign investment companies (PFIC) and losses deferred due to wash sales.
The federal tax cost of investment securities and unrealized appreciation (depreciation) as of period end were as follows:
Gross unrealized appreciation | $ 614,205,042 |
Gross unrealized depreciation | (96,595,356) |
Net unrealized appreciation (depreciation) on securities | $ 517,609,686 |
| |
Tax cost | $ 2,364,093,848 |
The tax-based components of distributable earnings as of period end were as follows:
Undistributed ordinary income | $ 15,098,490 |
Undistributed long-term capital gain | $ 223,448,456 |
Net unrealized appreciation (depreciation) on securities and other investments | $ 517,609,686 |
Annual Report
3. Significant Accounting Policies - continued
Income Tax Information and Distributions to Shareholders - continued
The tax character of distributions paid was as follows:
| July 31, 2015 | July 31, 2014 |
Ordinary Income | $ 12,432,052 | $ 10,662,065 |
Long-term Capital Gains | 319,195,013 | 362,625,476 |
Total | $ 331,627,065 | $ 373,287,541 |
Short-Term Trading (Redemption) Fees. Shares held by investors in the Fund less than 90 days may have been subject to a redemption fee equal to 1.50% of the NAV of shares redeemed. All redemption fees, which reduce the proceeds of the shareholder redemption, are retained by the Fund and accounted for as an addition to paid in capital.
4. Purchases and Sales of Investments.
Purchases and sales of securities, other than short-term securities, aggregated $962,585,438 and $1,295,483,282, respectively.
5. Fees and Other Transactions with Affiliates.
Management Fee. Fidelity Management & Research Company (the investment adviser) and its affiliates provide the Fund with investment management related services for which the Fund pays a monthly management fee. The management fee is the sum of an individual fund fee rate that is based on an annual rate of .45% of the Fund's average net assets and an annualized group fee rate that averaged .25% during the period. The group fee rate is based upon the average net assets of all the mutual funds advised by the investment adviser, including any mutual funds previously advised by the investment adviser that are currently advised by Fidelity SelectCo, LLC, an affiliate of the investment adviser. The group fee rate decreases as assets under management increase and increases as assets under management decrease. In addition, the management fee is subject to a performance adjustment (up to a maximum of ± .20% of the Fund's average net assets over a 36 month performance period). The upward or downward adjustment to the management fee is based on the relative investment performance of Small Cap Value as compared to its benchmark index, the Russell 2000 Value Index, over the same 36 month performance period. For the reporting period, the total annual management fee rate, including the performance adjustment, was .91% of the Fund's average net assets. The performance adjustment included in the management fee rate may be higher or lower than the maximum performance adjustment rate due to the difference between the average net assets for the reporting and performance periods.
During the period, the investment adviser waived a portion of its management fee as described in the Expense Reductions note.
Annual Report
Notes to Financial Statements - continued
5. Fees and Other Transactions with Affiliates - continued
Distribution and Service Plan Fees. In accordance with Rule 12b-1 of the 1940 Act, the Fund has adopted separate Distribution and Service Plans for each class of shares. Certain classes pay Fidelity Distributors Corporation (FDC), an affiliate of the investment adviser, separate Distribution and Service Fees, each of which is based on an annual percentage of each class' average net assets. In addition, FDC may pay financial intermediaries for selling shares of the Fund and providing shareholder support services. For the period, the Distribution and Service Fee rates, total fees and amounts retained by FDC were as follows:
| Distribution
Fee | Service
Fee | Total Fees | Retained
by FDC |
Class A | -% | .25% | $ 615,096 | $ 2,763 |
Class T | .25% | .25% | 487,452 | 894 |
Class B | .75% | .25% | 41,583 | 31,187 |
Class C | .75% | .25% | 674,689 | 13,458 |
| | | $ 1,818,820 | $ 48,302 |
Sales Load. FDC may receive a front-end sales charge of up to 5.75% for selling Class A shares and 3.50% for selling Class T shares, some of which is paid to financial intermediaries for selling shares of the Fund. Depending on the holding period, FDC may receive contingent deferred sales charges levied on Class A, Class T, Class B, and Class C redemptions. The deferred sales charges range from 5.00% to 1.00% for Class B shares, 1.00% for Class C shares, 1.00% for certain purchases of Class A shares and .25% for certain purchases of Class T shares.
For the period, sales charge amounts retained by FDC were as follows:
| Retained
by FDC |
Class A | $ 7,832 |
Class T | 3,175 |
Class B* | 2,039 |
Class C* | 847 |
| $ 13,893 |
* When Class B and Class C shares are initially sold, FDC pays commissions from its own resources to financial intermediaries through which the sales are made.
Annual Report
5. Fees and Other Transactions with Affiliates - continued
Transfer Agent Fees. Fidelity Investments Institutional Operations Company, Inc., (FIIOC), an affiliate of the investment adviser, is the transfer, dividend disbursing and shareholder servicing agent for each class of the Fund. FIIOC receives account fees and asset-based fees that vary according to the account size and type of account of the shareholders of the respective classes of the Fund. FIIOC pays for typesetting, printing and mailing of shareholder reports, except proxy statements.
For the period, transfer agent fees for each class were as follows:
| Amount | % of
Class-Level Average
Net Assets |
Class A | $ 534,282 | .22 |
Class T | 207,942 | .21 |
Class B | 12,447 | .30 |
Class C | 157,218 | .23 |
Small Cap Value | 4,104,906 | .20 |
Class I | 719,181 | .20 |
| $ 5,735,976 | |
Accounting and Security Lending Fees. Fidelity Service Company, Inc. (FSC), an affiliate of the investment adviser, maintains the Fund's accounting records. The accounting fee is based on the level of average net assets for each month. Under a separate contract, FSC administers the security lending program. The security lending fee is based on the number and duration of lending transactions.
Brokerage Commissions. The Fund placed a portion of its portfolio transactions with brokerage firms which are affiliates of the investment adviser. Brokerage commissions are included in net realized gain (loss) and change in net unrealized appreciation (depreciation) in the Statement of Operations. The commissions paid to these affiliated firms were $24,207 for the period.
Interfund Lending Program. Pursuant to an Exemptive Order issued by the SEC, the Fund, along with other registered investment companies having management contracts with FMR or other affiliated entities of FMR, may participate in an interfund lending program. This program provides an alternative credit facility allowing the funds to borrow from, or lend money to, other participating affiliated funds. At period end there were no interfund loans outstanding. The Fund's activity in this program during the period for which loans were outstanding was as follows:
Borrower or Lender | Average Loan
Balance | Weighted Average Interest Rate | Interest Expense |
Borrower | $ 14,895,000 | .33% | $ 136 |
Annual Report
Notes to Financial Statements - continued
6. Committed Line of Credit.
The Fund participates with other funds managed by the investment adviser or an affiliate in a $4.25 billion credit facility (the "line of credit") to be utilized for temporary or emergency purposes to fund shareholder redemptions or for other short-term liquidity purposes. The Fund has agreed to pay commitment fees on its pro-rata portion of the line of credit, which amounted to $4,108 and is reflected in Miscellaneous expenses on the Statement of Operations. During the period, the Fund did not borrow on this line of credit.
7. Security Lending.
The Fund lends portfolio securities through a lending agent from time to time in order to earn additional income. For equity securities, a lending agent is used and may loan securities to certain qualified borrowers, including Fidelity Capital Markets (FCM), a broker-dealer affiliated with the Fund. On the settlement date of the loan, the Fund receives collateral (in the form of U.S. Treasury obligations, letters of credit and/or cash) against the loaned securities and maintains collateral in an amount not less than 100% of the market value of the loaned securities during the period of the loan. The market value of the loaned securities is determined at the close of business of the Fund and any additional required collateral is delivered to the Fund on the next business day. If the borrower defaults on its obligation to return the securities loaned because of insolvency or other reasons, the Fund may apply collateral received from the borrower against the obligation. The Fund may experience delays and costs in recovering the securities loaned. Any cash collateral received is invested in the Fidelity Securities Lending Cash Central Fund. The value of loaned securities and cash collateral at period end are disclosed on the Fund's Statement of Assets and Liabilities. Security lending income represents the income earned on investing cash collateral, less rebates paid to borrowers and any lending agent fees associated with the loan, plus any premium payments received for lending certain types of securities. Security lending income is presented in the Statement of Operations as a component of income from Fidelity Central Funds, and includes $9,303 from securities loaned to FCM. Total security lending income during the period amounted to $2,526,958.
8. Expense Reductions.
The investment adviser contractually agreed to waive a portion of the Fund's management fee until May 31, 2015. During the period, this waiver reduced the Fund's management fee by $673,000. Effective June 1, 2015 the waiver was discontinued.
Annual Report
8. Expense Reductions - continued
Commissions paid to certain brokers with whom the investment adviser, or its affiliates, places trades on behalf of the Fund include an amount in addition to trade execution, which may be rebated back to the Fund to offset certain expenses. This amount totaled $131,172 for the period.
In addition, during the period the investment adviser reimbursed/waived a portion of fund-level operating expenses in the amount of $11,488 and a portion of class-level operating expenses as follows:
| Amount |
Class A | $ 5,981 |
Class T | 2,343 |
Class B | 9 |
Class C | 1,654 |
Small Cap Value | 55,260 |
Class I | 8,138 |
| $ 73,385 |
9. Distributions to Shareholders.
Distributions to shareholders of each class were as follows:
Years ended July 31, | 2015 | 2014 A |
From net investment income | | |
Class A | $ 207,059 | $ 171,608 |
Small Cap Value | 7,655,420 | 7,284,772 |
Class F | - | 2,011,606 |
Class I | 1,284,414 | 1,194,079 |
Total | $ 9,146,893 | $ 10,662,065 |
From net realized gain | | |
Class A | $ 29,002,450 | $ 26,941,211 |
Class T | 11,758,984 | 10,672,388 |
Class B | 573,044 | 695,128 |
Class C | 8,461,258 | 7,761,033 |
Small Cap Value | 233,242,234 | 236,012,007 |
Class F | - | 44,973,770 |
Class I | 39,442,202 | 35,569,940 |
Total | $ 322,480,172 | $ 362,625,477 |
A All Class F Shares were redeemed on November 19, 2013.
Annual Report
Notes to Financial Statements - continued
10. Share Transactions.
Share transactions for each class were as follows and may contain automatic conversions between classes or exchanges between funds:
| Shares | Dollars |
Years ended July 31, | 2015 | 2014 A | 2015 | 2014 A |
Class A | | | | |
Shares sold | 1,619,679 | 2,364,232 | $ 30,035,137 | $ 46,165,166 |
Reinvestment of distributions | 1,578,405 | 1,371,738 | 28,466,035 | 25,837,208 |
Shares redeemed | (4,261,712) | (4,138,116) | (79,564,907) | (80,966,690) |
Net increase (decrease) | (1,063,628) | (402,146) | $ (21,063,735) | $ (8,964,316) |
Class T | | | | |
Shares sold | 599,331 | 987,146 | $ 10,911,777 | $ 19,000,773 |
Reinvestment of distributions | 655,613 | 566,918 | 11,618,861 | 10,525,159 |
Shares redeemed | (1,691,524) | (1,685,516) | (30,859,052) | (32,399,109) |
Net increase (decrease) | (436,580) | (131,452) | $ (8,328,414) | $ (2,873,177) |
Class B | | | | |
Shares sold | 5,056 | 9,527 | $ 89,676 | $ 174,532 |
Reinvestment of distributions | 31,870 | 33,965 | 537,830 | 607,035 |
Shares redeemed | (106,178) | (149,029) | (1,834,363) | (2,755,578) |
Net increase (decrease) | (69,252) | (105,537) | $ (1,206,857) | $ (1,974,011) |
Class C | | | | |
Shares sold | 167,565 | 268,818 | $ 2,897,201 | $ 4,960,750 |
Reinvestment of distributions | 447,025 | 378,946 | 7,553,140 | 6,778,684 |
Shares redeemed | (847,704) | (758,615) | (14,671,382) | (14,057,302) |
Net increase (decrease) | (233,114) | (110,851) | $ (4,221,041) | $ (2,317,868) |
Small Cap Value | | | | |
Shares sold | 13,163,441 | 19,542,379 | $ 248,872,334 | $ 386,966,432 |
Reinvestment of distributions | 12,098,173 | 11,711,859 | 221,448,638 | 222,752,806 |
Shares redeemed | (25,848,809) | (58,131,122)B | (487,056,437) | (1,153,341,425)B |
Net increase (decrease) | (587,195) | (26,876,884) | $ (16,735,465) | $ (543,622,187) |
Class F | | | | |
Shares sold | - | 879,716 | $ - | $ 17,395,091 |
Reinvestment of distributions | - | 2,497,893 | - | 46,985,376 |
Shares redeemed | - | (39,476,567)B | - | (787,183,278)B |
Net increase (decrease) | - | (36,098,958) | $ - | $ (722,802,811) |
Annual Report
10. Share Transactions - continued
| Shares | Dollars |
Years ended July 31, | 2015 | 2014 A | 2015 | 2014 A |
Class I | | | | |
Shares sold | 4,194,067 | 4,292,555 | $ 79,803,869 | $ 84,987,281 |
Reinvestment of distributions | 1,996,970 | 1,739,424 | 36,554,847 | 33,193,654 |
Shares redeemed | (4,316,971) | (6,306,791) | (81,701,452) | (125,274,359) |
Net increase (decrease) | 1,874,066 | (274,812) | $ 34,657,264 | $ (7,093,424) |
A All Class F Shares were redeemed on November 19, 2013.
B Amount includes in-kind redemptions.
11. Other.
The Fund's organizational documents provide former and current trustees and officers with a limited indemnification against liabilities arising in connection with the performance of their duties to the Fund. In the normal course of business, the Fund may also enter into contracts that provide general indemnifications. The Fund's maximum exposure under these arrangements is unknown as this would be dependent on future claims that may be made against the Fund. The risk of material loss from such claims is considered remote.
Annual Report
To the Trustees of Fidelity Securities Fund and the Shareholders of Fidelity Small Cap Value Fund:
In our opinion, the accompanying statement of assets and liabilities, including the schedule of investments, and the related statements of operations and of changes in net assets and the financial highlights present fairly, in all material respects, the financial position of Fidelity Small Cap Value Fund (a fund of Fidelity Securities Fund) at July 31, 2015, the results of its operations for the year then ended, the changes in its net assets for each of the two years in the period then ended and the financial highlights for each of the five years in the period then ended, in conformity with accounting principles generally accepted in the United States of America. These financial statements and financial highlights (hereafter referred to as "financial statements") are the responsibility of the Fidelity Small Cap Value Fund's management. Our responsibility is to express an opinion on these financial statements based on our audits. We conducted our audits of these financial statements in accordance with the standards of the Public Company Accounting Oversight Board (United States). Those standards require that we plan and perform the audit to obtain reasonable assurance about whether the financial statements are free of material misstatement. An audit includes examining, on a test basis, evidence supporting the amounts and disclosures in the financial statements, assessing the accounting principles used and significant estimates made by management, and evaluating the overall financial statement presentation. We believe that our audits, which included confirmation of securities at July 31, 2015 by correspondence with the custodian and brokers, provide a reasonable basis for our opinion.
PricewaterhouseCoopers LLP
Boston, Massachusetts
September 21, 2015
Annual Report
The Trustees, Member of the Advisory Board, and officers of the trust and fund, as applicable, are listed below. The Board of Trustees governs the fund and is responsible for protecting the interests of shareholders. The Trustees are experienced executives who meet periodically throughout the year to oversee the fund's activities, review contractual arrangements with companies that provide services to the fund, oversee management of the risks associated with such activities and contractual arrangements, and review the fund's performance. Each of the Trustees oversees 170 funds.
The Trustees hold office without limit in time except that (a) any Trustee may resign; (b) any Trustee may be removed by written instrument, signed by at least two-thirds of the number of Trustees prior to such removal; (c) any Trustee who requests to be retired or who has become incapacitated by illness or injury may be retired by written instrument signed by a majority of the other Trustees; and (d) any Trustee may be removed at any special meeting of shareholders by a two-thirds vote of the outstanding voting securities of the trust. Each Trustee who is not an interested person (as defined in the 1940 Act) of the trust and the fund (Independent Trustee), shall retire not later than the last day of the calendar year in which his or her 75th birthday occurs. The Independent Trustees may waive this mandatory retirement age policy with respect to individual Trustees. The officers and Advisory Board Member hold office without limit in time, except that any officer and Advisory Board Member may resign or may be removed by a vote of a majority of the Trustees at any regular meeting or any special meeting of the Trustees. Except as indicated, each individual has held the office shown or other offices in the same company for the past five years.
Experience, Skills, Attributes, and Qualifications of the Fund's Trustees. The Governance and Nominating Committee has adopted a statement of policy that describes the experience, qualifications, attributes, and skills that are necessary and desirable for potential Independent Trustee candidates (Statement of Policy). The Board believes that each Trustee satisfied at the time he or she was initially elected or appointed a Trustee, and continues to satisfy, the standards contemplated by the Statement of Policy. The Governance and Nominating Committee also engages professional search firms to help identify potential Independent Trustee candidates who have the experience, qualifications, attributes, and skills consistent with the Statement of Policy. From time to time, additional criteria based on the composition and skills of the current Independent Trustees, as well as experience or skills that may be appropriate in light of future changes to board composition, business conditions, and regulatory or other developments, have also been considered by the professional search firms and the Governance and Nominating Committee. In addition, the Board takes into account the Trustees' commitment and participation in Board and committee meetings, as well as their leadership of standing and ad hoc committees throughout their tenure.
In determining that a particular Trustee was and continues to be qualified to serve as a Trustee, the Board has considered a variety of criteria, none of which, in isolation, was controlling. The Board believes that, collectively, the Trustees have balanced and diverse experience, qualifications, attributes, and skills, which allow the Board to operate effectively in governing the fund and protecting the interests of shareholders. Information about the specific experience, skills, attributes, and qualifications of each Trustee, which in each case led to the Board's conclusion that the Trustee should serve (or continue to serve) as a trustee of the fund, is provided below.
Annual Report
Trustees and Officers - continued
Board Structure and Oversight Function. James C. Curvey is an interested person (as defined in the 1940 Act) and currently serves as Chairman. The Trustees have determined that an interested Chairman is appropriate and benefits shareholders because an interested Chairman has a personal and professional stake in the quality and continuity of services provided to the fund. Independent Trustees exercise their informed business judgment to appoint an individual of their choosing to serve as Chairman, regardless of whether the Trustee happens to be independent or a member of management. The Independent Trustees have determined that they can act independently and effectively without having an Independent Trustee serve as Chairman and that a key structural component for assuring that they are in a position to do so is for the Independent Trustees to constitute a substantial majority for the Board. The Independent Trustees also regularly meet in executive session. Ned C. Lautenbach serves as Chairman of the Independent Trustees and as such (i) acts as a liaison between the Independent Trustees and management with respect to matters important to the Independent Trustees and (ii) with management prepares agendas for Board meetings.
Fidelity funds are overseen by different Boards of Trustees. The funds' Board oversees Fidelity's high income and certain equity funds and other Boards oversee Fidelity's investment-grade bond, money market, asset allocation, and sector funds. The asset allocation funds may invest in Fidelity funds overseen by the funds' Board. The use of separate Boards, each with its own committee structure, allows the Trustees of each group of Fidelity funds to focus on the unique issues of the funds they oversee, including common research, investment, and operational issues. On occasion, the separate Boards establish joint committees to address issues of overlapping consequences for the Fidelity funds overseen by each Board.
The Trustees operate using a system of committees to facilitate the timely and efficient consideration of all matters of importance to the Trustees, the fund, and fund shareholders and to facilitate compliance with legal and regulatory requirements and oversight of the fund's activities and associated risks. The Board, acting through its committees, has charged FMR and its affiliates with (i) identifying events or circumstances the occurrence of which could have demonstrably adverse effects on the fund's business and/or reputation; (ii) implementing processes and controls to lessen the possibility that such events or circumstances occur or to mitigate the effects of such events or circumstances if they do occur; and (iii) creating and maintaining a system designed to evaluate continuously business and market conditions in order to facilitate the identification and implementation processes described in (i) and (ii) above. Because the day-to-day operations and activities of the fund are carried out by or through FMR, its affiliates and other service providers, the fund's exposure to risks is mitigated but not eliminated by the processes overseen by the Trustees. While each of the Board's committees has responsibility for overseeing different aspects of the fund's activities, oversight is exercised primarily through the Operations, Audit, and Compliance Committees. In addition, the Independent Trustees have worked with FMR to enhance the Board's oversight of investment and financial risks, legal and regulatory risks, technology risks, and operational risks, including the development of additional risk reporting to the Board. For example, a working group comprised of Independent Trustees and FMR has worked and continues to work to review the Fidelity fund's valuation-related activities, reporting and risk management. Appropriate personnel, including but not limited to the fund's Chief Compliance Officer (CCO), FMR's internal auditor, the independent accountants, the fund's Treasurer and portfolio management personnel, make periodic reports to the Board's committees, as appropriate, including an annual review of FMR's risk management program for the Fidelity funds. The responsibilities of each standing committee, including their oversight responsibilities, are described further under "Standing Committees of the Fund's Trustees."
Annual Report
The fund's Statement of Additional Information (SAI) includes more information about the Trustees. To request a free copy, call Fidelity at 1-800-544-8544.
Interested Trustees*:
Correspondence intended for each Trustee who is an interested person may be sent to Fidelity Investments, 245 Summer Street, Boston, Massachusetts 02210.
Name, Year of Birth; Principal Occupations and Other Relevant Experience+ |
James C. Curvey (1935) |
Year of Election or Appointment: 2007 Trustee Chairman of the Board of Trustees |
| Mr. Curvey also serves as Trustee of other Fidelity funds. Mr. Curvey is a Director of Fidelity Research & Analysis Co. (investment adviser firm, 2009-present), and Vice Chairman (2007-present) and Director of FMR LLC (diversified financial services company). In addition, Mr. Curvey serves as an Overseer for the Boston Symphony Orchestra and a member of the board of Artis-Naples, Naples, Florida, and as a Trustee for Brewster Academy, Wolfeboro, New Hampshire. Previously, Mr. Curvey served as a Director of Fidelity Investments Money Management, Inc. (investment adviser firm, 2009-2014), a Director of FMR (investment adviser firm, 2007-2014), and a Director of FMR Co., Inc. (investment adviser firm, 2007-2014). |
Charles S. Morrison (1960) |
Year of Election or Appointment: 2014 Trustee |
| Mr. Morrison also serves as Trustee of other funds. He serves as a Director of Fidelity Investments Money Management, Inc. (FIMM) (investment adviser firm, 2014-present), Director of Fidelity SelectCo, LLC (investment adviser firm, 2014-present), President, Asset Management (2014-present), and is an employee of Fidelity Investments. Previously, Mr. Morrison served as Vice President of Fidelity's Fixed Income and Asset Allocation Funds (2012-2014), President, Fixed Income (2011-2014), Vice President of Fidelity's Money Market Funds (2005-2009), President, Money Market Group Leader of FMR (investment adviser firm, 2009), and Senior Vice President, Money Market Group of FMR (2004-2009). Mr. Morrison also served as Vice President of Fidelity's Bond Funds (2002-2005), certain Balanced Funds (2002-2005), and certain Asset Allocation Funds (2002-2007), and as Senior Vice President (2002-2005) of Fidelity's Bond Division. |
* Trustees have been determined to be "Interested Trustees" by virtue of, among other things, their affiliation with the trust or various entities under common control with FMR.
+ The information above includes each Trustee's principal occupation during the last five years and other information relating to the experience, attributes, and skills relevant to each Trustee's qualifications to serve as a Trustee, which led to the conclusion that each Trustee should serve as a Trustee for the fund.
Annual Report
Independent Trustees:
Correspondence intended for each Independent Trustee (that is, the Trustees other than the Interested Trustees) may be sent to Fidelity Investments, P.O. Box 55235, Boston, Massachusetts 02205-5235.
Name, Year of Birth; Principal Occupations and Other Relevant Experience+ |
Dennis J. Dirks (1948) |
Year of Election or Appointment: 2005 Trustee |
| Mr. Dirks also serves as Trustee of other Fidelity funds. Prior to his retirement in May 2003, Mr. Dirks was Chief Operating Officer and a member of the Board of The Depository Trust & Clearing Corporation (DTCC). He also served as President, Chief Operating Officer, and Board member of The Depository Trust Company (DTC) and President and Board member of the National Securities Clearing Corporation (NSCC). In addition, Mr. Dirks served as Chief Executive Officer and Board member of the Government Securities Clearing Corporation, Chief Executive Officer and Board member of the Mortgage-Backed Securities Clearing Corporation, as a Trustee and a member of the Finance Committee of Manhattan College (2005-2008), and as a Trustee and a member of the Finance Committee of AHRC of Nassau County (2006-2008). Mr. Dirks is a member of the Independent Directors Council (IDC) Governing Council (2010-present) and Board of Directors for The Brookville Center for Children's Services, Inc. (2009-present). |
Alan J. Lacy (1953) |
Year of Election or Appointment: 2008 Trustee |
| Mr. Lacy also serves as Trustee of other Fidelity funds. Mr. Lacy serves as a member of the Board of Directors of Dave & Buster's Entertainment, Inc. (restaurant and entertainment complexes, 2010-present) and Bristol-Myers Squibb Company (global pharmaceuticals, 2008-present). In addition, Mr. Lacy served as Senior Adviser (2007-2014) of Oak Hill Capital Partners, L.P. (private equity) and also served as Chief Executive Officer (2000-2005) and Vice Chairman (2005-2006) of Sears Holdings Corporation and Sears, Roebuck and Co. (retail). Mr. Lacy is a member of the Board of Trustees of The National Parks Conservation Association (2006-present). Previously, Mr. Lacy served as Chairman of the Board of Trustees of the National Parks Conservation Association (2008-2011) and as a member of the Board of Directors for The Western Union Company (global money transfer, 2006-2011), The Hillman Companies, Inc. (hardware wholesalers, 2010-2014), and Earth Fare, Inc. (retail grocery, 2010-2014). |
Ned C. Lautenbach (1944) |
Year of Election or Appointment: 2000 Trustee Chairman of the Independent Trustees |
| Mr. Lautenbach also serves as Trustee of other Fidelity funds. Mr. Lautenbach currently serves as the Lead Director of the Eaton Corporation Board of Directors (diversified industrial, 1997-present). Mr. Lautenbach is Chairman of the Board of Directors of Artis-Naples in Naples, Florida (2012-present), a member of the Council on Foreign Relations (1994-present), and a member of the Board of Governors, State University System of Florida (2013-present). Previously, Mr. Lautenbach was a Partner/Advisory Partner at Clayton, Dubilier & Rice, LLC (private equity investment, 1998-2010), as well as a Director of Sony Corporation (2006-2007). |
Joseph Mauriello (1944) |
Year of Election or Appointment: 2008 Trustee |
| Mr. Mauriello also serves as Trustee of other Fidelity funds. Prior to his retirement in January 2006, Mr. Mauriello served in numerous senior management positions including Deputy Chairman and Chief Operating Officer (2004-2005), and Vice Chairman of Financial Services (2002-2004) of KPMG LLP US (professional services, 1965-2005). Mr. Mauriello currently serves as a member of the Board of Directors of XL Group plc. (global insurance and re-insurance, 2006-present). Previously, Mr. Mauriello served as a Director of the Hamilton Funds of the Bank of New York (2006-2007) and of Arcadia Resources Inc. (health care services and products, 2007-2012). |
Robert W. Selander (1950) |
Year of Election or Appointment: 2011 Trustee |
| Mr. Selander also serves as Trustee of other Fidelity funds. Mr. Selander serves as a Director of The Western Union Company (global money transfer, 2014-present). Previously, Mr. Selander served as a Member of the Advisory Board of other Fidelity funds (2011), and Executive Vice Chairman (2010), Chief Executive Officer (2009-2010), and President and Chief Executive Officer (1997-2009) of Mastercard, Inc. |
Cornelia M. Small (1944) |
Year of Election or Appointment: 2005 Trustee |
| Ms. Small also serves as Trustee of other Fidelity funds. Ms. Small is a member of the Board of Directors (2009-present) and Chair of the Investment Committee (2010-present) of the Teagle Foundation. Ms. Small also serves on the Investment Committee of the Berkshire Taconic Community Foundation (2008-present). Previously, Ms. Small served as Chairperson (2002-2008) and a member of the Investment Committee and Chairperson (2008-2012) and a member of the Board of Trustees of Smith College. In addition, Ms. Small served as Chief Investment Officer, Director of Global Equity Investments, and a member of the Board of Directors of Scudder, Stevens & Clark and Scudder Kemper Investments. |
William S. Stavropoulos (1939) |
Year of Election or Appointment: 2002 Trustee Vice Chairman of the Independent Trustees |
| Mr. Stavropoulos also serves as Trustee of other Fidelity funds. Mr. Stavropoulos serves as President and Founder of the Michigan Baseball Foundation, the Great Lakes Loons (2007-present). Mr. Stavropoulos is Chairman Emeritus of the Board of Directors of The Dow Chemical Company, where he previously served in numerous senior management positions, including President, CEO (1995-2000; 2002-2004), Chairman of the Executive Committee (2000-2006), and as a member of the Board of Directors (1990-2006). Currently, Mr. Stavropoulos is Chairman of the Board of Directors of Univar Inc. (global distributor of commodity and specialty chemicals), a Director of Teradata Corporation (data warehousing and technology solutions), and Maersk Inc. (industrial conglomerate), and a member of the Advisory Board for Metalmark Capital LLC (private equity investment, 2005-present). Mr. Stavropoulos is an operating advisor to Clayton, Dubilier & Rice, LLC (private equity investment). In addition, Mr. Stavropoulos is a member of the University of Notre Dame Advisory Council for the College of Science, a Trustee of the Rollin L. Gerstacker Foundation, and a Director of the Naples Philharmonic Center for the Arts. Previously, Mr. Stavropoulos served as a Director of Chemical Financial Corporation (bank holding company, 1993-2012) and Tyco International, Ltd. (multinational manufacturing and services, 2007-2012). |
David M. Thomas (1949) |
Year of Election or Appointment: 2008 Trustee |
| Mr. Thomas also serves as Trustee of other Fidelity funds. Mr. Thomas serves as Non-Executive Chairman of the Board of Directors of Fortune Brands Home and Security (home and security products, 2011-present), as a member of the Board of Directors (2004-present) and Presiding Director (2013-present) of Interpublic Group of Companies, Inc. (marketing communication), and as a member of the Board of Trustees of the University of Florida (2013-present). Previously, Mr. Thomas served as Executive Chairman (2005-2006) and Chairman and Chief Executive Officer (2000-2005) of IMS Health, Inc. (pharmaceutical and healthcare information solutions), and a Director of Fortune Brands, Inc. (consumer products, 2000-2011). |
+ The information above includes each Trustee's principal occupation during the last five years and other information relating to the experience, attributes, and skills relevant to each Trustee's qualifications to serve as a Trustee, which led to the conclusion that each Trustee should serve as a Trustee for the fund.
Advisory Board Member and Officers:
Correspondence intended for each officer and Peter S. Lynch may be sent to Fidelity Investments, 245 Summer Street, Boston, Massachusetts 02210. Officers appear below in alphabetical order.
Name, Year of Birth; Principal Occupation |
Peter S. Lynch (1944) |
Year of Election or Appointment: 2003 Member of the Advisory Board |
| Mr. Lynch also serves as Member of the Advisory Board of other Fidelity funds. Mr. Lynch is Vice Chairman and a Director of FMR (investment adviser firm) and FMR Co., Inc. (investment adviser firm). In addition, Mr. Lynch serves as a Trustee of Boston College and as the Chairman of the Inner-City Scholarship Fund. Previously, Mr. Lynch served on the Special Olympics International Board of Directors (1997-2006). |
Elizabeth Paige Baumann (1968) |
Year of Election or Appointment: 2012 Anti-Money Laundering (AML) Officer |
| Ms. Baumann also serves as AML Officer of other funds. She is Chief AML Officer of FMR LLC (diversified financial services company, 2012-present) and is an employee of Fidelity Investments. Previously, Ms. Baumann served as Vice President and Deputy Anti-Money Laundering Officer (2007-2012). |
Marc Bryant (1966) |
Year of Election or Appointment: 2015 Secretary and Chief Legal Officer (CLO) |
<R> | Mr. Bryant also serves as Secretary and Chief Legal Officer (CLO) of other funds. He is Senior Vice President and Deputy General Counsel of FMR LLC (diversified financial services company). Previously, Mr. Bryant served as Secretary and Chief Legal Officer of Fidelity Rutland Square Trust II (2010-2014) and Assistant Secretary of Fidelity's Fixed Income and Asset Allocation Funds (2013?2015). Prior to joining Fidelity Investments, Mr. Bryant served as a Senior Vice President and the Head of Global Retail Legal for AllianceBernstein L.P. (2006-2010), and as the General Counsel for ProFund Advisors LLC (2001-2006).</R> |
William C. Coffey (1969) |
Year of Election or Appointment: 2009 Assistant Secretary |
| Mr. Coffey also serves as Assistant Secretary of other funds. He is Senior Vice President and Deputy General Counsel of FMR LLC (diversified financial services company, 2010-present), and is an employee of Fidelity Investments. Previously, Mr. Coffey served as Vice President and Associate General Counsel of FMR LLC (2005-2009). |
Jonathan Davis (1968) |
Year of Election or Appointment: 2010 Assistant Treasurer |
| Mr. Davis also serves as Assistant Treasurer of other funds. Mr. Davis is an employee of Fidelity Investments. Previously, Mr. Davis served as Vice President and Associate General Counsel of FMR LLC (diversified financial services company, 2003-2010). |
Adrien E. Deberghes (1967) |
Year of Election or Appointment: 2008 Deputy Treasurer |
| Mr. Deberghes also serves as an officer of other funds. He is an employee of Fidelity Investments (2008-present). Prior to joining Fidelity Investments, Mr. Deberghes was Senior Vice President of Mutual Fund Administration at State Street Corporation (2007-2008), Senior Director of Mutual Fund Administration at Investors Bank & Trust (2005-2007), and Director of Finance for Dunkin' Brands (2000-2005). |
Stephanie J. Dorsey (1969) |
Year of Election or Appointment: 2010 Assistant Treasurer |
| Ms. Dorsey also serves as an officer of other funds. She is an employee of Fidelity Investments (2008-present) and has served in other fund officer roles. Prior to joining Fidelity Investments, Ms. Dorsey served as Treasurer (2004-2008) of the JPMorgan Mutual Funds and Vice President (2004-2008) of JPMorgan Chase Bank. |
Howard J. Galligan III (1966) |
Year of Election or Appointment: 2014 Chief Financial Officer |
| Mr. Galligan also serves as Chief Financial Officer of other funds. Mr. Galligan serves as President of Fidelity Pricing and Cash Management Services (FPCMS) (2014-present) and as a Director of Strategic Advisers, Inc. (investment adviser firm, 2008-present). Previously, Mr. Galligan served as Chief Administrative Officer of Asset Management (2011-2014) and Chief Operating Officer and Senior Vice President of Investment Support for Strategic Advisers, Inc. (2003-2011). |
Scott C. Goebel (1968) |
Year of Election or Appointment: 2015 Vice President |
| Mr. Goebel serves as an officer of other funds. Mr. Goebel also serves as Secretary of Fidelity SelectCo, LLC (investment adviser firm, 2013-present), Fidelity Investments Money Management, Inc. (FIMM) (investment adviser firm, 2010-present) and Fidelity Research and Analysis Company (FRAC) (investment adviser firm, 2010-present); General Counsel, Secretary, and Senior Vice President of FMR (investment adviser firm, 2008-present) and FMR Co., Inc. (investment adviser firm, 2008-present); Chief Legal Officer of Fidelity Management & Research (Hong Kong) Limited (investment adviser firm, 2008-present); and Assistant Secretary of Fidelity Management & Research (Japan) Limited (investment adviser firm, 2008-present) and FMR Investment Management (U.K.) Limited (investment adviser firm, 2008-present). Previously, Mr. Goebel served as Secretary and CLO of certain Fidelity funds (2008-2015), Assistant Secretary of FIMM (2008-2010), FRAC (2008-2010), and certain funds (2007-2008); and as Vice President and Secretary of Fidelity Distributors Corporation (FDC) (2005-2007). Mr. Goebel has been employed by FMR LLC (diversified financial services company) or an affiliate since 2001. |
Thomas C. Hense (1964) |
Year of Election or Appointment: 2008/2010/2015 Vice President |
| Mr. Hense serves as Vice President of Fidelity Advisor Multi-Asset Income Fund (2015) and other funds (High Income (2008), Small Cap (2008), and Value (2010) funds). Previously, Mr. Hense served as a portfolio manager for Fidelity's Institutional Money Management Group (Pyramis) (2003-2008). |
Brian B. Hogan (1964) |
Year of Election or Appointment: 2009 Vice President |
| Mr. Hogan also serves as Trustee or Vice President of other funds. Mr. Hogan serves as a Director of Fidelity SelectCo, LLC (investment adviser firm, 2014-present) and President of the Equity Division of FMR (investment adviser firm, 2009-present). Previously, Mr. Hogan served as Senior Vice President, Equity Research of FMR (2006-2009) and as a portfolio manager. |
Chris Maher (1972) |
Year of Election or Appointment: 2013 Assistant Treasurer |
| Mr. Maher serves as Assistant Treasurer of other funds. Mr. Maher is Vice President of Valuation Oversight and is an employee of Fidelity Investments. Previously, Mr. Maher served as Vice President of Asset Management Compliance (2013), Vice President of the Program Management Group of FMR (investment adviser firm, 2010-2013), and Vice President of Valuation Oversight (2008-2010). |
Kenneth B. Robins (1969) |
Year of Election or Appointment: 2008 President and Treasurer |
| Mr. Robins also serves as an officer of other funds. Mr. Robins serves as Executive Vice President of Fidelity Investments Money Management, Inc. (FIMM) (investment adviser firm, 2013-present) and is an employee of Fidelity Investments (2004-present). Previously, Mr. Robins served in other fund officer roles. |
Stephen Sadoski (1971) |
Year of Election or Appointment: 2012 Deputy Treasurer |
| Mr. Sadoski also serves as Deputy Treasurer of other funds. He is an employee of Fidelity Investments (2012-present) and has served in another fund officer role. Prior to joining Fidelity Investments, Mr. Sadoski served as an assistant chief accountant in the Division of Investment Management of the Securities and Exchange Commission (SEC) (2009-2012) and as a senior manager at Deloitte & Touche LLP (1997-2009). |
Stacie M. Smith (1974) |
Year of Election or Appointment: 2013 Deputy Treasurer |
| Ms. Smith also serves as an officer of other funds. She is an employee of Fidelity Investments (2009-present) and has served in other fund officer roles. Prior to joining Fidelity Investments, Ms. Smith served as Senior Audit Manager of Ernst & Young LLP (1996-2009). |
Renee Stagnone (1975) |
Year of Election or Appointment: 2013 Deputy Treasurer |
| Ms. Stagnone also serves as Deputy Treasurer of other funds. Ms. Stagnone is an employee of Fidelity Investments. |
Linda J. Wondrack (1964) |
Year of Election or Appointment: 2014 Chief Compliance Officer |
| Ms. Wondrack also serves as Chief Compliance Officer of other funds. Ms. Wondrack is Executive Vice President and head of the Ethics Office and Asset Management Compliance for Fidelity Investments (2012- present). Ms. Wondrack also serves as Chief Compliance Officer of Fidelity SelectCo, LLC (investment adviser firm, 2014-present); Chief Compliance Officer of Impresa Management LLC (2013-present); and Chief Compliance Officer of FMR Co., Inc. (investment adviser firm), Fidelity Investments Money Management, Inc. (investment adviser firm), Fidelity Management & Research (Japan) Limited (investment adviser firm), FMR Investment Management (U.K.) Limited (investment adviser firm), Fidelity Management & Research (Hong Kong) (investment adviser firm), Fidelity Management & Research Company (investment adviser firm), Pyramis Global Advisors, LLC (investment adviser firm), and Strategic Advisers, Inc. (investment adviser firm), Ballyrock Investment Advisors LLC, and Northern Neck Investors LLC (2012-present). Previously, Ms. Wondrack served as Senior Vice President and Chief Compliance Officer for Columbia Management Investment Advisers, LLC (2005-2012); Chief Compliance Officer for certain funds within the Columbia Family of Funds (2007-2012); and Senior Vice President of Compliance Risk Management at Bank of America (2005-2010). |
Joseph F. Zambello (1957) |
Year of Election or Appointment: 2011 Deputy Treasurer |
| Mr. Zambello also serves as Deputy Treasurer of other funds. Mr. Zambello is an employee of Fidelity Investments. Previously, Mr. Zambello served as Vice President of the Program Management Group of FMR (investment adviser firm, 2009-2011) and Vice President of the Transfer Agent Oversight Group (2005-2009). |
Annual Report
The Board of Trustees of Fidelity Small Cap Value Fund voted to pay on September 14, 2015 to shareholders of record at the opening of business on September 11, 2015, a distribution of $1.495 per share derived from capital gains realized from sales of portfolio securities and a dividend of $0.110 per share from net investment income.
The fund designates 100% of the dividends distributed during the fiscal year as qualifying for the dividends-received deduction for corporate shareholders.
The fund designates 100% of the dividends distributed during the fiscal year as amounts which can be taken into account as a dividend for the purposes of the maximum rate under section 1(h)(11) of the Internal Revenue Code.
The fund hereby designates as a capital gain dividend with respect to the taxable year ended July 31, 2015, $274,706,718, or, if subsequently determined to be different, the net capital gain of such year.
The fund will notify shareholders in January 2016 of amounts for use in preparing 2015 income tax returns.
Annual Report
Fidelity Small Cap Value Fund
Each year, the Board of Trustees, including the Independent Trustees (together, the Board), votes on the renewal of the management contract with Fidelity Management & Research Company (FMR) and the sub-advisory agreements (together, the Advisory Contracts) for the fund. The Board, assisted by the advice of fund counsel and Independent Trustees' counsel, requests and considers a broad range of information relevant to the renewal of the Advisory Contracts throughout the year.
The Board meets regularly and, at each of its meetings, covers an extensive agenda of topics and materials and considers factors that are relevant to its annual consideration of the renewal of the fund's Advisory Contracts, including the services and support provided to the fund and its shareholders. The Board has established various standing committees (Committees), each composed of and chaired by Independent Trustees with varying backgrounds, to which the Board has assigned specific subject matter responsibilities in order to enhance effective decision-making by the Board. The Board, acting directly and through its Committees, requests and receives information concerning the annual consideration of the renewal of the fund's Advisory Contracts. The Board also meets as needed to consider matters specifically related to the Board's annual consideration of the renewal of the Advisory Contracts. Members of the Board may also meet with trustees of other Fidelity funds through ad hoc joint committees to discuss certain matters relevant to all of the Fidelity funds.
At its July 2015 meeting, the Board unanimously determined to renew the fund's Advisory Contracts. In reaching its determination, the Board considered all factors it believed relevant, including (i) the nature, extent, and quality of the services to be provided to the fund and its shareholders (including the investment performance of the fund); (ii) the competitiveness of the fund's management fee and total expense ratio relative to peer funds; (iii) the total costs of the services to be provided by and the profits to be realized by Fidelity from its relationship with the fund; and (iv) the extent to which (if any) economies of scale exist and would be realized as the fund grows, and whether any economies of scale are appropriately shared with fund shareholders.
In considering whether to renew the Advisory Contracts for the fund, the Board reached a determination, with the assistance of fund counsel and Independent Trustees' counsel and through the exercise of its business judgment, that the renewal of the Advisory Contracts was in the best interests of the fund and its shareholders and that the compensation payable under the Advisory Contracts was fair and reasonable. The Board's decision to renew the Advisory Contracts was not based on any single factor, but rather was based on a comprehensive consideration of all the information provided to the Board at its meetings throughout the year. The Board, in reaching its determination to renew the Advisory Contracts, was aware that shareholders of the fund have a broad range of investment choices available to them, including a wide choice among funds offered by Fidelity's competitors, and that the fund's shareholders, who have the opportunity to review and weigh the disclosure provided by the fund in its prospectus and other public disclosures, have chosen to invest in this fund, which is part of the Fidelity family of funds.
Annual Report
Board Approval of Investment Advisory Contracts and
Management Fees - continued
Nature, Extent, and Quality of Services Provided. The Board considered Fidelity's staffing as it relates to the fund, including the backgrounds of investment personnel of Fidelity, and also considered the fund's investment objective, strategies, and related investment philosophy. The Independent Trustees also had discussions with senior management of Fidelity's investment operations and investment groups. The Board considered the structure of the portfolio manager compensation program and whether this structure provides appropriate incentives to act in the best interests of the fund. Additionally, the Board considered the portfolio managers' investments, if any, in the funds that they manage.
Resources Dedicated to Investment Management and Support Services. The Board and the Fund Oversight and Research Committees reviewed the general qualifications and capabilities of Fidelity's investment staff, including its size, education, experience, and resources, as well as Fidelity's approach to recruiting, training, managing, and compensating investment personnel. The Board noted that Fidelity has continued to increase the resources devoted to non-U.S. offices, including expansion of Fidelity's global investment organization. The Board also noted that Fidelity's analysts have extensive resources, tools and capabilities that allow them to conduct sophisticated quantitative and fundamental analysis, as well as credit analysis of issuers, counterparties and guarantors. Further, the Board considered that Fidelity's investment professionals have sufficient access to global information and data so as to provide competitive investment results over time, and that those professionals also have access to sophisticated tools that permit them to assess portfolio construction and risk and performance attribution characteristics continuously, as well as to transmit new information and research conclusions rapidly around the world. Additionally, in its deliberations, the Board considered Fidelity's trading, risk management, and compliance capabilities and resources, which are integral parts of the investment management process.
Shareholder and Administrative Services. The Board considered (i) the nature, extent, quality, and cost of advisory, administrative, and shareholder services performed by FMR, the sub-advisers (together with FMR, the Investment Advisers), and their affiliates under the Advisory Contracts and under separate agreements covering transfer agency, pricing and bookkeeping, and securities lending services for the fund; (ii) the nature and extent of the supervision of third party service providers, principally custodians and subcustodians; and (iii) the resources devoted to, and the record of compliance with, the fund's compliance policies and procedures. The Board also reviewed the allocation of fund brokerage, including allocations to brokers affiliated with the Investment Advisers, the use of brokerage commissions to pay fund expenses, and the use of "soft" commission dollars to pay for research services.
Annual Report
The Board noted that the growth of fund assets over time across the complex allows Fidelity to reinvest in the development of services designed to enhance the value or convenience of the Fidelity funds as investment vehicles. These services include 24-hour access to account information and market information through telephone representatives and over the Internet, investor education materials and asset allocation tools, and the expanded availability of Fidelity Investor Centers.
In 2014, the Board formed an ad hoc Committee on Transfer Agency Fees to review the variety of transfer agency fee structures throughout the industry and Fidelity's competitive positioning with respect to industry participants.
Investment in a Large Fund Family. The Board considered the benefits to shareholders of investing in a Fidelity fund, including the benefits of investing in a fund that is part of a large family of funds offering a variety of investment disciplines and providing a large variety of mutual fund investor services. The Board noted that Fidelity had taken, or had made recommendations that resulted in the Fidelity funds taking, a number of actions over the previous year that benefited particular funds, including (i) continuing to dedicate additional resources to investment research and to the support of the senior management team that oversees asset management; (ii) continuing efforts to enhance Fidelity's global research capabilities; (iii) launching new funds and making other enhancements to meet client needs; (iv) reducing management fees and total expenses for certain index funds and diversified international funds; (v) continuing to launch dedicated lower cost underlying funds to meet portfolio construction needs related to expanding underlying fund options for Fidelity funds of funds, specifically for the Freedom Fund product lines; (vi) rationalizing product lines and gaining increased efficiencies through fund mergers; (vii) launching active fixed-income exchange-traded funds; (viii) continuing to develop, acquire and implement systems and technology to improve services to the funds and information security and to increase efficiency; (ix) implementing investment enhancements to further strengthen Fidelity's target date product line to increase investors' probability of success in achieving their goals; (x) modifying the eligibility criteria for certain share classes to accommodate roll-over assets from employer-sponsored retirement plans; (xi) launching a new Class W of the Freedom Index Funds to attract and retain Fidelity record-kept retirement plan assets; and (xii) implementing changes to Fidelity's money market product line in response to recent money market regulatory reforms.
Investment Performance. The Board considered whether the fund has operated in accordance with its investment objective, as well as its record of compliance with its investment restrictions and its performance history. The Board noted that there were portfolio management changes for the fund in January 2013 and August 2013.
Annual Report
Board Approval of Investment Advisory Contracts and
Management Fees - continued
The Board took into account discussions with representatives of the Investment Advisers about fund investment performance that occur at Board meetings throughout the year. In this regard the Board noted that as part of regularly scheduled fund reviews and other reports to the Board on fund performance, the Board considers annualized return information for the fund, for different time periods, measured against a securities market index ("benchmark index") and a peer group of funds with similar objectives ("peer group"), if any. In its evaluation of fund investment performance, the Board gave particular attention to information indicating changes in performance of certain Fidelity funds for specific time periods and discussed with the Investment Advisers the reasons for any overperformance or underperformance.
In addition to reviewing absolute and relative fund performance, the Independent Trustees periodically consider the appropriateness of fund performance metrics in evaluating the results achieved. In general, the Independent Trustees believe that fund performance should be evaluated based on net performance (after fees and expenses) of both the highest performing and lowest performing fund share classes, where applicable, compared to appropriate benchmark indices, over appropriate time periods that may include full market cycles, and compared to peer groups, as applicable, over the same periods, taking into account relevant factors including the following: general market conditions; issuer-specific information; and fund cash flows and other factors.
The Independent Trustees recognize that shareholders evaluate performance on a net basis over their own holding periods, for which one-, three-, and five-year periods are often used as a proxy. For this reason, the performance information reviewed by the Board also included net cumulative calendar year total return information for the fund and an appropriate benchmark index and peer group for the most recent one-, three-, and five-year periods, as shown below. Returns are shown compared to the 25th percentile (top of box, 75% beaten) and 75th percentile (bottom of box, 25% beaten) of the peer universe.
Annual Report
Fidelity Small Cap Value Fund

The Board also considered that the fund's management fee is subject to upward or downward adjustment depending upon whether, and to what extent, the fund's investment performance for the performance period exceeds, or is exceeded by, a securities index, thus leading to a performance adjustment for the same period. The Board noted that the performance adjustment provides FMR with a strong economic incentive to seek to achieve superior performance for the fund's shareholders and helps to more closely align the interests of FMR and the shareholders of the fund.
Based on its review, the Board concluded that the nature, extent, and quality of services provided to the fund under the Advisory Contracts should benefit the shareholders of the fund.
Competitiveness of Management Fee and Total Expense Ratio. The Board considered the fund's management fee and total expense ratio compared to "mapped groups" of competitive funds and classes created for the purpose of facilitating the Trustees' competitive analysis of management fees and total expenses. Fidelity creates "mapped groups" by combining similar Lipper investment objective categories that have comparable investment mandates. Combining Lipper investment objective categories aids the Board's management fee and total expense ratio comparisons by broadening the competitive group used for comparison.
Management Fee. The Board considered two proprietary management fee comparisons for the 12-month periods shown in basis points (BP) in the chart below. The group of Lipper funds used by the Board for management fee comparisons is referred to below as the "Total Mapped Group." The Total Mapped Group comparison focuses on a fund's standing in terms of gross management fees before expense reimbursements or caps, and without giving effect to the fund's performance adjustment, relative to the total universe of funds with comparable investment mandates, regardless of whether their management fee structures also are comparable. Funds with comparable investment mandates offer exposure to similar types of securities. Funds with comparable management fee structures have similar management fee contractual arrangements (e.g., flat rate charged for advisory services, all-inclusive fee rate, etc.). "TMG %" represents the percentage of funds in the Total Mapped Group that had management fees that were lower than the fund's. For example, a hypothetical TMG % of 20% would mean that 80% of the funds in the Total Mapped Group had higher, and 20% had lower, management fees than the fund. The fund's actual TMG %s and the number of funds in the Total Mapped Group are in the chart below. The "Asset-Size Peer Group" (ASPG) comparison focuses on a fund's standing relative to a subset of non-Fidelity funds within the Total Mapped Group that are similar in size and management fee structure without taking into account performance adjustments, if any. For example, if a fund is in the first quartile of the ASPG, the fund's management fee ranks in the least expensive or lowest 25% of funds in the ASPG. The ASPG represents at least 15% of the funds in the Total Mapped Group with comparable asset size and management fee structures, subject to a minimum of 50 funds (or all funds in the Total Mapped Group if fewer than 50). Additional information, such as the ASPG quartile in which the fund's management fee rate ranked and the impact of the fund's performance adjustment, is also included in the chart and considered by the Board.
Annual Report
Board Approval of Investment Advisory Contracts and
Management Fees - continued
Fidelity Small Cap Value Fund

Annual Report
The Board noted that the fund's management fee rate ranked below the median of its Total Mapped Group and below the median of its ASPG for 2014. The Board also noted the effect of the fund's performance adjustment, if any, on the fund's management fee ranking.
The Board noted that, in 2014, the ad hoc Committee on Group Fee was formed by it and other Fidelity fund boards to conduct an in-depth review of the "group fee" component of the management fee of funds with such management fee structures. Committee focus included the mechanics of the group fee, the competitive landscape of group fee structures, Fidelity funds with no group fee component and investment products not included in group fee assets. The Board also considered that, for funds subject to the group fee, FMR agreed to voluntarily waive fees over a specified period of time in amounts designed to account for assets converted from certain funds to certain collective investment trusts.
The Board also noted that, in 2013, the ad hoc Committee on Management Fees was formed to conduct an in-depth review of the management fee rates of Fidelity's active equity mutual funds. The Committee focused on the following areas: (i) standard fee structures; (ii) research consumption and trading evolution; (iii) management fee competitiveness/profitability by category; and (iv) factors that drive institutional pricing.
Based on its review, the Board concluded that the fund's management fee is fair and reasonable in light of the services that the fund receives and the other factors considered.
Total Expense Ratio. In its review of each class's total expense ratio, the Board considered the fund's management fee as well as other fund or class expenses, as applicable, such as transfer agent fees, pricing and bookkeeping fees, fund-paid 12b-1 fees, and custodial, legal, and audit fees. The Board noted the impact of the fund's performance adjustment. The Board also noted that Fidelity may agree to waive fees and expenses from time to time, and the extent to which, if any, it has done so for the fund. As part of its review, the Board also considered the current and historical total expense ratios of each class of the fund compared to competitive fund median expenses. Each class of the fund is compared to those funds and classes in the Total Mapped Group (used by the Board for management fee comparisons) that have a similar sales load structure.
The Board noted that the total expense ratio of the retail class ranked below its competitive median for 2014 and the total expense ratio of each of Class A, Class T, Class B, Class C, and Class I ranked above its competitive median for 2014. The Board considered that, in general, various factors can affect total expense ratios. The Board noted that the total expense ratio of Class T was above the competitive median primarily because of higher 12b-1 fees on Class T as compared to most competitor funds. Class T has a higher 12b-1 fee, but a lower front-end sales charge, than traditionally priced front-end sales charge classes. The Board considered that Class T is primarily sold load-waived in the retirement plan market where its 0.50% 12b-1 fee is comparable to competing no-load, higher 12b-1 fee classes designed specifically for retirement plans. The Board noted that the fund offers multiple classes, each of which has a different sales load and 12b-1 fee structure, and that the multiple structures are intended to offer a range of pricing options for the intermediary market. The Board also noted that the total expense ratios of the classes vary primarily by the level of their 12b-1 fees, although differences in transfer agent fees may also cause expenses to vary from class to class.
Annual Report
Board Approval of Investment Advisory Contracts and
Management Fees - continued
Fees Charged to Other Fidelity Clients. The Board also considered Fidelity fee structures and other information with respect to clients of Fidelity, such as other funds advised or subadvised by Fidelity, pension plan clients, and other institutional clients with similar mandates. The Board noted the findings of the 2013 ad hoc joint committee (created with the board of other Fidelity funds), which reviewed and compared Fidelity's institutional investment advisory business with its business of providing services to the Fidelity funds, including the differences in services provided, fees charged, and costs incurred, as well as competition in their respective marketplaces.
Based on its review of total expense ratios and fees charged to other Fidelity clients, the Board concluded that, although in some cases above the median of the universe presented for comparison, the total expense ratio of each class of the fund was reasonable in light of the services that the fund and its shareholders receive and the other factors considered.
Costs of the Services and Profitability. The Board considered the revenues earned and the expenses incurred by Fidelity in conducting the business of developing, marketing, distributing, managing, administering and servicing the fund and servicing the fund's shareholders. The Board also considered the level of Fidelity's profits in respect of all the Fidelity funds.
On an annual basis, Fidelity presents to the Board information about the profitability of its relationship with the fund. Fidelity calculates profitability information for each fund, as well as aggregate profitability information for groups of Fidelity funds and all Fidelity funds, using a series of detailed revenue and cost allocation methodologies which originate with the books and records of Fidelity on which Fidelity's audited financial statements are based. The Audit Committee of the Board reviews any significant changes from the prior year's methodologies.
PricewaterhouseCoopers LLP (PwC), independent registered public accounting firm and auditor to Fidelity and certain Fidelity funds, has been engaged annually by the Board as part of the Board's assessment of Fidelity's profitability analysis. PwC's engagement includes the review and assessment of the methodologies used by Fidelity in determining the revenues and expenses attributable to Fidelity's mutual fund business, and completion of agreed-upon procedures in respect of the mathematical accuracy of fund profitability and its conformity to established allocation methodologies. After considering PwC's reports issued under the engagement and information provided by Fidelity, the Board concluded that while other allocation methods may also be reasonable, Fidelity's profitability methodologies are reasonable in all material respects.
Annual Report
The Board also reviewed Fidelity's non-fund businesses and fall-out benefits related to the mutual fund business as well as cases where Fidelity's affiliates may benefit from or be related to the fund's business.
The Board considered the costs of the services provided by and the profits realized by Fidelity in connection with the operation of the fund and was satisfied that the profitability was not excessive.
Economies of Scale. The Board considered whether there have been economies of scale in respect of the management of the Fidelity funds, whether the Fidelity funds (including the fund) have appropriately benefited from any such economies of scale, and whether there is potential for realization of any further economies of scale. The Board considered the extent to which the fund will benefit from economies of scale as assets grow through increased services to the fund, through waivers or reimbursements, or through fee or expense ratio reductions. The Board also noted that in 2013, it and the boards of other Fidelity funds created an ad hoc committee (the Economies of Scale Committee) to analyze whether Fidelity attains economies of scale in respect of the management and servicing of the Fidelity funds, whether the Fidelity funds have appropriately benefited from such economies of scale, and whether there is potential for realization of any further economies of scale.
The Board recognized that the fund's management contract incorporates a "group fee" structure, which provides for lower group fee rates as total group assets increase, and for higher group fee rates as total group assets decrease (with "group assets" defined to include fund assets under FMR's management plus sector fund assets previously under FMR's management and currently managed by Fidelity SelectCo, LLC). FMR calculates the group fee rates based on a tiered asset "breakpoint" schedule that varies based on asset class. The Board considered that the group fee is designed to deliver the benefits of economies of scale to fund shareholders when total Fidelity fund assets increase, even if assets of any particular fund are unchanged or have declined, because some portion of Fidelity's costs are attributable to services provided to all Fidelity funds, and all funds benefit if those costs can be allocated among more assets. The Board also considered that although the fund is partially closed to new investors, it continues to incur investment management expenses, and marketing and distribution expenses related to the retention of existing shareholders and assets. The Board further noted that the fund may continue to realize benefits from the group fee structure, even though assets may not be expected to grow significantly at the fund level. The Board concluded that, given the group fee structure, fund shareholders will benefit from lower management fees as group assets increase at the fund complex level, regardless of whether Fidelity achieves any such economies of scale.
Annual Report
Board Approval of Investment Advisory Contracts and
Management Fees - continued
The Board concluded, taking into account the analysis of the Economies of Scale Committee, that economies of scale, if any, are being appropriately shared between fund shareholders and Fidelity.
Additional Information Requested by the Board. In order to develop fully the factual basis for consideration of the Fidelity funds' Advisory Contracts, the Board requested and received additional information on certain topics, including: (i) fund performance trends and Fidelity's long-term strategies for certain funds; (ii) the various share classes employed by Fidelity and the attributes of each class, together with similar information on the distribution and servicing payments made by Fidelity or the funds to third-party participants in the distribution channels; (iii) fund profitability, and fund performance in relation to fund profitability; (iv) the methodology with respect to evaluating competitive fund data and peer group classifications and fee comparisons; (v) annual fund profitability margins, with particular focus on certain funds with negative margins; (vi) the realization of fall-out benefits in certain Fidelity business units; (vii) economies of scale and the way in which they are shared with fund shareholders; (viii) Fidelity's group fee structures, including the group fee schedule of breakpoints; (ix) the impact of cost containment measures on the funds; and (x) the transfer agent fee structure.
Based on its evaluation of all of the conclusions noted above, and after considering all factors it believed relevant, the Board concluded that the advisory fee structures are fair and reasonable, and that the fund's Advisory Contracts should be renewed.
Annual Report
Investment Adviser
Fidelity Management & Research Company
Boston, MA
Investment Sub-Advisers
FMR Co., Inc.
FMR Investment Management
(U.K.) Limited
Fidelity Management & Research
(Hong Kong) Limited
Fidelity Management & Research
(Japan) Limited
General Distributor
Fidelity Distributors Corporation
Smithfield, RI
Transfer and Service Agents
Fidelity Investments Institutional
Operations Company, Inc.
Boston, MA
Fidelity Service Company, Inc.
Boston, MA
Custodian
Northern Trust Company
Chicago, IL
The Fidelity Telephone Connection
Mutual Fund 24-Hour Service
Exchanges/Redemptions
and Account Assistance 1-800-544-6666
Product Information 1-800-544-6666
Retirement Accounts 1-800-544-4774
(8 a.m. - 9 p.m.)
TDD Service 1-800-544-0118
for the deaf and hearing impaired
(9 a.m. - 9 p.m. Eastern time)
Fidelity Automated Service
Telephone (FAST®)
1-800-544-5555

Automated line for quickest service
(Fidelity Investment logo)(registered trademark)
Corporate Headquarters
245 Summer St., Boston, MA 02210
www.fidelity.com
SCV-UANN-0915
1.803705.110
(Fidelity Investment logo)(registered trademark)
Fidelity Advisor®
Small Cap Value
Fund - Class A, Class T,
Class B and Class C
Annual Report
July 31, 2015
(Fidelity Cover Art)
Class A, Class T, Class B
and Class C are classes of
Fidelity® Small Cap Value Fund
Contents
Performance | (Click Here) | How the fund has done over time. |
Management's Discussion of Fund Performance | (Click Here) | The Portfolio Manager's review of fund performance and strategy. |
Shareholder Expense Example | (Click Here) | An example of shareholder expenses. |
Investment Changes | (Click Here) | A summary of major shifts in the fund's investments over the past six months. |
Investments | (Click Here) | A complete list of the fund's investments with their market values. |
Financial Statements | (Click Here) | Statements of assets and liabilities, operations, and changes in net assets, as well as financial highlights. |
Notes | (Click Here) | Notes to the financial statements. |
Report of Independent Registered Public Accounting Firm | (Click Here) | |
Trustees and Officers | (Click Here) | |
Distributions | (Click Here) | |
Board Approval of Investment Advisory Contracts and Management Fees | (Click Here) | |
To view a fund's proxy voting guidelines and proxy voting record for the 12-month period ended June 30, visit http://www.fidelity.com/proxyvotingresults or visit the Securities and Exchange Commission's (SEC) web site at http://www.sec.gov. You may also call 1-877-208-0098 to request a free copy of the proxy voting guidelines.
Standard & Poor's, S&P and S&P 500 are registered service marks of The McGraw-Hill Companies, Inc. and have been licensed for use by Fidelity Distributors Corporation.
Other third-party marks appearing herein are the property of their respective owners.
All other marks appearing herein are registered or unregistered trademarks or service marks of FMR LLC or an affiliated company. © 2015 FMR LLC. All rights reserved.
Annual Report
This report and the financial statements contained herein are submitted for the general information of the shareholders of the fund. This report is not authorized for distribution to prospective investors in the fund unless preceded or accompanied by an effective prospectus.
A fund files its complete schedule of portfolio holdings with the SEC for the first and third quarters of each fiscal year on Form N-Q. Forms N-Q are available on the SEC's web site at http://www.sec.gov. A fund's Forms N-Q may be reviewed and copied at the SEC's Public Reference Room in Washington, DC. Information regarding the operation of the SEC's Public Reference Room may be obtained by calling 1-800-SEC-0330. For a complete list of a fund's portfolio holdings, view the most recent holdings listing, semiannual report, or annual report on Fidelity's web site at http://www.fidelity.com, http://www.advisor.fidelity.com, or http://www.401k.com, as applicable.
NOT FDIC INSURED • MAY LOSE VALUE • NO BANK GUARANTEE
Neither the fund nor Fidelity Distributors Corporation is a bank.
Annual Report
Average annual total return reflects the change in the value of an investment, assuming reinvestment of the class' distributions from dividend income and capital gains (the profits earned upon the sale of securities that have grown in value, if any) and assuming a constant rate of performance each year. The $10,000 table and the fund's returns do not reflect the deduction of taxes that a shareholder would pay on fund distributions or the redemption of fund shares. During periods of reimbursement by Fidelity, a fund's total return will be greater than it would be had the reimbursement not occurred. How a fund did yesterday is no guarantee of how it will do tomorrow. Returns reflect the conversion of Class B shares to Class A shares after a maximum of seven years.
Average Annual Total Returns
Periods ended July 31, 2015 | Past 1
year | Past 5
years | Past 10
years |
Class A (incl. 5.75% sales charge) | 5.42% | 13.55% | 8.54% |
Class T (incl. 3.50% sales charge) | 7.68% | 13.81% | 8.54% |
Class B (incl. contingent deferred sales charge) A | 6.04% | 13.77% | 8.62% |
Class C (incl. contingent deferred sales charge)B | 10.07% | 14.05% | 8.37% |
A Class B shares' contingent deferred sales charges included in the past one year, past five years, and life of fund total return figures are 5%, 2%, and 0%, respectively.
B Class C shares' contingent deferred sales charges included in the past one year, past five years, and life of fund total return figures are 1%, 0%, and 0%, respectively.
Annual Report
$10,000 Over 10 years
Let's say hypothetically that $10,000 was invested in Fidelity Advisor® Small Cap Value Fund - Class A on July 31, 2005, and the current 5.75% sales charge was paid. The chart shows how the value of your investment would have changed, and also shows how the Russell 2000® Value Index performed over the same period.
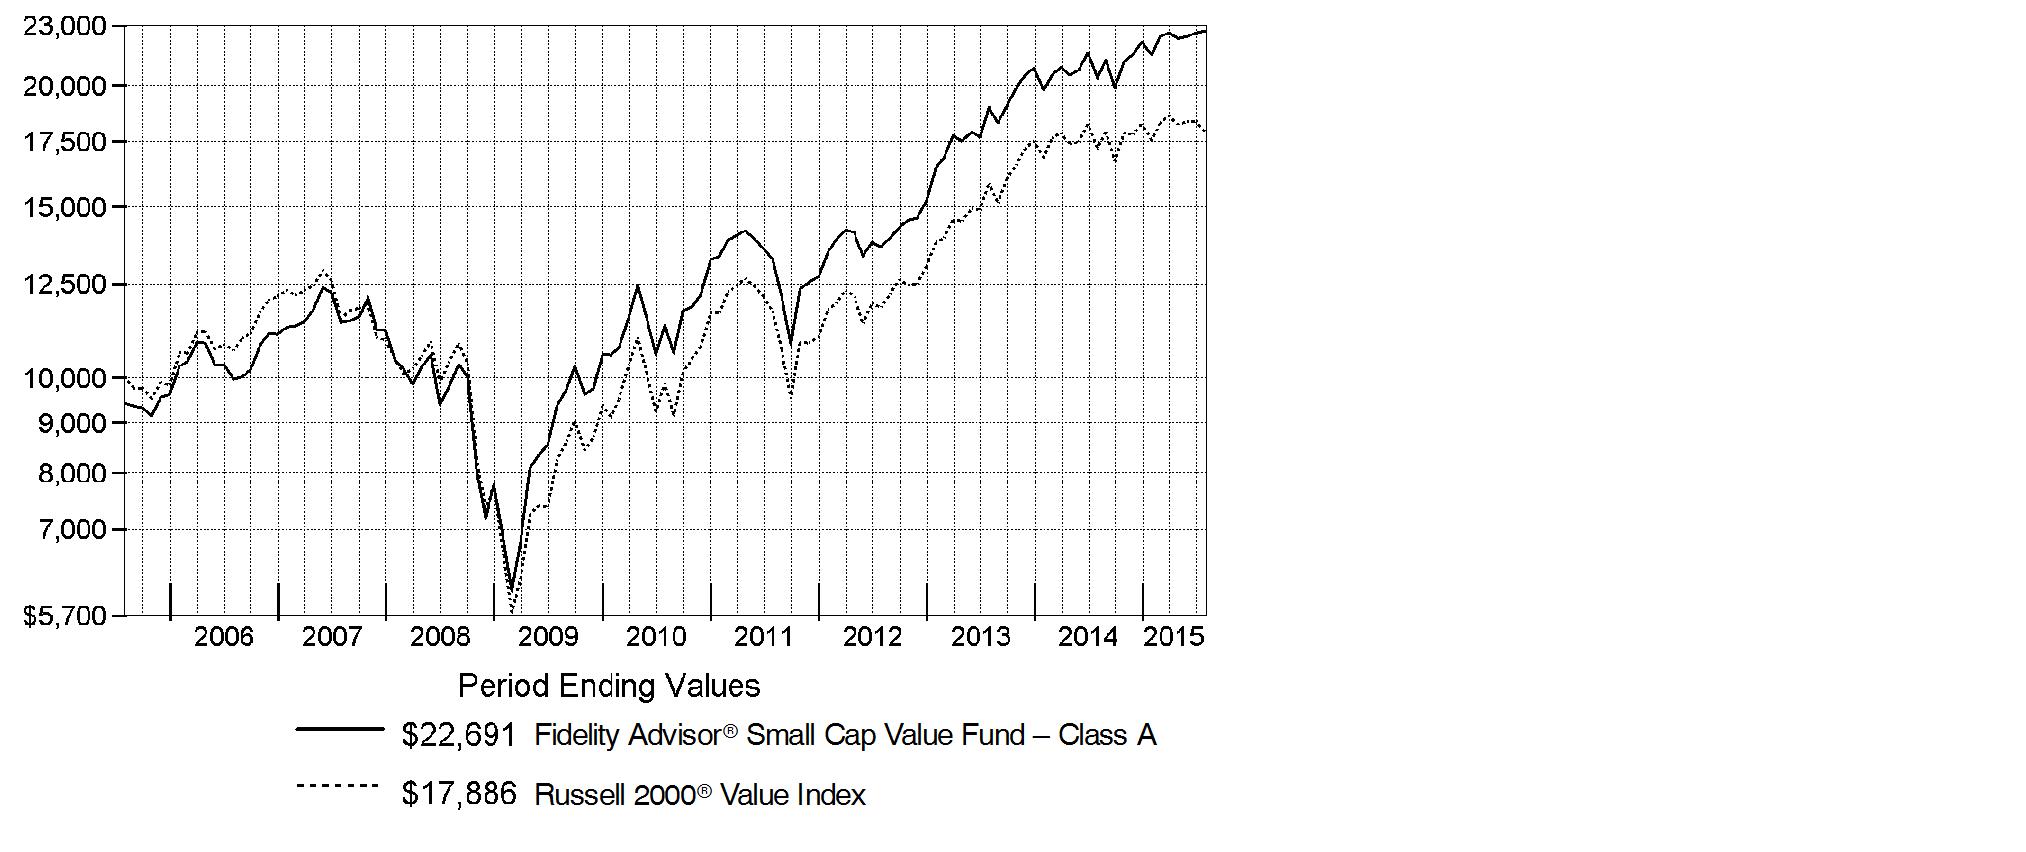
Annual Report
Market Recap: The U.S. equity market gained strongly for the 12 months ending July 31, 2015, as stocks recovered from volatility in late 2014 and early 2015, supported by a still-positive economic backdrop. The S&P 500® Index returned 11.21%, with growth stocks in the index far outpacing value-oriented names on prospects for continued U.S. economic growth. Consequently, the growth-oriented Nasdaq Composite Index® rose 18.71%, outpacing the broader S&P 500®, as well as the 12.03% advance of the smaller-cap Russell 2000® Index. Within the S&P 500®, seven of 10 sectors notched a gain, with significant performance variation. Health care (+27%) led the way, aided by merger activity. Consumer discretionary (+24%) benefited from spending linked to a seven-year low in unemployment. Strong first halves for the consumer staples sector and the real estate segment of financials yielded above-market returns (19% and 12%, respectively) for the full-year period. Conversely, energy (-26%) significantly lagged, due to a roughly 55% decline for U.S. crude-oil prices. Materials (-4%) also lost ground. At period end, investors remained focused on the slowing rate of U.S. earnings growth, the possible effect of a relatively stronger U.S. dollar on exports and inflation, and whether an economic slowdown in China would create ripples for the global economy.
Comments from Lead Portfolio Manager Derek Janssen: For the year, the fund significantly outpaced the 4.30% return of the benchmark Russell 2000® Value Index. (For specific results, please see the Performance section of this report.) Compared with the index, security selection was positive in nearly every sector of the market, especially financials, energy and information technology. The fund also benefited from an overweighting in the health care sector, by far the market's strongest-performing group. That favorable impact, however, was modestly tempered by subpar stock picking in the category. Our goal of managing potential damage from big losses was a plus. This was most evident in the beleaguered energy sector. Although we, too, experienced some struggles - most notably with ShawCor and Northern Oil and Gas - our aggregate energy holdings did vastly better than the sector as a whole. In financials, StanCorp Financial Group, a provider of group disability insurance, led the way on the positive side. Late in the period, the company agreed to be acquired, triggering a sharp rise in its share price. Meanwhile, in information technology, an out-of-index position for software company SS&C Technologies Holdings was a standout contributor. Elsewhere, a position in GrafTech International, which develops graphite electrodes and other carbon-based products, hurt results. In search of other opportunities, we sold the fund's shares in late 2014.
The views expressed above reflect those of the portfolio manager(s) only through the end of the period as stated on the cover of this report and do not necessarily represent the views of Fidelity or any other person in the Fidelity organization. Any such views are subject to change at any time based upon market or other conditions and Fidelity disclaims any responsibility to update such views. These views may not be relied on as investment advice and, because investment decisions for a Fidelity fund are based on numerous factors, may not be relied on as an indication of trading intent on behalf of any Fidelity fund.
Annual Report
Shareholder Expense Example
As a shareholder of the Fund, you incur two types of costs: (1) transaction costs, including sales charges (loads) on purchase payments or redemption proceeds, redemption fees and (2) ongoing costs, including management fees, distribution and/or service (12b-1) fees and other Fund expenses. This Example is intended to help you understand your ongoing costs (in dollars) of investing in the Fund and to compare these costs with the ongoing costs of investing in other mutual funds.
The Example is based on an investment of $1,000 invested at the beginning of the period and held for the entire period (February 1, 2015 to July 31, 2015).
Actual Expenses
The first line of the accompanying table for each class of the Fund provides information about actual account values and actual expenses. You may use the information in this line, together with the amount you invested, to estimate the expenses that you paid over the period. Simply divide your account value by $1,000.00 (for example, an $8,600 account value divided by $1,000.00 = 8.6), then multiply the result by the number in the first line for a class of the Fund under the heading entitled "Expenses Paid During Period" to estimate the expenses you paid on your account during this period. A small balance maintenance fee of $12.00 that is charged once a year may apply for certain accounts with a value of less than $2,000. This fee is not included in the table below. If it was, the estimate of expenses you paid during the period would be higher, and your ending account value lower, by this amount. In addition, the Fund, as a shareholder in the underlying Fidelity Central Funds, will indirectly bear its pro-rata share of the fees and expenses incurred by the underlying Fidelity Central Funds. These fees and expenses are not included in the Fund's annualized expense ratio used to calculate the expense estimate in the table below.
Hypothetical Example for Comparison Purposes
The second line of the accompanying table for each class of the Fund provides information about hypothetical account values and hypothetical expenses based on a Class' actual expense ratio and an assumed rate of return of 5% per year before expenses, which is not the Class' actual return. The hypothetical account values and expenses may not be used to estimate the actual ending account balance or expenses you paid for the period. You may use this information to compare the ongoing costs of investing in the Fund and other funds. To do so, compare this 5% hypothetical example with the 5% hypothetical examples that appear in the shareholder reports of the other funds. A small balance maintenance fee of $12.00 that is charged once a year may apply for certain accounts with a value of less than $2,000. This fee is not included in the table below. If it was, the estimate of expenses you paid during the period would be higher, and your ending account value lower, by this amount. In addition, the Fund, as a shareholder in the underlying Fidelity Central Funds, will indirectly bear its pro-rata share of the fees and expenses incurred by the underlying Fidelity Central Funds. These fees and expenses are not included in the Fund's annualized expense ratio used to calculate the expense estimate in the table below.
Please note that the expenses shown in the table are meant to highlight your ongoing costs only and do not reflect any transaction costs. Therefore, the second line of the table is useful in comparing ongoing costs only, and will not help you determine the relative total costs of owning different funds. In addition, if these transactional costs were included, your costs would have been higher.
Annual Report
| Annualized
Expense RatioB | Beginning
Account Value
February 1, 2015 | Ending
Account Value
July 31, 2015 | Expenses Paid
During Period*
February 1, 2015 to July 31, 2015 |
Class A | 1.35% | | | |
Actual | | $ 1,000.00 | $ 1,057.50 | $ 6.89 |
HypotheticalA | | $ 1,000.00 | $ 1,018.10 | $ 6.76 |
Class T | 1.60% | | | |
Actual | | $ 1,000.00 | $ 1,056.20 | $ 8.16 |
HypotheticalA | | $ 1,000.00 | $ 1,016.86 | $ 8.00 |
Class B | 2.19% | | | |
Actual | | $ 1,000.00 | $ 1,053.30 | $ 11.15 |
HypotheticalA | | $ 1,000.00 | $ 1,013.93 | $ 10.94 |
Class C | 2.12% | | | |
Actual | | $ 1,000.00 | $ 1,053.20 | $ 10.79 |
HypotheticalA | | $ 1,000.00 | $ 1,014.28 | $ 10.59 |
Small Cap Value | 1.09% | | | |
Actual | | $ 1,000.00 | $ 1,058.80 | $ 5.56 |
HypotheticalA | | $ 1,000.00 | $ 1,019.39 | $ 5.46 |
Class I | 1.09% | | | |
Actual | | $ 1,000.00 | $ 1,058.80 | $ 5.56 |
HypotheticalA | | $ 1,000.00 | $ 1,019.39 | $ 5.46 |
A 5% return per year before expenses
B Annualized expense ratio reflects expenses net of applicable fee waivers.
* Expenses are equal to each Class' annualized expense ratio, multiplied by the average account value over the period, multiplied by 181/365 (to reflect the one-half year period).
Annual Report
Investment Changes (Unaudited)
Top Ten Stocks as of July 31, 2015 |
| % of fund's
net assets | % of fund's net assets
6 months ago |
Aarons, Inc. Class A | 3.0 | 2.6 |
Aspen Insurance Holdings Ltd. | 2.7 | 2.5 |
Rouse Properties, Inc. | 2.7 | 2.9 |
Tech Data Corp. | 2.7 | 2.4 |
Federated Investors, Inc. Class B (non-vtg.) | 2.7 | 2.9 |
Store Capital Corp. | 2.6 | 0.0 |
Silgan Holdings, Inc. | 2.6 | 2.3 |
CVB Financial Corp. | 2.5 | 1.7 |
Universal Corp. | 2.4 | 1.7 |
DineEquity, Inc. | 2.4 | 1.4 |
| 26.3 | |
Top Five Market Sectors as of July 31, 2015 |
| % of fund's
net assets | % of fund's net assets
6 months ago |
Financials | 41.0 | 40.5 |
Industrials | 13.2 | 13.0 |
Information Technology | 12.9 | 12.8 |
Consumer Discretionary | 9.3 | 11.6 |
Health Care | 6.8 | 6.7 |
Asset Allocation (% of fund's net assets) |
As of July 31, 2015 * | As of January 31, 2015 ** |
 | Stocks 99.2% | |  | Stocks 99.2% | |
 | Short-Term
Investments and
Net Other Assets (Liabilities) 0.8% | |  | Short-Term
Investments and
Net Other Assets (Liabilities) 0.8% | |
* Foreign investments | 11.2% | | ** Foreign investments | 11.9% | |

Annual Report
Investments July 31, 2015
Showing Percentage of Net Assets
Common Stocks - 99.2% |
| Shares | | Value |
CONSUMER DISCRETIONARY - 9.3% |
Auto Components - 1.5% |
Standard Motor Products, Inc. (e) | 1,183,301 | | $ 43,273,318 |
Hotels, Restaurants & Leisure - 2.4% |
DineEquity, Inc. | 660,000 | | 68,646,600 |
Specialty Retail - 5.1% |
Aarons, Inc. Class A | 2,295,100 | | 84,872,798 |
Genesco, Inc. (a) | 616,728 | | 39,896,134 |
Hibbett Sports, Inc. (a) | 249,000 | | 11,341,950 |
Murphy U.S.A., Inc. (a) | 72,506 | | 3,970,429 |
| | 140,081,311 |
Textiles, Apparel & Luxury Goods - 0.3% |
Vera Bradley, Inc. (a) | 831,000 | | 9,024,660 |
TOTAL CONSUMER DISCRETIONARY | | 261,025,889 |
CONSUMER STAPLES - 4.2% |
Food Products - 1.8% |
Post Holdings, Inc. (a) | 931,300 | | 50,048,062 |
Tobacco - 2.4% |
Universal Corp. (d)(e) | 1,208,239 | | 68,930,035 |
TOTAL CONSUMER STAPLES | | 118,978,097 |
ENERGY - 4.3% |
Energy Equipment & Services - 1.8% |
Hornbeck Offshore Services, Inc. (a)(d) | 1,600,000 | | 29,120,000 |
ShawCor Ltd. Class A | 871,000 | | 20,472,180 |
| | 49,592,180 |
Oil, Gas & Consumable Fuels - 2.5% |
Northern Oil & Gas, Inc. (a)(d) | 1,958,249 | | 9,321,265 |
World Fuel Services Corp. | 1,537,200 | | 62,487,180 |
| | 71,808,445 |
TOTAL ENERGY | | 121,400,625 |
FINANCIALS - 41.0% |
Banks - 9.7% |
Associated Banc-Corp. | 2,890,335 | | 56,968,503 |
CVB Financial Corp. | 3,999,988 | | 70,839,787 |
First Citizen Bancshares, Inc. Class A (a) | 180,954 | | 46,385,748 |
Common Stocks - continued |
| Shares | | Value |
FINANCIALS - continued |
Banks - continued |
First Citizen Bancshares, Inc. Class A | 140,370 | | $ 35,982,446 |
First Niagara Financial Group, Inc. | 6,500,000 | | 63,115,000 |
| | 273,291,484 |
Capital Markets - 6.1% |
Federated Investors, Inc. Class B (non-vtg.) | 2,199,963 | | 74,160,753 |
OM Asset Management Ltd. | 2,232,001 | | 39,439,458 |
Waddell & Reed Financial, Inc. Class A | 1,264,100 | | 56,770,731 |
| | 170,370,942 |
Insurance - 11.5% |
Aspen Insurance Holdings Ltd. | 1,599,400 | | 76,915,146 |
Endurance Specialty Holdings Ltd. | 902,400 | | 62,707,776 |
First American Financial Corp. | 1,270,287 | | 51,548,246 |
ProAssurance Corp. | 1,368,200 | | 66,070,378 |
StanCorp Financial Group, Inc. | 581,300 | | 66,279,826 |
| | 323,521,372 |
Real Estate Investment Trusts - 8.2% |
National Retail Properties, Inc. (d) | 683,400 | | 25,401,978 |
Rouse Properties, Inc. (d)(e) | 4,350,000 | | 76,560,000 |
Sabra Health Care REIT, Inc. | 2,042,700 | | 55,867,845 |
Store Capital Corp. | 3,500,000 | | 73,500,000 |
| | 231,329,823 |
Real Estate Management & Development - 1.7% |
Kennedy Wilson Europe Real Estate PLC | 2,659,540 | | 47,554,949 |
Thrifts & Mortgage Finance - 3.8% |
Astoria Financial Corp. | 3,403,499 | | 51,460,905 |
Washington Federal, Inc. | 2,368,300 | | 55,134,024 |
| | 106,594,929 |
TOTAL FINANCIALS | | 1,152,663,499 |
HEALTH CARE - 6.8% |
Health Care Equipment & Supplies - 1.6% |
Integra LifeSciences Holdings Corp. (a) | 709,200 | | 45,480,996 |
Health Care Providers & Services - 2.7% |
AmSurg Corp. (a) | 148,800 | | 10,674,912 |
Civitas Solutions, Inc. (e) | 2,940,700 | | 66,136,343 |
| | 76,811,255 |
Common Stocks - continued |
| Shares | | Value |
HEALTH CARE - continued |
Health Care Technology - 1.1% |
Cegedim SA (a) | 670,247 | | $ 29,436,590 |
Pharmaceuticals - 1.4% |
Theravance, Inc. (d) | 2,594,553 | | 39,748,552 |
TOTAL HEALTH CARE | | 191,477,393 |
INDUSTRIALS - 13.2% |
Aerospace & Defense - 1.6% |
Moog, Inc. Class A (a) | 650,000 | | 43,459,000 |
Commercial Services & Supplies - 2.8% |
Essendant, Inc. | 1,273,798 | | 46,901,242 |
Knoll, Inc. | 1,269,800 | | 30,729,160 |
| | 77,630,402 |
Electrical Equipment - 3.3% |
AZZ, Inc. | 770,000 | | 39,847,500 |
EnerSys | 843,700 | | 52,689,065 |
| | 92,536,565 |
Machinery - 3.8% |
Columbus McKinnon Corp. (NY Shares) | 776,000 | | 18,204,960 |
Mueller Industries, Inc. | 1,600,400 | | 51,804,948 |
Valmont Industries, Inc. (d) | 340,000 | | 37,818,200 |
| | 107,828,108 |
Trading Companies & Distributors - 1.7% |
WESCO International, Inc. (a)(d) | 777,933 | | 47,733,969 |
TOTAL INDUSTRIALS | | 369,188,044 |
INFORMATION TECHNOLOGY - 12.9% |
Electronic Equipment & Components - 6.1% |
Ingram Micro, Inc. Class A | 2,048,300 | | 55,775,209 |
SYNNEX Corp. | 527,200 | | 39,872,136 |
Tech Data Corp. (a) | 1,286,373 | | 75,034,137 |
| | 170,681,482 |
Internet Software & Services - 2.8% |
Cimpress NV (a) | 600,000 | | 38,718,000 |
j2 Global, Inc. | 574,300 | | 40,430,720 |
| | 79,148,720 |
IT Services - 1.7% |
CACI International, Inc. Class A (a) | 578,334 | | 47,498,571 |
Common Stocks - continued |
| Shares | | Value |
INFORMATION TECHNOLOGY - continued |
Software - 2.3% |
SS&C Technologies Holdings, Inc. | 963,900 | | $ 65,574,117 |
TOTAL INFORMATION TECHNOLOGY | | 362,902,890 |
MATERIALS - 2.9% |
Containers & Packaging - 2.6% |
Silgan Holdings, Inc. | 1,350,000 | | 72,184,500 |
Metals & Mining - 0.3% |
Haynes International, Inc. | 186,142 | | 7,924,065 |
TOTAL MATERIALS | | 80,108,565 |
UTILITIES - 4.6% |
Electric Utilities - 3.8% |
El Paso Electric Co. | 1,524,121 | | 55,523,728 |
IDACORP, Inc. | 822,000 | | 51,054,420 |
| | 106,578,148 |
Gas Utilities - 0.8% |
Southwest Gas Corp. | 372,656 | | 20,995,439 |
TOTAL UTILITIES | | 127,573,587 |
TOTAL COMMON STOCKS (Cost $2,263,907,733) |
2,785,318,589
|
Money Market Funds - 3.4% |
| Shares | | Value |
Fidelity Cash Central Fund, 0.17% (b) | 17,732,670 | | $ 17,732,670 |
Fidelity Securities Lending Cash Central Fund, 0.18% (b)(c) | 78,652,275 | | 78,652,275 |
TOTAL MONEY MARKET FUNDS (Cost $96,384,945) |
96,384,945
|
TOTAL INVESTMENT PORTFOLIO - 102.6% (Cost $2,360,292,678) | 2,881,703,534 |
NET OTHER ASSETS (LIABILITIES) - (2.6)% | (72,769,368) |
NET ASSETS - 100% | $ 2,808,934,166 |
Legend |
(a) Non-income producing |
(b) Affiliated fund that is generally available only to investment companies and other accounts managed by Fidelity Investments. The rate quoted is the annualized seven-day yield of the fund at period end. A complete unaudited listing of the fund's holdings as of its most recent quarter end is available upon request. In addition, each Fidelity Central Fund's financial statements, which are not covered by the Fund's Report of Independent Registered Public Accounting Firm, are available on the SEC's website or upon request. |
(c) Investment made with cash collateral received from securities on loan. |
(d) Security or a portion of the security is on loan at period end. |
(e) Affiliated company |
Affiliated Central Funds |
Information regarding fiscal year to date income earned by the Fund from investments in Fidelity Central Funds is as follows: |
Fund | Income earned |
Fidelity Cash Central Fund | $ 32,820 |
Fidelity Securities Lending Cash Central Fund | 2,526,958 |
Total | $ 2,559,778 |
Other Affiliated Issuers |
An affiliated company is a company in which the Fund has ownership of at least 5% of the voting securities. Fiscal year to date transactions with companies which are or were affiliates are as follows: |
Affiliate | Value, beginning of period | Purchases | Sales Proceeds | Dividend Income | Value,
end of
period |
ACCO Brands Corp. | $ 50,386,144 | $ - | $ 54,199,221 | $ - | $ - |
Civitas Solutions, Inc. | - | 49,470,245 | - | - | 66,136,343 |
Rouse Properties, Inc. | 61,020,000 | 12,779,885 | - | 1,241,110 | 76,560,000 |
Standard Motor Products, Inc. | 5,166,001 | 37,876,193 | - | 350,548 | 43,273,318 |
Universal Corp. | 34,273,800 | 23,621,771 | - | 2,242,369 | 68,930,035 |
Total | $ 150,845,945 | $ 123,748,094 | $ 54,199,221 | $ 3,834,027 | $ 254,899,696 |
Other Information |
All investments are categorized as Level 1 under the Fair Value Hierarchy. The inputs or methodology used for valuing securities may not be an indication of the risk associated with investing in those securities. For more information on valuation inputs, please refer to the Investment Valuation section in the accompanying Notes to Financial Statements. |
Distribution of investments by country or territory of incorporation, as a percentage of total net assets, is as follows (Unaudited): |
United States of America | 88.8% |
Bermuda | 4.9% |
Bailiwick of Jersey | 1.7% |
United Kingdom | 1.4% |
Netherlands | 1.4% |
France | 1.1% |
Others (Individually Less Than 1%) | 0.7% |
| 100.0% |
See accompanying notes which are an integral part of the financial statements.
Annual Report
Statement of Assets and Liabilities
| | July 31, 2015 |
| | |
Assets | | |
Investment in securities, at value (including securities loaned of $78,959,780) - See accompanying schedule: Unaffiliated issuers (cost $2,038,966,810) | $ 2,530,418,893 | |
Fidelity Central Funds (cost $96,384,945) | 96,384,945 | |
Other affiliated issuers (cost $224,940,923) | 254,899,696 | |
Total Investments (cost $2,360,292,678) | | $ 2,881,703,534 |
Cash | | 734,073 |
Receivable for investments sold | | 15,532,470 |
Receivable for fund shares sold | | 1,661,236 |
Dividends receivable | | 1,471,580 |
Distributions receivable from Fidelity Central Funds | | 173,728 |
Other receivables | | 47,404 |
Total assets | | 2,901,324,025 |
| | |
Liabilities | | |
Payable for investments purchased | $ 8,089,386 | |
Payable for fund shares redeemed | 2,726,578 | |
Accrued management fee | 2,167,127 | |
Distribution and service plan fees payable | 144,360 | |
Other affiliated payables | 547,440 | |
Other payables and accrued expenses | 62,693 | |
Collateral on securities loaned, at value | 78,652,275 | |
Total liabilities | | 92,389,859 |
| | |
Net Assets | | $ 2,808,934,166 |
Net Assets consist of: | | |
Paid in capital | | $ 2,052,777,532 |
Undistributed net investment income | | 15,098,491 |
Accumulated undistributed net realized gain (loss) on investments and foreign currency transactions | | 219,647,286 |
Net unrealized appreciation (depreciation) on investments and assets and liabilities in foreign currencies | | 521,410,857 |
Net Assets | | $ 2,808,934,166 |
See accompanying notes which are an integral part of the financial statements.
Annual Report
Statement of Assets and Liabilities - continued
| | July 31, 2015 |
Calculation of Maximum Offering Price | | |
Class A: | | |
Net Asset Value and redemption price per share ($235,843,693 ÷ 12,321,881 shares) | | $ 19.14 |
| | |
Maximum offering price per share (100/94.25 of $19.14) | | $ 20.31 |
Class T: | | |
Net Asset Value and redemption price per share ($91,716,035 ÷ 4,884,772 shares) | | $ 18.78 |
| | |
Maximum offering price per share (100/96.50 of $18.78) | | $ 19.46 |
Class B: | | |
Net Asset Value and offering price per share ($3,472,809 ÷ 195,257 shares) | | $ 17.79 |
| | |
Class C: | | |
Net Asset Value and offering price per share ($64,928,190 ÷ 3,644,329 shares) | | $ 17.82 |
| | |
Small Cap Value: | | |
Net Asset Value, offering price and redemption price per share ($2,036,156,515 ÷ 104,710,600 shares) | | $ 19.45 |
| | |
Class I: | | |
Net Asset Value, offering price and redemption price per share ($376,816,924 ÷ 19,373,883 shares) | | $ 19.45 |
A Redemption price per share is equal to net asset value less any applicable contingent deferred sales charge.
See accompanying notes which are an integral part of the financial statements.
Annual Report
Financial Statements - continued
Statement of Operations
| Year ended July 31, 2015 |
| | |
Investment Income | | |
Dividends (including $3,834,027 earned from other affiliated issuers) | | $ 43,839,929 |
Special dividends | | 7,304,990 |
Interest | | 13 |
Income from Fidelity Central Funds | | 2,559,778 |
Total income | | 53,704,710 |
| | |
Expenses | | |
Management fee | | |
Basic fee | $ 19,717,517 | |
Performance adjustment | 5,968,836 | |
Transfer agent fees | 5,735,976 | |
Distribution and service plan fees | 1,818,820 | |
Accounting and security lending fees | 861,187 | |
Custodian fees and expenses | 49,188 | |
Independent trustees' compensation | 11,943 | |
Registration fees | 112,249 | |
Audit | 66,269 | |
Legal | 6,901 | |
Interest | 136 | |
Miscellaneous | 18,831 | |
Total expenses before reductions | 34,367,853 | |
Expense reductions | (889,045) | 33,478,808 |
Net investment income (loss) | | 20,225,902 |
Realized and Unrealized Gain (Loss) Net realized gain (loss) on: | | |
Investment securities: | | |
Unaffiliated issuers | 288,163,783 | |
Other affiliated issuers | (2,940,192) | |
Foreign currency transactions | 293,006 | |
Total net realized gain (loss) | | 285,516,597 |
Change in net unrealized appreciation (depreciation) on: Investment securities | 14,012,996 | |
Assets and liabilities in foreign currencies | 1 | |
Total change in net unrealized appreciation (depreciation) | | 14,012,997 |
Net gain (loss) | | 299,529,594 |
Net increase (decrease) in net assets resulting from operations | | $ 319,755,496 |
See accompanying notes which are an integral part of the financial statements.
Annual Report
Statement of Changes in Net Assets
| Year ended
July 31,
2015 | Year ended
July 31,
2014 |
Increase (Decrease) in Net Assets | | |
Operations | | |
Net investment income (loss) | $ 20,225,902 | $ 11,952,766 |
Net realized gain (loss) | 285,516,597 | 925,842,288 |
Change in net unrealized appreciation (depreciation) | 14,012,997 | (668,249,080) |
Net increase (decrease) in net assets resulting from operations | 319,755,496 | 269,545,974 |
Distributions to shareholders from net investment income | (9,146,893) | (10,662,065) |
Distributions to shareholders from net realized gain | (322,480,172) | (362,625,477) |
Total distributions | (331,627,065) | (373,287,542) |
Share transactions - net increase (decrease) | (16,898,248) | (1,289,647,794) |
Redemption fees | 149,785 | 536,076 |
Total increase (decrease) in net assets | (28,620,032) | (1,392,853,286) |
| | |
Net Assets | | |
Beginning of period | 2,837,554,198 | 4,230,407,484 |
End of period (including undistributed net investment income of $15,098,491 and undistributed net investment income of $5,856,882, respectively) | $ 2,808,934,166 | $ 2,837,554,198 |
See accompanying notes which are an integral part of the financial statements.
Annual Report
Financial Highlights - Class A
Years ended July 31, | 2015 | 2014 | 2013 | 2012 | 2011 |
Selected Per-Share Data | | | | | |
Net asset value, beginning of period | $ 19.29 | $ 19.96 | $ 14.86 | $ 15.48 | $ 13.45 |
Income from Investment Operations | | | | | |
Net investment income (loss) C | .10 L | .03 | .07 | .01 | .01F |
Net realized and unrealized gain (loss) | 2.01 | 1.24 | 5.57 | .30 | 2.22 |
Total from investment operations | 2.11 | 1.27 | 5.64 | .31 | 2.23 |
Distributions from net investment income | (.02) | (.01) | (.07) | (.01) | (.08) |
Distributions from net realized gain | (2.25) | (1.93) | (.47) | (.93) | (.12) |
Total distributions | (2.26)K | (1.94) | (.54) | (.93)J | (.20) |
Redemption fees added to paid in capitalC,H | - | - | - | - | - |
Net asset value, end of period | $ 19.14 | $ 19.29 | $ 19.96 | $ 14.86 | $ 15.48 |
Total ReturnA, B | 11.86% | 6.83% | 39.09% | 3.24% | 16.72% |
Ratios to Average Net Assets D, G | | | | | |
Expenses before reductions | 1.42% | 1.36% | 1.36% | 1.44% | 1.44% |
Expenses net of fee waivers, if any | 1.39% | 1.35% | 1.36% | 1.44% | 1.43% |
Expenses net of all reductions | 1.39% | 1.34% | 1.36% | 1.44% | 1.43% |
Net investment income (loss) | .52% L | .13% | .41% | .09% | .06%F |
Supplemental Data | | | | | |
Net assets, end of period
(000 omitted) | $ 235,844 | $ 258,183 | $ 275,265 | $ 150,285 | $ 140,707 |
Portfolio turnover rateE | 34% | 26%I | 29% | 27% | 22% |
A Total returns would have been lower if certain expenses had not been reduced during the applicable periods shown.
B Total returns do not include the effect of the sales charges.
C Calculated based on average shares outstanding during the period.
D Fees and expenses of any underlying Fidelity Central Funds are not included in the Fund's expense ratio. The Fund indirectly bears its proportionate share of the expenses of any underlying Fidelity Central Funds.
E Amount does not include the portfolio activity of any underlying Fidelity Central Funds.
F Investment income per share reflects a large, non-recurring dividend which amounted to $.06 per share. Excluding this non-recurring dividend, the ratio of net investment income (loss) to average net assets would have been (.31)%.
G Expense ratios reflect operating expenses of the class. Expenses before reductions do not reflect amounts reimbursed by the investment adviser or reductions from brokerage service arrangements or reductions from other expense offset arrangements and do not represent the amount paid by the class during periods when reimbursements or reductions occur. Expenses net of fee waivers reflect expenses after reimbursement by the investment adviser but prior to reductions from brokerage service arrangements or other expense offset arrangements. Expenses net of all reductions represent the net expenses paid by the class.
H Amount represents less than $.01 per share.
I Portfolio turnover rate excludes securities received or delivered in-kind.
J Total distributions of $.93 per share is comprised of distributions from net investment income of $.006 and distributions from net realized gain of $.925 per share.
K Total distributions of $2.26 per share is comprised of distributions from net investment income of $.016 and distributions from net realized gain of $2.248 per share.
L Investment income per share reflects a large, non-recurring dividend which amounted to $.05 per share. Excluding this non-recurring dividend, the ratio of net investment income (loss) to average net assets would have been .26%.
See accompanying notes which are an integral part of the financial statements.
Annual Report
Financial Highlights - Class T
Years ended July 31, | 2015 | 2014 | 2013 | 2012 | 2011 |
Selected Per-Share Data | | | | | |
Net asset value, beginning of period | $ 18.98 | $ 19.70 | $ 14.70 | $ 15.34 | $ 13.34 |
Income from Investment Operations | | | | | |
Net investment income (loss) C | .05J | (.02) | .03 | (.02) | (.03) F |
Net realized and unrealized gain (loss) | 1.98 | 1.23 | 5.50 | .31 | 2.20 |
Total from investment operations | 2.03 | 1.21 | 5.53 | .29 | 2.17 |
Distributions from net investment income | - | - | (.06) | - | (.05) |
Distributions from net realized gain | (2.23) | (1.93) | (.47) | (.93) | (.12) |
Total distributions | (2.23) | (1.93) | (.53) | (.93) | (.17) |
Redemption fees added to paid in capital C,H | - | - | - | - | - |
Net asset value, end of period | $ 18.78 | $ 18.98 | $ 19.70 | $ 14.70 | $ 15.34 |
Total ReturnA, B | 11.58% | 6.58% | 38.70% | 3.08% | 16.36% |
Ratios to Average Net Assets D, G | | | | | |
Expenses before reductions | 1.67% | 1.61% | 1.60% | 1.67% | 1.70% |
Expenses net of fee waivers, if any | 1.64% | 1.59% | 1.60% | 1.67% | 1.69% |
Expenses net of all reductions | 1.63% | 1.59% | 1.59% | 1.67% | 1.69% |
Net investment income (loss) | .27%J | (.11)% | .18% | (.14)% | (.19)% F |
Supplemental Data | | | | | |
Net assets, end of period
(000 omitted) | $ 91,716 | $ 100,975 | $ 107,444 | $ 57,514 | $ 55,845 |
Portfolio turnover rateE | 34% | 26% I | 29% | 27% | 22% |
A Total returns would have been lower if certain expenses had not been reduced during the applicable periods shown.
B Total returns do not include the effect of the sales charges.
C Calculated based on average shares outstanding during the period.
D Fees and expenses of any underlying Fidelity Central Funds are not included in the Fund's expense ratio. The Fund indirectly bears its proportionate share of the expenses of any underlying Fidelity Central Funds.
E Amount does not include the portfolio activity of any underlying Fidelity Central Funds.
F Investment income per share reflects a large, non-recurring dividend which amounted to $.06 per share. Excluding this non-recurring dividend, the ratio of net investment income (loss) to average net assets would have been (.57)%.
G Expense ratios reflect operating expenses of the class. Expenses before reductions do not reflect amounts reimbursed by the investment adviser or reductions from brokerage service arrangements or reductions from other expense offset arrangements and do not represent the amount paid by the class during periods when reimbursements or reductions occur. Expenses net of fee waivers reflect expenses after reimbursement by the investment adviser but prior to reductions from brokerage service arrangements or other expense offset arrangements. Expenses net of all reductions represent the net expenses paid by the class.
H Amount represents less than $.01 per share.
I Portfolio turnover rate excludes securities received or delivered in-kind.
J Investment income per share reflects a large, non-recurring dividend which amounted to $.05 per share. Excluding this non-recurring dividend, the ratio of net investment income (loss) to average net assets would have been .01%.
See accompanying notes which are an integral part of the financial statements.
Annual Report
Financial Highlights - Class B
Years ended July 31, | 2015 | 2014 | 2013 | 2012 | 2011 |
Selected Per-Share Data | | | | | |
Net asset value, beginning of period | $ 18.18 | $ 19.06 | $ 14.27 | $ 15.00 | $ 13.08 |
Income from Investment Operations | | | | | |
Net investment income (loss) C | (.06)J | (.13) | (.06) | (.09) | (.10) F |
Net realized and unrealized gain (loss) | 1.90 | 1.18 | 5.34 | .29 | 2.15 |
Total from investment operations | 1.84 | 1.05 | 5.28 | .20 | 2.05 |
Distributions from net investment income | - | - | (.02) | - | (.01) |
Distributions from net realized gain | (2.23) | (1.93) | (.47) | (.93) | (.12) |
Total distributions | (2.23) | (1.93) | (.49) | (.93) | (.13) |
Redemption fees added to paid in capitalC,H | - | - | - | - | - |
Net asset value, end of period | $ 17.79 | $ 18.18 | $ 19.06 | $ 14.27 | $ 15.00 |
Total ReturnA, B | 10.94% | 5.92% | 38.07% | 2.51% | 15.80% |
Ratios to Average Net Assets D, G | | | | | |
Expenses before reductions | 2.25% | 2.18% | 2.15% | 2.19% | 2.20% |
Expenses net of fee waivers, if any | 2.23% | 2.17% | 2.15% | 2.19% | 2.19% |
Expenses net of all reductions | 2.22% | 2.16% | 2.14% | 2.19% | 2.19% |
Net investment income (loss) | (.32)%J | (.69)% | (.37)% | (.66)% | (.69)%F |
Supplemental Data | | | | | |
Net assets, end of period (000 omitted) | $ 3,473 | $ 4,808 | $ 7,052 | $ 6,675 | $ 8,549 |
Portfolio turnover rateE | 34% | 26%I | 29% | 27% | 22% |
A Total returns would have been lower if certain expenses had not been reduced during the applicable periods shown.
B Total returns do not include the effect of the contingent deferred sales charge.
C Calculated based on average shares outstanding during the period.
D Fees and expenses of any underlying Fidelity Central Funds are not included in the Fund's expense ratio. The Fund indirectly bears its proportionate share of the expenses of any underlying Fidelity Central Funds.
E Amount does not include the portfolio activity of any underlying Fidelity Central Funds.
F Investment income per share reflects a large, non-recurring dividend which amounted to $.06 per share. Excluding this non-recurring dividend, the ratio of net investment income (loss) to average net assets would have been (1.07)%.
G Expense ratios reflect operating expenses of the class. Expenses before reductions do not reflect amounts reimbursed by the investment adviser or reductions from brokerage service arrangements or reductions from other expense offset arrangements and do not represent the amount paid by the class during periods when reimbursements or reductions occur. Expenses net of fee waivers reflect expenses after reimbursement by the investment adviser but prior to reductions from brokerage service arrangements or other expense offset arrangements. Expenses net of all reductions represent the net expenses paid by the class.
H Amount represents less than $.01 per share.
I Portfolio turnover rate excludes securities received or delivered in-kind.
J Investment income per share reflects a large, non-recurring dividend which amounted to $.05 per share. Excluding this non-recurring dividend, the ratio of net investment income (loss) to average net assets would have been (.58)%.
See accompanying notes which are an integral part of the financial statements.
Annual Report
Financial Highlights - Class C
Years ended July 31, | 2015 | 2014 | 2013 | 2012 | 2011 |
Selected Per-Share Data | | | | | |
Net asset value, beginning of period | $ 18.19 | $ 19.06 | $ 14.28 | $ 15.01 | $ 13.08 |
Income from Investment Operations | | | | | |
Net investment income (loss) C | (.04) J | (.12) | (.06) | (.09) | (.10) F |
Net realized and unrealized gain (loss) | 1.90 | 1.18 | 5.34 | .29 | 2.17 |
Total from investment operations | 1.86 | 1.06 | 5.28 | .20 | 2.07 |
Distributions from net investment income | - | - | (.03) | - | (.02) |
Distributions from net realized gain | (2.23) | (1.93) | (.47) | (.93) | (.12) |
Total distributions | (2.23) | (1.93) | (.50) | (.93) | (.14) |
Redemption fees added to paid in capital C,H | - | - | - | - | - |
Net asset value, end of period | $ 17.82 | $ 18.19 | $ 19.06 | $ 14.28 | $ 15.01 |
Total ReturnA, B | 11.05% | 5.97% | 38.00% | 2.52% | 15.91% |
Ratios to Average Net Assets D, G | | | | | |
Expenses before reductions | 2.19% | 2.12% | 2.13% | 2.19% | 2.18% |
Expenses net of fee waivers, if any | 2.16% | 2.11% | 2.13% | 2.19% | 2.18% |
Expenses net of all reductions | 2.15% | 2.10% | 2.12% | 2.19% | 2.18% |
Net investment income (loss) | (.25)% J | (.63)% | (.35)% | (.66)% | (.68)% F |
Supplemental Data | | | | | |
Net assets, end of period (000 omitted) | $ 64,928 | $ 70,541 | $ 76,018 | $ 47,265 | $ 47,457 |
Portfolio turnover rateE | 34% | 26% I | 29% | 27% | 22% |
A Total returns would have been lower if certain expenses had not been reduced during the applicable periods shown.
B Total returns do not include the effect of the contingent deferred sales charge.
C Calculated based on average shares outstanding during the period.
D Fees and expenses of any underlying Fidelity Central Funds are not included in the Fund's expense ratio. The Fund indirectly bears its proportionate share of the expenses of any underlying Fidelity Central Funds.
E Amount does not include the portfolio activity of any underlying Fidelity Central Funds.
F Investment income per share reflects a large, non-recurring dividend which amounted to $.06 per share. Excluding this non-recurring dividend, the ratio of net investment income (loss) to average net assets would have been (1.06)%.
G Expense ratios reflect operating expenses of the class. Expenses before reductions do not reflect amounts reimbursed by the investment adviser or reductions from brokerage service arrangements or reductions from other expense offset arrangements and do not represent the amount paid by the class during periods when reimbursements or reductions occur. Expenses net of fee waivers reflect expenses after reimbursement by the investment adviser but prior to reductions from brokerage service arrangements or other expense offset arrangements. Expenses net of all reductions represent the net expenses paid by the class.
H Amount represents less than $.01 per share.
I Portfolio turnover rate excludes securities received or delivered in-kind.
J Investment income per share reflects a large, non-recurring dividend which amounted to $.05 per share. Excluding this non-recurring dividend, the ratio of net investment income (loss) to average net assets would have been (.51)%.
See accompanying notes which are an integral part of the financial statements.
Annual Report
Financial Highlights - Small Cap Value
Years ended July 31, | 2015 | 2014 | 2013 | 2012 | 2011 |
Selected Per-Share Data | | | | | |
Net asset value, beginning of period | $ 19.57 | $ 20.22 | $ 15.05 | $ 15.62 | $ 13.56 |
Income from Investment Operations | | | | | |
Net investment income (loss) B | .15 I | .08 | .12 | .06 | .06E |
Net realized and unrealized gain (loss) | 2.05 | 1.26 | 5.63 | .32 | 2.23 |
Total from investment operations | 2.20 | 1.34 | 5.75 | .38 | 2.29 |
Distributions from net investment income | (.07) | (.06) | (.11) | (.02) | (.10) |
Distributions from net realized gain | (2.25) | (1.93) | (.47) | (.93) | (.13) |
Total distributions | (2.32) | (1.99) | (.58) | (.95) | (.23) |
Redemption fees added to paid in capitalB,G | - | - | - | - | - |
Net asset value, end of period | $ 19.45 | $ 19.57 | $ 20.22 | $ 15.05 | $ 15.62 |
Total ReturnA | 12.18% | 7.12% | 39.45% | 3.67% | 17.03% |
Ratios to Average Net Assets C, F | | | | | |
Expenses before reductions | 1.15% | 1.08% | 1.07% | 1.13% | 1.13% |
Expenses net of fee waivers, if any | 1.12% | 1.06% | 1.07% | 1.13% | 1.13% |
Expenses net of all reductions | 1.12% | 1.06% | 1.06% | 1.13% | 1.13% |
Net investment income (loss) | .78% I | .41% | .71% | .41% | .37%E |
Supplemental Data | | | | | |
Net assets, end of period
(000 omitted) | $ 2,036,157 | $ 2,060,546 | $ 2,672,854 | $ 1,756,962 | $ 1,899,805 |
Portfolio turnover rateD | 34% | 26%H | 29% | 27% | 22% |
A Total returns would have been lower if certain expenses had not been reduced during the applicable periods shown.
B Calculated based on average shares outstanding during the period.
C Fees and expenses of any underlying Fidelity Central Funds are not included in the Fund's expense ratio. The Fund indirectly bears its proportionate share of the expenses of any underlying Fidelity Central Funds.
D Amount does not include the portfolio activity of any underlying Fidelity Central Funds.
E Investment income per share reflects a large, non-recurring dividend which amounted to $.06 per share. Excluding this non-recurring dividend, the ratio of net investment income (loss) to average net assets would have been (.01)%.
F Expense ratios reflect operating expenses of the class. Expenses before reductions do not reflect amounts reimbursed by the investment adviser or reductions from brokerage service arrangements or reductions from other expense offset arrangements and do not represent the amount paid by the class during periods when reimbursements or reductions occur. Expenses net of fee waivers reflect expenses after reimbursement by the investment adviser but prior to reductions from brokerage service arrangements or other expense offset arrangements. Expenses net of all reductions represent the net expenses paid by the class.
G Amount represents less than $.01 per share.
H Portfolio turnover rate excludes securities received or delivered in-kind.
I Investment income per share reflects a large, non-recurring dividend which amounted to $.05 per share. Excluding this non-recurring dividend, the ratio of net investment income (loss) to average net assets would have been .53%.
See accompanying notes which are an integral part of the financial statements.
Annual Report
Financial Highlights - Class I
Years ended July 31, | 2015 | 2014 | 2013 | 2012 | 2011 |
Selected Per-Share Data | | | | | |
Net asset value, beginning of period | $ 19.57 | $ 20.23 | $ 15.05 | $ 15.63 | $ 13.58 |
Income from Investment Operations | | | | | |
Net investment income (loss) B | .15 I | .08 | .12 | .06 | .06E |
Net realized and unrealized gain (loss) | 2.05 | 1.25 | 5.65 | .31 | 2.23 |
Total from investment operations | 2.20 | 1.33 | 5.77 | .37 | 2.29 |
Distributions from net investment income | (.07) | (.06) | (.12) | (.02) | (.11) |
Distributions from net realized gain | (2.25) | (1.93) | (.47) | (.93) | (.13) |
Total distributions | (2.32) | (1.99) | (.59) | (.95) | (.24) |
Redemption fees added to paid in capital B,G | - | - | - | - | - |
Net asset value, end of period | $ 19.45 | $ 19.57 | $ 20.23 | $ 15.05 | $ 15.63 |
Total ReturnA | 12.17% | 7.08% | 39.54% | 3.59% | 17.02% |
Ratios to Average Net Assets C, F | | | | | |
Expenses before reductions | 1.15% | 1.09% | 1.07% | 1.14% | 1.10% |
Expenses net of fee waivers, if any | 1.12% | 1.07% | 1.07% | 1.14% | 1.10% |
Expenses net of all reductions | 1.12% | 1.07% | 1.06% | 1.14% | 1.10% |
Net investment income (loss) | .79%I | .40% | .70% | .39% | .39%E |
Supplemental Data | | | | | |
Net assets, end of period
(000 omitted) | $ 376,817 | $ 342,500 | $ 359,582 | $ 138,981 | $ 101,565 |
Portfolio turnover rateD | 34% | 26% H | 29% | 27% | 22% |
A Total returns would have been lower if certain expenses had not been reduced during the applicable periods shown.
B Calculated based on average shares outstanding during the period.
C Fees and expenses of any underlying Fidelity Central Funds are not included in the Fund's expense ratio. The Fund indirectly bears its proportionate share of the expenses of any underlying Fidelity Central Funds.
D Amount does not include the portfolio activity of any underlying Fidelity Central Funds.
E Investment income per share reflects a large, non-recurring dividend which amounted to $.06 per share. Excluding this non-recurring dividend, the ratio of net investment income (loss) to average net assets would have been .01%.
F Expense ratios reflect operating expenses of the class. Expenses before reductions do not reflect amounts reimbursed by the investment adviser or reductions from brokerage service arrangements or reductions from other expense offset arrangements and do not represent the amount paid by the class during periods when reimbursements or reductions occur. Expenses net of fee waivers reflect expenses after reimbursement by the investment adviser but prior to reductions from brokerage service arrangements or other expense offset arrangements. Expenses net of all reductions represent the net expenses paid by the class.
G Amount represents less than $.01 per share.
H Portfolio turnover rate excludes securities received or delivered in-kind.
I Investment income per share reflects a large, non-recurring dividend which amounted to $.05 per share. Excluding this non-recurring dividend, the ratio of net investment income (loss) to average net assets would have been .53%.
See accompanying notes which are an integral part of the financial statements.
Annual Report
For the period ended July 31, 2015
1. Organization.
Fidelity® Small Cap Value Fund (the Fund) is a fund of Fidelity Securities Fund (the Trust) and is authorized to issue an unlimited number of shares. The Trust is registered under the Investment Company Act of 1940, as amended (the 1940 Act), as an open-end management investment company organized as a Massachusetts business trust. The Fund offers Class A, Class T, Class C, Small Cap Value and Class I (formerly Institutional Class) shares, each of which, along with Class B shares, has equal rights as to assets and voting privileges. Class B shares are closed to new accounts and additional purchases, except for exchanges and reinvestments. The Fund's other share classes are also closed to new accounts with certain exceptions. The Fund offered Class F shares during the period June 26, 2009 through November 19, 2013 and all outstanding shares were redeemed by November 19, 2013. Each class has exclusive voting rights with respect to matters that affect that class. Class B shares will automatically convert to Class A shares after a holding period of seven years from the initial date of purchase.
2. Investments in Fidelity Central Funds.
The Fund invests in Fidelity Central Funds, which are open-end investment companies generally available only to other investment companies and accounts managed by the investment adviser and its affiliates. The Fund's Schedule of Investments lists each of the Fidelity Central Funds held as of period end, if any, as an investment of the Fund, but does not include the underlying holdings of each Fidelity Central Fund. As an Investing Fund, the Fund indirectly bears its proportionate share of the expenses of the underlying Fidelity Central Funds.
The Money Market Central Funds seek preservation of capital and current income and are managed by Fidelity Investments Money Management, Inc. (FIMM), an affiliate of the investment adviser. Annualized expenses of the Money Market Central Funds as of their most recent shareholder report date are less than .01%.
A complete unaudited list of holdings for each Fidelity Central Fund is available upon request or at the Securities and Exchange Commission (the SEC) website at www.sec.gov. In addition, the financial statements of the Fidelity Central Funds, which are not covered by the Fund's Report of Independent Registered Public Accounting Firm, are available on the SEC website or upon request.
Annual Report
3. Significant Accounting Policies.
The financial statements have been prepared in conformity with accounting principles generally accepted in the United States of America (GAAP), which require management to make certain estimates and assumptions at the date of the financial statements. Actual results could differ from those estimates. Subsequent events, if any, through the date that the financial statements were issued have been evaluated in the preparation of the financial statements. The following summarizes the significant accounting policies of the Fund:
Investment Valuation. Investments are valued as of 4:00 p.m. Eastern time on the last calendar day of the period. The Board of Trustees (the Board) has delegated the day to day responsibility for the valuation of the Fund's investments to the Fidelity Management & Research Company (FMR) Fair Value Committee (the Committee). In accordance with valuation policies and procedures approved by the Board, the Fund attempts to obtain prices from one or more third party pricing vendors or brokers to value its investments. When current market prices, quotations or currency exchange rates are not readily available or reliable, investments will be fair valued in good faith by the Committee, in accordance with procedures adopted by the Board. Factors used in determining fair value vary by investment type and may include market or investment specific events. The frequency with which these procedures are used cannot be predicted and they may be utilized to a significant extent. The Committee oversees the Fund's valuation policies and procedures and reports to the Board on the Committee's activities and fair value determinations. The Board monitors the appropriateness of the procedures used in valuing the Fund's investments and ratifies the fair value determinations of the Committee.
The Fund categorizes the inputs to valuation techniques used to value its investments into a disclosure hierarchy consisting of three levels as shown below:
Level 1 - quoted prices in active markets for identical investments
Level 2 - other significant observable inputs (including quoted prices for similar investments, interest rates, prepayment speeds, etc.)
Level 3 - unobservable inputs (including the Fund's own assumptions based on the best information available)
Annual Report
Notes to Financial Statements - continued
3. Significant Accounting Policies - continued
Investment Valuation - continued
Valuation techniques used to value the Fund's investments by major category are as follows:
Equity securities, including restricted securities, for which market quotations are readily available, are valued at the last reported sale price or official closing price as reported by a third party pricing vendor on the primary market or exchange on which they are traded and are categorized as Level 1 in the hierarchy. In the event there were no sales during the day or closing prices are not available, securities are valued at the last quoted bid price or may be valued using the last available price and are generally categorized as Level 2 in the hierarchy. For foreign equity securities, when market or security specific events arise, comparisons to the valuation of American Depositary Receipts (ADRs), futures contracts, Exchange-Traded Funds (ETFs) and certain indexes as well as quoted prices for similar securities may be used and would be categorized as Level 2 in the hierarchy. Utilizing these techniques may result in transfers between Level 1 and Level 2. For equity securities, including restricted securities, where observable inputs are limited, assumptions about market activity and risk are used and these securities may be categorized as Level 3 in the hierarchy.
Investments in open-end mutual funds, including the Fidelity Central Funds, are valued at their closing net asset value (NAV) each business day and are categorized as Level 1 in the hierarchy.
Changes in valuation techniques may result in transfers in or out of an assigned level within the disclosure hierarchy.
Foreign Currency. The Fund may use foreign currency contracts to facilitate transactions in foreign-denominated securities. Gains and losses from these transactions may arise from changes in the value of the foreign currency or if the counterparties do not perform under the contracts' terms.
Foreign-denominated assets, including investment securities, and liabilities are translated into U.S. dollars at the exchange rates at period end. Purchases and sales of investment securities, income and dividends received and expenses denominated in foreign currencies are translated into U.S. dollars at the exchange rate in effect on the transaction date.
The effects of exchange rate fluctuations on investments are included with the net realized and unrealized gain (loss) on investment securities. Other foreign currency transactions resulting in realized and unrealized gain (loss) are disclosed separately.
Annual Report
3. Significant Accounting Policies - continued
Investment Transactions and Income. For financial reporting purposes, the Fund's investment holdings and NAV include trades executed through the end of the last business day of the period. The NAV per share for processing shareholder transactions is calculated as of the close of business of the New York Stock Exchange (NYSE), normally 4:00 p.m. Eastern time and includes trades executed through the end of the prior business day. Gains and losses on securities sold are determined on the basis of identified cost and may include proceeds received from litigation. Dividend income is recorded on the ex-dividend date, except for certain dividends from foreign securities where the ex-dividend date may have passed, which are recorded as soon as the Fund is informed of the ex-dividend date. Non-cash dividends included in dividend income, if any, are recorded at the fair market value of the securities received. Income and capital gain distributions from Fidelity Central Funds, if any, are recorded on the ex-dividend date. Distributions received on securities that represent a return of capital or capital gain are recorded as a reduction of cost of investments and/or as a realized gain. Subsequent to ex-dividend date the Fund determines the components of these distributions, based upon receipt of tax filings or other correspondence relating to the underlying investment. Large, non-recurring dividends recognized by the Fund are presented separately on the Statement of Operations as "Special Dividends" and the impact of these dividends is presented in the Financial Highlights. Interest income is accrued as earned and includes coupon interest and amortization of premium and accretion of discount on debt securities as applicable. Investment income is recorded net of foreign taxes withheld where recovery of such taxes is uncertain.
Class Allocations and Expenses. Investment income, realized and unrealized capital gains and losses, common expenses of the Fund, and certain fund-level expense reductions, if any, are allocated daily on a pro-rata basis to each class based on the relative net assets of each class to the total net assets of the Fund. Each class differs with respect to transfer agent and distribution and service plan fees incurred. Certain expense reductions may also differ by class. For the reporting period, the allocated portion of income and expenses to each class as a percent of its average net assets may vary due to the timing of recording these transactions in relation to fluctuating net assets of the classes. Expenses directly attributable to a fund are charged to that fund. Expenses attributable to more than one fund are allocated among the respective funds on the basis of relative net assets or other appropriate methods. Expense estimates are accrued in the period to which they relate and adjustments are made when actual amounts are known.
Income Tax Information and Distributions to Shareholders. Each year, the Fund intends to qualify as a regulated investment company under Subchapter M of the Internal Revenue Code, including distributing substantially all of its taxable income and realized gains. As a result, no provision for U.S. Federal income taxes is required. As of July 31, 2015, the Fund did not have any unrecognized tax benefits in the financial
Annual Report
Notes to Financial Statements - continued
3. Significant Accounting Policies - continued
Income Tax Information and Distributions to Shareholders - continued
statements; nor is the Fund aware of any tax positions for which it is reasonably possible that the total amounts of unrecognized tax benefits will significantly change in the next twelve months. The Fund files a U.S. federal tax return, in addition to state and local tax returns as required. The Fund's federal income tax returns are subject to examination by the Internal Revenue Service (IRS) for a period of three fiscal years after they are filed. State and local tax returns may be subject to examination for an additional fiscal year depending on the jurisdiction. Foreign taxes are provided for based on the Fund's understanding of the tax rules and rates that exist in the foreign markets in which it invests.
Distributions are declared and recorded on the ex-dividend date. Income dividends and capital gain distributions are declared separately for each class. Income and capital gain distributions are determined in accordance with income tax regulations, which may differ from GAAP. In addition, the Fund claimed a portion of the payment made to redeeming shareholders as a distribution for income tax purposes.
Capital accounts within the financial statements are adjusted for permanent book-tax differences. These adjustments have no impact on net assets or the results of operations. Capital accounts are not adjusted for temporary book-tax differences which will reverse in a subsequent period.
Book-tax differences are primarily due to foreign currency transactions, passive foreign investment companies (PFIC) and losses deferred due to wash sales.
The federal tax cost of investment securities and unrealized appreciation (depreciation) as of period end were as follows:
Gross unrealized appreciation | $ 614,205,042 |
Gross unrealized depreciation | (96,595,356) |
Net unrealized appreciation (depreciation) on securities | $ 517,609,686 |
| |
Tax cost | $ 2,364,093,848 |
The tax-based components of distributable earnings as of period end were as follows:
Undistributed ordinary income | $ 15,098,490 |
Undistributed long-term capital gain | $ 223,448,456 |
Net unrealized appreciation (depreciation) on securities and other investments | $ 517,609,686 |
Annual Report
3. Significant Accounting Policies - continued
Income Tax Information and Distributions to Shareholders - continued
The tax character of distributions paid was as follows:
| July 31, 2015 | July 31, 2014 |
Ordinary Income | $ 12,432,052 | $ 10,662,065 |
Long-term Capital Gains | 319,195,013 | 362,625,476 |
Total | $ 331,627,065 | $ 373,287,541 |
Short-Term Trading (Redemption) Fees. Shares held by investors in the Fund less than 90 days may have been subject to a redemption fee equal to 1.50% of the NAV of shares redeemed. All redemption fees, which reduce the proceeds of the shareholder redemption, are retained by the Fund and accounted for as an addition to paid in capital.
4. Purchases and Sales of Investments.
Purchases and sales of securities, other than short-term securities, aggregated $962,585,438 and $1,295,483,282, respectively.
5. Fees and Other Transactions with Affiliates.
Management Fee. Fidelity Management & Research Company (the investment adviser) and its affiliates provide the Fund with investment management related services for which the Fund pays a monthly management fee. The management fee is the sum of an individual fund fee rate that is based on an annual rate of .45% of the Fund's average net assets and an annualized group fee rate that averaged .25% during the period. The group fee rate is based upon the average net assets of all the mutual funds advised by the investment adviser, including any mutual funds previously advised by the investment adviser that are currently advised by Fidelity SelectCo, LLC, an affiliate of the investment adviser. The group fee rate decreases as assets under management increase and increases as assets under management decrease. In addition, the management fee is subject to a performance adjustment (up to a maximum of ± .20% of the Fund's average net assets over a 36 month performance period). The upward or downward adjustment to the management fee is based on the relative investment performance of Small Cap Value as compared to its benchmark index, the Russell 2000 Value Index, over the same 36 month performance period. For the reporting period, the total annual management fee rate, including the performance adjustment, was .91% of the Fund's average net assets. The performance adjustment included in the management fee rate may be higher or lower than the maximum performance adjustment rate due to the difference between the average net assets for the reporting and performance periods.
During the period, the investment adviser waived a portion of its management fee as described in the Expense Reductions note.
Annual Report
Notes to Financial Statements - continued
5. Fees and Other Transactions with Affiliates - continued
Distribution and Service Plan Fees. In accordance with Rule 12b-1 of the 1940 Act, the Fund has adopted separate Distribution and Service Plans for each class of shares. Certain classes pay Fidelity Distributors Corporation (FDC), an affiliate of the investment adviser, separate Distribution and Service Fees, each of which is based on an annual percentage of each class' average net assets. In addition, FDC may pay financial intermediaries for selling shares of the Fund and providing shareholder support services. For the period, the Distribution and Service Fee rates, total fees and amounts retained by FDC were as follows:
| Distribution
Fee | Service
Fee | Total Fees | Retained
by FDC |
Class A | -% | .25% | $ 615,096 | $ 2,763 |
Class T | .25% | .25% | 487,452 | 894 |
Class B | .75% | .25% | 41,583 | 31,187 |
Class C | .75% | .25% | 674,689 | 13,458 |
| | | $ 1,818,820 | $ 48,302 |
Sales Load. FDC may receive a front-end sales charge of up to 5.75% for selling Class A shares and 3.50% for selling Class T shares, some of which is paid to financial intermediaries for selling shares of the Fund. Depending on the holding period, FDC may receive contingent deferred sales charges levied on Class A, Class T, Class B, and Class C redemptions. The deferred sales charges range from 5.00% to 1.00% for Class B shares, 1.00% for Class C shares, 1.00% for certain purchases of Class A shares and .25% for certain purchases of Class T shares.
For the period, sales charge amounts retained by FDC were as follows:
| Retained
by FDC |
Class A | $ 7,832 |
Class T | 3,175 |
Class B* | 2,039 |
Class C* | 847 |
| $ 13,893 |
* When Class B and Class C shares are initially sold, FDC pays commissions from its own resources to financial intermediaries through which the sales are made.
Annual Report
5. Fees and Other Transactions with Affiliates - continued
Transfer Agent Fees. Fidelity Investments Institutional Operations Company, Inc., (FIIOC), an affiliate of the investment adviser, is the transfer, dividend disbursing and shareholder servicing agent for each class of the Fund. FIIOC receives account fees and asset-based fees that vary according to the account size and type of account of the shareholders of the respective classes of the Fund. FIIOC pays for typesetting, printing and mailing of shareholder reports, except proxy statements.
For the period, transfer agent fees for each class were as follows:
| Amount | % of
Class-Level Average
Net Assets |
Class A | $ 534,282 | .22 |
Class T | 207,942 | .21 |
Class B | 12,447 | .30 |
Class C | 157,218 | .23 |
Small Cap Value | 4,104,906 | .20 |
Class I | 719,181 | .20 |
| $ 5,735,976 | |
Accounting and Security Lending Fees. Fidelity Service Company, Inc. (FSC), an affiliate of the investment adviser, maintains the Fund's accounting records. The accounting fee is based on the level of average net assets for each month. Under a separate contract, FSC administers the security lending program. The security lending fee is based on the number and duration of lending transactions.
Brokerage Commissions. The Fund placed a portion of its portfolio transactions with brokerage firms which are affiliates of the investment adviser. Brokerage commissions are included in net realized gain (loss) and change in net unrealized appreciation (depreciation) in the Statement of Operations. The commissions paid to these affiliated firms were $24,207 for the period.
Interfund Lending Program. Pursuant to an Exemptive Order issued by the SEC, the Fund, along with other registered investment companies having management contracts with FMR or other affiliated entities of FMR, may participate in an interfund lending program. This program provides an alternative credit facility allowing the funds to borrow from, or lend money to, other participating affiliated funds. At period end there were no interfund loans outstanding. The Fund's activity in this program during the period for which loans were outstanding was as follows:
Borrower or Lender | Average Loan
Balance | Weighted Average Interest Rate | Interest Expense |
Borrower | $ 14,895,000 | .33% | $ 136 |
Annual Report
Notes to Financial Statements - continued
6. Committed Line of Credit.
The Fund participates with other funds managed by the investment adviser or an affiliate in a $4.25 billion credit facility (the "line of credit") to be utilized for temporary or emergency purposes to fund shareholder redemptions or for other short-term liquidity purposes. The Fund has agreed to pay commitment fees on its pro-rata portion of the line of credit, which amounted to $4,108 and is reflected in Miscellaneous expenses on the Statement of Operations. During the period, the Fund did not borrow on this line of credit.
7. Security Lending.
The Fund lends portfolio securities through a lending agent from time to time in order to earn additional income. For equity securities, a lending agent is used and may loan securities to certain qualified borrowers, including Fidelity Capital Markets (FCM), a broker-dealer affiliated with the Fund. On the settlement date of the loan, the Fund receives collateral (in the form of U.S. Treasury obligations, letters of credit and/or cash) against the loaned securities and maintains collateral in an amount not less than 100% of the market value of the loaned securities during the period of the loan. The market value of the loaned securities is determined at the close of business of the Fund and any additional required collateral is delivered to the Fund on the next business day. If the borrower defaults on its obligation to return the securities loaned because of insolvency or other reasons, the Fund may apply collateral received from the borrower against the obligation. The Fund may experience delays and costs in recovering the securities loaned. Any cash collateral received is invested in the Fidelity Securities Lending Cash Central Fund. The value of loaned securities and cash collateral at period end are disclosed on the Fund's Statement of Assets and Liabilities. Security lending income represents the income earned on investing cash collateral, less rebates paid to borrowers and any lending agent fees associated with the loan, plus any premium payments received for lending certain types of securities. Security lending income is presented in the Statement of Operations as a component of income from Fidelity Central Funds, and includes $9,303 from securities loaned to FCM. Total security lending income during the period amounted to $2,526,958.
8. Expense Reductions.
The investment adviser contractually agreed to waive a portion of the Fund's management fee until May 31, 2015. During the period, this waiver reduced the Fund's management fee by $673,000. Effective June 1, 2015 the waiver was discontinued.
Annual Report
8. Expense Reductions - continued
Commissions paid to certain brokers with whom the investment adviser, or its affiliates, places trades on behalf of the Fund include an amount in addition to trade execution, which may be rebated back to the Fund to offset certain expenses. This amount totaled $131,172 for the period.
In addition, during the period the investment adviser reimbursed/waived a portion of fund-level operating expenses in the amount of $11,488 and a portion of class-level operating expenses as follows:
| Amount |
Class A | $ 5,981 |
Class T | 2,343 |
Class B | 9 |
Class C | 1,654 |
Small Cap Value | 55,260 |
Class I | 8,138 |
| $ 73,385 |
9. Distributions to Shareholders.
Distributions to shareholders of each class were as follows:
Years ended July 31, | 2015 | 2014 A |
From net investment income | | |
Class A | $ 207,059 | $ 171,608 |
Small Cap Value | 7,655,420 | 7,284,772 |
Class F | - | 2,011,606 |
Class I | 1,284,414 | 1,194,079 |
Total | $ 9,146,893 | $ 10,662,065 |
From net realized gain | | |
Class A | $ 29,002,450 | $ 26,941,211 |
Class T | 11,758,984 | 10,672,388 |
Class B | 573,044 | 695,128 |
Class C | 8,461,258 | 7,761,033 |
Small Cap Value | 233,242,234 | 236,012,007 |
Class F | - | 44,973,770 |
Class I | 39,442,202 | 35,569,940 |
Total | $ 322,480,172 | $ 362,625,477 |
A All Class F Shares were redeemed on November 19, 2013.
Annual Report
Notes to Financial Statements - continued
10. Share Transactions.
Share transactions for each class were as follows and may contain automatic conversions between classes or exchanges between funds:
| Shares | Dollars |
Years ended July 31, | 2015 | 2014 A | 2015 | 2014 A |
Class A | | | | |
Shares sold | 1,619,679 | 2,364,232 | $ 30,035,137 | $ 46,165,166 |
Reinvestment of distributions | 1,578,405 | 1,371,738 | 28,466,035 | 25,837,208 |
Shares redeemed | (4,261,712) | (4,138,116) | (79,564,907) | (80,966,690) |
Net increase (decrease) | (1,063,628) | (402,146) | $ (21,063,735) | $ (8,964,316) |
Class T | | | | |
Shares sold | 599,331 | 987,146 | $ 10,911,777 | $ 19,000,773 |
Reinvestment of distributions | 655,613 | 566,918 | 11,618,861 | 10,525,159 |
Shares redeemed | (1,691,524) | (1,685,516) | (30,859,052) | (32,399,109) |
Net increase (decrease) | (436,580) | (131,452) | $ (8,328,414) | $ (2,873,177) |
Class B | | | | |
Shares sold | 5,056 | 9,527 | $ 89,676 | $ 174,532 |
Reinvestment of distributions | 31,870 | 33,965 | 537,830 | 607,035 |
Shares redeemed | (106,178) | (149,029) | (1,834,363) | (2,755,578) |
Net increase (decrease) | (69,252) | (105,537) | $ (1,206,857) | $ (1,974,011) |
Class C | | | | |
Shares sold | 167,565 | 268,818 | $ 2,897,201 | $ 4,960,750 |
Reinvestment of distributions | 447,025 | 378,946 | 7,553,140 | 6,778,684 |
Shares redeemed | (847,704) | (758,615) | (14,671,382) | (14,057,302) |
Net increase (decrease) | (233,114) | (110,851) | $ (4,221,041) | $ (2,317,868) |
Small Cap Value | | | | |
Shares sold | 13,163,441 | 19,542,379 | $ 248,872,334 | $ 386,966,432 |
Reinvestment of distributions | 12,098,173 | 11,711,859 | 221,448,638 | 222,752,806 |
Shares redeemed | (25,848,809) | (58,131,122)B | (487,056,437) | (1,153,341,425)B |
Net increase (decrease) | (587,195) | (26,876,884) | $ (16,735,465) | $ (543,622,187) |
Class F | | | | |
Shares sold | - | 879,716 | $ - | $ 17,395,091 |
Reinvestment of distributions | - | 2,497,893 | - | 46,985,376 |
Shares redeemed | - | (39,476,567)B | - | (787,183,278)B |
Net increase (decrease) | - | (36,098,958) | $ - | $ (722,802,811) |
Annual Report
10. Share Transactions - continued
| Shares | Dollars |
Years ended July 31, | 2015 | 2014 A | 2015 | 2014 A |
Class I | | | | |
Shares sold | 4,194,067 | 4,292,555 | $ 79,803,869 | $ 84,987,281 |
Reinvestment of distributions | 1,996,970 | 1,739,424 | 36,554,847 | 33,193,654 |
Shares redeemed | (4,316,971) | (6,306,791) | (81,701,452) | (125,274,359) |
Net increase (decrease) | 1,874,066 | (274,812) | $ 34,657,264 | $ (7,093,424) |
A All Class F Shares were redeemed on November 19, 2013.
B Amount includes in-kind redemptions.
11. Other.
The Fund's organizational documents provide former and current trustees and officers with a limited indemnification against liabilities arising in connection with the performance of their duties to the Fund. In the normal course of business, the Fund may also enter into contracts that provide general indemnifications. The Fund's maximum exposure under these arrangements is unknown as this would be dependent on future claims that may be made against the Fund. The risk of material loss from such claims is considered remote.
Annual Report
To the Trustees of Fidelity Securities Fund and the Shareholders of Fidelity Small Cap Value Fund:
In our opinion, the accompanying statement of assets and liabilities, including the schedule of investments, and the related statements of operations and of changes in net assets and the financial highlights present fairly, in all material respects, the financial position of Fidelity Small Cap Value Fund (a fund of Fidelity Securities Fund) at July 31, 2015, the results of its operations for the year then ended, the changes in its net assets for each of the two years in the period then ended and the financial highlights for each of the five years in the period then ended, in conformity with accounting principles generally accepted in the United States of America. These financial statements and financial highlights (hereafter referred to as "financial statements") are the responsibility of the Fidelity Small Cap Value Fund's management. Our responsibility is to express an opinion on these financial statements based on our audits. We conducted our audits of these financial statements in accordance with the standards of the Public Company Accounting Oversight Board (United States). Those standards require that we plan and perform the audit to obtain reasonable assurance about whether the financial statements are free of material misstatement. An audit includes examining, on a test basis, evidence supporting the amounts and disclosures in the financial statements, assessing the accounting principles used and significant estimates made by management, and evaluating the overall financial statement presentation. We believe that our audits, which included confirmation of securities at July 31, 2015 by correspondence with the custodian and brokers, provide a reasonable basis for our opinion.
PricewaterhouseCoopers LLP
Boston, Massachusetts
September 21, 2015
Annual Report
The Trustees, Member of the Advisory Board, and officers of the trust and fund, as applicable, are listed below. The Board of Trustees governs the fund and is responsible for protecting the interests of shareholders. The Trustees are experienced executives who meet periodically throughout the year to oversee the fund's activities, review contractual arrangements with companies that provide services to the fund, oversee management of the risks associated with such activities and contractual arrangements, and review the fund's performance. Each of the Trustees oversees 170 funds.
The Trustees hold office without limit in time except that (a) any Trustee may resign; (b) any Trustee may be removed by written instrument, signed by at least two-thirds of the number of Trustees prior to such removal; (c) any Trustee who requests to be retired or who has become incapacitated by illness or injury may be retired by written instrument signed by a majority of the other Trustees; and (d) any Trustee may be removed at any special meeting of shareholders by a two-thirds vote of the outstanding voting securities of the trust. Each Trustee who is not an interested person (as defined in the 1940 Act) of the trust and the fund (Independent Trustee), shall retire not later than the last day of the calendar year in which his or her 75th birthday occurs. The Independent Trustees may waive this mandatory retirement age policy with respect to individual Trustees. The officers and Advisory Board Member hold office without limit in time, except that any officer and Advisory Board Member may resign or may be removed by a vote of a majority of the Trustees at any regular meeting or any special meeting of the Trustees. Except as indicated, each individual has held the office shown or other offices in the same company for the past five years.
Experience, Skills, Attributes, and Qualifications of the Fund's Trustees. The Governance and Nominating Committee has adopted a statement of policy that describes the experience, qualifications, attributes, and skills that are necessary and desirable for potential Independent Trustee candidates (Statement of Policy). The Board believes that each Trustee satisfied at the time he or she was initially elected or appointed a Trustee, and continues to satisfy, the standards contemplated by the Statement of Policy. The Governance and Nominating Committee also engages professional search firms to help identify potential Independent Trustee candidates who have the experience, qualifications, attributes, and skills consistent with the Statement of Policy. From time to time, additional criteria based on the composition and skills of the current Independent Trustees, as well as experience or skills that may be appropriate in light of future changes to board composition, business conditions, and regulatory or other developments, have also been considered by the professional search firms and the Governance and Nominating Committee. In addition, the Board takes into account the Trustees' commitment and participation in Board and committee meetings, as well as their leadership of standing and ad hoc committees throughout their tenure.
In determining that a particular Trustee was and continues to be qualified to serve as a Trustee, the Board has considered a variety of criteria, none of which, in isolation, was controlling. The Board believes that, collectively, the Trustees have balanced and diverse experience, qualifications, attributes, and skills, which allow the Board to operate effectively in governing the fund and protecting the interests of shareholders. Information about the specific experience, skills, attributes, and qualifications of each Trustee, which in each case led to the Board's conclusion that the Trustee should serve (or continue to serve) as a trustee of the fund, is provided below.
Annual Report
Trustees and Officers - continued
Board Structure and Oversight Function. James C. Curvey is an interested person (as defined in the 1940 Act) and currently serves as Chairman. The Trustees have determined that an interested Chairman is appropriate and benefits shareholders because an interested Chairman has a personal and professional stake in the quality and continuity of services provided to the fund. Independent Trustees exercise their informed business judgment to appoint an individual of their choosing to serve as Chairman, regardless of whether the Trustee happens to be independent or a member of management. The Independent Trustees have determined that they can act independently and effectively without having an Independent Trustee serve as Chairman and that a key structural component for assuring that they are in a position to do so is for the Independent Trustees to constitute a substantial majority for the Board. The Independent Trustees also regularly meet in executive session. Ned C. Lautenbach serves as Chairman of the Independent Trustees and as such (i) acts as a liaison between the Independent Trustees and management with respect to matters important to the Independent Trustees and (ii) with management prepares agendas for Board meetings.
Fidelity funds are overseen by different Boards of Trustees. The funds' Board oversees Fidelity's high income and certain equity funds and other Boards oversee Fidelity's investment-grade bond, money market, asset allocation, and sector funds. The asset allocation funds may invest in Fidelity funds overseen by the funds' Board. The use of separate Boards, each with its own committee structure, allows the Trustees of each group of Fidelity funds to focus on the unique issues of the funds they oversee, including common research, investment, and operational issues. On occasion, the separate Boards establish joint committees to address issues of overlapping consequences for the Fidelity funds overseen by each Board.
The Trustees operate using a system of committees to facilitate the timely and efficient consideration of all matters of importance to the Trustees, the fund, and fund shareholders and to facilitate compliance with legal and regulatory requirements and oversight of the fund's activities and associated risks. The Board, acting through its committees, has charged FMR and its affiliates with (i) identifying events or circumstances the occurrence of which could have demonstrably adverse effects on the fund's business and/or reputation; (ii) implementing processes and controls to lessen the possibility that such events or circumstances occur or to mitigate the effects of such events or circumstances if they do occur; and (iii) creating and maintaining a system designed to evaluate continuously business and market conditions in order to facilitate the identification and implementation processes described in (i) and (ii) above. Because the day-to-day operations and activities of the fund are carried out by or through FMR, its affiliates and other service providers, the fund's exposure to risks is mitigated but not eliminated by the processes overseen by the Trustees. While each of the Board's committees has responsibility for overseeing different aspects of the fund's activities, oversight is exercised primarily through the Operations, Audit, and Compliance Committees. In addition, the Independent Trustees have worked with FMR to enhance the Board's oversight of investment and financial risks, legal and regulatory risks, technology risks, and operational risks, including the development of additional risk reporting to the Board. For example, a working group comprised of Independent Trustees and FMR has worked and continues to work to review the Fidelity fund's valuation-related activities, reporting and risk management. Appropriate personnel, including but not limited to the fund's Chief Compliance Officer (CCO), FMR's internal auditor, the independent accountants, the fund's Treasurer and portfolio management personnel, make periodic reports to the Board's committees, as appropriate, including an annual review of FMR's risk management program for the Fidelity funds. The responsibilities of each standing committee, including their oversight responsibilities, are described further under "Standing Committees of the Fund's Trustees."
Annual Report
The fund's Statement of Additional Information (SAI) includes more information about the Trustees. To request a free copy, call Fidelity at 1-877-208-0098.
Interested Trustees*:
Correspondence intended for each Trustee who is an interested person may be sent to Fidelity Investments, 245 Summer Street, Boston, Massachusetts 02210.
Name, Year of Birth; Principal Occupations and Other Relevant Experience+ |
James C. Curvey (1935) |
Year of Election or Appointment: 2007 Trustee Chairman of the Board of Trustees |
| Mr. Curvey also serves as Trustee of other Fidelity funds. Mr. Curvey is a Director of Fidelity Research & Analysis Co. (investment adviser firm, 2009-present), and Vice Chairman (2007-present) and Director of FMR LLC (diversified financial services company). In addition, Mr. Curvey serves as an Overseer for the Boston Symphony Orchestra and a member of the board of Artis-Naples, Naples, Florida, and as a Trustee for Brewster Academy, Wolfeboro, New Hampshire. Previously, Mr. Curvey served as a Director of Fidelity Investments Money Management, Inc. (investment adviser firm, 2009-2014), a Director of FMR (investment adviser firm, 2007-2014), and a Director of FMR Co., Inc. (investment adviser firm, 2007-2014). |
Charles S. Morrison (1960) |
Year of Election or Appointment: 2014 Trustee |
| Mr. Morrison also serves as Trustee of other funds. He serves as a Director of Fidelity Investments Money Management, Inc. (FIMM) (investment adviser firm, 2014-present), Director of Fidelity SelectCo, LLC (investment adviser firm, 2014-present), President, Asset Management (2014-present), and is an employee of Fidelity Investments. Previously, Mr. Morrison served as Vice President of Fidelity's Fixed Income and Asset Allocation Funds (2012-2014), President, Fixed Income (2011-2014), Vice President of Fidelity's Money Market Funds (2005-2009), President, Money Market Group Leader of FMR (investment adviser firm, 2009), and Senior Vice President, Money Market Group of FMR (2004-2009). Mr. Morrison also served as Vice President of Fidelity's Bond Funds (2002-2005), certain Balanced Funds (2002-2005), and certain Asset Allocation Funds (2002-2007), and as Senior Vice President (2002-2005) of Fidelity's Bond Division. |
* Trustees have been determined to be "Interested Trustees" by virtue of, among other things, their affiliation with the trust or various entities under common control with FMR.
+ The information above includes each Trustee's principal occupation during the last five years and other information relating to the experience, attributes, and skills relevant to each Trustee's qualifications to serve as a Trustee, which led to the conclusion that each Trustee should serve as a Trustee for the fund.
Annual Report
Independent Trustees:
Correspondence intended for each Independent Trustee (that is, the Trustees other than the Interested Trustees) may be sent to Fidelity Investments, P.O. Box 55235, Boston, Massachusetts 02205-5235.
Name, Year of Birth; Principal Occupations and Other Relevant Experience+ |
Dennis J. Dirks (1948) |
Year of Election or Appointment: 2005 Trustee |
| Mr. Dirks also serves as Trustee of other Fidelity funds. Prior to his retirement in May 2003, Mr. Dirks was Chief Operating Officer and a member of the Board of The Depository Trust & Clearing Corporation (DTCC). He also served as President, Chief Operating Officer, and Board member of The Depository Trust Company (DTC) and President and Board member of the National Securities Clearing Corporation (NSCC). In addition, Mr. Dirks served as Chief Executive Officer and Board member of the Government Securities Clearing Corporation, Chief Executive Officer and Board member of the Mortgage-Backed Securities Clearing Corporation, as a Trustee and a member of the Finance Committee of Manhattan College (2005-2008), and as a Trustee and a member of the Finance Committee of AHRC of Nassau County (2006-2008). Mr. Dirks is a member of the Independent Directors Council (IDC) Governing Council (2010-present) and Board of Directors for The Brookville Center for Children's Services, Inc. (2009-present). |
Alan J. Lacy (1953) |
Year of Election or Appointment: 2008 Trustee |
| Mr. Lacy also serves as Trustee of other Fidelity funds. Mr. Lacy serves as a member of the Board of Directors of Dave & Buster's Entertainment, Inc. (restaurant and entertainment complexes, 2010-present) and Bristol-Myers Squibb Company (global pharmaceuticals, 2008-present). In addition, Mr. Lacy served as Senior Adviser (2007-2014) of Oak Hill Capital Partners, L.P. (private equity) and also served as Chief Executive Officer (2000-2005) and Vice Chairman (2005-2006) of Sears Holdings Corporation and Sears, Roebuck and Co. (retail). Mr. Lacy is a member of the Board of Trustees of The National Parks Conservation Association (2006-present). Previously, Mr. Lacy served as Chairman of the Board of Trustees of the National Parks Conservation Association (2008-2011) and as a member of the Board of Directors for The Western Union Company (global money transfer, 2006-2011), The Hillman Companies, Inc. (hardware wholesalers, 2010-2014), and Earth Fare, Inc. (retail grocery, 2010-2014). |
Ned C. Lautenbach (1944) |
Year of Election or Appointment: 2000 Trustee Chairman of the Independent Trustees |
| Mr. Lautenbach also serves as Trustee of other Fidelity funds. Mr. Lautenbach currently serves as the Lead Director of the Eaton Corporation Board of Directors (diversified industrial, 1997-present). Mr. Lautenbach is Chairman of the Board of Directors of Artis-Naples in Naples, Florida (2012-present), a member of the Council on Foreign Relations (1994-present), and a member of the Board of Governors, State University System of Florida (2013-present). Previously, Mr. Lautenbach was a Partner/Advisory Partner at Clayton, Dubilier & Rice, LLC (private equity investment, 1998-2010), as well as a Director of Sony Corporation (2006-2007). |
Joseph Mauriello (1944) |
Year of Election or Appointment: 2008 Trustee |
| Mr. Mauriello also serves as Trustee of other Fidelity funds. Prior to his retirement in January 2006, Mr. Mauriello served in numerous senior management positions including Deputy Chairman and Chief Operating Officer (2004-2005), and Vice Chairman of Financial Services (2002-2004) of KPMG LLP US (professional services, 1965-2005). Mr. Mauriello currently serves as a member of the Board of Directors of XL Group plc. (global insurance and re-insurance, 2006-present). Previously, Mr. Mauriello served as a Director of the Hamilton Funds of the Bank of New York (2006-2007) and of Arcadia Resources Inc. (health care services and products, 2007-2012). |
Robert W. Selander (1950) |
Year of Election or Appointment: 2011 Trustee |
| Mr. Selander also serves as Trustee of other Fidelity funds. Mr. Selander serves as a Director of The Western Union Company (global money transfer, 2014-present). Previously, Mr. Selander served as a Member of the Advisory Board of other Fidelity funds (2011), and Executive Vice Chairman (2010), Chief Executive Officer (2009-2010), and President and Chief Executive Officer (1997-2009) of Mastercard, Inc. |
Cornelia M. Small (1944) |
Year of Election or Appointment: 2005 Trustee |
| Ms. Small also serves as Trustee of other Fidelity funds. Ms. Small is a member of the Board of Directors (2009-present) and Chair of the Investment Committee (2010-present) of the Teagle Foundation. Ms. Small also serves on the Investment Committee of the Berkshire Taconic Community Foundation (2008-present). Previously, Ms. Small served as Chairperson (2002-2008) and a member of the Investment Committee and Chairperson (2008-2012) and a member of the Board of Trustees of Smith College. In addition, Ms. Small served as Chief Investment Officer, Director of Global Equity Investments, and a member of the Board of Directors of Scudder, Stevens & Clark and Scudder Kemper Investments. |
William S. Stavropoulos (1939) |
Year of Election or Appointment: 2002 Trustee Vice Chairman of the Independent Trustees |
| Mr. Stavropoulos also serves as Trustee of other Fidelity funds. Mr. Stavropoulos serves as President and Founder of the Michigan Baseball Foundation, the Great Lakes Loons (2007-present). Mr. Stavropoulos is Chairman Emeritus of the Board of Directors of The Dow Chemical Company, where he previously served in numerous senior management positions, including President, CEO (1995-2000; 2002-2004), Chairman of the Executive Committee (2000-2006), and as a member of the Board of Directors (1990-2006). Currently, Mr. Stavropoulos is Chairman of the Board of Directors of Univar Inc. (global distributor of commodity and specialty chemicals), a Director of Teradata Corporation (data warehousing and technology solutions), and Maersk Inc. (industrial conglomerate), and a member of the Advisory Board for Metalmark Capital LLC (private equity investment, 2005-present). Mr. Stavropoulos is an operating advisor to Clayton, Dubilier & Rice, LLC (private equity investment). In addition, Mr. Stavropoulos is a member of the University of Notre Dame Advisory Council for the College of Science, a Trustee of the Rollin L. Gerstacker Foundation, and a Director of the Naples Philharmonic Center for the Arts. Previously, Mr. Stavropoulos served as a Director of Chemical Financial Corporation (bank holding company, 1993-2012) and Tyco International, Ltd. (multinational manufacturing and services, 2007-2012). |
David M. Thomas (1949) |
Year of Election or Appointment: 2008 Trustee |
| Mr. Thomas also serves as Trustee of other Fidelity funds. Mr. Thomas serves as Non-Executive Chairman of the Board of Directors of Fortune Brands Home and Security (home and security products, 2011-present), as a member of the Board of Directors (2004-present) and Presiding Director (2013-present) of Interpublic Group of Companies, Inc. (marketing communication), and as a member of the Board of Trustees of the University of Florida (2013-present). Previously, Mr. Thomas served as Executive Chairman (2005-2006) and Chairman and Chief Executive Officer (2000-2005) of IMS Health, Inc. (pharmaceutical and healthcare information solutions), and a Director of Fortune Brands, Inc. (consumer products, 2000-2011). |
+ The information above includes each Trustee's principal occupation during the last five years and other information relating to the experience, attributes, and skills relevant to each Trustee's qualifications to serve as a Trustee, which led to the conclusion that each Trustee should serve as a Trustee for the fund.
Advisory Board Member and Officers:
Correspondence intended for each officer and Peter S. Lynch may be sent to Fidelity Investments, 245 Summer Street, Boston, Massachusetts 02210. Officers appear below in alphabetical order.
Name, Year of Birth; Principal Occupation |
Peter S. Lynch (1944) |
Year of Election or Appointment: 2003 Member of the Advisory Board |
| Mr. Lynch also serves as Member of the Advisory Board of other Fidelity funds. Mr. Lynch is Vice Chairman and a Director of FMR (investment adviser firm) and FMR Co., Inc. (investment adviser firm). In addition, Mr. Lynch serves as a Trustee of Boston College and as the Chairman of the Inner-City Scholarship Fund. Previously, Mr. Lynch served on the Special Olympics International Board of Directors (1997-2006). |
Elizabeth Paige Baumann (1968) |
Year of Election or Appointment: 2012 Anti-Money Laundering (AML) Officer |
| Ms. Baumann also serves as AML Officer of other funds. She is Chief AML Officer of FMR LLC (diversified financial services company, 2012-present) and is an employee of Fidelity Investments. Previously, Ms. Baumann served as Vice President and Deputy Anti-Money Laundering Officer (2007-2012). |
Marc Bryant (1966) |
Year of Election or Appointment: 2015 Secretary and Chief Legal Officer (CLO) |
<R> | Mr. Bryant also serves as Secretary and Chief Legal Officer (CLO) of other funds. He is Senior Vice President and Deputy General Counsel of FMR LLC (diversified financial services company). Previously, Mr. Bryant served as Secretary and Chief Legal Officer of Fidelity Rutland Square Trust II (2010-2014) and Assistant Secretary of Fidelity's Fixed Income and Asset Allocation Funds (2013?2015). Prior to joining Fidelity Investments, Mr. Bryant served as a Senior Vice President and the Head of Global Retail Legal for AllianceBernstein L.P. (2006-2010), and as the General Counsel for ProFund Advisors LLC (2001-2006).</R> |
William C. Coffey (1969) |
Year of Election or Appointment: 2009 Assistant Secretary |
| Mr. Coffey also serves as Assistant Secretary of other funds. He is Senior Vice President and Deputy General Counsel of FMR LLC (diversified financial services company, 2010-present), and is an employee of Fidelity Investments. Previously, Mr. Coffey served as Vice President and Associate General Counsel of FMR LLC (2005-2009). |
Jonathan Davis (1968) |
Year of Election or Appointment: 2010 Assistant Treasurer |
| Mr. Davis also serves as Assistant Treasurer of other funds. Mr. Davis is an employee of Fidelity Investments. Previously, Mr. Davis served as Vice President and Associate General Counsel of FMR LLC (diversified financial services company, 2003-2010). |
Adrien E. Deberghes (1967) |
Year of Election or Appointment: 2008 Deputy Treasurer |
| Mr. Deberghes also serves as an officer of other funds. He is an employee of Fidelity Investments (2008-present). Prior to joining Fidelity Investments, Mr. Deberghes was Senior Vice President of Mutual Fund Administration at State Street Corporation (2007-2008), Senior Director of Mutual Fund Administration at Investors Bank & Trust (2005-2007), and Director of Finance for Dunkin' Brands (2000-2005). |
Stephanie J. Dorsey (1969) |
Year of Election or Appointment: 2010 Assistant Treasurer |
| Ms. Dorsey also serves as an officer of other funds. She is an employee of Fidelity Investments (2008-present) and has served in other fund officer roles. Prior to joining Fidelity Investments, Ms. Dorsey served as Treasurer (2004-2008) of the JPMorgan Mutual Funds and Vice President (2004-2008) of JPMorgan Chase Bank. |
Howard J. Galligan III (1966) |
Year of Election or Appointment: 2014 Chief Financial Officer |
| Mr. Galligan also serves as Chief Financial Officer of other funds. Mr. Galligan serves as President of Fidelity Pricing and Cash Management Services (FPCMS) (2014-present) and as a Director of Strategic Advisers, Inc. (investment adviser firm, 2008-present). Previously, Mr. Galligan served as Chief Administrative Officer of Asset Management (2011-2014) and Chief Operating Officer and Senior Vice President of Investment Support for Strategic Advisers, Inc. (2003-2011). |
Scott C. Goebel (1968) |
Year of Election or Appointment: 2015 Vice President |
| Mr. Goebel serves as an officer of other funds. Mr. Goebel also serves as Secretary of Fidelity SelectCo, LLC (investment adviser firm, 2013-present), Fidelity Investments Money Management, Inc. (FIMM) (investment adviser firm, 2010-present) and Fidelity Research and Analysis Company (FRAC) (investment adviser firm, 2010-present); General Counsel, Secretary, and Senior Vice President of FMR (investment adviser firm, 2008-present) and FMR Co., Inc. (investment adviser firm, 2008-present); Chief Legal Officer of Fidelity Management & Research (Hong Kong) Limited (investment adviser firm, 2008-present); and Assistant Secretary of Fidelity Management & Research (Japan) Limited (investment adviser firm, 2008-present) and FMR Investment Management (U.K.) Limited (investment adviser firm, 2008-present). Previously, Mr. Goebel served as Secretary and CLO of certain Fidelity funds (2008-2015), Assistant Secretary of FIMM (2008-2010), FRAC (2008-2010), and certain funds (2007-2008); and as Vice President and Secretary of Fidelity Distributors Corporation (FDC) (2005-2007). Mr. Goebel has been employed by FMR LLC (diversified financial services company) or an affiliate since 2001. |
Thomas C. Hense (1964) |
Year of Election or Appointment: 2008/2010/2015 Vice President |
| Mr. Hense serves as Vice President of Fidelity Advisor Multi-Asset Income Fund (2015) and other funds (High Income (2008), Small Cap (2008), and Value (2010) funds). Previously, Mr. Hense served as a portfolio manager for Fidelity's Institutional Money Management Group (Pyramis) (2003-2008). |
Brian B. Hogan (1964) |
Year of Election or Appointment: 2009 Vice President |
| Mr. Hogan also serves as Trustee or Vice President of other funds. Mr. Hogan serves as a Director of Fidelity SelectCo, LLC (investment adviser firm, 2014-present) and President of the Equity Division of FMR (investment adviser firm, 2009-present). Previously, Mr. Hogan served as Senior Vice President, Equity Research of FMR (2006-2009) and as a portfolio manager. |
Chris Maher (1972) |
Year of Election or Appointment: 2013 Assistant Treasurer |
| Mr. Maher serves as Assistant Treasurer of other funds. Mr. Maher is Vice President of Valuation Oversight and is an employee of Fidelity Investments. Previously, Mr. Maher served as Vice President of Asset Management Compliance (2013), Vice President of the Program Management Group of FMR (investment adviser firm, 2010-2013), and Vice President of Valuation Oversight (2008-2010). |
Kenneth B. Robins (1969) |
Year of Election or Appointment: 2008 President and Treasurer |
| Mr. Robins also serves as an officer of other funds. Mr. Robins serves as Executive Vice President of Fidelity Investments Money Management, Inc. (FIMM) (investment adviser firm, 2013-present) and is an employee of Fidelity Investments (2004-present). Previously, Mr. Robins served in other fund officer roles. |
Stephen Sadoski (1971) |
Year of Election or Appointment: 2012 Deputy Treasurer |
| Mr. Sadoski also serves as Deputy Treasurer of other funds. He is an employee of Fidelity Investments (2012-present) and has served in another fund officer role. Prior to joining Fidelity Investments, Mr. Sadoski served as an assistant chief accountant in the Division of Investment Management of the Securities and Exchange Commission (SEC) (2009-2012) and as a senior manager at Deloitte & Touche LLP (1997-2009). |
Stacie M. Smith (1974) |
Year of Election or Appointment: 2013 Deputy Treasurer |
| Ms. Smith also serves as an officer of other funds. She is an employee of Fidelity Investments (2009-present) and has served in other fund officer roles. Prior to joining Fidelity Investments, Ms. Smith served as Senior Audit Manager of Ernst & Young LLP (1996-2009). |
Renee Stagnone (1975) |
Year of Election or Appointment: 2013 Deputy Treasurer |
| Ms. Stagnone also serves as Deputy Treasurer of other funds. Ms. Stagnone is an employee of Fidelity Investments. |
Linda J. Wondrack (1964) |
Year of Election or Appointment: 2014 Chief Compliance Officer |
| Ms. Wondrack also serves as Chief Compliance Officer of other funds. Ms. Wondrack is Executive Vice President and head of the Ethics Office and Asset Management Compliance for Fidelity Investments (2012- present). Ms. Wondrack also serves as Chief Compliance Officer of Fidelity SelectCo, LLC (investment adviser firm, 2014-present); Chief Compliance Officer of Impresa Management LLC (2013-present); and Chief Compliance Officer of FMR Co., Inc. (investment adviser firm), Fidelity Investments Money Management, Inc. (investment adviser firm), Fidelity Management & Research (Japan) Limited (investment adviser firm), FMR Investment Management (U.K.) Limited (investment adviser firm), Fidelity Management & Research (Hong Kong) (investment adviser firm), Fidelity Management & Research Company (investment adviser firm), Pyramis Global Advisors, LLC (investment adviser firm), and Strategic Advisers, Inc. (investment adviser firm), Ballyrock Investment Advisors LLC, and Northern Neck Investors LLC (2012-present). Previously, Ms. Wondrack served as Senior Vice President and Chief Compliance Officer for Columbia Management Investment Advisers, LLC (2005-2012); Chief Compliance Officer for certain funds within the Columbia Family of Funds (2007-2012); and Senior Vice President of Compliance Risk Management at Bank of America (2005-2010). |
Joseph F. Zambello (1957) |
Year of Election or Appointment: 2011 Deputy Treasurer |
| Mr. Zambello also serves as Deputy Treasurer of other funds. Mr. Zambello is an employee of Fidelity Investments. Previously, Mr. Zambello served as Vice President of the Program Management Group of FMR (investment adviser firm, 2009-2011) and Vice President of the Transfer Agent Oversight Group (2005-2009). |
Annual Report
The Board of Trustees of Fidelity Small Cap Value Fund voted to pay to shareholders of record at the opening of business, the following distributions per share derived from capital gains realized from sales of portfolio securities, and dividends derived from net investment income:
| Pay Date | Record Date | Dividends | Capital Gains |
Class A | 09/14/15 | 09/11/15 | $0.077 | $1.495 |
Class T | 09/14/15 | 09/11/15 | $0.050 | $1.495 |
Class B | 09/14/15 | 09/11/15 | $0.000 | $1.495 |
Class C | 09/14/15 | 09/11/15 | $0.000 | $1.495 |
The fund hereby designates as a capital gain dividend with respect to the taxable year ended July 31, 2015, $274,706,718, or, if subsequently determined to be different, the net capital gain of such year.
Class A, and Class T designate 100% of the dividends distributed during the fiscal year as qualifying for the dividends-received deduction for corporate shareholders.
Class A, and Class T designate 100% of the dividends distributed during the fiscal year as amounts which can be taken into account as a dividend for the purposes of the maximum rate under section 1(h)(11) of the Internal Revenue Code.
The fund will notify shareholders in January 2016 of amounts for use in preparing 2015 income tax returns.
Annual Report
Fidelity Small Cap Value Fund
Each year, the Board of Trustees, including the Independent Trustees (together, the Board), votes on the renewal of the management contract with Fidelity Management & Research Company (FMR) and the sub-advisory agreements (together, the Advisory Contracts) for the fund. The Board, assisted by the advice of fund counsel and Independent Trustees' counsel, requests and considers a broad range of information relevant to the renewal of the Advisory Contracts throughout the year.
The Board meets regularly and, at each of its meetings, covers an extensive agenda of topics and materials and considers factors that are relevant to its annual consideration of the renewal of the fund's Advisory Contracts, including the services and support provided to the fund and its shareholders. The Board has established various standing committees (Committees), each composed of and chaired by Independent Trustees with varying backgrounds, to which the Board has assigned specific subject matter responsibilities in order to enhance effective decision-making by the Board. The Board, acting directly and through its Committees, requests and receives information concerning the annual consideration of the renewal of the fund's Advisory Contracts. The Board also meets as needed to consider matters specifically related to the Board's annual consideration of the renewal of the Advisory Contracts. Members of the Board may also meet with trustees of other Fidelity funds through ad hoc joint committees to discuss certain matters relevant to all of the Fidelity funds.
At its July 2015 meeting, the Board unanimously determined to renew the fund's Advisory Contracts. In reaching its determination, the Board considered all factors it believed relevant, including (i) the nature, extent, and quality of the services to be provided to the fund and its shareholders (including the investment performance of the fund); (ii) the competitiveness of the fund's management fee and total expense ratio relative to peer funds; (iii) the total costs of the services to be provided by and the profits to be realized by Fidelity from its relationship with the fund; and (iv) the extent to which (if any) economies of scale exist and would be realized as the fund grows, and whether any economies of scale are appropriately shared with fund shareholders.
In considering whether to renew the Advisory Contracts for the fund, the Board reached a determination, with the assistance of fund counsel and Independent Trustees' counsel and through the exercise of its business judgment, that the renewal of the Advisory Contracts was in the best interests of the fund and its shareholders and that the compensation payable under the Advisory Contracts was fair and reasonable. The Board's decision to renew the Advisory Contracts was not based on any single factor, but rather was based on a comprehensive consideration of all the information provided to the Board at its meetings throughout the year. The Board, in reaching its determination to renew the Advisory Contracts, was aware that shareholders of the fund have a broad range of investment choices available to them, including a wide choice among funds offered by Fidelity's competitors, and that the fund's shareholders, who have the opportunity to review and weigh the disclosure provided by the fund in its prospectus and other public disclosures, have chosen to invest in this fund, which is part of the Fidelity family of funds.
Annual Report
Board Approval of Investment Advisory Contracts and
Management Fees - continued
Nature, Extent, and Quality of Services Provided. The Board considered Fidelity's staffing as it relates to the fund, including the backgrounds of investment personnel of Fidelity, and also considered the fund's investment objective, strategies, and related investment philosophy. The Independent Trustees also had discussions with senior management of Fidelity's investment operations and investment groups. The Board considered the structure of the portfolio manager compensation program and whether this structure provides appropriate incentives to act in the best interests of the fund. Additionally, the Board considered the portfolio managers' investments, if any, in the funds that they manage.
Resources Dedicated to Investment Management and Support Services. The Board and the Fund Oversight and Research Committees reviewed the general qualifications and capabilities of Fidelity's investment staff, including its size, education, experience, and resources, as well as Fidelity's approach to recruiting, training, managing, and compensating investment personnel. The Board noted that Fidelity has continued to increase the resources devoted to non-U.S. offices, including expansion of Fidelity's global investment organization. The Board also noted that Fidelity's analysts have extensive resources, tools and capabilities that allow them to conduct sophisticated quantitative and fundamental analysis, as well as credit analysis of issuers, counterparties and guarantors. Further, the Board considered that Fidelity's investment professionals have sufficient access to global information and data so as to provide competitive investment results over time, and that those professionals also have access to sophisticated tools that permit them to assess portfolio construction and risk and performance attribution characteristics continuously, as well as to transmit new information and research conclusions rapidly around the world. Additionally, in its deliberations, the Board considered Fidelity's trading, risk management, and compliance capabilities and resources, which are integral parts of the investment management process.
Shareholder and Administrative Services. The Board considered (i) the nature, extent, quality, and cost of advisory, administrative, and shareholder services performed by FMR, the sub-advisers (together with FMR, the Investment Advisers), and their affiliates under the Advisory Contracts and under separate agreements covering transfer agency, pricing and bookkeeping, and securities lending services for the fund; (ii) the nature and extent of the supervision of third party service providers, principally custodians and subcustodians; and (iii) the resources devoted to, and the record of compliance with, the fund's compliance policies and procedures. The Board also reviewed the allocation of fund brokerage, including allocations to brokers affiliated with the Investment Advisers, the use of brokerage commissions to pay fund expenses, and the use of "soft" commission dollars to pay for research services.
Annual Report
The Board noted that the growth of fund assets over time across the complex allows Fidelity to reinvest in the development of services designed to enhance the value or convenience of the Fidelity funds as investment vehicles. These services include 24-hour access to account information and market information through telephone representatives and over the Internet, investor education materials and asset allocation tools, and the expanded availability of Fidelity Investor Centers.
In 2014, the Board formed an ad hoc Committee on Transfer Agency Fees to review the variety of transfer agency fee structures throughout the industry and Fidelity's competitive positioning with respect to industry participants.
Investment in a Large Fund Family. The Board considered the benefits to shareholders of investing in a Fidelity fund, including the benefits of investing in a fund that is part of a large family of funds offering a variety of investment disciplines and providing a large variety of mutual fund investor services. The Board noted that Fidelity had taken, or had made recommendations that resulted in the Fidelity funds taking, a number of actions over the previous year that benefited particular funds, including (i) continuing to dedicate additional resources to investment research and to the support of the senior management team that oversees asset management; (ii) continuing efforts to enhance Fidelity's global research capabilities; (iii) launching new funds and making other enhancements to meet client needs; (iv) reducing management fees and total expenses for certain index funds and diversified international funds; (v) continuing to launch dedicated lower cost underlying funds to meet portfolio construction needs related to expanding underlying fund options for Fidelity funds of funds, specifically for the Freedom Fund product lines; (vi) rationalizing product lines and gaining increased efficiencies through fund mergers; (vii) launching active fixed-income exchange-traded funds; (viii) continuing to develop, acquire and implement systems and technology to improve services to the funds and information security and to increase efficiency; (ix) implementing investment enhancements to further strengthen Fidelity's target date product line to increase investors' probability of success in achieving their goals; (x) modifying the eligibility criteria for certain share classes to accommodate roll-over assets from employer-sponsored retirement plans; (xi) launching a new Class W of the Freedom Index Funds to attract and retain Fidelity record-kept retirement plan assets; and (xii) implementing changes to Fidelity's money market product line in response to recent money market regulatory reforms.
Investment Performance. The Board considered whether the fund has operated in accordance with its investment objective, as well as its record of compliance with its investment restrictions and its performance history. The Board noted that there were portfolio management changes for the fund in January 2013 and August 2013.
Annual Report
Board Approval of Investment Advisory Contracts and
Management Fees - continued
The Board took into account discussions with representatives of the Investment Advisers about fund investment performance that occur at Board meetings throughout the year. In this regard the Board noted that as part of regularly scheduled fund reviews and other reports to the Board on fund performance, the Board considers annualized return information for the fund, for different time periods, measured against a securities market index ("benchmark index") and a peer group of funds with similar objectives ("peer group"), if any. In its evaluation of fund investment performance, the Board gave particular attention to information indicating changes in performance of certain Fidelity funds for specific time periods and discussed with the Investment Advisers the reasons for any overperformance or underperformance.
In addition to reviewing absolute and relative fund performance, the Independent Trustees periodically consider the appropriateness of fund performance metrics in evaluating the results achieved. In general, the Independent Trustees believe that fund performance should be evaluated based on net performance (after fees and expenses) of both the highest performing and lowest performing fund share classes, where applicable, compared to appropriate benchmark indices, over appropriate time periods that may include full market cycles, and compared to peer groups, as applicable, over the same periods, taking into account relevant factors including the following: general market conditions; issuer-specific information; and fund cash flows and other factors.
The Independent Trustees recognize that shareholders evaluate performance on a net basis over their own holding periods, for which one-, three-, and five-year periods are often used as a proxy. For this reason, the performance information reviewed by the Board also included net cumulative calendar year total return information for the fund and an appropriate benchmark index and peer group for the most recent one-, three-, and five-year periods, as shown below. Returns are shown compared to the 25th percentile (top of box, 75% beaten) and 75th percentile (bottom of box, 25% beaten) of the peer universe.
Annual Report
Fidelity Small Cap Value Fund
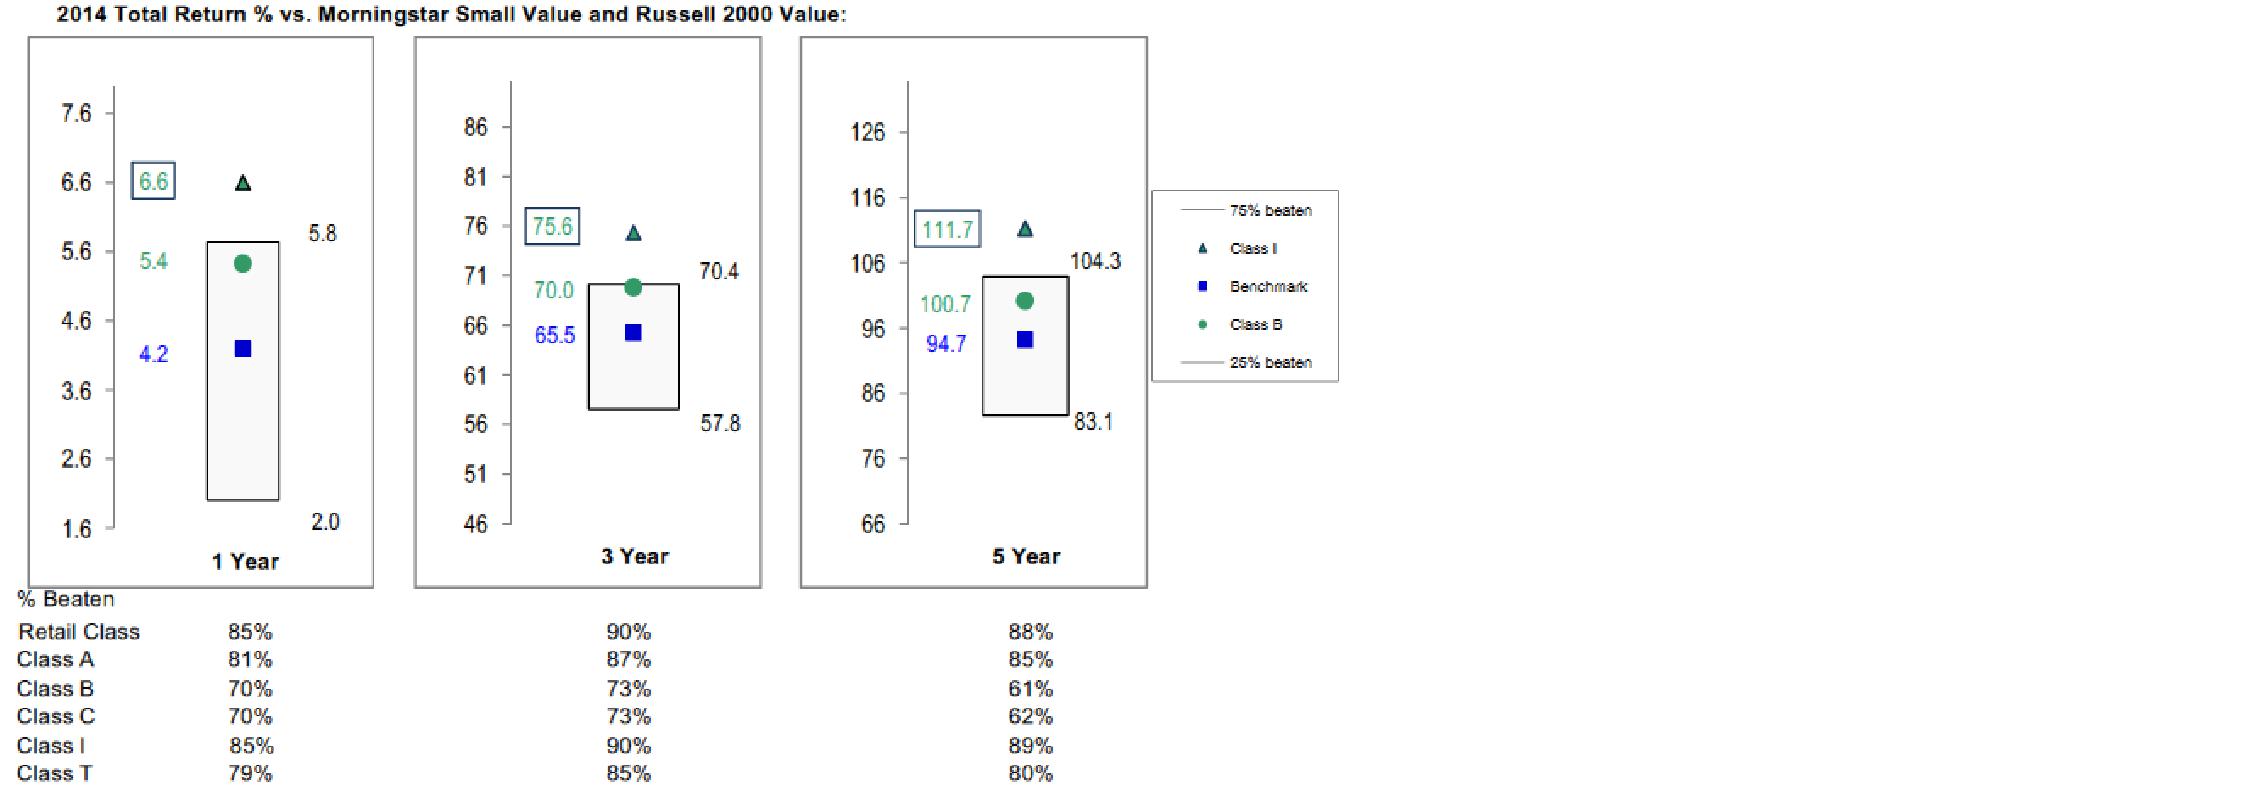
The Board also considered that the fund's management fee is subject to upward or downward adjustment depending upon whether, and to what extent, the fund's investment performance for the performance period exceeds, or is exceeded by, a securities index, thus leading to a performance adjustment for the same period. The Board noted that the performance adjustment provides FMR with a strong economic incentive to seek to achieve superior performance for the fund's shareholders and helps to more closely align the interests of FMR and the shareholders of the fund.
Based on its review, the Board concluded that the nature, extent, and quality of services provided to the fund under the Advisory Contracts should benefit the shareholders of the fund.
Competitiveness of Management Fee and Total Expense Ratio. The Board considered the fund's management fee and total expense ratio compared to "mapped groups" of competitive funds and classes created for the purpose of facilitating the Trustees' competitive analysis of management fees and total expenses. Fidelity creates "mapped groups" by combining similar Lipper investment objective categories that have comparable investment mandates. Combining Lipper investment objective categories aids the Board's management fee and total expense ratio comparisons by broadening the competitive group used for comparison.
Management Fee. The Board considered two proprietary management fee comparisons for the 12-month periods shown in basis points (BP) in the chart below. The group of Lipper funds used by the Board for management fee comparisons is referred to below as the "Total Mapped Group." The Total Mapped Group comparison focuses on a fund's standing in terms of gross management fees before expense reimbursements or caps, and without giving effect to the fund's performance adjustment, relative to the total universe of funds with comparable investment mandates, regardless of whether their management fee structures also are comparable. Funds with comparable investment mandates offer exposure to similar types of securities. Funds with comparable management fee structures have similar management fee contractual arrangements (e.g., flat rate charged for advisory services, all-inclusive fee rate, etc.). "TMG %" represents the percentage of funds in the Total Mapped Group that had management fees that were lower than the fund's. For example, a hypothetical TMG % of 20% would mean that 80% of the funds in the Total Mapped Group had higher, and 20% had lower, management fees than the fund. The fund's actual TMG %s and the number of funds in the Total Mapped Group are in the chart below. The "Asset-Size Peer Group" (ASPG) comparison focuses on a fund's standing relative to a subset of non-Fidelity funds within the Total Mapped Group that are similar in size and management fee structure without taking into account performance adjustments, if any. For example, if a fund is in the first quartile of the ASPG, the fund's management fee ranks in the least expensive or lowest 25% of funds in the ASPG. The ASPG represents at least 15% of the funds in the Total Mapped Group with comparable asset size and management fee structures, subject to a minimum of 50 funds (or all funds in the Total Mapped Group if fewer than 50). Additional information, such as the ASPG quartile in which the fund's management fee rate ranked and the impact of the fund's performance adjustment, is also included in the chart and considered by the Board.
Annual Report
Board Approval of Investment Advisory Contracts and
Management Fees - continued
Fidelity Small Cap Value Fund

Annual Report
The Board noted that the fund's management fee rate ranked below the median of its Total Mapped Group and below the median of its ASPG for 2014. The Board also noted the effect of the fund's performance adjustment, if any, on the fund's management fee ranking.
The Board noted that, in 2014, the ad hoc Committee on Group Fee was formed by it and other Fidelity fund boards to conduct an in-depth review of the "group fee" component of the management fee of funds with such management fee structures. Committee focus included the mechanics of the group fee, the competitive landscape of group fee structures, Fidelity funds with no group fee component and investment products not included in group fee assets. The Board also considered that, for funds subject to the group fee, FMR agreed to voluntarily waive fees over a specified period of time in amounts designed to account for assets converted from certain funds to certain collective investment trusts.
The Board also noted that, in 2013, the ad hoc Committee on Management Fees was formed to conduct an in-depth review of the management fee rates of Fidelity's active equity mutual funds. The Committee focused on the following areas: (i) standard fee structures; (ii) research consumption and trading evolution; (iii) management fee competitiveness/profitability by category; and (iv) factors that drive institutional pricing.
Based on its review, the Board concluded that the fund's management fee is fair and reasonable in light of the services that the fund receives and the other factors considered.
Total Expense Ratio. In its review of each class's total expense ratio, the Board considered the fund's management fee as well as other fund or class expenses, as applicable, such as transfer agent fees, pricing and bookkeeping fees, fund-paid 12b-1 fees, and custodial, legal, and audit fees. The Board noted the impact of the fund's performance adjustment. The Board also noted that Fidelity may agree to waive fees and expenses from time to time, and the extent to which, if any, it has done so for the fund. As part of its review, the Board also considered the current and historical total expense ratios of each class of the fund compared to competitive fund median expenses. Each class of the fund is compared to those funds and classes in the Total Mapped Group (used by the Board for management fee comparisons) that have a similar sales load structure.
The Board noted that the total expense ratio of the retail class ranked below its competitive median for 2014 and the total expense ratio of each of Class A, Class T, Class B, Class C, and Class I ranked above its competitive median for 2014. The Board considered that, in general, various factors can affect total expense ratios. The Board noted that the total expense ratio of Class T was above the competitive median primarily because of higher 12b-1 fees on Class T as compared to most competitor funds. Class T has a higher 12b-1 fee, but a lower front-end sales charge, than traditionally priced front-end sales charge classes. The Board considered that Class T is primarily sold load-waived in the retirement plan market where its 0.50% 12b-1 fee is comparable to competing no-load, higher 12b-1 fee classes designed specifically for retirement plans. The Board noted that the fund offers multiple classes, each of which has a different sales load and 12b-1 fee structure, and that the multiple structures are intended to offer a range of pricing options for the intermediary market. The Board also noted that the total expense ratios of the classes vary primarily by the level of their 12b-1 fees, although differences in transfer agent fees may also cause expenses to vary from class to class.
Annual Report
Board Approval of Investment Advisory Contracts and
Management Fees - continued
Fees Charged to Other Fidelity Clients. The Board also considered Fidelity fee structures and other information with respect to clients of Fidelity, such as other funds advised or subadvised by Fidelity, pension plan clients, and other institutional clients with similar mandates. The Board noted the findings of the 2013 ad hoc joint committee (created with the board of other Fidelity funds), which reviewed and compared Fidelity's institutional investment advisory business with its business of providing services to the Fidelity funds, including the differences in services provided, fees charged, and costs incurred, as well as competition in their respective marketplaces.
Based on its review of total expense ratios and fees charged to other Fidelity clients, the Board concluded that, although in some cases above the median of the universe presented for comparison, the total expense ratio of each class of the fund was reasonable in light of the services that the fund and its shareholders receive and the other factors considered.
Costs of the Services and Profitability. The Board considered the revenues earned and the expenses incurred by Fidelity in conducting the business of developing, marketing, distributing, managing, administering and servicing the fund and servicing the fund's shareholders. The Board also considered the level of Fidelity's profits in respect of all the Fidelity funds.
On an annual basis, Fidelity presents to the Board information about the profitability of its relationship with the fund. Fidelity calculates profitability information for each fund, as well as aggregate profitability information for groups of Fidelity funds and all Fidelity funds, using a series of detailed revenue and cost allocation methodologies which originate with the books and records of Fidelity on which Fidelity's audited financial statements are based. The Audit Committee of the Board reviews any significant changes from the prior year's methodologies.
PricewaterhouseCoopers LLP (PwC), independent registered public accounting firm and auditor to Fidelity and certain Fidelity funds, has been engaged annually by the Board as part of the Board's assessment of Fidelity's profitability analysis. PwC's engagement includes the review and assessment of the methodologies used by Fidelity in determining the revenues and expenses attributable to Fidelity's mutual fund business, and completion of agreed-upon procedures in respect of the mathematical accuracy of fund profitability and its conformity to established allocation methodologies. After considering PwC's reports issued under the engagement and information provided by Fidelity, the Board concluded that while other allocation methods may also be reasonable, Fidelity's profitability methodologies are reasonable in all material respects.
Annual Report
The Board also reviewed Fidelity's non-fund businesses and fall-out benefits related to the mutual fund business as well as cases where Fidelity's affiliates may benefit from or be related to the fund's business.
The Board considered the costs of the services provided by and the profits realized by Fidelity in connection with the operation of the fund and was satisfied that the profitability was not excessive.
Economies of Scale. The Board considered whether there have been economies of scale in respect of the management of the Fidelity funds, whether the Fidelity funds (including the fund) have appropriately benefited from any such economies of scale, and whether there is potential for realization of any further economies of scale. The Board considered the extent to which the fund will benefit from economies of scale as assets grow through increased services to the fund, through waivers or reimbursements, or through fee or expense ratio reductions. The Board also noted that in 2013, it and the boards of other Fidelity funds created an ad hoc committee (the Economies of Scale Committee) to analyze whether Fidelity attains economies of scale in respect of the management and servicing of the Fidelity funds, whether the Fidelity funds have appropriately benefited from such economies of scale, and whether there is potential for realization of any further economies of scale.
The Board recognized that the fund's management contract incorporates a "group fee" structure, which provides for lower group fee rates as total group assets increase, and for higher group fee rates as total group assets decrease (with "group assets" defined to include fund assets under FMR's management plus sector fund assets previously under FMR's management and currently managed by Fidelity SelectCo, LLC). FMR calculates the group fee rates based on a tiered asset "breakpoint" schedule that varies based on asset class. The Board considered that the group fee is designed to deliver the benefits of economies of scale to fund shareholders when total Fidelity fund assets increase, even if assets of any particular fund are unchanged or have declined, because some portion of Fidelity's costs are attributable to services provided to all Fidelity funds, and all funds benefit if those costs can be allocated among more assets. The Board also considered that although the fund is partially closed to new investors, it continues to incur investment management expenses, and marketing and distribution expenses related to the retention of existing shareholders and assets. The Board further noted that the fund may continue to realize benefits from the group fee structure, even though assets may not be expected to grow significantly at the fund level. The Board concluded that, given the group fee structure, fund shareholders will benefit from lower management fees as group assets increase at the fund complex level, regardless of whether Fidelity achieves any such economies of scale.
Annual Report
Board Approval of Investment Advisory Contracts and
Management Fees - continued
The Board concluded, taking into account the analysis of the Economies of Scale Committee, that economies of scale, if any, are being appropriately shared between fund shareholders and Fidelity.
Additional Information Requested by the Board. In order to develop fully the factual basis for consideration of the Fidelity funds' Advisory Contracts, the Board requested and received additional information on certain topics, including: (i) fund performance trends and Fidelity's long-term strategies for certain funds; (ii) the various share classes employed by Fidelity and the attributes of each class, together with similar information on the distribution and servicing payments made by Fidelity or the funds to third-party participants in the distribution channels; (iii) fund profitability, and fund performance in relation to fund profitability; (iv) the methodology with respect to evaluating competitive fund data and peer group classifications and fee comparisons; (v) annual fund profitability margins, with particular focus on certain funds with negative margins; (vi) the realization of fall-out benefits in certain Fidelity business units; (vii) economies of scale and the way in which they are shared with fund shareholders; (viii) Fidelity's group fee structures, including the group fee schedule of breakpoints; (ix) the impact of cost containment measures on the funds; and (x) the transfer agent fee structure.
Based on its evaluation of all of the conclusions noted above, and after considering all factors it believed relevant, the Board concluded that the advisory fee structures are fair and reasonable, and that the fund's Advisory Contracts should be renewed.
Annual Report
Investment Adviser
Fidelity Management & Research Company
Boston, MA
Investment Sub-Advisers
FMR Co., Inc.
FMR Investment Management
(U.K.) Limited
Fidelity Management & Research
(Hong Kong) Limited
Fidelity Management & Research
(Japan) Limited
General Distributor
Fidelity Distributors Corporation
Smithfield, RI
Transfer and Service Agents
Fidelity Investments Institutional
Operations Company, Inc.
Boston, MA
Fidelity Service Company, Inc.
Boston, MA
Custodian
Northern Trust Company
Chicago, IL
(Fidelity Investment logo)(registered trademark)
ASCV-UANN-0915
1.803731.110
(Fidelity Investment logo)(registered trademark)
Fidelity Advisor®
Small Cap Value
Fund - Class I
(formerly Institutional Class)
Annual Report
July 31, 2015
(Fidelity Cover Art)
Class I
is a class of Fidelity®
Small Cap Value Fund
Contents
Performance | (Click Here) | How the fund has done over time. |
Management's Discussion of Fund Performance | (Click Here) | The Portfolio Manager's review of fund performance and strategy. |
Shareholder Expense Example | (Click Here) | An example of shareholder expenses. |
Investment Changes | (Click Here) | A summary of major shifts in the fund's investments over the past six months. |
Investments | (Click Here) | A complete list of the fund's investments with their market values. |
Financial Statements | (Click Here) | Statements of assets and liabilities, operations, and changes in net assets, as well as financial highlights. |
Notes | (Click Here) | Notes to the financial statements. |
Report of Independent Registered Public Accounting Firm | (Click Here) | |
Trustees and Officers | (Click Here) | |
Distributions | (Click Here) | |
Board Approval of Investment Advisory Contracts and Management Fees | (Click Here) | |
To view a fund's proxy voting guidelines and proxy voting record for the 12-month period ended June 30, visit http://www.fidelity.com/proxyvotingresults or visit the Securities and Exchange Commission's (SEC) web site at http://www.sec.gov. You may also call 1-877-208-0098 to request a free copy of the proxy voting guidelines.
Standard & Poor's, S&P and S&P 500 are registered service marks of The McGraw-Hill Companies, Inc. and have been licensed for use by Fidelity Distributors Corporation.
Other third-party marks appearing herein are the property of their respective owners.
All other marks appearing herein are registered or unregistered trademarks or service marks of FMR LLC or an affiliated company. © 2015 FMR LLC. All rights reserved.
Annual Report
This report and the financial statements contained herein are submitted for the general information of the shareholders of the fund. This report is not authorized for distribution to prospective investors in the fund unless preceded or accompanied by an effective prospectus.
A fund files its complete schedule of portfolio holdings with the SEC for the first and third quarters of each fiscal year on Form N-Q. Forms N-Q are available on the SEC's web site at http://www.sec.gov. A fund's Forms N-Q may be reviewed and copied at the SEC's Public Reference Room in Washington, DC. Information regarding the operation of the SEC's Public Reference Room may be obtained by calling 1-800-SEC-0330. For a complete list of a fund's portfolio holdings, view the most recent holdings listing, semiannual report, or annual report on Fidelity's web site at http://www.fidelity.com, http://www.advisor.fidelity.com, or http://www.401k.com, as applicable.
NOT FDIC INSURED • MAY LOSE VALUE • NO BANK GUARANTEE
Neither the fund nor Fidelity Distributors Corporation is a bank.
Annual Report
Average annual total return reflects the change in the value of an investment, assuming reinvestment of the class' distributions from dividend income and capital gains (the profits earned upon the sale of securities that have grown in value, if any) and assuming a constant rate of performance each year. The $10,000 table and the fund's returns do not reflect the deduction of taxes that a shareholder would pay on fund distributions or the redemption of fund shares. During periods of reimbursement by Fidelity, a fund's total return will be greater than it would be had the reimbursement not occurred. How a fund did yesterday is no guarantee of how it will do tomorrow.
Average Annual Total Returns
Periods ended July 31, 2015 | Past 1
year | Past 5
years | Past 10
years |
Class I | 12.17% | 15.23% | 9.51% |
$10,000 Over 10 years
Let's say hypothetically that $10,000 was invested in Fidelity Advisor® Small Cap Value Fund - Class I on July 31, 2005. The chart shows how the value of your investment would have changed, and also shows how the Russell 2000® Value Index performed over the same period.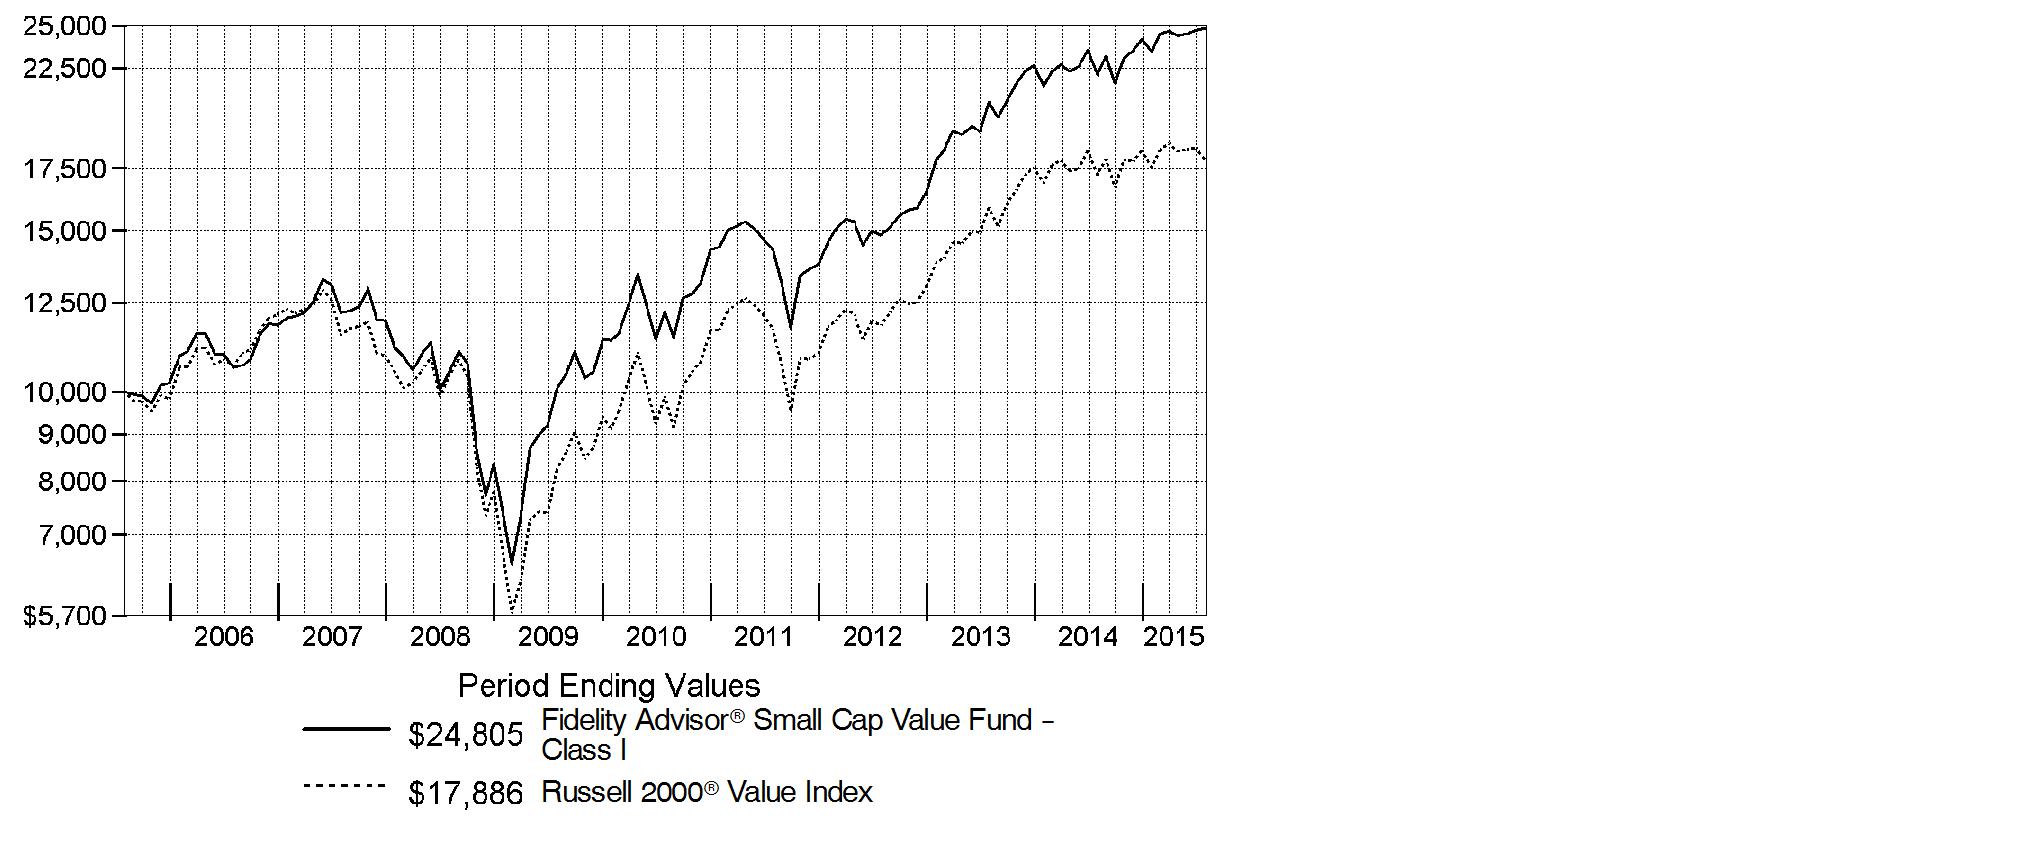
Annual Report
Market Recap: The U.S. equity market gained strongly for the 12 months ending July 31, 2015, as stocks recovered from volatility in late 2014 and early 2015, supported by a still-positive economic backdrop. The S&P 500® Index returned 11.21%, with growth stocks in the index far outpacing value-oriented names on prospects for continued U.S. economic growth. Consequently, the growth-oriented Nasdaq Composite Index® rose 18.71%, outpacing the broader S&P 500®, as well as the 12.03% advance of the smaller-cap Russell 2000® Index. Within the S&P 500®, seven of 10 sectors notched a gain, with significant performance variation. Health care (+27%) led the way, aided by merger activity. Consumer discretionary (+24%) benefited from spending linked to a seven-year low in unemployment. Strong first halves for the consumer staples sector and the real estate segment of financials yielded above-market returns (19% and 12%, respectively) for the full-year period. Conversely, energy (-26%) significantly lagged, due to a roughly 55% decline for U.S. crude-oil prices. Materials (-4%) also lost ground. At period end, investors remained focused on the slowing rate of U.S. earnings growth, the possible effect of a relatively stronger U.S. dollar on exports and inflation, and whether an economic slowdown in China would create ripples for the global economy.
Comments from Lead Portfolio Manager Derek Janssen: For the year, the fund significantly outpaced the 4.30% return of the benchmark Russell 2000® Value Index. (For specific results, please see the Performance section of this report.) Compared with the index, security selection was positive in nearly every sector of the market, especially financials, energy and information technology. The fund also benefited from an overweighting in the health care sector, by far the market's strongest-performing group. That favorable impact, however, was modestly tempered by subpar stock picking in the category. Our goal of managing potential damage from big losses was a plus. This was most evident in the beleaguered energy sector. Although we, too, experienced some struggles - most notably with ShawCor and Northern Oil and Gas - our aggregate energy holdings did vastly better than the sector as a whole. In financials, StanCorp Financial Group, a provider of group disability insurance, led the way on the positive side. Late in the period, the company agreed to be acquired, triggering a sharp rise in its share price. Meanwhile, in information technology, an out-of-index position for software company SS&C Technologies Holdings was a standout contributor. Elsewhere, a position in GrafTech International, which develops graphite electrodes and other carbon-based products, hurt results. In search of other opportunities, we sold the fund's shares in late 2014.
The views expressed above reflect those of the portfolio manager(s) only through the end of the period as stated on the cover of this report and do not necessarily represent the views of Fidelity or any other person in the Fidelity organization. Any such views are subject to change at any time based upon market or other conditions and Fidelity disclaims any responsibility to update such views. These views may not be relied on as investment advice and, because investment decisions for a Fidelity fund are based on numerous factors, may not be relied on as an indication of trading intent on behalf of any Fidelity fund.
Annual Report
Shareholder Expense Example
As a shareholder of the Fund, you incur two types of costs: (1) transaction costs, including sales charges (loads) on purchase payments or redemption proceeds, redemption fees and (2) ongoing costs, including management fees, distribution and/or service (12b-1) fees and other Fund expenses. This Example is intended to help you understand your ongoing costs (in dollars) of investing in the Fund and to compare these costs with the ongoing costs of investing in other mutual funds.
The Example is based on an investment of $1,000 invested at the beginning of the period and held for the entire period (February 1, 2015 to July 31, 2015).
Actual Expenses
The first line of the accompanying table for each class of the Fund provides information about actual account values and actual expenses. You may use the information in this line, together with the amount you invested, to estimate the expenses that you paid over the period. Simply divide your account value by $1,000.00 (for example, an $8,600 account value divided by $1,000.00 = 8.6), then multiply the result by the number in the first line for a class of the Fund under the heading entitled "Expenses Paid During Period" to estimate the expenses you paid on your account during this period. A small balance maintenance fee of $12.00 that is charged once a year may apply for certain accounts with a value of less than $2,000. This fee is not included in the table below. If it was, the estimate of expenses you paid during the period would be higher, and your ending account value lower, by this amount. In addition, the Fund, as a shareholder in the underlying Fidelity Central Funds, will indirectly bear its pro-rata share of the fees and expenses incurred by the underlying Fidelity Central Funds. These fees and expenses are not included in the Fund's annualized expense ratio used to calculate the expense estimate in the table below.
Hypothetical Example for Comparison Purposes
The second line of the accompanying table for each class of the Fund provides information about hypothetical account values and hypothetical expenses based on a Class' actual expense ratio and an assumed rate of return of 5% per year before expenses, which is not the Class' actual return. The hypothetical account values and expenses may not be used to estimate the actual ending account balance or expenses you paid for the period. You may use this information to compare the ongoing costs of investing in the Fund and other funds. To do so, compare this 5% hypothetical example with the 5% hypothetical examples that appear in the shareholder reports of the other funds. A small balance maintenance fee of $12.00 that is charged once a year may apply for certain accounts with a value of less than $2,000. This fee is not included in the table below. If it was, the estimate of expenses you paid during the period would be higher, and your ending account value lower, by this amount. In addition, the Fund, as a shareholder in the underlying Fidelity Central Funds, will indirectly bear its pro-rata share of the fees and expenses incurred by the underlying Fidelity Central Funds. These fees and expenses are not included in the Fund's annualized expense ratio used to calculate the expense estimate in the table below.
Please note that the expenses shown in the table are meant to highlight your ongoing costs only and do not reflect any transaction costs. Therefore, the second line of the table is useful in comparing ongoing costs only, and will not help you determine the relative total costs of owning different funds. In addition, if these transactional costs were included, your costs would have been higher.
Annual Report
| Annualized
Expense RatioB | Beginning
Account Value
February 1, 2015 | Ending
Account Value
July 31, 2015 | Expenses Paid
During Period*
February 1, 2015 to July 31, 2015 |
Class A | 1.35% | | | |
Actual | | $ 1,000.00 | $ 1,057.50 | $ 6.89 |
HypotheticalA | | $ 1,000.00 | $ 1,018.10 | $ 6.76 |
Class T | 1.60% | | | |
Actual | | $ 1,000.00 | $ 1,056.20 | $ 8.16 |
HypotheticalA | | $ 1,000.00 | $ 1,016.86 | $ 8.00 |
Class B | 2.19% | | | |
Actual | | $ 1,000.00 | $ 1,053.30 | $ 11.15 |
HypotheticalA | | $ 1,000.00 | $ 1,013.93 | $ 10.94 |
Class C | 2.12% | | | |
Actual | | $ 1,000.00 | $ 1,053.20 | $ 10.79 |
HypotheticalA | | $ 1,000.00 | $ 1,014.28 | $ 10.59 |
Small Cap Value | 1.09% | | | |
Actual | | $ 1,000.00 | $ 1,058.80 | $ 5.56 |
HypotheticalA | | $ 1,000.00 | $ 1,019.39 | $ 5.46 |
Class I | 1.09% | | | |
Actual | | $ 1,000.00 | $ 1,058.80 | $ 5.56 |
HypotheticalA | | $ 1,000.00 | $ 1,019.39 | $ 5.46 |
A 5% return per year before expenses
B Annualized expense ratio reflects expenses net of applicable fee waivers.
* Expenses are equal to each Class' annualized expense ratio, multiplied by the average account value over the period, multiplied by 181/365 (to reflect the one-half year period).
Annual Report
Investment Changes (Unaudited)
Top Ten Stocks as of July 31, 2015 |
| % of fund's
net assets | % of fund's net assets
6 months ago |
Aarons, Inc. Class A | 3.0 | 2.6 |
Aspen Insurance Holdings Ltd. | 2.7 | 2.5 |
Rouse Properties, Inc. | 2.7 | 2.9 |
Tech Data Corp. | 2.7 | 2.4 |
Federated Investors, Inc. Class B (non-vtg.) | 2.7 | 2.9 |
Store Capital Corp. | 2.6 | 0.0 |
Silgan Holdings, Inc. | 2.6 | 2.3 |
CVB Financial Corp. | 2.5 | 1.7 |
Universal Corp. | 2.4 | 1.7 |
DineEquity, Inc. | 2.4 | 1.4 |
| 26.3 | |
Top Five Market Sectors as of July 31, 2015 |
| % of fund's
net assets | % of fund's net assets
6 months ago |
Financials | 41.0 | 40.5 |
Industrials | 13.2 | 13.0 |
Information Technology | 12.9 | 12.8 |
Consumer Discretionary | 9.3 | 11.6 |
Health Care | 6.8 | 6.7 |
Asset Allocation (% of fund's net assets) |
As of July 31, 2015 * | As of January 31, 2015 ** |
 | Stocks 99.2% | |  | Stocks 99.2% | |
 | Short-Term
Investments and
Net Other Assets (Liabilities) 0.8% | |  | Short-Term
Investments and
Net Other Assets (Liabilities) 0.8% | |
* Foreign investments | 11.2% | | ** Foreign investments | 11.9% | |

Annual Report
Investments July 31, 2015
Showing Percentage of Net Assets
Common Stocks - 99.2% |
| Shares | | Value |
CONSUMER DISCRETIONARY - 9.3% |
Auto Components - 1.5% |
Standard Motor Products, Inc. (e) | 1,183,301 | | $ 43,273,318 |
Hotels, Restaurants & Leisure - 2.4% |
DineEquity, Inc. | 660,000 | | 68,646,600 |
Specialty Retail - 5.1% |
Aarons, Inc. Class A | 2,295,100 | | 84,872,798 |
Genesco, Inc. (a) | 616,728 | | 39,896,134 |
Hibbett Sports, Inc. (a) | 249,000 | | 11,341,950 |
Murphy U.S.A., Inc. (a) | 72,506 | | 3,970,429 |
| | 140,081,311 |
Textiles, Apparel & Luxury Goods - 0.3% |
Vera Bradley, Inc. (a) | 831,000 | | 9,024,660 |
TOTAL CONSUMER DISCRETIONARY | | 261,025,889 |
CONSUMER STAPLES - 4.2% |
Food Products - 1.8% |
Post Holdings, Inc. (a) | 931,300 | | 50,048,062 |
Tobacco - 2.4% |
Universal Corp. (d)(e) | 1,208,239 | | 68,930,035 |
TOTAL CONSUMER STAPLES | | 118,978,097 |
ENERGY - 4.3% |
Energy Equipment & Services - 1.8% |
Hornbeck Offshore Services, Inc. (a)(d) | 1,600,000 | | 29,120,000 |
ShawCor Ltd. Class A | 871,000 | | 20,472,180 |
| | 49,592,180 |
Oil, Gas & Consumable Fuels - 2.5% |
Northern Oil & Gas, Inc. (a)(d) | 1,958,249 | | 9,321,265 |
World Fuel Services Corp. | 1,537,200 | | 62,487,180 |
| | 71,808,445 |
TOTAL ENERGY | | 121,400,625 |
FINANCIALS - 41.0% |
Banks - 9.7% |
Associated Banc-Corp. | 2,890,335 | | 56,968,503 |
CVB Financial Corp. | 3,999,988 | | 70,839,787 |
First Citizen Bancshares, Inc. Class A (a) | 180,954 | | 46,385,748 |
Common Stocks - continued |
| Shares | | Value |
FINANCIALS - continued |
Banks - continued |
First Citizen Bancshares, Inc. Class A | 140,370 | | $ 35,982,446 |
First Niagara Financial Group, Inc. | 6,500,000 | | 63,115,000 |
| | 273,291,484 |
Capital Markets - 6.1% |
Federated Investors, Inc. Class B (non-vtg.) | 2,199,963 | | 74,160,753 |
OM Asset Management Ltd. | 2,232,001 | | 39,439,458 |
Waddell & Reed Financial, Inc. Class A | 1,264,100 | | 56,770,731 |
| | 170,370,942 |
Insurance - 11.5% |
Aspen Insurance Holdings Ltd. | 1,599,400 | | 76,915,146 |
Endurance Specialty Holdings Ltd. | 902,400 | | 62,707,776 |
First American Financial Corp. | 1,270,287 | | 51,548,246 |
ProAssurance Corp. | 1,368,200 | | 66,070,378 |
StanCorp Financial Group, Inc. | 581,300 | | 66,279,826 |
| | 323,521,372 |
Real Estate Investment Trusts - 8.2% |
National Retail Properties, Inc. (d) | 683,400 | | 25,401,978 |
Rouse Properties, Inc. (d)(e) | 4,350,000 | | 76,560,000 |
Sabra Health Care REIT, Inc. | 2,042,700 | | 55,867,845 |
Store Capital Corp. | 3,500,000 | | 73,500,000 |
| | 231,329,823 |
Real Estate Management & Development - 1.7% |
Kennedy Wilson Europe Real Estate PLC | 2,659,540 | | 47,554,949 |
Thrifts & Mortgage Finance - 3.8% |
Astoria Financial Corp. | 3,403,499 | | 51,460,905 |
Washington Federal, Inc. | 2,368,300 | | 55,134,024 |
| | 106,594,929 |
TOTAL FINANCIALS | | 1,152,663,499 |
HEALTH CARE - 6.8% |
Health Care Equipment & Supplies - 1.6% |
Integra LifeSciences Holdings Corp. (a) | 709,200 | | 45,480,996 |
Health Care Providers & Services - 2.7% |
AmSurg Corp. (a) | 148,800 | | 10,674,912 |
Civitas Solutions, Inc. (e) | 2,940,700 | | 66,136,343 |
| | 76,811,255 |
Common Stocks - continued |
| Shares | | Value |
HEALTH CARE - continued |
Health Care Technology - 1.1% |
Cegedim SA (a) | 670,247 | | $ 29,436,590 |
Pharmaceuticals - 1.4% |
Theravance, Inc. (d) | 2,594,553 | | 39,748,552 |
TOTAL HEALTH CARE | | 191,477,393 |
INDUSTRIALS - 13.2% |
Aerospace & Defense - 1.6% |
Moog, Inc. Class A (a) | 650,000 | | 43,459,000 |
Commercial Services & Supplies - 2.8% |
Essendant, Inc. | 1,273,798 | | 46,901,242 |
Knoll, Inc. | 1,269,800 | | 30,729,160 |
| | 77,630,402 |
Electrical Equipment - 3.3% |
AZZ, Inc. | 770,000 | | 39,847,500 |
EnerSys | 843,700 | | 52,689,065 |
| | 92,536,565 |
Machinery - 3.8% |
Columbus McKinnon Corp. (NY Shares) | 776,000 | | 18,204,960 |
Mueller Industries, Inc. | 1,600,400 | | 51,804,948 |
Valmont Industries, Inc. (d) | 340,000 | | 37,818,200 |
| | 107,828,108 |
Trading Companies & Distributors - 1.7% |
WESCO International, Inc. (a)(d) | 777,933 | | 47,733,969 |
TOTAL INDUSTRIALS | | 369,188,044 |
INFORMATION TECHNOLOGY - 12.9% |
Electronic Equipment & Components - 6.1% |
Ingram Micro, Inc. Class A | 2,048,300 | | 55,775,209 |
SYNNEX Corp. | 527,200 | | 39,872,136 |
Tech Data Corp. (a) | 1,286,373 | | 75,034,137 |
| | 170,681,482 |
Internet Software & Services - 2.8% |
Cimpress NV (a) | 600,000 | | 38,718,000 |
j2 Global, Inc. | 574,300 | | 40,430,720 |
| | 79,148,720 |
IT Services - 1.7% |
CACI International, Inc. Class A (a) | 578,334 | | 47,498,571 |
Common Stocks - continued |
| Shares | | Value |
INFORMATION TECHNOLOGY - continued |
Software - 2.3% |
SS&C Technologies Holdings, Inc. | 963,900 | | $ 65,574,117 |
TOTAL INFORMATION TECHNOLOGY | | 362,902,890 |
MATERIALS - 2.9% |
Containers & Packaging - 2.6% |
Silgan Holdings, Inc. | 1,350,000 | | 72,184,500 |
Metals & Mining - 0.3% |
Haynes International, Inc. | 186,142 | | 7,924,065 |
TOTAL MATERIALS | | 80,108,565 |
UTILITIES - 4.6% |
Electric Utilities - 3.8% |
El Paso Electric Co. | 1,524,121 | | 55,523,728 |
IDACORP, Inc. | 822,000 | | 51,054,420 |
| | 106,578,148 |
Gas Utilities - 0.8% |
Southwest Gas Corp. | 372,656 | | 20,995,439 |
TOTAL UTILITIES | | 127,573,587 |
TOTAL COMMON STOCKS (Cost $2,263,907,733) |
2,785,318,589
|
Money Market Funds - 3.4% |
| Shares | | Value |
Fidelity Cash Central Fund, 0.17% (b) | 17,732,670 | | $ 17,732,670 |
Fidelity Securities Lending Cash Central Fund, 0.18% (b)(c) | 78,652,275 | | 78,652,275 |
TOTAL MONEY MARKET FUNDS (Cost $96,384,945) |
96,384,945
|
TOTAL INVESTMENT PORTFOLIO - 102.6% (Cost $2,360,292,678) | 2,881,703,534 |
NET OTHER ASSETS (LIABILITIES) - (2.6)% | (72,769,368) |
NET ASSETS - 100% | $ 2,808,934,166 |
Legend |
(a) Non-income producing |
(b) Affiliated fund that is generally available only to investment companies and other accounts managed by Fidelity Investments. The rate quoted is the annualized seven-day yield of the fund at period end. A complete unaudited listing of the fund's holdings as of its most recent quarter end is available upon request. In addition, each Fidelity Central Fund's financial statements, which are not covered by the Fund's Report of Independent Registered Public Accounting Firm, are available on the SEC's website or upon request. |
(c) Investment made with cash collateral received from securities on loan. |
(d) Security or a portion of the security is on loan at period end. |
(e) Affiliated company |
Affiliated Central Funds |
Information regarding fiscal year to date income earned by the Fund from investments in Fidelity Central Funds is as follows: |
Fund | Income earned |
Fidelity Cash Central Fund | $ 32,820 |
Fidelity Securities Lending Cash Central Fund | 2,526,958 |
Total | $ 2,559,778 |
Other Affiliated Issuers |
An affiliated company is a company in which the Fund has ownership of at least 5% of the voting securities. Fiscal year to date transactions with companies which are or were affiliates are as follows: |
Affiliate | Value, beginning of period | Purchases | Sales Proceeds | Dividend Income | Value,
end of
period |
ACCO Brands Corp. | $ 50,386,144 | $ - | $ 54,199,221 | $ - | $ - |
Civitas Solutions, Inc. | - | 49,470,245 | - | - | 66,136,343 |
Rouse Properties, Inc. | 61,020,000 | 12,779,885 | - | 1,241,110 | 76,560,000 |
Standard Motor Products, Inc. | 5,166,001 | 37,876,193 | - | 350,548 | 43,273,318 |
Universal Corp. | 34,273,800 | 23,621,771 | - | 2,242,369 | 68,930,035 |
Total | $ 150,845,945 | $ 123,748,094 | $ 54,199,221 | $ 3,834,027 | $ 254,899,696 |
Other Information |
All investments are categorized as Level 1 under the Fair Value Hierarchy. The inputs or methodology used for valuing securities may not be an indication of the risk associated with investing in those securities. For more information on valuation inputs, please refer to the Investment Valuation section in the accompanying Notes to Financial Statements. |
Distribution of investments by country or territory of incorporation, as a percentage of total net assets, is as follows (Unaudited): |
United States of America | 88.8% |
Bermuda | 4.9% |
Bailiwick of Jersey | 1.7% |
United Kingdom | 1.4% |
Netherlands | 1.4% |
France | 1.1% |
Others (Individually Less Than 1%) | 0.7% |
| 100.0% |
See accompanying notes which are an integral part of the financial statements.
Annual Report
Statement of Assets and Liabilities
| | July 31, 2015 |
| | |
Assets | | |
Investment in securities, at value (including securities loaned of $78,959,780) - See accompanying schedule: Unaffiliated issuers (cost $2,038,966,810) | $ 2,530,418,893 | |
Fidelity Central Funds (cost $96,384,945) | 96,384,945 | |
Other affiliated issuers (cost $224,940,923) | 254,899,696 | |
Total Investments (cost $2,360,292,678) | | $ 2,881,703,534 |
Cash | | 734,073 |
Receivable for investments sold | | 15,532,470 |
Receivable for fund shares sold | | 1,661,236 |
Dividends receivable | | 1,471,580 |
Distributions receivable from Fidelity Central Funds | | 173,728 |
Other receivables | | 47,404 |
Total assets | | 2,901,324,025 |
| | |
Liabilities | | |
Payable for investments purchased | $ 8,089,386 | |
Payable for fund shares redeemed | 2,726,578 | |
Accrued management fee | 2,167,127 | |
Distribution and service plan fees payable | 144,360 | |
Other affiliated payables | 547,440 | |
Other payables and accrued expenses | 62,693 | |
Collateral on securities loaned, at value | 78,652,275 | |
Total liabilities | | 92,389,859 |
| | |
Net Assets | | $ 2,808,934,166 |
Net Assets consist of: | | |
Paid in capital | | $ 2,052,777,532 |
Undistributed net investment income | | 15,098,491 |
Accumulated undistributed net realized gain (loss) on investments and foreign currency transactions | | 219,647,286 |
Net unrealized appreciation (depreciation) on investments and assets and liabilities in foreign currencies | | 521,410,857 |
Net Assets | | $ 2,808,934,166 |
See accompanying notes which are an integral part of the financial statements.
Annual Report
Statement of Assets and Liabilities - continued
| | July 31, 2015 |
Calculation of Maximum Offering Price | | |
Class A: | | |
Net Asset Value and redemption price per share ($235,843,693 ÷ 12,321,881 shares) | | $ 19.14 |
| | |
Maximum offering price per share (100/94.25 of $19.14) | | $ 20.31 |
Class T: | | |
Net Asset Value and redemption price per share ($91,716,035 ÷ 4,884,772 shares) | | $ 18.78 |
| | |
Maximum offering price per share (100/96.50 of $18.78) | | $ 19.46 |
Class B: | | |
Net Asset Value and offering price per share ($3,472,809 ÷ 195,257 shares) | | $ 17.79 |
| | |
Class C: | | |
Net Asset Value and offering price per share ($64,928,190 ÷ 3,644,329 shares) | | $ 17.82 |
| | |
Small Cap Value: | | |
Net Asset Value, offering price and redemption price per share ($2,036,156,515 ÷ 104,710,600 shares) | | $ 19.45 |
| | |
Class I: | | |
Net Asset Value, offering price and redemption price per share ($376,816,924 ÷ 19,373,883 shares) | | $ 19.45 |
A Redemption price per share is equal to net asset value less any applicable contingent deferred sales charge.
See accompanying notes which are an integral part of the financial statements.
Annual Report
Financial Statements - continued
Statement of Operations
| Year ended July 31, 2015 |
| | |
Investment Income | | |
Dividends (including $3,834,027 earned from other affiliated issuers) | | $ 43,839,929 |
Special dividends | | 7,304,990 |
Interest | | 13 |
Income from Fidelity Central Funds | | 2,559,778 |
Total income | | 53,704,710 |
| | |
Expenses | | |
Management fee | | |
Basic fee | $ 19,717,517 | |
Performance adjustment | 5,968,836 | |
Transfer agent fees | 5,735,976 | |
Distribution and service plan fees | 1,818,820 | |
Accounting and security lending fees | 861,187 | |
Custodian fees and expenses | 49,188 | |
Independent trustees' compensation | 11,943 | |
Registration fees | 112,249 | |
Audit | 66,269 | |
Legal | 6,901 | |
Interest | 136 | |
Miscellaneous | 18,831 | |
Total expenses before reductions | 34,367,853 | |
Expense reductions | (889,045) | 33,478,808 |
Net investment income (loss) | | 20,225,902 |
Realized and Unrealized Gain (Loss) Net realized gain (loss) on: | | |
Investment securities: | | |
Unaffiliated issuers | 288,163,783 | |
Other affiliated issuers | (2,940,192) | |
Foreign currency transactions | 293,006 | |
Total net realized gain (loss) | | 285,516,597 |
Change in net unrealized appreciation (depreciation) on: Investment securities | 14,012,996 | |
Assets and liabilities in foreign currencies | 1 | |
Total change in net unrealized appreciation (depreciation) | | 14,012,997 |
Net gain (loss) | | 299,529,594 |
Net increase (decrease) in net assets resulting from operations | | $ 319,755,496 |
See accompanying notes which are an integral part of the financial statements.
Annual Report
Statement of Changes in Net Assets
| Year ended
July 31,
2015 | Year ended
July 31,
2014 |
Increase (Decrease) in Net Assets | | |
Operations | | |
Net investment income (loss) | $ 20,225,902 | $ 11,952,766 |
Net realized gain (loss) | 285,516,597 | 925,842,288 |
Change in net unrealized appreciation (depreciation) | 14,012,997 | (668,249,080) |
Net increase (decrease) in net assets resulting from operations | 319,755,496 | 269,545,974 |
Distributions to shareholders from net investment income | (9,146,893) | (10,662,065) |
Distributions to shareholders from net realized gain | (322,480,172) | (362,625,477) |
Total distributions | (331,627,065) | (373,287,542) |
Share transactions - net increase (decrease) | (16,898,248) | (1,289,647,794) |
Redemption fees | 149,785 | 536,076 |
Total increase (decrease) in net assets | (28,620,032) | (1,392,853,286) |
| | |
Net Assets | | |
Beginning of period | 2,837,554,198 | 4,230,407,484 |
End of period (including undistributed net investment income of $15,098,491 and undistributed net investment income of $5,856,882, respectively) | $ 2,808,934,166 | $ 2,837,554,198 |
See accompanying notes which are an integral part of the financial statements.
Annual Report
Financial Highlights - Class A
Years ended July 31, | 2015 | 2014 | 2013 | 2012 | 2011 |
Selected Per-Share Data | | | | | |
Net asset value, beginning of period | $ 19.29 | $ 19.96 | $ 14.86 | $ 15.48 | $ 13.45 |
Income from Investment Operations | | | | | |
Net investment income (loss) C | .10 L | .03 | .07 | .01 | .01F |
Net realized and unrealized gain (loss) | 2.01 | 1.24 | 5.57 | .30 | 2.22 |
Total from investment operations | 2.11 | 1.27 | 5.64 | .31 | 2.23 |
Distributions from net investment income | (.02) | (.01) | (.07) | (.01) | (.08) |
Distributions from net realized gain | (2.25) | (1.93) | (.47) | (.93) | (.12) |
Total distributions | (2.26)K | (1.94) | (.54) | (.93)J | (.20) |
Redemption fees added to paid in capitalC,H | - | - | - | - | - |
Net asset value, end of period | $ 19.14 | $ 19.29 | $ 19.96 | $ 14.86 | $ 15.48 |
Total ReturnA, B | 11.86% | 6.83% | 39.09% | 3.24% | 16.72% |
Ratios to Average Net Assets D, G | | | | | |
Expenses before reductions | 1.42% | 1.36% | 1.36% | 1.44% | 1.44% |
Expenses net of fee waivers, if any | 1.39% | 1.35% | 1.36% | 1.44% | 1.43% |
Expenses net of all reductions | 1.39% | 1.34% | 1.36% | 1.44% | 1.43% |
Net investment income (loss) | .52% L | .13% | .41% | .09% | .06%F |
Supplemental Data | | | | | |
Net assets, end of period
(000 omitted) | $ 235,844 | $ 258,183 | $ 275,265 | $ 150,285 | $ 140,707 |
Portfolio turnover rateE | 34% | 26%I | 29% | 27% | 22% |
A Total returns would have been lower if certain expenses had not been reduced during the applicable periods shown.
B Total returns do not include the effect of the sales charges.
C Calculated based on average shares outstanding during the period.
D Fees and expenses of any underlying Fidelity Central Funds are not included in the Fund's expense ratio. The Fund indirectly bears its proportionate share of the expenses of any underlying Fidelity Central Funds.
E Amount does not include the portfolio activity of any underlying Fidelity Central Funds.
F Investment income per share reflects a large, non-recurring dividend which amounted to $.06 per share. Excluding this non-recurring dividend, the ratio of net investment income (loss) to average net assets would have been (.31)%.
G Expense ratios reflect operating expenses of the class. Expenses before reductions do not reflect amounts reimbursed by the investment adviser or reductions from brokerage service arrangements or reductions from other expense offset arrangements and do not represent the amount paid by the class during periods when reimbursements or reductions occur. Expenses net of fee waivers reflect expenses after reimbursement by the investment adviser but prior to reductions from brokerage service arrangements or other expense offset arrangements. Expenses net of all reductions represent the net expenses paid by the class.
H Amount represents less than $.01 per share.
I Portfolio turnover rate excludes securities received or delivered in-kind.
J Total distributions of $.93 per share is comprised of distributions from net investment income of $.006 and distributions from net realized gain of $.925 per share.
K Total distributions of $2.26 per share is comprised of distributions from net investment income of $.016 and distributions from net realized gain of $2.248 per share.
L Investment income per share reflects a large, non-recurring dividend which amounted to $.05 per share. Excluding this non-recurring dividend, the ratio of net investment income (loss) to average net assets would have been .26%.
See accompanying notes which are an integral part of the financial statements.
Annual Report
Financial Highlights - Class T
Years ended July 31, | 2015 | 2014 | 2013 | 2012 | 2011 |
Selected Per-Share Data | | | | | |
Net asset value, beginning of period | $ 18.98 | $ 19.70 | $ 14.70 | $ 15.34 | $ 13.34 |
Income from Investment Operations | | | | | |
Net investment income (loss) C | .05J | (.02) | .03 | (.02) | (.03) F |
Net realized and unrealized gain (loss) | 1.98 | 1.23 | 5.50 | .31 | 2.20 |
Total from investment operations | 2.03 | 1.21 | 5.53 | .29 | 2.17 |
Distributions from net investment income | - | - | (.06) | - | (.05) |
Distributions from net realized gain | (2.23) | (1.93) | (.47) | (.93) | (.12) |
Total distributions | (2.23) | (1.93) | (.53) | (.93) | (.17) |
Redemption fees added to paid in capital C,H | - | - | - | - | - |
Net asset value, end of period | $ 18.78 | $ 18.98 | $ 19.70 | $ 14.70 | $ 15.34 |
Total ReturnA, B | 11.58% | 6.58% | 38.70% | 3.08% | 16.36% |
Ratios to Average Net Assets D, G | | | | | |
Expenses before reductions | 1.67% | 1.61% | 1.60% | 1.67% | 1.70% |
Expenses net of fee waivers, if any | 1.64% | 1.59% | 1.60% | 1.67% | 1.69% |
Expenses net of all reductions | 1.63% | 1.59% | 1.59% | 1.67% | 1.69% |
Net investment income (loss) | .27%J | (.11)% | .18% | (.14)% | (.19)% F |
Supplemental Data | | | | | |
Net assets, end of period
(000 omitted) | $ 91,716 | $ 100,975 | $ 107,444 | $ 57,514 | $ 55,845 |
Portfolio turnover rateE | 34% | 26% I | 29% | 27% | 22% |
A Total returns would have been lower if certain expenses had not been reduced during the applicable periods shown.
B Total returns do not include the effect of the sales charges.
C Calculated based on average shares outstanding during the period.
D Fees and expenses of any underlying Fidelity Central Funds are not included in the Fund's expense ratio. The Fund indirectly bears its proportionate share of the expenses of any underlying Fidelity Central Funds.
E Amount does not include the portfolio activity of any underlying Fidelity Central Funds.
F Investment income per share reflects a large, non-recurring dividend which amounted to $.06 per share. Excluding this non-recurring dividend, the ratio of net investment income (loss) to average net assets would have been (.57)%.
G Expense ratios reflect operating expenses of the class. Expenses before reductions do not reflect amounts reimbursed by the investment adviser or reductions from brokerage service arrangements or reductions from other expense offset arrangements and do not represent the amount paid by the class during periods when reimbursements or reductions occur. Expenses net of fee waivers reflect expenses after reimbursement by the investment adviser but prior to reductions from brokerage service arrangements or other expense offset arrangements. Expenses net of all reductions represent the net expenses paid by the class.
H Amount represents less than $.01 per share.
I Portfolio turnover rate excludes securities received or delivered in-kind.
J Investment income per share reflects a large, non-recurring dividend which amounted to $.05 per share. Excluding this non-recurring dividend, the ratio of net investment income (loss) to average net assets would have been .01%.
See accompanying notes which are an integral part of the financial statements.
Annual Report
Financial Highlights - Class B
Years ended July 31, | 2015 | 2014 | 2013 | 2012 | 2011 |
Selected Per-Share Data | | | | | |
Net asset value, beginning of period | $ 18.18 | $ 19.06 | $ 14.27 | $ 15.00 | $ 13.08 |
Income from Investment Operations | | | | | |
Net investment income (loss) C | (.06)J | (.13) | (.06) | (.09) | (.10) F |
Net realized and unrealized gain (loss) | 1.90 | 1.18 | 5.34 | .29 | 2.15 |
Total from investment operations | 1.84 | 1.05 | 5.28 | .20 | 2.05 |
Distributions from net investment income | - | - | (.02) | - | (.01) |
Distributions from net realized gain | (2.23) | (1.93) | (.47) | (.93) | (.12) |
Total distributions | (2.23) | (1.93) | (.49) | (.93) | (.13) |
Redemption fees added to paid in capitalC,H | - | - | - | - | - |
Net asset value, end of period | $ 17.79 | $ 18.18 | $ 19.06 | $ 14.27 | $ 15.00 |
Total ReturnA, B | 10.94% | 5.92% | 38.07% | 2.51% | 15.80% |
Ratios to Average Net Assets D, G | | | | | |
Expenses before reductions | 2.25% | 2.18% | 2.15% | 2.19% | 2.20% |
Expenses net of fee waivers, if any | 2.23% | 2.17% | 2.15% | 2.19% | 2.19% |
Expenses net of all reductions | 2.22% | 2.16% | 2.14% | 2.19% | 2.19% |
Net investment income (loss) | (.32)%J | (.69)% | (.37)% | (.66)% | (.69)%F |
Supplemental Data | | | | | |
Net assets, end of period (000 omitted) | $ 3,473 | $ 4,808 | $ 7,052 | $ 6,675 | $ 8,549 |
Portfolio turnover rateE | 34% | 26%I | 29% | 27% | 22% |
A Total returns would have been lower if certain expenses had not been reduced during the applicable periods shown.
B Total returns do not include the effect of the contingent deferred sales charge.
C Calculated based on average shares outstanding during the period.
D Fees and expenses of any underlying Fidelity Central Funds are not included in the Fund's expense ratio. The Fund indirectly bears its proportionate share of the expenses of any underlying Fidelity Central Funds.
E Amount does not include the portfolio activity of any underlying Fidelity Central Funds.
F Investment income per share reflects a large, non-recurring dividend which amounted to $.06 per share. Excluding this non-recurring dividend, the ratio of net investment income (loss) to average net assets would have been (1.07)%.
G Expense ratios reflect operating expenses of the class. Expenses before reductions do not reflect amounts reimbursed by the investment adviser or reductions from brokerage service arrangements or reductions from other expense offset arrangements and do not represent the amount paid by the class during periods when reimbursements or reductions occur. Expenses net of fee waivers reflect expenses after reimbursement by the investment adviser but prior to reductions from brokerage service arrangements or other expense offset arrangements. Expenses net of all reductions represent the net expenses paid by the class.
H Amount represents less than $.01 per share.
I Portfolio turnover rate excludes securities received or delivered in-kind.
J Investment income per share reflects a large, non-recurring dividend which amounted to $.05 per share. Excluding this non-recurring dividend, the ratio of net investment income (loss) to average net assets would have been (.58)%.
See accompanying notes which are an integral part of the financial statements.
Annual Report
Financial Highlights - Class C
Years ended July 31, | 2015 | 2014 | 2013 | 2012 | 2011 |
Selected Per-Share Data | | | | | |
Net asset value, beginning of period | $ 18.19 | $ 19.06 | $ 14.28 | $ 15.01 | $ 13.08 |
Income from Investment Operations | | | | | |
Net investment income (loss) C | (.04) J | (.12) | (.06) | (.09) | (.10) F |
Net realized and unrealized gain (loss) | 1.90 | 1.18 | 5.34 | .29 | 2.17 |
Total from investment operations | 1.86 | 1.06 | 5.28 | .20 | 2.07 |
Distributions from net investment income | - | - | (.03) | - | (.02) |
Distributions from net realized gain | (2.23) | (1.93) | (.47) | (.93) | (.12) |
Total distributions | (2.23) | (1.93) | (.50) | (.93) | (.14) |
Redemption fees added to paid in capital C,H | - | - | - | - | - |
Net asset value, end of period | $ 17.82 | $ 18.19 | $ 19.06 | $ 14.28 | $ 15.01 |
Total ReturnA, B | 11.05% | 5.97% | 38.00% | 2.52% | 15.91% |
Ratios to Average Net Assets D, G | | | | | |
Expenses before reductions | 2.19% | 2.12% | 2.13% | 2.19% | 2.18% |
Expenses net of fee waivers, if any | 2.16% | 2.11% | 2.13% | 2.19% | 2.18% |
Expenses net of all reductions | 2.15% | 2.10% | 2.12% | 2.19% | 2.18% |
Net investment income (loss) | (.25)% J | (.63)% | (.35)% | (.66)% | (.68)% F |
Supplemental Data | | | | | |
Net assets, end of period (000 omitted) | $ 64,928 | $ 70,541 | $ 76,018 | $ 47,265 | $ 47,457 |
Portfolio turnover rateE | 34% | 26% I | 29% | 27% | 22% |
A Total returns would have been lower if certain expenses had not been reduced during the applicable periods shown.
B Total returns do not include the effect of the contingent deferred sales charge.
C Calculated based on average shares outstanding during the period.
D Fees and expenses of any underlying Fidelity Central Funds are not included in the Fund's expense ratio. The Fund indirectly bears its proportionate share of the expenses of any underlying Fidelity Central Funds.
E Amount does not include the portfolio activity of any underlying Fidelity Central Funds.
F Investment income per share reflects a large, non-recurring dividend which amounted to $.06 per share. Excluding this non-recurring dividend, the ratio of net investment income (loss) to average net assets would have been (1.06)%.
G Expense ratios reflect operating expenses of the class. Expenses before reductions do not reflect amounts reimbursed by the investment adviser or reductions from brokerage service arrangements or reductions from other expense offset arrangements and do not represent the amount paid by the class during periods when reimbursements or reductions occur. Expenses net of fee waivers reflect expenses after reimbursement by the investment adviser but prior to reductions from brokerage service arrangements or other expense offset arrangements. Expenses net of all reductions represent the net expenses paid by the class.
H Amount represents less than $.01 per share.
I Portfolio turnover rate excludes securities received or delivered in-kind.
J Investment income per share reflects a large, non-recurring dividend which amounted to $.05 per share. Excluding this non-recurring dividend, the ratio of net investment income (loss) to average net assets would have been (.51)%.
See accompanying notes which are an integral part of the financial statements.
Annual Report
Financial Highlights - Small Cap Value
Years ended July 31, | 2015 | 2014 | 2013 | 2012 | 2011 |
Selected Per-Share Data | | | | | |
Net asset value, beginning of period | $ 19.57 | $ 20.22 | $ 15.05 | $ 15.62 | $ 13.56 |
Income from Investment Operations | | | | | |
Net investment income (loss) B | .15 I | .08 | .12 | .06 | .06E |
Net realized and unrealized gain (loss) | 2.05 | 1.26 | 5.63 | .32 | 2.23 |
Total from investment operations | 2.20 | 1.34 | 5.75 | .38 | 2.29 |
Distributions from net investment income | (.07) | (.06) | (.11) | (.02) | (.10) |
Distributions from net realized gain | (2.25) | (1.93) | (.47) | (.93) | (.13) |
Total distributions | (2.32) | (1.99) | (.58) | (.95) | (.23) |
Redemption fees added to paid in capitalB,G | - | - | - | - | - |
Net asset value, end of period | $ 19.45 | $ 19.57 | $ 20.22 | $ 15.05 | $ 15.62 |
Total ReturnA | 12.18% | 7.12% | 39.45% | 3.67% | 17.03% |
Ratios to Average Net Assets C, F | | | | | |
Expenses before reductions | 1.15% | 1.08% | 1.07% | 1.13% | 1.13% |
Expenses net of fee waivers, if any | 1.12% | 1.06% | 1.07% | 1.13% | 1.13% |
Expenses net of all reductions | 1.12% | 1.06% | 1.06% | 1.13% | 1.13% |
Net investment income (loss) | .78% I | .41% | .71% | .41% | .37%E |
Supplemental Data | | | | | |
Net assets, end of period
(000 omitted) | $ 2,036,157 | $ 2,060,546 | $ 2,672,854 | $ 1,756,962 | $ 1,899,805 |
Portfolio turnover rateD | 34% | 26%H | 29% | 27% | 22% |
A Total returns would have been lower if certain expenses had not been reduced during the applicable periods shown.
B Calculated based on average shares outstanding during the period.
C Fees and expenses of any underlying Fidelity Central Funds are not included in the Fund's expense ratio. The Fund indirectly bears its proportionate share of the expenses of any underlying Fidelity Central Funds.
D Amount does not include the portfolio activity of any underlying Fidelity Central Funds.
E Investment income per share reflects a large, non-recurring dividend which amounted to $.06 per share. Excluding this non-recurring dividend, the ratio of net investment income (loss) to average net assets would have been (.01)%.
F Expense ratios reflect operating expenses of the class. Expenses before reductions do not reflect amounts reimbursed by the investment adviser or reductions from brokerage service arrangements or reductions from other expense offset arrangements and do not represent the amount paid by the class during periods when reimbursements or reductions occur. Expenses net of fee waivers reflect expenses after reimbursement by the investment adviser but prior to reductions from brokerage service arrangements or other expense offset arrangements. Expenses net of all reductions represent the net expenses paid by the class.
G Amount represents less than $.01 per share.
H Portfolio turnover rate excludes securities received or delivered in-kind.
I Investment income per share reflects a large, non-recurring dividend which amounted to $.05 per share. Excluding this non-recurring dividend, the ratio of net investment income (loss) to average net assets would have been .53%.
See accompanying notes which are an integral part of the financial statements.
Annual Report
Financial Highlights - Class I
Years ended July 31, | 2015 | 2014 | 2013 | 2012 | 2011 |
Selected Per-Share Data | | | | | |
Net asset value, beginning of period | $ 19.57 | $ 20.23 | $ 15.05 | $ 15.63 | $ 13.58 |
Income from Investment Operations | | | | | |
Net investment income (loss) B | .15 I | .08 | .12 | .06 | .06E |
Net realized and unrealized gain (loss) | 2.05 | 1.25 | 5.65 | .31 | 2.23 |
Total from investment operations | 2.20 | 1.33 | 5.77 | .37 | 2.29 |
Distributions from net investment income | (.07) | (.06) | (.12) | (.02) | (.11) |
Distributions from net realized gain | (2.25) | (1.93) | (.47) | (.93) | (.13) |
Total distributions | (2.32) | (1.99) | (.59) | (.95) | (.24) |
Redemption fees added to paid in capital B,G | - | - | - | - | - |
Net asset value, end of period | $ 19.45 | $ 19.57 | $ 20.23 | $ 15.05 | $ 15.63 |
Total ReturnA | 12.17% | 7.08% | 39.54% | 3.59% | 17.02% |
Ratios to Average Net Assets C, F | | | | | |
Expenses before reductions | 1.15% | 1.09% | 1.07% | 1.14% | 1.10% |
Expenses net of fee waivers, if any | 1.12% | 1.07% | 1.07% | 1.14% | 1.10% |
Expenses net of all reductions | 1.12% | 1.07% | 1.06% | 1.14% | 1.10% |
Net investment income (loss) | .79%I | .40% | .70% | .39% | .39%E |
Supplemental Data | | | | | |
Net assets, end of period
(000 omitted) | $ 376,817 | $ 342,500 | $ 359,582 | $ 138,981 | $ 101,565 |
Portfolio turnover rateD | 34% | 26% H | 29% | 27% | 22% |
A Total returns would have been lower if certain expenses had not been reduced during the applicable periods shown.
B Calculated based on average shares outstanding during the period.
C Fees and expenses of any underlying Fidelity Central Funds are not included in the Fund's expense ratio. The Fund indirectly bears its proportionate share of the expenses of any underlying Fidelity Central Funds.
D Amount does not include the portfolio activity of any underlying Fidelity Central Funds.
E Investment income per share reflects a large, non-recurring dividend which amounted to $.06 per share. Excluding this non-recurring dividend, the ratio of net investment income (loss) to average net assets would have been .01%.
F Expense ratios reflect operating expenses of the class. Expenses before reductions do not reflect amounts reimbursed by the investment adviser or reductions from brokerage service arrangements or reductions from other expense offset arrangements and do not represent the amount paid by the class during periods when reimbursements or reductions occur. Expenses net of fee waivers reflect expenses after reimbursement by the investment adviser but prior to reductions from brokerage service arrangements or other expense offset arrangements. Expenses net of all reductions represent the net expenses paid by the class.
G Amount represents less than $.01 per share.
H Portfolio turnover rate excludes securities received or delivered in-kind.
I Investment income per share reflects a large, non-recurring dividend which amounted to $.05 per share. Excluding this non-recurring dividend, the ratio of net investment income (loss) to average net assets would have been .53%.
See accompanying notes which are an integral part of the financial statements.
Annual Report
For the period ended July 31, 2015
1. Organization.
Fidelity® Small Cap Value Fund (the Fund) is a fund of Fidelity Securities Fund (the Trust) and is authorized to issue an unlimited number of shares. The Trust is registered under the Investment Company Act of 1940, as amended (the 1940 Act), as an open-end management investment company organized as a Massachusetts business trust. The Fund offers Class A, Class T, Class C, Small Cap Value and Class I (formerly Institutional Class) shares, each of which, along with Class B shares, has equal rights as to assets and voting privileges. Class B shares are closed to new accounts and additional purchases, except for exchanges and reinvestments. The Fund's other share classes are also closed to new accounts with certain exceptions. The Fund offered Class F shares during the period June 26, 2009 through November 19, 2013 and all outstanding shares were redeemed by November 19, 2013. Each class has exclusive voting rights with respect to matters that affect that class. Class B shares will automatically convert to Class A shares after a holding period of seven years from the initial date of purchase.
2. Investments in Fidelity Central Funds.
The Fund invests in Fidelity Central Funds, which are open-end investment companies generally available only to other investment companies and accounts managed by the investment adviser and its affiliates. The Fund's Schedule of Investments lists each of the Fidelity Central Funds held as of period end, if any, as an investment of the Fund, but does not include the underlying holdings of each Fidelity Central Fund. As an Investing Fund, the Fund indirectly bears its proportionate share of the expenses of the underlying Fidelity Central Funds.
The Money Market Central Funds seek preservation of capital and current income and are managed by Fidelity Investments Money Management, Inc. (FIMM), an affiliate of the investment adviser. Annualized expenses of the Money Market Central Funds as of their most recent shareholder report date are less than .01%.
A complete unaudited list of holdings for each Fidelity Central Fund is available upon request or at the Securities and Exchange Commission (the SEC) website at www.sec.gov. In addition, the financial statements of the Fidelity Central Funds, which are not covered by the Fund's Report of Independent Registered Public Accounting Firm, are available on the SEC website or upon request.
Annual Report
3. Significant Accounting Policies.
The financial statements have been prepared in conformity with accounting principles generally accepted in the United States of America (GAAP), which require management to make certain estimates and assumptions at the date of the financial statements. Actual results could differ from those estimates. Subsequent events, if any, through the date that the financial statements were issued have been evaluated in the preparation of the financial statements. The following summarizes the significant accounting policies of the Fund:
Investment Valuation. Investments are valued as of 4:00 p.m. Eastern time on the last calendar day of the period. The Board of Trustees (the Board) has delegated the day to day responsibility for the valuation of the Fund's investments to the Fidelity Management & Research Company (FMR) Fair Value Committee (the Committee). In accordance with valuation policies and procedures approved by the Board, the Fund attempts to obtain prices from one or more third party pricing vendors or brokers to value its investments. When current market prices, quotations or currency exchange rates are not readily available or reliable, investments will be fair valued in good faith by the Committee, in accordance with procedures adopted by the Board. Factors used in determining fair value vary by investment type and may include market or investment specific events. The frequency with which these procedures are used cannot be predicted and they may be utilized to a significant extent. The Committee oversees the Fund's valuation policies and procedures and reports to the Board on the Committee's activities and fair value determinations. The Board monitors the appropriateness of the procedures used in valuing the Fund's investments and ratifies the fair value determinations of the Committee.
The Fund categorizes the inputs to valuation techniques used to value its investments into a disclosure hierarchy consisting of three levels as shown below:
Level 1 - quoted prices in active markets for identical investments
Level 2 - other significant observable inputs (including quoted prices for similar investments, interest rates, prepayment speeds, etc.)
Level 3 - unobservable inputs (including the Fund's own assumptions based on the best information available)
Annual Report
Notes to Financial Statements - continued
3. Significant Accounting Policies - continued
Investment Valuation - continued
Valuation techniques used to value the Fund's investments by major category are as follows:
Equity securities, including restricted securities, for which market quotations are readily available, are valued at the last reported sale price or official closing price as reported by a third party pricing vendor on the primary market or exchange on which they are traded and are categorized as Level 1 in the hierarchy. In the event there were no sales during the day or closing prices are not available, securities are valued at the last quoted bid price or may be valued using the last available price and are generally categorized as Level 2 in the hierarchy. For foreign equity securities, when market or security specific events arise, comparisons to the valuation of American Depositary Receipts (ADRs), futures contracts, Exchange-Traded Funds (ETFs) and certain indexes as well as quoted prices for similar securities may be used and would be categorized as Level 2 in the hierarchy. Utilizing these techniques may result in transfers between Level 1 and Level 2. For equity securities, including restricted securities, where observable inputs are limited, assumptions about market activity and risk are used and these securities may be categorized as Level 3 in the hierarchy.
Investments in open-end mutual funds, including the Fidelity Central Funds, are valued at their closing net asset value (NAV) each business day and are categorized as Level 1 in the hierarchy.
Changes in valuation techniques may result in transfers in or out of an assigned level within the disclosure hierarchy.
Foreign Currency. The Fund may use foreign currency contracts to facilitate transactions in foreign-denominated securities. Gains and losses from these transactions may arise from changes in the value of the foreign currency or if the counterparties do not perform under the contracts' terms.
Foreign-denominated assets, including investment securities, and liabilities are translated into U.S. dollars at the exchange rates at period end. Purchases and sales of investment securities, income and dividends received and expenses denominated in foreign currencies are translated into U.S. dollars at the exchange rate in effect on the transaction date.
The effects of exchange rate fluctuations on investments are included with the net realized and unrealized gain (loss) on investment securities. Other foreign currency transactions resulting in realized and unrealized gain (loss) are disclosed separately.
Annual Report
3. Significant Accounting Policies - continued
Investment Transactions and Income. For financial reporting purposes, the Fund's investment holdings and NAV include trades executed through the end of the last business day of the period. The NAV per share for processing shareholder transactions is calculated as of the close of business of the New York Stock Exchange (NYSE), normally 4:00 p.m. Eastern time and includes trades executed through the end of the prior business day. Gains and losses on securities sold are determined on the basis of identified cost and may include proceeds received from litigation. Dividend income is recorded on the ex-dividend date, except for certain dividends from foreign securities where the ex-dividend date may have passed, which are recorded as soon as the Fund is informed of the ex-dividend date. Non-cash dividends included in dividend income, if any, are recorded at the fair market value of the securities received. Income and capital gain distributions from Fidelity Central Funds, if any, are recorded on the ex-dividend date. Distributions received on securities that represent a return of capital or capital gain are recorded as a reduction of cost of investments and/or as a realized gain. Subsequent to ex-dividend date the Fund determines the components of these distributions, based upon receipt of tax filings or other correspondence relating to the underlying investment. Large, non-recurring dividends recognized by the Fund are presented separately on the Statement of Operations as "Special Dividends" and the impact of these dividends is presented in the Financial Highlights. Interest income is accrued as earned and includes coupon interest and amortization of premium and accretion of discount on debt securities as applicable. Investment income is recorded net of foreign taxes withheld where recovery of such taxes is uncertain.
Class Allocations and Expenses. Investment income, realized and unrealized capital gains and losses, common expenses of the Fund, and certain fund-level expense reductions, if any, are allocated daily on a pro-rata basis to each class based on the relative net assets of each class to the total net assets of the Fund. Each class differs with respect to transfer agent and distribution and service plan fees incurred. Certain expense reductions may also differ by class. For the reporting period, the allocated portion of income and expenses to each class as a percent of its average net assets may vary due to the timing of recording these transactions in relation to fluctuating net assets of the classes. Expenses directly attributable to a fund are charged to that fund. Expenses attributable to more than one fund are allocated among the respective funds on the basis of relative net assets or other appropriate methods. Expense estimates are accrued in the period to which they relate and adjustments are made when actual amounts are known.
Income Tax Information and Distributions to Shareholders. Each year, the Fund intends to qualify as a regulated investment company under Subchapter M of the Internal Revenue Code, including distributing substantially all of its taxable income and realized gains. As a result, no provision for U.S. Federal income taxes is required. As of July 31, 2015, the Fund did not have any unrecognized tax benefits in the financial
Annual Report
Notes to Financial Statements - continued
3. Significant Accounting Policies - continued
Income Tax Information and Distributions to Shareholders - continued
statements; nor is the Fund aware of any tax positions for which it is reasonably possible that the total amounts of unrecognized tax benefits will significantly change in the next twelve months. The Fund files a U.S. federal tax return, in addition to state and local tax returns as required. The Fund's federal income tax returns are subject to examination by the Internal Revenue Service (IRS) for a period of three fiscal years after they are filed. State and local tax returns may be subject to examination for an additional fiscal year depending on the jurisdiction. Foreign taxes are provided for based on the Fund's understanding of the tax rules and rates that exist in the foreign markets in which it invests.
Distributions are declared and recorded on the ex-dividend date. Income dividends and capital gain distributions are declared separately for each class. Income and capital gain distributions are determined in accordance with income tax regulations, which may differ from GAAP. In addition, the Fund claimed a portion of the payment made to redeeming shareholders as a distribution for income tax purposes.
Capital accounts within the financial statements are adjusted for permanent book-tax differences. These adjustments have no impact on net assets or the results of operations. Capital accounts are not adjusted for temporary book-tax differences which will reverse in a subsequent period.
Book-tax differences are primarily due to foreign currency transactions, passive foreign investment companies (PFIC) and losses deferred due to wash sales.
The federal tax cost of investment securities and unrealized appreciation (depreciation) as of period end were as follows:
Gross unrealized appreciation | $ 614,205,042 |
Gross unrealized depreciation | (96,595,356) |
Net unrealized appreciation (depreciation) on securities | $ 517,609,686 |
| |
Tax cost | $ 2,364,093,848 |
The tax-based components of distributable earnings as of period end were as follows:
Undistributed ordinary income | $ 15,098,490 |
Undistributed long-term capital gain | $ 223,448,456 |
Net unrealized appreciation (depreciation) on securities and other investments | $ 517,609,686 |
Annual Report
3. Significant Accounting Policies - continued
Income Tax Information and Distributions to Shareholders - continued
The tax character of distributions paid was as follows:
| July 31, 2015 | July 31, 2014 |
Ordinary Income | $ 12,432,052 | $ 10,662,065 |
Long-term Capital Gains | 319,195,013 | 362,625,476 |
Total | $ 331,627,065 | $ 373,287,541 |
Short-Term Trading (Redemption) Fees. Shares held by investors in the Fund less than 90 days may have been subject to a redemption fee equal to 1.50% of the NAV of shares redeemed. All redemption fees, which reduce the proceeds of the shareholder redemption, are retained by the Fund and accounted for as an addition to paid in capital.
4. Purchases and Sales of Investments.
Purchases and sales of securities, other than short-term securities, aggregated $962,585,438 and $1,295,483,282, respectively.
5. Fees and Other Transactions with Affiliates.
Management Fee. Fidelity Management & Research Company (the investment adviser) and its affiliates provide the Fund with investment management related services for which the Fund pays a monthly management fee. The management fee is the sum of an individual fund fee rate that is based on an annual rate of .45% of the Fund's average net assets and an annualized group fee rate that averaged .25% during the period. The group fee rate is based upon the average net assets of all the mutual funds advised by the investment adviser, including any mutual funds previously advised by the investment adviser that are currently advised by Fidelity SelectCo, LLC, an affiliate of the investment adviser. The group fee rate decreases as assets under management increase and increases as assets under management decrease. In addition, the management fee is subject to a performance adjustment (up to a maximum of ± .20% of the Fund's average net assets over a 36 month performance period). The upward or downward adjustment to the management fee is based on the relative investment performance of Small Cap Value as compared to its benchmark index, the Russell 2000 Value Index, over the same 36 month performance period. For the reporting period, the total annual management fee rate, including the performance adjustment, was .91% of the Fund's average net assets. The performance adjustment included in the management fee rate may be higher or lower than the maximum performance adjustment rate due to the difference between the average net assets for the reporting and performance periods.
During the period, the investment adviser waived a portion of its management fee as described in the Expense Reductions note.
Annual Report
Notes to Financial Statements - continued
5. Fees and Other Transactions with Affiliates - continued
Distribution and Service Plan Fees. In accordance with Rule 12b-1 of the 1940 Act, the Fund has adopted separate Distribution and Service Plans for each class of shares. Certain classes pay Fidelity Distributors Corporation (FDC), an affiliate of the investment adviser, separate Distribution and Service Fees, each of which is based on an annual percentage of each class' average net assets. In addition, FDC may pay financial intermediaries for selling shares of the Fund and providing shareholder support services. For the period, the Distribution and Service Fee rates, total fees and amounts retained by FDC were as follows:
| Distribution
Fee | Service
Fee | Total Fees | Retained
by FDC |
Class A | -% | .25% | $ 615,096 | $ 2,763 |
Class T | .25% | .25% | 487,452 | 894 |
Class B | .75% | .25% | 41,583 | 31,187 |
Class C | .75% | .25% | 674,689 | 13,458 |
| | | $ 1,818,820 | $ 48,302 |
Sales Load. FDC may receive a front-end sales charge of up to 5.75% for selling Class A shares and 3.50% for selling Class T shares, some of which is paid to financial intermediaries for selling shares of the Fund. Depending on the holding period, FDC may receive contingent deferred sales charges levied on Class A, Class T, Class B, and Class C redemptions. The deferred sales charges range from 5.00% to 1.00% for Class B shares, 1.00% for Class C shares, 1.00% for certain purchases of Class A shares and .25% for certain purchases of Class T shares.
For the period, sales charge amounts retained by FDC were as follows:
| Retained
by FDC |
Class A | $ 7,832 |
Class T | 3,175 |
Class B* | 2,039 |
Class C* | 847 |
| $ 13,893 |
* When Class B and Class C shares are initially sold, FDC pays commissions from its own resources to financial intermediaries through which the sales are made.
Annual Report
5. Fees and Other Transactions with Affiliates - continued
Transfer Agent Fees. Fidelity Investments Institutional Operations Company, Inc., (FIIOC), an affiliate of the investment adviser, is the transfer, dividend disbursing and shareholder servicing agent for each class of the Fund. FIIOC receives account fees and asset-based fees that vary according to the account size and type of account of the shareholders of the respective classes of the Fund. FIIOC pays for typesetting, printing and mailing of shareholder reports, except proxy statements.
For the period, transfer agent fees for each class were as follows:
| Amount | % of
Class-Level Average
Net Assets |
Class A | $ 534,282 | .22 |
Class T | 207,942 | .21 |
Class B | 12,447 | .30 |
Class C | 157,218 | .23 |
Small Cap Value | 4,104,906 | .20 |
Class I | 719,181 | .20 |
| $ 5,735,976 | |
Accounting and Security Lending Fees. Fidelity Service Company, Inc. (FSC), an affiliate of the investment adviser, maintains the Fund's accounting records. The accounting fee is based on the level of average net assets for each month. Under a separate contract, FSC administers the security lending program. The security lending fee is based on the number and duration of lending transactions.
Brokerage Commissions. The Fund placed a portion of its portfolio transactions with brokerage firms which are affiliates of the investment adviser. Brokerage commissions are included in net realized gain (loss) and change in net unrealized appreciation (depreciation) in the Statement of Operations. The commissions paid to these affiliated firms were $24,207 for the period.
Interfund Lending Program. Pursuant to an Exemptive Order issued by the SEC, the Fund, along with other registered investment companies having management contracts with FMR or other affiliated entities of FMR, may participate in an interfund lending program. This program provides an alternative credit facility allowing the funds to borrow from, or lend money to, other participating affiliated funds. At period end there were no interfund loans outstanding. The Fund's activity in this program during the period for which loans were outstanding was as follows:
Borrower or Lender | Average Loan
Balance | Weighted Average Interest Rate | Interest Expense |
Borrower | $ 14,895,000 | .33% | $ 136 |
Annual Report
Notes to Financial Statements - continued
6. Committed Line of Credit.
The Fund participates with other funds managed by the investment adviser or an affiliate in a $4.25 billion credit facility (the "line of credit") to be utilized for temporary or emergency purposes to fund shareholder redemptions or for other short-term liquidity purposes. The Fund has agreed to pay commitment fees on its pro-rata portion of the line of credit, which amounted to $4,108 and is reflected in Miscellaneous expenses on the Statement of Operations. During the period, the Fund did not borrow on this line of credit.
7. Security Lending.
The Fund lends portfolio securities through a lending agent from time to time in order to earn additional income. For equity securities, a lending agent is used and may loan securities to certain qualified borrowers, including Fidelity Capital Markets (FCM), a broker-dealer affiliated with the Fund. On the settlement date of the loan, the Fund receives collateral (in the form of U.S. Treasury obligations, letters of credit and/or cash) against the loaned securities and maintains collateral in an amount not less than 100% of the market value of the loaned securities during the period of the loan. The market value of the loaned securities is determined at the close of business of the Fund and any additional required collateral is delivered to the Fund on the next business day. If the borrower defaults on its obligation to return the securities loaned because of insolvency or other reasons, the Fund may apply collateral received from the borrower against the obligation. The Fund may experience delays and costs in recovering the securities loaned. Any cash collateral received is invested in the Fidelity Securities Lending Cash Central Fund. The value of loaned securities and cash collateral at period end are disclosed on the Fund's Statement of Assets and Liabilities. Security lending income represents the income earned on investing cash collateral, less rebates paid to borrowers and any lending agent fees associated with the loan, plus any premium payments received for lending certain types of securities. Security lending income is presented in the Statement of Operations as a component of income from Fidelity Central Funds, and includes $9,303 from securities loaned to FCM. Total security lending income during the period amounted to $2,526,958.
8. Expense Reductions.
The investment adviser contractually agreed to waive a portion of the Fund's management fee until May 31, 2015. During the period, this waiver reduced the Fund's management fee by $673,000. Effective June 1, 2015 the waiver was discontinued.
Annual Report
8. Expense Reductions - continued
Commissions paid to certain brokers with whom the investment adviser, or its affiliates, places trades on behalf of the Fund include an amount in addition to trade execution, which may be rebated back to the Fund to offset certain expenses. This amount totaled $131,172 for the period.
In addition, during the period the investment adviser reimbursed/waived a portion of fund-level operating expenses in the amount of $11,488 and a portion of class-level operating expenses as follows:
| Amount |
Class A | $ 5,981 |
Class T | 2,343 |
Class B | 9 |
Class C | 1,654 |
Small Cap Value | 55,260 |
Class I | 8,138 |
| $ 73,385 |
9. Distributions to Shareholders.
Distributions to shareholders of each class were as follows:
Years ended July 31, | 2015 | 2014 A |
From net investment income | | |
Class A | $ 207,059 | $ 171,608 |
Small Cap Value | 7,655,420 | 7,284,772 |
Class F | - | 2,011,606 |
Class I | 1,284,414 | 1,194,079 |
Total | $ 9,146,893 | $ 10,662,065 |
From net realized gain | | |
Class A | $ 29,002,450 | $ 26,941,211 |
Class T | 11,758,984 | 10,672,388 |
Class B | 573,044 | 695,128 |
Class C | 8,461,258 | 7,761,033 |
Small Cap Value | 233,242,234 | 236,012,007 |
Class F | - | 44,973,770 |
Class I | 39,442,202 | 35,569,940 |
Total | $ 322,480,172 | $ 362,625,477 |
A All Class F Shares were redeemed on November 19, 2013.
Annual Report
Notes to Financial Statements - continued
10. Share Transactions.
Share transactions for each class were as follows and may contain automatic conversions between classes or exchanges between funds:
| Shares | Dollars |
Years ended July 31, | 2015 | 2014 A | 2015 | 2014 A |
Class A | | | | |
Shares sold | 1,619,679 | 2,364,232 | $ 30,035,137 | $ 46,165,166 |
Reinvestment of distributions | 1,578,405 | 1,371,738 | 28,466,035 | 25,837,208 |
Shares redeemed | (4,261,712) | (4,138,116) | (79,564,907) | (80,966,690) |
Net increase (decrease) | (1,063,628) | (402,146) | $ (21,063,735) | $ (8,964,316) |
Class T | | | | |
Shares sold | 599,331 | 987,146 | $ 10,911,777 | $ 19,000,773 |
Reinvestment of distributions | 655,613 | 566,918 | 11,618,861 | 10,525,159 |
Shares redeemed | (1,691,524) | (1,685,516) | (30,859,052) | (32,399,109) |
Net increase (decrease) | (436,580) | (131,452) | $ (8,328,414) | $ (2,873,177) |
Class B | | | | |
Shares sold | 5,056 | 9,527 | $ 89,676 | $ 174,532 |
Reinvestment of distributions | 31,870 | 33,965 | 537,830 | 607,035 |
Shares redeemed | (106,178) | (149,029) | (1,834,363) | (2,755,578) |
Net increase (decrease) | (69,252) | (105,537) | $ (1,206,857) | $ (1,974,011) |
Class C | | | | |
Shares sold | 167,565 | 268,818 | $ 2,897,201 | $ 4,960,750 |
Reinvestment of distributions | 447,025 | 378,946 | 7,553,140 | 6,778,684 |
Shares redeemed | (847,704) | (758,615) | (14,671,382) | (14,057,302) |
Net increase (decrease) | (233,114) | (110,851) | $ (4,221,041) | $ (2,317,868) |
Small Cap Value | | | | |
Shares sold | 13,163,441 | 19,542,379 | $ 248,872,334 | $ 386,966,432 |
Reinvestment of distributions | 12,098,173 | 11,711,859 | 221,448,638 | 222,752,806 |
Shares redeemed | (25,848,809) | (58,131,122)B | (487,056,437) | (1,153,341,425)B |
Net increase (decrease) | (587,195) | (26,876,884) | $ (16,735,465) | $ (543,622,187) |
Class F | | | | |
Shares sold | - | 879,716 | $ - | $ 17,395,091 |
Reinvestment of distributions | - | 2,497,893 | - | 46,985,376 |
Shares redeemed | - | (39,476,567)B | - | (787,183,278)B |
Net increase (decrease) | - | (36,098,958) | $ - | $ (722,802,811) |
Annual Report
10. Share Transactions - continued
| Shares | Dollars |
Years ended July 31, | 2015 | 2014 A | 2015 | 2014 A |
Class I | | | | |
Shares sold | 4,194,067 | 4,292,555 | $ 79,803,869 | $ 84,987,281 |
Reinvestment of distributions | 1,996,970 | 1,739,424 | 36,554,847 | 33,193,654 |
Shares redeemed | (4,316,971) | (6,306,791) | (81,701,452) | (125,274,359) |
Net increase (decrease) | 1,874,066 | (274,812) | $ 34,657,264 | $ (7,093,424) |
A All Class F Shares were redeemed on November 19, 2013.
B Amount includes in-kind redemptions.
11. Other.
The Fund's organizational documents provide former and current trustees and officers with a limited indemnification against liabilities arising in connection with the performance of their duties to the Fund. In the normal course of business, the Fund may also enter into contracts that provide general indemnifications. The Fund's maximum exposure under these arrangements is unknown as this would be dependent on future claims that may be made against the Fund. The risk of material loss from such claims is considered remote.
Annual Report
To the Trustees of Fidelity Securities Fund and the Shareholders of Fidelity Small Cap Value Fund:
In our opinion, the accompanying statement of assets and liabilities, including the schedule of investments, and the related statements of operations and of changes in net assets and the financial highlights present fairly, in all material respects, the financial position of Fidelity Small Cap Value Fund (a fund of Fidelity Securities Fund) at July 31, 2015, the results of its operations for the year then ended, the changes in its net assets for each of the two years in the period then ended and the financial highlights for each of the five years in the period then ended, in conformity with accounting principles generally accepted in the United States of America. These financial statements and financial highlights (hereafter referred to as "financial statements") are the responsibility of the Fidelity Small Cap Value Fund's management. Our responsibility is to express an opinion on these financial statements based on our audits. We conducted our audits of these financial statements in accordance with the standards of the Public Company Accounting Oversight Board (United States). Those standards require that we plan and perform the audit to obtain reasonable assurance about whether the financial statements are free of material misstatement. An audit includes examining, on a test basis, evidence supporting the amounts and disclosures in the financial statements, assessing the accounting principles used and significant estimates made by management, and evaluating the overall financial statement presentation. We believe that our audits, which included confirmation of securities at July 31, 2015 by correspondence with the custodian and brokers, provide a reasonable basis for our opinion.
PricewaterhouseCoopers LLP
Boston, Massachusetts
September 21, 2015
Annual Report
The Trustees, Member of the Advisory Board, and officers of the trust and fund, as applicable, are listed below. The Board of Trustees governs the fund and is responsible for protecting the interests of shareholders. The Trustees are experienced executives who meet periodically throughout the year to oversee the fund's activities, review contractual arrangements with companies that provide services to the fund, oversee management of the risks associated with such activities and contractual arrangements, and review the fund's performance. Each of the Trustees oversees 170 funds.
The Trustees hold office without limit in time except that (a) any Trustee may resign; (b) any Trustee may be removed by written instrument, signed by at least two-thirds of the number of Trustees prior to such removal; (c) any Trustee who requests to be retired or who has become incapacitated by illness or injury may be retired by written instrument signed by a majority of the other Trustees; and (d) any Trustee may be removed at any special meeting of shareholders by a two-thirds vote of the outstanding voting securities of the trust. Each Trustee who is not an interested person (as defined in the 1940 Act) of the trust and the fund (Independent Trustee), shall retire not later than the last day of the calendar year in which his or her 75th birthday occurs. The Independent Trustees may waive this mandatory retirement age policy with respect to individual Trustees. The officers and Advisory Board Member hold office without limit in time, except that any officer and Advisory Board Member may resign or may be removed by a vote of a majority of the Trustees at any regular meeting or any special meeting of the Trustees. Except as indicated, each individual has held the office shown or other offices in the same company for the past five years.
Experience, Skills, Attributes, and Qualifications of the Fund's Trustees. The Governance and Nominating Committee has adopted a statement of policy that describes the experience, qualifications, attributes, and skills that are necessary and desirable for potential Independent Trustee candidates (Statement of Policy). The Board believes that each Trustee satisfied at the time he or she was initially elected or appointed a Trustee, and continues to satisfy, the standards contemplated by the Statement of Policy. The Governance and Nominating Committee also engages professional search firms to help identify potential Independent Trustee candidates who have the experience, qualifications, attributes, and skills consistent with the Statement of Policy. From time to time, additional criteria based on the composition and skills of the current Independent Trustees, as well as experience or skills that may be appropriate in light of future changes to board composition, business conditions, and regulatory or other developments, have also been considered by the professional search firms and the Governance and Nominating Committee. In addition, the Board takes into account the Trustees' commitment and participation in Board and committee meetings, as well as their leadership of standing and ad hoc committees throughout their tenure.
In determining that a particular Trustee was and continues to be qualified to serve as a Trustee, the Board has considered a variety of criteria, none of which, in isolation, was controlling. The Board believes that, collectively, the Trustees have balanced and diverse experience, qualifications, attributes, and skills, which allow the Board to operate effectively in governing the fund and protecting the interests of shareholders. Information about the specific experience, skills, attributes, and qualifications of each Trustee, which in each case led to the Board's conclusion that the Trustee should serve (or continue to serve) as a trustee of the fund, is provided below.
Annual Report
Trustees and Officers - continued
Board Structure and Oversight Function. James C. Curvey is an interested person (as defined in the 1940 Act) and currently serves as Chairman. The Trustees have determined that an interested Chairman is appropriate and benefits shareholders because an interested Chairman has a personal and professional stake in the quality and continuity of services provided to the fund. Independent Trustees exercise their informed business judgment to appoint an individual of their choosing to serve as Chairman, regardless of whether the Trustee happens to be independent or a member of management. The Independent Trustees have determined that they can act independently and effectively without having an Independent Trustee serve as Chairman and that a key structural component for assuring that they are in a position to do so is for the Independent Trustees to constitute a substantial majority for the Board. The Independent Trustees also regularly meet in executive session. Ned C. Lautenbach serves as Chairman of the Independent Trustees and as such (i) acts as a liaison between the Independent Trustees and management with respect to matters important to the Independent Trustees and (ii) with management prepares agendas for Board meetings.
Fidelity funds are overseen by different Boards of Trustees. The funds' Board oversees Fidelity's high income and certain equity funds and other Boards oversee Fidelity's investment-grade bond, money market, asset allocation, and sector funds. The asset allocation funds may invest in Fidelity funds overseen by the funds' Board. The use of separate Boards, each with its own committee structure, allows the Trustees of each group of Fidelity funds to focus on the unique issues of the funds they oversee, including common research, investment, and operational issues. On occasion, the separate Boards establish joint committees to address issues of overlapping consequences for the Fidelity funds overseen by each Board.
The Trustees operate using a system of committees to facilitate the timely and efficient consideration of all matters of importance to the Trustees, the fund, and fund shareholders and to facilitate compliance with legal and regulatory requirements and oversight of the fund's activities and associated risks. The Board, acting through its committees, has charged FMR and its affiliates with (i) identifying events or circumstances the occurrence of which could have demonstrably adverse effects on the fund's business and/or reputation; (ii) implementing processes and controls to lessen the possibility that such events or circumstances occur or to mitigate the effects of such events or circumstances if they do occur; and (iii) creating and maintaining a system designed to evaluate continuously business and market conditions in order to facilitate the identification and implementation processes described in (i) and (ii) above. Because the day-to-day operations and activities of the fund are carried out by or through FMR, its affiliates and other service providers, the fund's exposure to risks is mitigated but not eliminated by the processes overseen by the Trustees. While each of the Board's committees has responsibility for overseeing different aspects of the fund's activities, oversight is exercised primarily through the Operations, Audit, and Compliance Committees. In addition, the Independent Trustees have worked with FMR to enhance the Board's oversight of investment and financial risks, legal and regulatory risks, technology risks, and operational risks, including the development of additional risk reporting to the Board. For example, a working group comprised of Independent Trustees and FMR has worked and continues to work to review the Fidelity fund's valuation-related activities, reporting and risk management. Appropriate personnel, including but not limited to the fund's Chief Compliance Officer (CCO), FMR's internal auditor, the independent accountants, the fund's Treasurer and portfolio management personnel, make periodic reports to the Board's committees, as appropriate, including an annual review of FMR's risk management program for the Fidelity funds. The responsibilities of each standing committee, including their oversight responsibilities, are described further under "Standing Committees of the Fund's Trustees."
Annual Report
The fund's Statement of Additional Information (SAI) includes more information about the Trustees. To request a free copy, call Fidelity at 1-877-208-0098.
Interested Trustees*:
Correspondence intended for each Trustee who is an interested person may be sent to Fidelity Investments, 245 Summer Street, Boston, Massachusetts 02210.
Name, Year of Birth; Principal Occupations and Other Relevant Experience+ |
James C. Curvey (1935) |
Year of Election or Appointment: 2007 Trustee Chairman of the Board of Trustees |
| Mr. Curvey also serves as Trustee of other Fidelity funds. Mr. Curvey is a Director of Fidelity Research & Analysis Co. (investment adviser firm, 2009-present), and Vice Chairman (2007-present) and Director of FMR LLC (diversified financial services company). In addition, Mr. Curvey serves as an Overseer for the Boston Symphony Orchestra and a member of the board of Artis-Naples, Naples, Florida, and as a Trustee for Brewster Academy, Wolfeboro, New Hampshire. Previously, Mr. Curvey served as a Director of Fidelity Investments Money Management, Inc. (investment adviser firm, 2009-2014), a Director of FMR (investment adviser firm, 2007-2014), and a Director of FMR Co., Inc. (investment adviser firm, 2007-2014). |
Charles S. Morrison (1960) |
Year of Election or Appointment: 2014 Trustee |
| Mr. Morrison also serves as Trustee of other funds. He serves as a Director of Fidelity Investments Money Management, Inc. (FIMM) (investment adviser firm, 2014-present), Director of Fidelity SelectCo, LLC (investment adviser firm, 2014-present), President, Asset Management (2014-present), and is an employee of Fidelity Investments. Previously, Mr. Morrison served as Vice President of Fidelity's Fixed Income and Asset Allocation Funds (2012-2014), President, Fixed Income (2011-2014), Vice President of Fidelity's Money Market Funds (2005-2009), President, Money Market Group Leader of FMR (investment adviser firm, 2009), and Senior Vice President, Money Market Group of FMR (2004-2009). Mr. Morrison also served as Vice President of Fidelity's Bond Funds (2002-2005), certain Balanced Funds (2002-2005), and certain Asset Allocation Funds (2002-2007), and as Senior Vice President (2002-2005) of Fidelity's Bond Division. |
* Trustees have been determined to be "Interested Trustees" by virtue of, among other things, their affiliation with the trust or various entities under common control with FMR.
+ The information above includes each Trustee's principal occupation during the last five years and other information relating to the experience, attributes, and skills relevant to each Trustee's qualifications to serve as a Trustee, which led to the conclusion that each Trustee should serve as a Trustee for the fund.
Annual Report
Independent Trustees:
Correspondence intended for each Independent Trustee (that is, the Trustees other than the Interested Trustees) may be sent to Fidelity Investments, P.O. Box 55235, Boston, Massachusetts 02205-5235.
Name, Year of Birth; Principal Occupations and Other Relevant Experience+ |
Dennis J. Dirks (1948) |
Year of Election or Appointment: 2005 Trustee |
| Mr. Dirks also serves as Trustee of other Fidelity funds. Prior to his retirement in May 2003, Mr. Dirks was Chief Operating Officer and a member of the Board of The Depository Trust & Clearing Corporation (DTCC). He also served as President, Chief Operating Officer, and Board member of The Depository Trust Company (DTC) and President and Board member of the National Securities Clearing Corporation (NSCC). In addition, Mr. Dirks served as Chief Executive Officer and Board member of the Government Securities Clearing Corporation, Chief Executive Officer and Board member of the Mortgage-Backed Securities Clearing Corporation, as a Trustee and a member of the Finance Committee of Manhattan College (2005-2008), and as a Trustee and a member of the Finance Committee of AHRC of Nassau County (2006-2008). Mr. Dirks is a member of the Independent Directors Council (IDC) Governing Council (2010-present) and Board of Directors for The Brookville Center for Children's Services, Inc. (2009-present). |
Alan J. Lacy (1953) |
Year of Election or Appointment: 2008 Trustee |
| Mr. Lacy also serves as Trustee of other Fidelity funds. Mr. Lacy serves as a member of the Board of Directors of Dave & Buster's Entertainment, Inc. (restaurant and entertainment complexes, 2010-present) and Bristol-Myers Squibb Company (global pharmaceuticals, 2008-present). In addition, Mr. Lacy served as Senior Adviser (2007-2014) of Oak Hill Capital Partners, L.P. (private equity) and also served as Chief Executive Officer (2000-2005) and Vice Chairman (2005-2006) of Sears Holdings Corporation and Sears, Roebuck and Co. (retail). Mr. Lacy is a member of the Board of Trustees of The National Parks Conservation Association (2006-present). Previously, Mr. Lacy served as Chairman of the Board of Trustees of the National Parks Conservation Association (2008-2011) and as a member of the Board of Directors for The Western Union Company (global money transfer, 2006-2011), The Hillman Companies, Inc. (hardware wholesalers, 2010-2014), and Earth Fare, Inc. (retail grocery, 2010-2014). |
Ned C. Lautenbach (1944) |
Year of Election or Appointment: 2000 Trustee Chairman of the Independent Trustees |
| Mr. Lautenbach also serves as Trustee of other Fidelity funds. Mr. Lautenbach currently serves as the Lead Director of the Eaton Corporation Board of Directors (diversified industrial, 1997-present). Mr. Lautenbach is Chairman of the Board of Directors of Artis-Naples in Naples, Florida (2012-present), a member of the Council on Foreign Relations (1994-present), and a member of the Board of Governors, State University System of Florida (2013-present). Previously, Mr. Lautenbach was a Partner/Advisory Partner at Clayton, Dubilier & Rice, LLC (private equity investment, 1998-2010), as well as a Director of Sony Corporation (2006-2007). |
Joseph Mauriello (1944) |
Year of Election or Appointment: 2008 Trustee |
| Mr. Mauriello also serves as Trustee of other Fidelity funds. Prior to his retirement in January 2006, Mr. Mauriello served in numerous senior management positions including Deputy Chairman and Chief Operating Officer (2004-2005), and Vice Chairman of Financial Services (2002-2004) of KPMG LLP US (professional services, 1965-2005). Mr. Mauriello currently serves as a member of the Board of Directors of XL Group plc. (global insurance and re-insurance, 2006-present). Previously, Mr. Mauriello served as a Director of the Hamilton Funds of the Bank of New York (2006-2007) and of Arcadia Resources Inc. (health care services and products, 2007-2012). |
Robert W. Selander (1950) |
Year of Election or Appointment: 2011 Trustee |
| Mr. Selander also serves as Trustee of other Fidelity funds. Mr. Selander serves as a Director of The Western Union Company (global money transfer, 2014-present). Previously, Mr. Selander served as a Member of the Advisory Board of other Fidelity funds (2011), and Executive Vice Chairman (2010), Chief Executive Officer (2009-2010), and President and Chief Executive Officer (1997-2009) of Mastercard, Inc. |
Cornelia M. Small (1944) |
Year of Election or Appointment: 2005 Trustee |
| Ms. Small also serves as Trustee of other Fidelity funds. Ms. Small is a member of the Board of Directors (2009-present) and Chair of the Investment Committee (2010-present) of the Teagle Foundation. Ms. Small also serves on the Investment Committee of the Berkshire Taconic Community Foundation (2008-present). Previously, Ms. Small served as Chairperson (2002-2008) and a member of the Investment Committee and Chairperson (2008-2012) and a member of the Board of Trustees of Smith College. In addition, Ms. Small served as Chief Investment Officer, Director of Global Equity Investments, and a member of the Board of Directors of Scudder, Stevens & Clark and Scudder Kemper Investments. |
William S. Stavropoulos (1939) |
Year of Election or Appointment: 2002 Trustee Vice Chairman of the Independent Trustees |
| Mr. Stavropoulos also serves as Trustee of other Fidelity funds. Mr. Stavropoulos serves as President and Founder of the Michigan Baseball Foundation, the Great Lakes Loons (2007-present). Mr. Stavropoulos is Chairman Emeritus of the Board of Directors of The Dow Chemical Company, where he previously served in numerous senior management positions, including President, CEO (1995-2000; 2002-2004), Chairman of the Executive Committee (2000-2006), and as a member of the Board of Directors (1990-2006). Currently, Mr. Stavropoulos is Chairman of the Board of Directors of Univar Inc. (global distributor of commodity and specialty chemicals), a Director of Teradata Corporation (data warehousing and technology solutions), and Maersk Inc. (industrial conglomerate), and a member of the Advisory Board for Metalmark Capital LLC (private equity investment, 2005-present). Mr. Stavropoulos is an operating advisor to Clayton, Dubilier & Rice, LLC (private equity investment). In addition, Mr. Stavropoulos is a member of the University of Notre Dame Advisory Council for the College of Science, a Trustee of the Rollin L. Gerstacker Foundation, and a Director of the Naples Philharmonic Center for the Arts. Previously, Mr. Stavropoulos served as a Director of Chemical Financial Corporation (bank holding company, 1993-2012) and Tyco International, Ltd. (multinational manufacturing and services, 2007-2012). |
David M. Thomas (1949) |
Year of Election or Appointment: 2008 Trustee |
| Mr. Thomas also serves as Trustee of other Fidelity funds. Mr. Thomas serves as Non-Executive Chairman of the Board of Directors of Fortune Brands Home and Security (home and security products, 2011-present), as a member of the Board of Directors (2004-present) and Presiding Director (2013-present) of Interpublic Group of Companies, Inc. (marketing communication), and as a member of the Board of Trustees of the University of Florida (2013-present). Previously, Mr. Thomas served as Executive Chairman (2005-2006) and Chairman and Chief Executive Officer (2000-2005) of IMS Health, Inc. (pharmaceutical and healthcare information solutions), and a Director of Fortune Brands, Inc. (consumer products, 2000-2011). |
+ The information above includes each Trustee's principal occupation during the last five years and other information relating to the experience, attributes, and skills relevant to each Trustee's qualifications to serve as a Trustee, which led to the conclusion that each Trustee should serve as a Trustee for the fund.
Advisory Board Member and Officers:
Correspondence intended for each officer and Peter S. Lynch may be sent to Fidelity Investments, 245 Summer Street, Boston, Massachusetts 02210. Officers appear below in alphabetical order.
Name, Year of Birth; Principal Occupation |
Peter S. Lynch (1944) |
Year of Election or Appointment: 2003 Member of the Advisory Board |
| Mr. Lynch also serves as Member of the Advisory Board of other Fidelity funds. Mr. Lynch is Vice Chairman and a Director of FMR (investment adviser firm) and FMR Co., Inc. (investment adviser firm). In addition, Mr. Lynch serves as a Trustee of Boston College and as the Chairman of the Inner-City Scholarship Fund. Previously, Mr. Lynch served on the Special Olympics International Board of Directors (1997-2006). |
Elizabeth Paige Baumann (1968) |
Year of Election or Appointment: 2012 Anti-Money Laundering (AML) Officer |
| Ms. Baumann also serves as AML Officer of other funds. She is Chief AML Officer of FMR LLC (diversified financial services company, 2012-present) and is an employee of Fidelity Investments. Previously, Ms. Baumann served as Vice President and Deputy Anti-Money Laundering Officer (2007-2012). |
Marc Bryant (1966) |
Year of Election or Appointment: 2015 Secretary and Chief Legal Officer (CLO) |
<R> | Mr. Bryant also serves as Secretary and Chief Legal Officer (CLO) of other funds. He is Senior Vice President and Deputy General Counsel of FMR LLC (diversified financial services company). Previously, Mr. Bryant served as Secretary and Chief Legal Officer of Fidelity Rutland Square Trust II (2010-2014) and Assistant Secretary of Fidelity's Fixed Income and Asset Allocation Funds (2013?2015). Prior to joining Fidelity Investments, Mr. Bryant served as a Senior Vice President and the Head of Global Retail Legal for AllianceBernstein L.P. (2006-2010), and as the General Counsel for ProFund Advisors LLC (2001-2006).</R> |
William C. Coffey (1969) |
Year of Election or Appointment: 2009 Assistant Secretary |
| Mr. Coffey also serves as Assistant Secretary of other funds. He is Senior Vice President and Deputy General Counsel of FMR LLC (diversified financial services company, 2010-present), and is an employee of Fidelity Investments. Previously, Mr. Coffey served as Vice President and Associate General Counsel of FMR LLC (2005-2009). |
Jonathan Davis (1968) |
Year of Election or Appointment: 2010 Assistant Treasurer |
| Mr. Davis also serves as Assistant Treasurer of other funds. Mr. Davis is an employee of Fidelity Investments. Previously, Mr. Davis served as Vice President and Associate General Counsel of FMR LLC (diversified financial services company, 2003-2010). |
Adrien E. Deberghes (1967) |
Year of Election or Appointment: 2008 Deputy Treasurer |
| Mr. Deberghes also serves as an officer of other funds. He is an employee of Fidelity Investments (2008-present). Prior to joining Fidelity Investments, Mr. Deberghes was Senior Vice President of Mutual Fund Administration at State Street Corporation (2007-2008), Senior Director of Mutual Fund Administration at Investors Bank & Trust (2005-2007), and Director of Finance for Dunkin' Brands (2000-2005). |
Stephanie J. Dorsey (1969) |
Year of Election or Appointment: 2010 Assistant Treasurer |
| Ms. Dorsey also serves as an officer of other funds. She is an employee of Fidelity Investments (2008-present) and has served in other fund officer roles. Prior to joining Fidelity Investments, Ms. Dorsey served as Treasurer (2004-2008) of the JPMorgan Mutual Funds and Vice President (2004-2008) of JPMorgan Chase Bank. |
Howard J. Galligan III (1966) |
Year of Election or Appointment: 2014 Chief Financial Officer |
| Mr. Galligan also serves as Chief Financial Officer of other funds. Mr. Galligan serves as President of Fidelity Pricing and Cash Management Services (FPCMS) (2014-present) and as a Director of Strategic Advisers, Inc. (investment adviser firm, 2008-present). Previously, Mr. Galligan served as Chief Administrative Officer of Asset Management (2011-2014) and Chief Operating Officer and Senior Vice President of Investment Support for Strategic Advisers, Inc. (2003-2011). |
Scott C. Goebel (1968) |
Year of Election or Appointment: 2015 Vice President |
| Mr. Goebel serves as an officer of other funds. Mr. Goebel also serves as Secretary of Fidelity SelectCo, LLC (investment adviser firm, 2013-present), Fidelity Investments Money Management, Inc. (FIMM) (investment adviser firm, 2010-present) and Fidelity Research and Analysis Company (FRAC) (investment adviser firm, 2010-present); General Counsel, Secretary, and Senior Vice President of FMR (investment adviser firm, 2008-present) and FMR Co., Inc. (investment adviser firm, 2008-present); Chief Legal Officer of Fidelity Management & Research (Hong Kong) Limited (investment adviser firm, 2008-present); and Assistant Secretary of Fidelity Management & Research (Japan) Limited (investment adviser firm, 2008-present) and FMR Investment Management (U.K.) Limited (investment adviser firm, 2008-present). Previously, Mr. Goebel served as Secretary and CLO of certain Fidelity funds (2008-2015), Assistant Secretary of FIMM (2008-2010), FRAC (2008-2010), and certain funds (2007-2008); and as Vice President and Secretary of Fidelity Distributors Corporation (FDC) (2005-2007). Mr. Goebel has been employed by FMR LLC (diversified financial services company) or an affiliate since 2001. |
Thomas C. Hense (1964) |
Year of Election or Appointment: 2008/2010/2015 Vice President |
| Mr. Hense serves as Vice President of Fidelity Advisor Multi-Asset Income Fund (2015) and other funds (High Income (2008), Small Cap (2008), and Value (2010) funds). Previously, Mr. Hense served as a portfolio manager for Fidelity's Institutional Money Management Group (Pyramis) (2003-2008). |
Brian B. Hogan (1964) |
Year of Election or Appointment: 2009 Vice President |
| Mr. Hogan also serves as Trustee or Vice President of other funds. Mr. Hogan serves as a Director of Fidelity SelectCo, LLC (investment adviser firm, 2014-present) and President of the Equity Division of FMR (investment adviser firm, 2009-present). Previously, Mr. Hogan served as Senior Vice President, Equity Research of FMR (2006-2009) and as a portfolio manager. |
Chris Maher (1972) |
Year of Election or Appointment: 2013 Assistant Treasurer |
| Mr. Maher serves as Assistant Treasurer of other funds. Mr. Maher is Vice President of Valuation Oversight and is an employee of Fidelity Investments. Previously, Mr. Maher served as Vice President of Asset Management Compliance (2013), Vice President of the Program Management Group of FMR (investment adviser firm, 2010-2013), and Vice President of Valuation Oversight (2008-2010). |
Kenneth B. Robins (1969) |
Year of Election or Appointment: 2008 President and Treasurer |
| Mr. Robins also serves as an officer of other funds. Mr. Robins serves as Executive Vice President of Fidelity Investments Money Management, Inc. (FIMM) (investment adviser firm, 2013-present) and is an employee of Fidelity Investments (2004-present). Previously, Mr. Robins served in other fund officer roles. |
Stephen Sadoski (1971) |
Year of Election or Appointment: 2012 Deputy Treasurer |
| Mr. Sadoski also serves as Deputy Treasurer of other funds. He is an employee of Fidelity Investments (2012-present) and has served in another fund officer role. Prior to joining Fidelity Investments, Mr. Sadoski served as an assistant chief accountant in the Division of Investment Management of the Securities and Exchange Commission (SEC) (2009-2012) and as a senior manager at Deloitte & Touche LLP (1997-2009). |
Stacie M. Smith (1974) |
Year of Election or Appointment: 2013 Deputy Treasurer |
| Ms. Smith also serves as an officer of other funds. She is an employee of Fidelity Investments (2009-present) and has served in other fund officer roles. Prior to joining Fidelity Investments, Ms. Smith served as Senior Audit Manager of Ernst & Young LLP (1996-2009). |
Renee Stagnone (1975) |
Year of Election or Appointment: 2013 Deputy Treasurer |
| Ms. Stagnone also serves as Deputy Treasurer of other funds. Ms. Stagnone is an employee of Fidelity Investments. |
Linda J. Wondrack (1964) |
Year of Election or Appointment: 2014 Chief Compliance Officer |
| Ms. Wondrack also serves as Chief Compliance Officer of other funds. Ms. Wondrack is Executive Vice President and head of the Ethics Office and Asset Management Compliance for Fidelity Investments (2012- present). Ms. Wondrack also serves as Chief Compliance Officer of Fidelity SelectCo, LLC (investment adviser firm, 2014-present); Chief Compliance Officer of Impresa Management LLC (2013-present); and Chief Compliance Officer of FMR Co., Inc. (investment adviser firm), Fidelity Investments Money Management, Inc. (investment adviser firm), Fidelity Management & Research (Japan) Limited (investment adviser firm), FMR Investment Management (U.K.) Limited (investment adviser firm), Fidelity Management & Research (Hong Kong) (investment adviser firm), Fidelity Management & Research Company (investment adviser firm), Pyramis Global Advisors, LLC (investment adviser firm), and Strategic Advisers, Inc. (investment adviser firm), Ballyrock Investment Advisors LLC, and Northern Neck Investors LLC (2012-present). Previously, Ms. Wondrack served as Senior Vice President and Chief Compliance Officer for Columbia Management Investment Advisers, LLC (2005-2012); Chief Compliance Officer for certain funds within the Columbia Family of Funds (2007-2012); and Senior Vice President of Compliance Risk Management at Bank of America (2005-2010). |
Joseph F. Zambello (1957) |
Year of Election or Appointment: 2011 Deputy Treasurer |
| Mr. Zambello also serves as Deputy Treasurer of other funds. Mr. Zambello is an employee of Fidelity Investments. Previously, Mr. Zambello served as Vice President of the Program Management Group of FMR (investment adviser firm, 2009-2011) and Vice President of the Transfer Agent Oversight Group (2005-2009). |
Annual Report
The Board of Trustees of Fidelity Small Cap Value Fund voted to pay to shareholders of record at the opening of business, the following distributions per share derived from capital gains realized from sales of portfolio securities, and dividends derived from net investment income:
| Pay Date | Record Date | Dividends | Capital Gains |
Class I | 09/14/15 | 09/11/15 | $0.110 | $1.495 |
The fund hereby designates as a capital gain dividend with respect to the taxable year ended July 31, 2015, $274,706,718, or, if subsequently determined to be different, the net capital gain of such year.
Institutional Class designates 100% of the dividends distributed during the fiscal year as qualifying for the dividends-received deduction for corporate shareholders.
Institutional Class designates 100% of the dividends distributed during the fiscal year as amounts which can be taken into account as a dividend for the purposes of the maximum rate under section 1(h)(11) of the Internal Revenue Code.
The fund will notify shareholders in January 2016 of amounts for use in preparing 2015 income tax returns.
Annual Report
Fidelity Small Cap Value Fund
Each year, the Board of Trustees, including the Independent Trustees (together, the Board), votes on the renewal of the management contract with Fidelity Management & Research Company (FMR) and the sub-advisory agreements (together, the Advisory Contracts) for the fund. The Board, assisted by the advice of fund counsel and Independent Trustees' counsel, requests and considers a broad range of information relevant to the renewal of the Advisory Contracts throughout the year.
The Board meets regularly and, at each of its meetings, covers an extensive agenda of topics and materials and considers factors that are relevant to its annual consideration of the renewal of the fund's Advisory Contracts, including the services and support provided to the fund and its shareholders. The Board has established various standing committees (Committees), each composed of and chaired by Independent Trustees with varying backgrounds, to which the Board has assigned specific subject matter responsibilities in order to enhance effective decision-making by the Board. The Board, acting directly and through its Committees, requests and receives information concerning the annual consideration of the renewal of the fund's Advisory Contracts. The Board also meets as needed to consider matters specifically related to the Board's annual consideration of the renewal of the Advisory Contracts. Members of the Board may also meet with trustees of other Fidelity funds through ad hoc joint committees to discuss certain matters relevant to all of the Fidelity funds.
At its July 2015 meeting, the Board unanimously determined to renew the fund's Advisory Contracts. In reaching its determination, the Board considered all factors it believed relevant, including (i) the nature, extent, and quality of the services to be provided to the fund and its shareholders (including the investment performance of the fund); (ii) the competitiveness of the fund's management fee and total expense ratio relative to peer funds; (iii) the total costs of the services to be provided by and the profits to be realized by Fidelity from its relationship with the fund; and (iv) the extent to which (if any) economies of scale exist and would be realized as the fund grows, and whether any economies of scale are appropriately shared with fund shareholders.
In considering whether to renew the Advisory Contracts for the fund, the Board reached a determination, with the assistance of fund counsel and Independent Trustees' counsel and through the exercise of its business judgment, that the renewal of the Advisory Contracts was in the best interests of the fund and its shareholders and that the compensation payable under the Advisory Contracts was fair and reasonable. The Board's decision to renew the Advisory Contracts was not based on any single factor, but rather was based on a comprehensive consideration of all the information provided to the Board at its meetings throughout the year. The Board, in reaching its determination to renew the Advisory Contracts, was aware that shareholders of the fund have a broad range of investment choices available to them, including a wide choice among funds offered by Fidelity's competitors, and that the fund's shareholders, who have the opportunity to review and weigh the disclosure provided by the fund in its prospectus and other public disclosures, have chosen to invest in this fund, which is part of the Fidelity family of funds.
Annual Report
Board Approval of Investment Advisory Contracts and
Management Fees - continued
Nature, Extent, and Quality of Services Provided. The Board considered Fidelity's staffing as it relates to the fund, including the backgrounds of investment personnel of Fidelity, and also considered the fund's investment objective, strategies, and related investment philosophy. The Independent Trustees also had discussions with senior management of Fidelity's investment operations and investment groups. The Board considered the structure of the portfolio manager compensation program and whether this structure provides appropriate incentives to act in the best interests of the fund. Additionally, the Board considered the portfolio managers' investments, if any, in the funds that they manage.
Resources Dedicated to Investment Management and Support Services. The Board and the Fund Oversight and Research Committees reviewed the general qualifications and capabilities of Fidelity's investment staff, including its size, education, experience, and resources, as well as Fidelity's approach to recruiting, training, managing, and compensating investment personnel. The Board noted that Fidelity has continued to increase the resources devoted to non-U.S. offices, including expansion of Fidelity's global investment organization. The Board also noted that Fidelity's analysts have extensive resources, tools and capabilities that allow them to conduct sophisticated quantitative and fundamental analysis, as well as credit analysis of issuers, counterparties and guarantors. Further, the Board considered that Fidelity's investment professionals have sufficient access to global information and data so as to provide competitive investment results over time, and that those professionals also have access to sophisticated tools that permit them to assess portfolio construction and risk and performance attribution characteristics continuously, as well as to transmit new information and research conclusions rapidly around the world. Additionally, in its deliberations, the Board considered Fidelity's trading, risk management, and compliance capabilities and resources, which are integral parts of the investment management process.
Shareholder and Administrative Services. The Board considered (i) the nature, extent, quality, and cost of advisory, administrative, and shareholder services performed by FMR, the sub-advisers (together with FMR, the Investment Advisers), and their affiliates under the Advisory Contracts and under separate agreements covering transfer agency, pricing and bookkeeping, and securities lending services for the fund; (ii) the nature and extent of the supervision of third party service providers, principally custodians and subcustodians; and (iii) the resources devoted to, and the record of compliance with, the fund's compliance policies and procedures. The Board also reviewed the allocation of fund brokerage, including allocations to brokers affiliated with the Investment Advisers, the use of brokerage commissions to pay fund expenses, and the use of "soft" commission dollars to pay for research services.
Annual Report
The Board noted that the growth of fund assets over time across the complex allows Fidelity to reinvest in the development of services designed to enhance the value or convenience of the Fidelity funds as investment vehicles. These services include 24-hour access to account information and market information through telephone representatives and over the Internet, investor education materials and asset allocation tools, and the expanded availability of Fidelity Investor Centers.
In 2014, the Board formed an ad hoc Committee on Transfer Agency Fees to review the variety of transfer agency fee structures throughout the industry and Fidelity's competitive positioning with respect to industry participants.
Investment in a Large Fund Family. The Board considered the benefits to shareholders of investing in a Fidelity fund, including the benefits of investing in a fund that is part of a large family of funds offering a variety of investment disciplines and providing a large variety of mutual fund investor services. The Board noted that Fidelity had taken, or had made recommendations that resulted in the Fidelity funds taking, a number of actions over the previous year that benefited particular funds, including (i) continuing to dedicate additional resources to investment research and to the support of the senior management team that oversees asset management; (ii) continuing efforts to enhance Fidelity's global research capabilities; (iii) launching new funds and making other enhancements to meet client needs; (iv) reducing management fees and total expenses for certain index funds and diversified international funds; (v) continuing to launch dedicated lower cost underlying funds to meet portfolio construction needs related to expanding underlying fund options for Fidelity funds of funds, specifically for the Freedom Fund product lines; (vi) rationalizing product lines and gaining increased efficiencies through fund mergers; (vii) launching active fixed-income exchange-traded funds; (viii) continuing to develop, acquire and implement systems and technology to improve services to the funds and information security and to increase efficiency; (ix) implementing investment enhancements to further strengthen Fidelity's target date product line to increase investors' probability of success in achieving their goals; (x) modifying the eligibility criteria for certain share classes to accommodate roll-over assets from employer-sponsored retirement plans; (xi) launching a new Class W of the Freedom Index Funds to attract and retain Fidelity record-kept retirement plan assets; and (xii) implementing changes to Fidelity's money market product line in response to recent money market regulatory reforms.
Investment Performance. The Board considered whether the fund has operated in accordance with its investment objective, as well as its record of compliance with its investment restrictions and its performance history. The Board noted that there were portfolio management changes for the fund in January 2013 and August 2013.
Annual Report
Board Approval of Investment Advisory Contracts and
Management Fees - continued
The Board took into account discussions with representatives of the Investment Advisers about fund investment performance that occur at Board meetings throughout the year. In this regard the Board noted that as part of regularly scheduled fund reviews and other reports to the Board on fund performance, the Board considers annualized return information for the fund, for different time periods, measured against a securities market index ("benchmark index") and a peer group of funds with similar objectives ("peer group"), if any. In its evaluation of fund investment performance, the Board gave particular attention to information indicating changes in performance of certain Fidelity funds for specific time periods and discussed with the Investment Advisers the reasons for any overperformance or underperformance.
In addition to reviewing absolute and relative fund performance, the Independent Trustees periodically consider the appropriateness of fund performance metrics in evaluating the results achieved. In general, the Independent Trustees believe that fund performance should be evaluated based on net performance (after fees and expenses) of both the highest performing and lowest performing fund share classes, where applicable, compared to appropriate benchmark indices, over appropriate time periods that may include full market cycles, and compared to peer groups, as applicable, over the same periods, taking into account relevant factors including the following: general market conditions; issuer-specific information; and fund cash flows and other factors.
The Independent Trustees recognize that shareholders evaluate performance on a net basis over their own holding periods, for which one-, three-, and five-year periods are often used as a proxy. For this reason, the performance information reviewed by the Board also included net cumulative calendar year total return information for the fund and an appropriate benchmark index and peer group for the most recent one-, three-, and five-year periods, as shown below. Returns are shown compared to the 25th percentile (top of box, 75% beaten) and 75th percentile (bottom of box, 25% beaten) of the peer universe.
Annual Report
Fidelity Small Cap Value Fund

The Board also considered that the fund's management fee is subject to upward or downward adjustment depending upon whether, and to what extent, the fund's investment performance for the performance period exceeds, or is exceeded by, a securities index, thus leading to a performance adjustment for the same period. The Board noted that the performance adjustment provides FMR with a strong economic incentive to seek to achieve superior performance for the fund's shareholders and helps to more closely align the interests of FMR and the shareholders of the fund.
Based on its review, the Board concluded that the nature, extent, and quality of services provided to the fund under the Advisory Contracts should benefit the shareholders of the fund.
Competitiveness of Management Fee and Total Expense Ratio. The Board considered the fund's management fee and total expense ratio compared to "mapped groups" of competitive funds and classes created for the purpose of facilitating the Trustees' competitive analysis of management fees and total expenses. Fidelity creates "mapped groups" by combining similar Lipper investment objective categories that have comparable investment mandates. Combining Lipper investment objective categories aids the Board's management fee and total expense ratio comparisons by broadening the competitive group used for comparison.
Management Fee. The Board considered two proprietary management fee comparisons for the 12-month periods shown in basis points (BP) in the chart below. The group of Lipper funds used by the Board for management fee comparisons is referred to below as the "Total Mapped Group." The Total Mapped Group comparison focuses on a fund's standing in terms of gross management fees before expense reimbursements or caps, and without giving effect to the fund's performance adjustment, relative to the total universe of funds with comparable investment mandates, regardless of whether their management fee structures also are comparable. Funds with comparable investment mandates offer exposure to similar types of securities. Funds with comparable management fee structures have similar management fee contractual arrangements (e.g., flat rate charged for advisory services, all-inclusive fee rate, etc.). "TMG %" represents the percentage of funds in the Total Mapped Group that had management fees that were lower than the fund's. For example, a hypothetical TMG % of 20% would mean that 80% of the funds in the Total Mapped Group had higher, and 20% had lower, management fees than the fund. The fund's actual TMG %s and the number of funds in the Total Mapped Group are in the chart below. The "Asset-Size Peer Group" (ASPG) comparison focuses on a fund's standing relative to a subset of non-Fidelity funds within the Total Mapped Group that are similar in size and management fee structure without taking into account performance adjustments, if any. For example, if a fund is in the first quartile of the ASPG, the fund's management fee ranks in the least expensive or lowest 25% of funds in the ASPG. The ASPG represents at least 15% of the funds in the Total Mapped Group with comparable asset size and management fee structures, subject to a minimum of 50 funds (or all funds in the Total Mapped Group if fewer than 50). Additional information, such as the ASPG quartile in which the fund's management fee rate ranked and the impact of the fund's performance adjustment, is also included in the chart and considered by the Board.
Annual Report
Board Approval of Investment Advisory Contracts and
Management Fees - continued
Fidelity Small Cap Value Fund
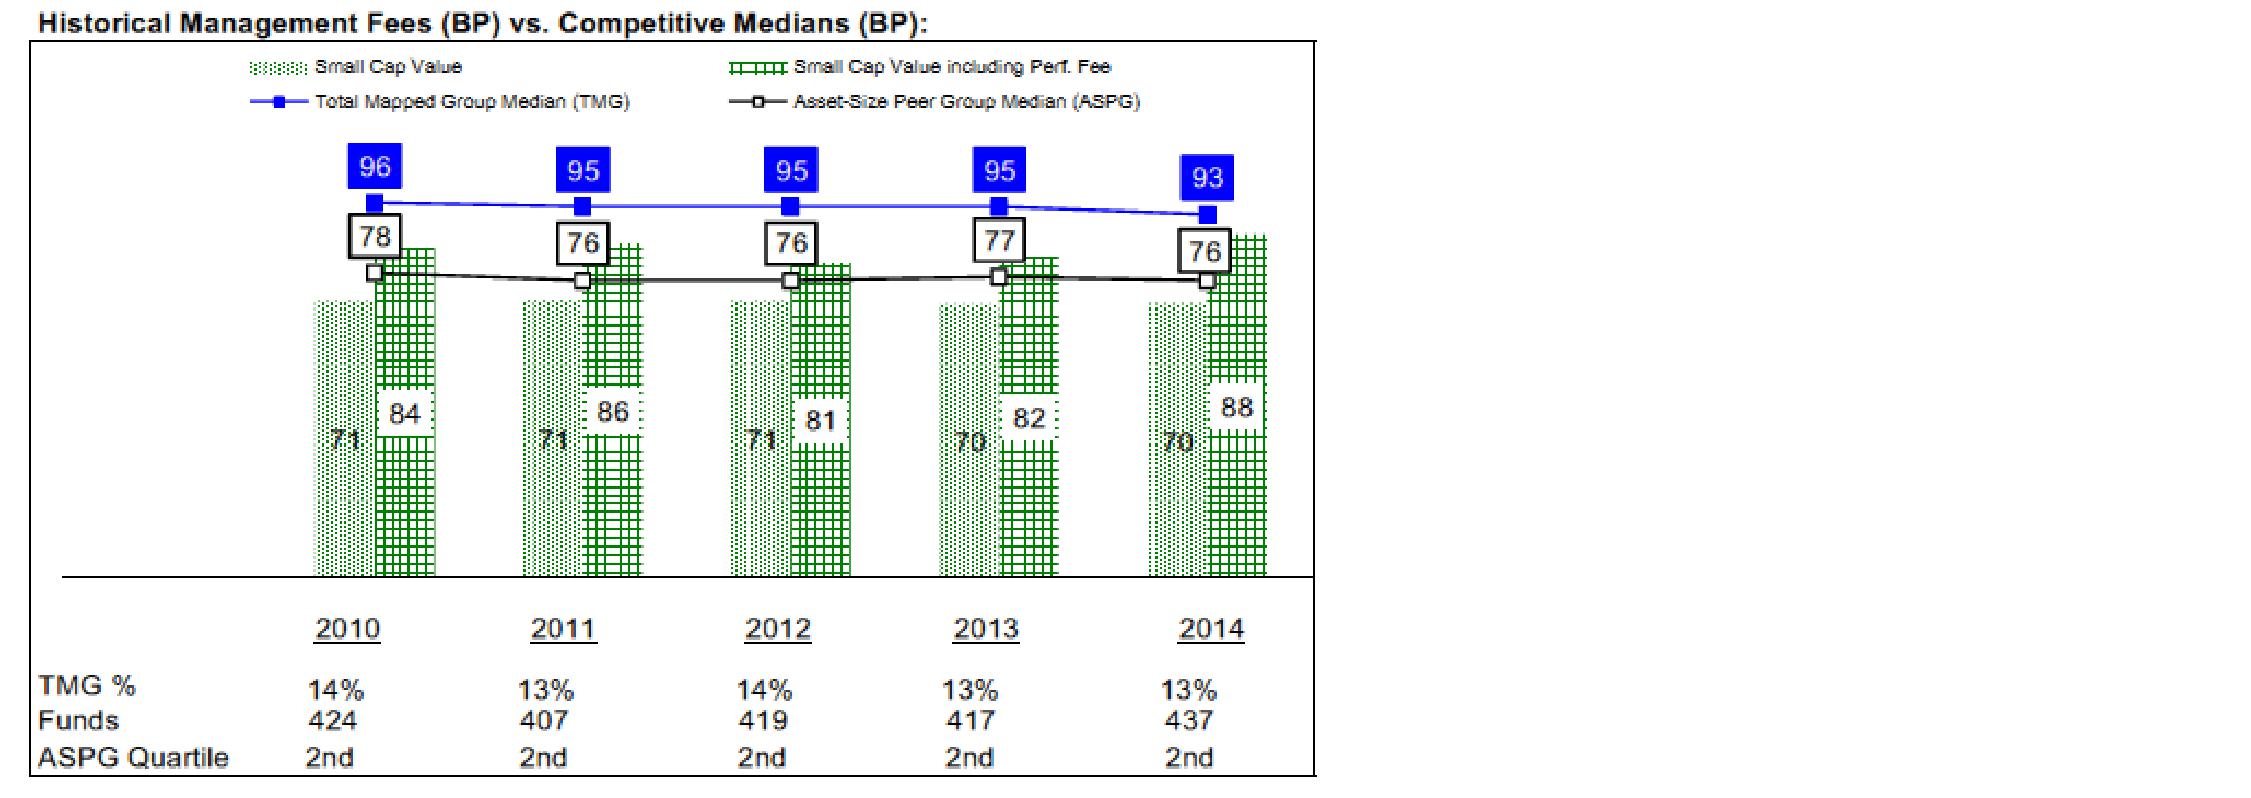
Annual Report
The Board noted that the fund's management fee rate ranked below the median of its Total Mapped Group and below the median of its ASPG for 2014. The Board also noted the effect of the fund's performance adjustment, if any, on the fund's management fee ranking.
The Board noted that, in 2014, the ad hoc Committee on Group Fee was formed by it and other Fidelity fund boards to conduct an in-depth review of the "group fee" component of the management fee of funds with such management fee structures. Committee focus included the mechanics of the group fee, the competitive landscape of group fee structures, Fidelity funds with no group fee component and investment products not included in group fee assets. The Board also considered that, for funds subject to the group fee, FMR agreed to voluntarily waive fees over a specified period of time in amounts designed to account for assets converted from certain funds to certain collective investment trusts.
The Board also noted that, in 2013, the ad hoc Committee on Management Fees was formed to conduct an in-depth review of the management fee rates of Fidelity's active equity mutual funds. The Committee focused on the following areas: (i) standard fee structures; (ii) research consumption and trading evolution; (iii) management fee competitiveness/profitability by category; and (iv) factors that drive institutional pricing.
Based on its review, the Board concluded that the fund's management fee is fair and reasonable in light of the services that the fund receives and the other factors considered.
Total Expense Ratio. In its review of each class's total expense ratio, the Board considered the fund's management fee as well as other fund or class expenses, as applicable, such as transfer agent fees, pricing and bookkeeping fees, fund-paid 12b-1 fees, and custodial, legal, and audit fees. The Board noted the impact of the fund's performance adjustment. The Board also noted that Fidelity may agree to waive fees and expenses from time to time, and the extent to which, if any, it has done so for the fund. As part of its review, the Board also considered the current and historical total expense ratios of each class of the fund compared to competitive fund median expenses. Each class of the fund is compared to those funds and classes in the Total Mapped Group (used by the Board for management fee comparisons) that have a similar sales load structure.
The Board noted that the total expense ratio of the retail class ranked below its competitive median for 2014 and the total expense ratio of each of Class A, Class T, Class B, Class C, and Class I ranked above its competitive median for 2014. The Board considered that, in general, various factors can affect total expense ratios. The Board noted that the total expense ratio of Class T was above the competitive median primarily because of higher 12b-1 fees on Class T as compared to most competitor funds. Class T has a higher 12b-1 fee, but a lower front-end sales charge, than traditionally priced front-end sales charge classes. The Board considered that Class T is primarily sold load-waived in the retirement plan market where its 0.50% 12b-1 fee is comparable to competing no-load, higher 12b-1 fee classes designed specifically for retirement plans. The Board noted that the fund offers multiple classes, each of which has a different sales load and 12b-1 fee structure, and that the multiple structures are intended to offer a range of pricing options for the intermediary market. The Board also noted that the total expense ratios of the classes vary primarily by the level of their 12b-1 fees, although differences in transfer agent fees may also cause expenses to vary from class to class.
Annual Report
Board Approval of Investment Advisory Contracts and
Management Fees - continued
Fees Charged to Other Fidelity Clients. The Board also considered Fidelity fee structures and other information with respect to clients of Fidelity, such as other funds advised or subadvised by Fidelity, pension plan clients, and other institutional clients with similar mandates. The Board noted the findings of the 2013 ad hoc joint committee (created with the board of other Fidelity funds), which reviewed and compared Fidelity's institutional investment advisory business with its business of providing services to the Fidelity funds, including the differences in services provided, fees charged, and costs incurred, as well as competition in their respective marketplaces.
Based on its review of total expense ratios and fees charged to other Fidelity clients, the Board concluded that, although in some cases above the median of the universe presented for comparison, the total expense ratio of each class of the fund was reasonable in light of the services that the fund and its shareholders receive and the other factors considered.
Costs of the Services and Profitability. The Board considered the revenues earned and the expenses incurred by Fidelity in conducting the business of developing, marketing, distributing, managing, administering and servicing the fund and servicing the fund's shareholders. The Board also considered the level of Fidelity's profits in respect of all the Fidelity funds.
On an annual basis, Fidelity presents to the Board information about the profitability of its relationship with the fund. Fidelity calculates profitability information for each fund, as well as aggregate profitability information for groups of Fidelity funds and all Fidelity funds, using a series of detailed revenue and cost allocation methodologies which originate with the books and records of Fidelity on which Fidelity's audited financial statements are based. The Audit Committee of the Board reviews any significant changes from the prior year's methodologies.
PricewaterhouseCoopers LLP (PwC), independent registered public accounting firm and auditor to Fidelity and certain Fidelity funds, has been engaged annually by the Board as part of the Board's assessment of Fidelity's profitability analysis. PwC's engagement includes the review and assessment of the methodologies used by Fidelity in determining the revenues and expenses attributable to Fidelity's mutual fund business, and completion of agreed-upon procedures in respect of the mathematical accuracy of fund profitability and its conformity to established allocation methodologies. After considering PwC's reports issued under the engagement and information provided by Fidelity, the Board concluded that while other allocation methods may also be reasonable, Fidelity's profitability methodologies are reasonable in all material respects.
Annual Report
The Board also reviewed Fidelity's non-fund businesses and fall-out benefits related to the mutual fund business as well as cases where Fidelity's affiliates may benefit from or be related to the fund's business.
The Board considered the costs of the services provided by and the profits realized by Fidelity in connection with the operation of the fund and was satisfied that the profitability was not excessive.
Economies of Scale. The Board considered whether there have been economies of scale in respect of the management of the Fidelity funds, whether the Fidelity funds (including the fund) have appropriately benefited from any such economies of scale, and whether there is potential for realization of any further economies of scale. The Board considered the extent to which the fund will benefit from economies of scale as assets grow through increased services to the fund, through waivers or reimbursements, or through fee or expense ratio reductions. The Board also noted that in 2013, it and the boards of other Fidelity funds created an ad hoc committee (the Economies of Scale Committee) to analyze whether Fidelity attains economies of scale in respect of the management and servicing of the Fidelity funds, whether the Fidelity funds have appropriately benefited from such economies of scale, and whether there is potential for realization of any further economies of scale.
The Board recognized that the fund's management contract incorporates a "group fee" structure, which provides for lower group fee rates as total group assets increase, and for higher group fee rates as total group assets decrease (with "group assets" defined to include fund assets under FMR's management plus sector fund assets previously under FMR's management and currently managed by Fidelity SelectCo, LLC). FMR calculates the group fee rates based on a tiered asset "breakpoint" schedule that varies based on asset class. The Board considered that the group fee is designed to deliver the benefits of economies of scale to fund shareholders when total Fidelity fund assets increase, even if assets of any particular fund are unchanged or have declined, because some portion of Fidelity's costs are attributable to services provided to all Fidelity funds, and all funds benefit if those costs can be allocated among more assets. The Board also considered that although the fund is partially closed to new investors, it continues to incur investment management expenses, and marketing and distribution expenses related to the retention of existing shareholders and assets. The Board further noted that the fund may continue to realize benefits from the group fee structure, even though assets may not be expected to grow significantly at the fund level. The Board concluded that, given the group fee structure, fund shareholders will benefit from lower management fees as group assets increase at the fund complex level, regardless of whether Fidelity achieves any such economies of scale.
Annual Report
Board Approval of Investment Advisory Contracts and
Management Fees - continued
The Board concluded, taking into account the analysis of the Economies of Scale Committee, that economies of scale, if any, are being appropriately shared between fund shareholders and Fidelity.
Additional Information Requested by the Board. In order to develop fully the factual basis for consideration of the Fidelity funds' Advisory Contracts, the Board requested and received additional information on certain topics, including: (i) fund performance trends and Fidelity's long-term strategies for certain funds; (ii) the various share classes employed by Fidelity and the attributes of each class, together with similar information on the distribution and servicing payments made by Fidelity or the funds to third-party participants in the distribution channels; (iii) fund profitability, and fund performance in relation to fund profitability; (iv) the methodology with respect to evaluating competitive fund data and peer group classifications and fee comparisons; (v) annual fund profitability margins, with particular focus on certain funds with negative margins; (vi) the realization of fall-out benefits in certain Fidelity business units; (vii) economies of scale and the way in which they are shared with fund shareholders; (viii) Fidelity's group fee structures, including the group fee schedule of breakpoints; (ix) the impact of cost containment measures on the funds; and (x) the transfer agent fee structure.
Based on its evaluation of all of the conclusions noted above, and after considering all factors it believed relevant, the Board concluded that the advisory fee structures are fair and reasonable, and that the fund's Advisory Contracts should be renewed.
Annual Report
Investment Adviser
Fidelity Management & Research Company
Boston, MA
Investment Sub-Advisers
FMR Co., Inc.
FMR Investment Management
(U.K.) Limited
Fidelity Management & Research
(Hong Kong) Limited
Fidelity Management & Research
(Japan) Limited
General Distributor
Fidelity Distributors Corporation
Smithfield, RI
Transfer and Service Agents
Fidelity Investments Institutional
Operations Company, Inc.
Boston, MA
Fidelity Service Company, Inc.
Boston, MA
Custodian
Northern Trust Company
Chicago, IL
(Fidelity Investment logo)(registered trademark)
ASCVI-UANN-0915
1.803743.110
Fidelity®
Leveraged Company Stock
Fund
Annual Report
July 31, 2015
(Fidelity Cover Art)
Contents
Performance | (Click Here) | How the fund has done over time. |
Management's Discussion of Fund Performance | (Click Here) | The Portfolio Manager's review of fund performance and strategy. |
Shareholder Expense Example | (Click Here) | An example of shareholder expenses. |
Investment Changes | (Click Here) | A summary of major shifts in the fund's investments over the last six months. |
Investments | (Click Here) | A complete list of the fund's investments with their market values. |
Financial Statements | (Click Here) | Statements of assets and liabilities, operations, and changes in net assets, as well as financial highlights. |
Notes | (Click Here) | Notes to the financial statements. |
Report of Independent Registered Public Accounting Firm | (Click Here) | |
Trustees and Officers | (Click Here) | |
Distributions | (Click Here) | |
Board Approval of Investment Advisory Contracts and Management Fees | (Click Here) | |
To view a fund's proxy voting guidelines and proxy voting record for the 12-month period ended June 30, visit http://www.fidelity.com/proxyvotingresults or visit the Securities and Exchange Commission's (SEC) web site at http://www.sec.gov. You may also call 1-800-544-8544 to request a free copy of the proxy voting guidelines.
Standard & Poor's, S&P and S&P 500 are registered service marks of The McGraw-Hill Companies, Inc. and have been licensed for use by Fidelity Distributors Corporation.
Other third-party marks appearing herein are the property of their respective owners.
All other marks appearing herein are registered or unregistered trademarks or service marks of FMR LLC or an affiliated company. © 2015 FMR LLC. All rights reserved.
Annual Report
This report and the financial statements contained herein are submitted for the general information of the shareholders of the fund. This report is not authorized for distribution to prospective investors in the fund unless preceded or accompanied by an effective prospectus.
A fund files its complete schedule of portfolio holdings with the SEC for the first and third quarters of each fiscal year on Form N-Q. Forms N-Q are available on the SEC's web site at http://www.sec.gov. A fund's Forms N-Q may be reviewed and copied at the SEC's Public Reference Room in Washington, DC. Information regarding the operation of the SEC's Public Reference Room may be obtained by calling 1-800-SEC-0330. For a complete list of a fund's portfolio holdings, view the most recent holdings listing, semiannual report, or annual report on Fidelity's web site at http://www.fidelity.com, http://www.advisor.fidelity.com, or http://www.401k.com, as applicable.
NOT FDIC INSURED • MAY LOSE VALUE • NO BANK GUARANTEE
Neither the fund nor Fidelity Distributors Corporation is a bank.
Annual Report
Average annual total return reflects the change in the value of an investment, assuming reinvestment of the class' distributions from dividend income and capital gains (the profits earned upon the sale of securities that have grown in value, if any) and assuming a constant rate of performance each year. The $10,000 table and the fund's returns do not reflect the deduction of taxes that a shareholder would pay on fund distributions or the redemption of fund shares. During periods of reimbursement by Fidelity, a fund's total return will be greater than it would be had the reimbursement not occurred. How a fund did yesterday is no guarantee of how it will do tomorrow.
Average Annual Total Returns
Periods ended July 31, 2015 | Past 1
year | Past 5
years | Past 10
years |
Fidelity® Leveraged Company Stock Fund | 3.12% | 15.60% | 8.33% |
$10,000 Over 10 Years
Let's say hypothetically that $10,000 was invested in Fidelity® Leveraged Company Stock Fund, a class of the fund, on July 31, 2005. The chart shows how the value of your investment would have changed, and also shows how the S&P 500® Index performed over the same period.
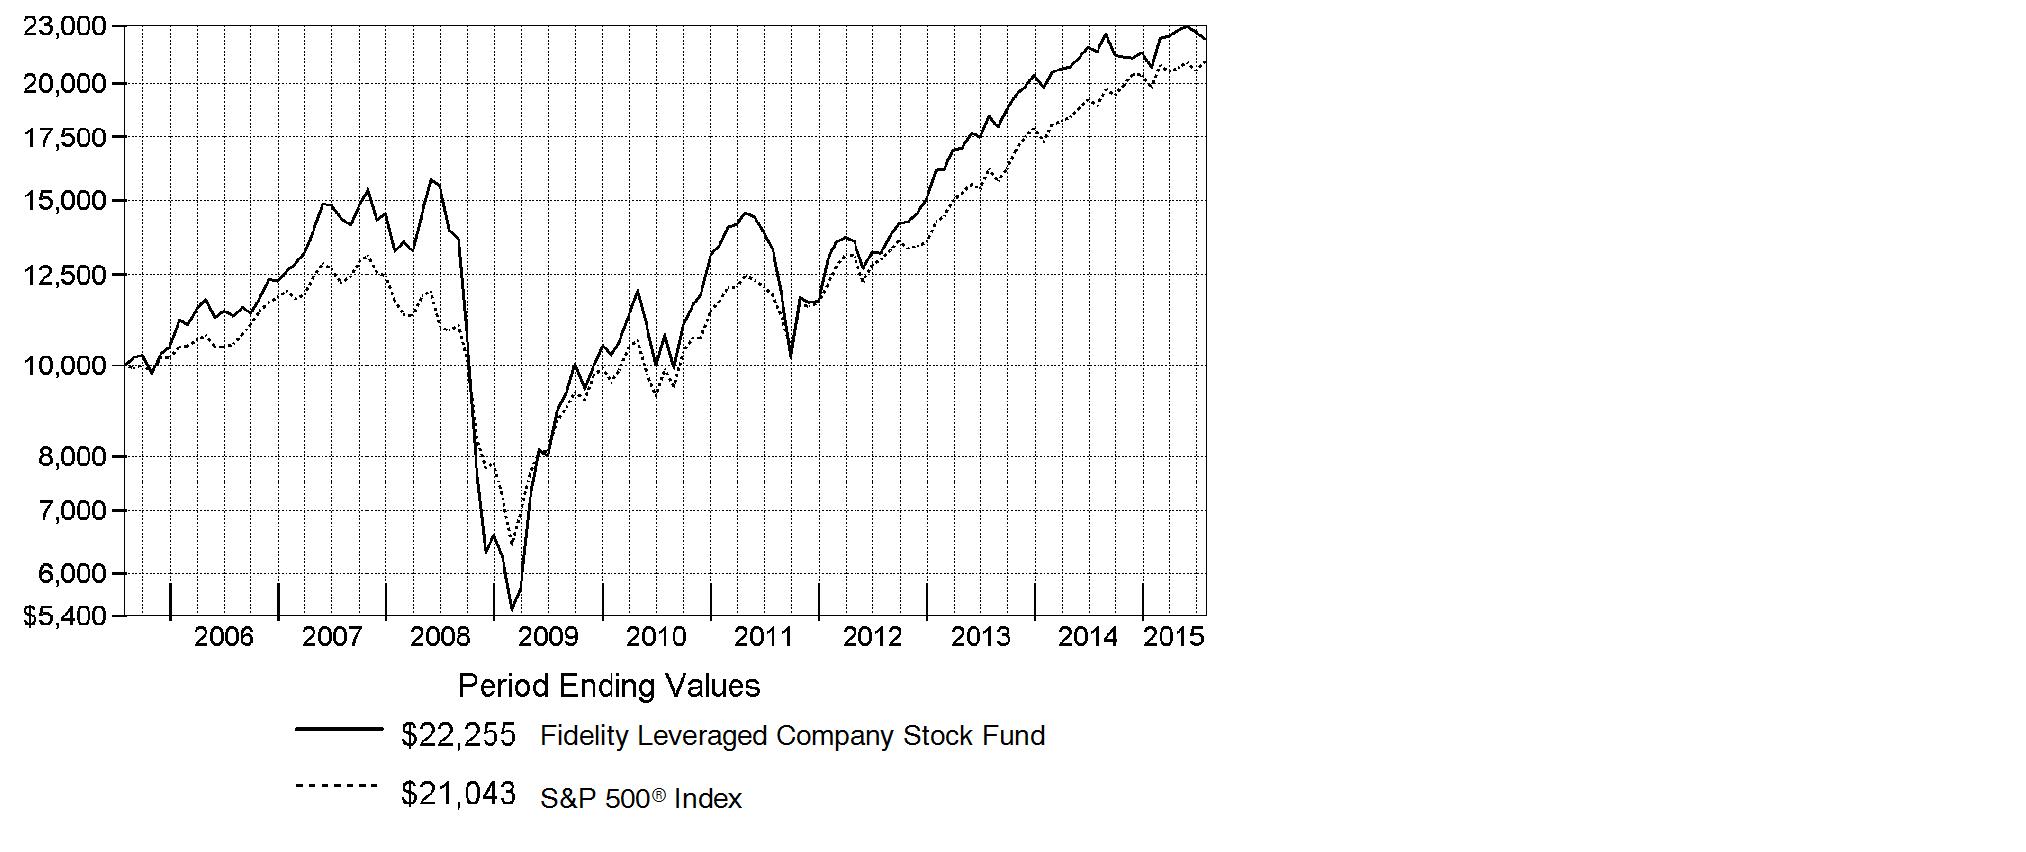
Annual Report
Market Recap: The U.S. equity market gained strongly for the 12 months ending July 31, 2015, as stocks recovered from volatility in late 2014 and early 2015, supported by a still-positive economic backdrop. The S&P 500® Index returned 11.21%, with growth stocks in the index far outpacing value-oriented names on prospects for continued U.S. economic growth. Consequently, the growth-oriented Nasdaq Composite Index® rose 18.71%, outpacing the broader S&P 500®, as well as the 12.03% advance of the smaller-cap Russell 2000® Index. Within the S&P 500®, seven of 10 sectors notched a gain, with significant performance variation. Health care (+27%) led the way, aided by merger activity. Consumer discretionary (+24%) benefited from spending linked to a seven-year low in unemployment. Strong first halves for the consumer staples sector and the real estate segment of financials yielded above-market returns (19% and 12%, respectively) for the full-year period. Conversely, energy (-26%) significantly lagged, due to a roughly 55% decline for U.S. crude-oil prices. Materials (-4%) also lost ground. At period end, investors remained focused on the slowing rate of U.S. earnings growth, the possible effect of a relatively stronger U.S. dollar on exports and inflation, and whether an economic slowdown in China would create ripples for the global economy.
Comments from Portfolio Manager Tom Soviero: For the year, the fund's share classes posted a modest return. (For specific class-level results, please see the Performance section of this report.) Leveraged stocks underperformed the S&P 500® Index as investors moved away from riskier asset classes. Accordingly, the fund significantly lagged the benchmark S&P 500® but handily bested the -1.83% return of the Credit Suisse Leveraged Equity Index. Security selection within energy, an overweighting in the weak-performing materials group and positioning in consumer staples were among the biggest detractors versus the S&P. The most notable individual disappointment was LyondellBasell Industries, a Netherlands-based multinational plastics, chemicals and refining company, a sizable overweighting and the fund's largest holding. The stock got hit hard when oil prices crashed this past year. In energy, an out-of-index stake in Continental Resources and an overweighting in Hess, two exploration & production companies, hurt. By contrast, a significant overweighting in the top-performing consumer discretionary sector helped relative performance, but was largely offset by disappointing security selection. Bright spots here, however, included an out-of-index stake in funeral-services provider Service Corporation International, which climbed amid better-than-expected financial results.
The views expressed above reflect those of the portfolio manager(s) only through the end of the period as stated on the cover of this report and do not necessarily represent the views of Fidelity or any other person in the Fidelity organization. Any such views are subject to change at any time based upon market or other conditions and Fidelity disclaims any responsibility to update such views. These views may not be relied on as investment advice and, because investment decisions for a Fidelity fund are based on numerous factors, may not be relied on as an indication of trading intent on behalf of any Fidelity fund.
Annual Report
Shareholder Expense Example
As a shareholder of the Fund, you incur two types of costs: (1) transaction costs, including redemption fees and (2) ongoing costs, including management fees and other Fund expenses. This Example is intended to help you understand your ongoing costs (in dollars) of investing in the Fund and to compare these costs with the ongoing costs of investing in other mutual funds.
The Example is based on an investment of $1,000 invested at the beginning of the period and held for the entire period (February 1, 2015 to July 31, 2015).
Actual Expenses
The first line of the accompanying table for each class of the Fund provides information about actual account values and actual expenses. You may use the information in this line, together with the amount you invested, to estimate the expenses that you paid over the period. Simply divide your account value by $1,000.00 (for example, an $8,600 account value divided by $1,000.00 = 8.6), then multiply the result by the number in the first line for a class of the Fund under the heading entitled "Expenses Paid During Period" to estimate the expenses you paid on your account during this period. A small balance maintenance fee of $12.00 that is charged once a year may apply for certain accounts with a value of less than $2,000. This fee is not included in the table below. If it was, the estimate of expenses you paid during the period would be higher, and your ending account value lower, by this amount. In addition, the Fund, as a shareholder in the underlying Fidelity Central Funds, will indirectly bear its pro-rata share of the fees and expenses incurred by the underlying Fidelity Central Funds. These fees and expenses are not included in the Fund's annualized expense ratio used to calculate the expense estimate in the table below.
Hypothetical Example for Comparison Purposes
The second line of the accompanying table for each class of the Fund provides information about hypothetical account values and hypothetical expenses based on a Class' actual expense ratio and an assumed rate of return of 5% per year before expenses, which is not the Class' actual return. The hypothetical account values and expenses may not be used to estimate the actual ending account balance or expenses you paid for the period. You may use this information to compare the ongoing costs of investing in the Fund and other funds. To do so, compare this 5% hypothetical example with the 5% hypothetical examples that appear in the shareholder reports of the other funds. A small balance maintenance fee of $12.00 that is charged once a year may apply for certain accounts with a value of less than $2,000. This fee is not included in the table below. If it was, the estimate of expenses you paid during the period would be higher, and your ending account value lower, by this amount. In addition, the Fund, as a shareholder in the underlying Fidelity Central Funds, will indirectly bear its pro-rata share of the fees and expenses incurred by the underlying Fidelity Central Funds. These fees and expenses are not included in the Fund's annualized expense ratio used to calculate the expense estimate in the table below.
Please note that the expenses shown in the table are meant to highlight your ongoing costs only and do not reflect any transaction costs. Therefore, the second line of the table is useful in comparing ongoing costs only, and will not help you determine the relative total costs of owning different funds. In addition, if these transactional costs were included, your costs would have been higher.
Annual Report
Shareholder Expense Example - continued
| Annualized
Expense RatioB | Beginning
Account Value
February 1, 2015 | Ending
Account Value
July 31, 2015 | Expenses Paid
During Period*
February 1, 2015
to July 31, 2015 |
Leveraged Company Stock | .78% | | | |
Actual | | $ 1,000.00 | $ 1,072.50 | $ 4.01 |
HypotheticalA | | $ 1,000.00 | $ 1,020.93 | $ 3.91 |
Class K | .67% | | | |
Actual | | $ 1,000.00 | $ 1,073.30 | $ 3.44 |
HypotheticalA | | $ 1,000.00 | $ 1,021.47 | $ 3.36 |
A 5% return per year before expenses
B Annualized expense ratio reflects expenses net of applicable fee waivers.
* Expenses are equal to each Class' annualized expense ratio, multiplied by the average account value over the period, multiplied by 181/365 (to reflect the one-half year period).
Annual Report
Investment Changes (Unaudited)
Top Ten Stocks as of July 31, 2015 |
| % of fund's
net assets | % of fund's net assets
6 months ago |
LyondellBasell Industries NV Class A | 9.0 | 7.5 |
Service Corp. International | 6.2 | 4.7 |
Boston Scientific Corp. | 3.4 | 2.9 |
WestRock Co. | 3.1 | 3.2 |
Bank of America Corp. | 2.9 | 2.4 |
Ford Motor Co. | 2.4 | 2.4 |
Delta Air Lines, Inc. | 2.4 | 3.2 |
Comcast Corp. Class A | 2.3 | 3.8 |
General Motors Co. | 2.2 | 2.2 |
HCA Holdings, Inc. | 2.1 | 1.6 |
| 36.0 | |
Top Five Market Sectors as of July 31, 2015 |
| % of fund's
net assets | % of fund's net assets
6 months ago |
Consumer Discretionary | 26.0 | 24.8 |
Health Care | 14.6 | 12.2 |
Materials | 14.3 | 13.2 |
Financials | 12.1 | 12.0 |
Industrials | 10.2 | 12.4 |
Asset Allocation (% of fund's net assets) |
As of July 31, 2015* | As of January 31, 2015** |
 | Stocks 96.9% | |  | Stocks 96.2% | |
 | Bonds 0.3% | |  | Bonds 0.4% | |
 | Short-Term
Investments and
Net Other Assets
(Liabilities) 2.8% | |  | Short-Term
Investments and
Net Other Assets
(Liabilities) 3.4% | |
* Foreign investments | 16.2% | | ** Foreign investments | 14.5% | |

Annual Report
Investments July 31, 2015
Showing Percentage of Net Assets
Common Stocks - 96.6% |
| Shares | | Value (000s) |
CONSUMER DISCRETIONARY - 26.0% |
Auto Components - 1.7% |
Delphi Automotive PLC | 490,700 | | $ 38,314 |
Tenneco, Inc. (a) | 825,300 | | 41,108 |
| | 79,422 |
Automobiles - 5.0% |
Ford Motor Co. | 7,806,833 | | 115,775 |
General Motors Co. | 3,272,337 | | 103,111 |
General Motors Co.: | | | |
warrants 7/10/16 (a) | 482,521 | | 10,615 |
warrants 7/10/19 (a) | 482,521 | | 7,098 |
| | 236,599 |
Diversified Consumer Services - 6.2% |
Service Corp. International | 9,646,027 | | 294,300 |
Hotels, Restaurants & Leisure - 0.8% |
ARAMARK Holdings Corp. | 987,744 | | 31,430 |
Penn National Gaming, Inc. (a) | 360,340 | | 6,875 |
Station Holdco LLC unit (a)(f)(g) | 146,846 | | 93 |
| | 38,398 |
Household Durables - 2.8% |
Hovnanian Enterprises, Inc. Class A (a)(d) | 1,419,000 | | 2,866 |
Lennar Corp. Class A | 677,100 | | 35,913 |
Newell Rubbermaid, Inc. | 2,129,847 | | 92,180 |
| | 130,959 |
Media - 6.9% |
AMC Networks, Inc. Class A (a) | 446,400 | | 37,596 |
Cinemark Holdings, Inc. | 2,343,045 | | 92,457 |
Comcast Corp. Class A | 1,723,034 | | 107,535 |
Gray Television, Inc. (a)(e) | 3,766,164 | | 63,611 |
Nexstar Broadcasting Group, Inc. Class A | 455,698 | | 26,139 |
| | 327,338 |
Specialty Retail - 2.6% |
Asbury Automotive Group, Inc. (a) | 385,122 | | 34,006 |
GameStop Corp. Class A (d) | 1,473,907 | | 67,579 |
Sally Beauty Holdings, Inc. (a) | 808,000 | | 24,070 |
| | 125,655 |
TOTAL CONSUMER DISCRETIONARY | | 1,232,671 |
Common Stocks - continued |
| Shares | | Value (000s) |
CONSUMER STAPLES - 1.7% |
Food Products - 1.3% |
ConAgra Foods, Inc. | 541,700 | | $ 23,867 |
Darling International, Inc. (a) | 2,698,383 | | 34,674 |
| | 58,541 |
Personal Products - 0.4% |
Revlon, Inc. (a) | 553,261 | | 19,901 |
TOTAL CONSUMER STAPLES | | 78,442 |
ENERGY - 6.4% |
Energy Equipment & Services - 1.7% |
Ensco PLC Class A | 110,000 | | 1,824 |
Halliburton Co. | 1,126,593 | | 47,080 |
Noble Corp. (d) | 987,610 | | 11,802 |
Oil States International, Inc. (a) | 270,466 | | 8,144 |
Schlumberger Ltd. | 109,400 | | 9,061 |
Transocean Ltd. (United States) (d) | 381,900 | | 5,064 |
| | 82,975 |
Oil, Gas & Consumable Fuels - 4.7% |
Continental Resources, Inc. (a) | 807,474 | | 26,978 |
Hess Corp. | 861,810 | | 50,855 |
QEP Resources, Inc. | 901,000 | | 12,506 |
Range Resources Corp. | 247,200 | | 9,725 |
Valero Energy Corp. | 1,103,866 | | 72,414 |
Western Refining, Inc. | 451,814 | | 19,952 |
Whiting Petroleum Corp. (a) | 1,439,895 | | 29,503 |
| | 221,933 |
TOTAL ENERGY | | 304,908 |
FINANCIALS - 11.8% |
Banks - 8.8% |
Bank of America Corp. | 7,570,599 | | 135,362 |
Barclays PLC sponsored ADR (d) | 2,441,721 | | 43,902 |
CIT Group, Inc. | 229,310 | | 10,787 |
Citigroup, Inc. | 1,221,847 | | 71,429 |
Huntington Bancshares, Inc. | 4,966,980 | | 57,965 |
Regions Financial Corp. | 5,015,480 | | 52,111 |
SunTrust Banks, Inc. | 1,019,600 | | 45,209 |
| | 416,765 |
Common Stocks - continued |
| Shares | | Value (000s) |
FINANCIALS - continued |
Capital Markets - 0.0% |
Motors Liquidation Co. GUC Trust (a) | 123,112 | | $ 2,093 |
Consumer Finance - 0.9% |
American Express Co. | 567,448 | | 43,160 |
Insurance - 0.5% |
Lincoln National Corp. | 435,700 | | 24,539 |
Real Estate Investment Trusts - 1.0% |
Gaming & Leisure Properties | 430,875 | | 14,111 |
Host Hotels & Resorts, Inc. | 1,016,122 | | 19,692 |
Sabra Health Care REIT, Inc. | 547,507 | | 14,974 |
| | 48,777 |
Real Estate Management & Development - 0.5% |
Realogy Holdings Corp. (a) | 463,840 | | 21,114 |
Thrifts & Mortgage Finance - 0.1% |
MGIC Investment Corp. (a) | 441,300 | | 4,885 |
TOTAL FINANCIALS | | 561,333 |
HEALTH CARE - 14.6% |
Health Care Equipment & Supplies - 3.4% |
Boston Scientific Corp. (a) | 9,434,356 | | 163,592 |
Health Care Providers & Services - 7.5% |
Community Health Systems, Inc. (a) | 1,267,827 | | 74,181 |
DaVita HealthCare Partners, Inc. (a) | 532,952 | | 42,119 |
HCA Holdings, Inc. (a) | 1,098,579 | | 102,179 |
Tenet Healthcare Corp. (a) | 1,452,844 | | 81,795 |
Universal Health Services, Inc. Class B | 385,505 | | 55,987 |
| | 356,261 |
Life Sciences Tools & Services - 0.6% |
PRA Health Sciences, Inc. | 651,400 | | 27,352 |
Pharmaceuticals - 3.1% |
Johnson & Johnson | 153,000 | | 15,332 |
Merck & Co., Inc. | 1,453,600 | | 85,704 |
Sanofi SA sponsored ADR | 819,934 | | 44,268 |
| | 145,304 |
TOTAL HEALTH CARE | | 692,509 |
Common Stocks - continued |
| Shares | | Value (000s) |
INDUSTRIALS - 10.2% |
Aerospace & Defense - 2.1% |
Honeywell International, Inc. | 426,776 | | $ 44,833 |
Huntington Ingalls Industries, Inc. | 258,160 | | 30,311 |
Textron, Inc. | 602,700 | | 26,338 |
| | 101,482 |
Airlines - 3.6% |
American Airlines Group, Inc. | 860,580 | | 34,509 |
Delta Air Lines, Inc. | 2,606,801 | | 115,586 |
Southwest Airlines Co. | 571,283 | | 20,680 |
| | 170,775 |
Building Products - 0.7% |
Allegion PLC | 246,500 | | 15,584 |
Armstrong World Industries, Inc. (a) | 273,500 | | 16,000 |
| | 31,584 |
Commercial Services & Supplies - 0.9% |
Civeo Corp. | 540,932 | | 1,158 |
Deluxe Corp. | 431,413 | | 27,796 |
Tyco International Ltd. | 328,233 | | 12,470 |
| | 41,424 |
Electrical Equipment - 0.5% |
Emerson Electric Co. | 163,500 | | 8,461 |
Generac Holdings, Inc. (a)(d) | 490,557 | | 17,204 |
| | 25,665 |
Industrial Conglomerates - 0.6% |
General Electric Co. | 1,103,883 | | 28,811 |
Machinery - 1.1% |
Ingersoll-Rand PLC | 739,500 | | 45,405 |
Pentair PLC | 78,757 | | 4,789 |
| | 50,194 |
Marine - 0.3% |
Genco Shipping & Trading Ltd. (a) | 565,366 | | 4,110 |
Genco Shipping & Trading Ltd. (a) | 8,314 | | 60 |
Navios Maritime Holdings, Inc. (d) | 2,162,794 | | 8,002 |
| | 12,172 |
Road & Rail - 0.2% |
Hertz Global Holdings, Inc. (a) | 707,700 | | 12,024 |
Common Stocks - continued |
| Shares | | Value (000s) |
INDUSTRIALS - continued |
Trading Companies & Distributors - 0.2% |
United Rentals, Inc. (a) | 147,000 | | $ 9,848 |
TOTAL INDUSTRIALS | | 483,979 |
INFORMATION TECHNOLOGY - 9.1% |
Communications Equipment - 1.3% |
Cisco Systems, Inc. | 2,181,349 | | 61,994 |
Electronic Equipment & Components - 1.5% |
Avnet, Inc. | 594,313 | | 24,801 |
Belden, Inc. | 510,764 | | 30,253 |
Corning, Inc. | 726,800 | | 13,577 |
TTM Technologies, Inc. (a) | 381,564 | | 3,484 |
| | 72,115 |
Internet Software & Services - 0.3% |
VeriSign, Inc. (a)(d) | 194,300 | | 13,784 |
IT Services - 0.2% |
Global Cash Access Holdings, Inc. (a) | 1,851,000 | | 9,348 |
Semiconductors & Semiconductor Equipment - 3.4% |
Freescale Semiconductor, Inc. (a) | 1,033,800 | | 41,218 |
Intersil Corp. Class A | 1,460,387 | | 16,254 |
Micron Technology, Inc. (a) | 2,079,945 | | 38,500 |
NXP Semiconductors NV (a) | 459,064 | | 44,525 |
ON Semiconductor Corp. (a) | 2,134,568 | | 22,669 |
| | 163,166 |
Software - 1.7% |
Citrix Systems, Inc. (a) | 230,899 | | 17,458 |
Microsoft Corp. | 1,384,568 | | 64,659 |
| | 82,117 |
Technology Hardware, Storage & Peripherals - 0.7% |
NCR Corp. (a) | 1,117,931 | | 30,788 |
TOTAL INFORMATION TECHNOLOGY | | 433,312 |
MATERIALS - 14.3% |
Chemicals - 9.8% |
H.B. Fuller Co. | 461,829 | | 18,501 |
LyondellBasell Industries NV Class A | 4,554,155 | | 427,315 |
Common Stocks - continued |
| Shares | | Value (000s) |
MATERIALS - continued |
Chemicals - continued |
OMNOVA Solutions, Inc. (a)(e) | 3,114,962 | | $ 20,154 |
Phosphate Holdings, Inc. (a) | 307,500 | | 20 |
| | 465,990 |
Containers & Packaging - 3.7% |
Sealed Air Corp. | 483,434 | | 25,704 |
WestRock Co. | 2,336,728 | | 147,354 |
| | 173,058 |
Metals & Mining - 0.0% |
Ormet Corp. (a)(e) | 1,405,000 | | 5 |
TimkenSteel Corp. | 114,367 | | 2,131 |
| | 2,136 |
Paper & Forest Products - 0.8% |
Louisiana-Pacific Corp. (a) | 1,563,090 | | 23,040 |
Neenah Paper, Inc. | 266,200 | | 16,126 |
| | 39,166 |
TOTAL MATERIALS | | 680,350 |
TELECOMMUNICATION SERVICES - 1.3% |
Diversified Telecommunication Services - 1.3% |
Frontier Communications Corp. (d) | 5,528,256 | | 26,093 |
Intelsat SA (a)(d) | 1,144,700 | | 10,886 |
Level 3 Communications, Inc. (a) | 514,400 | | 25,977 |
| | 62,956 |
UTILITIES - 1.2% |
Electric Utilities - 0.3% |
FirstEnergy Corp. | 421,304 | | 14,307 |
Independent Power and Renewable Electricity Producers - 0.9% |
Calpine Corp. (a) | 2,167,700 | | 39,669 |
TOTAL UTILITIES | | 53,976 |
TOTAL COMMON STOCKS (Cost $2,685,815) |
4,584,436
|
Nonconvertible Preferred Stocks - 0.3% |
| Shares | | Value (000s) |
FINANCIALS - 0.3% |
Capital Markets - 0.3% |
GMAC Capital Trust I Series 2, 8.125% (Cost $10,975) | 439,013 | | $ 11,515 |
Nonconvertible Bonds - 0.3% |
| Principal Amount (000s) | | |
ENERGY - 0.3% |
Energy Equipment & Services - 0.3% |
Offshore Group Investment Ltd. 7.5% 11/1/19 | | $ 13,360 | | 7,148 |
SAExploration Holdings, Inc. 10% 7/15/19 | | 14,345 | | 8,912 |
| | 16,060 |
TOTAL NONCONVERTIBLE BONDS (Cost $26,546) |
16,060
|
Money Market Funds - 6.3% |
| Shares | | |
Fidelity Cash Central Fund, 0.17% (b) | 136,369,538 | | 136,370 |
Fidelity Securities Lending Cash Central Fund, 0.18% (b)(c) | 164,240,156 | | 164,240 |
TOTAL MONEY MARKET FUNDS (Cost $300,610) |
300,610
|
TOTAL INVESTMENT PORTFOLIO - 103.5% (Cost $3,023,946) | | 4,912,621 |
NET OTHER ASSETS (LIABILITIES) - (3.5)% | | (166,336) |
NET ASSETS - 100% | $ 4,746,285 |
Legend |
(a) Non-income producing |
(b) Affiliated fund that is generally available only to investment companies and other accounts managed by Fidelity Investments. The rate quoted is the annualized seven-day yield of the fund at period end. A complete unaudited listing of the fund's holdings as of its most recent quarter end is available upon request. In addition, each Fidelity Central Fund's financial statements, which are not covered by the Fund's Report of Independent Registered Public Accounting Firm, are available on the SEC's website or upon request. |
(c) Investment made with cash collateral received from securities on loan. |
(d) Security or a portion of the security is on loan at period end. |
(e) Affiliated company |
(f) Investment is owned by an entity that is treated as a U.S. Corporation for tax purposes in which the Fund holds a percentage ownership. |
(g) Restricted securities - Investment in securities not registered under the Securities Act of 1933 (excluding 144A issues). At the end of the period, the value of restricted securities (excluding 144A issues) amounted to $93,000 or 0.0% of net assets. |
Additional information on each restricted holding is as follows: |
Security | Acquisition Date | Acquisition Cost (000s) |
Station Holdco LLC unit | 10/28/08 - 12/1/08 | $ 5,990 |
Affiliated Central Funds |
Information regarding fiscal year to date income earned by the Fund from investments in Fidelity Central Funds is as follows: |
Fund | Income earned
(Amounts in thousands) |
Fidelity Cash Central Fund | $ 151 |
Fidelity Securities Lending Cash Central Fund | 2,875 |
Total | $ 3,026 |
Other Affiliated Issuers |
An affiliated company is a company in which the Fund has ownership of at least 5% of the voting securities. Fiscal year to date transactions with companies which are or were affiliates are as follows: |
Affiliate
(Amounts in thousands) | Value,
beginning of
period | Purchases | Sales
Proceeds | Dividend
Income | Value,
end of
period |
Gray Television, Inc. | $ 45,872 | $ - | $ - | $ - | $ 63,611 |
OMNOVA Solutions, Inc. | 25,138 | - | - | - | 20,154 |
Ormet Corp. | 8 | - | - | - | 5 |
Total | $ 71,018 | $ - | $ - | $ - | $ 83,770 |
Other Information |
The following is a summary of the inputs used, as of July 31, 2015, involving the Fund's assets and liabilities carried at fair value. The inputs or methodology used for valuing securities may not be an indication of the risk associated with investing in those securities. For more information on valuation inputs, and their aggregation into the levels used in the table below, please refer to the Investment Valuation section in the accompanying Notes to Financial Statements. |
Valuation Inputs at Reporting Date: |
Description
(Amounts in thousands) | Total | Level 1 | Level 2 | Level 3 |
Investments in Securities: | | | | |
Equities: | | | | |
Consumer Discretionary | $ 1,232,671 | $ 1,232,578 | $ - | $ 93 |
Consumer Staples | 78,442 | 78,442 | - | - |
Energy | 304,908 | 304,908 | - | - |
Financials | 572,848 | 572,848 | - | - |
Health Care | 692,509 | 692,509 | - | - |
Industrials | 483,979 | 483,979 | - | - |
Information Technology | 433,312 | 433,312 | - | - |
Materials | 680,350 | 680,345 | - | 5 |
Telecommunication Services | 62,956 | 62,956 | - | - |
Utilities | 53,976 | 53,976 | - | - |
Corporate Bonds | 16,060 | - | 16,060 | - |
Money Market Funds | 300,610 | 300,610 | - | - |
Total Investments in Securities: | $ 4,912,621 | $ 4,896,463 | $ 16,060 | $ 98 |
Distribution of investments by country or territory of incorporation, as a percentage of total net assets, is as follows (Unaudited): |
United States of America | 83.8% |
Netherlands | 9.9% |
Ireland | 1.7% |
United Kingdom | 1.1% |
France | 1.0% |
Others (Individually Less Than 1%) | 2.5% |
| 100.0% |
See accompanying notes which are an integral part of the financial statements.
Annual Report
Statement of Assets and Liabilities
Amounts in thousands (except per-share amounts) | | July 31, 2015 |
| | |
Assets | | |
Investment in securities, at value (including securities loaned of $159,067) - See accompanying schedule: Unaffiliated issuers (cost $2,649,138) | $ 4,528,241 | |
Fidelity Central Funds (cost $300,610) | 300,610 | |
Other affiliated issuers (cost $74,198) | 83,770 | |
Total Investments (cost $3,023,946) | | $ 4,912,621 |
Receivable for fund shares sold | | 1,213 |
Dividends receivable | | 2,817 |
Interest receivable | | 314 |
Distributions receivable from Fidelity Central Funds | | 249 |
Other receivables | | 45 |
Total assets | | 4,917,259 |
| | |
Liabilities | | |
Payable for fund shares redeemed | $ 3,637 | |
Accrued management fee | 2,394 | |
Other affiliated payables | 642 | |
Other payables and accrued expenses | 61 | |
Collateral on securities loaned, at value | 164,240 | |
Total liabilities | | 170,974 |
| | |
Net Assets | | $ 4,746,285 |
Net Assets consist of: | | |
Paid in capital | | $ 2,672,305 |
Undistributed net investment income | | 24,974 |
Accumulated undistributed net realized gain (loss) on investments | | 160,331 |
Net unrealized appreciation (depreciation) on investments | | 1,888,675 |
Net Assets | | $ 4,746,285 |
See accompanying notes which are an integral part of the financial statements.
Annual Report
Statement of Assets and Liabilities - continued
Amounts in thousands (except per-share amounts) | | July 31, 2015 |
| | |
Leveraged Company Stock: | | |
Net Asset Value, offering price and redemption price per share ($3,755,492 ÷ 80,066.9 shares) | | $ 46.90 |
| | |
Class K: | | |
Net Asset Value, offering price and redemption price per share ($990,793 ÷ 21,082.6 shares) | | $ 47.00 |
See accompanying notes which are an integral part of the financial statements.
Annual Report
Financial Statements - continued
Statement of Operations
Amounts in thousands | Year ended July 31, 2015 |
| | |
Investment Income | | |
Dividends | | $ 79,289 |
Interest | | 2,240 |
Income from Fidelity Central Funds | | 3,026 |
Total income | | 84,555 |
| | |
Expenses | | |
Management fee | $ 30,550 | |
Transfer agent fees | 6,911 | |
Accounting and security lending fees | 1,139 | |
Custodian fees and expenses | 50 | |
Independent trustees' compensation | 22 | |
Registration fees | 84 | |
Audit | 66 | |
Legal | 23 | |
Miscellaneous | 35 | |
Total expenses before reductions | 38,880 | |
Expense reductions | (169) | 38,711 |
Net investment income (loss) | | 45,844 |
Realized and Unrealized Gain (Loss) Net realized gain (loss) on: | | |
Investment securities: | | |
Unaffiliated issuers | | 235,817 |
Change in net unrealized appreciation (depreciation) on investment securities | | (131,060) |
Net gain (loss) | | 104,757 |
Net increase (decrease) in net assets resulting from operations | | $ 150,601 |
See accompanying notes which are an integral part of the financial statements.
Annual Report
Statement of Changes in Net Assets
Amounts in thousands | Year ended
July 31,
2015 | Year ended
July 31,
2014 |
Increase (Decrease) in Net Assets | | |
Operations | | |
Net investment income (loss) | $ 45,844 | $ 44,390 |
Net realized gain (loss) | 235,817 | 184,977 |
Change in net unrealized appreciation (depreciation) | (131,060) | 610,173 |
Net increase (decrease) in net assets resulting from operations | 150,601 | 839,540 |
Distributions to shareholders from net investment income | (41,090) | (37,155) |
Share transactions - net increase (decrease) | (743,092) | (702,631) |
Redemption fees | 302 | 366 |
Total increase (decrease) in net assets | (633,279) | 100,120 |
| | |
Net Assets | | |
Beginning of period | 5,379,564 | 5,279,444 |
End of period (including undistributed net investment income of $24,974 and undistributed net investment income of $22,869, respectively) | $ 4,746,285 | $ 5,379,564 |
See accompanying notes which are an integral part of the financial statements.
Annual Report
Financial Highlights - Leveraged Company Stock
Years ended July 31, | 2015 | 2014 | 2013 | 2012 | 2011 |
Selected Per-Share Data | | | | | |
Net asset value, beginning of period | $ 45.82 | $ 39.44 | $ 28.22 | $ 28.85 | $ 23.50 |
Income from Investment Operations | | | | | |
Net investment income (loss)B | .41 | .34 | .42F | .16 | -H |
Net realized and unrealized gain (loss) | 1.01 | 6.31 | 10.92 | (.50) | 5.46 |
Total from investment operations | 1.42 | 6.65 | 11.34 | (.34) | 5.46 |
Distributions from net investment income | (.34) | (.27) | (.12) | (.29) | (.11) |
Redemption fees added to paid in capital B, H | - | - | - | - | - |
Net asset value, end of period | $ 46.90 | $ 45.82 | $ 39.44 | $ 28.22 | $ 28.85 |
Total ReturnA | 3.12% | 16.96% | 40.31% | (1.05)% | 23.27% |
Ratios to Average Net Assets C, G | | | | | |
Expenses before reductions | .79% | .79% | .82% | .86% | .85% |
Expenses net of fee waivers, if any | .78% | .79% | .82% | .86% | .85% |
Expenses net of all reductions | .78% | .79% | .82% | .85% | .84% |
Net investment income (loss) | .87% | .81% | 1.25%F | .60% | -%E |
Supplemental Data | | | | | |
Net assets, end of period (in millions) | $ 3,755 | $ 4,207 | $ 4,227 | $ 3,009 | $ 3,931 |
Portfolio turnover rateD | 4% | 10% | 21% | 29% | 18% |
A Total returns would have been lower if certain expenses had not been reduced during the applicable periods shown.
B Calculated based on average shares outstanding during the period.
C Fees and expenses of any underlying Fidelity Central Funds are not included in the Fund's expense ratio. The Fund indirectly bears its proportionate share of the expenses of any underlying Fidelity Central Funds.
D Amount does not include the portfolio activity of any underlying Fidelity Central Funds.
E Amount represents less than .01%.
F Investment income per share reflects a large, non-recurring dividend which amounted to $.08 per share. Excluding this non-recurring dividend, the ratio of net investment income (loss) to average net assets would have been 1.03%.
G Expense ratios reflect operating expenses of the class. Expenses before reductions do not reflect amounts reimbursed by the investment adviser or reductions from brokerage service arrangements or reductions from other expense offset arrangements and do not represent the amount paid by the class during periods when reimbursements or reductions occur. Expenses net of fee waivers reflect expenses after reimbursement by the investment adviser but prior to reductions from brokerage service arrangements or other expense offset arrangements. Expenses net of all reductions represent the net expenses paid by the class.
H Amount represents less than $.01 per share.
See accompanying notes which are an integral part of the financial statements.
Annual Report
Financial Highlights - Class K
Years ended July 31, | 2015 | 2014 | 2013 | 2012 | 2011 |
Selected Per-Share Data | | | | | |
Net asset value, beginning of period | $ 45.91 | $ 39.52 | $ 28.26 | $ 28.86 | $ 23.52 |
Income from Investment Operations | | | | | |
Net investment income (loss)B | .46 | .40 | .47E | .20 | .04 |
Net realized and unrealized gain (loss) | 1.03 | 6.31 | 10.93 | (.49) | 5.45 |
Total from investment operations | 1.49 | 6.71 | 11.40 | (.29) | 5.49 |
Distributions from net investment income | (.40) | (.32) | (.14) | (.31) | (.15) |
Redemption fees added to paid in capital B, G | - | - | - | - | - |
Net asset value, end of period | $ 47.00 | $ 45.91 | $ 39.52 | $ 28.26 | $ 28.86 |
Total ReturnA | 3.26% | 17.10% | 40.47% | (.87)% | 23.45% |
Ratios to Average Net Assets C, F | | | | | |
Expenses before reductions | .67% | .67% | .69% | .69% | .69% |
Expenses net of fee waivers, if any | .67% | .67% | .69% | .69% | .69% |
Expenses net of all reductions | .67% | .67% | .68% | .69% | .69% |
Net investment income (loss) | .99% | .92% | 1.39%E | .76% | .16% |
Supplemental Data | | | | | |
Net assets, end of period (in millions) | $ 991 | $ 1,173 | $ 1,053 | $ 600 | $ 555 |
Portfolio turnover rateD | 4% | 10% | 21% | 29% | 18% |
A Total returns would have been lower if certain expenses had not been reduced during the applicable periods shown.
B Calculated based on average shares outstanding during the period.
C Fees and expenses of any underlying Fidelity Central Funds are not included in the Fund's expense ratio. The Fund indirectly bears its proportionate share of the expenses of any underlying Fidelity Central Funds.
D Amount does not include the portfolio activity of any underlying Fidelity Central Funds.
E Investment income per share reflects a large, non-recurring dividend which amounted to $.08 per share. Excluding this non-recurring dividend, the ratio of net investment income (loss) to average net assets would have been 1.17%.
F Expense ratios reflect operating expenses of the class. Expenses before reductions do not reflect amounts reimbursed by the investment adviser or reductions from brokerage service arrangements or reductions from other expense offset arrangements and do not represent the amount paid by the class during periods when reimbursements or reductions occur. Expenses net of fee waivers reflect expenses after reimbursement by the investment adviser but prior to reductions from brokerage service arrangements or other expense offset arrangements. Expenses net of all reductions represent the net expenses paid by the class.
G Amount represents less than $.01 per share.
See accompanying notes which are an integral part of the financial statements.
Annual Report
For the period ended July 31, 2015
(Amounts in thousands except percentages)
1. Organization.
Fidelity Leveraged Company Stock Fund (the Fund) is a fund of Fidelity Securities Fund (the Trust) and is authorized to issue an unlimited number of shares. The Trust is registered under the Investment Company Act of 1940, as amended (the 1940 Act), as an open-end management investment company organized as a Massachusetts business trust. The Fund offers Leveraged Company Stock and Class K shares, each of which has equal rights as to assets and voting privileges. Each class has exclusive voting rights with respect to matters that affect that class.
2. Investments in Fidelity Central Funds.
The Fund invests in Fidelity Central Funds, which are open-end investment companies generally available only to other investment companies and accounts managed by the investment adviser and its affiliates. The Fund's Schedule of Investments lists each of the Fidelity Central Funds held as of period end, if any, as an investment of the Fund, but does not include the underlying holdings of each Fidelity Central Fund. As an Investing Fund, the Fund indirectly bears its proportionate share of the expenses of the underlying Fidelity Central Funds.
The Money Market Central Funds seek preservation of capital and current income and are managed by Fidelity Investments Money Management, Inc. (FIMM), an affiliate of the investment adviser. Annualized expenses of the Money Market Central Funds as of their most recent shareholder report date are less than .01%.
A complete unaudited list of holdings for each Fidelity Central Fund is available upon request or at the Securities and Exchange Commission (the SEC) website at www.sec.gov. In addition, the financial statements of the Fidelity Central Funds, which are not covered by the Fund's Report of Independent Registered Public Accounting Firm, are available on the SEC website or upon request.
3. Significant Accounting Policies.
The financial statements have been prepared in conformity with accounting principles generally accepted in the United States of America (GAAP), which require management to make certain estimates and assumptions at the date of the financial statements. Actual results could differ from those estimates. Subsequent events, if any, through the date that the financial statements were issued have been evaluated in the preparation of the financial statements. The following summarizes the significant accounting policies of the Fund:
Investment Valuation. Investments are valued as of 4:00 p.m. Eastern time on the last calendar day of the period. The Board of Trustees (the Board) has delegated the day to
Annual Report
Notes to Financial Statements - continued
(Amounts in thousands except percentages)
3. Significant Accounting Policies - continued
Investment Valuation - continued
day responsibility for the valuation of the Fund's investments to the Fidelity Management & Research Company (FMR) Fair Value Committee (the Committee). In accordance with valuation policies and procedures approved by the Board, the Fund attempts to obtain prices from one or more third party pricing vendors or brokers to value its investments. When current market prices, quotations or currency exchange rates are not readily available or reliable, investments will be fair valued in good faith by the Committee, in accordance with procedures adopted by the Board. Factors used in determining fair value vary by investment type and may include market or investment specific events, changes in interest rates and credit quality. The frequency with which these procedures are used cannot be predicted and they may be utilized to a significant extent. The Committee oversees the Fund's valuation policies and procedures and reports to the Board on the Committee's activities and fair value determinations. The Board monitors the appropriateness of the procedures used in valuing the Fund's investments and ratifies the fair value determinations of the Committee.
The Fund categorizes the inputs to valuation techniques used to value its investments into a disclosure hierarchy consisting of three levels as shown below:
Level 1 - quoted prices in active markets for identical investments
Level 2 - other significant observable inputs (including quoted prices for similar investments, interest rates, prepayment speeds, etc.)
Level 3 - unobservable inputs (including the Fund's own assumptions based on the best information available)
Valuation techniques used to value the Fund's investments by major category are as follows:
Equity securities, including restricted securities, for which market quotations are readily available, are valued at the last reported sale price or official closing price as reported by a third party pricing vendor on the primary market or exchange on which they are traded and are categorized as Level 1 in the hierarchy. In the event there were no sales during the day or closing prices are not available, securities are valued at the last quoted bid price or may be valued using the last available price and are generally categorized as Level 2 in the hierarchy. For foreign equity securities, when market or security specific events arise, comparisons to the valuation of American Depositary Receipts (ADRs), futures contracts, Exchange-Traded Funds (ETFs) and certain indexes as well as quoted prices for similar securities may be used and would be categorized as Level 2 in the hierarchy. Utilizing these techniques may result in transfers between Level 1 and Level 2.
Annual Report
3. Significant Accounting Policies - continued
Investment Valuation - continued
For equity securities, including restricted securities, where observable inputs are limited, assumptions about market activity and risk are used and these securities may be categorized as Level 3 in the hierarchy.
Debt securities, including restricted securities, are valued based on evaluated prices received from third party pricing vendors or from brokers who make markets in such securities. Corporate bonds are valued by pricing vendors who utilize matrix pricing which considers yield or price of bonds of comparable quality, coupon, maturity and type or by broker-supplied prices. When independent prices are unavailable or unreliable, debt securities may be valued utilizing pricing methodologies which consider similar factors that would be used by third party pricing vendors. Debt securities are generally categorized as Level 2 in the hierarchy but may be Level 3 depending on the circumstances.
Investments in open-end mutual funds, including the Fidelity Central Funds, are valued at their closing net asset value (NAV) each business day and are categorized as Level 1 in the hierarchy.
Changes in valuation techniques may result in transfers in or out of an assigned level within the disclosure hierarchy. The aggregate value of investments by input level as of July 31, 2015, is included at the end of the Fund's Schedule of Investments.
Investment Transactions and Income. For financial reporting purposes, the Fund's investment holdings and NAV include trades executed through the end of the last business day of the period. The NAV per share for processing shareholder transactions is calculated as of the close of business of the New York Stock Exchange (NYSE), normally 4:00 p.m. Eastern time and includes trades executed through the end of the prior business day. Gains and losses on securities sold are determined on the basis of identified cost and may include proceeds received from litigation. Dividend income is recorded on the ex-dividend date, except for certain dividends from foreign securities where the ex-dividend date may have passed, which are recorded as soon as the Fund is informed of the ex-dividend date. Non-cash dividends included in dividend income, if any, are recorded at the fair market value of the securities received. Income and capital gain distributions from Fidelity Central Funds, if any, are recorded on the ex-dividend date. Distributions received on securities that represent a return of capital or capital gain are recorded as a reduction of cost of investments and/or as a realized gain. Subsequent to ex-dividend date the Fund determines the components of these distributions, based upon receipt of tax filings or other correspondence relating to the underlying investment. Interest income is accrued as earned and includes coupon interest and amortization of premium and accretion of discount on debt securities as applicable.
Annual Report
Notes to Financial Statements - continued
(Amounts in thousands except percentages)
3. Significant Accounting Policies - continued
Class Allocations and Expenses. Investment income, realized and unrealized capital gains and losses, common expenses of the Fund, and certain fund-level expense reductions, if any, are allocated daily on a pro-rata basis to each class based on the relative net assets of each class to the total net assets of the Fund. Each class differs with respect to transfer agent fees incurred. Certain expense reductions may also differ by class. For the reporting period, the allocated portion of income and expenses to each class as a percent of its average net assets may vary due to the timing of recording these transactions in relation to fluctuating net assets of the classes. Expenses directly attributable to a fund are charged to that fund. Expenses attributable to more than one fund are allocated among the respective funds on the basis of relative net assets or other appropriate methods. Expense estimates are accrued in the period to which they relate and adjustments are made when actual amounts are known.
Income Tax Information and Distributions to Shareholders. Each year, the Fund intends to qualify as a regulated investment company under Subchapter M of the Internal Revenue Code, including distributing substantially all of its taxable income and realized gains. As a result, no provision for U.S. Federal income taxes is required. As of July 31, 2015, the Fund did not have any unrecognized tax benefits in the financial statements; nor is the Fund aware of any tax positions for which it is reasonably possible that the total amounts of unrecognized tax benefits will significantly change in the next twelve months. The Fund files a U.S. federal tax return, in addition to state and local tax returns as required. The Fund's federal income tax returns are subject to examination by the Internal Revenue Service (IRS) for a period of three fiscal years after they are filed. State and local tax returns may be subject to examination for an additional fiscal year depending on the jurisdiction.
Distributions are declared and recorded on the ex-dividend date. Income dividends and capital gain distributions are declared separately for each class. Income and capital gain distributions are determined in accordance with income tax regulations, which may differ from GAAP. In addition, the Fund claimed a portion of the payment made to redeeming shareholders as a distribution for income tax purposes.
Capital accounts within the financial statements are adjusted for permanent book-tax differences. These adjustments have no impact on net assets or the results of operations. Capital accounts are not adjusted for temporary book-tax differences which will reverse in a subsequent period.
Book-tax differences are primarily due to market discount, equity-debt classifications, capital loss carryforwards and losses deferred due to excise tax regulations.
Annual Report
3. Significant Accounting Policies - continued
Income Tax Information and Distributions to Shareholders - continued
The federal tax cost of investment securities and unrealized appreciation (depreciation) as of period end were as follows:
Gross unrealized appreciation | $ 2,114,722 |
Gross unrealized depreciation | (222,542) |
Net unrealized appreciation (depreciation) on securities | $ 1,892,180 |
| |
Tax Cost | $ 3,020,441 |
The tax-based components of distributable earnings as of period end were as follows:
Undistributed ordinary income | $ 21,665 |
Undistributed long-term capital gain | $ 160,331 |
Net unrealized appreciation (depreciation) on securities and other investments | $ 1,892,180 |
The tax character of distributions paid was as follows:
| July 31, 2015 | July 31, 2014 |
Ordinary Income | $ 41,090 | $ 37,155 |
Short-Term Trading (Redemption) Fees. Shares held by investors in the Fund less than 90 days may have been subject to a redemption fee equal to 1.50% of the NAV of shares redeemed. All redemption fees, which reduce the proceeds of the shareholder redemption, are retained by the Fund and accounted for as an addition to paid in capital.
Restricted Securities. The Fund may invest in securities that are subject to legal or contractual restrictions on resale. These securities generally may be resold in transactions exempt from registration or to the public if the securities are registered. Disposal of these securities may involve time-consuming negotiations and expense, and prompt sale at an acceptable price may be difficult. Information regarding restricted securities is included at the end of the Fund's Schedule of Investments.
4. Purchases and Sales of Investments.
Purchases and sales of securities, other than short-term securities, aggregated $195,757 and $943,000, respectively.
Annual Report
Notes to Financial Statements - continued
(Amounts in thousands except percentages)
5. Fees and Other Transactions with Affiliates.
Management Fee. Fidelity Management & Research Company (the investment adviser) and its affiliates provide the Fund with investment management related services for which the Fund pays a monthly management fee. The management fee is the sum of an individual fund fee rate that is based on an annual rate of .35% of the Fund's average net assets and an annualized group fee rate that averaged .25% during the period. The group fee rate is based upon the average net assets of all the mutual funds advised by the investment adviser, including any mutual funds previously advised by the investment adviser that are currently advised by Fidelity SelectCo, LLC, an affiliate of the investment adviser. The group fee rate decreases as assets under management increase and increases as assets under management decrease. For the reporting period, the total annual management fee rate was .60% of the Fund's average net assets.
Transfer Agent Fees. Fidelity Investments Institutional Operations Company, Inc., (FIIOC), an affiliate of the investment adviser, is the transfer, dividend disbursing and shareholder servicing agent for each class of the Fund. FIIOC receives account fees and asset-based fees that vary according to the account size and type of account of the shareholders of Leveraged Company Stock. FIIOC receives an asset-based fee of Class K's average net assets. FIIOC pays for typesetting, printing and mailing of shareholder reports, except proxy statements.
For the period, transfer agent fees for each class were as follows:
| Amount | % of
Class-Level Average
Net Assets |
Leveraged Company Stock | $ 6,377 | .16 |
Class K | 534 | .05 |
| $ 6,911 | |
Accounting and Security Lending Fees. Fidelity Service Company, Inc. (FSC), an affiliate of the investment adviser, maintains the Fund's accounting records. The accounting fee is based on the level of average net assets for each month. Under a separate contract, FSC administers the security lending program. The security lending fee is based on the number and duration of lending transactions.
Brokerage Commissions. The Fund placed a portion of its portfolio transactions with brokerage firms which are affiliates of the investment adviser. Brokerage commissions are included in net realized gain (loss) and change in net unrealized appreciation (depreciation) in the Statement of Operations. The commissions paid to these affiliated firms were $22 for the period.
Annual Report
5. Fees and Other Transactions with Affiliates - continued
Interfund Lending Program. Pursuant to an Exemptive Order issued by the SEC, the Fund, along with other registered investment companies having management contracts with FMR or other affiliated entities of FMR, may participate in an interfund lending program. This program provides an alternative credit facility allowing the funds to borrow from, or lend money to, other participating affiliated funds. At period end, there were no interfund loans outstanding. The Fund's activity in this program during the period for which loans were outstanding was as follows:
Borrower or Lender | Average Loan
Balance | Weighted Average
Interest Rate | Interest Expense |
Borrower | $ 9,431 | .34% | $ -* |
* Amount represents two hundred seventy dollars.
6. Committed Line of Credit.
The Fund participates with other funds managed by the investment adviser or an affiliate in a $4.25 billion credit facility (the "line of credit") to be utilized for temporary or emergency purposes to fund shareholder redemptions or for other short-term liquidity purposes. The Fund has agreed to pay commitment fees on its pro-rata portion of the line of credit, which amounted to $7 and is reflected in Miscellaneous expenses on the Statement of Operations. During the period, the Fund did not borrow on this line of credit.
7. Security Lending.
The Fund lends portfolio securities through a lending agent from time to time in order to earn additional income. For equity securities, a lending agent is used and may loan securities to certain qualified borrowers, including Fidelity Capital Markets (FCM), a broker-dealer affiliated with the Fund. On the settlement date of the loan, the Fund receives collateral (in the form of U.S. Treasury obligations, letters of credit and/or cash) against the loaned securities and maintains collateral in an amount not less than 100% of the market value of the loaned securities during the period of the loan. The market value of the loaned securities is determined at the close of business of the Fund and any additional required collateral is delivered to the Fund on the next business day. If the borrower defaults on its obligation to return the securities loaned because of insolvency or other reasons, the Fund may apply collateral received from the borrower against the obligation. The Fund may experience delays and costs in recovering the securities loaned. Any cash collateral received is invested in the Fidelity Securities Lending Cash Central Fund. The value of loaned securities and cash collateral at period end are disclosed on the Fund's Statement of Assets and Liabilities. The value of securities loaned to FCM at period end was $5,708. Security lending income represents the income
Annual Report
Notes to Financial Statements - continued
(Amounts in thousands except percentages)
7. Security Lending - continued
earned on investing cash collateral, less rebates paid to borrowers and any lending agent fees associated with the loan, plus any premium payments received for lending certain types of securities. Security lending income is presented in the Statement of Operations as a component of income from Fidelity Central Funds. Total security lending income during the period amounted to $2,875, including $167 from securities loaned to FCM.
8. Expense Reductions.
Commissions paid to certain brokers with whom the investment adviser, or its affiliates, places trades on behalf of the Fund include an amount in addition to trade execution, which may be rebated back to the Fund to offset certain expenses. This amount totaled $48 for the period.
In addition, during the period the investment adviser reimbursed/waived a portion of fund-level operating expenses in the amount of $20 and a portion of class-level operating expenses as follows:
| Amount |
Leveraged Company Stock | $ 101 |
9. Distributions to Shareholders.
Distributions to shareholders of each class were as follows:
Years ended July 31, | 2015 | 2014 |
From net investment income | | |
Leveraged Company Stock | $ 30,775 | $ 28,583 |
Class K | 10,315 | 8,572 |
Total | $ 41,090 | $ 37,155 |
10. Share Transactions.
Share transactions for each class were as follows and may contain automatic conversions between classes or exchanges between funds:
| Shares | Dollars |
Years ended July 31, | 2015 | 2014 | 2015 | 2014 |
Leveraged Company Stock | | | | |
Shares sold | 5,334 | 9,604 | $ 246,873 | $ 407,601 |
Reinvestment of distributions | 626 | 670 | 29,028 | 26,928 |
Shares redeemed | (17,699) | (25,643) | (811,035) | (1,089,706) |
Net increase (decrease) | (11,739) | (15,369) | $ (535,134) | $ (655,177) |
Annual Report
10. Share Transactions - continued
| Shares | Dollars |
Years ended July 31, | 2015 | 2014 | 2015 | 2014 |
Class K | | | | |
Shares sold | 5,815 | 5,696 | $ 269,619 | $ 243,726 |
Reinvestment of distributions | 222 | 213 | 10,315 | 8,572 |
Shares redeemed | (10,500) | (7,002) | (487,892) | (299,752) |
Net increase (decrease) | (4,463) | (1,093) | $ (207,958) | $ (47,454) |
11. Other.
The Fund's organizational documents provide former and current trustees and officers with a limited indemnification against liabilities arising in connection with the performance of their duties to the Fund. In the normal course of business, the Fund may also enter into contracts that provide general indemnifications. The Fund's maximum exposure under these arrangements is unknown as this would be dependent on future claims that may be made against the Fund. The risk of material loss from such claims is considered remote.
Annual Report
To the Trustees of Fidelity Securities Fund and the Shareholders of Fidelity Leveraged Company Stock Fund:
In our opinion, the accompanying statement of assets and liabilities, including the schedule of investments, and the related statements of operations and of changes in net assets and the financial highlights present fairly, in all material respects, the financial position of Fidelity Leveraged Company Stock Fund (a fund of Fidelity Securities Fund) at July 31, 2015, the results of its operations for the year then ended, the changes in its net assets for each of the two years in the period then ended and the financial highlights for each of the five years in the period then ended, in conformity with accounting principles generally accepted in the United States of America. These financial statements and financial highlights (hereafter referred to as "financial statements") are the responsibility of the Fidelity Leveraged Company Stock Fund's management. Our responsibility is to express an opinion on these financial statements based on our audits. We conducted our audits of these financial statements in accordance with the standards of the Public Company Accounting Oversight Board (United States). Those standards require that we plan and perform the audit to obtain reasonable assurance about whether the financial statements are free of material misstatement. An audit includes examining, on a test basis, evidence supporting the amounts and disclosures in the financial statements, assessing the accounting principles used and significant estimates made by management, and evaluating the overall financial statement presentation. We believe that our audits, which included confirmation of securities at July 31, 2015 by correspondence with the custodian and brokers, provide a reasonable basis for our opinion.
PricewaterhouseCoopers LLP
Boston, Massachusetts
September 17, 2015
Annual Report
The Trustees, Member of the Advisory Board, and officers of the trust and fund, as applicable, are listed below. The Board of Trustees governs the fund and is responsible for protecting the interests of shareholders. The Trustees are experienced executives who meet periodically throughout the year to oversee the fund's activities, review contractual arrangements with companies that provide services to the fund, oversee management of the risks associated with such activities and contractual arrangements, and review the fund's performance. Each of the Trustees oversees 170 funds.
The Trustees hold office without limit in time except that (a) any Trustee may resign; (b) any Trustee may be removed by written instrument, signed by at least two-thirds of the number of Trustees prior to such removal; (c) any Trustee who requests to be retired or who has become incapacitated by illness or injury may be retired by written instrument signed by a majority of the other Trustees; and (d) any Trustee may be removed at any special meeting of shareholders by a two-thirds vote of the outstanding voting securities of the trust. Each Trustee who is not an interested person (as defined in the 1940 Act) of the trust and the fund (Independent Trustee), shall retire not later than the last day of the calendar year in which his or her 75th birthday occurs. The Independent Trustees may waive this mandatory retirement age policy with respect to individual Trustees. The officers and Advisory Board Member hold office without limit in time, except that any officer and Advisory Board Member may resign or may be removed by a vote of a majority of the Trustees at any regular meeting or any special meeting of the Trustees. Except as indicated, each individual has held the office shown or other offices in the same company for the past five years.
Experience, Skills, Attributes, and Qualifications of the Fund's Trustees. The Governance and Nominating Committee has adopted a statement of policy that describes the experience, qualifications, attributes, and skills that are necessary and desirable for potential Independent Trustee candidates (Statement of Policy). The Board believes that each Trustee satisfied at the time he or she was initially elected or appointed a Trustee, and continues to satisfy, the standards contemplated by the Statement of Policy. The Governance and Nominating Committee also engages professional search firms to help identify potential Independent Trustee candidates who have the experience, qualifications, attributes, and skills consistent with the Statement of Policy. From time to time, additional criteria based on the composition and skills of the current Independent Trustees, as well as experience or skills that may be appropriate in light of future changes to board composition, business conditions, and regulatory or other developments, have also been considered by the professional search firms and the Governance and Nominating Committee. In addition, the Board takes into account the Trustees' commitment and participation in Board and committee meetings, as well as their leadership of standing and ad hoc committees throughout their tenure.
In determining that a particular Trustee was and continues to be qualified to serve as a Trustee, the Board has considered a variety of criteria, none of which, in isolation, was controlling. The Board believes that, collectively, the Trustees have balanced and diverse experience, qualifications, attributes, and skills, which allow the Board to operate effectively in governing the fund and protecting the interests of shareholders. Information about the specific experience, skills, attributes, and qualifications of each Trustee, which in each case led to the Board's conclusion that the Trustee should serve (or continue to serve) as a trustee of the fund, is provided below.
Annual Report
Board Structure and Oversight Function. James C. Curvey is an interested person (as defined in the 1940 Act) and currently serves as Chairman. The Trustees have determined that an interested Chairman is appropriate and benefits shareholders because an interested Chairman has a personal and professional stake in the quality and continuity of services provided to the fund. Independent Trustees exercise their informed business judgment to appoint an individual of their choosing to serve as Chairman, regardless of whether the Trustee happens to be independent or a member of management. The Independent Trustees have determined that they can act independently and effectively without having an Independent Trustee serve as Chairman and that a key structural component for assuring that they are in a position to do so is for the Independent Trustees to constitute a substantial majority for the Board. The Independent Trustees also regularly meet in executive session. Ned C. Lautenbach serves as Chairman of the Independent Trustees and as such (i) acts as a liaison between the Independent Trustees and management with respect to matters important to the Independent Trustees and (ii) with management prepares agendas for Board meetings.
Fidelity funds are overseen by different Boards of Trustees. The fund's Board oversees Fidelity's high income and certain equity funds and other Boards oversee Fidelity's investment-grade bond, money market, asset allocation, and sector funds. The asset allocation funds may invest in Fidelity funds overseen by the fund's Board. The use of separate Boards, each with its own committee structure, allows the Trustees of each group of Fidelity funds to focus on the unique issues of the funds they oversee, including common research, investment, and operational issues. On occasion, the separate Boards establish joint committees to address issues of overlapping consequences for the Fidelity funds overseen by each Board.
The Trustees operate using a system of committees to facilitate the timely and efficient consideration of all matters of importance to the Trustees, the fund, and fund shareholders and to facilitate compliance with legal and regulatory requirements and oversight of the fund's activities and associated risks. The Board, acting through its committees, has charged FMR and its affiliates with (i) identifying events or circumstances the occurrence of which could have demonstrably adverse effects on the fund's business and/or reputation; (ii) implementing processes and controls to lessen the possibility that such events or circumstances occur or to mitigate the effects of such events or circumstances if they do occur; and (iii) creating and maintaining a system designed to evaluate continuously business and market conditions in order to facilitate the identification and implementation processes described in (i) and (ii) above. Because the day-to-day operations and activities of the fund are carried out by or through FMR, its affiliates and other service providers, the fund's exposure to risks is mitigated but not eliminated by the processes overseen by the Trustees. While each of the Board's committees has responsibility for overseeing different aspects of the fund's activities, oversight is exercised primarily through the Operations, Audit, and Compliance Committees. In addition, the Independent Trustees have worked with FMR to enhance the Board's oversight of investment and financial risks, legal and regulatory risks, technology risks, and operational risks, including the development of additional risk reporting to the Board. For example, a working group comprised of Independent Trustees and FMR has worked and continues to work to review the Fidelity funds' valuation-related activities, reporting and risk management. Appropriate personnel, including but not limited to the fund's Chief Compliance Officer (CCO), FMR's internal auditor, the independent accountants, the fund's Treasurer and portfolio management personnel, make periodic reports to the Board's committees, as appropriate, including an annual review of FMR's risk management program for the Fidelity funds. The responsibilities of each standing committee, including their oversight responsibilities, are described further under "Standing Committees of the Fund's Trustees."
Annual Report
Trustees and Officers - continued
The fund's Statement of Additional Information (SAI) includes more information about the Trustees. To request a free copy, call Fidelity at 1-800-544-8544.
Interested Trustees*:
Correspondence intended for each Trustee who is an interested person may be sent to Fidelity Investments, 245 Summer Street, Boston, Massachusetts 02210.
Name, Year of Birth; Principal Occupations and Other Relevant Experience+ |
James C. Curvey (1935) |
Year of Election or Appointment: 2007 Trustee Chairman of the Board of Trustees |
| Mr. Curvey also serves as Trustee of other Fidelity funds. Mr. Curvey is a Director of Fidelity Research & Analysis Co. (investment adviser firm, 2009-present), and Vice Chairman (2007-present) and Director of FMR LLC (diversified financial services company). In addition, Mr. Curvey serves as an Overseer for the Boston Symphony Orchestra and a member of the board of Artis-Naples, Naples, Florida, and as a Trustee for Brewster Academy, Wolfeboro, New Hampshire. Previously, Mr. Curvey served as a Director of Fidelity Investments Money Management, Inc. (investment adviser firm, 2009-2014), a Director of FMR (investment adviser firm, 2007-2014), and a Director of FMR Co., Inc. (investment adviser firm, 2007-2014). |
Charles S. Morrison (1960) |
Year of Election or Appointment: 2014 Trustee |
| Mr. Morrison also serves as Trustee of other funds. He serves as a Director of Fidelity Investments Money Management, Inc. (FIMM) (investment adviser firm, 2014-present), Director of Fidelity SelectCo, LLC (investment adviser firm, 2014-present), President, Asset Management (2014-present), and is an employee of Fidelity Investments. Previously, Mr. Morrison served as Vice President of Fidelity's Fixed Income and Asset Allocation Funds (2012-2014), President, Fixed Income (2011-2014), Vice President of Fidelity's Money Market Funds (2005-2009), President, Money Market Group Leader of FMR (investment adviser firm, 2009), and Senior Vice President, Money Market Group of FMR (2004-2009). Mr. Morrison also served as Vice President of Fidelity's Bond Funds (2002-2005), certain Balanced Funds (2002-2005), and certain Asset Allocation Funds (2002-2007), and as Senior Vice President (2002-2005) of Fidelity's Bond Division. |
* Trustees have been determined to be "Interested Trustees" by virtue of, among other things, their affiliation with the trust or various entities under common control with FMR.
+ The information above includes each Trustee's principal occupation during the last five years and other information relating to the experience, attributes, and skills relevant to each Trustee's qualifications to serve as a Trustee, which led to the conclusion that each Trustee should serve as a Trustee for the fund.
Annual Report
Trustees and Officers - continued
Independent Trustees:
Correspondence intended for each Independent Trustee (that is, the Trustees other than the Interested Trustees) may be sent to Fidelity Investments, P.O. Box 55235, Boston, Massachusetts 02205-5235.
Name, Year of Birth; Principal Occupations and Other Relevant Experience+ |
Dennis J. Dirks (1948) |
Year of Election or Appointment: 2005 Trustee |
| Mr. Dirks also serves as Trustee of other Fidelity funds. Prior to his retirement in May 2003, Mr. Dirks was Chief Operating Officer and a member of the Board of The Depository Trust & Clearing Corporation (DTCC). He also served as President, Chief Operating Officer, and Board member of The Depository Trust Company (DTC) and President and Board member of the National Securities Clearing Corporation (NSCC). In addition, Mr. Dirks served as Chief Executive Officer and Board member of the Government Securities Clearing Corporation, Chief Executive Officer and Board member of the Mortgage-Backed Securities Clearing Corporation, as a Trustee and a member of the Finance Committee of Manhattan College (2005-2008), and as a Trustee and a member of the Finance Committee of AHRC of Nassau County (2006-2008). Mr. Dirks is a member of the Independent Directors Council (IDC) Governing Council (2010-present) and Board of Directors for The Brookville Center for Children's Services, Inc. (2009-present). |
Alan J. Lacy (1953) |
Year of Election or Appointment: 2008 Trustee |
| Mr. Lacy also serves as Trustee of other Fidelity funds. Mr. Lacy serves as a member of the Board of Directors of Dave & Buster's Entertainment, Inc. (restaurant and entertainment complexes, 2010-present) and Bristol-Myers Squibb Company (global pharmaceuticals, 2008-present). In addition, Mr. Lacy served as Senior Adviser (2007-2014) of Oak Hill Capital Partners, L.P. (private equity) and also served as Chief Executive Officer (2000-2005) and Vice Chairman (2005-2006) of Sears Holdings Corporation and Sears, Roebuck and Co. (retail). Mr. Lacy is a member of the Board of Trustees of The National Parks Conservation Association (2006-present). Previously, Mr. Lacy served as Chairman of the Board of Trustees of the National Parks Conservation Association (2008-2011) and as a member of the Board of Directors for The Western Union Company (global money transfer, 2006-2011), The Hillman Companies, Inc. (hardware wholesalers, 2010-2014), and Earth Fare, Inc. (retail grocery, 2010-2014). |
Ned C. Lautenbach (1944) |
Year of Election or Appointment: 2000 Trustee Chairman of the Independent Trustees |
| Mr. Lautenbach also serves as Trustee of other Fidelity funds. Mr. Lautenbach currently serves as the Lead Director of the Eaton Corporation Board of Directors (diversified industrial, 1997-present). Mr. Lautenbach is Chairman of the Board of Directors of Artis-Naples in Naples, Florida (2012-present), a member of the Council on Foreign Relations (1994-present), and a member of the Board of Governors, State University System of Florida (2013-present). Previously, Mr. Lautenbach was a Partner/Advisory Partner at Clayton, Dubilier & Rice, LLC (private equity investment, 1998-2010), as well as a Director of Sony Corporation (2006-2007). |
Joseph Mauriello (1944) |
Year of Election or Appointment: 2008 Trustee |
| Mr. Mauriello also serves as Trustee of other Fidelity funds. Prior to his retirement in January 2006, Mr. Mauriello served in numerous senior management positions including Deputy Chairman and Chief Operating Officer (2004-2005), and Vice Chairman of Financial Services (2002-2004) of KPMG LLP US (professional services, 1965-2005). Mr. Mauriello currently serves as a member of the Board of Directors of XL Group plc. (global insurance and re-insurance, 2006-present). Previously, Mr. Mauriello served as a Director of the Hamilton Funds of the Bank of New York (2006-2007) and of Arcadia Resources Inc. (health care services and products, 2007-2012). |
Robert W. Selander (1950) |
Year of Election or Appointment: 2011 Trustee |
| Mr. Selander also serves as Trustee of other Fidelity funds. Mr. Selander serves as a Director of The Western Union Company (global money transfer, 2014-present). Previously, Mr. Selander served as a Member of the Advisory Board of other Fidelity funds (2011), and Executive Vice Chairman (2010), Chief Executive Officer (2009-2010), and President and Chief Executive Officer (1997-2009) of Mastercard, Inc. |
Cornelia M. Small (1944) |
Year of Election or Appointment: 2005 Trustee |
| Ms. Small also serves as Trustee of other Fidelity funds. Ms. Small is a member of the Board of Directors (2009-present) and Chair of the Investment Committee (2010-present) of the Teagle Foundation. Ms. Small also serves on the Investment Committee of the Berkshire Taconic Community Foundation (2008-present). Previously, Ms. Small served as Chairperson (2002-2008) and a member of the Investment Committee and Chairperson (2008-2012) and a member of the Board of Trustees of Smith College. In addition, Ms. Small served as Chief Investment Officer, Director of Global Equity Investments, and a member of the Board of Directors of Scudder, Stevens & Clark and Scudder Kemper Investments. |
William S. Stavropoulos (1939) |
Year of Election or Appointment: 2002 Trustee Vice Chairman of the Independent Trustees |
| Mr. Stavropoulos also serves as Trustee of other Fidelity funds. Mr. Stavropoulos serves as President and Founder of the Michigan Baseball Foundation, the Great Lakes Loons (2007-present). Mr. Stavropoulos is Chairman Emeritus of the Board of Directors of The Dow Chemical Company, where he previously served in numerous senior management positions, including President, CEO (1995-2000; 2002-2004), Chairman of the Executive Committee (2000-2006), and as a member of the Board of Directors (1990-2006). Currently, Mr. Stavropoulos is Chairman of the Board of Directors of Univar Inc. (global distributor of commodity and specialty chemicals), a Director of Teradata Corporation (data warehousing and technology solutions), and Maersk Inc. (industrial conglomerate), and a member of the Advisory Board for Metalmark Capital LLC (private equity investment, 2005-present). Mr. Stavropoulos is an operating advisor to Clayton, Dubilier & Rice, LLC (private equity investment). In addition, Mr. Stavropoulos is a member of the University of Notre Dame Advisory Council for the College of Science, a Trustee of the Rollin L. Gerstacker Foundation, and a Director of the Naples Philharmonic Center for the Arts. Previously, Mr. Stavropoulos served as a Director of Chemical Financial Corporation (bank holding company, 1993-2012) and Tyco International, Ltd. (multinational manufacturing and services, 2007-2012). |
David M. Thomas (1949) |
Year of Election or Appointment: 2008 Trustee |
| Mr. Thomas also serves as Trustee of other Fidelity funds. Mr. Thomas serves as Non-Executive Chairman of the Board of Directors of Fortune Brands Home and Security (home and security products, 2011-present), as a member of the Board of Directors (2004-present) and Presiding Director (2013-present) of Interpublic Group of Companies, Inc. (marketing communication), and as a member of the Board of Trustees of the University of Florida (2013-present). Previously, Mr. Thomas served as Executive Chairman (2005-2006) and Chairman and Chief Executive Officer (2000-2005) of IMS Health, Inc. (pharmaceutical and healthcare information solutions), and a Director of Fortune Brands, Inc. (consumer products, 2000-2011). |
+ The information above includes each Trustee's principal occupation during the last five years and other information relating to the experience, attributes, and skills relevant to each Trustee's qualifications to serve as a Trustee, which led to the conclusion that each Trustee should serve as a Trustee for the fund.
Advisory Board Member and Officers:
Correspondence intended for each officer and Peter S. Lynch may be sent to Fidelity Investments, 245 Summer Street, Boston, Massachusetts 02210. Officers appear below in alphabetical order.
Name, Year of Birth; Principal Occupation |
Peter S. Lynch (1944) |
Year of Election or Appointment: 2003 Member of the Advisory Board |
| Mr. Lynch also serves as Member of the Advisory Board of other Fidelity funds. Mr. Lynch is Vice Chairman and a Director of FMR (investment adviser firm) and FMR Co., Inc. (investment adviser firm). In addition, Mr. Lynch serves as a Trustee of Boston College and as the Chairman of the Inner-City Scholarship Fund. Previously, Mr. Lynch served on the Special Olympics International Board of Directors (1997-2006). |
Elizabeth Paige Baumann (1968) |
Year of Election or Appointment: 2012 Anti-Money Laundering (AML) Officer |
| Ms. Baumann also serves as AML Officer of other funds. She is Chief AML Officer of FMR LLC (diversified financial services company, 2012-present) and is an employee of Fidelity Investments. Previously, Ms. Baumann served as Vice President and Deputy Anti-Money Laundering Officer (2007-2012). |
Marc Bryant (1966) |
Year of Election or Appointment: 2015 Secretary and Chief Legal Officer (CLO) |
| Mr. Bryant also serves as Secretary and Chief Legal Officer (CLO) of other funds. He is Senior Vice President and Deputy General Counsel of FMR LLC (diversified financial services company). Previously, Mr. Bryant served as Secretary and Chief Legal Officer of Fidelity Rutland Square Trust II (2010-2014) and Assistant Secretary of Fidelity's Fixed Income and Asset Allocation Funds (2013-2015). Prior to joining Fidelity Investments, Mr. Bryant served as a Senior Vice President and the Head of Global Retail Legal for AllianceBernstein L.P. (2006-2010), and as the General Counsel for ProFund Advisors LLC (2001-2006). |
William C. Coffey (1969) |
Year of Election or Appointment: 2009 Assistant Secretary |
| Mr. Coffey also serves as Assistant Secretary of other funds. He is Senior Vice President and Deputy General Counsel of FMR LLC (diversified financial services company, 2010-present), and is an employee of Fidelity Investments. Previously, Mr. Coffey served as Vice President and Associate General Counsel of FMR LLC (2005-2009). |
Jonathan Davis (1968) |
Year of Election or Appointment: 2010 Assistant Treasurer |
| Mr. Davis also serves as Assistant Treasurer of other funds. Mr. Davis is an employee of Fidelity Investments. Previously, Mr. Davis served as Vice President and Associate General Counsel of FMR LLC (diversified financial services company, 2003-2010). |
Adrien E. Deberghes (1967) |
Year of Election or Appointment: 2008 Deputy Treasurer |
| Mr. Deberghes also serves as an officer of other funds. He is an employee of Fidelity Investments (2008-present). Prior to joining Fidelity Investments, Mr. Deberghes was Senior Vice President of Mutual Fund Administration at State Street Corporation (2007-2008), Senior Director of Mutual Fund Administration at Investors Bank & Trust (2005-2007), and Director of Finance for Dunkin' Brands (2000-2005). |
Stephanie J. Dorsey (1969) |
Year of Election or Appointment: 2010 Assistant Treasurer |
| Ms. Dorsey also serves as an officer of other funds. She is an employee of Fidelity Investments (2008-present) and has served in other fund officer roles. Prior to joining Fidelity Investments, Ms. Dorsey served as Treasurer (2004-2008) of the JPMorgan Mutual Funds and Vice President (2004-2008) of JPMorgan Chase Bank. |
Howard J. Galligan III (1966) |
Year of Election or Appointment: 2014 Chief Financial Officer |
| Mr. Galligan also serves as Chief Financial Officer of other funds. Mr. Galligan serves as President of Fidelity Pricing and Cash Management Services (FPCMS) (2014-present) and as a Director of Strategic Advisers, Inc. (investment adviser firm, 2008-present). Previously, Mr. Galligan served as Chief Administrative Officer of Asset Management (2011-2014) and Chief Operating Officer and Senior Vice President of Investment Support for Strategic Advisers, Inc. (2003-2011). |
Scott C. Goebel (1968) |
Year of Election or Appointment: 2015 Vice President |
| Mr. Goebel serves as an officer of other funds. Mr. Goebel also serves as Secretary of Fidelity SelectCo, LLC (investment adviser firm, 2013-present), Fidelity Investments Money Management, Inc. (FIMM) (investment adviser firm, 2010-present) and Fidelity Research and Analysis Company (FRAC) (investment adviser firm, 2010-present); General Counsel, Secretary, and Senior Vice President of FMR (investment adviser firm, 2008-present) and FMR Co., Inc. (investment adviser firm, 2008-present); Chief Legal Officer of Fidelity Management & Research (Hong Kong) Limited (investment adviser firm, 2008-present); and Assistant Secretary of Fidelity Management & Research (Japan) Limited (investment adviser firm, 2008-present) and FMR Investment Management (U.K.) Limited (investment adviser firm, 2008-present). Previously, Mr. Goebel served as Secretary and CLO of certain Fidelity funds (2008-2015), Assistant Secretary of FIMM (2008-2010), FRAC (2008-2010), and certain funds (2007-2008); and as Vice President and Secretary of Fidelity Distributors Corporation (FDC) (2005-2007). Mr. Goebel has been employed by FMR LLC (diversified financial services company) or an affiliate since 2001. |
Brian B. Hogan (1964) |
Year of Election or Appointment: 2009 Vice President |
| Mr. Hogan also serves as Trustee or Vice President of other funds. Mr. Hogan serves as a Director of Fidelity SelectCo, LLC (investment adviser firm, 2014-present) and President of the Equity Division of FMR (investment adviser firm, 2009-present). Previously, Mr. Hogan served as Senior Vice President, Equity Research of FMR (2006-2009) and as a portfolio manager. |
Chris Maher (1972) |
Year of Election or Appointment: 2013 Assistant Treasurer |
| Mr. Maher serves as Assistant Treasurer of other funds. Mr. Maher is Vice President of Valuation Oversight and is an employee of Fidelity Investments. Previously, Mr. Maher served as Vice President of Asset Management Compliance (2013), Vice President of the Program Management Group of FMR (investment adviser firm, 2010-2013), and Vice President of Valuation Oversight (2008-2010). |
Melissa M. Reilly (1971) |
Year of Election or Appointment: 2014 Vice President of certain Equity Funds |
<R> | Ms. Reilly also serves as Vice President of other funds. Ms. Reilly is an employee of Fidelity Investments (2004-present).</R> |
Kenneth B. Robins (1969) |
Year of Election or Appointment: 2008 President and Treasurer |
| Mr. Robins also serves as an officer of other funds. Mr. Robins serves as Executive Vice President of Fidelity Investments Money Management, Inc. (FIMM) (investment adviser firm, 2013-present) and is an employee of Fidelity Investments (2004-present). Previously, Mr. Robins served in other fund officer roles. |
Stephen Sadoski (1971) |
Year of Election or Appointment: 2012 Deputy Treasurer |
| Mr. Sadoski also serves as Deputy Treasurer of other funds. He is an employee of Fidelity Investments (2012-present) and has served in another fund officer role. Prior to joining Fidelity Investments, Mr. Sadoski served as an assistant chief accountant in the Division of Investment Management of the Securities and Exchange Commission (SEC) (2009-2012) and as a senior manager at Deloitte & Touche LLP (1997-2009). |
Stacie M. Smith (1974) |
Year of Election or Appointment: 2013 Deputy Treasurer |
| Ms. Smith also serves as an officer of other funds. She is an employee of Fidelity Investments (2009-present) and has served in other fund officer roles. Prior to joining Fidelity Investments, Ms. Smith served as Senior Audit Manager of Ernst & Young LLP (1996-2009). |
Renee Stagnone (1975) |
Year of Election or Appointment: 2013 Deputy Treasurer |
| Ms. Stagnone also serves as Deputy Treasurer of other funds. Ms. Stagnone is an employee of Fidelity Investments. |
Linda J. Wondrack (1964) |
Year of Election or Appointment: 2014 Chief Compliance Officer |
| Ms. Wondrack also serves as Chief Compliance Officer of other funds. Ms. Wondrack is Executive Vice President and head of the Ethics Office and Asset Management Compliance for Fidelity Investments (2012-present). Ms. Wondrack also serves as Chief Compliance Officer of Fidelity SelectCo, LLC (investment adviser firm, 2014-present); Chief Compliance Officer of Impresa Management LLC (2013-present); and Chief Compliance Officer of FMR Co., Inc. (investment adviser firm), Fidelity Investments Money Management, Inc. (investment adviser firm), Fidelity Management & Research (Japan) Limited (investment adviser firm), FMR Investment Management (U.K.) Limited (investment adviser firm), Fidelity Management & Research (Hong Kong) (investment adviser firm), Fidelity Management & Research Company (investment adviser firm), Pyramis Global Advisors, LLC (investment adviser firm), and Strategic Advisers, Inc. (investment adviser firm), Ballyrock Investment Advisors LLC, and Northern Neck Investors LLC (2012-present). Previously, Ms. Wondrack served as Senior Vice President and Chief Compliance Officer for Columbia Management Investment Advisers, LLC (2005-2012); Chief Compliance Officer for certain funds within the Columbia Family of Funds (2007-2012); and Senior Vice President of Compliance Risk Management at Bank of America (2005-2010). |
Joseph F. Zambello (1957) |
Year of Election or Appointment: 2011 Deputy Treasurer |
| Mr. Zambello also serves as Deputy Treasurer of other funds. Mr. Zambello is an employee of Fidelity Investments. Previously, Mr. Zambello served as Vice President of the Program Management Group of FMR (investment adviser firm, 2009-2011) and Vice President of the Transfer Agent Oversight Group (2005-2009). |
Annual Report
The Board of Trustees of Fidelity Leveraged Company Stock Fund voted to pay to shareholders of record at the opening of business on record date, the following distributions per share derived from capital gains realized from sales of portfolio securities, and dividends derived from net investment income:
| Pay Date | Record Date | Dividends | Capital Gains |
Leveraged Company Stock | 09/14/15 | 09/11/15 | $ 0.218 | $ 1.642 |
The fund hereby designates as a capital gain dividend with respect to the taxable year ended July 31, 2015, $179,866,042, or, if subsequently determined to be different, the net capital gain of such year.
Leveraged Company Stock designates 100% of the dividends distributed during the fiscal year as qualifying for the dividends-received deduction for corporate shareholders.
Leveraged Company Stock designates 100% of the dividends distributed during the fiscal year as amounts which may be taken into account as a dividend for the purposes of the maximum rate under section 1(h)(11) of the Internal Revenue Code.
The fund will notify shareholders in January 2016 of amounts for use in preparing 2015 income tax returns.
Annual Report
Fidelity Leveraged Company Stock Fund
Each year, the Board of Trustees, including the Independent Trustees (together, the Board), votes on the renewal of the management contract with Fidelity Management & Research Company (FMR) and the sub-advisory agreements (together, the Advisory Contracts) for the fund. The Board, assisted by the advice of fund counsel and Independent Trustees' counsel, requests and considers a broad range of information relevant to the renewal of the Advisory Contracts throughout the year.
The Board meets regularly and, at each of its meetings, covers an extensive agenda of topics and materials and considers factors that are relevant to its annual consideration of the renewal of the fund's Advisory Contracts, including the services and support provided to the fund and its shareholders. The Board has established various standing committees (Committees), each composed of and chaired by Independent Trustees with varying backgrounds, to which the Board has assigned specific subject matter responsibilities in order to enhance effective decision-making by the Board. The Board, acting directly and through its Committees, requests and receives information concerning the annual consideration of the renewal of the fund's Advisory Contracts. The Board also meets as needed to consider matters specifically related to the Board's annual consideration of the renewal of the Advisory Contracts. Members of the Board may also meet with trustees of other Fidelity funds through ad hoc joint committees to discuss certain matters relevant to all of the Fidelity funds.
At its July 2015 meeting, the Board unanimously determined to renew the fund's Advisory Contracts. In reaching its determination, the Board considered all factors it believed relevant, including (i) the nature, extent, and quality of the services to be provided to the fund and its shareholders (including the investment performance of the fund); (ii) the competitiveness of the fund's management fee and total expense ratio relative to peer funds; (iii) the total costs of the services to be provided by and the profits to be realized by Fidelity from its relationship with the fund; and (iv) the extent to which (if any) economies of scale exist and would be realized as the fund grows, and whether any economies of scale are appropriately shared with fund shareholders.
In considering whether to renew the Advisory Contracts for the fund, the Board reached a determination, with the assistance of fund counsel and Independent Trustees' counsel and through the exercise of its business judgment, that the renewal of the Advisory Contracts was in the best interests of the fund and its shareholders and that the compensation payable under the Advisory Contracts was fair and reasonable. The Board's decision to renew the Advisory Contracts was not based on any single factor, but rather was based on a comprehensive consideration of all the information provided to the Board at its meetings throughout the year. The Board, in reaching its determination to renew the Advisory Contracts, was aware that shareholders of the fund have a broad range of investment choices available to them, including a wide choice among funds offered by Fidelity's competitors, and that the fund's shareholders, who have the opportunity to review and weigh the disclosure provided by the fund in its prospectus and other public disclosures, have chosen to invest in this fund, which is part of the Fidelity family of funds.
Annual Report
Nature, Extent, and Quality of Services Provided. The Board considered Fidelity's staffing as it relates to the fund, including the backgrounds of investment personnel of Fidelity, and also considered the fund's investment objective, strategies, and related investment philosophy. The Independent Trustees also had discussions with senior management of Fidelity's investment operations and investment groups. The Board considered the structure of the portfolio manager compensation program and whether this structure provides appropriate incentives to act in the best interests of the fund. Additionally, the Board considered the portfolio managers' investments, if any, in the funds that they manage.
Resources Dedicated to Investment Management and Support Services. The Board and the Fund Oversight and Research Committees reviewed the general qualifications and capabilities of Fidelity's investment staff, including its size, education, experience, and resources, as well as Fidelity's approach to recruiting, training, managing, and compensating investment personnel. The Board noted that Fidelity has continued to increase the resources devoted to non-U.S. offices, including expansion of Fidelity's global investment organization. The Board also noted that Fidelity's analysts have extensive resources, tools and capabilities that allow them to conduct sophisticated quantitative and fundamental analysis, as well as credit analysis of issuers, counterparties and guarantors. Further, the Board considered that Fidelity's investment professionals have sufficient access to global information and data so as to provide competitive investment results over time, and that those professionals also have access to sophisticated tools that permit them to assess portfolio construction and risk and performance attribution characteristics continuously, as well as to transmit new information and research conclusions rapidly around the world. Additionally, in its deliberations, the Board considered Fidelity's trading, risk management, and compliance capabilities and resources, which are integral parts of the investment management process.
Shareholder and Administrative Services. The Board considered (i) the nature, extent, quality, and cost of advisory, administrative, and shareholder services performed by FMR, the sub-advisers (together with FMR, the Investment Advisers), and their affiliates under the Advisory Contracts and under separate agreements covering transfer agency, pricing and bookkeeping, and securities lending services for the fund; (ii) the nature and extent of the supervision of third party service providers, principally custodians and subcustodians; and (iii) the resources devoted to, and the record of compliance with, the fund's compliance policies and procedures. The Board also reviewed the allocation of fund brokerage, including allocations to brokers affiliated with the Investment Advisers, the use of brokerage commissions to pay fund expenses, and the use of "soft" commission dollars to pay for research services.
Annual Report
Board Approval of Investment Advisory Contracts and
Management Fees - continued
The Board noted that the growth of fund assets over time across the complex allows Fidelity to reinvest in the development of services designed to enhance the value or convenience of the Fidelity funds as investment vehicles. These services include 24-hour access to account information and market information through telephone representatives and over the Internet, investor education materials and asset allocation tools, and the expanded availability of Fidelity Investor Centers.
In 2014, the Board formed an ad hoc Committee on Transfer Agency Fees to review the variety of transfer agency fee structures throughout the industry and Fidelity's competitive positioning with respect to industry participants.
Investment in a Large Fund Family. The Board considered the benefits to shareholders of investing in a Fidelity fund, including the benefits of investing in a fund that is part of a large family of funds offering a variety of investment disciplines and providing a large variety of mutual fund investor services. The Board noted that Fidelity had taken, or had made recommendations that resulted in the Fidelity funds taking, a number of actions over the previous year that benefited particular funds, including (i) continuing to dedicate additional resources to investment research and to the support of the senior management team that oversees asset management; (ii) continuing efforts to enhance Fidelity's global research capabilities; (iii) launching new funds and making other enhancements to meet client needs; (iv) reducing management fees and total expenses for certain index funds and diversified international funds; (v) continuing to launch dedicated lower cost underlying funds to meet portfolio construction needs related to expanding underlying fund options for Fidelity funds of funds, specifically for the Freedom Fund product lines; (vi) rationalizing product lines and gaining increased efficiencies through fund mergers; (vii) launching active fixed-income exchange-traded funds; (viii) continuing to develop, acquire and implement systems and technology to improve services to the funds and information security and to increase efficiency; (ix) implementing investment enhancements to further strengthen Fidelity's target date product line to increase investors' probability of success in achieving their goals; (x) modifying the eligibility criteria for certain share classes to accommodate roll-over assets from employer-sponsored retirement plans; (xi) launching a new Class W of the Freedom Index Funds to attract and retain Fidelity record-kept retirement plan assets; and (xii) implementing changes to Fidelity's money market product line in response to recent money market regulatory reforms.
Investment Performance. The Board considered whether the fund has operated in accordance with its investment objective, as well as its record of compliance with its investment restrictions and its performance history.
Annual Report
The Board took into account discussions with representatives of the Investment Advisers about fund investment performance that occur at Board meetings throughout the year. In this regard the Board noted that as part of regularly scheduled fund reviews and other reports to the Board on fund performance, the Board considers annualized return information for the fund, for different time periods, measured against a securities market index ("benchmark index") and a peer group of funds with similar objectives ("peer group"), if any. In its evaluation of fund investment performance, the Board gave particular attention to information indicating changes in performance of certain Fidelity funds for specific time periods and discussed with the Investment Advisers the reasons for any overperformance or underperformance.
In addition to reviewing absolute and relative fund performance, the Independent Trustees periodically consider the appropriateness of fund performance metrics in evaluating the results achieved. In general, the Independent Trustees believe that fund performance should be evaluated based on net performance (after fees and expenses) of both the highest performing and lowest performing fund share classes, where applicable, compared to appropriate benchmark indices, over appropriate time periods that may include full market cycles, and compared to peer groups, as applicable, over the same periods, taking into account relevant factors including the following: general market conditions; issuer-specific information; and fund cash flows and other factors.
The Independent Trustees recognize that shareholders evaluate performance on a net basis over their own holding periods, for which one-, three-, and five-year periods are often used as a proxy. For this reason, the performance information reviewed by the Board also included net cumulative calendar year total return information for the fund and an appropriate benchmark index and peer group for the most recent one-, three-, and five-year periods, as shown below. Returns are shown compared to the 25th percentile (top of box, 75% beaten) and 75th percentile (bottom of box, 25% beaten) of the peer universe.
Annual Report
Board Approval of Investment Advisory Contracts and
Management Fees - continued
Fidelity Leveraged Company Stock Fund

Based on its review, the Board concluded that the nature, extent, and quality of services provided to the fund under the Advisory Contracts should benefit the shareholders of the fund.
Competitiveness of Management Fee and Total Expense Ratio. The Board considered the fund's management fee and total expense ratio compared to "mapped groups" of competitive funds and classes created for the purpose of facilitating the Trustees' competitive analysis of management fees and total expenses. Fidelity creates "mapped groups" by combining similar Lipper investment objective categories that have comparable investment mandates. Combining Lipper investment objective categories aids the Board's management fee and total expense ratio comparisons by broadening the competitive group used for comparison.
Management Fee. The Board considered two proprietary management fee comparisons for the 12-month periods shown in basis points (BP) in the chart below. The group of Lipper funds used by the Board for management fee comparisons is referred to below as the "Total Mapped Group." The Total Mapped Group comparison focuses on a fund's standing in terms of gross management fees before expense reimbursements or caps relative to the total universe of funds with comparable investment mandates, regardless of whether their management fee structures also are comparable. Funds with comparable investment mandates offer exposure to similar types of securities. Funds with comparable management fee structures have similar management fee contractual arrangements (e.g., flat rate charged for advisory services, all-inclusive fee rate, etc.). "TMG %" represents the percentage of funds in the Total Mapped Group that had management fees that were lower than the fund's. For example, a hypothetical TMG % of 20% would mean that 80% of the funds in the Total Mapped Group had higher, and 20% had lower, management fees than the fund. The fund's actual TMG %s and the number of funds in the Total Mapped Group are in the chart below. The "Asset-Size Peer Group" (ASPG) comparison focuses on a fund's standing relative to a subset of non-Fidelity funds within the Total Mapped Group that are similar in size and management fee structure without taking into account performance adjustments, if any. For example, if a fund is in the first quartile of the ASPG, the fund's management fee ranks in the least expensive or lowest 25% of funds in the ASPG. The ASPG represents at least 15% of the funds in the Total Mapped Group with comparable asset size and management fee structures, subject to a minimum of 50 funds (or all funds in the Total Mapped Group if fewer than 50). Additional information, such as the ASPG quartile in which the fund's management fee rate ranked, is also included in the chart and considered by the Board.
Annual Report
Fidelity Leveraged Company Stock Fund

The Board noted that the fund's management fee rate ranked below the median of its Total Mapped Group and below the median of its ASPG for 2014.
The Board noted that, in 2014, the ad hoc Committee on Group Fee was formed by it and other Fidelity fund boards to conduct an in-depth review of the "group fee" component of the management fee of funds with such management fee structures. Committee focus included the mechanics of the group fee, the competitive landscape of group fee structures, Fidelity funds with no group fee component and investment products not included in group fee assets. The Board also considered that, for funds subject to the group fee, FMR agreed to voluntarily waive fees over a specified period of time in amounts designed to account for assets converted from certain funds to certain collective investment trusts.
Annual Report
Board Approval of Investment Advisory Contracts and
Management Fees - continued
The Board also noted that, in 2013, the ad hoc Committee on Management Fees was formed to conduct an in-depth review of the management fee rates of Fidelity's active equity mutual funds. The Committee focused on the following areas: (i) standard fee structures; (ii) research consumption and trading evolution; (iii) management fee competitiveness/profitability by category; and (iv) factors that drive institutional pricing.
Based on its review, the Board concluded that the fund's management fee is fair and reasonable in light of the services that the fund receives and the other factors considered.
Total Expense Ratio. In its review of each class's total expense ratio, the Board considered the fund's management fee as well as other fund or class expenses, as applicable, such as transfer agent fees, pricing and bookkeeping fees, and custodial, legal, and audit fees. The Board also noted that Fidelity may agree to waive fees and expenses from time to time, and the extent to which, if any, it has done so for the fund. As part of its review, the Board also considered the current and historical total expense ratios of each class of the fund compared to competitive fund median expenses. Each class of the fund is compared to those funds and classes in the Total Mapped Group (used by the Board for management fee comparisons) that have a similar sales load structure.
The Board noted that the total expense ratio of each class ranked below its competitive median for 2014.
Fees Charged to Other Fidelity Clients. The Board also considered Fidelity fee structures and other information with respect to clients of Fidelity, such as other funds advised or subadvised by Fidelity, pension plan clients, and other institutional clients with similar mandates. The Board noted the findings of the 2013 ad hoc joint committee (created with the board of other Fidelity funds), which reviewed and compared Fidelity's institutional investment advisory business with its business of providing services to the Fidelity funds, including the differences in services provided, fees charged, and costs incurred, as well as competition in their respective marketplaces.
Based on its review of total expense ratios and fees charged to other Fidelity clients, the Board concluded that the total expense ratio of each class of the fund was reasonable in light of the services that the fund and its shareholders receive and the other factors considered.
Costs of the Services and Profitability. The Board considered the revenues earned and the expenses incurred by Fidelity in conducting the business of developing, marketing, distributing, managing, administering and servicing the fund and servicing the fund's shareholders. The Board also considered the level of Fidelity's profits in respect of all the Fidelity funds.
Annual Report
On an annual basis, Fidelity presents to the Board information about the profitability of its relationship with the fund. Fidelity calculates profitability information for each fund, as well as aggregate profitability information for groups of Fidelity funds and all Fidelity funds, using a series of detailed revenue and cost allocation methodologies which originate with the books and records of Fidelity on which Fidelity's audited financial statements are based. The Audit Committee of the Board reviews any significant changes from the prior year's methodologies.
PricewaterhouseCoopers LLP (PwC), independent registered public accounting firm and auditor to Fidelity and certain Fidelity funds, has been engaged annually by the Board as part of the Board's assessment of Fidelity's profitability analysis. PwC's engagement includes the review and assessment of the methodologies used by Fidelity in determining the revenues and expenses attributable to Fidelity's mutual fund business, and completion of agreed-upon procedures in respect of the mathematical accuracy of fund profitability and its conformity to established allocation methodologies. After considering PwC's reports issued under the engagement and information provided by Fidelity, the Board concluded that while other allocation methods may also be reasonable, Fidelity's profitability methodologies are reasonable in all material respects.
The Board also reviewed Fidelity's non-fund businesses and fall-out benefits related to the mutual fund business as well as cases where Fidelity's affiliates may benefit from or be related to the fund's business.
The Board considered the costs of the services provided by and the profits realized by Fidelity in connection with the operation of the fund and was satisfied that the profitability was not excessive.
Economies of Scale. The Board considered whether there have been economies of scale in respect of the management of the Fidelity funds, whether the Fidelity funds (including the fund) have appropriately benefited from any such economies of scale, and whether there is potential for realization of any further economies of scale. The Board considered the extent to which the fund will benefit from economies of scale as assets grow through increased services to the fund, through waivers or reimbursements, or through fee or expense ratio reductions. The Board also noted that in 2013, it and the boards of other Fidelity funds created an ad hoc committee (the Economies of Scale Committee) to analyze whether Fidelity attains economies of scale in respect of the management and servicing of the Fidelity funds, whether the Fidelity funds have appropriately benefited from such economies of scale, and whether there is potential for realization of any further economies of scale.
The Board recognized that the fund's management contract incorporates a "group fee" structure, which provides for lower group fee rates as total group assets increase, and for higher group fee rates as total group assets decrease (with "group assets" defined to include fund assets under FMR's management plus sector fund assets previously under FMR's management and currently managed by Fidelity SelectCo, LLC). FMR calculates the group fee rates based on a tiered asset "breakpoint" schedule that varies based on asset class. The Board considered that the group fee is designed to deliver the benefits of economies of scale to fund shareholders when total Fidelity fund assets increase, even if assets of any particular fund are unchanged or have declined, because some portion of Fidelity's costs are attributable to services provided to all Fidelity funds, and all funds benefit if those costs can be allocated among more assets. The Board concluded that, given the group fee structure, fund shareholders will benefit from lower management fees as group assets increase at the fund complex level, regardless of whether Fidelity achieves any such economies of scale.
Annual Report
Board Approval of Investment Advisory Contracts and
Management Fees - continued
The Board concluded, taking into account the analysis of the Economies of Scale Committee, that economies of scale, if any, are being appropriately shared between fund shareholders and Fidelity.
Additional Information Requested by the Board. In order to develop fully the factual basis for consideration of the Fidelity funds' Advisory Contracts, the Board requested and received additional information on certain topics, including: (i) fund performance trends and Fidelity's long-term strategies for certain funds; (ii) the various share classes employed by Fidelity and the attributes of each class, together with similar information on the distribution and servicing payments made by Fidelity or the funds to third-party participants in the distribution channels; (iii) fund profitability, and fund performance in relation to fund profitability; (iv) the methodology with respect to evaluating competitive fund data and peer group classifications and fee comparisons; (v) annual fund profitability margins, with particular focus on certain funds with negative margins; (vi) the realization of fall-out benefits in certain Fidelity business units; (vii) economies of scale and the way in which they are shared with fund shareholders; (viii) Fidelity's group fee structures, including the group fee schedule of breakpoints; (ix) the impact of cost containment measures on the funds; and (x) the transfer agent fee structure.
Based on its evaluation of all of the conclusions noted above, and after considering all factors it believed relevant, the Board concluded that the advisory fee structures are fair and reasonable, and that the fund's Advisory Contracts should be renewed.
Annual Report
Investment Adviser
Fidelity Management & Research Company
Boston, MA
Investment Sub-Advisers
FMR Co., Inc.
FMR Investment Management
(U.K.) Limited
Fidelity Management & Research
(Hong Kong) Limited
Fidelity Management & Research
(Japan) Limited
General Distributor
Fidelity Distributors Corporation
Smithfield, RI
Transfer and Service Agents
Fidelity Investments Institutional
Operations Company, Inc.
Boston, MA
Fidelity Service Company, Inc.
Boston, MA
Custodian
JPMorgan Chase Bank
New York, NY
The Fidelity Telephone Connection
Mutual Fund 24-Hour Service
Exchanges/Redemptions
and Account Assistance 1-800-544-6666
Product Information 1-800-544-6666
Retirement Accounts 1-800-544-4774
(8 a.m. - 9 p.m.)
TDD Service 1-800-544-0118
for the deaf and hearing impaired
(9 a.m. - 9 p.m. Eastern time)
Fidelity Automated Service
Telephone (FAST®)
1-800-544-5555

Automated line for quickest service
(Fidelity Investment logo)(registered trademark)
Corporate Headquarters
245 Summer St., Boston, MA 02210
www.fidelity.com
LSF-UANN-0915
1.789248.112
Fidelity®
Leveraged Company Stock
Fund -
Class K
Annual Report
July 31, 2015
(Fidelity Cover Art)
Contents
Performance | (Click Here) | How the fund has done over time. |
Management's Discussion of Fund Performance | (Click Here) | The Portfolio Manager's review of fund performance and strategy. |
Shareholder Expense Example | (Click Here) | An example of shareholder expenses. |
Investment Changes | (Click Here) | A summary of major shifts in the fund's investments over the last six months. |
Investments | (Click Here) | A complete list of the fund's investments with their market values. |
Financial Statements | (Click Here) | Statements of assets and liabilities, operations, and changes in net assets, as well as financial highlights. |
Notes | (Click Here) | Notes to the financial statements. |
Report of Independent Registered Public Accounting Firm | (Click Here) | |
Trustees and Officers | (Click Here) | |
Distributions | (Click Here) | |
Board Approval of Investment Advisory Contracts and Management Fees | (Click Here) | |
To view a fund's proxy voting guidelines and proxy voting record for the 12-month period ended June 30, visit http://www.fidelity.com/proxyvotingresults or visit the Securities and Exchange Commission's (SEC) web site at http://www.sec.gov. You may also call 1-800-835-5092 to request a free copy of the proxy voting guidelines.
Standard & Poor's, S&P and S&P 500 are registered service marks of The McGraw-Hill Companies, Inc. and have been licensed for use by Fidelity Distributors Corporation.
Other third-party marks appearing herein are the property of their respective owners.
All other marks appearing herein are registered or unregistered trademarks or service marks of FMR LLC or an affiliated company. © 2015 FMR LLC. All rights reserved.
Annual Report
This report and the financial statements contained herein are submitted for the general information of the shareholders of the fund. This report is not authorized for distribution to prospective investors in the fund unless preceded or accompanied by an effective prospectus.
A fund files its complete schedule of portfolio holdings with the SEC for the first and third quarters of each fiscal year on Form N-Q. Forms N-Q are available on the SEC's web site at http://www.sec.gov. A fund's Forms N-Q may be reviewed and copied at the SEC's Public Reference Room in Washington, DC. Information regarding the operation of the SEC's Public Reference Room may be obtained by calling 1-800-SEC-0330. For a complete list of a fund's portfolio holdings, view the most recent holdings listing, semiannual report, or annual report on Fidelity's web site at http://www.fidelity.com, http://www.advisor.fidelity.com, or http://www.401k.com, as applicable.
NOT FDIC INSURED • MAY LOSE VALUE • NO BANK GUARANTEE
Neither the fund nor Fidelity Distributors Corporation is a bank.
Annual Report
Average annual total return reflects the change in the value of an investment, assuming reinvestment of the class' distributions from dividend income and capital gains (the profits earned upon the sale of securities that have grown in value, if any) and assuming a constant rate of performance each year. The $10,000 table and the fund's returns do not reflect the deduction of taxes that a shareholder would pay on fund distributions or the redemption of fund shares. During periods of reimbursement by Fidelity, a fund's total return will be greater than it would be had the reimbursement not occurred. How a fund did yesterday is no guarantee of how it will do tomorrow.
Average Annual Total Returns
Periods ended July 31, 2015 | Past 1
year | Past 5
years | Past 10
years |
Class K A | 3.26% | 15.76% | 8.46% |
A The initial offering of Class K shares took place on May 9, 2008. Returns prior to May 9, 2008 are those of Fidelity® Leveraged Company Stock Fund, the original class of the fund.
$10,000 Over 10 Years
Let's say hypothetically that $10,000 was invested in Fidelity® Leveraged Company Stock Fund - Class K on July 31, 2005. The chart shows how the value of your investment would have changed, and also shows how the S&P 500® Index performed over the same period. The initial offering of Class K took place on May 9, 2008. See footnote A above for additional information regarding the performance of Class K.
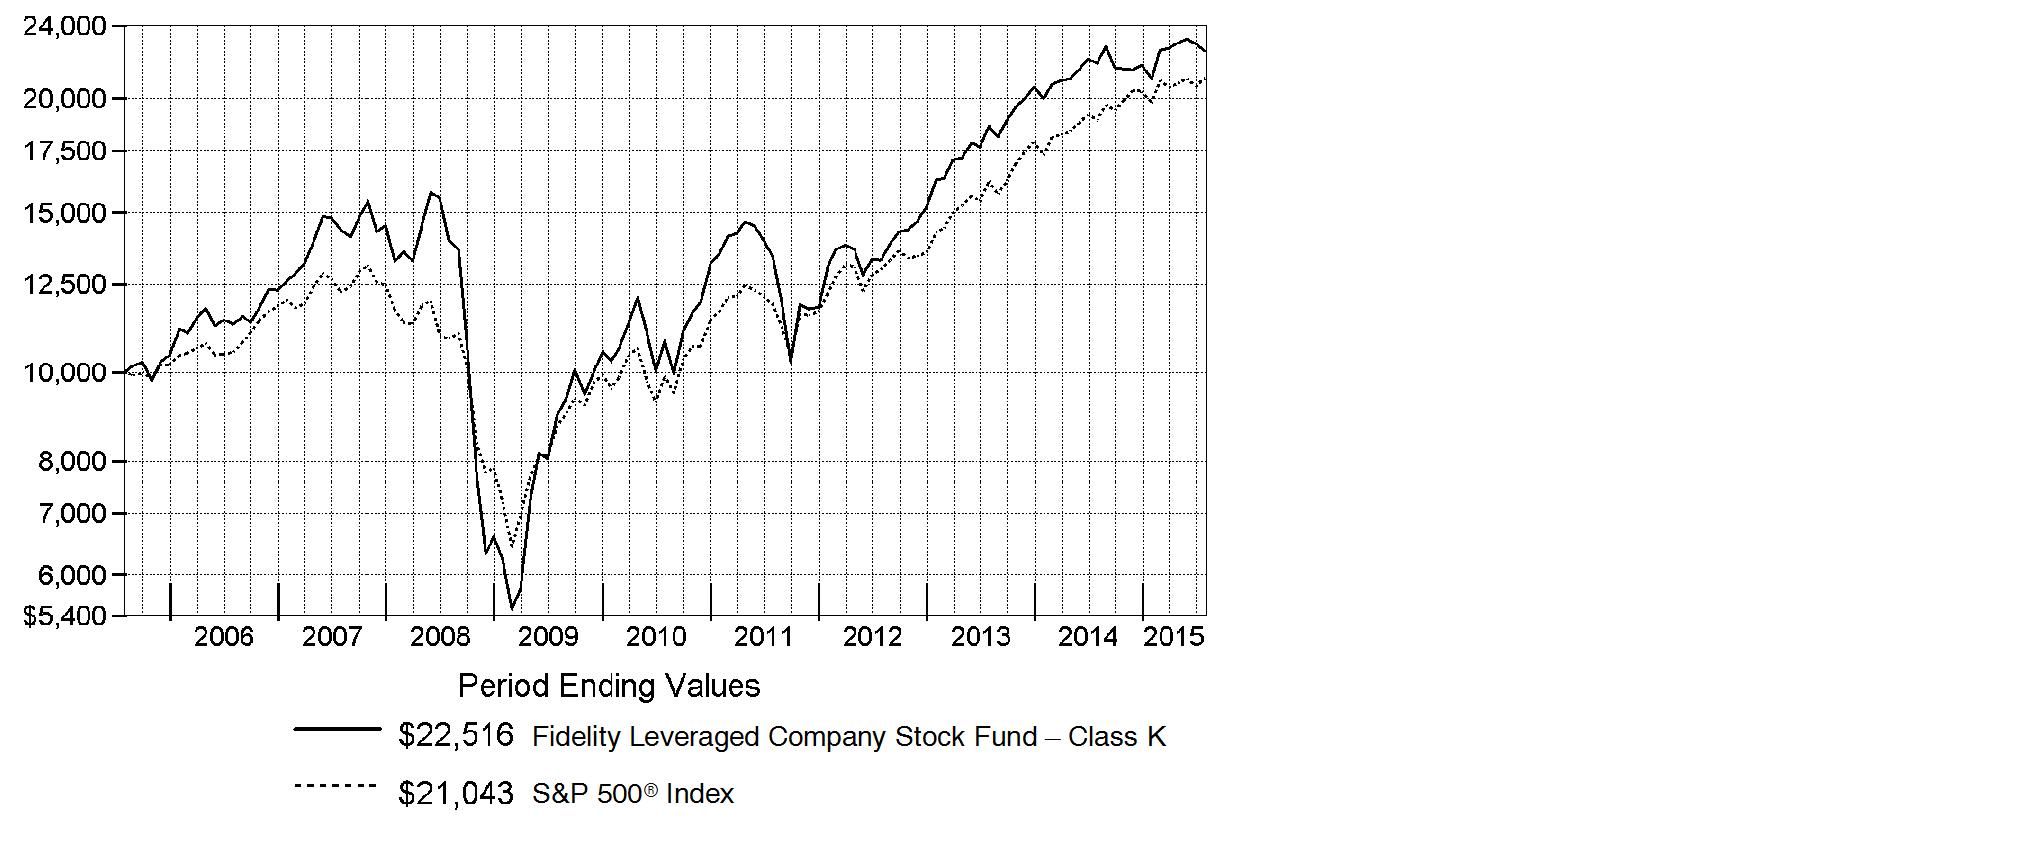
Annual Report
Market Recap: The U.S. equity market gained strongly for the 12 months ending July 31, 2015, as stocks recovered from volatility in late 2014 and early 2015, supported by a still-positive economic backdrop. The S&P 500® Index returned 11.21%, with growth stocks in the index far outpacing value-oriented names on prospects for continued U.S. economic growth. Consequently, the growth-oriented Nasdaq Composite Index® rose 18.71%, outpacing the broader S&P 500®, as well as the 12.03% advance of the smaller-cap Russell 2000® Index. Within the S&P 500®, seven of 10 sectors notched a gain, with significant performance variation. Health care (+27%) led the way, aided by merger activity. Consumer discretionary (+24%) benefited from spending linked to a seven-year low in unemployment. Strong first halves for the consumer staples sector and the real estate segment of financials yielded above-market returns (19% and 12%, respectively) for the full-year period. Conversely, energy (-26%) significantly lagged, due to a roughly 55% decline for U.S. crude-oil prices. Materials (-4%) also lost ground. At period end, investors remained focused on the slowing rate of U.S. earnings growth, the possible effect of a relatively stronger U.S. dollar on exports and inflation, and whether an economic slowdown in China would create ripples for the global economy.
Comments from Portfolio Manager Tom Soviero: For the year, the fund's share classes posted a modest return. (For specific class-level results, please see the Performance section of this report.) Leveraged stocks underperformed the S&P 500® Index as investors moved away from riskier asset classes. Accordingly, the fund significantly lagged the benchmark S&P 500® but handily bested the -1.83% return of the Credit Suisse Leveraged Equity Index. Security selection within energy, an overweighting in the weak-performing materials group and positioning in consumer staples were among the biggest detractors versus the S&P. The most notable individual disappointment was LyondellBasell Industries, a Netherlands-based multinational plastics, chemicals and refining company, a sizable overweighting and the fund's largest holding. The stock got hit hard when oil prices crashed this past year. In energy, an out-of-index stake in Continental Resources and an overweighting in Hess, two exploration & production companies, hurt. By contrast, a significant overweighting in the top-performing consumer discretionary sector helped relative performance, but was largely offset by disappointing security selection. Bright spots here, however, included an out-of-index stake in funeral-services provider Service Corporation International, which climbed amid better-than-expected financial results.
The views expressed above reflect those of the portfolio manager(s) only through the end of the period as stated on the cover of this report and do not necessarily represent the views of Fidelity or any other person in the Fidelity organization. Any such views are subject to change at any time based upon market or other conditions and Fidelity disclaims any responsibility to update such views. These views may not be relied on as investment advice and, because investment decisions for a Fidelity fund are based on numerous factors, may not be relied on as an indication of trading intent on behalf of any Fidelity fund.
Annual Report
Shareholder Expense Example
As a shareholder of the Fund, you incur two types of costs: (1) transaction costs, including redemption fees and (2) ongoing costs, including management fees and other Fund expenses. This Example is intended to help you understand your ongoing costs (in dollars) of investing in the Fund and to compare these costs with the ongoing costs of investing in other mutual funds.
The Example is based on an investment of $1,000 invested at the beginning of the period and held for the entire period (February 1, 2015 to July 31, 2015).
Actual Expenses
The first line of the accompanying table for each class of the Fund provides information about actual account values and actual expenses. You may use the information in this line, together with the amount you invested, to estimate the expenses that you paid over the period. Simply divide your account value by $1,000.00 (for example, an $8,600 account value divided by $1,000.00 = 8.6), then multiply the result by the number in the first line for a class of the Fund under the heading entitled "Expenses Paid During Period" to estimate the expenses you paid on your account during this period. A small balance maintenance fee of $12.00 that is charged once a year may apply for certain accounts with a value of less than $2,000. This fee is not included in the table below. If it was, the estimate of expenses you paid during the period would be higher, and your ending account value lower, by this amount. In addition, the Fund, as a shareholder in the underlying Fidelity Central Funds, will indirectly bear its pro-rata share of the fees and expenses incurred by the underlying Fidelity Central Funds. These fees and expenses are not included in the Fund's annualized expense ratio used to calculate the expense estimate in the table below.
Hypothetical Example for Comparison Purposes
The second line of the accompanying table for each class of the Fund provides information about hypothetical account values and hypothetical expenses based on a Class' actual expense ratio and an assumed rate of return of 5% per year before expenses, which is not the Class' actual return. The hypothetical account values and expenses may not be used to estimate the actual ending account balance or expenses you paid for the period. You may use this information to compare the ongoing costs of investing in the Fund and other funds. To do so, compare this 5% hypothetical example with the 5% hypothetical examples that appear in the shareholder reports of the other funds. A small balance maintenance fee of $12.00 that is charged once a year may apply for certain accounts with a value of less than $2,000. This fee is not included in the table below. If it was, the estimate of expenses you paid during the period would be higher, and your ending account value lower, by this amount. In addition, the Fund, as a shareholder in the underlying Fidelity Central Funds, will indirectly bear its pro-rata share of the fees and expenses incurred by the underlying Fidelity Central Funds. These fees and expenses are not included in the Fund's annualized expense ratio used to calculate the expense estimate in the table below.
Please note that the expenses shown in the table are meant to highlight your ongoing costs only and do not reflect any transaction costs. Therefore, the second line of the table is useful in comparing ongoing costs only, and will not help you determine the relative total costs of owning different funds. In addition, if these transactional costs were included, your costs would have been higher.
Annual Report
| Annualized
Expense RatioB | Beginning
Account Value
February 1, 2015 | Ending
Account Value
July 31, 2015 | Expenses Paid
During Period*
February 1, 2015
to July 31, 2015 |
Leveraged Company Stock | .78% | | | |
Actual | | $ 1,000.00 | $ 1,072.50 | $ 4.01 |
HypotheticalA | | $ 1,000.00 | $ 1,020.93 | $ 3.91 |
Class K | .67% | | | |
Actual | | $ 1,000.00 | $ 1,073.30 | $ 3.44 |
HypotheticalA | | $ 1,000.00 | $ 1,021.47 | $ 3.36 |
A 5% return per year before expenses
B Annualized expense ratio reflects expenses net of applicable fee waivers.
* Expenses are equal to each Class' annualized expense ratio, multiplied by the average account value over the period, multiplied by 181/365 (to reflect the one-half year period).
Annual Report
Investment Changes (Unaudited)
Top Ten Stocks as of July 31, 2015 |
| % of fund's
net assets | % of fund's net assets
6 months ago |
LyondellBasell Industries NV Class A | 9.0 | 7.5 |
Service Corp. International | 6.2 | 4.7 |
Boston Scientific Corp. | 3.4 | 2.9 |
WestRock Co. | 3.1 | 3.2 |
Bank of America Corp. | 2.9 | 2.4 |
Ford Motor Co. | 2.4 | 2.4 |
Delta Air Lines, Inc. | 2.4 | 3.2 |
Comcast Corp. Class A | 2.3 | 3.8 |
General Motors Co. | 2.2 | 2.2 |
HCA Holdings, Inc. | 2.1 | 1.6 |
| 36.0 | |
Top Five Market Sectors as of July 31, 2015 |
| % of fund's
net assets | % of fund's net assets
6 months ago |
Consumer Discretionary | 26.0 | 24.8 |
Health Care | 14.6 | 12.2 |
Materials | 14.3 | 13.2 |
Financials | 12.1 | 12.0 |
Industrials | 10.2 | 12.4 |
Asset Allocation (% of fund's net assets) |
As of July 31, 2015* | As of January 31, 2015** |
 | Stocks 96.9% | |  | Stocks 96.2% | |
 | Bonds 0.3% | |  | Bonds 0.4% | |
 | Short-Term
Investments and
Net Other Assets
(Liabilities) 2.8% | |  | Short-Term
Investments and
Net Other Assets
(Liabilities) 3.4% | |
* Foreign investments | 16.2% | | ** Foreign investments | 14.5% | |

Annual Report
Investments July 31, 2015
Showing Percentage of Net Assets
Common Stocks - 96.6% |
| Shares | | Value (000s) |
CONSUMER DISCRETIONARY - 26.0% |
Auto Components - 1.7% |
Delphi Automotive PLC | 490,700 | | $ 38,314 |
Tenneco, Inc. (a) | 825,300 | | 41,108 |
| | 79,422 |
Automobiles - 5.0% |
Ford Motor Co. | 7,806,833 | | 115,775 |
General Motors Co. | 3,272,337 | | 103,111 |
General Motors Co.: | | | |
warrants 7/10/16 (a) | 482,521 | | 10,615 |
warrants 7/10/19 (a) | 482,521 | | 7,098 |
| | 236,599 |
Diversified Consumer Services - 6.2% |
Service Corp. International | 9,646,027 | | 294,300 |
Hotels, Restaurants & Leisure - 0.8% |
ARAMARK Holdings Corp. | 987,744 | | 31,430 |
Penn National Gaming, Inc. (a) | 360,340 | | 6,875 |
Station Holdco LLC unit (a)(f)(g) | 146,846 | | 93 |
| | 38,398 |
Household Durables - 2.8% |
Hovnanian Enterprises, Inc. Class A (a)(d) | 1,419,000 | | 2,866 |
Lennar Corp. Class A | 677,100 | | 35,913 |
Newell Rubbermaid, Inc. | 2,129,847 | | 92,180 |
| | 130,959 |
Media - 6.9% |
AMC Networks, Inc. Class A (a) | 446,400 | | 37,596 |
Cinemark Holdings, Inc. | 2,343,045 | | 92,457 |
Comcast Corp. Class A | 1,723,034 | | 107,535 |
Gray Television, Inc. (a)(e) | 3,766,164 | | 63,611 |
Nexstar Broadcasting Group, Inc. Class A | 455,698 | | 26,139 |
| | 327,338 |
Specialty Retail - 2.6% |
Asbury Automotive Group, Inc. (a) | 385,122 | | 34,006 |
GameStop Corp. Class A (d) | 1,473,907 | | 67,579 |
Sally Beauty Holdings, Inc. (a) | 808,000 | | 24,070 |
| | 125,655 |
TOTAL CONSUMER DISCRETIONARY | | 1,232,671 |
Common Stocks - continued |
| Shares | | Value (000s) |
CONSUMER STAPLES - 1.7% |
Food Products - 1.3% |
ConAgra Foods, Inc. | 541,700 | | $ 23,867 |
Darling International, Inc. (a) | 2,698,383 | | 34,674 |
| | 58,541 |
Personal Products - 0.4% |
Revlon, Inc. (a) | 553,261 | | 19,901 |
TOTAL CONSUMER STAPLES | | 78,442 |
ENERGY - 6.4% |
Energy Equipment & Services - 1.7% |
Ensco PLC Class A | 110,000 | | 1,824 |
Halliburton Co. | 1,126,593 | | 47,080 |
Noble Corp. (d) | 987,610 | | 11,802 |
Oil States International, Inc. (a) | 270,466 | | 8,144 |
Schlumberger Ltd. | 109,400 | | 9,061 |
Transocean Ltd. (United States) (d) | 381,900 | | 5,064 |
| | 82,975 |
Oil, Gas & Consumable Fuels - 4.7% |
Continental Resources, Inc. (a) | 807,474 | | 26,978 |
Hess Corp. | 861,810 | | 50,855 |
QEP Resources, Inc. | 901,000 | | 12,506 |
Range Resources Corp. | 247,200 | | 9,725 |
Valero Energy Corp. | 1,103,866 | | 72,414 |
Western Refining, Inc. | 451,814 | | 19,952 |
Whiting Petroleum Corp. (a) | 1,439,895 | | 29,503 |
| | 221,933 |
TOTAL ENERGY | | 304,908 |
FINANCIALS - 11.8% |
Banks - 8.8% |
Bank of America Corp. | 7,570,599 | | 135,362 |
Barclays PLC sponsored ADR (d) | 2,441,721 | | 43,902 |
CIT Group, Inc. | 229,310 | | 10,787 |
Citigroup, Inc. | 1,221,847 | | 71,429 |
Huntington Bancshares, Inc. | 4,966,980 | | 57,965 |
Regions Financial Corp. | 5,015,480 | | 52,111 |
SunTrust Banks, Inc. | 1,019,600 | | 45,209 |
| | 416,765 |
Common Stocks - continued |
| Shares | | Value (000s) |
FINANCIALS - continued |
Capital Markets - 0.0% |
Motors Liquidation Co. GUC Trust (a) | 123,112 | | $ 2,093 |
Consumer Finance - 0.9% |
American Express Co. | 567,448 | | 43,160 |
Insurance - 0.5% |
Lincoln National Corp. | 435,700 | | 24,539 |
Real Estate Investment Trusts - 1.0% |
Gaming & Leisure Properties | 430,875 | | 14,111 |
Host Hotels & Resorts, Inc. | 1,016,122 | | 19,692 |
Sabra Health Care REIT, Inc. | 547,507 | | 14,974 |
| | 48,777 |
Real Estate Management & Development - 0.5% |
Realogy Holdings Corp. (a) | 463,840 | | 21,114 |
Thrifts & Mortgage Finance - 0.1% |
MGIC Investment Corp. (a) | 441,300 | | 4,885 |
TOTAL FINANCIALS | | 561,333 |
HEALTH CARE - 14.6% |
Health Care Equipment & Supplies - 3.4% |
Boston Scientific Corp. (a) | 9,434,356 | | 163,592 |
Health Care Providers & Services - 7.5% |
Community Health Systems, Inc. (a) | 1,267,827 | | 74,181 |
DaVita HealthCare Partners, Inc. (a) | 532,952 | | 42,119 |
HCA Holdings, Inc. (a) | 1,098,579 | | 102,179 |
Tenet Healthcare Corp. (a) | 1,452,844 | | 81,795 |
Universal Health Services, Inc. Class B | 385,505 | | 55,987 |
| | 356,261 |
Life Sciences Tools & Services - 0.6% |
PRA Health Sciences, Inc. | 651,400 | | 27,352 |
Pharmaceuticals - 3.1% |
Johnson & Johnson | 153,000 | | 15,332 |
Merck & Co., Inc. | 1,453,600 | | 85,704 |
Sanofi SA sponsored ADR | 819,934 | | 44,268 |
| | 145,304 |
TOTAL HEALTH CARE | | 692,509 |
Common Stocks - continued |
| Shares | | Value (000s) |
INDUSTRIALS - 10.2% |
Aerospace & Defense - 2.1% |
Honeywell International, Inc. | 426,776 | | $ 44,833 |
Huntington Ingalls Industries, Inc. | 258,160 | | 30,311 |
Textron, Inc. | 602,700 | | 26,338 |
| | 101,482 |
Airlines - 3.6% |
American Airlines Group, Inc. | 860,580 | | 34,509 |
Delta Air Lines, Inc. | 2,606,801 | | 115,586 |
Southwest Airlines Co. | 571,283 | | 20,680 |
| | 170,775 |
Building Products - 0.7% |
Allegion PLC | 246,500 | | 15,584 |
Armstrong World Industries, Inc. (a) | 273,500 | | 16,000 |
| | 31,584 |
Commercial Services & Supplies - 0.9% |
Civeo Corp. | 540,932 | | 1,158 |
Deluxe Corp. | 431,413 | | 27,796 |
Tyco International Ltd. | 328,233 | | 12,470 |
| | 41,424 |
Electrical Equipment - 0.5% |
Emerson Electric Co. | 163,500 | | 8,461 |
Generac Holdings, Inc. (a)(d) | 490,557 | | 17,204 |
| | 25,665 |
Industrial Conglomerates - 0.6% |
General Electric Co. | 1,103,883 | | 28,811 |
Machinery - 1.1% |
Ingersoll-Rand PLC | 739,500 | | 45,405 |
Pentair PLC | 78,757 | | 4,789 |
| | 50,194 |
Marine - 0.3% |
Genco Shipping & Trading Ltd. (a) | 565,366 | | 4,110 |
Genco Shipping & Trading Ltd. (a) | 8,314 | | 60 |
Navios Maritime Holdings, Inc. (d) | 2,162,794 | | 8,002 |
| | 12,172 |
Road & Rail - 0.2% |
Hertz Global Holdings, Inc. (a) | 707,700 | | 12,024 |
Common Stocks - continued |
| Shares | | Value (000s) |
INDUSTRIALS - continued |
Trading Companies & Distributors - 0.2% |
United Rentals, Inc. (a) | 147,000 | | $ 9,848 |
TOTAL INDUSTRIALS | | 483,979 |
INFORMATION TECHNOLOGY - 9.1% |
Communications Equipment - 1.3% |
Cisco Systems, Inc. | 2,181,349 | | 61,994 |
Electronic Equipment & Components - 1.5% |
Avnet, Inc. | 594,313 | | 24,801 |
Belden, Inc. | 510,764 | | 30,253 |
Corning, Inc. | 726,800 | | 13,577 |
TTM Technologies, Inc. (a) | 381,564 | | 3,484 |
| | 72,115 |
Internet Software & Services - 0.3% |
VeriSign, Inc. (a)(d) | 194,300 | | 13,784 |
IT Services - 0.2% |
Global Cash Access Holdings, Inc. (a) | 1,851,000 | | 9,348 |
Semiconductors & Semiconductor Equipment - 3.4% |
Freescale Semiconductor, Inc. (a) | 1,033,800 | | 41,218 |
Intersil Corp. Class A | 1,460,387 | | 16,254 |
Micron Technology, Inc. (a) | 2,079,945 | | 38,500 |
NXP Semiconductors NV (a) | 459,064 | | 44,525 |
ON Semiconductor Corp. (a) | 2,134,568 | | 22,669 |
| | 163,166 |
Software - 1.7% |
Citrix Systems, Inc. (a) | 230,899 | | 17,458 |
Microsoft Corp. | 1,384,568 | | 64,659 |
| | 82,117 |
Technology Hardware, Storage & Peripherals - 0.7% |
NCR Corp. (a) | 1,117,931 | | 30,788 |
TOTAL INFORMATION TECHNOLOGY | | 433,312 |
MATERIALS - 14.3% |
Chemicals - 9.8% |
H.B. Fuller Co. | 461,829 | | 18,501 |
LyondellBasell Industries NV Class A | 4,554,155 | | 427,315 |
Common Stocks - continued |
| Shares | | Value (000s) |
MATERIALS - continued |
Chemicals - continued |
OMNOVA Solutions, Inc. (a)(e) | 3,114,962 | | $ 20,154 |
Phosphate Holdings, Inc. (a) | 307,500 | | 20 |
| | 465,990 |
Containers & Packaging - 3.7% |
Sealed Air Corp. | 483,434 | | 25,704 |
WestRock Co. | 2,336,728 | | 147,354 |
| | 173,058 |
Metals & Mining - 0.0% |
Ormet Corp. (a)(e) | 1,405,000 | | 5 |
TimkenSteel Corp. | 114,367 | | 2,131 |
| | 2,136 |
Paper & Forest Products - 0.8% |
Louisiana-Pacific Corp. (a) | 1,563,090 | | 23,040 |
Neenah Paper, Inc. | 266,200 | | 16,126 |
| | 39,166 |
TOTAL MATERIALS | | 680,350 |
TELECOMMUNICATION SERVICES - 1.3% |
Diversified Telecommunication Services - 1.3% |
Frontier Communications Corp. (d) | 5,528,256 | | 26,093 |
Intelsat SA (a)(d) | 1,144,700 | | 10,886 |
Level 3 Communications, Inc. (a) | 514,400 | | 25,977 |
| | 62,956 |
UTILITIES - 1.2% |
Electric Utilities - 0.3% |
FirstEnergy Corp. | 421,304 | | 14,307 |
Independent Power and Renewable Electricity Producers - 0.9% |
Calpine Corp. (a) | 2,167,700 | | 39,669 |
TOTAL UTILITIES | | 53,976 |
TOTAL COMMON STOCKS (Cost $2,685,815) |
4,584,436
|
Nonconvertible Preferred Stocks - 0.3% |
| Shares | | Value (000s) |
FINANCIALS - 0.3% |
Capital Markets - 0.3% |
GMAC Capital Trust I Series 2, 8.125% (Cost $10,975) | 439,013 | | $ 11,515 |
Nonconvertible Bonds - 0.3% |
| Principal Amount (000s) | | |
ENERGY - 0.3% |
Energy Equipment & Services - 0.3% |
Offshore Group Investment Ltd. 7.5% 11/1/19 | | $ 13,360 | | 7,148 |
SAExploration Holdings, Inc. 10% 7/15/19 | | 14,345 | | 8,912 |
| | 16,060 |
TOTAL NONCONVERTIBLE BONDS (Cost $26,546) |
16,060
|
Money Market Funds - 6.3% |
| Shares | | |
Fidelity Cash Central Fund, 0.17% (b) | 136,369,538 | | 136,370 |
Fidelity Securities Lending Cash Central Fund, 0.18% (b)(c) | 164,240,156 | | 164,240 |
TOTAL MONEY MARKET FUNDS (Cost $300,610) |
300,610
|
TOTAL INVESTMENT PORTFOLIO - 103.5% (Cost $3,023,946) | | 4,912,621 |
NET OTHER ASSETS (LIABILITIES) - (3.5)% | | (166,336) |
NET ASSETS - 100% | $ 4,746,285 |
Legend |
(a) Non-income producing |
(b) Affiliated fund that is generally available only to investment companies and other accounts managed by Fidelity Investments. The rate quoted is the annualized seven-day yield of the fund at period end. A complete unaudited listing of the fund's holdings as of its most recent quarter end is available upon request. In addition, each Fidelity Central Fund's financial statements, which are not covered by the Fund's Report of Independent Registered Public Accounting Firm, are available on the SEC's website or upon request. |
(c) Investment made with cash collateral received from securities on loan. |
(d) Security or a portion of the security is on loan at period end. |
(e) Affiliated company |
(f) Investment is owned by an entity that is treated as a U.S. Corporation for tax purposes in which the Fund holds a percentage ownership. |
(g) Restricted securities - Investment in securities not registered under the Securities Act of 1933 (excluding 144A issues). At the end of the period, the value of restricted securities (excluding 144A issues) amounted to $93,000 or 0.0% of net assets. |
Additional information on each restricted holding is as follows: |
Security | Acquisition Date | Acquisition Cost (000s) |
Station Holdco LLC unit | 10/28/08 - 12/1/08 | $ 5,990 |
Affiliated Central Funds |
Information regarding fiscal year to date income earned by the Fund from investments in Fidelity Central Funds is as follows: |
Fund | Income earned
(Amounts in thousands) |
Fidelity Cash Central Fund | $ 151 |
Fidelity Securities Lending Cash Central Fund | 2,875 |
Total | $ 3,026 |
Other Affiliated Issuers |
An affiliated company is a company in which the Fund has ownership of at least 5% of the voting securities. Fiscal year to date transactions with companies which are or were affiliates are as follows: |
Affiliate
(Amounts in thousands) | Value,
beginning of
period | Purchases | Sales
Proceeds | Dividend
Income | Value,
end of
period |
Gray Television, Inc. | $ 45,872 | $ - | $ - | $ - | $ 63,611 |
OMNOVA Solutions, Inc. | 25,138 | - | - | - | 20,154 |
Ormet Corp. | 8 | - | - | - | 5 |
Total | $ 71,018 | $ - | $ - | $ - | $ 83,770 |
Other Information |
The following is a summary of the inputs used, as of July 31, 2015, involving the Fund's assets and liabilities carried at fair value. The inputs or methodology used for valuing securities may not be an indication of the risk associated with investing in those securities. For more information on valuation inputs, and their aggregation into the levels used in the table below, please refer to the Investment Valuation section in the accompanying Notes to Financial Statements. |
Valuation Inputs at Reporting Date: |
Description
(Amounts in thousands) | Total | Level 1 | Level 2 | Level 3 |
Investments in Securities: | | | | |
Equities: | | | | |
Consumer Discretionary | $ 1,232,671 | $ 1,232,578 | $ - | $ 93 |
Consumer Staples | 78,442 | 78,442 | - | - |
Energy | 304,908 | 304,908 | - | - |
Financials | 572,848 | 572,848 | - | - |
Health Care | 692,509 | 692,509 | - | - |
Industrials | 483,979 | 483,979 | - | - |
Information Technology | 433,312 | 433,312 | - | - |
Materials | 680,350 | 680,345 | - | 5 |
Telecommunication Services | 62,956 | 62,956 | - | - |
Utilities | 53,976 | 53,976 | - | - |
Corporate Bonds | 16,060 | - | 16,060 | - |
Money Market Funds | 300,610 | 300,610 | - | - |
Total Investments in Securities: | $ 4,912,621 | $ 4,896,463 | $ 16,060 | $ 98 |
Distribution of investments by country or territory of incorporation, as a percentage of total net assets, is as follows (Unaudited): |
United States of America | 83.8% |
Netherlands | 9.9% |
Ireland | 1.7% |
United Kingdom | 1.1% |
France | 1.0% |
Others (Individually Less Than 1%) | 2.5% |
| 100.0% |
See accompanying notes which are an integral part of the financial statements.
Annual Report
Statement of Assets and Liabilities
Amounts in thousands (except per-share amounts) | | July 31, 2015 |
| | |
Assets | | |
Investment in securities, at value (including securities loaned of $159,067) - See accompanying schedule: Unaffiliated issuers (cost $2,649,138) | $ 4,528,241 | |
Fidelity Central Funds (cost $300,610) | 300,610 | |
Other affiliated issuers (cost $74,198) | 83,770 | |
Total Investments (cost $3,023,946) | | $ 4,912,621 |
Receivable for fund shares sold | | 1,213 |
Dividends receivable | | 2,817 |
Interest receivable | | 314 |
Distributions receivable from Fidelity Central Funds | | 249 |
Other receivables | | 45 |
Total assets | | 4,917,259 |
| | |
Liabilities | | |
Payable for fund shares redeemed | $ 3,637 | |
Accrued management fee | 2,394 | |
Other affiliated payables | 642 | |
Other payables and accrued expenses | 61 | |
Collateral on securities loaned, at value | 164,240 | |
Total liabilities | | 170,974 |
| | |
Net Assets | | $ 4,746,285 |
Net Assets consist of: | | |
Paid in capital | | $ 2,672,305 |
Undistributed net investment income | | 24,974 |
Accumulated undistributed net realized gain (loss) on investments | | 160,331 |
Net unrealized appreciation (depreciation) on investments | | 1,888,675 |
Net Assets | | $ 4,746,285 |
See accompanying notes which are an integral part of the financial statements.
Annual Report
Financial Statements - continued
Statement of Assets and Liabilities - continued
Amounts in thousands (except per-share amounts) | | July 31, 2015 |
| | |
Leveraged Company Stock: | | |
Net Asset Value, offering price and redemption price per share ($3,755,492 ÷ 80,066.9 shares) | | $ 46.90 |
| | |
Class K: | | |
Net Asset Value, offering price and redemption price per share ($990,793 ÷ 21,082.6 shares) | | $ 47.00 |
See accompanying notes which are an integral part of the financial statements.
Annual Report
Statement of Operations
Amounts in thousands | Year ended July 31, 2015 |
| | |
Investment Income | | |
Dividends | | $ 79,289 |
Interest | | 2,240 |
Income from Fidelity Central Funds | | 3,026 |
Total income | | 84,555 |
| | |
Expenses | | |
Management fee | $ 30,550 | |
Transfer agent fees | 6,911 | |
Accounting and security lending fees | 1,139 | |
Custodian fees and expenses | 50 | |
Independent trustees' compensation | 22 | |
Registration fees | 84 | |
Audit | 66 | |
Legal | 23 | |
Miscellaneous | 35 | |
Total expenses before reductions | 38,880 | |
Expense reductions | (169) | 38,711 |
Net investment income (loss) | | 45,844 |
Realized and Unrealized Gain (Loss) Net realized gain (loss) on: | | |
Investment securities: | | |
Unaffiliated issuers | | 235,817 |
Change in net unrealized appreciation (depreciation) on investment securities | | (131,060) |
Net gain (loss) | | 104,757 |
Net increase (decrease) in net assets resulting from operations | | $ 150,601 |
See accompanying notes which are an integral part of the financial statements.
Annual Report
Financial Statements - continued
Statement of Changes in Net Assets
Amounts in thousands | Year ended
July 31,
2015 | Year ended
July 31,
2014 |
Increase (Decrease) in Net Assets | | |
Operations | | |
Net investment income (loss) | $ 45,844 | $ 44,390 |
Net realized gain (loss) | 235,817 | 184,977 |
Change in net unrealized appreciation (depreciation) | (131,060) | 610,173 |
Net increase (decrease) in net assets resulting from operations | 150,601 | 839,540 |
Distributions to shareholders from net investment income | (41,090) | (37,155) |
Share transactions - net increase (decrease) | (743,092) | (702,631) |
Redemption fees | 302 | 366 |
Total increase (decrease) in net assets | (633,279) | 100,120 |
| | |
Net Assets | | |
Beginning of period | 5,379,564 | 5,279,444 |
End of period (including undistributed net investment income of $24,974 and undistributed net investment income of $22,869, respectively) | $ 4,746,285 | $ 5,379,564 |
See accompanying notes which are an integral part of the financial statements.
Annual Report
Financial Highlights - Leveraged Company Stock
Years ended July 31, | 2015 | 2014 | 2013 | 2012 | 2011 |
Selected Per-Share Data | | | | | |
Net asset value, beginning of period | $ 45.82 | $ 39.44 | $ 28.22 | $ 28.85 | $ 23.50 |
Income from Investment Operations | | | | | |
Net investment income (loss)B | .41 | .34 | .42F | .16 | -H |
Net realized and unrealized gain (loss) | 1.01 | 6.31 | 10.92 | (.50) | 5.46 |
Total from investment operations | 1.42 | 6.65 | 11.34 | (.34) | 5.46 |
Distributions from net investment income | (.34) | (.27) | (.12) | (.29) | (.11) |
Redemption fees added to paid in capital B, H | - | - | - | - | - |
Net asset value, end of period | $ 46.90 | $ 45.82 | $ 39.44 | $ 28.22 | $ 28.85 |
Total ReturnA | 3.12% | 16.96% | 40.31% | (1.05)% | 23.27% |
Ratios to Average Net Assets C, G | | | | | |
Expenses before reductions | .79% | .79% | .82% | .86% | .85% |
Expenses net of fee waivers, if any | .78% | .79% | .82% | .86% | .85% |
Expenses net of all reductions | .78% | .79% | .82% | .85% | .84% |
Net investment income (loss) | .87% | .81% | 1.25%F | .60% | -%E |
Supplemental Data | | | | | |
Net assets, end of period (in millions) | $ 3,755 | $ 4,207 | $ 4,227 | $ 3,009 | $ 3,931 |
Portfolio turnover rateD | 4% | 10% | 21% | 29% | 18% |
A Total returns would have been lower if certain expenses had not been reduced during the applicable periods shown.
B Calculated based on average shares outstanding during the period.
C Fees and expenses of any underlying Fidelity Central Funds are not included in the Fund's expense ratio. The Fund indirectly bears its proportionate share of the expenses of any underlying Fidelity Central Funds.
D Amount does not include the portfolio activity of any underlying Fidelity Central Funds.
E Amount represents less than .01%.
F Investment income per share reflects a large, non-recurring dividend which amounted to $.08 per share. Excluding this non-recurring dividend, the ratio of net investment income (loss) to average net assets would have been 1.03%.
G Expense ratios reflect operating expenses of the class. Expenses before reductions do not reflect amounts reimbursed by the investment adviser or reductions from brokerage service arrangements or reductions from other expense offset arrangements and do not represent the amount paid by the class during periods when reimbursements or reductions occur. Expenses net of fee waivers reflect expenses after reimbursement by the investment adviser but prior to reductions from brokerage service arrangements or other expense offset arrangements. Expenses net of all reductions represent the net expenses paid by the class.
H Amount represents less than $.01 per share.
See accompanying notes which are an integral part of the financial statements.
Annual Report
Financial Highlights - Class K
Years ended July 31, | 2015 | 2014 | 2013 | 2012 | 2011 |
Selected Per-Share Data | | | | | |
Net asset value, beginning of period | $ 45.91 | $ 39.52 | $ 28.26 | $ 28.86 | $ 23.52 |
Income from Investment Operations | | | | | |
Net investment income (loss)B | .46 | .40 | .47E | .20 | .04 |
Net realized and unrealized gain (loss) | 1.03 | 6.31 | 10.93 | (.49) | 5.45 |
Total from investment operations | 1.49 | 6.71 | 11.40 | (.29) | 5.49 |
Distributions from net investment income | (.40) | (.32) | (.14) | (.31) | (.15) |
Redemption fees added to paid in capital B, G | - | - | - | - | - |
Net asset value, end of period | $ 47.00 | $ 45.91 | $ 39.52 | $ 28.26 | $ 28.86 |
Total ReturnA | 3.26% | 17.10% | 40.47% | (.87)% | 23.45% |
Ratios to Average Net Assets C, F | | | | | |
Expenses before reductions | .67% | .67% | .69% | .69% | .69% |
Expenses net of fee waivers, if any | .67% | .67% | .69% | .69% | .69% |
Expenses net of all reductions | .67% | .67% | .68% | .69% | .69% |
Net investment income (loss) | .99% | .92% | 1.39%E | .76% | .16% |
Supplemental Data | | | | | |
Net assets, end of period (in millions) | $ 991 | $ 1,173 | $ 1,053 | $ 600 | $ 555 |
Portfolio turnover rateD | 4% | 10% | 21% | 29% | 18% |
A Total returns would have been lower if certain expenses had not been reduced during the applicable periods shown.
B Calculated based on average shares outstanding during the period.
C Fees and expenses of any underlying Fidelity Central Funds are not included in the Fund's expense ratio. The Fund indirectly bears its proportionate share of the expenses of any underlying Fidelity Central Funds.
D Amount does not include the portfolio activity of any underlying Fidelity Central Funds.
E Investment income per share reflects a large, non-recurring dividend which amounted to $.08 per share. Excluding this non-recurring dividend, the ratio of net investment income (loss) to average net assets would have been 1.17%.
F Expense ratios reflect operating expenses of the class. Expenses before reductions do not reflect amounts reimbursed by the investment adviser or reductions from brokerage service arrangements or reductions from other expense offset arrangements and do not represent the amount paid by the class during periods when reimbursements or reductions occur. Expenses net of fee waivers reflect expenses after reimbursement by the investment adviser but prior to reductions from brokerage service arrangements or other expense offset arrangements. Expenses net of all reductions represent the net expenses paid by the class.
G Amount represents less than $.01 per share.
See accompanying notes which are an integral part of the financial statements.
Annual Report
For the period ended July 31, 2015
(Amounts in thousands except percentages)
1. Organization.
Fidelity Leveraged Company Stock Fund (the Fund) is a fund of Fidelity Securities Fund (the Trust) and is authorized to issue an unlimited number of shares. The Trust is registered under the Investment Company Act of 1940, as amended (the 1940 Act), as an open-end management investment company organized as a Massachusetts business trust. The Fund offers Leveraged Company Stock and Class K shares, each of which has equal rights as to assets and voting privileges. Each class has exclusive voting rights with respect to matters that affect that class.
2. Investments in Fidelity Central Funds.
The Fund invests in Fidelity Central Funds, which are open-end investment companies generally available only to other investment companies and accounts managed by the investment adviser and its affiliates. The Fund's Schedule of Investments lists each of the Fidelity Central Funds held as of period end, if any, as an investment of the Fund, but does not include the underlying holdings of each Fidelity Central Fund. As an Investing Fund, the Fund indirectly bears its proportionate share of the expenses of the underlying Fidelity Central Funds.
The Money Market Central Funds seek preservation of capital and current income and are managed by Fidelity Investments Money Management, Inc. (FIMM), an affiliate of the investment adviser. Annualized expenses of the Money Market Central Funds as of their most recent shareholder report date are less than .01%.
A complete unaudited list of holdings for each Fidelity Central Fund is available upon request or at the Securities and Exchange Commission (the SEC) website at www.sec.gov. In addition, the financial statements of the Fidelity Central Funds, which are not covered by the Fund's Report of Independent Registered Public Accounting Firm, are available on the SEC website or upon request.
3. Significant Accounting Policies.
The financial statements have been prepared in conformity with accounting principles generally accepted in the United States of America (GAAP), which require management to make certain estimates and assumptions at the date of the financial statements. Actual results could differ from those estimates. Subsequent events, if any, through the date that the financial statements were issued have been evaluated in the preparation of the financial statements. The following summarizes the significant accounting policies of the Fund:
Investment Valuation. Investments are valued as of 4:00 p.m. Eastern time on the last calendar day of the period. The Board of Trustees (the Board) has delegated the day to
Annual Report
3. Significant Accounting Policies - continued
Investment Valuation - continued
day responsibility for the valuation of the Fund's investments to the Fidelity Management & Research Company (FMR) Fair Value Committee (the Committee). In accordance with valuation policies and procedures approved by the Board, the Fund attempts to obtain prices from one or more third party pricing vendors or brokers to value its investments. When current market prices, quotations or currency exchange rates are not readily available or reliable, investments will be fair valued in good faith by the Committee, in accordance with procedures adopted by the Board. Factors used in determining fair value vary by investment type and may include market or investment specific events, changes in interest rates and credit quality. The frequency with which these procedures are used cannot be predicted and they may be utilized to a significant extent. The Committee oversees the Fund's valuation policies and procedures and reports to the Board on the Committee's activities and fair value determinations. The Board monitors the appropriateness of the procedures used in valuing the Fund's investments and ratifies the fair value determinations of the Committee.
The Fund categorizes the inputs to valuation techniques used to value its investments into a disclosure hierarchy consisting of three levels as shown below:
Level 1 - quoted prices in active markets for identical investments
Level 2 - other significant observable inputs (including quoted prices for similar investments, interest rates, prepayment speeds, etc.)
Level 3 - unobservable inputs (including the Fund's own assumptions based on the best information available)
Valuation techniques used to value the Fund's investments by major category are as follows:
Equity securities, including restricted securities, for which market quotations are readily available, are valued at the last reported sale price or official closing price as reported by a third party pricing vendor on the primary market or exchange on which they are traded and are categorized as Level 1 in the hierarchy. In the event there were no sales during the day or closing prices are not available, securities are valued at the last quoted bid price or may be valued using the last available price and are generally categorized as Level 2 in the hierarchy. For foreign equity securities, when market or security specific events arise, comparisons to the valuation of American Depositary Receipts (ADRs), futures contracts, Exchange-Traded Funds (ETFs) and certain indexes as well as quoted prices for similar securities may be used and would be categorized as Level 2 in the hierarchy. Utilizing these techniques may result in transfers between Level 1 and Level 2.
Annual Report
Notes to Financial Statements - continued
(Amounts in thousands except percentages)
3. Significant Accounting Policies - continued
Investment Valuation - continued
For equity securities, including restricted securities, where observable inputs are limited, assumptions about market activity and risk are used and these securities may be categorized as Level 3 in the hierarchy.
Debt securities, including restricted securities, are valued based on evaluated prices received from third party pricing vendors or from brokers who make markets in such securities. Corporate bonds are valued by pricing vendors who utilize matrix pricing which considers yield or price of bonds of comparable quality, coupon, maturity and type or by broker-supplied prices. When independent prices are unavailable or unreliable, debt securities may be valued utilizing pricing methodologies which consider similar factors that would be used by third party pricing vendors. Debt securities are generally categorized as Level 2 in the hierarchy but may be Level 3 depending on the circumstances.
Investments in open-end mutual funds, including the Fidelity Central Funds, are valued at their closing net asset value (NAV) each business day and are categorized as Level 1 in the hierarchy.
Changes in valuation techniques may result in transfers in or out of an assigned level within the disclosure hierarchy. The aggregate value of investments by input level as of July 31, 2015, is included at the end of the Fund's Schedule of Investments.
Investment Transactions and Income. For financial reporting purposes, the Fund's investment holdings and NAV include trades executed through the end of the last business day of the period. The NAV per share for processing shareholder transactions is calculated as of the close of business of the New York Stock Exchange (NYSE), normally 4:00 p.m. Eastern time and includes trades executed through the end of the prior business day. Gains and losses on securities sold are determined on the basis of identified cost and may include proceeds received from litigation. Dividend income is recorded on the ex-dividend date, except for certain dividends from foreign securities where the ex-dividend date may have passed, which are recorded as soon as the Fund is informed of the ex-dividend date. Non-cash dividends included in dividend income, if any, are recorded at the fair market value of the securities received. Income and capital gain distributions from Fidelity Central Funds, if any, are recorded on the ex-dividend date. Distributions received on securities that represent a return of capital or capital gain are recorded as a reduction of cost of investments and/or as a realized gain. Subsequent to ex-dividend date the Fund determines the components of these distributions, based upon receipt of tax filings or other correspondence relating to the underlying investment. Interest income is accrued as earned and includes coupon interest and amortization of premium and accretion of discount on debt securities as applicable.
Annual Report
3. Significant Accounting Policies - continued
Class Allocations and Expenses. Investment income, realized and unrealized capital gains and losses, common expenses of the Fund, and certain fund-level expense reductions, if any, are allocated daily on a pro-rata basis to each class based on the relative net assets of each class to the total net assets of the Fund. Each class differs with respect to transfer agent fees incurred. Certain expense reductions may also differ by class. For the reporting period, the allocated portion of income and expenses to each class as a percent of its average net assets may vary due to the timing of recording these transactions in relation to fluctuating net assets of the classes. Expenses directly attributable to a fund are charged to that fund. Expenses attributable to more than one fund are allocated among the respective funds on the basis of relative net assets or other appropriate methods. Expense estimates are accrued in the period to which they relate and adjustments are made when actual amounts are known.
Income Tax Information and Distributions to Shareholders. Each year, the Fund intends to qualify as a regulated investment company under Subchapter M of the Internal Revenue Code, including distributing substantially all of its taxable income and realized gains. As a result, no provision for U.S. Federal income taxes is required. As of July 31, 2015, the Fund did not have any unrecognized tax benefits in the financial statements; nor is the Fund aware of any tax positions for which it is reasonably possible that the total amounts of unrecognized tax benefits will significantly change in the next twelve months. The Fund files a U.S. federal tax return, in addition to state and local tax returns as required. The Fund's federal income tax returns are subject to examination by the Internal Revenue Service (IRS) for a period of three fiscal years after they are filed. State and local tax returns may be subject to examination for an additional fiscal year depending on the jurisdiction.
Distributions are declared and recorded on the ex-dividend date. Income dividends and capital gain distributions are declared separately for each class. Income and capital gain distributions are determined in accordance with income tax regulations, which may differ from GAAP. In addition, the Fund claimed a portion of the payment made to redeeming shareholders as a distribution for income tax purposes.
Capital accounts within the financial statements are adjusted for permanent book-tax differences. These adjustments have no impact on net assets or the results of operations. Capital accounts are not adjusted for temporary book-tax differences which will reverse in a subsequent period.
Book-tax differences are primarily due to market discount, equity-debt classifications, capital loss carryforwards and losses deferred due to excise tax regulations.
Annual Report
Notes to Financial Statements - continued
(Amounts in thousands except percentages)
3. Significant Accounting Policies - continued
Income Tax Information and Distributions to Shareholders - continued
The federal tax cost of investment securities and unrealized appreciation (depreciation) as of period end were as follows:
Gross unrealized appreciation | $ 2,114,722 |
Gross unrealized depreciation | (222,542) |
Net unrealized appreciation (depreciation) on securities | $ 1,892,180 |
| |
Tax Cost | $ 3,020,441 |
The tax-based components of distributable earnings as of period end were as follows:
Undistributed ordinary income | $ 21,665 |
Undistributed long-term capital gain | $ 160,331 |
Net unrealized appreciation (depreciation) on securities and other investments | $ 1,892,180 |
The tax character of distributions paid was as follows:
| July 31, 2015 | July 31, 2014 |
Ordinary Income | $ 41,090 | $ 37,155 |
Short-Term Trading (Redemption) Fees. Shares held by investors in the Fund less than 90 days may have been subject to a redemption fee equal to 1.50% of the NAV of shares redeemed. All redemption fees, which reduce the proceeds of the shareholder redemption, are retained by the Fund and accounted for as an addition to paid in capital.
Restricted Securities. The Fund may invest in securities that are subject to legal or contractual restrictions on resale. These securities generally may be resold in transactions exempt from registration or to the public if the securities are registered. Disposal of these securities may involve time-consuming negotiations and expense, and prompt sale at an acceptable price may be difficult. Information regarding restricted securities is included at the end of the Fund's Schedule of Investments.
4. Purchases and Sales of Investments.
Purchases and sales of securities, other than short-term securities, aggregated $195,757 and $943,000, respectively.
Annual Report
5. Fees and Other Transactions with Affiliates.
Management Fee. Fidelity Management & Research Company (the investment adviser) and its affiliates provide the Fund with investment management related services for which the Fund pays a monthly management fee. The management fee is the sum of an individual fund fee rate that is based on an annual rate of .35% of the Fund's average net assets and an annualized group fee rate that averaged .25% during the period. The group fee rate is based upon the average net assets of all the mutual funds advised by the investment adviser, including any mutual funds previously advised by the investment adviser that are currently advised by Fidelity SelectCo, LLC, an affiliate of the investment adviser. The group fee rate decreases as assets under management increase and increases as assets under management decrease. For the reporting period, the total annual management fee rate was .60% of the Fund's average net assets.
Transfer Agent Fees. Fidelity Investments Institutional Operations Company, Inc., (FIIOC), an affiliate of the investment adviser, is the transfer, dividend disbursing and shareholder servicing agent for each class of the Fund. FIIOC receives account fees and asset-based fees that vary according to the account size and type of account of the shareholders of Leveraged Company Stock. FIIOC receives an asset-based fee of Class K's average net assets. FIIOC pays for typesetting, printing and mailing of shareholder reports, except proxy statements.
For the period, transfer agent fees for each class were as follows:
| Amount | % of
Class-Level Average
Net Assets |
Leveraged Company Stock | $ 6,377 | .16 |
Class K | 534 | .05 |
| $ 6,911 | |
Accounting and Security Lending Fees. Fidelity Service Company, Inc. (FSC), an affiliate of the investment adviser, maintains the Fund's accounting records. The accounting fee is based on the level of average net assets for each month. Under a separate contract, FSC administers the security lending program. The security lending fee is based on the number and duration of lending transactions.
Brokerage Commissions. The Fund placed a portion of its portfolio transactions with brokerage firms which are affiliates of the investment adviser. Brokerage commissions are included in net realized gain (loss) and change in net unrealized appreciation (depreciation) in the Statement of Operations. The commissions paid to these affiliated firms were $22 for the period.
Annual Report
Notes to Financial Statements - continued
(Amounts in thousands except percentages)
5. Fees and Other Transactions with Affiliates - continued
Interfund Lending Program. Pursuant to an Exemptive Order issued by the SEC, the Fund, along with other registered investment companies having management contracts with FMR or other affiliated entities of FMR, may participate in an interfund lending program. This program provides an alternative credit facility allowing the funds to borrow from, or lend money to, other participating affiliated funds. At period end, there were no interfund loans outstanding. The Fund's activity in this program during the period for which loans were outstanding was as follows:
Borrower or Lender | Average Loan
Balance | Weighted Average
Interest Rate | Interest Expense |
Borrower | $ 9,431 | .34% | $ -* |
* Amount represents two hundred seventy dollars.
6. Committed Line of Credit.
The Fund participates with other funds managed by the investment adviser or an affiliate in a $4.25 billion credit facility (the "line of credit") to be utilized for temporary or emergency purposes to fund shareholder redemptions or for other short-term liquidity purposes. The Fund has agreed to pay commitment fees on its pro-rata portion of the line of credit, which amounted to $7 and is reflected in Miscellaneous expenses on the Statement of Operations. During the period, the Fund did not borrow on this line of credit.
7. Security Lending.
The Fund lends portfolio securities through a lending agent from time to time in order to earn additional income. For equity securities, a lending agent is used and may loan securities to certain qualified borrowers, including Fidelity Capital Markets (FCM), a broker-dealer affiliated with the Fund. On the settlement date of the loan, the Fund receives collateral (in the form of U.S. Treasury obligations, letters of credit and/or cash) against the loaned securities and maintains collateral in an amount not less than 100% of the market value of the loaned securities during the period of the loan. The market value of the loaned securities is determined at the close of business of the Fund and any additional required collateral is delivered to the Fund on the next business day. If the borrower defaults on its obligation to return the securities loaned because of insolvency or other reasons, the Fund may apply collateral received from the borrower against the obligation. The Fund may experience delays and costs in recovering the securities loaned. Any cash collateral received is invested in the Fidelity Securities Lending Cash Central Fund. The value of loaned securities and cash collateral at period end are disclosed on the Fund's Statement of Assets and Liabilities. The value of securities loaned to FCM at period end was $5,708. Security lending income represents the income
Annual Report
7. Security Lending - continued
earned on investing cash collateral, less rebates paid to borrowers and any lending agent fees associated with the loan, plus any premium payments received for lending certain types of securities. Security lending income is presented in the Statement of Operations as a component of income from Fidelity Central Funds. Total security lending income during the period amounted to $2,875, including $167 from securities loaned to FCM.
8. Expense Reductions.
Commissions paid to certain brokers with whom the investment adviser, or its affiliates, places trades on behalf of the Fund include an amount in addition to trade execution, which may be rebated back to the Fund to offset certain expenses. This amount totaled $48 for the period.
In addition, during the period the investment adviser reimbursed/waived a portion of fund-level operating expenses in the amount of $20 and a portion of class-level operating expenses as follows:
| Amount |
Leveraged Company Stock | $ 101 |
9. Distributions to Shareholders.
Distributions to shareholders of each class were as follows:
Years ended July 31, | 2015 | 2014 |
From net investment income | | |
Leveraged Company Stock | $ 30,775 | $ 28,583 |
Class K | 10,315 | 8,572 |
Total | $ 41,090 | $ 37,155 |
10. Share Transactions.
Share transactions for each class were as follows and may contain automatic conversions between classes or exchanges between funds:
| Shares | Dollars |
Years ended July 31, | 2015 | 2014 | 2015 | 2014 |
Leveraged Company Stock | | | | |
Shares sold | 5,334 | 9,604 | $ 246,873 | $ 407,601 |
Reinvestment of distributions | 626 | 670 | 29,028 | 26,928 |
Shares redeemed | (17,699) | (25,643) | (811,035) | (1,089,706) |
Net increase (decrease) | (11,739) | (15,369) | $ (535,134) | $ (655,177) |
Annual Report
Notes to Financial Statements - continued
(Amounts in thousands except percentages)
10. Share Transactions - continued
| Shares | Dollars |
Years ended July 31, | 2015 | 2014 | 2015 | 2014 |
Class K | | | | |
Shares sold | 5,815 | 5,696 | $ 269,619 | $ 243,726 |
Reinvestment of distributions | 222 | 213 | 10,315 | 8,572 |
Shares redeemed | (10,500) | (7,002) | (487,892) | (299,752) |
Net increase (decrease) | (4,463) | (1,093) | $ (207,958) | $ (47,454) |
11. Other.
The Fund's organizational documents provide former and current trustees and officers with a limited indemnification against liabilities arising in connection with the performance of their duties to the Fund. In the normal course of business, the Fund may also enter into contracts that provide general indemnifications. The Fund's maximum exposure under these arrangements is unknown as this would be dependent on future claims that may be made against the Fund. The risk of material loss from such claims is considered remote.
Annual Report
To the Trustees of Fidelity Securities Fund and the Shareholders of Fidelity Leveraged Company Stock Fund:
In our opinion, the accompanying statement of assets and liabilities, including the schedule of investments, and the related statements of operations and of changes in net assets and the financial highlights present fairly, in all material respects, the financial position of Fidelity Leveraged Company Stock Fund (a fund of Fidelity Securities Fund) at July 31, 2015, the results of its operations for the year then ended, the changes in its net assets for each of the two years in the period then ended and the financial highlights for each of the five years in the period then ended, in conformity with accounting principles generally accepted in the United States of America. These financial statements and financial highlights (hereafter referred to as "financial statements") are the responsibility of the Fidelity Leveraged Company Stock Fund's management. Our responsibility is to express an opinion on these financial statements based on our audits. We conducted our audits of these financial statements in accordance with the standards of the Public Company Accounting Oversight Board (United States). Those standards require that we plan and perform the audit to obtain reasonable assurance about whether the financial statements are free of material misstatement. An audit includes examining, on a test basis, evidence supporting the amounts and disclosures in the financial statements, assessing the accounting principles used and significant estimates made by management, and evaluating the overall financial statement presentation. We believe that our audits, which included confirmation of securities at July 31, 2015 by correspondence with the custodian and brokers, provide a reasonable basis for our opinion.
PricewaterhouseCoopers LLP
Boston, Massachusetts
September 17, 2015
Annual Report
The Trustees, Member of the Advisory Board, and officers of the trust and fund, as applicable, are listed below. The Board of Trustees governs the fund and is responsible for protecting the interests of shareholders. The Trustees are experienced executives who meet periodically throughout the year to oversee the fund's activities, review contractual arrangements with companies that provide services to the fund, oversee management of the risks associated with such activities and contractual arrangements, and review the fund's performance. Each of the Trustees oversees 170 funds.
The Trustees hold office without limit in time except that (a) any Trustee may resign; (b) any Trustee may be removed by written instrument, signed by at least two-thirds of the number of Trustees prior to such removal; (c) any Trustee who requests to be retired or who has become incapacitated by illness or injury may be retired by written instrument signed by a majority of the other Trustees; and (d) any Trustee may be removed at any special meeting of shareholders by a two-thirds vote of the outstanding voting securities of the trust. Each Trustee who is not an interested person (as defined in the 1940 Act) of the trust and the fund (Independent Trustee), shall retire not later than the last day of the calendar year in which his or her 75th birthday occurs. The Independent Trustees may waive this mandatory retirement age policy with respect to individual Trustees. The officers and Advisory Board Member hold office without limit in time, except that any officer and Advisory Board Member may resign or may be removed by a vote of a majority of the Trustees at any regular meeting or any special meeting of the Trustees. Except as indicated, each individual has held the office shown or other offices in the same company for the past five years.
Experience, Skills, Attributes, and Qualifications of the Fund's Trustees. The Governance and Nominating Committee has adopted a statement of policy that describes the experience, qualifications, attributes, and skills that are necessary and desirable for potential Independent Trustee candidates (Statement of Policy). The Board believes that each Trustee satisfied at the time he or she was initially elected or appointed a Trustee, and continues to satisfy, the standards contemplated by the Statement of Policy. The Governance and Nominating Committee also engages professional search firms to help identify potential Independent Trustee candidates who have the experience, qualifications, attributes, and skills consistent with the Statement of Policy. From time to time, additional criteria based on the composition and skills of the current Independent Trustees, as well as experience or skills that may be appropriate in light of future changes to board composition, business conditions, and regulatory or other developments, have also been considered by the professional search firms and the Governance and Nominating Committee. In addition, the Board takes into account the Trustees' commitment and participation in Board and committee meetings, as well as their leadership of standing and ad hoc committees throughout their tenure.
In determining that a particular Trustee was and continues to be qualified to serve as a Trustee, the Board has considered a variety of criteria, none of which, in isolation, was controlling. The Board believes that, collectively, the Trustees have balanced and diverse experience, qualifications, attributes, and skills, which allow the Board to operate effectively in governing the fund and protecting the interests of shareholders. Information about the specific experience, skills, attributes, and qualifications of each Trustee, which in each case led to the Board's conclusion that the Trustee should serve (or continue to serve) as a trustee of the fund, is provided below.
Annual Report
Trustees and Officers - continued
Board Structure and Oversight Function. James C. Curvey is an interested person (as defined in the 1940 Act) and currently serves as Chairman. The Trustees have determined that an interested Chairman is appropriate and benefits shareholders because an interested Chairman has a personal and professional stake in the quality and continuity of services provided to the fund. Independent Trustees exercise their informed business judgment to appoint an individual of their choosing to serve as Chairman, regardless of whether the Trustee happens to be independent or a member of management. The Independent Trustees have determined that they can act independently and effectively without having an Independent Trustee serve as Chairman and that a key structural component for assuring that they are in a position to do so is for the Independent Trustees to constitute a substantial majority for the Board. The Independent Trustees also regularly meet in executive session. Ned C. Lautenbach serves as Chairman of the Independent Trustees and as such (i) acts as a liaison between the Independent Trustees and management with respect to matters important to the Independent Trustees and (ii) with management prepares agendas for Board meetings.
Fidelity funds are overseen by different Boards of Trustees. The fund's Board oversees Fidelity's high income and certain equity funds and other Boards oversee Fidelity's investment-grade bond, money market, asset allocation, and sector funds. The asset allocation funds may invest in Fidelity funds overseen by the fund's Board. The use of separate Boards, each with its own committee structure, allows the Trustees of each group of Fidelity funds to focus on the unique issues of the funds they oversee, including common research, investment, and operational issues. On occasion, the separate Boards establish joint committees to address issues of overlapping consequences for the Fidelity funds overseen by each Board.
The Trustees operate using a system of committees to facilitate the timely and efficient consideration of all matters of importance to the Trustees, the fund, and fund shareholders and to facilitate compliance with legal and regulatory requirements and oversight of the fund's activities and associated risks. The Board, acting through its committees, has charged FMR and its affiliates with (i) identifying events or circumstances the occurrence of which could have demonstrably adverse effects on the fund's business and/or reputation; (ii) implementing processes and controls to lessen the possibility that such events or circumstances occur or to mitigate the effects of such events or circumstances if they do occur; and (iii) creating and maintaining a system designed to evaluate continuously business and market conditions in order to facilitate the identification and implementation processes described in (i) and (ii) above. Because the day-to-day operations and activities of the fund are carried out by or through FMR, its affiliates and other service providers, the fund's exposure to risks is mitigated but not eliminated by the processes overseen by the Trustees. While each of the Board's committees has responsibility for overseeing different aspects of the fund's activities, oversight is exercised primarily through the Operations, Audit, and Compliance Committees. In addition, the Independent Trustees have worked with FMR to enhance the Board's oversight of investment and financial risks, legal and regulatory risks, technology risks, and operational risks, including the development of additional risk reporting to the Board. For example, a working group comprised of Independent Trustees and FMR has worked and continues to work to review the Fidelity funds' valuation-related activities, reporting and risk management. Appropriate personnel, including but not limited to the fund's Chief Compliance Officer (CCO), FMR's internal auditor, the independent accountants, the fund's Treasurer and portfolio management personnel, make periodic reports to the Board's committees, as appropriate, including an annual review of FMR's risk management program for the Fidelity funds. The responsibilities of each standing committee, including their oversight responsibilities, are described further under "Standing Committees of the Fund's Trustees."
Annual Report
The fund's Statement of Additional Information (SAI) includes more information about the Trustees. To request a free copy, call Fidelity at 1-800-544-8544.
Interested Trustees*:
Correspondence intended for each Trustee who is an interested person may be sent to Fidelity Investments, 245 Summer Street, Boston, Massachusetts 02210.
Name, Year of Birth; Principal Occupations and Other Relevant Experience+ |
James C. Curvey (1935) |
Year of Election or Appointment: 2008 Trustee Chairman of the Board of Trustees |
| Mr. Curvey also serves as Trustee of other Fidelity funds. Mr. Curvey is a Director of Fidelity Research & Analysis Co. (investment adviser firm, 2009-present), and Vice Chairman (2007-present) and Director of FMR LLC (diversified financial services company). In addition, Mr. Curvey serves as an Overseer for the Boston Symphony Orchestra and a member of the board of Artis-Naples, Naples, Florida, and as a Trustee for Brewster Academy, Wolfeboro, New Hampshire. Previously, Mr. Curvey served as a Director of Fidelity Investments Money Management, Inc. (investment adviser firm, 2009-2014), a Director of FMR (investment adviser firm, 2007-2014), and a Director of FMR Co., Inc. (investment adviser firm, 2007-2014). |
Charles S. Morrison (1960) |
Year of Election or Appointment: 2014 Trustee |
| Mr. Morrison also serves as Trustee of other funds. He serves as a Director of Fidelity Investments Money Management, Inc. (FIMM) (investment adviser firm, 2014-present), Director of Fidelity SelectCo, LLC (investment adviser firm, 2014-present), President, Asset Management (2014-present), and is an employee of Fidelity Investments. Previously, Mr. Morrison served as Vice President of Fidelity's Fixed Income and Asset Allocation Funds (2012-2014), President, Fixed Income (2011-2014), Vice President of Fidelity's Money Market Funds (2005-2009), President, Money Market Group Leader of FMR (investment adviser firm, 2009), and Senior Vice President, Money Market Group of FMR (2004-2009). Mr. Morrison also served as Vice President of Fidelity's Bond Funds (2002-2005), certain Balanced Funds (2002-2005), and certain Asset Allocation Funds (2002-2007), and as Senior Vice President (2002-2005) of Fidelity's Bond Division. |
* Trustees have been determined to be "Interested Trustees" by virtue of, among other things, their affiliation with the trust or various entities under common control with FMR.
+ The information above includes each Trustee's principal occupation during the last five years and other information relating to the experience, attributes, and skills relevant to each Trustee's qualifications to serve as a Trustee, which led to the conclusion that each Trustee should serve as a Trustee for the fund.
Annual Report
Independent Trustees:
Correspondence intended for each Independent Trustee (that is, the Trustees other than the Interested Trustees) may be sent to Fidelity Investments, P.O. Box 55235, Boston, Massachusetts 02205-5235.
Name, Year of Birth; Principal Occupations and Other Relevant Experience+ |
Dennis J. Dirks (1948) |
Year of Election or Appointment: 2005 Trustee |
| Mr. Dirks also serves as Trustee of other Fidelity funds. Prior to his retirement in May 2003, Mr. Dirks was Chief Operating Officer and a member of the Board of The Depository Trust & Clearing Corporation (DTCC). He also served as President, Chief Operating Officer, and Board member of The Depository Trust Company (DTC) and President and Board member of the National Securities Clearing Corporation (NSCC). In addition, Mr. Dirks served as Chief Executive Officer and Board member of the Government Securities Clearing Corporation, Chief Executive Officer and Board member of the Mortgage-Backed Securities Clearing Corporation, as a Trustee and a member of the Finance Committee of Manhattan College (2005-2008), and as a Trustee and a member of the Finance Committee of AHRC of Nassau County (2006-2008). Mr. Dirks is a member of the Independent Directors Council (IDC) Governing Council (2010-present) and Board of Directors for The Brookville Center for Children's Services, Inc. (2009-present). |
Alan J. Lacy (1953) |
Year of Election or Appointment: 2008 Trustee |
| Mr. Lacy also serves as Trustee of other Fidelity funds. Mr. Lacy serves as a member of the Board of Directors of Dave & Buster's Entertainment, Inc. (restaurant and entertainment complexes, 2010-present) and Bristol-Myers Squibb Company (global pharmaceuticals, 2008-present). In addition, Mr. Lacy served as Senior Adviser (2007-2014) of Oak Hill Capital Partners, L.P. (private equity) and also served as Chief Executive Officer (2000-2005) and Vice Chairman (2005-2006) of Sears Holdings Corporation and Sears, Roebuck and Co. (retail). Mr. Lacy is a member of the Board of Trustees of The National Parks Conservation Association (2006-present). Previously, Mr. Lacy served as Chairman of the Board of Trustees of the National Parks Conservation Association (2008-2011) and as a member of the Board of Directors for The Western Union Company (global money transfer, 2006-2011), The Hillman Companies, Inc. (hardware wholesalers, 2010-2014), and Earth Fare, Inc. (retail grocery, 2010-2014). |
Ned C. Lautenbach (1944) |
Year of Election or Appointment: 2000 Trustee Chairman of the Independent Trustees |
| Mr. Lautenbach also serves as Trustee of other Fidelity funds. Mr. Lautenbach currently serves as the Lead Director of the Eaton Corporation Board of Directors (diversified industrial, 1997-present). Mr. Lautenbach is Chairman of the Board of Directors of Artis-Naples in Naples, Florida (2012-present), a member of the Council on Foreign Relations (1994-present), and a member of the Board of Governors, State University System of Florida (2013-present). Previously, Mr. Lautenbach was a Partner/Advisory Partner at Clayton, Dubilier & Rice, LLC (private equity investment, 1998-2010), as well as a Director of Sony Corporation (2006-2007). |
Joseph Mauriello (1944) |
Year of Election or Appointment: 2008 Trustee |
| Mr. Mauriello also serves as Trustee of other Fidelity funds. Prior to his retirement in January 2006, Mr. Mauriello served in numerous senior management positions including Deputy Chairman and Chief Operating Officer (2004-2005), and Vice Chairman of Financial Services (2002-2004) of KPMG LLP US (professional services, 1965-2005). Mr. Mauriello currently serves as a member of the Board of Directors of XL Group plc. (global insurance and re-insurance, 2006-present). Previously, Mr. Mauriello served as a Director of the Hamilton Funds of the Bank of New York (2006-2007) and of Arcadia Resources Inc. (health care services and products, 2007-2012). |
Robert W. Selander (1950) |
Year of Election or Appointment: 2011 Trustee |
| Mr. Selander also serves as Trustee of other Fidelity funds. Mr. Selander serves as a Director of The Western Union Company (global money transfer, 2014-present). Previously, Mr. Selander served as a Member of the Advisory Board of other Fidelity funds (2011), and Executive Vice Chairman (2010), Chief Executive Officer (2009-2010), and President and Chief Executive Officer (1997-2009) of Mastercard, Inc. |
Cornelia M. Small (1944) |
Year of Election or Appointment: 2005 Trustee |
| Ms. Small also serves as Trustee of other Fidelity funds. Ms. Small is a member of the Board of Directors (2009-present) and Chair of the Investment Committee (2010-present) of the Teagle Foundation. Ms. Small also serves on the Investment Committee of the Berkshire Taconic Community Foundation (2008-present). Previously, Ms. Small served as Chairperson (2002-2008) and a member of the Investment Committee and Chairperson (2008-2012) and a member of the Board of Trustees of Smith College. In addition, Ms. Small served as Chief Investment Officer, Director of Global Equity Investments, and a member of the Board of Directors of Scudder, Stevens & Clark and Scudder Kemper Investments. |
William S. Stavropoulos (1939) |
Year of Election or Appointment: 2002 Trustee Vice Chairman of the Independent Trustees |
| Mr. Stavropoulos also serves as Trustee of other Fidelity funds. Mr. Stavropoulos serves as President and Founder of the Michigan Baseball Foundation, the Great Lakes Loons (2007-present). Mr. Stavropoulos is Chairman Emeritus of the Board of Directors of The Dow Chemical Company, where he previously served in numerous senior management positions, including President, CEO (1995-2000; 2002-2004), Chairman of the Executive Committee (2000-2006), and as a member of the Board of Directors (1990-2006). Currently, Mr. Stavropoulos is Chairman of the Board of Directors of Univar Inc. (global distributor of commodity and specialty chemicals), a Director of Teradata Corporation (data warehousing and technology solutions), and Maersk Inc. (industrial conglomerate), and a member of the Advisory Board for Metalmark Capital LLC (private equity investment, 2005-present). Mr. Stavropoulos is an operating advisor to Clayton, Dubilier & Rice, LLC (private equity investment). In addition, Mr. Stavropoulos is a member of the University of Notre Dame Advisory Council for the College of Science, a Trustee of the Rollin L. Gerstacker Foundation, and a Director of the Naples Philharmonic Center for the Arts. Previously, Mr. Stavropoulos served as a Director of Chemical Financial Corporation (bank holding company, 1993-2012) and Tyco International, Ltd. (multinational manufacturing and services, 2007-2012). |
David M. Thomas (1949) |
Year of Election or Appointment: 2008 Trustee |
| Mr. Thomas also serves as Trustee of other Fidelity funds. Mr. Thomas serves as Non-Executive Chairman of the Board of Directors of Fortune Brands Home and Security (home and security products, 2011-present), as a member of the Board of Directors (2004-present) and Presiding Director (2013-present) of Interpublic Group of Companies, Inc. (marketing communication), and as a member of the Board of Trustees of the University of Florida (2013-present). Previously, Mr. Thomas served as Executive Chairman (2005-2006) and Chairman and Chief Executive Officer (2000-2005) of IMS Health, Inc. (pharmaceutical and healthcare information solutions), and a Director of Fortune Brands, Inc. (consumer products, 2000-2011). |
+ The information above includes each Trustee's principal occupation during the last five years and other information relating to the experience, attributes, and skills relevant to each Trustee's qualifications to serve as a Trustee, which led to the conclusion that each Trustee should serve as a Trustee for the fund.
Advisory Board Member and Officers:
Correspondence intended for each officer and Peter S. Lynch may be sent to Fidelity Investments, 245 Summer Street, Boston, Massachusetts 02210. Officers appear below in alphabetical order.
Name, Year of Birth; Principal Occupation |
Peter S. Lynch (1944) |
Year of Election or Appointment: 2003 Member of the Advisory Board |
| Mr. Lynch also serves as Member of the Advisory Board of other Fidelity funds. Mr. Lynch is Vice Chairman and a Director of FMR (investment adviser firm) and FMR Co., Inc. (investment adviser firm). In addition, Mr. Lynch serves as a Trustee of Boston College and as the Chairman of the Inner-City Scholarship Fund. Previously, Mr. Lynch served on the Special Olympics International Board of Directors (1997-2006). |
Elizabeth Paige Baumann (1968) |
Year of Election or Appointment: 2012 Anti-Money Laundering (AML) Officer |
| Ms. Baumann also serves as AML Officer of other funds. She is Chief AML Officer of FMR LLC (diversified financial services company, 2012-present) and is an employee of Fidelity Investments. Previously, Ms. Baumann served as Vice President and Deputy Anti-Money Laundering Officer (2007-2012). |
Marc Bryant (1966) |
Year of Election or Appointment: 2015 Secretary and Chief Legal Officer (CLO) |
| Mr. Bryant also serves as Secretary and Chief Legal Officer (CLO) of other funds. He is Senior Vice President and Deputy General Counsel of FMR LLC (diversified financial services company). Previously, Mr. Bryant served as Secretary and Chief Legal Officer of Fidelity Rutland Square Trust II (2010-2014) and Assistant Secretary of Fidelity's Fixed Income and Asset Allocation Funds (2013-2015). Prior to joining Fidelity Investments, Mr. Bryant served as a Senior Vice President and the Head of Global Retail Legal for AllianceBernstein L.P. (2006-2010), and as the General Counsel for ProFund Advisors LLC (2001-2006). |
William C. Coffey (1969) |
Year of Election or Appointment: 2009 Assistant Secretary |
| Mr. Coffey also serves as Assistant Secretary of other funds. He is Senior Vice President and Deputy General Counsel of FMR LLC (diversified financial services company, 2010-present), and is an employee of Fidelity Investments. Previously, Mr. Coffey served as Vice President and Associate General Counsel of FMR LLC (2005-2009). |
Jonathan Davis (1968) |
Year of Election or Appointment: 2010 Assistant Treasurer |
| Mr. Davis also serves as Assistant Treasurer of other funds. Mr. Davis is an employee of Fidelity Investments. Previously, Mr. Davis served as Vice President and Associate General Counsel of FMR LLC (diversified financial services company, 2003-2010). |
Adrien E. Deberghes (1967) |
Year of Election or Appointment: 2008 Deputy Treasurer |
| Mr. Deberghes also serves as an officer of other funds. He is an employee of Fidelity Investments (2008-present). Prior to joining Fidelity Investments, Mr. Deberghes was Senior Vice President of Mutual Fund Administration at State Street Corporation (2007-2008), Senior Director of Mutual Fund Administration at Investors Bank & Trust (2005-2007), and Director of Finance for Dunkin' Brands (2000-2005). |
Stephanie J. Dorsey (1969) |
Year of Election or Appointment: 2010 Assistant Treasurer |
| Ms. Dorsey also serves as an officer of other funds. She is an employee of Fidelity Investments (2008-present) and has served in other fund officer roles. Prior to joining Fidelity Investments, Ms. Dorsey served as Treasurer (2004-2008) of the JPMorgan Mutual Funds and Vice President (2004-2008) of JPMorgan Chase Bank. |
Howard J. Galligan III (1966) |
Year of Election or Appointment: 2014 Chief Financial Officer |
| Mr. Galligan also serves as Chief Financial Officer of other funds. Mr. Galligan serves as President of Fidelity Pricing and Cash Management Services (FPCMS) (2014-present) and as a Director of Strategic Advisers, Inc. (investment adviser firm, 2008-present). Previously, Mr. Galligan served as Chief Administrative Officer of Asset Management (2011-2014) and Chief Operating Officer and Senior Vice President of Investment Support for Strategic Advisers, Inc. (2003-2011). |
Scott C. Goebel (1968) |
Year of Election or Appointment: 2015 Vice President |
| Mr. Goebel serves as an officer of other funds. Mr. Goebel also serves as Secretary of Fidelity SelectCo, LLC (investment adviser firm, 2013-present), Fidelity Investments Money Management, Inc. (FIMM) (investment adviser firm, 2010-present) and Fidelity Research and Analysis Company (FRAC) (investment adviser firm, 2010-present); General Counsel, Secretary, and Senior Vice President of FMR (investment adviser firm, 2008-present) and FMR Co., Inc. (investment adviser firm, 2008-present); Chief Legal Officer of Fidelity Management & Research (Hong Kong) Limited (investment adviser firm, 2008-present); and Assistant Secretary of Fidelity Management & Research (Japan) Limited (investment adviser firm, 2008-present) and FMR Investment Management (U.K.) Limited (investment adviser firm, 2008-present). Previously, Mr. Goebel served as Secretary and CLO of certain Fidelity funds (2008-2015), Assistant Secretary of FIMM (2008-2010), FRAC (2008-2010), and certain funds (2007-2008); and as Vice President and Secretary of Fidelity Distributors Corporation (FDC) (2005-2007). Mr. Goebel has been employed by FMR LLC (diversified financial services company) or an affiliate since 2001. |
Brian B. Hogan (1964) |
Year of Election or Appointment: 2009 Vice President |
| Mr. Hogan also serves as Trustee or Vice President of other funds. Mr. Hogan serves as a Director of Fidelity SelectCo, LLC (investment adviser firm, 2014-present) and President of the Equity Division of FMR (investment adviser firm, 2009-present). Previously, Mr. Hogan served as Senior Vice President, Equity Research of FMR (2006-2009) and as a portfolio manager. |
Chris Maher (1972) |
Year of Election or Appointment: 2013 Assistant Treasurer |
| Mr. Maher serves as Assistant Treasurer of other funds. Mr. Maher is Vice President of Valuation Oversight and is an employee of Fidelity Investments. Previously, Mr. Maher served as Vice President of Asset Management Compliance (2013), Vice President of the Program Management Group of FMR (investment adviser firm, 2010-2013), and Vice President of Valuation Oversight (2008-2010). |
Melissa M. Reilly (1971) |
Year of Election or Appointment: 2014 Vice President of certain Equity Funds |
<R> | Ms. Reilly also serves as Vice President of other funds. Ms. Reilly is an employee of Fidelity Investments (2004-present).</R> |
Kenneth B. Robins (1969) |
Year of Election or Appointment: 2008 President and Treasurer |
| Mr. Robins also serves as an officer of other funds. Mr. Robins serves as Executive Vice President of Fidelity Investments Money Management, Inc. (FIMM) (investment adviser firm, 2013-present) and is an employee of Fidelity Investments (2004-present). Previously, Mr. Robins served in other fund officer roles. |
Stephen Sadoski (1971) |
Year of Election or Appointment: 2012 Deputy Treasurer |
| Mr. Sadoski also serves as Deputy Treasurer of other funds. He is an employee of Fidelity Investments (2012-present) and has served in another fund officer role. Prior to joining Fidelity Investments, Mr. Sadoski served as an assistant chief accountant in the Division of Investment Management of the Securities and Exchange Commission (SEC) (2009-2012) and as a senior manager at Deloitte & Touche LLP (1997-2009). |
Stacie M. Smith (1974) |
Year of Election or Appointment: 2013 Deputy Treasurer |
| Ms. Smith also serves as an officer of other funds. She is an employee of Fidelity Investments (2009-present) and has served in other fund officer roles. Prior to joining Fidelity Investments, Ms. Smith served as Senior Audit Manager of Ernst & Young LLP (1996-2009). |
Renee Stagnone (1975) |
Year of Election or Appointment: 2013 Deputy Treasurer |
| Ms. Stagnone also serves as Deputy Treasurer of other funds. Ms. Stagnone is an employee of Fidelity Investments. |
Linda J. Wondrack (1964) |
Year of Election or Appointment: 2014 Chief Compliance Officer |
| Ms. Wondrack also serves as Chief Compliance Officer of other funds. Ms. Wondrack is Executive Vice President and head of the Ethics Office and Asset Management Compliance for Fidelity Investments (2012-present). Ms. Wondrack also serves as Chief Compliance Officer of Fidelity SelectCo, LLC (investment adviser firm, 2014-present); Chief Compliance Officer of Impresa Management LLC (2013-present); and Chief Compliance Officer of FMR Co., Inc. (investment adviser firm), Fidelity Investments Money Management, Inc. (investment adviser firm), Fidelity Management & Research (Japan) Limited (investment adviser firm), FMR Investment Management (U.K.) Limited (investment adviser firm), Fidelity Management & Research (Hong Kong) (investment adviser firm), Fidelity Management & Research Company (investment adviser firm), Pyramis Global Advisors, LLC (investment adviser firm), and Strategic Advisers, Inc. (investment adviser firm), Ballyrock Investment Advisors LLC, and Northern Neck Investors LLC (2012-present). Previously, Ms. Wondrack served as Senior Vice President and Chief Compliance Officer for Columbia Management Investment Advisers, LLC (2005-2012); Chief Compliance Officer for certain funds within the Columbia Family of Funds (2007-2012); and Senior Vice President of Compliance Risk Management at Bank of America (2005-2010). |
Joseph F. Zambello (1957) |
Year of Election or Appointment: 2011 Deputy Treasurer |
| Mr. Zambello also serves as Deputy Treasurer of other funds. Mr. Zambello is an employee of Fidelity Investments. Previously, Mr. Zambello served as Vice President of the Program Management Group of FMR (investment adviser firm, 2009-2011) and Vice President of the Transfer Agent Oversight Group (2005-2009). |
Annual Report
The Board of Trustees of Fidelity Leveraged Company Stock Fund voted to pay to shareholders of record at the opening of business on record date, the following distributions per share derived from capital gains realized from sales of portfolio securities, and dividends derived from net investment income:
| Pay Date | Record Date | Dividends | Capital Gains |
Class K | 09/14/15 | 09/11/15 | $ 0.249 | $ 1.642 |
The fund hereby designates as a capital gain dividend with respect to the taxable year ended July 31, 2015, $179,866,042, or, if subsequently determined to be different, the net capital gain of such year.
Class K designates 100% of the dividends distributed during the fiscal year as qualifying for the dividends-received deduction for corporate shareholders.
Class K designates 100% of the dividends distributed during the fiscal year as amounts which may be taken into account as a dividend for the purposes of the maximum rate under section 1(h)(11) of the Internal Revenue Code.
The fund will notify shareholders in January 2016 of amounts for use in preparing 2015 income tax returns.
Annual Report
Fidelity Leveraged Company Stock Fund
Each year, the Board of Trustees, including the Independent Trustees (together, the Board), votes on the renewal of the management contract with Fidelity Management & Research Company (FMR) and the sub-advisory agreements (together, the Advisory Contracts) for the fund. The Board, assisted by the advice of fund counsel and Independent Trustees' counsel, requests and considers a broad range of information relevant to the renewal of the Advisory Contracts throughout the year.
The Board meets regularly and, at each of its meetings, covers an extensive agenda of topics and materials and considers factors that are relevant to its annual consideration of the renewal of the fund's Advisory Contracts, including the services and support provided to the fund and its shareholders. The Board has established various standing committees (Committees), each composed of and chaired by Independent Trustees with varying backgrounds, to which the Board has assigned specific subject matter responsibilities in order to enhance effective decision-making by the Board. The Board, acting directly and through its Committees, requests and receives information concerning the annual consideration of the renewal of the fund's Advisory Contracts. The Board also meets as needed to consider matters specifically related to the Board's annual consideration of the renewal of the Advisory Contracts. Members of the Board may also meet with trustees of other Fidelity funds through ad hoc joint committees to discuss certain matters relevant to all of the Fidelity funds.
At its July 2015 meeting, the Board unanimously determined to renew the fund's Advisory Contracts. In reaching its determination, the Board considered all factors it believed relevant, including (i) the nature, extent, and quality of the services to be provided to the fund and its shareholders (including the investment performance of the fund); (ii) the competitiveness of the fund's management fee and total expense ratio relative to peer funds; (iii) the total costs of the services to be provided by and the profits to be realized by Fidelity from its relationship with the fund; and (iv) the extent to which (if any) economies of scale exist and would be realized as the fund grows, and whether any economies of scale are appropriately shared with fund shareholders.
In considering whether to renew the Advisory Contracts for the fund, the Board reached a determination, with the assistance of fund counsel and Independent Trustees' counsel and through the exercise of its business judgment, that the renewal of the Advisory Contracts was in the best interests of the fund and its shareholders and that the compensation payable under the Advisory Contracts was fair and reasonable. The Board's decision to renew the Advisory Contracts was not based on any single factor, but rather was based on a comprehensive consideration of all the information provided to the Board at its meetings throughout the year. The Board, in reaching its determination to renew the Advisory Contracts, was aware that shareholders of the fund have a broad range of investment choices available to them, including a wide choice among funds offered by Fidelity's competitors, and that the fund's shareholders, who have the opportunity to review and weigh the disclosure provided by the fund in its prospectus and other public disclosures, have chosen to invest in this fund, which is part of the Fidelity family of funds.
Annual Report
Board Approval of Investment Advisory Contracts and
Management Fees - continued
Nature, Extent, and Quality of Services Provided. The Board considered Fidelity's staffing as it relates to the fund, including the backgrounds of investment personnel of Fidelity, and also considered the fund's investment objective, strategies, and related investment philosophy. The Independent Trustees also had discussions with senior management of Fidelity's investment operations and investment groups. The Board considered the structure of the portfolio manager compensation program and whether this structure provides appropriate incentives to act in the best interests of the fund. Additionally, the Board considered the portfolio managers' investments, if any, in the funds that they manage.
Resources Dedicated to Investment Management and Support Services. The Board and the Fund Oversight and Research Committees reviewed the general qualifications and capabilities of Fidelity's investment staff, including its size, education, experience, and resources, as well as Fidelity's approach to recruiting, training, managing, and compensating investment personnel. The Board noted that Fidelity has continued to increase the resources devoted to non-U.S. offices, including expansion of Fidelity's global investment organization. The Board also noted that Fidelity's analysts have extensive resources, tools and capabilities that allow them to conduct sophisticated quantitative and fundamental analysis, as well as credit analysis of issuers, counterparties and guarantors. Further, the Board considered that Fidelity's investment professionals have sufficient access to global information and data so as to provide competitive investment results over time, and that those professionals also have access to sophisticated tools that permit them to assess portfolio construction and risk and performance attribution characteristics continuously, as well as to transmit new information and research conclusions rapidly around the world. Additionally, in its deliberations, the Board considered Fidelity's trading, risk management, and compliance capabilities and resources, which are integral parts of the investment management process.
Shareholder and Administrative Services. The Board considered (i) the nature, extent, quality, and cost of advisory, administrative, and shareholder services performed by FMR, the sub-advisers (together with FMR, the Investment Advisers), and their affiliates under the Advisory Contracts and under separate agreements covering transfer agency, pricing and bookkeeping, and securities lending services for the fund; (ii) the nature and extent of the supervision of third party service providers, principally custodians and subcustodians; and (iii) the resources devoted to, and the record of compliance with, the fund's compliance policies and procedures. The Board also reviewed the allocation of fund brokerage, including allocations to brokers affiliated with the Investment Advisers, the use of brokerage commissions to pay fund expenses, and the use of "soft" commission dollars to pay for research services.
Annual Report
The Board noted that the growth of fund assets over time across the complex allows Fidelity to reinvest in the development of services designed to enhance the value or convenience of the Fidelity funds as investment vehicles. These services include 24-hour access to account information and market information through telephone representatives and over the Internet, investor education materials and asset allocation tools, and the expanded availability of Fidelity Investor Centers.
In 2014, the Board formed an ad hoc Committee on Transfer Agency Fees to review the variety of transfer agency fee structures throughout the industry and Fidelity's competitive positioning with respect to industry participants.
Investment in a Large Fund Family. The Board considered the benefits to shareholders of investing in a Fidelity fund, including the benefits of investing in a fund that is part of a large family of funds offering a variety of investment disciplines and providing a large variety of mutual fund investor services. The Board noted that Fidelity had taken, or had made recommendations that resulted in the Fidelity funds taking, a number of actions over the previous year that benefited particular funds, including (i) continuing to dedicate additional resources to investment research and to the support of the senior management team that oversees asset management; (ii) continuing efforts to enhance Fidelity's global research capabilities; (iii) launching new funds and making other enhancements to meet client needs; (iv) reducing management fees and total expenses for certain index funds and diversified international funds; (v) continuing to launch dedicated lower cost underlying funds to meet portfolio construction needs related to expanding underlying fund options for Fidelity funds of funds, specifically for the Freedom Fund product lines; (vi) rationalizing product lines and gaining increased efficiencies through fund mergers; (vii) launching active fixed-income exchange-traded funds; (viii) continuing to develop, acquire and implement systems and technology to improve services to the funds and information security and to increase efficiency; (ix) implementing investment enhancements to further strengthen Fidelity's target date product line to increase investors' probability of success in achieving their goals; (x) modifying the eligibility criteria for certain share classes to accommodate roll-over assets from employer-sponsored retirement plans; (xi) launching a new Class W of the Freedom Index Funds to attract and retain Fidelity record-kept retirement plan assets; and (xii) implementing changes to Fidelity's money market product line in response to recent money market regulatory reforms.
Investment Performance. The Board considered whether the fund has operated in accordance with its investment objective, as well as its record of compliance with its investment restrictions and its performance history.
Annual Report
Board Approval of Investment Advisory Contracts and
Management Fees - continued
The Board took into account discussions with representatives of the Investment Advisers about fund investment performance that occur at Board meetings throughout the year. In this regard the Board noted that as part of regularly scheduled fund reviews and other reports to the Board on fund performance, the Board considers annualized return information for the fund, for different time periods, measured against a securities market index ("benchmark index") and a peer group of funds with similar objectives ("peer group"), if any. In its evaluation of fund investment performance, the Board gave particular attention to information indicating changes in performance of certain Fidelity funds for specific time periods and discussed with the Investment Advisers the reasons for any overperformance or underperformance.
In addition to reviewing absolute and relative fund performance, the Independent Trustees periodically consider the appropriateness of fund performance metrics in evaluating the results achieved. In general, the Independent Trustees believe that fund performance should be evaluated based on net performance (after fees and expenses) of both the highest performing and lowest performing fund share classes, where applicable, compared to appropriate benchmark indices, over appropriate time periods that may include full market cycles, and compared to peer groups, as applicable, over the same periods, taking into account relevant factors including the following: general market conditions; issuer-specific information; and fund cash flows and other factors.
The Independent Trustees recognize that shareholders evaluate performance on a net basis over their own holding periods, for which one-, three-, and five-year periods are often used as a proxy. For this reason, the performance information reviewed by the Board also included net cumulative calendar year total return information for the fund and an appropriate benchmark index and peer group for the most recent one-, three-, and five-year periods, as shown below. Returns are shown compared to the 25th percentile (top of box, 75% beaten) and 75th percentile (bottom of box, 25% beaten) of the peer universe.
Annual Report
Fidelity Leveraged Company Stock Fund
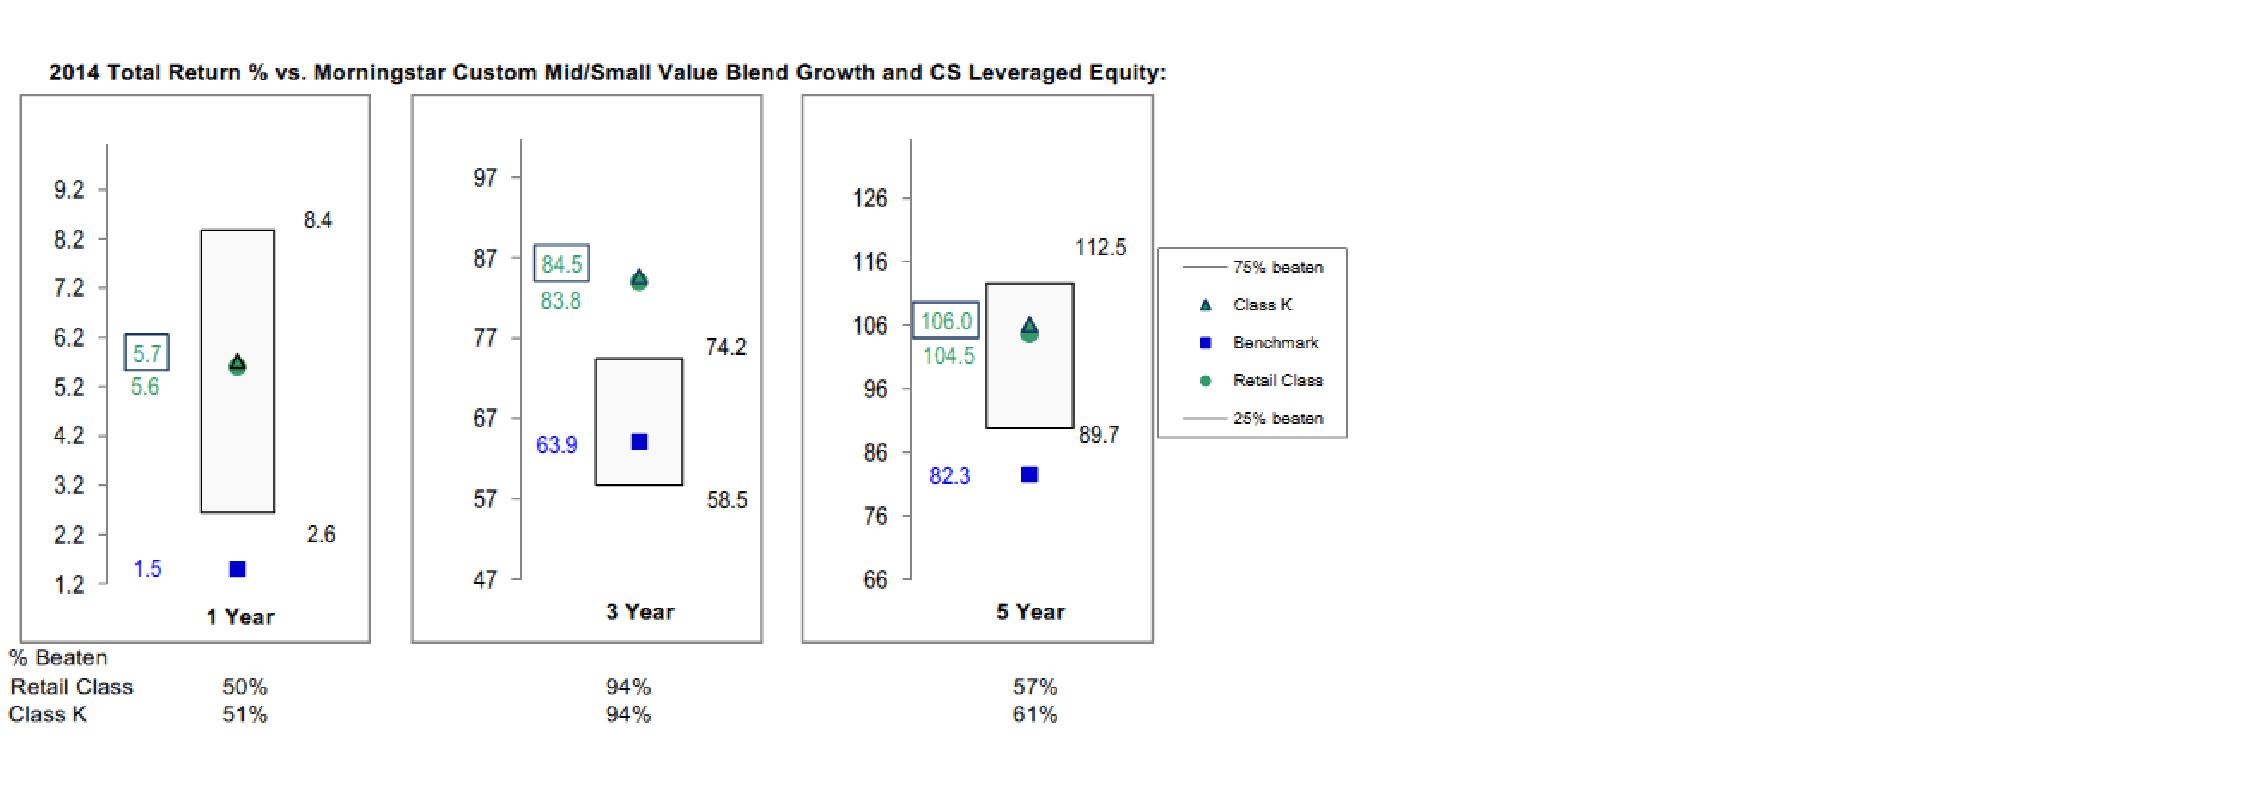
Based on its review, the Board concluded that the nature, extent, and quality of services provided to the fund under the Advisory Contracts should benefit the shareholders of the fund.
Competitiveness of Management Fee and Total Expense Ratio. The Board considered the fund's management fee and total expense ratio compared to "mapped groups" of competitive funds and classes created for the purpose of facilitating the Trustees' competitive analysis of management fees and total expenses. Fidelity creates "mapped groups" by combining similar Lipper investment objective categories that have comparable investment mandates. Combining Lipper investment objective categories aids the Board's management fee and total expense ratio comparisons by broadening the competitive group used for comparison.
Management Fee. The Board considered two proprietary management fee comparisons for the 12-month periods shown in basis points (BP) in the chart below. The group of Lipper funds used by the Board for management fee comparisons is referred to below as the "Total Mapped Group." The Total Mapped Group comparison focuses on a fund's standing in terms of gross management fees before expense reimbursements or caps relative to the total universe of funds with comparable investment mandates, regardless of whether their management fee structures also are comparable. Funds with comparable investment mandates offer exposure to similar types of securities. Funds with comparable management fee structures have similar management fee contractual arrangements (e.g., flat rate charged for advisory services, all-inclusive fee rate, etc.). "TMG %" represents the percentage of funds in the Total Mapped Group that had management fees that were lower than the fund's. For example, a hypothetical TMG % of 20% would mean that 80% of the funds in the Total Mapped Group had higher, and 20% had lower, management fees than the fund. The fund's actual TMG %s and the number of funds in the Total Mapped Group are in the chart below. The "Asset-Size Peer Group" (ASPG) comparison focuses on a fund's standing relative to a subset of non-Fidelity funds within the Total Mapped Group that are similar in size and management fee structure without taking into account performance adjustments, if any. For example, if a fund is in the first quartile of the ASPG, the fund's management fee ranks in the least expensive or lowest 25% of funds in the ASPG. The ASPG represents at least 15% of the funds in the Total Mapped Group with comparable asset size and management fee structures, subject to a minimum of 50 funds (or all funds in the Total Mapped Group if fewer than 50). Additional information, such as the ASPG quartile in which the fund's management fee rate ranked, is also included in the chart and considered by the Board.
Annual Report
Board Approval of Investment Advisory Contracts and
Management Fees - continued
Fidelity Leveraged Company Stock Fund
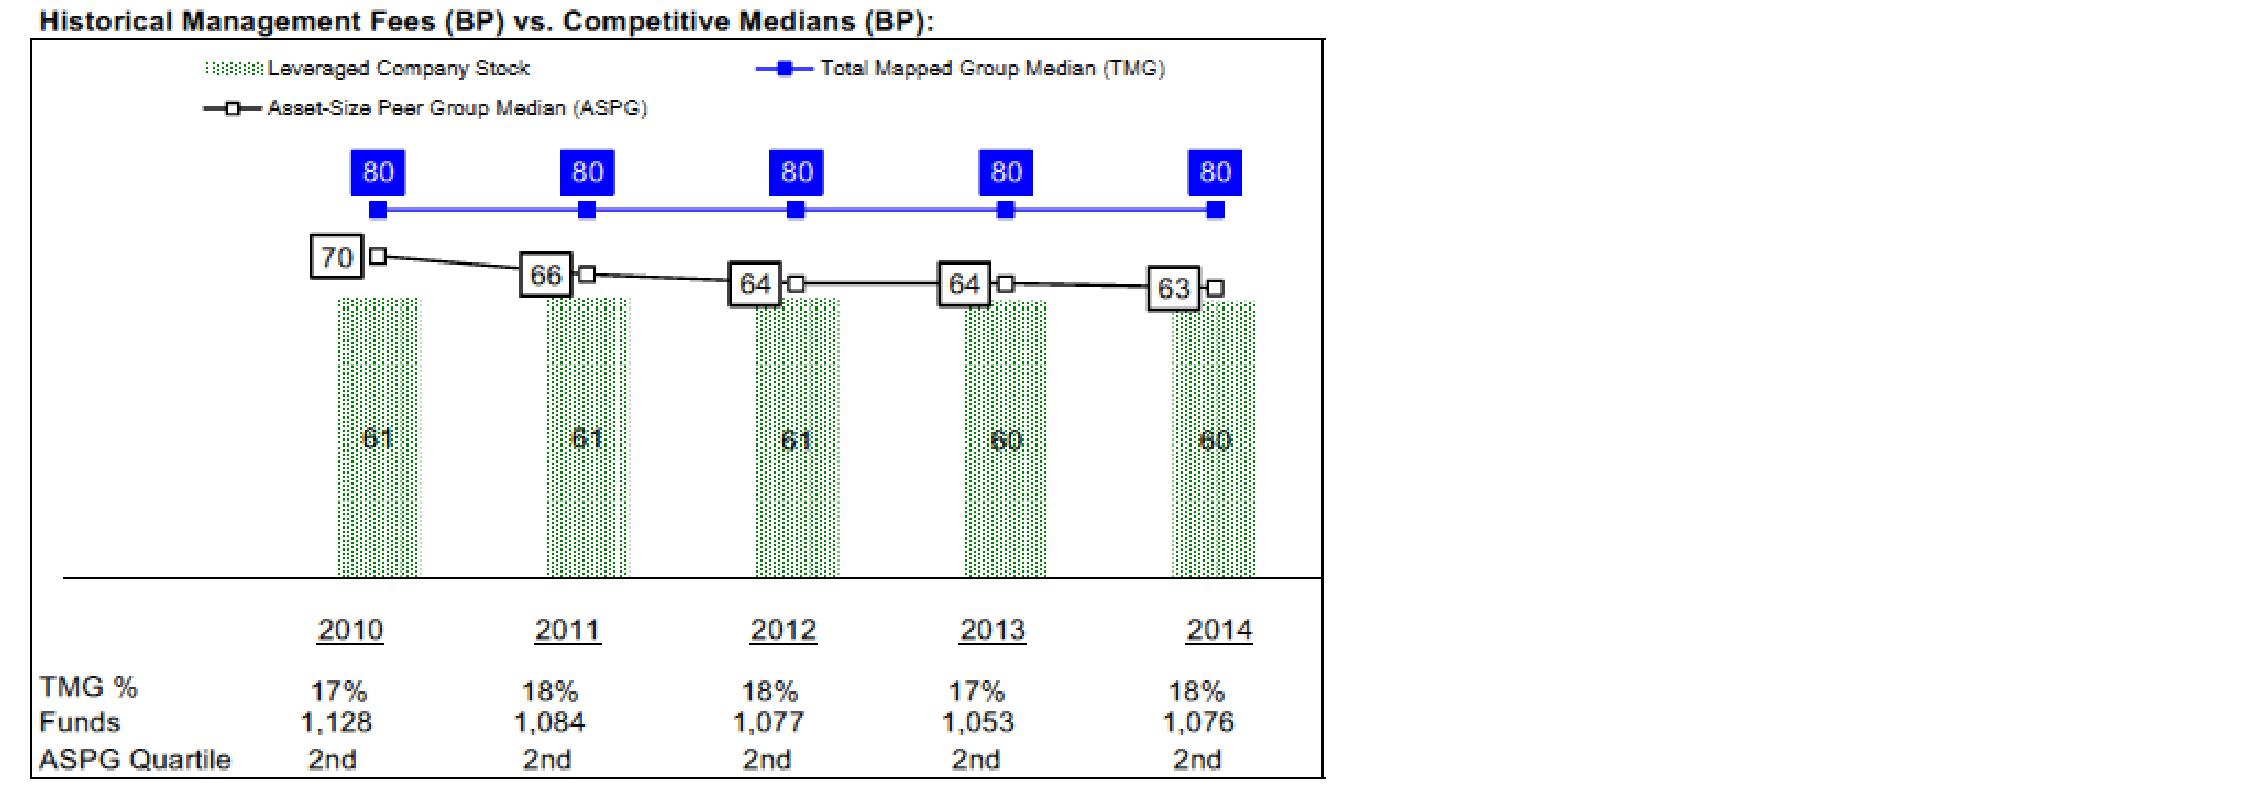
The Board noted that the fund's management fee rate ranked below the median of its Total Mapped Group and below the median of its ASPG for 2014.
The Board noted that, in 2014, the ad hoc Committee on Group Fee was formed by it and other Fidelity fund boards to conduct an in-depth review of the "group fee" component of the management fee of funds with such management fee structures. Committee focus included the mechanics of the group fee, the competitive landscape of group fee structures, Fidelity funds with no group fee component and investment products not included in group fee assets. The Board also considered that, for funds subject to the group fee, FMR agreed to voluntarily waive fees over a specified period of time in amounts designed to account for assets converted from certain funds to certain collective investment trusts.
Annual Report
The Board also noted that, in 2013, the ad hoc Committee on Management Fees was formed to conduct an in-depth review of the management fee rates of Fidelity's active equity mutual funds. The Committee focused on the following areas: (i) standard fee structures; (ii) research consumption and trading evolution; (iii) management fee competitiveness/profitability by category; and (iv) factors that drive institutional pricing.
Based on its review, the Board concluded that the fund's management fee is fair and reasonable in light of the services that the fund receives and the other factors considered.
Total Expense Ratio. In its review of each class's total expense ratio, the Board considered the fund's management fee as well as other fund or class expenses, as applicable, such as transfer agent fees, pricing and bookkeeping fees, and custodial, legal, and audit fees. The Board also noted that Fidelity may agree to waive fees and expenses from time to time, and the extent to which, if any, it has done so for the fund. As part of its review, the Board also considered the current and historical total expense ratios of each class of the fund compared to competitive fund median expenses. Each class of the fund is compared to those funds and classes in the Total Mapped Group (used by the Board for management fee comparisons) that have a similar sales load structure.
The Board noted that the total expense ratio of each class ranked below its competitive median for 2014.
Fees Charged to Other Fidelity Clients. The Board also considered Fidelity fee structures and other information with respect to clients of Fidelity, such as other funds advised or subadvised by Fidelity, pension plan clients, and other institutional clients with similar mandates. The Board noted the findings of the 2013 ad hoc joint committee (created with the board of other Fidelity funds), which reviewed and compared Fidelity's institutional investment advisory business with its business of providing services to the Fidelity funds, including the differences in services provided, fees charged, and costs incurred, as well as competition in their respective marketplaces.
Based on its review of total expense ratios and fees charged to other Fidelity clients, the Board concluded that the total expense ratio of each class of the fund was reasonable in light of the services that the fund and its shareholders receive and the other factors considered.
Costs of the Services and Profitability. The Board considered the revenues earned and the expenses incurred by Fidelity in conducting the business of developing, marketing, distributing, managing, administering and servicing the fund and servicing the fund's shareholders. The Board also considered the level of Fidelity's profits in respect of all the Fidelity funds.
Annual Report
Board Approval of Investment Advisory Contracts and
Management Fees - continued
On an annual basis, Fidelity presents to the Board information about the profitability of its relationship with the fund. Fidelity calculates profitability information for each fund, as well as aggregate profitability information for groups of Fidelity funds and all Fidelity funds, using a series of detailed revenue and cost allocation methodologies which originate with the books and records of Fidelity on which Fidelity's audited financial statements are based. The Audit Committee of the Board reviews any significant changes from the prior year's methodologies.
PricewaterhouseCoopers LLP (PwC), independent registered public accounting firm and auditor to Fidelity and certain Fidelity funds, has been engaged annually by the Board as part of the Board's assessment of Fidelity's profitability analysis. PwC's engagement includes the review and assessment of the methodologies used by Fidelity in determining the revenues and expenses attributable to Fidelity's mutual fund business, and completion of agreed-upon procedures in respect of the mathematical accuracy of fund profitability and its conformity to established allocation methodologies. After considering PwC's reports issued under the engagement and information provided by Fidelity, the Board concluded that while other allocation methods may also be reasonable, Fidelity's profitability methodologies are reasonable in all material respects.
The Board also reviewed Fidelity's non-fund businesses and fall-out benefits related to the mutual fund business as well as cases where Fidelity's affiliates may benefit from or be related to the fund's business.
The Board considered the costs of the services provided by and the profits realized by Fidelity in connection with the operation of the fund and was satisfied that the profitability was not excessive.
Economies of Scale. The Board considered whether there have been economies of scale in respect of the management of the Fidelity funds, whether the Fidelity funds (including the fund) have appropriately benefited from any such economies of scale, and whether there is potential for realization of any further economies of scale. The Board considered the extent to which the fund will benefit from economies of scale as assets grow through increased services to the fund, through waivers or reimbursements, or through fee or expense ratio reductions. The Board also noted that in 2013, it and the boards of other Fidelity funds created an ad hoc committee (the Economies of Scale Committee) to analyze whether Fidelity attains economies of scale in respect of the management and servicing of the Fidelity funds, whether the Fidelity funds have appropriately benefited from such economies of scale, and whether there is potential for realization of any further economies of scale.
The Board recognized that the fund's management contract incorporates a "group fee" structure, which provides for lower group fee rates as total group assets increase, and for higher group fee rates as total group assets decrease (with "group assets" defined to include fund assets under FMR's management plus sector fund assets previously under FMR's management and currently managed by Fidelity SelectCo, LLC). FMR calculates the group fee rates based on a tiered asset "breakpoint" schedule that varies based on asset class. The Board considered that the group fee is designed to deliver the benefits of economies of scale to fund shareholders when total Fidelity fund assets increase, even if assets of any particular fund are unchanged or have declined, because some portion of Fidelity's costs are attributable to services provided to all Fidelity funds, and all funds benefit if those costs can be allocated among more assets. The Board concluded that, given the group fee structure, fund shareholders will benefit from lower management fees as group assets increase at the fund complex level, regardless of whether Fidelity achieves any such economies of scale.
Annual Report
The Board concluded, taking into account the analysis of the Economies of Scale Committee, that economies of scale, if any, are being appropriately shared between fund shareholders and Fidelity.
Additional Information Requested by the Board. In order to develop fully the factual basis for consideration of the Fidelity funds' Advisory Contracts, the Board requested and received additional information on certain topics, including: (i) fund performance trends and Fidelity's long-term strategies for certain funds; (ii) the various share classes employed by Fidelity and the attributes of each class, together with similar information on the distribution and servicing payments made by Fidelity or the funds to third-party participants in the distribution channels; (iii) fund profitability, and fund performance in relation to fund profitability; (iv) the methodology with respect to evaluating competitive fund data and peer group classifications and fee comparisons; (v) annual fund profitability margins, with particular focus on certain funds with negative margins; (vi) the realization of fall-out benefits in certain Fidelity business units; (vii) economies of scale and the way in which they are shared with fund shareholders; (viii) Fidelity's group fee structures, including the group fee schedule of breakpoints; (ix) the impact of cost containment measures on the funds; and (x) the transfer agent fee structure.
Based on its evaluation of all of the conclusions noted above, and after considering all factors it believed relevant, the Board concluded that the advisory fee structures are fair and reasonable, and that the fund's Advisory Contracts should be renewed.
Annual Report
Investment Adviser
Fidelity Management & Research Company
Boston, MA
Investment Sub-Advisers
FMR Co., Inc.
FMR Investment Management
(U.K.) Limited
Fidelity Management & Research
(Hong Kong) Limited
Fidelity Management & Research
(Japan) Limited
General Distributor
Fidelity Distributors Corporation
Smithfield, RI
Transfer and Service Agents
Fidelity Investments Institutional
Operations Company, Inc.
Boston, MA
Fidelity Service Company, Inc.
Boston, MA
Custodian
JPMorgan Chase Bank
New York, NY
(Fidelity Investment logo)(registered trademark)
Corporate Headquarters
245 Summer St., Boston, MA 02210
www.fidelity.com
LSF-K-UANN-0915
1.863381.106
Fidelity®
Series Small Cap Opportunities
Fund
Fidelity Series Small Cap Opportunities Fund
Class F
Annual Report
July 31, 2015
(Fidelity Cover Art)
Contents
Performance | (Click Here) | How the fund has done over time. |
Management's Discussion of Fund Performance | (Click Here) | The Portfolio Manager's review of fund performance and strategy. |
Shareholder Expense Example | (Click Here) | An example of shareholder expenses. |
Investment Changes | (Click Here) | A summary of major shifts in the fund's investments over the past six months. |
Investments | (Click Here) | A complete list of the fund's investments with their market values. |
Financial Statements | (Click Here) | Statements of assets and liabilities, operations, and changes in net assets, as well as financial highlights. |
Notes | (Click Here) | Notes to the financial statements. |
Report of Independent Registered Public Accounting Firm | (Click Here) | |
Trustees and Officers | (Click Here) | |
Distributions | (Click Here) | |
Board Approval of Investment Advisory Contracts and Management Fees | (Click Here) | |
To view a fund's proxy voting guidelines and proxy voting record for the 12-month period ended June 30, visit http://www.fidelity.com/proxyvotingresults or visit the Securities and Exchange Commission's (SEC) web site at http://www.sec.gov. You may also call 1-800-544-8544 for Fidelity® Series Small Cap Opportunities Fund or 1-800-835-5092 for Class F of the fund to request a free copy of the proxy voting guidelines.
Standard & Poor's, S&P and S&P 500 are registered service marks of The McGraw-Hill Companies, Inc. and have been licensed for use by Fidelity Distributors Corporation.
Other third-party marks appearing herein are the property of their respective owners.
All other marks appearing herein are registered or unregistered trademarks or service marks of FMR LLC or an affiliated company. © 2015 FMR LLC. All rights reserved.
Annual Report
This report and the financial statements contained herein are submitted for the general information of the shareholders of the fund. This report is not authorized for distribution to prospective investors in the fund unless preceded or accompanied by an effective prospectus.
A fund files its complete schedule of portfolio holdings with the SEC for the first and third quarters of each fiscal year on Form N-Q. Forms N-Q are available on the SEC's web site at http://www.sec.gov. A fund's Forms N-Q may be reviewed and copied at the SEC's Public Reference Room in Washington, DC. Information regarding the operation of the SEC's Public Reference Room may be obtained by calling 1-800-SEC-0330. For a complete list of a fund's portfolio holdings, view the most recent holdings listing, semiannual report, or annual report on Fidelity's web site at http://www.fidelity.com, http://www.advisor.fidelity.com, or http://www.401k.com, as applicable.
NOT FDIC INSURED • MAY LOSE VALUE • NO BANK GUARANTEE
Neither the fund nor Fidelity Distributors Corporation is a bank.
Annual Report
Average annual total return reflects the change in the value of an investment, assuming reinvestment of the class' distributions from dividend income and capital gains (the profits earned upon the sale of securities that have grown in value, if any) and assuming a constant rate of performance each year. The $10,000 table and the fund's returns do not reflect the deduction of taxes that a shareholder would pay on fund distributions or the redemption of fund shares. During periods of reimbursement by Fidelity, a fund's total return will be greater than it would be had the reimbursement not occurred. How a fund did yesterday is no guarantee of how it will do tomorrow.
Average Annual Total Returns
Periods ended July 31, 2015 | Past 1
year | Past 5
years | Life of
fund A |
Fidelity ® Series Small Cap Opportunities Fund | 12.66% | 14.71% | 6.98% |
Class F B | 12.87% | 14.92% | 7.14% |
A From March 22, 2007.
B The initial offering of Class F shares took place on June 26, 2009. Returns prior to June 26, 2009, are those of Fidelity Series Small Cap Opportunities Fund, the original class of the fund.
$10,000 Over Life of Fund
Let's say hypothetically that $10,000 was invested in Fidelity Series Small Cap Opportunities Fund, a class of the fund, on March 22, 2007, when the fund started. The chart shows how the value of your investment would have changed, and also shows how the Russell 2000® Index performed over the same period.
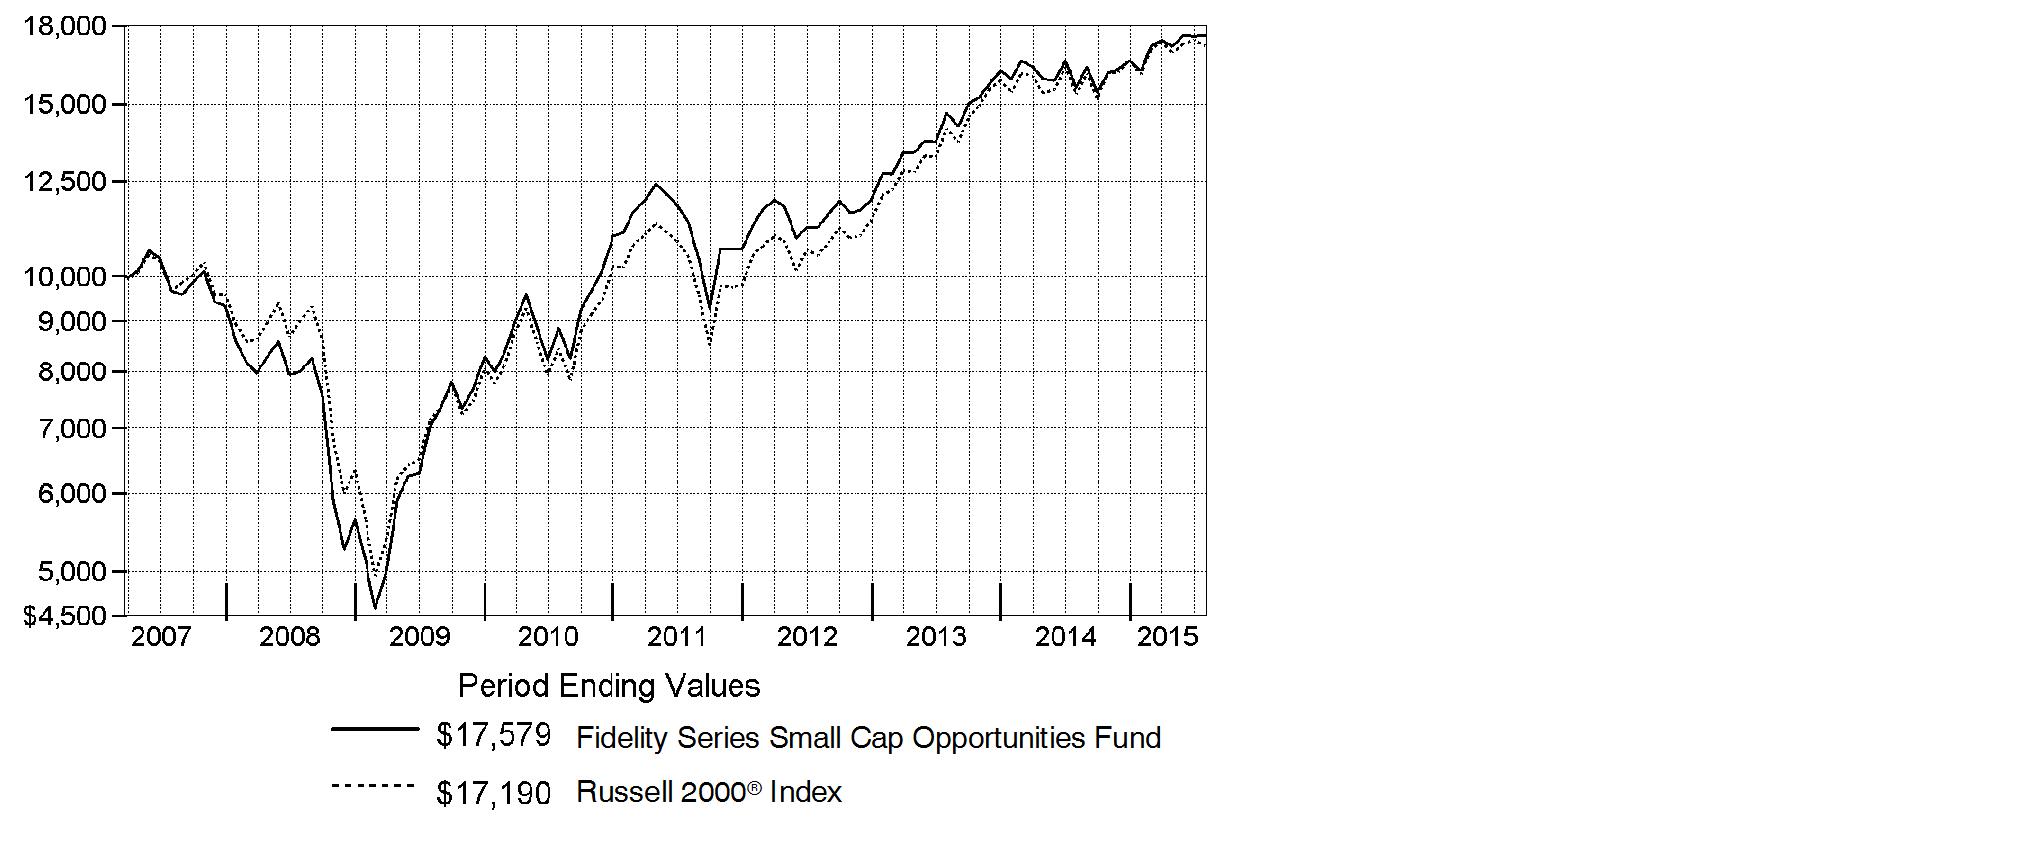
Annual Report
Market Recap: The U.S. equity market gained strongly for the 12 months ending July 31, 2015, as stocks recovered from volatility in late 2014 and early 2015, supported by a still-positive economic backdrop. The S&P 500® Index returned 11.21%, with growth stocks in the index far outpacing value-oriented names on prospects for continued U.S. economic growth. Consequently, the growth-oriented Nasdaq Composite Index® rose 18.71%, outpacing the broader S&P 500®, as well as the 12.03% advance of the smaller-cap Russell 2000® Index. Within the S&P 500®, seven of 10 sectors notched a gain, with significant performance variation. Health care (+27%) led the way, aided by merger activity. Consumer discretionary (+24%) benefited from spending linked to a seven-year low in unemployment. Strong first halves for the consumer staples sector and the real estate segment of financials yielded above-market returns (19% and 12%, respectively) for the full-year period. Conversely, energy (-26%) significantly lagged, due to a roughly 55% decline for U.S. crude-oil prices. Materials (-4%) also lost ground. At period end, investors remained focused on the slowing rate of U.S. earnings growth, the possible effect of a relatively stronger U.S. dollar on exports and inflation, and whether an economic slowdown in China would create ripples for the global economy.
Comments from Lead Portfolio Manager Richard Thompson: For the year, the fund's share classes outperformed the benchmark, the Russell 2000® Index. (For specific class-level results, please see the Performance section of this report.) Stock selection, particularly within health care's pharmaceuticals, biotechnology & life sciences segment, drove relative outperformance. On an individual basis, biopharmaceutical companies Auspex Pharmaceuticals and Neurocrine Biosciences were the top two relative contributors. Auspex Pharmaceuticals, which we sold by period end, rose in response to December's positive Phase 3 data for its lead drug targeting Huntington's disease. Neurocrine Biosciences performed well after announcing positive Phase 3 results for its drug aimed at reducing symptoms of endometriosis. Elsewhere, longtime holding Sapient, a digital marketing technology firm, rose following its acquisition in February by French holding company Publicis Groupe. We sold the position by period end. Conversely, positioning in the materials sector detracted from the fund's relative result. An overweighted position in Stone Energy was particularly detrimental, as the stock fell in July due to lower oil and gas prices. We significantly decreased the fund's stake by period end. The fund's position in chemical company Tronox also disappointed.
The views expressed above reflect those of the portfolio manager(s) only through the end of the period as stated on the cover of this report and do not necessarily represent the views of Fidelity or any other person in the Fidelity organization. Any such views are subject to change at any time based upon market or other conditions and Fidelity disclaims any responsibility to update such views. These views may not be relied on as investment advice and, because investment decisions for a Fidelity fund are based on numerous factors, may not be relied on as an indication of trading intent on behalf of any Fidelity fund.
Annual Report
Shareholder Expense Example
As a shareholder of the Fund, you incur two types of costs: (1) transaction costs, and (2) ongoing costs, including management fees and other Fund expenses. This Example is intended to help you understand your ongoing costs (in dollars) of investing in the Fund and to compare these costs with the ongoing costs of investing in other mutual funds.
The Example is based on an investment of $1,000 invested at the beginning of the period and held for the entire period (February 1, 2015 to July 31, 2015).
Actual Expenses
The first line of the accompanying table for each class of the Fund provides information about actual account values and actual expenses. You may use the information in this line, together with the amount you invested, to estimate the expenses that you paid over the period. Simply divide your account value by $1,000.00 (for example, an $8,600 account value divided by $1,000.00 = 8.6), then multiply the result by the number in the first line for a class of the Fund under the heading entitled "Expenses Paid During Period" to estimate the expenses you paid on your account during this period. In addition, the Fund, as a shareholder in the underlying Fidelity Central Funds, will indirectly bear its pro-rata share of the fees and expenses incurred by the underlying Fidelity Central Funds. These fees and expenses are not included in the Fund's annualized expense ratio used to calculate the expense estimate in the table below.
Hypothetical Example for Comparison Purposes
The second line of the accompanying table for each class of the Fund provides information about hypothetical account values and hypothetical expenses based on a Class' actual expense ratio and an assumed rate of return of 5% per year before expenses, which is not the Class' actual return. The hypothetical account values and expenses may not be used to estimate the actual ending account balance or expenses you paid for the period. You may use this information to compare the ongoing costs of investing in the Fund and other funds. To do so, compare this 5% hypothetical example with the 5% hypothetical examples that appear in the shareholder reports of the other funds. In addition, the Fund, as a shareholder in the underlying Fidelity Central Funds, will indirectly bear its pro-rata share of the fees and expenses incurred by the underlying Fidelity Central Funds. These fees and expenses are not included in the Fund's annualized expense ratio used to calculate the expense estimate in the table below.
Please note that the expenses shown in the table are meant to highlight your ongoing costs only and do not reflect any transaction costs. Therefore, the second line of the table is useful in comparing ongoing costs only, and will not help you determine the relative total costs of owning different funds.
Annual Report
| Annualized
Expense RatioB | Beginning
Account Value
February 1, 2015 | Ending
Account Value
July 31, 2015 | Expenses Paid
During Period*
February 1, 2015 to July 31, 2015 |
Series Small Cap Opportunities | .76% | | | |
Actual | | $ 1,000.00 | $ 1,084.70 | $ 3.93 |
HypotheticalA | | $ 1,000.00 | $ 1,021.03 | $ 3.81 |
Class F | .60% | | | |
Actual | | $ 1,000.00 | $ 1,085.80 | $ 3.10 |
HypotheticalA | | $ 1,000.00 | $ 1,021.82 | $ 3.01 |
A 5% return per year before expenses
B Annualized expense ratio reflects expenses net of applicable fee waivers.
* Expenses are equal to each Class' annualized expense ratio, multiplied by the average account value over the period, multiplied by 181/365 (to reflect the one-half year period).
Annual Report
Investment Changes (Unaudited)
Top Ten Stocks as of July 31, 2015 |
| % of fund's
net assets | % of fund's net assets
6 months ago |
Bank of the Ozarks, Inc. | 1.4 | 1.1 |
Huntington Bancshares, Inc. | 1.3 | 1.2 |
Global Payments, Inc. | 1.3 | 1.1 |
PacWest Bancorp | 1.3 | 1.2 |
Allied World Assur Co. Holdings AG | 1.2 | 0.9 |
Mid-America Apartment Communities, Inc. | 1.1 | 1.1 |
Maximus, Inc. | 1.1 | 0.9 |
Associated Banc-Corp. | 1.1 | 0.9 |
Banner Corp. | 1.1 | 0.9 |
MB Financial, Inc. | 1.1 | 0.9 |
| 12.0 | |
Top Five Market Sectors as of July 31, 2015 |
| % of fund's
net assets | % of fund's net assets
6 months ago |
Financials | 23.2 | 23.1 |
Information Technology | 16.4 | 18.3 |
Health Care | 15.5 | 14.4 |
Consumer Discretionary | 13.7 | 13.3 |
Industrials | 12.6 | 12.0 |
Asset Allocation (% of fund's net assets) |
As of July 31, 2015 * | As of January 31, 2015 ** |
 | Stocks and
Equity Futures 95.8% | |  | Stocks and
Equity Futures 96.6% | |
 | Short-Term
Investments and
Net Other Assets (Liabilities) 4.2% | |  | Short-Term
Investments and
Net Other Assets (Liabilities) 3.4% | |
* Foreign investments | 7.7% | | ** Foreign investments | 7.5% | |

Annual Report
Investments July 31, 2015
Showing Percentage of Net Assets
Common Stocks - 94.5% |
| Shares | | Value |
CONSUMER DISCRETIONARY - 13.7% |
Auto Components - 2.0% |
Cooper Tire & Rubber Co. | 650,080 | | $ 21,407,134 |
Horizon Global Corp. (a) | 556,883 | | 6,972,175 |
Standard Motor Products, Inc. | 446,634 | | 16,333,405 |
Tenneco, Inc. (a) | 839,086 | | 41,794,874 |
Visteon Corp. (a) | 246,300 | | 24,514,239 |
| | 111,021,827 |
Diversified Consumer Services - 0.7% |
Service Corp. International | 1,237,200 | | 37,746,972 |
Hotels, Restaurants & Leisure - 2.9% |
Bloomin' Brands, Inc. | 1,362,116 | | 31,723,682 |
Brinker International, Inc. | 609,200 | | 36,491,080 |
Buffalo Wild Wings, Inc. (a) | 188,300 | | 36,827,714 |
Domino's Pizza, Inc. | 153,900 | | 17,519,976 |
Texas Roadhouse, Inc. Class A | 996,043 | | 39,234,134 |
| | 161,796,586 |
Household Durables - 1.3% |
Ethan Allen Interiors, Inc. (d) | 1,308,735 | | 39,510,710 |
Jarden Corp. (a) | 621,322 | | 34,172,710 |
| | 73,683,420 |
Leisure Products - 0.7% |
Brunswick Corp. | 784,900 | | 41,670,341 |
Media - 1.2% |
MDC Partners, Inc. Class A (sub. vtg.) | 1,400,058 | | 24,683,027 |
Nexstar Broadcasting Group, Inc. Class A | 686,017 | | 39,349,935 |
| | 64,032,962 |
Multiline Retail - 0.5% |
Dillard's, Inc. Class A | 273,744 | | 27,889,039 |
Specialty Retail - 2.1% |
Chico's FAS, Inc. | 1,308,629 | | 19,917,333 |
Genesco, Inc. (a) | 358,525 | | 23,192,982 |
GNC Holdings, Inc. | 711,900 | | 35,032,599 |
Murphy U.S.A., Inc. (a) | 385,100 | | 21,088,076 |
Zumiez, Inc. (a) | 771,282 | | 20,130,460 |
| | 119,361,450 |
Textiles, Apparel & Luxury Goods - 2.3% |
Deckers Outdoor Corp. (a) | 416,900 | | 30,383,672 |
Common Stocks - continued |
| Shares | | Value |
CONSUMER DISCRETIONARY - continued |
Textiles, Apparel & Luxury Goods - continued |
G-III Apparel Group Ltd. (a) | 749,174 | | $ 54,112,838 |
Steven Madden Ltd. (a) | 1,031,439 | | 42,990,378 |
| | 127,486,888 |
TOTAL CONSUMER DISCRETIONARY | | 764,689,485 |
CONSUMER STAPLES - 2.9% |
Beverages - 0.3% |
Coca-Cola Bottling Co. Consolidated | 97,255 | | 15,755,310 |
Food & Staples Retailing - 0.6% |
Casey's General Stores, Inc. | 327,550 | | 33,480,523 |
Food Products - 1.3% |
Aryzta AG | 276,930 | | 14,062,874 |
Greencore Group PLC | 4,117,809 | | 20,346,344 |
Ingredion, Inc. | 164,700 | | 14,526,540 |
J&J Snack Foods Corp. | 209,450 | | 24,790,502 |
| | 73,726,260 |
Personal Products - 0.7% |
Coty, Inc. Class A | 539,200 | | 14,412,816 |
Inter Parfums, Inc. | 706,100 | | 21,458,379 |
| | 35,871,195 |
TOTAL CONSUMER STAPLES | | 158,833,288 |
ENERGY - 2.9% |
Energy Equipment & Services - 0.9% |
Atwood Oceanics, Inc. | 445,226 | | 9,260,701 |
Bristow Group, Inc. | 539,649 | | 24,311,187 |
Total Energy Services, Inc. | 1,245,270 | | 14,082,306 |
| | 47,654,194 |
Oil, Gas & Consumable Fuels - 2.0% |
Boardwalk Pipeline Partners, LP | 1,333,200 | | 18,558,144 |
Diamondback Energy, Inc. | 319,793 | | 21,522,069 |
Newfield Exploration Co. (a) | 616,612 | | 20,218,707 |
PDC Energy, Inc. (a) | 367,200 | | 17,240,040 |
Common Stocks - continued |
| Shares | | Value |
ENERGY - continued |
Oil, Gas & Consumable Fuels - continued |
Stone Energy Corp. (a) | 1,604,546 | | $ 9,290,321 |
Western Refining, Inc. | 592,712 | | 26,174,162 |
| | 113,003,443 |
TOTAL ENERGY | | 160,657,637 |
FINANCIALS - 23.2% |
Banks - 9.7% |
Associated Banc-Corp. | 3,012,513 | | 59,376,631 |
BancFirst Corp. | 472,978 | | 30,086,131 |
Bank of the Ozarks, Inc. | 1,792,674 | | 79,092,773 |
Banner Corp. (e) | 1,244,271 | | 59,301,956 |
BBCN Bancorp, Inc. | 3,045,910 | | 46,754,719 |
City National Corp. | 109,111 | | 9,810,170 |
Huntington Bancshares, Inc. | 6,317,900 | | 73,729,893 |
Investors Bancorp, Inc. | 3,969,400 | | 48,347,292 |
MB Financial, Inc. | 1,737,200 | | 59,238,520 |
PacWest Bancorp | 1,550,388 | | 71,767,461 |
| | 537,505,546 |
Capital Markets - 3.3% |
AURELIUS AG | 857,135 | | 41,419,335 |
OM Asset Management Ltd. | 2,415,724 | | 42,685,843 |
Raymond James Financial, Inc. | 686,700 | | 40,515,300 |
Waddell & Reed Financial, Inc. Class A | 1,273,441 | | 57,190,235 |
| | 181,810,713 |
Insurance - 3.2% |
Allied World Assur Co. Holdings AG | 1,639,013 | | 69,264,689 |
Aspen Insurance Holdings Ltd. | 760,690 | | 36,581,582 |
Primerica, Inc. | 890,205 | | 40,263,972 |
StanCorp Financial Group, Inc. | 295,277 | | 33,667,484 |
| | 179,777,727 |
Real Estate Investment Trusts - 6.0% |
Cousins Properties, Inc. | 4,688,720 | | 48,668,914 |
Equity Lifestyle Properties, Inc. | 846,500 | | 48,995,420 |
Home Properties, Inc. | 621,090 | | 45,774,333 |
Kite Realty Group Trust | 1,481,298 | | 39,106,267 |
Mid-America Apartment Communities, Inc. | 742,400 | | 59,644,416 |
Common Stocks - continued |
| Shares | | Value |
FINANCIALS - continued |
Real Estate Investment Trusts - continued |
National Retail Properties, Inc. (d) | 1,190,441 | | $ 44,248,692 |
Ramco-Gershenson Properties Trust (SBI) | 2,795,450 | | 47,354,923 |
| | 333,792,965 |
Thrifts & Mortgage Finance - 1.0% |
WSFS Financial Corp. (e) | 1,975,653 | | 56,720,998 |
TOTAL FINANCIALS | | 1,289,607,949 |
HEALTH CARE - 15.5% |
Biotechnology - 9.2% |
ACADIA Pharmaceuticals, Inc. (a)(d) | 639,927 | | 31,234,837 |
Agios Pharmaceuticals, Inc. (a)(d) | 164,063 | | 18,076,461 |
Anacor Pharmaceuticals, Inc. (a) | 245,900 | | 36,685,821 |
Ardelyx, Inc. (a) | 15,200 | | 299,744 |
BioCryst Pharmaceuticals, Inc. (a)(d) | 1,242,950 | | 19,240,866 |
BioMarin Pharmaceutical, Inc. (a) | 130,044 | | 19,021,536 |
Biotie Therapies Corp. sponsored ADR | 653,800 | | 11,722,634 |
bluebird bio, Inc. (a) | 113,768 | | 18,866,147 |
Cellectis SA sponsored ADR | 448,095 | | 15,911,853 |
Chimerix, Inc. (a) | 467,290 | | 25,112,165 |
Coherus BioSciences, Inc. | 564,911 | | 19,817,078 |
Curis, Inc. (a) | 5,523,406 | | 17,343,495 |
Dyax Corp. (a) | 1,100,015 | | 27,071,369 |
Genocea Biosciences, Inc. (a)(d) | 888,582 | | 11,551,566 |
Insmed, Inc. (a) | 916,635 | | 24,840,809 |
Intercept Pharmaceuticals, Inc. (a) | 71,798 | | 18,941,030 |
Isis Pharmaceuticals, Inc. (a) | 278,872 | | 15,318,439 |
La Jolla Pharmaceutical Co. (a)(d) | 468,100 | | 14,230,240 |
Mirati Therapeutics, Inc. (a)(d) | 585,269 | | 16,744,546 |
Neurocrine Biosciences, Inc. (a) | 609,582 | | 30,552,250 |
Novavax, Inc. (a) | 2,403,762 | | 28,989,370 |
Spark Therapeutics, Inc. | 312,600 | | 19,206,144 |
TESARO, Inc. (a) | 362,700 | | 21,036,600 |
Ultragenyx Pharmaceutical, Inc. (a) | 259,700 | | 31,405,521 |
Xencor, Inc. (a) | 870,300 | | 19,486,017 |
| | 512,706,538 |
Health Care Equipment & Supplies - 2.7% |
CONMED Corp. | 238,300 | | 13,516,376 |
Hologic, Inc. (a) | 590,100 | | 24,583,566 |
Common Stocks - continued |
| Shares | | Value |
HEALTH CARE - continued |
Health Care Equipment & Supplies - continued |
Integra LifeSciences Holdings Corp. (a) | 313,668 | | $ 20,115,529 |
NxStage Medical, Inc. (a) | 948,600 | | 13,546,008 |
Seaspine Holdings Corp. (a) | 78,373 | | 1,228,889 |
Sirona Dental Systems, Inc. (a) | 260,000 | | 26,982,800 |
Teleflex, Inc. | 190,100 | | 25,471,499 |
Wright Medical Group, Inc. (a) | 904,800 | | 23,380,032 |
| | 148,824,699 |
Health Care Providers & Services - 2.1% |
AmSurg Corp. (a) | 354,100 | | 25,403,134 |
Molina Healthcare, Inc. (a) | 157,400 | | 11,872,682 |
Surgical Care Affiliates, Inc. (a) | 856,636 | | 32,569,301 |
Team Health Holdings, Inc. (a) | 486,800 | | 32,815,188 |
Wellcare Health Plans, Inc. (a) | 188,800 | | 15,255,040 |
| | 117,915,345 |
Life Sciences Tools & Services - 0.4% |
Bruker Corp. (a) | 1,198,066 | | 25,219,289 |
Pharmaceuticals - 1.1% |
Prestige Brands Holdings, Inc. (a) | 433,654 | | 20,650,603 |
Theravance, Inc. (d) | 1,126,649 | | 17,260,263 |
ZS Pharma, Inc. (a) | 351,800 | | 21,013,014 |
| | 58,923,880 |
TOTAL HEALTH CARE | | 863,589,751 |
INDUSTRIALS - 12.6% |
Aerospace & Defense - 1.4% |
Moog, Inc. Class A (a) | 437,417 | | 29,245,701 |
Teledyne Technologies, Inc. (a) | 482,134 | | 49,982,832 |
| | 79,228,533 |
Air Freight & Logistics - 0.8% |
Hub Group, Inc. Class A (a) | 1,069,263 | | 45,048,050 |
Airlines - 0.5% |
JetBlue Airways Corp. (a) | 1,364,200 | | 31,349,316 |
Commercial Services & Supplies - 1.2% |
Deluxe Corp. | 590,000 | | 38,013,700 |
West Corp. | 993,300 | | 28,656,705 |
| | 66,670,405 |
Construction & Engineering - 0.8% |
EMCOR Group, Inc. | 908,500 | | 43,453,555 |
Common Stocks - continued |
| Shares | | Value |
INDUSTRIALS - continued |
Electrical Equipment - 0.3% |
OSRAM Licht AG | 306,639 | | $ 17,457,964 |
Industrial Conglomerates - 0.4% |
Carlisle Companies, Inc. | 216,500 | | 21,922,790 |
Machinery - 3.2% |
AGCO Corp. | 513,000 | | 28,220,130 |
Kornit Digital Ltd. (a)(d) | 1,391,400 | | 20,230,956 |
KUKA AG (d) | 309,700 | | 26,550,394 |
Navistar International Corp. (a)(d) | 455,534 | | 7,990,066 |
Terex Corp. | 585,500 | | 12,974,680 |
TriMas Corp. (a) | 1,116,444 | | 26,236,434 |
Valmont Industries, Inc. (d) | 261,500 | | 29,086,645 |
Wabtec Corp. | 249,850 | | 25,282,322 |
| | 176,571,627 |
Professional Services - 1.9% |
Dun & Bradstreet Corp. | 279,206 | | 34,836,533 |
Huron Consulting Group, Inc. (a) | 424,631 | | 32,471,533 |
Stantec, Inc. | 1,364,400 | | 37,942,599 |
| | 105,250,665 |
Trading Companies & Distributors - 2.1% |
Kaman Corp. | 780,680 | | 30,813,440 |
Titan Machinery, Inc. (a)(d)(e) | 1,584,719 | | 22,265,302 |
Watsco, Inc. | 343,500 | | 44,050,440 |
WESCO International, Inc. (a) | 305,500 | | 18,745,480 |
| | 115,874,662 |
TOTAL INDUSTRIALS | | 702,827,567 |
INFORMATION TECHNOLOGY - 16.4% |
Communications Equipment - 1.3% |
F5 Networks, Inc. (a) | 163,800 | | 21,972,132 |
Ixia (a) | 2,544,369 | | 33,585,671 |
Radware Ltd. (a) | 844,101 | | 16,071,683 |
| | 71,629,486 |
Electronic Equipment & Components - 1.5% |
CDW Corp. | 1,272,500 | | 45,720,925 |
Jabil Circuit, Inc. | 425,614 | | 8,618,684 |
Trimble Navigation Ltd. (a) | 1,169,200 | | 27,008,520 |
| | 81,348,129 |
Common Stocks - continued |
| Shares | | Value |
INFORMATION TECHNOLOGY - continued |
Internet Software & Services - 3.1% |
Bankrate, Inc. (a) | 2,692,001 | | $ 24,551,049 |
EarthLink Holdings Corp. | 508,568 | | 3,732,889 |
Gogo, Inc. (a)(d) | 198,600 | | 3,620,478 |
IAC/InterActiveCorp | 227,400 | | 17,568,924 |
MINDBODY, Inc. (e) | 526,600 | | 5,160,680 |
NIC, Inc. | 1,217,847 | | 21,969,960 |
Pandora Media, Inc. (a) | 910,600 | | 15,953,712 |
Rackspace Hosting, Inc. (a) | 784,317 | | 26,690,308 |
Stamps.com, Inc. (a) | 339,002 | | 23,255,537 |
Web.com Group, Inc. (a) | 1,129,741 | | 28,119,253 |
| | 170,622,790 |
IT Services - 4.1% |
Datalink Corp. (a)(e) | 1,664,540 | | 11,285,581 |
ExlService Holdings, Inc. (a) | 1,427,060 | | 55,327,116 |
Global Payments, Inc. | 651,300 | | 73,004,217 |
Maximus, Inc. | 871,000 | | 59,410,910 |
WEX, Inc. (a) | 313,800 | | 32,020,152 |
| | 231,047,976 |
Semiconductors & Semiconductor Equipment - 1.8% |
Cirrus Logic, Inc. (a) | 666,102 | | 21,988,027 |
Intersil Corp. Class A | 1,686,800 | | 18,774,084 |
Monolithic Power Systems, Inc. | 653,070 | | 33,770,250 |
PMC-Sierra, Inc. (a) | 1,679,300 | | 11,436,033 |
Qorvo, Inc. (a) | 243,150 | | 14,090,543 |
| | 100,058,937 |
Software - 2.9% |
BroadSoft, Inc. (a) | 575,749 | | 20,105,155 |
CommVault Systems, Inc. (a) | 625,777 | | 23,447,864 |
Interactive Intelligence Group, Inc. (a) | 407,900 | | 16,911,534 |
Pegasystems, Inc. | 592,600 | | 16,053,534 |
Rovi Corp. (a) | 1,109,759 | | 12,196,251 |
SolarWinds, Inc. (a) | 355,200 | | 14,168,928 |
Synchronoss Technologies, Inc. (a) | 942,361 | | 45,044,856 |
Tangoe, Inc. (a) | 1,274,400 | | 14,043,888 |
| | 161,972,010 |
Technology Hardware, Storage & Peripherals - 1.7% |
Electronics for Imaging, Inc. (a) | 661,525 | | 30,231,693 |
Nimble Storage, Inc. (a)(d) | 778,300 | | 21,496,646 |
Quantum Corp. (a) | 11,950,411 | | 12,667,436 |
Common Stocks - continued |
| Shares | | Value |
INFORMATION TECHNOLOGY - continued |
Technology Hardware, Storage & Peripherals - continued |
Silicon Graphics International Corp. (a)(d)(e) | 2,187,649 | | $ 11,178,886 |
Super Micro Computer, Inc. (a) | 679,170 | | 18,113,464 |
| | 93,688,125 |
TOTAL INFORMATION TECHNOLOGY | | 910,367,453 |
MATERIALS - 3.9% |
Chemicals - 2.1% |
Axiall Corp. | 830,346 | | 24,437,083 |
PolyOne Corp. | 1,055,401 | | 36,168,592 |
Sensient Technologies Corp. | 492,900 | | 33,709,431 |
Tronox Ltd. Class A | 2,320,144 | | 25,475,181 |
| | 119,790,287 |
Containers & Packaging - 1.1% |
Avery Dennison Corp. | 308,500 | | 18,772,225 |
Berry Plastics Group, Inc. (a) | 1,254,860 | | 40,858,242 |
| | 59,630,467 |
Metals & Mining - 0.7% |
Compass Minerals International, Inc. | 392,300 | | 31,384,000 |
Steel Dynamics, Inc. | 363,800 | | 7,286,914 |
| | 38,670,914 |
TOTAL MATERIALS | | 218,091,668 |
TELECOMMUNICATION SERVICES - 0.7% |
Diversified Telecommunication Services - 0.5% |
8x8, Inc. (a) | 562,654 | | 4,900,716 |
Cogent Communications Group, Inc. | 407,400 | | 12,951,246 |
FairPoint Communications, Inc. (a) | 128,800 | | 2,140,656 |
Lumos Networks Corp. | 141,000 | | 1,968,360 |
Towerstream Corp. (a)(d)(e) | 5,386,878 | | 8,511,267 |
| | 30,472,245 |
Wireless Telecommunication Services - 0.2% |
RingCentral, Inc. (a) | 502,700 | | 9,903,190 |
TOTAL TELECOMMUNICATION SERVICES | | 40,375,435 |
Common Stocks - continued |
| Shares | | Value |
UTILITIES - 2.7% |
Electric Utilities - 1.5% |
El Paso Electric Co. | 490,480 | | $ 17,868,186 |
Great Plains Energy, Inc. | 604,080 | | 15,772,529 |
IDACORP, Inc. | 356,100 | | 22,117,371 |
Portland General Electric Co. | 691,832 | | 24,912,870 |
| | 80,670,956 |
Gas Utilities - 0.8% |
Atmos Energy Corp. | 397,786 | | 21,997,566 |
Laclede Group, Inc. | 464,400 | | 25,128,684 |
| | 47,126,250 |
Independent Power and Renewable Electricity Producers - 0.4% |
Dynegy, Inc. (a) | 604,120 | | 15,737,326 |
NextEra Energy Partners LP | 226,100 | | 8,067,248 |
| | 23,804,574 |
TOTAL UTILITIES | | 151,601,780 |
TOTAL COMMON STOCKS (Cost $4,457,016,586) |
5,260,642,013
|
Convertible Preferred Stocks - 0.0% |
| | | |
HEALTH CARE - 0.0% |
Biotechnology - 0.0% |
CytomX Therapeutics, Inc. Series D (g) (Cost $985,900) | 6,646,127 | |
985,900
|
U.S. Treasury Obligations - 0.1% |
| Principal Amount | | |
U.S. Treasury Bills, yield at date of purchase 0.01% to 0.05% 8/20/15 to 10/29/15 (f)
(Cost $2,309,836) | | $ 2,310,000 | |
2,309,745
|
Money Market Funds - 6.8% |
| Shares | | Value |
Fidelity Cash Central Fund, 0.17% (b) | 266,657,092 | | $ 266,657,092 |
Fidelity Securities Lending Cash Central Fund, 0.18% (b)(c) | 114,131,968 | | 114,131,968 |
TOTAL MONEY MARKET FUNDS (Cost $380,789,060) |
380,789,060
|
TOTAL INVESTMENT PORTFOLIO - 101.4% (Cost $4,841,101,382) | 5,644,726,718 |
NET OTHER ASSETS (LIABILITIES) - (1.4)% | (76,212,855) |
NET ASSETS - 100% | $ 5,568,513,863 |
Futures Contracts |
| Expiration Date | | Underlying Face Amount at Value | | Unrealized Appreciation/
(Depreciation) |
Purchased |
Equity Index Contracts |
573 ICE Russell 2000 Index Contracts (United States) | Sept. 2015 | | $ 70,776,960 | | $ (847,982) |
|
The face value of futures purchased as a percentage of net assets is 1.3% |
Legend |
(a) Non-income producing |
(b) Affiliated fund that is generally available only to investment companies and other accounts managed by Fidelity Investments. The rate quoted is the annualized seven-day yield of the fund at period end. A complete unaudited listing of the fund's holdings as of its most recent quarter end is available upon request. In addition, each Fidelity Central Fund's financial statements, which are not covered by the Fund's Report of Independent Registered Public Accounting Firm, are available on the SEC's website or upon request. |
(c) Investment made with cash collateral received from securities on loan. |
(d) Security or a portion of the security is on loan at period end. |
(e) Affiliated company |
(f) Security or a portion of the security was pledged to cover margin requirements for futures contracts. At period end, the value of securities pledged amounted to $2,309,745. |
(g) Restricted securities - Investment in securities not registered under the Securities Act of 1933 (excluding 144A issues). At the end of the period, the value of restricted securities (excluding 144A issues) amounted to $985,900 or 0.0% of net assets. |
Additional information on each restricted holding is as follows: |
Security | Acquisition Date | Acquisition Cost |
CytomX Therapeutics, Inc. Series D | 6/12/15 | $ 985,900 |
Affiliated Central Funds |
Information regarding fiscal year to date income earned by the Fund from investments in Fidelity Central Funds is as follows: |
Fund | Income earned |
Fidelity Cash Central Fund | $ 299,253 |
Fidelity Securities Lending Cash Central Fund | 1,576,483 |
Total | $ 1,875,736 |
Other Affiliated Issuers |
An affiliated company is a company in which the Fund has ownership of at least 5% of the voting securities. Fiscal year to date transactions with companies which are or were affiliates are as follows: |
Affiliate | Value, beginning of period | Purchases | Sales Proceeds | Dividend Income | Value,
end of
period |
Banner Corp. | $ 51,542,249 | $ 417,731 | $ 2,061,937 | $ 915,639 | $ 59,301,956 |
Datalink Corp. | 12,863,242 | 7,529,400 | 2,261,824 | - | 11,285,581 |
MINDBODY, Inc. | - | 6,953,481 | - | - | 5,160,680 |
Mirati Therapeutics, Inc. | 11,960,748 | 4,157,488 | 10,021,640 | - | - |
Neonode, Inc. | 9,543,365 | - | 6,658,007 | - | - |
Points International Ltd. | 25,447,665 | 1,527,795 | 15,779,855 | - | - |
ServiceSource International, Inc. | 19,646,501 | - | 17,738,035 | - | - |
Silicon Graphics International Corp. | 20,729,984 | 76,909 | - | - | 11,178,886 |
Titan Machinery, Inc. | 22,881,167 | 335,898 | 13,239 | - | 22,265,302 |
Towerstream Corp. | 8,888,349 | - | - | - | 8,511,267 |
WSFS Financial Corp. | 31,559,736 | 15,904,340 | - | 350,835 | 56,720,998 |
Total | $ 215,063,006 | $ 36,903,042 | $ 54,534,537 | $ 1,266,474 | $ 174,424,670 |
Other Information |
The following is a summary of the inputs used, as of July 31, 2015, involving the Fund's assets and liabilities carried at fair value. The inputs or methodology used for valuing securities may not be an indication of the risk associated with investing in those securities. For more information on valuation inputs, and their aggregation into the levels used in the table below, please refer to the Investment Valuation section in the accompanying Notes to Financial Statements. |
Valuation Inputs at Reporting Date: |
Description | Total | Level 1 | Level 2 | Level 3 |
Investments in Securities: | | | | |
Equities: | | | | |
Consumer Discretionary | $ 764,689,485 | $ 764,689,485 | $ - | $ - |
Consumer Staples | 158,833,288 | 158,833,288 | - | - |
Energy | 160,657,637 | 160,657,637 | - | - |
Financials | 1,289,607,949 | 1,289,607,949 | - | - |
Health Care | 864,575,651 | 863,589,751 | - | 985,900 |
Industrials | 702,827,567 | 702,827,567 | - | - |
Information Technology | 910,367,453 | 910,367,453 | - | - |
Materials | 218,091,668 | 218,091,668 | - | - |
Telecommunication Services | 40,375,435 | 40,375,435 | - | - |
Utilities | 151,601,780 | 151,601,780 | - | - |
U.S. Government and Government Agency Obligations | 2,309,745 | - | 2,309,745 | - |
Money Market Funds | 380,789,060 | 380,789,060 | - | - |
Total Investments in Securities: | $ 5,644,726,718 | $ 5,641,431,073 | $ 2,309,745 | $ 985,900 |
Derivative Instruments: | | | | |
Liabilities | | | | |
Futures Contracts | $ (847,982) | $ (847,982) | $ - | $ - |
Value of Derivative Instruments |
The following table is a summary of the Fund's value of derivative instruments by primary risk exposure as of July 31, 2015. For additional information on derivative instruments, please refer to the Derivative Instruments section in the accompanying Notes to Financial Statements. |
Primary Risk Exposure /
Derivative Type | Value |
| Asset | Liability |
Equity Risk | | |
Futures Contracts (a) | $ - | $ (847,982) |
Total Value of Derivatives | $ - | $ (847,982) |
(a) Reflects gross cumulative appreciation (depreciation) on futures contracts as presented in the Schedule of Investments. Only the period end receivable or payable for daily variation margin and net unrealized appreciation (depreciation) are presented in the Statement of Assets and Liabilities. |
See accompanying notes which are an integral part of the financial statements.
Annual Report
Statement of Assets and Liabilities
| | July 31, 2015 |
| | |
Assets | | |
Investment in securities, at value (including securities loaned of $112,671,575) - See accompanying schedule: Unaffiliated issuers (cost $4,275,200,095) | $ 5,089,512,988 | |
Fidelity Central Funds (cost $380,789,060) | 380,789,060 | |
Other affiliated issuers (cost $185,112,227) | 174,424,670 | |
Total Investments (cost $4,841,101,382) | | $ 5,644,726,718 |
Cash | | 712,233 |
Receivable for investments sold | | 90,114,887 |
Receivable for fund shares sold | | 24,211,667 |
Dividends receivable | | 2,222,676 |
Distributions receivable from Fidelity Central Funds | | 95,761 |
Receivable for daily variation margin for derivative instruments | | 230,926 |
Other receivables | | 114,847 |
Total assets | | 5,762,429,715 |
| | |
Liabilities | | |
Payable for investments purchased | $ 76,296,680 | |
Payable for fund shares redeemed | 225,466 | |
Accrued management fee | 2,718,562 | |
Other affiliated payables | 461,362 | |
Other payables and accrued expenses | 81,814 | |
Collateral on securities loaned, at value | 114,131,968 | |
Total liabilities | | 193,915,852 |
| | |
Net Assets | | $ 5,568,513,863 |
Net Assets consist of: | | |
Paid in capital | | $ 4,480,321,226 |
Undistributed net investment income | | 12,811,213 |
Accumulated undistributed net realized gain (loss) on investments and foreign currency transactions | | 272,643,973 |
Net unrealized appreciation (depreciation) on investments and assets and liabilities in foreign currencies | | 802,737,451 |
Net Assets | | $ 5,568,513,863 |
See accompanying notes which are an integral part of the financial statements.
Annual Report
Statement of Assets and Liabilities - continued
| | July 31, 2015 |
Series Small Cap Opportunities: | | |
Net Asset Value, offering price and redemption price per
share ($2,647,013,034 ÷ 191,418,342 shares) | | $ 13.83 |
| | |
Class F: | | |
Net Asset Value, offering price and redemption price per
share ($2,921,500,829 ÷ 209,933,416 shares) | | $ 13.92 |
See accompanying notes which are an integral part of the financial statements.
Annual Report
Financial Statements - continued
Statement of Operations
| Year ended July 31, 2015 |
| | |
Investment Income | | |
Dividends (including $1,266,474 earned from other affiliated issuers) | | $ 63,511,400 |
Interest | | 642 |
Income from Fidelity Central Funds | | 1,875,736 |
Total income | | 65,387,778 |
| | |
Expenses | | |
Management fee | | |
Basic fee | $ 39,022,431 | |
Performance adjustment | (6,980,672) | |
Transfer agent fees | 4,422,763 | |
Accounting and security lending fees | 1,146,445 | |
Custodian fees and expenses | 114,582 | |
Independent trustees' compensation | 23,317 | |
Audit | 79,942 | |
Legal | 13,334 | |
Miscellaneous | 37,062 | |
Total expenses before reductions | 37,879,204 | |
Expense reductions | (420,978) | 37,458,226 |
Net investment income (loss) | | 27,929,552 |
Realized and Unrealized Gain (Loss) Net realized gain (loss) on: | | |
Investment securities: | | |
Unaffiliated issuers | 338,332,404 | |
Other affiliated issuers | (45,102,364) | |
Foreign currency transactions | 119,297 | |
Futures contracts | 6,391,915 | |
Total net realized gain (loss) | | 299,741,252 |
Change in net unrealized appreciation (depreciation) on: Investment securities | 340,861,886 | |
Assets and liabilities in foreign currencies | (28,286) | |
Futures contracts | 91,405 | |
Total change in net unrealized appreciation (depreciation) | | 340,925,005 |
Net gain (loss) | | 640,666,257 |
Net increase (decrease) in net assets resulting from operations | | $ 668,595,809 |
See accompanying notes which are an integral part of the financial statements.
Annual Report
Statement of Changes in Net Assets
| Year ended
July 31,
2015 | Year ended
July 31,
2014 |
Increase (Decrease) in Net Assets | | |
Operations | | |
Net investment income (loss) | $ 27,929,552 | $ 12,448,754 |
Net realized gain (loss) | 299,741,252 | 388,400,199 |
Change in net unrealized appreciation (depreciation) | 340,925,005 | (189,066,056) |
Net increase (decrease) in net assets resulting from operations | 668,595,809 | 211,782,897 |
Distributions to shareholders from net investment income | (23,180,446) | (2,397,517) |
Distributions to shareholders from net realized gain | (274,549,615) | (355,403,438) |
Total distributions | (297,730,061) | (357,800,955) |
Share transactions - net increase (decrease) | 171,463,697 | 2,217,612,913 |
Total increase (decrease) in net assets | 542,329,445 | 2,071,594,855 |
| | |
Net Assets | | |
Beginning of period | 5,026,184,418 | 2,954,589,563 |
End of period (including undistributed net investment income of $12,811,213 and undistributed net investment income of $9,455,513, respectively) | $ 5,568,513,863 | $ 5,026,184,418 |
See accompanying notes which are an integral part of the financial statements.
Annual Report
Financial Highlights - Series Small Cap Opportunities
Years ended July 31, | 2015 | 2014 | 2013 | 2012 | 2011 |
Selected Per-Share Data | | | | | |
Net asset value, beginning of period | $ 12.96 | $ 13.55 | $ 10.93 | $ 11.22 | $ 8.76 |
Income from Investment Operations | | | | | |
Net investment income (loss) B | .05 | .02 | .04 | -H | -E,H |
Net realized and unrealized gain (loss) | 1.53 | .77 | 3.20 | (.17) | 2.50 |
Total from investment operations | 1.58 | .79 | 3.24 | (.17) | 2.50 |
Distributions from net investment income | (.04) | -H | (.05) | -H | -F |
Distributions from net realized gain | (.66) | (1.38) | (.57) | (.11) | (.04)F |
Total distributions | (.71)K | (1.38) | (.62) | (.12)J | (.04) |
Net asset value, end of period | $ 13.83 | $ 12.96 | $ 13.55 | $ 10.93 | $ 11.22 |
Total ReturnA | 12.66% | 6.29% | 30.91% | (1.41)% | 28.50% |
Ratios to Average Net Assets C, G | | | | | |
Expenses before reductions | .77% | .82% | .98% | 1.12% | 1.10% |
Expenses net of fee waivers, if any | .76% | .82% | .98% | 1.12% | 1.10% |
Expenses net of all reductions | .76% | .82% | .96% | 1.11% | 1.09% |
Net investment income (loss) | .41% | .19% | .30% | .04% | (.04)%E |
Supplemental Data | | | | | |
Net assets, end of period (000 omitted) | $ 2,647,013 | $ 2,425,973 | $ 1,602,664 | $ 1,329,447 | $ 1,415,570 |
Portfolio turnover rateD | 59% | 90%I | 77% | 66% | 73% |
A Total returns would have been lower if certain expenses had not been reduced during the applicable periods shown.
B Calculated based on average shares outstanding during the period.
C Fees and expenses of any underlying Fidelity Central Funds are not included in the Fund's expense ratio. The Fund indirectly bears its proportionate share of the expenses of any underlying Fidelity Central Funds.
D Amount does not include the portfolio activity of any underlying Fidelity Central Funds.
E Investment income per share reflects a large, non-recurring dividend which amounted to $.02 per share. Excluding this non-recurring dividend, the ratio of net investment income (loss) to average net assets would have been (.27) %.
F The amounts shown reflect certain reclassifications related to book to tax differences that were made in the year shown.
G Expense ratios reflect operating expenses of the class. Expenses before reductions do not reflect amounts reimbursed by the investment adviser or reductions from brokerage service arrangements or reductions from other expense offset arrangements and do not represent the amount paid by the class during periods when reimbursements or reductions occur. Expenses net of fee waivers reflect expenses after reimbursement by the investment adviser but prior to reductions from brokerage service arrangements or other expense offset arrangements. Expenses net of all reductions represent the net expenses paid by the class.
H Amount represents less than $.01 per share.
I Portfolio turnover rate excludes securities received or delivered in-kind.
J Total distributions of $.12 per share is comprised of distributions from net investment income of $.003 and distributions from net realized gain of $.113 per share.
K Total distributions of $.71 per share is comprised of distributions from net investment income of $.042 and distributions from net realized gain of $.664 per share.
See accompanying notes which are an integral part of the financial statements.
Annual Report
Financial Highlights - Class F
Years ended July 31, | 2015 | 2014 | 2013 | 2012 | 2011 |
Selected Per-Share Data | | | | | |
Net asset value, beginning of period | $ 13.04 | $ 13.62 | $ 10.99 | $ 11.27 | $ 8.79 |
Income from Investment Operations | | | | | |
Net investment income (loss) B | .08 | .05 | .06 | .03 | .02E |
Net realized and unrealized gain (loss) | 1.53 | .77 | 3.21 | (.18) | 2.50 |
Total from investment operations | 1.61 | .82 | 3.27 | (.15) | 2.52 |
Distributions from net investment income | (.07) | (.01) | (.07) | (.01) | -F |
Distributions from net realized gain | (.66) | (1.39) | (.57) | (.11) | (.04)F |
Total distributions | (.73) | (1.40) | (.64) | (.13)I | (.04) |
Net asset value, end of period | $ 13.92 | $ 13.04 | $ 13.62 | $ 10.99 | $ 11.27 |
Total ReturnA | 12.87% | 6.52% | 31.09% | (1.23)% | 28.74% |
Ratios to Average Net Assets C, G | | | | | |
Expenses before reductions | .60% | .65% | .79% | .91% | .89% |
Expenses net of fee waivers, if any | .60% | .65% | .79% | .91% | .89% |
Expenses net of all reductions | .59% | .65% | .77% | .91% | .88% |
Net investment income (loss) | .58% | .36% | .49% | .24% | .17%E |
Supplemental Data | | | | | |
Net assets, end of period (000 omitted) | $ 2,921,501 | $ 2,600,212 | $ 1,351,926 | $ 923,975 | $ 478,821 |
Portfolio turnover rateD | 59% | 90%H | 77% | 66% | 73% |
A Total returns would have been lower if certain expenses had not been reduced during the applicable periods shown.
B Calculated based on average shares outstanding during the period.
C Fees and expenses of any underlying Fidelity Central Funds are not included in the Fund's expense ratio. The Fund indirectly bears its proportionate share of the expenses of any underlying Fidelity Central Funds.
D Amount does not include the portfolio activity of any underlying Fidelity Central Funds.
E Investment income per share reflects a large, non-recurring dividend which amounted to $.02 per share. Excluding this non-recurring dividend, the ratio of net investment income (loss) to average net assets would have been (.06) %.
F The amounts shown reflect certain reclassifications related to book to tax differences that were made in the year shown.
G Expense ratios reflect operating expenses of the class. Expenses before reductions do not reflect amounts reimbursed by the investment adviser or reductions from brokerage service arrangements or reductions from other expense offset arrangements and do not represent the amount paid by the class during periods when reimbursements or reductions occur. Expenses net of fee waivers reflect expenses after reimbursement by the investment adviser but prior to reductions from brokerage service arrangements or other expense offset arrangements. Expenses net of all reductions represent the net expenses paid by the class.
H Portfolio turnover rate excludes securities received or delivered in-kind.
I Total distributions of $.13 per share is comprised of distributions from net investment income of $.012 and distributions from net realized gain of $.113 per share.
See accompanying notes which are an integral part of the financial statements.
Annual Report
For the period ended July 31, 2015
1. Organization.
Fidelity Series Small Cap Opportunities Fund (the Fund) is a fund of Fidelity Securities Fund (the Trust) and is authorized to issue an unlimited number of shares. Shares of the Fund are only available for purchase by mutual funds for which Fidelity Management & Research Company (FMR) or an affiliate serves as an investment manager and, for shares of Series Small Cap Opportunities, FMR investment professionals. The Trust is registered under the Investment Company Act of 1940, as amended (the 1940 Act), as an open-end management investment company organized as a Massachusetts business trust. The Fund offers Series Small Cap Opportunities and Class F shares, each of which has equal rights as to assets and voting privileges. Each class has exclusive voting rights with respect to matters that affect that class.
2. Investments in Fidelity Central Funds.
The Fund invests in Fidelity Central Funds, which are open-end investment companies generally available only to other investment companies and accounts managed by the investment adviser and its affiliates. The Fund's Schedule of Investments lists each of the Fidelity Central Funds held as of period end, if any, as an investment of the Fund, but does not include the underlying holdings of each Fidelity Central Fund. As an Investing Fund, the Fund indirectly bears its proportionate share of the expenses of the underlying Fidelity Central Funds.
The Money Market Central Funds seek preservation of capital and current income and are managed by Fidelity Investments Money Management, Inc. (FIMM), an affiliate of the investment adviser. Annualized expenses of the Money Market Central Funds as of their most recent shareholder report date are less than .01%.
A complete unaudited list of holdings for each Fidelity Central Fund is available upon request or at the Securities and Exchange Commission (the SEC) website at www.sec.gov. In addition, the financial statements of the Fidelity Central Funds, which are not covered by the Fund's Report of Independent Registered Public Accounting Firm, are available on the SEC website or upon request.
3. Significant Accounting Policies.
The financial statements have been prepared in conformity with accounting principles generally accepted in the United States of America (GAAP), which require management to make certain estimates and assumptions at the date of the financial statements. Actual results could differ from those estimates. Subsequent events, if any, through the date that the financial statements were issued have been evaluated in the preparation of the financial statements. The following summarizes the significant accounting policies of the Fund:
Annual Report
3. Significant Accounting Policies - continued
Investment Valuation. Investments are valued as of 4:00 p.m. Eastern time on the last calendar day of the period. The Board of Trustees (the Board) has delegated the day to day responsibility for the valuation of the Fund's investments to the FMR Fair Value Committee (the Committee). In accordance with valuation policies and procedures approved by the Board, the Fund attempts to obtain prices from one or more third party pricing vendors or brokers to value its investments. When current market prices, quotations or currency exchange rates are not readily available or reliable, investments will be fair valued in good faith by the Committee, in accordance with procedures adopted by the Board. Factors used in determining fair value vary by investment type and may include market or investment specific events, changes in interest rates and credit quality. The frequency with which these procedures are used cannot be predicted and they may be utilized to a significant extent. The Committee oversees the Fund's valuation policies and procedures and reports to the Board on the Committee's activities and fair value determinations. The Board monitors the appropriateness of the procedures used in valuing the Fund's investments and ratifies the fair value determinations of the Committee.
The Fund categorizes the inputs to valuation techniques used to value its investments into a disclosure hierarchy consisting of three levels as shown below:
Level 1 - quoted prices in active markets for identical investments
Level 2 - other significant observable inputs (including quoted prices for similar investments, interest rates, prepayment speeds, etc.)
Level 3 - unobservable inputs (including the Fund's own assumptions based on the best information available)
Valuation techniques used to value the Fund's investments by major category are as follows:
Equity securities, including restricted securities, for which market quotations are readily available, are valued at the last reported sale price or official closing price as reported by a third party pricing vendor on the primary market or exchange on which they are traded and are categorized as Level 1 in the hierarchy. In the event there were no sales during the day or closing prices are not available, securities are valued at the last quoted bid price or may be valued using the last available price and are generally categorized as Level 2 in the hierarchy. For foreign equity securities, when market or security specific events arise, comparisons to the valuation of American Depositary Receipts (ADRs), futures contracts, Exchange-Traded Funds (ETFs) and certain indexes as well as quoted prices for similar securities may be used and would be categorized as Level 2 in the hierarchy. Utilizing these techniques may result in transfers between Level 1 and Level 2.
Annual Report
Notes to Financial Statements - continued
3. Significant Accounting Policies - continued
Investment Valuation - continued
For equity securities, including restricted securities, where observable inputs are limited, assumptions about market activity and risk are used and these securities may be categorized as Level 3 in the hierarchy.
Debt securities, including restricted securities, are valued based on evaluated prices received from third party pricing vendors or from brokers who make markets in such securities. U.S. government and government agency obligations are valued by pricing vendors who utilize matrix pricing which considers yield or price of bonds of comparable quality, coupon, maturity and type or by broker-supplied prices. When independent prices are unavailable or unreliable, debt securities may be valued utilizing pricing methodologies which consider similar factors that would be used by third party pricing vendors. Debt securities are generally categorized as Level 2 in the hierarchy but may be Level 3 depending on the circumstances
Futures contracts are valued at the settlement price established each day by the board of trade or exchange on which they are traded and are categorized as Level 1 in the hierarchy. Investments in open-end mutual funds, including the Fidelity Central Funds, are valued at their closing net asset value (NAV) each business day and are categorized as Level 1 in the hierarchy.
Changes in valuation techniques may result in transfers in or out of an assigned level within the disclosure hierarchy. The aggregate value of investments by input level as of July 31, 2015, is included at the end of the Fund's Schedule of Investments.
Foreign Currency. The Fund may use foreign currency contracts to facilitate transactions in foreign-denominated securities. Gains and losses from these transactions may arise from changes in the value of the foreign currency or if the counterparties do not perform under the contracts' terms.
Foreign-denominated assets, including investment securities, and liabilities are translated into U.S. dollars at the exchange rates at period end. Purchases and sales of investment securities, income and dividends received and expenses denominated in foreign currencies are translated into U.S. dollars at the exchange rate in effect on the transaction date.
The effects of exchange rate fluctuations on investments are included with the net realized and unrealized gain (loss) on investment securities. Other foreign currency transactions resulting in realized and unrealized gain (loss) are disclosed separately.
Annual Report
3. Significant Accounting Policies - continued
Investment Transactions and Income. For financial reporting purposes, the Fund's investment holdings and NAV include trades executed through the end of the last business day of the period. The NAV per share for processing shareholder transactions is calculated as of the close of business of the New York Stock Exchange (NYSE), normally 4:00 p.m. Eastern time and includes trades executed through the end of the prior business day. Gains and losses on securities sold are determined on the basis of identified cost and may include proceeds received from litigation. Dividend income is recorded on the ex-dividend date, except for certain dividends from foreign securities where the ex-dividend date may have passed, which are recorded as soon as the Fund is informed of the ex-dividend date. Non-cash dividends included in dividend income, if any, are recorded at the fair market value of the securities received. Income and capital gain distributions from Fidelity Central Funds, if any, are recorded on the ex-dividend date. Distributions received on securities that represent a return of capital or capital gain are recorded as a reduction of cost of investments and/or as a realized gain. Subsequent to ex-dividend date the Fund determines the components of these distributions, based upon receipt of tax filings or other correspondence relating to the underlying investment. Interest income is accrued as earned and includes coupon interest and amortization of premium and accretion of discount on debt securities as applicable. Investment income is recorded net of foreign taxes withheld where recovery of such taxes is uncertain.
Class Allocations and Expenses. Investment income, realized and unrealized capital gains and losses, common expenses of the Fund, and certain fund-level expense reductions, if any, are allocated daily on a pro-rata basis to each class based on the relative net assets of each class to the total net assets of the Fund. Each class differs with respect to transfer agent fees incurred. Certain expense reductions may also differ by class. For the reporting period, the allocated portion of income and expenses to each class as a percent of its average net assets may vary due to the timing of recording these transactions in relation to fluctuating net assets of the classes. Expenses directly attributable to a fund are charged to that fund. Expenses attributable to more than one fund are allocated among the respective funds on the basis of relative net assets or other appropriate methods. Expense estimates are accrued in the period to which they relate and adjustments are made when actual amounts are known.
Income Tax Information and Distributions to Shareholders. Each year, the Fund intends to qualify as a regulated investment company under Subchapter M of the Internal Revenue Code, including distributing substantially all of its taxable income and realized gains. As a result, no provision for U.S. Federal income taxes is required. As of July 31, 2015, the Fund did not have any unrecognized tax benefits in the financial statements; nor is the Fund aware of any tax positions for which it is reasonably possible that the total amounts of unrecognized tax benefits will significantly change in the next
Annual Report
Notes to Financial Statements - continued
3. Significant Accounting Policies - continued
Income Tax Information and Distributions to Shareholders - continued
twelve months. The Fund files a U.S. federal tax return, in addition to state and local tax returns as required. The Fund's federal income tax returns are subject to examination by the Internal Revenue Service (IRS) for a period of three fiscal years after they are filed. State and local tax returns may be subject to examination for an additional fiscal year depending on the jurisdiction. Foreign taxes are provided for based on the Fund's understanding of the tax rules and rates that exist in the foreign markets in which it invests.
Distributions are declared and recorded on the ex-dividend date. Income dividends and capital gain distributions are declared separately for each class. Income and capital gain distributions are determined in accordance with income tax regulations, which may differ from GAAP.
Capital accounts within the financial statements are adjusted for permanent book-tax differences. These adjustments have no impact on net assets or the results of operations. Capital accounts are not adjusted for temporary book-tax differences which will reverse in a subsequent period.
Book-tax differences are primarily due to future transactions, foreign currency transactions, market discount, partnerships and losses deferred due to wash sales.
The federal tax cost of investment securities and unrealized appreciation (depreciation) as of period end were as follows:
Gross unrealized appreciation | $ 1,145,896,165 |
Gross unrealized depreciation | (345,435,252) |
Net unrealized appreciation (depreciation) on securities | $ 800,460,913 |
| |
Tax Cost | $ 4,844,265,805 |
The tax-based components of distributable earnings as of period end were as follows:
Undistributed ordinary income | $ 12,811,205 |
Undistributed long-term capital gain | $ 274,960,422 |
Net unrealized appreciation (depreciation) on securities and other investments | $ 800,421,010 |
Annual Report
3. Significant Accounting Policies - continued
Income Tax Information and Distributions to Shareholders - continued
The tax character of distributions paid was as follows:
| July 31, 2015 | July 31, 2014 |
Ordinary Income | $ 111,703,354 | $ 93,611,792 |
Long-term Capital Gains | 186,026,707 | 264,189,163 |
Total | $ 297,730,061 | $ 357,800,955 |
Restricted Securities. The Fund may invest in securities that are subject to legal or contractual restrictions on resale. These securities generally may be resold in transactions exempt from registration or to the public if the securities are registered. Disposal of these securities may involve time-consuming negotiations and expense, and prompt sale at an acceptable price may be difficult. Information regarding restricted securities is included at the end of the Fund's Schedule of Investments.
4. Derivative Instruments.
Risk Exposures and the Use of Derivative Instruments. The Fund's investment objective allows the Fund to enter into various types of derivative contracts, including futures contracts. Derivatives are investments whose value is primarily derived from underlying assets, indices or reference rates and may be transacted on an exchange or over-the-counter (OTC). Derivatives may involve a future commitment to buy or sell a specified asset based on specified terms, to exchange future cash flows at periodic intervals based on a notional principal amount, or for one party to make one or more payments upon the occurrence of specified events in exchange for periodic payments from the other party.
The Fund used derivatives to increase returns and to manage exposure to certain risks as defined below. The success of any strategy involving derivatives depends on analysis of numerous economic factors, and if the strategies for investment do not work as intended, the Fund may not achieve its objectives.
The Fund's use of derivatives increased or decreased its exposure to the following risk:
Equity Risk | Equity risk relates to the fluctuations in the value of financial instruments as a result of changes in market prices (other than those arising from interest rate risk or foreign exchange risk), whether caused by factors specific to an individual investment, its issuer, or all factors affecting all instruments traded in a market or market segment. |
Annual Report
Notes to Financial Statements - continued
4. Derivative Instruments - continued
Risk Exposures and the Use of Derivative Instruments - continued
The Fund is also exposed to additional risks from investing in derivatives, such as liquidity risk and counterparty credit risk. Liquidity risk is the risk that the Fund will be unable to close out the derivative in the open market in a timely manner. Counterparty credit risk is the risk that the counterparty will not be able to fulfill its obligation to the Fund. Counterparty credit risk related to exchange-traded futures contracts may be mitigated by the protection provided by the exchange on which they trade.
Investing in derivatives may involve greater risks than investing in the underlying assets directly and, to varying degrees, may involve risk of loss in excess of any initial investment and collateral received and amounts recognized in the Statement of Assets and Liabilities. In addition, there may be the risk that the change in value of the derivative contract does not correspond to the change in value of the underlying instrument.
Futures Contracts. A futures contract is an agreement between two parties to buy or sell a specified underlying instrument for a fixed price at a specified future date. The Fund used futures contracts to manage its exposure to the stock market.
Upon entering into a futures contract, a fund is required to deposit either cash or securities (initial margin) with a clearing broker in an amount equal to a certain percentage of the face value of the contract. Futures contracts are marked-to-market daily and subsequent daily payments (variation margin) are made or received by a fund depending on the daily fluctuations in the value of the futures contracts and are recorded as unrealized appreciation or (depreciation). This receivable and/or payable, if any, is included in daily variation margin for derivative instruments in the Statement of Assets and Liabilities. Realized gain or (loss) is recorded upon the expiration or closing of a futures contract.
Any open futures contracts at period end are presented in the Schedule of Investments under the caption "Futures Contracts." The underlying face amount at value reflects each contract's exposure to the underlying instrument or index at period end and is representative of volume of activity during the period. Securities deposited to meet initial margin requirements are identified in the Schedule of Investments.
During the period the Fund recognized net realized gain (loss) of $6,391,915 and a change in net unrealized appreciation (depreciation) of $91,405 related to its investment in futures contracts. These amounts are included in the Statement of Operations.
5. Purchases and Sales of Investments.
Purchases and sales of securities, other than short-term securities, aggregated $3,123,618,646 and $3,373,569,732, respectively.
Annual Report
6. Fees and Other Transactions with Affiliates.
Management Fee. Fidelity Management & Research Company (the investment adviser) and its affiliates provide the Fund with investment management related services for which the Fund pays a monthly management fee. The management fee is the sum of an individual fund fee rate that is based on an annual rate of .45% of the Fund's average net assets and an annualized group fee rate that averaged .25% during the period. The group fee rate is based upon the average net assets of all the mutual funds advised by the investment adviser, including any mutual funds previously advised by the investment adviser that are currently advised by Fidelity SelectCo, LLC, an affiliate of the investment adviser. The group fee rate decreases as assets under management increase and increases as assets under management decrease. In addition, the management fee is subject to a performance adjustment (up to a maximum of ± .20% of the Fund's average net assets over a 36 month performance period). The upward or downward adjustment to the management fee is based on the relative investment performance of Series Small Cap Opportunities as compared to its benchmark index, the Russell 2000® Index, over the same 36 month performance period. For the reporting period, the total annual management fee rate, including the performance adjustment, was .57% of the Fund's average net assets. The performance adjustment included in the management fee rate may be higher or lower than the maximum performance adjustment rate due to the difference between the average net assets for the reporting and performance periods.
Transfer Agent Fees. Fidelity Investments Institutional Operations Company, Inc., (FIIOC), an affiliate of the investment adviser, is the transfer, dividend disbursing and shareholder servicing agent for each class of the Fund. FIIOC receives account fees and asset-based fees that vary according to the account size and type of account of the shareholders of Series Small Cap Opportunities. FIIOC receives no fees for providing transfer agency services to Class F. FIIOC pays for typesetting, printing and mailing of shareholder reports, except proxy statements.
For the period, transfer agent fees for each applicable class were as follows:
| Amount | % of
Class-Level Average
Net Assets |
Series Small Cap Opportunities | $ 4,422,763 | .17 |
Accounting and Security Lending Fees. Fidelity Service Company, Inc. (FSC), an affiliate of the investment adviser, maintains the Fund's accounting records. The accounting fee is based on the level of average net assets for each month. Under a separate contract, FSC administers the security lending program. The security lending fee is based on the number and duration of lending transactions.
Annual Report
Notes to Financial Statements - continued
6. Fees and Other Transactions with Affiliates - continued
Brokerage Commissions. The Fund placed a portion of its portfolio transactions with brokerage firms which are affiliates of the investment adviser. Brokerage commissions are included in net realized gain (loss) and change in net unrealized appreciation (depreciation) in the Statement of Operations. The commissions paid to these affiliated firms were $130,902 for the period.
7. Committed Line of Credit.
The Fund participates with other funds managed by the investment adviser or an affiliate in a $4.25 billion credit facility (the "line of credit") to be utilized for temporary or emergency purposes to fund shareholder redemptions or for other short-term liquidity purposes. The Fund has agreed to pay commitment fees on its pro-rata portion of the line of credit, which amounted to $8,049 and is reflected in Miscellaneous expenses on the Statement of Operations. During the period, the Fund did not borrow on this line of credit.
8. Security Lending.
The Fund lends portfolio securities through a lending agent from time to time in order to earn additional income. For equity securities, a lending agent is used and may loan securities to certain qualified borrowers, including Fidelity Capital Markets (FCM), a broker-dealer affiliated with the Fund. On the settlement date of the loan, the Fund receives collateral (in the form of U.S. Treasury obligations, letters of credit and/or cash) against the loaned securities and maintains collateral in an amount not less than 100% of the market value of the loaned securities during the period of the loan. The market value of the loaned securities is determined at the close of business of the Fund and any additional required collateral is delivered to the Fund on the next business day. If the borrower defaults on its obligation to return the securities loaned because of insolvency or other reasons, the Fund may apply collateral received from the borrower against the obligation. The Fund may experience delays and costs in recovering the securities loaned. Any cash collateral received is invested in the Fidelity Securities Lending Cash Central Fund. The value of loaned securities and cash collateral at period end are disclosed on the Fund's Statement of Assets and Liabilities. The value of securities loaned to FCM at period end was $4,824,526. Security lending income represents the income earned on investing cash collateral, less rebates paid to borrowers and any lending agent fees associated with the loan, plus any premium payments received for lending certain types of securities. Security lending income is presented in the Statement of Operations as a component of income from Fidelity Central Funds. Total security lending income during the period amounted to $1,576,483, including $66,216 from securities loaned to FCM.
Annual Report
9. Expense Reductions.
Commissions paid to certain brokers with whom the investment adviser, or its affiliates, places trades on behalf of the Fund include an amount in addition to trade execution, which may be rebated back to the Fund to offset certain expenses. This amount totaled $345,810 for the period. In addition, through arrangements with the Fund's custodian, credits realized as a result of uninvested cash balances were used to reduce the Fund's expenses. During the period, these credits reduced the Fund's custody expense by $443.
In addition, during the period the investment adviser reimbursed/waived a portion of fund-level operating expenses in the amount of $22,755 and a portion of class-level operating expenses as follows:
| Amount |
Series Small Cap Opportunities | $ 51,970 |
10. Distributions to Shareholders.
Distributions to shareholders of each class were as follows:
Years ended July 31, | 2015 | 2014 |
From net investment income | | |
Series Small Cap Opportunities | $ 8,552,160 | $ 562,708 |
Class F | 14,628,286 | 1,834,809 |
Total | $ 23,180,446 | $ 2,397,517 |
From net realized gain | | |
Series Small Cap Opportunities | $ 131,736,083 | $ 185,928,427 |
Class F | 142,813,532 | 169,475,011 |
Total | $ 274,549,615 | $ 355,403,438 |
11. Share Transactions.
Transactions for each class of shares were as follows:
| Shares | Dollars |
Years ended July 31, | 2015 | 2014 | 2015 | 2014 |
Series Small Cap Opportunities | | | | |
Shares sold | 28,483,380 | 88,985,520 A | $ 373,867,989 | $ 1,176,045,095 A |
Reinvestment of distributions | 11,011,697 | 14,725,510 | 140,288,243 | 186,491,135 |
Shares redeemed | (35,222,232) | (34,876,222) | (467,728,523) | (465,134,933) |
Net increase (decrease) | 4,272,845 | 68,834,808 | $ 46,427,709 | $ 897,401,297 |
Annual Report
Notes to Financial Statements - continued
11. Share Transactions - continued
| Shares | Dollars |
Years ended July 31, | 2015 | 2014 | 2015 | 2014 |
Class F | | | | |
Shares sold | 42,361,309 | 112,573,524 A | $ 560,257,508 | $ 1,499,078,862 A |
Reinvestment of distributions | 12,293,383 | 13,452,037 | 157,441,818 | 171,309,820 |
Shares redeemed | (44,064,466) | (25,924,826) | (592,663,338) | (350,177,066) |
Net increase (decrease) | 10,590,226 | 100,100,735 | $ 125,035,988 | $ 1,320,211,616 |
A Amount includes in-kind exchanges.
12. Other.
The Fund's organizational documents provide former and current trustees and officers with a limited indemnification against liabilities arising in connection with the performance of their duties to the Fund. In the normal course of business, the Fund may also enter into contracts that provide general indemnifications. The Fund's maximum exposure under these arrangements is unknown as this would be dependent on future claims that may be made against the Fund. The risk of material loss from such claims is considered remote.
At the end of the period, mutual funds managed by the investment adviser or its affiliates were the owners of record of all of the outstanding shares of the Fund.
Annual Report
To the Trustees of Fidelity Securities Fund and Shareholders of Fidelity Series Small Cap Opportunities Fund:
We have audited the accompanying statement of assets and liabilities of Fidelity Series Small Cap Opportunities Fund (the Fund), a fund of Fidelity Securities Fund, including the schedule of investments, as of July 31, 2015, and the related statement of operations for the year then ended, the statement of changes in net assets for each of the two years in the period then ended, and the financial highlights for each of the five years in the period then ended. These financial statements and financial highlights are the responsibility of the Fund's management. Our responsibility is to express an opinion on these financial statements and financial highlights based on our audits.
We conducted our audits in accordance with the standards of the Public Company Accounting Oversight Board (United States). Those standards require that we plan and perform the audit to obtain reasonable assurance about whether the financial statements and financial highlights are free of material misstatement. The Fund is not required to have, nor were we engaged to perform, an audit of its internal control over financial reporting. Our audits included consideration of internal control over financial reporting as a basis for designing audit procedures that are appropriate in the circumstances, but not for the purpose of expressing an opinion on the effectiveness of the Fund's internal control over financial reporting. Accordingly, we express no such opinion. An audit also includes examining, on a test basis, evidence supporting the amounts and disclosures in the financial statements, assessing the accounting principles used and significant estimates made by management, as well as evaluating the overall financial statement presentation. Our procedures included confirmation of securities owned as of July 31, 2015, by correspondence with the custodians and brokers; when replies were not received from brokers, we performed other auditing procedures. We believe that our audits provide a reasonable basis for our opinion.
In our opinion, such financial statements and financial highlights referred to above present fairly, in all material respects, the financial position of Fidelity Series Small Cap Opportunities Fund as of July 31, 2015, the results of its operations for the year then ended, the changes in its net assets for each of the two years in the period then ended, and the financial highlights for each of the five years in the period then ended, in conformity with accounting principles generally accepted in the United States of America.
DELOITTE & TOUCHE LLP
Boston, Massachusetts
September 17, 2015
Annual Report
The Trustees, Member of the Advisory Board, and officers of the trust and fund, as applicable, are listed below. The Board of Trustees governs the fund and is responsible for protecting the interests of shareholders. The Trustees are experienced executives who meet periodically throughout the year to oversee the fund's activities, review contractual arrangements with companies that provide services to the fund, oversee management of the risks associated with such activities and contractual arrangements, and review the fund's performance. Each of the Trustees oversees 170 funds.
The Trustees hold office without limit in time except that (a) any Trustee may resign; (b) any Trustee may be removed by written instrument, signed by at least two-thirds of the number of Trustees prior to such removal; (c) any Trustee who requests to be retired or who has become incapacitated by illness or injury may be retired by written instrument signed by a majority of the other Trustees; and (d) any Trustee may be removed at any special meeting of shareholders by a two-thirds vote of the outstanding voting securities of the trust. Each Trustee who is not an interested person (as defined in the 1940 Act) of the trust and the fund (Independent Trustee), shall retire not later than the last day of the calendar year in which his or her 75th birthday occurs. The Independent Trustees may waive this mandatory retirement age policy with respect to individual Trustees. The officers and Advisory Board Member hold office without limit in time, except that any officer and Advisory Board Member may resign or may be removed by a vote of a majority of the Trustees at any regular meeting or any special meeting of the Trustees. Except as indicated, each individual has held the office shown or other offices in the same company for the past five years.
Experience, Skills, Attributes, and Qualifications of the Fund's Trustees. The Governance and Nominating Committee has adopted a statement of policy that describes the experience, qualifications, attributes, and skills that are necessary and desirable for potential Independent Trustee candidates (Statement of Policy). The Board believes that each Trustee satisfied at the time he or she was initially elected or appointed a Trustee, and continues to satisfy, the standards contemplated by the Statement of Policy. The Governance and Nominating Committee also engages professional search firms to help identify potential Independent Trustee candidates who have the experience, qualifications, attributes, and skills consistent with the Statement of Policy. From time to time, additional criteria based on the composition and skills of the current Independent Trustees, as well as experience or skills that may be appropriate in light of future changes to board composition, business conditions, and regulatory or other developments, have also been considered by the professional search firms and the Governance and Nominating Committee. In addition, the Board takes into account the Trustees' commitment and participation in Board and committee meetings, as well as their leadership of standing and ad hoc committees throughout their tenure.
In determining that a particular Trustee was and continues to be qualified to serve as a Trustee, the Board has considered a variety of criteria, none of which, in isolation, was controlling. The Board believes that, collectively, the Trustees have balanced and diverse experience, qualifications, attributes, and skills, which allow the Board to operate effectively in governing the fund and protecting the interests of shareholders. Information about the specific experience, skills, attributes, and qualifications of each Trustee, which in each case led to the Board's conclusion that the Trustee should serve (or continue to serve) as a trustee of the fund, is provided below.
Annual Report
Trustees and Officers - continued
Board Structure and Oversight Function. James C. Curvey is an interested person (as defined in the 1940 Act) and currently serves as Chairman. The Trustees have determined that an interested Chairman is appropriate and benefits shareholders because an interested Chairman has a personal and professional stake in the quality and continuity of services provided to the fund. Independent Trustees exercise their informed business judgment to appoint an individual of their choosing to serve as Chairman, regardless of whether the Trustee happens to be independent or a member of management. The Independent Trustees have determined that they can act independently and effectively without having an Independent Trustee serve as Chairman and that a key structural component for assuring that they are in a position to do so is for the Independent Trustees to constitute a substantial majority for the Board. The Independent Trustees also regularly meet in executive session. Ned C. Lautenbach serves as Chairman of the Independent Trustees and as such (i) acts as a liaison between the Independent Trustees and management with respect to matters important to the Independent Trustees and (ii) with management prepares agendas for Board meetings.
Fidelity funds are overseen by different Boards of Trustees. The fund's Board oversees Fidelity's high income and certain equity funds and other Boards oversee Fidelity's investment-grade bond, money market, asset allocation, and sector funds. The asset allocation funds may invest in Fidelity funds overseen by the fund's Board. The use of separate Boards, each with its own committee structure, allows the Trustees of each group of Fidelity funds to focus on the unique issues of the funds they oversee, including common research, investment, and operational issues. On occasion, the separate Boards establish joint committees to address issues of overlapping consequences for the Fidelity funds overseen by each Board.
The Trustees operate using a system of committees to facilitate the timely and efficient consideration of all matters of importance to the Trustees, the fund, and fund shareholders and to facilitate compliance with legal and regulatory requirements and oversight of the fund's activities and associated risks. The Board, acting through its committees, has charged FMR and its affiliates with (i) identifying events or circumstances the occurrence of which could have demonstrably adverse effects on the fund's business and/or reputation; (ii) implementing processes and controls to lessen the possibility that such events or circumstances occur or to mitigate the effects of such events or circumstances if they do occur; and (iii) creating and maintaining a system designed to evaluate continuously business and market conditions in order to facilitate the identification and implementation processes described in (i) and (ii) above. Because the day-to-day operations and activities of the fund are carried out by or through FMR, its affiliates and other service providers, the fund's exposure to risks is mitigated but not eliminated by the processes overseen by the Trustees. While each of the Board's committees has responsibility for overseeing different aspects of the fund's activities, oversight is exercised primarily through the Operations, Audit, and Compliance Committees. In addition, the Independent Trustees have worked with FMR to enhance the Board's oversight of investment and financial risks, legal and regulatory risks, technology risks, and operational risks, including the development of additional risk reporting to the Board. For example, a working group comprised of Independent Trustees and FMR has worked and continues to work to review the Fidelity funds' valuation-related activities, reporting and risk management. Appropriate personnel, including but not limited to the fund's Chief Compliance Officer (CCO), FMR's internal auditor, the independent accountants, the fund's Treasurer and portfolio management personnel, make periodic reports to the Board's committees, as appropriate, including an annual review of FMR's risk management program for the Fidelity funds. The responsibilities of each standing committee, including their oversight responsibilities, are described further under "Standing Committees of the Fund's Trustees."
Annual Report
The funds' Statement of Additional Information (SAI) includes more information about the Trustees. To request a free copy, call Fidelity at 1-800-544-8544 for Fidelity Series Small Cap Opportunities Fund, or 1-800-835-5092 for Class F.
Interested Trustees*:
Correspondence intended for each Trustee who is an interested person may be sent to Fidelity Investments, 245 Summer Street, Boston, Massachusetts 02210.
Name, Year of Birth; Principal Occupations and Other Relevant Experience+ |
James C. Curvey (1935) |
Year of Election or Appointment: 2007 Trustee Chairman of the Board of Trustees |
| Mr. Curvey also serves as Trustee of other Fidelity funds. Mr. Curvey is a Director of Fidelity Research & Analysis Co. (investment adviser firm, 2009-present), and Vice Chairman (2007-present) and Director of FMR LLC (diversified financial services company). In addition, Mr. Curvey serves as an Overseer for the Boston Symphony Orchestra and a member of the board of Artis-Naples, Naples, Florida, and as a Trustee for Brewster Academy, Wolfeboro, New Hampshire. Previously, Mr. Curvey served as a Director of Fidelity Investments Money Management, Inc. (investment adviser firm, 2009-2014), a Director of FMR (investment adviser firm, 2007-2014), and a Director of FMR Co., Inc. (investment adviser firm, 2007-2014). |
Charles S. Morrison (1960) |
Year of Election or Appointment: 2014 Trustee |
| Mr. Morrison also serves as Trustee of other funds. He serves as a Director of Fidelity Investments Money Management, Inc. (FIMM) (investment adviser firm, 2014-present), Director of Fidelity SelectCo, LLC (investment adviser firm, 2014-present), President, Asset Management (2014-present), and is an employee of Fidelity Investments. Previously, Mr. Morrison served as Vice President of Fidelity's Fixed Income and Asset Allocation Funds (2012-2014), President, Fixed Income (2011-2014), Vice President of Fidelity's Money Market Funds (2005-2009), President, Money Market Group Leader of FMR (investment adviser firm, 2009), and Senior Vice President, Money Market Group of FMR (2004-2009). Mr. Morrison also served as Vice President of Fidelity's Bond Funds (2002-2005), certain Balanced Funds (2002-2005), and certain Asset Allocation Funds (2002-2007), and as Senior Vice President (2002-2005) of Fidelity's Bond Division. |
* Trustees have been determined to be "Interested Trustees" by virtue of, among other things, their affiliation with the trust or various entities under common control with FMR.
+ The information above includes each Trustee's principal occupation during the last five years and other information relating to the experience, attributes, and skills relevant to each Trustee's qualifications to serve as a Trustee, which led to the conclusion that each Trustee should serve as a Trustee for the fund.
Annual Report
Independent Trustees:
Correspondence intended for each Independent Trustee (that is, the Trustees other than the Interested Trustees) may be sent to Fidelity Investments, P.O. Box 55235, Boston, Massachusetts 02205-5235.
Name, Year of Birth; Principal Occupations and Other Relevant Experience+ |
Dennis J. Dirks (1948) |
Year of Election or Appointment: 2005 Trustee |
| Mr. Dirks also serves as Trustee of other Fidelity funds. Prior to his retirement in May 2003, Mr. Dirks was Chief Operating Officer and a member of the Board of The Depository Trust & Clearing Corporation (DTCC). He also served as President, Chief Operating Officer, and Board member of The Depository Trust Company (DTC) and President and Board member of the National Securities Clearing Corporation (NSCC). In addition, Mr. Dirks served as Chief Executive Officer and Board member of the Government Securities Clearing Corporation, Chief Executive Officer and Board member of the Mortgage-Backed Securities Clearing Corporation, as a Trustee and a member of the Finance Committee of Manhattan College (2005-2008), and as a Trustee and a member of the Finance Committee of AHRC of Nassau County (2006-2008). Mr. Dirks is a member of the Independent Directors Council (IDC) Governing Council (2010-present) and Board of Directors for The Brookville Center for Children's Services, Inc. (2009-present). |
Alan J. Lacy (1953) |
Year of Election or Appointment: 2008 Trustee |
| Mr. Lacy also serves as Trustee of other Fidelity funds. Mr. Lacy serves as a member of the Board of Directors of Dave & Buster's Entertainment, Inc. (restaurant and entertainment complexes, 2010-present) and Bristol-Myers Squibb Company (global pharmaceuticals, 2008-present). In addition, Mr. Lacy served as Senior Adviser (2007-2014) of Oak Hill Capital Partners, L.P. (private equity) and also served as Chief Executive Officer (2000-2005) and Vice Chairman (2005-2006) of Sears Holdings Corporation and Sears, Roebuck and Co. (retail). Mr. Lacy is a member of the Board of Trustees of The National Parks Conservation Association (2006-present). Previously, Mr. Lacy served as Chairman of the Board of Trustees of the National Parks Conservation Association (2008-2011) and as a member of the Board of Directors for The Western Union Company (global money transfer, 2006-2011), The Hillman Companies, Inc. (hardware wholesalers, 2010-2014), and Earth Fare, Inc. (retail grocery, 2010-2014). |
Ned C. Lautenbach (1944) |
Year of Election or Appointment: 2000 Trustee Chairman of the Independent Trustees |
| Mr. Lautenbach also serves as Trustee of other Fidelity funds. Mr. Lautenbach currently serves as the Lead Director of the Eaton Corporation Board of Directors (diversified industrial, 1997-present). Mr. Lautenbach is Chairman of the Board of Directors of Artis-Naples in Naples, Florida (2012-present), a member of the Council on Foreign Relations (1994-present), and a member of the Board of Governors, State University System of Florida (2013-present). Previously, Mr. Lautenbach was a Partner/Advisory Partner at Clayton, Dubilier & Rice, LLC (private equity investment, 1998-2010), as well as a Director of Sony Corporation (2006-2007). |
Joseph Mauriello (1944) |
Year of Election or Appointment: 2008 Trustee |
| Mr. Mauriello also serves as Trustee of other Fidelity funds. Prior to his retirement in January 2006, Mr. Mauriello served in numerous senior management positions including Deputy Chairman and Chief Operating Officer (2004-2005), and Vice Chairman of Financial Services (2002-2004) of KPMG LLP US (professional services, 1965-2005). Mr. Mauriello currently serves as a member of the Board of Directors of XL Group plc. (global insurance and re-insurance, 2006-present). Previously, Mr. Mauriello served as a Director of the Hamilton Funds of the Bank of New York (2006-2007) and of Arcadia Resources Inc. (health care services and products, 2007-2012). |
Robert W. Selander (1950) |
Year of Election or Appointment: 2011 Trustee |
| Mr. Selander also serves as Trustee of other Fidelity funds. Mr. Selander serves as a Director of The Western Union Company (global money transfer, 2014-present). Previously, Mr. Selander served as a Member of the Advisory Board of other Fidelity funds (2011), and Executive Vice Chairman (2010), Chief Executive Officer (2009-2010), and President and Chief Executive Officer (1997-2009) of Mastercard, Inc. |
Cornelia M. Small (1944) |
Year of Election or Appointment: 2005 Trustee |
| Ms. Small also serves as Trustee of other Fidelity funds. Ms. Small is a member of the Board of Directors (2009-present) and Chair of the Investment Committee (2010-present) of the Teagle Foundation. Ms. Small also serves on the Investment Committee of the Berkshire Taconic Community Foundation (2008-present). Previously, Ms. Small served as Chairperson (2002-2008) and a member of the Investment Committee and Chairperson (2008-2012) and a member of the Board of Trustees of Smith College. In addition, Ms. Small served as Chief Investment Officer, Director of Global Equity Investments, and a member of the Board of Directors of Scudder, Stevens & Clark and Scudder Kemper Investments. |
William S. Stavropoulos (1939) |
Year of Election or Appointment: 2002 Trustee Vice Chairman of the Independent Trustees |
| Mr. Stavropoulos also serves as Trustee of other Fidelity funds. Mr. Stavropoulos serves as President and Founder of the Michigan Baseball Foundation, the Great Lakes Loons (2007-present). Mr. Stavropoulos is Chairman Emeritus of the Board of Directors of The Dow Chemical Company, where he previously served in numerous senior management positions, including President, CEO (1995-2000; 2002-2004), Chairman of the Executive Committee (2000-2006), and as a member of the Board of Directors (1990-2006). Currently, Mr. Stavropoulos is Chairman of the Board of Directors of Univar Inc. (global distributor of commodity and specialty chemicals), a Director of Teradata Corporation (data warehousing and technology solutions), and Maersk Inc. (industrial conglomerate), and a member of the Advisory Board for Metalmark Capital LLC (private equity investment, 2005-present). Mr. Stavropoulos is an operating advisor to Clayton, Dubilier & Rice, LLC (private equity investment). In addition, Mr. Stavropoulos is a member of the University of Notre Dame Advisory Council for the College of Science, a Trustee of the Rollin L. Gerstacker Foundation, and a Director of the Naples Philharmonic Center for the Arts. Previously, Mr. Stavropoulos served as a Director of Chemical Financial Corporation (bank holding company, 1993-2012) and Tyco International, Ltd. (multinational manufacturing and services, 2007-2012). |
David M. Thomas (1949) |
Year of Election or Appointment: 2008 Trustee |
| Mr. Thomas also serves as Trustee of other Fidelity funds. Mr. Thomas serves as Non-Executive Chairman of the Board of Directors of Fortune Brands Home and Security (home and security products, 2011-present), as a member of the Board of Directors (2004-present) and Presiding Director (2013-present) of Interpublic Group of Companies, Inc. (marketing communication), and as a member of the Board of Trustees of the University of Florida (2013-present). Previously, Mr. Thomas served as Executive Chairman (2005-2006) and Chairman and Chief Executive Officer (2000-2005) of IMS Health, Inc. (pharmaceutical and healthcare information solutions), and a Director of Fortune Brands, Inc. (consumer products, 2000-2011). |
+ The information above includes each Trustee's principal occupation during the last five years and other information relating to the experience, attributes, and skills relevant to each Trustee's qualifications to serve as a Trustee, which led to the conclusion that each Trustee should serve as a Trustee for the fund.
Advisory Board Member and Officers:
Correspondence intended for each officer and Peter S. Lynch may be sent to Fidelity Investments, 245 Summer Street, Boston, Massachusetts 02210. Officers appear below in alphabetical order.
Name, Year of Birth; Principal Occupation |
Peter S. Lynch (1944) |
Year of Election or Appointment: 2003 Member of the Advisory Board |
| Mr. Lynch also serves as Member of the Advisory Board of other Fidelity funds. Mr. Lynch is Vice Chairman and a Director of FMR (investment adviser firm) and FMR Co., Inc. (investment adviser firm). In addition, Mr. Lynch serves as a Trustee of Boston College and as the Chairman of the Inner-City Scholarship Fund. Previously, Mr. Lynch served on the Special Olympics International Board of Directors (1997-2006). |
Elizabeth Paige Baumann (1968) |
Year of Election or Appointment: 2012 Anti-Money Laundering (AML) Officer |
| Ms. Baumann also serves as AML Officer of other funds. She is Chief AML Officer of FMR LLC (diversified financial services company, 2012-present) and is an employee of Fidelity Investments. Previously, Ms. Baumann served as Vice President and Deputy Anti-Money Laundering Officer (2007-2012). |
Marc Bryant (1966) |
Year of Election or Appointment: 2015 Secretary and Chief Legal Officer (CLO) |
| Mr. Bryant also serves as Secretary and Chief Legal Officer (CLO) of other funds. He is Senior Vice President and Deputy General Counsel of FMR LLC (diversified financial services company). Previously, Mr. Bryant served as Secretary and Chief Legal Officer of Fidelity Rutland Square Trust II (2010-2014) and Assistant Secretary of Fidelity's Fixed Income and Asset Allocation Funds (2013-2015). Prior to joining Fidelity Investments, Mr. Bryant served as a Senior Vice President and the Head of Global Retail Legal for AllianceBernstein L.P. (2006-2010), and as the General Counsel for ProFund Advisors LLC (2001-2006). |
|
William C. Coffey (1969) |
Year of Election or Appointment: 2009 Assistant Secretary |
| Mr. Coffey also serves as Assistant Secretary of other funds. He is Senior Vice President and Deputy General Counsel of FMR LLC (diversified financial services company, 2010-present), and is an employee of Fidelity Investments. Previously, Mr. Coffey served as Vice President and Associate General Counsel of FMR LLC (2005-2009). |
Jonathan Davis (1968) |
Year of Election or Appointment: 2010 Assistant Treasurer |
| Mr. Davis also serves as Assistant Treasurer of other funds. Mr. Davis is an employee of Fidelity Investments. Previously, Mr. Davis served as Vice President and Associate General Counsel of FMR LLC (diversified financial services company, 2003-2010). |
Adrien E. Deberghes (1967) |
Year of Election or Appointment: 2008 Deputy Treasurer |
| Mr. Deberghes also serves as an officer of other funds. He is an employee of Fidelity Investments (2008-present). Prior to joining Fidelity Investments, Mr. Deberghes was Senior Vice President of Mutual Fund Administration at State Street Corporation (2007-2008), Senior Director of Mutual Fund Administration at Investors Bank & Trust (2005-2007), and Director of Finance for Dunkin' Brands (2000-2005). |
Stephanie J. Dorsey (1969) |
Year of Election or Appointment: 2010 Assistant Treasurer |
| Ms. Dorsey also serves as an officer of other funds. She is an employee of Fidelity Investments (2008-present) and has served in other fund officer roles. Prior to joining Fidelity Investments, Ms. Dorsey served as Treasurer (2004-2008) of the JPMorgan Mutual Funds and Vice President (2004-2008) of JPMorgan Chase Bank. |
Howard J. Galligan III (1966) |
Year of Election or Appointment: 2014 Chief Financial Officer |
| Mr. Galligan also serves as Chief Financial Officer of other funds. Mr. Galligan serves as President of Fidelity Pricing and Cash Management Services (FPCMS) (2014-present) and as a Director of Strategic Advisers, Inc. (investment adviser firm, 2008-present). Previously, Mr. Galligan served as Chief Administrative Officer of Asset Management (2011-2014) and Chief Operating Officer and Senior Vice President of Investment Support for Strategic Advisers, Inc. (2003-2011). |
Scott C. Goebel (1968) |
Year of Election or Appointment: 2015 Vice President |
| Mr. Goebel serves as an officer of other funds. Mr. Goebel also serves as Secretary of Fidelity SelectCo, LLC (investment adviser firm, 2013-present), Fidelity Investments Money Management, Inc. (FIMM) (investment adviser firm, 2010-present) and Fidelity Research and Analysis Company (FRAC) (investment adviser firm, 2010-present); General Counsel, Secretary, and Senior Vice President of FMR (investment adviser firm, 2008-present) and FMR Co., Inc. (investment adviser firm, 2008-present); Chief Legal Officer of Fidelity Management & Research (Hong Kong) Limited (investment adviser firm, 2008-present); and Assistant Secretary of Fidelity Management & Research (Japan) Limited (investment adviser firm, 2008-present) and FMR Investment Management (U.K.) Limited (investment adviser firm, 2008-present). Previously, Mr. Goebel served as Secretary and CLO of certain Fidelity funds (2008-2015), Assistant Secretary of FIMM (2008-2010), FRAC (2008-2010), and certain funds (2007-2008); and as Vice President and Secretary of Fidelity Distributors Corporation (FDC) (2005-2007). Mr. Goebel has been employed by FMR LLC (diversified financial services company) or an affiliate since 2001. |
Thomas C. Hense (1964) |
Year of Election or Appointment: 2008/2010/2015 Vice President |
| Mr. Hense serves as Vice President of Fidelity Advisor Multi-Asset Income Fund (2015) and other funds (High Income (2008), Small Cap (2008), and Value (2010) funds). Previously, Mr. Hense served as a portfolio manager for Fidelity's Institutional Money Management Group (Pyramis) (2003-2008). |
Brian B. Hogan (1964) |
Year of Election or Appointment: 2009 Vice President |
| Mr. Hogan also serves as Trustee or Vice President of other funds. Mr. Hogan serves as a Director of Fidelity SelectCo, LLC (investment adviser firm, 2014-present) and President of the Equity Division of FMR (investment adviser firm, 2009-present). Previously, Mr. Hogan served as Senior Vice President, Equity Research of FMR (2006-2009) and as a portfolio manager. |
Chris Maher (1972) |
Year of Election or Appointment: 2013 Assistant Treasurer |
| Mr. Maher serves as Assistant Treasurer of other funds. Mr. Maher is Vice President of Valuation Oversight and is an employee of Fidelity Investments. Previously, Mr. Maher served as Vice President of Asset Management Compliance (2013), Vice President of the Program Management Group of FMR (investment adviser firm, 2010-2013), and Vice President of Valuation Oversight (2008-2010). |
Kenneth B. Robins (1969) |
Year of Election or Appointment: 2008 President and Treasurer |
| Mr. Robins also serves as an officer of other funds. Mr. Robins serves as Executive Vice President of Fidelity Investments Money Management, Inc. (FIMM) (investment adviser firm, 2013-present) and is an employee of Fidelity Investments (2004-present). Previously, Mr. Robins served in other fund officer roles. |
Stephen Sadoski (1971) |
Year of Election or Appointment: 2012 Deputy Treasurer |
| Mr. Sadoski also serves as Deputy Treasurer of other funds. He is an employee of Fidelity Investments (2012-present) and has served in another fund officer role. Prior to joining Fidelity Investments, Mr. Sadoski served as an assistant chief accountant in the Division of Investment Management of the Securities and Exchange Commission (SEC) (2009-2012) and as a senior manager at Deloitte & Touche LLP (1997-2009). |
Stacie M. Smith (1974) |
Year of Election or Appointment: 2013 Deputy Treasurer |
| Ms. Smith also serves as an officer of other funds. She is an employee of Fidelity Investments (2009-present) and has served in other fund officer roles. Prior to joining Fidelity Investments, Ms. Smith served as Senior Audit Manager of Ernst & Young LLP (1996-2009). |
Renee Stagnone (1975) |
Year of Election or Appointment: 2013 Deputy Treasurer |
| Ms. Stagnone also serves as Deputy Treasurer of other funds. Ms. Stagnone is an employee of Fidelity Investments. |
Linda J. Wondrack (1964) |
Year of Election or Appointment: 2014 Chief Compliance Officer |
| Ms. Wondrack also serves as Chief Compliance Officer of other funds. Ms. Wondrack is Executive Vice President and head of the Ethics Office and Asset Management Compliance for Fidelity Investments (2012-
present). Ms. Wondrack also serves as Chief Compliance Officer of Fidelity SelectCo, LLC (investment adviser firm, 2014-present); Chief Compliance Officer of Impresa Management LLC (2013-present); and Chief Compliance Officer of FMR Co., Inc. (investment adviser firm), Fidelity Investments Money Management, Inc. (investment adviser firm), Fidelity Management & Research (Japan) Limited (investment adviser firm), FMR Investment Management (U.K.) Limited (investment adviser firm), Fidelity Management & Research (Hong Kong) (investment adviser firm), Fidelity Management & Research Company (investment adviser firm), Pyramis Global Advisors, LLC (investment adviser firm), and Strategic Advisers, Inc. (investment adviser firm), Ballyrock Investment Advisors LLC, and Northern Neck Investors LLC (2012-present). Previously, Ms. Wondrack served as Senior Vice President and Chief Compliance Officer for Columbia Management Investment Advisers, LLC (2005-2012); Chief Compliance Officer for certain funds within the Columbia Family of Funds (2007-2012); and Senior Vice President of Compliance Risk Management at Bank of America (2005-2010). |
Joseph F. Zambello (1957) |
Year of Election or Appointment: 2011 Deputy Treasurer |
| Mr. Zambello also serves as Deputy Treasurer of other funds. Mr. Zambello is an employee of Fidelity Investments. Previously, Mr. Zambello served as Vice President of the Program Management Group of FMR (investment adviser firm, 2009-2011) and Vice President of the Transfer Agent Oversight Group (2005-2009). |
Annual Report
The Board of Trustees of Fidelity Series Small Cap Opportunities Fund voted to pay to shareholders of record at the opening of business on record date, the following distributions per share derived from capital gains realized from sales of portfolio securities; and dividends derived from net investment income:
| Pay Date | Record Date | Dividends | Capital Gains |
Series Small Cap Opportunities | 09/14/2015 | 09/11/2015 | $0.027 | $0.677 |
Class F | 09/14/2015 | 09/11/2015 | $0.040 | $0.677 |
The fund hereby designates as a capital gain dividend with respect to the taxable year ended July 31, 2015, $295,810,485, or, if subsequently determined to be different, the net capital gain of such year.
Series Small Cap Opportunities designates 19% and 100%; and Class F designates 18% and 100% of the dividends distributed in September and December, respectively during the fiscal year as qualifying for the dividends-received deduction for corporate shareholders.
Series Small Cap Opportunities designates 24% and 100%; and Class F designates 23% and 100% of the dividends distributed in September and December, respectively during the fiscal year as amounts which may be taken into account as a dividend for the purposes of the maximum rate under Section 1(h)(11) of the Internal Revenue Code.
The fund will notify shareholders in January 2016 of amounts for use in preparing 2015 income tax returns.
Annual Report
Fidelity Series Small Cap Opportunities Fund
Each year, the Board of Trustees, including the Independent Trustees (together, the Board), votes on the renewal of the management contract with Fidelity Management & Research Company (FMR) and the sub-advisory agreements (together, the Advisory Contracts) for the fund. The Board, assisted by the advice of fund counsel and Independent Trustees' counsel, requests and considers a broad range of information relevant to the renewal of the Advisory Contracts throughout the year.
The Board meets regularly and, at each of its meetings, covers an extensive agenda of topics and materials and considers factors that are relevant to its annual consideration of the renewal of the fund's Advisory Contracts, including the services and support provided to the fund and its shareholders. The Board has established various standing committees (Committees), each composed of and chaired by Independent Trustees with varying backgrounds, to which the Board has assigned specific subject matter responsibilities in order to enhance effective decision-making by the Board. The Board, acting directly and through its Committees, requests and receives information concerning the annual consideration of the renewal of the fund's Advisory Contracts. The Board also meets as needed to consider matters specifically related to the Board's annual consideration of the renewal of the Advisory Contracts. Members of the Board may also meet with trustees of other Fidelity funds through ad hoc joint committees to discuss certain matters relevant to all of the Fidelity funds.
At its July 2015 meeting, the Board unanimously determined to renew the fund's Advisory Contracts. In reaching its determination, the Board considered all factors it believed relevant, including (i) the nature, extent, and quality of the services to be provided to the fund and its shareholders (including the investment performance of the fund); (ii) the competitiveness of the fund's management fee and total expense ratio relative to peer funds; (iii) the total costs of the services to be provided by and the profits to be realized by Fidelity from its relationship with the fund; and (iv) the extent to which (if any) economies of scale exist and would be realized as the fund grows, and whether any economies of scale are appropriately shared with fund shareholders.
In considering whether to renew the Advisory Contracts for the fund, the Board reached a determination, with the assistance of fund counsel and Independent Trustees' counsel and through the exercise of its business judgment, that the renewal of the Advisory Contracts was in the best interests of the fund and its shareholders and that the compensation payable under the Advisory Contracts was fair and reasonable. The Board's decision to renew the Advisory Contracts was not based on any single factor, but rather was based on a comprehensive consideration of all the information provided to the Board at its meetings throughout the year. The Board, in reaching its determination to renew the Advisory Contracts, was aware that shareholders of the fund have a broad range of investment choices available to them, including a wide choice among funds offered by Fidelity's competitors, and that the fund's shareholders, who have the opportunity to review and weigh the disclosure provided by the fund in its prospectus and other public disclosures, have chosen to invest in this fund, which is part of the Fidelity family of funds.
Annual Report
Board Approval of Investment Advisory Contracts and
Management Fees - continued
Nature, Extent, and Quality of Services Provided. The Board considered Fidelity's staffing as it relates to the fund, including the backgrounds of investment personnel of Fidelity, and also considered the fund's investment objective, strategies, and related investment philosophy. The Independent Trustees also had discussions with senior management of Fidelity's investment operations and investment groups. The Board considered the structure of the portfolio manager compensation program and whether this structure provides appropriate incentives to act in the best interests of the fund. Additionally, the Board considered the portfolio managers' investments, if any, in the funds that they manage.
Resources Dedicated to Investment Management and Support Services. The Board and the Fund Oversight and Research Committees reviewed the general qualifications and capabilities of Fidelity's investment staff, including its size, education, experience, and resources, as well as Fidelity's approach to recruiting, training, managing, and compensating investment personnel. The Board noted that Fidelity has continued to increase the resources devoted to non-U.S. offices, including expansion of Fidelity's global investment organization. The Board also noted that Fidelity's analysts have extensive resources, tools and capabilities that allow them to conduct sophisticated quantitative and fundamental analysis, as well as credit analysis of issuers, counterparties and guarantors. Further, the Board considered that Fidelity's investment professionals have sufficient access to global information and data so as to provide competitive investment results over time, and that those professionals also have access to sophisticated tools that permit them to assess portfolio construction and risk and performance attribution characteristics continuously, as well as to transmit new information and research conclusions rapidly around the world. Additionally, in its deliberations, the Board considered Fidelity's trading, risk management, and compliance capabilities and resources, which are integral parts of the investment management process.
Shareholder and Administrative Services. The Board considered (i) the nature, extent, quality, and cost of advisory, administrative, and shareholder services performed by FMR, the sub-advisers (together with FMR, the Investment Advisers), and their affiliates under the Advisory Contracts and under separate agreements covering transfer agency, pricing and bookkeeping, and securities lending services for the fund; (ii) the nature and extent of the supervision of third party service providers, principally custodians and subcustodians; and (iii) the resources devoted to, and the record of compliance with, the fund's compliance policies and procedures. The Board also reviewed the allocation of fund brokerage, including allocations to brokers affiliated with the Investment Advisers, the use of brokerage commissions to pay fund expenses, and the use of "soft" commission dollars to pay for research services.
Annual Report
The Board noted that the growth of fund assets over time across the complex allows Fidelity to reinvest in the development of services designed to enhance the value or convenience of the Fidelity funds as investment vehicles. These services include 24-hour access to account information and market information through telephone representatives and over the Internet, investor education materials and asset allocation tools, and the expanded availability of Fidelity Investor Centers.
In 2014, the Board formed an ad hoc Committee on Transfer Agency Fees to review the variety of transfer agency fee structures throughout the industry and Fidelity's competitive positioning with respect to industry participants.
Investment in a Large Fund Family. The Board considered the benefits to shareholders of investing in a Fidelity fund, including the benefits of investing in a fund that is part of a large family of funds offering a variety of investment disciplines and providing a large variety of mutual fund investor services. The Board noted that Fidelity had taken, or had made recommendations that resulted in the Fidelity funds taking, a number of actions over the previous year that benefited particular funds, including (i) continuing to dedicate additional resources to investment research and to the support of the senior management team that oversees asset management; (ii) continuing efforts to enhance Fidelity's global research capabilities; (iii) launching new funds and making other enhancements to meet client needs; (iv) reducing management fees and total expenses for certain index funds and diversified international funds; (v) continuing to launch dedicated lower cost underlying funds to meet portfolio construction needs related to expanding underlying fund options for Fidelity funds of funds, specifically for the Freedom Fund product lines; (vi) rationalizing product lines and gaining increased efficiencies through fund mergers; (vii) launching active fixed-income exchange-traded funds; (viii) continuing to develop, acquire and implement systems and technology to improve services to the funds and information security and to increase efficiency; (ix) implementing investment enhancements to further strengthen Fidelity's target date product line to increase investors' probability of success in achieving their goals; (x) modifying the eligibility criteria for certain share classes to accommodate roll-over assets from employer-sponsored retirement plans; (xi) launching a new Class W of the Freedom Index Funds to attract and retain Fidelity record-kept retirement plan assets; and (xii) implementing changes to Fidelity's money market product line in response to recent money market regulatory reforms.
Investment Performance. The Board considered whether the fund has operated in accordance with its investment objective, as well as its record of compliance with its investment restrictions and its performance history. The Board noted that there were portfolio management changes for the fund in January 2013, April 2013, October 2013, and September 2014.
Annual Report
Board Approval of Investment Advisory Contracts and
Management Fees - continued
The Board took into account discussions with representatives of the Investment Advisers about fund investment performance that occur at Board meetings throughout the year. In this regard the Board noted that as part of regularly scheduled fund reviews and other reports to the Board on fund performance, the Board considers annualized return information for the fund, for different time periods, measured against a securities market index ("benchmark index") and a peer group of funds with similar objectives ("peer group"), if any. In its evaluation of fund investment performance, the Board gave particular attention to information indicating changes in performance of certain Fidelity funds for specific time periods and discussed with the Investment Advisers the reasons for any overperformance or underperformance.
In addition to reviewing absolute and relative fund performance, the Independent Trustees periodically consider the appropriateness of fund performance metrics in evaluating the results achieved. In general, the Independent Trustees believe that fund performance should be evaluated based on net performance (after fees and expenses) of both the highest performing and lowest performing fund share classes, where applicable, compared to appropriate benchmark indices, over appropriate time periods that may include full market cycles, and compared to peer groups, as applicable, over the same periods, taking into account relevant factors including the following: general market conditions; issuer-specific information; and fund cash flows and other factors.
The Independent Trustees recognize that shareholders evaluate performance on a net basis over their own holding periods, for which one-, three-, and five-year periods are often used as a proxy. For this reason, the performance information reviewed by the Board also included net cumulative calendar year total return information for the fund and an appropriate benchmark index and peer group for the most recent one-, three-, and five-year periods, as shown below. Returns are shown compared to the 25th percentile (top of box, 75% beaten) and 75th percentile (bottom of box, 25% beaten) of the peer universe.
Annual Report
Fidelity Series Small Cap Opportunities Fund
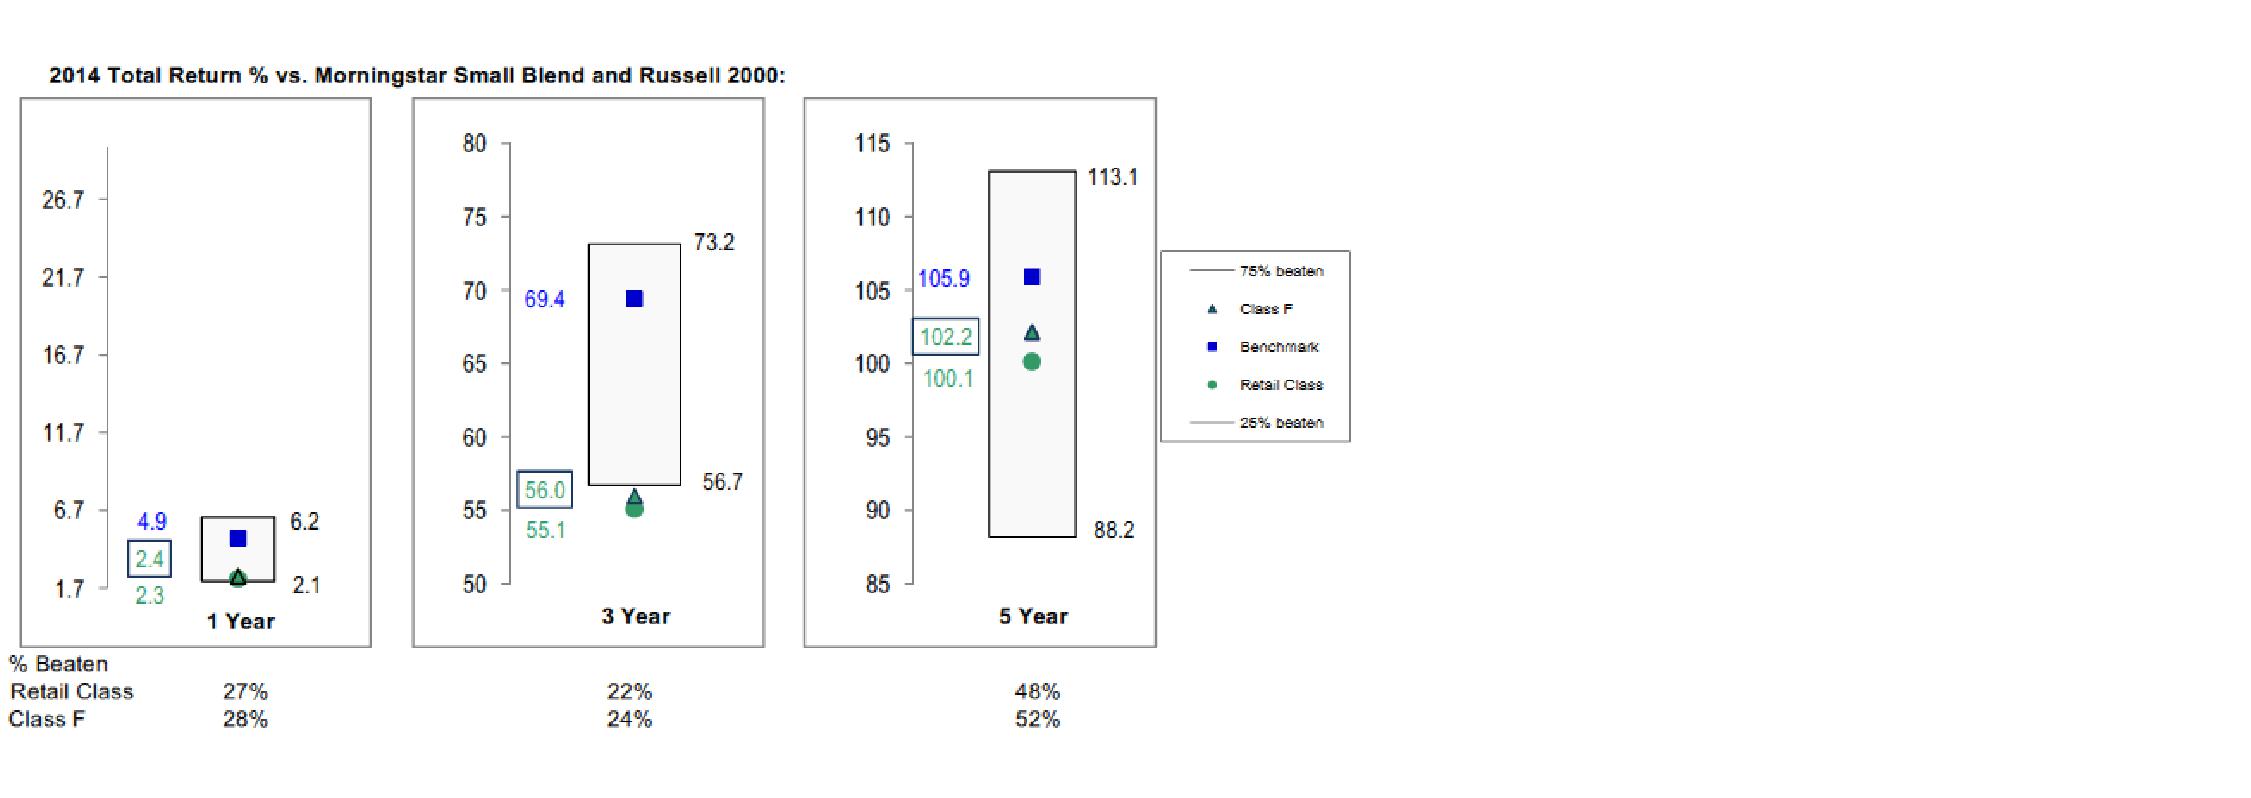
The Board has discussed the fund's underperformance with FMR and has engaged with FMR to consider what steps might be taken to remediate the fund's underperformance.
The Board also considered that the fund's management fee is subject to upward or downward adjustment depending upon whether, and to what extent, the fund's investment performance for the performance period exceeds, or is exceeded by, a securities index, thus leading to a performance adjustment for the same period. The Board noted that the performance adjustment provides FMR with a strong economic incentive to seek to achieve superior performance for the fund's shareholders and helps to more closely align the interests of FMR and the shareholders of the fund.
Based on its review, the Board concluded that the nature, extent, and quality of services provided to the fund under the Advisory Contracts should benefit the shareholders of the fund.
Competitiveness of Management Fee and Total Expense Ratio. The Board considered the fund's management fee and total expense ratio compared to "mapped groups" of competitive funds and classes created for the purpose of facilitating the Trustees' competitive analysis of management fees and total expenses. Fidelity creates "mapped groups" by combining similar Lipper investment objective categories that have comparable investment mandates. Combining Lipper investment objective categories aids the Board's management fee and total expense ratio comparisons by broadening the competitive group used for comparison.
Annual Report
Board Approval of Investment Advisory Contracts and
Management Fees - continued
Management Fee. The Board considered two proprietary management fee comparisons for the 12-month periods shown in basis points (BP) in the chart below. The group of Lipper funds used by the Board for management fee comparisons is referred to below as the "Total Mapped Group." The Total Mapped Group comparison focuses on a fund's standing in terms of gross management fees before expense reimbursements or caps, and without giving effect to the fund's performance adjustment, relative to the total universe of funds with comparable investment mandates, regardless of whether their management fee structures also are comparable. Funds with comparable investment mandates offer exposure to similar types of securities. Funds with comparable management fee structures have similar management fee contractual arrangements (e.g., flat rate charged for advisory services, all-inclusive fee rate, etc.). "TMG %" represents the percentage of funds in the Total Mapped Group that had management fees that were lower than the fund's. For example, a hypothetical TMG % of 20% would mean that 80% of the funds in the Total Mapped Group had higher, and 20% had lower, management fees than the fund. The fund's actual TMG %s and the number of funds in the Total Mapped Group are in the chart below. The "Asset-Size Peer Group" (ASPG) comparison focuses on a fund's standing relative to a subset of non-Fidelity funds within the Total Mapped Group that are similar in size and management fee structure without taking into account performance adjustments, if any. For example, if a fund is in the first quartile of the ASPG, the fund's management fee ranks in the least expensive or lowest 25% of funds in the ASPG. The ASPG represents at least 15% of the funds in the Total Mapped Group with comparable asset size and management fee structures, subject to a minimum of 50 funds (or all funds in the Total Mapped Group if fewer than 50). Additional information, such as the ASPG quartile in which the fund's management fee rate ranked and the impact of the fund's performance adjustment, is also included in the chart and considered by the Board.
Annual Report
Fidelity Series Small Cap Opportunities Fund
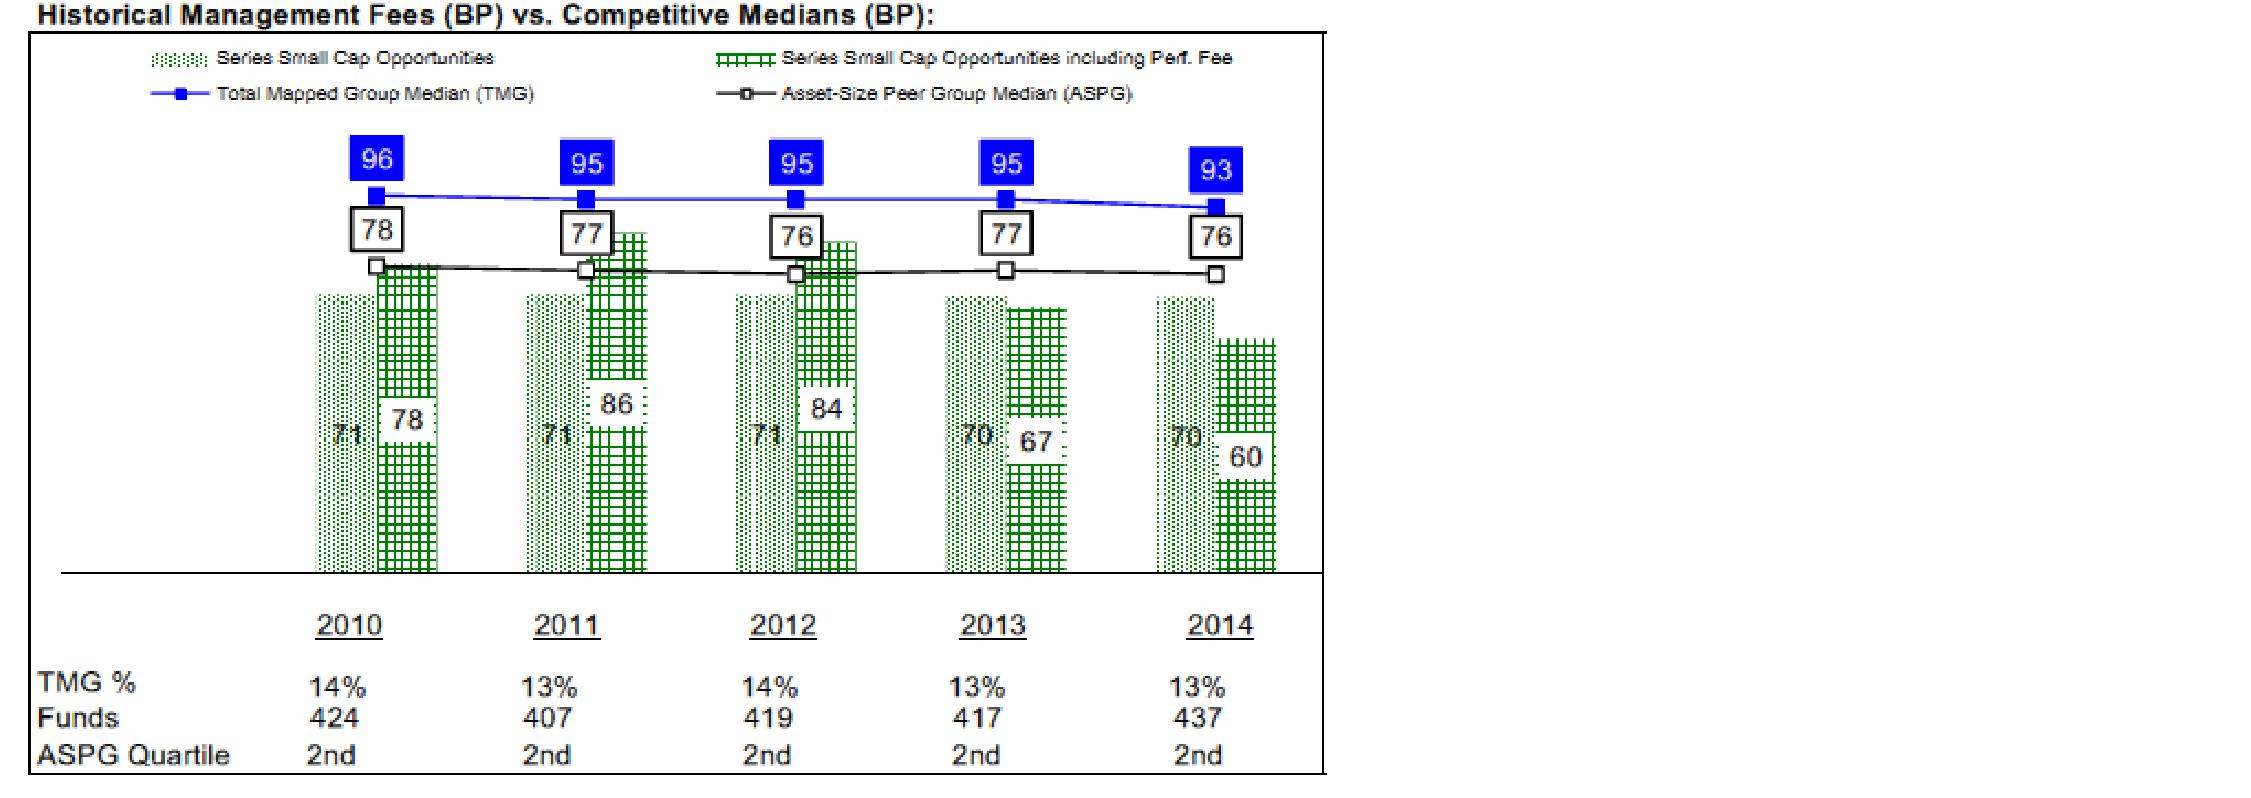
The Board noted that the fund's management fee rate ranked below the median of its Total Mapped Group and below the median of its ASPG for 2014. The Board also noted the effect of the fund's performance adjustment, if any, on the fund's management fee ranking.
The Board noted that, in 2014, the ad hoc Committee on Group Fee was formed by it and other Fidelity fund boards to conduct an in-depth review of the "group fee" component of the management fee of funds with such management fee structures. Committee focus included the mechanics of the group fee, the competitive landscape of group fee structures, Fidelity funds with no group fee component and investment products not included in group fee assets. The Board also considered that, for funds subject to the group fee, FMR agreed to voluntarily waive fees over a specified period of time in amounts designed to account for assets converted from certain funds to certain collective investment trusts.
The Board also noted that, in 2013, the ad hoc Committee on Management Fees was formed to conduct an in-depth review of the management fee rates of Fidelity's active equity mutual funds. The Committee focused on the following areas: (i) standard fee structures; (ii) research consumption and trading evolution; (iii) management fee competitiveness/profitability by category; and (iv) factors that drive institutional pricing.
Based on its review, the Board concluded that the fund's management fee is fair and reasonable in light of the services that the fund receives and the other factors considered.
Annual Report
Board Approval of Investment Advisory Contracts and
Management Fees - continued
Total Expense Ratio. In its review of each class's total expense ratio, the Board considered the fund's management fee as well as other fund or class expenses, as applicable, such as transfer agent fees, pricing and bookkeeping fees, and custodial, legal, and audit fees. The Board noted the impact of the fund's performance adjustment. The Board also noted that Fidelity may agree to waive fees and expenses from time to time, and the extent to which, if any, it has done so for the fund. As part of its review, the Board also considered the current and historical total expense ratios of each class of the fund compared to competitive fund median expenses. Each class of the fund is compared to those funds and classes in the Total Mapped Group (used by the Board for management fee comparisons) that have a similar sales load structure.
The Board noted that the total expense ratio of each class ranked below its competitive median for 2014.
Fees Charged to Other Fidelity Clients. The Board also considered Fidelity fee structures and other information with respect to clients of Fidelity, such as other funds advised or subadvised by Fidelity, pension plan clients, and other institutional clients with similar mandates. The Board noted the findings of the 2013 ad hoc joint committee (created with the board of other Fidelity funds), which reviewed and compared Fidelity's institutional investment advisory business with its business of providing services to the Fidelity funds, including the differences in services provided, fees charged, and costs incurred, as well as competition in their respective marketplaces.
Based on its review of total expense ratios and fees charged to other Fidelity clients, the Board concluded that the total expense ratio of each class of the fund was reasonable in light of the services that the fund and its shareholders receive and the other factors considered.
Costs of the Services and Profitability. The Board considered the revenues earned and the expenses incurred by Fidelity in conducting the business of developing, marketing, distributing, managing, administering and servicing the fund and servicing the fund's shareholders. The Board also considered the level of Fidelity's profits in respect of all the Fidelity funds.
On an annual basis, Fidelity presents to the Board information about the profitability of its relationship with the fund. Fidelity calculates profitability information for each fund, as well as aggregate profitability information for groups of Fidelity funds and all Fidelity funds, using a series of detailed revenue and cost allocation methodologies which originate with the books and records of Fidelity on which Fidelity's audited financial statements are based. The Audit Committee of the Board reviews any significant changes from the prior year's methodologies.
PricewaterhouseCoopers LLP (PwC), independent registered public accounting firm and auditor to Fidelity and certain Fidelity funds, has been engaged annually by the Board as part of the Board's assessment of Fidelity's profitability analysis. PwC's engagement includes the review and assessment of the methodologies used by Fidelity in determining the revenues and expenses attributable to Fidelity's mutual fund business, and completion of agreed-upon procedures in respect of the mathematical accuracy of fund profitability and its conformity to established allocation methodologies. After considering PwC's reports issued under the engagement and information provided by Fidelity, the Board concluded that while other allocation methods may also be reasonable, Fidelity's profitability methodologies are reasonable in all material respects.
Annual Report
The Board also reviewed Fidelity's non-fund businesses and fall-out benefits related to the mutual fund business as well as cases where Fidelity's affiliates may benefit from or be related to the fund's business.
The Board considered the costs of the services provided by and the profits realized by Fidelity in connection with the operation of the fund and was satisfied that the profitability was not excessive.
Economies of Scale. The Board considered whether there have been economies of scale in respect of the management of the Fidelity funds, whether the Fidelity funds (including the fund) have appropriately benefited from any such economies of scale, and whether there is potential for realization of any further economies of scale. The Board considered the extent to which the fund will benefit from economies of scale as assets grow through increased services to the fund, through waivers or reimbursements, or through fee or expense ratio reductions. The Board also noted that in 2013, it and the boards of other Fidelity funds created an ad hoc committee (the Economies of Scale Committee) to analyze whether Fidelity attains economies of scale in respect of the management and servicing of the Fidelity funds, whether the Fidelity funds have appropriately benefited from such economies of scale, and whether there is potential for realization of any further economies of scale.
The Board recognized that the fund's management contract incorporates a "group fee" structure, which provides for lower group fee rates as total group assets increase, and for higher group fee rates as total group assets decrease (with "group assets" defined to include fund assets under FMR's management plus sector fund assets previously under FMR's management and currently managed by Fidelity SelectCo, LLC). FMR calculates the group fee rates based on a tiered asset "breakpoint" schedule that varies based on asset class. The Board considered that the group fee is designed to deliver the benefits of economies of scale to fund shareholders when total Fidelity fund assets increase, even if assets of any particular fund are unchanged or have declined, because some portion of Fidelity's costs are attributable to services provided to all Fidelity funds, and all funds benefit if those costs can be allocated among more assets. The Board also considered that although the fund is offered only to other Fidelity funds, it continues to incur investment management expenses. The Board further noted that the fund may continue to realize benefits from the group fee structure, even though assets may not be expected to grow significantly at the fund level. The Board concluded that, given the group fee structure, fund shareholders will benefit from lower management fees as group assets increase at the fund complex level, regardless of whether Fidelity achieves any such economies of scale.
Annual Report
Board Approval of Investment Advisory Contracts and
Management Fees - continued
The Board concluded, taking into account the analysis of the Economies of Scale Committee, that economies of scale, if any, are being appropriately shared between fund shareholders and Fidelity.
Additional Information Requested by the Board. In order to develop fully the factual basis for consideration of the Fidelity funds' Advisory Contracts, the Board requested and received additional information on certain topics, including: (i) fund performance trends and Fidelity's long-term strategies for certain funds; (ii) the various share classes employed by Fidelity and the attributes of each class, together with similar information on the distribution and servicing payments made by Fidelity or the funds to third-party participants in the distribution channels; (iii) fund profitability, and fund performance in relation to fund profitability; (iv) the methodology with respect to evaluating competitive fund data and peer group classifications and fee comparisons; (v) annual fund profitability margins, with particular focus on certain funds with negative margins; (vi) the realization of fall-out benefits in certain Fidelity business units; (vii) economies of scale and the way in which they are shared with fund shareholders; (viii) Fidelity's group fee structures, including the group fee schedule of breakpoints; (ix) the impact of cost containment measures on the funds; and (x) the transfer agent fee structure.
Based on its evaluation of all of the conclusions noted above, and after considering all factors it believed relevant, the Board concluded that the advisory fee structures are fair and reasonable, and that the fund's Advisory Contracts should be renewed.
Annual Report
Investment Adviser
Fidelity Management & Research Company
Boston, MA
Investment Sub-Advisers
FMR Co., Inc.
FMR Investment Management
(U.K.) Limited
Fidelity Management & Research
(Hong Kong) Limited
Fidelity Management & Research
(Japan) Limited
FIL Investments (Japan) Limited
FIL Investment Advisors
FIL Investment Advisors (UK) Limited
General Distributor
Fidelity Distributors Corporation
Smithfield, RI
Transfer and Service Agents
Fidelity Investments Institutional Operations Company, Inc.
Boston, MA
Fidelity Service Company, Inc.
Boston, MA
Custodian
Brown Brothers Harriman & Co.
Boston, MA
(Fidelity Investment logo)(registered trademark)
Corporate Headquarters
245 Summer St., Boston, MA 02210
www.fidelity.com
SMO-ANN-0915
1.839807.108
Fidelity®
Series Real Estate Equity
Fund
Fidelity Series Real Estate Equity Fund
Class F
Annual Report
July 31, 2015
(Fidelity Cover Art)
Contents
Performance | (Click Here) | How the fund has done over time. |
Management's Discussion of Fund Performance | (Click Here) | The Portfolio Manager's review of fund performance and strategy. |
Shareholder Expense Example | (Click Here) | An example of shareholder expenses. |
Investment Changes | (Click Here) | A summary of major shifts in the fund's investments over the past six months. |
Investments | (Click Here) | A complete list of the fund's investments with their market values. |
Financial Statements | (Click Here) | Statements of assets and liabilities, operations, and changes in net assets, as well as financial highlights. |
Notes | (Click Here) | Notes to the financial statements. |
Report of Independent Registered Public Accounting Firm | (Click Here) | |
Trustees and Officers | (Click Here) | |
Distributions | (Click Here) | |
Board Approval of Investment Advisory Contracts and Management Fees | (Click Here) | |
To view a fund's proxy voting guidelines and proxy voting record for the 12-month period ended June 30, visit http://www.fidelity.com/proxyvotingresults or visit the Securities and Exchange Commission's (SEC) web site at http://www.sec.gov. You may also call 1-800-544-8544 for Fidelity® Series Real Estate Equity Fund or 1-800-835-5092 for Class F of the fund to request a free copy of the proxy voting guidelines.
Standard & Poor's, S&P and S&P 500 are registered service marks of The McGraw-Hill Companies, Inc. and have been licensed for use by Fidelity Distributors Corporation.
Other third-party marks appearing herein are the property of their respective owners.
All other marks appearing herein are registered or unregistered trademarks or service marks of FMR LLC or an affiliated company. © 2015 FMR LLC. All rights reserved.
Annual Report
This report and the financial statements contained herein are submitted for the general information of the shareholders of the fund. This report is not authorized for distribution to prospective investors in the fund unless preceded or accompanied by an effective prospectus.
A fund files its complete schedule of portfolio holdings with the SEC for the first and third quarters of each fiscal year on Form N-Q. Forms N-Q are available on the SEC's web site at http://www.sec.gov. A fund's Forms N-Q may be reviewed and copied at the SEC's Public Reference Room in Washington, DC. Information regarding the operation of the SEC's Public Reference Room may be obtained by calling 1-800-SEC-0330. For a complete list of a fund's portfolio holdings, view the most recent holdings listing, semiannual report, or annual report on Fidelity's web site at http://www.fidelity.com, http://www.advisor.fidelity.com, or http://www.401k.com, as applicable.
NOT FDIC INSURED • MAY LOSE VALUE • NO BANK GUARANTEE
Neither the fund nor Fidelity Distributors Corporation is a bank.
Annual Report
Average annual total return reflects the change in the value of an investment, assuming reinvestment of the class' distributions from dividend income and capital gains (the profits earned upon the sale of securities that have grown in value, if any) and assuming a constant rate of performance each year. The $10,000 table and the fund's returns do not reflect the deduction of taxes that a shareholder would pay on fund distributions or the redemption of fund shares. During periods of reimbursement by Fidelity, a fund's total return will be greater than it would be had the reimbursement not occurred. How a fund did yesterday is no guarantee of how it will do tomorrow.
Average Annual Total Returns
Periods ended July 31, 2015 | Past 1
year | Life of
fund A |
Fidelity® Series Real Estate Equity Fund | 10.04% | 14.63% |
Class F | 10.23% | 14.85% |
A From October 20, 2011.
$10,000 Over Life of Fund
Let's say hypothetically that $10,000 was invested in Fidelity® Series Real Estate Equity Fund, a class of the fund, on October 20, 2011, when the fund started. The chart shows how the value of your investment would have changed, and also shows how the S&P 500® Index performed over the same period.
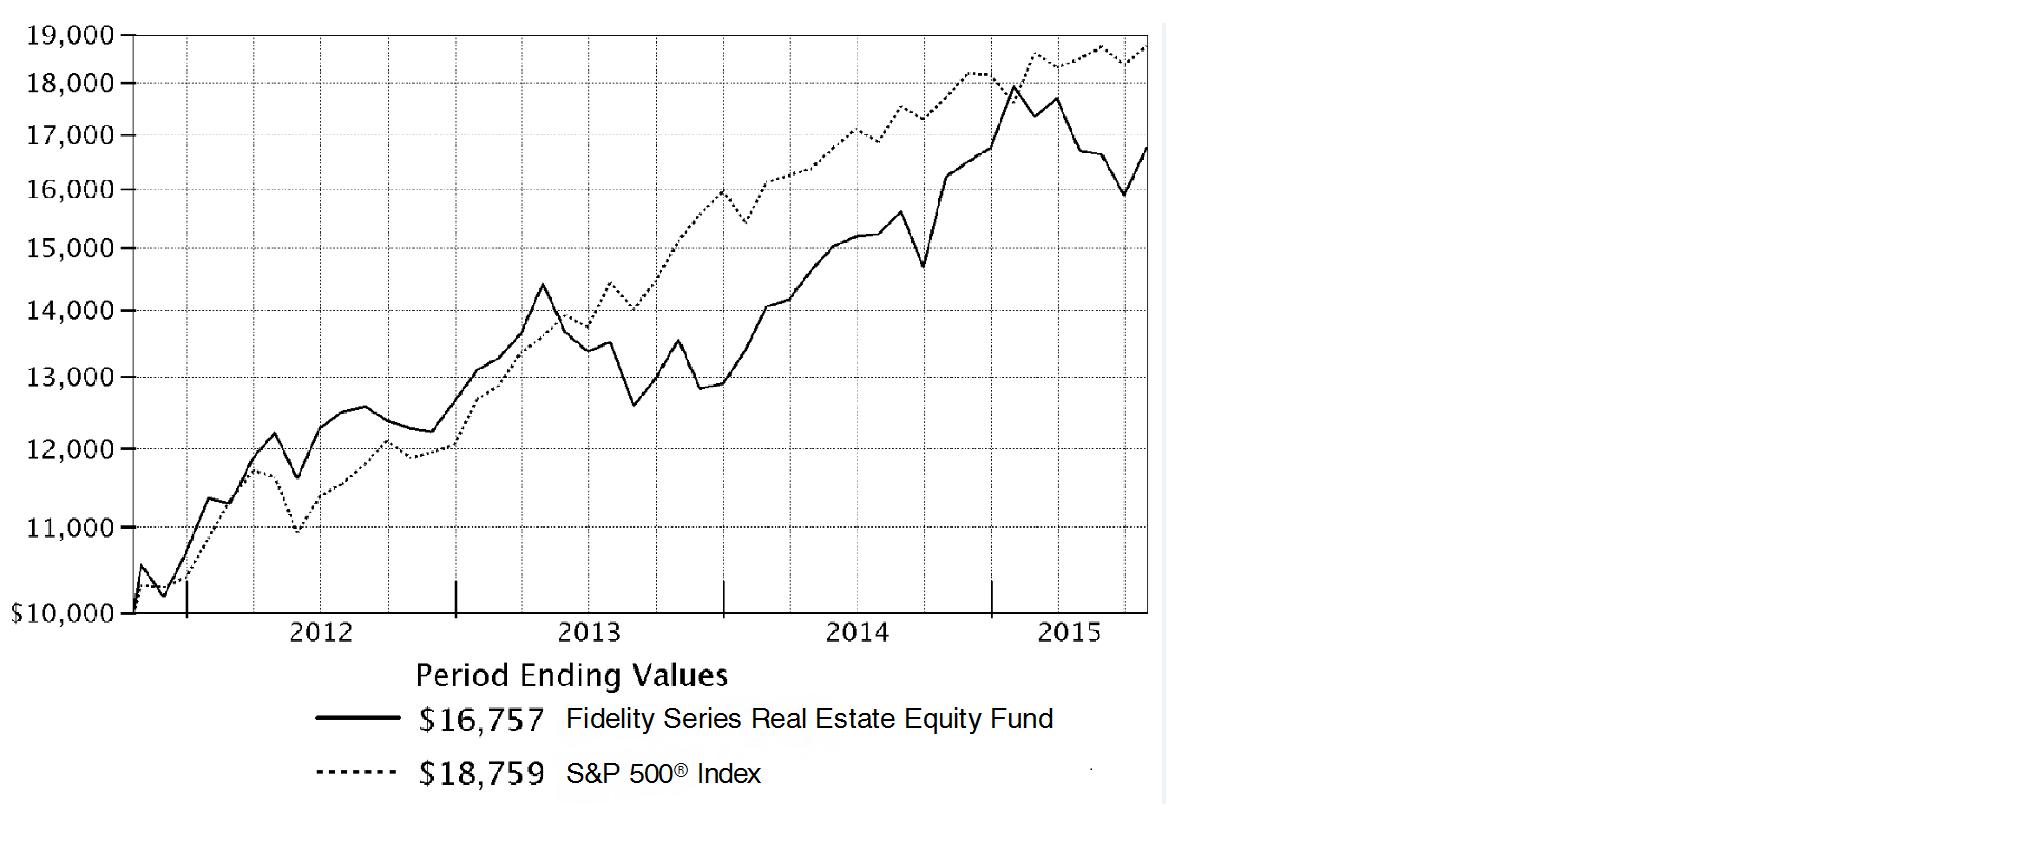
Annual Report
Market Recap: The U.S. equity market gained strongly for the 12 months ending July 31, 2015 as stocks recovered from volatility in late 2014 and early 2015, supported by a still-positive economic backdrop. The S&P 500® Index returned 11.21%, with growth stocks in the index far outpacing value-oriented names on prospects for continued U.S. economic growth. As a result, the growth-oriented Nasdaq Composite Index® rose 18.71%, outpacing the broader S&P 500®, as well as the 12.03% advance of the smaller-cap Russell 2000® Index. Within the S&P 500®, seven of 10 sectors notched a gain, with significant performance variation. Health care (+27%) led the way, aided by merger activity. Consumer discretionary (+24%) benefited from spending linked to a seven-year low in unemployment. Strong first halves for consumer staples and the real estate segment of the financials sector yielded above-market returns (19% and 12%, respectively) for the full-year period. Conversely, energy (-26%) significantly lagged, due to a roughly 55% decline for U.S. crude-oil prices. Materials (-4%) also lost ground. At period end, investors remained focused on the slowing rate of U.S. earnings growth, the possible effect of a relatively stronger U.S. dollar on exports and inflation, and whether an economic slowdown in China would create ripples for the global economy.
Comments from Portfolio Manager Samuel Wald: For the year, the fund's share classes fell short of the 11.29% return of our sector benchmark, the Dow Jones U.S. Select Real Estate Securities IndexSM. (For specific class-level results, please see the Performance section of this report.) Versus the benchmark, the fund was hampered by security selection in the retail and health care sectors. Among retail REITs, underweightings in General Growth Properties (GGP) and Macerich notably detracted. I initially avoided GGP, a sizable index constituent, because I thought other retail REITs offered better risk/reward characteristics. But in March I took advantage of GGP's weakness to add exposure here. We also lacked exposure to Macerich, another index component, for much of the period. I eventually did establish a position in the stock, as I saw more performance potential over the medium term. Elsewhere, hotel REIT Felcor Lodging Trust struggled as one of its large redevelopment projects encountered delays. The fund benefited from underweighting Host Hotels & Resorts, which lagged along with the hotel sector. Other positives included self-storage operator Extra Space Storage and apartment REIT Essex Property Trust. Lastly, stock picking in the industrial/office sector was beneficial, led by Alexandria Real Estate Equities, an owner of laboratory space.
The views expressed above reflect those of the portfolio manager(s) only through the end of the period as stated on the cover of this report and do not necessarily represent the views of Fidelity or any other person in the Fidelity organization. Any such views are subject to change at any time based upon market or other conditions and Fidelity disclaims any responsibility to update such views. These views may not be relied on as investment advice and, because investment decisions for a Fidelity fund are based on numerous factors, may not be relied on as an indication of trading intent on behalf of any Fidelity fund.
Annual Report
Shareholder Expense Example
As a shareholder of the Fund, you incur two types of costs: (1) transaction costs, and (2) ongoing costs, including management fees and other Fund expenses. This Example is intended to help you understand your ongoing costs (in dollars) of investing in the Fund and to compare these costs with the ongoing costs of investing in other mutual funds.
The Example is based on an investment of $1,000 invested at the beginning of the period and held for the entire period (February 1, 2015 to July 31, 2015).
Actual Expenses
The first line of the accompanying table for each class of the Fund provides information about actual account values and actual expenses. You may use the information in this line, together with the amount you invested, to estimate the expenses that you paid over the period. Simply divide your account value by $1,000.00 (for example, an $8,600 account value divided by $1,000.00 = 8.6), then multiply the result by the number in the first line for a class of the Fund under the heading entitled "Expenses Paid During Period" to estimate the expenses you paid on your account during this period. In addition, the Fund, as a shareholder in the underlying Fidelity Central Funds, will indirectly bear its pro-rata share of the fees and expenses incurred by the underlying Fidelity Central Funds. These fees and expenses are not included in the Fund's annualized expense ratio used to calculate the expense estimate in the table below.
Hypothetical Example for Comparison Purposes
The second line of the accompanying table for each class of the Fund provides information about hypothetical account values and hypothetical expenses based on a Class' actual expense ratio and an assumed rate of return of 5% per year before expenses, which is not the Class' actual return. The hypothetical account values and expenses may not be used to estimate the actual ending account balance or expenses you paid for the period. You may use this information to compare the ongoing costs of investing in the Fund and other funds. To do so, compare this 5% hypothetical example with the 5% hypothetical examples that appear in the shareholder reports of the other funds. In addition, the Fund, as a shareholder in the underlying Fidelity Central Funds, will indirectly bear its pro-rata share of the fees and expenses incurred by the underlying Fidelity Central Funds. These fees and expenses are not included in the Fund's annualized expense ratio used to calculate the expense estimate in the table below.
Please note that the expenses shown in the table are meant to highlight your ongoing costs only and do not reflect any transaction costs. Therefore, the second line of the table is useful in comparing ongoing costs only, and will not help you determine the relative total costs of owning different funds.
Annual Report
| Annualized
Expense RatioB | Beginning
Account Value
February 1, 2015 | Ending
Account Value
July 31, 2015 | Expenses Paid
During Period*
February 1, 2015
to July 31, 2015 |
Series Real Estate Equity | .75% | | | |
Actual | | $ 1,000.00 | $ 934.10 | $ 3.60 |
HypotheticalA | | $ 1,000.00 | $ 1,021.08 | $ 3.76 |
Class F | .59% | | | |
Actual | | $ 1,000.00 | $ 935.40 | $ 2.83 |
HypotheticalA | | $ 1,000.00 | $ 1,021.87 | $ 2.96 |
A 5% return per year before expenses
B Annualized expense ratio reflects expenses net of applicable fee waivers.
* Expenses are equal to each Class' annualized expense ratio, multiplied by the average account value over the period, multiplied by 181/365 (to reflect the one-half year period).
Annual Report
Investment Changes (Unaudited)
Top Ten Stocks as of July 31, 2015 |
| % of fund's
net assets | % of fund's net assets
6 months ago |
Simon Property Group, Inc. | 10.2 | 12.3 |
Boston Properties, Inc. | 5.6 | 5.8 |
Essex Property Trust, Inc. | 5.1 | 4.9 |
Public Storage | 4.5 | 3.3 |
HCP, Inc. | 4.4 | 5.1 |
SL Green Realty Corp. | 4.2 | 4.5 |
UDR, Inc. | 3.9 | 3.3 |
Alexandria Real Estate Equities, Inc. | 3.8 | 3.8 |
Extra Space Storage, Inc. | 3.4 | 3.3 |
Ventas, Inc. | 3.3 | 2.6 |
| 48.4 | |
Top Five REIT Sectors as of July 31, 2015 |
| % of fund's
net assets | % of fund's net assets
6 months ago |
REITs - Apartments | 18.0 | 17.2 |
REITs - Office Property | 16.6 | 15.9 |
REITs - Regional Malls | 15.7 | 15.6 |
REITs - Health Care | 11.4 | 11.5 |
REITs - Shopping Centers | 9.4 | 9.4 |
Asset Allocation (% of fund's net assets) |
As of July 31, 2015 | As of January 31, 2015 |
 | Stocks 99.2% | |  | Stocks 98.6% | |
 | Short-Term
Investments and
Net Other Assets
(Liabilities) 0.8% | |  | Short-Term
Investments and
Net Other Assets
(Liabilities) 1.4% | |

Annual Report
Investments July 31, 2015
Showing Percentage of Net Assets
Common Stocks - 99.2% |
| Shares | | Value |
REAL ESTATE INVESTMENT TRUSTS - 97.0% |
REITs - Apartments - 18.0% |
American Campus Communities, Inc. | 569,500 | | $ 21,253,740 |
American Residential Properties, Inc. | 203,200 | | 3,759,200 |
AvalonBay Communities, Inc. | 172,035 | | 29,648,512 |
Camden Property Trust (SBI) | 338,800 | | 26,978,644 |
Equity Residential (SBI) | 359,151 | | 26,868,086 |
Essex Property Trust, Inc. | 280,367 | | 63,057,342 |
Mid-America Apartment Communities, Inc. | 24,600 | | 1,976,364 |
UDR, Inc. | 1,415,000 | | 47,841,150 |
TOTAL REITS - APARTMENTS | | 221,383,038 |
REITs - Diversified - 5.3% |
Cousins Properties, Inc. | 1,733,126 | | 17,989,848 |
Digital Realty Trust, Inc. | 336,800 | | 21,646,136 |
Liberty Property Trust (SBI) | 575,400 | | 19,580,862 |
Vornado Realty Trust | 66,100 | | 6,448,055 |
TOTAL REITS - DIVERSIFIED | | 65,664,901 |
REITs - Health Care - 11.4% |
Community Healthcare Trust, Inc. | 59,800 | | 1,128,426 |
HCP, Inc. | 1,388,259 | | 53,642,328 |
Health Care REIT, Inc. | 230,849 | | 16,013,995 |
Medical Properties Trust, Inc. | 402,300 | | 5,499,441 |
Sabra Health Care REIT, Inc. | 493,913 | | 13,508,521 |
Senior Housing Properties Trust (SBI) | 597,400 | | 10,317,098 |
Ventas, Inc. | 599,137 | | 40,196,101 |
TOTAL REITS - HEALTH CARE | | 140,305,910 |
REITs - Hotels - 6.4% |
Ashford Hospitality Prime, Inc. | 470,083 | | 6,844,408 |
FelCor Lodging Trust, Inc. | 2,954,013 | | 27,649,562 |
Host Hotels & Resorts, Inc. | 845,300 | | 16,381,914 |
LaSalle Hotel Properties (SBI) | 197,600 | | 6,574,152 |
RLJ Lodging Trust | 718,000 | | 21,417,940 |
TOTAL REITS - HOTELS | | 78,867,976 |
REITs - Management/Investment - 0.3% |
Weyerhaeuser Co. | 109,900 | | 3,372,831 |
Common Stocks - continued |
| Shares | | Value |
REAL ESTATE INVESTMENT TRUSTS - CONTINUED |
REITs - Manufactured Homes - 1.9% |
Sun Communities, Inc. | 331,555 | | $ 23,046,388 |
REITs - Office Property - 16.6% |
Alexandria Real Estate Equities, Inc. | 510,308 | | 47,310,655 |
Boston Properties, Inc. | 560,149 | | 69,055,169 |
Mack-Cali Realty Corp. | 861,900 | | 17,961,996 |
Parkway Properties, Inc. | 1,038,400 | | 18,628,896 |
SL Green Realty Corp. | 450,432 | | 51,862,740 |
TOTAL REITS - OFFICE PROPERTY | | 204,819,456 |
REITs - Regional Malls - 15.7% |
General Growth Properties, Inc. | 826,800 | | 22,439,352 |
Simon Property Group, Inc. | 665,023 | | 124,505,604 |
Taubman Centers, Inc. | 359,422 | | 26,884,766 |
The Macerich Co. | 236,300 | | 18,705,508 |
TOTAL REITS - REGIONAL MALLS | | 192,535,230 |
REITs - Shopping Centers - 9.4% |
Cedar Shopping Centers, Inc. | 1,640,990 | | 10,994,633 |
Federal Realty Investment Trust (SBI) | 283,552 | | 38,787,078 |
Kite Realty Group Trust | 421,950 | | 11,139,480 |
Ramco-Gershenson Properties Trust (SBI) | 475,300 | | 8,051,582 |
Urban Edge Properties | 1,496,550 | | 32,130,929 |
WP Glimcher, Inc. | 1,038,211 | | 14,057,377 |
TOTAL REITS - SHOPPING CENTERS | | 115,161,079 |
REITs - Storage - 7.9% |
Extra Space Storage, Inc. | 561,300 | | 41,266,776 |
Public Storage | 270,887 | | 55,580,595 |
TOTAL REITS - STORAGE | | 96,847,371 |
REITs - Warehouse/Industrial - 4.1% |
DCT Industrial Trust, Inc. | 870,975 | | 30,275,091 |
Common Stocks - continued |
| Shares | | Value |
REAL ESTATE INVESTMENT TRUSTS - CONTINUED |
REITs - Warehouse/Industrial - continued |
Prologis, Inc. | 347,006 | | $ 14,091,914 |
Terreno Realty Corp. | 297,700 | | 6,242,769 |
TOTAL REITS - WAREHOUSE/INDUSTRIAL | | 50,609,774 |
TOTAL REAL ESTATE INVESTMENT TRUSTS | | 1,192,613,954 |
REAL ESTATE MANAGEMENT & DEVELOPMENT - 2.2% |
Real Estate Operating Companies - 2.2% |
Forest City Enterprises, Inc. Class A (a) | 1,189,642 | | 27,778,141 |
TOTAL COMMON STOCKS (Cost $1,023,936,484) |
1,220,392,095
|
Money Market Funds - 0.5% |
| | | |
Fidelity Cash Central Fund, 0.17% (b)
(Cost $5,663,318) | 5,663,318 | |
5,663,318
|
TOTAL INVESTMENT PORTFOLIO - 99.7% (Cost $1,029,599,802) | | 1,226,055,413 |
NET OTHER ASSETS (LIABILITIES) - 0.3% | | 3,482,693 |
NET ASSETS - 100% | $ 1,229,538,106 |
Legend |
(a) Non-income producing |
(b) Affiliated fund that is generally available only to investment companies and other accounts managed by Fidelity Investments. The rate quoted is the annualized seven-day yield of the fund at period end. A complete unaudited listing of the fund's holdings as of its most recent quarter end is available upon request. In addition, each Fidelity Central Fund's financial statements, which are not covered by the Fund's Report of Independent Registered Public Accounting Firm, are available on the SEC's website or upon request. |
Affiliated Central Funds |
Information regarding fiscal year to date income earned by the Fund from investments in Fidelity Central Funds is as follows: |
Fund | Income earned |
Fidelity Cash Central Fund | $ 14,841 |
Fidelity Securities Lending Cash Central Fund | 50,964 |
Total | $ 65,805 |
Other Information |
All investments are categorized as Level 1 under the Fair Value Hierarchy. The inputs or methodology used for valuing securities may not be an indication of the risk associated with investing in those securities. For more information on valuation inputs, please refer to the Investment Valuation section in the accompanying Notes to Financial Statements. |
See accompanying notes which are an integral part of the financial statements.
Annual Report
Statement of Assets and Liabilities
| | July 31, 2015 |
| | |
Assets | | |
Investment in securities, at value - See accompanying schedule: Unaffiliated issuers (cost $1,023,936,484) | $ 1,220,392,095 | |
Fidelity Central Funds (cost $5,663,318) | 5,663,318 | |
Total Investments (cost $1,029,599,802) | | $ 1,226,055,413 |
Receivable for investments sold | | 7,453,321 |
Receivable for fund shares sold | | 18,877,259 |
Dividends receivable | | 232,985 |
Distributions receivable from Fidelity Central Funds | | 1,005 |
Other receivables | | 35,650 |
Total assets | | 1,252,655,633 |
| | |
Liabilities | | |
Payable for investments purchased | $ 21,418,505 | |
Payable for fund shares redeemed | 999,201 | |
Accrued management fee | 547,572 | |
Other affiliated payables | 107,601 | |
Other payables and accrued expenses | 44,648 | |
Total liabilities | | 23,117,527 |
| | |
Net Assets | | $ 1,229,538,106 |
Net Assets consist of: | | |
Paid in capital | | $ 944,469,177 |
Undistributed net investment income | | 4,163,387 |
Accumulated undistributed net realized gain (loss) on investments | | 84,449,931 |
Net unrealized appreciation (depreciation) on investments | | 196,455,611 |
Net Assets | | $ 1,229,538,106 |
See accompanying notes which are an integral part of the financial statements.
Annual Report
Statement of Assets and Liabilities - continued
| | July 31, 2015 |
| | |
Series Real Estate Equity:
Net Asset Value, offering price and redemption price per share ($577,786,433 ÷ 40,733,215 shares) | | $ 14.18 |
| | |
Class F:
Net Asset Value, offering price and redemption price per share ($651,751,673 ÷ 45,936,475 shares) | | $ 14.19 |
See accompanying notes which are an integral part of the financial statements.
Annual Report
Financial Statements - continued
Statement of Operations
| Year ended July 31, 2015 |
| | |
Investment Income | | |
Dividends | | $ 30,458,324 |
Income from Fidelity Central Funds | | 65,805 |
Total income | | 30,524,129 |
| | |
Expenses | | |
Management fee | $ 6,878,733 | |
Transfer agent fees | 974,476 | |
Accounting and security lending fees | 406,085 | |
Custodian fees and expenses | 34,450 | |
Independent trustees' compensation | 5,279 | |
Audit | 50,940 | |
Legal | 2,989 | |
Interest | 3,448 | |
Miscellaneous | 8,733 | |
Total expenses before reductions | 8,365,133 | |
Expense reductions | (128,767) | 8,236,366 |
Net investment income (loss) | | 22,287,763 |
Realized and Unrealized Gain (Loss) Net realized gain (loss) on: | | |
Investment securities: | | |
Unaffiliated issuers | | 105,851,825 |
Change in net unrealized appreciation (depreciation) on investment securities | | 7,806,315 |
Net gain (loss) | | 113,658,140 |
Net increase (decrease) in net assets resulting from operations | | $ 135,945,903 |
See accompanying notes which are an integral part of the financial statements.
Annual Report
Statement of Changes in Net Assets
| Year ended
July 31,
2015 | Year ended
July 31,
2014 |
Increase (Decrease) in Net Assets | | |
Operations | | |
Net investment income (loss) | $ 22,287,763 | $ 21,695,094 |
Net realized gain (loss) | 105,851,825 | 51,455,849 |
Change in net unrealized appreciation (depreciation) | 7,806,315 | 71,304,807 |
Net increase (decrease) in net assets resulting from operations | 135,945,903 | 144,455,750 |
Distributions to shareholders from net investment income | (22,136,162) | (19,187,861) |
Distributions to shareholders from net realized gain | (71,866,191) | (29,660,377) |
Total distributions | (94,002,353) | (48,848,238) |
Share transactions - net increase (decrease) | (57,207,882) | 124,245,341 |
Total increase (decrease) in net assets | (15,264,332) | 219,852,853 |
| | |
Net Assets | | |
Beginning of period | 1,244,802,438 | 1,024,949,585 |
End of period (including undistributed net investment income of $4,163,387 and undistributed net investment income of $4,533,326, respectively) | $ 1,229,538,106 | $ 1,244,802,438 |
See accompanying notes which are an integral part of the financial statements.
Annual Report
Financial Highlights - Series Real Estate Equity
Years ended July 31, | 2015 | 2014 | 2013 | 2012G |
Selected Per-Share Data | | | | |
Net asset value, beginning of period | $ 13.85 | $ 12.87 | $ 12.39 | $ 10.00 |
Income from Investment Operations | | | | |
Net investment income (loss)D | .24 | .23 | .18 | .11 |
Net realized and unrealized gain (loss) | 1.11 | 1.31 | .78 | 2.38 |
Total from investment operations | 1.35 | 1.54 | .96 | 2.49 |
Distributions from net investment income | (.23) | (.21) | (.17) | (.08) |
Distributions from net realized gain | (.79) | (.35) | (.31) | (.02) |
Total distributions | (1.02) | (.56) | (.48) | (.10) |
Net asset value, end of period | $ 14.18 | $ 13.85 | $ 12.87 | $ 12.39 |
Total ReturnB, C | 10.04% | 12.72% | 8.06% | 25.03% |
Ratios to Average Net Assets E, H | | | | |
Expenses before reductions | .76% | .77% | .79% | .81%A |
Expenses net of fee waivers, if any | .75% | .77% | .79% | .81%A |
Expenses net of all reductions | .74% | .76% | .78% | .81%A |
Net investment income (loss) | 1.69% | 1.84% | 1.44% | 1.27%A |
Supplemental Data | | | | |
Net assets, end of period (000 omitted) | $ 577,786 | $ 598,298 | $ 531,188 | $ 475,392 |
Portfolio turnover rateF | 60% | 69% | 48% | 40%A |
A Annualized
B Total returns for periods of less than one year are not annualized.
C Total returns would have been lower if certain expenses had not been reduced during the applicable periods shown.
D Calculated based on average shares outstanding during the period.
E Fees and expenses of any underlying Fidelity Central Funds are not included in the Fund's expense ratio. The Fund indirectly bears its proportionate share of the expenses of any underlying Fidelity Central Funds.
F Amount does not include the portfolio activity of any underlying Fidelity Central Funds.
G For the period October 20, 2011 (commencement of operations) to July 31, 2012.
H Expense ratios reflect operating expenses of the class. Expenses before reductions do not reflect amounts reimbursed by the investment adviser or reductions from brokerage service arrangements or reductions from other expense offset arrangements and do not represent the amount paid by the class during periods when reimbursements or reductions occur. Expense ratios before reductions for start-up periods may not be representative of long-term operating periods. Expenses net of fee waivers reflect expenses after reimbursement by the investment adviser but prior to reductions from brokerage service arrangements or other expense offset arrangements. Expenses net of all reductions represent the net expenses paid by the class.
See accompanying notes which are an integral part of the financial statements.
Annual Report
Financial Highlights - Class F
Years ended July 31, | 2015 | 2014 | 2013 | 2012G |
Selected Per-Share Data | | | | |
Net asset value, beginning of period | $ 13.86 | $ 12.87 | $ 12.39 | $ 10.00 |
Income from Investment Operations | | | | |
Net investment income (loss)D | .26 | .26 | .21 | .13 |
Net realized and unrealized gain (loss) | 1.11 | 1.31 | .78 | 2.37 |
Total from investment operations | 1.37 | 1.57 | .99 | 2.50 |
Distributions from net investment income | (.25) | (.23) | (.20) | (.09) |
Distributions from net realized gain | (.79) | (.35) | (.31) | (.02) |
Total distributions | (1.04) | (.58) | (.51) | (.11) |
Net asset value, end of period | $ 14.19 | $ 13.86 | $ 12.87 | $ 12.39 |
Total ReturnB, C | 10.23% | 13.01% | 8.27% | 25.16% |
Ratios to Average Net Assets E, H | | | | |
Expenses before reductions | .59% | .59% | .60% | .61%A |
Expenses net of fee waivers, if any | .59% | .59% | .60% | .61%A |
Expenses net of all reductions | .58% | .59% | .59% | .61%A |
Net investment income (loss) | 1.86% | 2.02% | 1.63% | 1.47%A |
Supplemental Data | | | | |
Net assets, end of period (000 omitted) | $ 651,752 | $ 646,504 | $ 493,761 | $ 323,523 |
Portfolio turnover rateF | 60% | 69% | 48% | 40%A |
A Annualized
B Total returns for periods of less than one year are not annualized.
C Total returns would have been lower if certain expenses had not been reduced during the applicable periods shown.
D Calculated based on average shares outstanding during the period.
E Fees and expenses of any underlying Fidelity Central Funds are not included in the Fund's expense ratio. The Fund indirectly bears its proportionate share of the expenses of any underlying Fidelity Central Funds.
F Amount does not include the portfolio activity of any underlying Fidelity Central Funds.
G For the period October 20, 2011 (commencement of operations) to July 31, 2012.
H Expense ratios reflect operating expenses of the class. Expenses before reductions do not reflect amounts reimbursed by the investment adviser or reductions from brokerage service arrangements or reductions from other expense offset arrangements and do not represent the amount paid by the class during periods when reimbursements or reductions occur. Expense ratios before reductions for start-up periods may not be representative of long-term operating periods. Expenses net of fee waivers reflect expenses after reimbursement by the investment adviser but prior to reductions from brokerage service arrangements or other expense offset arrangements. Expenses net of all reductions represent the net expenses paid by the class.
See accompanying notes which are an integral part of the financial statements.
Annual Report
For the period ended July 31, 2015
1. Organization.
Fidelity Series Real Estate Equity Fund (the Fund) is a non-diversified fund of Fidelity Securities Fund (the Trust) and is authorized to issue an unlimited number of shares. Shares of the Fund are only available for purchase by mutual funds for which Fidelity Management & Research Company (FMR) or an affiliate serves as an investment manager. The Trust is registered under the Investment Company Act of 1940, as amended (the 1940 Act), as an open-end management investment company organized as a Massachusetts business trust. The Fund offers Series Real Estate Equity and Class F shares, each of which has equal rights as to assets and voting privileges. Each class has exclusive voting rights with respect to matters that affect that class.
2. Investments in Fidelity Central Funds.
The Fund invests in Fidelity Central Funds, which are open-end investment companies generally available only to other investment companies and accounts managed by the investment adviser and its affiliates. The Fund's Schedule of Investments lists each of the Fidelity Central Funds held as of period end, if any, as an investment of the Fund, but does not include the underlying holdings of each Fidelity Central Fund. As an Investing Fund, the Fund indirectly bears its proportionate share of the expenses of the underlying Fidelity Central Funds.
The Money Market Central Funds seek preservation of capital and current income and are managed by Fidelity Investments Money Management, Inc. (FIMM), an affiliate of the investment adviser. Annualized expenses of the Money Market Central Funds as of their most recent shareholder report date are less than .01%.
A complete unaudited list of holdings for each Fidelity Central Fund is available upon request or at the Securities and Exchange Commission (the SEC) website at www.sec.gov. In addition, the financial statements of the Fidelity Central Funds, which are not covered by the Fund's Report of Independent Registered Public Accounting Firm, are available on the SEC website or upon request.
3. Significant Accounting Policies.
The financial statements have been prepared in conformity with accounting principles generally accepted in the United States of America (GAAP), which require management to make certain estimates and assumptions at the date of the financial statements. Actual results could differ from those estimates. Subsequent events, if any, through the date that the financial statements were issued have been evaluated in the preparation of
Annual Report
Notes to Financial Statements - continued
3. Significant Accounting Policies - continued
the financial statements. The following summarizes the significant accounting policies of the Fund:
Investment Valuation. Investments are valued as of 4:00 p.m. Eastern time on the last calendar day of the period. The Board of Trustees (the Board) has delegated the day to day responsibility for the valuation of the Fund's investments to the FMR Fair Value Committee (the Committee). In accordance with valuation policies and procedures approved by the Board, the Fund attempts to obtain prices from one or more third party pricing vendors or brokers to value its investments. When current market prices, quotations or currency exchange rates are not readily available or reliable, investments will be fair valued in good faith by the Committee, in accordance with procedures adopted by the Board. Factors used in determining fair value vary by investment type and may include market or investment specific events. The frequency with which these procedures are used cannot be predicted and they may be utilized to a significant extent. The Committee oversees the Fund's valuation policies and procedures and reports to the Board on the Committee's activities and fair value determinations. The Board monitors the appropriateness of the procedures used in valuing the Fund's investments and ratifies the fair value determinations of the Committee.
The Fund categorizes the inputs to valuation techniques used to value its investments into a disclosure hierarchy consisting of three levels as shown below:
Level 1 - quoted prices in active markets for identical investments
Level 2 - other significant observable inputs (including quoted prices for similar investments, interest rates, prepayment speeds, etc.)
Level 3 - unobservable inputs (including the Fund's own assumptions based on the best information available)
Valuation techniques used to value the Fund's investments by major category are as follows:
Equity securities, including restricted securities, for which market quotations are readily available, are valued at the last reported sale price or official closing price as reported by a third party pricing vendor on the primary market or exchange on which they are traded and are categorized as Level 1 in the hierarchy. In the event there were no sales during the day or closing prices are not available, securities are valued at the last quoted bid price or may be valued using the last available price and are generally categorized as Level 2 in the hierarchy. For foreign equity securities, when market or security specific events arise, comparisons to the valuation of American Depositary Receipts (ADRs), futures contracts, Exchange-Traded Funds (ETFs) and certain indexes as well as quoted prices for similar securities may be used and would be categorized as Level 2 in the
Annual Report
3. Significant Accounting Policies - continued
Investment Valuation - continued
hierarchy. Utilizing these techniques may result in transfers between Level 1 and Level 2. For equity securities, including restricted securities, where observable inputs are limited, assumptions about market activity and risk are used and these securities may be categorized as Level 3 in the hierarchy.
Investments in open-end mutual funds, including the Fidelity Central Funds, are valued at their closing net asset value (NAV) each business day and are categorized as Level 1 in the hierarchy.
Changes in valuation techniques may result in transfers in or out of an assigned level within the disclosure hierarchy.
Investment Transactions and Income. For financial reporting purposes, the Fund's investment holdings and NAV include trades executed through the end of the last business day of the period. The NAV per share for processing shareholder transactions is calculated as of the close of business of the New York Stock Exchange (NYSE), normally 4:00 p.m. Eastern time and includes trades executed through the end of the prior business day. Gains and losses on securities sold are determined on the basis of identified cost. Dividend income is recorded on the ex-dividend date, except for certain dividends from foreign securities where the ex-dividend date may have passed, which are recorded as soon as the Fund is informed of the ex-dividend date. Non-cash dividends included in dividend income, if any, are recorded at the fair market value of the securities received. Income and capital gain distributions from Fidelity Central Funds, if any, are recorded on the ex-dividend date. Distributions received on securities that represent a return of capital or capital gain are recorded as a reduction of cost of investments and/or as a realized gain. Subsequent to ex-dividend date the Fund determines the components of these distributions, based upon receipt of tax filings or other correspondence relating to the underlying investment.
Class Allocations and Expenses. Investment income, realized and unrealized capital gains and losses, common expenses of the Fund, and certain fund-level expense reductions, if any, are allocated daily on a pro-rata basis to each class based on the relative net assets of each class to the total net assets of the Fund. Each class differs with respect to transfer agent fees incurred. Certain expense reductions may also differ by class. For the reporting period, the allocated portion of income and expenses to each class as a percent of its average net assets may vary due to the timing of recording these transactions in relation to fluctuating net assets of the classes. Expenses directly attributable to a fund are charged to that fund. Expenses attributable to more than one fund are allocated
Annual Report
Notes to Financial Statements - continued
3. Significant Accounting Policies - continued
Class Allocations and Expenses - continued
among the respective funds on the basis of relative net assets or other appropriate methods. Expense estimates are accrued in the period to which they relate and adjustments are made when actual amounts are known.
Income Tax Information and Distributions to Shareholders. Each year, the Fund intends to qualify as a regulated investment company under Subchapter M of the Internal Revenue Code, including distributing substantially all of its taxable income and realized gains. As a result, no provision for U.S. Federal income taxes is required. As of July 31, 2015, the Fund did not have any unrecognized tax benefits in the financial statements; nor is the Fund aware of any tax positions for which it is reasonably possible that the total amounts of unrecognized tax benefits will significantly change in the next twelve months. The Fund files a U.S. federal tax return, in addition to state and local tax returns as required. The Fund's federal income tax returns are subject to examination by the Internal Revenue Service (IRS) for a period of three fiscal years after they are filed. State and local tax returns may be subject to examination for an additional fiscal year depending on the jurisdiction.
Distributions are declared and recorded on the ex-dividend date. Income dividends and capital gain distributions are declared separately for each class. Income and capital gain distributions are determined in accordance with income tax regulations, which may differ from GAAP.
Capital accounts within the financial statements are adjusted for permanent book-tax differences. These adjustments have no impact on net assets or the results of operations. Capital accounts are not adjusted for temporary book-tax differences which will reverse in a subsequent period.
Book-tax differences are primarily due to losses deferred due to wash sales.
The federal tax cost of investment securities and unrealized appreciation (depreciation) as of period end were as follows:
Gross unrealized appreciation | $ 219,335,385 |
Gross unrealized depreciation | (25,371,761) |
Net unrealized appreciation (depreciation) on securities | $ 193,963,624 |
| |
Tax Cost | $ 1,032,091,789 |
Annual Report
3. Significant Accounting Policies - continued
Income Tax Information and Distributions to Shareholders - continued
The tax-based components of distributable earnings as of period end were as follows:
Undistributed ordinary income | $ 19,154,345 |
Undistributed long-term capital gain | $ 71,950,959 |
Net unrealized appreciation (depreciation) on securities and other investments | $ 193,963,624 |
The tax character of distributions paid was as follows:
| July 31, 2015 | July 31, 2014 |
Ordinary Income | $ 23,076,953 | $ 25,299,133 |
Long-term Capital Gains | 70,925,400 | 23,549,105 |
Total | $ 94,002,353 | $ 48,848,238 |
4. Purchases and Sales of Investments.
Purchases and sales of securities, other than short-term securities, aggregated $746,641,028 and $854,467,059, respectively.
5. Fees and Other Transactions with Affiliates.
Management Fee. Fidelity Management & Research Company (the investment adviser) and its affiliates provide the Fund with investment management related services for which the Fund pays a monthly management fee. The management fee is the sum of an individual fund fee rate that is based on an annual rate of .30% of the Fund's average net assets and an annualized group fee rate that averaged .25% during the period. The group fee rate is based upon the average net assets of all the mutual funds advised by the investment adviser, including any mutual funds previously advised by the investment adviser that are currently advised by Fidelity SelectCo, LLC, an affiliate of the investment adviser. The group fee rate decreases as assets under management increase and increases as assets under management decrease. For the reporting period, the total annual management fee rate was .55% of the Fund's average net assets.
Transfer Agent Fees. Fidelity Investments Institutional Operations Company, Inc., (FIIOC), an affiliate of the investment adviser, is the transfer, dividend disbursing and shareholder servicing agent for each class of the Fund. FIIOC receives account fees and asset-based fees that vary according to the account size and type of account of the shareholders of Series Real Estate Equity. FIIOC receives no fees for providing transfer agency services to Class F. FIIOC pays for typesetting, printing and mailing of shareholder reports, except proxy statements.
Annual Report
Notes to Financial Statements - continued
5. Fees and Other Transactions with Affiliates - continued
Transfer Agent Fees - continued
For the period, transfer agent fees for each applicable class were as follows:
| Amount | % of
Class-Level Average
Net Assets |
Series Real Estate Equity | $ 974,476 | .17 |
Accounting and Security Lending Fees. Fidelity Service Company, Inc. (FSC), an affiliate of the investment adviser, maintains the Fund's accounting records. The accounting fee is based on the level of average net assets for each month. Under a separate contract, FSC administers the security lending program. The security lending fee is based on the number and duration of lending transactions.
Brokerage Commissions. The Fund placed a portion of its portfolio transactions with brokerage firms which are affiliates of the investment adviser. Brokerage commissions are included in net realized gain (loss) and change in net unrealized appreciation (depreciation) in the Statement of Operations. The commissions paid to these affiliated firms were $5,709 for the period.
Interfund Lending Program. Pursuant to an Exemptive Order issued by the SEC, the Fund, along with other registered investment companies having management contracts with FMR or other affiliated entities of FMR, may participate in an interfund lending program. This program provides an alternative credit facility allowing the funds to borrow from, or lend money to, other participating affiliated funds. At period end, there were no interfund loans outstanding. The Fund's activity in this program during the period for which loans were outstanding was as follows:
Borrower or Lender | Average Loan
Balance | Weighted Average
Interest Rate | Interest
Expense |
Borrower | $ 30,168,667 | .34% | $ 3,448 |
6. Committed Line of Credit.
The Fund participates with other funds managed by the investment adviser or an affiliate in a $4.25 billion credit facility (the "line of credit") to be utilized for temporary or emergency purposes to fund shareholder redemptions or for other short-term liquidity purposes. The Fund has agreed to pay commitment fees on its pro-rata portion of the line of credit, which amounted to $1,837 and is reflected in Miscellaneous expenses on the Statement of Operations. During the period, the Fund did not borrow on this line of credit.
Annual Report
7. Security Lending.
The Fund lends portfolio securities through a lending agent from time to time in order to earn additional income. For equity securities, a lending agent is used and may loan securities to certain qualified borrowers, including Fidelity Capital Markets (FCM), a broker-dealer affiliated with the Fund. On the settlement date of the loan, the Fund receives collateral (in the form of U.S. Treasury obligations, letters of credit and/or cash) against the loaned securities and maintains collateral in an amount not less than 100% of the market value of the loaned securities during the period of the loan. The market value of the loaned securities is determined at the close of business of the Fund and any additional required collateral is delivered to the Fund on the next business day. If the borrower defaults on its obligation to return the securities loaned because of insolvency or other reasons, the Fund may apply collateral received from the borrower against the obligation. The Fund may experience delays and costs in recovering the securities loaned. Any cash collateral received is invested in the Fidelity Securities Lending Cash Central Fund. At period end, there were no security loans outstanding. Security lending income represents the income earned on investing cash collateral, less rebates paid to borrowers and any lending agent fees associated with the loan, plus any premium payments received for lending certain types of securities. Security lending income is presented in the Statement of Operations as a component of income from Fidelity Central Funds. Total security lending income during the period amounted to $50,964. During the period, there were no securities loaned to FCM.
8. Expense Reductions.
Commissions paid to certain brokers with whom the investment adviser, or its affiliates, places trades on behalf of the Fund include an amount in addition to trade execution, which may be rebated back to the Fund to offset certain expenses. This amount totaled $111,029 for the period.
In addition, during the period the investment adviser reimbursed/waived a portion of fund-level operating expenses in the amount of $4,697 and a portion of class-level operating expenses as follows:
| Amount |
Series Real Estate Equity | $ 13,041 |
Annual Report
Notes to Financial Statements - continued
9. Distributions to Shareholders.
Distributions to shareholders of each class were as follows:
Years ended July 31, | 2015 | 2014 |
From net investment income | | |
Series Real Estate Equity | $ 9,854,635 | $ 9,282,647 |
Class F | 12,281,527 | 9,905,214 |
Total | $ 22,136,162 | $ 19,187,861 |
From net realized gain | | |
Series Real Estate Equity | $ 34,110,116 | $ 14,856,526 |
Class F | 37,756,075 | 14,803,851 |
Total | $ 71,866,191 | $ 29,660,377 |
10. Share Transactions.
Transactions for each class of shares were as follows:
| Shares | Dollars |
Years ended July 31, | 2015 | 2014 | 2015 | 2014 |
Series Real Estate Equity | | | | |
Shares sold | 5,563,053 | 12,135,298 | $ 79,011,834 | $ 155,920,114 |
Reinvestment of distributions | 3,171,934 | 2,036,221 | 43,964,751 | 24,139,173 |
Shares redeemed | (11,198,553) | (12,260,138) | (163,372,510) | (160,457,152) |
Net increase (decrease) | (2,463,566) | 1,911,381 | $ (40,395,925) | $ 19,602,135 |
Class F | | | | |
Shares sold | 8,500,030 | 17,886,060 | $ 120,305,866 | $ 232,091,231 |
Reinvestment of distributions | 3,607,000 | 2,085,724 | 50,037,602 | 24,709,065 |
Shares redeemed | (12,831,072) | (11,669,575) | (187,155,425) | (152,157,090) |
Net increase (decrease) | (724,042) | 8,302,209 | $ (16,811,957) | $ 104,643,206 |
11. Other.
The Fund's organizational documents provide former and current trustees and officers with a limited indemnification against liabilities arising in connection with the performance of their duties to the Fund. In the normal course of business, the Fund may also enter into contracts that provide general indemnifications. The Fund's maximum exposure under these arrangements is unknown as this would be dependent on future claims that may be made against the Fund. The risk of material loss from such claims is considered remote.
At the end of the period, mutual funds managed by the investment adviser or its affiliates were the owners of record of all the outstanding shares of the Fund.
Annual Report
To the Trustees of Fidelity Securities Fund and Shareholders of Fidelity Series Real Estate Equity Fund:
We have audited the accompanying statement of assets and liabilities of Fidelity Series Real Estate Equity Fund (the Fund), a fund of Fidelity Securities Fund, including the schedule of investments, as of July 31, 2015, and the related statement of operations for the year then ended, the statement of changes in net assets for each of the two years in the period then ended, and the financial highlights for each of the periods presented. These financial statements and financial highlights are the responsibility of the Fund's management. Our responsibility is to express an opinion on these financial statements and financial highlights based on our audits.
We conducted our audits in accordance with the standards of the Public Company Accounting Oversight Board (United States). Those standards require that we plan and perform the audit to obtain reasonable assurance about whether the financial statements and financial highlights are free of material misstatement. The Fund is not required to have, nor were we engaged to perform, an audit of its internal control over financial reporting. Our audits included consideration of internal control over financial reporting as a basis for designing audit procedures that are appropriate in the circumstances, but not for the purpose of expressing an opinion on the effectiveness of the Fund's internal control over financial reporting. Accordingly, we express no such opinion. An audit also includes examining, on a test basis, evidence supporting the amounts and disclosures in the financial statements, assessing the accounting principles used and significant estimates made by management, as well as evaluating the overall financial statement presentation. Our procedures included confirmation of securities owned as of July 31, 2015, by correspondence with the custodians and brokers; when replies were not received from brokers, we performed other auditing procedures. We believe that our audits provide a reasonable basis for our opinion.
In our opinion, such financial statements and financial highlights referred to above present fairly, in all material respects, the financial position of Fidelity Series Real Estate Equity Fund as of July 31, 2015, the results of its operations for the year then ended, the changes in its net assets for each of the two years in the period then ended, and the financial highlights for each of the periods presented, in conformity with accounting principles generally accepted in the United States of America.
DELOITTE & TOUCHE LLP
Boston, Massachusetts
September 17, 2015
Annual Report
The Trustees, Member of the Advisory Board, and officers of the trust and fund, as applicable, are listed below. The Board of Trustees governs the fund and is responsible for protecting the interests of shareholders. The Trustees are experienced executives who meet periodically throughout the year to oversee the fund's activities, review contractual arrangements with companies that provide services to the fund, oversee management of the risks associated with such activities and contractual arrangements, and review the fund's performance. Each of the Trustees oversees 170 funds.
The Trustees hold office without limit in time except that (a) any Trustee may resign; (b) any Trustee may be removed by written instrument, signed by at least two-thirds of the number of Trustees prior to such removal; (c) any Trustee who requests to be retired or who has become incapacitated by illness or injury may be retired by written instrument signed by a majority of the other Trustees; and (d) any Trustee may be removed at any special meeting of shareholders by a two-thirds vote of the outstanding voting securities of the trust. Each Trustee who is not an interested person (as defined in the 1940 Act) of the trust and the fund (Independent Trustee), shall retire not later than the last day of the calendar year in which his or her 75th birthday occurs. The Independent Trustees may waive this mandatory retirement age policy with respect to individual Trustees. The officers and Advisory Board Member hold office without limit in time, except that any officer and Advisory Board Member may resign or may be removed by a vote of a majority of the Trustees at any regular meeting or any special meeting of the Trustees. Except as indicated, each individual has held the office shown or other offices in the same company for the past five years.
Experience, Skills, Attributes, and Qualifications of the Fund's Trustees. The Governance and Nominating Committee has adopted a statement of policy that describes the experience, qualifications, attributes, and skills that are necessary and desirable for potential Independent Trustee candidates (Statement of Policy). The Board believes that each Trustee satisfied at the time he or she was initially elected or appointed a Trustee, and continues to satisfy, the standards contemplated by the Statement of Policy. The Governance and Nominating Committee also engages professional search firms to help identify potential Independent Trustee candidates who have the experience, qualifications, attributes, and skills consistent with the Statement of Policy. From time to time, additional criteria based on the composition and skills of the current Independent Trustees, as well as experience or skills that may be appropriate in light of future changes to board composition, business conditions, and regulatory or other developments, have also been considered by the professional search firms and the Governance and Nominating Committee. In addition, the Board takes into account the Trustees' commitment and participation in Board and committee meetings, as well as their leadership of standing and ad hoc committees throughout their tenure.
In determining that a particular Trustee was and continues to be qualified to serve as a Trustee, the Board has considered a variety of criteria, none of which, in isolation, was controlling. The Board believes that, collectively, the Trustees have balanced and diverse experience, qualifications, attributes, and skills, which allow the Board to operate effectively in governing the fund and protecting the interests of shareholders. Information about the specific experience, skills, attributes, and qualifications of each Trustee, which in each case led to the Board's conclusion that the Trustee should serve (or continue to serve) as a trustee of the fund, is provided below.
Annual Report
Trustees and Officers - continued
Board Structure and Oversight Function. James C. Curvey is an interested person (as defined in the 1940 Act) and currently serves as Chairman. The Trustees have determined that an interested Chairman is appropriate and benefits shareholders because an interested Chairman has a personal and professional stake in the quality and continuity of services provided to the fund. Independent Trustees exercise their informed business judgment to appoint an individual of their choosing to serve as Chairman, regardless of whether the Trustee happens to be independent or a member of management. The Independent Trustees have determined that they can act independently and effectively without having an Independent Trustee serve as Chairman and that a key structural component for assuring that they are in a position to do so is for the Independent Trustees to constitute a substantial majority for the Board. The Independent Trustees also regularly meet in executive session. Ned C. Lautenbach serves as Chairman of the Independent Trustees and as such (i) acts as a liaison between the Independent Trustees and management with respect to matters important to the Independent Trustees and (ii) with management prepares agendas for Board meetings.
Fidelity funds are overseen by different Boards of Trustees. The fund's Board oversees Fidelity's high income and certain equity funds and other Boards oversee Fidelity's investment-grade bond, money market, asset allocation, and sector funds. The asset allocation funds may invest in Fidelity funds overseen by the fund's Board. The use of separate Boards, each with its own committee structure, allows the Trustees of each group of Fidelity funds to focus on the unique issues of the funds they oversee, including common research, investment, and operational issues. On occasion, the separate Boards establish joint committees to address issues of overlapping consequences for the Fidelity funds overseen by each Board.
The Trustees operate using a system of committees to facilitate the timely and efficient consideration of all matters of importance to the Trustees, the fund, and fund shareholders and to facilitate compliance with legal and regulatory requirements and oversight of the fund's activities and associated risks. The Board, acting through its committees, has charged FMR and its affiliates with (i) identifying events or circumstances the occurrence of which could have demonstrably adverse effects on the fund's business and/or reputation; (ii) implementing processes and controls to lessen the possibility that such events or circumstances occur or to mitigate the effects of such events or circumstances if they do occur; and (iii) creating and maintaining a system designed to evaluate continuously business and market conditions in order to facilitate the identification and implementation processes described in (i) and (ii) above. Because the day-to-day operations and activities of the fund are carried out by or through FMR, its affiliates and other service providers, the fund's exposure to risks is mitigated but not eliminated by the processes overseen by the Trustees. While each of the Board's committees has responsibility for overseeing different aspects of the fund's activities, oversight is exercised primarily through the Operations, Audit, and Compliance Committees. In addition, the Independent Trustees have worked with FMR to enhance the Board's oversight of investment and financial risks, legal and regulatory risks, technology risks, and operational risks, including the development of additional risk reporting to the Board. For example, a working group comprised of Independent Trustees and FMR has worked and continues to work to review the Fidelity funds' valuation-related activities, reporting and risk management. Appropriate personnel, including but not limited to the fund's Chief Compliance Officer (CCO), FMR's internal auditor, the independent accountants, the fund's Treasurer and portfolio management personnel, make periodic reports to the Board's committees, as appropriate, including an annual review of FMR's risk management program for the Fidelity funds. The responsibilities of each standing committee, including their oversight responsibilities, are described further under "Standing Committees of the Fund's Trustees."
Annual Report
The fund's Statements of Additional Information (SAIs) include more information about the Trustees. To request a free copy, call Fidelity at 1-800-544-8544 for Fidelity Series Real Estate Equity Fund, or 1-800-835-5092 for Class F.
Interested Trustees*:
Correspondence intended for each Trustee who is an interested person may be sent to Fidelity Investments, 245 Summer Street, Boston, Massachusetts 02210.
Name, Year of Birth; Principal Occupations and Other Relevant Experience+ |
James C. Curvey (1935) |
Year of Election or Appointment: 2007 Trustee Chairman of the Board of Trustees |
| Mr. Curvey also serves as Trustee of other Fidelity funds. Mr. Curvey is a Director of Fidelity Research & Analysis Co. (investment adviser firm, 2009-present), and Vice Chairman (2007-present) and Director of FMR LLC (diversified financial services company). In addition, Mr. Curvey serves as an Overseer for the Boston Symphony Orchestra and a member of the board of Artis-Naples, Naples, Florida, and as a Trustee for Brewster Academy, Wolfeboro, New Hampshire. Previously, Mr. Curvey served as a Director of Fidelity Investments Money Management, Inc. (investment adviser firm, 2009-2014), a Director of FMR (investment adviser firm, 2007-2014), and a Director of FMR Co., Inc. (investment adviser firm, 2007-2014). |
Charles S. Morrison (1960) |
Year of Election or Appointment: 2014 Trustee |
| Mr. Morrison also serves as Trustee of other funds. He serves as a Director of Fidelity Investments Money Management, Inc. (FIMM) (investment adviser firm, 2014-present), Director of Fidelity SelectCo, LLC (investment adviser firm, 2014-present), President, Asset Management (2014-present), and is an employee of Fidelity Investments. Previously, Mr. Morrison served as Vice President of Fidelity's Fixed Income and Asset Allocation Funds (2012-2014), President, Fixed Income (2011-2014), Vice President of Fidelity's Money Market Funds (2005-2009), President, Money Market Group Leader of FMR (investment adviser firm, 2009), and Senior Vice President, Money Market Group of FMR (2004-2009). Mr. Morrison also served as Vice President of Fidelity's Bond Funds (2002-2005), certain Balanced Funds (2002-2005), and certain Asset Allocation Funds (2002-2007), and as Senior Vice President (2002-2005) of Fidelity's Bond Division. |
* Trustees have been determined to be "Interested Trustees" by virtue of, among other things, their affiliation with the trust or various entities under common control with FMR.
+ The information above includes each Trustee's principal occupation during the last five years and other information relating to the experience, attributes, and skills relevant to each Trustee's qualifications to serve as a Trustee, which led to the conclusion that each Trustee should serve as a Trustee for the fund.
Annual Report
Independent Trustees:
Correspondence intended for each Independent Trustee (that is, the Trustees other than the Interested Trustees) may be sent to Fidelity Investments, P.O. Box 55235, Boston, Massachusetts 02205-5235.
Name, Year of Birth; Principal Occupations and Other Relevant Experience+ |
Dennis J. Dirks (1948) |
Year of Election or Appointment: 2005 Trustee |
| Mr. Dirks also serves as Trustee of other Fidelity funds. Prior to his retirement in May 2003, Mr. Dirks was Chief Operating Officer and a member of the Board of The Depository Trust & Clearing Corporation (DTCC). He also served as President, Chief Operating Officer, and Board member of The Depository Trust Company (DTC) and President and Board member of the National Securities Clearing Corporation (NSCC). In addition, Mr. Dirks served as Chief Executive Officer and Board member of the Government Securities Clearing Corporation, Chief Executive Officer and Board member of the Mortgage-Backed Securities Clearing Corporation, as a Trustee and a member of the Finance Committee of Manhattan College (2005-2008), and as a Trustee and a member of the Finance Committee of AHRC of Nassau County (2006-2008). Mr. Dirks is a member of the Independent Directors Council (IDC) Governing Council (2010-present) and Board of Directors for The Brookville Center for Children's Services, Inc. (2009-present). |
Alan J. Lacy (1953) |
Year of Election or Appointment: 2008 Trustee |
| Mr. Lacy also serves as Trustee of other Fidelity funds. Mr. Lacy serves as a member of the Board of Directors of Dave & Buster's Entertainment, Inc. (restaurant and entertainment complexes, 2010-present) and Bristol-Myers Squibb Company (global pharmaceuticals, 2008-present). In addition, Mr. Lacy served as Senior Adviser (2007-2014) of Oak Hill Capital Partners, L.P. (private equity) and also served as Chief Executive Officer (2000-2005) and Vice Chairman (2005-2006) of Sears Holdings Corporation and Sears, Roebuck and Co. (retail). Mr. Lacy is a member of the Board of Trustees of The National Parks Conservation Association (2006-present). Previously, Mr. Lacy served as Chairman of the Board of Trustees of the National Parks Conservation Association (2008-2011) and as a member of the Board of Directors for The Western Union Company (global money transfer, 2006-2011), The Hillman Companies, Inc. (hardware wholesalers, 2010-2014), and Earth Fare, Inc. (retail grocery, 2010-2014). |
Ned C. Lautenbach (1944) |
Year of Election or Appointment: 2000 Trustee Chairman of the Independent Trustees |
| Mr. Lautenbach also serves as Trustee of other Fidelity funds. Mr. Lautenbach currently serves as the Lead Director of the Eaton Corporation Board of Directors (diversified industrial, 1997-present). Mr. Lautenbach is Chairman of the Board of Directors of Artis-Naples in Naples, Florida (2012-present), a member of the Council on Foreign Relations (1994-present), and a member of the Board of Governors, State University System of Florida (2013-present). Previously, Mr. Lautenbach was a Partner/Advisory Partner at Clayton, Dubilier & Rice, LLC (private equity investment, 1998-2010), as well as a Director of Sony Corporation (2006-2007). |
Joseph Mauriello (1944) |
Year of Election or Appointment: 2008 Trustee |
| Mr. Mauriello also serves as Trustee of other Fidelity funds. Prior to his retirement in January 2006, Mr. Mauriello served in numerous senior management positions including Deputy Chairman and Chief Operating Officer (2004-2005), and Vice Chairman of Financial Services (2002-2004) of KPMG LLP US (professional services, 1965-2005). Mr. Mauriello currently serves as a member of the Board of Directors of XL Group plc. (global insurance and re-insurance, 2006-present). Previously, Mr. Mauriello served as a Director of the Hamilton Funds of the Bank of New York (2006-2007) and of Arcadia Resources Inc. (health care services and products, 2007-2012). |
Robert W. Selander (1950) |
Year of Election or Appointment: 2011 Trustee |
| Mr. Selander also serves as Trustee of other Fidelity funds. Mr. Selander serves as a Director of The Western Union Company (global money transfer, 2014-present). Previously, Mr. Selander served as a Member of the Advisory Board of other Fidelity funds (2011), and Executive Vice Chairman (2010), Chief Executive Officer (2009-2010), and President and Chief Executive Officer (1997-2009) of Mastercard, Inc. |
Cornelia M. Small (1944) |
Year of Election or Appointment: 2005 Trustee |
| Ms. Small also serves as Trustee of other Fidelity funds. Ms. Small is a member of the Board of Directors (2009-present) and Chair of the Investment Committee (2010-present) of the Teagle Foundation. Ms. Small also serves on the Investment Committee of the Berkshire Taconic Community Foundation (2008-present). Previously, Ms. Small served as Chairperson (2002-2008) and a member of the Investment Committee and Chairperson (2008-2012) and a member of the Board of Trustees of Smith College. In addition, Ms. Small served as Chief Investment Officer, Director of Global Equity Investments, and a member of the Board of Directors of Scudder, Stevens & Clark and Scudder Kemper Investments. |
William S. Stavropoulos (1939) |
Year of Election or Appointment: 2002 Trustee Vice Chairman of the Independent Trustees |
| Mr. Stavropoulos also serves as Trustee of other Fidelity funds. Mr. Stavropoulos serves as President and Founder of the Michigan Baseball Foundation, the Great Lakes Loons (2007-present). Mr. Stavropoulos is Chairman Emeritus of the Board of Directors of The Dow Chemical Company, where he previously served in numerous senior management positions, including President, CEO (1995-2000; 2002-2004), Chairman of the Executive Committee (2000-2006), and as a member of the Board of Directors (1990-2006). Currently, Mr. Stavropoulos is Chairman of the Board of Directors of Univar Inc. (global distributor of commodity and specialty chemicals), a Director of Teradata Corporation (data warehousing and technology solutions), and Maersk Inc. (industrial conglomerate), and a member of the Advisory Board for Metalmark Capital LLC (private equity investment, 2005-present). Mr. Stavropoulos is an operating advisor to Clayton, Dubilier & Rice, LLC (private equity investment). In addition, Mr. Stavropoulos is a member of the University of Notre Dame Advisory Council for the College of Science, a Trustee of the Rollin L. Gerstacker Foundation, and a Director of the Naples Philharmonic Center for the Arts. Previously, Mr. Stavropoulos served as a Director of Chemical Financial Corporation (bank holding company, 1993-2012) and Tyco International, Ltd. (multinational manufacturing and services, 2007-2012). |
David M. Thomas (1949) |
Year of Election or Appointment: 2008 Trustee |
| Mr. Thomas also serves as Trustee of other Fidelity funds. Mr. Thomas serves as Non-Executive Chairman of the Board of Directors of Fortune Brands Home and Security (home and security products, 2011-present), as a member of the Board of Directors (2004-present) and Presiding Director (2013-present) of Interpublic Group of Companies, Inc. (marketing communication), and as a member of the Board of Trustees of the University of Florida (2013-present). Previously, Mr. Thomas served as Executive Chairman (2005-2006) and Chairman and Chief Executive Officer (2000-2005) of IMS Health, Inc. (pharmaceutical and healthcare information solutions), and a Director of Fortune Brands, Inc. (consumer products, 2000-2011). |
+ The information above includes each Trustee's principal occupation during the last five years and other information relating to the experience, attributes, and skills relevant to each Trustee's qualifications to serve as a Trustee, which led to the conclusion that each Trustee should serve as a Trustee for the fund.
Advisory Board Member and Officers:
Correspondence intended for each officer and Peter S. Lynch may be sent to Fidelity Investments, 245 Summer Street, Boston, Massachusetts 02210. Officers appear below in alphabetical order.
Name, Year of Birth; Principal Occupation |
Peter S. Lynch (1944) |
Year of Election or Appointment: 2003 Member of the Advisory Board |
| Mr. Lynch also serves as Member of the Advisory Board of other Fidelity funds. Mr. Lynch is Vice Chairman and a Director of FMR (investment adviser firm) and FMR Co., Inc. (investment adviser firm). In addition, Mr. Lynch serves as a Trustee of Boston College and as the Chairman of the Inner-City Scholarship Fund. Previously, Mr. Lynch served on the Special Olympics International Board of Directors (1997-2006). |
Christopher S. Bartel (1971) |
Year of Election or Appointment: 2011 Vice President |
| Mr. Bartel also serves as Vice President of other funds. Mr. Bartel serves as a Director, President, and Chief Executive Officer of Fidelity Management & Research (Japan) Limited (investment adviser firm, 2012-present), a Director of Fidelity Management & Research (Hong Kong) (investment adviser firm, 2012-present), and Senior Vice President of Global Equity Research (2010-present). Previously, Mr. Bartel served as Senior Vice President of Equity Research (2009-2010), Managing Director of Research (2006-2009), and an analyst and portfolio manager (2000-2006). |
Elizabeth Paige Baumann (1968) |
Year of Election or Appointment: 2012 Anti-Money Laundering (AML) Officer |
| Ms. Baumann also serves as AML Officer of other funds. She is Chief AML Officer of FMR LLC (diversified financial services company, 2012-present) and is an employee of Fidelity Investments. Previously, Ms. Baumann served as Vice President and Deputy Anti-Money Laundering Officer (2007-2012). |
Marc Bryant (1966) |
Year of Election or Appointment: 2015 Secretary and Chief Legal Officer (CLO) |
<R> | Mr. Bryant also serves as Secretary and Chief Legal Officer (CLO) of other funds. He is Senior Vice President and Deputy General Counsel of FMR LLC (diversified financial services company), Previously, Mr. Bryant served as Secretary and Chief Legal Officer of Fidelity Rutland Square Trust II (2010-2014) and Assistant Secretary of Fidelity's Fixed Income and Asset Allocation Funds (2013-2015). Prior to joining Fidelity Investments, Mr. Bryant served as a Senior Vice President and the Head of Global Retail Legal for Alliance Bernstein L.P. (2006-2010), and as the General Counsel for ProFund Advisors LLC (2001-2006).</R> |
William C. Coffey (1969) |
Year of Election or Appointment: 2009 Assistant Secretary |
| Mr. Coffey also serves as Assistant Secretary of other funds. He is Senior Vice President and Deputy General Counsel of FMR LLC (diversified financial services company, 2010-present), and is an employee of Fidelity Investments. Previously, Mr. Coffey served as Vice President and Associate General Counsel of FMR LLC (2005-2009). |
Jonathan Davis (1968) |
Year of Election or Appointment: 2010 Assistant Treasurer |
| Mr. Davis also serves as Assistant Treasurer of other funds. Mr. Davis is an employee of Fidelity Investments. Previously, Mr. Davis served as Vice President and Associate General Counsel of FMR LLC (diversified financial services company, 2003-2010). |
Adrien E. Deberghes (1967) |
Year of Election or Appointment: 2008 Deputy Treasurer |
| Mr. Deberghes also serves as an officer of other funds. He is an employee of Fidelity Investments (2008-present). Prior to joining Fidelity Investments, Mr. Deberghes was Senior Vice President of Mutual Fund Administration at State Street Corporation (2007-2008), Senior Director of Mutual Fund Administration at Investors Bank & Trust (2005-2007), and Director of Finance for Dunkin' Brands (2000-2005). |
Stephanie J. Dorsey (1969) |
Year of Election or Appointment: 2010 Assistant Treasurer |
| Ms. Dorsey also serves as an officer of other funds. She is an employee of Fidelity Investments (2008-present) and has served in other fund officer roles. Prior to joining Fidelity Investments, Ms. Dorsey served as Treasurer (2004-2008) of the JPMorgan Mutual Funds and Vice President (2004-2008) of JPMorgan Chase Bank. |
Howard J. Galligan III (1966) |
Year of Election or Appointment: 2014 Chief Financial Officer |
| Mr. Galligan also serves as Chief Financial Officer of other funds. Mr. Galligan serves as President of Fidelity Pricing and Cash Management Services (FPCMS) (2014-present) and as a Director of Strategic Advisers, Inc. (investment adviser firm, 2008-present). Previously, Mr. Galligan served as Chief Administrative Officer of Asset Management (2011-2014) and Chief Operating Officer and Senior Vice President of Investment Support for Strategic Advisers, Inc. (2003-2011). |
Scott C. Goebel (1968) |
Year of Election or Appointment: 2015 Vice President |
| Mr. Goebel serves as an officer of other funds. Mr. Goebel also serves as Secretary of Fidelity SelectCo, LLC (investment adviser firm, 2013-present), Fidelity Investments Money Management, Inc. (FIMM) (investment adviser firm, 2010-present) and Fidelity Research and Analysis Company (FRAC) (investment adviser firm, 2010-present); General Counsel, Secretary, and Senior Vice President of FMR (investment adviser firm, 2008-present) and FMR Co., Inc. (investment adviser firm, 2008-present); Chief Legal Officer of Fidelity Management & Research (Hong Kong) Limited (investment adviser firm, 2008-present); and Assistant Secretary of Fidelity Management & Research (Japan) Limited (investment adviser firm, 2008-present) and FMR Investment Management (U.K.) Limited (investment adviser firm, 2008-present). Previously, Mr. Goebel served as Secretary and CLO of certain Fidelity funds (2008-2015), Assistant Secretary of FIMM (2008-2010), FRAC (2008-2010), and certain funds (2007-2008); and as Vice President and Secretary of Fidelity Distributors Corporation (FDC) (2005-2007). Mr. Goebel has been employed by FMR LLC (diversified financial services company) or an affiliate since 2001. |
Brian B. Hogan (1964) |
Year of Election or Appointment: 2011 Vice President |
| Mr. Hogan also serves as Trustee or Vice President of other funds. Mr. Hogan serves as a Director of Fidelity SelectCo, LLC (investment adviser firm, 2014-present) and President of the Equity Division of FMR (investment adviser firm, 2009-present). Previously, Mr. Hogan served as Senior Vice President, Equity Research of FMR (2006-2009) and as a portfolio manager. |
Chris Maher (1972) |
Year of Election or Appointment: 2013 Assistant Treasurer |
| Mr. Maher serves as Assistant Treasurer of other funds. Mr. Maher is Vice President of Valuation Oversight and is an employee of Fidelity Investments. Previously, Mr. Maher served as Vice President of Asset Management Compliance (2013), Vice President of the Program Management Group of FMR (investment adviser firm, 2010-2013), and Vice President of Valuation Oversight (2008-2010). |
Kenneth B. Robins (1969) |
Year of Election or Appointment: 2008 President and Treasurer |
| Mr. Robins also serves as an officer of other funds. Mr. Robins serves as Executive Vice President of Fidelity Investments Money Management, Inc. (FIMM) (investment adviser firm, 2013-present) and is an employee of Fidelity Investments (2004-present). Previously, Mr. Robins served in other fund officer roles. |
Stephen Sadoski (1971) |
Year of Election or Appointment: 2012 Deputy Treasurer |
| Mr. Sadoski also serves as Deputy Treasurer of other funds. He is an employee of Fidelity Investments (2012-present) and has served in another fund officer role. Prior to joining Fidelity Investments, Mr. Sadoski served as an assistant chief accountant in the Division of Investment Management of the Securities and Exchange Commission (SEC) (2009-2012) and as a senior manager at Deloitte & Touche LLP (1997-2009). |
Stacie M. Smith (1974) |
Year of Election or Appointment: 2013 Deputy Treasurer |
| Ms. Smith also serves as an officer of other funds. She is an employee of Fidelity Investments (2009-present) and has served in other fund officer roles. Prior to joining Fidelity Investments, Ms. Smith served as Senior Audit Manager of Ernst & Young LLP (1996-2009). |
Renee Stagnone (1975) |
Year of Election or Appointment: 2013 Deputy Treasurer |
| Ms. Stagnone also serves as Deputy Treasurer of other funds. Ms. Stagnone is an employee of Fidelity Investments. |
Linda J. Wondrack (1964) |
Year of Election or Appointment: 2014 Chief Compliance Officer |
| Ms. Wondrack also serves as Chief Compliance Officer of other funds. Ms. Wondrack is Executive Vice President and head of the Ethics Office and Asset Management Compliance for Fidelity Investments (2012-present). Ms. Wondrack also serves as Chief Compliance Officer of Fidelity SelectCo, LLC (investment adviser firm, 2014-present); Chief Compliance Officer of Impresa Management LLC (2013-present); and Chief Compliance Officer of FMR Co., Inc. (investment adviser firm), Fidelity Investments Money Management, Inc. (investment adviser firm), Fidelity Management & Research (Japan) Limited (investment adviser firm), FMR Investment Management (U.K.) Limited (investment adviser firm), Fidelity Management & Research (Hong Kong) (investment adviser firm), Fidelity Management & Research Company (investment adviser firm), Pyramis Global Advisors, LLC (investment adviser firm), and Strategic Advisers, Inc. (investment adviser firm), Ballyrock Investment Advisors LLC, and Northern Neck Investors LLC (2012-present). Previously, Ms. Wondrack served as Senior Vice President and Chief Compliance Officer for Columbia Management Investment Advisers, LLC (2005-2012); Chief Compliance Officer for certain funds within the Columbia Family of Funds (2007-2012); and Senior Vice President of Compliance Risk Management at Bank of America (2005-2010). |
Joseph F. Zambello (1957) |
Year of Election or Appointment: 2011 Deputy Treasurer |
| Mr. Zambello also serves as Deputy Treasurer of other funds. Mr. Zambello is an employee of Fidelity Investments. Previously, Mr. Zambello served as Vice President of the Program Management Group of FMR (investment adviser firm, 2009-2011) and Vice President of the Transfer Agent Oversight Group (2005-2009). |
Annual Report
The Board of Trustees of Fidelity Series Real Estate Equity Fund voted to pay shareholders of record at the opening of business on record date, the following distributions per share derived from capital gains realized from sales of portfolio securities, and dividends derived from net investment income:
| Pay Date | Record Date | Dividends | Capital Gains |
Series Real Estate Equity | 9/14/15 | 9/11/15 | $0.064 | $0.983 |
Class F | 9/14/15 | 9/11/15 | $0.069 | $0.983 |
The fund hereby designates as a capital gain dividend with respect to the taxable year ended July 31, 2015, $91,377,682, or, if subsequently determined to be different, the net capital gain of such year.
A total of 0.01% of the dividends distributed during the fiscal year was derived from interest on U.S. Government securities which is generally exempt from state income tax.
The fund will notify shareholders in January 2016 of amounts for use in preparing 2015 income tax returns.
Annual Report
Fidelity Series Real Estate Equity Fund
Each year, the Board of Trustees, including the Independent Trustees (together, the Board), votes on the renewal of the management contract with Fidelity Management & Research Company (FMR) and the sub-advisory agreements (together, the Advisory Contracts) for the fund. The Board, assisted by the advice of fund counsel and Independent Trustees' counsel, requests and considers a broad range of information relevant to the renewal of the Advisory Contracts throughout the year.
The Board meets regularly and, at each of its meetings, covers an extensive agenda of topics and materials and considers factors that are relevant to its annual consideration of the renewal of the fund's Advisory Contracts, including the services and support provided to the fund and its shareholders. The Board has established various standing committees (Committees), each composed of and chaired by Independent Trustees with varying backgrounds, to which the Board has assigned specific subject matter responsibilities in order to enhance effective decision-making by the Board. The Board, acting directly and through its Committees, requests and receives information concerning the annual consideration of the renewal of the fund's Advisory Contracts. The Board also meets as needed to consider matters specifically related to the Board's annual consideration of the renewal of the Advisory Contracts. Members of the Board may also meet with trustees of other Fidelity funds through ad hoc joint committees to discuss certain matters relevant to all of the Fidelity funds.
At its July 2015 meeting, the Board unanimously determined to renew the fund's Advisory Contracts. In reaching its determination, the Board considered all factors it believed relevant, including (i) the nature, extent, and quality of the services to be provided to the fund and its shareholders (including the investment performance of the fund); (ii) the competitiveness of the fund's management fee and total expense ratio relative to peer funds; (iii) the total costs of the services to be provided by and the profits to be realized by Fidelity from its relationship with the fund; and (iv) the extent to which (if any) economies of scale exist and would be realized as the fund grows, and whether any economies of scale are appropriately shared with fund shareholders.
In considering whether to renew the Advisory Contracts for the fund, the Board reached a determination, with the assistance of fund counsel and Independent Trustees' counsel and through the exercise of its business judgment, that the renewal of the Advisory Contracts was in the best interests of the fund and its shareholders and that the compensation payable under the Advisory Contracts was fair and reasonable. The Board's decision to renew the Advisory Contracts was not based on any single factor, but rather was based on a comprehensive consideration of all the information provided to the Board at its meetings throughout the year. The Board, in reaching its determination to renew the Advisory Contracts, was aware that shareholders of the fund have a broad range of investment choices available to them, including a wide choice among funds offered by Fidelity's competitors, and that the fund's shareholders, who have the opportunity to review and weigh the disclosure provided by the fund in its prospectus and other public disclosures, have chosen to invest in this fund, which is part of the Fidelity family of funds.
Annual Report
Board Approval of Investment Advisory Contracts and
Management Fees - continued
Nature, Extent, and Quality of Services Provided. The Board considered Fidelity's staffing as it relates to the fund, including the backgrounds of investment personnel of Fidelity, and also considered the fund's investment objective, strategies, and related investment philosophy. The Independent Trustees also had discussions with senior management of Fidelity's investment operations and investment groups. The Board considered the structure of the portfolio manager compensation program and whether this structure provides appropriate incentives to act in the best interests of the fund. Additionally, the Board considered the portfolio managers' investments, if any, in the funds that they manage.
Resources Dedicated to Investment Management and Support Services. The Board and the Fund Oversight and Research Committees reviewed the general qualifications and capabilities of Fidelity's investment staff, including its size, education, experience, and resources, as well as Fidelity's approach to recruiting, training, managing, and compensating investment personnel. The Board noted that Fidelity has continued to increase the resources devoted to non-U.S. offices, including expansion of Fidelity's global investment organization. The Board also noted that Fidelity's analysts have extensive resources, tools and capabilities that allow them to conduct sophisticated quantitative and fundamental analysis, as well as credit analysis of issuers, counterparties and guarantors. Further, the Board considered that Fidelity's investment professionals have sufficient access to global information and data so as to provide competitive investment results over time, and that those professionals also have access to sophisticated tools that permit them to assess portfolio construction and risk and performance attribution characteristics continuously, as well as to transmit new information and research conclusions rapidly around the world. Additionally, in its deliberations, the Board considered Fidelity's trading, risk management, and compliance capabilities and resources, which are integral parts of the investment management process.
Shareholder and Administrative Services. The Board considered (i) the nature, extent, quality, and cost of advisory, administrative, and shareholder services performed by FMR, the sub-advisers (together with FMR, the Investment Advisers), and their affiliates under the Advisory Contracts and under separate agreements covering transfer agency, pricing and bookkeeping, and securities lending services for the fund; (ii) the nature and extent of the supervision of third party service providers, principally custodians and subcustodians; and (iii) the resources devoted to, and the record of compliance with, the fund's compliance policies and procedures. The Board also reviewed the allocation of fund brokerage, including allocations to brokers affiliated with the Investment Advisers, the use of brokerage commissions to pay fund expenses, and the use of "soft" commission dollars to pay for research services.
Annual Report
The Board noted that the growth of fund assets over time across the complex allows Fidelity to reinvest in the development of services designed to enhance the value or convenience of the Fidelity funds as investment vehicles. These services include 24-hour access to account information and market information through telephone representatives and over the Internet, investor education materials and asset allocation tools, and the expanded availability of Fidelity Investor Centers.
In 2014, the Board formed an ad hoc Committee on Transfer Agency Fees to review the variety of transfer agency fee structures throughout the industry and Fidelity's competitive positioning with respect to industry participants.
Investment in a Large Fund Family. The Board considered the benefits to shareholders of investing in a Fidelity fund, including the benefits of investing in a fund that is part of a large family of funds offering a variety of investment disciplines and providing a large variety of mutual fund investor services. The Board noted that Fidelity had taken, or had made recommendations that resulted in the Fidelity funds taking, a number of actions over the previous year that benefited particular funds, including (i) continuing to dedicate additional resources to investment research and to the support of the senior management team that oversees asset management; (ii) continuing efforts to enhance Fidelity's global research capabilities; (iii) launching new funds and making other enhancements to meet client needs; (iv) reducing management fees and total expenses for certain index funds and diversified international funds; (v) continuing to launch dedicated lower cost underlying funds to meet portfolio construction needs related to expanding underlying fund options for Fidelity funds of funds, specifically for the Freedom Fund product lines; (vi) rationalizing product lines and gaining increased efficiencies through fund mergers; (vii) launching active fixed-income exchange-traded funds; (viii) continuing to develop, acquire and implement systems and technology to improve services to the funds and information security and to increase efficiency; (ix) implementing investment enhancements to further strengthen Fidelity's target date product line to increase investors' probability of success in achieving their goals; (x) modifying the eligibility criteria for certain share classes to accommodate roll-over assets from employer-sponsored retirement plans; (xi) launching a new Class W of the Freedom Index Funds to attract and retain Fidelity record-kept retirement plan assets; and (xii) implementing changes to Fidelity's money market product line in response to recent money market regulatory reforms.
Investment Performance. The Board considered whether the fund has operated in accordance with its investment objective, as well as its record of compliance with its investment restrictions and its performance history.
Annual Report
Board Approval of Investment Advisory Contracts and
Management Fees - continued
The Board took into account discussions with representatives of the Investment Advisers about fund investment performance that occur at Board meetings throughout the year. In this regard the Board noted that as part of regularly scheduled fund reviews and other reports to the Board on fund performance, the Board considers annualized return information for the fund, for different time periods, measured against a securities market index ("benchmark index") and a peer group of funds with similar objectives ("peer group"), if any. In its evaluation of fund investment performance, the Board gave particular attention to information indicating changes in performance of certain Fidelity funds for specific time periods and discussed with the Investment Advisers the reasons for any overperformance or underperformance.
In addition to reviewing absolute and relative fund performance, the Independent Trustees periodically consider the appropriateness of fund performance metrics in evaluating the results achieved. In general, the Independent Trustees believe that fund performance should be evaluated based on net performance (after fees and expenses) of both the highest performing and lowest performing fund share classes, where applicable, compared to appropriate benchmark indices, over appropriate time periods that may include full market cycles, and compared to peer groups, as applicable, over the same periods, taking into account relevant factors including the following: general market conditions; issuer-specific information; and fund cash flows and other factors.
The Independent Trustees recognize that shareholders evaluate performance on a net basis over their own holding periods, for which one-, three-, and five-year periods are often used as a proxy. For this reason, the performance information reviewed by the Board also included net cumulative calendar year total return information for the fund and an appropriate benchmark index for the most recent one- and three-year periods, as shown below. A peer group is not shown below because the fund does not generally utilize a peer group for performance comparison purposes.
Annual Report
Fidelity Series Real Estate Equity Fund
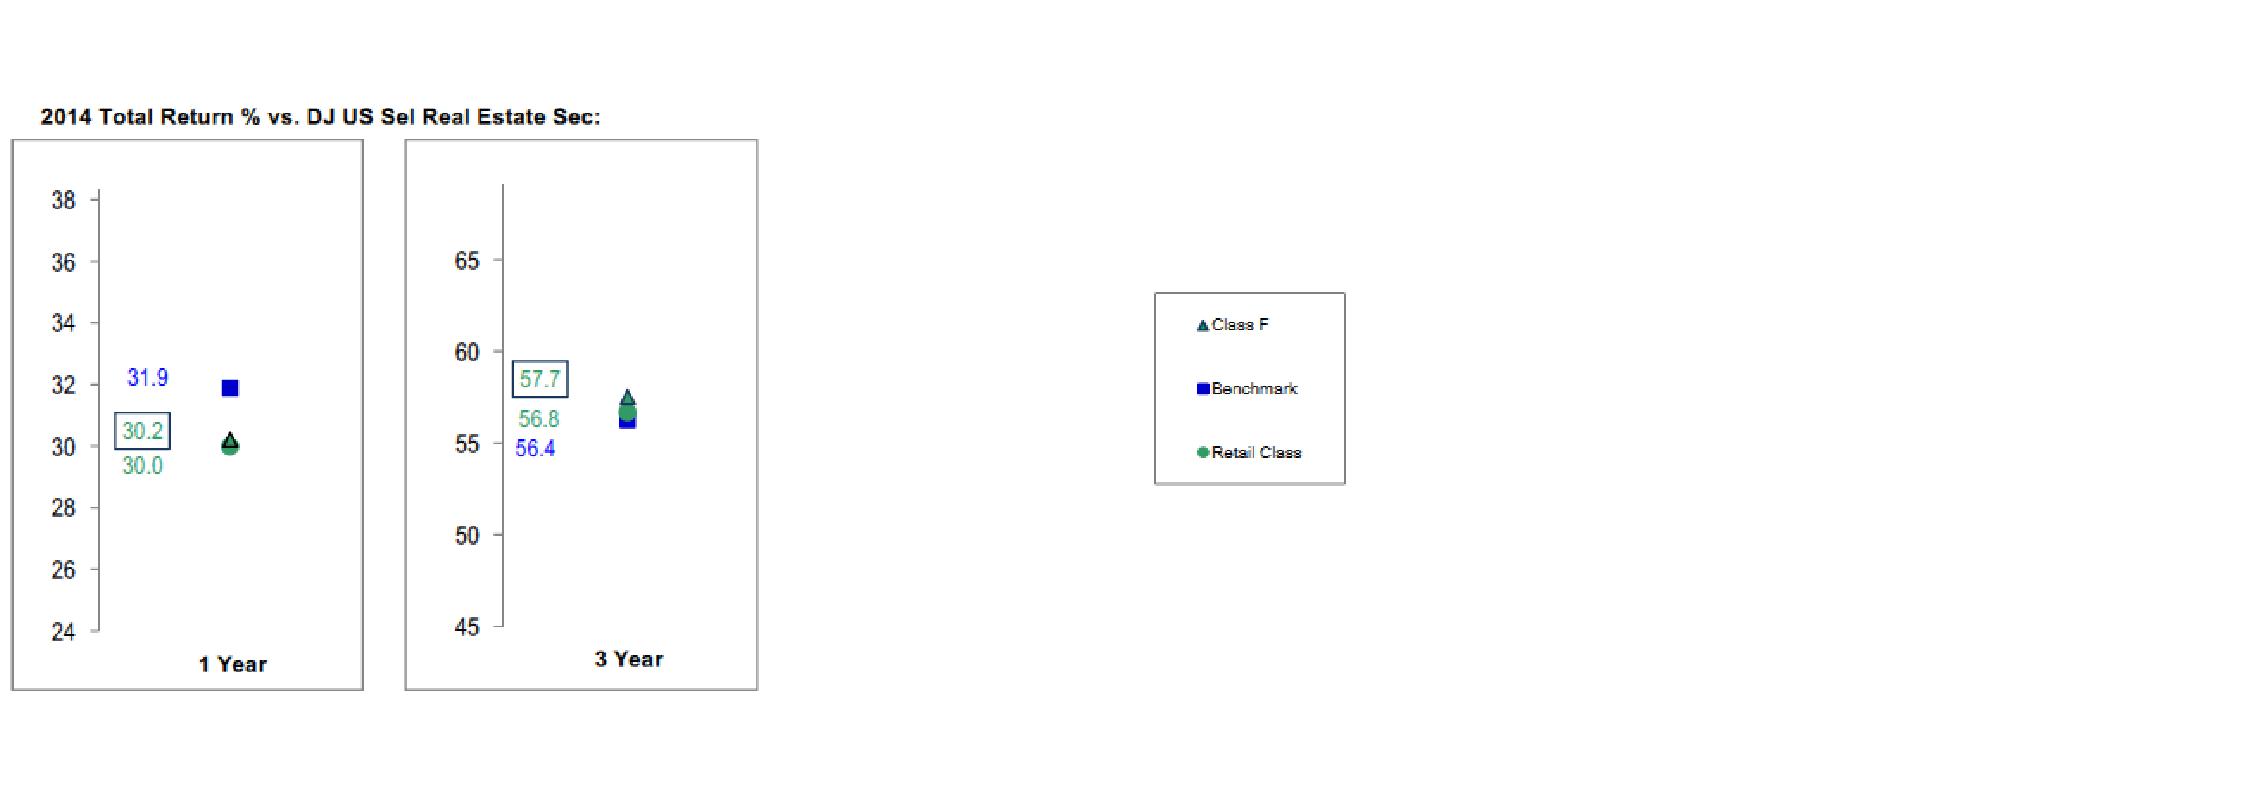
Based on its review, the Board concluded that the nature, extent, and quality of services provided to the fund under the Advisory Contracts should benefit the shareholders of the fund.
Competitiveness of Management Fee and Total Expense Ratio. The Board considered the fund's management fee and total expense ratio compared to "mapped groups" of competitive funds and classes created for the purpose of facilitating the Trustees' competitive analysis of management fees and total expenses. Fidelity creates "mapped groups" by combining similar Lipper investment objective categories that have comparable investment mandates. Combining Lipper investment objective categories aids the Board's management fee and total expense ratio comparisons by broadening the competitive group used for comparison.
Management Fee. The Board considered two proprietary management fee comparisons for the 12-month (or shorter) periods shown in basis points (BP) in the chart below. The group of Lipper funds used by the Board for management fee comparisons is referred to below as the "Total Mapped Group." The Total Mapped Group comparison focuses on a fund's standing in terms of gross management fees before expense reimbursements or caps relative to the total universe of funds with comparable investment mandates, regardless of whether their management fee structures also are comparable. Funds with comparable investment mandates offer exposure to similar types of securities. Funds with comparable management fee structures have similar management fee contractual arrangements (e.g., flat rate charged for advisory services, all-inclusive fee rate, etc.). "TMG %" represents the percentage of funds in the Total Mapped Group that had management fees that were lower than the fund's. For example, a hypothetical TMG % of 20% would mean that 80% of the funds in the Total Mapped Group had higher, and 20% had lower, management fees than the fund. The fund's actual TMG %s and the number of funds in the Total Mapped Group are in the chart below. The "Asset-Size Peer Group" (ASPG) comparison focuses on a fund's standing relative to a subset of non-Fidelity funds within the Total Mapped Group that are similar in size and management fee structure without taking into account performance adjustments, if any. For example, if a fund is in the first quartile of the ASPG, the fund's management fee ranks in the least expensive or lowest 25% of funds in the ASPG. The ASPG represents at least 15% of the funds in the Total Mapped Group with comparable asset size and management fee structures, subject to a minimum of 50 funds (or all funds in the Total Mapped Group if fewer than 50). Additional information, such as the ASPG quartile in which the fund's management fee rate ranked, is also included in the chart and considered by the Board.
Annual Report
Board Approval of Investment Advisory Contracts and
Management Fees - continued
Fidelity Series Real Estate Equity Fund
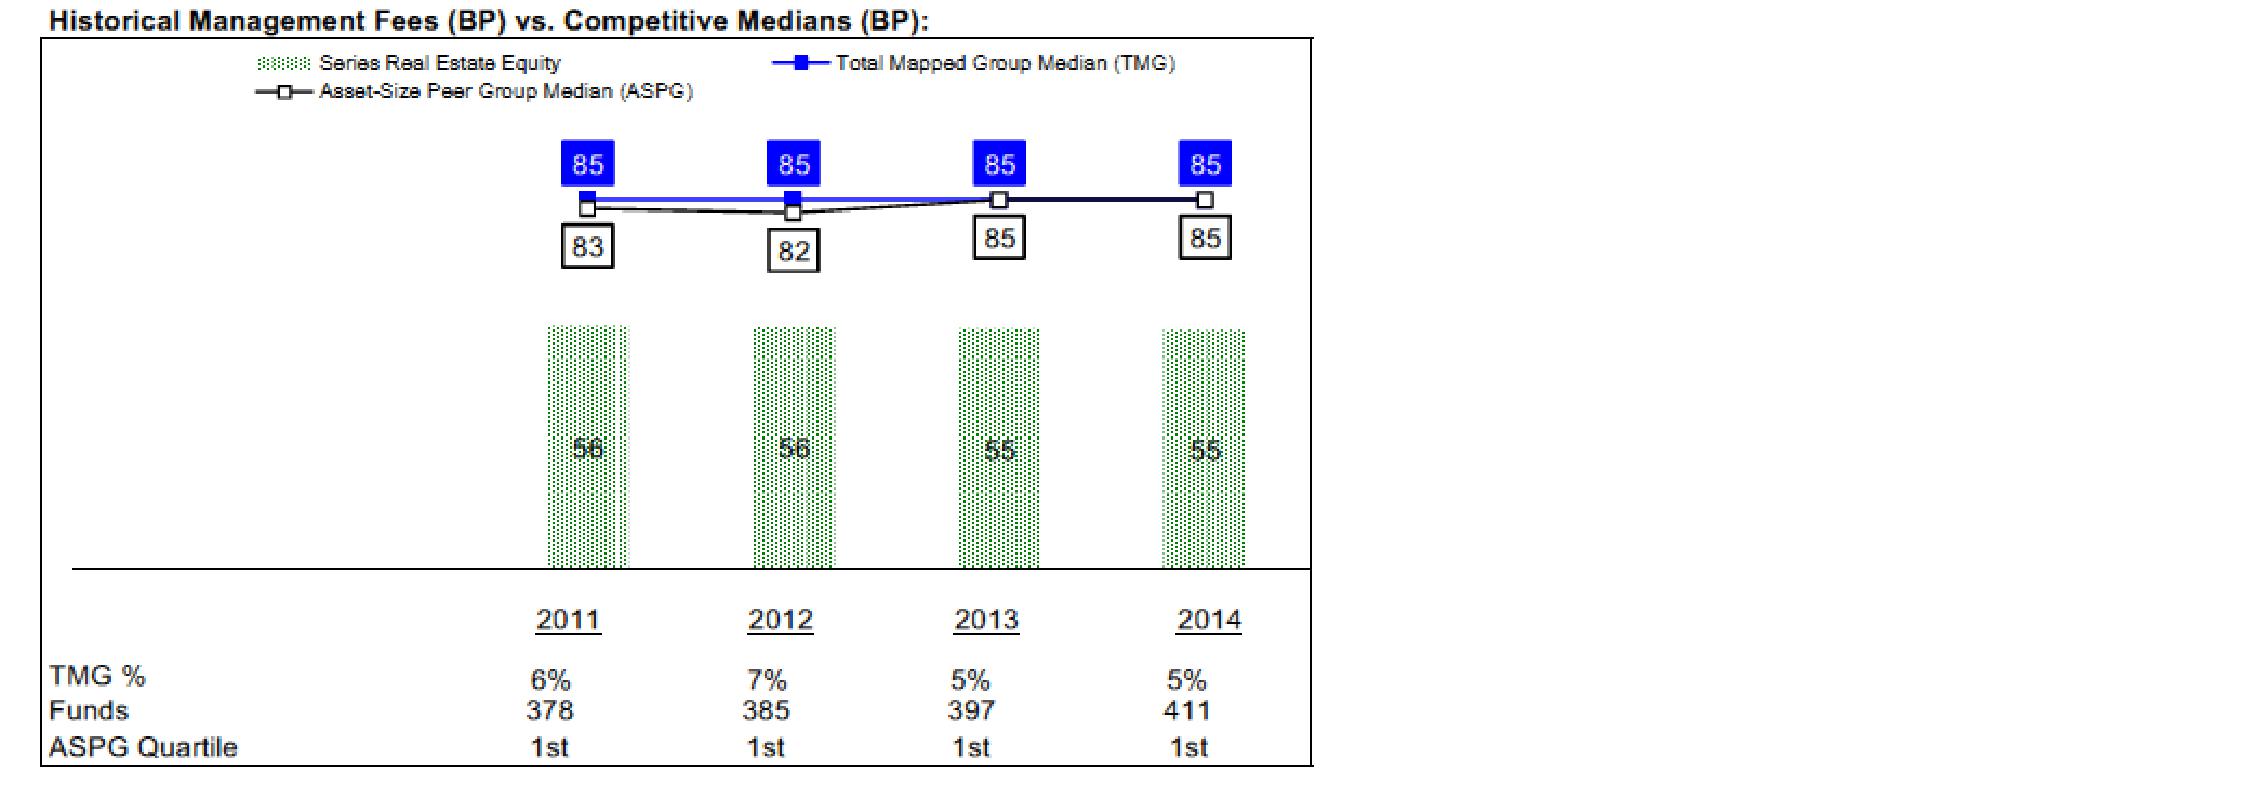
The Board noted that the fund's management fee rate ranked below the median of its Total Mapped Group and below the median of its ASPG for 2014.
The Board noted that, in 2014, the ad hoc Committee on Group Fee was formed by it and other Fidelity fund boards to conduct an in-depth review of the "group fee" component of the management fee of funds with such management fee structures. Committee focus included the mechanics of the group fee, the competitive landscape of group fee structures, Fidelity funds with no group fee component and investment products not included in group fee assets. The Board also considered that, for funds subject to the group fee, FMR agreed to voluntarily waive fees over a specified period of time in amounts designed to account for assets converted from certain funds to certain collective investment trusts.
Annual Report
The Board also noted that, in 2013, the ad hoc Committee on Management Fees was formed to conduct an in-depth review of the management fee rates of Fidelity's active equity mutual funds. The Committee focused on the following areas: (i) standard fee structures; (ii) research consumption and trading evolution; (iii) management fee competitiveness/profitability by category; and (iv) factors that drive institutional pricing.
Based on its review, the Board concluded that the fund's management fee is fair and reasonable in light of the services that the fund receives and the other factors considered.
Total Expense Ratio. In its review of each class's total expense ratio, the Board considered the fund's management fee as well as other fund or class expenses, as applicable, such as transfer agent fees, pricing and bookkeeping fees, and custodial, legal, and audit fees. The Board also noted that Fidelity may agree to waive fees and expenses from time to time, and the extent to which, if any, it has done so for the fund. As part of its review, the Board also considered the current and historical total expense ratios of each class of the fund compared to competitive fund median expenses. Each class of the fund is compared to those funds and classes in the Total Mapped Group (used by the Board for management fee comparisons) that have a similar sales load structure.
The Board noted that the total expense ratio of each class ranked below its competitive median for 2014.
Fees Charged to Other Fidelity Clients. The Board also considered Fidelity fee structures and other information with respect to clients of Fidelity, such as other funds advised or subadvised by Fidelity, pension plan clients, and other institutional clients with similar mandates. The Board noted the findings of the 2013 ad hoc joint committee (created with the board of other Fidelity funds), which reviewed and compared Fidelity's institutional investment advisory business with its business of providing services to the Fidelity funds, including the differences in services provided, fees charged, and costs incurred, as well as competition in their respective marketplaces.
Based on its review of total expense ratios and fees charged to other Fidelity clients, the Board concluded that the total expense ratio of each class of the fund was reasonable in light of the services that the fund and its shareholders receive and the other factors considered.
Costs of the Services and Profitability. The Board considered the revenues earned and the expenses incurred by Fidelity in conducting the business of developing, marketing, distributing, managing, administering and servicing the fund and servicing the fund's shareholders. The Board also considered the level of Fidelity's profits in respect of all the Fidelity funds.
Annual Report
Board Approval of Investment Advisory Contracts and
Management Fees - continued
On an annual basis, Fidelity presents to the Board information about the profitability of its relationship with the fund. Fidelity calculates profitability information for each fund, as well as aggregate profitability information for groups of Fidelity funds and all Fidelity funds, using a series of detailed revenue and cost allocation methodologies which originate with the books and records of Fidelity on which Fidelity's audited financial statements are based. The Audit Committee of the Board reviews any significant changes from the prior year's methodologies.
PricewaterhouseCoopers LLP (PwC), independent registered public accounting firm and auditor to Fidelity and certain Fidelity funds, has been engaged annually by the Board as part of the Board's assessment of Fidelity's profitability analysis. PwC's engagement includes the review and assessment of the methodologies used by Fidelity in determining the revenues and expenses attributable to Fidelity's mutual fund business, and completion of agreed-upon procedures in respect of the mathematical accuracy of fund profitability and its conformity to established allocation methodologies. After considering PwC's reports issued under the engagement and information provided by Fidelity, the Board concluded that while other allocation methods may also be reasonable, Fidelity's profitability methodologies are reasonable in all material respects.
The Board also reviewed Fidelity's non-fund businesses and fall-out benefits related to the mutual fund business as well as cases where Fidelity's affiliates may benefit from or be related to the fund's business.
The Board considered the costs of the services provided by and the profits realized by Fidelity in connection with the operation of the fund and was satisfied that the profitability was not excessive.
Economies of Scale. The Board considered whether there have been economies of scale in respect of the management of the Fidelity funds, whether the Fidelity funds (including the fund) have appropriately benefited from any such economies of scale, and whether there is potential for realization of any further economies of scale. The Board considered the extent to which the fund will benefit from economies of scale as assets grow through increased services to the fund, through waivers or reimbursements, or through fee or expense ratio reductions. The Board also noted that in 2013, it and the boards of other Fidelity funds created an ad hoc committee (the Economies of Scale Committee) to analyze whether Fidelity attains economies of scale in respect of the management and servicing of the Fidelity funds, whether the Fidelity funds have appropriately benefited from such economies of scale, and whether there is potential for realization of any further economies of scale.
Annual Report
The Board recognized that the fund's management contract incorporates a "group fee" structure, which provides for lower group fee rates as total group assets increase, and for higher group fee rates as total group assets decrease (with "group assets" defined to include fund assets under FMR's management plus sector fund assets previously under FMR's management and currently managed by Fidelity SelectCo, LLC). FMR calculates the group fee rates based on a tiered asset "breakpoint" schedule that varies based on asset class. The Board considered that the group fee is designed to deliver the benefits of economies of scale to fund shareholders when total Fidelity fund assets increase, even if assets of any particular fund are unchanged or have declined, because some portion of Fidelity's costs are attributable to services provided to all Fidelity funds, and all funds benefit if those costs can be allocated among more assets. The Board also considered that although the fund is offered only to other Fidelity funds, it continues to incur investment management expenses. The Board further noted that the fund may continue to realize benefits from the group fee structure, even though assets may not be expected to grow significantly at the fund level. The Board concluded that, given the group fee structure, fund shareholders will benefit from lower management fees as group assets increase at the fund complex level, regardless of whether Fidelity achieves any such economies of scale.
The Board concluded, taking into account the analysis of the Economies of Scale Committee, that economies of scale, if any, are being appropriately shared between fund shareholders and Fidelity.
Additional Information Requested by the Board. In order to develop fully the factual basis for consideration of the Fidelity funds' Advisory Contracts, the Board requested and received additional information on certain topics, including: (i) fund performance trends and Fidelity's long-term strategies for certain funds; (ii) the various share classes employed by Fidelity and the attributes of each class, together with similar information on the distribution and servicing payments made by Fidelity or the funds to third-party participants in the distribution channels; (iii) fund profitability, and fund performance in relation to fund profitability; (iv) the methodology with respect to evaluating competitive fund data and peer group classifications and fee comparisons; (v) annual fund profitability margins, with particular focus on certain funds with negative margins; (vi) the realization of fall-out benefits in certain Fidelity business units; (vii) economies of scale and the way in which they are shared with fund shareholders; (viii) Fidelity's group fee structures, including the group fee schedule of breakpoints; (ix) the impact of cost containment measures on the funds; and (x) the transfer agent fee structure.
Based on its evaluation of all of the conclusions noted above, and after considering all factors it believed relevant, the Board concluded that the advisory fee structures are fair and reasonable, and that the fund's Advisory Contracts should be renewed.
Annual Report
Investment Adviser
Fidelity Management & Research Company
Boston, MA
Investment Sub-Advisers
FMR Co., Inc.
FMR Investment Management
(U.K.) Limited
Fidelity Management & Research
(Hong Kong) Limited
Fidelity Management & Research
(Japan) Limited
General Distributor
Fidelity Distributors Corporation
Smithfield, RI
Transfer and Service Agents
Fidelity Investments Institutional Operations Company, Inc.
Boston, MA
Fidelity Service Company, Inc.
Boston, MA
Custodian
State Street Bank and Trust Company
Quincy, MA
(Fidelity Investment logo)(registered trademark)
Corporate Headquarters
245 Summer St., Boston, MA 02210
www.fidelity.com
SLE-ANN-0915
1.930453.103
Fidelity®
Blue Chip Value
Fund
Annual Report
July 31, 2015
(Fidelity Cover Art)
Contents
Performance | (Click Here) | How the fund has done over time. |
Management's Discussion of Fund Performance | (Click Here) | The Portfolio Manager's review of fund performance and strategy. |
Shareholder Expense Example | (Click Here) | An example of shareholder expenses. |
Investment Changes | (Click Here) | A summary of major shifts in the fund's investments over the past 6 months. |
Investments | (Click Here) | A complete list of the fund's investments with their market values. |
Financial Statements | (Click Here) | Statements of assets and liabilities, operations, and changes in net assets, as well as financial highlights. |
Notes | (Click Here) | Notes to the financial statements. |
Report of Independent Registered Public Accounting Firm | (Click Here) | |
Trustees and Officers | (Click Here) | |
Distributions | (Click Here) | |
Board Approval of Investment Advisory Contracts and Management Fees | (Click Here) | |
To view a fund's proxy voting guidelines and proxy voting record for the 12-month period ended June 30, visit http://www.fidelity.com/proxyvotingresults or visit the Securities and Exchange Commission's (SEC) web site at http://www.sec.gov. You may also call 1-800-544-8544 to request a free copy of the proxy voting guidelines.
Standard & Poor's, S&P and S&P 500 are registered service marks of The McGraw-Hill Companies, Inc. and have been licensed for use by Fidelity Distributors Corporation.
Other third-party marks appearing herein are the property of their respective owners.
All other marks appearing herein are registered or unregistered trademarks or service marks of FMR LLC or an affiliated company. © 2015 FMR LLC. All rights reserved.
Annual Report
This report and the financial statements contained herein are submitted for the general information of the shareholders of the fund. This report is not authorized for distribution to prospective investors in the fund unless preceded or accompanied by an effective prospectus.
A fund files its complete schedule of portfolio holdings with the SEC for the first and third quarters of each fiscal year on Form N-Q. Forms N-Q are available on the SEC's web site at http://www.sec.gov. A fund's Forms N-Q may be reviewed and copied at the SEC's Public Reference Room in Washington, DC. Information regarding the operation of the SEC's Public Reference Room may be obtained by calling 1-800-SEC-0330. For a complete list of a fund's portfolio holdings, view the most recent holdings listing, semiannual report, or annual report on Fidelity's web site at http://www.fidelity.com, http://www.advisor.fidelity.com, or http://www.401k.com, as applicable.
NOT FDIC INSURED • MAY LOSE VALUE • NO BANK GUARANTEE
Neither the fund nor Fidelity Distributors Corporation is a bank.
Annual Report
Average annual total return reflects the change in the value of an investment, assuming reinvestment of the fund's distributions from dividend income and capital gains (the profits earned upon the sale of securities that have grown in value, if any) and assuming a constant rate of performance each year. The $10,000 table and the fund's returns do not reflect the deduction of taxes that a shareholder would pay on fund distributions or the redemption of fund shares. During periods of reimbursement by Fidelity, a fund's total return will be greater than it would be had the reimbursement not occurred. How a fund did yesterday is no guarantee of how it will do tomorrow.
Average Annual Total Returns
Periods ended July 31, 2015 | Past 1
year | Past 5
years | Past 10
years |
Fidelity® Blue Chip Value Fund | 12.52% | 13.19% | 4.98% |
$10,000 Over 10 Years
Let's say hypothetically that $10,000 was invested in Fidelity® Blue Chip Value Fund on July 31, 2005. The chart shows how the value of your investment would have changed, and also shows how the Russell 1000® Value Index performed over the same period.
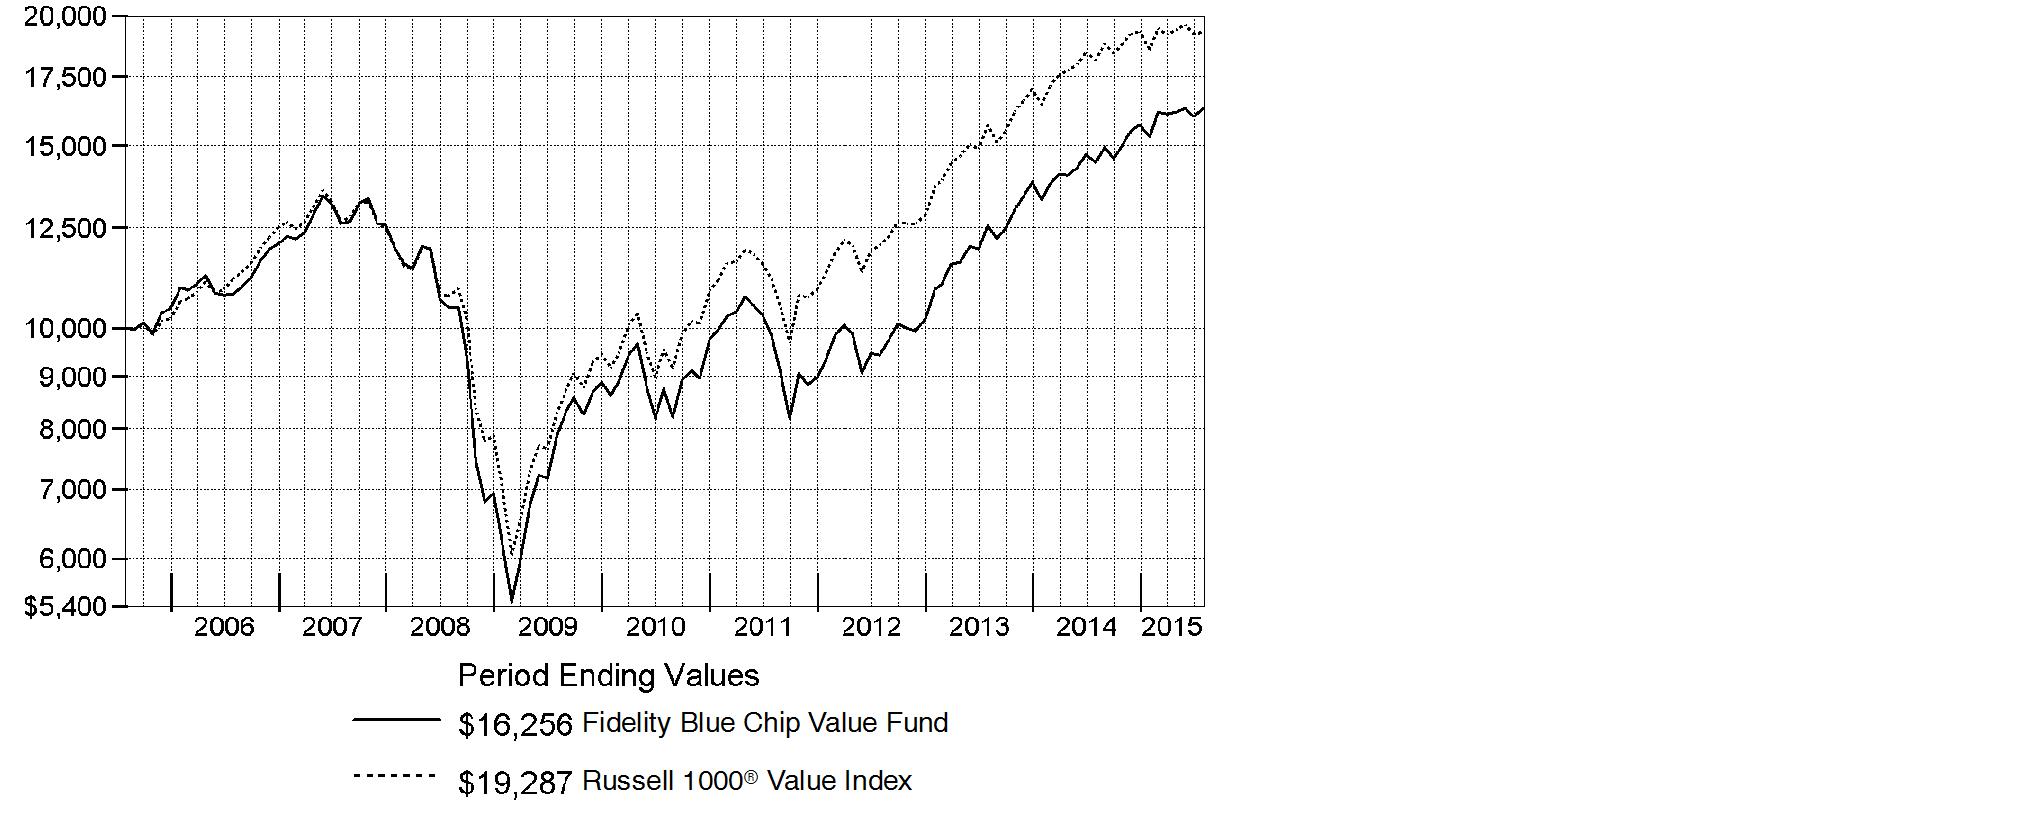
Annual Report
Market Recap: The U.S. equity market gained strongly for the 12 months ending July 31, 2015, as stocks recovered from volatility in late 2014 and early 2015, supported by a still-positive economic backdrop. The S&P 500® Index returned 11.21%, with growth stocks in the index far outpacing value-oriented names on prospects for continued U.S. economic growth. Consequently, the growth-oriented Nasdaq Composite Index® rose 18.71%, outpacing the broader S&P 500®, as well as the 12.03% advance of the smaller-cap Russell 2000® Index. Within the S&P 500®, seven of 10 sectors notched a gain, with significant performance variation. Health care (+27%) led the way, aided by merger activity. Consumer discretionary (+24%) benefited from spending linked to a seven-year low in unemployment. Strong first halves for the consumer staples sector and the real estate segment of financials yielded above-market returns (19% and 12%, respectively) for the full-year period. Conversely, energy (-26%) significantly lagged, due to a roughly 55% decline for U.S. crude-oil prices. Materials (-4%) also lost ground. At period end, investors remained focused on the slowing rate of U.S. earnings growth, the possible effect of a relatively stronger U.S. dollar on exports and inflation, and whether an economic slowdown in China would create ripples for the global economy.
Comments from Portfolio Manager Sean Gavin: For the year, the fund substantially outpaced the 6.40% return of the benchmark Russell 1000® Value Index. (For specific results, please see the Performance section of this report.) The health care sector led the way versus the benchmark, as the fund received a boost from both my stock choices and decision to underweight this strong group. A non-benchmark stake in Teva Pharmaceuticals was a big contributor, as was health insurance provider Cigna, which in June agreed to be purchased for a premium by a larger competitor. This caused Cigna's stock to exceed my target price, and I sold the position soon afterwards. The fund's positioning also was helpful in the energy sector. That said, several of the fund's biggest individual detractors were energy stocks hampered by continued-low oil prices, including out-of-index holdings BW Offshore and Suncor Energy. Conversely, subpar stock picking in the media industry detracted, especially a position in Viacom. This non-benchmark stock continued to meet my valuation and quality criteria as of period end. However, it encountered a number of business challenges - all of them short term, in my view - that caused the stock to return roughly -25%. Currency effects also hurt performance, as a relatively strong U.S. dollar sapped the fund's non-U.S. investments, including Canada's Suncor. Of final note, a position in Internet search company Google was a meaningful contributor.
The views expressed above reflect those of the portfolio manager(s) only through the end of the period as stated on the cover of this report and do not necessarily represent the views of Fidelity or any other person in the Fidelity organization. Any such views are subject to change at any time based upon market or other conditions and Fidelity disclaims any responsibility to update such views. These views may not be relied on as investment advice and, because investment decisions for a Fidelity fund are based on numerous factors, may not be relied on as an indication of trading intent on behalf of any Fidelity fund.
Annual Report
Shareholder Expense Example
As a shareholder of the Fund, you incur two types of costs: (1) transaction costs and (2) ongoing costs, including management fees and other Fund expenses. This Example is intended to help you understand your ongoing costs (in dollars) of investing in the Fund and to compare these costs with the ongoing costs of investing in other mutual funds.
The Example is based on an investment of $1,000 invested at the beginning of the period and held for the entire period (February 1, 2015 to July 31, 2015).
Actual Expenses
The first line of the accompanying table provides information about actual account values and actual expenses. You may use the information in this line, together with the amount you invested, to estimate the expenses that you paid over the period. Simply divide your account value by $1,000.00 (for example, an $8,600 account value divided by $1,000.00 = 8.6), then multiply the result by the number in the first line under the heading entitled "Expenses Paid During Period" to estimate the expenses you paid on your account during this period. A small balance maintenance fee of $12.00 that is charged once a year may apply for certain accounts with a value of less than $2,000. This fee is not included in the table below. If it was, the estimate of expenses you paid during the period would be higher, and your ending account value lower, by this amount. In addition, the Fund, as a shareholder in the underlying Fidelity Central Funds, will indirectly bear its pro-rata share of the fees and expenses incurred by the underlying Fidelity Central Funds. These fees and expenses are not included in the Fund's annualized expense ratio used to calculate the expense estimate in the table below.
Hypothetical Example for Comparison Purposes
The second line of the accompanying table provides information about hypothetical account values and hypothetical expenses based on the Fund's actual expense ratio and an assumed rate of return of 5% per year before expenses, which is not the Fund's actual return. The hypothetical account values and expenses may not be used to estimate the actual ending account balance or expenses you paid for the period. You may use this information to compare the ongoing costs of investing in the Fund and other funds. To do so, compare this 5% hypothetical example with the 5% hypothetical examples that appear in the shareholder reports of the other funds. A small balance maintenance fee of $12.00 that is charged once a year may apply for certain accounts with a value of less than $2,000. This fee is not included in the table below. If it was, the estimate of expenses you paid during the period would be higher, and your ending account value lower, by this amount. In addition, the Fund, as a shareholder in the underlying Fidelity Central Funds, will indirectly bear its pro-rata share of the fees and expenses incurred by the underlying Fidelity Central Funds. These fees and expenses are not included in the Fund's annualized expense ratio used to calculate the expense estimate in the table below.
Please note that the expenses shown in the table are meant to highlight your ongoing costs only and do not reflect any transaction costs. Therefore, the second line of the table is useful in comparing ongoing costs only, and will not help you determine the relative total costs of owning different funds.
Annual Report
Shareholder Expense Example - continued
| Annualized
Expense RatioB | Beginning
Account Value
February 1, 2015 | Ending
Account Value
July 31, 2015 | Expenses Paid
During Period*
February 1, 2015
to July 31, 2015 |
Actual | .90% | $ 1,000.00 | $ 1,065.00 | $ 4.61 |
HypotheticalA | | $ 1,000.00 | $ 1,020.33 | $ 4.51 |
A 5% return per year before expenses
B Annualized expense ratio reflects expenses net of applicable fee waivers.
* Expenses are equal to the Fund's annualized expense ratio, multiplied by the average account value over the period, multiplied by 181/365 (to reflect the one-half year period).
Annual Report
Investment Changes (Unaudited)
Top Ten Stocks as of July 31, 2015 |
| % of fund's
net assets | % of fund's net assets
6 months ago |
Teva Pharmaceutical Industries Ltd. sponsored ADR | 4.5 | 3.9 |
JPMorgan Chase & Co. | 3.6 | 2.8 |
Wells Fargo & Co. | 3.4 | 3.2 |
Oracle Corp. | 3.3 | 3.6 |
Johnson & Johnson | 3.2 | 0.0 |
Berkshire Hathaway, Inc. Class B | 3.1 | 3.4 |
Google, Inc. Class A | 3.0 | 3.2 |
AutoZone, Inc. | 2.7 | 2.8 |
EMC Corp. | 2.6 | 2.9 |
Chevron Corp. | 2.4 | 2.9 |
| 31.8 | |
Top Five Market Sectors as of July 31, 2015 |
| % of fund's
net assets | % of fund's net assets
6 months ago |
Financials | 27.0 | 26.4 |
Information Technology | 18.9 | 19.8 |
Health Care | 14.8 | 14.9 |
Consumer Discretionary | 10.1 | 12.7 |
Energy | 7.6 | 8.0 |
Asset Allocation (% of fund's net assets) |
As of July 31, 2015* | As of January 31, 2015** |
 | Stocks 90.9% | |  | Stocks 93.0% | |
 | Short-Term
Investments and
Net Other Assets
(Liabilities) 9.1% | |  | Short-Term
Investments and
Net Other Assets
(Liabilities) 7.0% | |
* Foreign investments | 18.6% | | ** Foreign investments | 22.3% | |

Annual Report
Investments July 31, 2015
Showing Percentage of Net Assets
Common Stocks - 90.9% |
| Shares | | Value |
CONSUMER DISCRETIONARY - 10.1% |
Automobiles - 1.2% |
Harley-Davidson, Inc. | 87,500 | | $ 5,101,250 |
Leisure Products - 0.8% |
Mattel, Inc. | 141,900 | | 3,293,499 |
Media - 3.3% |
Starz Series A (a) | 115,300 | | 4,663,885 |
Viacom, Inc. Class B (non-vtg.) | 152,000 | | 8,664,000 |
| | 13,327,885 |
Specialty Retail - 4.8% |
AutoZone, Inc. (a) | 15,700 | | 11,004,758 |
Bed Bath & Beyond, Inc. (a) | 63,200 | | 4,122,536 |
GNC Holdings, Inc. | 92,800 | | 4,566,688 |
| | 19,693,982 |
TOTAL CONSUMER DISCRETIONARY | | 41,416,616 |
CONSUMER STAPLES - 3.9% |
Beverages - 1.7% |
C&C Group PLC | 1,825,414 | | 7,112,892 |
Food & Staples Retailing - 2.2% |
Safeway, Inc.: | | | |
rights (a) | 48,800 | | 0 |
rights (a) | 48,800 | | 8,784 |
Tesco PLC | 770,200 | | 2,590,137 |
Wal-Mart Stores, Inc. | 86,500 | | 6,226,270 |
| | 8,825,191 |
TOTAL CONSUMER STAPLES | | 15,938,083 |
ENERGY - 7.6% |
Energy Equipment & Services - 0.8% |
BW Offshore Ltd. | 5,203,200 | | 3,121,238 |
Oil, Gas & Consumable Fuels - 6.8% |
Chevron Corp. | 111,735 | | 9,886,313 |
Exxon Mobil Corp. | 22,800 | | 1,805,988 |
Marathon Petroleum Corp. | 176,400 | | 9,643,788 |
Suncor Energy, Inc. | 242,300 | | 6,825,196 |
| | 28,161,285 |
TOTAL ENERGY | | 31,282,523 |
Common Stocks - continued |
| Shares | | Value |
FINANCIALS - 27.0% |
Banks - 8.8% |
JPMorgan Chase & Co. | 216,716 | | $ 14,851,547 |
U.S. Bancorp | 168,197 | | 7,604,186 |
Wells Fargo & Co. | 239,998 | | 13,888,684 |
| | 36,344,417 |
Capital Markets - 2.3% |
Fortress Investment Group LLC | 624,100 | | 4,268,844 |
The Blackstone Group LP | 131,400 | | 5,157,450 |
| | 9,426,294 |
Consumer Finance - 2.9% |
Capital One Financial Corp. | 77,533 | | 6,303,433 |
Discover Financial Services | 98,800 | | 5,514,028 |
| | 11,817,461 |
Diversified Financial Services - 3.1% |
Berkshire Hathaway, Inc. Class B (a) | 90,700 | | 12,946,518 |
Insurance - 6.8% |
ACE Ltd. | 55,400 | | 6,025,858 |
Allstate Corp. | 94,900 | | 6,543,355 |
Prudential PLC | 367,866 | | 8,654,203 |
The Travelers Companies, Inc. | 62,000 | | 6,579,440 |
| | 27,802,856 |
Real Estate Investment Trusts - 3.1% |
American Capital Agency Corp. | 255,500 | | 4,920,930 |
Annaly Capital Management, Inc. | 784,200 | | 7,802,790 |
| | 12,723,720 |
TOTAL FINANCIALS | | 111,061,266 |
HEALTH CARE - 14.8% |
Biotechnology - 1.9% |
Amgen, Inc. | 45,500 | | 8,034,845 |
Health Care Providers & Services - 3.1% |
Express Scripts Holding Co. (a) | 70,100 | | 6,313,907 |
Laboratory Corp. of America Holdings (a) | 50,200 | | 6,389,958 |
| | 12,703,865 |
Pharmaceuticals - 9.8% |
Johnson & Johnson | 131,500 | | 13,177,615 |
Common Stocks - continued |
| Shares | | Value |
HEALTH CARE - continued |
Pharmaceuticals - continued |
Sanofi SA sponsored ADR | 156,300 | | $ 8,438,637 |
Teva Pharmaceutical Industries Ltd. sponsored ADR | 268,300 | | 18,518,067 |
| | 40,134,319 |
TOTAL HEALTH CARE | | 60,873,029 |
INDUSTRIALS - 3.5% |
Aerospace & Defense - 1.1% |
United Technologies Corp. | 45,100 | | 4,523,981 |
Machinery - 2.4% |
Deere & Co. | 103,600 | | 9,797,452 |
TOTAL INDUSTRIALS | | 14,321,433 |
INFORMATION TECHNOLOGY - 18.9% |
Communications Equipment - 3.8% |
Cisco Systems, Inc. | 287,685 | | 8,176,008 |
Harris Corp. | 87,500 | | 7,257,250 |
| | 15,433,258 |
Electronic Equipment & Components - 0.6% |
Keysight Technologies, Inc. (a) | 77,800 | | 2,376,012 |
Internet Software & Services - 3.0% |
Google, Inc. Class A (a) | 18,900 | | 12,426,750 |
IT Services - 3.2% |
IBM Corp. | 37,600 | | 6,090,824 |
The Western Union Co. | 352,800 | | 7,140,672 |
| | 13,231,496 |
Software - 3.3% |
Oracle Corp. | 343,500 | | 13,719,390 |
Technology Hardware, Storage & Peripherals - 5.0% |
EMC Corp. | 403,500 | | 10,850,115 |
Samsung Electronics Co. Ltd. | 9,705 | | 9,862,805 |
| | 20,712,920 |
TOTAL INFORMATION TECHNOLOGY | | 77,899,826 |
Common Stocks - continued |
| Shares | | Value |
MATERIALS - 3.1% |
Chemicals - 3.1% |
Agrium, Inc. | 43,900 | | $ 4,491,203 |
CF Industries Holdings, Inc. | 137,400 | | 8,134,080 |
| | 12,625,283 |
UTILITIES - 2.0% |
Electric Utilities - 2.0% |
Exelon Corp. | 260,100 | | 8,346,609 |
TOTAL COMMON STOCKS (Cost $354,213,822) |
373,764,668
|
Money Market Funds - 8.8% |
| | | |
Fidelity Cash Central Fund, 0.17% (b)
(Cost $36,019,324) | 36,019,324 | |
36,019,324
|
TOTAL INVESTMENT PORTFOLIO - 99.7% (Cost $390,233,146) | | 409,783,992 |
NET OTHER ASSETS (LIABILITIES) - 0.3% | | 1,184,467 |
NET ASSETS - 100% | $ 410,968,459 |
Legend |
(a) Non-income producing |
(b) Affiliated fund that is generally available only to investment companies and other accounts managed by Fidelity Investments. The rate quoted is the annualized seven-day yield of the fund at period end. A complete unaudited listing of the fund's holdings as of its most recent quarter end is available upon request. In addition, each Fidelity Central Fund's financial statements, which are not covered by the Fund's Report of Independent Registered Public Accounting Firm, are available on the SEC's website or upon request. |
Affiliated Central Funds |
Information regarding fiscal year to date income earned by the Fund from investments in Fidelity Central Funds is as follows: |
Fund | Income earned |
Fidelity Cash Central Fund | $ 27,301 |
Fidelity Securities Lending Cash Central Fund | 13,385 |
Total | $ 40,686 |
Other Information |
The following is a summary of the inputs used, as of July 31, 2015, involving the Fund's assets and liabilities carried at fair value. The inputs or methodology used for valuing securities may not be an indication of the risk associated with investing in those securities. For more information on valuation inputs, and their aggregation into the levels used in the table below, please refer to the Investment Valuation section in the accompanying Notes to Financial Statements. |
Valuation Inputs at Reporting Date: |
Description | Total | Level 1 | Level 2 | Level 3 |
Investments in Securities: | | | | |
Equities: | | | | |
Consumer Discretionary | $ 41,416,616 | $ 41,416,616 | $ - | $ - |
Consumer Staples | 15,938,083 | 13,339,162 | 2,590,137 | 8,784 |
Energy | 31,282,523 | 31,282,523 | - | - |
Financials | 111,061,266 | 102,407,063 | 8,654,203 | - |
Health Care | 60,873,029 | 60,873,029 | - | - |
Industrials | 14,321,433 | 14,321,433 | - | - |
Information Technology | 77,899,826 | 77,899,826 | - | - |
Materials | 12,625,283 | 12,625,283 | - | - |
Utilities | 8,346,609 | 8,346,609 | - | - |
Money Market Funds | 36,019,324 | 36,019,324 | - | - |
Total Investments in Securities: | $ 409,783,992 | $ 398,530,868 | $ 11,244,340 | $ 8,784 |
Distribution of investments by country or territory of incorporation, as a percentage of total net assets, is as follows (Unaudited): |
United States of America | 81.4% |
Israel | 4.5% |
Canada | 2.8% |
United Kingdom | 2.8% |
Korea (South) | 2.4% |
France | 2.1% |
Ireland | 1.7% |
Switzerland | 1.5% |
Others (Individually Less Than 1%) | 0.8% |
| 100.0% |
See accompanying notes which are an integral part of the financial statements.
Annual Report
Statement of Assets and Liabilities
| | July 31, 2015 |
| | |
Assets | | |
Investment in securities, at value - See accompanying schedule: Unaffiliated issuers (cost $354,213,822) | $ 373,764,668 | |
Fidelity Central Funds (cost $36,019,324) | 36,019,324 | |
Total Investments (cost $390,233,146) | | $ 409,783,992 |
Receivable for investments sold | | 1,445,447 |
Receivable for fund shares sold | | 1,803,267 |
Dividends receivable | | 215,977 |
Distributions receivable from Fidelity Central Funds | | 4,933 |
Other receivables | | 1,275 |
Total assets | | 413,254,891 |
| | |
Liabilities | | |
Payable for investments purchased | $ 1,732,733 | |
Payable for fund shares redeemed | 188,166 | |
Accrued management fee | 234,843 | |
Other affiliated payables | 81,000 | |
Other payables and accrued expenses | 49,690 | |
Total liabilities | | 2,286,432 |
| | |
Net Assets | | $ 410,968,459 |
Net Assets consist of: | | |
Paid in capital | | $ 457,305,206 |
Undistributed net investment income | | 4,925,285 |
Accumulated undistributed net realized gain (loss) on investments and foreign currency transactions | | (70,812,735) |
Net unrealized appreciation (depreciation) on investments and assets and liabilities in foreign currencies | | 19,550,703 |
Net Assets, for 24,339,531 shares outstanding | | $ 410,968,459 |
| | |
Net Asset Value, offering price and redemption price per share ($410,968,459 ÷ 24,339,531 shares) | | $ 16.88 |
See accompanying notes which are an integral part of the financial statements.
Annual Report
Financial Statements - continued
Statement of Operations
Year ended July 31, 2015 |
Investment Income | | |
Dividends | | $ 7,765,315 |
Special dividends | | 2,866,372 |
Interest | | 5 |
Income from Fidelity Central Funds | | 40,686 |
Total income | | 10,672,378 |
| | |
Expenses | | |
Management fee | | |
Basic fee | $ 1,972,751 | |
Performance adjustment | (31,422) | |
Transfer agent fees | 757,834 | |
Accounting and security lending fees | 140,088 | |
Custodian fees and expenses | 13,800 | |
Independent trustees' compensation | 1,496 | |
Registration fees | 30,108 | |
Audit | 60,160 | |
Legal | 1,343 | |
Miscellaneous | 2,274 | |
Total expenses before reductions | 2,948,432 | |
Expense reductions | (11,827) | 2,936,605 |
Net investment income (loss) | | 7,735,773 |
Realized and Unrealized Gain (Loss) Net realized gain (loss) on: | | |
Investment securities: | | |
Unaffiliated issuers | 31,049,097 | |
Foreign currency transactions | (34,641) | |
Futures contracts | 6,346 | |
Total net realized gain (loss) | | 31,020,802 |
Change in net unrealized appreciation (depreciation) on: Investment securities | 2,266,553 | |
Assets and liabilities in foreign currencies | (128) | |
Total change in net unrealized appreciation (depreciation) | | 2,266,425 |
Net gain (loss) | | 33,287,227 |
Net increase (decrease) in net assets resulting from operations | | $ 41,023,000 |
See accompanying notes which are an integral part of the financial statements.
Annual Report
Statement of Changes in Net Assets
| Year ended
July 31,
2015 | Year ended
July 31,
2014 |
Increase (Decrease) in Net Assets | | |
Operations | | |
Net investment income (loss) | $ 7,735,773 | $ 4,422,152 |
Net realized gain (loss) | 31,020,802 | 49,264,536 |
Change in net unrealized appreciation (depreciation) | 2,266,425 | (4,025,531) |
Net increase (decrease) in net assets resulting from operations | 41,023,000 | 49,661,157 |
Distributions to shareholders from net investment income | (4,830,518) | (2,139,474) |
Share transactions | | |
Proceeds from sales of shares | 115,913,276 | 137,673,635 |
Reinvestment of distributions | 4,701,954 | 2,081,150 |
Cost of shares redeemed | (75,665,221) | (139,310,785) |
Net increase (decrease) in net assets resulting from share transactions | 44,950,009 | 444,000 |
Total increase (decrease) in net assets | 81,142,491 | 47,965,683 |
| | |
Net Assets | | |
Beginning of period | 329,825,968 | 281,860,285 |
End of period (including undistributed net investment income of $4,925,285 and undistributed net investment income of $2,682,966, respectively) | $ 410,968,459 | $ 329,825,968 |
Other Information Shares | | |
Sold | 7,061,079 | 9,827,800 |
Issued in reinvestment of distributions | 302,238 | 150,333 |
Redeemed | (4,693,685) | (9,464,241) |
Net increase (decrease) | 2,669,632 | 513,892 |
See accompanying notes which are an integral part of the financial statements.
Annual Report
Financial Highlights
Years ended July 31, | 2015 | 2014 | 2013 | 2012 | 2011 |
Selected Per-Share Data | | | | | |
Net asset value, beginning of period | $ 15.22 | $ 13.32 | $ 10.26 | $ 10.86 | $ 9.82 |
Income from Investment Operations | | | | | |
Net investment income (loss) B | .35 E | .18 | .18 | .18 | .14 |
Net realized and unrealized gain (loss) | 1.54 | 1.81 | 3.17 | (.62) | 1.04 |
Total from investment operations | 1.89 | 1.99 | 3.35 | (.44) | 1.18 |
Distributions from net investment income | (.23) | (.09) | (.29) | (.16) | (.14) |
Distributions from net realized gain | - | - | - | - | (.01) |
Total distributions | (.23) | (.09) | (.29) | (.16) | (.14) H |
Net asset value, end of period | $ 16.88 | $ 15.22 | $ 13.32 | $ 10.26 | $ 10.86 |
Total ReturnA | 12.52% | 14.99% | 33.33% | (3.95)% | 12.14% |
Ratios to Average Net Assets C, F | | | | | |
Expenses before reductions | .82% | .66% | .64% | .77% | .75% |
Expenses net of fee waivers, if any | .82% | .66% | .64% | .77% | .75% |
Expenses net of all reductions | .82% | .66% | .62% | .76% | .74% |
Net investment income (loss) | 2.15% E | 1.28% | 1.58% | 1.76% | 1.31% |
Supplemental Data | | | | | |
Net assets, end of period (000 omitted) | $ 410,968 | $ 329,826 | $ 281,860 | $ 238,132 | $ 433,047 |
Portfolio turnover rate D | 138% | 102% G | 88% | 102% | 141% |
A Total returns would have been lower if certain expenses had not been reduced during the applicable periods shown.
B Calculated based on average shares outstanding during the period.
C Fees and expenses of any underlying Fidelity Central Funds are not included in the Fund's expense ratio. The Fund indirectly bears its proportionate share of the expenses of any underlying Fidelity Central Funds.
D Amount does not include the portfolio activity of any underlying Fidelity Central Funds.
E Investment income per share reflects a large, non-recurring dividend which amounted to $.13 per share. Excluding this non-recurring dividend, the ratio of net investment income (loss) to average net assets would have been 1.35%.
F Expense ratios reflect operating expenses of the Fund. Expenses before reductions do not reflect amounts reimbursed by the investment adviser or reductions from brokerage service arrangements or reductions from other expense offset arrangements and do not represent the amount paid by the Fund during periods when reimbursements or reductions occur. Expenses net of fee waivers reflect expenses after reimbursement by the investment adviser but prior to reductions from brokerage service arrangements or other expense offset arrangements. Expenses net of all reductions represent the net expenses paid by the Fund.
G Portfolio turnover rate excludes securities received or delivered in-kind.
H Total distributions of $.14 per share is comprised of distributions from net investment income of $.135 and distributions from net realized gain of $.005 per share.
See accompanying notes which are an integral part of the financial statements.
Annual Report
For the period ended July 31, 2015
1. Organization.
Fidelity Blue Chip Value Fund (the Fund) is a fund of Fidelity Securities Fund (the Trust) and is authorized to issue an unlimited number of shares. Share transactions on the Statement of Changes in Net Assets may contain exchanges between funds. The Trust is registered under the Investment Company Act of 1940, as amended (the 1940 Act), as an open-end management investment company organized as a Massachusetts business trust.
2. Investments in Fidelity Central Funds.
The Fund invests in Fidelity Central Funds, which are open-end investment companies generally available only to other investment companies and accounts managed by the investment adviser and its affiliates. The Fund's Schedule of Investments lists each of the Fidelity Central Funds held as of period end, if any, as an investment of the Fund, but does not include the underlying holdings of each Fidelity Central Fund. As an Investing Fund, the Fund indirectly bears its proportionate share of the expenses of the underlying Fidelity Central Funds.
The Money Market Central Funds seek preservation of capital and current income and are managed by Fidelity Investments Money Management, Inc. (FIMM), an affiliate of the investment adviser. Annualized expenses of the Money Market Central Funds as of their most recent shareholder report date are less than .01%.
A complete unaudited list of holdings for each Fidelity Central Fund is available upon request or at the Securities and Exchange Commission (the SEC) website at www.sec.gov. In addition, the financial statements of the Fidelity Central Funds, which are not covered by the Fund's Report of Independent Registered Public Accounting Firm, are available on the SEC website or upon request.
3. Significant Accounting Policies.
The financial statements have been prepared in conformity with accounting principles generally accepted in the United States of America (GAAP), which require management to make certain estimates and assumptions at the date of the financial statements. Actual results could differ from those estimates. Subsequent events, if any, through the date that the financial statements were issued have been evaluated in the preparation of the financial statements. The following summarizes the significant accounting policies of the Fund:
Investment Valuation. Investments are valued as of 4:00 p.m. Eastern time on the last calendar day of the period. The Board of Trustees (the Board) has delegated the day to day responsibility for the valuation of the Fund's investments to the Fidelity Management
Annual Report
3. Significant Accounting Policies - continued
Investment Valuation - continued
& Research Company (FMR) Fair Value Committee (the Committee). In accordance with valuation policies and procedures approved by the Board, the Fund attempts to obtain prices from one or more third party pricing vendors or brokers to value its investments. When current market prices, quotations or currency exchange rates are not readily available or reliable, investments will be fair valued in good faith by the Committee, in accordance with procedures adopted by the Board. Factors used in determining fair value vary by investment type and may include market or investment specific events. The frequency with which these procedures are used cannot be predicted and they may be utilized to a significant extent. The Committee oversees the Fund's valuation policies and procedures and reports to the Board on the Committee's activities and fair value determinations. The Board monitors the appropriateness of the procedures used in valuing the Fund's investments and ratifies the fair value determinations of the Committee.
The Fund categorizes the inputs to valuation techniques used to value its investments into a disclosure hierarchy consisting of three levels as shown below:
Level 1 - quoted prices in active markets for identical investments
Level 2 - other significant observable inputs (including quoted prices for similar investments, interest rates, prepayment speeds, etc.)
Level 3 - unobservable inputs (including the Fund's own assumptions based on the best information available)
Valuation techniques used to value the Fund's investments by major category are as follows:
Equity securities, including restricted securities, for which market quotations are readily available, are valued at the last reported sale price or official closing price as reported by a third party pricing vendor on the primary market or exchange on which they are traded and are categorized as Level 1 in the hierarchy. In the event there were no sales during the day or closing prices are not available, securities are valued at the last quoted bid price or may be valued using the last available price and are generally categorized as Level 2 in the hierarchy. For foreign equity securities, when market or security specific events arise, comparisons to the valuation of American Depositary Receipts (ADRs), futures contracts, Exchange-Traded Funds (ETFs) and certain indexes as well as quoted prices for similar securities may be used and would be categorized as Level 2 in the hierarchy. Utilizing these techniques may result in transfers between Level 1 and Level 2.
Annual Report
Notes to Financial Statements - continued
3. Significant Accounting Policies - continued
Investment Valuation - continued
For equity securities, including restricted securities, where observable inputs are limited, assumptions about market activity and risk are used and these securities may be categorized as Level 3 in the hierarchy.
Investments in open-end mutual funds, including the Fidelity Central Funds, are valued at their closing net asset value (NAV) each business day and are categorized as Level 1 in the hierarchy.
Changes in valuation techniques may result in transfers in or out of an assigned level within the disclosure hierarchy. The aggregate value of investments by input level as of July 31, 2015, is included at the end of the Fund's Schedule of Investments.
Foreign Currency. The Fund may use foreign currency contracts to facilitate transactions in foreign-denominated securities. Gains and losses from these transactions may arise from changes in the value of the foreign currency or if the counterparties do not perform under the contracts' terms.
Foreign-denominated assets, including investment securities, and liabilities are translated into U.S. dollars at the exchange rates at period end. Purchases and sales of investment securities, income and dividends received and expenses denominated in foreign currencies are translated into U.S. dollars at the exchange rate in effect on the transaction date.
The effects of exchange rate fluctuations on investments are included with the net realized and unrealized gain (loss) on investment securities. Other foreign currency transactions resulting in realized and unrealized gain (loss) are disclosed separately.
Investment Transactions and Income. For financial reporting purposes, the Fund's investment holdings and NAV include trades executed through the end of the last business day of the period. The NAV per share for processing shareholder transactions is calculated as of the close of business of the New York Stock Exchange (NYSE), normally 4:00 p.m. Eastern time and includes trades executed through the end of the prior business day. Gains and losses on securities sold are determined on the basis of identified cost and may include proceeds received from litigation. Dividend income is recorded on the ex-dividend date, except for certain dividends from foreign securities where the ex-dividend date may have passed, which are recorded as soon as the Fund is informed of the ex-dividend date. Non-cash dividends included in dividend income, if any, are recorded at the fair market value of the securities received. Income and capital gain distributions from Fidelity Central Funds, if any, are recorded on the ex-dividend date.
Annual Report
3. Significant Accounting Policies - continued
Investment Transactions and Income - continued
Distributions received on securities that represent a return of capital or capital gain are recorded as a reduction of cost of investments and/or as a realized gain. Subsequent to ex-dividend date the Fund determines the components of these distributions, based upon receipt of tax filings or other correspondence relating to the underlying investment. Large, non-recurring dividends recognized by the Fund are presented separately on the Statement of Operations as "Special Dividends" and the impact of these dividends is presented in the Financial Highlights. Interest income is accrued as earned and includes coupon interest and amortization of premium and accretion of discount on debt securities as applicable. Investment income is recorded net of foreign taxes withheld where recovery of such taxes is uncertain.
Expenses. Expenses directly attributable to a fund are charged to that fund. Expenses attributable to more than one fund are allocated among the respective funds on the basis of relative net assets or other appropriate methods. Expense estimates are accrued in the period to which they relate and adjustments are made when actual amounts are known.
Income Tax Information and Distributions to Shareholders. Each year, the Fund intends to qualify as a regulated investment company under Subchapter M of the Internal Revenue Code, including distributing substantially all of its taxable income and realized gains. As a result, no provision for U.S. Federal income taxes is required. As of July 31, 2015, the Fund did not have any unrecognized tax benefits in the financial statements; nor is the Fund aware of any tax positions for which it is reasonably possible that the total amounts of unrecognized tax benefits will significantly change in the next twelve months. The Fund files a U.S. federal tax return, in addition to state and local tax returns as required. The Fund's federal income tax returns are subject to examination by the Internal Revenue Service (IRS) for a period of three fiscal years after they are filed. State and local tax returns may be subject to examination for an additional fiscal year depending on the jurisdiction. Foreign taxes are provided for based on the Fund's understanding of the tax rules and rates that exist in the foreign markets in which it invests.
Distributions are declared and recorded on the ex-dividend date. Income and capital gain distributions are determined in accordance with income tax regulations, which may differ from GAAP.
Capital accounts within the financial statements are adjusted for permanent book-tax differences. These adjustments have no impact on net assets or the results of operations. Capital accounts are not adjusted for temporary book-tax differences which will reverse in a subsequent period.
Annual Report
Notes to Financial Statements - continued
3. Significant Accounting Policies - continued
Income Tax Information and Distributions to Shareholders - continued
Book-tax differences are primarily due to futures contracts, foreign currency transactions, partnerships, capital loss carryforwards, and losses deferred due to wash sales.
The federal tax cost of investment securities and unrealized appreciation (depreciation) as of period end were as follows:
Gross unrealized appreciation | $ 34,483,620 |
Gross unrealized depreciation | (17,791,185) |
Net unrealized appreciation (depreciation) on securities | $ 16,692,435 |
| |
Tax Cost | $ 393,091,557 |
The tax-based components of distributable earnings as of period end were as follows:
Undistributed ordinary income | $ 4,925,285 |
Capital loss carryforward | $ (67,954,324) |
Net unrealized appreciation (depreciation) on securities and other investments | $ 16,692,292 |
Capital loss carryforwards are only available to offset future capital gains of the Fund to the extent provided by regulations and may be limited. Under the Regulated Investment Company Modernization Act of 2010 (the Act), the Fund is permitted to carryforward capital losses incurred in taxable years beginning after December 22, 2010 for an unlimited period and such capital losses are required to be used prior to any losses that expire. The capital loss carryforward information presented below, including any applicable limitation, is estimated as of fiscal period end and is subject to adjustment.
Fiscal year of expiration | |
2017 | $ (12,454,196) |
2018 | (55,500,128) |
Total capital loss carryforward | $ (67,954,324) |
The tax character of distributions paid was as follows:
| July 31, 2015 | July 31, 2014 |
Ordinary Income | $ 4,830,518 | $ 2,139,474 |
4. Derivative Instruments.
Risk Exposures and the Use of Derivative Instruments. The Fund's investment objective allows the Fund to enter into various types of derivative contracts, including futures contracts. Derivatives are investments whose value is primarily derived from
Annual Report
4. Derivative Instruments - continued
Risk Exposures and the Use of Derivative Instruments - continued
underlying assets, indices or reference rates and may be transacted on an exchange or over-the-counter (OTC). Derivatives may involve a future commitment to buy or sell a specified asset based on specified terms, to exchange future cash flows at periodic intervals based on a notional principal amount, or for one party to make one or more payments upon the occurrence of specified events in exchange for periodic payments from the other party.
The Fund used derivatives to increase returns and to manage exposure to certain risks as defined below. The success of any strategy involving derivatives depends on analysis of numerous economic factors, and if the strategies for investment do not work as intended, the Fund may not achieve its objectives.
The Fund's use of derivatives increased or decreased its exposure to the following risk:
Equity Risk | Equity risk relates to the fluctuations in the value of financial instruments as a result of changes in market prices (other than those arising from interest rate risk or foreign exchange risk), whether caused by factors specific to an individual investment, its issuer, or all factors affecting all instruments traded in a market or market segment. |
The Fund is also exposed to additional risks from investing in derivatives, such as liquidity risk and counterparty credit risk. Liquidity risk is the risk that the Fund will be unable to close out the derivative in the open market in a timely manner. Counterparty credit risk is the risk that the counterparty will not be able to fulfill its obligation to the Fund. Counterparty credit risk related to exchange-traded futures contracts may be mitigated by the protection provided by the exchange on which they trade.
Investing in derivatives may involve greater risks than investing in the underlying assets directly and, to varying degrees, may involve risk of loss in excess of any initial investment and collateral received and amounts recognized in the Statement of Assets and Liabilities. In addition, there may be the risk that the change in value of the derivative contract does not correspond to the change in value of the underlying instrument.
Futures Contracts. A futures contract is an agreement between two parties to buy or sell a specified underlying instrument for a fixed price at a specified future date. The Fund used futures contracts to manage its exposure to the stock market.
Upon entering into a futures contract, a fund is required to deposit either cash or securities (initial margin) with a clearing broker in an amount equal to a certain percentage of the face value of the contract. Futures contracts are marked-to-market daily and subsequent daily payments (variation margin) are made or received by a fund depending on
Annual Report
Notes to Financial Statements - continued
4. Derivative Instruments - continued
Futures Contracts - continued
the daily fluctuations in the value of the futures contracts and are recorded as unrealized appreciation or (depreciation). This receivable and/or payable, if any, is included in daily variation margin for derivative instruments in the Statement of Assets and Liabilities. Realized gain or (loss) is recorded upon the expiration or closing of a futures contract.
Any open futures contracts at period end are presented in the Schedule of Investments under the caption "Futures Contracts." The underlying face amount at value reflects each contract's exposure to the underlying instrument or index at period end.
During the period the Fund recognized net realized gain (loss) of $6,346 related to its investment in futures contracts. This amount is included in the Statement of Operations.
5. Purchases and Sales of Investments.
Purchases and sales of securities, other than short-term securities, aggregated $498,364,266 and $470,758,730, respectively.
6. Fees and Other Transactions with Affiliates.
Management Fee. Fidelity Management & Research Company (the investment adviser) and its affiliates provide the Fund with investment management related services for which the Fund pays a monthly management fee. The management fee is the sum of an individual fund fee rate that is based on an annual rate of .30% of the Fund's average net assets and an annualized group fee rate that averaged .25% during the period. The group fee rate is based upon the average net assets of all the mutual funds advised by the investment adviser, including any mutual funds previously advised by the investment adviser that are currently advised by Fidelity SelectCo, LLC, an affiliate of the investment adviser. The group fee rate decreases as assets under management increase and increases as assets under management decrease. In addition, the management fee is subject to a performance adjustment (up to a maximum of ± .20% of the Fund's average net assets over a 36 month performance period). The upward or downward adjustment to the management fee is based on the Fund's relative investment performance as compared to its benchmark index, the Russell 1000 Value Index, over the same 36 month performance period. For the reporting period, the total annual management fee rate, including the performance adjustment, was .54% of the Fund's average net assets. The performance adjustment included in the management fee rate may be higher or lower than the maximum performance adjustment rate due to the difference between the average net assets for the reporting and performance periods.
Annual Report
6. Fees and Other Transactions with Affiliates - continued
Transfer Agent Fees. Fidelity Investments Institutional Operations Company, Inc. (FIIOC), an affiliate of the investment adviser, is the Fund's transfer, dividend disbursing and shareholder servicing agent. FIIOC receives account fees and asset-based fees that vary according to account size and type of account. FIIOC pays for typesetting, printing and mailing of shareholder reports, except proxy statements. For the period, the transfer agent fees were equivalent to an annual rate of .21% of average net assets.
Accounting and Security Lending Fees. Fidelity Service Company, Inc. (FSC), an affiliate of the investment adviser, maintains the Fund's accounting records. The accounting fee is based on the level of average net assets for each month. Under a separate contract, FSC administers the security lending program. The security lending fee is based on the number and duration of lending transactions.
Brokerage Commissions. The Fund placed a portion of its portfolio transactions with brokerage firms which are affiliates of the investment adviser. Brokerage commissions are included in net realized gain (loss) and change in net unrealized appreciation (depreciation) in the Statement of Operations. The commissions paid to these affiliated firms were $4,030 for the period.
7. Committed Line of Credit.
The Fund participates with other funds managed by the investment adviser or an affiliate in a $4.25 billion credit facility (the "line of credit") to be utilized for temporary or emergency purposes to fund shareholder redemptions or for other short-term liquidity purposes. The Fund has agreed to pay commitment fees on its pro-rata portion of the line of credit, which amounted to $514 and is reflected in Miscellaneous expenses on the Statement of Operations. During the period, the Fund did not borrow on this line of credit.
8. Security Lending.
The Fund lends portfolio securities through a lending agent from time to time in order to earn additional income. For equity securities, a lending agent is used and may loan securities to certain qualified borrowers, including Fidelity Capital Markets (FCM), a broker-dealer affiliated with the Fund. On the settlement date of the loan, the Fund receives collateral (in the form of U.S. Treasury obligations, letters of credit and/or cash) against the loaned securities and maintains collateral in an amount not less than 100% of the market value of the loaned securities during the period of the loan. The market value of the loaned securities is determined at the close of business of the Fund and any additional required collateral is delivered to the Fund on the next business day. If the borrower defaults on its obligation to return the securities loaned because of insolvency or other reasons, the Fund may apply collateral received from the borrower against the
Annual Report
Notes to Financial Statements - continued
8. Security Lending - continued
obligation. The Fund may experience delays and costs in recovering the securities loaned. Any cash collateral received is invested in the Fidelity Securities Lending Cash Central Fund. At period end, there were no security loans outstanding. Security lending income represents the income earned on investing cash collateral, less rebates paid to borrowers and any lending agent fees associated with the loan, plus any premium payments received for lending certain types of securities. Security lending income is presented in the Statement of Operations as a component of income from Fidelity Central Funds. Total security lending income during the period amounted to $13,385. During the period, there were no securities loaned to FCM.
9. Expense Reductions.
Commissions paid to certain brokers with whom the investment adviser, or its affiliates, places trades on behalf of the Fund include an amount in addition to trade execution, which may be rebated back to the Fund to offset certain expenses. This amount totaled $2,080 for the period. In addition, through arrangements with the Fund's custodian, credits realized as a result of uninvested cash balances were used to reduce the Fund's expenses. During the period, these credits reduced the Fund's custody expenses by $304.
In addition, during the period the investment adviser reimbursed/waived a portion of fund-level operating expenses in the amount of $1,537 and a portion of class-level operating expenses in the amount of $7,906.
10. Other.
The Fund's organizational documents provide former and current trustees and officers with a limited indemnification against liabilities arising in connection with the performance of their duties to the Fund. In the normal course of business, the Fund may also enter into contracts that provide general indemnifications. The Fund's maximum exposure under these arrangements is unknown as this would be dependent on future claims that may be made against the Fund. The risk of material loss from such claims is considered remote.
Annual Report
To the Trustees of Fidelity Securities Fund and the Shareholders of Fidelity Blue Chip Value Fund:
In our opinion, the accompanying statement of assets and liabilities, including the schedule of investments, and the related statements of operations and of changes in net assets and the financial highlights present fairly, in all material respects, the financial position of Fidelity Blue Chip Value Fund (a fund of Fidelity Securities Fund) at July 31, 2015, the results of its operations for the year then ended, the changes in its net assets for each of the two years in the period then ended and the financial highlights for each of the five years in the period then ended, in conformity with accounting principles generally accepted in the United States of America. These financial statements and financial highlights (hereafter referred to as "financial statements") are the responsibility of the Fidelity Blue Chip Value Fund's management. Our responsibility is to express an opinion on these financial statements based on our audits. We conducted our audits of these financial statements in accordance with the standards of the Public Company Accounting Oversight Board (United States). Those standards require that we plan and perform the audit to obtain reasonable assurance about whether the financial statements are free of material misstatement. An audit includes examining, on a test basis, evidence supporting the amounts and disclosures in the financial statements, assessing the accounting principles used and significant estimates made by management, and evaluating the overall financial statement presentation. We believe that our audits, which included confirmation of securities at July 31, 2015 by correspondence with the custodian and brokers, provide a reasonable basis for our opinion.
PricewaterhouseCoopers LLP
Boston, Massachusetts
September 18, 2015
Annual Report
The Trustees, Member of the Advisory Board, and officers of the trust and fund, as applicable, are listed below. The Board of Trustees governs the fund and is responsible for protecting the interests of shareholders. The Trustees are experienced executives who meet periodically throughout the year to oversee the fund's activities, review contractual arrangements with companies that provide services to the fund, oversee management of the risks associated with such activities and contractual arrangements, and review the fund's performance. Each of the Trustees oversees 170 funds.
The Trustees hold office without limit in time except that (a) any Trustee may resign; (b) any Trustee may be removed by written instrument, signed by at least two-thirds of the number of Trustees prior to such removal; (c) any Trustee who requests to be retired or who has become incapacitated by illness or injury may be retired by written instrument signed by a majority of the other Trustees; and (d) any Trustee may be removed at any special meeting of shareholders by a two-thirds vote of the outstanding voting securities of the trust. Each Trustee who is not an interested person (as defined in the 1940 Act) of the trust and the fund (Independent Trustee), shall retire not later than the last day of the calendar year in which his or her 75th birthday occurs. The Independent Trustees may waive this mandatory retirement age policy with respect to individual Trustees. The officers and Advisory Board Member hold office without limit in time, except that any officer and Advisory Board Member may resign or may be removed by a vote of a majority of the Trustees at any regular meeting or any special meeting of the Trustees. Except as indicated, each individual has held the office shown or other offices in the same company for the past five years.
Experience, Skills, Attributes, and Qualifications of the Fund's Trustees. The Governance and Nominating Committee has adopted a statement of policy that describes the experience, qualifications, attributes, and skills that are necessary and desirable for potential Independent Trustee candidates (Statement of Policy). The Board believes that each Trustee satisfied at the time he or she was initially elected or appointed a Trustee, and continues to satisfy, the standards contemplated by the Statement of Policy. The Governance and Nominating Committee also engages professional search firms to help identify potential Independent Trustee candidates who have the experience, qualifications, attributes, and skills consistent with the Statement of Policy. From time to time, additional criteria based on the composition and skills of the current Independent Trustees, as well as experience or skills that may be appropriate in light of future changes to board composition, business conditions, and regulatory or other developments, have also been considered by the professional search firms and the Governance and Nominating Committee. In addition, the Board takes into account the Trustees' commitment and participation in Board and committee meetings, as well as their leadership of standing and ad hoc committees throughout their tenure.
In determining that a particular Trustee was and continues to be qualified to serve as a Trustee, the Board has considered a variety of criteria, none of which, in isolation, was controlling. The Board believes that, collectively, the Trustees have balanced and diverse experience, qualifications, attributes, and skills, which allow the Board to operate effectively in governing the fund and protecting the interests of shareholders. Information about the specific experience, skills, attributes, and qualifications of each Trustee, which in each case led to the Board's conclusion that the Trustee should serve (or continue to serve) as a trustee of the fund, is provided below.
Annual Report
Board Structure and Oversight Function. James C. Curvey is an interested person (as defined in the 1940 Act) and currently serves as Chairman. The Trustees have determined that an interested Chairman is appropriate and benefits shareholders because an interested Chairman has a personal and professional stake in the quality and continuity of services provided to the fund. Independent Trustees exercise their informed business judgment to appoint an individual of their choosing to serve as Chairman, regardless of whether the Trustee happens to be independent or a member of management. The Independent Trustees have determined that they can act independently and effectively without having an Independent Trustee serve as Chairman and that a key structural component for assuring that they are in a position to do so is for the Independent Trustees to constitute a substantial majority for the Board. The Independent Trustees also regularly meet in executive session. Ned C. Lautenbach serves as Chairman of the Independent Trustees and as such (i) acts as a liaison between the Independent Trustees and management with respect to matters important to the Independent Trustees and (ii) with management prepares agendas for Board meetings.
Fidelity funds are overseen by different Boards of Trustees. The fund's Board oversees Fidelity's high income and certain equity funds and other Boards oversee Fidelity's investment-grade bond, money market, asset allocation, and sector funds. The asset allocation funds may invest in Fidelity funds overseen by the fund's Board. The use of separate Boards, each with its own committee structure, allows the Trustees of each group of Fidelity funds to focus on the unique issues of the funds they oversee, including common research, investment, and operational issues. On occasion, the separate Boards establish joint committees to address issues of overlapping consequences for the Fidelity funds overseen by each Board.
The Trustees operate using a system of committees to facilitate the timely and efficient consideration of all matters of importance to the Trustees, the fund, and fund shareholders and to facilitate compliance with legal and regulatory requirements and oversight of the fund's activities and associated risks. The Board, acting through its committees, has charged FMR and its affiliates with (i) identifying events or circumstances the occurrence of which could have demonstrably adverse effects on the fund's business and/or reputation; (ii) implementing processes and controls to lessen the possibility that such events or circumstances occur or to mitigate the effects of such events or circumstances if they do occur; and (iii) creating and maintaining a system designed to evaluate continuously business and market conditions in order to facilitate the identification and implementation processes described in (i) and (ii) above. Because the day-to-day operations and activities of the fund are carried out by or through FMR, its affiliates and other service providers, the fund's exposure to risks is mitigated but not eliminated by the processes overseen by the Trustees. While each of the Board's committees has responsibility for overseeing different aspects of the fund's activities, oversight is exercised primarily through the Operations, Audit, and Compliance Committees. In addition, the Independent Trustees have worked with FMR to enhance the Board's oversight of investment and financial risks, legal and regulatory risks, technology risks, and operational risks, including the development of additional risk reporting to the Board. For example, a working group comprised of Independent Trustees and FMR has worked and continues to work to review the Fidelity funds' valuation-related activities, reporting and risk management. Appropriate personnel, including but not limited to the fund's Chief Compliance Officer (CCO), FMR's internal auditor, the independent accountants, the fund's Treasurer and portfolio management personnel, make periodic reports to the Board's committees, as appropriate, including an annual review of FMR's risk management program for the Fidelity funds. The responsibilities of each standing committee, including their oversight responsibilities, are described further under "Standing Committees of the Fund's Trustees."
Annual Report
Trustees and Officers - continued
The fund's Statement of Additional Information (SAI) includes more information about the Trustees. To request a free copy, call Fidelity at 1-800-544-8544.
Interested Trustees*:
Correspondence intended for each Trustee who is an interested person may be sent to Fidelity Investments, 245 Summer Street, Boston, Massachusetts 02210.
Name, Year of Birth; Principal Occupations and Other Relevant Experience+ |
James C. Curvey (1935) |
Year of Election or Appointment: 2007 Trustee Chairman of the Board of Trustees |
| Mr. Curvey also serves as Trustee of other Fidelity funds. Mr. Curvey is a Director of Fidelity Research & Analysis Co. (investment adviser firm, 2009-present), and Vice Chairman (2007-present) and Director of FMR LLC (diversified financial services company). In addition, Mr. Curvey serves as an Overseer for the Boston Symphony Orchestra and a member of the board of Artis-Naples, Naples, Florida, and as a Trustee for Brewster Academy, Wolfeboro, New Hampshire. Previously, Mr. Curvey served as a Director of Fidelity Investments Money Management, Inc. (investment adviser firm, 2009-2014), a Director of FMR (investment adviser firm, 2007-2014), and a Director of FMR Co., Inc. (investment adviser firm, 2007-2014). |
Charles S. Morrison (1960) |
Year of Election or Appointment: 2014 Trustee |
| Mr. Morrison also serves as Trustee of other funds. He serves as a Director of Fidelity Investments Money Management, Inc. (FIMM) (investment adviser firm, 2014-present), Director of Fidelity SelectCo, LLC (investment adviser firm, 2014-present), President, Asset Management (2014-present), and is an employee of Fidelity Investments. Previously, Mr. Morrison served as Vice President of Fidelity's Fixed Income and Asset Allocation Funds (2012-2014), President, Fixed Income (2011-2014), Vice President of Fidelity's Money Market Funds (2005-2009), President, Money Market Group Leader of FMR (investment adviser firm, 2009), and Senior Vice President, Money Market Group of FMR (2004-2009). Mr. Morrison also served as Vice President of Fidelity's Bond Funds (2002-2005), certain Balanced Funds (2002-2005), and certain Asset Allocation Funds (2002-2007), and as Senior Vice President (2002-2005) of Fidelity's Bond Division. |
* Trustees have been determined to be "Interested Trustees" by virtue of, among other things, their affiliation with the trust or various entities under common control with FMR.
+ The information above includes each Trustee's principal occupation during the last five years and other information relating to the experience, attributes, and skills relevant to each Trustee's qualifications to serve as a Trustee, which led to the conclusion that each Trustee should serve as a Trustee for the fund.
Annual Report
Trustees and Officers - continued
Independent Trustees:
Correspondence intended for each Independent Trustee (that is, the Trustees other than the Interested Trustees) may be sent to Fidelity Investments, P.O. Box 55235, Boston, Massachusetts 02205-5235.
Name, Year of Birth; Principal Occupations and Other Relevant Experience+ |
Dennis J. Dirks (1948) |
Year of Election or Appointment: 2005 Trustee |
| Mr. Dirks also serves as Trustee of other Fidelity funds. Prior to his retirement in May 2003, Mr. Dirks was Chief Operating Officer and a member of the Board of The Depository Trust & Clearing Corporation (DTCC). He also served as President, Chief Operating Officer, and Board member of The Depository Trust Company (DTC) and President and Board member of the National Securities Clearing Corporation (NSCC). In addition, Mr. Dirks served as Chief Executive Officer and Board member of the Government Securities Clearing Corporation, Chief Executive Officer and Board member of the Mortgage-Backed Securities Clearing Corporation, as a Trustee and a member of the Finance Committee of Manhattan College (2005-2008), and as a Trustee and a member of the Finance Committee of AHRC of Nassau County (2006-2008). Mr. Dirks is a member of the Independent Directors Council (IDC) Governing Council (2010-present) and Board of Directors for The Brookville Center for Children's Services, Inc. (2009-present). |
Alan J. Lacy (1953) |
Year of Election or Appointment: 2008 Trustee |
| Mr. Lacy also serves as Trustee of other Fidelity funds. Mr. Lacy serves as a member of the Board of Directors of Dave & Buster's Entertainment, Inc. (restaurant and entertainment complexes, 2010-present) and Bristol-Myers Squibb Company (global pharmaceuticals, 2008-present). In addition, Mr. Lacy served as Senior Adviser (2007-2014) of Oak Hill Capital Partners, L.P. (private equity) and also served as Chief Executive Officer (2000-2005) and Vice Chairman (2005-2006) of Sears Holdings Corporation and Sears, Roebuck and Co. (retail). Mr. Lacy is a member of the Board of Trustees of The National Parks Conservation Association (2006-present). Previously, Mr. Lacy served as Chairman of the Board of Trustees of the National Parks Conservation Association (2008-2011) and as a member of the Board of Directors for The Western Union Company (global money transfer, 2006-2011), The Hillman Companies, Inc. (hardware wholesalers, 2010-2014), and Earth Fare, Inc. (retail grocery, 2010-2014). |
Ned C. Lautenbach (1944) |
Year of Election or Appointment: 2000 Trustee Chairman of the Independent Trustees |
| Mr. Lautenbach also serves as Trustee of other Fidelity funds. Mr. Lautenbach currently serves as the Lead Director of the Eaton Corporation Board of Directors (diversified industrial, 1997-present). Mr. Lautenbach is Chairman of the Board of Directors of Artis-Naples in Naples, Florida (2012-present), a member of the Council on Foreign Relations (1994-present), and a member of the Board of Governors, State University System of Florida (2013-present). Previously, Mr. Lautenbach was a Partner/Advisory Partner at Clayton, Dubilier & Rice, LLC (private equity investment, 1998-2010), as well as a Director of Sony Corporation (2006-2007). |
Joseph Mauriello (1944) |
Year of Election or Appointment: 2008 Trustee |
| Mr. Mauriello also serves as Trustee of other Fidelity funds. Prior to his retirement in January 2006, Mr. Mauriello served in numerous senior management positions including Deputy Chairman and Chief Operating Officer (2004-2005), and Vice Chairman of Financial Services (2002-2004) of KPMG LLP US (professional services, 1965-2005). Mr. Mauriello currently serves as a member of the Board of Directors of XL Group plc. (global insurance and re-insurance, 2006-present). Previously, Mr. Mauriello served as a Director of the Hamilton Funds of the Bank of New York (2006-2007) and of Arcadia Resources Inc. (health care services and products, 2007-2012). |
Robert W. Selander (1950) |
Year of Election or Appointment: 2011 Trustee |
| Mr. Selander also serves as Trustee of other Fidelity funds. Mr. Selander serves as a Director of The Western Union Company (global money transfer, 2014-present). Previously, Mr. Selander served as a Member of the Advisory Board of other Fidelity funds (2011), and Executive Vice Chairman (2010), Chief Executive Officer (2009-2010), and President and Chief Executive Officer (1997-2009) of Mastercard, Inc. |
Cornelia M. Small (1944) |
Year of Election or Appointment: 2005 Trustee |
| Ms. Small also serves as Trustee of other Fidelity funds. Ms. Small is a member of the Board of Directors (2009-present) and Chair of the Investment Committee (2010-present) of the Teagle Foundation. Ms. Small also serves on the Investment Committee of the Berkshire Taconic Community Foundation (2008-present). Previously, Ms. Small served as Chairperson (2002-2008) and a member of the Investment Committee and Chairperson (2008-2012) and a member of the Board of Trustees of Smith College. In addition, Ms. Small served as Chief Investment Officer, Director of Global Equity Investments, and a member of the Board of Directors of Scudder, Stevens & Clark and Scudder Kemper Investments. |
William S. Stavropoulos (1939) |
Year of Election or Appointment: 2002 Trustee Vice Chairman of the Independent Trustees |
| Mr. Stavropoulos also serves as Trustee of other Fidelity funds. Mr. Stavropoulos serves as President and Founder of the Michigan Baseball Foundation, the Great Lakes Loons (2007-present). Mr. Stavropoulos is Chairman Emeritus of the Board of Directors of The Dow Chemical Company, where he previously served in numerous senior management positions, including President, CEO (1995-2000; 2002-2004), Chairman of the Executive Committee (2000-2006), and as a member of the Board of Directors (1990-2006). Currently, Mr. Stavropoulos is Chairman of the Board of Directors of Univar Inc. (global distributor of commodity and specialty chemicals), a Director of Teradata Corporation (data warehousing and technology solutions), and Maersk Inc. (industrial conglomerate), and a member of the Advisory Board for Metalmark Capital LLC (private equity investment, 2005-present). Mr. Stavropoulos is an operating advisor to Clayton, Dubilier & Rice, LLC (private equity investment). In addition, Mr. Stavropoulos is a member of the University of Notre Dame Advisory Council for the College of Science, a Trustee of the Rollin L. Gerstacker Foundation, and a Director of the Naples Philharmonic Center for the Arts. Previously, Mr. Stavropoulos served as a Director of Chemical Financial Corporation (bank holding company, 1993-2012) and Tyco International, Ltd. (multinational manufacturing and services, 2007-2012). |
David M. Thomas (1949) |
Year of Election or Appointment: 2008 Trustee |
| Mr. Thomas also serves as Trustee of other Fidelity funds. Mr. Thomas serves as Non-Executive Chairman of the Board of Directors of Fortune Brands Home and Security (home and security products, 2011-present), as a member of the Board of Directors (2004-present) and Presiding Director (2013-present) of Interpublic Group of Companies, Inc. (marketing communication), and as a member of the Board of Trustees of the University of Florida (2013-present). Previously, Mr. Thomas served as Executive Chairman (2005-2006) and Chairman and Chief Executive Officer (2000-2005) of IMS Health, Inc. (pharmaceutical and healthcare information solutions), and a Director of Fortune Brands, Inc. (consumer products, 2000-2011). |
+ The information above includes each Trustee's principal occupation during the last five years and other information relating to the experience, attributes, and skills relevant to each Trustee's qualifications to serve as a Trustee, which led to the conclusion that each Trustee should serve as a Trustee for the fund.
Advisory Board Member and Officers:
Correspondence intended for each officer and Peter S. Lynch may be sent to Fidelity Investments, 245 Summer Street, Boston, Massachusetts 02210. Officers appear below in alphabetical order.
Name, Year of Birth; Principal Occupation |
Peter S. Lynch (1944) |
Year of Election or Appointment: 2003 Member of the Advisory Board |
| Mr. Lynch also serves as Member of the Advisory Board of other Fidelity funds. Mr. Lynch is Vice Chairman and a Director of FMR (investment adviser firm) and FMR Co., Inc. (investment adviser firm). In addition, Mr. Lynch serves as a Trustee of Boston College and as the Chairman of the Inner-City Scholarship Fund. Previously, Mr. Lynch served on the Special Olympics International Board of Directors (1997-2006). |
Elizabeth Paige Baumann (1968) |
Year of Election or Appointment: 2012 Anti-Money Laundering (AML) Officer |
| Ms. Baumann also serves as AML Officer of other funds. She is Chief AML Officer of FMR LLC (diversified financial services company, 2012-present) and is an employee of Fidelity Investments. Previously, Ms. Baumann served as Vice President and Deputy Anti-Money Laundering Officer (2007-2012). |
Marc Bryant (1966) |
Year of Election or Appointment: 2015 Secretary and Chief Legal Officer (CLO) |
<R> | Mr. Bryant also serves as Secretary and Chief Legal Officer (CLO) of other funds. He is Senior Vice President and Deputy General Counsel of FMR LLC (diversified financial services company). Previously, Mr. Bryant served as Secretary and Chief Legal Officer of Fidelity Rutland Square Trust II (2010-2014) and Assistant Secretary of Fidelity's Fixed Income and Asset Allocation Funds (2013-2015). Prior to joining Fidelity Investments, Mr. Bryant served as a Senior Vice President and the Head of Global Retail Legal for Alliance Bernstein L.P. (2006-2010), and as the General Counsel for ProFund Advisors LLC (2001-2006).</R> |
William C. Coffey (1969) |
Year of Election or Appointment: 2009 Assistant Secretary |
| Mr. Coffey also serves as Assistant Secretary of other funds. He is Senior Vice President and Deputy General Counsel of FMR LLC (diversified financial services company, 2010-present), and is an employee of Fidelity Investments. Previously, Mr. Coffey served as Vice President and Associate General Counsel of FMR LLC (2005-2009). |
Jonathan Davis (1968) |
Year of Election or Appointment: 2010 Assistant Treasurer |
| Mr. Davis also serves as Assistant Treasurer of other funds. Mr. Davis is an employee of Fidelity Investments. Previously, Mr. Davis served as Vice President and Associate General Counsel of FMR LLC (diversified financial services company, 2003-2010). |
Adrien E. Deberghes (1967) |
Year of Election or Appointment: 2008 Deputy Treasurer |
| Mr. Deberghes also serves as an officer of other funds. He is an employee of Fidelity Investments (2008-present). Prior to joining Fidelity Investments, Mr. Deberghes was Senior Vice President of Mutual Fund Administration at State Street Corporation (2007-2008), Senior Director of Mutual Fund Administration at Investors Bank & Trust (2005-2007), and Director of Finance for Dunkin' Brands (2000-2005). |
Stephanie J. Dorsey (1969) |
Year of Election or Appointment: 2010 Assistant Treasurer |
| Ms. Dorsey also serves as an officer of other funds. She is an employee of Fidelity Investments (2008-present) and has served in other fund officer roles. Prior to joining Fidelity Investments, Ms. Dorsey served as Treasurer (2004-2008) of the JPMorgan Mutual Funds and Vice President (2004-2008) of JPMorgan Chase Bank. |
Howard J. Galligan III (1966) |
Year of Election or Appointment: 2014 Chief Financial Officer |
| Mr. Galligan also serves as Chief Financial Officer of other funds. Mr. Galligan serves as President of Fidelity Pricing and Cash Management Services (FPCMS) (2014-present) and as a Director of Strategic Advisers, Inc. (investment adviser firm, 2008-present). Previously, Mr. Galligan served as Chief Administrative Officer of Asset Management (2011-2014) and Chief Operating Officer and Senior Vice President of Investment Support for Strategic Advisers, Inc. (2003-2011). |
Scott C. Goebel (1968) |
Year of Election or Appointment: 2015 Vice President |
| Mr. Goebel serves as an officer of other funds. Mr. Goebel also serves as Secretary of Fidelity SelectCo, LLC (investment adviser firm, 2013-present), Fidelity Investments Money Management, Inc. (FIMM) (investment adviser firm, 2010-present) and Fidelity Research and Analysis Company (FRAC) (investment adviser firm, 2010-present); General Counsel, Secretary, and Senior Vice President of FMR (investment adviser firm, 2008-present) and FMR Co., Inc. (investment adviser firm, 2008-present); Chief Legal Officer of Fidelity Management & Research (Hong Kong) Limited (investment adviser firm, 2008-present); and Assistant Secretary of Fidelity Management & Research (Japan) Limited (investment adviser firm, 2008-present) and FMR Investment Management (U.K.) Limited (investment adviser firm, 2008-present). Previously, Mr. Goebel served as Secretary and CLO of certain Fidelity funds (2008-2015), Assistant Secretary of FIMM (2008-2010), FRAC (2008-2010), and certain funds (2007-2008); and as Vice President and Secretary of Fidelity Distributors Corporation (FDC) (2005-2007). Mr. Goebel has been employed by FMR LLC (diversified financial services company) or an affiliate since 2001. |
Thomas C. Hense (1964) |
Year of Election or Appointment: 2008/2010/2015 Vice President |
| Mr. Hense serves as Vice President of Fidelity Advisor Multi-Asset Income Fund (2015) and other funds (High Income (2008), Small Cap (2008), and Value (2010) funds). Previously, Mr. Hense served as a portfolio manager for Fidelity's Institutional Money Management Group (Pyramis) (2003-2008). |
Brian B. Hogan (1964) |
Year of Election or Appointment: 2009 Vice President |
| Mr. Hogan also serves as Trustee or Vice President of other funds. Mr. Hogan serves as a Director of Fidelity SelectCo, LLC (investment adviser firm, 2014-present) and President of the Equity Division of FMR (investment adviser firm, 2009-present). Previously, Mr. Hogan served as Senior Vice President, Equity Research of FMR (2006-2009) and as a portfolio manager. |
Chris Maher (1972) |
Year of Election or Appointment: 2013 Assistant Treasurer |
| Mr. Maher serves as Assistant Treasurer of other funds. Mr. Maher is Vice President of Valuation Oversight and is an employee of Fidelity Investments. Previously, Mr. Maher served as Vice President of Asset Management Compliance (2013), Vice President of the Program Management Group of FMR (investment adviser firm, 2010-2013), and Vice President of Valuation Oversight (2008-2010). |
Kenneth B. Robins (1969) |
Year of Election or Appointment: 2008 President and Treasurer |
| Mr. Robins also serves as an officer of other funds. Mr. Robins serves as Executive Vice President of Fidelity Investments Money Management, Inc. (FIMM) (investment adviser firm, 2013-present) and is an employee of Fidelity Investments (2004-present). Previously, Mr. Robins served in other fund officer roles. |
Stephen Sadoski (1971) |
Year of Election or Appointment: 2012 Deputy Treasurer |
| Mr. Sadoski also serves as Deputy Treasurer of other funds. He is an employee of Fidelity Investments (2012-present) and has served in another fund officer role. Prior to joining Fidelity Investments, Mr. Sadoski served as an assistant chief accountant in the Division of Investment Management of the Securities and Exchange Commission (SEC) (2009-2012) and as a senior manager at Deloitte & Touche LLP (1997-2009). |
Stacie M. Smith (1974) |
Year of Election or Appointment: 2013 Deputy Treasurer |
| Ms. Smith also serves as an officer of other funds. She is an employee of Fidelity Investments (2009-present) and has served in other fund officer roles. Prior to joining Fidelity Investments, Ms. Smith served as Senior Audit Manager of Ernst & Young LLP (1996-2009). |
Renee Stagnone (1975) |
Year of Election or Appointment: 2013 Deputy Treasurer |
| Ms. Stagnone also serves as Deputy Treasurer of other funds. Ms. Stagnone is an employee of Fidelity Investments. |
Linda J. Wondrack (1964) |
Year of Election or Appointment: 2014 Chief Compliance Officer |
| Ms. Wondrack also serves as Chief Compliance Officer of other funds. Ms. Wondrack is Executive Vice President and head of the Ethics Office and Asset Management Compliance for Fidelity Investments (2012-present). Ms. Wondrack also serves as Chief Compliance Officer of Fidelity SelectCo, LLC (investment adviser firm, 2014-present); Chief Compliance Officer of Impresa Management LLC (2013-present); and Chief Compliance Officer of FMR Co., Inc. (investment adviser firm), Fidelity Investments Money Management, Inc. (investment adviser firm), Fidelity Management & Research (Japan) Limited (investment adviser firm), FMR Investment Management (U.K.) Limited (investment adviser firm), Fidelity Management & Research (Hong Kong) (investment adviser firm), Fidelity Management & Research Company (investment adviser firm), Pyramis Global Advisors, LLC (investment adviser firm), and Strategic Advisers, Inc. (investment adviser firm), Ballyrock Investment Advisors LLC, and Northern Neck Investors LLC (2012-present). Previously, Ms. Wondrack served as Senior Vice President and Chief Compliance Officer for Columbia Management Investment Advisers, LLC (2005-2012); Chief Compliance Officer for certain funds within the Columbia Family of Funds (2007-2012); and Senior Vice President of Compliance Risk Management at Bank of America (2005-2010). |
Joseph F. Zambello (1957) |
Year of Election or Appointment: 2011 Deputy Treasurer |
| Mr. Zambello also serves as Deputy Treasurer of other funds. Mr. Zambello is an employee of Fidelity Investments. Previously, Mr. Zambello served as Vice President of the Program Management Group of FMR (investment adviser firm, 2009-2011) and Vice President of the Transfer Agent Oversight Group (2005-2009). |
Annual Report
The fund designates 100% and 96% of the dividends distributed in September and December, respectively during the fiscal year as qualifying for the dividends-received deduction for corporate shareholders.
The fund designates 100% of the dividends distributed in September and December, respectively during the fiscal year as amounts which may be taken into account as a dividend for the purposes of the maximum rate under section 1(h)(11) of the Internal Revenue Code.
The fund will notify shareholders in January 2016 of amounts for use in preparing 2015 income tax returns.
Annual Report
Fidelity Blue Chip Value Fund
Each year, the Board of Trustees, including the Independent Trustees (together, the Board), votes on the renewal of the management contract with Fidelity Management & Research Company (FMR) and the sub-advisory agreements (together, the Advisory Contracts) for the fund. The Board, assisted by the advice of fund counsel and Independent Trustees' counsel, requests and considers a broad range of information relevant to the renewal of the Advisory Contracts throughout the year.
The Board meets regularly and, at each of its meetings, covers an extensive agenda of topics and materials and considers factors that are relevant to its annual consideration of the renewal of the fund's Advisory Contracts, including the services and support provided to the fund and its shareholders. The Board has established various standing committees (Committees), each composed of and chaired by Independent Trustees with varying backgrounds, to which the Board has assigned specific subject matter responsibilities in order to enhance effective decision-making by the Board. The Board, acting directly and through its Committees, requests and receives information concerning the annual consideration of the renewal of the fund's Advisory Contracts. The Board also meets as needed to consider matters specifically related to the Board's annual consideration of the renewal of the Advisory Contracts. Members of the Board may also meet with trustees of other Fidelity funds through ad hoc joint committees to discuss certain matters relevant to all of the Fidelity funds.
At its July 2015 meeting, the Board unanimously determined to renew the fund's Advisory Contracts. In reaching its determination, the Board considered all factors it believed relevant, including (i) the nature, extent, and quality of the services to be provided to the fund and its shareholders (including the investment performance of the fund); (ii) the competitiveness of the fund's management fee and total expense ratio relative to peer funds; (iii) the total costs of the services to be provided by and the profits to be realized by Fidelity from its relationship with the fund; and (iv) the extent to which (if any) economies of scale exist and would be realized as the fund grows, and whether any economies of scale are appropriately shared with fund shareholders.
In considering whether to renew the Advisory Contracts for the fund, the Board reached a determination, with the assistance of fund counsel and Independent Trustees' counsel and through the exercise of its business judgment, that the renewal of the Advisory Contracts was in the best interests of the fund and its shareholders and that the compensation payable under the Advisory Contracts was fair and reasonable. The Board's decision to renew the Advisory Contracts was not based on any single factor, but rather was based on a comprehensive consideration of all the information provided to the Board at its meetings throughout the year. The Board, in reaching its determination to renew the Advisory Contracts, was aware that shareholders of the fund have a broad range of investment choices available to them, including a wide choice among funds offered by Fidelity's competitors, and that the fund's shareholders, who have the opportunity to review and weigh the disclosure provided by the fund in its prospectus and other public disclosures, have chosen to invest in this fund, which is part of the Fidelity family of funds.
Annual Report
Nature, Extent, and Quality of Services Provided. The Board considered Fidelity's staffing as it relates to the fund, including the backgrounds of investment personnel of Fidelity, and also considered the fund's investment objective, strategies, and related investment philosophy. The Independent Trustees also had discussions with senior management of Fidelity's investment operations and investment groups. The Board considered the structure of the portfolio manager compensation program and whether this structure provides appropriate incentives to act in the best interests of the fund. Additionally, the Board considered the portfolio managers' investments, if any, in the funds that they manage.
Resources Dedicated to Investment Management and Support Services. The Board and the Fund Oversight and Research Committees reviewed the general qualifications and capabilities of Fidelity's investment staff, including its size, education, experience, and resources, as well as Fidelity's approach to recruiting, training, managing, and compensating investment personnel. The Board noted that Fidelity has continued to increase the resources devoted to non-U.S. offices, including expansion of Fidelity's global investment organization. The Board also noted that Fidelity's analysts have extensive resources, tools and capabilities that allow them to conduct sophisticated quantitative and fundamental analysis, as well as credit analysis of issuers, counterparties and guarantors. Further, the Board considered that Fidelity's investment professionals have sufficient access to global information and data so as to provide competitive investment results over time, and that those professionals also have access to sophisticated tools that permit them to assess portfolio construction and risk and performance attribution characteristics continuously, as well as to transmit new information and research conclusions rapidly around the world. Additionally, in its deliberations, the Board considered Fidelity's trading, risk management, and compliance capabilities and resources, which are integral parts of the investment management process.
Shareholder and Administrative Services. The Board considered (i) the nature, extent, quality, and cost of advisory, administrative, and shareholder services performed by FMR, the sub-advisers (together with FMR, the Investment Advisers), and their affiliates under the Advisory Contracts and under separate agreements covering transfer agency, pricing and bookkeeping, and securities lending services for the fund; (ii) the nature and extent of the supervision of third party service providers, principally custodians and subcustodians; and (iii) the resources devoted to, and the record of compliance with, the fund's compliance policies and procedures. The Board also reviewed the allocation of fund brokerage, including allocations to brokers affiliated with the Investment Advisers, the use of brokerage commissions to pay fund expenses, and the use of "soft" commission dollars to pay for research services.
Annual Report
Board Approval of Investment Advisory Contracts and
Management Fees - continued
The Board noted that the growth of fund assets over time across the complex allows Fidelity to reinvest in the development of services designed to enhance the value or convenience of the Fidelity funds as investment vehicles. These services include 24-hour access to account information and market information through telephone representatives and over the Internet, investor education materials and asset allocation tools, and the expanded availability of Fidelity Investor Centers.
In 2014, the Board formed an ad hoc Committee on Transfer Agency Fees to review the variety of transfer agency fee structures throughout the industry and Fidelity's competitive positioning with respect to industry participants.
Investment in a Large Fund Family. The Board considered the benefits to shareholders of investing in a Fidelity fund, including the benefits of investing in a fund that is part of a large family of funds offering a variety of investment disciplines and providing a large variety of mutual fund investor services. The Board noted that Fidelity had taken, or had made recommendations that resulted in the Fidelity funds taking, a number of actions over the previous year that benefited particular funds, including (i) continuing to dedicate additional resources to investment research and to the support of the senior management team that oversees asset management; (ii) continuing efforts to enhance Fidelity's global research capabilities; (iii) launching new funds and making other enhancements to meet client needs; (iv) reducing management fees and total expenses for certain index funds and diversified international funds; (v) continuing to launch dedicated lower cost underlying funds to meet portfolio construction needs related to expanding underlying fund options for Fidelity funds of funds, specifically for the Freedom Fund product lines; (vi) rationalizing product lines and gaining increased efficiencies through fund mergers; (vii) launching active fixed-income exchange-traded funds; (viii) continuing to develop, acquire and implement systems and technology to improve services to the funds and information security and to increase efficiency; (ix) implementing investment enhancements to further strengthen Fidelity's target date product line to increase investors' probability of success in achieving their goals; (x) modifying the eligibility criteria for certain share classes to accommodate roll-over assets from employer-sponsored retirement plans; (xi) launching a new Class W of the Freedom Index Funds to attract and retain Fidelity record-kept retirement plan assets; and (xii) implementing changes to Fidelity's money market product line in response to recent money market regulatory reforms.
Investment Performance. The Board considered whether the fund has operated in accordance with its investment objective, as well as its record of compliance with its investment restrictions and its performance history. The Board noted that there was a portfolio management change for the fund in September 2014.
Annual Report
The Board took into account discussions with representatives of the Investment Advisers about fund investment performance that occur at Board meetings throughout the year. In this regard the Board noted that as part of regularly scheduled fund reviews and other reports to the Board on fund performance, the Board considers annualized return information for the fund, for different time periods, measured against a securities market index ("benchmark index") and a peer group of funds with similar objectives ("peer group"), if any. In its evaluation of fund investment performance, the Board gave particular attention to information indicating changes in performance of certain Fidelity funds for specific time periods and discussed with the Investment Advisers the reasons for any overperformance or underperformance.
In addition to reviewing absolute and relative fund performance, the Independent Trustees periodically consider the appropriateness of fund performance metrics in evaluating the results achieved. In general, the Independent Trustees believe that fund performance should be evaluated based on net performance (after fees and expenses) of both the highest performing and lowest performing fund share classes, where applicable, compared to appropriate benchmark indices, over appropriate time periods that may include full market cycles, and compared to peer groups, as applicable, over the same periods, taking into account relevant factors including the following: general market conditions; issuer-specific information; and fund cash flows and other factors.
The Independent Trustees recognize that shareholders evaluate performance on a net basis over their own holding periods, for which one-, three-, and five-year periods are often used as a proxy. For this reason, the performance information reviewed by the Board also included net cumulative calendar year total return information for the fund and an appropriate benchmark index and peer group for the most recent one-, three-, and five-year periods, as shown below. Returns are shown compared to the 25th percentile (top of box, 75% beaten) and 75th percentile (bottom of box, 25% beaten) of the peer universe.
Annual Report
Board Approval of Investment Advisory Contracts and
Management Fees - continued
Fidelity Blue Chip Value Fund
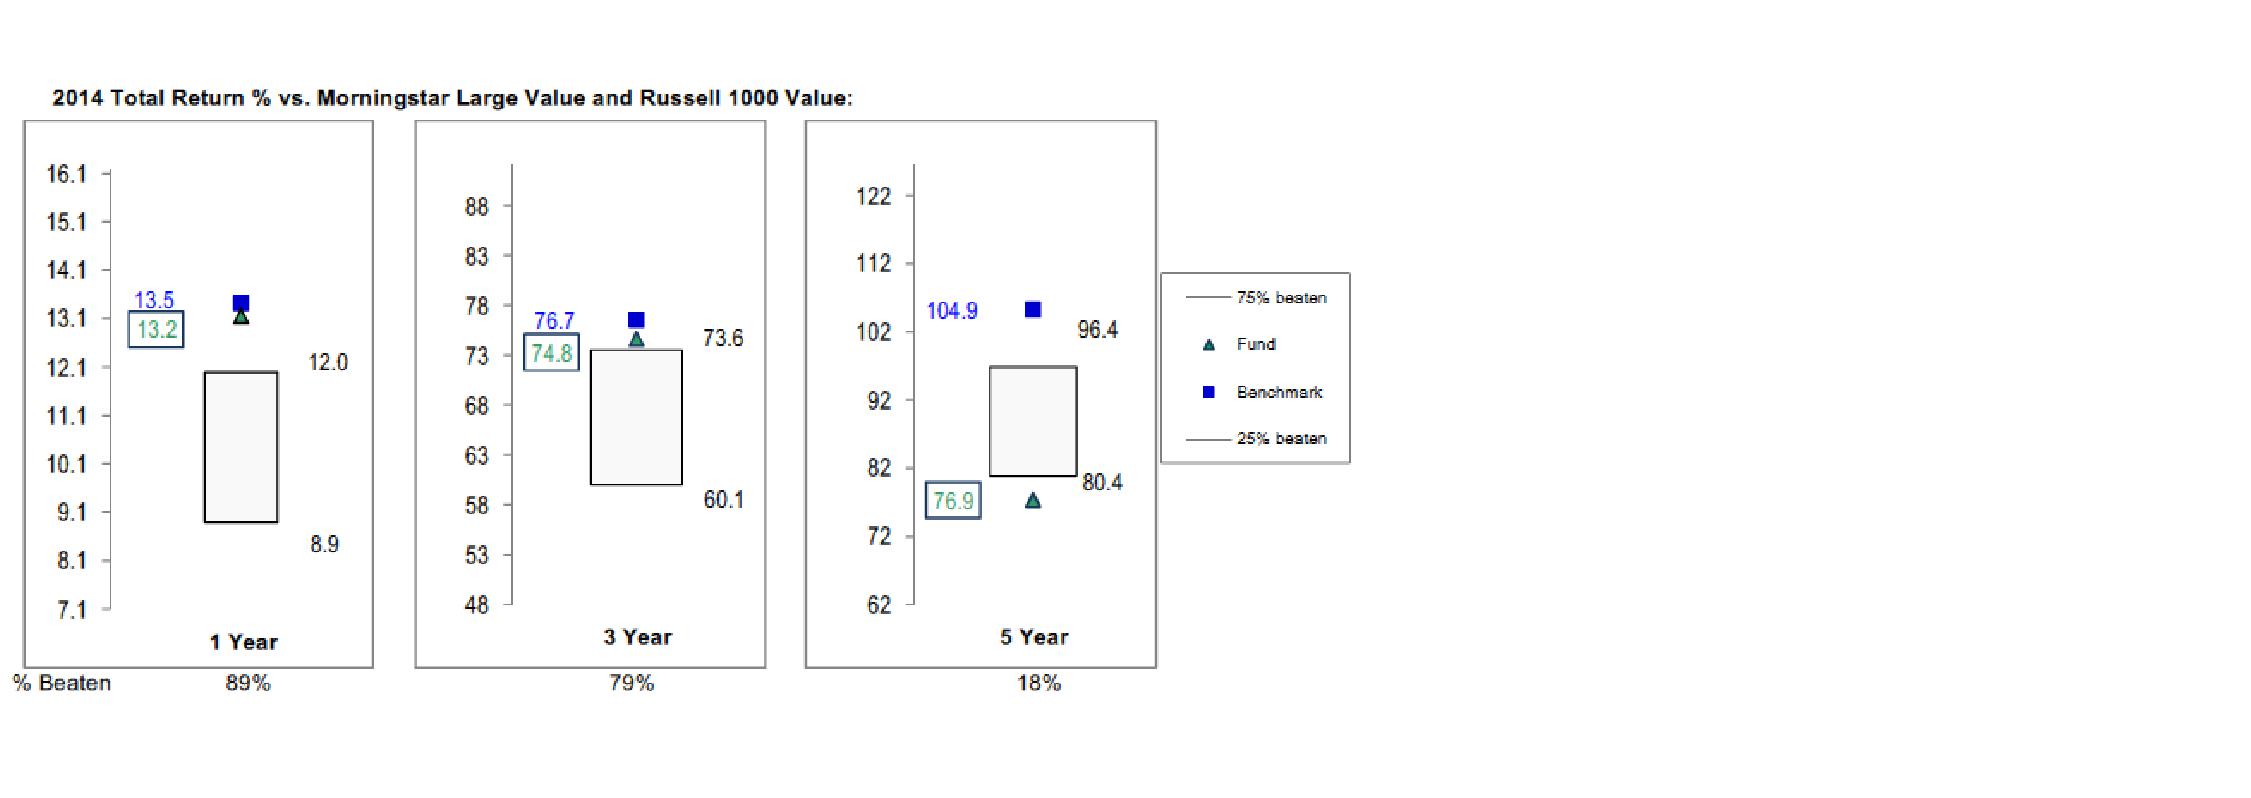
The Board also considered that the fund's management fee is subject to upward or downward adjustment depending upon whether, and to what extent, the fund's investment performance for the performance period exceeds, or is exceeded by, a securities index, thus leading to a performance adjustment for the same period. The Board noted that the performance adjustment provides FMR with a strong economic incentive to seek to achieve superior performance for the fund's shareholders and helps to more closely align the interests of FMR and the shareholders of the fund.
Based on its review, the Board concluded that the nature, extent, and quality of services provided to the fund under the Advisory Contracts should benefit the shareholders of the fund.
Competitiveness of Management Fee and Total Expense Ratio. The Board considered the fund's management fee and total expense ratio compared to "mapped groups" of competitive funds and classes created for the purpose of facilitating the Trustees' competitive analysis of management fees and total expenses. Fidelity creates "mapped groups" by combining similar Lipper investment objective categories that have comparable investment mandates. Combining Lipper investment objective categories aids the Board's management fee and total expense ratio comparisons by broadening the competitive group used for comparison.
Management Fee. The Board considered two proprietary management fee comparisons for the 12-month periods shown in basis points (BP) in the chart below. The group of Lipper funds used by the Board for management fee comparisons is referred to below as the "Total Mapped Group." The Total Mapped Group comparison focuses on a fund's standing in terms of gross management fees before expense reimbursements or caps, and without giving effect to the fund's performance adjustment, relative to the total universe of funds with comparable investment mandates, regardless of whether their management fee structures also are comparable. Funds with comparable investment mandates offer exposure to similar types of securities. Funds with comparable management fee structures have similar management fee contractual arrangements (e.g., flat rate charged for advisory services, all-inclusive fee rate, etc.). "TMG %" represents the percentage of funds in the Total Mapped Group that had management fees that were lower than the fund's. For example, a hypothetical TMG % of 20% would mean that 80% of the funds in the Total Mapped Group had higher, and 20% had lower, management fees than the fund. The fund's actual TMG %s and the number of funds in the Total Mapped Group are in the chart below. The "Asset-Size Peer Group" (ASPG) comparison focuses on a fund's standing relative to a subset of non-Fidelity funds within the Total Mapped Group that are similar in size and management fee structure without taking into account performance adjustments, if any. For example, if a fund is in the first quartile of the ASPG, the fund's management fee ranks in the least expensive or lowest 25% of funds in the ASPG. The ASPG represents at least 15% of the funds in the Total Mapped Group with comparable asset size and management fee structures, subject to a minimum of 50 funds (or all funds in the Total Mapped Group if fewer than 50). Additional information, such as the ASPG quartile in which the fund's management fee rate ranked and the impact of the fund's performance adjustment, is also included in the chart and considered by the Board.
Annual Report
Fidelity Blue Chip Value Fund
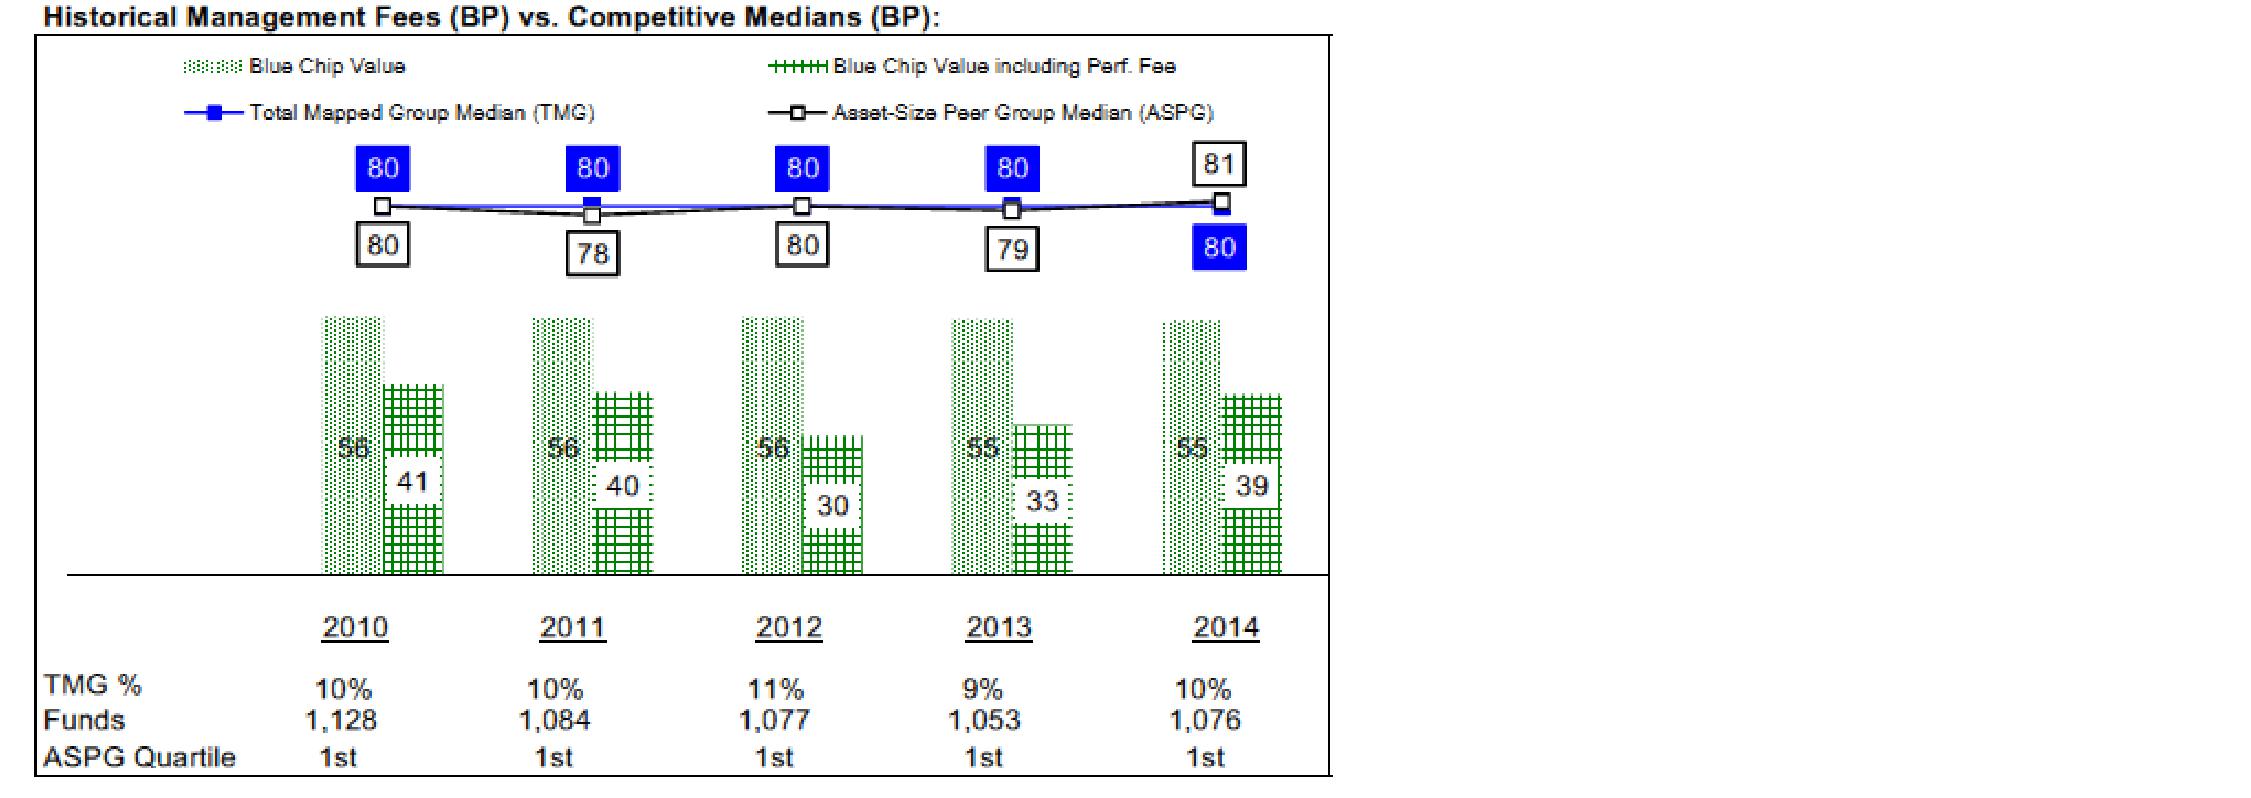
Annual Report
Board Approval of Investment Advisory Contracts and
Management Fees - continued
The Board noted that the fund's management fee rate ranked below the median of its Total Mapped Group and below the median of its ASPG for 2014. The Board also noted the effect of the fund's performance adjustment, if any, on the fund's management fee ranking.
The Board noted that, in 2014, the ad hoc Committee on Group Fee was formed by it and other Fidelity fund boards to conduct an in-depth review of the "group fee" component of the management fee of funds with such management fee structures. Committee focus included the mechanics of the group fee, the competitive landscape of group fee structures, Fidelity funds with no group fee component and investment products not included in group fee assets. The Board also considered that, for funds subject to the group fee, FMR agreed to voluntarily waive fees over a specified period of time in amounts designed to account for assets converted from certain funds to certain collective investment trusts.
The Board also noted that, in 2013, the ad hoc Committee on Management Fees was formed to conduct an in-depth review of the management fee rates of Fidelity's active equity mutual funds. The Committee focused on the following areas: (i) standard fee structures; (ii) research consumption and trading evolution; (iii) management fee competitiveness/profitability by category; and (iv) factors that drive institutional pricing.
Based on its review, the Board concluded that the fund's management fee is fair and reasonable in light of the services that the fund receives and the other factors considered.
Total Expense Ratio. In its review of the fund's total expense ratio, the Board considered the fund's management fee as well as other fund expenses, such as transfer agent fees, pricing and bookkeeping fees, and custodial, legal, and audit fees. The Board noted the impact of the fund's performance adjustment. The Board also noted that Fidelity may agree to waive fees and expenses from time to time, and the extent to which, if any, it has done so for the fund. As part of its review, the Board also considered the current and historical total expense ratios of the fund compared to competitive fund median expenses. The fund is compared to those funds and classes in the Total Mapped Group (used by the Board for management fee comparisons) that have a similar sales load structure.
The Board noted that the fund's total expense ratio ranked below its competitive median for 2014.
Fees Charged to Other Fidelity Clients. The Board also considered Fidelity fee structures and other information with respect to clients of Fidelity, such as other funds advised or subadvised by Fidelity, pension plan clients, and other institutional clients with similar mandates. The Board noted the findings of the 2013 ad hoc joint committee (created with the board of other Fidelity funds), which reviewed and compared Fidelity's institutional investment advisory business with its business of providing services to the Fidelity funds, including the differences in services provided, fees charged, and costs incurred, as well as competition in their respective marketplaces.
Annual Report
Based on its review of total expense ratios and fees charged to other Fidelity clients, the Board concluded that the fund's total expense ratio was reasonable in light of the services that the fund and its shareholders receive and the other factors considered.
Costs of the Services and Profitability. The Board considered the revenues earned and the expenses incurred by Fidelity in conducting the business of developing, marketing, distributing, managing, administering and servicing the fund and servicing the fund's shareholders. The Board also considered the level of Fidelity's profits in respect of all the Fidelity funds.
On an annual basis, Fidelity presents to the Board information about the profitability of its relationship with the fund. Fidelity calculates profitability information for each fund, as well as aggregate profitability information for groups of Fidelity funds and all Fidelity funds, using a series of detailed revenue and cost allocation methodologies which originate with the books and records of Fidelity on which Fidelity's audited financial statements are based. The Audit Committee of the Board reviews any significant changes from the prior year's methodologies.
PricewaterhouseCoopers LLP (PwC), independent registered public accounting firm and auditor to Fidelity and certain Fidelity funds, has been engaged annually by the Board as part of the Board's assessment of Fidelity's profitability analysis. PwC's engagement includes the review and assessment of the methodologies used by Fidelity in determining the revenues and expenses attributable to Fidelity's mutual fund business, and completion of agreed-upon procedures in respect of the mathematical accuracy of fund profitability and its conformity to established allocation methodologies. After considering PwC's reports issued under the engagement and information provided by Fidelity, the Board concluded that while other allocation methods may also be reasonable, Fidelity's profitability methodologies are reasonable in all material respects.
The Board also reviewed Fidelity's non-fund businesses and fall-out benefits related to the mutual fund business as well as cases where Fidelity's affiliates may benefit from or be related to the fund's business.
The Board considered the costs of the services provided by and the profits realized by Fidelity in connection with the operation of the fund and was satisfied that the profitability was not excessive.
Economies of Scale. The Board considered whether there have been economies of scale in respect of the management of the Fidelity funds, whether the Fidelity funds (including the fund) have appropriately benefited from any such economies of scale, and whether there is potential for realization of any further economies of scale. The Board considered the extent to which the fund will benefit from economies of scale as assets grow through increased services to the fund, through waivers or reimbursements, or through fee or expense ratio reductions. The Board also noted that in 2013, it and the boards of other Fidelity funds created an ad hoc committee (the Economies of Scale Committee) to analyze whether Fidelity attains economies of scale in respect of the management and servicing of the Fidelity funds, whether the Fidelity funds have appropriately benefited from such economies of scale, and whether there is potential for realization of any further economies of scale.
Annual Report
Board Approval of Investment Advisory Contracts and
Management Fees - continued
The Board recognized that the fund's management contract incorporates a "group fee" structure, which provides for lower group fee rates as total group assets increase, and for higher group fee rates as total group assets decrease (with "group assets" defined to include fund assets under FMR's management plus sector fund assets previously under FMR's management and currently managed by Fidelity SelectCo, LLC). FMR calculates the group fee rates based on a tiered asset "breakpoint" schedule that varies based on asset class. The Board considered that the group fee is designed to deliver the benefits of economies of scale to fund shareholders when total Fidelity fund assets increase, even if assets of any particular fund are unchanged or have declined, because some portion of Fidelity's costs are attributable to services provided to all Fidelity funds, and all funds benefit if those costs can be allocated among more assets. The Board concluded that, given the group fee structure, fund shareholders will benefit from lower management fees as group assets increase at the fund complex level, regardless of whether Fidelity achieves any such economies of scale.
The Board concluded, taking into account the analysis of the Economies of Scale Committee, that economies of scale, if any, are being appropriately shared between fund shareholders and Fidelity.
Additional Information Requested by the Board. In order to develop fully the factual basis for consideration of the Fidelity funds' Advisory Contracts, the Board requested and received additional information on certain topics, including: (i) fund performance trends and Fidelity's long-term strategies for certain funds; (ii) the various share classes employed by Fidelity and the attributes of each class, together with similar information on the distribution and servicing payments made by Fidelity or the funds to third-party participants in the distribution channels; (iii) fund profitability, and fund performance in relation to fund profitability; (iv) the methodology with respect to evaluating competitive fund data and peer group classifications and fee comparisons; (v) annual fund profitability margins, with particular focus on certain funds with negative margins; (vi) the realization of fall-out benefits in certain Fidelity business units; (vii) economies of scale and the way in which they are shared with fund shareholders; (viii) Fidelity's group fee structures, including the group fee schedule of breakpoints; (ix) the impact of cost containment measures on the funds; and (x) the transfer agent fee structure.
Annual Report
Based on its evaluation of all of the conclusions noted above, and after considering all factors it believed relevant, the Board concluded that the advisory fee structures are fair and reasonable, and that the fund's Advisory Contracts should be renewed.
Annual Report
Investment Adviser
Fidelity Management & Research Company
Boston, MA
Investment Sub-Advisers
FMR Co., Inc.
FMR Investment Management
(U.K.) Limited
Fidelity Management & Research
(Japan) Limited
Fidelity Management & Research
(Hong Kong) Limited
General Distributor
Fidelity Distributors Corporation
Smithfield, RI
Transfer and Service Agents
Fidelity Investments Institutional
Operations Company, Inc.
Boston, MA
Fidelity Service Company, Inc.
Boston, MA
Custodian
Brown Brothers Harriman & Co.
Boston, MA
The Fidelity Telephone Connection
Mutual Fund 24-Hour Service
Exchanges/Redemptions
and Account Assistance 1-800-544-6666
Product Information 1-800-544-6666
Retirement Accounts 1-800-544-4774
(8 a.m. - 9 p.m.)
TDD Service 1-800-544-0118
for the deaf and hearing impaired
(9 a.m. - 9 p.m. Eastern time)
Fidelity Automated Service
Telephone (FAST®)
1-800-544-5555

Automated line for quickest service
(Fidelity Investment logo)(registered trademark)
Corporate Headquarters
245 Summer St., Boston, MA 02210
www.fidelity.com
BCV-UANN-0915
1.789709.112
Fidelity®
Dividend Growth
Fund
Annual Report
July 31, 2015
(Fidelity Cover Art)
Contents
Performance | (Click Here) | How the fund has done over time. |
Management's Discussion of Fund Performance | (Click Here) | The Portfolio Manager's review of fund performance and strategy. |
Shareholder Expense Example | (Click Here) | An example of shareholder expenses. |
Investment Changes | (Click Here) | A summary of major shifts in the fund's investments over the past six months. |
Investments | (Click Here) | A complete list of the fund's investments with their market values. |
Financial Statements | (Click Here) | Statements of assets and liabilities, operations, and changes in net assets, as well as financial highlights. |
Notes | (Click Here) | Notes to the financial statements. |
Report of Independent Registered Public Accounting Firm | (Click Here) | |
Trustees and Officers | (Click Here) | |
Distributions | (Click Here) | |
Board Approval of Investment Advisory Contracts and Management Fees | (Click Here) | |
To view a fund's proxy voting guidelines and proxy voting record for the 12-month period ended June 30, visit http://www.fidelity.com/proxyvotingresults or visit the Securities and Exchange Commission's (SEC) web site at http://www.sec.gov. You may also call 1-800-544-8544 to request a free copy of the proxy voting guidelines.
Standard & Poor's, S&P and S&P 500 are registered service marks of The McGraw-Hill Companies, Inc. and have been licensed for use by Fidelity Distributors Corporation.
Other third-party marks appearing herein are the property of their respective owners.
All other marks appearing herein are registered or unregistered trademarks or service marks of FMR LLC or an affiliated company. © 2015 FMR LLC. All rights reserved.
Annual Report
This report and the financial statements contained herein are submitted for the general information of the shareholders of the fund. This report is not authorized for distribution to prospective investors in the fund unless preceded or accompanied by an effective prospectus.
A fund files its complete schedule of portfolio holdings with the SEC for the first and third quarters of each fiscal year on Form N-Q. Forms N-Q are available on the SEC's web site at http://www.sec.gov. A fund's Forms N-Q may be reviewed and copied at the SEC's Public Reference Room in Washington, DC. Information regarding the operation of the SEC's Public Reference Room may be obtained by calling 1-800-SEC-0330. For a complete list of a fund's portfolio holdings, view the most recent holdings listing, semiannual report, or annual report on Fidelity's web site at http://www.fidelity.com, http://www.advisor.fidelity.com, or http://www.401k.com, as applicable.
NOT FDIC INSURED • MAY LOSE VALUE • NO BANK GUARANTEE
Neither the fund nor Fidelity Distributors Corporation is a bank.
Annual Report
Average annual total return reflects the change in the value of an investment, assuming reinvestment of the class' distributions from dividend income and capital gains (the profits earned upon the sale of securities that have grown in value, if any) and assuming a constant rate of performance each year. The $10,000 table and the fund's returns do not reflect the deduction of taxes that a shareholder would pay on fund distributions or the redemption of fund shares. During periods of reimbursement by Fidelity, a fund's total return will be greater than it would be had the reimbursement not occurred. How a fund did yesterday is no guarantee of how it will do tomorrow.
Average Annual Total Returns
Periods ended July 31, 2015 | Past 1
year | Past 5
years | Past 10
years |
Fidelity® Dividend Growth Fund | 9.54% | 14.68% | 7.39% |
$10,000 Over 10 Years
Let's say hypothetically that $10,000 was invested in Fidelity® Dividend Growth Fund, a class of the fund, on July 31, 2005. The chart shows how the value of your investment would have changed, and also shows how the S&P 500® Index performed over the same period.
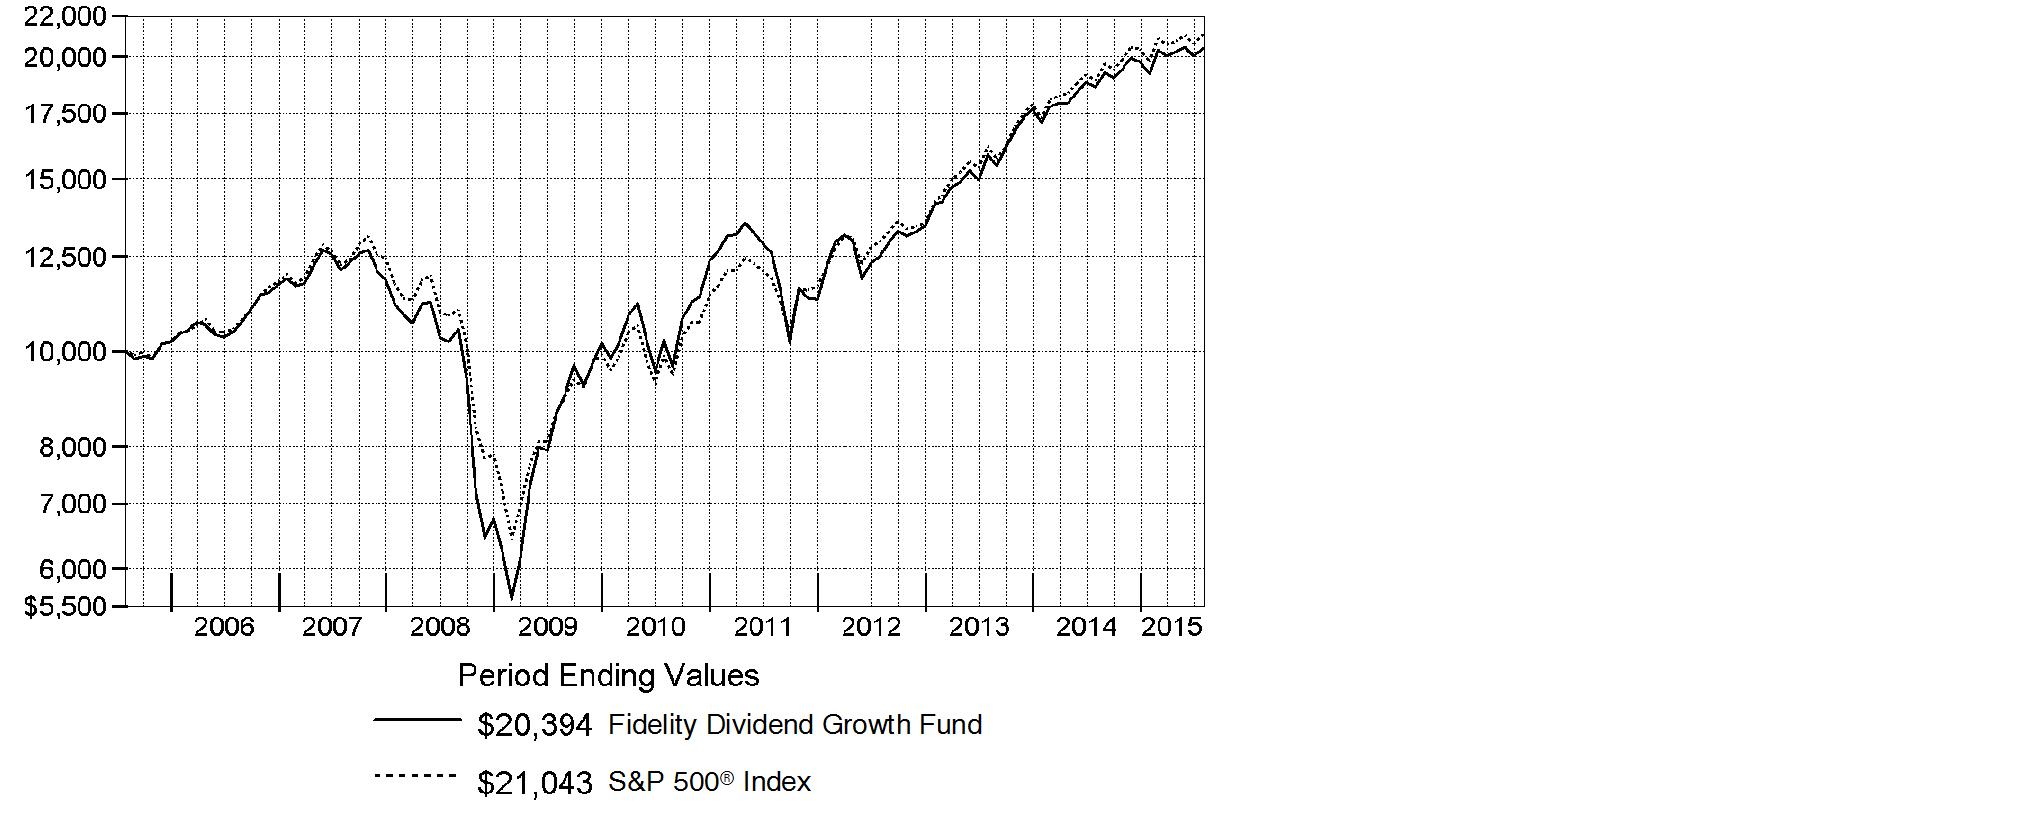
Annual Report
Market Recap: The U.S. equity market gained strongly for the 12 months ending July 31, 2015, as stocks recovered from volatility in late 2014 and early 2015, supported by a still-positive economic backdrop. The S&P 500® Index returned 11.21%, with growth stocks in the index far outpacing value-oriented names on prospects for continued U.S. economic growth. Consequently, the growth-oriented Nasdaq Composite Index® rose 18.71%, outpacing the broader S&P 500®, as well as the 12.03% advance of the smaller-cap Russell 2000® Index. Within the S&P 500®, seven of 10 sectors notched a gain, with significant performance variation. Health care (+27%) led the way, aided by merger activity. Consumer discretionary (+24%) benefited from spending linked to a seven-year low in unemployment. Strong first halves for the consumer staples sector and the real estate segment of financials yielded above-market returns (19% and 12%, respectively) for the full-year period. Conversely, energy (-26%) significantly lagged, due to a roughly 55% decline for U.S. crude-oil prices. Materials (-4%) also lost ground. At period end, investors remained focused on the slowing rate of U.S. earnings growth, the possible effect of a relatively stronger U.S. dollar on exports and inflation, and whether an economic slowdown in China would create ripples for the global economy.
Comments from Portfolio Manager Ramona Persaud: For the year, the fund's share classes underperformed the benchmark S&P 500®. (For specific class-level results, please see the Performance section of this report.) Versus the benchmark, stock picking in materials and information technology hurt performance, as did positioning in consumer discretionary and the fund's cash position, the latter of which detracted in an up market. While both security selection and an underweighting in the lagging energy sector were relative contributors overall, an overweighting in integrated-oil giant Chevron, one of the fund's largest holdings, proved the fund's largest individual detractor. Its shares suffered along with the entire sector as energy prices collapsed. Overall, the fund's foreign investments were a plus versus the benchmark, despite the continued rise of the U.S. dollar. Included was a non-benchmark stake in European telecom and media company Altice, the fund's top individual contributor. Shares of Luxembourg-based Altice rose on news of acquisitions in Portugal and France.
The views expressed above reflect those of the portfolio manager(s) only through the end of the period as stated on the cover of this report and do not necessarily represent the views of Fidelity or any other person in the Fidelity organization. Any such views are subject to change at any time based upon market or other conditions and Fidelity disclaims any responsibility to update such views. These views may not be relied on as investment advice and, because investment decisions for a Fidelity fund are based on numerous factors, may not be relied on as an indication of trading intent on behalf of any Fidelity fund.
Annual Report
Shareholder Expense Example
As a shareholder of the Fund, you incur two types of costs: (1) transaction costs, and (2) ongoing costs, including management fees and other Fund expenses. This Example is intended to help you understand your ongoing costs (in dollars) of investing in the Fund and to compare these costs with the ongoing costs of investing in other mutual funds.
The Example is based on an investment of $1,000 invested at the beginning of the period and held for the entire period (February 1, 2015 to July 31, 2015).
Actual Expenses
The first line of the accompanying table for each class of the Fund provides information about actual account values and actual expenses. You may use the information in this line, together with the amount you invested, to estimate the expenses that you paid over the period. Simply divide your account value by $1,000.00 (for example, an $8,600 account value divided by $1,000.00 = 8.6), then multiply the result by the number in the first line for a class of the Fund under the heading entitled "Expenses Paid During Period" to estimate the expenses you paid on your account during this period. A small balance maintenance fee of $12.00 that is charged once a year may apply for certain accounts with a value of less than $2,000. This fee is not included in the table below. If it was, the estimate of expenses you paid during the period would be higher, and your ending account value lower, by this amount. In addition, the Fund, as a shareholder in the underlying Fidelity Central Funds, will indirectly bear its pro-rata share of the fees and expenses incurred by the underlying Fidelity Central Funds. These fees and expenses are not included in the Fund's annualized expense ratio used to calculate the expense estimate in the table below.
Hypothetical Example for Comparison Purposes
The second line of the accompanying table for each class of the Fund provides information about hypothetical account values and hypothetical expenses based on a Class' actual expense ratio and an assumed rate of return of 5% per year before expenses, which is not the Class' actual return. The hypothetical account values and expenses may not be used to estimate the actual ending account balance or expenses you paid for the period. You may use this information to compare the ongoing costs of investing in the Fund and other funds. To do so, compare this 5% hypothetical example with the 5% hypothetical examples that appear in the shareholder reports of the other funds. A small balance maintenance fee of $12.00 that is charged once a year may apply for certain accounts with a value of less than $2,000. This fee is not included in the table below. If it was, the estimate of expenses you paid during the period would be higher, and your ending account value lower, by this amount. In addition, the Fund, as a shareholder in the underlying Fidelity Central Funds, will indirectly bear its pro-rata share of the fees and expenses incurred by the underlying Fidelity Central Funds. These fees and expenses are not included in the Fund's annualized expense ratio used to calculate the expense estimate in the table below.
Please note that the expenses shown in the table are meant to highlight your ongoing costs only and do not reflect any transaction costs. Therefore, the second line of the table is useful in comparing ongoing costs only, and will not help you determine the relative total costs of owning different funds.
Annual Report
Shareholder Expense Example - continued
| Annualized
Expense RatioB | Beginning
Account Value
February 1, 2015 | Ending
Account Value
July 31, 2015 | Expenses Paid
During Period*
February 1, 2015
to July 31, 2015 |
Dividend Growth | .69% | | | |
Actual | | $ 1,000.00 | $ 1,063.30 | $ 3.53 |
HypotheticalA | | $ 1,000.00 | $ 1,021.37 | $ 3.46 |
Class K | .58% | | | |
Actual | | $ 1,000.00 | $ 1,063.90 | $ 2.97 |
HypotheticalA | | $ 1,000.00 | $ 1,021.92 | $ 2.91 |
A 5% return per year before expenses
B Annualized expense ratio reflects expenses net of applicable fee waivers.
* Expenses are equal to each Class' annualized expense ratio, multiplied by the average account value over the period, multiplied by 181/365 (to reflect the one-half year period).
Annual Report
Investment Changes (Unaudited)
Top Ten Stocks as of July 31, 2015 |
| % of fund's
net assets | % of fund's net assets
6 months ago |
Apple, Inc. | 4.7 | 4.4 |
JPMorgan Chase & Co. | 2.9 | 1.8 |
General Electric Co. | 2.6 | 1.8 |
Johnson & Johnson | 2.6 | 2.4 |
Wells Fargo & Co. | 2.5 | 2.1 |
Google, Inc. Class C | 2.5 | 2.3 |
Microsoft Corp. | 2.5 | 2.6 |
Exxon Mobil Corp. | 2.3 | 1.9 |
CVS Health Corp. | 2.3 | 1.4 |
Medtronic PLC | 2.0 | 2.0 |
| 26.9 | |
Top Five Market Sectors as of July 31, 2015 |
| % of fund's
net assets | % of fund's net assets
6 months ago |
Information Technology | 23.3 | 21.5 |
Financials | 17.3 | 14.0 |
Health Care | 15.2 | 17.0 |
Consumer Staples | 12.0 | 11.7 |
Industrials | 9.6 | 7.7 |
Asset Allocation (% of fund's net assets) |
As of July 31, 2015 * | As of January 31, 2015 ** |
 | Stocks 97.5% | |  | Stocks 97.2% | |
 | Convertible
Securities 0.1% | |  | Convertible
Securities 0.1% | |
 | Short-Term
Investments and
Net Other Assets (Liabilities) 2.4% | |  | Short-Term
Investments and
Net Other Assets (Liabilities) 2.7% | |
* Foreign investments | 15.5% | | ** Foreign investments | 17.0% | |

Annual Report
Investments July 31, 2015
Showing Percentage of Net Assets
Common Stocks - 97.5% |
| Shares | | Value (000s) |
CONSUMER DISCRETIONARY - 9.2% |
Diversified Consumer Services - 0.6% |
H&R Block, Inc. | 1,512,420 | | $ 50,348 |
Hotels, Restaurants & Leisure - 1.1% |
Las Vegas Sands Corp. | 390,400 | | 21,878 |
Wyndham Worldwide Corp. | 831,491 | | 68,615 |
| | 90,493 |
Leisure Products - 0.3% |
Vista Outdoor, Inc. (a) | 438,400 | | 20,679 |
Media - 2.6% |
Altice SA (a) | 506,500 | | 63,970 |
Comcast Corp. Class A | 2,482,696 | | 154,945 |
| | 218,915 |
Multiline Retail - 1.9% |
Dillard's, Inc. Class A | 559,900 | | 57,043 |
Target Corp. | 1,298,600 | | 106,290 |
| | 163,333 |
Specialty Retail - 1.9% |
AutoZone, Inc. (a) | 109,500 | | 76,753 |
Foot Locker, Inc. | 1,229,479 | | 86,740 |
| | 163,493 |
Textiles, Apparel & Luxury Goods - 0.8% |
Fossil Group, Inc. (a) | 316,000 | | 21,725 |
VF Corp. | 583,100 | | 44,951 |
| | 66,676 |
TOTAL CONSUMER DISCRETIONARY | | 773,937 |
CONSUMER STAPLES - 12.0% |
Beverages - 3.7% |
Constellation Brands, Inc. Class A (sub. vtg.) | 438,200 | | 52,593 |
Dr. Pepper Snapple Group, Inc. | 482,108 | | 38,675 |
PepsiCo, Inc. | 1,008,100 | | 97,130 |
The Coca-Cola Co. | 2,936,038 | | 120,612 |
| | 309,010 |
Food & Staples Retailing - 4.2% |
CVS Health Corp. | 1,676,300 | | 188,533 |
Kroger Co. | 933,418 | | 36,627 |
Common Stocks - continued |
| Shares | | Value (000s) |
CONSUMER STAPLES - continued |
Food & Staples Retailing - continued |
Rami Levi Chain Stores Hashikma Marketing 2006 Ltd. | 489,201 | | $ 23,325 |
Walgreens Boots Alliance, Inc. | 1,077,636 | | 104,132 |
| | 352,617 |
Food Products - 0.5% |
Greencore Group PLC | 6,474,677 | | 31,992 |
Hilton Food Group PLC | 1,939,205 | | 13,340 |
| | 45,332 |
Household Products - 1.8% |
Energizer Holdings, Inc. | 154,300 | | 5,942 |
Procter & Gamble Co. | 1,912,600 | | 146,696 |
| | 152,638 |
Personal Products - 0.2% |
Edgewell Personal Care Co. (a) | 154,300 | | 14,768 |
Tobacco - 1.6% |
British American Tobacco PLC (United Kingdom) | 541,303 | | 32,140 |
Imperial Tobacco Group PLC | 822,622 | | 43,228 |
Japan Tobacco, Inc. | 1,532,800 | | 59,532 |
| | 134,900 |
TOTAL CONSUMER STAPLES | | 1,009,265 |
ENERGY - 7.2% |
Energy Equipment & Services - 0.0% |
Aspen Aerogels, Inc. (a) | 587,999 | | 3,875 |
Oil, Gas & Consumable Fuels - 7.2% |
Chevron Corp. | 1,827,300 | | 161,680 |
Columbia Pipeline Group, Inc. | 1,146,600 | | 33,458 |
Emerald Oil, Inc. warrants 2/4/16 (a) | 8,559 | | 0 |
EQT Midstream Partners LP | 248,000 | | 19,537 |
Exxon Mobil Corp. | 2,424,497 | | 192,044 |
Imperial Oil Ltd. | 816,200 | | 30,199 |
Kinder Morgan, Inc. | 2,231,100 | | 77,285 |
Northern Oil & Gas, Inc. (a) | 1,037,290 | | 4,938 |
PrairieSky Royalty Ltd. (d) | 971,100 | | 19,937 |
Suncor Energy, Inc. | 2,306,200 | | 64,962 |
| | 604,040 |
TOTAL ENERGY | | 607,915 |
Common Stocks - continued |
| Shares | | Value (000s) |
FINANCIALS - 17.3% |
Banks - 11.5% |
Bank of America Corp. | 8,043,817 | | $ 143,823 |
Citigroup, Inc. | 2,279,961 | | 133,287 |
JPMorgan Chase & Co. | 3,539,635 | | 242,571 |
PacWest Bancorp | 1,236,200 | | 57,224 |
SunTrust Banks, Inc. | 1,316,300 | | 58,365 |
U.S. Bancorp | 2,678,069 | | 121,075 |
Wells Fargo & Co. | 3,613,193 | | 209,095 |
| | 965,440 |
Capital Markets - 1.8% |
Ameriprise Financial, Inc. | 485,600 | | 61,025 |
Diamond Hill Investment Group, Inc. | 47,038 | | 9,054 |
Franklin Resources, Inc. | 437,400 | | 19,924 |
The Blackstone Group LP | 1,646,084 | | 64,609 |
| | 154,612 |
Consumer Finance - 1.1% |
Capital One Financial Corp. | 1,193,567 | | 97,037 |
Imperial Holdings, Inc. warrants 4/11/19 | 48,012 | | 10 |
| | 97,047 |
Diversified Financial Services - 1.2% |
McGraw Hill Financial, Inc. | 965,827 | | 98,273 |
Insurance - 1.1% |
MetLife, Inc. | 884,100 | | 49,280 |
The Chubb Corp. | 322,800 | | 40,134 |
| | 89,414 |
Real Estate Investment Trusts - 0.6% |
American Tower Corp. | 519,100 | | 49,372 |
TOTAL FINANCIALS | | 1,454,158 |
HEALTH CARE - 15.2% |
Biotechnology - 1.3% |
Amgen, Inc. | 612,410 | | 108,145 |
Health Care Equipment & Supplies - 2.8% |
Medtronic PLC | 2,130,103 | | 166,979 |
The Cooper Companies, Inc. | 358,484 | | 63,452 |
| | 230,431 |
Common Stocks - continued |
| Shares | | Value (000s) |
HEALTH CARE - continued |
Health Care Providers & Services - 1.8% |
Cardinal Health, Inc. | 789,503 | | $ 67,092 |
McKesson Corp. | 396,058 | | 87,359 |
| | 154,451 |
Health Care Technology - 0.2% |
CompuGroup Medical AG | 535,522 | | 16,912 |
Pharmaceuticals - 9.1% |
AbbVie, Inc. | 1,437,300 | | 100,625 |
Allergan PLC (a) | 361,900 | | 119,843 |
Astellas Pharma, Inc. | 2,833,000 | | 42,677 |
Johnson & Johnson | 2,165,943 | | 217,049 |
Sanofi SA sponsored ADR | 1,269,900 | | 68,562 |
Shire PLC | 1,026,500 | | 91,252 |
Teva Pharmaceutical Industries Ltd. sponsored ADR | 1,843,900 | | 127,266 |
| | 767,274 |
TOTAL HEALTH CARE | | 1,277,213 |
INDUSTRIALS - 9.6% |
Aerospace & Defense - 2.5% |
The Boeing Co. | 872,900 | | 125,846 |
United Technologies Corp. | 871,766 | | 87,447 |
| | 213,293 |
Air Freight & Logistics - 0.8% |
FedEx Corp. | 371,952 | | 63,760 |
Construction & Engineering - 0.1% |
Astaldi SpA | 658,500 | | 6,335 |
Electrical Equipment - 0.7% |
BWX Technologies, Inc. | 2,487,600 | | 61,095 |
Industrial Conglomerates - 4.4% |
Danaher Corp. | 986,292 | | 90,305 |
General Electric Co. | 8,575,500 | | 223,821 |
Roper Industries, Inc. | 336,044 | | 56,210 |
| | 370,336 |
Machinery - 0.8% |
Deere & Co. | 725,300 | | 68,592 |
Road & Rail - 0.3% |
CSX Corp. | 829,700 | | 25,953 |
TOTAL INDUSTRIALS | | 809,364 |
Common Stocks - continued |
| Shares | | Value (000s) |
INFORMATION TECHNOLOGY - 23.3% |
Communications Equipment - 3.2% |
Cisco Systems, Inc. | 4,609,986 | | $ 131,016 |
QUALCOMM, Inc. | 2,161,983 | | 139,210 |
| | 270,226 |
Electronic Equipment & Components - 0.9% |
TE Connectivity Ltd. | 1,178,294 | | 71,782 |
Internet Software & Services - 2.5% |
Google, Inc. Class C | 333,206 | | 208,457 |
IT Services - 3.7% |
ASAC II LP (a)(e) | 2,514,134 | | 43,673 |
Fidelity National Information Services, Inc. | 1,007,950 | | 65,950 |
IBM Corp. | 771,800 | | 125,024 |
Leidos Holdings, Inc. | 421,100 | | 17,181 |
Science Applications International Corp. | 241,500 | | 12,964 |
Total System Services, Inc. | 1,059,500 | | 48,970 |
| | 313,762 |
Software - 5.4% |
Activision Blizzard, Inc. | 1,709,717 | | 44,094 |
Micro Focus International PLC | 1,907,363 | | 41,641 |
Microsoft Corp. | 4,447,716 | | 207,708 |
Oracle Corp. | 4,072,160 | | 162,642 |
| | 456,085 |
Technology Hardware, Storage & Peripherals - 7.6% |
Apple, Inc. | 3,236,218 | | 392,557 |
EMC Corp. | 4,270,300 | | 114,828 |
Hewlett-Packard Co. | 2,616,800 | | 79,865 |
Samsung Electronics Co. Ltd. | 19,759 | | 20,080 |
Western Digital Corp. | 369,400 | | 31,791 |
| | 639,121 |
TOTAL INFORMATION TECHNOLOGY | | 1,959,433 |
MATERIALS - 2.8% |
Chemicals - 2.5% |
CF Industries Holdings, Inc. | 1,266,900 | | 75,000 |
LyondellBasell Industries NV Class A | 603,500 | | 56,626 |
Monsanto Co. | 415,700 | | 42,356 |
Potash Corp. of Saskatchewan, Inc. | 1,412,000 | | 38,413 |
| | 212,395 |
Common Stocks - continued |
| Shares | | Value (000s) |
MATERIALS - continued |
Containers & Packaging - 0.3% |
Ball Corp. | 360,100 | | $ 24,429 |
TOTAL MATERIALS | | 236,824 |
TELECOMMUNICATION SERVICES - 0.9% |
Diversified Telecommunication Services - 0.3% |
AT&T, Inc. | 885,500 | | 30,762 |
Wireless Telecommunication Services - 0.6% |
Vodafone Group PLC sponsored ADR | 1,303,400 | | 49,242 |
TOTAL TELECOMMUNICATION SERVICES | | 80,004 |
TOTAL COMMON STOCKS (Cost $6,728,369) | 8,208,113 |
Convertible Bonds - 0.1% |
| Principal Amount (000s) | | |
ENERGY - 0.1% |
Oil, Gas & Consumable Fuels - 0.1% |
Amyris, Inc. 3% 2/27/17 (Cost $7,356) | | $ 7,356 | | 6,527 |
Money Market Funds - 2.9% |
| Shares | | |
Fidelity Cash Central Fund, 0.17% (b) | 224,911,560 | | 224,912 |
Fidelity Securities Lending Cash Central Fund, 0.18% (b)(c) | 21,483,522 | | 21,484 |
TOTAL MONEY MARKET FUNDS (Cost $246,396) | 246,396 |
TOTAL INVESTMENT PORTFOLIO - 100.5% (Cost $6,982,121) | | 8,461,036 |
NET OTHER ASSETS (LIABILITIES) - (0.5)% | | (44,651) |
NET ASSETS - 100% | $ 8,416,385 |
Legend |
(a) Non-income producing |
(b) Affiliated fund that is generally available only to investment companies and other accounts managed by Fidelity Investments. The rate quoted is the annualized seven-day yield of the fund at period end. A complete unaudited listing of the fund's holdings as of its most recent quarter end is available upon request. In addition, each Fidelity Central Fund's financial statements, which are not covered by the Fund's Report of Independent Registered Public Accounting Firm, are available on the SEC's website or upon request. |
(c) Investment made with cash collateral received from securities on loan. |
(d) Security or a portion of the security is on loan at period end. |
(e) Restricted securities - Investment in securities not registered under the Securities Act of 1933 (excluding 144A issues). At the end of the period, the value of restricted securities (excluding 144A issues) amounted to $43,673,000 or 0.5% of net assets. |
Additional information on each restricted holding is as follows: |
Security | Acquisition Date | Acquisition Cost (000s) |
ASAC II LP | 10/10/13 | $ 25,141 |
Affiliated Central Funds |
Information regarding fiscal year to date income earned by the Fund from investments in Fidelity Central Funds is as follows: |
Fund | Income earned
(Amounts in
thousands) |
Fidelity Cash Central Fund | $ 323 |
Fidelity Securities Lending Cash Central Fund | 593 |
Total | $ 916 |
Other Affiliated Issuers |
An affiliated company is a company in which the Fund has ownership of at least 5% of the voting securities. Fiscal year to date transactions with companies which are or were affiliates are as follows: |
Affiliate
(Amounts in
thousands) | Value, beginning of period | Purchases | Sales Proceeds | Dividend Income | Value,
end of
period |
TAG Oil Ltd. | $ 7,147 | $ - | $ 4,852 | $ - | $ - |
TAG Oil Ltd. (144A) | 337 | - | 195 | - | - |
Total | $ 7,484 | $ - | $ 5,047 | $ - | $ - |
Other Information |
The following is a summary of the inputs used, as of July 31, 2015, involving the Fund's assets and liabilities carried at fair value. The inputs or methodology used for valuing securities may not be an indication of the risk associated with investing in those securities. For more information on valuation inputs, and their aggregation into the levels used in the table below, please refer to the Investment Valuation section in the accompanying Notes to Financial Statements. |
Valuation Inputs at Reporting Date: |
Description
(Amounts in thousands) | Total | Level 1 | Level 2 | Level 3 |
Investments in Securities: | | | | |
Equities: | | | | |
Consumer Discretionary | $ 773,937 | $ 773,937 | $ - | $ - |
Consumer Staples | 1,009,265 | 977,125 | 32,140 | - |
Energy | 607,915 | 607,915 | - | - |
Financials | 1,454,158 | 1,454,148 | 10 | - |
Health Care | 1,277,213 | 1,185,961 | 91,252 | - |
Industrials | 809,364 | 809,364 | - | - |
Information Technology | 1,959,433 | 1,915,760 | - | 43,673 |
Materials | 236,824 | 236,824 | - | - |
Telecommunication Services | 80,004 | 80,004 | - | - |
Corporate Bonds | 6,527 | - | 6,527 | - |
Money Market Funds | 246,396 | 246,396 | - | - |
Total Investments in Securities: | $ 8,461,036 | $ 8,287,434 | $ 129,929 | $ 43,673 |
The following is a summary of transfers between Level 1 and Level 2 for the period ended July 31, 2015. Transfers are assumed to have occurred at the beginning of the period, and are primarily attributable to the valuation techniques used for foreign equity securities, as discussed in the accompanying Notes to Financial Statements: |
Transfers | Total (000s) |
Level 1 to Level 2 | $ 0 |
Level 2 to Level 1 | $ 113,833 |
Distribution of investments by country or territory of incorporation, as a percentage of total net assets, is as follows (Unaudited): |
United States of America | 84.5% |
Ireland | 3.8% |
United Kingdom | 2.1% |
Canada | 1.8% |
Israel | 1.8% |
Japan | 1.2% |
Bailiwick of Jersey | 1.1% |
Others (Individually Less Than 1%) | 3.7% |
| 100.0% |
See accompanying notes which are an integral part of the financial statements.
Annual Report
Statement of Assets and Liabilities
Amounts in thousands (except per-share amounts) | | July 31, 2015 |
| | |
Assets | | |
Investment in securities, at value (including securities loaned of $20,025) - See accompanying schedule: Unaffiliated issuers (cost $6,735,725) | $ 8,214,640 | |
Fidelity Central Funds (cost $246,396) | 246,396 | |
Total Investments (cost $6,982,121) | | $ 8,461,036 |
Cash | | 49 |
Foreign currency held at value (cost $443) | | 442 |
Receivable for investments sold | | 7,919 |
Receivable for fund shares sold | | 2,792 |
Dividends receivable | | 8,793 |
Interest receivable | | 94 |
Distributions receivable from Fidelity Central Funds | | 73 |
Other receivables | | 524 |
Total assets | | 8,481,722 |
| | |
Liabilities | | |
Payable for investments purchased | $ 30,929 | |
Payable for fund shares redeemed | 7,364 | |
Accrued management fee | 3,908 | |
Other affiliated payables | 1,062 | |
Other payables and accrued expenses | 590 | |
Collateral on securities loaned, at value | 21,484 | |
Total liabilities | | 65,337 |
| | |
Net Assets | | $ 8,416,385 |
Net Assets consist of: | | |
Paid in capital | | $ 6,351,250 |
Undistributed net investment income | | 65,329 |
Accumulated undistributed net realized gain (loss) on investments and foreign currency transactions | | 520,911 |
Net unrealized appreciation (depreciation) on investments and assets and liabilities in foreign currencies | | 1,478,895 |
Net Assets | | $ 8,416,385 |
See accompanying notes which are an integral part of the financial statements.
Annual Report
Statement of Assets and Liabilities - continued
Amounts in thousands (except per-share amounts) | | July 31, 2015 |
| | |
Dividend Growth:
Net Asset Value, offering price and redemption price per share ($6,474,163 ÷ 187,859 shares) | | $ 34.46 |
| | |
Class K:
Net Asset Value, offering price and redemption price per share ($1,942,222 ÷ 56,374 shares) | | $ 34.45 |
See accompanying notes which are an integral part of the financial statements.
Annual Report
Financial Statements - continued
Statement of Operations
Amounts in thousands | Year ended July 31, 2015 |
| | |
Investment Income | | |
Dividends | | $ 181,071 |
Interest | | 221 |
Income from Fidelity Central Funds | | 916 |
Total income | | 182,208 |
| | |
Expenses | | |
Management fee | | |
Basic fee | $ 47,458 | |
Performance adjustment | (4,090) | |
Transfer agent fees | 11,763 | |
Accounting and security lending fees | 1,243 | |
Custodian fees and expenses | 165 | |
Independent trustees' compensation | 38 | |
Registration fees | 72 | |
Audit | 84 | |
Legal | 33 | |
Miscellaneous | 59 | |
Total expenses before reductions | 56,825 | |
Expense reductions | (391) | 56,434 |
Net investment income (loss) | | 125,774 |
Realized and Unrealized Gain (Loss) Net realized gain (loss) on: | | |
Investment securities: | | |
Unaffiliated issuers | 780,232 | |
Other affiliated issuers | (12,370) | |
Foreign currency transactions | 6 | |
Futures contracts | 61 | |
Total net realized gain (loss) | | 767,929 |
Change in net unrealized appreciation (depreciation) on: Investment securities | (102,141) | |
Assets and liabilities in foreign currencies | 5 | |
Futures contracts | (38) | |
Total change in net unrealized appreciation (depreciation) | | (102,174) |
Net gain (loss) | | 665,755 |
Net increase (decrease) in net assets resulting from operations | | $ 791,529 |
See accompanying notes which are an integral part of the financial statements.
Annual Report
Statement of Changes in Net Assets
Amounts in thousands | Year ended
July 31,
2015 | Year ended
July 31,
2014 |
Increase (Decrease) in Net Assets | | |
Operations | | |
Net investment income (loss) | $ 125,774 | $ 135,648 |
Net realized gain (loss) | 767,929 | 1,400,831 |
Change in net unrealized appreciation (depreciation) | (102,174) | (186,688) |
Net increase (decrease) in net assets resulting from operations | 791,529 | 1,349,791 |
Distributions to shareholders from net investment income | (124,133) | (90,956) |
Distributions to shareholders from net realized gain | (1,267,766) | (759,327) |
Total distributions | (1,391,899) | (850,283) |
Share transactions - net increase (decrease) | 479,167 | (233,820) |
Total increase (decrease) in net assets | (121,203) | 265,688 |
| | |
Net Assets | | |
Beginning of period | 8,537,588 | 8,271,900 |
End of period (including undistributed net investment income of $65,329 and undistributed net investment income of $74,179, respectively) | $ 8,416,385 | $ 8,537,588 |
See accompanying notes which are an integral part of the financial statements.
Annual Report
Financial Highlights - Dividend Growth
Years ended July 31, | 2015 | 2014 | 2013 | 2012 | 2011 |
Selected Per-Share Data | | | | | |
Net asset value, beginning of period | $ 37.27 | $ 35.33 | $ 28.61 | $ 28.96 | $ 23.84 |
Income from Investment Operations | | | | | |
Net investment income (loss)B | .49 | .56 | .40 | .20 | .12 |
Net realized and unrealized gain (loss) | 2.71 | 4.98 | 7.12 | (.41) | 5.23 |
Total from investment operations | 3.20 | 5.54 | 7.52 | (.21) | 5.35 |
Distributions from net investment income | (.51) | (.37) | (.30) | (.12) | (.15) |
Distributions from net realized gain | (5.49) | (3.23) | (.50) | (.02) | (.08) |
Total distributions | (6.01) G | (3.60) | (.80) | (.14) | (.23) |
Net asset value, end of period | $ 34.46 | $ 37.27 | $ 35.33 | $ 28.61 | $ 28.96 |
Total Return A | 9.54% | 17.30% | 26.83% | (.67)% | 22.57% |
Ratios to Average Net AssetsC, E | | | | | |
Expenses before reductions | .69% | .56% | .63% | .91% | .93% |
Expenses net of fee waivers, if any | .68% | .56% | .63% | .91% | .93% |
Expenses net of all reductions | .68% | .56% | .62% | .91% | .93% |
Net investment income (loss) | 1.43% | 1.58% | 1.26% | .75% | .44% |
Supplemental Data | | | | | |
Net assets, end of period (in millions) | $ 6,474 | $ 6,481 | $ 6,633 | $ 5,905 | $ 9,309 |
Portfolio turnover rate D | 64% | 99% | 69% | 63% F | 67% |
A Total returns would have been lower if certain expenses had not been reduced during the applicable periods shown.
B Calculated based on average shares outstanding during the period.
C Fees and expenses of any underlying Fidelity Central Funds are not included in the Fund's expense ratio. The Fund indirectly bears its proportionate share of the expenses of any underlying Fidelity Central Funds.
D Amount does not include the portfolio activity of any underlying Fidelity Central Funds.
E Expense ratios reflect operating expenses of the class. Expenses before reductions do not reflect amounts reimbursed by the investment adviser or reductions from brokerage service arrangements or reductions from other expense offset arrangements and do not represent the amount paid by the class during periods when reimbursements or reductions occur. Expenses net of fee waivers reflect expenses after reimbursement by the investment adviser but prior to reductions from brokerage service arrangements or other expense offset arrangements. Expenses net of all reductions represent the net expenses paid by the class.
F Portfolio turnover rate excludes securities received or delivered in-kind.
G Total distributions of $6.01 per share is comprised of distributions from net investment income of $.512 and distributions from net realized gain of $5.493 per share.
See accompanying notes which are an integral part of the financial statements.
Annual Report
Financial Highlights - Class K
Years ended July 31, | 2015 | 2014 | 2013 | 2012 | 2011 |
Selected Per-Share Data | | | | | |
Net asset value, beginning of period | $ 37.27 | $ 35.34 | $ 28.62 | $ 28.98 | $ 23.86 |
Income from Investment Operations | | | | | |
Net investment income (loss)B | .53 | .60 | .45 | .25 | .17 |
Net realized and unrealized gain (loss) | 2.70 | 4.97 | 7.12 | (.43) | 5.22 |
Total from investment operations | 3.23 | 5.57 | 7.57 | (.18) | 5.39 |
Distributions from net investment income | (.56) | (.42) | (.35) | (.17) | (.20) |
Distributions from net realized gain | (5.49) | (3.23) | (.50) | (.02) | (.08) |
Total distributions | (6.05) | (3.64) I | (.85) | (.18) H | (.27) G |
Net asset value, end of period | $ 34.45 | $ 37.27 | $ 35.34 | $ 28.62 | $ 28.98 |
Total Return A | 9.65% | 17.44% | 27.04% | (.52)% | 22.79% |
Ratios to Average Net AssetsC, E | | | | | |
Expenses before reductions | .57% | .44% | .48% | .75% | .78% |
Expenses net of fee waivers, if any | .57% | .43% | .48% | .75% | .78% |
Expenses net of all reductions | .57% | .43% | .47% | .75% | .77% |
Net investment income (loss) | 1.54% | 1.70% | 1.41% | .91% | .60% |
Supplemental Data | | | | | |
Net assets, end of period (in millions) | $ 1,942 | $ 2,057 | $ 1,639 | $ 1,221 | $ 634 |
Portfolio turnover rate D | 64% | 99% | 69% | 63% F | 67% |
A Total returns would have been lower if certain expenses had not been reduced during the applicable periods shown.
B Calculated based on average shares outstanding during the period.
C Fees and expenses of any underlying Fidelity Central Funds are not included in the Fund's expense ratio. The Fund indirectly bears its proportionate share of the expenses of any underlying Fidelity Central Funds.
D Amount does not include the portfolio activity of any underlying Fidelity Central Funds.
E Expense ratios reflect operating expenses of the class. Expenses before reductions do not reflect amounts reimbursed by the investment adviser or reductions from brokerage service arrangements or reductions from other expense offset arrangements and do not represent the amount paid by the class during periods when reimbursements or reductions occur. Expenses net of fee waivers reflect expenses after reimbursement by the investment adviser but prior to reductions from brokerage service arrangements or other expense offset arrangements. Expenses net of all reductions represent the net expenses paid by the class.
F Portfolio turnover rate excludes securities received or delivered in-kind.
G Total distributions of $.27 per share is comprised of distributions from net investment income of $.197 and distributions from net realized gain of $.077 per share.
H Total distributions of $.18 per share is comprised of distributions from net investment income of $.169 and distributions from net realized gain of $.015 per share.
I Total distributions of $3.64 per share is comprised of distributions from net investment income of $.419 and distributions from net realized gain of $3.225 per share.
See accompanying notes which are an integral part of the financial statements.
Annual Report
For the period ended July 31, 2015
(Amounts in thousands except percentages)
1. Organization.
Fidelity Dividend Growth Fund (the Fund) is a fund of Fidelity Securities Fund (the Trust) and is authorized to issue an unlimited number of shares. The Trust is registered under the Investment Company Act of 1940, as amended (the 1940 Act), as an open-end management investment company organized as a Massachusetts business trust. The Fund offers Dividend Growth and Class K shares, each of which has equal rights as to assets and voting privileges. Each class has exclusive voting rights with respect to matters that affect that class.
2. Investments in Fidelity Central Funds.
The Fund invests in Fidelity Central Funds, which are open-end investment companies generally available only to other investment companies and accounts managed by the investment adviser and its affiliates. The Fund's Schedule of Investments lists each of the Fidelity Central Funds held as of period end, if any, as an investment of the Fund, but does not include the underlying holdings of each Fidelity Central Fund. As an Investing Fund, the Fund indirectly bears its proportionate share of the expenses of the underlying Fidelity Central Funds.
The Money Market Central Funds seek preservation of capital and current income and are managed by Fidelity Investments Money Management, Inc. (FIMM), an affiliate of the investment adviser. Annualized expenses of the Money Market Central Funds as of their most recent shareholder report date are less than .01%.
A complete unaudited list of holdings for each Fidelity Central Fund is available upon request or at the Securities and Exchange Commission (the SEC) website at www.sec.gov. In addition, the financial statements of the Fidelity Central Funds, which are not covered by the Fund's Report of Independent Registered Public Accounting Firm, are available on the SEC website or upon request.
3. Significant Accounting Policies.
The financial statements have been prepared in conformity with accounting principles generally accepted in the United States of America (GAAP), which require management to make certain estimates and assumptions at the date of the financial statements. Actual results could differ from those estimates. Subsequent events, if any, through the date that the financial statements were issued have been evaluated in the preparation of the financial statements. The following summarizes the significant accounting policies of the Fund:
Investment Valuation. Investments are valued as of 4:00 p.m. Eastern time on the last calendar day of the period. The Board of Trustees (the Board) has delegated the day to day responsibility for the valuation of the Fund's investments to the Fidelity Management & Research Company (FMR) Fair Value Committee (the Committee). In accordance
Annual Report
Notes to Financial Statements - continued
(Amounts in thousands except percentages)
3. Significant Accounting Policies - continued
Investment Valuation - continued
with valuation policies and procedures approved by the Board, the Fund attempts to obtain prices from one or more third party pricing vendors or brokers to value its investments. When current market prices, quotations or currency exchange rates are not readily available or reliable, investments will be fair valued in good faith by the Committee, in accordance with procedures adopted by the Board. Factors used in determining fair value vary by investment type and may include market or investment specific events, changes in interest rates and credit quality. The frequency with which these procedures are used cannot be predicted and they may be utilized to a significant extent. The Committee oversees the Fund's valuation policies and procedures and reports to the Board on the Committee's activities and fair value determinations. The Board monitors the appropriateness of the procedures used in valuing the Fund's investments and ratifies the fair value determinations of the Committee.
The Fund categorizes the inputs to valuation techniques used to value its investments into a disclosure hierarchy consisting of three levels as shown below:
Level 1 - quoted prices in active markets for identical investments
Level 2 - other significant observable inputs (including quoted prices for similar investments, interest rates, prepayment speeds, etc.)
Level 3 - unobservable inputs (including the Fund's own assumptions based on the best information available)
Valuation techniques used to value the Fund's investments by major category are as follows:
Equity securities, including restricted securities, for which market quotations are readily available, are valued at the last reported sale price or official closing price as reported by a third party pricing vendor on the primary market or exchange on which they are traded and are categorized as Level 1 in the hierarchy. In the event there were no sales during the day or closing prices are not available, securities are valued at the last quoted bid price or may be valued using the last available price and are generally categorized as Level 2 in the hierarchy. For foreign equity securities, when market or security specific events arise, comparisons to the valuation of American Depositary Receipts (ADRs), futures contracts, Exchange-Traded Funds (ETFs) and certain indexes as well as quoted prices for similar securities may be used and would be categorized as Level 2 in the hierarchy. Utilizing these techniques may result in transfers between Level 1 and Level 2. For equity securities, including restricted securities, where observable inputs are limited, assumptions about market activity and risk are used and these securities may be categorized as Level 3 in the hierarchy.
Annual Report
3. Significant Accounting Policies - continued
Investment Valuation - continued
Debt securities, including restricted securities, are valued based on evaluated prices received from third party pricing vendors or from brokers who make markets in such securities. Corporate bonds are valued by pricing vendors who utilize matrix pricing which considers yield or price of bonds of comparable quality, coupon, maturity and type or by broker-supplied prices. When independent prices are unavailable or unreliable, debt securities may be valued utilizing pricing methodologies which consider similar factors that would be used by third party pricing vendors. Debt securities are generally categorized as Level 2 in the hierarchy but may be Level 3 depending on the circumstances.
Investments in open-end mutual funds, including the Fidelity Central Funds, are valued at their closing net asset value (NAV) each business day and are categorized as Level 1 in the hierarchy.
Changes in valuation techniques may result in transfers in or out of an assigned level within the disclosure hierarchy. The aggregate value of investments by input level as of July 31, 2015, including information on transfers between Levels 1 and 2, is included at the end of the Fund's Schedule of Investments.
Foreign Currency. The Fund may use foreign currency contracts to facilitate transactions in foreign-denominated securities. Gains and losses from these transactions may arise from changes in the value of the foreign currency or if the counterparties do not perform under the contracts' terms.
Foreign-denominated assets, including investment securities, and liabilities are translated into U.S. dollars at the exchange rates at period end. Purchases and sales of investment securities, income and dividends received and expenses denominated in foreign currencies are translated into U.S. dollars at the exchange rate in effect on the transaction date.
The effects of exchange rate fluctuations on investments are included with the net realized and unrealized gain (loss) on investment securities. Other foreign currency transactions resulting in realized and unrealized gain (loss) are disclosed separately.
Investment Transactions and Income. For financial reporting purposes, the Fund's investment holdings and NAV include trades executed through the end of the last business day of the period. The NAV per share for processing shareholder transactions is calculated as of the close of business of the New York Stock Exchange (NYSE), normally 4:00 p.m. Eastern time and includes trades executed through the end of the prior business day. Gains and losses on securities sold are determined on the basis of identified cost and may include proceeds received from litigation. Dividend income is recorded on
Annual Report
Notes to Financial Statements - continued
(Amounts in thousands except percentages)
3. Significant Accounting Policies - continued
Investment Transactions and Income - continued
the ex-dividend date, except for certain dividends from foreign securities where the ex-dividend date may have passed, which are recorded as soon as the Fund is informed of the ex-dividend date. Non-cash dividends included in dividend income, if any, are recorded at the fair market value of the securities received. Income and capital gain distributions from Fidelity Central Funds, if any, are recorded on the ex-dividend date. Distributions received on securities that represent a return of capital or capital gain are recorded as a reduction of cost of investments and/or as a realized gain. Subsequent to ex-dividend date the Fund determines the components of these distributions, based upon receipt of tax filings or other correspondence relating to the underlying investment. Interest income is accrued as earned and includes coupon interest and amortization of premium and accretion of discount on debt securities as applicable. Investment income is recorded net of foreign taxes withheld where recovery of such taxes is uncertain.
Class Allocations and Expenses. Investment income, realized and unrealized capital gains and losses, common expenses of the Fund, and certain fund-level expense reductions, if any, are allocated daily on a pro-rata basis to each class based on the relative net assets of each class to the total net assets of the Fund. Each class differs with respect to transfer agent fees incurred. Certain expense reductions may also differ by class. For the reporting period, the allocated portion of income and expenses to each class as a percent of its average net assets may vary due to the timing of recording these transactions in relation to fluctuating net assets of the classes. Expenses directly attributable to a fund are charged to that fund. Expenses attributable to more than one fund are allocated among the respective funds on the basis of relative net assets or other appropriate methods. Expense estimates are accrued in the period to which they relate and adjustments are made when actual amounts are known.
Deferred Trustee Compensation. Under a Deferred Compensation Plan (the Plan), independent Trustees may elect to defer receipt of a portion of their annual compensation. Deferred amounts are invested in a cross-section of Fidelity funds, are marked-to-market and remain in the Fund until distributed in accordance with the Plan. The investment of deferred amounts and the offsetting payable to the Trustees are included in the accompanying Statement of Assets and Liabilities.
Income Tax Information and Distributions to Shareholders. Each year, the Fund intends to qualify as a regulated investment company under Subchapter M of the Internal Revenue Code, including distributing substantially all of its taxable income and realized gains. As a result, no provision for U.S. Federal income taxes is required. As of July 31, 2015, the Fund did not have any unrecognized tax benefits in the financial statements; nor is the Fund aware of any tax positions for which it is reasonably possible
Annual Report
3. Significant Accounting Policies - continued
Income Tax Information and Distributions to Shareholders - continued
that the total amounts of unrecognized tax benefits will significantly change in the next twelve months. The Fund files a U.S. federal tax return, in addition to state and local tax returns as required. The Fund's federal income tax returns are subject to examination by the Internal Revenue Service (IRS) for a period of three fiscal years after they are filed. State and local tax returns may be subject to examination for an additional fiscal year depending on the jurisdiction. Foreign taxes are provided for based on the Fund's understanding of the tax rules and rates that exist in the foreign markets in which it invests.
Distributions are declared and recorded on the ex-dividend date. Income dividends and capital gain distributions are declared separately for each class. Income and capital gain distributions are determined in accordance with income tax regulations, which may differ from GAAP. In addition, the Fund claimed a portion of the payment made to redeeming shareholders as a distribution for income tax purposes.
Capital accounts within the financial statements are adjusted for permanent book-tax differences. These adjustments have no impact on net assets or the results of operations. Capital accounts are not adjusted for temporary book-tax differences which will reverse in a subsequent period.
Book-tax differences are primarily due to futures contracts, foreign currency transactions, partnerships, deferred trustees compensation and losses deferred due to wash sales.
The federal tax cost of investment securities and unrealized appreciation (depreciation) as of period end were as follows:
Gross unrealized appreciation | $ 1,734,617 |
Gross unrealized depreciation | (262,113) |
Net unrealized appreciation (depreciation) on securities | $ 1,472,503 |
| |
Tax Cost | $ 6,988,532 |
The tax-based components of distributable earnings as of period end were as follows:
Undistributed ordinary income | $ 69,735 |
Undistributed long-term capital gain | $ 523,374 |
Net unrealized appreciation (depreciation) on securities and other investments | $ 1,472,497 |
Annual Report
Notes to Financial Statements - continued
(Amounts in thousands except percentages)
3. Significant Accounting Policies - continued
Income Tax Information and Distributions to Shareholders - continued
The tax character of distributions paid was as follows:
| July 31, 2015 | July 31, 2014 |
Ordinary Income | $ 247,357 | $ 309,025 |
Long-term Capital Gains | 1,144,542 | 541,258 |
Total | $ 1,391,899 | $ 850,283 |
Restricted Securities. The Fund may invest in securities that are subject to legal or contractual restrictions on resale. These securities generally may be resold in transactions exempt from registration or to the public if the securities are registered. Disposal of these securities may involve time-consuming negotiations and expense, and prompt sale at an acceptable price may be difficult. Information regarding restricted securities is included at the end of the Fund's Schedule of Investments.
4. Derivative Instruments.
Risk Exposures and the Use of Derivative Instruments. The Fund's investment objective allows the Fund to enter into various types of derivative contracts, including futures contracts. Derivatives are investments whose value is primarily derived from underlying assets, indices or reference rates and may be transacted on an exchange or over-the-counter (OTC). Derivatives may involve a future commitment to buy or sell a specified asset based on specified terms, to exchange future cash flows at periodic intervals based on a notional principal amount, or for one party to make one or more payments upon the occurrence of specified events in exchange for periodic payments from the other party.
The Fund used derivatives to increase returns and to manage exposure to certain risks as defined below. The success of any strategy involving derivatives depends on analysis of numerous economic factors, and if the strategies for investment do not work as intended, the Fund may not achieve its objectives.
The Fund's use of derivatives increased or decreased its exposure to the following risk:
Equity Risk | Equity risk relates to the fluctuations in the value of financial instruments as a result of changes in market prices (other than those arising from interest rate risk or foreign exchange risk), whether caused by factors specific to an individual investment, its issuer, or all factors affecting all instruments traded in a market or market segment. |
Annual Report
4. Derivative Instruments - continued
Risk Exposures and the Use of Derivative Instruments - continued
The Fund is also exposed to additional risks from investing in derivatives, such as liquidity risk and counterparty credit risk. Liquidity risk is the risk that the Fund will be unable to close out the derivative in the open market in a timely manner. Counterparty credit risk is the risk that the counterparty will not be able to fulfill its obligation to the Fund. Counterparty credit risk related to exchange-traded futures contracts may be mitigated by the protection provided by the exchange on which they trade.
Investing in derivatives may involve greater risks than investing in the underlying assets directly and, to varying degrees, may involve risk of loss in excess of any initial investment and collateral received and amounts recognized in the Statement of Assets and Liabilities. In addition, there may be the risk that the change in value of the derivative contract does not correspond to the change in value of the underlying instrument.
Futures Contracts. A futures contract is an agreement between two parties to buy or sell a specified underlying instrument for a fixed price at a specified future date. The Fund used futures contracts to manage its exposure to the stock market.
Upon entering into a futures contract, a fund is required to deposit either cash or securities (initial margin) with a clearing broker in an amount equal to a certain percentage of the face value of the contract. Futures contracts are marked-to-market daily and subsequent daily payments (variation margin) are made or received by a fund depending on the daily fluctuations in the value of the futures contracts and are recorded as unrealized appreciation or (depreciation). This receivable and/or payable, if any, is included in daily variation margin for derivative instruments in the Statement of Assets and Liabilities. Realized gain or (loss) is recorded upon the expiration or closing of a futures contract.
Any open futures contracts at period end are presented in the Schedule of Investments under the caption "Futures Contracts". The underlying face amount at value reflects each contract's exposure to the underlying instrument or index at period end.
During the period the Fund recognized net realized gain (loss) of $61 and a change in net unrealized appreciation (depreciation) of $(38) related to its investment in futures contracts. These amounts are included in the Statement of Operations.
5. Purchases and Sales of Investments.
Purchases and sales of securities, other than short-term securities, aggregated $5,390,300 and $6,115,911, respectively.
Annual Report
Notes to Financial Statements - continued
(Amounts in thousands except percentages)
6. Fees and Other Transactions with Affiliates.
Management Fee. Fidelity Management & Research Company (the investment adviser) and its affiliates provide the Fund with investment management related services for which the Fund pays a monthly management fee. The management fee is the sum of an individual fund fee rate that is based on an annual rate of .30% of the Fund's average net assets and an annualized group fee rate that averaged .25% during the period. The group fee rate is based upon the average net assets of all the mutual funds advised by the investment adviser, including any mutual funds previously advised by the investment adviser that are currently advised by Fidelity SelectCo, LLC, an affiliate of the investment adviser. The group fee rate decreases as assets under management increase and increases as assets under management decrease. In addition, the management fee is subject to a performance adjustment (up to a maximum of ± .20% of the Fund's average net assets over a 36 month performance period). The upward or downward adjustment to the management fee is based on the relative investment performance of Dividend Growth as compared to its benchmark index, the S&P 500 Index, over the same 36 month performance period. For the reporting period, the total annual management fee rate, including the performance adjustment, was .50% of the Fund's average net assets. The performance adjustment included in the management fee rate may be higher or lower than the maximum performance adjustment rate due to the difference between the average net assets for the reporting and performance periods.
Transfer Agent Fees. Fidelity Investments Institutional Operations Company, Inc., (FIIOC), an affiliate of the investment adviser, is the transfer, dividend disbursing and shareholder servicing agent for each class of the Fund. FIIOC receives account fees and asset-based fees that vary according to the account size and type of account of the shareholders of Dividend Growth, except for Class K. FIIOC receives an asset-based fee of Class K's average net assets. FIIOC pays for typesetting, printing and mailing of shareholder reports, except proxy statements.
For the period, transfer agent fees for each class were as follows:
| Amount | % of
Class-Level Average
Net Assets |
Dividend Growth | $ 10,782 | .16 |
Class K | 981 | .05 |
| $ 11,763 | |
Accounting and Security Lending Fees. Fidelity Service Company, Inc. (FSC), an affiliate of the investment adviser, maintains the Fund's accounting records. The accounting fee is based on the level of average net assets for each month. Under a separate contract, FSC administers the security lending program. The security lending fee is based on the number and duration of lending transactions.
Annual Report
6. Fees and Other Transactions with Affiliates - continued
Brokerage Commissions. The Fund placed a portion of its portfolio transactions with brokerage firms which are affiliates of the investment adviser. Brokerage commissions are included in net realized gain (loss) and change in net unrealized appreciation (depreciation) in the Statement of Operations. The commissions paid to these affiliated firms were $85 for the period.
7. Committed Line of Credit.
The Fund participates with other funds managed by the investment adviser or an affiliate in a $4.25 billion credit facility (the "line of credit") to be utilized for temporary or emergency purposes to fund shareholder redemptions or for other short-term liquidity purposes. The Fund has agreed to pay commitment fees on its pro-rata portion of the line of credit, which amounted to $13 and is reflected in Miscellaneous expenses on the Statement of Operations. During the period, the Fund did not borrow on this line of credit.
8. Security Lending.
The Fund lends portfolio securities through a lending agent from time to time in order to earn additional income. For equity securities, a lending agent is used and may loan securities to certain qualified borrowers, including Fidelity Capital Markets (FCM), a broker-dealer affiliated with the Fund. On the settlement date of the loan, the Fund receives collateral (in the form of U.S. Treasury obligations, letters of credit and/or cash) against the loaned securities and maintains collateral in an amount not less than 100% of the market value of the loaned securities during the period of the loan. The market value of the loaned securities is determined at the close of business of the Fund and any additional required collateral is delivered to the Fund on the next business day. If the borrower defaults on its obligation to return the securities loaned because of insolvency or other reasons, the Fund may apply collateral received from the borrower against the obligation. The Fund may experience delays and costs in recovering the securities loaned. Any cash collateral received is invested in the Fidelity Securities Lending Cash Central Fund. The value of loaned securities and cash collateral at period end are disclosed on the Fund's Statement of Assets and Liabilities. Security lending income represents the income earned on investing cash collateral, less rebates paid to borrowers and any lending agent fees associated with the loan, plus any premium payments received for lending certain types of securities. Security lending income is presented in the Statement of Operations as a component of income from Fidelity Central Funds. Total security lending income during the period amounted to $593. During the period, there were no securities loaned to FCM.
Annual Report
Notes to Financial Statements - continued
(Amounts in thousands except percentages)
9. Expense Reductions.
Commissions paid to certain brokers with whom the investment adviser, or its affiliates, places trades on behalf of the Fund include an amount in addition to trade execution, which may be rebated back to the Fund to offset certain expenses. This amount totaled $191 for the period.
In addition, through arrangements with the Fund's custodian, credits realized as a result of uninvested cash balances were used to reduce the Fund's expenses. During the period, these credits reduced the Fund's custody expenses by $1.
In addition, during the period the investment adviser reimbursed/waived a portion of fund-level operating expenses in the amount of $34 and a portion of class-level operating expenses as follows:
| Amount |
Dividend Growth | $ 165 |
10. Distributions to Shareholders.
Distributions to shareholders of each class were as follows:
Years ended July 31, | 2015 | 2014 |
From net investment income | | |
Dividend Growth | $ 92,079 | $ 70,700 |
Class K | 32,054 | 20,256 |
Total | $ 124,133 | $ 90,956 |
From net realized gain | | |
Dividend Growth | $ 962,404 | $ 606,886 |
Class K | 305,362 | 152,441 |
Total | $ 1,267,766 | $ 759,327 |
11. Share Transactions.
Share transactions for each class were as follows and may contain automatic conversions between classes or exchanges between funds:
| Shares | Dollars |
Years ended July 31, | 2015 | 2014 | 2015 | 2014 |
Dividend Growth | | | | |
Shares sold | 10,859 | 11,713 | $ 370,250 | $ 413,381 |
Reinvestment of distributions | 30,298 | 19,201 | 1,009,516 | 630,027 |
Shares redeemed | (27,183) | (44,744) | (929,933) | (1,586,974) |
Net increase (decrease) | 13,974 | (13,830) | $ 449,833 | $ (543,566) |
Annual Report
11. Share Transactions - continued
| Shares | Dollars |
Years ended July 31, | 2015 | 2014 | 2015 | 2014 |
Class K | | | | |
Shares sold | 9,521 | 14,508 | $ 325,624 | $ 525,067 |
Reinvestment of distributions | 10,135 | 5,265 | 337,416 | 172,697 |
Shares redeemed | (18,467) | (10,980) | (633,706) | (388,018) |
Net increase (decrease) | 1,189 | 8,793 | $ 29,334 | $ 309,746 |
12. Other.
The Fund's organizational documents provide former and current trustees and officers with a limited indemnification against liabilities arising in connection with the performance of their duties to the Fund. In the normal course of business, the Fund may also enter into contracts that provide general indemnifications. The Fund's maximum exposure under these arrangements is unknown as this would be dependent on future claims that may be made against the Fund. The risk of material loss from such claims is considered remote.
Annual Report
To the Trustees of Fidelity Securities Fund and the Shareholders of Fidelity Dividend Growth Fund:
In our opinion, the accompanying statement of assets and liabilities, including the schedule of investments, and the related statements of operations and of changes in net assets and the financial highlights present fairly, in all material respects, the financial position of Fidelity Dividend Growth Fund (a fund of Fidelity Securities Fund) at July 31, 2015, the results of its operations for the year then ended, the changes in its net assets for each of the two years in the period then ended and the financial highlights for each of the five years in the period then ended, in conformity with accounting principles generally accepted in the United States of America. These financial statements and financial highlights (hereafter referred to as "financial statements") are the responsibility of the Fidelity Dividend Growth Fund's management. Our responsibility is to express an opinion on these financial statements based on our audits. We conducted our audits of these financial statements in accordance with the standards of the Public Company Accounting Oversight Board (United States). Those standards require that we plan and perform the audit to obtain reasonable assurance about whether the financial statements are free of material misstatement. An audit includes examining, on a test basis, evidence supporting the amounts and disclosures in the financial statements, assessing the accounting principles used and significant estimates made by management, and evaluating the overall financial statement presentation. We believe that our audits, which included confirmation of securities at July 31, 2015 by correspondence with the custodian and brokers, provide a reasonable basis for our opinion.
PricewaterhouseCoopers LLP
Boston, Massachusetts
September 23, 2015
Annual Report
The Trustees, Member of the Advisory Board, and officers of the trust and fund, as applicable, are listed below. The Board of Trustees governs the fund and is responsible for protecting the interests of shareholders. The Trustees are experienced executives who meet periodically throughout the year to oversee the fund's activities, review contractual arrangements with companies that provide services to the fund, oversee management of the risks associated with such activities and contractual arrangements, and review the fund's performance. Each of the Trustees oversees 170 funds.
The Trustees hold office without limit in time except that (a) any Trustee may resign; (b) any Trustee may be removed by written instrument, signed by at least two-thirds of the number of Trustees prior to such removal; (c) any Trustee who requests to be retired or who has become incapacitated by illness or injury may be retired by written instrument signed by a majority of the other Trustees; and (d) any Trustee may be removed at any special meeting of shareholders by a two-thirds vote of the outstanding voting securities of the trust. Each Trustee who is not an interested person (as defined in the 1940 Act) of the trust and the fund (Independent Trustee), shall retire not later than the last day of the calendar year in which his or her 75th birthday occurs. The Independent Trustees may waive this mandatory retirement age policy with respect to individual Trustees. The officers and Advisory Board Member hold office without limit in time, except that any officer and Advisory Board Member may resign or may be removed by a vote of a majority of the Trustees at any regular meeting or any special meeting of the Trustees. Except as indicated, each individual has held the office shown or other offices in the same company for the past five years.
Experience, Skills, Attributes, and Qualifications of the Fund's Trustees. The Governance and Nominating Committee has adopted a statement of policy that describes the experience, qualifications, attributes, and skills that are necessary and desirable for potential Independent Trustee candidates (Statement of Policy). The Board believes that each Trustee satisfied at the time he or she was initially elected or appointed a Trustee, and continues to satisfy, the standards contemplated by the Statement of Policy. The Governance and Nominating Committee also engages professional search firms to help identify potential Independent Trustee candidates who have the experience, qualifications, attributes, and skills consistent with the Statement of Policy. From time to time, additional criteria based on the composition and skills of the current Independent Trustees, as well as experience or skills that may be appropriate in light of future changes to board composition, business conditions, and regulatory or other developments, have also been considered by the professional search firms and the Governance and Nominating Committee. In addition, the Board takes into account the Trustees' commitment and participation in Board and committee meetings, as well as their leadership of standing and ad hoc committees throughout their tenure.
In determining that a particular Trustee was and continues to be qualified to serve as a Trustee, the Board has considered a variety of criteria, none of which, in isolation, was controlling. The Board believes that, collectively, the Trustees have balanced and diverse experience, qualifications, attributes, and skills, which allow the Board to operate effectively in governing the fund and protecting the interests of shareholders. Information about the specific experience, skills, attributes, and qualifications of each Trustee, which in each case led to the Board's conclusion that the Trustee should serve (or continue to serve) as a trustee of the fund, is provided below.
Annual Report
Trustees and Officers - continued
Board Structure and Oversight Function. James C. Curvey is an interested person (as defined in the 1940 Act) and currently serves as Chairman. The Trustees have determined that an interested Chairman is appropriate and benefits shareholders because an interested Chairman has a personal and professional stake in the quality and continuity of services provided to the fund. Independent Trustees exercise their informed business judgment to appoint an individual of their choosing to serve as Chairman, regardless of whether the Trustee happens to be independent or a member of management. The Independent Trustees have determined that they can act independently and effectively without having an Independent Trustee serve as Chairman and that a key structural component for assuring that they are in a position to do so is for the Independent Trustees to constitute a substantial majority for the Board. The Independent Trustees also regularly meet in executive session. Ned C. Lautenbach serves as Chairman of the Independent Trustees and as such (i) acts as a liaison between the Independent Trustees and management with respect to matters important to the Independent Trustees and (ii) with management prepares agendas for Board meetings.
Fidelity funds are overseen by different Boards of Trustees. The fund's Board oversees Fidelity's high income and certain equity funds and other Boards oversee Fidelity's investment-grade bond, money market, asset allocation, and sector funds. The asset allocation funds may invest in Fidelity funds overseen by the fund's Board. The use of separate Boards, each with its own committee structure, allows the Trustees of each group of Fidelity funds to focus on the unique issues of the funds they oversee, including common research, investment, and operational issues. On occasion, the separate Boards establish joint committees to address issues of overlapping consequences for the Fidelity funds overseen by each Board.
The Trustees operate using a system of committees to facilitate the timely and efficient consideration of all matters of importance to the Trustees, the fund, and fund shareholders and to facilitate compliance with legal and regulatory requirements and oversight of the fund's activities and associated risks. The Board, acting through its committees, has charged FMR and its affiliates with (i) identifying events or circumstances the occurrence of which could have demonstrably adverse effects on the fund's business and/or reputation; (ii) implementing processes and controls to lessen the possibility that such events or circumstances occur or to mitigate the effects of such events or circumstances if they do occur; and (iii) creating and maintaining a system designed to evaluate continuously business and market conditions in order to facilitate the identification and implementation processes described in (i) and (ii) above. Because the day-to-day operations and activities of the fund are carried out by or through FMR, its affiliates and other service providers, the fund's exposure to risks is mitigated but not eliminated by the processes overseen by the Trustees. While each of the Board's committees has responsibility for overseeing different aspects of the fund's activities, oversight is exercised primarily through the Operations, Audit, and Compliance Committees. In addition, the Independent Trustees have worked with FMR to enhance the Board's oversight of investment and financial risks, legal and regulatory risks, technology risks, and operational risks, including the development of additional risk reporting to the Board. For example, a working group comprised of Independent Trustees and FMR has worked and continues to work to review the Fidelity funds' valuation-related activities, reporting and risk management. Appropriate personnel, including but not limited to the fund's Chief Compliance Officer (CCO), FMR's internal auditor, the independent accountants, the fund's Treasurer and portfolio management personnel, make periodic reports to the Board's committees, as appropriate, including an annual review of FMR's risk management program for the Fidelity funds. The responsibilities of each standing committee, including their oversight responsibilities, are described further under "Standing Committees of the Fund's Trustees."
Annual Report
The fund's Statement of Additional Information (SAI) includes more information about the Trustees. To request a free copy, call Fidelity at 1-800-544-8544.
Interested Trustees*:
Correspondence intended for each Trustee who is an interested person may be sent to Fidelity Investments, 245 Summer Street, Boston, Massachusetts 02210.
Name, Year of Birth; Principal Occupations and Other Relevant Experience+ |
James C. Curvey (1935) |
Year of Election or Appointment: 2007 Trustee Chairman of the Board of Trustees |
| Mr. Curvey also serves as Trustee of other Fidelity funds. Mr. Curvey is a Director of Fidelity Research & Analysis Co. (investment adviser firm, 2009-present), and Vice Chairman (2007-present) and Director of FMR LLC (diversified financial services company). In addition, Mr. Curvey serves as an Overseer for the Boston Symphony Orchestra and a member of the board of Artis-Naples, Naples, Florida, and as a Trustee for Brewster Academy, Wolfeboro, New Hampshire. Previously, Mr. Curvey served as a Director of Fidelity Investments Money Management, Inc. (investment adviser firm, 2009-2014), a Director of FMR (investment adviser firm, 2007-2014), and a Director of FMR Co., Inc. (investment adviser firm, 2007-2014). |
Charles S. Morrison (1960) |
Year of Election or Appointment: 2014 Trustee |
| Mr. Morrison also serves as Trustee of other funds. He serves as a Director of Fidelity Investments Money Management, Inc. (FIMM) (investment adviser firm, 2014-present), Director of Fidelity SelectCo, LLC (investment adviser firm, 2014-present), President, Asset Management (2014-present), and is an employee of Fidelity Investments. Previously, Mr. Morrison served as Vice President of Fidelity's Fixed Income and Asset Allocation Funds (2012-2014), President, Fixed Income (2011-2014), Vice President of Fidelity's Money Market Funds (2005-2009), President, Money Market Group Leader of FMR (investment adviser firm, 2009), and Senior Vice President, Money Market Group of FMR (2004-2009). Mr. Morrison also served as Vice President of Fidelity's Bond Funds (2002-2005), certain Balanced Funds (2002-2005), and certain Asset Allocation Funds (2002-2007), and as Senior Vice President (2002-2005) of Fidelity's Bond Division. |
* Trustees have been determined to be "Interested Trustees" by virtue of, among other things, their affiliation with the trust or various entities under common control with FMR.
+ The information above includes each Trustee's principal occupation during the last five years and other information relating to the experience, attributes, and skills relevant to each Trustee's qualifications to serve as a Trustee, which led to the conclusion that each Trustee should serve as a Trustee for the fund.
Annual Report
Independent Trustees:
Correspondence intended for each Independent Trustee (that is, the Trustees other than the Interested Trustees) may be sent to Fidelity Investments, P.O. Box 55235, Boston, Massachusetts 02205-5235.
Name, Year of Birth; Principal Occupations and Other Relevant Experience+ |
Dennis J. Dirks (1948) |
Year of Election or Appointment: 2005 Trustee |
| Mr. Dirks also serves as Trustee of other Fidelity funds. Prior to his retirement in May 2003, Mr. Dirks was Chief Operating Officer and a member of the Board of The Depository Trust & Clearing Corporation (DTCC). He also served as President, Chief Operating Officer, and Board member of The Depository Trust Company (DTC) and President and Board member of the National Securities Clearing Corporation (NSCC). In addition, Mr. Dirks served as Chief Executive Officer and Board member of the Government Securities Clearing Corporation, Chief Executive Officer and Board member of the Mortgage-Backed Securities Clearing Corporation, as a Trustee and a member of the Finance Committee of Manhattan College (2005-2008), and as a Trustee and a member of the Finance Committee of AHRC of Nassau County (2006-2008). Mr. Dirks is a member of the Independent Directors Council (IDC) Governing Council (2010-present) and Board of Directors for The Brookville Center for Children's Services, Inc. (2009-present). |
Alan J. Lacy (1953) |
Year of Election or Appointment: 2008 Trustee |
| Mr. Lacy also serves as Trustee of other Fidelity funds. Mr. Lacy serves as a member of the Board of Directors of Dave & Buster's Entertainment, Inc. (restaurant and entertainment complexes, 2010-present) and Bristol-Myers Squibb Company (global pharmaceuticals, 2008-present). In addition, Mr. Lacy served as Senior Adviser (2007-2014) of Oak Hill Capital Partners, L.P. (private equity) and also served as Chief Executive Officer (2000-2005) and Vice Chairman (2005-2006) of Sears Holdings Corporation and Sears, Roebuck and Co. (retail). Mr. Lacy is a member of the Board of Trustees of The National Parks Conservation Association (2006-present). Previously, Mr. Lacy served as Chairman of the Board of Trustees of the National Parks Conservation Association (2008-2011) and as a member of the Board of Directors for The Western Union Company (global money transfer, 2006-2011), The Hillman Companies, Inc. (hardware wholesalers, 2010-2014), and Earth Fare, Inc. (retail grocery, 2010-2014). |
Ned C. Lautenbach (1944) |
Year of Election or Appointment: 2000 Trustee Chairman of the Independent Trustees |
| Mr. Lautenbach also serves as Trustee of other Fidelity funds. Mr. Lautenbach currently serves as the Lead Director of the Eaton Corporation Board of Directors (diversified industrial, 1997-present). Mr. Lautenbach is Chairman of the Board of Directors of Artis-Naples in Naples, Florida (2012-present), a member of the Council on Foreign Relations (1994-present), and a member of the Board of Governors, State University System of Florida (2013-present). Previously, Mr. Lautenbach was a Partner/Advisory Partner at Clayton, Dubilier & Rice, LLC (private equity investment, 1998-2010), as well as a Director of Sony Corporation (2006-2007). |
Joseph Mauriello (1944) |
Year of Election or Appointment: 2008 Trustee |
| Mr. Mauriello also serves as Trustee of other Fidelity funds. Prior to his retirement in January 2006, Mr. Mauriello served in numerous senior management positions including Deputy Chairman and Chief Operating Officer (2004-2005), and Vice Chairman of Financial Services (2002-2004) of KPMG LLP US (professional services, 1965-2005). Mr. Mauriello currently serves as a member of the Board of Directors of XL Group plc. (global insurance and re-insurance, 2006-present). Previously, Mr. Mauriello served as a Director of the Hamilton Funds of the Bank of New York (2006-2007) and of Arcadia Resources Inc. (health care services and products, 2007-2012). |
Robert W. Selander (1950) |
Year of Election or Appointment: 2011 Trustee |
| Mr. Selander also serves as Trustee of other Fidelity funds. Mr. Selander serves as a Director of The Western Union Company (global money transfer, 2014-present). Previously, Mr. Selander served as a Member of the Advisory Board of other Fidelity funds (2011), and Executive Vice Chairman (2010), Chief Executive Officer (2009-2010), and President and Chief Executive Officer (1997-2009) of Mastercard, Inc. |
Cornelia M. Small (1944) |
Year of Election or Appointment: 2005 Trustee |
| Ms. Small also serves as Trustee of other Fidelity funds. Ms. Small is a member of the Board of Directors (2009-present) and Chair of the Investment Committee (2010-present) of the Teagle Foundation. Ms. Small also serves on the Investment Committee of the Berkshire Taconic Community Foundation (2008-present). Previously, Ms. Small served as Chairperson (2002-2008) and a member of the Investment Committee and Chairperson (2008-2012) and a member of the Board of Trustees of Smith College. In addition, Ms. Small served as Chief Investment Officer, Director of Global Equity Investments, and a member of the Board of Directors of Scudder, Stevens & Clark and Scudder Kemper Investments. |
William S. Stavropoulos (1939) |
Year of Election or Appointment: 2001 Trustee Vice Chairman of the Independent Trustees |
| Mr. Stavropoulos also serves as Trustee of other Fidelity funds. Mr. Stavropoulos serves as President and Founder of the Michigan Baseball Foundation, the Great Lakes Loons (2007-present). Mr. Stavropoulos is Chairman Emeritus of the Board of Directors of The Dow Chemical Company, where he previously served in numerous senior management positions, including President, CEO (1995-2000; 2002-2004), Chairman of the Executive Committee (2000-2006), and as a member of the Board of Directors (1990-2006). Currently, Mr. Stavropoulos is Chairman of the Board of Directors of Univar Inc. (global distributor of commodity and specialty chemicals), a Director of Teradata Corporation (data warehousing and technology solutions), and Maersk Inc. (industrial conglomerate), and a member of the Advisory Board for Metalmark Capital LLC (private equity investment, 2005-present). Mr. Stavropoulos is an operating advisor to Clayton, Dubilier & Rice, LLC (private equity investment). In addition, Mr. Stavropoulos is a member of the University of Notre Dame Advisory Council for the College of Science, a Trustee of the Rollin L. Gerstacker Foundation, and a Director of the Naples Philharmonic Center for the Arts. Previously, Mr. Stavropoulos served as a Director of Chemical Financial Corporation (bank holding company, 1993-2012) and Tyco International, Ltd. (multinational manufacturing and services, 2007-2012). |
David M. Thomas (1949) |
Year of Election or Appointment: 2008 Trustee |
| Mr. Thomas also serves as Trustee of other Fidelity funds. Mr. Thomas serves as Non-Executive Chairman of the Board of Directors of Fortune Brands Home and Security (home and security products, 2011-present), as a member of the Board of Directors (2004-present) and Presiding Director (2013-present) of Interpublic Group of Companies, Inc. (marketing communication), and as a member of the Board of Trustees of the University of Florida (2013-present). Previously, Mr. Thomas served as Executive Chairman (2005-2006) and Chairman and Chief Executive Officer (2000-2005) of IMS Health, Inc. (pharmaceutical and healthcare information solutions), and a Director of Fortune Brands, Inc. (consumer products, 2000-2011). |
+ The information above includes each Trustee's principal occupation during the last five years and other information relating to the experience, attributes, and skills relevant to each Trustee's qualifications to serve as a Trustee, which led to the conclusion that each Trustee should serve as a Trustee for the fund.
Advisory Board Member and Officers:
Correspondence intended for each officer and Peter S. Lynch may be sent to Fidelity Investments, 245 Summer Street, Boston, Massachusetts 02210. Officers appear below in alphabetical order.
Name, Year of Birth; Principal Occupation |
Peter S. Lynch (1944) |
Year of Election or Appointment: 2003 Member of the Advisory Board |
| Mr. Lynch also serves as Member of the Advisory Board of other Fidelity funds. Mr. Lynch is Vice Chairman and a Director of FMR (investment adviser firm) and FMR Co., Inc. (investment adviser firm). In addition, Mr. Lynch serves as a Trustee of Boston College and as the Chairman of the Inner-City Scholarship Fund. Previously, Mr. Lynch served on the Special Olympics International Board of Directors (1997-2006). |
Elizabeth Paige Baumann (1968) |
Year of Election or Appointment: 2012 Anti-Money Laundering (AML) Officer |
| Ms. Baumann also serves as AML Officer of other funds. She is Chief AML Officer of FMR LLC (diversified financial services company, 2012-present) and is an employee of Fidelity Investments. Previously, Ms. Baumann served as Vice President and Deputy Anti-Money Laundering Officer (2007-2012). |
Marc Bryant (1966) |
Year of Election or Appointment: 2015 Secretary and Chief Legal Officer (CLO) |
<R> | Mr. Bryant also serves as Secretary and Chief Legal Officer (CLO) of other funds. He is Senior Vice President and Deputy General Counsel of FMR LLC (diversified financial services company). Previously, Mr. Bryant served as Secretary and Chief Legal Officer of Fidelity Rutland Square Trust II (2010-2014) and Assistant Secretary of Fidelity's Fixed Income and Asset Allocation Funds (2013-2015). Prior to joining Fidelity Investments, Mr. Bryant served as a Senior Vice President and the Head of Global Retail Legal for AllianceBernstein L.P. (2006-2010), and as the General Counsel for ProFund Advisors LLC (2001-2006).</R> |
William C. Coffey (1969) |
Year of Election or Appointment: 2009 Assistant Secretary |
| Mr. Coffey also serves as Assistant Secretary of other funds. He is Senior Vice President and Deputy General Counsel of FMR LLC (diversified financial services company, 2010-present), and is an employee of Fidelity Investments. Previously, Mr. Coffey served as Vice President and Associate General Counsel of FMR LLC (2005-2009). |
Jonathan Davis (1968) |
Year of Election or Appointment: 2010 Assistant Treasurer |
| Mr. Davis also serves as Assistant Treasurer of other funds. Mr. Davis is an employee of Fidelity Investments. Previously, Mr. Davis served as Vice President and Associate General Counsel of FMR LLC (diversified financial services company, 2003-2010). |
Adrien E. Deberghes (1967) |
Year of Election or Appointment: 2008 Deputy Treasurer |
| Mr. Deberghes also serves as an officer of other funds. He is an employee of Fidelity Investments (2008-present). Prior to joining Fidelity Investments, Mr. Deberghes was Senior Vice President of Mutual Fund Administration at State Street Corporation (2007-2008), Senior Director of Mutual Fund Administration at Investors Bank & Trust (2005-2007), and Director of Finance for Dunkin' Brands (2000-2005). |
Stephanie J. Dorsey (1969) |
Year of Election or Appointment: 2010 Assistant Treasurer |
| Ms. Dorsey also serves as an officer of other funds. She is an employee of Fidelity Investments (2008-present) and has served in other fund officer roles. Prior to joining Fidelity Investments, Ms. Dorsey served as Treasurer (2004-2008) of the JPMorgan Mutual Funds and Vice President (2004-2008) of JPMorgan Chase Bank. |
Howard J. Galligan III (1966) |
Year of Election or Appointment: 2014 Chief Financial Officer |
| Mr. Galligan also serves as Chief Financial Officer of other funds. Mr. Galligan serves as President of Fidelity Pricing and Cash Management Services (FPCMS) (2014-present) and as a Director of Strategic Advisers, Inc. (investment adviser firm, 2008-present). Previously, Mr. Galligan served as Chief Administrative Officer of Asset Management (2011-2014) and Chief Operating Officer and Senior Vice President of Investment Support for Strategic Advisers, Inc. (2003-2011). |
Scott C. Goebel (1968) |
Year of Election or Appointment: 2015 Vice President |
| Mr. Goebel serves as an officer of other funds. Mr. Goebel also serves as Secretary of Fidelity SelectCo, LLC (investment adviser firm, 2013-present), Fidelity Investments Money Management, Inc. (FIMM) (investment adviser firm, 2010-present) and Fidelity Research and Analysis Company (FRAC) (investment adviser firm, 2010-present); General Counsel, Secretary, and Senior Vice President of FMR (investment adviser firm, 2008-present) and FMR Co., Inc. (investment adviser firm, 2008-present); Chief Legal Officer of Fidelity Management & Research (Hong Kong) Limited (investment adviser firm, 2008-present); and Assistant Secretary of Fidelity Management & Research (Japan) Limited (investment adviser firm, 2008-present) and FMR Investment Management (U.K.) Limited (investment adviser firm, 2008-present). Previously, Mr. Goebel served as Secretary and CLO of certain Fidelity funds (2008-2015), Assistant Secretary of FIMM (2008-2010), FRAC (2008-2010), and certain funds (2007-2008); and as Vice President and Secretary of Fidelity Distributors Corporation (FDC) (2005-2007). Mr. Goebel has been employed by FMR LLC (diversified financial services company) or an affiliate since 2001. |
Brian B. Hogan (1964) |
Year of Election or Appointment: 2009 Vice President |
| Mr. Hogan also serves as Trustee or Vice President of other funds. Mr. Hogan serves as a Director of Fidelity SelectCo, LLC (investment adviser firm, 2014-present) and President of the Equity Division of FMR (investment adviser firm, 2009-present). Previously, Mr. Hogan served as Senior Vice President, Equity Research of FMR (2006-2009) and as a portfolio manager. |
Chris Maher (1972) |
Year of Election or Appointment: 2013 Assistant Treasurer |
| Mr. Maher serves as Assistant Treasurer of other funds. Mr. Maher is Vice President of Valuation Oversight and is an employee of Fidelity Investments. Previously, Mr. Maher served as Vice President of Asset Management Compliance (2013), Vice President of the Program Management Group of FMR (investment adviser firm, 2010-2013), and Vice President of Valuation Oversight (2008-2010). |
Melissa M. Reilly (1971) |
Year of Election or Appointment: 2014 Vice President of certain Equity Funds |
| Ms. Reilly also serves as Vice President of other funds. Ms. Reilly is an employee of Fidelity Investments (2004-present). |
Kenneth B. Robins (1969) |
Year of Election or Appointment: 2008 President and Treasurer |
| Mr. Robins also serves as an officer of other funds. Mr. Robins serves as Executive Vice President of Fidelity Investments Money Management, Inc. (FIMM) (investment adviser firm, 2013-present) and is an employee of Fidelity Investments (2004-present). Previously, Mr. Robins served in other fund officer roles. |
Stephen Sadoski (1971) |
Year of Election or Appointment: 2012 Deputy Treasurer |
| Mr. Sadoski also serves as Deputy Treasurer of other funds. He is an employee of Fidelity Investments (2012-present) and has served in another fund officer role. Prior to joining Fidelity Investments, Mr. Sadoski served as an assistant chief accountant in the Division of Investment Management of the Securities and Exchange Commission (SEC) (2009-2012) and as a senior manager at Deloitte & Touche LLP (1997-2009). |
Stacie M. Smith (1974) |
Year of Election or Appointment: 2013 Deputy Treasurer |
| Ms. Smith also serves as an officer of other funds. She is an employee of Fidelity Investments (2009-present) and has served in other fund officer roles. Prior to joining Fidelity Investments, Ms. Smith served as Senior Audit Manager of Ernst & Young LLP (1996-2009). |
Renee Stagnone (1975) |
Year of Election or Appointment: 2013 Deputy Treasurer |
| Ms. Stagnone also serves as Deputy Treasurer of other funds. Ms. Stagnone is an employee of Fidelity Investments. |
Linda J. Wondrack (1964) |
Year of Election or Appointment: 2014 Chief Compliance Officer |
| Ms. Wondrack also serves as Chief Compliance Officer of other funds. Ms. Wondrack is Executive Vice President and head of the Ethics Office and Asset Management Compliance for Fidelity Investments (2012-present). Ms. Wondrack also serves as Chief Compliance Officer of Fidelity SelectCo, LLC (investment adviser firm, 2014-present); Chief Compliance Officer of Impresa Management LLC (2013-present); and Chief Compliance Officer of FMR Co., Inc. (investment adviser firm), Fidelity Investments Money Management, Inc. (investment adviser firm), Fidelity Management & Research (Japan) Limited (investment adviser firm), FMR Investment Management (U.K.) Limited (investment adviser firm), Fidelity Management & Research (Hong Kong) (investment adviser firm), Fidelity Management & Research Company (investment adviser firm), Pyramis Global Advisors, LLC (investment adviser firm), and Strategic Advisers, Inc. (investment adviser firm), Ballyrock Investment Advisors LLC, and Northern Neck Investors LLC (2012-present). Previously, Ms. Wondrack served as Senior Vice President and Chief Compliance Officer for Columbia Management Investment Advisers, LLC (2005-2012); Chief Compliance Officer for certain funds within the Columbia Family of Funds (2007-2012); and Senior Vice President of Compliance Risk Management at Bank of America (2005-2010). |
Joseph F. Zambello (1957) |
Year of Election or Appointment: 2011 Deputy Treasurer |
| Mr. Zambello also serves as Deputy Treasurer of other funds. Mr. Zambello is an employee of Fidelity Investments. Previously, Mr. Zambello served as Vice President of the Program Management Group of FMR (investment adviser firm, 2009-2011) and Vice President of the Transfer Agent Oversight Group (2005-2009). |
Annual Report
The Board of Trustees of Fidelity Dividend Growth Fund voted to pay on record date, the following distributions per share derived from capital gains realized from sales of portfolio securities, and dividends derived from net investment income:
| Pay Date | Record Date | Dividends | Capital Gains |
Dividend Growth | 9/14/15 | 9/11/15 | $0.267 | $2.186 |
The fund hereby designates as a capital gain dividend with respect to the taxable year ended July 31, 2015 $691,972,023, or, if subsequently determined to be different, the net capital gain of such year.
Dividend Growth designates 43% and 72% of the dividends distributed in September and December, respectively during the fiscal year as qualifying for the dividends-received deduction for corporate shareholders.
Dividend Growth designates 60% and 86% of the dividends distributed in September and December, respectively during the fiscal year as amounts which may be taken into account as a dividend for the purposes of the maximum rate under section 1(h)(11) of the Internal Revenue Code.
The fund will notify shareholders in January 2016 of amounts for use in preparing 2015 income tax returns.
Annual Report
Fidelity Dividend Growth Fund
Each year, the Board of Trustees, including the Independent Trustees (together, the Board), votes on the renewal of the management contract with Fidelity Management & Research Company (FMR) and the sub-advisory agreements (together, the Advisory Contracts) for the fund. The Board, assisted by the advice of fund counsel and Independent Trustees' counsel, requests and considers a broad range of information relevant to the renewal of the Advisory Contracts throughout the year.
The Board meets regularly and, at each of its meetings, covers an extensive agenda of topics and materials and considers factors that are relevant to its annual consideration of the renewal of the fund's Advisory Contracts, including the services and support provided to the fund and its shareholders. The Board has established various standing committees (Committees), each composed of and chaired by Independent Trustees with varying backgrounds, to which the Board has assigned specific subject matter responsibilities in order to enhance effective decision-making by the Board. The Board, acting directly and through its Committees, requests and receives information concerning the annual consideration of the renewal of the fund's Advisory Contracts. The Board also meets as needed to consider matters specifically related to the Board's annual consideration of the renewal of the Advisory Contracts. Members of the Board may also meet with trustees of other Fidelity funds through ad hoc joint committees to discuss certain matters relevant to all of the Fidelity funds.
At its July 2015 meeting, the Board unanimously determined to renew the fund's Advisory Contracts. In reaching its determination, the Board considered all factors it believed relevant, including (i) the nature, extent, and quality of the services to be provided to the fund and its shareholders (including the investment performance of the fund); (ii) the competitiveness of the fund's management fee and total expense ratio relative to peer funds; (iii) the total costs of the services to be provided by and the profits to be realized by Fidelity from its relationship with the fund; and (iv) the extent to which (if any) economies of scale exist and would be realized as the fund grows, and whether any economies of scale are appropriately shared with fund shareholders.
In considering whether to renew the Advisory Contracts for the fund, the Board reached a determination, with the assistance of fund counsel and Independent Trustees' counsel and through the exercise of its business judgment, that the renewal of the Advisory Contracts was in the best interests of the fund and its shareholders and that the compensation payable under the Advisory Contracts was fair and reasonable. The Board's decision to renew the Advisory Contracts was not based on any single factor, but rather was based on a comprehensive consideration of all the information provided to the Board at its meetings throughout the year. The Board, in reaching its determination to renew the Advisory Contracts, was aware that shareholders of the fund have a broad range of investment choices available to them, including a wide choice among funds offered by Fidelity's competitors, and that the fund's shareholders, who have the opportunity to review and weigh the disclosure provided by the fund in its prospectus and other public disclosures, have chosen to invest in this fund, which is part of the Fidelity family of funds.
Annual Report
Board Approval of Investment Advisory Contracts and
Management Fees - continued
Nature, Extent, and Quality of Services Provided. The Board considered Fidelity's staffing as it relates to the fund, including the backgrounds of investment personnel of Fidelity, and also considered the fund's investment objective, strategies, and related investment philosophy. The Independent Trustees also had discussions with senior management of Fidelity's investment operations and investment groups. The Board considered the structure of the portfolio manager compensation program and whether this structure provides appropriate incentives to act in the best interests of the fund. Additionally, the Board considered the portfolio managers' investments, if any, in the funds that they manage.
Resources Dedicated to Investment Management and Support Services. The Board and the Fund Oversight and Research Committees reviewed the general qualifications and capabilities of Fidelity's investment staff, including its size, education, experience, and resources, as well as Fidelity's approach to recruiting, training, managing, and compensating investment personnel. The Board noted that Fidelity has continued to increase the resources devoted to non-U.S. offices, including expansion of Fidelity's global investment organization. The Board also noted that Fidelity's analysts have extensive resources, tools and capabilities that allow them to conduct sophisticated quantitative and fundamental analysis, as well as credit analysis of issuers, counterparties and guarantors. Further, the Board considered that Fidelity's investment professionals have sufficient access to global information and data so as to provide competitive investment results over time, and that those professionals also have access to sophisticated tools that permit them to assess portfolio construction and risk and performance attribution characteristics continuously, as well as to transmit new information and research conclusions rapidly around the world. Additionally, in its deliberations, the Board considered Fidelity's trading, risk management, and compliance capabilities and resources, which are integral parts of the investment management process.
Shareholder and Administrative Services. The Board considered (i) the nature, extent, quality, and cost of advisory, administrative, and shareholder services performed by FMR, the sub-advisers (together with FMR, the Investment Advisers), and their affiliates under the Advisory Contracts and under separate agreements covering transfer agency, pricing and bookkeeping, and securities lending services for the fund; (ii) the nature and extent of the supervision of third party service providers, principally custodians and subcustodians; and (iii) the resources devoted to, and the record of compliance with, the fund's compliance policies and procedures. The Board also reviewed the allocation of fund brokerage, including allocations to brokers affiliated with the Investment Advisers, the use of brokerage commissions to pay fund expenses, and the use of "soft" commission dollars to pay for research services.
Annual Report
The Board noted that the growth of fund assets over time across the complex allows Fidelity to reinvest in the development of services designed to enhance the value or convenience of the Fidelity funds as investment vehicles. These services include 24-hour access to account information and market information through telephone representatives and over the Internet, investor education materials and asset allocation tools, and the expanded availability of Fidelity Investor Centers.
In 2014, the Board formed an ad hoc Committee on Transfer Agency Fees to review the variety of transfer agency fee structures throughout the industry and Fidelity's competitive positioning with respect to industry participants.
Investment in a Large Fund Family. The Board considered the benefits to shareholders of investing in a Fidelity fund, including the benefits of investing in a fund that is part of a large family of funds offering a variety of investment disciplines and providing a large variety of mutual fund investor services. The Board noted that Fidelity had taken, or had made recommendations that resulted in the Fidelity funds taking, a number of actions over the previous year that benefited particular funds, including (i) continuing to dedicate additional resources to investment research and to the support of the senior management team that oversees asset management; (ii) continuing efforts to enhance Fidelity's global research capabilities; (iii) launching new funds and making other enhancements to meet client needs; (iv) reducing management fees and total expenses for certain index funds and diversified international funds; (v) continuing to launch dedicated lower cost underlying funds to meet portfolio construction needs related to expanding underlying fund options for Fidelity funds of funds, specifically for the Freedom Fund product lines; (vi) rationalizing product lines and gaining increased efficiencies through fund mergers; (vii) launching active fixed-income exchange-traded funds; (viii) continuing to develop, acquire and implement systems and technology to improve services to the funds and information security and to increase efficiency; (ix) implementing investment enhancements to further strengthen Fidelity's target date product line to increase investors' probability of success in achieving their goals; (x) modifying the eligibility criteria for certain share classes to accommodate roll-over assets from employer-sponsored retirement plans; (xi) launching a new Class W of the Freedom Index Funds to attract and retain Fidelity record-kept retirement plan assets; and (xii) implementing changes to Fidelity's money market product line in response to recent money market regulatory reforms.
Investment Performance. The Board considered whether the fund has operated in accordance with its investment objective, as well as its record of compliance with its investment restrictions and its performance history. The Board noted that there was a portfolio management change for the fund in January 2014.
Annual Report
Board Approval of Investment Advisory Contracts and
Management Fees - continued
The Board took into account discussions with representatives of the Investment Advisers about fund investment performance that occur at Board meetings throughout the year. In this regard the Board noted that as part of regularly scheduled fund reviews and other reports to the Board on fund performance, the Board considers annualized return information for the fund, for different time periods, measured against a securities market index ("benchmark index") and a peer group of funds with similar objectives ("peer group"), if any. In its evaluation of fund investment performance, the Board gave particular attention to information indicating changes in performance of certain Fidelity funds for specific time periods and discussed with the Investment Advisers the reasons for any overperformance or underperformance.
In addition to reviewing absolute and relative fund performance, the Independent Trustees periodically consider the appropriateness of fund performance metrics in evaluating the results achieved. In general, the Independent Trustees believe that fund performance should be evaluated based on net performance (after fees and expenses) of both the highest performing and lowest performing fund share classes, where applicable, compared to appropriate benchmark indices, over appropriate time periods that may include full market cycles, and compared to peer groups, as applicable, over the same periods, taking into account relevant factors including the following: general market conditions; issuer-specific information; and fund cash flows and other factors.
The Independent Trustees recognize that shareholders evaluate performance on a net basis over their own holding periods, for which one-, three-, and five-year periods are often used as a proxy. For this reason, the performance information reviewed by the Board also included net cumulative calendar year total return information for the fund and an appropriate benchmark index and peer group for the most recent one-, three-, and five-year periods, as shown below. Returns are shown compared to the 25th percentile (top of box, 75% beaten) and 75th percentile (bottom of box, 25% beaten) of the peer universe.
Annual Report
Fidelity Dividend Growth Fund
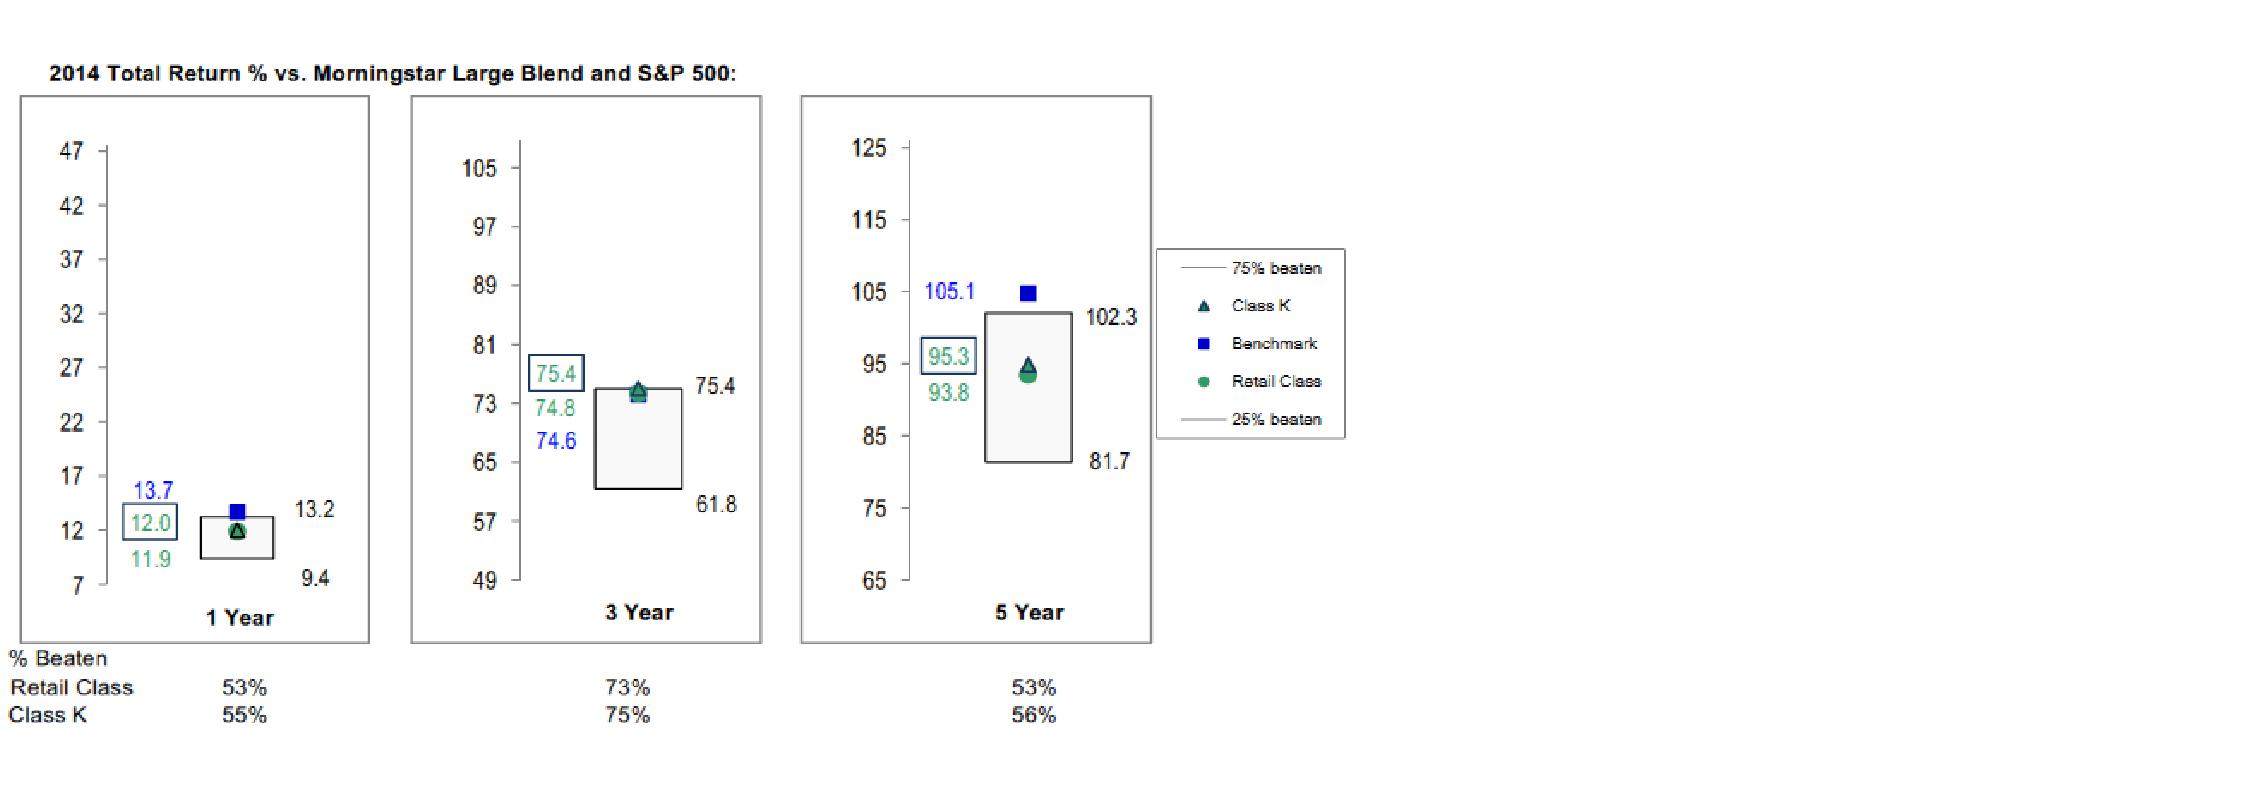
The Board also considered that the fund's management fee is subject to upward or downward adjustment depending upon whether, and to what extent, the fund's investment performance for the performance period exceeds, or is exceeded by, a securities index, thus leading to a performance adjustment for the same period. The Board noted that the performance adjustment provides FMR with a strong economic incentive to seek to achieve superior performance for the fund's shareholders and helps to more closely align the interests of FMR and the shareholders of the fund.
Based on its review, the Board concluded that the nature, extent, and quality of services provided to the fund under the Advisory Contracts should benefit the shareholders of the fund.
Competitiveness of Management Fee and Total Expense Ratio. The Board considered the fund's management fee and total expense ratio compared to "mapped groups" of competitive funds and classes created for the purpose of facilitating the Trustees' competitive analysis of management fees and total expenses. Fidelity creates "mapped groups" by combining similar Lipper investment objective categories that have comparable investment mandates. Combining Lipper investment objective categories aids the Board's management fee and total expense ratio comparisons by broadening the competitive group used for comparison.
Management Fee. The Board considered two proprietary management fee comparisons for the 12-month periods shown in basis points (BP) in the chart below. The group of Lipper funds used by the Board for management fee comparisons is referred to below as the "Total Mapped Group." The Total Mapped Group comparison focuses on a fund's standing in terms of gross management fees before expense reimbursements or caps, and without giving effect to the fund's performance adjustment, relative to the total universe of funds with comparable investment mandates, regardless of whether their management fee structures also are comparable. Funds with comparable investment mandates offer exposure to similar types of securities. Funds with comparable management fee structures have similar management fee contractual arrangements (e.g., flat rate charged for advisory services, all-inclusive fee rate, etc.). "TMG %" represents the percentage of funds in the Total Mapped Group that had management fees that were lower than the fund's. For example, a hypothetical TMG % of 20% would mean that 80% of the funds in the Total Mapped Group had higher, and 20% had lower, management fees than the fund. The fund's actual TMG %s and the number of funds in the Total Mapped Group are in the chart below. The "Asset-Size Peer Group" (ASPG) comparison focuses on a fund's standing relative to a subset of non-Fidelity funds within the Total Mapped Group that are similar in size and management fee structure without taking into account performance adjustments, if any. For example, if a fund is in the first quartile of the ASPG, the fund's management fee ranks in the least expensive or lowest 25% of funds in the ASPG. The ASPG represents at least 15% of the funds in the Total Mapped Group with comparable asset size and management fee structures, subject to a minimum of 50 funds (or all funds in the Total Mapped Group if fewer than 50). Additional information, such as the ASPG quartile in which the fund's management fee rate ranked and the impact of the fund's performance adjustment, is also included in the chart and considered by the Board.
Annual Report
Board Approval of Investment Advisory Contracts and
Management Fees - continued
Fidelity Dividend Growth Fund
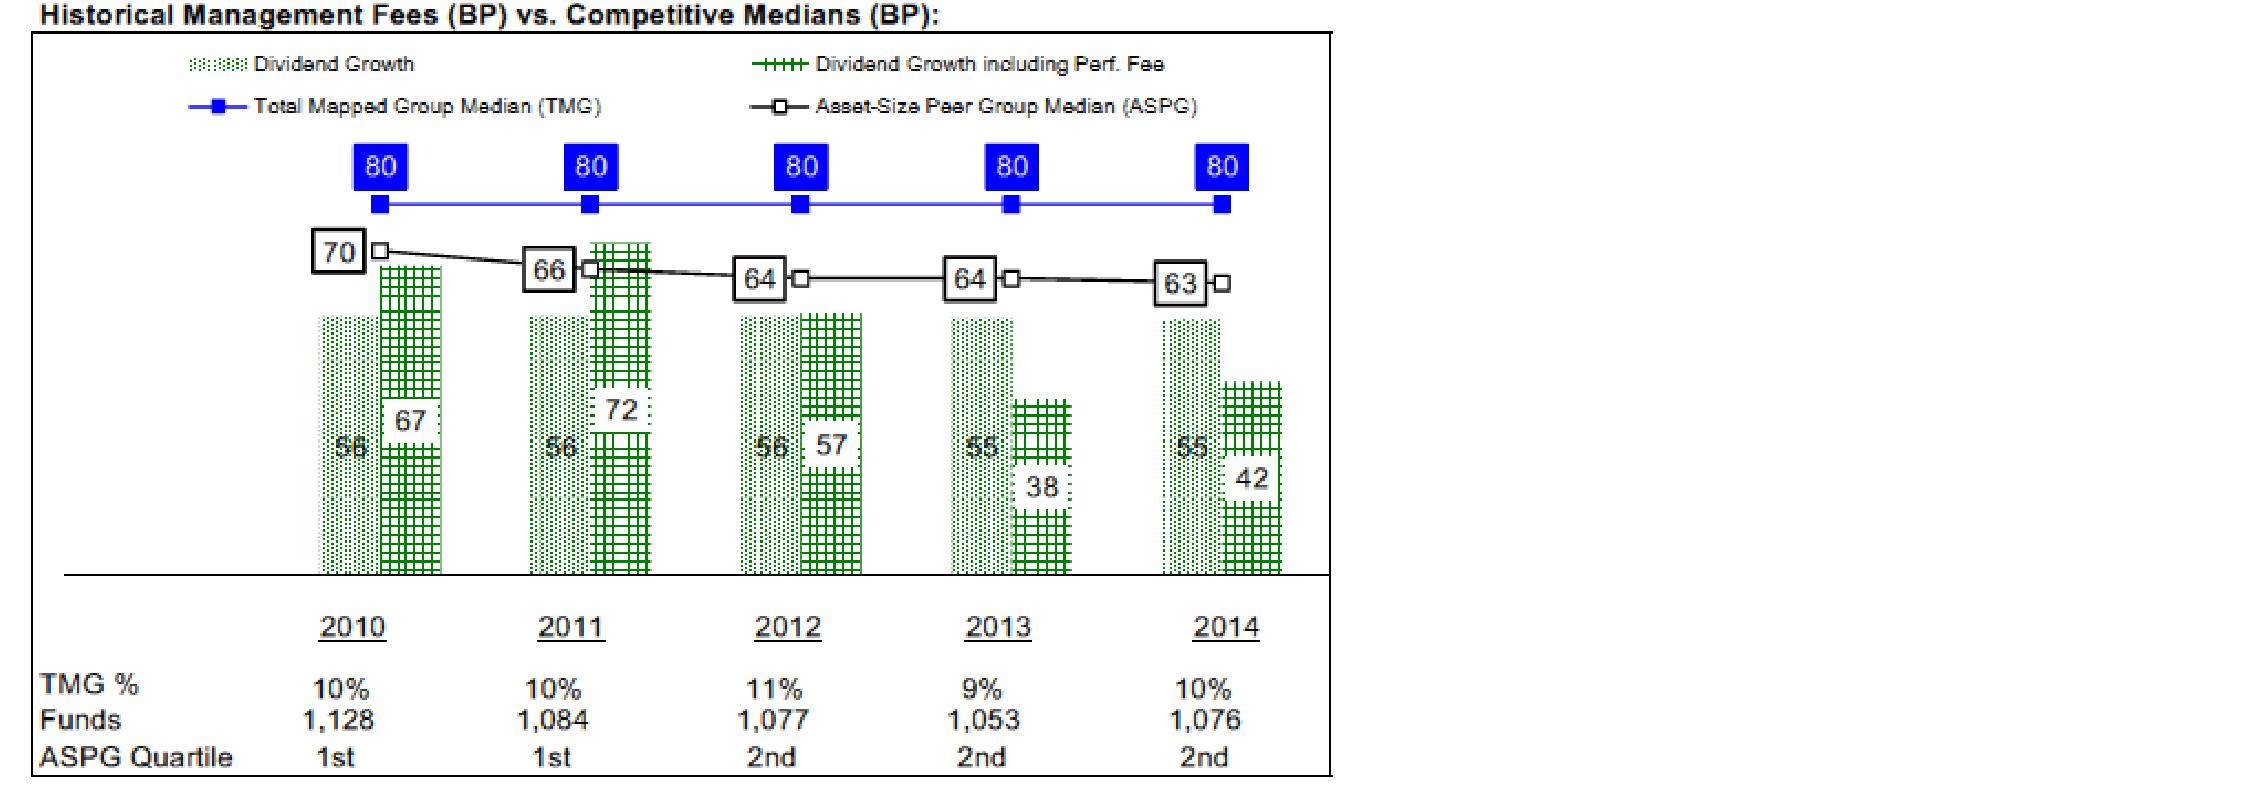
Annual Report
The Board noted that the fund's management fee rate ranked below the median of its Total Mapped Group and below the median of its ASPG for 2014. The Board also noted the effect of the fund's performance adjustment, if any, on the fund's management fee ranking.
The Board noted that, in 2014, the ad hoc Committee on Group Fee was formed by it and other Fidelity fund boards to conduct an in-depth review of the "group fee" component of the management fee of funds with such management fee structures. Committee focus included the mechanics of the group fee, the competitive landscape of group fee structures, Fidelity funds with no group fee component and investment products not included in group fee assets. The Board also considered that, for funds subject to the group fee, FMR agreed to voluntarily waive fees over a specified period of time in amounts designed to account for assets converted from certain funds to certain collective investment trusts.
The Board also noted that, in 2013, the ad hoc Committee on Management Fees was formed to conduct an in-depth review of the management fee rates of Fidelity's active equity mutual funds. The Committee focused on the following areas: (i) standard fee structures; (ii) research consumption and trading evolution; (iii) management fee competitiveness/profitability by category; and (iv) factors that drive institutional pricing.
Based on its review, the Board concluded that the fund's management fee is fair and reasonable in light of the services that the fund receives and the other factors considered.
Total Expense Ratio. In its review of each class's total expense ratio, the Board considered the fund's management fee as well as other fund or class expenses, as applicable, such as transfer agent fees, pricing and bookkeeping fees, and custodial, legal, and audit fees. The Board noted the impact of the fund's performance adjustment. The Board also noted that Fidelity may agree to waive fees and expenses from time to time, and the extent to which, if any, it has done so for the fund. As part of its review, the Board also considered the current and historical total expense ratios of each class of the fund compared to competitive fund median expenses. Each class of the fund is compared to those funds and classes in the Total Mapped Group (used by the Board for management fee comparisons) that have a similar sales load structure.
The Board noted that the total expense ratio of each class ranked below its competitive median for 2014.
Fees Charged to Other Fidelity Clients. The Board also considered Fidelity fee structures and other information with respect to clients of Fidelity, such as other funds advised or subadvised by Fidelity, pension plan clients, and other institutional clients with similar mandates. The Board noted the findings of the 2013 ad hoc joint committee (created with the board of other Fidelity funds), which reviewed and compared Fidelity's institutional investment advisory business with its business of providing services to the Fidelity funds, including the differences in services provided, fees charged, and costs incurred, as well as competition in their respective marketplaces.
Annual Report
Board Approval of Investment Advisory Contracts and
Management Fees - continued
Based on its review of total expense ratios and fees charged to other Fidelity clients, the Board concluded that the total expense ratio of each class of the fund was reasonable in light of the services that the fund and its shareholders receive and the other factors considered.
Costs of the Services and Profitability. The Board considered the revenues earned and the expenses incurred by Fidelity in conducting the business of developing, marketing, distributing, managing, administering and servicing the fund and servicing the fund's shareholders. The Board also considered the level of Fidelity's profits in respect of all the Fidelity funds.
On an annual basis, Fidelity presents to the Board information about the profitability of its relationship with the fund. Fidelity calculates profitability information for each fund, as well as aggregate profitability information for groups of Fidelity funds and all Fidelity funds, using a series of detailed revenue and cost allocation methodologies which originate with the books and records of Fidelity on which Fidelity's audited financial statements are based. The Audit Committee of the Board reviews any significant changes from the prior year's methodologies.
PricewaterhouseCoopers LLP (PwC), independent registered public accounting firm and auditor to Fidelity and certain Fidelity funds, has been engaged annually by the Board as part of the Board's assessment of Fidelity's profitability analysis. PwC's engagement includes the review and assessment of the methodologies used by Fidelity in determining the revenues and expenses attributable to Fidelity's mutual fund business, and completion of agreed-upon procedures in respect of the mathematical accuracy of fund profitability and its conformity to established allocation methodologies. After considering PwC's reports issued under the engagement and information provided by Fidelity, the Board concluded that while other allocation methods may also be reasonable, Fidelity's profitability methodologies are reasonable in all material respects.
The Board also reviewed Fidelity's non-fund businesses and fall-out benefits related to the mutual fund business as well as cases where Fidelity's affiliates may benefit from or be related to the fund's business.
The Board considered the costs of the services provided by and the profits realized by Fidelity in connection with the operation of the fund and was satisfied that the profitability was not excessive.
Economies of Scale. The Board considered whether there have been economies of scale in respect of the management of the Fidelity funds, whether the Fidelity funds (including the fund) have appropriately benefited from any such economies of scale, and whether there is potential for realization of any further economies of scale. The Board considered the extent to which the fund will benefit from economies of scale as assets grow through increased services to the fund, through waivers or reimbursements, or through fee or expense ratio reductions. The Board also noted that in 2013, it and the boards of other Fidelity funds created an ad hoc committee (the Economies of Scale Committee) to analyze whether Fidelity attains economies of scale in respect of the management and servicing of the Fidelity funds, whether the Fidelity funds have appropriately benefited from such economies of scale, and whether there is potential for realization of any further economies of scale.
Annual Report
The Board recognized that the fund's management contract incorporates a "group fee" structure, which provides for lower group fee rates as total group assets increase, and for higher group fee rates as total group assets decrease (with "group assets" defined to include fund assets under FMR's management plus sector fund assets previously under FMR's management and currently managed by Fidelity SelectCo, LLC).
FMR calculates the group fee rates based on a tiered asset "breakpoint" schedule that varies based on asset class. The Board considered that the group fee is designed to deliver the benefits of economies of scale to fund shareholders when total Fidelity fund assets increase, even if assets of any particular fund are unchanged or have declined, because some portion of Fidelity's costs are attributable to services provided to all Fidelity funds, and all funds benefit if those costs can be allocated among more assets. The Board concluded that, given the group fee structure, fund shareholders will benefit from lower management fees as group assets increase at the fund complex level, regardless of whether Fidelity achieves any such economies of scale.
The Board concluded, taking into account the analysis of the Economies of Scale Committee, that economies of scale, if any, are being appropriately shared between fund shareholders and Fidelity.
Additional Information Requested by the Board. In order to develop fully the factual basis for consideration of the Fidelity funds' Advisory Contracts, the Board requested and received additional information on certain topics, including: (i) fund performance trends and Fidelity's long-term strategies for certain funds; (ii) the various share classes employed by Fidelity and the attributes of each class, together with similar information on the distribution and servicing payments made by Fidelity or the funds to third-party participants in the distribution channels; (iii) fund profitability, and fund performance in relation to fund profitability; (iv) the methodology with respect to evaluating competitive fund data and peer group classifications and fee comparisons; (v) annual fund profitability margins, with particular focus on certain funds with negative margins; (vi) the realization of fall-out benefits in certain Fidelity business units; (vii) economies of scale and the way in which they are shared with fund shareholders; (viii) Fidelity's group fee structures, including the group fee schedule of breakpoints; (ix) the impact of cost containment measures on the funds; and (x) the transfer agent fee structure.
Annual Report
Board Approval of Investment Advisory Contracts and
Management Fees - continued
Based on its evaluation of all of the conclusions noted above, and after considering all factors it believed relevant, the Board concluded that the advisory fee structures are fair and reasonable, and that the fund's Advisory Contracts should be renewed.
Annual Report
Investment Adviser
Fidelity Management & Research Company
Boston, MA
Investment Sub-Advisers
FMR Co., Inc.
FMR Investment Management
(U.K.) Limited
Fidelity Management & Research
(Hong Kong) Limited
Fidelity Management & Research
(Japan) Limited
General Distributor
Fidelity Distributors Corporation
Smithfield, RI
Transfer and Service Agents
Fidelity Investments Institutional
Operations Company, Inc.
Boston, MA
Fidelity Service Company, Inc.
Boston, MA
Custodian
Brown Brothers Harriman & Co.
Boston, MA
The Fidelity Telephone Connection
Mutual Fund 24-Hour Service
Exchanges/Redemptions
and Account Assistance 1-800-544-6666
Product Information 1-800-544-6666
Retirement Accounts 1-800-544-4774 (8 a.m. - 9 p.m.)
TDD Service 1-800-544-0118 for the deaf and hearing impaired
(9 a.m. - 9 p.m. Eastern time)
Fidelity Automated Service
Telephone (FAST®)
1-800-544-5555

Automated line for quickest service
(Fidelity Investment logo)(registered trademark)
Corporate Headquarters
245 Summer St., Boston, MA 02210
www.fidelity.com
DGF-UANN-0915
1.789245.112
Fidelity®
Dividend Growth
Fund -
Class K
Annual Report
July 31, 2015
(Fidelity Cover Art)
Contents
Performance | (Click Here) | How the fund has done over time. |
Management's Discussion of Fund Performance | (Click Here) | The Portfolio Manager's review of fund performance and strategy. |
Shareholder Expense Example | (Click Here) | An example of shareholder expenses. |
Investment Changes | (Click Here) | A summary of major shifts in the fund's investments over the past six months. |
Investments | (Click Here) | A complete list of the fund's investments with their market values. |
Financial Statements | (Click Here) | Statements of assets and liabilities, operations, and changes in net assets, as well as financial highlights. |
Notes | (Click Here) | Notes to the financial statements. |
Report of Independent Registered Public Accounting Firm | (Click Here) | |
Trustees and Officers | (Click Here) | |
Distributions | (Click Here) | |
Board Approval of Investment Advisory Contracts and Management Fees | (Click Here) | |
To view a fund's proxy voting guidelines and proxy voting record for the 12-month period ended June 30, visit http://www.fidelity.com/proxyvotingresults or visit the Securities and Exchange Commission's (SEC) web site at http://www.sec.gov. You may also call 1-800-835-5092 to request a free copy of the proxy voting guidelines.
Standard & Poor's, S&P and S&P 500 are registered service marks of The McGraw-Hill Companies, Inc. and have been licensed for use by Fidelity Distributors Corporation.
Other third-party marks appearing herein are the property of their respective owners.
All other marks appearing herein are registered or unregistered trademarks or service marks of FMR LLC or an affiliated company. © 2015 FMR LLC. All rights reserved.
Annual Report
This report and the financial statements contained herein are submitted for the general information of the shareholders of the fund. This report is not authorized for distribution to prospective investors in the fund unless preceded or accompanied by an effective prospectus.
A fund files its complete schedule of portfolio holdings with the SEC for the first and third quarters of each fiscal year on Form N-Q. Forms N-Q are available on the SEC's web site at http://www.sec.gov. A fund's Forms N-Q may be reviewed and copied at the SEC's Public Reference Room in Washington, DC. Information regarding the operation of the SEC's Public Reference Room may be obtained by calling 1-800-SEC-0330. For a complete list of a fund's portfolio holdings, view the most recent holdings listing, semiannual report, or annual report on Fidelity's web site at http://www.fidelity.com, http://www.advisor.fidelity.com, or http://www.401k.com, as applicable.
NOT FDIC INSURED • MAY LOSE VALUE • NO BANK GUARANTEE
Neither the fund nor Fidelity Distributors Corporation is a bank.
Annual Report
Average annual total return reflects the change in the value of an investment, assuming reinvestment of the class' distributions from dividend income and capital gains (the profits earned upon the sale of securities that have grown in value, if any) and assuming a constant rate of performance each year. The $10,000 table and the fund's returns do not reflect the deduction of taxes that a shareholder would pay on fund distributions or the redemption of fund shares. During periods of reimbursement by Fidelity, a fund's total return will be greater than it would be had the reimbursement not occurred. How a fund did yesterday is no guarantee of how it will do tomorrow.
Average Annual Total Returns
Periods ended July 31, 2015 | Past 1
year | Past 5
years | Past 10
years |
Class K A | 9.65% | 14.85% | 7.51% |
A The initial offering of Class K shares took place on May 9, 2008. Returns prior to May 9, 2008 are those of Fidelity® Dividend Growth Fund, the original class of the fund.
$10,000 Over 10 Years
Let's say hypothetically that $10,000 was invested in Fidelity® Dividend Growth Fund - Class K on July 31, 2005. The chart shows how the value of your investment would have changed, and also shows how the S&P 500® Index performed over the same period. See footnote A above for additional information regarding the performance of Class K.
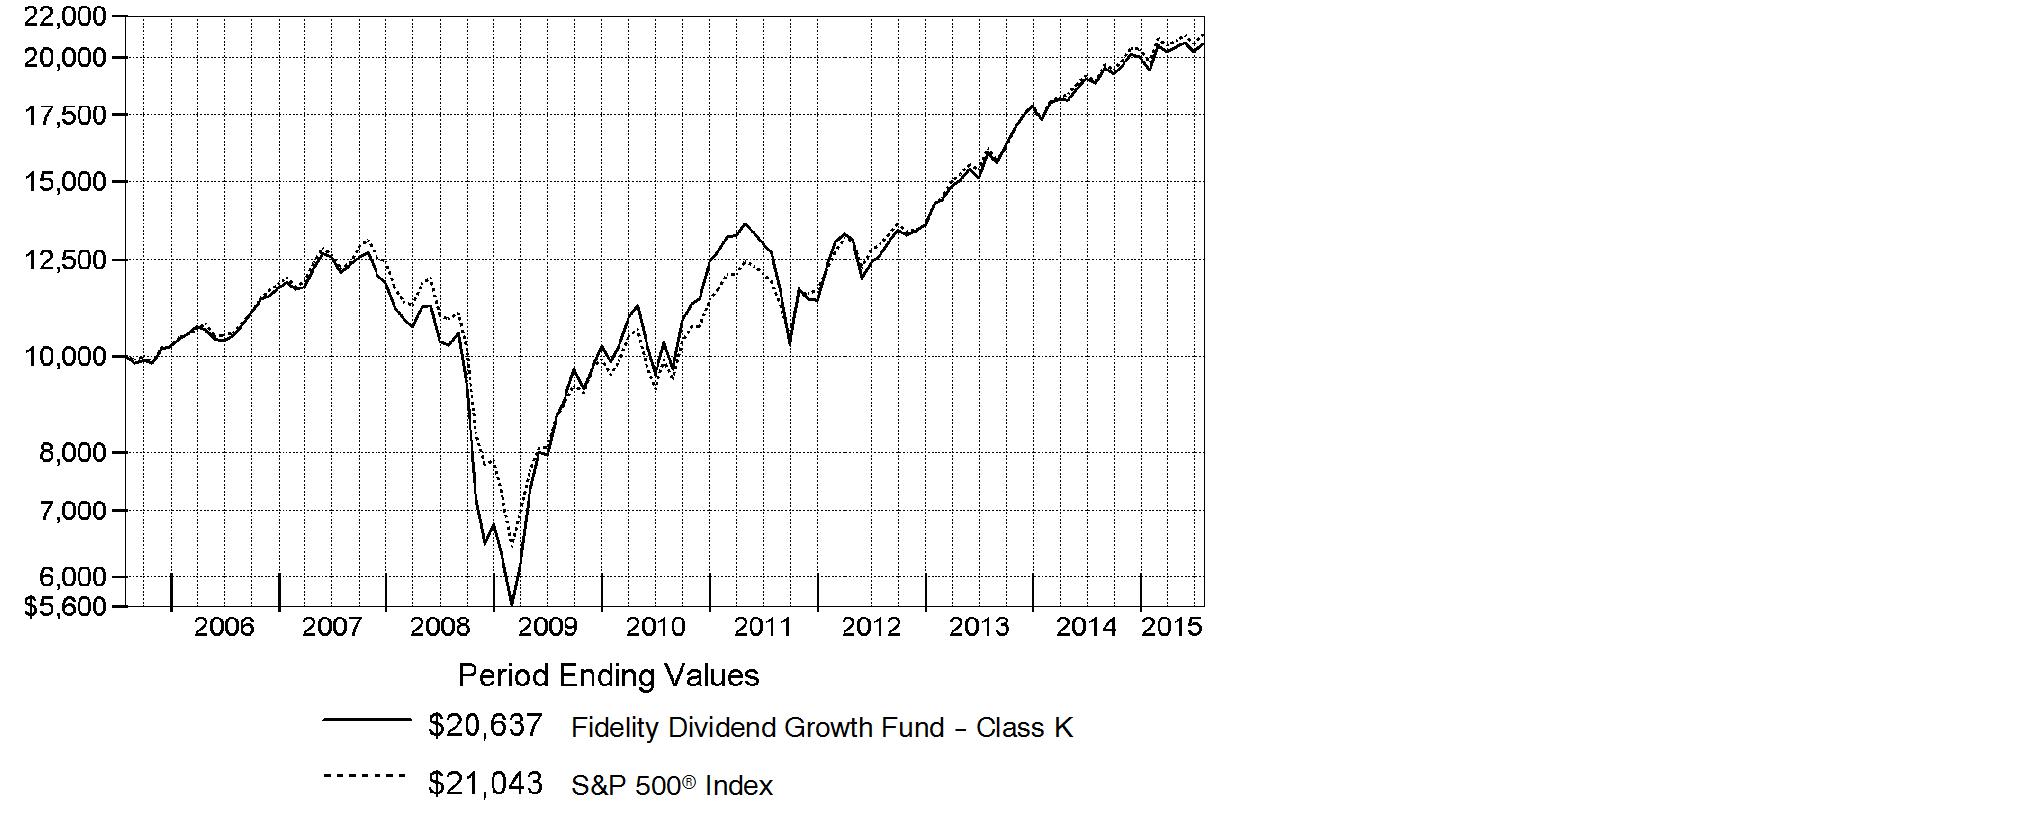
Annual Report
Market Recap: The U.S. equity market gained strongly for the 12 months ending July 31, 2015, as stocks recovered from volatility in late 2014 and early 2015, supported by a still-positive economic backdrop. The S&P 500® Index returned 11.21%, with growth stocks in the index far outpacing value-oriented names on prospects for continued U.S. economic growth. Consequently, the growth-oriented Nasdaq Composite Index® rose 18.71%, outpacing the broader S&P 500®, as well as the 12.03% advance of the smaller-cap Russell 2000® Index. Within the S&P 500®, seven of 10 sectors notched a gain, with significant performance variation. Health care (+27%) led the way, aided by merger activity. Consumer discretionary (+24%) benefited from spending linked to a seven-year low in unemployment. Strong first halves for the consumer staples sector and the real estate segment of financials yielded above-market returns (19% and 12%, respectively) for the full-year period. Conversely, energy (-26%) significantly lagged, due to a roughly 55% decline for U.S. crude-oil prices. Materials (-4%) also lost ground. At period end, investors remained focused on the slowing rate of U.S. earnings growth, the possible effect of a relatively stronger U.S. dollar on exports and inflation, and whether an economic slowdown in China would create ripples for the global economy.
Comments from Portfolio Manager Ramona Persaud: For the year, the fund's share classes underperformed the benchmark S&P 500®. (For specific class-level results, please see the Performance section of this report.) Versus the benchmark, stock picking in materials and information technology hurt performance, as did positioning in consumer discretionary and the fund's cash position, the latter of which detracted in an up market. While both security selection and an underweighting in the lagging energy sector were relative contributors overall, an overweighting in integrated-oil giant Chevron, one of the fund's largest holdings, proved the fund's largest individual detractor. Its shares suffered along with the entire sector as energy prices collapsed. Overall, the fund's foreign investments were a plus versus the benchmark, despite the continued rise of the U.S. dollar. Included was a non-benchmark stake in European telecom and media company Altice, the fund's top individual contributor. Shares of Luxembourg-based Altice rose on news of acquisitions in Portugal and France.
The views expressed above reflect those of the portfolio manager(s) only through the end of the period as stated on the cover of this report and do not necessarily represent the views of Fidelity or any other person in the Fidelity organization. Any such views are subject to change at any time based upon market or other conditions and Fidelity disclaims any responsibility to update such views. These views may not be relied on as investment advice and, because investment decisions for a Fidelity fund are based on numerous factors, may not be relied on as an indication of trading intent on behalf of any Fidelity fund.
Annual Report
Shareholder Expense Example
As a shareholder of the Fund, you incur two types of costs: (1) transaction costs, and (2) ongoing costs, including management fees and other Fund expenses. This Example is intended to help you understand your ongoing costs (in dollars) of investing in the Fund and to compare these costs with the ongoing costs of investing in other mutual funds.
The Example is based on an investment of $1,000 invested at the beginning of the period and held for the entire period (February 1, 2015 to July 31, 2015).
Actual Expenses
The first line of the accompanying table for each class of the Fund provides information about actual account values and actual expenses. You may use the information in this line, together with the amount you invested, to estimate the expenses that you paid over the period. Simply divide your account value by $1,000.00 (for example, an $8,600 account value divided by $1,000.00 = 8.6), then multiply the result by the number in the first line for a class of the Fund under the heading entitled "Expenses Paid During Period" to estimate the expenses you paid on your account during this period. A small balance maintenance fee of $12.00 that is charged once a year may apply for certain accounts with a value of less than $2,000. This fee is not included in the table below. If it was, the estimate of expenses you paid during the period would be higher, and your ending account value lower, by this amount. In addition, the Fund, as a shareholder in the underlying Fidelity Central Funds, will indirectly bear its pro-rata share of the fees and expenses incurred by the underlying Fidelity Central Funds. These fees and expenses are not included in the Fund's annualized expense ratio used to calculate the expense estimate in the table below.
Hypothetical Example for Comparison Purposes
The second line of the accompanying table for each class of the Fund provides information about hypothetical account values and hypothetical expenses based on a Class' actual expense ratio and an assumed rate of return of 5% per year before expenses, which is not the Class' actual return. The hypothetical account values and expenses may not be used to estimate the actual ending account balance or expenses you paid for the period. You may use this information to compare the ongoing costs of investing in the Fund and other funds. To do so, compare this 5% hypothetical example with the 5% hypothetical examples that appear in the shareholder reports of the other funds. A small balance maintenance fee of $12.00 that is charged once a year may apply for certain accounts with a value of less than $2,000. This fee is not included in the table below. If it was, the estimate of expenses you paid during the period would be higher, and your ending account value lower, by this amount. In addition, the Fund, as a shareholder in the underlying Fidelity Central Funds, will indirectly bear its pro-rata share of the fees and expenses incurred by the underlying Fidelity Central Funds. These fees and expenses are not included in the Fund's annualized expense ratio used to calculate the expense estimate in the table below.
Please note that the expenses shown in the table are meant to highlight your ongoing costs only and do not reflect any transaction costs. Therefore, the second line of the table is useful in comparing ongoing costs only, and will not help you determine the relative total costs of owning different funds.
Annual Report
| Annualized
Expense RatioB | Beginning
Account Value
February 1, 2015 | Ending
Account Value
July 31, 2015 | Expenses Paid
During Period*
February 1, 2015
to July 31, 2015 |
Dividend Growth | .69% | | | |
Actual | | $ 1,000.00 | $ 1,063.30 | $ 3.53 |
HypotheticalA | | $ 1,000.00 | $ 1,021.37 | $ 3.46 |
Class K | .58% | | | |
Actual | | $ 1,000.00 | $ 1,063.90 | $ 2.97 |
HypotheticalA | | $ 1,000.00 | $ 1,021.92 | $ 2.91 |
A 5% return per year before expenses
B Annualized expense ratio reflects expenses net of applicable fee waivers.
* Expenses are equal to each Class' annualized expense ratio, multiplied by the average account value over the period, multiplied by 181/365 (to reflect the one-half year period).
Annual Report
Investment Changes (Unaudited)
Top Ten Stocks as of July 31, 2015 |
| % of fund's
net assets | % of fund's net assets
6 months ago |
Apple, Inc. | 4.7 | 4.4 |
JPMorgan Chase & Co. | 2.9 | 1.8 |
General Electric Co. | 2.6 | 1.8 |
Johnson & Johnson | 2.6 | 2.4 |
Wells Fargo & Co. | 2.5 | 2.1 |
Google, Inc. Class C | 2.5 | 2.3 |
Microsoft Corp. | 2.5 | 2.6 |
Exxon Mobil Corp. | 2.3 | 1.9 |
CVS Health Corp. | 2.3 | 1.4 |
Medtronic PLC | 2.0 | 2.0 |
| 26.9 | |
Top Five Market Sectors as of July 31, 2015 |
| % of fund's
net assets | % of fund's net assets
6 months ago |
Information Technology | 23.3 | 21.5 |
Financials | 17.3 | 14.0 |
Health Care | 15.2 | 17.0 |
Consumer Staples | 12.0 | 11.7 |
Industrials | 9.6 | 7.7 |
Asset Allocation (% of fund's net assets) |
As of July 31, 2015 * | As of January 31, 2015 ** |
 | Stocks 97.5% | |  | Stocks 97.2% | |
 | Convertible
Securities 0.1% | |  | Convertible
Securities 0.1% | |
 | Short-Term
Investments and
Net Other Assets (Liabilities) 2.4% | |  | Short-Term
Investments and
Net Other Assets (Liabilities) 2.7% | |
* Foreign investments | 15.5% | | ** Foreign investments | 17.0% | |

Annual Report
Investments July 31, 2015
Showing Percentage of Net Assets
Common Stocks - 97.5% |
| Shares | | Value (000s) |
CONSUMER DISCRETIONARY - 9.2% |
Diversified Consumer Services - 0.6% |
H&R Block, Inc. | 1,512,420 | | $ 50,348 |
Hotels, Restaurants & Leisure - 1.1% |
Las Vegas Sands Corp. | 390,400 | | 21,878 |
Wyndham Worldwide Corp. | 831,491 | | 68,615 |
| | 90,493 |
Leisure Products - 0.3% |
Vista Outdoor, Inc. (a) | 438,400 | | 20,679 |
Media - 2.6% |
Altice SA (a) | 506,500 | | 63,970 |
Comcast Corp. Class A | 2,482,696 | | 154,945 |
| | 218,915 |
Multiline Retail - 1.9% |
Dillard's, Inc. Class A | 559,900 | | 57,043 |
Target Corp. | 1,298,600 | | 106,290 |
| | 163,333 |
Specialty Retail - 1.9% |
AutoZone, Inc. (a) | 109,500 | | 76,753 |
Foot Locker, Inc. | 1,229,479 | | 86,740 |
| | 163,493 |
Textiles, Apparel & Luxury Goods - 0.8% |
Fossil Group, Inc. (a) | 316,000 | | 21,725 |
VF Corp. | 583,100 | | 44,951 |
| | 66,676 |
TOTAL CONSUMER DISCRETIONARY | | 773,937 |
CONSUMER STAPLES - 12.0% |
Beverages - 3.7% |
Constellation Brands, Inc. Class A (sub. vtg.) | 438,200 | | 52,593 |
Dr. Pepper Snapple Group, Inc. | 482,108 | | 38,675 |
PepsiCo, Inc. | 1,008,100 | | 97,130 |
The Coca-Cola Co. | 2,936,038 | | 120,612 |
| | 309,010 |
Food & Staples Retailing - 4.2% |
CVS Health Corp. | 1,676,300 | | 188,533 |
Kroger Co. | 933,418 | | 36,627 |
Common Stocks - continued |
| Shares | | Value (000s) |
CONSUMER STAPLES - continued |
Food & Staples Retailing - continued |
Rami Levi Chain Stores Hashikma Marketing 2006 Ltd. | 489,201 | | $ 23,325 |
Walgreens Boots Alliance, Inc. | 1,077,636 | | 104,132 |
| | 352,617 |
Food Products - 0.5% |
Greencore Group PLC | 6,474,677 | | 31,992 |
Hilton Food Group PLC | 1,939,205 | | 13,340 |
| | 45,332 |
Household Products - 1.8% |
Energizer Holdings, Inc. | 154,300 | | 5,942 |
Procter & Gamble Co. | 1,912,600 | | 146,696 |
| | 152,638 |
Personal Products - 0.2% |
Edgewell Personal Care Co. (a) | 154,300 | | 14,768 |
Tobacco - 1.6% |
British American Tobacco PLC (United Kingdom) | 541,303 | | 32,140 |
Imperial Tobacco Group PLC | 822,622 | | 43,228 |
Japan Tobacco, Inc. | 1,532,800 | | 59,532 |
| | 134,900 |
TOTAL CONSUMER STAPLES | | 1,009,265 |
ENERGY - 7.2% |
Energy Equipment & Services - 0.0% |
Aspen Aerogels, Inc. (a) | 587,999 | | 3,875 |
Oil, Gas & Consumable Fuels - 7.2% |
Chevron Corp. | 1,827,300 | | 161,680 |
Columbia Pipeline Group, Inc. | 1,146,600 | | 33,458 |
Emerald Oil, Inc. warrants 2/4/16 (a) | 8,559 | | 0 |
EQT Midstream Partners LP | 248,000 | | 19,537 |
Exxon Mobil Corp. | 2,424,497 | | 192,044 |
Imperial Oil Ltd. | 816,200 | | 30,199 |
Kinder Morgan, Inc. | 2,231,100 | | 77,285 |
Northern Oil & Gas, Inc. (a) | 1,037,290 | | 4,938 |
PrairieSky Royalty Ltd. (d) | 971,100 | | 19,937 |
Suncor Energy, Inc. | 2,306,200 | | 64,962 |
| | 604,040 |
TOTAL ENERGY | | 607,915 |
Common Stocks - continued |
| Shares | | Value (000s) |
FINANCIALS - 17.3% |
Banks - 11.5% |
Bank of America Corp. | 8,043,817 | | $ 143,823 |
Citigroup, Inc. | 2,279,961 | | 133,287 |
JPMorgan Chase & Co. | 3,539,635 | | 242,571 |
PacWest Bancorp | 1,236,200 | | 57,224 |
SunTrust Banks, Inc. | 1,316,300 | | 58,365 |
U.S. Bancorp | 2,678,069 | | 121,075 |
Wells Fargo & Co. | 3,613,193 | | 209,095 |
| | 965,440 |
Capital Markets - 1.8% |
Ameriprise Financial, Inc. | 485,600 | | 61,025 |
Diamond Hill Investment Group, Inc. | 47,038 | | 9,054 |
Franklin Resources, Inc. | 437,400 | | 19,924 |
The Blackstone Group LP | 1,646,084 | | 64,609 |
| | 154,612 |
Consumer Finance - 1.1% |
Capital One Financial Corp. | 1,193,567 | | 97,037 |
Imperial Holdings, Inc. warrants 4/11/19 | 48,012 | | 10 |
| | 97,047 |
Diversified Financial Services - 1.2% |
McGraw Hill Financial, Inc. | 965,827 | | 98,273 |
Insurance - 1.1% |
MetLife, Inc. | 884,100 | | 49,280 |
The Chubb Corp. | 322,800 | | 40,134 |
| | 89,414 |
Real Estate Investment Trusts - 0.6% |
American Tower Corp. | 519,100 | | 49,372 |
TOTAL FINANCIALS | | 1,454,158 |
HEALTH CARE - 15.2% |
Biotechnology - 1.3% |
Amgen, Inc. | 612,410 | | 108,145 |
Health Care Equipment & Supplies - 2.8% |
Medtronic PLC | 2,130,103 | | 166,979 |
The Cooper Companies, Inc. | 358,484 | | 63,452 |
| | 230,431 |
Common Stocks - continued |
| Shares | | Value (000s) |
HEALTH CARE - continued |
Health Care Providers & Services - 1.8% |
Cardinal Health, Inc. | 789,503 | | $ 67,092 |
McKesson Corp. | 396,058 | | 87,359 |
| | 154,451 |
Health Care Technology - 0.2% |
CompuGroup Medical AG | 535,522 | | 16,912 |
Pharmaceuticals - 9.1% |
AbbVie, Inc. | 1,437,300 | | 100,625 |
Allergan PLC (a) | 361,900 | | 119,843 |
Astellas Pharma, Inc. | 2,833,000 | | 42,677 |
Johnson & Johnson | 2,165,943 | | 217,049 |
Sanofi SA sponsored ADR | 1,269,900 | | 68,562 |
Shire PLC | 1,026,500 | | 91,252 |
Teva Pharmaceutical Industries Ltd. sponsored ADR | 1,843,900 | | 127,266 |
| | 767,274 |
TOTAL HEALTH CARE | | 1,277,213 |
INDUSTRIALS - 9.6% |
Aerospace & Defense - 2.5% |
The Boeing Co. | 872,900 | | 125,846 |
United Technologies Corp. | 871,766 | | 87,447 |
| | 213,293 |
Air Freight & Logistics - 0.8% |
FedEx Corp. | 371,952 | | 63,760 |
Construction & Engineering - 0.1% |
Astaldi SpA | 658,500 | | 6,335 |
Electrical Equipment - 0.7% |
BWX Technologies, Inc. | 2,487,600 | | 61,095 |
Industrial Conglomerates - 4.4% |
Danaher Corp. | 986,292 | | 90,305 |
General Electric Co. | 8,575,500 | | 223,821 |
Roper Industries, Inc. | 336,044 | | 56,210 |
| | 370,336 |
Machinery - 0.8% |
Deere & Co. | 725,300 | | 68,592 |
Road & Rail - 0.3% |
CSX Corp. | 829,700 | | 25,953 |
TOTAL INDUSTRIALS | | 809,364 |
Common Stocks - continued |
| Shares | | Value (000s) |
INFORMATION TECHNOLOGY - 23.3% |
Communications Equipment - 3.2% |
Cisco Systems, Inc. | 4,609,986 | | $ 131,016 |
QUALCOMM, Inc. | 2,161,983 | | 139,210 |
| | 270,226 |
Electronic Equipment & Components - 0.9% |
TE Connectivity Ltd. | 1,178,294 | | 71,782 |
Internet Software & Services - 2.5% |
Google, Inc. Class C | 333,206 | | 208,457 |
IT Services - 3.7% |
ASAC II LP (a)(e) | 2,514,134 | | 43,673 |
Fidelity National Information Services, Inc. | 1,007,950 | | 65,950 |
IBM Corp. | 771,800 | | 125,024 |
Leidos Holdings, Inc. | 421,100 | | 17,181 |
Science Applications International Corp. | 241,500 | | 12,964 |
Total System Services, Inc. | 1,059,500 | | 48,970 |
| | 313,762 |
Software - 5.4% |
Activision Blizzard, Inc. | 1,709,717 | | 44,094 |
Micro Focus International PLC | 1,907,363 | | 41,641 |
Microsoft Corp. | 4,447,716 | | 207,708 |
Oracle Corp. | 4,072,160 | | 162,642 |
| | 456,085 |
Technology Hardware, Storage & Peripherals - 7.6% |
Apple, Inc. | 3,236,218 | | 392,557 |
EMC Corp. | 4,270,300 | | 114,828 |
Hewlett-Packard Co. | 2,616,800 | | 79,865 |
Samsung Electronics Co. Ltd. | 19,759 | | 20,080 |
Western Digital Corp. | 369,400 | | 31,791 |
| | 639,121 |
TOTAL INFORMATION TECHNOLOGY | | 1,959,433 |
MATERIALS - 2.8% |
Chemicals - 2.5% |
CF Industries Holdings, Inc. | 1,266,900 | | 75,000 |
LyondellBasell Industries NV Class A | 603,500 | | 56,626 |
Monsanto Co. | 415,700 | | 42,356 |
Potash Corp. of Saskatchewan, Inc. | 1,412,000 | | 38,413 |
| | 212,395 |
Common Stocks - continued |
| Shares | | Value (000s) |
MATERIALS - continued |
Containers & Packaging - 0.3% |
Ball Corp. | 360,100 | | $ 24,429 |
TOTAL MATERIALS | | 236,824 |
TELECOMMUNICATION SERVICES - 0.9% |
Diversified Telecommunication Services - 0.3% |
AT&T, Inc. | 885,500 | | 30,762 |
Wireless Telecommunication Services - 0.6% |
Vodafone Group PLC sponsored ADR | 1,303,400 | | 49,242 |
TOTAL TELECOMMUNICATION SERVICES | | 80,004 |
TOTAL COMMON STOCKS (Cost $6,728,369) | 8,208,113 |
Convertible Bonds - 0.1% |
| Principal Amount (000s) | | |
ENERGY - 0.1% |
Oil, Gas & Consumable Fuels - 0.1% |
Amyris, Inc. 3% 2/27/17 (Cost $7,356) | | $ 7,356 | | 6,527 |
Money Market Funds - 2.9% |
| Shares | | |
Fidelity Cash Central Fund, 0.17% (b) | 224,911,560 | | 224,912 |
Fidelity Securities Lending Cash Central Fund, 0.18% (b)(c) | 21,483,522 | | 21,484 |
TOTAL MONEY MARKET FUNDS (Cost $246,396) | 246,396 |
TOTAL INVESTMENT PORTFOLIO - 100.5% (Cost $6,982,121) | | 8,461,036 |
NET OTHER ASSETS (LIABILITIES) - (0.5)% | | (44,651) |
NET ASSETS - 100% | $ 8,416,385 |
Legend |
(a) Non-income producing |
(b) Affiliated fund that is generally available only to investment companies and other accounts managed by Fidelity Investments. The rate quoted is the annualized seven-day yield of the fund at period end. A complete unaudited listing of the fund's holdings as of its most recent quarter end is available upon request. In addition, each Fidelity Central Fund's financial statements, which are not covered by the Fund's Report of Independent Registered Public Accounting Firm, are available on the SEC's website or upon request. |
(c) Investment made with cash collateral received from securities on loan. |
(d) Security or a portion of the security is on loan at period end. |
(e) Restricted securities - Investment in securities not registered under the Securities Act of 1933 (excluding 144A issues). At the end of the period, the value of restricted securities (excluding 144A issues) amounted to $43,673,000 or 0.5% of net assets. |
Additional information on each restricted holding is as follows: |
Security | Acquisition Date | Acquisition Cost (000s) |
ASAC II LP | 10/10/13 | $ 25,141 |
Affiliated Central Funds |
Information regarding fiscal year to date income earned by the Fund from investments in Fidelity Central Funds is as follows: |
Fund | Income earned
(Amounts in
thousands) |
Fidelity Cash Central Fund | $ 323 |
Fidelity Securities Lending Cash Central Fund | 593 |
Total | $ 916 |
Other Affiliated Issuers |
An affiliated company is a company in which the Fund has ownership of at least 5% of the voting securities. Fiscal year to date transactions with companies which are or were affiliates are as follows: |
Affiliate
(Amounts in
thousands) | Value, beginning of period | Purchases | Sales Proceeds | Dividend Income | Value,
end of
period |
TAG Oil Ltd. | $ 7,147 | $ - | $ 4,852 | $ - | $ - |
TAG Oil Ltd. (144A) | 337 | - | 195 | - | - |
Total | $ 7,484 | $ - | $ 5,047 | $ - | $ - |
Other Information |
The following is a summary of the inputs used, as of July 31, 2015, involving the Fund's assets and liabilities carried at fair value. The inputs or methodology used for valuing securities may not be an indication of the risk associated with investing in those securities. For more information on valuation inputs, and their aggregation into the levels used in the table below, please refer to the Investment Valuation section in the accompanying Notes to Financial Statements. |
Valuation Inputs at Reporting Date: |
Description
(Amounts in thousands) | Total | Level 1 | Level 2 | Level 3 |
Investments in Securities: | | | | |
Equities: | | | | |
Consumer Discretionary | $ 773,937 | $ 773,937 | $ - | $ - |
Consumer Staples | 1,009,265 | 977,125 | 32,140 | - |
Energy | 607,915 | 607,915 | - | - |
Financials | 1,454,158 | 1,454,148 | 10 | - |
Health Care | 1,277,213 | 1,185,961 | 91,252 | - |
Industrials | 809,364 | 809,364 | - | - |
Information Technology | 1,959,433 | 1,915,760 | - | 43,673 |
Materials | 236,824 | 236,824 | - | - |
Telecommunication Services | 80,004 | 80,004 | - | - |
Corporate Bonds | 6,527 | - | 6,527 | - |
Money Market Funds | 246,396 | 246,396 | - | - |
Total Investments in Securities: | $ 8,461,036 | $ 8,287,434 | $ 129,929 | $ 43,673 |
The following is a summary of transfers between Level 1 and Level 2 for the period ended July 31, 2015. Transfers are assumed to have occurred at the beginning of the period, and are primarily attributable to the valuation techniques used for foreign equity securities, as discussed in the accompanying Notes to Financial Statements: |
Transfers | Total (000s) |
Level 1 to Level 2 | $ 0 |
Level 2 to Level 1 | $ 113,833 |
Distribution of investments by country or territory of incorporation, as a percentage of total net assets, is as follows (Unaudited): |
United States of America | 84.5% |
Ireland | 3.8% |
United Kingdom | 2.1% |
Canada | 1.8% |
Israel | 1.8% |
Japan | 1.2% |
Bailiwick of Jersey | 1.1% |
Others (Individually Less Than 1%) | 3.7% |
| 100.0% |
See accompanying notes which are an integral part of the financial statements.
Annual Report
Statement of Assets and Liabilities
Amounts in thousands (except per-share amounts) | | July 31, 2015 |
| | |
Assets | | |
Investment in securities, at value (including securities loaned of $20,025) - See accompanying schedule: Unaffiliated issuers (cost $6,735,725) | $ 8,214,640 | |
Fidelity Central Funds (cost $246,396) | 246,396 | |
Total Investments (cost $6,982,121) | | $ 8,461,036 |
Cash | | 49 |
Foreign currency held at value (cost $443) | | 442 |
Receivable for investments sold | | 7,919 |
Receivable for fund shares sold | | 2,792 |
Dividends receivable | | 8,793 |
Interest receivable | | 94 |
Distributions receivable from Fidelity Central Funds | | 73 |
Other receivables | | 524 |
Total assets | | 8,481,722 |
| | |
Liabilities | | |
Payable for investments purchased | $ 30,929 | |
Payable for fund shares redeemed | 7,364 | |
Accrued management fee | 3,908 | |
Other affiliated payables | 1,062 | |
Other payables and accrued expenses | 590 | |
Collateral on securities loaned, at value | 21,484 | |
Total liabilities | | 65,337 |
| | |
Net Assets | | $ 8,416,385 |
Net Assets consist of: | | |
Paid in capital | | $ 6,351,250 |
Undistributed net investment income | | 65,329 |
Accumulated undistributed net realized gain (loss) on investments and foreign currency transactions | | 520,911 |
Net unrealized appreciation (depreciation) on investments and assets and liabilities in foreign currencies | | 1,478,895 |
Net Assets | | $ 8,416,385 |
See accompanying notes which are an integral part of the financial statements.
Annual Report
Financial Statements - continued
Statement of Assets and Liabilities - continued
Amounts in thousands (except per-share amounts) | | July 31, 2015 |
| | |
Dividend Growth:
Net Asset Value, offering price and redemption price per share ($6,474,163 ÷ 187,859 shares) | | $ 34.46 |
| | |
Class K:
Net Asset Value, offering price and redemption price per share ($1,942,222 ÷ 56,374 shares) | | $ 34.45 |
See accompanying notes which are an integral part of the financial statements.
Annual Report
Statement of Operations
Amounts in thousands | Year ended July 31, 2015 |
| | |
Investment Income | | |
Dividends | | $ 181,071 |
Interest | | 221 |
Income from Fidelity Central Funds | | 916 |
Total income | | 182,208 |
| | |
Expenses | | |
Management fee | | |
Basic fee | $ 47,458 | |
Performance adjustment | (4,090) | |
Transfer agent fees | 11,763 | |
Accounting and security lending fees | 1,243 | |
Custodian fees and expenses | 165 | |
Independent trustees' compensation | 38 | |
Registration fees | 72 | |
Audit | 84 | |
Legal | 33 | |
Miscellaneous | 59 | |
Total expenses before reductions | 56,825 | |
Expense reductions | (391) | 56,434 |
Net investment income (loss) | | 125,774 |
Realized and Unrealized Gain (Loss) Net realized gain (loss) on: | | |
Investment securities: | | |
Unaffiliated issuers | 780,232 | |
Other affiliated issuers | (12,370) | |
Foreign currency transactions | 6 | |
Futures contracts | 61 | |
Total net realized gain (loss) | | 767,929 |
Change in net unrealized appreciation (depreciation) on: Investment securities | (102,141) | |
Assets and liabilities in foreign currencies | 5 | |
Futures contracts | (38) | |
Total change in net unrealized appreciation (depreciation) | | (102,174) |
Net gain (loss) | | 665,755 |
Net increase (decrease) in net assets resulting from operations | | $ 791,529 |
See accompanying notes which are an integral part of the financial statements.
Annual Report
Financial Statements - continued
Statement of Changes in Net Assets
Amounts in thousands | Year ended
July 31,
2015 | Year ended
July 31,
2014 |
Increase (Decrease) in Net Assets | | |
Operations | | |
Net investment income (loss) | $ 125,774 | $ 135,648 |
Net realized gain (loss) | 767,929 | 1,400,831 |
Change in net unrealized appreciation (depreciation) | (102,174) | (186,688) |
Net increase (decrease) in net assets resulting from operations | 791,529 | 1,349,791 |
Distributions to shareholders from net investment income | (124,133) | (90,956) |
Distributions to shareholders from net realized gain | (1,267,766) | (759,327) |
Total distributions | (1,391,899) | (850,283) |
Share transactions - net increase (decrease) | 479,167 | (233,820) |
Total increase (decrease) in net assets | (121,203) | 265,688 |
| | |
Net Assets | | |
Beginning of period | 8,537,588 | 8,271,900 |
End of period (including undistributed net investment income of $65,329 and undistributed net investment income of $74,179, respectively) | $ 8,416,385 | $ 8,537,588 |
See accompanying notes which are an integral part of the financial statements.
Annual Report
Financial Highlights - Dividend Growth
Years ended July 31, | 2015 | 2014 | 2013 | 2012 | 2011 |
Selected Per-Share Data | | | | | |
Net asset value, beginning of period | $ 37.27 | $ 35.33 | $ 28.61 | $ 28.96 | $ 23.84 |
Income from Investment Operations | | | | | |
Net investment income (loss)B | .49 | .56 | .40 | .20 | .12 |
Net realized and unrealized gain (loss) | 2.71 | 4.98 | 7.12 | (.41) | 5.23 |
Total from investment operations | 3.20 | 5.54 | 7.52 | (.21) | 5.35 |
Distributions from net investment income | (.51) | (.37) | (.30) | (.12) | (.15) |
Distributions from net realized gain | (5.49) | (3.23) | (.50) | (.02) | (.08) |
Total distributions | (6.01) G | (3.60) | (.80) | (.14) | (.23) |
Net asset value, end of period | $ 34.46 | $ 37.27 | $ 35.33 | $ 28.61 | $ 28.96 |
Total Return A | 9.54% | 17.30% | 26.83% | (.67)% | 22.57% |
Ratios to Average Net AssetsC, E | | | | | |
Expenses before reductions | .69% | .56% | .63% | .91% | .93% |
Expenses net of fee waivers, if any | .68% | .56% | .63% | .91% | .93% |
Expenses net of all reductions | .68% | .56% | .62% | .91% | .93% |
Net investment income (loss) | 1.43% | 1.58% | 1.26% | .75% | .44% |
Supplemental Data | | | | | |
Net assets, end of period (in millions) | $ 6,474 | $ 6,481 | $ 6,633 | $ 5,905 | $ 9,309 |
Portfolio turnover rate D | 64% | 99% | 69% | 63% F | 67% |
A Total returns would have been lower if certain expenses had not been reduced during the applicable periods shown.
B Calculated based on average shares outstanding during the period.
C Fees and expenses of any underlying Fidelity Central Funds are not included in the Fund's expense ratio. The Fund indirectly bears its proportionate share of the expenses of any underlying Fidelity Central Funds.
D Amount does not include the portfolio activity of any underlying Fidelity Central Funds.
E Expense ratios reflect operating expenses of the class. Expenses before reductions do not reflect amounts reimbursed by the investment adviser or reductions from brokerage service arrangements or reductions from other expense offset arrangements and do not represent the amount paid by the class during periods when reimbursements or reductions occur. Expenses net of fee waivers reflect expenses after reimbursement by the investment adviser but prior to reductions from brokerage service arrangements or other expense offset arrangements. Expenses net of all reductions represent the net expenses paid by the class.
F Portfolio turnover rate excludes securities received or delivered in-kind.
G Total distributions of $6.01 per share is comprised of distributions from net investment income of $.512 and distributions from net realized gain of $5.493 per share.
See accompanying notes which are an integral part of the financial statements.
Annual Report
Financial Highlights - Class K
Years ended July 31, | 2015 | 2014 | 2013 | 2012 | 2011 |
Selected Per-Share Data | | | | | |
Net asset value, beginning of period | $ 37.27 | $ 35.34 | $ 28.62 | $ 28.98 | $ 23.86 |
Income from Investment Operations | | | | | |
Net investment income (loss)B | .53 | .60 | .45 | .25 | .17 |
Net realized and unrealized gain (loss) | 2.70 | 4.97 | 7.12 | (.43) | 5.22 |
Total from investment operations | 3.23 | 5.57 | 7.57 | (.18) | 5.39 |
Distributions from net investment income | (.56) | (.42) | (.35) | (.17) | (.20) |
Distributions from net realized gain | (5.49) | (3.23) | (.50) | (.02) | (.08) |
Total distributions | (6.05) | (3.64) I | (.85) | (.18) H | (.27) G |
Net asset value, end of period | $ 34.45 | $ 37.27 | $ 35.34 | $ 28.62 | $ 28.98 |
Total Return A | 9.65% | 17.44% | 27.04% | (.52)% | 22.79% |
Ratios to Average Net AssetsC, E | | | | | |
Expenses before reductions | .57% | .44% | .48% | .75% | .78% |
Expenses net of fee waivers, if any | .57% | .43% | .48% | .75% | .78% |
Expenses net of all reductions | .57% | .43% | .47% | .75% | .77% |
Net investment income (loss) | 1.54% | 1.70% | 1.41% | .91% | .60% |
Supplemental Data | | | | | |
Net assets, end of period (in millions) | $ 1,942 | $ 2,057 | $ 1,639 | $ 1,221 | $ 634 |
Portfolio turnover rate D | 64% | 99% | 69% | 63% F | 67% |
A Total returns would have been lower if certain expenses had not been reduced during the applicable periods shown.
B Calculated based on average shares outstanding during the period.
C Fees and expenses of any underlying Fidelity Central Funds are not included in the Fund's expense ratio. The Fund indirectly bears its proportionate share of the expenses of any underlying Fidelity Central Funds.
D Amount does not include the portfolio activity of any underlying Fidelity Central Funds.
E Expense ratios reflect operating expenses of the class. Expenses before reductions do not reflect amounts reimbursed by the investment adviser or reductions from brokerage service arrangements or reductions from other expense offset arrangements and do not represent the amount paid by the class during periods when reimbursements or reductions occur. Expenses net of fee waivers reflect expenses after reimbursement by the investment adviser but prior to reductions from brokerage service arrangements or other expense offset arrangements. Expenses net of all reductions represent the net expenses paid by the class.
F Portfolio turnover rate excludes securities received or delivered in-kind.
G Total distributions of $.27 per share is comprised of distributions from net investment income of $.197 and distributions from net realized gain of $.077 per share.
H Total distributions of $.18 per share is comprised of distributions from net investment income of $.169 and distributions from net realized gain of $.015 per share.
I Total distributions of $3.64 per share is comprised of distributions from net investment income of $.419 and distributions from net realized gain of $3.225 per share.
See accompanying notes which are an integral part of the financial statements.
Annual Report
For the period ended July 31, 2015
(Amounts in thousands except percentages)
1. Organization.
Fidelity Dividend Growth Fund (the Fund) is a fund of Fidelity Securities Fund (the Trust) and is authorized to issue an unlimited number of shares. The Trust is registered under the Investment Company Act of 1940, as amended (the 1940 Act), as an open-end management investment company organized as a Massachusetts business trust. The Fund offers Dividend Growth and Class K shares, each of which has equal rights as to assets and voting privileges. Each class has exclusive voting rights with respect to matters that affect that class.
2. Investments in Fidelity Central Funds.
The Fund invests in Fidelity Central Funds, which are open-end investment companies generally available only to other investment companies and accounts managed by the investment adviser and its affiliates. The Fund's Schedule of Investments lists each of the Fidelity Central Funds held as of period end, if any, as an investment of the Fund, but does not include the underlying holdings of each Fidelity Central Fund. As an Investing Fund, the Fund indirectly bears its proportionate share of the expenses of the underlying Fidelity Central Funds.
The Money Market Central Funds seek preservation of capital and current income and are managed by Fidelity Investments Money Management, Inc. (FIMM), an affiliate of the investment adviser. Annualized expenses of the Money Market Central Funds as of their most recent shareholder report date are less than .01%.
A complete unaudited list of holdings for each Fidelity Central Fund is available upon request or at the Securities and Exchange Commission (the SEC) website at www.sec.gov. In addition, the financial statements of the Fidelity Central Funds, which are not covered by the Fund's Report of Independent Registered Public Accounting Firm, are available on the SEC website or upon request.
3. Significant Accounting Policies.
The financial statements have been prepared in conformity with accounting principles generally accepted in the United States of America (GAAP), which require management to make certain estimates and assumptions at the date of the financial statements. Actual results could differ from those estimates. Subsequent events, if any, through the date that the financial statements were issued have been evaluated in the preparation of the financial statements. The following summarizes the significant accounting policies of the Fund:
Investment Valuation. Investments are valued as of 4:00 p.m. Eastern time on the last calendar day of the period. The Board of Trustees (the Board) has delegated the day to day responsibility for the valuation of the Fund's investments to the Fidelity Management & Research Company (FMR) Fair Value Committee (the Committee). In accordance
Annual Report
Notes to Financial Statements - continued
(Amounts in thousands except percentages)
3. Significant Accounting Policies - continued
Investment Valuation - continued
with valuation policies and procedures approved by the Board, the Fund attempts to obtain prices from one or more third party pricing vendors or brokers to value its investments. When current market prices, quotations or currency exchange rates are not readily available or reliable, investments will be fair valued in good faith by the Committee, in accordance with procedures adopted by the Board. Factors used in determining fair value vary by investment type and may include market or investment specific events, changes in interest rates and credit quality. The frequency with which these procedures are used cannot be predicted and they may be utilized to a significant extent. The Committee oversees the Fund's valuation policies and procedures and reports to the Board on the Committee's activities and fair value determinations. The Board monitors the appropriateness of the procedures used in valuing the Fund's investments and ratifies the fair value determinations of the Committee.
The Fund categorizes the inputs to valuation techniques used to value its investments into a disclosure hierarchy consisting of three levels as shown below:
Level 1 - quoted prices in active markets for identical investments
Level 2 - other significant observable inputs (including quoted prices for similar investments, interest rates, prepayment speeds, etc.)
Level 3 - unobservable inputs (including the Fund's own assumptions based on the best information available)
Valuation techniques used to value the Fund's investments by major category are as follows:
Equity securities, including restricted securities, for which market quotations are readily available, are valued at the last reported sale price or official closing price as reported by a third party pricing vendor on the primary market or exchange on which they are traded and are categorized as Level 1 in the hierarchy. In the event there were no sales during the day or closing prices are not available, securities are valued at the last quoted bid price or may be valued using the last available price and are generally categorized as Level 2 in the hierarchy. For foreign equity securities, when market or security specific events arise, comparisons to the valuation of American Depositary Receipts (ADRs), futures contracts, Exchange-Traded Funds (ETFs) and certain indexes as well as quoted prices for similar securities may be used and would be categorized as Level 2 in the hierarchy. Utilizing these techniques may result in transfers between Level 1 and Level 2. For equity securities, including restricted securities, where observable inputs are limited, assumptions about market activity and risk are used and these securities may be categorized as Level 3 in the hierarchy.
Annual Report
3. Significant Accounting Policies - continued
Investment Valuation - continued
Debt securities, including restricted securities, are valued based on evaluated prices received from third party pricing vendors or from brokers who make markets in such securities. Corporate bonds are valued by pricing vendors who utilize matrix pricing which considers yield or price of bonds of comparable quality, coupon, maturity and type or by broker-supplied prices. When independent prices are unavailable or unreliable, debt securities may be valued utilizing pricing methodologies which consider similar factors that would be used by third party pricing vendors. Debt securities are generally categorized as Level 2 in the hierarchy but may be Level 3 depending on the circumstances.
Investments in open-end mutual funds, including the Fidelity Central Funds, are valued at their closing net asset value (NAV) each business day and are categorized as Level 1 in the hierarchy.
Changes in valuation techniques may result in transfers in or out of an assigned level within the disclosure hierarchy. The aggregate value of investments by input level as of July 31, 2015, including information on transfers between Levels 1 and 2, is included at the end of the Fund's Schedule of Investments.
Foreign Currency. The Fund may use foreign currency contracts to facilitate transactions in foreign-denominated securities. Gains and losses from these transactions may arise from changes in the value of the foreign currency or if the counterparties do not perform under the contracts' terms.
Foreign-denominated assets, including investment securities, and liabilities are translated into U.S. dollars at the exchange rates at period end. Purchases and sales of investment securities, income and dividends received and expenses denominated in foreign currencies are translated into U.S. dollars at the exchange rate in effect on the transaction date.
The effects of exchange rate fluctuations on investments are included with the net realized and unrealized gain (loss) on investment securities. Other foreign currency transactions resulting in realized and unrealized gain (loss) are disclosed separately.
Investment Transactions and Income. For financial reporting purposes, the Fund's investment holdings and NAV include trades executed through the end of the last business day of the period. The NAV per share for processing shareholder transactions is calculated as of the close of business of the New York Stock Exchange (NYSE), normally 4:00 p.m. Eastern time and includes trades executed through the end of the prior business day. Gains and losses on securities sold are determined on the basis of identified cost and may include proceeds received from litigation. Dividend income is recorded on
Annual Report
Notes to Financial Statements - continued
(Amounts in thousands except percentages)
3. Significant Accounting Policies - continued
Investment Transactions and Income - continued
the ex-dividend date, except for certain dividends from foreign securities where the ex-dividend date may have passed, which are recorded as soon as the Fund is informed of the ex-dividend date. Non-cash dividends included in dividend income, if any, are recorded at the fair market value of the securities received. Income and capital gain distributions from Fidelity Central Funds, if any, are recorded on the ex-dividend date. Distributions received on securities that represent a return of capital or capital gain are recorded as a reduction of cost of investments and/or as a realized gain. Subsequent to ex-dividend date the Fund determines the components of these distributions, based upon receipt of tax filings or other correspondence relating to the underlying investment. Interest income is accrued as earned and includes coupon interest and amortization of premium and accretion of discount on debt securities as applicable. Investment income is recorded net of foreign taxes withheld where recovery of such taxes is uncertain.
Class Allocations and Expenses. Investment income, realized and unrealized capital gains and losses, common expenses of the Fund, and certain fund-level expense reductions, if any, are allocated daily on a pro-rata basis to each class based on the relative net assets of each class to the total net assets of the Fund. Each class differs with respect to transfer agent fees incurred. Certain expense reductions may also differ by class. For the reporting period, the allocated portion of income and expenses to each class as a percent of its average net assets may vary due to the timing of recording these transactions in relation to fluctuating net assets of the classes. Expenses directly attributable to a fund are charged to that fund. Expenses attributable to more than one fund are allocated among the respective funds on the basis of relative net assets or other appropriate methods. Expense estimates are accrued in the period to which they relate and adjustments are made when actual amounts are known.
Deferred Trustee Compensation. Under a Deferred Compensation Plan (the Plan), independent Trustees may elect to defer receipt of a portion of their annual compensation. Deferred amounts are invested in a cross-section of Fidelity funds, are marked-to-market and remain in the Fund until distributed in accordance with the Plan. The investment of deferred amounts and the offsetting payable to the Trustees are included in the accompanying Statement of Assets and Liabilities.
Income Tax Information and Distributions to Shareholders. Each year, the Fund intends to qualify as a regulated investment company under Subchapter M of the Internal Revenue Code, including distributing substantially all of its taxable income and realized gains. As a result, no provision for U.S. Federal income taxes is required. As of July 31, 2015, the Fund did not have any unrecognized tax benefits in the financial statements; nor is the Fund aware of any tax positions for which it is reasonably possible
Annual Report
3. Significant Accounting Policies - continued
Income Tax Information and Distributions to Shareholders - continued
that the total amounts of unrecognized tax benefits will significantly change in the next twelve months. The Fund files a U.S. federal tax return, in addition to state and local tax returns as required. The Fund's federal income tax returns are subject to examination by the Internal Revenue Service (IRS) for a period of three fiscal years after they are filed. State and local tax returns may be subject to examination for an additional fiscal year depending on the jurisdiction. Foreign taxes are provided for based on the Fund's understanding of the tax rules and rates that exist in the foreign markets in which it invests.
Distributions are declared and recorded on the ex-dividend date. Income dividends and capital gain distributions are declared separately for each class. Income and capital gain distributions are determined in accordance with income tax regulations, which may differ from GAAP. In addition, the Fund claimed a portion of the payment made to redeeming shareholders as a distribution for income tax purposes.
Capital accounts within the financial statements are adjusted for permanent book-tax differences. These adjustments have no impact on net assets or the results of operations. Capital accounts are not adjusted for temporary book-tax differences which will reverse in a subsequent period.
Book-tax differences are primarily due to futures contracts, foreign currency transactions, partnerships, deferred trustees compensation and losses deferred due to wash sales.
The federal tax cost of investment securities and unrealized appreciation (depreciation) as of period end were as follows:
Gross unrealized appreciation | $ 1,734,617 |
Gross unrealized depreciation | (262,113) |
Net unrealized appreciation (depreciation) on securities | $ 1,472,503 |
| |
Tax Cost | $ 6,988,532 |
The tax-based components of distributable earnings as of period end were as follows:
Undistributed ordinary income | $ 69,735 |
Undistributed long-term capital gain | $ 523,374 |
Net unrealized appreciation (depreciation) on securities and other investments | $ 1,472,497 |
Annual Report
Notes to Financial Statements - continued
(Amounts in thousands except percentages)
3. Significant Accounting Policies - continued
Income Tax Information and Distributions to Shareholders - continued
The tax character of distributions paid was as follows:
| July 31, 2015 | July 31, 2014 |
Ordinary Income | $ 247,357 | $ 309,025 |
Long-term Capital Gains | 1,144,542 | 541,258 |
Total | $ 1,391,899 | $ 850,283 |
Restricted Securities. The Fund may invest in securities that are subject to legal or contractual restrictions on resale. These securities generally may be resold in transactions exempt from registration or to the public if the securities are registered. Disposal of these securities may involve time-consuming negotiations and expense, and prompt sale at an acceptable price may be difficult. Information regarding restricted securities is included at the end of the Fund's Schedule of Investments.
4. Derivative Instruments.
Risk Exposures and the Use of Derivative Instruments. The Fund's investment objective allows the Fund to enter into various types of derivative contracts, including futures contracts. Derivatives are investments whose value is primarily derived from underlying assets, indices or reference rates and may be transacted on an exchange or over-the-counter (OTC). Derivatives may involve a future commitment to buy or sell a specified asset based on specified terms, to exchange future cash flows at periodic intervals based on a notional principal amount, or for one party to make one or more payments upon the occurrence of specified events in exchange for periodic payments from the other party.
The Fund used derivatives to increase returns and to manage exposure to certain risks as defined below. The success of any strategy involving derivatives depends on analysis of numerous economic factors, and if the strategies for investment do not work as intended, the Fund may not achieve its objectives.
The Fund's use of derivatives increased or decreased its exposure to the following risk:
Equity Risk | Equity risk relates to the fluctuations in the value of financial instruments as a result of changes in market prices (other than those arising from interest rate risk or foreign exchange risk), whether caused by factors specific to an individual investment, its issuer, or all factors affecting all instruments traded in a market or market segment. |
Annual Report
4. Derivative Instruments - continued
Risk Exposures and the Use of Derivative Instruments - continued
The Fund is also exposed to additional risks from investing in derivatives, such as liquidity risk and counterparty credit risk. Liquidity risk is the risk that the Fund will be unable to close out the derivative in the open market in a timely manner. Counterparty credit risk is the risk that the counterparty will not be able to fulfill its obligation to the Fund. Counterparty credit risk related to exchange-traded futures contracts may be mitigated by the protection provided by the exchange on which they trade.
Investing in derivatives may involve greater risks than investing in the underlying assets directly and, to varying degrees, may involve risk of loss in excess of any initial investment and collateral received and amounts recognized in the Statement of Assets and Liabilities. In addition, there may be the risk that the change in value of the derivative contract does not correspond to the change in value of the underlying instrument.
Futures Contracts. A futures contract is an agreement between two parties to buy or sell a specified underlying instrument for a fixed price at a specified future date. The Fund used futures contracts to manage its exposure to the stock market.
Upon entering into a futures contract, a fund is required to deposit either cash or securities (initial margin) with a clearing broker in an amount equal to a certain percentage of the face value of the contract. Futures contracts are marked-to-market daily and subsequent daily payments (variation margin) are made or received by a fund depending on the daily fluctuations in the value of the futures contracts and are recorded as unrealized appreciation or (depreciation). This receivable and/or payable, if any, is included in daily variation margin for derivative instruments in the Statement of Assets and Liabilities. Realized gain or (loss) is recorded upon the expiration or closing of a futures contract.
Any open futures contracts at period end are presented in the Schedule of Investments under the caption "Futures Contracts". The underlying face amount at value reflects each contract's exposure to the underlying instrument or index at period end.
During the period the Fund recognized net realized gain (loss) of $61 and a change in net unrealized appreciation (depreciation) of $(38) related to its investment in futures contracts. These amounts are included in the Statement of Operations.
5. Purchases and Sales of Investments.
Purchases and sales of securities, other than short-term securities, aggregated $5,390,300 and $6,115,911, respectively.
Annual Report
Notes to Financial Statements - continued
(Amounts in thousands except percentages)
6. Fees and Other Transactions with Affiliates.
Management Fee. Fidelity Management & Research Company (the investment adviser) and its affiliates provide the Fund with investment management related services for which the Fund pays a monthly management fee. The management fee is the sum of an individual fund fee rate that is based on an annual rate of .30% of the Fund's average net assets and an annualized group fee rate that averaged .25% during the period. The group fee rate is based upon the average net assets of all the mutual funds advised by the investment adviser, including any mutual funds previously advised by the investment adviser that are currently advised by Fidelity SelectCo, LLC, an affiliate of the investment adviser. The group fee rate decreases as assets under management increase and increases as assets under management decrease. In addition, the management fee is subject to a performance adjustment (up to a maximum of ± .20% of the Fund's average net assets over a 36 month performance period). The upward or downward adjustment to the management fee is based on the relative investment performance of Dividend Growth as compared to its benchmark index, the S&P 500 Index, over the same 36 month performance period. For the reporting period, the total annual management fee rate, including the performance adjustment, was .50% of the Fund's average net assets. The performance adjustment included in the management fee rate may be higher or lower than the maximum performance adjustment rate due to the difference between the average net assets for the reporting and performance periods.
Transfer Agent Fees. Fidelity Investments Institutional Operations Company, Inc., (FIIOC), an affiliate of the investment adviser, is the transfer, dividend disbursing and shareholder servicing agent for each class of the Fund. FIIOC receives account fees and asset-based fees that vary according to the account size and type of account of the shareholders of Dividend Growth, except for Class K. FIIOC receives an asset-based fee of Class K's average net assets. FIIOC pays for typesetting, printing and mailing of shareholder reports, except proxy statements.
For the period, transfer agent fees for each class were as follows:
| Amount | % of
Class-Level Average
Net Assets |
Dividend Growth | $ 10,782 | .16 |
Class K | 981 | .05 |
| $ 11,763 | |
Accounting and Security Lending Fees. Fidelity Service Company, Inc. (FSC), an affiliate of the investment adviser, maintains the Fund's accounting records. The accounting fee is based on the level of average net assets for each month. Under a separate contract, FSC administers the security lending program. The security lending fee is based on the number and duration of lending transactions.
Annual Report
6. Fees and Other Transactions with Affiliates - continued
Brokerage Commissions. The Fund placed a portion of its portfolio transactions with brokerage firms which are affiliates of the investment adviser. Brokerage commissions are included in net realized gain (loss) and change in net unrealized appreciation (depreciation) in the Statement of Operations. The commissions paid to these affiliated firms were $85 for the period.
7. Committed Line of Credit.
The Fund participates with other funds managed by the investment adviser or an affiliate in a $4.25 billion credit facility (the "line of credit") to be utilized for temporary or emergency purposes to fund shareholder redemptions or for other short-term liquidity purposes. The Fund has agreed to pay commitment fees on its pro-rata portion of the line of credit, which amounted to $13 and is reflected in Miscellaneous expenses on the Statement of Operations. During the period, the Fund did not borrow on this line of credit.
8. Security Lending.
The Fund lends portfolio securities through a lending agent from time to time in order to earn additional income. For equity securities, a lending agent is used and may loan securities to certain qualified borrowers, including Fidelity Capital Markets (FCM), a broker-dealer affiliated with the Fund. On the settlement date of the loan, the Fund receives collateral (in the form of U.S. Treasury obligations, letters of credit and/or cash) against the loaned securities and maintains collateral in an amount not less than 100% of the market value of the loaned securities during the period of the loan. The market value of the loaned securities is determined at the close of business of the Fund and any additional required collateral is delivered to the Fund on the next business day. If the borrower defaults on its obligation to return the securities loaned because of insolvency or other reasons, the Fund may apply collateral received from the borrower against the obligation. The Fund may experience delays and costs in recovering the securities loaned. Any cash collateral received is invested in the Fidelity Securities Lending Cash Central Fund. The value of loaned securities and cash collateral at period end are disclosed on the Fund's Statement of Assets and Liabilities. Security lending income represents the income earned on investing cash collateral, less rebates paid to borrowers and any lending agent fees associated with the loan, plus any premium payments received for lending certain types of securities. Security lending income is presented in the Statement of Operations as a component of income from Fidelity Central Funds. Total security lending income during the period amounted to $593. During the period, there were no securities loaned to FCM.
Annual Report
Notes to Financial Statements - continued
(Amounts in thousands except percentages)
9. Expense Reductions.
Commissions paid to certain brokers with whom the investment adviser, or its affiliates, places trades on behalf of the Fund include an amount in addition to trade execution, which may be rebated back to the Fund to offset certain expenses. This amount totaled $191 for the period.
In addition, through arrangements with the Fund's custodian, credits realized as a result of uninvested cash balances were used to reduce the Fund's expenses. During the period, these credits reduced the Fund's custody expenses by $1.
In addition, during the period the investment adviser reimbursed/waived a portion of fund-level operating expenses in the amount of $34 and a portion of class-level operating expenses as follows:
| Amount |
Dividend Growth | $ 165 |
10. Distributions to Shareholders.
Distributions to shareholders of each class were as follows:
Years ended July 31, | 2015 | 2014 |
From net investment income | | |
Dividend Growth | $ 92,079 | $ 70,700 |
Class K | 32,054 | 20,256 |
Total | $ 124,133 | $ 90,956 |
From net realized gain | | |
Dividend Growth | $ 962,404 | $ 606,886 |
Class K | 305,362 | 152,441 |
Total | $ 1,267,766 | $ 759,327 |
11. Share Transactions.
Share transactions for each class were as follows and may contain automatic conversions between classes or exchanges between funds:
| Shares | Dollars |
Years ended July 31, | 2015 | 2014 | 2015 | 2014 |
Dividend Growth | | | | |
Shares sold | 10,859 | 11,713 | $ 370,250 | $ 413,381 |
Reinvestment of distributions | 30,298 | 19,201 | 1,009,516 | 630,027 |
Shares redeemed | (27,183) | (44,744) | (929,933) | (1,586,974) |
Net increase (decrease) | 13,974 | (13,830) | $ 449,833 | $ (543,566) |
Annual Report
11. Share Transactions - continued
| Shares | Dollars |
Years ended July 31, | 2015 | 2014 | 2015 | 2014 |
Class K | | | | |
Shares sold | 9,521 | 14,508 | $ 325,624 | $ 525,067 |
Reinvestment of distributions | 10,135 | 5,265 | 337,416 | 172,697 |
Shares redeemed | (18,467) | (10,980) | (633,706) | (388,018) |
Net increase (decrease) | 1,189 | 8,793 | $ 29,334 | $ 309,746 |
12. Other.
The Fund's organizational documents provide former and current trustees and officers with a limited indemnification against liabilities arising in connection with the performance of their duties to the Fund. In the normal course of business, the Fund may also enter into contracts that provide general indemnifications. The Fund's maximum exposure under these arrangements is unknown as this would be dependent on future claims that may be made against the Fund. The risk of material loss from such claims is considered remote.
Annual Report
To the Trustees of Fidelity Securities Fund and the Shareholders of Fidelity Dividend Growth Fund:
In our opinion, the accompanying statement of assets and liabilities, including the schedule of investments, and the related statements of operations and of changes in net assets and the financial highlights present fairly, in all material respects, the financial position of Fidelity Dividend Growth Fund (a fund of Fidelity Securities Fund) at July 31, 2015, the results of its operations for the year then ended, the changes in its net assets for each of the two years in the period then ended and the financial highlights for each of the five years in the period then ended, in conformity with accounting principles generally accepted in the United States of America. These financial statements and financial highlights (hereafter referred to as "financial statements") are the responsibility of the Fidelity Dividend Growth Fund's management. Our responsibility is to express an opinion on these financial statements based on our audits. We conducted our audits of these financial statements in accordance with the standards of the Public Company Accounting Oversight Board (United States). Those standards require that we plan and perform the audit to obtain reasonable assurance about whether the financial statements are free of material misstatement. An audit includes examining, on a test basis, evidence supporting the amounts and disclosures in the financial statements, assessing the accounting principles used and significant estimates made by management, and evaluating the overall financial statement presentation. We believe that our audits, which included confirmation of securities at July 31, 2015 by correspondence with the custodian and brokers, provide a reasonable basis for our opinion.
PricewaterhouseCoopers LLP
Boston, Massachusetts
September 23, 2015
Annual Report
The Trustees, Member of the Advisory Board, and officers of the trust and fund, as applicable, are listed below. The Board of Trustees governs the fund and is responsible for protecting the interests of shareholders. The Trustees are experienced executives who meet periodically throughout the year to oversee the fund's activities, review contractual arrangements with companies that provide services to the fund, oversee management of the risks associated with such activities and contractual arrangements, and review the fund's performance. Each of the Trustees oversees 170 funds.
The Trustees hold office without limit in time except that (a) any Trustee may resign; (b) any Trustee may be removed by written instrument, signed by at least two-thirds of the number of Trustees prior to such removal; (c) any Trustee who requests to be retired or who has become incapacitated by illness or injury may be retired by written instrument signed by a majority of the other Trustees; and (d) any Trustee may be removed at any special meeting of shareholders by a two-thirds vote of the outstanding voting securities of the trust. Each Trustee who is not an interested person (as defined in the 1940 Act) of the trust and the fund (Independent Trustee), shall retire not later than the last day of the calendar year in which his or her 75th birthday occurs. The Independent Trustees may waive this mandatory retirement age policy with respect to individual Trustees. The officers and Advisory Board Member hold office without limit in time, except that any officer and Advisory Board Member may resign or may be removed by a vote of a majority of the Trustees at any regular meeting or any special meeting of the Trustees. Except as indicated, each individual has held the office shown or other offices in the same company for the past five years.
Experience, Skills, Attributes, and Qualifications of the Fund's Trustees. The Governance and Nominating Committee has adopted a statement of policy that describes the experience, qualifications, attributes, and skills that are necessary and desirable for potential Independent Trustee candidates (Statement of Policy). The Board believes that each Trustee satisfied at the time he or she was initially elected or appointed a Trustee, and continues to satisfy, the standards contemplated by the Statement of Policy. The Governance and Nominating Committee also engages professional search firms to help identify potential Independent Trustee candidates who have the experience, qualifications, attributes, and skills consistent with the Statement of Policy. From time to time, additional criteria based on the composition and skills of the current Independent Trustees, as well as experience or skills that may be appropriate in light of future changes to board composition, business conditions, and regulatory or other developments, have also been considered by the professional search firms and the Governance and Nominating Committee. In addition, the Board takes into account the Trustees' commitment and participation in Board and committee meetings, as well as their leadership of standing and ad hoc committees throughout their tenure.
In determining that a particular Trustee was and continues to be qualified to serve as a Trustee, the Board has considered a variety of criteria, none of which, in isolation, was controlling. The Board believes that, collectively, the Trustees have balanced and diverse experience, qualifications, attributes, and skills, which allow the Board to operate effectively in governing the fund and protecting the interests of shareholders. Information about the specific experience, skills, attributes, and qualifications of each Trustee, which in each case led to the Board's conclusion that the Trustee should serve (or continue to serve) as a trustee of the fund, is provided below.
Annual Report
Trustees and Officers - continued
Board Structure and Oversight Function. James C. Curvey is an interested person (as defined in the 1940 Act) and currently serves as Chairman. The Trustees have determined that an interested Chairman is appropriate and benefits shareholders because an interested Chairman has a personal and professional stake in the quality and continuity of services provided to the fund. Independent Trustees exercise their informed business judgment to appoint an individual of their choosing to serve as Chairman, regardless of whether the Trustee happens to be independent or a member of management. The Independent Trustees have determined that they can act independently and effectively without having an Independent Trustee serve as Chairman and that a key structural component for assuring that they are in a position to do so is for the Independent Trustees to constitute a substantial majority for the Board. The Independent Trustees also regularly meet in executive session. Ned C. Lautenbach serves as Chairman of the Independent Trustees and as such (i) acts as a liaison between the Independent Trustees and management with respect to matters important to the Independent Trustees and (ii) with management prepares agendas for Board meetings.
Fidelity funds are overseen by different Boards of Trustees. The fund's Board oversees Fidelity's high income and certain equity funds and other Boards oversee Fidelity's investment-grade bond, money market, asset allocation, and sector funds. The asset allocation funds may invest in Fidelity funds overseen by the fund's Board. The use of separate Boards, each with its own committee structure, allows the Trustees of each group of Fidelity funds to focus on the unique issues of the funds they oversee, including common research, investment, and operational issues. On occasion, the separate Boards establish joint committees to address issues of overlapping consequences for the Fidelity funds overseen by each Board.
The Trustees operate using a system of committees to facilitate the timely and efficient consideration of all matters of importance to the Trustees, the fund, and fund shareholders and to facilitate compliance with legal and regulatory requirements and oversight of the fund's activities and associated risks. The Board, acting through its committees, has charged FMR and its affiliates with (i) identifying events or circumstances the occurrence of which could have demonstrably adverse effects on the fund's business and/or reputation; (ii) implementing processes and controls to lessen the possibility that such events or circumstances occur or to mitigate the effects of such events or circumstances if they do occur; and (iii) creating and maintaining a system designed to evaluate continuously business and market conditions in order to facilitate the identification and implementation processes described in (i) and (ii) above. Because the day-to-day operations and activities of the fund are carried out by or through FMR, its affiliates and other service providers, the fund's exposure to risks is mitigated but not eliminated by the processes overseen by the Trustees. While each of the Board's committees has responsibility for overseeing different aspects of the fund's activities, oversight is exercised primarily through the Operations, Audit, and Compliance Committees. In addition, the Independent Trustees have worked with FMR to enhance the Board's oversight of investment and financial risks, legal and regulatory risks, technology risks, and operational risks, including the development of additional risk reporting to the Board. For example, a working group comprised of Independent Trustees and FMR has worked and continues to work to review the Fidelity funds' valuation-related activities, reporting and risk management. Appropriate personnel, including but not limited to the fund's Chief Compliance Officer (CCO), FMR's internal auditor, the independent accountants, the fund's Treasurer and portfolio management personnel, make periodic reports to the Board's committees, as appropriate, including an annual review of FMR's risk management program for the Fidelity funds. The responsibilities of each standing committee, including their oversight responsibilities, are described further under "Standing Committees of the Fund's Trustees."
Annual Report
The fund's Statement of Additional Information (SAI) includes more information about the Trustees. To request a free copy, call Fidelity at 1-800-835-5092.
Interested Trustees*:
Correspondence intended for each Trustee who is an interested person may be sent to Fidelity Investments, 245 Summer Street, Boston, Massachusetts 02210.
Name, Year of Birth; Principal Occupations and Other Relevant Experience+ |
James C. Curvey (1935) |
Year of Election or Appointment: 2007 Trustee Chairman of the Board of Trustees |
| Mr. Curvey also serves as Trustee of other Fidelity funds. Mr. Curvey is a Director of Fidelity Research & Analysis Co. (investment adviser firm, 2009-present), and Vice Chairman (2007-present) and Director of FMR LLC (diversified financial services company). In addition, Mr. Curvey serves as an Overseer for the Boston Symphony Orchestra and a member of the board of Artis-Naples, Naples, Florida, and as a Trustee for Brewster Academy, Wolfeboro, New Hampshire. Previously, Mr. Curvey served as a Director of Fidelity Investments Money Management, Inc. (investment adviser firm, 2009-2014), a Director of FMR (investment adviser firm, 2007-2014), and a Director of FMR Co., Inc. (investment adviser firm, 2007-2014). |
Charles S. Morrison (1960) |
Year of Election or Appointment: 2014 Trustee |
| Mr. Morrison also serves as Trustee of other funds. He serves as a Director of Fidelity Investments Money Management, Inc. (FIMM) (investment adviser firm, 2014-present), Director of Fidelity SelectCo, LLC (investment adviser firm, 2014-present), President, Asset Management (2014-present), and is an employee of Fidelity Investments. Previously, Mr. Morrison served as Vice President of Fidelity's Fixed Income and Asset Allocation Funds (2012-2014), President, Fixed Income (2011-2014), Vice President of Fidelity's Money Market Funds (2005-2009), President, Money Market Group Leader of FMR (investment adviser firm, 2009), and Senior Vice President, Money Market Group of FMR (2004-2009). Mr. Morrison also served as Vice President of Fidelity's Bond Funds (2002-2005), certain Balanced Funds (2002-2005), and certain Asset Allocation Funds (2002-2007), and as Senior Vice President (2002-2005) of Fidelity's Bond Division. |
* Trustees have been determined to be "Interested Trustees" by virtue of, among other things, their affiliation with the trust or various entities under common control with FMR.
+ The information above includes each Trustee's principal occupation during the last five years and other information relating to the experience, attributes, and skills relevant to each Trustee's qualifications to serve as a Trustee, which led to the conclusion that each Trustee should serve as a Trustee for the fund.
Annual Report
Independent Trustees:
Correspondence intended for each Independent Trustee (that is, the Trustees other than the Interested Trustees) may be sent to Fidelity Investments, P.O. Box 55235, Boston, Massachusetts 02205-5235.
Name, Year of Birth; Principal Occupations and Other Relevant Experience+ |
Dennis J. Dirks (1948) |
Year of Election or Appointment: 2005 Trustee |
| Mr. Dirks also serves as Trustee of other Fidelity funds. Prior to his retirement in May 2003, Mr. Dirks was Chief Operating Officer and a member of the Board of The Depository Trust & Clearing Corporation (DTCC). He also served as President, Chief Operating Officer, and Board member of The Depository Trust Company (DTC) and President and Board member of the National Securities Clearing Corporation (NSCC). In addition, Mr. Dirks served as Chief Executive Officer and Board member of the Government Securities Clearing Corporation, Chief Executive Officer and Board member of the Mortgage-Backed Securities Clearing Corporation, as a Trustee and a member of the Finance Committee of Manhattan College (2005-2008), and as a Trustee and a member of the Finance Committee of AHRC of Nassau County (2006-2008). Mr. Dirks is a member of the Independent Directors Council (IDC) Governing Council (2010-present) and Board of Directors for The Brookville Center for Children's Services, Inc. (2009-present). |
Alan J. Lacy (1953) |
Year of Election or Appointment: 2008 Trustee |
| Mr. Lacy also serves as Trustee of other Fidelity funds. Mr. Lacy serves as a member of the Board of Directors of Dave & Buster's Entertainment, Inc. (restaurant and entertainment complexes, 2010-present) and Bristol-Myers Squibb Company (global pharmaceuticals, 2008-present). In addition, Mr. Lacy served as Senior Adviser (2007-2014) of Oak Hill Capital Partners, L.P. (private equity) and also served as Chief Executive Officer (2000-2005) and Vice Chairman (2005-2006) of Sears Holdings Corporation and Sears, Roebuck and Co. (retail). Mr. Lacy is a member of the Board of Trustees of The National Parks Conservation Association (2006-present). Previously, Mr. Lacy served as Chairman of the Board of Trustees of the National Parks Conservation Association (2008-2011) and as a member of the Board of Directors for The Western Union Company (global money transfer, 2006-2011), The Hillman Companies, Inc. (hardware wholesalers, 2010-2014), and Earth Fare, Inc. (retail grocery, 2010-2014). |
Ned C. Lautenbach (1944) |
Year of Election or Appointment: 2000 Trustee Chairman of the Independent Trustees |
| Mr. Lautenbach also serves as Trustee of other Fidelity funds. Mr. Lautenbach currently serves as the Lead Director of the Eaton Corporation Board of Directors (diversified industrial, 1997-present). Mr. Lautenbach is Chairman of the Board of Directors of Artis-Naples in Naples, Florida (2012-present), a member of the Council on Foreign Relations (1994-present), and a member of the Board of Governors, State University System of Florida (2013-present). Previously, Mr. Lautenbach was a Partner/Advisory Partner at Clayton, Dubilier & Rice, LLC (private equity investment, 1998-2010), as well as a Director of Sony Corporation (2006-2007). |
Joseph Mauriello (1944) |
Year of Election or Appointment: 2008 Trustee |
| Mr. Mauriello also serves as Trustee of other Fidelity funds. Prior to his retirement in January 2006, Mr. Mauriello served in numerous senior management positions including Deputy Chairman and Chief Operating Officer (2004-2005), and Vice Chairman of Financial Services (2002-2004) of KPMG LLP US (professional services, 1965-2005). Mr. Mauriello currently serves as a member of the Board of Directors of XL Group plc. (global insurance and re-insurance, 2006-present). Previously, Mr. Mauriello served as a Director of the Hamilton Funds of the Bank of New York (2006-2007) and of Arcadia Resources Inc. (health care services and products, 2007-2012). |
Robert W. Selander (1950) |
Year of Election or Appointment: 2011 Trustee |
| Mr. Selander also serves as Trustee of other Fidelity funds. Mr. Selander serves as a Director of The Western Union Company (global money transfer, 2014-present). Previously, Mr. Selander served as a Member of the Advisory Board of other Fidelity funds (2011), and Executive Vice Chairman (2010), Chief Executive Officer (2009-2010), and President and Chief Executive Officer (1997-2009) of Mastercard, Inc. |
Cornelia M. Small (1944) |
Year of Election or Appointment: 2005 Trustee |
| Ms. Small also serves as Trustee of other Fidelity funds. Ms. Small is a member of the Board of Directors (2009-present) and Chair of the Investment Committee (2010-present) of the Teagle Foundation. Ms. Small also serves on the Investment Committee of the Berkshire Taconic Community Foundation (2008-present). Previously, Ms. Small served as Chairperson (2002-2008) and a member of the Investment Committee and Chairperson (2008-2012) and a member of the Board of Trustees of Smith College. In addition, Ms. Small served as Chief Investment Officer, Director of Global Equity Investments, and a member of the Board of Directors of Scudder, Stevens & Clark and Scudder Kemper Investments. |
William S. Stavropoulos (1939) |
Year of Election or Appointment: 2001 Trustee Vice Chairman of the Independent Trustees |
| Mr. Stavropoulos also serves as Trustee of other Fidelity funds. Mr. Stavropoulos serves as President and Founder of the Michigan Baseball Foundation, the Great Lakes Loons (2007-present). Mr. Stavropoulos is Chairman Emeritus of the Board of Directors of The Dow Chemical Company, where he previously served in numerous senior management positions, including President, CEO (1995-2000; 2002-2004), Chairman of the Executive Committee (2000-2006), and as a member of the Board of Directors (1990-2006). Currently, Mr. Stavropoulos is Chairman of the Board of Directors of Univar Inc. (global distributor of commodity and specialty chemicals), a Director of Teradata Corporation (data warehousing and technology solutions), and Maersk Inc. (industrial conglomerate), and a member of the Advisory Board for Metalmark Capital LLC (private equity investment, 2005-present). Mr. Stavropoulos is an operating advisor to Clayton, Dubilier & Rice, LLC (private equity investment). In addition, Mr. Stavropoulos is a member of the University of Notre Dame Advisory Council for the College of Science, a Trustee of the Rollin L. Gerstacker Foundation, and a Director of the Naples Philharmonic Center for the Arts. Previously, Mr. Stavropoulos served as a Director of Chemical Financial Corporation (bank holding company, 1993-2012) and Tyco International, Ltd. (multinational manufacturing and services, 2007-2012). |
David M. Thomas (1949) |
Year of Election or Appointment: 2008 Trustee |
| Mr. Thomas also serves as Trustee of other Fidelity funds. Mr. Thomas serves as Non-Executive Chairman of the Board of Directors of Fortune Brands Home and Security (home and security products, 2011-present), as a member of the Board of Directors (2004-present) and Presiding Director (2013-present) of Interpublic Group of Companies, Inc. (marketing communication), and as a member of the Board of Trustees of the University of Florida (2013-present). Previously, Mr. Thomas served as Executive Chairman (2005-2006) and Chairman and Chief Executive Officer (2000-2005) of IMS Health, Inc. (pharmaceutical and healthcare information solutions), and a Director of Fortune Brands, Inc. (consumer products, 2000-2011). |
+ The information above includes each Trustee's principal occupation during the last five years and other information relating to the experience, attributes, and skills relevant to each Trustee's qualifications to serve as a Trustee, which led to the conclusion that each Trustee should serve as a Trustee for the fund.
Advisory Board Member and Officers:
Correspondence intended for each officer and Peter S. Lynch may be sent to Fidelity Investments, 245 Summer Street, Boston, Massachusetts 02210. Officers appear below in alphabetical order.
Name, Year of Birth; Principal Occupation |
Peter S. Lynch (1944) |
Year of Election or Appointment: 2003 Member of the Advisory Board |
| Mr. Lynch also serves as Member of the Advisory Board of other Fidelity funds. Mr. Lynch is Vice Chairman and a Director of FMR (investment adviser firm) and FMR Co., Inc. (investment adviser firm). In addition, Mr. Lynch serves as a Trustee of Boston College and as the Chairman of the Inner-City Scholarship Fund. Previously, Mr. Lynch served on the Special Olympics International Board of Directors (1997-2006). |
Elizabeth Paige Baumann (1968) |
Year of Election or Appointment: 2012 Anti-Money Laundering (AML) Officer |
| Ms. Baumann also serves as AML Officer of other funds. She is Chief AML Officer of FMR LLC (diversified financial services company, 2012-present) and is an employee of Fidelity Investments. Previously, Ms. Baumann served as Vice President and Deputy Anti-Money Laundering Officer (2007-2012). |
Marc Bryant (1966) |
Year of Election or Appointment: 2015 Secretary and Chief Legal Officer (CLO) |
<R> | Mr. Bryant also serves as Secretary and Chief Legal Officer (CLO) of other funds. He is Senior Vice President and Deputy General Counsel of FMR LLC (diversified financial services company). Previously, Mr. Bryant served as Secretary and Chief Legal Officer of Fidelity Rutland Square Trust II (2010-2014) and Assistant Secretary of Fidelity's Fixed Income and Asset Allocation Funds (2013-2015). Prior to joining Fidelity Investments, Mr. Bryant served as a Senior Vice President and the Head of Global Retail Legal for AllianceBernstein L.P. (2006-2010), and as the General Counsel for ProFund Advisors LLC (2001-2006).</R> |
William C. Coffey (1969) |
Year of Election or Appointment: 2009 Assistant Secretary |
| Mr. Coffey also serves as Assistant Secretary of other funds. He is Senior Vice President and Deputy General Counsel of FMR LLC (diversified financial services company, 2010-present), and is an employee of Fidelity Investments. Previously, Mr. Coffey served as Vice President and Associate General Counsel of FMR LLC (2005-2009). |
Jonathan Davis (1968) |
Year of Election or Appointment: 2010 Assistant Treasurer |
| Mr. Davis also serves as Assistant Treasurer of other funds. Mr. Davis is an employee of Fidelity Investments. Previously, Mr. Davis served as Vice President and Associate General Counsel of FMR LLC (diversified financial services company, 2003-2010). |
Adrien E. Deberghes (1967) |
Year of Election or Appointment: 2008 Deputy Treasurer |
| Mr. Deberghes also serves as an officer of other funds. He is an employee of Fidelity Investments (2008-present). Prior to joining Fidelity Investments, Mr. Deberghes was Senior Vice President of Mutual Fund Administration at State Street Corporation (2007-2008), Senior Director of Mutual Fund Administration at Investors Bank & Trust (2005-2007), and Director of Finance for Dunkin' Brands (2000-2005). |
Stephanie J. Dorsey (1969) |
Year of Election or Appointment: 2010 Assistant Treasurer |
| Ms. Dorsey also serves as an officer of other funds. She is an employee of Fidelity Investments (2008-present) and has served in other fund officer roles. Prior to joining Fidelity Investments, Ms. Dorsey served as Treasurer (2004-2008) of the JPMorgan Mutual Funds and Vice President (2004-2008) of JPMorgan Chase Bank. |
Howard J. Galligan III (1966) |
Year of Election or Appointment: 2014 Chief Financial Officer |
| Mr. Galligan also serves as Chief Financial Officer of other funds. Mr. Galligan serves as President of Fidelity Pricing and Cash Management Services (FPCMS) (2014-present) and as a Director of Strategic Advisers, Inc. (investment adviser firm, 2008-present). Previously, Mr. Galligan served as Chief Administrative Officer of Asset Management (2011-2014) and Chief Operating Officer and Senior Vice President of Investment Support for Strategic Advisers, Inc. (2003-2011). |
Scott C. Goebel (1968) |
Year of Election or Appointment: 2015 Vice President |
| Mr. Goebel serves as an officer of other funds. Mr. Goebel also serves as Secretary of Fidelity SelectCo, LLC (investment adviser firm, 2013-present), Fidelity Investments Money Management, Inc. (FIMM) (investment adviser firm, 2010-present) and Fidelity Research and Analysis Company (FRAC) (investment adviser firm, 2010-present); General Counsel, Secretary, and Senior Vice President of FMR (investment adviser firm, 2008-present) and FMR Co., Inc. (investment adviser firm, 2008-present); Chief Legal Officer of Fidelity Management & Research (Hong Kong) Limited (investment adviser firm, 2008-present); and Assistant Secretary of Fidelity Management & Research (Japan) Limited (investment adviser firm, 2008-present) and FMR Investment Management (U.K.) Limited (investment adviser firm, 2008-present). Previously, Mr. Goebel served as Secretary and CLO of certain Fidelity funds (2008-2015), Assistant Secretary of FIMM (2008-2010), FRAC (2008-2010), and certain funds (2007-2008); and as Vice President and Secretary of Fidelity Distributors Corporation (FDC) (2005-2007). Mr. Goebel has been employed by FMR LLC (diversified financial services company) or an affiliate since 2001. |
Brian B. Hogan (1964) |
Year of Election or Appointment: 2009 Vice President |
| Mr. Hogan also serves as Trustee or Vice President of other funds. Mr. Hogan serves as a Director of Fidelity SelectCo, LLC (investment adviser firm, 2014-present) and President of the Equity Division of FMR (investment adviser firm, 2009-present). Previously, Mr. Hogan served as Senior Vice President, Equity Research of FMR (2006-2009) and as a portfolio manager. |
Chris Maher (1972) |
Year of Election or Appointment: 2013 Assistant Treasurer |
| Mr. Maher serves as Assistant Treasurer of other funds. Mr. Maher is Vice President of Valuation Oversight and is an employee of Fidelity Investments. Previously, Mr. Maher served as Vice President of Asset Management Compliance (2013), Vice President of the Program Management Group of FMR (investment adviser firm, 2010-2013), and Vice President of Valuation Oversight (2008-2010). |
Melissa M. Reilly (1971) |
Year of Election or Appointment: 2014 Vice President of certain Equity Funds |
| Ms. Reilly also serves as Vice President of other funds. Ms. Reilly is an employee of Fidelity Investments (2004-present). |
Kenneth B. Robins (1969) |
Year of Election or Appointment: 2008 President and Treasurer |
| Mr. Robins also serves as an officer of other funds. Mr. Robins serves as Executive Vice President of Fidelity Investments Money Management, Inc. (FIMM) (investment adviser firm, 2013-present) and is an employee of Fidelity Investments (2004-present). Previously, Mr. Robins served in other fund officer roles. |
Stephen Sadoski (1971) |
Year of Election or Appointment: 2012 Deputy Treasurer |
| Mr. Sadoski also serves as Deputy Treasurer of other funds. He is an employee of Fidelity Investments (2012-present) and has served in another fund officer role. Prior to joining Fidelity Investments, Mr. Sadoski served as an assistant chief accountant in the Division of Investment Management of the Securities and Exchange Commission (SEC) (2009-2012) and as a senior manager at Deloitte & Touche LLP (1997-2009). |
Stacie M. Smith (1974) |
Year of Election or Appointment: 2013 Deputy Treasurer |
| Ms. Smith also serves as an officer of other funds. She is an employee of Fidelity Investments (2009-present) and has served in other fund officer roles. Prior to joining Fidelity Investments, Ms. Smith served as Senior Audit Manager of Ernst & Young LLP (1996-2009). |
Renee Stagnone (1975) |
Year of Election or Appointment: 2013 Deputy Treasurer |
| Ms. Stagnone also serves as Deputy Treasurer of other funds. Ms. Stagnone is an employee of Fidelity Investments. |
Linda J. Wondrack (1964) |
Year of Election or Appointment: 2014 Chief Compliance Officer |
| Ms. Wondrack also serves as Chief Compliance Officer of other funds. Ms. Wondrack is Executive Vice President and head of the Ethics Office and Asset Management Compliance for Fidelity Investments (2012-present). Ms. Wondrack also serves as Chief Compliance Officer of Fidelity SelectCo, LLC (investment adviser firm, 2014-present); Chief Compliance Officer of Impresa Management LLC (2013-present); and Chief Compliance Officer of FMR Co., Inc. (investment adviser firm), Fidelity Investments Money Management, Inc. (investment adviser firm), Fidelity Management & Research (Japan) Limited (investment adviser firm), FMR Investment Management (U.K.) Limited (investment adviser firm), Fidelity Management & Research (Hong Kong) (investment adviser firm), Fidelity Management & Research Company (investment adviser firm), Pyramis Global Advisors, LLC (investment adviser firm), and Strategic Advisers, Inc. (investment adviser firm), Ballyrock Investment Advisors LLC, and Northern Neck Investors LLC (2012-present). Previously, Ms. Wondrack served as Senior Vice President and Chief Compliance Officer for Columbia Management Investment Advisers, LLC (2005-2012); Chief Compliance Officer for certain funds within the Columbia Family of Funds (2007-2012); and Senior Vice President of Compliance Risk Management at Bank of America (2005-2010). |
Joseph F. Zambello (1957) |
Year of Election or Appointment: 2011 Deputy Treasurer |
| Mr. Zambello also serves as Deputy Treasurer of other funds. Mr. Zambello is an employee of Fidelity Investments. Previously, Mr. Zambello served as Vice President of the Program Management Group of FMR (investment adviser firm, 2009-2011) and Vice President of the Transfer Agent Oversight Group (2005-2009). |
Annual Report
The Board of Trustees of Fidelity Dividend Growth Fund voted to pay on record date, the following distributions per share derived from capital gains realized from sales of portfolio securities, and dividends derived from net investment income:
| Pay Date | Record Date | Dividends | Capital Gains |
Class K | 9/14/15 | 9/11/15 | $0.290 | $2.186 |
The fund hereby designates as a capital gain dividend with respect to the taxable year ended July 31, 2015 $691,972,023, or, if subsequently determined to be different, the net capital gain of such year.
Class K designates 42% and 68% of the dividends distributed in September and December, respectively during the fiscal year as qualifying for the dividends-received deduction for corporate shareholders.
Class K designates 58% and 82% of the dividends distributed in September and December, respectively during the fiscal year as amounts which may be taken into account as a dividend for the purposes of the maximum rate under section 1(h)(11) of the Internal Revenue Code.
The fund will notify shareholders in January 2016 of amounts for use in preparing 2015 income tax returns.
Annual Report
Fidelity Dividend Growth Fund
Each year, the Board of Trustees, including the Independent Trustees (together, the Board), votes on the renewal of the management contract with Fidelity Management & Research Company (FMR) and the sub-advisory agreements (together, the Advisory Contracts) for the fund. The Board, assisted by the advice of fund counsel and Independent Trustees' counsel, requests and considers a broad range of information relevant to the renewal of the Advisory Contracts throughout the year.
The Board meets regularly and, at each of its meetings, covers an extensive agenda of topics and materials and considers factors that are relevant to its annual consideration of the renewal of the fund's Advisory Contracts, including the services and support provided to the fund and its shareholders. The Board has established various standing committees (Committees), each composed of and chaired by Independent Trustees with varying backgrounds, to which the Board has assigned specific subject matter responsibilities in order to enhance effective decision-making by the Board. The Board, acting directly and through its Committees, requests and receives information concerning the annual consideration of the renewal of the fund's Advisory Contracts. The Board also meets as needed to consider matters specifically related to the Board's annual consideration of the renewal of the Advisory Contracts. Members of the Board may also meet with trustees of other Fidelity funds through ad hoc joint committees to discuss certain matters relevant to all of the Fidelity funds.
At its July 2015 meeting, the Board unanimously determined to renew the fund's Advisory Contracts. In reaching its determination, the Board considered all factors it believed relevant, including (i) the nature, extent, and quality of the services to be provided to the fund and its shareholders (including the investment performance of the fund); (ii) the competitiveness of the fund's management fee and total expense ratio relative to peer funds; (iii) the total costs of the services to be provided by and the profits to be realized by Fidelity from its relationship with the fund; and (iv) the extent to which (if any) economies of scale exist and would be realized as the fund grows, and whether any economies of scale are appropriately shared with fund shareholders.
In considering whether to renew the Advisory Contracts for the fund, the Board reached a determination, with the assistance of fund counsel and Independent Trustees' counsel and through the exercise of its business judgment, that the renewal of the Advisory Contracts was in the best interests of the fund and its shareholders and that the compensation payable under the Advisory Contracts was fair and reasonable. The Board's decision to renew the Advisory Contracts was not based on any single factor, but rather was based on a comprehensive consideration of all the information provided to the Board at its meetings throughout the year. The Board, in reaching its determination to renew the Advisory Contracts, was aware that shareholders of the fund have a broad range of investment choices available to them, including a wide choice among funds offered by Fidelity's competitors, and that the fund's shareholders, who have the opportunity to review and weigh the disclosure provided by the fund in its prospectus and other public disclosures, have chosen to invest in this fund, which is part of the Fidelity family of funds.
Annual Report
Board Approval of Investment Advisory Contracts and
Management Fees - continued
Nature, Extent, and Quality of Services Provided. The Board considered Fidelity's staffing as it relates to the fund, including the backgrounds of investment personnel of Fidelity, and also considered the fund's investment objective, strategies, and related investment philosophy. The Independent Trustees also had discussions with senior management of Fidelity's investment operations and investment groups. The Board considered the structure of the portfolio manager compensation program and whether this structure provides appropriate incentives to act in the best interests of the fund. Additionally, the Board considered the portfolio managers' investments, if any, in the funds that they manage.
Resources Dedicated to Investment Management and Support Services. The Board and the Fund Oversight and Research Committees reviewed the general qualifications and capabilities of Fidelity's investment staff, including its size, education, experience, and resources, as well as Fidelity's approach to recruiting, training, managing, and compensating investment personnel. The Board noted that Fidelity has continued to increase the resources devoted to non-U.S. offices, including expansion of Fidelity's global investment organization. The Board also noted that Fidelity's analysts have extensive resources, tools and capabilities that allow them to conduct sophisticated quantitative and fundamental analysis, as well as credit analysis of issuers, counterparties and guarantors. Further, the Board considered that Fidelity's investment professionals have sufficient access to global information and data so as to provide competitive investment results over time, and that those professionals also have access to sophisticated tools that permit them to assess portfolio construction and risk and performance attribution characteristics continuously, as well as to transmit new information and research conclusions rapidly around the world. Additionally, in its deliberations, the Board considered Fidelity's trading, risk management, and compliance capabilities and resources, which are integral parts of the investment management process.
Shareholder and Administrative Services. The Board considered (i) the nature, extent, quality, and cost of advisory, administrative, and shareholder services performed by FMR, the sub-advisers (together with FMR, the Investment Advisers), and their affiliates under the Advisory Contracts and under separate agreements covering transfer agency, pricing and bookkeeping, and securities lending services for the fund; (ii) the nature and extent of the supervision of third party service providers, principally custodians and subcustodians; and (iii) the resources devoted to, and the record of compliance with, the fund's compliance policies and procedures. The Board also reviewed the allocation of fund brokerage, including allocations to brokers affiliated with the Investment Advisers, the use of brokerage commissions to pay fund expenses, and the use of "soft" commission dollars to pay for research services.
Annual Report
The Board noted that the growth of fund assets over time across the complex allows Fidelity to reinvest in the development of services designed to enhance the value or convenience of the Fidelity funds as investment vehicles. These services include 24-hour access to account information and market information through telephone representatives and over the Internet, investor education materials and asset allocation tools, and the expanded availability of Fidelity Investor Centers.
In 2014, the Board formed an ad hoc Committee on Transfer Agency Fees to review the variety of transfer agency fee structures throughout the industry and Fidelity's competitive positioning with respect to industry participants.
Investment in a Large Fund Family. The Board considered the benefits to shareholders of investing in a Fidelity fund, including the benefits of investing in a fund that is part of a large family of funds offering a variety of investment disciplines and providing a large variety of mutual fund investor services. The Board noted that Fidelity had taken, or had made recommendations that resulted in the Fidelity funds taking, a number of actions over the previous year that benefited particular funds, including (i) continuing to dedicate additional resources to investment research and to the support of the senior management team that oversees asset management; (ii) continuing efforts to enhance Fidelity's global research capabilities; (iii) launching new funds and making other enhancements to meet client needs; (iv) reducing management fees and total expenses for certain index funds and diversified international funds; (v) continuing to launch dedicated lower cost underlying funds to meet portfolio construction needs related to expanding underlying fund options for Fidelity funds of funds, specifically for the Freedom Fund product lines; (vi) rationalizing product lines and gaining increased efficiencies through fund mergers; (vii) launching active fixed-income exchange-traded funds; (viii) continuing to develop, acquire and implement systems and technology to improve services to the funds and information security and to increase efficiency; (ix) implementing investment enhancements to further strengthen Fidelity's target date product line to increase investors' probability of success in achieving their goals; (x) modifying the eligibility criteria for certain share classes to accommodate roll-over assets from employer-sponsored retirement plans; (xi) launching a new Class W of the Freedom Index Funds to attract and retain Fidelity record-kept retirement plan assets; and (xii) implementing changes to Fidelity's money market product line in response to recent money market regulatory reforms.
Investment Performance. The Board considered whether the fund has operated in accordance with its investment objective, as well as its record of compliance with its investment restrictions and its performance history. The Board noted that there was a portfolio management change for the fund in January 2014.
Annual Report
Board Approval of Investment Advisory Contracts and
Management Fees - continued
The Board took into account discussions with representatives of the Investment Advisers about fund investment performance that occur at Board meetings throughout the year. In this regard the Board noted that as part of regularly scheduled fund reviews and other reports to the Board on fund performance, the Board considers annualized return information for the fund, for different time periods, measured against a securities market index ("benchmark index") and a peer group of funds with similar objectives ("peer group"), if any. In its evaluation of fund investment performance, the Board gave particular attention to information indicating changes in performance of certain Fidelity funds for specific time periods and discussed with the Investment Advisers the reasons for any overperformance or underperformance.
In addition to reviewing absolute and relative fund performance, the Independent Trustees periodically consider the appropriateness of fund performance metrics in evaluating the results achieved. In general, the Independent Trustees believe that fund performance should be evaluated based on net performance (after fees and expenses) of both the highest performing and lowest performing fund share classes, where applicable, compared to appropriate benchmark indices, over appropriate time periods that may include full market cycles, and compared to peer groups, as applicable, over the same periods, taking into account relevant factors including the following: general market conditions; issuer-specific information; and fund cash flows and other factors.
The Independent Trustees recognize that shareholders evaluate performance on a net basis over their own holding periods, for which one-, three-, and five-year periods are often used as a proxy. For this reason, the performance information reviewed by the Board also included net cumulative calendar year total return information for the fund and an appropriate benchmark index and peer group for the most recent one-, three-, and five-year periods, as shown below. Returns are shown compared to the 25th percentile (top of box, 75% beaten) and 75th percentile (bottom of box, 25% beaten) of the peer universe.
Annual Report
Fidelity Dividend Growth Fund

The Board also considered that the fund's management fee is subject to upward or downward adjustment depending upon whether, and to what extent, the fund's investment performance for the performance period exceeds, or is exceeded by, a securities index, thus leading to a performance adjustment for the same period. The Board noted that the performance adjustment provides FMR with a strong economic incentive to seek to achieve superior performance for the fund's shareholders and helps to more closely align the interests of FMR and the shareholders of the fund.
Based on its review, the Board concluded that the nature, extent, and quality of services provided to the fund under the Advisory Contracts should benefit the shareholders of the fund.
Competitiveness of Management Fee and Total Expense Ratio. The Board considered the fund's management fee and total expense ratio compared to "mapped groups" of competitive funds and classes created for the purpose of facilitating the Trustees' competitive analysis of management fees and total expenses. Fidelity creates "mapped groups" by combining similar Lipper investment objective categories that have comparable investment mandates. Combining Lipper investment objective categories aids the Board's management fee and total expense ratio comparisons by broadening the competitive group used for comparison.
Management Fee. The Board considered two proprietary management fee comparisons for the 12-month periods shown in basis points (BP) in the chart below. The group of Lipper funds used by the Board for management fee comparisons is referred to below as the "Total Mapped Group." The Total Mapped Group comparison focuses on a fund's standing in terms of gross management fees before expense reimbursements or caps, and without giving effect to the fund's performance adjustment, relative to the total universe of funds with comparable investment mandates, regardless of whether their management fee structures also are comparable. Funds with comparable investment mandates offer exposure to similar types of securities. Funds with comparable management fee structures have similar management fee contractual arrangements (e.g., flat rate charged for advisory services, all-inclusive fee rate, etc.). "TMG %" represents the percentage of funds in the Total Mapped Group that had management fees that were lower than the fund's. For example, a hypothetical TMG % of 20% would mean that 80% of the funds in the Total Mapped Group had higher, and 20% had lower, management fees than the fund. The fund's actual TMG %s and the number of funds in the Total Mapped Group are in the chart below. The "Asset-Size Peer Group" (ASPG) comparison focuses on a fund's standing relative to a subset of non-Fidelity funds within the Total Mapped Group that are similar in size and management fee structure without taking into account performance adjustments, if any. For example, if a fund is in the first quartile of the ASPG, the fund's management fee ranks in the least expensive or lowest 25% of funds in the ASPG. The ASPG represents at least 15% of the funds in the Total Mapped Group with comparable asset size and management fee structures, subject to a minimum of 50 funds (or all funds in the Total Mapped Group if fewer than 50). Additional information, such as the ASPG quartile in which the fund's management fee rate ranked and the impact of the fund's performance adjustment, is also included in the chart and considered by the Board.
Annual Report
Board Approval of Investment Advisory Contracts and
Management Fees - continued
Fidelity Dividend Growth Fund

Annual Report
The Board noted that the fund's management fee rate ranked below the median of its Total Mapped Group and below the median of its ASPG for 2014. The Board also noted the effect of the fund's performance adjustment, if any, on the fund's management fee ranking.
The Board noted that, in 2014, the ad hoc Committee on Group Fee was formed by it and other Fidelity fund boards to conduct an in-depth review of the "group fee" component of the management fee of funds with such management fee structures. Committee focus included the mechanics of the group fee, the competitive landscape of group fee structures, Fidelity funds with no group fee component and investment products not included in group fee assets. The Board also considered that, for funds subject to the group fee, FMR agreed to voluntarily waive fees over a specified period of time in amounts designed to account for assets converted from certain funds to certain collective investment trusts.
The Board also noted that, in 2013, the ad hoc Committee on Management Fees was formed to conduct an in-depth review of the management fee rates of Fidelity's active equity mutual funds. The Committee focused on the following areas: (i) standard fee structures; (ii) research consumption and trading evolution; (iii) management fee competitiveness/profitability by category; and (iv) factors that drive institutional pricing.
Based on its review, the Board concluded that the fund's management fee is fair and reasonable in light of the services that the fund receives and the other factors considered.
Total Expense Ratio. In its review of each class's total expense ratio, the Board considered the fund's management fee as well as other fund or class expenses, as applicable, such as transfer agent fees, pricing and bookkeeping fees, and custodial, legal, and audit fees. The Board noted the impact of the fund's performance adjustment. The Board also noted that Fidelity may agree to waive fees and expenses from time to time, and the extent to which, if any, it has done so for the fund. As part of its review, the Board also considered the current and historical total expense ratios of each class of the fund compared to competitive fund median expenses. Each class of the fund is compared to those funds and classes in the Total Mapped Group (used by the Board for management fee comparisons) that have a similar sales load structure.
The Board noted that the total expense ratio of each class ranked below its competitive median for 2014.
Fees Charged to Other Fidelity Clients. The Board also considered Fidelity fee structures and other information with respect to clients of Fidelity, such as other funds advised or subadvised by Fidelity, pension plan clients, and other institutional clients with similar mandates. The Board noted the findings of the 2013 ad hoc joint committee (created with the board of other Fidelity funds), which reviewed and compared Fidelity's institutional investment advisory business with its business of providing services to the Fidelity funds, including the differences in services provided, fees charged, and costs incurred, as well as competition in their respective marketplaces.
Annual Report
Board Approval of Investment Advisory Contracts and
Management Fees - continued
Based on its review of total expense ratios and fees charged to other Fidelity clients, the Board concluded that the total expense ratio of each class of the fund was reasonable in light of the services that the fund and its shareholders receive and the other factors considered.
Costs of the Services and Profitability. The Board considered the revenues earned and the expenses incurred by Fidelity in conducting the business of developing, marketing, distributing, managing, administering and servicing the fund and servicing the fund's shareholders. The Board also considered the level of Fidelity's profits in respect of all the Fidelity funds.
On an annual basis, Fidelity presents to the Board information about the profitability of its relationship with the fund. Fidelity calculates profitability information for each fund, as well as aggregate profitability information for groups of Fidelity funds and all Fidelity funds, using a series of detailed revenue and cost allocation methodologies which originate with the books and records of Fidelity on which Fidelity's audited financial statements are based. The Audit Committee of the Board reviews any significant changes from the prior year's methodologies.
PricewaterhouseCoopers LLP (PwC), independent registered public accounting firm and auditor to Fidelity and certain Fidelity funds, has been engaged annually by the Board as part of the Board's assessment of Fidelity's profitability analysis. PwC's engagement includes the review and assessment of the methodologies used by Fidelity in determining the revenues and expenses attributable to Fidelity's mutual fund business, and completion of agreed-upon procedures in respect of the mathematical accuracy of fund profitability and its conformity to established allocation methodologies. After considering PwC's reports issued under the engagement and information provided by Fidelity, the Board concluded that while other allocation methods may also be reasonable, Fidelity's profitability methodologies are reasonable in all material respects.
The Board also reviewed Fidelity's non-fund businesses and fall-out benefits related to the mutual fund business as well as cases where Fidelity's affiliates may benefit from or be related to the fund's business.
The Board considered the costs of the services provided by and the profits realized by Fidelity in connection with the operation of the fund and was satisfied that the profitability was not excessive.
Economies of Scale. The Board considered whether there have been economies of scale in respect of the management of the Fidelity funds, whether the Fidelity funds (including the fund) have appropriately benefited from any such economies of scale, and whether there is potential for realization of any further economies of scale. The Board considered the extent to which the fund will benefit from economies of scale as assets grow through increased services to the fund, through waivers or reimbursements, or through fee or expense ratio reductions. The Board also noted that in 2013, it and the boards of other Fidelity funds created an ad hoc committee (the Economies of Scale Committee) to analyze whether Fidelity attains economies of scale in respect of the management and servicing of the Fidelity funds, whether the Fidelity funds have appropriately benefited from such economies of scale, and whether there is potential for realization of any further economies of scale.
Annual Report
The Board recognized that the fund's management contract incorporates a "group fee" structure, which provides for lower group fee rates as total group assets increase, and for higher group fee rates as total group assets decrease (with "group assets" defined to include fund assets under FMR's management plus sector fund assets previously under FMR's management and currently managed by Fidelity SelectCo, LLC).
FMR calculates the group fee rates based on a tiered asset "breakpoint" schedule that varies based on asset class. The Board considered that the group fee is designed to deliver the benefits of economies of scale to fund shareholders when total Fidelity fund assets increase, even if assets of any particular fund are unchanged or have declined, because some portion of Fidelity's costs are attributable to services provided to all Fidelity funds, and all funds benefit if those costs can be allocated among more assets. The Board concluded that, given the group fee structure, fund shareholders will benefit from lower management fees as group assets increase at the fund complex level, regardless of whether Fidelity achieves any such economies of scale.
The Board concluded, taking into account the analysis of the Economies of Scale Committee, that economies of scale, if any, are being appropriately shared between fund shareholders and Fidelity.
Additional Information Requested by the Board. In order to develop fully the factual basis for consideration of the Fidelity funds' Advisory Contracts, the Board requested and received additional information on certain topics, including: (i) fund performance trends and Fidelity's long-term strategies for certain funds; (ii) the various share classes employed by Fidelity and the attributes of each class, together with similar information on the distribution and servicing payments made by Fidelity or the funds to third-party participants in the distribution channels; (iii) fund profitability, and fund performance in relation to fund profitability; (iv) the methodology with respect to evaluating competitive fund data and peer group classifications and fee comparisons; (v) annual fund profitability margins, with particular focus on certain funds with negative margins; (vi) the realization of fall-out benefits in certain Fidelity business units; (vii) economies of scale and the way in which they are shared with fund shareholders; (viii) Fidelity's group fee structures, including the group fee schedule of breakpoints; (ix) the impact of cost containment measures on the funds; and (x) the transfer agent fee structure.
Annual Report
Board Approval of Investment Advisory Contracts and
Management Fees - continued
Based on its evaluation of all of the conclusions noted above, and after considering all factors it believed relevant, the Board concluded that the advisory fee structures are fair and reasonable, and that the fund's Advisory Contracts should be renewed.
Annual Report
Investment Adviser
Fidelity Management & Research Company
Boston, MA
Investment Sub-Advisers
FMR Co., Inc.
FMR Investment Management
(U.K.) Limited
Fidelity Management & Research
(Hong Kong) Limited
Fidelity Management & Research
(Japan) Limited
General Distributor
Fidelity Distributors Corporation
Smithfield, RI
Transfer and Service Agents
Fidelity Investments Institutional
Operations Company, Inc.
Boston, MA
Fidelity Service Company, Inc.
Boston, MA
Custodian
Brown Brothers Harriman & Co.
Boston, MA
(Fidelity Investment logo)(registered trademark)
Corporate Headquarters
245 Summer St., Boston, MA 02210
www.fidelity.com
DGF-K-UANN-0915
1.863064.106
Fidelity®
Blue Chip Growth
Fund
Annual Report
July 31, 2015
(Fidelity Cover Art)
Contents
Performance | (Click Here) | How the fund has done over time. |
Management's Discussion of Fund Performance | (Click Here) | The Portfolio Manager's review of fund performance and strategy. |
Shareholder Expense Example | (Click Here) | An example of shareholder expenses. |
Investment Changes | (Click Here) | A summary of major shifts in the fund's investments over the past six months. |
Investments | (Click Here) | A complete list of the fund's investments with their market values. |
Financial Statements | (Click Here) | Statements of assets and liabilities, operations, and changes in net assets, as well as financial highlights. |
Notes | (Click Here) | Notes to the financial statements. |
Report of Independent Registered Public Accounting Firm | (Click Here) | |
Trustees and Officers | (Click Here) | |
Distributions | (Click Here) | |
Board Approval of Investment Advisory Contracts and Management Fees | (Click Here) | |
To view a fund's proxy voting guidelines and proxy voting record for the 12-month period ended June 30, visit http://www.fidelity.com/proxyvotingresults or visit the Securities and Exchange Commission's (SEC) web site at http://www.sec.gov. You may also call 1-800-544-8544 to request a free copy of the proxy voting guidelines.
Standard & Poor's, S&P and S&P 500 are registered service marks of The McGraw-Hill Companies, Inc. and have been licensed for use by Fidelity Distributors Corporation.
Other third-party marks appearing herein are the property of their respective owners.
All other marks appearing herein are registered or unregistered trademarks or service marks of FMR LLC or an affiliated company. © 2015 FMR LLC. All rights reserved.
Annual Report
This report and the financial statements contained herein are submitted for the general information of the shareholders of the fund. This report is not authorized for distribution to prospective investors in the fund unless preceded or accompanied by an effective prospectus.
A fund files its complete schedule of portfolio holdings with the SEC for the first and third quarters of each fiscal year on Form N-Q. Forms N-Q are available on the SEC's web site at http://www.sec.gov. A fund's Forms N-Q may be reviewed and copied at the SEC's Public Reference Room in Washington, DC. Information regarding the operation of the SEC's Public Reference Room may be obtained by calling 1-800-SEC-0330. For a complete list of a fund's portfolio holdings, view the most recent holdings listing, semiannual report, or annual report on Fidelity's web site at http://www.fidelity.com, http://www.advisor.fidelity.com, or http://www.401k.com, as applicable.
NOT FDIC INSURED • MAY LOSE VALUE • NO BANK GUARANTEE
Neither the fund nor Fidelity Distributors Corporation is a bank.
Annual Report
Average annual total return reflects the change in the value of an investment, assuming reinvestment of the class' distributions from dividend income and capital gains (the profits earned upon the sale of securities that have grown in value, if any) and assuming a constant rate of performance each year. The $10,000 table and the fund's returns do not reflect the deduction of taxes that a shareholder would pay on fund distributions or the redemption of fund shares. During periods of reimbursement by Fidelity, a fund's total return will be greater than it would be had the reimbursement not occurred. How a fund did yesterday is no guarantee of how it will do tomorrow.
Average Annual Total Returns
Periods ended July 31, 2015 | Past 1
year | Past 5
years | Past 10
years |
Fidelity® Blue Chip Growth Fund | 19.72% | 19.49% | 9.96% |
$10,000 Over 10 Years
Let's say hypothetically that $10,000 was invested in Fidelity® Blue Chip Growth Fund, a class of the fund, on July 31, 2005. The chart shows how the value of your investment would have changed, and also shows how the Russell 1000® Growth Index performed over the same period.
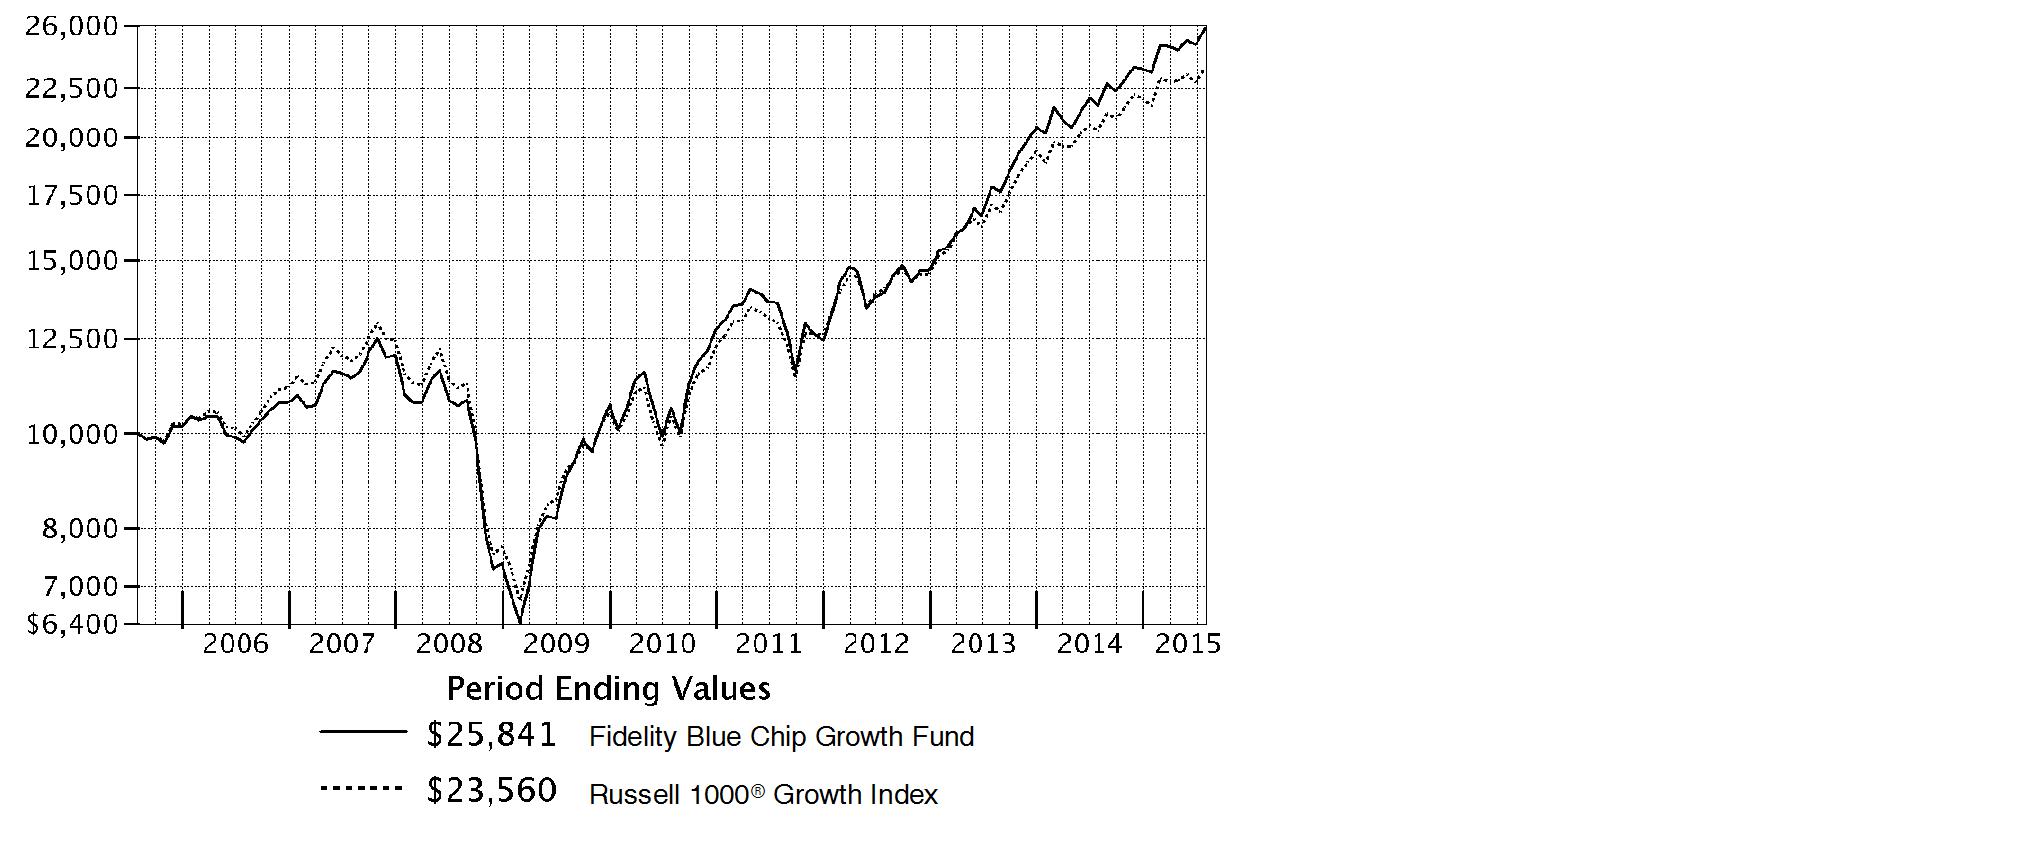
Annual Report
Market Recap: The U.S. equity market gained strongly for the 12 months ending July 31, 2015, as stocks recovered from volatility in late 2014 and early 2015, supported by a still-positive economic backdrop. The S&P 500® Index returned 11.21%, with growth stocks in the index far outpacing value-oriented names on prospects for continued U.S. economic growth. Consequently, the growth-oriented Nasdaq Composite Index® rose 18.71%, outpacing the broader S&P 500®, as well as the 12.03% advance of the smaller-cap Russell 2000® Index. Within the S&P 500®, seven of 10 sectors notched a gain, with significant performance variation. Health care (+27%) led the way, aided by merger activity. Consumer discretionary (+24%) benefited from spending linked to a seven-year low in unemployment. Strong first halves for the consumer staples sector and the real estate segment of financials yielded above-market returns (19% and 12%, respectively) for the full-year period. Conversely, energy (-26%) significantly lagged, due to a roughly 55% decline for U.S. crude-oil prices. Materials (-4%) also lost ground. At period end, investors remained focused on the slowing rate of U.S. earnings growth, the possible effect of a relatively stronger U.S. dollar on exports and inflation, and whether an economic slowdown in China would create ripples for the global economy.
Comments from Portfolio Manager Sonu Kalra: For the year, the fund's share classes handily outperformed the 16.08% gain of the benchmark Russell 1000® Growth Index. (For specific class-level results, please see the Performance section of this report.) Versus the benchmark, both stock selection and sector positioning provided a strong lift. Picks within information technology, health care and consumer discretionary were particularly helpful. The last category produced the largest individual contributor for the year: e-commerce giant Amazon.com. The fund held a substantial overweighting in the stock, which also was one of the fund's largest holdings. Strong first-quarter revenue growth of 15%, as well as profitability that exceeded investors' expectations, helped to lift the stock. In addition, for the first time Amazon provided financials for its decade-old cloud division, which included revenue growth of nearly 50% from the same period a year earlier. The firm also reported that it was on pace to generate at least $5 billion in sales this year. Turning to detractors, picks in consumer staples dragged on results the most, especially an overweighting in Keurig Green Mountain. The stock was hurt by lower-than-expected revenue related to a double-digit sales slide for its home-brewing machines. In addition, Keurig announced downside earnings guidance for consecutive quarters.
The views expressed above reflect those of the portfolio manager(s) only through the end of the period as stated on the cover of this report and do not necessarily represent the views of Fidelity or any other person in the Fidelity organization. Any such views are subject to change at any time based upon market or other conditions and Fidelity disclaims any responsibility to update such views. These views may not be relied on as investment advice and, because investment decisions for a Fidelity fund are based on numerous factors, may not be relied on as an indication of trading intent on behalf of any Fidelity fund.
Annual Report
Shareholder Expense Example
As a shareholder of the Fund, you incur two types of costs: (1) transaction costs, and (2) ongoing costs, including management fees and other Fund expenses. This Example is intended to help you understand your ongoing costs (in dollars) of investing in the Fund and to compare these costs with the ongoing costs of investing in other mutual funds.
The Example is based on an investment of $1,000 invested at the beginning of the period and held for the entire period (February 1, 2015 to July 31, 2015).
Actual Expenses
The first line of the accompanying table for each class of the Fund provides information about actual account values and actual expenses. You may use the information in this line, together with the amount you invested, to estimate the expenses that you paid over the period. Simply divide your account value by $1,000.00 (for example, an $8,600 account value divided by $1,000.00 = 8.6), then multiply the result by the number in the first line for a class of the Fund under the heading entitled "Expenses Paid During Period" to estimate the expenses you paid on your account during this period. A small balance maintenance fee of $12.00 that is charged once a year may apply for certain accounts with a value of less than $2,000. This fee is not included in the table below. If it was, the estimate of expenses you paid during the period would be higher, and your ending account value lower, by this amount. In addition, the Fund, as a shareholder in the underlying Fidelity Central Funds, will indirectly bear its pro-rata share of the fees and expenses incurred by the underlying Fidelity Central Funds. These fees and expenses are not included in the Fund's annualized expense ratio used to calculate the expense estimate in the table below.
Hypothetical Example for Comparison Purposes
The second line of the accompanying table for each class of the Fund provides information about hypothetical account values and hypothetical expenses based on a Class' actual expense ratio and an assumed rate of return of 5% per year before expenses, which is not the Class' actual return. The hypothetical account values and expenses may not be used to estimate the actual ending account balance or expenses you paid for the period. You may use this information to compare the ongoing costs of investing in the Fund and other funds. To do so, compare this 5% hypothetical example with the 5% hypothetical examples that appear in the shareholder reports of the other funds. A small balance maintenance fee of $12.00 that is charged once a year may apply for certain accounts with a value of less than $2,000. This fee is not included in the table below. If it was, the estimate of expenses you paid during the period would be higher, and your ending account value lower, by this amount. In addition, the Fund, as a shareholder in the underlying Fidelity Central Funds, will indirectly bear its pro-rata share of the fees and expenses incurred by the underlying Fidelity Central Funds. These fees and expenses are not included in the Fund's annualized expense ratio used to calculate the expense estimate in the table below.
Please note that the expenses shown in the table are meant to highlight your ongoing costs only and do not reflect any transaction costs. Therefore, the second line of the table is useful in comparing ongoing costs only, and will not help you determine the relative total costs of owning different funds.
Annual Report
Shareholder Expense Example - continued
| Annualized
Expense Ratio B | Beginning
Account Value
February 1, 2015 | Ending
Account Value
July 31, 2015 | Expenses Paid
During Period*
February 1, 2015
to July 31, 2015 |
Blue Chip Growth | .88% | | | |
Actual | | $ 1,000.00 | $ 1,108.60 | $ 4.60 |
HypotheticalA | | $ 1,000.00 | $ 1,020.43 | $ 4.41 |
Class K | .78% | | | |
Actual | | $ 1,000.00 | $ 1,109.10 | $ 4.08 |
HypotheticalA | | $ 1,000.00 | $ 1,020.93 | $ 3.91 |
A 5% return per year before expenses
B Annualized expense ratio reflects expenses net of applicable fee waivers.
* Expenses are equal to each Class' annualized expense ratio, multiplied by the average account value over the period, multiplied by 181/365 (to reflect the one-half year period).
Annual Report
Investment Changes (Unaudited)
Top Ten Stocks as of July 31, 2015 |
| % of fund's
net assets | % of fund's net assets
6 months ago |
Apple, Inc. | 6.4 | 6.6 |
Google, Inc. Class A | 4.3 | 2.7 |
Amazon.com, Inc. | 3.9 | 2.9 |
Facebook, Inc. Class A | 2.9 | 2.4 |
Gilead Sciences, Inc. | 2.2 | 2.6 |
Google, Inc. Class C | 2.0 | 2.2 |
The Walt Disney Co. | 2.0 | 1.5 |
Salesforce.com, Inc. | 1.8 | 1.4 |
Home Depot, Inc. | 1.8 | 1.9 |
Visa, Inc. Class A | 1.8 | 1.7 |
| 29.1 | |
Top Five Market Sectors as of July 31, 2015 |
| % of fund's
net assets | % of fund's net assets
6 months ago |
Information Technology | 34.2 | 33.4 |
Consumer Discretionary | 24.9 | 23.3 |
Health Care | 18.0 | 16.4 |
Consumer Staples | 9.8 | 9.8 |
Industrials | 5.5 | 8.3 |
Asset Allocation (% of fund's net assets) |
As of July 31, 2015* | As of January 31, 2015** |
 | Stocks 98.1% | |  | Stocks 98.6% | |
 | Convertible
Securities 1.9% | |  | Convertible
Securities 1.4% | |
 | Short-Term
Investments and
Net Other Assets
(Liabilities)† 0.0% | |  | Short-Term
Investments and
Net Other Assets
(Liabilities)† 0.0% | |
* Foreign investments | 12.5% | | ** Foreign investments | 12.2% | |
†Amount represents less than 0.1%. |

Annual Report
Investments July 31, 2015
Showing Percentage of Net Assets
Common Stocks - 98.1% |
| Shares | | Value (000s) |
CONSUMER DISCRETIONARY - 24.8% |
Auto Components - 0.2% |
Magna International, Inc. Class A (sub. vtg.) | 484,850 | | $ 26,344 |
Motherson Sumi Systems Ltd. | 787,172 | | 4,274 |
Motherson Sumi Systems Ltd. | 393,586 | | 2,137 |
| | 32,755 |
Automobiles - 1.4% |
General Motors Co. | 487,500 | | 15,361 |
Mahindra & Mahindra Ltd. (a) | 247,500 | | 5,274 |
Renault SA | 240,600 | | 22,138 |
Tesla Motors, Inc. (a)(d) | 943,456 | | 251,101 |
| | 293,874 |
Diversified Consumer Services - 0.0% |
2U, Inc. (a) | 27,917 | | 896 |
Houghton Mifflin Harcourt Co. (a) | 184,900 | | 4,831 |
| | 5,727 |
Hotels, Restaurants & Leisure - 5.3% |
Buffalo Wild Wings, Inc. (a) | 414,138 | | 80,997 |
Chipotle Mexican Grill, Inc. (a) | 273,917 | | 203,309 |
Dave & Buster's Entertainment, Inc. | 878,400 | | 34,082 |
Domino's Pizza, Inc. | 397,600 | | 45,263 |
Hilton Worldwide Holdings, Inc. | 1,915,700 | | 51,437 |
Jubilant Foodworks Ltd. (a) | 225,049 | | 6,444 |
Las Vegas Sands Corp. | 204,500 | | 11,460 |
McDonald's Corp. | 2,437,500 | | 243,409 |
Panera Bread Co. Class A (a) | 138,656 | | 28,302 |
Papa John's International, Inc. | 457,000 | | 34,531 |
Starbucks Corp. | 5,153,644 | | 298,551 |
Starwood Hotels & Resorts Worldwide, Inc. | 100,900 | | 8,018 |
Whitbread PLC | 305,594 | | 24,768 |
Wingstop, Inc. | 214,500 | | 7,353 |
Yum! Brands, Inc. | 404,900 | | 35,534 |
Zoe's Kitchen, Inc. (a)(d) | 336,600 | | 15,097 |
| | 1,128,555 |
Household Durables - 1.7% |
D.R. Horton, Inc. | 1,195,800 | | 35,503 |
GoPro, Inc. Class A (a)(d) | 1,720,200 | | 106,824 |
Jarden Corp. (a) | 626,600 | | 34,463 |
Sony Corp. (a) | 1,574,800 | | 44,640 |
Sony Corp. sponsored ADR (a) | 835,200 | | 23,678 |
Tempur Sealy International, Inc. (a) | 175,600 | | 13,267 |
Common Stocks - continued |
| Shares | | Value (000s) |
CONSUMER DISCRETIONARY - continued |
Household Durables - continued |
TRI Pointe Homes, Inc. (a) | 1,715,500 | | $ 25,389 |
Whirlpool Corp. | 484,200 | | 86,057 |
| | 369,821 |
Internet & Catalog Retail - 5.6% |
Amazon.com, Inc. (a) | 1,532,868 | | 821,847 |
Ctrip.com International Ltd. sponsored ADR (a) | 352,484 | | 25,231 |
Groupon, Inc. Class A (a)(d) | 7,317,800 | | 35,272 |
JD.com, Inc. sponsored ADR (a) | 478,800 | | 15,815 |
Jumei International Holding Ltd. sponsored ADR (a) | 298,900 | | 5,592 |
MakeMyTrip Ltd. (a) | 203,800 | | 2,975 |
Netflix, Inc. (a) | 859,361 | | 98,234 |
Priceline Group, Inc. (a) | 120,700 | | 150,099 |
The Honest Co., Inc. (h) | 150,143 | | 6,870 |
Vipshop Holdings Ltd. ADR (a) | 1,087,600 | | 21,197 |
| | 1,183,132 |
Leisure Products - 0.1% |
Hasbro, Inc. | 80,300 | | 6,323 |
MCBC Holdings, Inc. | 70,729 | | 1,082 |
NJOY, Inc. (a)(h) | 1,178,168 | | 0 |
Spin Master Corp. (a) | 416,000 | | 5,802 |
| | 13,207 |
Media - 2.3% |
Comcast Corp. Class A | 195,100 | | 12,176 |
DreamWorks Animation SKG, Inc. Class A (a) | 162,100 | | 3,908 |
Liberty Global PLC Class C (a) | 79,000 | | 3,882 |
Liberty LiLac Group Class C (a) | 3,950 | | 168 |
Live Nation Entertainment, Inc. (a) | 78,600 | | 2,061 |
Naspers Ltd. Class N | 203,000 | | 28,403 |
Starz Series A (a) | 327,200 | | 13,235 |
The Walt Disney Co. | 3,521,900 | | 422,628 |
| | 486,461 |
Multiline Retail - 1.3% |
B&M European Value Retail S.A. | 3,831,367 | | 21,342 |
Burlington Stores, Inc. (a) | 494,200 | | 27,201 |
Dollar Tree, Inc. (a) | 641,200 | | 50,033 |
Ollie's Bargain Outlet Holdings, Inc. | 75,700 | | 1,485 |
Target Corp. | 2,110,123 | | 172,714 |
| | 272,775 |
Common Stocks - continued |
| Shares | | Value (000s) |
CONSUMER DISCRETIONARY - continued |
Specialty Retail - 4.6% |
Abercrombie & Fitch Co. Class A | 94,700 | | $ 1,903 |
Advance Auto Parts, Inc. | 13,800 | | 2,404 |
Boot Barn Holdings, Inc. | 188,600 | | 5,960 |
Finish Line, Inc. Class A | 234,500 | | 6,446 |
Five Below, Inc. (a) | 738,200 | | 27,217 |
H&M Hennes & Mauritz AB (B Shares) | 250,369 | | 9,960 |
Home Depot, Inc. | 3,321,600 | | 388,727 |
Inditex SA | 566,956 | | 19,411 |
L Brands, Inc. | 988,582 | | 79,798 |
Michaels Companies, Inc. (a) | 632,800 | | 16,035 |
Office Depot, Inc. (a) | 440,700 | | 3,526 |
Restoration Hardware Holdings, Inc. (a)(d) | 1,767,222 | | 179,302 |
Ross Stores, Inc. | 1,323,126 | | 70,337 |
Signet Jewelers Ltd. | 52,500 | | 6,364 |
Staples, Inc. | 252,800 | | 3,719 |
Tiffany & Co., Inc. | 192,700 | | 18,441 |
TJX Companies, Inc. | 1,718,652 | | 119,996 |
Ulta Salon, Cosmetics & Fragrance, Inc. (a) | 160,400 | | 26,631 |
| | 986,177 |
Textiles, Apparel & Luxury Goods - 2.3% |
Columbia Sportswear Co. | 782,800 | | 56,002 |
Crocs, Inc. (a) | 950,300 | | 14,948 |
G-III Apparel Group Ltd. (a) | 313,200 | | 22,622 |
Hanesbrands, Inc. | 1,078,000 | | 33,450 |
Kate Spade & Co. (a) | 290,604 | | 5,847 |
lululemon athletica, Inc. (a)(d) | 890,458 | | 55,974 |
NIKE, Inc. Class B | 942,575 | | 108,603 |
PVH Corp. | 452,400 | | 52,496 |
Skechers U.S.A., Inc. Class A (sub. vtg.) (a) | 573,200 | | 86,238 |
Tory Burch LLC unit (g)(h) | 293,611 | | 20,890 |
Under Armour, Inc. Class A (sub. vtg.) (a) | 276,900 | | 27,504 |
| | 484,574 |
TOTAL CONSUMER DISCRETIONARY | | 5,257,058 |
CONSUMER STAPLES - 9.6% |
Beverages - 2.7% |
Anheuser-Busch InBev SA NV ADR | 421,691 | | 50,413 |
Coca-Cola Bottling Co. Consolidated | 31,100 | | 5,038 |
Constellation Brands, Inc. Class A (sub. vtg.) | 233,600 | | 28,037 |
Common Stocks - continued |
| Shares | | Value (000s) |
CONSUMER STAPLES - continued |
Beverages - continued |
Kweichow Moutai Co. Ltd. | 239,587 | | $ 7,980 |
Monster Beverage Corp. (a) | 1,121,735 | | 172,242 |
PepsiCo, Inc. | 1,026,854 | | 98,937 |
The Coca-Cola Co. | 5,225,152 | | 214,649 |
United Spirits Ltd. (a) | 41,658 | | 2,412 |
| | 579,708 |
Food & Staples Retailing - 2.8% |
Costco Wholesale Corp. | 835,600 | | 121,413 |
CVS Health Corp. | 1,770,300 | | 199,106 |
Kroger Co. | 2,949,774 | | 115,749 |
Rite Aid Corp. (a) | 1,674,700 | | 14,922 |
Sprouts Farmers Market LLC (a) | 1,327,477 | | 32,550 |
Tesco PLC | 7,211,300 | | 24,251 |
United Natural Foods, Inc. (a) | 75,200 | | 3,424 |
Wal-Mart de Mexico SA de CV Series V | 1,543,900 | | 3,750 |
Walgreens Boots Alliance, Inc. | 372,500 | | 35,995 |
Whole Foods Market, Inc. | 1,061,710 | | 38,646 |
| | 589,806 |
Food Products - 2.4% |
Associated British Foods PLC | 1,025,700 | | 51,642 |
Blue Buffalo Pet Products, Inc. | 254,400 | | 7,108 |
China Modern Dairy Holdings Ltd. | 7,448,000 | | 2,411 |
Edita Food Industries SAE GDR (a)(f) | 129,600 | | 2,890 |
Freshpet, Inc. (d) | 412,800 | | 6,819 |
Keurig Green Mountain, Inc. | 2,494,688 | | 187,201 |
Mead Johnson Nutrition Co. Class A | 632,094 | | 55,871 |
Mondelez International, Inc. | 2,467,200 | | 111,345 |
Pinnacle Foods, Inc. | 48,900 | | 2,198 |
The Hain Celestial Group, Inc. (a) | 718,200 | | 48,823 |
WhiteWave Foods Co. (a) | 469,669 | | 24,244 |
| | 500,552 |
Personal Products - 1.6% |
AMOREPACIFIC Group, Inc. | 72,220 | | 12,047 |
Edgewell Personal Care Co. (a) | 330,600 | | 31,642 |
Estee Lauder Companies, Inc. Class A | 698,100 | | 62,208 |
Herbalife Ltd. (a) | 2,178,258 | | 109,980 |
Nu Skin Enterprises, Inc. Class A (d)(e) | 3,392,600 | | 134,517 |
| | 350,394 |
Common Stocks - continued |
| Shares | | Value (000s) |
CONSUMER STAPLES - continued |
Tobacco - 0.1% |
Imperial Tobacco Group PLC | 205,961 | | $ 10,823 |
Reynolds American, Inc. | 107,100 | | 9,188 |
| | 20,011 |
TOTAL CONSUMER STAPLES | | 2,040,471 |
ENERGY - 1.2% |
Energy Equipment & Services - 0.0% |
U.S. Silica Holdings, Inc. (d) | 150,320 | | 3,385 |
Oil, Gas & Consumable Fuels - 1.2% |
Anadarko Petroleum Corp. | 322,100 | | 23,948 |
Cimarex Energy Co. | 393,907 | | 41,014 |
Continental Resources, Inc. (a) | 529,600 | | 17,694 |
EOG Resources, Inc. | 698,024 | | 53,880 |
Memorial Resource Development Corp. (a) | 277,000 | | 4,238 |
Noble Energy, Inc. | 377,879 | | 13,313 |
PDC Energy, Inc. (a) | 49,400 | | 2,319 |
Pioneer Natural Resources Co. | 351,300 | | 44,534 |
Rice Energy, Inc. (a) | 564,200 | | 10,184 |
SM Energy Co. | 616,700 | | 22,861 |
Whiting Petroleum Corp. (a) | 1,085,900 | | 22,250 |
| | 256,235 |
TOTAL ENERGY | | 259,620 |
FINANCIALS - 4.2% |
Banks - 2.3% |
Axis Bank Ltd. (a) | 953,180 | | 8,543 |
Bank of America Corp. | 6,102,087 | | 109,105 |
Citigroup, Inc. | 2,135,590 | | 124,847 |
Gree Electric Applicances, Inc. ELS (BNP Paribas Arbitrage Warrant Program) warrants 12/10/15 (f) | 1,573,600 | | 5,654 |
Hangzhou Hikvision Digital Technology Co. Ltd. ELS (BNP Paribas Arbitrage Warrant Program) warrants 11/06/2015 (a)(f) | 2,828,700 | | 15,044 |
HDFC Bank Ltd. sponsored ADR | 656,000 | | 40,980 |
ICICI Bank Ltd. sponsored ADR | 1,851,145 | | 18,641 |
JPMorgan Chase & Co. | 2,392,077 | | 163,929 |
Regions Financial Corp. | 818,000 | | 8,499 |
| | 495,242 |
Common Stocks - continued |
| Shares | | Value (000s) |
FINANCIALS - continued |
Capital Markets - 1.3% |
Ameriprise Financial, Inc. | 184,953 | | $ 23,243 |
Bank of New York Mellon Corp. | 236,500 | | 10,264 |
BlackRock, Inc. Class A | 177,800 | | 59,798 |
Charles Schwab Corp. | 705,700 | | 24,615 |
Fairfax India Holdings Corp. (a) | 920,000 | | 10,442 |
Goldman Sachs Group, Inc. | 31,300 | | 6,419 |
Invesco Ltd. | 611,272 | | 23,595 |
Morgan Stanley | 1,331,951 | | 51,733 |
Northern Trust Corp. | 219,100 | | 16,759 |
State Street Corp. | 182,700 | | 13,988 |
The Blackstone Group LP | 795,400 | | 31,219 |
Weifu High-Technology Co. Ltd. ELS (UBS Warrant Programme) warrants 6/17/16 (f) | 1,794,900 | | 7,269 |
| | 279,344 |
Consumer Finance - 0.1% |
Shriram Transport Finance Co. Ltd. | 444,501 | | 6,192 |
Springleaf Holdings, Inc. (a) | 236,000 | | 11,920 |
Synchrony Financial (d) | 126,900 | | 4,360 |
| | 22,472 |
Diversified Financial Services - 0.1% |
McGraw Hill Financial, Inc. | 100,100 | | 10,185 |
Moody's Corp. | 113,400 | | 12,523 |
Multi Commodity Exchange of India Ltd. (a) | 4,622 | | 82 |
| | 22,790 |
Insurance - 0.0% |
American International Group, Inc. | 33,300 | | 2,135 |
Real Estate Investment Trusts - 0.2% |
Extra Space Storage, Inc. | 256,400 | | 18,851 |
Lamar Advertising Co. Class A | 206,900 | | 12,424 |
| | 31,275 |
Real Estate Management & Development - 0.1% |
Parsvnath Developers Ltd. (a)(e) | 21,771,340 | | 6,516 |
Realogy Holdings Corp. (a) | 280,867 | | 12,785 |
| | 19,301 |
Thrifts & Mortgage Finance - 0.1% |
Housing Development Finance Corp. Ltd. | 697,722 | | 14,616 |
Common Stocks - continued |
| Shares | | Value (000s) |
FINANCIALS - continued |
Thrifts & Mortgage Finance - continued |
Indiabulls Housing Finance Ltd. | 604,148 | | $ 6,970 |
LIC Housing Finance Ltd. | 351,944 | | 2,746 |
| | 24,332 |
TOTAL FINANCIALS | | 896,891 |
HEALTH CARE - 17.9% |
Biotechnology - 10.3% |
Acceleron Pharma, Inc. (a) | 42,500 | | 1,217 |
Aduro Biotech, Inc. (d) | 86,500 | | 2,268 |
Agios Pharmaceuticals, Inc. (a) | 194,340 | | 21,412 |
Alexion Pharmaceuticals, Inc. (a) | 597,096 | | 117,891 |
Alkermes PLC (a) | 792,100 | | 55,463 |
Alnylam Pharmaceuticals, Inc. (a) | 685,563 | | 87,361 |
Amgen, Inc. | 1,185,802 | | 209,401 |
Ascendis Pharma A/S ADR | 333,600 | | 6,682 |
Avalanche Biotechnologies, Inc. (a) | 89,800 | | 1,322 |
BioCryst Pharmaceuticals, Inc. (a) | 1,038,000 | | 16,068 |
Biogen, Inc. (a) | 930,500 | | 296,625 |
BioMarin Pharmaceutical, Inc. (a) | 318,704 | | 46,617 |
bluebird bio, Inc. (a) | 201,800 | | 33,464 |
Calithera Biosciences, Inc. (d) | 264,600 | | 1,958 |
Catabasis Pharmaceuticals, Inc. | 525,300 | | 6,829 |
Celgene Corp. (a) | 1,912,300 | | 250,989 |
Cellectis SA sponsored ADR | 67,300 | | 2,390 |
Chiasma, Inc. | 221,566 | | 4,700 |
Chiasma, Inc. | 148,000 | | 3,488 |
Chiasma, Inc. warrants (a) | 55,391 | | 807 |
Chimerix, Inc. (a) | 85,600 | | 4,600 |
China Biologic Products, Inc. (a) | 59,200 | | 7,244 |
Cidara Therapeutics, Inc. | 62,400 | | 872 |
Coherus BioSciences, Inc. | 367,600 | | 12,895 |
DBV Technologies SA sponsored ADR (a) | 108,200 | | 4,716 |
Dicerna Pharmaceuticals, Inc. (a) | 160,160 | | 1,957 |
Dyax Corp. (a) | 141,500 | | 3,482 |
Esperion Therapeutics, Inc. (a) | 37,800 | | 2,344 |
Exelixis, Inc. (a)(d) | 2,828,200 | | 16,206 |
FibroGen, Inc. (d) | 71,142 | | 1,654 |
Gilead Sciences, Inc. | 3,974,060 | | 468,383 |
Incyte Corp. (a) | 39,500 | | 4,119 |
Intercept Pharmaceuticals, Inc. (a) | 132,900 | | 35,060 |
Common Stocks - continued |
| Shares | | Value (000s) |
HEALTH CARE - continued |
Biotechnology - continued |
Intrexon Corp. (a)(d) | 477,059 | | $ 31,128 |
Ironwood Pharmaceuticals, Inc. Class A (a) | 901,481 | | 9,420 |
Isis Pharmaceuticals, Inc. (a) | 126,900 | | 6,971 |
Kite Pharma, Inc. (a)(d) | 98,400 | | 7,161 |
Merrimack Pharmaceuticals, Inc. (a)(d) | 1,584,158 | | 16,000 |
Neurocrine Biosciences, Inc. (a) | 544,900 | | 27,310 |
Novavax, Inc. (a) | 442,600 | | 5,338 |
ProNai Therapeutics, Inc. | 295,100 | | 8,086 |
Prothena Corp. PLC (a) | 97,700 | | 6,445 |
Radius Health, Inc. (a) | 85,300 | | 6,681 |
Regeneron Pharmaceuticals, Inc. (a) | 383,089 | | 212,101 |
Retrophin, Inc. (a) | 201,500 | | 6,396 |
Sage Therapeutics, Inc. | 24,700 | | 1,688 |
Seattle Genetics, Inc. (a) | 376,400 | | 18,018 |
Seres Therapeutics, Inc. | 49,400 | | 1,870 |
Spark Therapeutics, Inc. | 17,900 | | 1,100 |
Ultragenyx Pharmaceutical, Inc. (a) | 59,300 | | 7,171 |
uniQure B.V. (a) | 303,687 | | 7,820 |
Versartis, Inc. (a) | 178,500 | | 3,231 |
Vertex Pharmaceuticals, Inc. (a) | 506,260 | | 68,345 |
Xencor, Inc. (a) | 111,400 | | 2,494 |
ZIOPHARM Oncology, Inc. (a)(d) | 1,143,546 | | 15,278 |
| | 2,200,536 |
Health Care Equipment & Supplies - 0.8% |
Boston Scientific Corp. (a) | 2,758,800 | | 47,838 |
Glaukos Corp. | 190,000 | | 6,040 |
Hologic, Inc. (a) | 153,700 | | 6,403 |
Intuitive Surgical, Inc. (a) | 121,207 | | 64,624 |
Invuity, Inc. | 511,800 | | 6,029 |
Medtronic PLC | 272,570 | | 21,367 |
Nevro Corp. | 41,400 | | 2,102 |
Novadaq Technologies, Inc. (a) | 475,319 | | 5,452 |
St. Jude Medical, Inc. | 57,700 | | 4,259 |
Zeltiq Aesthetics, Inc. (a) | 428,900 | | 14,733 |
| | 178,847 |
Health Care Providers & Services - 1.2% |
Adeptus Health, Inc. Class A (a) | 288,400 | | 31,692 |
AmerisourceBergen Corp. | 143,600 | | 15,186 |
AmSurg Corp. (a) | 158,400 | | 11,364 |
Apollo Hospitals Enterprise Ltd. (a) | 936,371 | | 19,899 |
Common Stocks - continued |
| Shares | | Value (000s) |
HEALTH CARE - continued |
Health Care Providers & Services - continued |
Cardinal Health, Inc. | 308,631 | | $ 26,227 |
Cigna Corp. | 135,900 | | 19,578 |
Diplomat Pharmacy, Inc. | 128,000 | | 5,911 |
Express Scripts Holding Co. (a) | 46,400 | | 4,179 |
HCA Holdings, Inc. (a) | 781,000 | | 72,641 |
McKesson Corp. | 139,400 | | 30,747 |
Teladoc, Inc. (a) | 49,800 | | 1,572 |
UnitedHealth Group, Inc. | 102,300 | | 12,419 |
| | 251,415 |
Health Care Technology - 0.3% |
athenahealth, Inc. (a) | 75,975 | | 10,633 |
Castlight Health, Inc. Class B (a)(d) | 513,500 | | 3,687 |
Cerner Corp. (a) | 558,718 | | 40,071 |
Evolent Health, Inc. | 243,600 | | 5,196 |
| | 59,587 |
Life Sciences Tools & Services - 0.2% |
Illumina, Inc. (a) | 151,735 | | 33,275 |
Lonza Group AG | 38,158 | | 5,532 |
| | 38,807 |
Pharmaceuticals - 5.1% |
AbbVie, Inc. | 1,021,700 | | 71,529 |
Achaogen, Inc. (a) | 329,000 | | 2,372 |
Allergan PLC (a) | 1,140,055 | | 377,529 |
Bristol-Myers Squibb Co. | 2,284,100 | | 149,928 |
CSPC Pharmaceutical Group Ltd. | 2,126,000 | | 1,947 |
Dermira, Inc. | 315,700 | | 7,129 |
Eli Lilly & Co. | 365,400 | | 30,880 |
Endo Health Solutions, Inc. (a) | 66,800 | | 5,848 |
GW Pharmaceuticals PLC ADR (a) | 263,866 | | 30,215 |
Jazz Pharmaceuticals PLC (a) | 141,100 | | 27,125 |
Mallinckrodt PLC (a) | 202,600 | | 25,114 |
Relypsa, Inc. (a) | 104,900 | | 3,473 |
Shire PLC sponsored ADR | 275,259 | | 73,442 |
Tetraphase Pharmaceuticals, Inc. (a) | 215,700 | | 10,257 |
Teva Pharmaceutical Industries Ltd. sponsored ADR | 1,281,000 | | 88,415 |
Common Stocks - continued |
| Shares | | Value (000s) |
HEALTH CARE - continued |
Pharmaceuticals - continued |
Valeant Pharmaceuticals International, Inc. (Canada) (a) | 642,400 | | $ 164,705 |
ZS Pharma, Inc. (a) | 216,200 | | 12,914 |
| | 1,082,822 |
TOTAL HEALTH CARE | | 3,812,014 |
INDUSTRIALS - 5.4% |
Aerospace & Defense - 1.3% |
General Dynamics Corp. | 43,700 | | 6,516 |
Honeywell International, Inc. | 1,041,600 | | 109,420 |
Huntington Ingalls Industries, Inc. | 78,800 | | 9,252 |
The Boeing Co. | 1,059,426 | | 152,737 |
TransDigm Group, Inc. (a) | 18,300 | | 4,141 |
| | 282,066 |
Air Freight & Logistics - 0.3% |
FedEx Corp. | 264,378 | | 45,320 |
United Parcel Service, Inc. Class B | 43,800 | | 4,483 |
XPO Logistics, Inc. (a)(d) | 516,700 | | 22,399 |
| | 72,202 |
Airlines - 0.9% |
American Airlines Group, Inc. | 1,871,393 | | 75,043 |
Azul-Linhas Aereas Brasileiras warrants (a)(h) | 165,571 | | 0 |
Delta Air Lines, Inc. | 635,300 | | 28,169 |
Southwest Airlines Co. | 624,002 | | 22,589 |
Spirit Airlines, Inc. (a) | 772,100 | | 46,187 |
United Continental Holdings, Inc. (a) | 290,000 | | 16,353 |
Wizz Air Holdings PLC | 270,524 | | 6,966 |
| | 195,307 |
Building Products - 0.3% |
A.O. Smith Corp. | 274,254 | | 19,697 |
Caesarstone Sdot-Yam Ltd. | 254,100 | | 18,229 |
Continental Building Products, Inc. (a) | 1,019,000 | | 21,644 |
Lennox International, Inc. | 19,800 | | 2,338 |
Toto Ltd. | 470,000 | | 7,660 |
| | 69,568 |
Commercial Services & Supplies - 0.2% |
Interface, Inc. | 1,258,200 | | 32,675 |
Common Stocks - continued |
| Shares | | Value (000s) |
INDUSTRIALS - continued |
Construction & Engineering - 0.0% |
Beijing Urban Consolidated & Development Group Ltd. (H Shares) | 2,494,000 | | $ 2,217 |
Larsen & Toubro Ltd. (a) | 204,799 | | 5,733 |
| | 7,950 |
Electrical Equipment - 0.4% |
Acuity Brands, Inc. | 187,300 | | 37,683 |
SolarCity Corp. (a)(d) | 813,632 | | 47,191 |
| | 84,874 |
Industrial Conglomerates - 0.6% |
Danaher Corp. | 632,200 | | 57,884 |
General Electric Co. | 2,563,700 | | 66,913 |
| | 124,797 |
Machinery - 0.3% |
Eicher Motors Ltd. (a) | 14,288 | | 4,258 |
Ingersoll-Rand PLC | 465,784 | | 28,599 |
Manitowoc Co., Inc. | 125,200 | | 2,212 |
Middleby Corp. (a) | 39,700 | | 4,871 |
Pentair PLC | 61,700 | | 3,752 |
Rational AG | 6,060 | | 2,368 |
Zhengzhou Yutong Bus Co. Ltd. | 1,652,100 | | 5,151 |
| | 51,211 |
Professional Services - 0.3% |
Equifax, Inc. | 42,900 | | 4,381 |
Huron Consulting Group, Inc. (a) | 193,220 | | 14,776 |
Manpower, Inc. | 425,100 | | 38,463 |
Verisk Analytics, Inc. (a) | 109,300 | | 8,537 |
WageWorks, Inc. (a) | 61,700 | | 3,082 |
| | 69,239 |
Road & Rail - 0.4% |
Canadian Pacific Railway Ltd. (d) | 182,800 | | 29,427 |
Container Corp. of India Ltd. | 242,276 | | 6,216 |
J.B. Hunt Transport Services, Inc. | 570,000 | | 47,948 |
| | 83,591 |
Trading Companies & Distributors - 0.4% |
HD Supply Holdings, Inc. (a) | 1,854,400 | | 66,388 |
United Rentals, Inc. (a) | 154,600 | | 10,357 |
| | 76,745 |
Common Stocks - continued |
| Shares | | Value (000s) |
INDUSTRIALS - continued |
Transportation Infrastructure - 0.0% |
Qingdao Port International Co. Ltd. | 3,284,000 | | $ 2,110 |
TOTAL INDUSTRIALS | | 1,152,335 |
INFORMATION TECHNOLOGY - 32.9% |
Communications Equipment - 0.3% |
CommScope Holding Co., Inc. (a) | 207,800 | | 6,519 |
Palo Alto Networks, Inc. (a) | 145,991 | | 27,130 |
QUALCOMM, Inc. | 435,400 | | 28,035 |
| | 61,684 |
Electronic Equipment & Components - 0.2% |
Fitbit, Inc. (d) | 685,200 | | 32,616 |
Jabil Circuit, Inc. | 598,700 | | 12,124 |
| | 44,740 |
Internet Software & Services - 12.1% |
58.com, Inc. ADR (a) | 173,700 | | 10,316 |
Akamai Technologies, Inc. (a) | 499,830 | | 38,342 |
Alibaba Group Holding Ltd. sponsored ADR | 1,308,300 | | 102,492 |
Baidu.com, Inc. sponsored ADR (a) | 12,500 | | 2,158 |
Criteo SA sponsored ADR (a) | 63,487 | | 3,379 |
Dropbox, Inc. (a)(h) | 1,003,814 | | 16,824 |
eBay, Inc. (a) | 262,700 | | 7,387 |
Facebook, Inc. Class A (a) | 6,501,501 | | 611,206 |
Gogo, Inc. (a)(d) | 1,570,900 | | 28,638 |
Google, Inc.: | | | |
Class A (a) | 1,393,954 | | 916,525 |
Class C | 693,337 | | 433,759 |
HomeAway, Inc. (a) | 1,269,500 | | 38,136 |
Info Edge India Ltd. | 661,765 | | 8,612 |
Just Dial Ltd. | 578,216 | | 9,757 |
JUST EAT Ltd. (a) | 3,090,962 | | 21,046 |
NetEase, Inc. sponsored ADR | 182,500 | | 25,300 |
New Relic, Inc. | 175,317 | | 6,101 |
Rackspace Hosting, Inc. (a) | 1,296,301 | | 44,113 |
Tencent Holdings Ltd. | 3,180,100 | | 59,247 |
Twitter, Inc. (a) | 4,222,800 | | 130,949 |
Yahoo!, Inc. (a) | 1,411,576 | | 51,762 |
Youku Tudou, Inc. ADR (a) | 640,200 | | 12,420 |
| | 2,578,469 |
Common Stocks - continued |
| Shares | | Value (000s) |
INFORMATION TECHNOLOGY - continued |
IT Services - 4.5% |
Alliance Data Systems Corp. (a) | 39,000 | | $ 10,727 |
Cognizant Technology Solutions Corp. Class A (a) | 3,786,554 | | 238,932 |
EOH Holdings Ltd. | 181,500 | | 2,473 |
MasterCard, Inc. Class A | 2,756,100 | | 268,444 |
PayPal Holdings, Inc. (a) | 262,700 | | 10,166 |
Sabre Corp. | 1,063,400 | | 28,286 |
Total System Services, Inc. | 164,800 | | 7,617 |
Visa, Inc. Class A | 5,116,896 | | 385,507 |
| | 952,152 |
Semiconductors & Semiconductor Equipment - 4.5% |
Ambarella, Inc. (a)(d) | 199,800 | | 23,151 |
Analog Devices, Inc. | 3,367,821 | | 196,445 |
Atmel Corp. | 1,138,100 | | 9,423 |
Avago Technologies Ltd. | 1,079,300 | | 135,064 |
Broadcom Corp. Class A | 1,606,100 | | 81,285 |
Cavium, Inc. (a) | 952,301 | | 64,566 |
Cirrus Logic, Inc. (a) | 2,136,500 | | 70,526 |
Maxim Integrated Products, Inc. | 238,800 | | 8,129 |
Micron Technology, Inc. (a) | 229,900 | | 4,255 |
Monolithic Power Systems, Inc. | 189,704 | | 9,810 |
NVIDIA Corp. | 1,274,870 | | 25,434 |
NXP Semiconductors NV (a) | 2,766,207 | | 268,294 |
Qorvo, Inc. (a) | 458,986 | | 26,598 |
Skyworks Solutions, Inc. | 249,900 | | 23,908 |
| | 946,888 |
Software - 4.8% |
Activision Blizzard, Inc. | 4,806,016 | | 123,947 |
Adobe Systems, Inc. (a) | 962,950 | | 78,952 |
Appirio, Inc. (h) | 87,529 | | 434 |
Citrix Systems, Inc. (a) | 60,900 | | 4,605 |
Electronic Arts, Inc. (a) | 1,754,200 | | 125,513 |
Fortinet, Inc. (a) | 492,496 | | 23,512 |
HubSpot, Inc. | 52,500 | | 2,832 |
Intuit, Inc. | 201,700 | | 21,334 |
Micro Focus International PLC | 103,400 | | 2,257 |
Mobileye NV (a) | 209,400 | | 12,585 |
Nintendo Co. Ltd. | 288,800 | | 50,823 |
Paycom Software, Inc. (a) | 174,200 | | 5,574 |
Playtech Ltd. | 159,408 | | 2,257 |
Qlik Technologies, Inc. (a) | 893,800 | | 36,163 |
Common Stocks - continued |
| Shares | | Value (000s) |
INFORMATION TECHNOLOGY - continued |
Software - continued |
Rapid7, Inc. | 33,300 | | $ 765 |
Red Hat, Inc. (a) | 436,200 | | 34,495 |
Salesforce.com, Inc. (a) | 5,329,007 | | 390,616 |
Splunk, Inc. (a) | 99,400 | | 6,952 |
Tableau Software, Inc. (a) | 424,500 | | 44,462 |
Take-Two Interactive Software, Inc. (a) | 225,000 | | 7,106 |
Workday, Inc. Class A (a) | 78,800 | | 6,645 |
Workiva, Inc. (d) | 139,200 | | 2,031 |
Zendesk, Inc. (a) | 521,400 | | 10,756 |
Zynga, Inc. (a) | 6,076,283 | | 15,069 |
| | 1,009,685 |
Technology Hardware, Storage & Peripherals - 6.5% |
Apple, Inc. | 11,249,709 | | 1,364,597 |
Nimble Storage, Inc. (a) | 662,600 | | 18,301 |
SanDisk Corp. | 112,800 | | 6,801 |
| | 1,389,699 |
TOTAL INFORMATION TECHNOLOGY | | 6,983,317 |
MATERIALS - 1.9% |
Chemicals - 1.6% |
Agrium, Inc. | 129,200 | | 13,218 |
Air Products & Chemicals, Inc. | 64,500 | | 9,192 |
Ashland, Inc. | 147,900 | | 16,908 |
CF Industries Holdings, Inc. | 2,305,300 | | 136,474 |
E.I. du Pont de Nemours & Co. | 1,295,100 | | 72,215 |
Eastman Chemical Co. | 53,300 | | 4,179 |
Monsanto Co. | 590,300 | | 60,146 |
Potash Corp. of Saskatchewan, Inc. | 657,800 | | 17,895 |
PPG Industries, Inc. | 69,800 | | 7,565 |
Syngenta AG sponsored ADR | 46,900 | | 3,862 |
| | 341,654 |
Construction Materials - 0.1% |
Eagle Materials, Inc. | 218,700 | | 16,871 |
Prism Cement Ltd. (a) | 2,498,232 | | 4,195 |
Shree Cement Ltd. (a) | 10,816 | | 1,931 |
| | 22,997 |
Common Stocks - continued |
| Shares | | Value (000s) |
MATERIALS - continued |
Containers & Packaging - 0.2% |
Sealed Air Corp. | 509,700 | | $ 27,101 |
WestRock Co. | 67,600 | | 4,263 |
| | 31,364 |
Metals & Mining - 0.0% |
Compass Minerals International, Inc. | 3,736 | | 299 |
TOTAL MATERIALS | | 396,314 |
TELECOMMUNICATION SERVICES - 0.2% |
Wireless Telecommunication Services - 0.2% |
Bharti Infratel Ltd. | 4,948,490 | | 34,619 |
UTILITIES - 0.0% |
Electric Utilities - 0.0% |
Power Grid Corp. of India Ltd. | 757,980 | | 1,696 |
Independent Power and Renewable Electricity Producers - 0.0% |
Dynegy, Inc. (a) | 211,432 | | 5,508 |
TOTAL UTILITIES | | 7,204 |
TOTAL COMMON STOCKS (Cost $13,536,286) |
20,839,843
|
Preferred Stocks - 1.9% |
| | | |
Convertible Preferred Stocks - 1.9% |
CONSUMER DISCRETIONARY - 0.1% |
Internet & Catalog Retail - 0.1% |
Meituan Corp. Series D (h) | 1,581,852 | | 12,291 |
The Honest Co., Inc. Series C (h) | 350,333 | | 16,029 |
| | 28,320 |
Leisure Products - 0.0% |
NJOY, Inc.: | | | |
Series C (a)(h) | 607,766 | | 302 |
Series D (a)(h) | 149,114 | | 74 |
| | 376 |
TOTAL CONSUMER DISCRETIONARY | | 28,696 |
Preferred Stocks - continued |
| Shares | | Value (000s) |
Convertible Preferred Stocks - continued |
CONSUMER STAPLES - 0.2% |
Food & Staples Retailing - 0.1% |
Blue Apron, Inc. Series D (h) | 780,377 | | $ 10,400 |
Food Products - 0.1% |
BLUE BOTTLE Coffee, Inc. Series C (h) | 632,822 | | 21,086 |
Tobacco - 0.0% |
PAX Labs, Inc. Series C (h) | 2,555,833 | | 9,840 |
TOTAL CONSUMER STAPLES | | 41,326 |
FINANCIALS - 0.1% |
Consumer Finance - 0.1% |
Oportun Finance Corp. Series H (h) | 3,552,125 | | 10,114 |
HEALTH CARE - 0.1% |
Biotechnology - 0.1% |
CytomX Therapeutics, Inc. Series D (h) | 23,852,048 | | 3,538 |
Gensight Biologics Series B (h) | 1,059,505 | | 3,235 |
Immunocore Ltd. Series A (h) | 11,275 | | 2,129 |
Pronutria Biosciences, Inc. Series C (h) | 545,634 | | 5,500 |
| | 14,402 |
INDUSTRIALS - 0.1% |
Aerospace & Defense - 0.0% |
Space Exploration Technologies Corp. Series G (h) | 97,277 | | 7,535 |
Airlines - 0.0% |
Azul-Linhas Aereas Brasileiras Series B (a)(h) | 165,571 | | 5,803 |
Professional Services - 0.1% |
YourPeople, Inc. Series C (h) | 692,196 | | 10,314 |
TOTAL INDUSTRIALS | | 23,652 |
INFORMATION TECHNOLOGY - 1.3% |
Internet Software & Services - 1.0% |
Uber Technologies, Inc.: | | | |
Series D, 8.00% (a)(h) | 5,156,948 | | 204,421 |
Series E, 8.00% (h) | 102,648 | | 4,069 |
| | 208,490 |
Preferred Stocks - continued |
| Shares | | Value (000s) |
Convertible Preferred Stocks - continued |
INFORMATION TECHNOLOGY - continued |
IT Services - 0.1% |
AppNexus, Inc. Series E (h) | 646,522 | | $ 17,805 |
Nutanix, Inc. Series E (h) | 482,746 | | 7,685 |
| | 25,490 |
Software - 0.2% |
Appirio, Inc. Series E (h) | 612,702 | | 3,039 |
Cloudera, Inc. Series F (a)(h) | 186,078 | | 6,109 |
Cloudflare, Inc. Series D (h) | 696,025 | | 4,903 |
Dataminr, Inc. Series D (h) | 277,250 | | 3,535 |
Delphix Corp. Series D (h) | 675,445 | | 6,079 |
Snapchat, Inc. Series F (h) | 661,195 | | 20,312 |
Taboola.Com Ltd. Series E (h) | 634,902 | | 3,505 |
| | 47,482 |
TOTAL INFORMATION TECHNOLOGY | | 281,462 |
TOTAL CONVERTIBLE PREFERRED STOCKS | | 399,652 |
Nonconvertible Preferred Stocks - 0.0% |
CONSUMER DISCRETIONARY - 0.0% |
Automobiles - 0.0% |
Volkswagen AG | 41,700 | | 8,353 |
TOTAL PREFERRED STOCKS (Cost $277,814) |
408,005
|
Money Market Funds - 2.6% |
| | | |
Fidelity Cash Central Fund, 0.17% (b) | 53,438,973 | | 53,439 |
Fidelity Securities Lending Cash Central Fund, 0.18% (b)(c) | 488,639,941 | | 488,640 |
TOTAL MONEY MARKET FUNDS (Cost $542,079) |
542,079
|
TOTAL INVESTMENT PORTFOLIO - 102.6% (Cost $14,356,179) | 21,789,927 |
NET OTHER ASSETS (LIABILITIES) - (2.6)% | | (545,711) |
NET ASSETS - 100% | $ 21,244,216 |
Legend |
(a) Non-income producing |
(b) Affiliated fund that is generally available only to investment companies and other accounts managed by Fidelity Investments. The rate quoted is the annualized seven-day yield of the fund at period end. A complete unaudited listing of the fund's holdings as of its most recent quarter end is available upon request. In addition, each Fidelity Central Fund's financial statements, which are not covered by the Fund's Report of Independent Registered Public Accounting Firm, are available on the SEC's website or upon request. |
(c) Investment made with cash collateral received from securities on loan. |
(d) Security or a portion of the security is on loan at period end. |
(e) Affiliated company |
(f) Security exempt from registration under Rule 144A of the Securities Act of 1933. These securities may be resold in transactions exempt from registration, normally to qualified institutional buyers. At the end of the period, the value of these securities amounted to $30,857,000 or 0.1% of net assets. |
(g) Investment is owned by an entity that is treated as a corporation for U.S. tax purposes and is wholly-owned by the Fund. |
(h) Restricted securities - Investment in securities not registered under the Securities Act of 1933 (excluding 144A issues). At the end of the period, the value of restricted securities (excluding 144A issues) amounted to $444,671,000 or 2.1% of net assets. |
Additional information on each restricted holding is as follows: |
Security | Acquisition Date | Acquisition Cost (000s) |
Appirio, Inc. | 2/12/15 | $ 625 |
Appirio, Inc. Series E | 2/12/15 | $ 4,375 |
AppNexus, Inc. Series E | 8/1/14 | $ 12,951 |
Azul-Linhas Aereas Brasileiras Series B | 12/24/13 | $ 7,023 |
Azul-Linhas Aereas Brasileiras warrants | 12/24/13 | $ 0* |
Blue Apron, Inc. Series D | 5/18/15 | $ 10,400 |
BLUE BOTTLE Coffee, Inc. Series C | 5/29/15 | $ 21,086 |
Cloudera, Inc. Series F | 2/5/14 | $ 2,709 |
Cloudflare, Inc. Series D | 11/5/14 - 6/24/15 | $ 4,349 |
CytomX Therapeutics, Inc. Series D | 6/12/15 | $ 3,538 |
Dataminr, Inc. Series D | 3/6/15 | $ 3,535 |
Delphix Corp. Series D | 7/10/15 | $ 6,079 |
Dropbox, Inc. | 5/2/12 | $ 9,084 |
Gensight Biologics Series B | 7/2/15 | $ 3,266 |
Security | Acquisition Date | Acquisition Cost (000s) |
Immunocore Ltd. Series A | 7/27/15 | $ 2,122 |
Meituan Corp. Series D | 1/26/15 | $ 10,000 |
NJOY, Inc. | 9/11/13 | $ 9,520 |
NJOY, Inc. Series C | 6/7/13 | $ 4,913 |
NJOY, Inc. Series D | 2/14/14 | $ 2,524 |
Nutanix, Inc. Series E | 8/26/14 | $ 6,467 |
Oportun Finance Corp. Series H | 2/6/15 | $ 10,114 |
PAX Labs, Inc. Series C | 5/22/15 | $ 9,840 |
Pronutria Biosciences, Inc. Series C | 1/30/15 | $ 5,500 |
Snapchat, Inc. Series F | 3/25/15 | $ 20,312 |
Security | Acquisition Date | Acquisition Cost (000s) |
Space Exploration Technologies Corp. Series G | 1/20/15 | $ 7,535 |
Taboola.Com Ltd. Series E | 12/22/14 | $ 6,619 |
The Honest Co., Inc. | 8/21/14 | $ 4,062 |
The Honest Co., Inc. Series C | 8/21/14 | $ 9,479 |
Tory Burch LLC unit | 5/14/15 | $ 20,890 |
Uber Technologies, Inc. Series D, 8.00% | 6/6/14 | $ 80,000 |
Uber Technologies, Inc. Series E, 8.00% | 12/5/14 | $ 3,420 |
YourPeople, Inc. Series C | 5/1/15 | $ 10,314 |
* Amount represents less than $1,000. |
Affiliated Central Funds |
Information regarding fiscal year to date income earned by the Fund from investments in Fidelity Central Funds is as follows: |
Fund | Income earned
(Amounts in thousands) |
Fidelity Cash Central Fund | $ 52 |
Fidelity Securities Lending Cash Central Fund | 7,635 |
Total | $ 7,687 |
Other Affiliated Issuers |
An affiliated company is a company in which the Fund has ownership of at least 5% of the voting securities. Fiscal year to date transactions with companies which are or were affiliates are as follows: |
Affiliate
(Amounts in thousands) | Value,
beginning of
period | Purchases | Sales
Proceeds* | Dividend
Income | Value,
end of
period |
Nu Skin Enterprises, Inc. Class A | $ - | $ 199,704 | $ 13,224 | $ 1,500 | $ 134,517 |
Parsvnath Developers Ltd. | 9,495 | - | - | - | 6,516 |
Total | $ 9,495 | $ 199,704 | $ 13,224 | $ 1,500 | $ 141,033 |
* Includes the value of securities delivered through in-kind transactions, if applicable. |
Other Information |
The following is a summary of the inputs used, as of July 31, 2015, involving the Fund's assets and liabilities carried at fair value. The inputs or methodology used for valuing securities may not be an indication of the risk associated with investing in those securities. For more information on valuation inputs, and their aggregation into the levels used in the tables below, please refer to the Investment Valuation section in the accompanying Notes to Financial Statements. |
Valuation Inputs at Reporting Date: |
Description
(Amounts in thousands) | Total | Level 1 | Level 2 | Level 3 |
Investments in Securities: | | | | |
Equities: | | | | |
Consumer Discretionary | $ 5,294,107 | $ 5,193,011 | $ 44,640 | $ 56,456 |
Consumer Staples | 2,081,797 | 2,016,220 | 24,251 | 41,326 |
Energy | 259,620 | 259,620 | - | - |
Financials | 907,005 | 868,924 | 12,923 | 25,158 |
Health Care | 3,826,416 | 3,806,507 | 4,700 | 15,209 |
Industrials | 1,175,987 | 1,152,335 | - | 23,652 |
Information Technology | 7,264,779 | 6,906,812 | 59,247 | 298,720 |
Materials | 396,314 | 396,314 | - | - |
Telecommunication Services | 34,619 | 34,619 | - | - |
Utilities | 7,204 | 5,508 | 1,696 | - |
Money Market Funds | 542,079 | 542,079 | - | - |
Total Investments in Securities: | $ 21,789,927 | $ 21,181,949 | $ 147,457 | $ 460,521 |
(Amounts in thousands) | |
Investments in Securities: | |
Equities - Information Technology | |
Beginning Balance | $ 106,211 |
Net Realized Gain (Loss) on Investment Securities | - |
Net Unrealized Gain (Loss) on Investment Securities | 128,201 |
Cost of Purchases | 68,732 |
Proceeds of Sales | (4,424) |
Amortization/Accretion | - |
Transfers into Level 3 | - |
Transfers out of Level 3 | - |
Ending Balance | $ 298,720 |
The change in unrealized gain (loss) for the period attributable to Level 3 securities held at July 31, 2015 | $ 127,904 |
Equities - Other Investments in Securities | |
Beginning Balance | $ 40,051 |
Net Realized Gain (Loss) on Investment Securities | - |
Net Unrealized Gain (Loss) on Investment Securities | (24,069) |
Cost of Purchases | 145,819 |
Proceeds of Sales | - |
Amortization/Accretion | - |
Transfers into Level 3 | - |
Transfers out of Level 3 | - |
Ending Balance | $ 161,801 |
The change in unrealized gain (loss) for the period attributable to Level 3 securities held at July 31, 2015 | $ (24,069) |
The information used in the above reconciliations represents fiscal year to date activity for any Investments in Securities identified as using Level 3 inputs at either the beginning or the end of the current fiscal period. Transfers in or out of Level 3 represent the beginning value of any Security or Instrument where a change in the pricing level occurred from the beginning to the end of the period. The cost of purchases and the proceeds of sales may include securities received or delivered through corporate actions or exchanges. Realized and unrealized gains (losses) disclosed in the reconciliations are included in Net Gain (Loss) on the Fund's Statement of Operations. |
Distribution of investments by country or territory of incorporation, as a percentage of total net assets, is as follows (Unaudited): |
United States of America | 87.5% |
Ireland | 2.6% |
Cayman Islands | 2.0% |
Netherlands | 1.6% |
Canada | 1.5% |
Others (Individually Less Than 1%) | 4.8% |
| 100.0% |
See accompanying notes which are an integral part of the financial statements.
Annual Report
Statement of Assets and Liabilities
Amounts in thousands (except per-share amounts) | | July 31, 2015 |
| | |
Assets | | |
Investment in securities, at value (including securities loaned of $478,533) - See accompanying schedule: Unaffiliated issuers (cost $13,600,342) | $ 21,106,815 | |
Fidelity Central Funds (cost $542,079) | 542,079 | |
Other affiliated issuers (cost $213,758) | 141,033 | |
Total Investments (cost $14,356,179) | | $ 21,789,927 |
Receivable for investments sold | | 125,584 |
Receivable for fund shares sold | | 21,725 |
Dividends receivable | | 4,666 |
Distributions receivable from Fidelity Central Funds | | 535 |
Other receivables | | 988 |
Total assets | | 21,943,425 |
| | |
Liabilities | | |
Payable to custodian bank | $ 3,353 | |
Payable for investments purchased | 159,997 | |
Payable for fund shares redeemed | 29,972 | |
Accrued management fee | 12,521 | |
Other affiliated payables | 2,353 | |
Other payables and accrued expenses | 2,373 | |
Collateral on securities loaned, at value | 488,640 | |
Total liabilities | | 699,209 |
| | |
Net Assets | | $ 21,244,216 |
Net Assets consist of: | | |
Paid in capital | | $ 12,894,155 |
Undistributed net investment income | | 9,347 |
Accumulated undistributed net realized gain (loss) on investments and foreign currency transactions | | 908,422 |
Net unrealized appreciation (depreciation) on investments and assets and liabilities in foreign currencies | | 7,432,292 |
Net Assets | | $ 21,244,216 |
Blue Chip Growth: | | |
Net Asset Value, offering price and redemption price per share ($15,345,898 ÷ 203,930 shares) | | $ 75.25 |
| | |
Class K: | | |
Net Asset Value, offering price and redemption price per share ($5,898,318 ÷ 78,265 shares) | | $ 75.36 |
See accompanying notes which are an integral part of the financial statements.
Annual Report
Financial Statements - continued
Statement of Operations
Amounts in thousands | Year ended July 31, 2015 |
| | |
Investment Income | | |
Dividends (including $1,500 earned from other affiliated issuers) | | $ 176,596 |
Income from Fidelity Central Funds | | 7,687 |
Total income | | 184,283 |
| | |
Expenses | | |
Management fee | | |
Basic fee | $ 105,459 | |
Performance adjustment | 31,633 | |
Transfer agent fees | 24,727 | |
Accounting and security lending fees | 1,743 | |
Custodian fees and expenses | 340 | |
Independent trustees' compensation | 82 | |
Registration fees | 326 | |
Audit | 97 | |
Legal | 42 | |
Interest | 4 | |
Miscellaneous | 117 | |
Total expenses before reductions | 164,570 | |
Expense reductions | (888) | 163,682 |
Net investment income (loss) | | 20,601 |
Realized and Unrealized Gain (Loss) Net realized gain (loss) on: | | |
Investment securities: | | |
Unaffiliated issuers | 1,234,669 | |
Other affiliated issuers | (3,573) | |
Foreign currency transactions | (793) | |
Total net realized gain (loss) | | 1,230,303 |
Change in net unrealized appreciation (depreciation) on: Investment securities (net of increase in deferred foreign taxes of $20) | 2,175,458 | |
Assets and liabilities in foreign currencies | (39) | |
Total change in net unrealized appreciation (depreciation) | | 2,175,419 |
Net gain (loss) | | 3,405,722 |
Net increase (decrease) in net assets resulting from operations | | $ 3,426,323 |
See accompanying notes which are an integral part of the financial statements.
Annual Report
Statement of Changes in Net Assets
Amounts in thousands | Year ended
July 31,
2015 | Year ended
July 31,
2014 |
Increase (Decrease) in Net Assets | | |
Operations | | |
Net investment income (loss) | $ 20,601 | $ 47,516 |
Net realized gain (loss) | 1,230,303 | 4,690,305 |
Change in net unrealized appreciation (depreciation) | 2,175,419 | (1,368,277) |
Net increase (decrease) in net assets resulting from operations | 3,426,323 | 3,369,544 |
Distributions to shareholders from net investment income | (27,789) | (80,757) |
Distributions to shareholders from net realized gain | (1,011,245) | (1,378,625) |
Total distributions | (1,039,034) | (1,459,382) |
Share transactions - net increase (decrease) | 2,274,956 | (5,511,393) |
Total increase (decrease) in net assets | 4,662,245 | (3,601,231) |
| | |
Net Assets | | |
Beginning of period | 16,581,971 | 20,183,202 |
End of period (including undistributed net investment income of $9,347 and undistributed net investment income of $17,541, respectively) | $ 21,244,216 | $ 16,581,971 |
See accompanying notes which are an integral part of the financial statements.
Annual Report
Financial Highlights - Blue Chip Growth
Years ended July 31, | 2015 | 2014 | 2013 | 2012 | 2011 |
Selected Per-Share Data | | | | | |
Net asset value, beginning of period | $ 66.72 | $ 59.65 | $ 47.38 | $ 48.17 | $ 37.63 |
Income from Investment Operations | | | | | |
Net investment income (loss) B | .05 | .15 | .39 | .10 | (.03) |
Net realized and unrealized gain (loss) | 12.56 | 11.63 | 12.79 | .75 | 10.61 |
Total from investment operations | 12.61 | 11.78 | 13.18 | .85 | 10.58 |
Distributions from net investment income | (.09) | (.24) | (.23) | (.04) | .00 E, G |
Distributions from net realized gain | (3.99) | (4.47) | (.68) | (1.60) | (.04) E |
Total distributions | (4.08) | (4.71) | (.91) | (1.64) | (.04) |
Net asset value, end of period | $ 75.25 | $ 66.72 | $ 59.65 | $ 47.38 | $ 48.17 |
Total Return A | 19.72% | 21.07% | 28.25% | 2.27% | 28.12% |
Ratios to Average Net Assets C, F | | | | | |
Expenses before reductions | .89% | .80% | .76% | .90% | .94% |
Expenses net of fee waivers, if any | .89% | .80% | .76% | .90% | .94% |
Expenses net of all reductions | .88% | .80% | .74% | .89% | .92% |
Net investment income (loss) | .07% | .23% | .75% | .21% | (.06)% |
Supplemental Data | | | | | |
Net assets, end of period (in millions) | $ 15,346 | $ 11,970 | $ 12,927 | $ 10,595 | $ 12,024 |
Portfolio turnover rate D | 51% H | 57% H | 75% | 95% | 132% |
A Total returns would have been lower if certain expenses had not been reduced during the applicable periods shown.
B Calculated based on average shares outstanding during the period.
C Fees and expenses of any underlying Fidelity Central Funds are not included in the Fund's expense ratio. The Fund indirectly bears its proportionate share of the expenses of any underlying Fidelity Central Funds.
D Amount does not include the portfolio activity of any underlying Fidelity Central Funds.
E The amounts shown reflect certain reclassifications related to book to tax differences that were made in the year shown.
F Expense ratios reflect operating expenses of the class. Expenses before reductions do not reflect amounts reimbursed by the investment adviser or reductions from brokerage service arrangements or reductions from other expense offset arrangements and do not represent the amount paid by the class during periods when reimbursements or reductions occur. Expenses net of fee waivers reflect expenses after reimbursement by the investment adviser but prior to reductions from brokerage service arrangements or other expense offset arrangements. Expenses net of all reductions represent the net expenses paid by the class.
G Amount represents less than $.01 per share.
H Portfolio turnover rate excludes securities received or delivered in-kind.
See accompanying notes which are an integral part of the financial statements.
Annual Report
Financial Highlights - Class K
Years ended July 31, | 2015 | 2014 | 2013 | 2012 | 2011 |
Selected Per-Share Data | | | | | |
Net asset value, beginning of period | $ 66.82 | $ 59.74 | $ 47.46 | $ 48.21 | $ 37.66 |
Income from Investment Operations | | | | | |
Net investment income (loss) B | .13 | .23 | .47 | .17 | .05 |
Net realized and unrealized gain (loss) | 12.57 | 11.64 | 12.79 | .75 | 10.62 |
Total from investment operations | 12.70 | 11.87 | 13.26 | .92 | 10.67 |
Distributions from net investment income | (.17) | (.33) | (.30) | (.08) | (.05) E |
Distributions from net realized gain | (3.99) | (4.47) | (.68) | (1.60) | (.07) E |
Total distributions | (4.16) | (4.79) I | (.98) | (1.67) H | (.12) |
Net asset value, end of period | $ 75.36 | $ 66.82 | $ 59.74 | $ 47.46 | $ 48.21 |
Total ReturnA | 19.84% | 21.23% | 28.42% | 2.43% | 28.37% |
Ratios to Average Net Assets C, F | | | | | |
Expenses before reductions | .78% | .68% | .61% | .74% | .77% |
Expenses net of fee waivers, if any | .77% | .68% | .61% | .74% | .77% |
Expenses net of all reductions | .77% | .67% | .60% | .73% | .76% |
Net investment income (loss) | .19% | .36% | .89% | .37% | .11% |
Supplemental Data | | | | | |
Net assets, end of period (in millions) | $ 5,898 | $ 4,612 | $ 3,506 | $ 2,467 | $ 1,455 |
Portfolio turnover rateD | 51% G | 57% G | 75% | 95% | 132% |
A Total returns would have been lower if certain expenses had not been reduced during the applicable periods shown.
B Calculated based on average shares outstanding during the period.
C Fees and expenses of any underlying Fidelity Central Funds are not included in the Fund's expense ratio. The Fund indirectly bears its proportionate share of the expenses of any underlying Fidelity Central Funds.
D Amount does not include the portfolio activity of any underlying Fidelity Central Funds.
E The amounts shown reflect certain reclassifications related to book to tax differences that were made in the year shown.
F Expense ratios reflect operating expenses of the class. Expenses before reductions do not reflect amounts reimbursed by the investment adviser or reductions from brokerage service arrangements or reductions from other expense offset arrangements and do not represent the amount paid by the class during periods when reimbursements or reductions occur. Expenses net of fee waivers reflect expenses after reimbursement by the investment adviser but prior to reductions from brokerage service arrangements or other expense offset arrangements. Expenses net of all reductions represent the net expenses paid by the class.
G Portfolio turnover rate excludes securities received or delivered in-kind.
H Total distributions of $1.67 per share is comprised of distributions from net investment income of $.076 and distributions from net realized gain of $1.598 per share.
I Total distributions of $4.79 per share is comprised of distributions from net investment income of $.325 and distributions from net realized gain of $4.466 per share.
See accompanying notes which are an integral part of the financial statements.
Annual Report
For the period ended July 31, 2015
(Amounts in thousands except percentages)
1. Organization.
Fidelity Blue Chip Growth Fund (the Fund) is a fund of Fidelity Securities Fund (the Trust) and is authorized to issue an unlimited number of shares. The Trust is registered under the Investment Company Act of 1940, as amended (the 1940 Act), as an open-end management investment company organized as a Massachusetts business trust. The Fund offers Blue Chip Growth and Class K shares, each of which has equal rights as to assets and voting privileges. The Fund offered Class F shares during the period June 26, 2009 through November 19, 2013, and all outstanding shares were redeemed by November 19, 2013. Each class has exclusive voting rights with respect to matters that affect that class.
2. Investments in Fidelity Central Funds.
The Fund invests in Fidelity Central Funds, which are open-end investment companies generally available only to other investment companies and accounts managed by the investment adviser and its affiliates. The Fund's Schedule of Investments lists each of the Fidelity Central Funds held as of period end, if any, as an investment of the Fund, but does not include the underlying holdings of each Fidelity Central Fund. As an Investing Fund, the Fund indirectly bears its proportionate share of the expenses of the underlying Fidelity Central Funds.
The Money Market Central Funds seek preservation of capital and current income and are managed by Fidelity Investments Money Management, Inc. (FIMM), an affiliate of the investment adviser. Annualized expenses of the Money Market Central Funds as of their most recent shareholder report date are less than .01%.
A complete unaudited list of holdings for each Fidelity Central Fund is available upon request or at the Securities and Exchange Commission (the SEC) website at www.sec.gov. In addition, the financial statements of the Fidelity Central Funds, which are not covered by the Fund's Report of Independent Registered Public Accounting Firm, are available on the SEC website or upon request.
3. Significant Accounting Policies.
The financial statements have been prepared in conformity with accounting principles generally accepted in the United States of America (GAAP), which require management to make certain estimates and assumptions at the date of the financial statements. Actual results could differ from those estimates. Subsequent events, if any, through the date that the financial statements were issued have been evaluated in the preparation of
Annual Report
3. Significant Accounting Policies - continued
the financial statements. The following summarizes the significant accounting policies of the Fund:
Investment Valuation. Investments are valued as of 4:00 p.m. Eastern time on the last calendar day of the period. The Board of Trustees (the Board) has delegated the day to day responsibility for the valuation of the Fund's investments to the Fidelity Management & Research Company (FMR) Fair Value Committee (the Committee). In accordance with valuation policies and procedures approved by the Board, the Fund attempts to obtain prices from one or more third party pricing vendors or brokers to value its investments. When current market prices, quotations or currency exchange rates are not readily available or reliable, investments will be fair valued in good faith by the Committee, in accordance with procedures adopted by the Board. Factors used in determining fair value vary by investment type and may include market or investment specific events. The frequency with which these procedures are used cannot be predicted and they may be utilized to a significant extent. The Committee oversees the Fund's valuation policies and procedures and reports to the Board on the Committee's activities and fair value determinations. The Board monitors the appropriateness of the procedures used in valuing the Fund's investments and ratifies the fair value determinations of the Committee.
The Fund categorizes the inputs to valuation techniques used to value its investments into a disclosure hierarchy consisting of three levels as shown below:
Level 1 - quoted prices in active markets for identical investments
Level 2 - other significant observable inputs (including quoted prices for similar investments, interest rates, prepayment speeds, etc.)
Level 3 - unobservable inputs (including the Fund's own assumptions based on the best information available)
Valuation techniques used to value the Fund's investments by major category are as follows:
Equity securities, including restricted securities, for which market quotations are readily available, are valued at the last reported sale price or official closing price as reported by a third party pricing vendor on the primary market or exchange on which they are traded and are categorized as Level 1 in the hierarchy. In the event there were no sales during the day or closing prices are not available, securities are valued at the last quoted bid price or may be valued using the last available price and are generally categorized as Level 2 in the hierarchy. For foreign equity securities, when market or security specific events arise, comparisons to the valuation of American Depositary Receipts (ADRs),
Annual Report
Notes to Financial Statements - continued
(Amounts in thousands except percentages)
3. Significant Accounting Policies - continued
Investment Valuation - continued
futures contracts, Exchange-Traded Funds (ETFs) and certain indexes as well as quoted prices for similar securities may be used and would be categorized as Level 2 in the hierarchy. Utilizing these techniques may result in transfers between Level 1 and Level 2. For equity securities, including restricted securities, where observable inputs are limited, assumptions about market activity and risk are used and these securities may be categorized as Level 3 in the hierarchy.
Investments in open-end mutual funds, including the Fidelity Central Funds, are valued at their closing net asset value (NAV) each business day and are categorized as Level 1 in the hierarchy.
The following provides information on Level 3 securities held by the Fund that were valued at period end based on unobservable inputs. These amounts exclude valuations provided by a broker.
Asset Type | Fair Value at 07/31/15 | Valuation
Technique(s) | Unobservable
Input | Amount or Range/Weighted Average | Impact to
Valuation from
an Increase
in Input* |
Equities | $ 460,521 | Adjusted transaction price | Proxy movement | 2.0% | Increase |
| | Black scholes | Discount for lack of marketability | 10.0% | Decrease |
| | Expected distribution | Recovery rate | 0.0% | Increase |
| | Last transaction price | Transaction price | $0.00 - $120.93 / $37.34 | Increase |
| | | Discount rate | 15.0% | Decrease |
| | | Put premium | 38.0% | Increase |
| | Market comparable | Discount rate | 10.0% - 30.0% / 17.1% | Decrease |
| | | EV/Sales multiple | 2.2 - 7.9 / 6.7 | Increase |
| | | EV/GMV multiple | 0.4 | Increase |
| | | Discount for lack of marketability | 15.0% | Decrease |
| | | Premium rate | 15.0% | Increase |
| | | P/E multiple | 14.0 | Increase |
* Represents the expected directional change in the fair value of the level 3 investments that would result from an increase in the corresponding input. A decrease to the unobservable input would have the opposite effect. Significant changes in these inputs could result in significant higher or lower fair value measurements.
Annual Report
3. Significant Accounting Policies - continued
Investment Valuation - continued
Changes in valuation techniques may result in transfers in or out of an assigned level within the disclosure hierarchy. The aggregate value of investments by input level as of July 31, 2015, as well as a roll forward of Level 3 investments, is included at the end of the Fund's Schedule of Investments.
Foreign Currency. The Fund may use foreign currency contracts to facilitate transactions in foreign-denominated securities. Gains and losses from these transactions may arise from changes in the value of the foreign currency or if the counterparties do not perform under the contracts' terms.
Foreign-denominated assets, including investment securities, and liabilities are translated into U.S. dollars at the exchange rates at period end. Purchases and sales of investment securities, income and dividends received and expenses denominated in foreign currencies are translated into U.S. dollars at the exchange rate in effect on the transaction date.
The effects of exchange rate fluctuations on investments are included with the net realized and unrealized gain (loss) on investment securities. Other foreign currency transactions resulting in realized and unrealized gain (loss) are disclosed separately.
Investment Transactions and Income. For financial reporting purposes, the Fund's investment holdings and NAV include trades executed through the end of the last business day of the period. The NAV per share for processing shareholder transactions is calculated as of the close of business of the New York Stock Exchange (NYSE), normally 4:00 p.m. Eastern time and includes trades executed through the end of the prior business day. Gains and losses on securities sold are determined on the basis of identified cost and may include proceeds received from litigation. Dividend income is recorded on the ex-dividend date, except for certain dividends from foreign securities where the ex-dividend date may have passed, which are recorded as soon as the Fund is informed of the ex-dividend date. Non-cash dividends included in dividend income, if any, are recorded at the fair market value of the securities received. Income and capital gain distributions from Fidelity Central Funds, if any, are recorded on the ex-dividend date. Distributions received on securities that represent a return of capital or capital gain are recorded as a reduction of cost of investments and/or as a realized gain. Subsequent to ex-dividend date the Fund determines the components of these distributions, based upon receipt of tax filings or other correspondence relating to the underlying investment. Investment income is recorded net of foreign taxes withheld where recovery of such taxes is uncertain.
Annual Report
Notes to Financial Statements - continued
(Amounts in thousands except percentages)
3. Significant Accounting Policies - continued
Class Allocations and Expenses. Investment income, realized and unrealized capital gains and losses, common expenses of the Fund, and certain fund-level expense reductions, if any, are allocated daily on a pro-rata basis to each class based on the relative net assets of each class to the total net assets of the Fund. Each class differs with respect to transfer agent fees incurred. Certain expense reductions may also differ by class. For the reporting period, the allocated portion of income and expenses to each class as a percent of its average net assets may vary due to the timing of recording these transactions in relation to fluctuating net assets of the classes. Expenses directly attributable to a fund are charged to that fund. Expenses attributable to more than one fund are allocated among the respective funds on the basis of relative net assets or other appropriate methods. Expense estimates are accrued in the period to which they relate and adjustments are made when actual amounts are known.
Deferred Trustee Compensation. Under a Deferred Compensation Plan (the Plan), independent Trustees may elect to defer receipt of a portion of their annual compensation. Deferred amounts are invested in a cross-section of Fidelity funds, are marked-to-market and remain in the Fund until distributed in accordance with the Plan. The investment of deferred amounts and the offsetting payable to the Trustees are included in the accompanying Statement of Assets and Liabilities.
Income Tax Information and Distributions to Shareholders. Each year, the Fund intends to qualify as a regulated investment company under Subchapter M of the Internal Revenue Code, including distributing substantially all of its taxable income and realized gains. As a result, no provision for U.S. Federal income taxes is required. As of July 31, 2015, the Fund did not have any unrecognized tax benefits in the financial statements; nor is the Fund aware of any tax positions for which it is reasonably possible that the total amounts of unrecognized tax benefits will significantly change in the next twelve months. The Fund files a U.S. federal tax return, in addition to state and local tax returns as required. The Fund's federal income tax returns are subject to examination by the Internal Revenue Service (IRS) for a period of three fiscal years after they are filed. State and local tax returns may be subject to examination for an additional fiscal year depending on the jurisdiction. Foreign taxes are provided for based on the Fund's understanding of the tax rules and rates that exist in the foreign markets in which it invests. The Fund is subject to a tax imposed on capital gains by certain countries in which it invests. An estimated deferred tax liability for net unrealized appreciation on the applicable securities is included in Other payables and accrued expenses on the Statement of Assets & Liabilities.
Annual Report
3. Significant Accounting Policies - continued
Income Tax Information and Distributions to Shareholders - continued
Distributions are declared and recorded on the ex-dividend date. Income dividends and capital gain distributions are declared separately for each class. Income and capital gain distributions are determined in accordance with income tax regulations, which may differ from GAAP. In addition, the Fund claimed a portion of the payment made to redeeming shareholders as a distribution for income tax purposes.
Capital accounts within the financial statements are adjusted for permanent book-tax differences. These adjustments have no impact on net assets or the results of operations. Capital accounts are not adjusted for temporary book-tax differences which will reverse in a subsequent period.
Book-tax differences are primarily due to foreign currency transactions, passive foreign investment companies (PFIC), redemptions in kind, partnerships, deferred trustees compensation and losses deferred due to wash sales.
The federal tax cost of investment securities and unrealized appreciation (depreciation) as of period end were as follows:
Gross unrealized appreciation | $ 7,806,934 |
Gross unrealized depreciation | (441,334) |
Net unrealized appreciation (depreciation) on securities | $ 7,365,600 |
| |
Tax Cost | $ 14,424,327 |
The tax-based components of distributable earnings as of period end were as follows:
Undistributed ordinary income | $ 10,114 |
Undistributed long-term capital gain | $ 976,571 |
Net unrealized appreciation (depreciation) on securities and other investments | $ 7,365,612 |
The tax character of distributions paid was as follows:
| July 31, 2015 | July 31, 2014 |
Ordinary Income | $ 90,358 | $ 155,664 |
Long-term Capital Gains | 948,676 | 1,303,718 |
Total | $ 1,039,034 | $ 1,459,382 |
Annual Report
Notes to Financial Statements - continued
(Amounts in thousands except percentages)
3. Significant Accounting Policies - continued
Restricted Securities. The Fund may invest in securities that are subject to legal or contractual restrictions on resale. These securities generally may be resold in transactions exempt from registration or to the public if the securities are registered. Disposal of these securities may involve time-consuming negotiations and expense, and prompt sale at an acceptable price may be difficult. Information regarding restricted securities is included at the end of the Fund's Schedule of Investments.
4. Purchases and Sales of Investments.
Purchases and sales of securities, other than short-term securities and in-kind-transactions, aggregated $11,170,396 and $9,789,224, respectively.
Redemptions In-Kind. During the period, 1,878 shares of the Fund held by unaffiliated entities were redeemed for cash and investments with a value of $137,687. The net realized gain of $67,543 on investments delivered through in-kind redemptions is included in the accompanying Statement of Operations. The amount of in-kind redemptions is included in share transactions in the accompanying Statement of Changes in Net Assets as well as Note 10: Share Transactions. The Fund recognized no gain or loss for federal income tax purposes.
5. Fees and Other Transactions with Affiliates.
Management Fee. Fidelity Management & Research Company (the investment adviser) and its affiliates provide the Fund with investment management related services for which the Fund pays a monthly management fee. The management fee is the sum of an individual fund fee rate that is based on an annual rate of .30% of the Fund's average net assets and an annualized group fee rate that averaged .25% during the period. The group fee rate is based upon the average net assets of all the mutual funds advised by the investment adviser, including any mutual funds previously advised by the investment adviser that are currently advised by Fidelity SelectCo, LLC, an affiliate of the investment adviser. The group fee rate decreases as assets under management increase and increases as assets under management decrease. In addition, the management fee is subject to a performance adjustment (up to a maximum of ±.20% of the Fund's average net assets over a 36 month performance period). The upward or downward adjustment to the management fee is based on the relative investment performance of Blue Chip Growth as compared to its benchmark index, the Russell 1000 Growth Index, over the same 36 month performance period. For the reporting period, the total annual management fee rate, including the performance adjustment, was .71% of the Fund's average net assets. The performance adjustment included in the management fee rate may be higher or lower than the maximum performance adjustment rate due to the difference between the average net assets for the reporting and performance periods.
Annual Report
5. Fees and Other Transactions with Affiliates - continued
Transfer Agent Fees. Fidelity Investments Institutional Operations Company, Inc., (FIIOC), an affiliate of the investment adviser, is the transfer, dividend disbursing and shareholder servicing agent for each class of the Fund. FIIOC receives account fees and asset-based fees that vary according to the account size and type of account of the shareholders of Blue Chip Growth, except for Class K. FIIOC receives an asset-based fee of Class K's average net assets. FIIOC pays for typesetting, printing and mailing of shareholder reports, except proxy statements.
For the period, transfer agent fees for each class were as follows:
| Amount | % of
Class-Level Average
Net Assets |
Blue Chip Growth | $ 22,117 | .16 |
Class K | 2,610 | .05 |
| $ 24,727 | |
Accounting and Security Lending Fees. Fidelity Service Company, Inc. (FSC), an affiliate of the investment adviser, maintains the Fund's accounting records. The accounting fee is based on the level of average net assets for each month. Under a separate contract, FSC administers the security lending program. The security lending fee is based on the number and duration of lending transactions.
Brokerage Commissions. The Fund placed a portion of its portfolio transactions with brokerage firms which are affiliates of the investment adviser. Brokerage commissions are included in net realized gain (loss) and change in net unrealized appreciation (depreciation) in the Consolidated Statement of Operations. The commissions paid to these affiliated firms were $154 for the period.
Interfund Lending Program. Pursuant to an Exemptive Order issued by the SEC, the Fund, along with other registered investment companies having management contracts with FMR or other affiliated entities of FMR, may participate in an interfund lending program. This program provides an alternative credit facility allowing the funds to borrow from, or lend money to, other participating affiliated funds. At period end, there were no interfund loans outstanding. The Fund's activity in this program during the period for which loans were outstanding was as follows:
Borrower or Lender | Average Loan
Balance | Weighted Average
Interest Rate | Interest Expense |
Borrower | $ 20,139 | .34% | $ 4 |
Annual Report
Notes to Financial Statements - continued
(Amounts in thousands except percentages)
6. Committed Line of Credit.
The Fund participates with other funds managed by the investment adviser or an affiliate in a $4.25 billion credit facility (the "line of credit") to be utilized for temporary or emergency purposes to fund shareholder redemptions or for other short-term liquidity purposes. The Fund has agreed to pay commitment fees on its pro-rata portion of the line of credit, which amounted to $27 and is reflected in Miscellaneous expenses on the Statement of Operations. During the period, the Fund did not borrow on this line of credit.
7. Security Lending.
The Fund lends portfolio securities through a lending agent from time to time in order to earn additional income. For equity securities, a lending agent is used and may loan securities to certain qualified borrowers, including Fidelity Capital Markets (FCM), a broker-dealer affiliated with the Fund. On the settlement date of the loan, the Fund receives collateral (in the form of U.S. Treasury obligations, letters of credit and/or cash) against the loaned securities and maintains collateral in an amount not less than 100% of the market value of the loaned securities during the period of the loan. The market value of the loaned securities is determined at the close of business of the Fund and any additional required collateral is delivered to the Fund on the next business day. If the borrower defaults on its obligation to return the securities loaned because of insolvency or other reasons, the Fund may apply collateral received from the borrower against the obligation. The Fund may experience delays and costs in recovering the securities loaned. Any cash collateral received is invested in the Fidelity Securities Lending Cash Central Fund. The value of loaned securities and cash collateral at period end are disclosed on the Fund's Statement of Assets and Liabilities. The value of securities loaned to FCM at period end was $12,834. Security lending income represents the income earned on investing cash collateral, less rebates paid to borrowers and any lending agent fees associated with the loan, plus any premium payments received for lending certain types of securities. Security lending income is presented in the Statement of Operations as a component of income from Fidelity Central Funds. Total security lending income during the period amounted to $7,635, including $435 from securities loaned to FCM.
8. Expense Reductions.
Commissions paid to certain brokers with whom the investment adviser, or its affiliates, places trades on behalf of the Fund include an amount in addition to trade execution, which may be rebated back to the Fund to offset certain expenses. This amount totaled $512 for the period. In addition, through arrangements with the Fund's custodian, credits realized as a result of uninvested cash balances were used to reduce the Fund's expenses. During the period, these credits reduced the Fund's custody expenses by $2.
Annual Report
8. Expense Reductions - continued
In addition, during the period the investment adviser reimbursed/waived a portion of fund-level operating expenses in the amount of $82 and a portion of class-level operating expenses as follows:
| Amount |
Blue Chip Growth | $ 292 |
9. Distributions to Shareholders.
Distributions to shareholders of each class were as follows:
Years ended July 31, | 2015 | 2014 A |
From net investment income | | |
Blue Chip Growth | $ 15,581 | $ 47,730 |
Class K | 12,208 | 19,791 |
Class F | - | 13,236 |
Total | $ 27,789 | $ 80,757 |
From net realized gain | | |
Blue Chip Growth | $ 722,639 | $ 908,543 |
Class K | 288,606 | 269,912 |
Class F | - | 200,170 |
Total | $ 1,011,245 | $ 1,378,625 |
A All Class F shares were redeemed on November 19, 2013.
10. Share Transactions.
Share transactions for each class were as follows and may contain automatic conversions between classes or exchanges between funds:
| Shares | Dollars |
Years ended July 31, | 2015 | 2014 A | 2015 | 2014 A |
Blue Chip Growth | | | | |
Shares sold | 45,258 | 30,779 | $ 3,161,935 | $ 1,939,078 |
Reinvestment of distributions | 10,699 | 16,131 | 715,067 | 933,288 |
Shares redeemed | (31,433) | (84,222)B | (2,196,025) | (5,182,185)B |
Net increase (decrease) | 24,524 | (37,312) | $ 1,680,977 | $ (2,309,819) |
Class K | | | | |
Shares sold | 26,108 | 17,861 | $ 1,808,830 | $ 1,132,520 |
Reinvestment of distributions | 4,497 | 4,984 | 300,814 | 289,703 |
Shares redeemed | (21,373)C | (12,491) | (1,515,665)C | (788,832) |
Net increase (decrease) | 9,232 | 10,354 | $ 593,979 | $ 633,391 |
Annual Report
Notes to Financial Statements - continued
(Amounts in thousands except percentages)
10. Share Transactions - continued
| Shares | Dollars |
Years ended July 31, | 2015 | 2014 A | 2015 | 2014 A |
Class F | | | | |
Shares sold | - | 3,759 | $ - | $ 226,491 |
Reinvestment of distributions | - | 3,740 | - | 213,405 |
Shares redeemed | - | (70,205)B | - | (4,274,861)B |
Net increase (decrease) | - | (62,706) | $ - | $ (3,834,965) |
A All Class F shares were redeemed on November 19, 2013.
B Amount includes in-kind redemptions.
C Amount includes in-kind redemptions (See Note 4: Redemptions In-Kind).
11. Other.
The Fund's organizational documents provide former and current trustees and officers with a limited indemnification against liabilities arising in connection with the performance of their duties to the Fund. In the normal course of business, the Fund may also enter into contracts that provide general indemnifications. The Fund's maximum exposure under these arrangements is unknown as this would be dependent on future claims that may be made against the Fund. The risk of material loss from such claims is considered remote.
Annual Report
To the Trustees of Fidelity Securities Fund and Shareholders of Fidelity Blue Chip Growth Fund:
We have audited the accompanying statement of assets and liabilities of Fidelity Blue Chip Growth Fund (the Fund), a fund of Fidelity Securities Fund, including the schedule of investments, as of July 31, 2015, and the related statement of operations for the year then ended, the statement of changes in net assets for each of the two years in the period then ended, and the financial highlights for each of the five years in the period then ended. These financial statements and financial highlights are the responsibility of the Fund's management. Our responsibility is to express an opinion on these financial statements and financial highlights based on our audits.
We conducted our audits in accordance with the standards of the Public Company Accounting Oversight Board (United States). Those standards require that we plan and perform the audit to obtain reasonable assurance about whether the financial statements and financial highlights are free of material misstatement. The Fund is not required to have, nor were we engaged to perform, an audit of its internal control over financial reporting. Our audits included consideration of internal control over financial reporting as a basis for designing audit procedures that are appropriate in the circumstances, but not for the purpose of expressing an opinion on the effectiveness of the Fund's internal control over financial reporting. Accordingly, we express no such opinion. An audit also includes examining, on a test basis, evidence supporting the amounts and disclosures in the financial statements, assessing the accounting principles used and significant estimates made by management, as well as evaluating the overall financial statement presentation. Our procedures included confirmation of securities owned as of July 31, 2015, by correspondence with the custodians and brokers; when replies were not received from brokers, we performed other auditing procedures. We believe that our audits provide a reasonable basis for our opinion.
In our opinion, such financial statements and financial highlights referred to above present fairly, in all material respects, the financial position of Fidelity Blue Chip Growth Fund as of July 31, 2015, the results of its operations for the year then ended, the changes in its net assets for each of the two years in the period then ended, and the financial highlights for each of the five years in the period then ended, in conformity with accounting principles generally accepted in the United States of America.
DELOITTE & TOUCHE LLP
Boston, Massachusetts
September 24, 2015
Annual Report
The Trustees, Member of the Advisory Board, and officers of the trust and fund, as applicable, are listed below. The Board of Trustees governs the fund and is responsible for protecting the interests of shareholders. The Trustees are experienced executives who meet periodically throughout the year to oversee the fund's activities, review contractual arrangements with companies that provide services to the fund, oversee management of the risks associated with such activities and contractual arrangements, and review the fund's performance. Each of the Trustees oversees 170 funds.
The Trustees hold office without limit in time except that (a) any Trustee may resign; (b) any Trustee may be removed by written instrument, signed by at least two-thirds of the number of Trustees prior to such removal; (c) any Trustee who requests to be retired or who has become incapacitated by illness or injury may be retired by written instrument signed by a majority of the other Trustees; and (d) any Trustee may be removed at any special meeting of shareholders by a two-thirds vote of the outstanding voting securities of the trust. Each Trustee who is not an interested person (as defined in the 1940 Act) of the trust and the fund (Independent Trustee), shall retire not later than the last day of the calendar year in which his or her 75th birthday occurs. The Independent Trustees may waive this mandatory retirement age policy with respect to individual Trustees. The officers and Advisory Board Member hold office without limit in time, except that any officer and Advisory Board Member may resign or may be removed by a vote of a majority of the Trustees at any regular meeting or any special meeting of the Trustees. Except as indicated, each individual has held the office shown or other offices in the same company for the past five years.
Experience, Skills, Attributes, and Qualifications of the Fund's Trustees. The Governance and Nominating Committee has adopted a statement of policy that describes the experience, qualifications, attributes, and skills that are necessary and desirable for potential Independent Trustee candidates (Statement of Policy). The Board believes that each Trustee satisfied at the time he or she was initially elected or appointed a Trustee, and continues to satisfy, the standards contemplated by the Statement of Policy. The Governance and Nominating Committee also engages professional search firms to help identify potential Independent Trustee candidates who have the experience, qualifications, attributes, and skills consistent with the Statement of Policy. From time to time, additional criteria based on the composition and skills of the current Independent Trustees, as well as experience or skills that may be appropriate in light of future changes to board composition, business conditions, and regulatory or other developments, have also been considered by the professional search firms and the Governance and Nominating Committee. In addition, the Board takes into account the Trustees' commitment and participation in Board and committee meetings, as well as their leadership of standing and ad hoc committees throughout their tenure.
In determining that a particular Trustee was and continues to be qualified to serve as a Trustee, the Board has considered a variety of criteria, none of which, in isolation, was controlling. The Board believes that, collectively, the Trustees have balanced and diverse experience, qualifications, attributes, and skills, which allow the Board to operate effectively in governing the fund and protecting the interests of shareholders. Information about the specific experience, skills, attributes, and qualifications of each Trustee, which in each case led to the Board's conclusion that the Trustee should serve (or continue to serve) as a trustee of the fund, is provided below.
Annual Report
Trustees and Officers - continued
Board Structure and Oversight Function. James C. Curvey is an interested person (as defined in the 1940 Act) and currently serves as Chairman. The Trustees have determined that an interested Chairman is appropriate and benefits shareholders because an interested Chairman has a personal and professional stake in the quality and continuity of services provided to the fund. Independent Trustees exercise their informed business judgment to appoint an individual of their choosing to serve as Chairman, regardless of whether the Trustee happens to be independent or a member of management. The Independent Trustees have determined that they can act independently and effectively without having an Independent Trustee serve as Chairman and that a key structural component for assuring that they are in a position to do so is for the Independent Trustees to constitute a substantial majority for the Board. The Independent Trustees also regularly meet in executive session. Ned C. Lautenbach serves as Chairman of the Independent Trustees and as such (i) acts as a liaison between the Independent Trustees and management with respect to matters important to the Independent Trustees and (ii) with management prepares agendas for Board meetings.
Fidelity funds are overseen by different Boards of Trustees. The fund's Board oversees Fidelity's high income and certain equity funds and other Boards oversee Fidelity's investment-grade bond, money market, asset allocation, and sector funds. The asset allocation funds may invest in Fidelity funds overseen by the fund's Board. The use of separate Boards, each with its own committee structure, allows the Trustees of each group of Fidelity funds to focus on the unique issues of the funds they oversee, including common research, investment, and operational issues. On occasion, the separate Boards establish joint committees to address issues of overlapping consequences for the Fidelity funds overseen by each Board.
The Trustees operate using a system of committees to facilitate the timely and efficient consideration of all matters of importance to the Trustees, the fund, and fund shareholders and to facilitate compliance with legal and regulatory requirements and oversight of the fund's activities and associated risks. The Board, acting through its committees, has charged FMR and its affiliates with (i) identifying events or circumstances the occurrence of which could have demonstrably adverse effects on the fund's business and/or reputation; (ii) implementing processes and controls to lessen the possibility that such events or circumstances occur or to mitigate the effects of such events or circumstances if they do occur; and (iii) creating and maintaining a system designed to evaluate continuously business and market conditions in order to facilitate the identification and implementation processes described in (i) and (ii) above. Because the day-to-day operations and activities of the fund are carried out by or through FMR, its affiliates and other service providers, the fund's exposure to risks is mitigated but not eliminated by the processes overseen by the Trustees. While each of the Board's committees has responsibility for overseeing different aspects of the fund's activities, oversight is exercised primarily through the Operations, Audit, and Compliance Committees. In addition, the Independent Trustees have worked with FMR to enhance the Board's oversight of investment and financial risks, legal and regulatory risks, technology risks, and operational risks, including the development of additional risk reporting to the Board. For example, a working group comprised of Independent Trustees and FMR has worked and continues to work to review the Fidelity funds' valuation-related activities, reporting and risk management. Appropriate personnel, including but not limited to the fund's Chief Compliance Officer (CCO), FMR's internal auditor, the independent accountants, the fund's Treasurer and portfolio management personnel, make periodic reports to the Board's committees, as appropriate, including an annual review of FMR's risk management program for the Fidelity funds. The responsibilities of each standing committee, including their oversight responsibilities, are described further under "Standing Committees of the Fund's Trustees."
Annual Report
The fund's Statement of Additional Information (SAI) includes more information about the Trustees. To request a free copy, call Fidelity at 1-800-544-8544.
Interested Trustees*:
Correspondence intended for each Trustee who is an interested person may be sent to Fidelity Investments, 245 Summer Street, Boston, Massachusetts 02210.
Name, Year of Birth; Principal Occupations and Other Relevant Experience+ |
James C. Curvey (1935) |
Year of Election or Appointment: 2007 Trustee Chairman of the Board of Trustees |
| Mr. Curvey also serves as Trustee of other Fidelity funds. Mr. Curvey is a Director of Fidelity Research & Analysis Co. (investment adviser firm, 2009-present), and Vice Chairman (2007-present) and Director of FMR LLC (diversified financial services company). In addition, Mr. Curvey serves as an Overseer for the Boston Symphony Orchestra and a member of the board of Artis-Naples, Naples, Florida, and as a Trustee for Brewster Academy, Wolfeboro, New Hampshire. Previously, Mr. Curvey served as a Director of Fidelity Investments Money Management, Inc. (investment adviser firm, 2009-2014), a Director of FMR (investment adviser firm, 2007-2014), and a Director of FMR Co., Inc. (investment adviser firm, 2007-2014). |
Charles S. Morrison (1960) |
Year of Election or Appointment: 2014 Trustee |
| Mr. Morrison also serves as Trustee of other funds. He serves as a Director of Fidelity Investments Money Management, Inc. (FIMM) (investment adviser firm, 2014-present), Director of Fidelity SelectCo, LLC (investment adviser firm, 2014-present), President, Asset Management (2014-present), and is an employee of Fidelity Investments. Previously, Mr. Morrison served as Vice President of Fidelity's Fixed Income and Asset Allocation Funds (2012-2014), President, Fixed Income (2011-2014), Vice President of Fidelity's Money Market Funds (2005-2009), President, Money Market Group Leader of FMR (investment adviser firm, 2009), and Senior Vice President, Money Market Group of FMR (2004-2009). Mr. Morrison also served as Vice President of Fidelity's Bond Funds (2002-2005), certain Balanced Funds (2002-2005), and certain Asset Allocation Funds (2002-2007), and as Senior Vice President (2002-2005) of Fidelity's Bond Division. |
* Trustees have been determined to be "Interested Trustees" by virtue of, among other things, their affiliation with the trust or various entities under common control with FMR.
+ The information above includes each Trustee's principal occupation during the last five years and other information relating to the experience, attributes, and skills relevant to each Trustee's qualifications to serve as a Trustee, which led to the conclusion that each Trustee should serve as a Trustee for the fund.
Annual Report
Independent Trustees:
Correspondence intended for each Independent Trustee (that is, the Trustees other than the Interested Trustees) may be sent to Fidelity Investments, P.O. Box 55235, Boston, Massachusetts 02205-5235.
Name, Year of Birth; Principal Occupations and Other Relevant Experience+ |
Dennis J. Dirks (1948) |
Year of Election or Appointment: 2005 Trustee |
| Mr. Dirks also serves as Trustee of other Fidelity funds. Prior to his retirement in May 2003, Mr. Dirks was Chief Operating Officer and a member of the Board of The Depository Trust & Clearing Corporation (DTCC). He also served as President, Chief Operating Officer, and Board member of The Depository Trust Company (DTC) and President and Board member of the National Securities Clearing Corporation (NSCC). In addition, Mr. Dirks served as Chief Executive Officer and Board member of the Government Securities Clearing Corporation, Chief Executive Officer and Board member of the Mortgage-Backed Securities Clearing Corporation, as a Trustee and a member of the Finance Committee of Manhattan College (2005-2008), and as a Trustee and a member of the Finance Committee of AHRC of Nassau County (2006-2008). Mr. Dirks is a member of the Independent Directors Council (IDC) Governing Council (2010-present) and Board of Directors for The Brookville Center for Children's Services, Inc. (2009-present). |
Alan J. Lacy (1953) |
Year of Election or Appointment: 2008 Trustee |
| Mr. Lacy also serves as Trustee of other Fidelity funds. Mr. Lacy serves as a member of the Board of Directors of Dave & Buster's Entertainment, Inc. (restaurant and entertainment complexes, 2010-present) and Bristol-Myers Squibb Company (global pharmaceuticals, 2008-present). In addition, Mr. Lacy served as Senior Adviser (2007-2014) of Oak Hill Capital Partners, L.P. (private equity) and also served as Chief Executive Officer (2000-2005) and Vice Chairman (2005-2006) of Sears Holdings Corporation and Sears, Roebuck and Co. (retail). Mr. Lacy is a member of the Board of Trustees of The National Parks Conservation Association (2006-present). Previously, Mr. Lacy served as Chairman of the Board of Trustees of the National Parks Conservation Association (2008-2011) and as a member of the Board of Directors for The Western Union Company (global money transfer, 2006-2011), The Hillman Companies, Inc. (hardware wholesalers, 2010-2014), and Earth Fare, Inc. (retail grocery, 2010-2014). |
Ned C. Lautenbach (1944) |
Year of Election or Appointment: 2000 Trustee Chairman of the Independent Trustees |
| Mr. Lautenbach also serves as Trustee of other Fidelity funds. Mr. Lautenbach currently serves as the Lead Director of the Eaton Corporation Board of Directors (diversified industrial, 1997-present). Mr. Lautenbach is Chairman of the Board of Directors of Artis-Naples in Naples, Florida (2012-present), a member of the Council on Foreign Relations (1994-present), and a member of the Board of Governors, State University System of Florida (2013-present). Previously, Mr. Lautenbach was a Partner/Advisory Partner at Clayton, Dubilier & Rice, LLC (private equity investment, 1998-2010), as well as a Director of Sony Corporation (2006-2007). |
Joseph Mauriello (1944) |
Year of Election or Appointment: 2008 Trustee |
| Mr. Mauriello also serves as Trustee of other Fidelity funds. Prior to his retirement in January 2006, Mr. Mauriello served in numerous senior management positions including Deputy Chairman and Chief Operating Officer (2004-2005), and Vice Chairman of Financial Services (2002-2004) of KPMG LLP US (professional services, 1965-2005). Mr. Mauriello currently serves as a member of the Board of Directors of XL Group plc. (global insurance and re-insurance, 2006-present). Previously, Mr. Mauriello served as a Director of the Hamilton Funds of the Bank of New York (2006-2007) and of Arcadia Resources Inc. (health care services and products, 2007-2012). |
Robert W. Selander (1950) |
Year of Election or Appointment: 2011 Trustee |
| Mr. Selander also serves as Trustee of other Fidelity funds. Mr. Selander serves as a Director of The Western Union Company (global money transfer, 2014-present). Previously, Mr. Selander served as a Member of the Advisory Board of other Fidelity funds (2011), and Executive Vice Chairman (2010), Chief Executive Officer (2009-2010), and President and Chief Executive Officer (1997-2009) of Mastercard, Inc. |
Cornelia M. Small (1944) |
Year of Election or Appointment: 2005 Trustee |
| Ms. Small also serves as Trustee of other Fidelity funds. Ms. Small is a member of the Board of Directors (2009-present) and Chair of the Investment Committee (2010-present) of the Teagle Foundation. Ms. Small also serves on the Investment Committee of the Berkshire Taconic Community Foundation (2008-present). Previously, Ms. Small served as Chairperson (2002-2008) and a member of the Investment Committee and Chairperson (2008-2012) and a member of the Board of Trustees of Smith College. In addition, Ms. Small served as Chief Investment Officer, Director of Global Equity Investments, and a member of the Board of Directors of Scudder, Stevens & Clark and Scudder Kemper Investments. |
William S. Stavropoulos (1939) |
Year of Election or Appointment: 2002 Trustee Vice Chairman of the Independent Trustees |
| Mr. Stavropoulos also serves as Trustee of other Fidelity funds. Mr. Stavropoulos serves as President and Founder of the Michigan Baseball Foundation, the Great Lakes Loons (2007-present). Mr. Stavropoulos is Chairman Emeritus of the Board of Directors of The Dow Chemical Company, where he previously served in numerous senior management positions, including President, CEO (1995-2000; 2002-2004), Chairman of the Executive Committee (2000-2006), and as a member of the Board of Directors (1990-2006). Currently, Mr. Stavropoulos is Chairman of the Board of Directors of Univar Inc. (global distributor of commodity and specialty chemicals), a Director of Teradata Corporation (data warehousing and technology solutions), and Maersk Inc. (industrial conglomerate), and a member of the Advisory Board for Metalmark Capital LLC (private equity investment, 2005-present). Mr. Stavropoulos is an operating advisor to Clayton, Dubilier & Rice, LLC (private equity investment). In addition, Mr. Stavropoulos is a member of the University of Notre Dame Advisory Council for the College of Science, a Trustee of the Rollin L. Gerstacker Foundation, and a Director of the Naples Philharmonic Center for the Arts. Previously, Mr. Stavropoulos served as a Director of Chemical Financial Corporation (bank holding company, 1993-2012) and Tyco International, Ltd. (multinational manufacturing and services, 2007-2012). |
David M. Thomas (1949) |
Year of Election or Appointment: 2008 Trustee |
| Mr. Thomas also serves as Trustee of other Fidelity funds. Mr. Thomas serves as Non-Executive Chairman of the Board of Directors of Fortune Brands Home and Security (home and security products, 2011-present), as a member of the Board of Directors (2004-present) and Presiding Director (2013-present) of Interpublic Group of Companies, Inc. (marketing communication), and as a member of the Board of Trustees of the University of Florida (2013-present). Previously, Mr. Thomas served as Executive Chairman (2005-2006) and Chairman and Chief Executive Officer (2000-2005) of IMS Health, Inc. (pharmaceutical and healthcare information solutions), and a Director of Fortune Brands, Inc. (consumer products, 2000-2011). |
+ The information above includes each Trustee's principal occupation during the last five years and other information relating to the experience, attributes, and skills relevant to each Trustee's qualifications to serve as a Trustee, which led to the conclusion that each Trustee should serve as a Trustee for the fund.
Advisory Board Member and Officers:
Correspondence intended for each officer and Peter S. Lynch may be sent to Fidelity Investments, 245 Summer Street, Boston, Massachusetts 02210. Officers appear below in alphabetical order.
Name, Year of Birth; Principal Occupation |
Peter S. Lynch (1944) |
Year of Election or Appointment: 2003 Member of the Advisory Board |
| Mr. Lynch also serves as Member of the Advisory Board of other Fidelity funds. Mr. Lynch is Vice Chairman and a Director of FMR (investment adviser firm) and FMR Co., Inc. (investment adviser firm). In addition, Mr. Lynch serves as a Trustee of Boston College and as the Chairman of the Inner-City Scholarship Fund. Previously, Mr. Lynch served on the Special Olympics International Board of Directors (1997-2006). |
Elizabeth Paige Baumann (1968) |
Year of Election or Appointment: 2012 Anti-Money Laundering (AML) Officer |
| Ms. Baumann also serves as AML Officer of other funds. She is Chief AML Officer of FMR LLC (diversified financial services company, 2012-present) and is an employee of Fidelity Investments. Previously, Ms. Baumann served as Vice President and Deputy Anti-Money Laundering Officer (2007-2012). |
Marc Bryant (1966) |
Year of Election or Appointment: 2015 Secretary and Chief Legal Officer (CLO) |
| Mr. Bryant also serves as Secretary and Chief Legal Officer (CLO) of other funds. He is Senior Vice President and Deputy General Counsel of FMR LLC (diversified financial services company). Previously, Mr. Bryant served as Secretary and Chief Legal Officer of Fidelity Rutland Square Trust II (2010-2014) and Assistant Secretary of Fidelity's Fixed Income and Asset Allocation Funds (2013-2015). Prior to joining Fidelity Investments, Mr. Bryant served as a Senior Vice President and the Head of Global Retail Legal for AllianceBernstein L.P. (2006-2010), and as the General Counsel for ProFund Advisors LLC (2001-2006). |
William C. Coffey (1969) |
Year of Election or Appointment: 2009 Assistant Secretary |
| Mr. Coffey also serves as Assistant Secretary of other funds. He is Senior Vice President and Deputy General Counsel of FMR LLC (diversified financial services company, 2010-present), and is an employee of Fidelity Investments. Previously, Mr. Coffey served as Vice President and Associate General Counsel of FMR LLC (2005-2009). |
Jonathan Davis (1968) |
Year of Election or Appointment: 2010 Assistant Treasurer |
| Mr. Davis also serves as Assistant Treasurer of other funds. Mr. Davis is an employee of Fidelity Investments. Previously, Mr. Davis served as Vice President and Associate General Counsel of FMR LLC (diversified financial services company, 2003-2010). |
Adrien E. Deberghes (1967) |
Year of Election or Appointment: 2008 Deputy Treasurer |
| Mr. Deberghes also serves as an officer of other funds. He is an employee of Fidelity Investments (2008-present). Prior to joining Fidelity Investments, Mr. Deberghes was Senior Vice President of Mutual Fund Administration at State Street Corporation (2007-2008), Senior Director of Mutual Fund Administration at Investors Bank & Trust (2005-2007), and Director of Finance for Dunkin' Brands (2000-2005). |
Stephanie J. Dorsey (1969) |
Year of Election or Appointment: 2010 Assistant Treasurer |
| Ms. Dorsey also serves as an officer of other funds. She is an employee of Fidelity Investments (2008-present) and has served in other fund officer roles. Prior to joining Fidelity Investments, Ms. Dorsey served as Treasurer (2004-2008) of the JPMorgan Mutual Funds and Vice President (2004-2008) of JPMorgan Chase Bank. |
Howard J. Galligan III (1966) |
Year of Election or Appointment: 2014 Chief Financial Officer |
| Mr. Galligan also serves as Chief Financial Officer of other funds. Mr. Galligan serves as President of Fidelity Pricing and Cash Management Services (FPCMS) (2014-present) and as a Director of Strategic Advisers, Inc. (investment adviser firm, 2008-present). Previously, Mr. Galligan served as Chief Administrative Officer of Asset Management (2011-2014) and Chief Operating Officer and Senior Vice President of Investment Support for Strategic Advisers, Inc. (2003-2011). |
Scott C. Goebel (1968) |
Year of Election or Appointment: 2015 Vice President |
| Mr. Goebel serves as an officer of other funds. Mr. Goebel also serves as Secretary of Fidelity SelectCo, LLC (investment adviser firm, 2013-present), Fidelity Investments Money Management, Inc. (FIMM) (investment adviser firm, 2010-present) and Fidelity Research and Analysis Company (FRAC) (investment adviser firm, 2010-present); General Counsel, Secretary, and Senior Vice President of FMR (investment adviser firm, 2008-present) and FMR Co., Inc. (investment adviser firm, 2008-present); Chief Legal Officer of Fidelity Management & Research (Hong Kong) Limited (investment adviser firm, 2008-present); and Assistant Secretary of Fidelity Management & Research (Japan) Limited (investment adviser firm, 2008-present) and FMR Investment Management (U.K.) Limited (investment adviser firm, 2008-present). Previously, Mr. Goebel served as Secretary and CLO of certain Fidelity funds (2008-2015), Assistant Secretary of FIMM (2008-2010), FRAC (2008-2010), and certain funds (2007-2008); and as Vice President and Secretary of Fidelity Distributors Corporation (FDC) (2005-2007). Mr. Goebel has been employed by FMR LLC (diversified financial services company) or an affiliate since 2001. |
Brian B. Hogan (1964) |
Year of Election or Appointment: 2009 Vice President |
| Mr. Hogan also serves as Trustee or Vice President of other funds. Mr. Hogan serves as a Director of Fidelity SelectCo, LLC (investment adviser firm, 2014-present) and President of the Equity Division of FMR (investment adviser firm, 2009-present). Previously, Mr. Hogan served as Senior Vice President, Equity Research of FMR (2006-2009) and as a portfolio manager. |
Chris Maher (1972) |
Year of Election or Appointment: 2013 Assistant Treasurer |
| Mr. Maher serves as Assistant Treasurer of other funds. Mr. Maher is Vice President of Valuation Oversight and is an employee of Fidelity Investments. Previously, Mr. Maher served as Vice President of Asset Management Compliance (2013), Vice President of the Program Management Group of FMR (investment adviser firm, 2010-2013), and Vice President of Valuation Oversight (2008-2010). |
Melissa M. Reilly (1971) |
Year of Election or Appointment: 2014 Vice President of certain Equity Funds |
| Ms. Reilly also serves as Vice President of other funds. Ms. Reilly is an employee of Fidelity Investments (2004-present). |
Kenneth B. Robins (1969) |
Year of Election or Appointment: 2008 President and Treasurer |
| Mr. Robins also serves as an officer of other funds. Mr. Robins serves as Executive Vice President of Fidelity Investments Money Management, Inc. (FIMM) (investment adviser firm, 2013-present) and is an employee of Fidelity Investments (2004-present). Previously, Mr. Robins served in other fund officer roles. |
Stephen Sadoski (1971) |
Year of Election or Appointment: 2012 Deputy Treasurer |
| Mr. Sadoski also serves as Deputy Treasurer of other funds. He is an employee of Fidelity Investments (2012-present) and has served in another fund officer role. Prior to joining Fidelity Investments, Mr. Sadoski served as an assistant chief accountant in the Division of Investment Management of the Securities and Exchange Commission (SEC) (2009-2012) and as a senior manager at Deloitte & Touche LLP (1997-2009). |
Stacie M. Smith (1974) |
Year of Election or Appointment: 2013 Deputy Treasurer |
| Ms. Smith also serves as an officer of other funds. She is an employee of Fidelity Investments (2009-present) and has served in other fund officer roles. Prior to joining Fidelity Investments, Ms. Smith served as Senior Audit Manager of Ernst & Young LLP (1996-2009). |
Renee Stagnone (1975) |
Year of Election or Appointment: 2013 Deputy Treasurer |
| Ms. Stagnone also serves as Deputy Treasurer of other funds. Ms. Stagnone is an employee of Fidelity Investments. |
Linda J. Wondrack (1964) |
Year of Election or Appointment: 2014 Chief Compliance Officer |
| Ms. Wondrack also serves as Chief Compliance Officer of other funds. Ms. Wondrack is Executive Vice President and head of the Ethics Office and Asset Management Compliance for Fidelity Investments (2012-present). Ms. Wondrack also serves as Chief Compliance Officer of Fidelity SelectCo, LLC (investment adviser firm, 2014-present); Chief Compliance Officer of Impresa Management LLC (2013-present); and Chief Compliance Officer of FMR Co., Inc. (investment adviser firm), Fidelity Investments Money Management, Inc. (investment adviser firm), Fidelity Management & Research (Japan) Limited (investment adviser firm), FMR Investment Management (U.K.) Limited (investment adviser firm), Fidelity Management & Research (Hong Kong) (investment adviser firm), Fidelity Management & Research Company (investment adviser firm), Pyramis Global Advisors, LLC (investment adviser firm), and Strategic Advisers, Inc. (investment adviser firm), Ballyrock Investment Advisors LLC, and Northern Neck Investors LLC (2012-present). Previously, Ms. Wondrack served as Senior Vice President and Chief Compliance Officer for Columbia Management Investment Advisers, LLC (2005-2012); Chief Compliance Officer for certain funds within the Columbia Family of Funds (2007-2012); and Senior Vice President of Compliance Risk Management at Bank of America (2005-2010). |
Joseph F. Zambello (1957) |
Year of Election or Appointment: 2011 Deputy Treasurer |
| Mr. Zambello also serves as Deputy Treasurer of other funds. Mr. Zambello is an employee of Fidelity Investments. Previously, Mr. Zambello served as Vice President of the Program Management Group of FMR (investment adviser firm, 2009-2011) and Vice President of the Transfer Agent Oversight Group (2005-2009). |
Annual Report
The Board of Trustees of Fidelity Blue Chip Growth Fund voted to pay on September 14, 2015, to shareholders of record at the opening of business on September 11, 2015, a distribution of $3.444 per share derived from capital gains realized from sales of portfolio securities; and a dividend of $0.026 per share from net investment income.
The fund hereby designates as a capital gain dividend with respect to the taxable year ended July 31, 2015, $1,186,669,842 or, if subsequently determined to be different, the net capital gain of such year.
The fund designates 100% of the dividends distributed during the fiscal year as qualifying for the dividends-received deduction for corporate shareholders.
The fund designates 100% of the dividends distributed during the fiscal year as amounts which can be taken into account as a dividend for the purposes of the maximum rate under section 1(h)(11) of the Internal Revenue Code.
The fund will notify shareholders in January 2016 of amounts for use in preparing 2015 income tax returns.
Annual Report
Fidelity Blue Chip Growth Fund
Each year, the Board of Trustees, including the Independent Trustees (together, the Board), votes on the renewal of the management contract with Fidelity Management & Research Company (FMR) and the sub-advisory agreements (together, the Advisory Contracts) for the fund. The Board, assisted by the advice of fund counsel and Independent Trustees' counsel, requests and considers a broad range of information relevant to the renewal of the Advisory Contracts throughout the year.
The Board meets regularly and, at each of its meetings, covers an extensive agenda of topics and materials and considers factors that are relevant to its annual consideration of the renewal of the fund's Advisory Contracts, including the services and support provided to the fund and its shareholders. The Board has established various standing committees (Committees), each composed of and chaired by Independent Trustees with varying backgrounds, to which the Board has assigned specific subject matter responsibilities in order to enhance effective decision-making by the Board. The Board, acting directly and through its Committees, requests and receives information concerning the annual consideration of the renewal of the fund's Advisory Contracts. The Board also meets as needed to consider matters specifically related to the Board's annual consideration of the renewal of the Advisory Contracts. Members of the Board may also meet with trustees of other Fidelity funds through ad hoc joint committees to discuss certain matters relevant to all of the Fidelity funds.
At its July 2015 meeting, the Board unanimously determined to renew the fund's Advisory Contracts. In reaching its determination, the Board considered all factors it believed relevant, including (i) the nature, extent, and quality of the services to be provided to the fund and its shareholders (including the investment performance of the fund); (ii) the competitiveness of the fund's management fee and total expense ratio relative to peer funds; (iii) the total costs of the services to be provided by and the profits to be realized by Fidelity from its relationship with the fund; and (iv) the extent to which (if any) economies of scale exist and would be realized as the fund grows, and whether any economies of scale are appropriately shared with fund shareholders.
In considering whether to renew the Advisory Contracts for the fund, the Board reached a determination, with the assistance of fund counsel and Independent Trustees' counsel and through the exercise of its business judgment, that the renewal of the Advisory Contracts was in the best interests of the fund and its shareholders and that the compensation payable under the Advisory Contracts was fair and reasonable. The Board's decision to renew the Advisory Contracts was not based on any single factor, but rather was based on a comprehensive consideration of all the information provided to the Board at its meetings throughout the year. The Board, in reaching its determination to renew the Advisory Contracts, was aware that shareholders of the fund have a broad range of investment choices available to them, including a wide choice among funds offered by Fidelity's competitors, and that the fund's shareholders, who have the opportunity to review and weigh the disclosure provided by the fund in its prospectus and other public disclosures, have chosen to invest in this fund, which is part of the Fidelity family of funds.
Annual Report
Board Approval of Investment Advisory Contracts and
Management Fees - continued
Nature, Extent, and Quality of Services Provided. The Board considered Fidelity's staffing as it relates to the fund, including the backgrounds of investment personnel of Fidelity, and also considered the fund's investment objective, strategies, and related investment philosophy. The Independent Trustees also had discussions with senior management of Fidelity's investment operations and investment groups. The Board considered the structure of the portfolio manager compensation program and whether this structure provides appropriate incentives to act in the best interests of the fund. Additionally, the Board considered the portfolio managers' investments, if any, in the funds that they manage.
Resources Dedicated to Investment Management and Support Services. The Board and the Fund Oversight and Research Committees reviewed the general qualifications and capabilities of Fidelity's investment staff, including its size, education, experience, and resources, as well as Fidelity's approach to recruiting, training, managing, and compensating investment personnel. The Board noted that Fidelity has continued to increase the resources devoted to non-U.S. offices, including expansion of Fidelity's global investment organization. The Board also noted that Fidelity's analysts have extensive resources, tools and capabilities that allow them to conduct sophisticated quantitative and fundamental analysis, as well as credit analysis of issuers, counterparties and guarantors. Further, the Board considered that Fidelity's investment professionals have sufficient access to global information and data so as to provide competitive investment results over time, and that those professionals also have access to sophisticated tools that permit them to assess portfolio construction and risk and performance attribution characteristics continuously, as well as to transmit new information and research conclusions rapidly around the world. Additionally, in its deliberations, the Board considered Fidelity's trading, risk management, and compliance capabilities and resources, which are integral parts of the investment management process.
Shareholder and Administrative Services. The Board considered (i) the nature, extent, quality, and cost of advisory, administrative, and shareholder services performed by FMR, the sub-advisers (together with FMR, the Investment Advisers), and their affiliates under the Advisory Contracts and under separate agreements covering transfer agency, pricing and bookkeeping, and securities lending services for the fund; (ii) the nature and extent of the supervision of third party service providers, principally custodians and subcustodians; and (iii) the resources devoted to, and the record of compliance with, the fund's compliance policies and procedures. The Board also reviewed the allocation of fund brokerage, including allocations to brokers affiliated with the Investment Advisers, the use of brokerage commissions to pay fund expenses, and the use of "soft" commission dollars to pay for research services.
Annual Report
The Board noted that the growth of fund assets over time across the complex allows Fidelity to reinvest in the development of services designed to enhance the value or convenience of the Fidelity funds as investment vehicles. These services include 24-hour access to account information and market information through telephone representatives and over the Internet, investor education materials and asset allocation tools, and the expanded availability of Fidelity Investor Centers.
In 2014, the Board formed an ad hoc Committee on Transfer Agency Fees to review the variety of transfer agency fee structures throughout the industry and Fidelity's competitive positioning with respect to industry participants.
Investment in a Large Fund Family. The Board considered the benefits to shareholders of investing in a Fidelity fund, including the benefits of investing in a fund that is part of a large family of funds offering a variety of investment disciplines and providing a large variety of mutual fund investor services. The Board noted that Fidelity had taken, or had made recommendations that resulted in the Fidelity funds taking, a number of actions over the previous year that benefited particular funds, including (i) continuing to dedicate additional resources to investment research and to the support of the senior management team that oversees asset management; (ii) continuing efforts to enhance Fidelity's global research capabilities; (iii) launching new funds and making other enhancements to meet client needs; (iv) reducing management fees and total expenses for certain index funds and diversified international funds; (v) continuing to launch dedicated lower cost underlying funds to meet portfolio construction needs related to expanding underlying fund options for Fidelity funds of funds, specifically for the Freedom Fund product lines; (vi) rationalizing product lines and gaining increased efficiencies through fund mergers; (vii) launching active fixed-income exchange-traded funds; (viii) continuing to develop, acquire and implement systems and technology to improve services to the funds and information security and to increase efficiency; (ix) implementing investment enhancements to further strengthen Fidelity's target date product line to increase investors' probability of success in achieving their goals; (x) modifying the eligibility criteria for certain share classes to accommodate roll-over assets from employer-sponsored retirement plans; (xi) launching a new Class W of the Freedom Index Funds to attract and retain Fidelity record-kept retirement plan assets; and (xii) implementing changes to Fidelity's money market product line in response to recent money market regulatory reforms.
Investment Performance. The Board considered whether the fund has operated in accordance with its investment objective, as well as its record of compliance with its investment restrictions and its performance history.
Annual Report
Board Approval of Investment Advisory Contracts and
Management Fees - continued
The Board took into account discussions with representatives of the Investment Advisers about fund investment performance that occur at Board meetings throughout the year. In this regard the Board noted that as part of regularly scheduled fund reviews and other reports to the Board on fund performance, the Board considers annualized return information for the fund, for different time periods, measured against a securities market index ("benchmark index") and a peer group of funds with similar objectives ("peer group"), if any. In its evaluation of fund investment performance, the Board gave particular attention to information indicating changes in performance of certain Fidelity funds for specific time periods and discussed with the Investment Advisers the reasons for any overperformance or underperformance.
In addition to reviewing absolute and relative fund performance, the Independent Trustees periodically consider the appropriateness of fund performance metrics in evaluating the results achieved. In general, the Independent Trustees believe that fund performance should be evaluated based on net performance (after fees and expenses) of both the highest performing and lowest performing fund share classes, where applicable, compared to appropriate benchmark indices, over appropriate time periods that may include full market cycles, and compared to peer groups, as applicable, over the same periods, taking into account relevant factors including the following: general market conditions; issuer-specific information; and fund cash flows and other factors.
The Independent Trustees recognize that shareholders evaluate performance on a net basis over their own holding periods, for which one-, three-, and five-year periods are often used as a proxy. For this reason, the performance information reviewed by the Board also included net cumulative calendar year total return information for the fund and an appropriate benchmark index and peer group for the most recent one-, three-, and five-year periods, as shown below. Returns are shown compared to the 25th percentile (top of box, 75% beaten) and 75th percentile (bottom of box, 25% beaten) of the peer universe.
Annual Report
Fidelity Blue Chip Growth Fund

The Board also considered that the fund's management fee is subject to upward or downward adjustment depending upon whether, and to what extent, the fund's investment performance for the performance period exceeds, or is exceeded by, a securities index, thus leading to a performance adjustment for the same period. The Board noted that the performance adjustment provides FMR with a strong economic incentive to seek to achieve superior performance for the fund's shareholders and helps to more closely align the interests of FMR and the shareholders of the fund.
Based on its review, the Board concluded that the nature, extent, and quality of services provided to the fund under the Advisory Contracts should benefit the shareholders of the fund.
Competitiveness of Management Fee and Total Expense Ratio. The Board considered the fund's management fee and total expense ratio compared to "mapped groups" of competitive funds and classes created for the purpose of facilitating the Trustees' competitive analysis of management fees and total expenses. Fidelity creates "mapped groups" by combining similar Lipper investment objective categories that have comparable investment mandates. Combining Lipper investment objective categories aids the Board's management fee and total expense ratio comparisons by broadening the competitive group used for comparison.
Management Fee. The Board considered two proprietary management fee comparisons for the 12-month periods shown in basis points (BP) in the chart below. The group of Lipper funds used by the Board for management fee comparisons is referred to below as the "Total Mapped Group." The Total Mapped Group comparison focuses on a fund's standing in terms of gross management fees before expense reimbursements or caps, and without giving effect to the fund's performance adjustment, relative to the total universe of funds with comparable investment mandates, regardless of whether their management fee structures also are comparable. Funds with comparable investment mandates offer exposure to similar types of securities. Funds with comparable management fee structures have similar management fee contractual arrangements (e.g., flat rate charged for advisory services, all-inclusive fee rate, etc.). "TMG %" represents the percentage of funds in the Total Mapped Group that had management fees that were lower than the fund's. For example, a hypothetical TMG % of 20% would mean that 80% of the funds in the Total Mapped Group had higher, and 20% had lower, management fees than the fund. The fund's actual TMG %s and the number of funds in the Total Mapped Group are in the chart below. The "Asset-Size Peer Group" (ASPG) comparison focuses on a fund's standing relative to a subset of non-Fidelity funds within the Total Mapped Group that are similar in size and management fee structure without taking into account performance adjustments, if any. For example, if a fund is in the first quartile of the ASPG, the fund's management fee ranks in the least expensive or lowest 25% of funds in the ASPG. The ASPG represents at least 15% of the funds in the Total Mapped Group with comparable asset size and management fee structures, subject to a minimum of 50 funds (or all funds in the Total Mapped Group if fewer than 50). Additional information, such as the ASPG quartile in which the fund's management fee rate ranked and the impact of the fund's performance adjustment, is also included in the chart and considered by the Board.
Annual Report
Board Approval of Investment Advisory Contracts and
Management Fees - continued
Fidelity Blue Chip Growth Fund
Annual Report

The Board noted that the fund's management fee rate ranked below the median of its Total Mapped Group and below the median of its ASPG for 2014. The Board also noted the effect of the fund's performance adjustment, if any, on the fund's management fee ranking.
The Board noted that, in 2014, the ad hoc Committee on Group Fee was formed by it and other Fidelity fund boards to conduct an in-depth review of the "group fee" component of the management fee of funds with such management fee structures. Committee focus included the mechanics of the group fee, the competitive landscape of group fee structures, Fidelity funds with no group fee component and investment products not included in group fee assets. The Board also considered that, for funds subject to the group fee, FMR agreed to voluntarily waive fees over a specified period of time in amounts designed to account for assets converted from certain funds to certain collective investment trusts.
The Board also noted that, in 2013, the ad hoc Committee on Management Fees was formed to conduct an in-depth review of the management fee rates of Fidelity's active equity mutual funds. The Committee focused on the following areas: (i) standard fee structures; (ii) research consumption and trading evolution; (iii) management fee competitiveness/profitability by category; and (iv) factors that drive institutional pricing.
Annual Report
Board Approval of Investment Advisory Contracts and
Management Fees - continued
Based on its review, the Board concluded that the fund's management fee is fair and reasonable in light of the services that the fund receives and the other factors considered.
Total Expense Ratio. In its review of each class's total expense ratio, the Board considered the fund's management fee as well as other fund or class expenses, as applicable, such as transfer agent fees, pricing and bookkeeping fees, and custodial, legal, and audit fees. The Board noted the impact of the fund's performance adjustment. The Board also noted that Fidelity may agree to waive fees and expenses from time to time, and the extent to which, if any, it has done so for the fund. As part of its review, the Board also considered the current and historical total expense ratios of each class of the fund compared to competitive fund median expenses. Each class of the fund is compared to those funds and classes in the Total Mapped Group (used by the Board for management fee comparisons) that have a similar sales load structure.
The Board noted that the total expense ratio of each class ranked below its competitive median for 2014.
Fees Charged to Other Fidelity Clients. The Board also considered Fidelity fee structures and other information with respect to clients of Fidelity, such as other funds advised or subadvised by Fidelity, pension plan clients, and other institutional clients with similar mandates. The Board noted the findings of the 2013 ad hoc joint committee (created with the board of other Fidelity funds), which reviewed and compared Fidelity's institutional investment advisory business with its business of providing services to the Fidelity funds, including the differences in services provided, fees charged, and costs incurred, as well as competition in their respective marketplaces.
Based on its review of total expense ratios and fees charged to other Fidelity clients, the Board concluded that the total expense ratio of each class of the fund was reasonable in light of the services that the fund and its shareholders receive and the other factors considered.
Costs of the Services and Profitability. The Board considered the revenues earned and the expenses incurred by Fidelity in conducting the business of developing, marketing, distributing, managing, administering and servicing the fund and servicing the fund's shareholders. The Board also considered the level of Fidelity's profits in respect of all the Fidelity funds.
On an annual basis, Fidelity presents to the Board information about the profitability of its relationship with the fund. Fidelity calculates profitability information for each fund, as well as aggregate profitability information for groups of Fidelity funds and all Fidelity funds, using a series of detailed revenue and cost allocation methodologies which originate with the books and records of Fidelity on which Fidelity's audited financial statements are based. The Audit Committee of the Board reviews any significant changes from the prior year's methodologies.
Annual Report
PricewaterhouseCoopers LLP (PwC), independent registered public accounting firm and auditor to Fidelity and certain Fidelity funds, has been engaged annually by the Board as part of the Board's assessment of Fidelity's profitability analysis. PwC's engagement includes the review and assessment of the methodologies used by Fidelity in determining the revenues and expenses attributable to Fidelity's mutual fund business, and completion of agreed-upon procedures in respect of the mathematical accuracy of fund profitability and its conformity to established allocation methodologies. After considering PwC's reports issued under the engagement and information provided by Fidelity, the Board concluded that while other allocation methods may also be reasonable, Fidelity's profitability methodologies are reasonable in all material respects.
The Board also reviewed Fidelity's non-fund businesses and fall-out benefits related to the mutual fund business as well as cases where Fidelity's affiliates may benefit from or be related to the fund's business.
The Board considered the costs of the services provided by and the profits realized by Fidelity in connection with the operation of the fund and was satisfied that the profitability was not excessive.
Economies of Scale. The Board considered whether there have been economies of scale in respect of the management of the Fidelity funds, whether the Fidelity funds (including the fund) have appropriately benefited from any such economies of scale, and whether there is potential for realization of any further economies of scale. The Board considered the extent to which the fund will benefit from economies of scale as assets grow through increased services to the fund, through waivers or reimbursements, or through fee or expense ratio reductions. The Board also noted that in 2013, it and the boards of other Fidelity funds created an ad hoc committee (the Economies of Scale Committee) to analyze whether Fidelity attains economies of scale in respect of the management and servicing of the Fidelity funds, whether the Fidelity funds have appropriately benefited from such economies of scale, and whether there is potential for realization of any further economies of scale.
The Board recognized that the fund's management contract incorporates a "group fee" structure, which provides for lower group fee rates as total group assets increase, and for higher group fee rates as total group assets decrease (with "group assets" defined to include fund assets under FMR's management plus sector fund assets previously under FMR's management and currently managed by Fidelity SelectCo, LLC). FMR calculates the group fee rates based on a tiered asset "breakpoint" schedule that varies based on asset class. The Board considered that the group fee is designed to deliver the benefits of economies of scale to fund shareholders when total Fidelity fund assets increase, even if assets of any particular fund are unchanged or have declined, because some portion of Fidelity's costs are attributable to services provided to all Fidelity funds, and all funds benefit if those costs can be allocated among more assets. The Board concluded that, given the group fee structure, fund shareholders will benefit from lower management fees as group assets increase at the fund complex level, regardless of whether Fidelity achieves any such economies of scale.
Annual Report
Board Approval of Investment Advisory Contracts and
Management Fees - continued
The Board concluded, taking into account the analysis of the Economies of Scale Committee, that economies of scale, if any, are being appropriately shared between fund shareholders and Fidelity.
Additional Information Requested by the Board. In order to develop fully the factual basis for consideration of the Fidelity funds' Advisory Contracts, the Board requested and received additional information on certain topics, including: (i) fund performance trends and Fidelity's long-term strategies for certain funds; (ii) the various share classes employed by Fidelity and the attributes of each class, together with similar information on the distribution and servicing payments made by Fidelity or the funds to third-party participants in the distribution channels; (iii) fund profitability, and fund performance in relation to fund profitability; (iv) the methodology with respect to evaluating competitive fund data and peer group classifications and fee comparisons; (v) annual fund profitability margins, with particular focus on certain funds with negative margins; (vi) the realization of fall-out benefits in certain Fidelity business units; (vii) economies of scale and the way in which they are shared with fund shareholders; (viii) Fidelity's group fee structures, including the group fee schedule of breakpoints; (ix) the impact of cost containment measures on the funds; and (x) the transfer agent fee structure.
Based on its evaluation of all of the conclusions noted above, and after considering all factors it believed relevant, the Board concluded that the advisory fee structures are fair and reasonable, and that the fund's Advisory Contracts should be renewed.
Annual Report
Investment Adviser
Fidelity Management & Research Company
Boston, MA
Investment Sub-Advisers
FMR Co., Inc.
FMR Investment Management
(U.K.) Limited
Fidelity Management & Research
(Hong Kong) Limited
Fidelity Management & Research
(Japan) Limited
General Distributor
Fidelity Distributors Corporation
Smithfield, RI
Transfer and Service Agents
Fidelity Investments Institutional
Operations Company, Inc.
Boston, MA
Fidelity Service Company, Inc.
Boston, MA
Custodian
JPMorgan Chase Bank
New York, NY
The Fidelity Telephone Connection
Mutual Fund 24-Hour Service
Exchanges/Redemptions
and Account Assistance 1-800-544-6666
Product Information 1-800-544-6666
Retirement Accounts 1-800-544-4774
(8 a.m. - 9 p.m.)
TDD Service 1-800-544-0118
for the deaf and hearing impaired
(9 a.m. - 9 p.m. Eastern time)
Fidelity Automated Service
Telephone (FAST®)
1-800-544-5555

Automated line for quickest service
(Fidelity Investment logo)(registered trademark)
Corporate Headquarters
245 Summer St., Boston, MA 02210
www.fidelity.com
BCF-UANN-0915
1.789244.112
Fidelity®
Blue Chip Growth
Fund -
Class K
Annual Report
July 31, 2015
(Fidelity Cover Art)
Contents
Performance | (Click Here) | How the fund has done over time. |
Management's Discussion of Fund Performance | (Click Here) | The Portfolio Manager's review of fund performance and strategy. |
Shareholder Expense Example | (Click Here) | An example of shareholder expenses. |
Investment Changes | (Click Here) | A summary of major shifts in the fund's investments over the past six months. |
Investments | (Click Here) | A complete list of the fund's investments with their market values. |
Financial Statements | (Click Here) | Statements of assets and liabilities, operations, and changes in net assets, as well as financial highlights. |
Notes | (Click Here) | Notes to the financial statements. |
Report of Independent Registered Public Accounting Firm | (Click Here) | |
Trustees and Officers | (Click Here) | |
Distributions | (Click Here) | |
Board Approval of Investment Advisory Contracts and Management Fees | (Click Here) | |
To view a fund's proxy voting guidelines and proxy voting record for the 12-month period ended June 30, visit http://www.fidelity.com/proxyvotingresults or visit the Securities and Exchange Commission's (SEC) web site at http://www.sec.gov. You may also call 1-800-835-5092 to request a free copy of the proxy voting guidelines.
Standard & Poor's, S&P and S&P 500 are registered service marks of The McGraw-Hill Companies, Inc. and have been licensed for use by Fidelity Distributors Corporation.
Other third-party marks appearing herein are the property of their respective owners.
All other marks appearing herein are registered or unregistered trademarks or service marks of FMR LLC or an affiliated company. © 2015 FMR LLC. All rights reserved.
Annual Report
This report and the financial statements contained herein are submitted for the general information of the shareholders of the fund. This report is not authorized for distribution to prospective investors in the fund unless preceded or accompanied by an effective prospectus.
A fund files its complete schedule of portfolio holdings with the SEC for the first and third quarters of each fiscal year on Form N-Q. Forms N-Q are available on the SEC's web site at http://www.sec.gov. A fund's Forms N-Q may be reviewed and copied at the SEC's Public Reference Room in Washington, DC. Information regarding the operation of the SEC's Public Reference Room may be obtained by calling 1-800-SEC-0330. For a complete list of a fund's portfolio holdings, view the most recent holdings listing, semiannual report, or annual report on Fidelity's web site at http://www.fidelity.com, http://www.advisor.fidelity.com, or http://www.401k.com, as applicable.
NOT FDIC INSURED • MAY LOSE VALUE • NO BANK GUARANTEE
Neither the fund nor Fidelity Distributors Corporation is a bank.
Annual Report
Average annual total return reflects the change in the value of an investment, assuming reinvestment of the class' distributions from dividend income and capital gains (the profits earned upon the sale of securities that have grown in value, if any) and assuming a constant rate of performance each year. The $10,000 table and the fund's returns do not reflect the deduction of taxes that a shareholder would pay on fund distributions or the redemption of fund shares. During periods of reimbursement by Fidelity, a fund's total return will be greater than it would be had the reimbursement not occurred. How a fund did yesterday is no guarantee of how it will do tomorrow.
Average Annual Total Returns
Periods ended July 31, 2015 | Past 1
year | Past 5
years | Past 10
years |
Class K A | 19.84% | 19.66% | 10.09% |
A The initial offering of Class K shares took place on May 9, 2008. Returns prior to May 9, 2008, are those of Fidelity® Blue Chip Growth Fund, the original class of the fund.
$10,000 Over 10 Years
Let's say hypothetically that $10,000 was invested in Fidelity® Blue Chip Growth Fund - Class K on July 31, 2005. The chart shows how the value of your investment would have changed, and also shows how the Russell 1000® Growth Index performed over the same period. See footnote A above for additional information regarding the performance of Class K.
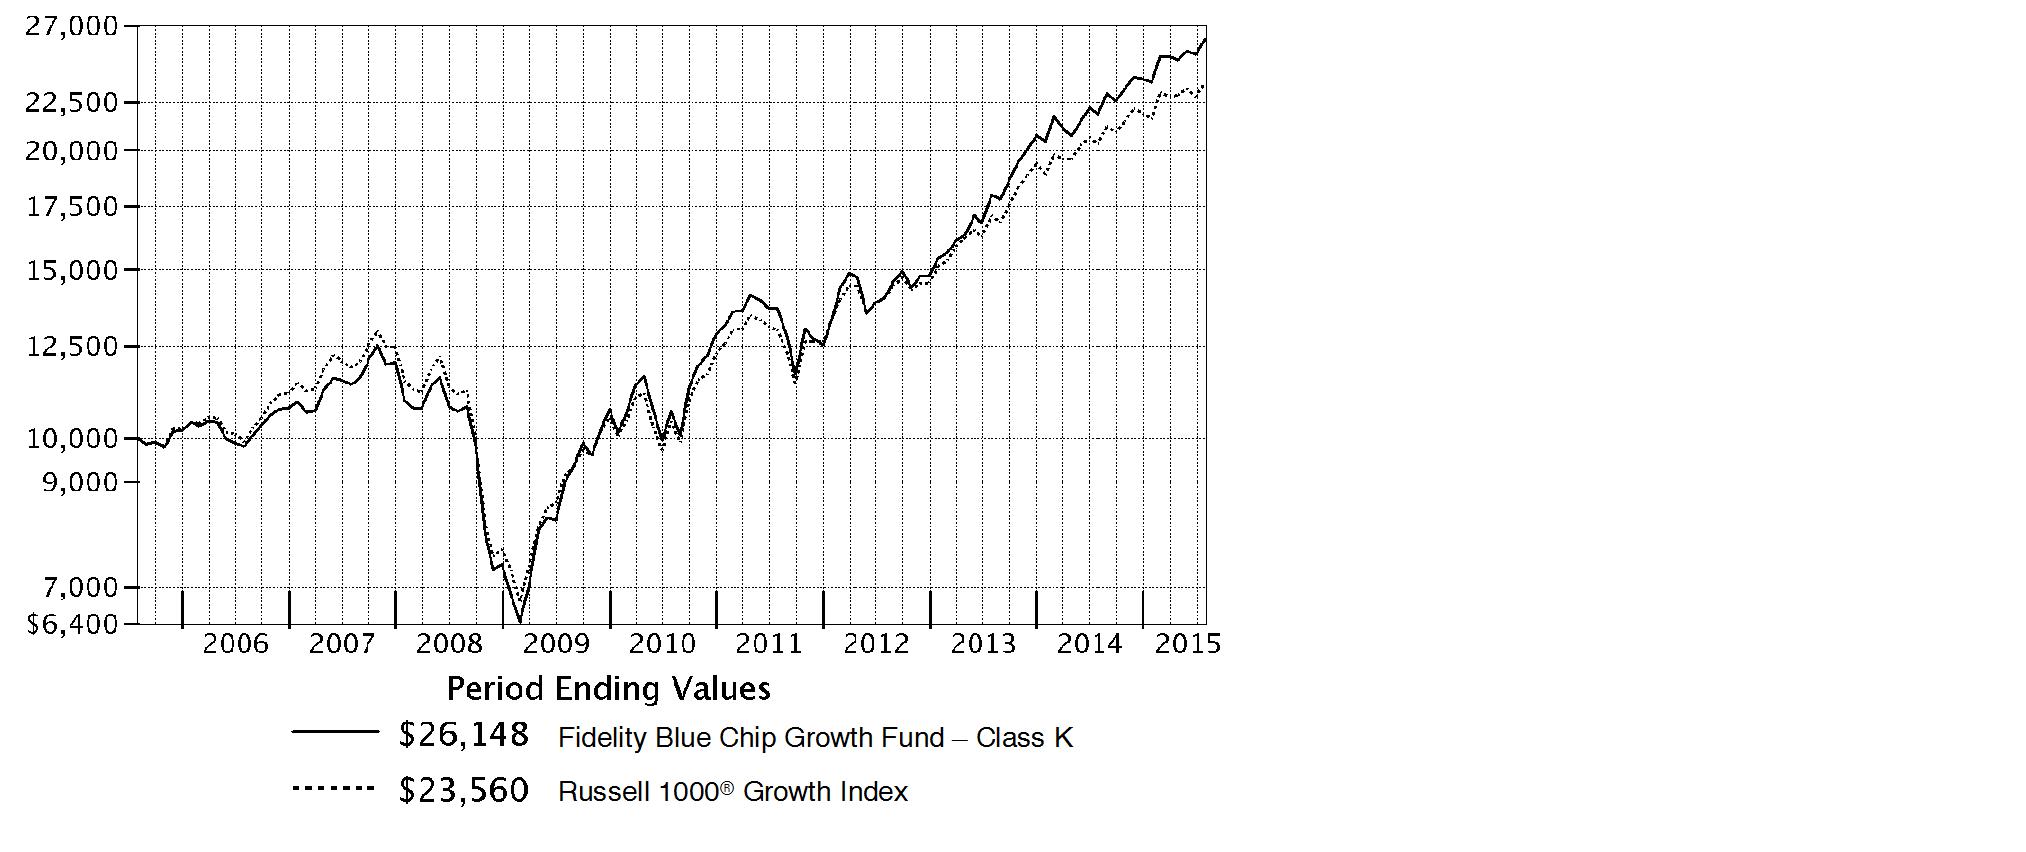
Annual Report
Market Recap: The U.S. equity market gained strongly for the 12 months ending July 31, 2015, as stocks recovered from volatility in late 2014 and early 2015, supported by a still-positive economic backdrop. The S&P 500® Index returned 11.21%, with growth stocks in the index far outpacing value-oriented names on prospects for continued U.S. economic growth. Consequently, the growth-oriented Nasdaq Composite Index® rose 18.71%, outpacing the broader S&P 500®, as well as the 12.03% advance of the smaller-cap Russell 2000® Index. Within the S&P 500®, seven of 10 sectors notched a gain, with significant performance variation. Health care (+27%) led the way, aided by merger activity. Consumer discretionary (+24%) benefited from spending linked to a seven-year low in unemployment. Strong first halves for the consumer staples sector and the real estate segment of financials yielded above-market returns (19% and 12%, respectively) for the full-year period. Conversely, energy (-26%) significantly lagged, due to a roughly 55% decline for U.S. crude-oil prices. Materials (-4%) also lost ground. At period end, investors remained focused on the slowing rate of U.S. earnings growth, the possible effect of a relatively stronger U.S. dollar on exports and inflation, and whether an economic slowdown in China would create ripples for the global economy.
Comments from Portfolio Manager Sonu Kalra: For the year, the fund's share classes handily outperformed the 16.08% gain of the benchmark Russell 1000® Growth Index. (For specific class-level results, please see the Performance section of this report.) Versus the benchmark, both stock selection and sector positioning provided a strong lift. Picks within information technology, health care and consumer discretionary were particularly helpful. The last category produced the largest individual contributor for the year: e-commerce giant Amazon.com. The fund held a substantial overweighting in the stock, which also was one of the fund's largest holdings. Strong first-quarter revenue growth of 15%, as well as profitability that exceeded investors' expectations, helped to lift the stock. In addition, for the first time Amazon provided financials for its decade-old cloud division, which included revenue growth of nearly 50% from the same period a year earlier. The firm also reported that it was on pace to generate at least $5 billion in sales this year. Turning to detractors, picks in consumer staples dragged on results the most, especially an overweighting in Keurig Green Mountain. The stock was hurt by lower-than-expected revenue related to a double-digit sales slide for its home-brewing machines. In addition, Keurig announced downside earnings guidance for consecutive quarters.
The views expressed above reflect those of the portfolio manager(s) only through the end of the period as stated on the cover of this report and do not necessarily represent the views of Fidelity or any other person in the Fidelity organization. Any such views are subject to change at any time based upon market or other conditions and Fidelity disclaims any responsibility to update such views. These views may not be relied on as investment advice and, because investment decisions for a Fidelity fund are based on numerous factors, may not be relied on as an indication of trading intent on behalf of any Fidelity fund.
Annual Report
Shareholder Expense Example
As a shareholder of the Fund, you incur two types of costs: (1) transaction costs, and (2) ongoing costs, including management fees and other Fund expenses. This Example is intended to help you understand your ongoing costs (in dollars) of investing in the Fund and to compare these costs with the ongoing costs of investing in other mutual funds.
The Example is based on an investment of $1,000 invested at the beginning of the period and held for the entire period (February 1, 2015 to July 31, 2015).
Actual Expenses
The first line of the accompanying table for each class of the Fund provides information about actual account values and actual expenses. You may use the information in this line, together with the amount you invested, to estimate the expenses that you paid over the period. Simply divide your account value by $1,000.00 (for example, an $8,600 account value divided by $1,000.00 = 8.6), then multiply the result by the number in the first line for a class of the Fund under the heading entitled "Expenses Paid During Period" to estimate the expenses you paid on your account during this period. A small balance maintenance fee of $12.00 that is charged once a year may apply for certain accounts with a value of less than $2,000. This fee is not included in the table below. If it was, the estimate of expenses you paid during the period would be higher, and your ending account value lower, by this amount. In addition, the Fund, as a shareholder in the underlying Fidelity Central Funds, will indirectly bear its pro-rata share of the fees and expenses incurred by the underlying Fidelity Central Funds. These fees and expenses are not included in the Fund's annualized expense ratio used to calculate the expense estimate in the table below.
Hypothetical Example for Comparison Purposes
The second line of the accompanying table for each class of the Fund provides information about hypothetical account values and hypothetical expenses based on a Class' actual expense ratio and an assumed rate of return of 5% per year before expenses, which is not the Class' actual return. The hypothetical account values and expenses may not be used to estimate the actual ending account balance or expenses you paid for the period. You may use this information to compare the ongoing costs of investing in the Fund and other funds. To do so, compare this 5% hypothetical example with the 5% hypothetical examples that appear in the shareholder reports of the other funds. A small balance maintenance fee of $12.00 that is charged once a year may apply for certain accounts with a value of less than $2,000. This fee is not included in the table below. If it was, the estimate of expenses you paid during the period would be higher, and your ending account value lower, by this amount. In addition, the Fund, as a shareholder in the underlying Fidelity Central Funds, will indirectly bear its pro-rata share of the fees and expenses incurred by the underlying Fidelity Central Funds. These fees and expenses are not included in the Fund's annualized expense ratio used to calculate the expense estimate in the table below.
Please note that the expenses shown in the table are meant to highlight your ongoing costs only and do not reflect any transaction costs. Therefore, the second line of the table is useful in comparing ongoing costs only, and will not help you determine the relative total costs of owning different funds.
Annual Report
| Annualized
Expense Ratio B | Beginning
Account Value
February 1, 2015 | Ending
Account Value
July 31, 2015 | Expenses Paid
During Period*
February 1, 2015
to July 31, 2015 |
Blue Chip Growth | .88% | | | |
Actual | | $ 1,000.00 | $ 1,108.60 | $ 4.60 |
HypotheticalA | | $ 1,000.00 | $ 1,020.43 | $ 4.41 |
Class K | .78% | | | |
Actual | | $ 1,000.00 | $ 1,109.10 | $ 4.08 |
HypotheticalA | | $ 1,000.00 | $ 1,020.93 | $ 3.91 |
A 5% return per year before expenses
B Annualized expense ratio reflects expenses net of applicable fee waivers.
* Expenses are equal to each Class' annualized expense ratio, multiplied by the average account value over the period, multiplied by 181/365 (to reflect the one-half year period).
Annual Report
Investment Changes (Unaudited)
Top Ten Stocks as of July 31, 2015 |
| % of fund's
net assets | % of fund's net assets
6 months ago |
Apple, Inc. | 6.4 | 6.6 |
Google, Inc. Class A | 4.3 | 2.7 |
Amazon.com, Inc. | 3.9 | 2.9 |
Facebook, Inc. Class A | 2.9 | 2.4 |
Gilead Sciences, Inc. | 2.2 | 2.6 |
Google, Inc. Class C | 2.0 | 2.2 |
The Walt Disney Co. | 2.0 | 1.5 |
Salesforce.com, Inc. | 1.8 | 1.4 |
Home Depot, Inc. | 1.8 | 1.9 |
Visa, Inc. Class A | 1.8 | 1.7 |
| 29.1 | |
Top Five Market Sectors as of July 31, 2015 |
| % of fund's
net assets | % of fund's net assets
6 months ago |
Information Technology | 34.2 | 33.4 |
Consumer Discretionary | 24.9 | 23.3 |
Health Care | 18.0 | 16.4 |
Consumer Staples | 9.8 | 9.8 |
Industrials | 5.5 | 8.3 |
Asset Allocation (% of fund's net assets) |
As of July 31, 2015* | As of January 31, 2015** |
 | Stocks 98.1% | |  | Stocks 98.6% | |
 | Convertible
Securities 1.9% | |  | Convertible
Securities 1.4% | |
 | Short-Term
Investments and
Net Other Assets
(Liabilities)† 0.0% | |  | Short-Term
Investments and
Net Other Assets
(Liabilities)† 0.0% | |
* Foreign investments | 12.5% | | ** Foreign investments | 12.2% | |
†Amount represents less than 0.1%. |

Annual Report
Investments July 31, 2015
Showing Percentage of Net Assets
Common Stocks - 98.1% |
| Shares | | Value (000s) |
CONSUMER DISCRETIONARY - 24.8% |
Auto Components - 0.2% |
Magna International, Inc. Class A (sub. vtg.) | 484,850 | | $ 26,344 |
Motherson Sumi Systems Ltd. | 787,172 | | 4,274 |
Motherson Sumi Systems Ltd. | 393,586 | | 2,137 |
| | 32,755 |
Automobiles - 1.4% |
General Motors Co. | 487,500 | | 15,361 |
Mahindra & Mahindra Ltd. (a) | 247,500 | | 5,274 |
Renault SA | 240,600 | | 22,138 |
Tesla Motors, Inc. (a)(d) | 943,456 | | 251,101 |
| | 293,874 |
Diversified Consumer Services - 0.0% |
2U, Inc. (a) | 27,917 | | 896 |
Houghton Mifflin Harcourt Co. (a) | 184,900 | | 4,831 |
| | 5,727 |
Hotels, Restaurants & Leisure - 5.3% |
Buffalo Wild Wings, Inc. (a) | 414,138 | | 80,997 |
Chipotle Mexican Grill, Inc. (a) | 273,917 | | 203,309 |
Dave & Buster's Entertainment, Inc. | 878,400 | | 34,082 |
Domino's Pizza, Inc. | 397,600 | | 45,263 |
Hilton Worldwide Holdings, Inc. | 1,915,700 | | 51,437 |
Jubilant Foodworks Ltd. (a) | 225,049 | | 6,444 |
Las Vegas Sands Corp. | 204,500 | | 11,460 |
McDonald's Corp. | 2,437,500 | | 243,409 |
Panera Bread Co. Class A (a) | 138,656 | | 28,302 |
Papa John's International, Inc. | 457,000 | | 34,531 |
Starbucks Corp. | 5,153,644 | | 298,551 |
Starwood Hotels & Resorts Worldwide, Inc. | 100,900 | | 8,018 |
Whitbread PLC | 305,594 | | 24,768 |
Wingstop, Inc. | 214,500 | | 7,353 |
Yum! Brands, Inc. | 404,900 | | 35,534 |
Zoe's Kitchen, Inc. (a)(d) | 336,600 | | 15,097 |
| | 1,128,555 |
Household Durables - 1.7% |
D.R. Horton, Inc. | 1,195,800 | | 35,503 |
GoPro, Inc. Class A (a)(d) | 1,720,200 | | 106,824 |
Jarden Corp. (a) | 626,600 | | 34,463 |
Sony Corp. (a) | 1,574,800 | | 44,640 |
Sony Corp. sponsored ADR (a) | 835,200 | | 23,678 |
Tempur Sealy International, Inc. (a) | 175,600 | | 13,267 |
Common Stocks - continued |
| Shares | | Value (000s) |
CONSUMER DISCRETIONARY - continued |
Household Durables - continued |
TRI Pointe Homes, Inc. (a) | 1,715,500 | | $ 25,389 |
Whirlpool Corp. | 484,200 | | 86,057 |
| | 369,821 |
Internet & Catalog Retail - 5.6% |
Amazon.com, Inc. (a) | 1,532,868 | | 821,847 |
Ctrip.com International Ltd. sponsored ADR (a) | 352,484 | | 25,231 |
Groupon, Inc. Class A (a)(d) | 7,317,800 | | 35,272 |
JD.com, Inc. sponsored ADR (a) | 478,800 | | 15,815 |
Jumei International Holding Ltd. sponsored ADR (a) | 298,900 | | 5,592 |
MakeMyTrip Ltd. (a) | 203,800 | | 2,975 |
Netflix, Inc. (a) | 859,361 | | 98,234 |
Priceline Group, Inc. (a) | 120,700 | | 150,099 |
The Honest Co., Inc. (h) | 150,143 | | 6,870 |
Vipshop Holdings Ltd. ADR (a) | 1,087,600 | | 21,197 |
| | 1,183,132 |
Leisure Products - 0.1% |
Hasbro, Inc. | 80,300 | | 6,323 |
MCBC Holdings, Inc. | 70,729 | | 1,082 |
NJOY, Inc. (a)(h) | 1,178,168 | | 0 |
Spin Master Corp. (a) | 416,000 | | 5,802 |
| | 13,207 |
Media - 2.3% |
Comcast Corp. Class A | 195,100 | | 12,176 |
DreamWorks Animation SKG, Inc. Class A (a) | 162,100 | | 3,908 |
Liberty Global PLC Class C (a) | 79,000 | | 3,882 |
Liberty LiLac Group Class C (a) | 3,950 | | 168 |
Live Nation Entertainment, Inc. (a) | 78,600 | | 2,061 |
Naspers Ltd. Class N | 203,000 | | 28,403 |
Starz Series A (a) | 327,200 | | 13,235 |
The Walt Disney Co. | 3,521,900 | | 422,628 |
| | 486,461 |
Multiline Retail - 1.3% |
B&M European Value Retail S.A. | 3,831,367 | | 21,342 |
Burlington Stores, Inc. (a) | 494,200 | | 27,201 |
Dollar Tree, Inc. (a) | 641,200 | | 50,033 |
Ollie's Bargain Outlet Holdings, Inc. | 75,700 | | 1,485 |
Target Corp. | 2,110,123 | | 172,714 |
| | 272,775 |
Common Stocks - continued |
| Shares | | Value (000s) |
CONSUMER DISCRETIONARY - continued |
Specialty Retail - 4.6% |
Abercrombie & Fitch Co. Class A | 94,700 | | $ 1,903 |
Advance Auto Parts, Inc. | 13,800 | | 2,404 |
Boot Barn Holdings, Inc. | 188,600 | | 5,960 |
Finish Line, Inc. Class A | 234,500 | | 6,446 |
Five Below, Inc. (a) | 738,200 | | 27,217 |
H&M Hennes & Mauritz AB (B Shares) | 250,369 | | 9,960 |
Home Depot, Inc. | 3,321,600 | | 388,727 |
Inditex SA | 566,956 | | 19,411 |
L Brands, Inc. | 988,582 | | 79,798 |
Michaels Companies, Inc. (a) | 632,800 | | 16,035 |
Office Depot, Inc. (a) | 440,700 | | 3,526 |
Restoration Hardware Holdings, Inc. (a)(d) | 1,767,222 | | 179,302 |
Ross Stores, Inc. | 1,323,126 | | 70,337 |
Signet Jewelers Ltd. | 52,500 | | 6,364 |
Staples, Inc. | 252,800 | | 3,719 |
Tiffany & Co., Inc. | 192,700 | | 18,441 |
TJX Companies, Inc. | 1,718,652 | | 119,996 |
Ulta Salon, Cosmetics & Fragrance, Inc. (a) | 160,400 | | 26,631 |
| | 986,177 |
Textiles, Apparel & Luxury Goods - 2.3% |
Columbia Sportswear Co. | 782,800 | | 56,002 |
Crocs, Inc. (a) | 950,300 | | 14,948 |
G-III Apparel Group Ltd. (a) | 313,200 | | 22,622 |
Hanesbrands, Inc. | 1,078,000 | | 33,450 |
Kate Spade & Co. (a) | 290,604 | | 5,847 |
lululemon athletica, Inc. (a)(d) | 890,458 | | 55,974 |
NIKE, Inc. Class B | 942,575 | | 108,603 |
PVH Corp. | 452,400 | | 52,496 |
Skechers U.S.A., Inc. Class A (sub. vtg.) (a) | 573,200 | | 86,238 |
Tory Burch LLC unit (g)(h) | 293,611 | | 20,890 |
Under Armour, Inc. Class A (sub. vtg.) (a) | 276,900 | | 27,504 |
| | 484,574 |
TOTAL CONSUMER DISCRETIONARY | | 5,257,058 |
CONSUMER STAPLES - 9.6% |
Beverages - 2.7% |
Anheuser-Busch InBev SA NV ADR | 421,691 | | 50,413 |
Coca-Cola Bottling Co. Consolidated | 31,100 | | 5,038 |
Constellation Brands, Inc. Class A (sub. vtg.) | 233,600 | | 28,037 |
Common Stocks - continued |
| Shares | | Value (000s) |
CONSUMER STAPLES - continued |
Beverages - continued |
Kweichow Moutai Co. Ltd. | 239,587 | | $ 7,980 |
Monster Beverage Corp. (a) | 1,121,735 | | 172,242 |
PepsiCo, Inc. | 1,026,854 | | 98,937 |
The Coca-Cola Co. | 5,225,152 | | 214,649 |
United Spirits Ltd. (a) | 41,658 | | 2,412 |
| | 579,708 |
Food & Staples Retailing - 2.8% |
Costco Wholesale Corp. | 835,600 | | 121,413 |
CVS Health Corp. | 1,770,300 | | 199,106 |
Kroger Co. | 2,949,774 | | 115,749 |
Rite Aid Corp. (a) | 1,674,700 | | 14,922 |
Sprouts Farmers Market LLC (a) | 1,327,477 | | 32,550 |
Tesco PLC | 7,211,300 | | 24,251 |
United Natural Foods, Inc. (a) | 75,200 | | 3,424 |
Wal-Mart de Mexico SA de CV Series V | 1,543,900 | | 3,750 |
Walgreens Boots Alliance, Inc. | 372,500 | | 35,995 |
Whole Foods Market, Inc. | 1,061,710 | | 38,646 |
| | 589,806 |
Food Products - 2.4% |
Associated British Foods PLC | 1,025,700 | | 51,642 |
Blue Buffalo Pet Products, Inc. | 254,400 | | 7,108 |
China Modern Dairy Holdings Ltd. | 7,448,000 | | 2,411 |
Edita Food Industries SAE GDR (a)(f) | 129,600 | | 2,890 |
Freshpet, Inc. (d) | 412,800 | | 6,819 |
Keurig Green Mountain, Inc. | 2,494,688 | | 187,201 |
Mead Johnson Nutrition Co. Class A | 632,094 | | 55,871 |
Mondelez International, Inc. | 2,467,200 | | 111,345 |
Pinnacle Foods, Inc. | 48,900 | | 2,198 |
The Hain Celestial Group, Inc. (a) | 718,200 | | 48,823 |
WhiteWave Foods Co. (a) | 469,669 | | 24,244 |
| | 500,552 |
Personal Products - 1.6% |
AMOREPACIFIC Group, Inc. | 72,220 | | 12,047 |
Edgewell Personal Care Co. (a) | 330,600 | | 31,642 |
Estee Lauder Companies, Inc. Class A | 698,100 | | 62,208 |
Herbalife Ltd. (a) | 2,178,258 | | 109,980 |
Nu Skin Enterprises, Inc. Class A (d)(e) | 3,392,600 | | 134,517 |
| | 350,394 |
Common Stocks - continued |
| Shares | | Value (000s) |
CONSUMER STAPLES - continued |
Tobacco - 0.1% |
Imperial Tobacco Group PLC | 205,961 | | $ 10,823 |
Reynolds American, Inc. | 107,100 | | 9,188 |
| | 20,011 |
TOTAL CONSUMER STAPLES | | 2,040,471 |
ENERGY - 1.2% |
Energy Equipment & Services - 0.0% |
U.S. Silica Holdings, Inc. (d) | 150,320 | | 3,385 |
Oil, Gas & Consumable Fuels - 1.2% |
Anadarko Petroleum Corp. | 322,100 | | 23,948 |
Cimarex Energy Co. | 393,907 | | 41,014 |
Continental Resources, Inc. (a) | 529,600 | | 17,694 |
EOG Resources, Inc. | 698,024 | | 53,880 |
Memorial Resource Development Corp. (a) | 277,000 | | 4,238 |
Noble Energy, Inc. | 377,879 | | 13,313 |
PDC Energy, Inc. (a) | 49,400 | | 2,319 |
Pioneer Natural Resources Co. | 351,300 | | 44,534 |
Rice Energy, Inc. (a) | 564,200 | | 10,184 |
SM Energy Co. | 616,700 | | 22,861 |
Whiting Petroleum Corp. (a) | 1,085,900 | | 22,250 |
| | 256,235 |
TOTAL ENERGY | | 259,620 |
FINANCIALS - 4.2% |
Banks - 2.3% |
Axis Bank Ltd. (a) | 953,180 | | 8,543 |
Bank of America Corp. | 6,102,087 | | 109,105 |
Citigroup, Inc. | 2,135,590 | | 124,847 |
Gree Electric Applicances, Inc. ELS (BNP Paribas Arbitrage Warrant Program) warrants 12/10/15 (f) | 1,573,600 | | 5,654 |
Hangzhou Hikvision Digital Technology Co. Ltd. ELS (BNP Paribas Arbitrage Warrant Program) warrants 11/06/2015 (a)(f) | 2,828,700 | | 15,044 |
HDFC Bank Ltd. sponsored ADR | 656,000 | | 40,980 |
ICICI Bank Ltd. sponsored ADR | 1,851,145 | | 18,641 |
JPMorgan Chase & Co. | 2,392,077 | | 163,929 |
Regions Financial Corp. | 818,000 | | 8,499 |
| | 495,242 |
Common Stocks - continued |
| Shares | | Value (000s) |
FINANCIALS - continued |
Capital Markets - 1.3% |
Ameriprise Financial, Inc. | 184,953 | | $ 23,243 |
Bank of New York Mellon Corp. | 236,500 | | 10,264 |
BlackRock, Inc. Class A | 177,800 | | 59,798 |
Charles Schwab Corp. | 705,700 | | 24,615 |
Fairfax India Holdings Corp. (a) | 920,000 | | 10,442 |
Goldman Sachs Group, Inc. | 31,300 | | 6,419 |
Invesco Ltd. | 611,272 | | 23,595 |
Morgan Stanley | 1,331,951 | | 51,733 |
Northern Trust Corp. | 219,100 | | 16,759 |
State Street Corp. | 182,700 | | 13,988 |
The Blackstone Group LP | 795,400 | | 31,219 |
Weifu High-Technology Co. Ltd. ELS (UBS Warrant Programme) warrants 6/17/16 (f) | 1,794,900 | | 7,269 |
| | 279,344 |
Consumer Finance - 0.1% |
Shriram Transport Finance Co. Ltd. | 444,501 | | 6,192 |
Springleaf Holdings, Inc. (a) | 236,000 | | 11,920 |
Synchrony Financial (d) | 126,900 | | 4,360 |
| | 22,472 |
Diversified Financial Services - 0.1% |
McGraw Hill Financial, Inc. | 100,100 | | 10,185 |
Moody's Corp. | 113,400 | | 12,523 |
Multi Commodity Exchange of India Ltd. (a) | 4,622 | | 82 |
| | 22,790 |
Insurance - 0.0% |
American International Group, Inc. | 33,300 | | 2,135 |
Real Estate Investment Trusts - 0.2% |
Extra Space Storage, Inc. | 256,400 | | 18,851 |
Lamar Advertising Co. Class A | 206,900 | | 12,424 |
| | 31,275 |
Real Estate Management & Development - 0.1% |
Parsvnath Developers Ltd. (a)(e) | 21,771,340 | | 6,516 |
Realogy Holdings Corp. (a) | 280,867 | | 12,785 |
| | 19,301 |
Thrifts & Mortgage Finance - 0.1% |
Housing Development Finance Corp. Ltd. | 697,722 | | 14,616 |
Common Stocks - continued |
| Shares | | Value (000s) |
FINANCIALS - continued |
Thrifts & Mortgage Finance - continued |
Indiabulls Housing Finance Ltd. | 604,148 | | $ 6,970 |
LIC Housing Finance Ltd. | 351,944 | | 2,746 |
| | 24,332 |
TOTAL FINANCIALS | | 896,891 |
HEALTH CARE - 17.9% |
Biotechnology - 10.3% |
Acceleron Pharma, Inc. (a) | 42,500 | | 1,217 |
Aduro Biotech, Inc. (d) | 86,500 | | 2,268 |
Agios Pharmaceuticals, Inc. (a) | 194,340 | | 21,412 |
Alexion Pharmaceuticals, Inc. (a) | 597,096 | | 117,891 |
Alkermes PLC (a) | 792,100 | | 55,463 |
Alnylam Pharmaceuticals, Inc. (a) | 685,563 | | 87,361 |
Amgen, Inc. | 1,185,802 | | 209,401 |
Ascendis Pharma A/S ADR | 333,600 | | 6,682 |
Avalanche Biotechnologies, Inc. (a) | 89,800 | | 1,322 |
BioCryst Pharmaceuticals, Inc. (a) | 1,038,000 | | 16,068 |
Biogen, Inc. (a) | 930,500 | | 296,625 |
BioMarin Pharmaceutical, Inc. (a) | 318,704 | | 46,617 |
bluebird bio, Inc. (a) | 201,800 | | 33,464 |
Calithera Biosciences, Inc. (d) | 264,600 | | 1,958 |
Catabasis Pharmaceuticals, Inc. | 525,300 | | 6,829 |
Celgene Corp. (a) | 1,912,300 | | 250,989 |
Cellectis SA sponsored ADR | 67,300 | | 2,390 |
Chiasma, Inc. | 221,566 | | 4,700 |
Chiasma, Inc. | 148,000 | | 3,488 |
Chiasma, Inc. warrants (a) | 55,391 | | 807 |
Chimerix, Inc. (a) | 85,600 | | 4,600 |
China Biologic Products, Inc. (a) | 59,200 | | 7,244 |
Cidara Therapeutics, Inc. | 62,400 | | 872 |
Coherus BioSciences, Inc. | 367,600 | | 12,895 |
DBV Technologies SA sponsored ADR (a) | 108,200 | | 4,716 |
Dicerna Pharmaceuticals, Inc. (a) | 160,160 | | 1,957 |
Dyax Corp. (a) | 141,500 | | 3,482 |
Esperion Therapeutics, Inc. (a) | 37,800 | | 2,344 |
Exelixis, Inc. (a)(d) | 2,828,200 | | 16,206 |
FibroGen, Inc. (d) | 71,142 | | 1,654 |
Gilead Sciences, Inc. | 3,974,060 | | 468,383 |
Incyte Corp. (a) | 39,500 | | 4,119 |
Intercept Pharmaceuticals, Inc. (a) | 132,900 | | 35,060 |
Common Stocks - continued |
| Shares | | Value (000s) |
HEALTH CARE - continued |
Biotechnology - continued |
Intrexon Corp. (a)(d) | 477,059 | | $ 31,128 |
Ironwood Pharmaceuticals, Inc. Class A (a) | 901,481 | | 9,420 |
Isis Pharmaceuticals, Inc. (a) | 126,900 | | 6,971 |
Kite Pharma, Inc. (a)(d) | 98,400 | | 7,161 |
Merrimack Pharmaceuticals, Inc. (a)(d) | 1,584,158 | | 16,000 |
Neurocrine Biosciences, Inc. (a) | 544,900 | | 27,310 |
Novavax, Inc. (a) | 442,600 | | 5,338 |
ProNai Therapeutics, Inc. | 295,100 | | 8,086 |
Prothena Corp. PLC (a) | 97,700 | | 6,445 |
Radius Health, Inc. (a) | 85,300 | | 6,681 |
Regeneron Pharmaceuticals, Inc. (a) | 383,089 | | 212,101 |
Retrophin, Inc. (a) | 201,500 | | 6,396 |
Sage Therapeutics, Inc. | 24,700 | | 1,688 |
Seattle Genetics, Inc. (a) | 376,400 | | 18,018 |
Seres Therapeutics, Inc. | 49,400 | | 1,870 |
Spark Therapeutics, Inc. | 17,900 | | 1,100 |
Ultragenyx Pharmaceutical, Inc. (a) | 59,300 | | 7,171 |
uniQure B.V. (a) | 303,687 | | 7,820 |
Versartis, Inc. (a) | 178,500 | | 3,231 |
Vertex Pharmaceuticals, Inc. (a) | 506,260 | | 68,345 |
Xencor, Inc. (a) | 111,400 | | 2,494 |
ZIOPHARM Oncology, Inc. (a)(d) | 1,143,546 | | 15,278 |
| | 2,200,536 |
Health Care Equipment & Supplies - 0.8% |
Boston Scientific Corp. (a) | 2,758,800 | | 47,838 |
Glaukos Corp. | 190,000 | | 6,040 |
Hologic, Inc. (a) | 153,700 | | 6,403 |
Intuitive Surgical, Inc. (a) | 121,207 | | 64,624 |
Invuity, Inc. | 511,800 | | 6,029 |
Medtronic PLC | 272,570 | | 21,367 |
Nevro Corp. | 41,400 | | 2,102 |
Novadaq Technologies, Inc. (a) | 475,319 | | 5,452 |
St. Jude Medical, Inc. | 57,700 | | 4,259 |
Zeltiq Aesthetics, Inc. (a) | 428,900 | | 14,733 |
| | 178,847 |
Health Care Providers & Services - 1.2% |
Adeptus Health, Inc. Class A (a) | 288,400 | | 31,692 |
AmerisourceBergen Corp. | 143,600 | | 15,186 |
AmSurg Corp. (a) | 158,400 | | 11,364 |
Apollo Hospitals Enterprise Ltd. (a) | 936,371 | | 19,899 |
Common Stocks - continued |
| Shares | | Value (000s) |
HEALTH CARE - continued |
Health Care Providers & Services - continued |
Cardinal Health, Inc. | 308,631 | | $ 26,227 |
Cigna Corp. | 135,900 | | 19,578 |
Diplomat Pharmacy, Inc. | 128,000 | | 5,911 |
Express Scripts Holding Co. (a) | 46,400 | | 4,179 |
HCA Holdings, Inc. (a) | 781,000 | | 72,641 |
McKesson Corp. | 139,400 | | 30,747 |
Teladoc, Inc. (a) | 49,800 | | 1,572 |
UnitedHealth Group, Inc. | 102,300 | | 12,419 |
| | 251,415 |
Health Care Technology - 0.3% |
athenahealth, Inc. (a) | 75,975 | | 10,633 |
Castlight Health, Inc. Class B (a)(d) | 513,500 | | 3,687 |
Cerner Corp. (a) | 558,718 | | 40,071 |
Evolent Health, Inc. | 243,600 | | 5,196 |
| | 59,587 |
Life Sciences Tools & Services - 0.2% |
Illumina, Inc. (a) | 151,735 | | 33,275 |
Lonza Group AG | 38,158 | | 5,532 |
| | 38,807 |
Pharmaceuticals - 5.1% |
AbbVie, Inc. | 1,021,700 | | 71,529 |
Achaogen, Inc. (a) | 329,000 | | 2,372 |
Allergan PLC (a) | 1,140,055 | | 377,529 |
Bristol-Myers Squibb Co. | 2,284,100 | | 149,928 |
CSPC Pharmaceutical Group Ltd. | 2,126,000 | | 1,947 |
Dermira, Inc. | 315,700 | | 7,129 |
Eli Lilly & Co. | 365,400 | | 30,880 |
Endo Health Solutions, Inc. (a) | 66,800 | | 5,848 |
GW Pharmaceuticals PLC ADR (a) | 263,866 | | 30,215 |
Jazz Pharmaceuticals PLC (a) | 141,100 | | 27,125 |
Mallinckrodt PLC (a) | 202,600 | | 25,114 |
Relypsa, Inc. (a) | 104,900 | | 3,473 |
Shire PLC sponsored ADR | 275,259 | | 73,442 |
Tetraphase Pharmaceuticals, Inc. (a) | 215,700 | | 10,257 |
Teva Pharmaceutical Industries Ltd. sponsored ADR | 1,281,000 | | 88,415 |
Common Stocks - continued |
| Shares | | Value (000s) |
HEALTH CARE - continued |
Pharmaceuticals - continued |
Valeant Pharmaceuticals International, Inc. (Canada) (a) | 642,400 | | $ 164,705 |
ZS Pharma, Inc. (a) | 216,200 | | 12,914 |
| | 1,082,822 |
TOTAL HEALTH CARE | | 3,812,014 |
INDUSTRIALS - 5.4% |
Aerospace & Defense - 1.3% |
General Dynamics Corp. | 43,700 | | 6,516 |
Honeywell International, Inc. | 1,041,600 | | 109,420 |
Huntington Ingalls Industries, Inc. | 78,800 | | 9,252 |
The Boeing Co. | 1,059,426 | | 152,737 |
TransDigm Group, Inc. (a) | 18,300 | | 4,141 |
| | 282,066 |
Air Freight & Logistics - 0.3% |
FedEx Corp. | 264,378 | | 45,320 |
United Parcel Service, Inc. Class B | 43,800 | | 4,483 |
XPO Logistics, Inc. (a)(d) | 516,700 | | 22,399 |
| | 72,202 |
Airlines - 0.9% |
American Airlines Group, Inc. | 1,871,393 | | 75,043 |
Azul-Linhas Aereas Brasileiras warrants (a)(h) | 165,571 | | 0 |
Delta Air Lines, Inc. | 635,300 | | 28,169 |
Southwest Airlines Co. | 624,002 | | 22,589 |
Spirit Airlines, Inc. (a) | 772,100 | | 46,187 |
United Continental Holdings, Inc. (a) | 290,000 | | 16,353 |
Wizz Air Holdings PLC | 270,524 | | 6,966 |
| | 195,307 |
Building Products - 0.3% |
A.O. Smith Corp. | 274,254 | | 19,697 |
Caesarstone Sdot-Yam Ltd. | 254,100 | | 18,229 |
Continental Building Products, Inc. (a) | 1,019,000 | | 21,644 |
Lennox International, Inc. | 19,800 | | 2,338 |
Toto Ltd. | 470,000 | | 7,660 |
| | 69,568 |
Commercial Services & Supplies - 0.2% |
Interface, Inc. | 1,258,200 | | 32,675 |
Common Stocks - continued |
| Shares | | Value (000s) |
INDUSTRIALS - continued |
Construction & Engineering - 0.0% |
Beijing Urban Consolidated & Development Group Ltd. (H Shares) | 2,494,000 | | $ 2,217 |
Larsen & Toubro Ltd. (a) | 204,799 | | 5,733 |
| | 7,950 |
Electrical Equipment - 0.4% |
Acuity Brands, Inc. | 187,300 | | 37,683 |
SolarCity Corp. (a)(d) | 813,632 | | 47,191 |
| | 84,874 |
Industrial Conglomerates - 0.6% |
Danaher Corp. | 632,200 | | 57,884 |
General Electric Co. | 2,563,700 | | 66,913 |
| | 124,797 |
Machinery - 0.3% |
Eicher Motors Ltd. (a) | 14,288 | | 4,258 |
Ingersoll-Rand PLC | 465,784 | | 28,599 |
Manitowoc Co., Inc. | 125,200 | | 2,212 |
Middleby Corp. (a) | 39,700 | | 4,871 |
Pentair PLC | 61,700 | | 3,752 |
Rational AG | 6,060 | | 2,368 |
Zhengzhou Yutong Bus Co. Ltd. | 1,652,100 | | 5,151 |
| | 51,211 |
Professional Services - 0.3% |
Equifax, Inc. | 42,900 | | 4,381 |
Huron Consulting Group, Inc. (a) | 193,220 | | 14,776 |
Manpower, Inc. | 425,100 | | 38,463 |
Verisk Analytics, Inc. (a) | 109,300 | | 8,537 |
WageWorks, Inc. (a) | 61,700 | | 3,082 |
| | 69,239 |
Road & Rail - 0.4% |
Canadian Pacific Railway Ltd. (d) | 182,800 | | 29,427 |
Container Corp. of India Ltd. | 242,276 | | 6,216 |
J.B. Hunt Transport Services, Inc. | 570,000 | | 47,948 |
| | 83,591 |
Trading Companies & Distributors - 0.4% |
HD Supply Holdings, Inc. (a) | 1,854,400 | | 66,388 |
United Rentals, Inc. (a) | 154,600 | | 10,357 |
| | 76,745 |
Common Stocks - continued |
| Shares | | Value (000s) |
INDUSTRIALS - continued |
Transportation Infrastructure - 0.0% |
Qingdao Port International Co. Ltd. | 3,284,000 | | $ 2,110 |
TOTAL INDUSTRIALS | | 1,152,335 |
INFORMATION TECHNOLOGY - 32.9% |
Communications Equipment - 0.3% |
CommScope Holding Co., Inc. (a) | 207,800 | | 6,519 |
Palo Alto Networks, Inc. (a) | 145,991 | | 27,130 |
QUALCOMM, Inc. | 435,400 | | 28,035 |
| | 61,684 |
Electronic Equipment & Components - 0.2% |
Fitbit, Inc. (d) | 685,200 | | 32,616 |
Jabil Circuit, Inc. | 598,700 | | 12,124 |
| | 44,740 |
Internet Software & Services - 12.1% |
58.com, Inc. ADR (a) | 173,700 | | 10,316 |
Akamai Technologies, Inc. (a) | 499,830 | | 38,342 |
Alibaba Group Holding Ltd. sponsored ADR | 1,308,300 | | 102,492 |
Baidu.com, Inc. sponsored ADR (a) | 12,500 | | 2,158 |
Criteo SA sponsored ADR (a) | 63,487 | | 3,379 |
Dropbox, Inc. (a)(h) | 1,003,814 | | 16,824 |
eBay, Inc. (a) | 262,700 | | 7,387 |
Facebook, Inc. Class A (a) | 6,501,501 | | 611,206 |
Gogo, Inc. (a)(d) | 1,570,900 | | 28,638 |
Google, Inc.: | | | |
Class A (a) | 1,393,954 | | 916,525 |
Class C | 693,337 | | 433,759 |
HomeAway, Inc. (a) | 1,269,500 | | 38,136 |
Info Edge India Ltd. | 661,765 | | 8,612 |
Just Dial Ltd. | 578,216 | | 9,757 |
JUST EAT Ltd. (a) | 3,090,962 | | 21,046 |
NetEase, Inc. sponsored ADR | 182,500 | | 25,300 |
New Relic, Inc. | 175,317 | | 6,101 |
Rackspace Hosting, Inc. (a) | 1,296,301 | | 44,113 |
Tencent Holdings Ltd. | 3,180,100 | | 59,247 |
Twitter, Inc. (a) | 4,222,800 | | 130,949 |
Yahoo!, Inc. (a) | 1,411,576 | | 51,762 |
Youku Tudou, Inc. ADR (a) | 640,200 | | 12,420 |
| | 2,578,469 |
Common Stocks - continued |
| Shares | | Value (000s) |
INFORMATION TECHNOLOGY - continued |
IT Services - 4.5% |
Alliance Data Systems Corp. (a) | 39,000 | | $ 10,727 |
Cognizant Technology Solutions Corp. Class A (a) | 3,786,554 | | 238,932 |
EOH Holdings Ltd. | 181,500 | | 2,473 |
MasterCard, Inc. Class A | 2,756,100 | | 268,444 |
PayPal Holdings, Inc. (a) | 262,700 | | 10,166 |
Sabre Corp. | 1,063,400 | | 28,286 |
Total System Services, Inc. | 164,800 | | 7,617 |
Visa, Inc. Class A | 5,116,896 | | 385,507 |
| | 952,152 |
Semiconductors & Semiconductor Equipment - 4.5% |
Ambarella, Inc. (a)(d) | 199,800 | | 23,151 |
Analog Devices, Inc. | 3,367,821 | | 196,445 |
Atmel Corp. | 1,138,100 | | 9,423 |
Avago Technologies Ltd. | 1,079,300 | | 135,064 |
Broadcom Corp. Class A | 1,606,100 | | 81,285 |
Cavium, Inc. (a) | 952,301 | | 64,566 |
Cirrus Logic, Inc. (a) | 2,136,500 | | 70,526 |
Maxim Integrated Products, Inc. | 238,800 | | 8,129 |
Micron Technology, Inc. (a) | 229,900 | | 4,255 |
Monolithic Power Systems, Inc. | 189,704 | | 9,810 |
NVIDIA Corp. | 1,274,870 | | 25,434 |
NXP Semiconductors NV (a) | 2,766,207 | | 268,294 |
Qorvo, Inc. (a) | 458,986 | | 26,598 |
Skyworks Solutions, Inc. | 249,900 | | 23,908 |
| | 946,888 |
Software - 4.8% |
Activision Blizzard, Inc. | 4,806,016 | | 123,947 |
Adobe Systems, Inc. (a) | 962,950 | | 78,952 |
Appirio, Inc. (h) | 87,529 | | 434 |
Citrix Systems, Inc. (a) | 60,900 | | 4,605 |
Electronic Arts, Inc. (a) | 1,754,200 | | 125,513 |
Fortinet, Inc. (a) | 492,496 | | 23,512 |
HubSpot, Inc. | 52,500 | | 2,832 |
Intuit, Inc. | 201,700 | | 21,334 |
Micro Focus International PLC | 103,400 | | 2,257 |
Mobileye NV (a) | 209,400 | | 12,585 |
Nintendo Co. Ltd. | 288,800 | | 50,823 |
Paycom Software, Inc. (a) | 174,200 | | 5,574 |
Playtech Ltd. | 159,408 | | 2,257 |
Qlik Technologies, Inc. (a) | 893,800 | | 36,163 |
Common Stocks - continued |
| Shares | | Value (000s) |
INFORMATION TECHNOLOGY - continued |
Software - continued |
Rapid7, Inc. | 33,300 | | $ 765 |
Red Hat, Inc. (a) | 436,200 | | 34,495 |
Salesforce.com, Inc. (a) | 5,329,007 | | 390,616 |
Splunk, Inc. (a) | 99,400 | | 6,952 |
Tableau Software, Inc. (a) | 424,500 | | 44,462 |
Take-Two Interactive Software, Inc. (a) | 225,000 | | 7,106 |
Workday, Inc. Class A (a) | 78,800 | | 6,645 |
Workiva, Inc. (d) | 139,200 | | 2,031 |
Zendesk, Inc. (a) | 521,400 | | 10,756 |
Zynga, Inc. (a) | 6,076,283 | | 15,069 |
| | 1,009,685 |
Technology Hardware, Storage & Peripherals - 6.5% |
Apple, Inc. | 11,249,709 | | 1,364,597 |
Nimble Storage, Inc. (a) | 662,600 | | 18,301 |
SanDisk Corp. | 112,800 | | 6,801 |
| | 1,389,699 |
TOTAL INFORMATION TECHNOLOGY | | 6,983,317 |
MATERIALS - 1.9% |
Chemicals - 1.6% |
Agrium, Inc. | 129,200 | | 13,218 |
Air Products & Chemicals, Inc. | 64,500 | | 9,192 |
Ashland, Inc. | 147,900 | | 16,908 |
CF Industries Holdings, Inc. | 2,305,300 | | 136,474 |
E.I. du Pont de Nemours & Co. | 1,295,100 | | 72,215 |
Eastman Chemical Co. | 53,300 | | 4,179 |
Monsanto Co. | 590,300 | | 60,146 |
Potash Corp. of Saskatchewan, Inc. | 657,800 | | 17,895 |
PPG Industries, Inc. | 69,800 | | 7,565 |
Syngenta AG sponsored ADR | 46,900 | | 3,862 |
| | 341,654 |
Construction Materials - 0.1% |
Eagle Materials, Inc. | 218,700 | | 16,871 |
Prism Cement Ltd. (a) | 2,498,232 | | 4,195 |
Shree Cement Ltd. (a) | 10,816 | | 1,931 |
| | 22,997 |
Common Stocks - continued |
| Shares | | Value (000s) |
MATERIALS - continued |
Containers & Packaging - 0.2% |
Sealed Air Corp. | 509,700 | | $ 27,101 |
WestRock Co. | 67,600 | | 4,263 |
| | 31,364 |
Metals & Mining - 0.0% |
Compass Minerals International, Inc. | 3,736 | | 299 |
TOTAL MATERIALS | | 396,314 |
TELECOMMUNICATION SERVICES - 0.2% |
Wireless Telecommunication Services - 0.2% |
Bharti Infratel Ltd. | 4,948,490 | | 34,619 |
UTILITIES - 0.0% |
Electric Utilities - 0.0% |
Power Grid Corp. of India Ltd. | 757,980 | | 1,696 |
Independent Power and Renewable Electricity Producers - 0.0% |
Dynegy, Inc. (a) | 211,432 | | 5,508 |
TOTAL UTILITIES | | 7,204 |
TOTAL COMMON STOCKS (Cost $13,536,286) |
20,839,843
|
Preferred Stocks - 1.9% |
| | | |
Convertible Preferred Stocks - 1.9% |
CONSUMER DISCRETIONARY - 0.1% |
Internet & Catalog Retail - 0.1% |
Meituan Corp. Series D (h) | 1,581,852 | | 12,291 |
The Honest Co., Inc. Series C (h) | 350,333 | | 16,029 |
| | 28,320 |
Leisure Products - 0.0% |
NJOY, Inc.: | | | |
Series C (a)(h) | 607,766 | | 302 |
Series D (a)(h) | 149,114 | | 74 |
| | 376 |
TOTAL CONSUMER DISCRETIONARY | | 28,696 |
Preferred Stocks - continued |
| Shares | | Value (000s) |
Convertible Preferred Stocks - continued |
CONSUMER STAPLES - 0.2% |
Food & Staples Retailing - 0.1% |
Blue Apron, Inc. Series D (h) | 780,377 | | $ 10,400 |
Food Products - 0.1% |
BLUE BOTTLE Coffee, Inc. Series C (h) | 632,822 | | 21,086 |
Tobacco - 0.0% |
PAX Labs, Inc. Series C (h) | 2,555,833 | | 9,840 |
TOTAL CONSUMER STAPLES | | 41,326 |
FINANCIALS - 0.1% |
Consumer Finance - 0.1% |
Oportun Finance Corp. Series H (h) | 3,552,125 | | 10,114 |
HEALTH CARE - 0.1% |
Biotechnology - 0.1% |
CytomX Therapeutics, Inc. Series D (h) | 23,852,048 | | 3,538 |
Gensight Biologics Series B (h) | 1,059,505 | | 3,235 |
Immunocore Ltd. Series A (h) | 11,275 | | 2,129 |
Pronutria Biosciences, Inc. Series C (h) | 545,634 | | 5,500 |
| | 14,402 |
INDUSTRIALS - 0.1% |
Aerospace & Defense - 0.0% |
Space Exploration Technologies Corp. Series G (h) | 97,277 | | 7,535 |
Airlines - 0.0% |
Azul-Linhas Aereas Brasileiras Series B (a)(h) | 165,571 | | 5,803 |
Professional Services - 0.1% |
YourPeople, Inc. Series C (h) | 692,196 | | 10,314 |
TOTAL INDUSTRIALS | | 23,652 |
INFORMATION TECHNOLOGY - 1.3% |
Internet Software & Services - 1.0% |
Uber Technologies, Inc.: | | | |
Series D, 8.00% (a)(h) | 5,156,948 | | 204,421 |
Series E, 8.00% (h) | 102,648 | | 4,069 |
| | 208,490 |
Preferred Stocks - continued |
| Shares | | Value (000s) |
Convertible Preferred Stocks - continued |
INFORMATION TECHNOLOGY - continued |
IT Services - 0.1% |
AppNexus, Inc. Series E (h) | 646,522 | | $ 17,805 |
Nutanix, Inc. Series E (h) | 482,746 | | 7,685 |
| | 25,490 |
Software - 0.2% |
Appirio, Inc. Series E (h) | 612,702 | | 3,039 |
Cloudera, Inc. Series F (a)(h) | 186,078 | | 6,109 |
Cloudflare, Inc. Series D (h) | 696,025 | | 4,903 |
Dataminr, Inc. Series D (h) | 277,250 | | 3,535 |
Delphix Corp. Series D (h) | 675,445 | | 6,079 |
Snapchat, Inc. Series F (h) | 661,195 | | 20,312 |
Taboola.Com Ltd. Series E (h) | 634,902 | | 3,505 |
| | 47,482 |
TOTAL INFORMATION TECHNOLOGY | | 281,462 |
TOTAL CONVERTIBLE PREFERRED STOCKS | | 399,652 |
Nonconvertible Preferred Stocks - 0.0% |
CONSUMER DISCRETIONARY - 0.0% |
Automobiles - 0.0% |
Volkswagen AG | 41,700 | | 8,353 |
TOTAL PREFERRED STOCKS (Cost $277,814) |
408,005
|
Money Market Funds - 2.6% |
| | | |
Fidelity Cash Central Fund, 0.17% (b) | 53,438,973 | | 53,439 |
Fidelity Securities Lending Cash Central Fund, 0.18% (b)(c) | 488,639,941 | | 488,640 |
TOTAL MONEY MARKET FUNDS (Cost $542,079) |
542,079
|
TOTAL INVESTMENT PORTFOLIO - 102.6% (Cost $14,356,179) | 21,789,927 |
NET OTHER ASSETS (LIABILITIES) - (2.6)% | | (545,711) |
NET ASSETS - 100% | $ 21,244,216 |
Legend |
(a) Non-income producing |
(b) Affiliated fund that is generally available only to investment companies and other accounts managed by Fidelity Investments. The rate quoted is the annualized seven-day yield of the fund at period end. A complete unaudited listing of the fund's holdings as of its most recent quarter end is available upon request. In addition, each Fidelity Central Fund's financial statements, which are not covered by the Fund's Report of Independent Registered Public Accounting Firm, are available on the SEC's website or upon request. |
(c) Investment made with cash collateral received from securities on loan. |
(d) Security or a portion of the security is on loan at period end. |
(e) Affiliated company |
(f) Security exempt from registration under Rule 144A of the Securities Act of 1933. These securities may be resold in transactions exempt from registration, normally to qualified institutional buyers. At the end of the period, the value of these securities amounted to $30,857,000 or 0.1% of net assets. |
(g) Investment is owned by an entity that is treated as a corporation for U.S. tax purposes and is wholly-owned by the Fund. |
(h) Restricted securities - Investment in securities not registered under the Securities Act of 1933 (excluding 144A issues). At the end of the period, the value of restricted securities (excluding 144A issues) amounted to $444,671,000 or 2.1% of net assets. |
Additional information on each restricted holding is as follows: |
Security | Acquisition Date | Acquisition Cost (000s) |
Appirio, Inc. | 2/12/15 | $ 625 |
Appirio, Inc. Series E | 2/12/15 | $ 4,375 |
AppNexus, Inc. Series E | 8/1/14 | $ 12,951 |
Azul-Linhas Aereas Brasileiras Series B | 12/24/13 | $ 7,023 |
Azul-Linhas Aereas Brasileiras warrants | 12/24/13 | $ 0* |
Blue Apron, Inc. Series D | 5/18/15 | $ 10,400 |
BLUE BOTTLE Coffee, Inc. Series C | 5/29/15 | $ 21,086 |
Cloudera, Inc. Series F | 2/5/14 | $ 2,709 |
Cloudflare, Inc. Series D | 11/5/14 - 6/24/15 | $ 4,349 |
CytomX Therapeutics, Inc. Series D | 6/12/15 | $ 3,538 |
Dataminr, Inc. Series D | 3/6/15 | $ 3,535 |
Delphix Corp. Series D | 7/10/15 | $ 6,079 |
Dropbox, Inc. | 5/2/12 | $ 9,084 |
Gensight Biologics Series B | 7/2/15 | $ 3,266 |
Security | Acquisition Date | Acquisition Cost (000s) |
Immunocore Ltd. Series A | 7/27/15 | $ 2,122 |
Meituan Corp. Series D | 1/26/15 | $ 10,000 |
NJOY, Inc. | 9/11/13 | $ 9,520 |
NJOY, Inc. Series C | 6/7/13 | $ 4,913 |
NJOY, Inc. Series D | 2/14/14 | $ 2,524 |
Nutanix, Inc. Series E | 8/26/14 | $ 6,467 |
Oportun Finance Corp. Series H | 2/6/15 | $ 10,114 |
PAX Labs, Inc. Series C | 5/22/15 | $ 9,840 |
Pronutria Biosciences, Inc. Series C | 1/30/15 | $ 5,500 |
Snapchat, Inc. Series F | 3/25/15 | $ 20,312 |
Security | Acquisition Date | Acquisition Cost (000s) |
Space Exploration Technologies Corp. Series G | 1/20/15 | $ 7,535 |
Taboola.Com Ltd. Series E | 12/22/14 | $ 6,619 |
The Honest Co., Inc. | 8/21/14 | $ 4,062 |
The Honest Co., Inc. Series C | 8/21/14 | $ 9,479 |
Tory Burch LLC unit | 5/14/15 | $ 20,890 |
Uber Technologies, Inc. Series D, 8.00% | 6/6/14 | $ 80,000 |
Uber Technologies, Inc. Series E, 8.00% | 12/5/14 | $ 3,420 |
YourPeople, Inc. Series C | 5/1/15 | $ 10,314 |
* Amount represents less than $1,000. |
Affiliated Central Funds |
Information regarding fiscal year to date income earned by the Fund from investments in Fidelity Central Funds is as follows: |
Fund | Income earned
(Amounts in thousands) |
Fidelity Cash Central Fund | $ 52 |
Fidelity Securities Lending Cash Central Fund | 7,635 |
Total | $ 7,687 |
Other Affiliated Issuers |
An affiliated company is a company in which the Fund has ownership of at least 5% of the voting securities. Fiscal year to date transactions with companies which are or were affiliates are as follows: |
Affiliate
(Amounts in thousands) | Value,
beginning of
period | Purchases | Sales
Proceeds* | Dividend
Income | Value,
end of
period |
Nu Skin Enterprises, Inc. Class A | $ - | $ 199,704 | $ 13,224 | $ 1,500 | $ 134,517 |
Parsvnath Developers Ltd. | 9,495 | - | - | - | 6,516 |
Total | $ 9,495 | $ 199,704 | $ 13,224 | $ 1,500 | $ 141,033 |
* Includes the value of securities delivered through in-kind transactions, if applicable. |
Other Information |
The following is a summary of the inputs used, as of July 31, 2015, involving the Fund's assets and liabilities carried at fair value. The inputs or methodology used for valuing securities may not be an indication of the risk associated with investing in those securities. For more information on valuation inputs, and their aggregation into the levels used in the tables below, please refer to the Investment Valuation section in the accompanying Notes to Financial Statements. |
Valuation Inputs at Reporting Date: |
Description
(Amounts in thousands) | Total | Level 1 | Level 2 | Level 3 |
Investments in Securities: | | | | |
Equities: | | | | |
Consumer Discretionary | $ 5,294,107 | $ 5,193,011 | $ 44,640 | $ 56,456 |
Consumer Staples | 2,081,797 | 2,016,220 | 24,251 | 41,326 |
Energy | 259,620 | 259,620 | - | - |
Financials | 907,005 | 868,924 | 12,923 | 25,158 |
Health Care | 3,826,416 | 3,806,507 | 4,700 | 15,209 |
Industrials | 1,175,987 | 1,152,335 | - | 23,652 |
Information Technology | 7,264,779 | 6,906,812 | 59,247 | 298,720 |
Materials | 396,314 | 396,314 | - | - |
Telecommunication Services | 34,619 | 34,619 | - | - |
Utilities | 7,204 | 5,508 | 1,696 | - |
Money Market Funds | 542,079 | 542,079 | - | - |
Total Investments in Securities: | $ 21,789,927 | $ 21,181,949 | $ 147,457 | $ 460,521 |
(Amounts in thousands) | |
Investments in Securities: | |
Equities - Information Technology | |
Beginning Balance | $ 106,211 |
Net Realized Gain (Loss) on Investment Securities | - |
Net Unrealized Gain (Loss) on Investment Securities | 128,201 |
Cost of Purchases | 68,732 |
Proceeds of Sales | (4,424) |
Amortization/Accretion | - |
Transfers into Level 3 | - |
Transfers out of Level 3 | - |
Ending Balance | $ 298,720 |
The change in unrealized gain (loss) for the period attributable to Level 3 securities held at July 31, 2015 | $ 127,904 |
Equities - Other Investments in Securities | |
Beginning Balance | $ 40,051 |
Net Realized Gain (Loss) on Investment Securities | - |
Net Unrealized Gain (Loss) on Investment Securities | (24,069) |
Cost of Purchases | 145,819 |
Proceeds of Sales | - |
Amortization/Accretion | - |
Transfers into Level 3 | - |
Transfers out of Level 3 | - |
Ending Balance | $ 161,801 |
The change in unrealized gain (loss) for the period attributable to Level 3 securities held at July 31, 2015 | $ (24,069) |
The information used in the above reconciliations represents fiscal year to date activity for any Investments in Securities identified as using Level 3 inputs at either the beginning or the end of the current fiscal period. Transfers in or out of Level 3 represent the beginning value of any Security or Instrument where a change in the pricing level occurred from the beginning to the end of the period. The cost of purchases and the proceeds of sales may include securities received or delivered through corporate actions or exchanges. Realized and unrealized gains (losses) disclosed in the reconciliations are included in Net Gain (Loss) on the Fund's Statement of Operations. |
Distribution of investments by country or territory of incorporation, as a percentage of total net assets, is as follows (Unaudited): |
United States of America | 87.5% |
Ireland | 2.6% |
Cayman Islands | 2.0% |
Netherlands | 1.6% |
Canada | 1.5% |
Others (Individually Less Than 1%) | 4.8% |
| 100.0% |
See accompanying notes which are an integral part of the financial statements.
Annual Report
Statement of Assets and Liabilities
Amounts in thousands (except per-share amounts) | | July 31, 2015 |
| | |
Assets | | |
Investment in securities, at value (including securities loaned of $478,533) - See accompanying schedule: Unaffiliated issuers (cost $13,600,342) | $ 21,106,815 | |
Fidelity Central Funds (cost $542,079) | 542,079 | |
Other affiliated issuers (cost $213,758) | 141,033 | |
Total Investments (cost $14,356,179) | | $ 21,789,927 |
Receivable for investments sold | | 125,584 |
Receivable for fund shares sold | | 21,725 |
Dividends receivable | | 4,666 |
Distributions receivable from Fidelity Central Funds | | 535 |
Other receivables | | 988 |
Total assets | | 21,943,425 |
| | |
Liabilities | | |
Payable to custodian bank | $ 3,353 | |
Payable for investments purchased | 159,997 | |
Payable for fund shares redeemed | 29,972 | |
Accrued management fee | 12,521 | |
Other affiliated payables | 2,353 | |
Other payables and accrued expenses | 2,373 | |
Collateral on securities loaned, at value | 488,640 | |
Total liabilities | | 699,209 |
| | |
Net Assets | | $ 21,244,216 |
Net Assets consist of: | | |
Paid in capital | | $ 12,894,155 |
Undistributed net investment income | | 9,347 |
Accumulated undistributed net realized gain (loss) on investments and foreign currency transactions | | 908,422 |
Net unrealized appreciation (depreciation) on investments and assets and liabilities in foreign currencies | | 7,432,292 |
Net Assets | | $ 21,244,216 |
Blue Chip Growth: | | |
Net Asset Value, offering price and redemption price per share ($15,345,898 ÷ 203,930 shares) | | $ 75.25 |
| | |
Class K: | | |
Net Asset Value, offering price and redemption price per share ($5,898,318 ÷ 78,265 shares) | | $ 75.36 |
See accompanying notes which are an integral part of the financial statements.
Annual Report
Statement of Operations
Amounts in thousands | Year ended July 31, 2015 |
| | |
Investment Income | | |
Dividends (including $1,500 earned from other affiliated issuers) | | $ 176,596 |
Income from Fidelity Central Funds | | 7,687 |
Total income | | 184,283 |
| | |
Expenses | | |
Management fee | | |
Basic fee | $ 105,459 | |
Performance adjustment | 31,633 | |
Transfer agent fees | 24,727 | |
Accounting and security lending fees | 1,743 | |
Custodian fees and expenses | 340 | |
Independent trustees' compensation | 82 | |
Registration fees | 326 | |
Audit | 97 | |
Legal | 42 | |
Interest | 4 | |
Miscellaneous | 117 | |
Total expenses before reductions | 164,570 | |
Expense reductions | (888) | 163,682 |
Net investment income (loss) | | 20,601 |
Realized and Unrealized Gain (Loss) Net realized gain (loss) on: | | |
Investment securities: | | |
Unaffiliated issuers | 1,234,669 | |
Other affiliated issuers | (3,573) | |
Foreign currency transactions | (793) | |
Total net realized gain (loss) | | 1,230,303 |
Change in net unrealized appreciation (depreciation) on: Investment securities (net of increase in deferred foreign taxes of $20) | 2,175,458 | |
Assets and liabilities in foreign currencies | (39) | |
Total change in net unrealized appreciation (depreciation) | | 2,175,419 |
Net gain (loss) | | 3,405,722 |
Net increase (decrease) in net assets resulting from operations | | $ 3,426,323 |
See accompanying notes which are an integral part of the financial statements.
Annual Report
Financial Statements - continued
Statement of Changes in Net Assets
Amounts in thousands | Year ended
July 31,
2015 | Year ended
July 31,
2014 |
Increase (Decrease) in Net Assets | | |
Operations | | |
Net investment income (loss) | $ 20,601 | $ 47,516 |
Net realized gain (loss) | 1,230,303 | 4,690,305 |
Change in net unrealized appreciation (depreciation) | 2,175,419 | (1,368,277) |
Net increase (decrease) in net assets resulting from operations | 3,426,323 | 3,369,544 |
Distributions to shareholders from net investment income | (27,789) | (80,757) |
Distributions to shareholders from net realized gain | (1,011,245) | (1,378,625) |
Total distributions | (1,039,034) | (1,459,382) |
Share transactions - net increase (decrease) | 2,274,956 | (5,511,393) |
Total increase (decrease) in net assets | 4,662,245 | (3,601,231) |
| | |
Net Assets | | |
Beginning of period | 16,581,971 | 20,183,202 |
End of period (including undistributed net investment income of $9,347 and undistributed net investment income of $17,541, respectively) | $ 21,244,216 | $ 16,581,971 |
See accompanying notes which are an integral part of the financial statements.
Annual Report
Financial Highlights - Blue Chip Growth
Years ended July 31, | 2015 | 2014 | 2013 | 2012 | 2011 |
Selected Per-Share Data | | | | | |
Net asset value, beginning of period | $ 66.72 | $ 59.65 | $ 47.38 | $ 48.17 | $ 37.63 |
Income from Investment Operations | | | | | |
Net investment income (loss) B | .05 | .15 | .39 | .10 | (.03) |
Net realized and unrealized gain (loss) | 12.56 | 11.63 | 12.79 | .75 | 10.61 |
Total from investment operations | 12.61 | 11.78 | 13.18 | .85 | 10.58 |
Distributions from net investment income | (.09) | (.24) | (.23) | (.04) | .00 E, G |
Distributions from net realized gain | (3.99) | (4.47) | (.68) | (1.60) | (.04) E |
Total distributions | (4.08) | (4.71) | (.91) | (1.64) | (.04) |
Net asset value, end of period | $ 75.25 | $ 66.72 | $ 59.65 | $ 47.38 | $ 48.17 |
Total Return A | 19.72% | 21.07% | 28.25% | 2.27% | 28.12% |
Ratios to Average Net Assets C, F | | | | | |
Expenses before reductions | .89% | .80% | .76% | .90% | .94% |
Expenses net of fee waivers, if any | .89% | .80% | .76% | .90% | .94% |
Expenses net of all reductions | .88% | .80% | .74% | .89% | .92% |
Net investment income (loss) | .07% | .23% | .75% | .21% | (.06)% |
Supplemental Data | | | | | |
Net assets, end of period (in millions) | $ 15,346 | $ 11,970 | $ 12,927 | $ 10,595 | $ 12,024 |
Portfolio turnover rate D | 51% H | 57% H | 75% | 95% | 132% |
A Total returns would have been lower if certain expenses had not been reduced during the applicable periods shown.
B Calculated based on average shares outstanding during the period.
C Fees and expenses of any underlying Fidelity Central Funds are not included in the Fund's expense ratio. The Fund indirectly bears its proportionate share of the expenses of any underlying Fidelity Central Funds.
D Amount does not include the portfolio activity of any underlying Fidelity Central Funds.
E The amounts shown reflect certain reclassifications related to book to tax differences that were made in the year shown.
F Expense ratios reflect operating expenses of the class. Expenses before reductions do not reflect amounts reimbursed by the investment adviser or reductions from brokerage service arrangements or reductions from other expense offset arrangements and do not represent the amount paid by the class during periods when reimbursements or reductions occur. Expenses net of fee waivers reflect expenses after reimbursement by the investment adviser but prior to reductions from brokerage service arrangements or other expense offset arrangements. Expenses net of all reductions represent the net expenses paid by the class.
G Amount represents less than $.01 per share.
H Portfolio turnover rate excludes securities received or delivered in-kind.
See accompanying notes which are an integral part of the financial statements.
Annual Report
Financial Highlights - Class K
Years ended July 31, | 2015 | 2014 | 2013 | 2012 | 2011 |
Selected Per-Share Data | | | | | |
Net asset value, beginning of period | $ 66.82 | $ 59.74 | $ 47.46 | $ 48.21 | $ 37.66 |
Income from Investment Operations | | | | | |
Net investment income (loss) B | .13 | .23 | .47 | .17 | .05 |
Net realized and unrealized gain (loss) | 12.57 | 11.64 | 12.79 | .75 | 10.62 |
Total from investment operations | 12.70 | 11.87 | 13.26 | .92 | 10.67 |
Distributions from net investment income | (.17) | (.33) | (.30) | (.08) | (.05) E |
Distributions from net realized gain | (3.99) | (4.47) | (.68) | (1.60) | (.07) E |
Total distributions | (4.16) | (4.79) I | (.98) | (1.67) H | (.12) |
Net asset value, end of period | $ 75.36 | $ 66.82 | $ 59.74 | $ 47.46 | $ 48.21 |
Total ReturnA | 19.84% | 21.23% | 28.42% | 2.43% | 28.37% |
Ratios to Average Net Assets C, F | | | | | |
Expenses before reductions | .78% | .68% | .61% | .74% | .77% |
Expenses net of fee waivers, if any | .77% | .68% | .61% | .74% | .77% |
Expenses net of all reductions | .77% | .67% | .60% | .73% | .76% |
Net investment income (loss) | .19% | .36% | .89% | .37% | .11% |
Supplemental Data | | | | | |
Net assets, end of period (in millions) | $ 5,898 | $ 4,612 | $ 3,506 | $ 2,467 | $ 1,455 |
Portfolio turnover rateD | 51% G | 57% G | 75% | 95% | 132% |
A Total returns would have been lower if certain expenses had not been reduced during the applicable periods shown.
B Calculated based on average shares outstanding during the period.
C Fees and expenses of any underlying Fidelity Central Funds are not included in the Fund's expense ratio. The Fund indirectly bears its proportionate share of the expenses of any underlying Fidelity Central Funds.
D Amount does not include the portfolio activity of any underlying Fidelity Central Funds.
E The amounts shown reflect certain reclassifications related to book to tax differences that were made in the year shown.
F Expense ratios reflect operating expenses of the class. Expenses before reductions do not reflect amounts reimbursed by the investment adviser or reductions from brokerage service arrangements or reductions from other expense offset arrangements and do not represent the amount paid by the class during periods when reimbursements or reductions occur. Expenses net of fee waivers reflect expenses after reimbursement by the investment adviser but prior to reductions from brokerage service arrangements or other expense offset arrangements. Expenses net of all reductions represent the net expenses paid by the class.
G Portfolio turnover rate excludes securities received or delivered in-kind.
H Total distributions of $1.67 per share is comprised of distributions from net investment income of $.076 and distributions from net realized gain of $1.598 per share.
I Total distributions of $4.79 per share is comprised of distributions from net investment income of $.325 and distributions from net realized gain of $4.466 per share.
See accompanying notes which are an integral part of the financial statements.
Annual Report
For the period ended July 31, 2015
(Amounts in thousands except percentages)
1. Organization.
Fidelity Blue Chip Growth Fund (the Fund) is a fund of Fidelity Securities Fund (the Trust) and is authorized to issue an unlimited number of shares. The Trust is registered under the Investment Company Act of 1940, as amended (the 1940 Act), as an open-end management investment company organized as a Massachusetts business trust. The Fund offers Blue Chip Growth and Class K shares, each of which has equal rights as to assets and voting privileges. The Fund offered Class F shares during the period June 26, 2009 through November 19, 2013, and all outstanding shares were redeemed by November 19, 2013. Each class has exclusive voting rights with respect to matters that affect that class.
2. Investments in Fidelity Central Funds.
The Fund invests in Fidelity Central Funds, which are open-end investment companies generally available only to other investment companies and accounts managed by the investment adviser and its affiliates. The Fund's Schedule of Investments lists each of the Fidelity Central Funds held as of period end, if any, as an investment of the Fund, but does not include the underlying holdings of each Fidelity Central Fund. As an Investing Fund, the Fund indirectly bears its proportionate share of the expenses of the underlying Fidelity Central Funds.
The Money Market Central Funds seek preservation of capital and current income and are managed by Fidelity Investments Money Management, Inc. (FIMM), an affiliate of the investment adviser. Annualized expenses of the Money Market Central Funds as of their most recent shareholder report date are less than .01%.
A complete unaudited list of holdings for each Fidelity Central Fund is available upon request or at the Securities and Exchange Commission (the SEC) website at www.sec.gov. In addition, the financial statements of the Fidelity Central Funds, which are not covered by the Fund's Report of Independent Registered Public Accounting Firm, are available on the SEC website or upon request.
3. Significant Accounting Policies.
The financial statements have been prepared in conformity with accounting principles generally accepted in the United States of America (GAAP), which require management to make certain estimates and assumptions at the date of the financial statements. Actual results could differ from those estimates. Subsequent events, if any, through the date that the financial statements were issued have been evaluated in the preparation of
Annual Report
Notes to Financial Statements - continued
(Amounts in thousands except percentages)
3. Significant Accounting Policies - continued
the financial statements. The following summarizes the significant accounting policies of the Fund:
Investment Valuation. Investments are valued as of 4:00 p.m. Eastern time on the last calendar day of the period. The Board of Trustees (the Board) has delegated the day to day responsibility for the valuation of the Fund's investments to the Fidelity Management & Research Company (FMR) Fair Value Committee (the Committee). In accordance with valuation policies and procedures approved by the Board, the Fund attempts to obtain prices from one or more third party pricing vendors or brokers to value its investments. When current market prices, quotations or currency exchange rates are not readily available or reliable, investments will be fair valued in good faith by the Committee, in accordance with procedures adopted by the Board. Factors used in determining fair value vary by investment type and may include market or investment specific events. The frequency with which these procedures are used cannot be predicted and they may be utilized to a significant extent. The Committee oversees the Fund's valuation policies and procedures and reports to the Board on the Committee's activities and fair value determinations. The Board monitors the appropriateness of the procedures used in valuing the Fund's investments and ratifies the fair value determinations of the Committee.
The Fund categorizes the inputs to valuation techniques used to value its investments into a disclosure hierarchy consisting of three levels as shown below:
Level 1 - quoted prices in active markets for identical investments
Level 2 - other significant observable inputs (including quoted prices for similar investments, interest rates, prepayment speeds, etc.)
Level 3 - unobservable inputs (including the Fund's own assumptions based on the best information available)
Valuation techniques used to value the Fund's investments by major category are as follows:
Equity securities, including restricted securities, for which market quotations are readily available, are valued at the last reported sale price or official closing price as reported by a third party pricing vendor on the primary market or exchange on which they are traded and are categorized as Level 1 in the hierarchy. In the event there were no sales during the day or closing prices are not available, securities are valued at the last quoted bid price or may be valued using the last available price and are generally categorized as Level 2 in the hierarchy. For foreign equity securities, when market or security specific events arise, comparisons to the valuation of American Depositary Receipts (ADRs),
Annual Report
3. Significant Accounting Policies - continued
Investment Valuation - continued
futures contracts, Exchange-Traded Funds (ETFs) and certain indexes as well as quoted prices for similar securities may be used and would be categorized as Level 2 in the hierarchy. Utilizing these techniques may result in transfers between Level 1 and Level 2. For equity securities, including restricted securities, where observable inputs are limited, assumptions about market activity and risk are used and these securities may be categorized as Level 3 in the hierarchy.
Investments in open-end mutual funds, including the Fidelity Central Funds, are valued at their closing net asset value (NAV) each business day and are categorized as Level 1 in the hierarchy.
The following provides information on Level 3 securities held by the Fund that were valued at period end based on unobservable inputs. These amounts exclude valuations provided by a broker.
Asset Type | Fair Value at 07/31/15 | Valuation
Technique(s) | Unobservable
Input | Amount or Range/Weighted Average | Impact to
Valuation from
an Increase
in Input* |
Equities | $ 460,521 | Adjusted transaction price | Proxy movement | 2.0% | Increase |
| | Black scholes | Discount for lack of marketability | 10.0% | Decrease |
| | Expected distribution | Recovery rate | 0.0% | Increase |
| | Last transaction price | Transaction price | $0.00 - $120.93 / $37.34 | Increase |
| | | Discount rate | 15.0% | Decrease |
| | | Put premium | 38.0% | Increase |
| | Market comparable | Discount rate | 10.0% - 30.0% / 17.1% | Decrease |
| | | EV/Sales multiple | 2.2 - 7.9 / 6.7 | Increase |
| | | EV/GMV multiple | 0.4 | Increase |
| | | Discount for lack of marketability | 15.0% | Decrease |
| | | Premium rate | 15.0% | Increase |
| | | P/E multiple | 14.0 | Increase |
* Represents the expected directional change in the fair value of the level 3 investments that would result from an increase in the corresponding input. A decrease to the unobservable input would have the opposite effect. Significant changes in these inputs could result in significant higher or lower fair value measurements.
Annual Report
Notes to Financial Statements - continued
(Amounts in thousands except percentages)
3. Significant Accounting Policies - continued
Investment Valuation - continued
Changes in valuation techniques may result in transfers in or out of an assigned level within the disclosure hierarchy. The aggregate value of investments by input level as of July 31, 2015, as well as a roll forward of Level 3 investments, is included at the end of the Fund's Schedule of Investments.
Foreign Currency. The Fund may use foreign currency contracts to facilitate transactions in foreign-denominated securities. Gains and losses from these transactions may arise from changes in the value of the foreign currency or if the counterparties do not perform under the contracts' terms.
Foreign-denominated assets, including investment securities, and liabilities are translated into U.S. dollars at the exchange rates at period end. Purchases and sales of investment securities, income and dividends received and expenses denominated in foreign currencies are translated into U.S. dollars at the exchange rate in effect on the transaction date.
The effects of exchange rate fluctuations on investments are included with the net realized and unrealized gain (loss) on investment securities. Other foreign currency transactions resulting in realized and unrealized gain (loss) are disclosed separately.
Investment Transactions and Income. For financial reporting purposes, the Fund's investment holdings and NAV include trades executed through the end of the last business day of the period. The NAV per share for processing shareholder transactions is calculated as of the close of business of the New York Stock Exchange (NYSE), normally 4:00 p.m. Eastern time and includes trades executed through the end of the prior business day. Gains and losses on securities sold are determined on the basis of identified cost and may include proceeds received from litigation. Dividend income is recorded on the ex-dividend date, except for certain dividends from foreign securities where the ex-dividend date may have passed, which are recorded as soon as the Fund is informed of the ex-dividend date. Non-cash dividends included in dividend income, if any, are recorded at the fair market value of the securities received. Income and capital gain distributions from Fidelity Central Funds, if any, are recorded on the ex-dividend date. Distributions received on securities that represent a return of capital or capital gain are recorded as a reduction of cost of investments and/or as a realized gain. Subsequent to ex-dividend date the Fund determines the components of these distributions, based upon receipt of tax filings or other correspondence relating to the underlying investment. Investment income is recorded net of foreign taxes withheld where recovery of such taxes is uncertain.
Annual Report
3. Significant Accounting Policies - continued
Class Allocations and Expenses. Investment income, realized and unrealized capital gains and losses, common expenses of the Fund, and certain fund-level expense reductions, if any, are allocated daily on a pro-rata basis to each class based on the relative net assets of each class to the total net assets of the Fund. Each class differs with respect to transfer agent fees incurred. Certain expense reductions may also differ by class. For the reporting period, the allocated portion of income and expenses to each class as a percent of its average net assets may vary due to the timing of recording these transactions in relation to fluctuating net assets of the classes. Expenses directly attributable to a fund are charged to that fund. Expenses attributable to more than one fund are allocated among the respective funds on the basis of relative net assets or other appropriate methods. Expense estimates are accrued in the period to which they relate and adjustments are made when actual amounts are known.
Deferred Trustee Compensation. Under a Deferred Compensation Plan (the Plan), independent Trustees may elect to defer receipt of a portion of their annual compensation. Deferred amounts are invested in a cross-section of Fidelity funds, are marked-to-market and remain in the Fund until distributed in accordance with the Plan. The investment of deferred amounts and the offsetting payable to the Trustees are included in the accompanying Statement of Assets and Liabilities.
Income Tax Information and Distributions to Shareholders. Each year, the Fund intends to qualify as a regulated investment company under Subchapter M of the Internal Revenue Code, including distributing substantially all of its taxable income and realized gains. As a result, no provision for U.S. Federal income taxes is required. As of July 31, 2015, the Fund did not have any unrecognized tax benefits in the financial statements; nor is the Fund aware of any tax positions for which it is reasonably possible that the total amounts of unrecognized tax benefits will significantly change in the next twelve months. The Fund files a U.S. federal tax return, in addition to state and local tax returns as required. The Fund's federal income tax returns are subject to examination by the Internal Revenue Service (IRS) for a period of three fiscal years after they are filed. State and local tax returns may be subject to examination for an additional fiscal year depending on the jurisdiction. Foreign taxes are provided for based on the Fund's understanding of the tax rules and rates that exist in the foreign markets in which it invests. The Fund is subject to a tax imposed on capital gains by certain countries in which it invests. An estimated deferred tax liability for net unrealized appreciation on the applicable securities is included in Other payables and accrued expenses on the Statement of Assets & Liabilities.
Annual Report
Notes to Financial Statements - continued
(Amounts in thousands except percentages)
3. Significant Accounting Policies - continued
Income Tax Information and Distributions to Shareholders - continued
Distributions are declared and recorded on the ex-dividend date. Income dividends and capital gain distributions are declared separately for each class. Income and capital gain distributions are determined in accordance with income tax regulations, which may differ from GAAP. In addition, the Fund claimed a portion of the payment made to redeeming shareholders as a distribution for income tax purposes.
Capital accounts within the financial statements are adjusted for permanent book-tax differences. These adjustments have no impact on net assets or the results of operations. Capital accounts are not adjusted for temporary book-tax differences which will reverse in a subsequent period.
Book-tax differences are primarily due to foreign currency transactions, passive foreign investment companies (PFIC), redemptions in kind, partnerships, deferred trustees compensation and losses deferred due to wash sales.
The federal tax cost of investment securities and unrealized appreciation (depreciation) as of period end were as follows:
Gross unrealized appreciation | $ 7,806,934 |
Gross unrealized depreciation | (441,334) |
Net unrealized appreciation (depreciation) on securities | $ 7,365,600 |
| |
Tax Cost | $ 14,424,327 |
The tax-based components of distributable earnings as of period end were as follows:
Undistributed ordinary income | $ 10,114 |
Undistributed long-term capital gain | $ 976,571 |
Net unrealized appreciation (depreciation) on securities and other investments | $ 7,365,612 |
The tax character of distributions paid was as follows:
| July 31, 2015 | July 31, 2014 |
Ordinary Income | $ 90,358 | $ 155,664 |
Long-term Capital Gains | 948,676 | 1,303,718 |
Total | $ 1,039,034 | $ 1,459,382 |
Annual Report
3. Significant Accounting Policies - continued
Restricted Securities. The Fund may invest in securities that are subject to legal or contractual restrictions on resale. These securities generally may be resold in transactions exempt from registration or to the public if the securities are registered. Disposal of these securities may involve time-consuming negotiations and expense, and prompt sale at an acceptable price may be difficult. Information regarding restricted securities is included at the end of the Fund's Schedule of Investments.
4. Purchases and Sales of Investments.
Purchases and sales of securities, other than short-term securities and in-kind-transactions, aggregated $11,170,396 and $9,789,224, respectively.
Redemptions In-Kind. During the period, 1,878 shares of the Fund held by unaffiliated entities were redeemed for cash and investments with a value of $137,687. The net realized gain of $67,543 on investments delivered through in-kind redemptions is included in the accompanying Statement of Operations. The amount of in-kind redemptions is included in share transactions in the accompanying Statement of Changes in Net Assets as well as Note 10: Share Transactions. The Fund recognized no gain or loss for federal income tax purposes.
5. Fees and Other Transactions with Affiliates.
Management Fee. Fidelity Management & Research Company (the investment adviser) and its affiliates provide the Fund with investment management related services for which the Fund pays a monthly management fee. The management fee is the sum of an individual fund fee rate that is based on an annual rate of .30% of the Fund's average net assets and an annualized group fee rate that averaged .25% during the period. The group fee rate is based upon the average net assets of all the mutual funds advised by the investment adviser, including any mutual funds previously advised by the investment adviser that are currently advised by Fidelity SelectCo, LLC, an affiliate of the investment adviser. The group fee rate decreases as assets under management increase and increases as assets under management decrease. In addition, the management fee is subject to a performance adjustment (up to a maximum of ±.20% of the Fund's average net assets over a 36 month performance period). The upward or downward adjustment to the management fee is based on the relative investment performance of Blue Chip Growth as compared to its benchmark index, the Russell 1000 Growth Index, over the same 36 month performance period. For the reporting period, the total annual management fee rate, including the performance adjustment, was .71% of the Fund's average net assets. The performance adjustment included in the management fee rate may be higher or lower than the maximum performance adjustment rate due to the difference between the average net assets for the reporting and performance periods.
Annual Report
Notes to Financial Statements - continued
(Amounts in thousands except percentages)
5. Fees and Other Transactions with Affiliates - continued
Transfer Agent Fees. Fidelity Investments Institutional Operations Company, Inc., (FIIOC), an affiliate of the investment adviser, is the transfer, dividend disbursing and shareholder servicing agent for each class of the Fund. FIIOC receives account fees and asset-based fees that vary according to the account size and type of account of the shareholders of Blue Chip Growth, except for Class K. FIIOC receives an asset-based fee of Class K's average net assets. FIIOC pays for typesetting, printing and mailing of shareholder reports, except proxy statements.
For the period, transfer agent fees for each class were as follows:
| Amount | % of
Class-Level Average
Net Assets |
Blue Chip Growth | $ 22,117 | .16 |
Class K | 2,610 | .05 |
| $ 24,727 | |
Accounting and Security Lending Fees. Fidelity Service Company, Inc. (FSC), an affiliate of the investment adviser, maintains the Fund's accounting records. The accounting fee is based on the level of average net assets for each month. Under a separate contract, FSC administers the security lending program. The security lending fee is based on the number and duration of lending transactions.
Brokerage Commissions. The Fund placed a portion of its portfolio transactions with brokerage firms which are affiliates of the investment adviser. Brokerage commissions are included in net realized gain (loss) and change in net unrealized appreciation (depreciation) in the Consolidated Statement of Operations. The commissions paid to these affiliated firms were $154 for the period.
Interfund Lending Program. Pursuant to an Exemptive Order issued by the SEC, the Fund, along with other registered investment companies having management contracts with FMR or other affiliated entities of FMR, may participate in an interfund lending program. This program provides an alternative credit facility allowing the funds to borrow from, or lend money to, other participating affiliated funds. At period end, there were no interfund loans outstanding. The Fund's activity in this program during the period for which loans were outstanding was as follows:
Borrower or Lender | Average Loan
Balance | Weighted Average
Interest Rate | Interest Expense |
Borrower | $ 20,139 | .34% | $ 4 |
Annual Report
6. Committed Line of Credit.
The Fund participates with other funds managed by the investment adviser or an affiliate in a $4.25 billion credit facility (the "line of credit") to be utilized for temporary or emergency purposes to fund shareholder redemptions or for other short-term liquidity purposes. The Fund has agreed to pay commitment fees on its pro-rata portion of the line of credit, which amounted to $27 and is reflected in Miscellaneous expenses on the Statement of Operations. During the period, the Fund did not borrow on this line of credit.
7. Security Lending.
The Fund lends portfolio securities through a lending agent from time to time in order to earn additional income. For equity securities, a lending agent is used and may loan securities to certain qualified borrowers, including Fidelity Capital Markets (FCM), a broker-dealer affiliated with the Fund. On the settlement date of the loan, the Fund receives collateral (in the form of U.S. Treasury obligations, letters of credit and/or cash) against the loaned securities and maintains collateral in an amount not less than 100% of the market value of the loaned securities during the period of the loan. The market value of the loaned securities is determined at the close of business of the Fund and any additional required collateral is delivered to the Fund on the next business day. If the borrower defaults on its obligation to return the securities loaned because of insolvency or other reasons, the Fund may apply collateral received from the borrower against the obligation. The Fund may experience delays and costs in recovering the securities loaned. Any cash collateral received is invested in the Fidelity Securities Lending Cash Central Fund. The value of loaned securities and cash collateral at period end are disclosed on the Fund's Statement of Assets and Liabilities. The value of securities loaned to FCM at period end was $12,834. Security lending income represents the income earned on investing cash collateral, less rebates paid to borrowers and any lending agent fees associated with the loan, plus any premium payments received for lending certain types of securities. Security lending income is presented in the Statement of Operations as a component of income from Fidelity Central Funds. Total security lending income during the period amounted to $7,635, including $435 from securities loaned to FCM.
8. Expense Reductions.
Commissions paid to certain brokers with whom the investment adviser, or its affiliates, places trades on behalf of the Fund include an amount in addition to trade execution, which may be rebated back to the Fund to offset certain expenses. This amount totaled $512 for the period. In addition, through arrangements with the Fund's custodian, credits realized as a result of uninvested cash balances were used to reduce the Fund's expenses. During the period, these credits reduced the Fund's custody expenses by $2.
Annual Report
Notes to Financial Statements - continued
(Amounts in thousands except percentages)
8. Expense Reductions - continued
In addition, during the period the investment adviser reimbursed/waived a portion of fund-level operating expenses in the amount of $82 and a portion of class-level operating expenses as follows:
| Amount |
Blue Chip Growth | $ 292 |
9. Distributions to Shareholders.
Distributions to shareholders of each class were as follows:
Years ended July 31, | 2015 | 2014 A |
From net investment income | | |
Blue Chip Growth | $ 15,581 | $ 47,730 |
Class K | 12,208 | 19,791 |
Class F | - | 13,236 |
Total | $ 27,789 | $ 80,757 |
From net realized gain | | |
Blue Chip Growth | $ 722,639 | $ 908,543 |
Class K | 288,606 | 269,912 |
Class F | - | 200,170 |
Total | $ 1,011,245 | $ 1,378,625 |
A All Class F shares were redeemed on November 19, 2013.
10. Share Transactions.
Share transactions for each class were as follows and may contain automatic conversions between classes or exchanges between funds:
| Shares | Dollars |
Years ended July 31, | 2015 | 2014 A | 2015 | 2014 A |
Blue Chip Growth | | | | |
Shares sold | 45,258 | 30,779 | $ 3,161,935 | $ 1,939,078 |
Reinvestment of distributions | 10,699 | 16,131 | 715,067 | 933,288 |
Shares redeemed | (31,433) | (84,222)B | (2,196,025) | (5,182,185)B |
Net increase (decrease) | 24,524 | (37,312) | $ 1,680,977 | $ (2,309,819) |
Class K | | | | |
Shares sold | 26,108 | 17,861 | $ 1,808,830 | $ 1,132,520 |
Reinvestment of distributions | 4,497 | 4,984 | 300,814 | 289,703 |
Shares redeemed | (21,373)C | (12,491) | (1,515,665)C | (788,832) |
Net increase (decrease) | 9,232 | 10,354 | $ 593,979 | $ 633,391 |
Annual Report
10. Share Transactions - continued
| Shares | Dollars |
Years ended July 31, | 2015 | 2014 A | 2015 | 2014 A |
Class F | | | | |
Shares sold | - | 3,759 | $ - | $ 226,491 |
Reinvestment of distributions | - | 3,740 | - | 213,405 |
Shares redeemed | - | (70,205)B | - | (4,274,861)B |
Net increase (decrease) | - | (62,706) | $ - | $ (3,834,965) |
A All Class F shares were redeemed on November 19, 2013.
B Amount includes in-kind redemptions.
C Amount includes in-kind redemptions (See Note 4: Redemptions In-Kind).
11. Other.
The Fund's organizational documents provide former and current trustees and officers with a limited indemnification against liabilities arising in connection with the performance of their duties to the Fund. In the normal course of business, the Fund may also enter into contracts that provide general indemnifications. The Fund's maximum exposure under these arrangements is unknown as this would be dependent on future claims that may be made against the Fund. The risk of material loss from such claims is considered remote.
Annual Report
To the Trustees of Fidelity Securities Fund and Shareholders of Fidelity Blue Chip Growth Fund:
We have audited the accompanying statement of assets and liabilities of Fidelity Blue Chip Growth Fund (the Fund), a fund of Fidelity Securities Fund, including the schedule of investments, as of July 31, 2015, and the related statement of operations for the year then ended, the statement of changes in net assets for each of the two years in the period then ended, and the financial highlights for each of the five years in the period then ended. These financial statements and financial highlights are the responsibility of the Fund's management. Our responsibility is to express an opinion on these financial statements and financial highlights based on our audits.
We conducted our audits in accordance with the standards of the Public Company Accounting Oversight Board (United States). Those standards require that we plan and perform the audit to obtain reasonable assurance about whether the financial statements and financial highlights are free of material misstatement. The Fund is not required to have, nor were we engaged to perform, an audit of its internal control over financial reporting. Our audits included consideration of internal control over financial reporting as a basis for designing audit procedures that are appropriate in the circumstances, but not for the purpose of expressing an opinion on the effectiveness of the Fund's internal control over financial reporting. Accordingly, we express no such opinion. An audit also includes examining, on a test basis, evidence supporting the amounts and disclosures in the financial statements, assessing the accounting principles used and significant estimates made by management, as well as evaluating the overall financial statement presentation. Our procedures included confirmation of securities owned as of July 31, 2015, by correspondence with the custodians and brokers; when replies were not received from brokers, we performed other auditing procedures. We believe that our audits provide a reasonable basis for our opinion.
In our opinion, such financial statements and financial highlights referred to above present fairly, in all material respects, the financial position of Fidelity Blue Chip Growth Fund as of July 31, 2015, the results of its operations for the year then ended, the changes in its net assets for each of the two years in the period then ended, and the financial highlights for each of the five years in the period then ended, in conformity with accounting principles generally accepted in the United States of America.
DELOITTE & TOUCHE LLP
Boston, Massachusetts
September 24, 2015
Annual Report
The Trustees, Member of the Advisory Board, and officers of the trust and fund, as applicable, are listed below. The Board of Trustees governs the fund and is responsible for protecting the interests of shareholders. The Trustees are experienced executives who meet periodically throughout the year to oversee the fund's activities, review contractual arrangements with companies that provide services to the fund, oversee management of the risks associated with such activities and contractual arrangements, and review the fund's performance. Each of the Trustees oversees 170 funds.
The Trustees hold office without limit in time except that (a) any Trustee may resign; (b) any Trustee may be removed by written instrument, signed by at least two-thirds of the number of Trustees prior to such removal; (c) any Trustee who requests to be retired or who has become incapacitated by illness or injury may be retired by written instrument signed by a majority of the other Trustees; and (d) any Trustee may be removed at any special meeting of shareholders by a two-thirds vote of the outstanding voting securities of the trust. Each Trustee who is not an interested person (as defined in the 1940 Act) of the trust and the fund (Independent Trustee), shall retire not later than the last day of the calendar year in which his or her 75th birthday occurs. The Independent Trustees may waive this mandatory retirement age policy with respect to individual Trustees. The officers and Advisory Board Member hold office without limit in time, except that any officer and Advisory Board Member may resign or may be removed by a vote of a majority of the Trustees at any regular meeting or any special meeting of the Trustees. Except as indicated, each individual has held the office shown or other offices in the same company for the past five years.
Experience, Skills, Attributes, and Qualifications of the Fund's Trustees. The Governance and Nominating Committee has adopted a statement of policy that describes the experience, qualifications, attributes, and skills that are necessary and desirable for potential Independent Trustee candidates (Statement of Policy). The Board believes that each Trustee satisfied at the time he or she was initially elected or appointed a Trustee, and continues to satisfy, the standards contemplated by the Statement of Policy. The Governance and Nominating Committee also engages professional search firms to help identify potential Independent Trustee candidates who have the experience, qualifications, attributes, and skills consistent with the Statement of Policy. From time to time, additional criteria based on the composition and skills of the current Independent Trustees, as well as experience or skills that may be appropriate in light of future changes to board composition, business conditions, and regulatory or other developments, have also been considered by the professional search firms and the Governance and Nominating Committee. In addition, the Board takes into account the Trustees' commitment and participation in Board and committee meetings, as well as their leadership of standing and ad hoc committees throughout their tenure.
In determining that a particular Trustee was and continues to be qualified to serve as a Trustee, the Board has considered a variety of criteria, none of which, in isolation, was controlling. The Board believes that, collectively, the Trustees have balanced and diverse experience, qualifications, attributes, and skills, which allow the Board to operate effectively in governing the fund and protecting the interests of shareholders. Information about the specific experience, skills, attributes, and qualifications of each Trustee, which in each case led to the Board's conclusion that the Trustee should serve (or continue to serve) as a trustee of the fund, is provided below.
Annual Report
Board Structure and Oversight Function. James C. Curvey is an interested person (as defined in the 1940 Act) and currently serves as Chairman. The Trustees have determined that an interested Chairman is appropriate and benefits shareholders because an interested Chairman has a personal and professional stake in the quality and continuity of services provided to the fund. Independent Trustees exercise their informed business judgment to appoint an individual of their choosing to serve as Chairman, regardless of whether the Trustee happens to be independent or a member of management. The Independent Trustees have determined that they can act independently and effectively without having an Independent Trustee serve as Chairman and that a key structural component for assuring that they are in a position to do so is for the Independent Trustees to constitute a substantial majority for the Board. The Independent Trustees also regularly meet in executive session. Ned C. Lautenbach serves as Chairman of the Independent Trustees and as such (i) acts as a liaison between the Independent Trustees and management with respect to matters important to the Independent Trustees and (ii) with management prepares agendas for Board meetings.
Fidelity funds are overseen by different Boards of Trustees. The fund's Board oversees Fidelity's high income and certain equity funds and other Boards oversee Fidelity's investment-grade bond, money market, asset allocation, and sector funds. The asset allocation funds may invest in Fidelity funds overseen by the fund's Board. The use of separate Boards, each with its own committee structure, allows the Trustees of each group of Fidelity funds to focus on the unique issues of the funds they oversee, including common research, investment, and operational issues. On occasion, the separate Boards establish joint committees to address issues of overlapping consequences for the Fidelity funds overseen by each Board.
The Trustees operate using a system of committees to facilitate the timely and efficient consideration of all matters of importance to the Trustees, the fund, and fund shareholders and to facilitate compliance with legal and regulatory requirements and oversight of the fund's activities and associated risks. The Board, acting through its committees, has charged FMR and its affiliates with (i) identifying events or circumstances the occurrence of which could have demonstrably adverse effects on the fund's business and/or reputation; (ii) implementing processes and controls to lessen the possibility that such events or circumstances occur or to mitigate the effects of such events or circumstances if they do occur; and (iii) creating and maintaining a system designed to evaluate continuously business and market conditions in order to facilitate the identification and implementation processes described in (i) and (ii) above. Because the day-to-day operations and activities of the fund are carried out by or through FMR, its affiliates and other service providers, the fund's exposure to risks is mitigated but not eliminated by the processes overseen by the Trustees. While each of the Board's committees has responsibility for overseeing different aspects of the fund's activities, oversight is exercised primarily through the Operations, Audit, and Compliance Committees. In addition, the Independent Trustees have worked with FMR to enhance the Board's oversight of investment and financial risks, legal and regulatory risks, technology risks, and operational risks, including the development of additional risk reporting to the Board. For example, a working group comprised of Independent Trustees and FMR has worked and continues to work to review the Fidelity funds' valuation-related activities, reporting and risk management. Appropriate personnel, including but not limited to the fund's Chief Compliance Officer (CCO), FMR's internal auditor, the independent accountants, the fund's Treasurer and portfolio management personnel, make periodic reports to the Board's committees, as appropriate, including an annual review of FMR's risk management program for the Fidelity funds. The responsibilities of each standing committee, including their oversight responsibilities, are described further under "Standing Committees of the Fund's Trustees."
Annual Report
Trustees and Officers - continued
The fund's Statement of Additional Information (SAI) includes more information about the Trustees. To request a free copy, call Fidelity at 1-800-835-5092.
Interested Trustees*:
Correspondence intended for each Trustee who is an interested person may be sent to Fidelity Investments, 245 Summer Street, Boston, Massachusetts 02210.
Name, Year of Birth; Principal Occupations and Other Relevant Experience+ |
James C. Curvey (1935) |
Year of Election or Appointment: 2007 Trustee Chairman of the Board of Trustees |
| Mr. Curvey also serves as Trustee of other Fidelity funds. Mr. Curvey is a Director of Fidelity Research & Analysis Co. (investment adviser firm, 2009-present), and Vice Chairman (2007-present) and Director of FMR LLC (diversified financial services company). In addition, Mr. Curvey serves as an Overseer for the Boston Symphony Orchestra and a member of the board of Artis-Naples, Naples, Florida, and as a Trustee for Brewster Academy, Wolfeboro, New Hampshire. Previously, Mr. Curvey served as a Director of Fidelity Investments Money Management, Inc. (investment adviser firm, 2009-2014), a Director of FMR (investment adviser firm, 2007-2014), and a Director of FMR Co., Inc. (investment adviser firm, 2007-2014). |
Charles S. Morrison (1960) |
Year of Election or Appointment: 2014 Trustee |
| Mr. Morrison also serves as Trustee of other funds. He serves as a Director of Fidelity Investments Money Management, Inc. (FIMM) (investment adviser firm, 2014-present), Director of Fidelity SelectCo, LLC (investment adviser firm, 2014-present), President, Asset Management (2014-present), and is an employee of Fidelity Investments. Previously, Mr. Morrison served as Vice President of Fidelity's Fixed Income and Asset Allocation Funds (2012-2014), President, Fixed Income (2011-2014), Vice President of Fidelity's Money Market Funds (2005-2009), President, Money Market Group Leader of FMR (investment adviser firm, 2009), and Senior Vice President, Money Market Group of FMR (2004-2009). Mr. Morrison also served as Vice President of Fidelity's Bond Funds (2002-2005), certain Balanced Funds (2002-2005), and certain Asset Allocation Funds (2002-2007), and as Senior Vice President (2002-2005) of Fidelity's Bond Division. |
* Trustees have been determined to be "Interested Trustees" by virtue of, among other things, their affiliation with the trust or various entities under common control with FMR.
+ The information above includes each Trustee's principal occupation during the last five years and other information relating to the experience, attributes, and skills relevant to each Trustee's qualifications to serve as a Trustee, which led to the conclusion that each Trustee should serve as a Trustee for the fund.
Annual Report
Trustees and Officers - continued
Independent Trustees:
Correspondence intended for each Independent Trustee (that is, the Trustees other than the Interested Trustees) may be sent to Fidelity Investments, P.O. Box 55235, Boston, Massachusetts 02205-5235.
Name, Year of Birth; Principal Occupations and Other Relevant Experience+ |
Dennis J. Dirks (1948) |
Year of Election or Appointment: 2005 Trustee |
| Mr. Dirks also serves as Trustee of other Fidelity funds. Prior to his retirement in May 2003, Mr. Dirks was Chief Operating Officer and a member of the Board of The Depository Trust & Clearing Corporation (DTCC). He also served as President, Chief Operating Officer, and Board member of The Depository Trust Company (DTC) and President and Board member of the National Securities Clearing Corporation (NSCC). In addition, Mr. Dirks served as Chief Executive Officer and Board member of the Government Securities Clearing Corporation, Chief Executive Officer and Board member of the Mortgage-Backed Securities Clearing Corporation, as a Trustee and a member of the Finance Committee of Manhattan College (2005-2008), and as a Trustee and a member of the Finance Committee of AHRC of Nassau County (2006-2008). Mr. Dirks is a member of the Independent Directors Council (IDC) Governing Council (2010-present) and Board of Directors for The Brookville Center for Children's Services, Inc. (2009-present). |
Alan J. Lacy (1953) |
Year of Election or Appointment: 2008 Trustee |
| Mr. Lacy also serves as Trustee of other Fidelity funds. Mr. Lacy serves as a member of the Board of Directors of Dave & Buster's Entertainment, Inc. (restaurant and entertainment complexes, 2010-present) and Bristol-Myers Squibb Company (global pharmaceuticals, 2008-present). In addition, Mr. Lacy served as Senior Adviser (2007-2014) of Oak Hill Capital Partners, L.P. (private equity) and also served as Chief Executive Officer (2000-2005) and Vice Chairman (2005-2006) of Sears Holdings Corporation and Sears, Roebuck and Co. (retail). Mr. Lacy is a member of the Board of Trustees of The National Parks Conservation Association (2006-present). Previously, Mr. Lacy served as Chairman of the Board of Trustees of the National Parks Conservation Association (2008-2011) and as a member of the Board of Directors for The Western Union Company (global money transfer, 2006-2011), The Hillman Companies, Inc. (hardware wholesalers, 2010-2014), and Earth Fare, Inc. (retail grocery, 2010-2014). |
Ned C. Lautenbach (1944) |
Year of Election or Appointment: 2000 Trustee Chairman of the Independent Trustees |
| Mr. Lautenbach also serves as Trustee of other Fidelity funds. Mr. Lautenbach currently serves as the Lead Director of the Eaton Corporation Board of Directors (diversified industrial, 1997-present). Mr. Lautenbach is Chairman of the Board of Directors of Artis-Naples in Naples, Florida (2012-present), a member of the Council on Foreign Relations (1994-present), and a member of the Board of Governors, State University System of Florida (2013-present). Previously, Mr. Lautenbach was a Partner/Advisory Partner at Clayton, Dubilier & Rice, LLC (private equity investment, 1998-2010), as well as a Director of Sony Corporation (2006-2007). |
Joseph Mauriello (1944) |
Year of Election or Appointment: 2008 Trustee |
| Mr. Mauriello also serves as Trustee of other Fidelity funds. Prior to his retirement in January 2006, Mr. Mauriello served in numerous senior management positions including Deputy Chairman and Chief Operating Officer (2004-2005), and Vice Chairman of Financial Services (2002-2004) of KPMG LLP US (professional services, 1965-2005). Mr. Mauriello currently serves as a member of the Board of Directors of XL Group plc. (global insurance and re-insurance, 2006-present). Previously, Mr. Mauriello served as a Director of the Hamilton Funds of the Bank of New York (2006-2007) and of Arcadia Resources Inc. (health care services and products, 2007-2012). |
Robert W. Selander (1950) |
Year of Election or Appointment: 2011 Trustee |
| Mr. Selander also serves as Trustee of other Fidelity funds. Mr. Selander serves as a Director of The Western Union Company (global money transfer, 2014-present). Previously, Mr. Selander served as a Member of the Advisory Board of other Fidelity funds (2011), and Executive Vice Chairman (2010), Chief Executive Officer (2009-2010), and President and Chief Executive Officer (1997-2009) of Mastercard, Inc. |
Cornelia M. Small (1944) |
Year of Election or Appointment: 2005 Trustee |
| Ms. Small also serves as Trustee of other Fidelity funds. Ms. Small is a member of the Board of Directors (2009-present) and Chair of the Investment Committee (2010-present) of the Teagle Foundation. Ms. Small also serves on the Investment Committee of the Berkshire Taconic Community Foundation (2008-present). Previously, Ms. Small served as Chairperson (2002-2008) and a member of the Investment Committee and Chairperson (2008-2012) and a member of the Board of Trustees of Smith College. In addition, Ms. Small served as Chief Investment Officer, Director of Global Equity Investments, and a member of the Board of Directors of Scudder, Stevens & Clark and Scudder Kemper Investments. |
William S. Stavropoulos (1939) |
Year of Election or Appointment: 2002 Trustee Vice Chairman of the Independent Trustees |
| Mr. Stavropoulos also serves as Trustee of other Fidelity funds. Mr. Stavropoulos serves as President and Founder of the Michigan Baseball Foundation, the Great Lakes Loons (2007-present). Mr. Stavropoulos is Chairman Emeritus of the Board of Directors of The Dow Chemical Company, where he previously served in numerous senior management positions, including President, CEO (1995-2000; 2002-2004), Chairman of the Executive Committee (2000-2006), and as a member of the Board of Directors (1990-2006). Currently, Mr. Stavropoulos is Chairman of the Board of Directors of Univar Inc. (global distributor of commodity and specialty chemicals), a Director of Teradata Corporation (data warehousing and technology solutions), and Maersk Inc. (industrial conglomerate), and a member of the Advisory Board for Metalmark Capital LLC (private equity investment, 2005-present). Mr. Stavropoulos is an operating advisor to Clayton, Dubilier & Rice, LLC (private equity investment). In addition, Mr. Stavropoulos is a member of the University of Notre Dame Advisory Council for the College of Science, a Trustee of the Rollin L. Gerstacker Foundation, and a Director of the Naples Philharmonic Center for the Arts. Previously, Mr. Stavropoulos served as a Director of Chemical Financial Corporation (bank holding company, 1993-2012) and Tyco International, Ltd. (multinational manufacturing and services, 2007-2012). |
David M. Thomas (1949) |
Year of Election or Appointment: 2008 Trustee |
| Mr. Thomas also serves as Trustee of other Fidelity funds. Mr. Thomas serves as Non-Executive Chairman of the Board of Directors of Fortune Brands Home and Security (home and security products, 2011-present), as a member of the Board of Directors (2004-present) and Presiding Director (2013-present) of Interpublic Group of Companies, Inc. (marketing communication), and as a member of the Board of Trustees of the University of Florida (2013-present). Previously, Mr. Thomas served as Executive Chairman (2005-2006) and Chairman and Chief Executive Officer (2000-2005) of IMS Health, Inc. (pharmaceutical and healthcare information solutions), and a Director of Fortune Brands, Inc. (consumer products, 2000-2011). |
+ The information above includes each Trustee's principal occupation during the last five years and other information relating to the experience, attributes, and skills relevant to each Trustee's qualifications to serve as a Trustee, which led to the conclusion that each Trustee should serve as a Trustee for the fund.
Advisory Board Member and Officers:
Correspondence intended for each officer and Peter S. Lynch may be sent to Fidelity Investments, 245 Summer Street, Boston, Massachusetts 02210. Officers appear below in alphabetical order.
Name, Year of Birth; Principal Occupation |
Peter S. Lynch (1944) |
Year of Election or Appointment: 2003 Member of the Advisory Board |
| Mr. Lynch also serves as Member of the Advisory Board of other Fidelity funds. Mr. Lynch is Vice Chairman and a Director of FMR (investment adviser firm) and FMR Co., Inc. (investment adviser firm). In addition, Mr. Lynch serves as a Trustee of Boston College and as the Chairman of the Inner-City Scholarship Fund. Previously, Mr. Lynch served on the Special Olympics International Board of Directors (1997-2006). |
Elizabeth Paige Baumann (1968) |
Year of Election or Appointment: 2012 Anti-Money Laundering (AML) Officer |
| Ms. Baumann also serves as AML Officer of other funds. She is Chief AML Officer of FMR LLC (diversified financial services company, 2012-present) and is an employee of Fidelity Investments. Previously, Ms. Baumann served as Vice President and Deputy Anti-Money Laundering Officer (2007-2012). |
Marc Bryant (1966) |
Year of Election or Appointment: 2015 Secretary and Chief Legal Officer (CLO) |
| Mr. Bryant also serves as Secretary and Chief Legal Officer (CLO) of other funds. He is Senior Vice President and Deputy General Counsel of FMR LLC (diversified financial services company). Previously, Mr. Bryant served as Secretary and Chief Legal Officer of Fidelity Rutland Square Trust II (2010-2014) and Assistant Secretary of Fidelity's Fixed Income and Asset Allocation Funds (2013-2015). Prior to joining Fidelity Investments, Mr. Bryant served as a Senior Vice President and the Head of Global Retail Legal for AllianceBernstein L.P. (2006-2010), and as the General Counsel for ProFund Advisors LLC (2001-2006). |
William C. Coffey (1969) |
Year of Election or Appointment: 2009 Assistant Secretary |
| Mr. Coffey also serves as Assistant Secretary of other funds. He is Senior Vice President and Deputy General Counsel of FMR LLC (diversified financial services company, 2010-present), and is an employee of Fidelity Investments. Previously, Mr. Coffey served as Vice President and Associate General Counsel of FMR LLC (2005-2009). |
Jonathan Davis (1968) |
Year of Election or Appointment: 2010 Assistant Treasurer |
| Mr. Davis also serves as Assistant Treasurer of other funds. Mr. Davis is an employee of Fidelity Investments. Previously, Mr. Davis served as Vice President and Associate General Counsel of FMR LLC (diversified financial services company, 2003-2010). |
Adrien E. Deberghes (1967) |
Year of Election or Appointment: 2008 Deputy Treasurer |
| Mr. Deberghes also serves as an officer of other funds. He is an employee of Fidelity Investments (2008-present). Prior to joining Fidelity Investments, Mr. Deberghes was Senior Vice President of Mutual Fund Administration at State Street Corporation (2007-2008), Senior Director of Mutual Fund Administration at Investors Bank & Trust (2005-2007), and Director of Finance for Dunkin' Brands (2000-2005). |
Stephanie J. Dorsey (1969) |
Year of Election or Appointment: 2010 Assistant Treasurer |
| Ms. Dorsey also serves as an officer of other funds. She is an employee of Fidelity Investments (2008-present) and has served in other fund officer roles. Prior to joining Fidelity Investments, Ms. Dorsey served as Treasurer (2004-2008) of the JPMorgan Mutual Funds and Vice President (2004-2008) of JPMorgan Chase Bank. |
Howard J. Galligan III (1966) |
Year of Election or Appointment: 2014 Chief Financial Officer |
| Mr. Galligan also serves as Chief Financial Officer of other funds. Mr. Galligan serves as President of Fidelity Pricing and Cash Management Services (FPCMS) (2014-present) and as a Director of Strategic Advisers, Inc. (investment adviser firm, 2008-present). Previously, Mr. Galligan served as Chief Administrative Officer of Asset Management (2011-2014) and Chief Operating Officer and Senior Vice President of Investment Support for Strategic Advisers, Inc. (2003-2011). |
Scott C. Goebel (1968) |
Year of Election or Appointment: 2015 Vice President |
| Mr. Goebel serves as an officer of other funds. Mr. Goebel also serves as Secretary of Fidelity SelectCo, LLC (investment adviser firm, 2013-present), Fidelity Investments Money Management, Inc. (FIMM) (investment adviser firm, 2010-present) and Fidelity Research and Analysis Company (FRAC) (investment adviser firm, 2010-present); General Counsel, Secretary, and Senior Vice President of FMR (investment adviser firm, 2008-present) and FMR Co., Inc. (investment adviser firm, 2008-present); Chief Legal Officer of Fidelity Management & Research (Hong Kong) Limited (investment adviser firm, 2008-present); and Assistant Secretary of Fidelity Management & Research (Japan) Limited (investment adviser firm, 2008-present) and FMR Investment Management (U.K.) Limited (investment adviser firm, 2008-present). Previously, Mr. Goebel served as Secretary and CLO of certain Fidelity funds (2008-2015), Assistant Secretary of FIMM (2008-2010), FRAC (2008-2010), and certain funds (2007-2008); and as Vice President and Secretary of Fidelity Distributors Corporation (FDC) (2005-2007). Mr. Goebel has been employed by FMR LLC (diversified financial services company) or an affiliate since 2001. |
Brian B. Hogan (1964) |
Year of Election or Appointment: 2009 Vice President |
| Mr. Hogan also serves as Trustee or Vice President of other funds. Mr. Hogan serves as a Director of Fidelity SelectCo, LLC (investment adviser firm, 2014-present) and President of the Equity Division of FMR (investment adviser firm, 2009-present). Previously, Mr. Hogan served as Senior Vice President, Equity Research of FMR (2006-2009) and as a portfolio manager. |
Chris Maher (1972) |
Year of Election or Appointment: 2013 Assistant Treasurer |
| Mr. Maher serves as Assistant Treasurer of other funds. Mr. Maher is Vice President of Valuation Oversight and is an employee of Fidelity Investments. Previously, Mr. Maher served as Vice President of Asset Management Compliance (2013), Vice President of the Program Management Group of FMR (investment adviser firm, 2010-2013), and Vice President of Valuation Oversight (2008-2010). |
Melissa M. Reilly (1971) |
Year of Election or Appointment: 2014 Vice President of certain Equity Funds |
| Ms. Reilly also serves as Vice President of other funds. Ms. Reilly is an employee of Fidelity Investments (2004-present). |
Kenneth B. Robins (1969) |
Year of Election or Appointment: 2008 President and Treasurer |
| Mr. Robins also serves as an officer of other funds. Mr. Robins serves as Executive Vice President of Fidelity Investments Money Management, Inc. (FIMM) (investment adviser firm, 2013-present) and is an employee of Fidelity Investments (2004-present). Previously, Mr. Robins served in other fund officer roles. |
Stephen Sadoski (1971) |
Year of Election or Appointment: 2012 Deputy Treasurer |
| Mr. Sadoski also serves as Deputy Treasurer of other funds. He is an employee of Fidelity Investments (2012-present) and has served in another fund officer role. Prior to joining Fidelity Investments, Mr. Sadoski served as an assistant chief accountant in the Division of Investment Management of the Securities and Exchange Commission (SEC) (2009-2012) and as a senior manager at Deloitte & Touche LLP (1997-2009). |
Stacie M. Smith (1974) |
Year of Election or Appointment: 2013 Deputy Treasurer |
| Ms. Smith also serves as an officer of other funds. She is an employee of Fidelity Investments (2009-present) and has served in other fund officer roles. Prior to joining Fidelity Investments, Ms. Smith served as Senior Audit Manager of Ernst & Young LLP (1996-2009). |
Renee Stagnone (1975) |
Year of Election or Appointment: 2013 Deputy Treasurer |
| Ms. Stagnone also serves as Deputy Treasurer of other funds. Ms. Stagnone is an employee of Fidelity Investments. |
Linda J. Wondrack (1964) |
Year of Election or Appointment: 2014 Chief Compliance Officer |
| Ms. Wondrack also serves as Chief Compliance Officer of other funds. Ms. Wondrack is Executive Vice President and head of the Ethics Office and Asset Management Compliance for Fidelity Investments (2012-present). Ms. Wondrack also serves as Chief Compliance Officer of Fidelity SelectCo, LLC (investment adviser firm, 2014-present); Chief Compliance Officer of Impresa Management LLC (2013-present); and Chief Compliance Officer of FMR Co., Inc. (investment adviser firm), Fidelity Investments Money Management, Inc. (investment adviser firm), Fidelity Management & Research (Japan) Limited (investment adviser firm), FMR Investment Management (U.K.) Limited (investment adviser firm), Fidelity Management & Research (Hong Kong) (investment adviser firm), Fidelity Management & Research Company (investment adviser firm), Pyramis Global Advisors, LLC (investment adviser firm), and Strategic Advisers, Inc. (investment adviser firm), Ballyrock Investment Advisors LLC, and Northern Neck Investors LLC (2012-present). Previously, Ms. Wondrack served as Senior Vice President and Chief Compliance Officer for Columbia Management Investment Advisers, LLC (2005-2012); Chief Compliance Officer for certain funds within the Columbia Family of Funds (2007-2012); and Senior Vice President of Compliance Risk Management at Bank of America (2005-2010). |
Joseph F. Zambello (1957) |
Year of Election or Appointment: 2011 Deputy Treasurer |
| Mr. Zambello also serves as Deputy Treasurer of other funds. Mr. Zambello is an employee of Fidelity Investments. Previously, Mr. Zambello served as Vice President of the Program Management Group of FMR (investment adviser firm, 2009-2011) and Vice President of the Transfer Agent Oversight Group (2005-2009). |
Annual Report
The Board of Trustees of Fidelity Blue Chip Growth Fund voted to pay to shareholders of record at the opening of business on record date, the following distributions per share derived from capital gains realized from sales of portfolio securities; and dividends derived from net investment income:
| Pay Date | Record Date | Dividends | Capital Gains |
Class K | 09/14/15 | 09/11/15 | $0.069 | $3.444 |
The fund hereby designates as a capital gain dividend with respect to the taxable year ended July 31, 2015, $1,186,669,842, or, if subsequently determined to be different, the net capital gain of such year.
Class K designates 100% of the dividends distributed during the fiscal year as qualifying for the dividends-received deduction for corporate shareholders.
Class K designates 100% of the dividends distributed during the fiscal year as amounts which can be taken into account as a dividend for the purposes of the maximum rate under section 1(h)(11) of the Internal Revenue Code.
The fund will notify shareholders in January 2016 of amounts for use in preparing 2015 income tax returns.
Annual Report
Fidelity Blue Chip Growth Fund
Each year, the Board of Trustees, including the Independent Trustees (together, the Board), votes on the renewal of the management contract with Fidelity Management & Research Company (FMR) and the sub-advisory agreements (together, the Advisory Contracts) for the fund. The Board, assisted by the advice of fund counsel and Independent Trustees' counsel, requests and considers a broad range of information relevant to the renewal of the Advisory Contracts throughout the year.
The Board meets regularly and, at each of its meetings, covers an extensive agenda of topics and materials and considers factors that are relevant to its annual consideration of the renewal of the fund's Advisory Contracts, including the services and support provided to the fund and its shareholders. The Board has established various standing committees (Committees), each composed of and chaired by Independent Trustees with varying backgrounds, to which the Board has assigned specific subject matter responsibilities in order to enhance effective decision-making by the Board. The Board, acting directly and through its Committees, requests and receives information concerning the annual consideration of the renewal of the fund's Advisory Contracts. The Board also meets as needed to consider matters specifically related to the Board's annual consideration of the renewal of the Advisory Contracts. Members of the Board may also meet with trustees of other Fidelity funds through ad hoc joint committees to discuss certain matters relevant to all of the Fidelity funds.
At its July 2015 meeting, the Board unanimously determined to renew the fund's Advisory Contracts. In reaching its determination, the Board considered all factors it believed relevant, including (i) the nature, extent, and quality of the services to be provided to the fund and its shareholders (including the investment performance of the fund); (ii) the competitiveness of the fund's management fee and total expense ratio relative to peer funds; (iii) the total costs of the services to be provided by and the profits to be realized by Fidelity from its relationship with the fund; and (iv) the extent to which (if any) economies of scale exist and would be realized as the fund grows, and whether any economies of scale are appropriately shared with fund shareholders.
In considering whether to renew the Advisory Contracts for the fund, the Board reached a determination, with the assistance of fund counsel and Independent Trustees' counsel and through the exercise of its business judgment, that the renewal of the Advisory Contracts was in the best interests of the fund and its shareholders and that the compensation payable under the Advisory Contracts was fair and reasonable. The Board's decision to renew the Advisory Contracts was not based on any single factor, but rather was based on a comprehensive consideration of all the information provided to the Board at its meetings throughout the year. The Board, in reaching its determination to renew the Advisory Contracts, was aware that shareholders of the fund have a broad range of investment choices available to them, including a wide choice among funds offered by Fidelity's competitors, and that the fund's shareholders, who have the opportunity to review and weigh the disclosure provided by the fund in its prospectus and other public disclosures, have chosen to invest in this fund, which is part of the Fidelity family of funds.
Annual Report
Nature, Extent, and Quality of Services Provided. The Board considered Fidelity's staffing as it relates to the fund, including the backgrounds of investment personnel of Fidelity, and also considered the fund's investment objective, strategies, and related investment philosophy. The Independent Trustees also had discussions with senior management of Fidelity's investment operations and investment groups. The Board considered the structure of the portfolio manager compensation program and whether this structure provides appropriate incentives to act in the best interests of the fund. Additionally, the Board considered the portfolio managers' investments, if any, in the funds that they manage.
Resources Dedicated to Investment Management and Support Services. The Board and the Fund Oversight and Research Committees reviewed the general qualifications and capabilities of Fidelity's investment staff, including its size, education, experience, and resources, as well as Fidelity's approach to recruiting, training, managing, and compensating investment personnel. The Board noted that Fidelity has continued to increase the resources devoted to non-U.S. offices, including expansion of Fidelity's global investment organization. The Board also noted that Fidelity's analysts have extensive resources, tools and capabilities that allow them to conduct sophisticated quantitative and fundamental analysis, as well as credit analysis of issuers, counterparties and guarantors. Further, the Board considered that Fidelity's investment professionals have sufficient access to global information and data so as to provide competitive investment results over time, and that those professionals also have access to sophisticated tools that permit them to assess portfolio construction and risk and performance attribution characteristics continuously, as well as to transmit new information and research conclusions rapidly around the world. Additionally, in its deliberations, the Board considered Fidelity's trading, risk management, and compliance capabilities and resources, which are integral parts of the investment management process.
Shareholder and Administrative Services. The Board considered (i) the nature, extent, quality, and cost of advisory, administrative, and shareholder services performed by FMR, the sub-advisers (together with FMR, the Investment Advisers), and their affiliates under the Advisory Contracts and under separate agreements covering transfer agency, pricing and bookkeeping, and securities lending services for the fund; (ii) the nature and extent of the supervision of third party service providers, principally custodians and subcustodians; and (iii) the resources devoted to, and the record of compliance with, the fund's compliance policies and procedures. The Board also reviewed the allocation of fund brokerage, including allocations to brokers affiliated with the Investment Advisers, the use of brokerage commissions to pay fund expenses, and the use of "soft" commission dollars to pay for research services.
Annual Report
Board Approval of Investment Advisory Contracts and
Management Fees - continued
The Board noted that the growth of fund assets over time across the complex allows Fidelity to reinvest in the development of services designed to enhance the value or convenience of the Fidelity funds as investment vehicles. These services include 24-hour access to account information and market information through telephone representatives and over the Internet, investor education materials and asset allocation tools, and the expanded availability of Fidelity Investor Centers.
In 2014, the Board formed an ad hoc Committee on Transfer Agency Fees to review the variety of transfer agency fee structures throughout the industry and Fidelity's competitive positioning with respect to industry participants.
Investment in a Large Fund Family. The Board considered the benefits to shareholders of investing in a Fidelity fund, including the benefits of investing in a fund that is part of a large family of funds offering a variety of investment disciplines and providing a large variety of mutual fund investor services. The Board noted that Fidelity had taken, or had made recommendations that resulted in the Fidelity funds taking, a number of actions over the previous year that benefited particular funds, including (i) continuing to dedicate additional resources to investment research and to the support of the senior management team that oversees asset management; (ii) continuing efforts to enhance Fidelity's global research capabilities; (iii) launching new funds and making other enhancements to meet client needs; (iv) reducing management fees and total expenses for certain index funds and diversified international funds; (v) continuing to launch dedicated lower cost underlying funds to meet portfolio construction needs related to expanding underlying fund options for Fidelity funds of funds, specifically for the Freedom Fund product lines; (vi) rationalizing product lines and gaining increased efficiencies through fund mergers; (vii) launching active fixed-income exchange-traded funds; (viii) continuing to develop, acquire and implement systems and technology to improve services to the funds and information security and to increase efficiency; (ix) implementing investment enhancements to further strengthen Fidelity's target date product line to increase investors' probability of success in achieving their goals; (x) modifying the eligibility criteria for certain share classes to accommodate roll-over assets from employer-sponsored retirement plans; (xi) launching a new Class W of the Freedom Index Funds to attract and retain Fidelity record-kept retirement plan assets; and (xii) implementing changes to Fidelity's money market product line in response to recent money market regulatory reforms.
Investment Performance. The Board considered whether the fund has operated in accordance with its investment objective, as well as its record of compliance with its investment restrictions and its performance history.
Annual Report
The Board took into account discussions with representatives of the Investment Advisers about fund investment performance that occur at Board meetings throughout the year. In this regard the Board noted that as part of regularly scheduled fund reviews and other reports to the Board on fund performance, the Board considers annualized return information for the fund, for different time periods, measured against a securities market index ("benchmark index") and a peer group of funds with similar objectives ("peer group"), if any. In its evaluation of fund investment performance, the Board gave particular attention to information indicating changes in performance of certain Fidelity funds for specific time periods and discussed with the Investment Advisers the reasons for any overperformance or underperformance.
In addition to reviewing absolute and relative fund performance, the Independent Trustees periodically consider the appropriateness of fund performance metrics in evaluating the results achieved. In general, the Independent Trustees believe that fund performance should be evaluated based on net performance (after fees and expenses) of both the highest performing and lowest performing fund share classes, where applicable, compared to appropriate benchmark indices, over appropriate time periods that may include full market cycles, and compared to peer groups, as applicable, over the same periods, taking into account relevant factors including the following: general market conditions; issuer-specific information; and fund cash flows and other factors.
The Independent Trustees recognize that shareholders evaluate performance on a net basis over their own holding periods, for which one-, three-, and five-year periods are often used as a proxy. For this reason, the performance information reviewed by the Board also included net cumulative calendar year total return information for the fund and an appropriate benchmark index and peer group for the most recent one-, three-, and five-year periods, as shown below. Returns are shown compared to the 25th percentile (top of box, 75% beaten) and 75th percentile (bottom of box, 25% beaten) of the peer universe.
Annual Report
Board Approval of Investment Advisory Contracts and
Management Fees - continued
Fidelity Blue Chip Growth Fund
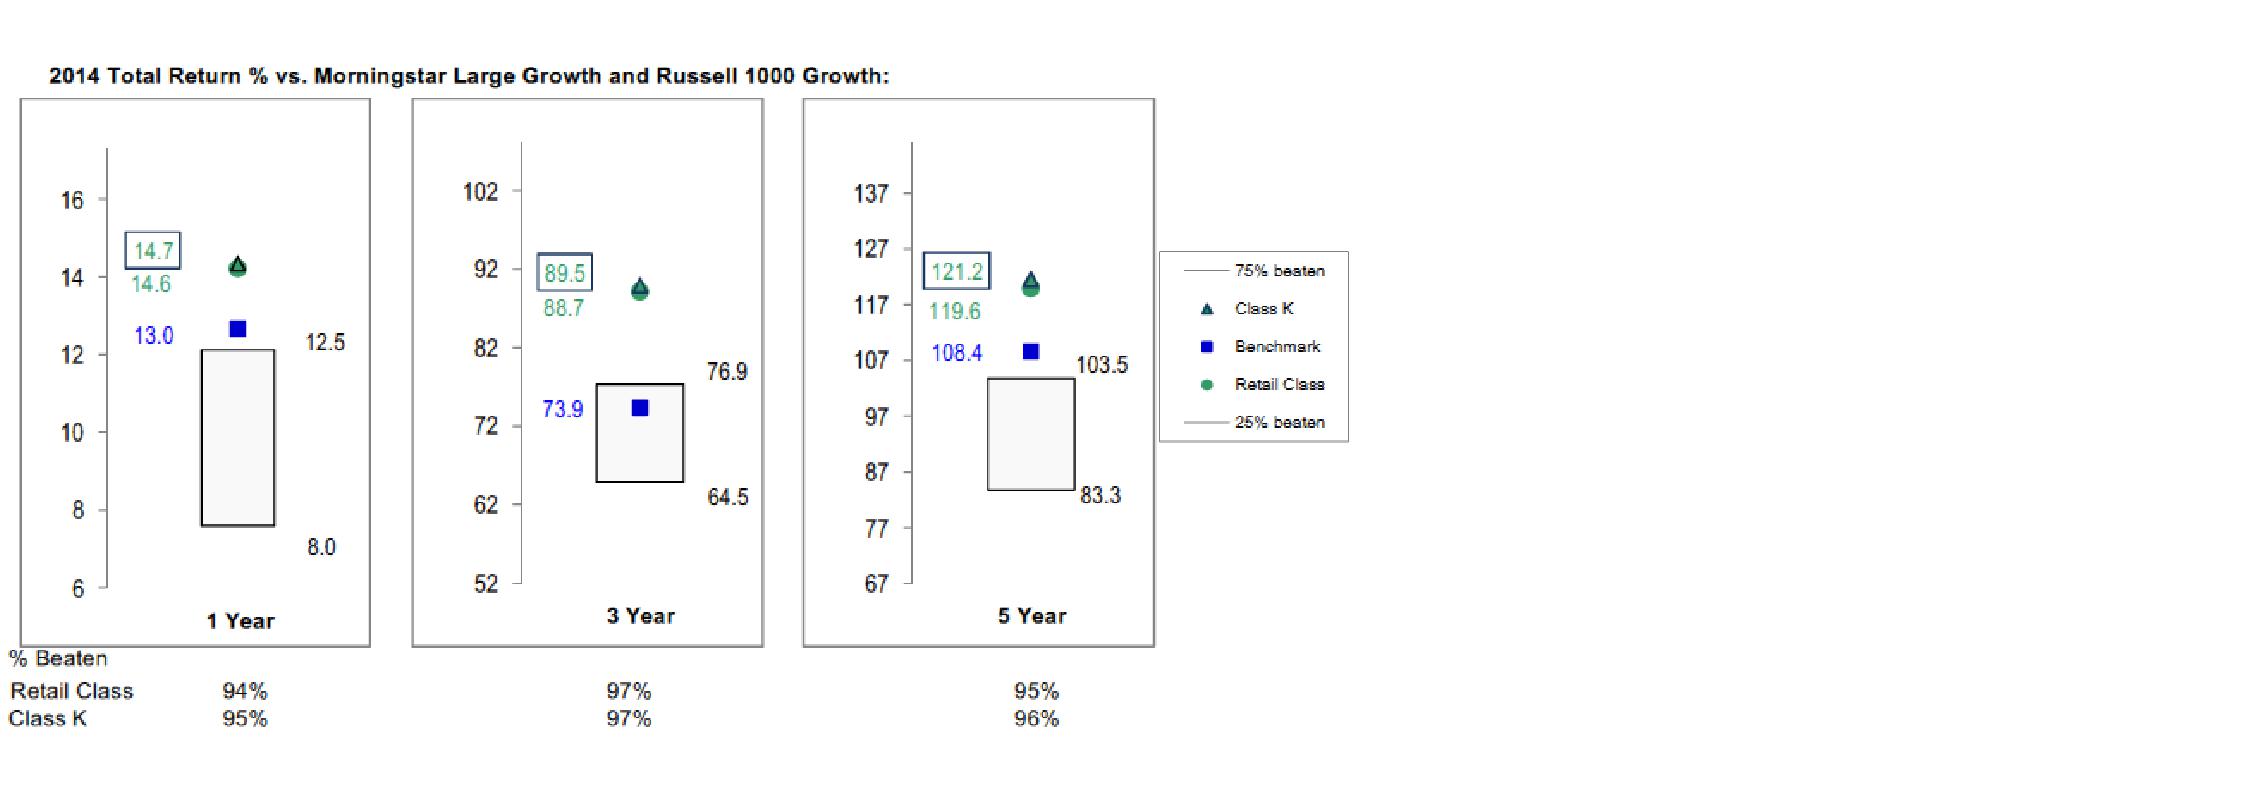
The Board also considered that the fund's management fee is subject to upward or downward adjustment depending upon whether, and to what extent, the fund's investment performance for the performance period exceeds, or is exceeded by, a securities index, thus leading to a performance adjustment for the same period. The Board noted that the performance adjustment provides FMR with a strong economic incentive to seek to achieve superior performance for the fund's shareholders and helps to more closely align the interests of FMR and the shareholders of the fund.
Based on its review, the Board concluded that the nature, extent, and quality of services provided to the fund under the Advisory Contracts should benefit the shareholders of the fund.
Competitiveness of Management Fee and Total Expense Ratio. The Board considered the fund's management fee and total expense ratio compared to "mapped groups" of competitive funds and classes created for the purpose of facilitating the Trustees' competitive analysis of management fees and total expenses. Fidelity creates "mapped groups" by combining similar Lipper investment objective categories that have comparable investment mandates. Combining Lipper investment objective categories aids the Board's management fee and total expense ratio comparisons by broadening the competitive group used for comparison.
Management Fee. The Board considered two proprietary management fee comparisons for the 12-month periods shown in basis points (BP) in the chart below. The group of Lipper funds used by the Board for management fee comparisons is referred to below as the "Total Mapped Group." The Total Mapped Group comparison focuses on a fund's standing in terms of gross management fees before expense reimbursements or caps, and without giving effect to the fund's performance adjustment, relative to the total universe of funds with comparable investment mandates, regardless of whether their management fee structures also are comparable. Funds with comparable investment mandates offer exposure to similar types of securities. Funds with comparable management fee structures have similar management fee contractual arrangements (e.g., flat rate charged for advisory services, all-inclusive fee rate, etc.). "TMG %" represents the percentage of funds in the Total Mapped Group that had management fees that were lower than the fund's. For example, a hypothetical TMG % of 20% would mean that 80% of the funds in the Total Mapped Group had higher, and 20% had lower, management fees than the fund. The fund's actual TMG %s and the number of funds in the Total Mapped Group are in the chart below. The "Asset-Size Peer Group" (ASPG) comparison focuses on a fund's standing relative to a subset of non-Fidelity funds within the Total Mapped Group that are similar in size and management fee structure without taking into account performance adjustments, if any. For example, if a fund is in the first quartile of the ASPG, the fund's management fee ranks in the least expensive or lowest 25% of funds in the ASPG. The ASPG represents at least 15% of the funds in the Total Mapped Group with comparable asset size and management fee structures, subject to a minimum of 50 funds (or all funds in the Total Mapped Group if fewer than 50). Additional information, such as the ASPG quartile in which the fund's management fee rate ranked and the impact of the fund's performance adjustment, is also included in the chart and considered by the Board.
Annual Report
Fidelity Blue Chip Growth Fund
Annual Report
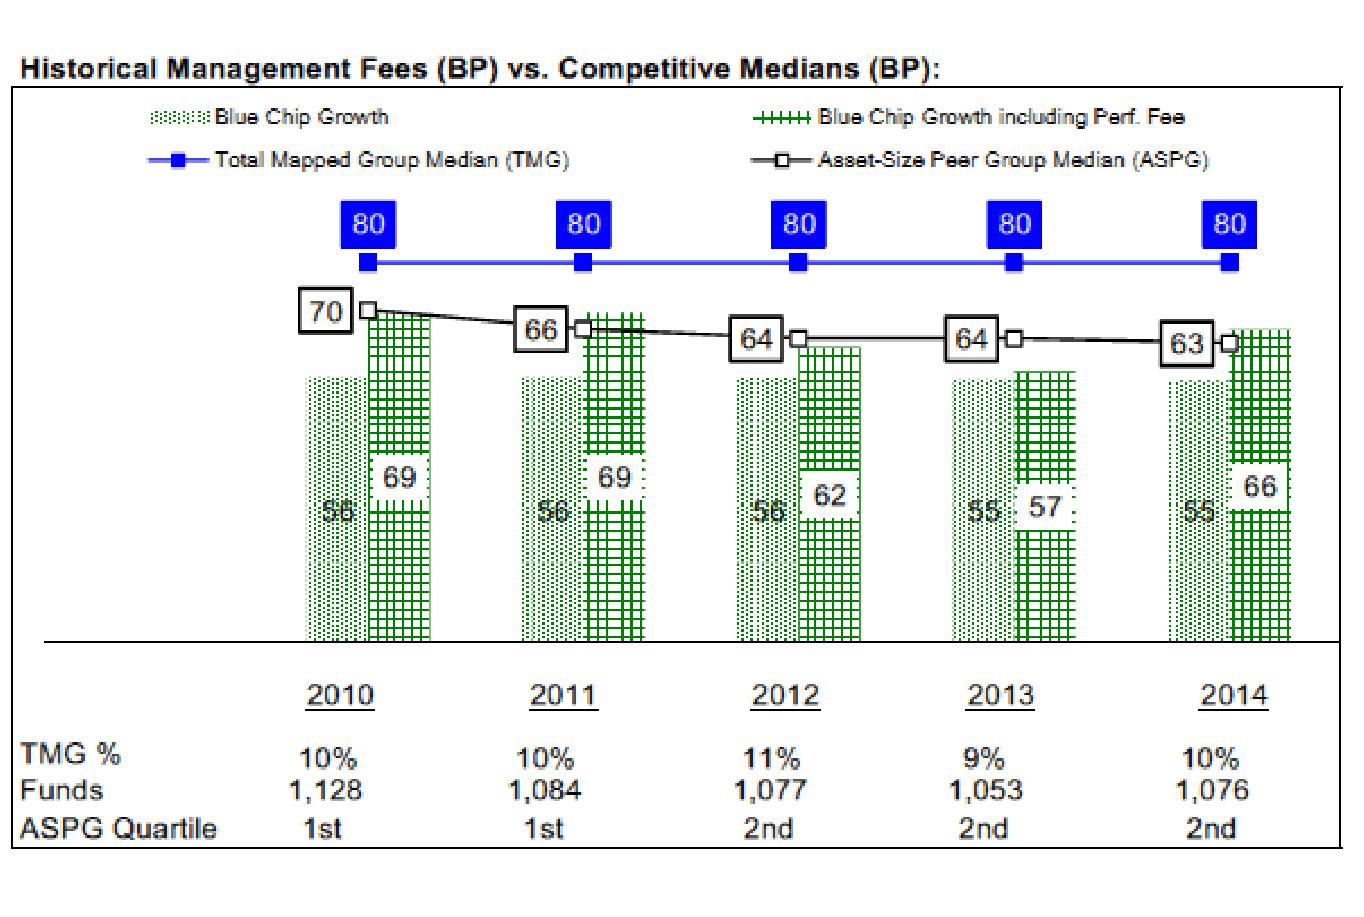
The Board noted that the fund's management fee rate ranked below the median of its Total Mapped Group and below the median of its ASPG for 2014. The Board also noted the effect of the fund's performance adjustment, if any, on the fund's management fee ranking.
The Board noted that, in 2014, the ad hoc Committee on Group Fee was formed by it and other Fidelity fund boards to conduct an in-depth review of the "group fee" component of the management fee of funds with such management fee structures. Committee focus included the mechanics of the group fee, the competitive landscape of group fee structures, Fidelity funds with no group fee component and investment products not included in group fee assets. The Board also considered that, for funds subject to the group fee, FMR agreed to voluntarily waive fees over a specified period of time in amounts designed to account for assets converted from certain funds to certain collective investment trusts.
Board Approval of Investment Advisory Contracts and
Management Fees - continued
The Board also noted that, in 2013, the ad hoc Committee on Management Fees was formed to conduct an in-depth review of the management fee rates of Fidelity's active equity mutual funds. The Committee focused on the following areas: (i) standard fee structures; (ii) research consumption and trading evolution; (iii) management fee competitiveness/profitability by category; and (iv) factors that drive institutional pricing.
Annual Report
Based on its review, the Board concluded that the fund's management fee is fair and reasonable in light of the services that the fund receives and the other factors considered.
Total Expense Ratio. In its review of each class's total expense ratio, the Board considered the fund's management fee as well as other fund or class expenses, as applicable, such as transfer agent fees, pricing and bookkeeping fees, and custodial, legal, and audit fees. The Board noted the impact of the fund's performance adjustment. The Board also noted that Fidelity may agree to waive fees and expenses from time to time, and the extent to which, if any, it has done so for the fund. As part of its review, the Board also considered the current and historical total expense ratios of each class of the fund compared to competitive fund median expenses. Each class of the fund is compared to those funds and classes in the Total Mapped Group (used by the Board for management fee comparisons) that have a similar sales load structure.
The Board noted that the total expense ratio of each class ranked below its competitive median for 2014.
Fees Charged to Other Fidelity Clients. The Board also considered Fidelity fee structures and other information with respect to clients of Fidelity, such as other funds advised or subadvised by Fidelity, pension plan clients, and other institutional clients with similar mandates. The Board noted the findings of the 2013 ad hoc joint committee (created with the board of other Fidelity funds), which reviewed and compared Fidelity's institutional investment advisory business with its business of providing services to the Fidelity funds, including the differences in services provided, fees charged, and costs incurred, as well as competition in their respective marketplaces.
Based on its review of total expense ratios and fees charged to other Fidelity clients, the Board concluded that the total expense ratio of each class of the fund was reasonable in light of the services that the fund and its shareholders receive and the other factors considered.
Costs of the Services and Profitability. The Board considered the revenues earned and the expenses incurred by Fidelity in conducting the business of developing, marketing, distributing, managing, administering and servicing the fund and servicing the fund's shareholders. The Board also considered the level of Fidelity's profits in respect of all the Fidelity funds.
On an annual basis, Fidelity presents to the Board information about the profitability of its relationship with the fund. Fidelity calculates profitability information for each fund, as well as aggregate profitability information for groups of Fidelity funds and all Fidelity funds, using a series of detailed revenue and cost allocation methodologies which originate with the books and records of Fidelity on which Fidelity's audited financial statements are based. The Audit Committee of the Board reviews any significant changes from the prior year's methodologies.
Annual Report
Board Approval of Investment Advisory Contracts and
Management Fees - continued
PricewaterhouseCoopers LLP (PwC), independent registered public accounting firm and auditor to Fidelity and certain Fidelity funds, has been engaged annually by the Board as part of the Board's assessment of Fidelity's profitability analysis. PwC's engagement includes the review and assessment of the methodologies used by Fidelity in determining the revenues and expenses attributable to Fidelity's mutual fund business, and completion of agreed-upon procedures in respect of the mathematical accuracy of fund profitability and its conformity to established allocation methodologies. After considering PwC's reports issued under the engagement and information provided by Fidelity, the Board concluded that while other allocation methods may also be reasonable, Fidelity's profitability methodologies are reasonable in all material respects.
The Board also reviewed Fidelity's non-fund businesses and fall-out benefits related to the mutual fund business as well as cases where Fidelity's affiliates may benefit from or be related to the fund's business.
The Board considered the costs of the services provided by and the profits realized by Fidelity in connection with the operation of the fund and was satisfied that the profitability was not excessive.
Economies of Scale. The Board considered whether there have been economies of scale in respect of the management of the Fidelity funds, whether the Fidelity funds (including the fund) have appropriately benefited from any such economies of scale, and whether there is potential for realization of any further economies of scale. The Board considered the extent to which the fund will benefit from economies of scale as assets grow through increased services to the fund, through waivers or reimbursements, or through fee or expense ratio reductions. The Board also noted that in 2013, it and the boards of other Fidelity funds created an ad hoc committee (the Economies of Scale Committee) to analyze whether Fidelity attains economies of scale in respect of the management and servicing of the Fidelity funds, whether the Fidelity funds have appropriately benefited from such economies of scale, and whether there is potential for realization of any further economies of scale.
The Board recognized that the fund's management contract incorporates a "group fee" structure, which provides for lower group fee rates as total group assets increase, and for higher group fee rates as total group assets decrease (with "group assets" defined to include fund assets under FMR's management plus sector fund assets previously under FMR's management and currently managed by Fidelity SelectCo, LLC). FMR calculates the group fee rates based on a tiered asset "breakpoint" schedule that varies based on asset class. The Board considered that the group fee is designed to deliver the benefits of economies of scale to fund shareholders when total Fidelity fund assets increase, even if assets of any particular fund are unchanged or have declined, because some portion of Fidelity's costs are attributable to services provided to all Fidelity funds, and all funds benefit if those costs can be allocated among more assets. The Board concluded that, given the group fee structure, fund shareholders will benefit from lower management fees as group assets increase at the fund complex level, regardless of whether Fidelity achieves any such economies of scale.
Annual Report
The Board concluded, taking into account the analysis of the Economies of Scale Committee, that economies of scale, if any, are being appropriately shared between fund shareholders and Fidelity.
Additional Information Requested by the Board. In order to develop fully the factual basis for consideration of the Fidelity funds' Advisory Contracts, the Board requested and received additional information on certain topics, including: (i) fund performance trends and Fidelity's long-term strategies for certain funds; (ii) the various share classes employed by Fidelity and the attributes of each class, together with similar information on the distribution and servicing payments made by Fidelity or the funds to third-party participants in the distribution channels; (iii) fund profitability, and fund performance in relation to fund profitability; (iv) the methodology with respect to evaluating competitive fund data and peer group classifications and fee comparisons; (v) annual fund profitability margins, with particular focus on certain funds with negative margins; (vi) the realization of fall-out benefits in certain Fidelity business units; (vii) economies of scale and the way in which they are shared with fund shareholders; (viii) Fidelity's group fee structures, including the group fee schedule of breakpoints; (ix) the impact of cost containment measures on the funds; and (x) the transfer agent fee structure.
Based on its evaluation of all of the conclusions noted above, and after considering all factors it believed relevant, the Board concluded that the advisory fee structures are fair and reasonable, and that the fund's Advisory Contracts should be renewed.
Annual Report
Investment Adviser
Fidelity Management & Research Company
Boston, MA
Investment Sub-Advisers
FMR Co., Inc.
FMR Investment Management
(U.K.) Limited
Fidelity Management & Research
(Hong Kong) Limited
Fidelity Management & Research
(Japan) Limited
General Distributor
Fidelity Distributors Corporation
Smithfield, RI
Transfer and Service Agents
Fidelity Investments Institutional
Operations Company, Inc.
Boston, MA
Fidelity Service Company, Inc.
Boston, MA
Custodian
JPMorgan Chase Bank
New York, NY
(Fidelity Investment logo)(registered trademark)
Corporate Headquarters
245 Summer St., Boston, MA 02210
www.fidelity.com
BCF-K-UANN-0915
1.863112.106
Fidelity®
OTC
Portfolio
Annual Report
July 31, 2015
(Fidelity Cover Art)
Contents
Performance | (Click Here) | How the fund has done over time. |
Management's Discussion of Fund Performance | (Click Here) | The Portfolio Manager's review of fund performance and strategy. |
Shareholder Expense Example | (Click Here) | An example of shareholder expenses. |
Investment Changes | (Click Here) | A summary of major shifts in the fund's investments over the past six months. |
Investments | (Click Here) | A complete list of the fund's investments with their market values. |
Financial Statements | (Click Here) | Statements of assets and liabilities, operations, and changes in net assets, as well as financial highlights. |
Notes | (Click Here) | Notes to the financial statements. |
Report of Independent Registered Public Accounting Firm | (Click Here) | |
Trustees and Officers | (Click Here) | |
Distributions | (Click Here) | |
Board Approval of Investment Advisory Contracts and Management Fees | (Click Here) | |
To view a fund's proxy voting guidelines and proxy voting record for the 12-month period ended June 30, visit http://www.fidelity.com/proxyvotingresults or visit the Securities and Exchange Commission's (SEC) web site at http://www.sec.gov. You may also call 1-800-544-8544 to request a free copy of the proxy voting guidelines.
Standard & Poor's, S&P and S&P 500 are registered service marks of The McGraw-Hill Companies, Inc. and have been licensed for use by Fidelity Distributors Corporation.
Other third-party marks appearing herein are the property of their respective owners.
All other marks appearing herein are registered or unregistered trademarks or service marks of FMR LLC or an affiliated company. © 2015 FMR LLC. All rights reserved.
Annual Report
This report and the financial statements contained herein are submitted for the general information of the shareholders of the fund. This report is not authorized for distribution to prospective investors in the fund unless preceded or accompanied by an effective prospectus.
A fund files its complete schedule of portfolio holdings with the SEC for the first and third quarters of each fiscal year on Form N-Q. Forms N-Q are available on the SEC's web site at http://www.sec.gov. A fund's Forms N-Q may be reviewed and copied at the SEC's Public Reference Room in Washington, DC. Information regarding the operation of the SEC's Public Reference Room may be obtained by calling 1-800-SEC-0330. For a complete list of a fund's portfolio holdings, view the most recent holdings listing, semiannual report, or annual report on Fidelity's web site at http://www.fidelity.com, http://www.advisor.fidelity.com, or http://www.401k.com, as applicable.
NOT FDIC INSURED • MAY LOSE VALUE • NO BANK GUARANTEE
Neither the fund nor Fidelity Distributors Corporation is a bank.
Annual Report
Average annual total return reflects the change in the value of an investment, assuming reinvestment of the class' distributions from dividend income and capital gains (the profits earned upon the sale of securities that have grown in value, if any) and assuming a constant rate of performance each year. The $10,000 table and the fund's returns do not reflect the deduction of taxes that a shareholder would pay on fund distributions or the redemption of fund shares. During periods of reimbursement by Fidelity, a fund's total return will be greater than it would be had the reimbursement not occurred. How a fund did yesterday is no guarantee of how it will do tomorrow.
Average Annual Total Returns
Periods ended July 31, 2015 | Past 1
year | Past 5
years | Past 10
years |
Fidelity® OTC Portfolio | 21.34% | 20.34% | 12.18% |
$10,000 Over 10 Years
Let's say hypothetically that $10,000 was invested in Fidelity® OTC Portfolio, a class of the fund, on July 31, 2005. The chart shows how the value of your investment would have changed, and also shows how the Nasdaq Composite Index® performed over the same period.
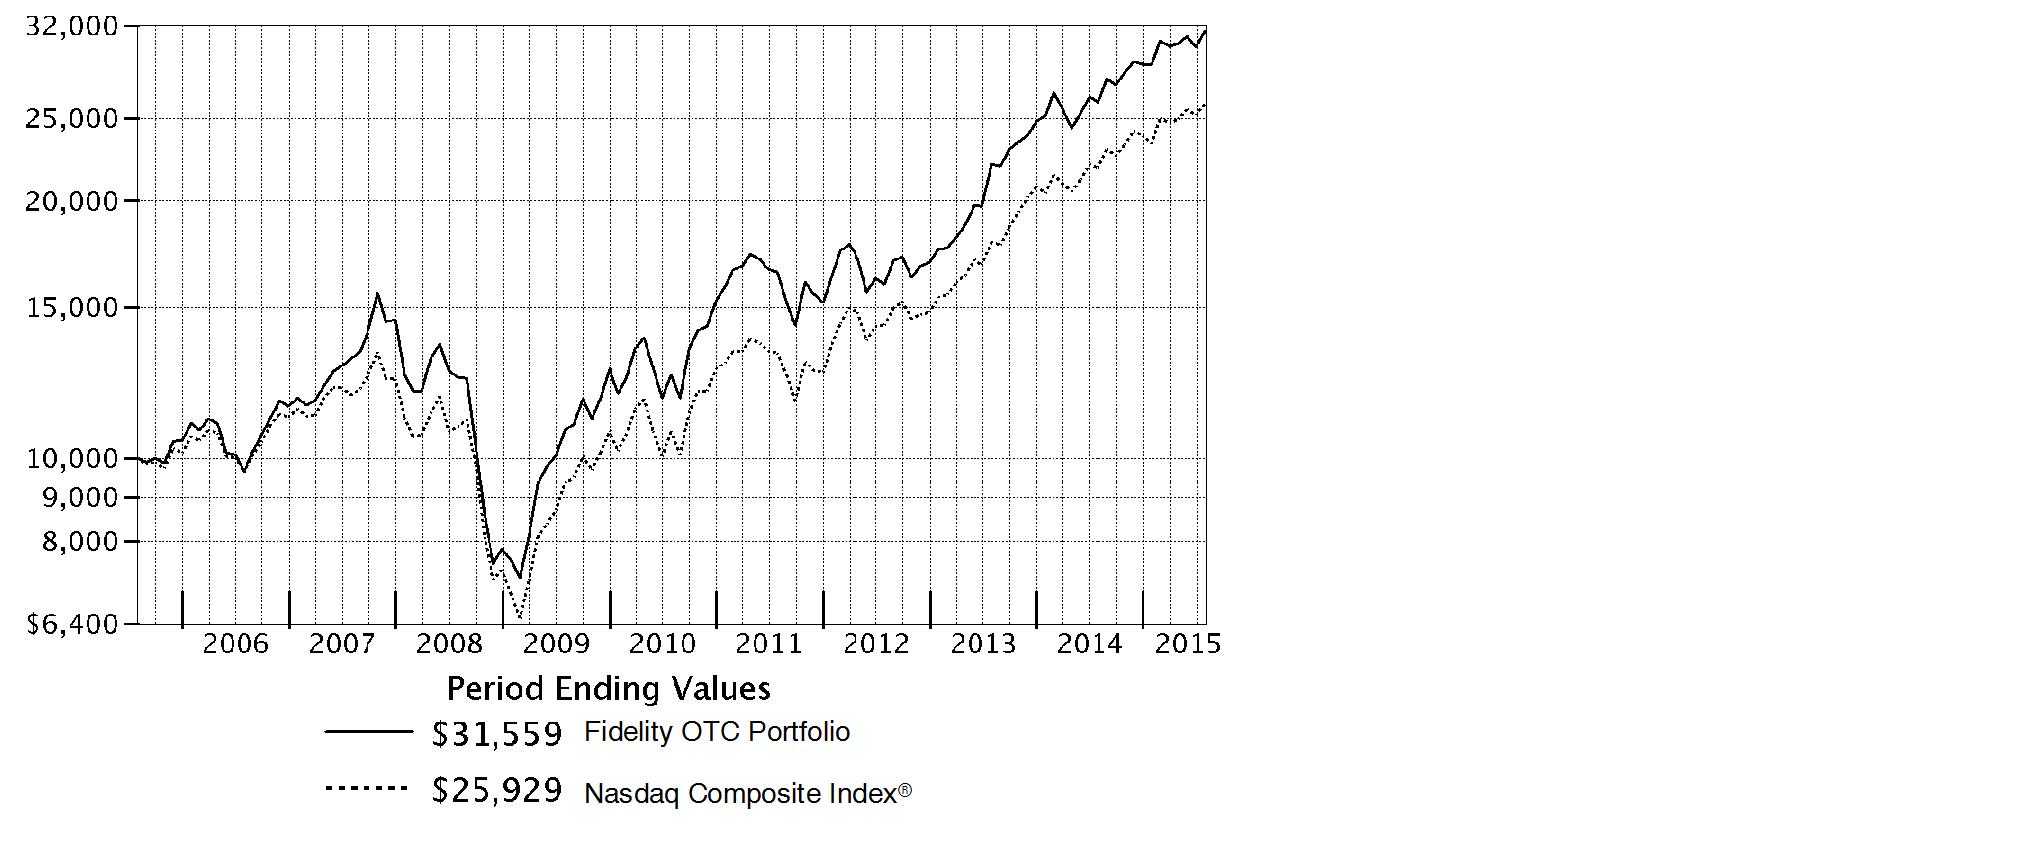
Annual Report
Market Recap: The U.S. equity market gained strongly for the 12 months ending July 31, 2015, as stocks recovered from volatility in late 2014 and early 2015, supported by a still-positive economic backdrop. The S&P 500® Index returned 11.21%, with growth stocks in the index far outpacing value-oriented names on prospects for continued U.S. economic growth. Consequently, the growth-oriented Nasdaq Composite Index® rose 18.71%, outpacing the broader S&P 500®, as well as the 12.03% advance of the smaller-cap Russell 2000® Index. Within the S&P 500®, seven of 10 sectors notched a gain, with significant performance variation. Health care (+27%) led the way, aided by merger activity. Consumer discretionary (+24%) benefited from spending linked to a seven-year low in unemployment. Strong first halves for the consumer staples sector and the real estate segment of financials yielded above-market returns (19% and 12%, respectively) for the full-year period. Conversely, energy (-26%) significantly lagged, due to a roughly 55% decline for U.S. crude-oil prices. Materials (-4%) also lost ground. At period end, investors remained focused on the slowing rate of U.S. earnings growth, the possible effect of a relatively stronger U.S. dollar on exports and inflation, and whether an economic slowdown in China would create ripples for the global economy.
Comments from Portfolio Manager Gavin Baker: For the year, the fund's share classes handily outperformed the benchmark Nasdaq Composite Index®. (For specific class-level results, please see the Performance section of this report.) Both security selection and sector allocation - primarily overweighting health care and underweighting energy and industrials - aided results versus the benchmark. The only notable sector-level detraction came from choices in the consumer staples sector, where several benchmark names not owned in the fund did well, whereas overweighting Keurig Green Mountain detracted substantially. Stock picks in the consumer discretionary and information technology sectors added the most relative value by far. The fund's overweighing in Amazon.com and a non-benchmark stake in U.K.-based fast-fashion e-tailer ASOS ranked the top contributors there. Overweightings in two other retailing names, flash sellers Groupon and Zulily, rated the fund's largest individual detractors. In health care, Synageva Biopharma stock returned 217% while held in the fund; the company received a buyout offer in May from Alexion Pharmaceuticals, another fund holding. Conversely, our holdings in Puma Biotechnology returned about -59%, detracting from relative results.
The views expressed above reflect those of the portfolio manager(s) only through the end of the period as stated on the cover of this report and do not necessarily represent the views of Fidelity or any other person in the Fidelity organization. Any such views are subject to change at any time based upon market or other conditions and Fidelity disclaims any responsibility to update such views. These views may not be relied on as investment advice and, because investment decisions for a Fidelity fund are based on numerous factors, may not be relied on as an indication of trading intent on behalf of any Fidelity fund.
Annual Report
Shareholder Expense Example
As a shareholder of the Fund, you incur two types of costs: (1) transaction costs, and (2) ongoing costs, including management fees and other Fund expenses. This Example is intended to help you understand your ongoing costs (in dollars) of investing in the Fund and to compare these costs with the ongoing costs of investing in other mutual funds.
The Example is based on an investment of $1,000 invested at the beginning of the period and held for the entire period (February 1, 2015 to July 31, 2015).
Actual Expenses
The first line of the accompanying table for each class of the Fund provides information about actual account values and actual expenses. You may use the information in this line, together with the amount you invested, to estimate the expenses that you paid over the period. Simply divide your account value by $1,000.00 (for example, an $8,600 account value divided by $1,000.00 = 8.6), then multiply the result by the number in the first line for a class of the Fund under the heading entitled "Expenses Paid During Period" to estimate the expenses you paid on your account during this period. A small balance maintenance fee of $12.00 that is charged once a year may apply for certain accounts with a value of less than $2,000. This fee is not included in the table below. If it was, the estimate of expenses you paid during the period would be higher, and your ending account value lower, by this amount. In addition, the Fund, as a shareholder in the underlying Fidelity Central Funds, will indirectly bear its pro-rata share of the fees and expenses incurred by the underlying Fidelity Central Funds. These fees and expenses are not included in the Fund's annualized expense ratio used to calculate the expense estimate in the table below.
Hypothetical Example for Comparison Purposes
The second line of the accompanying table for each class of the Fund provides information about hypothetical account values and hypothetical expenses based on a Class' actual expense ratio and an assumed rate of return of 5% per year before expenses, which is not the Class' actual return. The hypothetical account values and expenses may not be used to estimate the actual ending account balance or expenses you paid for the period. You may use this information to compare the ongoing costs of investing in the Fund and other funds. To do so, compare this 5% hypothetical example with the 5% hypothetical examples that appear in the shareholder reports of the other funds. A small balance maintenance fee of $12.00 that is charged once a year may apply for certain accounts with a value of less than $2,000. This fee is not included in the table below. If it was, the estimate of expenses you paid during the period would be higher, and your ending account value lower, by this amount. In addition, the Fund, as a shareholder in the underlying Fidelity Central Funds, will indirectly bear its pro-rata share of the fees and expenses incurred by the underlying Fidelity Central Funds. These fees and expenses are not included in the Fund's annualized expense ratio used to calculate the expense estimate in the table below.
Please note that the expenses shown in the table are meant to highlight your ongoing costs only and do not reflect any transaction costs. Therefore, the second line of the table is useful in comparing ongoing costs only, and will not help you determine the relative total costs of owning different funds.
Annual Report
Shareholder Expense Example - continued
| Annualized
Expense RatioB | Beginning
Account Value
February 1, 2015 | Ending
Account Value
July 31, 2015 | Expenses Paid
During Period*
February 1, 2015 to July 31, 2015 |
OTC | .89% | | | |
Actual | | $ 1,000.00 | $ 1,094.50 | $ 4.62 |
HypotheticalA | | $ 1,000.00 | $ 1,020.38 | $ 4.46 |
Class K | .78% | | | |
Actual | | $ 1,000.00 | $ 1,095.10 | $ 4.05 |
HypotheticalA | | $ 1,000.00 | $ 1,020.93 | $ 3.91 |
A 5% return per year before expenses
B Annualized expense ratio reflects expenses net of applicable fee waivers.
* Expenses are equal to each Class' annualized expense ratio, multiplied by the average account value over the period, multiplied by 181/365 (to reflect the one-half year period).
Annual Report
Investment Changes (Unaudited)
Top Ten Stocks as of July 31, 2015 |
| % of fund's
net assets | % of fund's net assets
6 months ago |
Apple, Inc. | 9.2 | 10.4 |
Amazon.com, Inc. | 5.7 | 5.8 |
Google, Inc. Class C | 4.0 | 4.3 |
Google, Inc. Class A | 3.9 | 4.2 |
Microsoft Corp. | 3.5 | 2.0 |
Facebook, Inc. Class A | 2.8 | 2.7 |
Activision Blizzard, Inc. | 2.7 | 2.2 |
athenahealth, Inc. | 2.4 | 2.7 |
Groupon, Inc. Class A | 2.4 | 3.9 |
Gilead Sciences, Inc. | 2.3 | 2.3 |
| 38.9 | |
Top Five Market Sectors as of July 31, 2015 |
| % of fund's
net assets | % of fund's net assets
6 months ago |
Information Technology | 47.2 | 49.9 |
Health Care | 20.9 | 20.8 |
Consumer Discretionary | 16.6 | 17.5 |
Consumer Staples | 6.4 | 3.6 |
Financials | 4.0 | 3.1 |
Asset Allocation (% of fund's net assets) |
As of July 31, 2015 * | As of January 31, 2015 ** |
 | Stocks 97.4% | |  | Stocks 98.1% | |
 | Convertible
Securities 2.4% | |  | Convertible
Securities 1.9% | |
 | Short-Term
Investments and
Net Other Assets (Liabilities) 0.2% | |  | Short-Term
Investments and
Net Other Assets (Liabilities) 0.0% | |
* Foreign investments | 9.6% | | ** Foreign investments | 12.4% | |

Annual Report
Investments July 31, 2015
Showing Percentage of Net Assets
Common Stocks - 97.4% |
| Shares | | Value (000s) |
CONSUMER DISCRETIONARY - 16.3% |
Automobiles - 1.9% |
Tesla Motors, Inc. (a)(d) | 963,399 | | $ 256,409 |
Diversified Consumer Services - 0.2% |
2U, Inc. (a) | 793,541 | | 25,465 |
Hotels, Restaurants & Leisure - 1.8% |
Buffalo Wild Wings, Inc. (a) | 220,700 | | 43,165 |
Intrawest Resorts Holdings, Inc. (a) | 751,535 | | 7,493 |
Panera Bread Co. Class A (a) | 531,500 | | 108,490 |
Starbucks Corp. | 1,306,820 | | 75,704 |
Vail Resorts, Inc. | 88,400 | | 9,697 |
Wingstop, Inc. | 7,100 | | 243 |
Wynn Resorts Ltd. | 15 | | 2 |
| | 244,794 |
Household Durables - 0.4% |
Garmin Ltd. (d) | 818,100 | | 34,287 |
GoPro, Inc. Class A (a)(d) | 248,100 | | 15,407 |
| | 49,694 |
Internet & Catalog Retail - 10.2% |
Amazon.com, Inc. (a) | 1,449,898 | | 777,363 |
ASOS PLC ADR (a)(d) | 383,452 | | 20,162 |
Etsy, Inc. (d) | 1,933,875 | | 40,302 |
Groupon, Inc. Class A (a)(d)(e) | 65,822,881 | | 317,266 |
Ocado Group PLC (a) | 245,400 | | 1,521 |
Wayfair LLC Class A (d) | 2,862,168 | | 106,787 |
zulily, Inc. Class A (a)(d) | 8,568,800 | | 113,194 |
| | 1,376,595 |
Leisure Products - 0.0% |
MCBC Holdings, Inc. | 139,300 | | 2,131 |
Media - 0.8% |
Charter Communications, Inc. Class A (a)(d) | 313,100 | | 58,193 |
Liberty Global PLC Class A (a) | 483,600 | | 25,370 |
Liberty LiLac Group Class A (a) | 24,180 | | 1,034 |
Twenty-First Century Fox, Inc. Class A | 738,000 | | 25,454 |
| | 110,051 |
Specialty Retail - 0.4% |
Ross Stores, Inc. | 1,036,000 | | 55,074 |
Ulta Salon, Cosmetics & Fragrance, Inc. (a) | 15 | | 2 |
| | 55,076 |
Common Stocks - continued |
| Shares | | Value (000s) |
CONSUMER DISCRETIONARY - continued |
Textiles, Apparel & Luxury Goods - 0.6% |
lululemon athletica, Inc. (a) | 571,346 | | $ 35,915 |
LVMH Moet Hennessy - Louis Vuitton SA ADR (d) | 1,308,700 | | 48,867 |
| | 84,782 |
TOTAL CONSUMER DISCRETIONARY | | 2,204,997 |
CONSUMER STAPLES - 6.3% |
Beverages - 0.5% |
Monster Beverage Corp. (a) | 446,100 | | 68,499 |
Food & Staples Retailing - 3.0% |
Costco Wholesale Corp. | 1,619,650 | | 235,335 |
Sprouts Farmers Market LLC (a) | 2,677,800 | | 65,660 |
Walgreens Boots Alliance, Inc. | 576,600 | | 55,717 |
Whole Foods Market, Inc. | 1,376,900 | | 50,119 |
| | 406,831 |
Food Products - 2.8% |
Blue Buffalo Pet Products, Inc. | 57,700 | | 1,612 |
Danone SA sponsored ADR | 3,735,524 | | 50,878 |
Diamond Foods, Inc. (a) | 95 | | 3 |
Keurig Green Mountain, Inc. | 2,397,746 | | 179,927 |
Mondelez International, Inc. | 3,292,600 | | 148,595 |
| | 381,015 |
TOTAL CONSUMER STAPLES | | 856,345 |
ENERGY - 1.4% |
Energy Equipment & Services - 0.1% |
Oceaneering International, Inc. | 322,400 | | 12,902 |
Oil, Gas & Consumable Fuels - 1.3% |
Anadarko Petroleum Corp. | 31,300 | | 2,327 |
Carrizo Oil & Gas, Inc. (a) | 26,300 | | 1,003 |
Diamondback Energy, Inc. | 1,007,700 | | 67,818 |
EOG Resources, Inc. | 668,900 | | 51,632 |
Noble Energy, Inc. | 1,397,600 | | 49,237 |
| | 172,017 |
TOTAL ENERGY | | 184,919 |
Common Stocks - continued |
| Shares | | Value (000s) |
FINANCIALS - 3.8% |
Banks - 2.8% |
Bank of America Corp. | 3,728,500 | | $ 66,666 |
Citigroup, Inc. | 1,189,200 | | 69,521 |
Commerce Bancshares, Inc. | 772,295 | | 36,367 |
Fifth Third Bancorp | 533,400 | | 11,239 |
Huntington Bancshares, Inc. | 230,700 | | 2,692 |
JPMorgan Chase & Co. | 759,500 | | 52,049 |
Signature Bank (a) | 270,100 | | 39,324 |
UMB Financial Corp. | 549,500 | | 30,124 |
Wells Fargo & Co. | 1,323,200 | | 76,574 |
| | 384,556 |
Capital Markets - 0.3% |
Carlyle Group LP | 630,500 | | 16,778 |
Northern Trust Corp. | 320,900 | | 24,546 |
| | 41,324 |
Consumer Finance - 0.7% |
Capital One Financial Corp. | 1,075,500 | | 87,438 |
Real Estate Management & Development - 0.0% |
WeWork Companies, Inc. Class A (f) | 29,911 | | 984 |
TOTAL FINANCIALS | | 514,302 |
HEALTH CARE - 20.7% |
Biotechnology - 16.1% |
Acceleron Pharma, Inc. (a) | 164,200 | | 4,703 |
Adaptimmune Therapeutics PLC sponsored ADR | 594,600 | | 8,949 |
Aduro Biotech, Inc. (d) | 55,900 | | 1,466 |
Aduro Biotech, Inc. | 1,938,567 | | 45,746 |
Alexion Pharmaceuticals, Inc. (a) | 1,115,989 | | 220,341 |
Alkermes PLC (a) | 905,536 | | 63,406 |
Alnylam Pharmaceuticals, Inc. (a) | 139,200 | | 17,738 |
Amgen, Inc. | 424,200 | | 74,909 |
Anacor Pharmaceuticals, Inc. (a) | 133,200 | | 19,872 |
Array BioPharma, Inc. (a)(d) | 6,768,400 | | 39,324 |
Avalanche Biotechnologies, Inc. (a) | 996,552 | | 14,669 |
Bellicum Pharmaceuticals, Inc. (d) | 983,400 | | 20,012 |
BioCryst Pharmaceuticals, Inc. (a) | 2,910,964 | | 45,062 |
Biogen, Inc. (a) | 316,100 | | 100,766 |
BioMarin Pharmaceutical, Inc. (a) | 626,756 | | 91,676 |
Blueprint Medicines Corp. | 164,834 | | 4,454 |
Celldex Therapeutics, Inc. (a) | 1,283,885 | | 30,235 |
Common Stocks - continued |
| Shares | | Value (000s) |
HEALTH CARE - continued |
Biotechnology - continued |
Cellectis SA sponsored ADR | 249,800 | | $ 8,870 |
Chiasma, Inc. | 102,900 | | 2,425 |
Chimerix, Inc. (a) | 55,200 | | 2,966 |
Cidara Therapeutics, Inc. | 40,300 | | 563 |
Clovis Oncology, Inc. (a) | 1,053,954 | | 88,985 |
Coherus BioSciences, Inc. | 440,306 | | 15,446 |
Dicerna Pharmaceuticals, Inc. (a) | 316,729 | | 3,870 |
Dyax Corp. (a) | 1,021,100 | | 25,129 |
Exelixis, Inc. (a) | 693,121 | | 3,972 |
Foundation Medicine, Inc. (a) | 5 | | 0 |
Galapagos Genomics NV sponsored ADR | 786,600 | | 47,707 |
Genocea Biosciences, Inc. (a) | 852,070 | | 11,077 |
Gilead Sciences, Inc. | 2,602,199 | | 306,695 |
Heron Therapeutics, Inc. (a) | 242,500 | | 7,842 |
Intercept Pharmaceuticals, Inc. (a) | 310,319 | | 81,865 |
Ironwood Pharmaceuticals, Inc. Class A (a) | 3,166,642 | | 33,091 |
Isis Pharmaceuticals, Inc. (a) | 83,049 | | 4,562 |
Juno Therapeutics, Inc. (d) | 587,724 | | 28,751 |
Karyopharm Therapeutics, Inc. (a) | 616,858 | | 12,658 |
Lion Biotechnologies, Inc. (a)(d)(e) | 3,012,600 | | 25,788 |
Medivation, Inc. (a) | 1,113,004 | | 117,233 |
Novavax, Inc. (a) | 2,849,200 | | 34,361 |
Ophthotech Corp. (a) | 883,500 | | 59,804 |
Otonomy, Inc. | 217,345 | | 5,601 |
OvaScience, Inc. (a)(d) | 977,313 | | 27,853 |
Portola Pharmaceuticals, Inc. (a)(e) | 2,836,107 | | 140,217 |
ProNai Therapeutics, Inc. | 31,600 | | 866 |
PTC Therapeutics, Inc. (a) | 169,766 | | 8,694 |
Puma Biotechnology, Inc. (a) | 946,587 | | 85,761 |
Sage Therapeutics, Inc. | 15,900 | | 1,087 |
Seattle Genetics, Inc. (a)(d) | 1,648,886 | | 78,932 |
Spark Therapeutics, Inc. (d) | 32,300 | | 1,985 |
TESARO, Inc. (a) | 465,800 | | 27,016 |
Trevena, Inc. (a)(e) | 3,354,221 | | 19,522 |
Ultragenyx Pharmaceutical, Inc. (a) | 295,105 | | 35,687 |
uniQure B.V. (a) | 304,700 | | 7,846 |
Versartis, Inc. (a)(d) | 508,600 | | 9,206 |
XOMA Corp. (a)(d) | 1,989,413 | | 1,453 |
| | 2,178,714 |
Common Stocks - continued |
| Shares | | Value (000s) |
HEALTH CARE - continued |
Health Care Equipment & Supplies - 0.5% |
HeartWare International, Inc. (a) | 22,300 | | $ 2,023 |
IDEXX Laboratories, Inc. (a) | 407,204 | | 29,616 |
Inogen, Inc. (a) | 36,400 | | 1,618 |
Novadaq Technologies, Inc. (a) | 2,702,756 | | 31,001 |
| | 64,258 |
Health Care Providers & Services - 0.3% |
Accretive Health, Inc. (a)(e) | 7,198,902 | | 18,789 |
Diplomat Pharmacy, Inc. (d) | 556,700 | | 25,708 |
Teladoc, Inc. (a) | 31,700 | | 1,001 |
| | 45,498 |
Health Care Technology - 2.6% |
athenahealth, Inc. (a)(d)(e) | 2,339,204 | | 327,395 |
Castlight Health, Inc. Class B (a)(d) | 64,300 | | 462 |
Veeva Systems, Inc. Class A (a)(d) | 1,023,800 | | 27,561 |
| | 355,418 |
Life Sciences Tools & Services - 0.0% |
NantKwest, Inc. | 53,100 | | 1,625 |
Pharmaceuticals - 1.2% |
Achaogen, Inc. (a)(d) | 833,100 | | 6,007 |
Flex Pharma, Inc. | 473,196 | | 7,377 |
GW Pharmaceuticals PLC ADR (a) | 128,127 | | 14,672 |
Intra-Cellular Therapies, Inc. (a) | 259,500 | | 7,551 |
Jazz Pharmaceuticals PLC (a) | 134,700 | | 25,895 |
Relypsa, Inc. (a) | 535,600 | | 17,734 |
Shire PLC sponsored ADR | 288,900 | | 77,081 |
Tetraphase Pharmaceuticals, Inc. (a) | 27,300 | | 1,298 |
Theravance, Inc. | 79 | | 1 |
| | 157,616 |
TOTAL HEALTH CARE | | 2,803,129 |
INDUSTRIALS - 2.6% |
Airlines - 1.2% |
American Airlines Group, Inc. | 3,952,500 | | 158,495 |
Commercial Services & Supplies - 0.2% |
Regus PLC | 2,388,800 | | 10,475 |
Stericycle, Inc. (a) | 144,600 | | 20,384 |
| | 30,859 |
Common Stocks - continued |
| Shares | | Value (000s) |
INDUSTRIALS - continued |
Electrical Equipment - 0.7% |
SolarCity Corp. (a)(d) | 1,538,948 | | $ 89,259 |
Professional Services - 0.1% |
TriNet Group, Inc. (a) | 595,100 | | 15,996 |
WageWorks, Inc. (a) | 100,353 | | 5,013 |
| | 21,009 |
Road & Rail - 0.4% |
J.B. Hunt Transport Services, Inc. | 654,080 | | 55,021 |
TOTAL INDUSTRIALS | | 354,643 |
INFORMATION TECHNOLOGY - 45.8% |
Communications Equipment - 2.1% |
Cisco Systems, Inc. | 1,395,000 | | 39,646 |
QUALCOMM, Inc. | 3,874,153 | | 249,457 |
| | 289,103 |
Electronic Equipment & Components - 0.1% |
Littelfuse, Inc. | 73,900 | | 6,799 |
Internet Software & Services - 17.6% |
58.com, Inc. ADR (a) | 25,300 | | 1,503 |
Alibaba Group Holding Ltd. sponsored ADR | 1,699,200 | | 133,115 |
Baidu.com, Inc. sponsored ADR (a) | 101,500 | | 17,525 |
Cornerstone OnDemand, Inc. (a) | 1,653,782 | | 59,635 |
Criteo SA sponsored ADR (a)(e) | 5,475,671 | | 291,470 |
Cvent, Inc. (a) | 170,200 | | 4,582 |
Demandware, Inc. (a) | 11,300 | | 854 |
Dropbox, Inc. (a)(f) | 331,524 | | 5,556 |
Facebook, Inc. Class A (a) | 4,050,038 | | 380,744 |
Google, Inc.: | | | |
Class A (a) | 801,227 | | 526,807 |
Class C | 868,269 | | 543,198 |
JUST EAT Ltd. (a) | 243,200 | | 1,656 |
LinkedIn Corp. Class A (a) | 463,200 | | 94,150 |
Marketo, Inc. (a)(d) | 1,978,078 | | 60,153 |
Opower, Inc. (a)(d) | 1,080,100 | | 10,855 |
Rackspace Hosting, Inc. (a) | 4,642,030 | | 157,968 |
Shopify, Inc. Class A (d) | 16,900 | | 632 |
Twitter, Inc. (a) | 1,194,700 | | 37,048 |
Wix.com Ltd. (a) | 358,405 | | 10,035 |
Common Stocks - continued |
| Shares | | Value (000s) |
INFORMATION TECHNOLOGY - continued |
Internet Software & Services - continued |
Yahoo!, Inc. (a) | 881,400 | | $ 32,321 |
Zillow Group, Inc. (a)(d) | 128,300 | | 10,456 |
| | 2,380,263 |
Semiconductors & Semiconductor Equipment - 4.0% |
Analog Devices, Inc. | 412,700 | | 24,073 |
Applied Micro Circuits Corp. (a) | 450,050 | | 2,795 |
Avago Technologies Ltd. | 237,300 | | 29,696 |
Broadcom Corp. Class A | 52,300 | | 2,647 |
Cirrus Logic, Inc. (a) | 681,630 | | 22,501 |
Intel Corp. | 950,800 | | 27,526 |
Marvell Technology Group Ltd. | 4,577,000 | | 56,938 |
Micron Technology, Inc. (a) | 5,473,900 | | 101,322 |
NVIDIA Corp. | 12,466,961 | | 248,716 |
Qorvo, Inc. (a) | 500,316 | | 28,993 |
| | 545,207 |
Software - 11.6% |
Activision Blizzard, Inc. | 14,492,439 | | 373,760 |
GameLoft SE (a)(e) | 7,635,987 | | 36,312 |
HubSpot, Inc. | 496,180 | | 26,769 |
Interactive Intelligence Group, Inc. (a) | 218,487 | | 9,058 |
Microsoft Corp. | 10,170,539 | | 474,964 |
NetSuite, Inc. (a) | 103,400 | | 10,220 |
Paylocity Holding Corp. (a) | 239,000 | | 8,585 |
Rapid7, Inc. | 21,300 | | 489 |
Salesforce.com, Inc. (a) | 2,180,220 | | 159,810 |
ServiceNow, Inc. (a) | 305,707 | | 24,609 |
Synchronoss Technologies, Inc. (a)(e) | 2,664,361 | | 127,356 |
Ubisoft Entertainment SA (a)(e) | 10,524,882 | | 204,478 |
Xero Ltd. (a)(d) | 650,187 | | 7,597 |
Zendesk, Inc. (a)(d)(e) | 5,151,317 | | 106,272 |
| | 1,570,279 |
Technology Hardware, Storage & Peripherals - 10.4% |
Apple, Inc. | 10,295,120 | | 1,248,795 |
Nimble Storage, Inc. (a)(d) | 2,196,708 | | 60,673 |
SanDisk Corp. | 1,135,000 | | 68,429 |
Seagate Technology LLC | 277,500 | | 14,042 |
Common Stocks - continued |
| Shares | | Value (000s) |
INFORMATION TECHNOLOGY - continued |
Technology Hardware, Storage & Peripherals - continued |
Silicon Graphics International Corp. (a) | 74 | | $ 0 |
Western Digital Corp. | 170,100 | | 14,639 |
| | 1,406,578 |
TOTAL INFORMATION TECHNOLOGY | | 6,198,229 |
MATERIALS - 0.1% |
Chemicals - 0.1% |
Monsanto Co. | 202,000 | | 20,582 |
TELECOMMUNICATION SERVICES - 0.4% |
Diversified Telecommunication Services - 0.1% |
Cogent Communications Group, Inc. | 261,100 | | 8,300 |
Wireless Telecommunication Services - 0.3% |
Vodafone Group PLC sponsored ADR | 1,159,500 | | 43,806 |
TOTAL TELECOMMUNICATION SERVICES | | 52,106 |
TOTAL COMMON STOCKS (Cost $10,101,643) |
13,189,252
|
Convertible Preferred Stocks - 2.4% |
| | | |
CONSUMER DISCRETIONARY - 0.3% |
Household Durables - 0.2% |
Roku, Inc.: | | | |
Series F, 8.00% (a)(f) | 16,562,507 | | 21,366 |
Series G, 8.00% (f) | 3,185,945 | | 4,110 |
| | 25,476 |
Internet & Catalog Retail - 0.0% |
One Kings Lane, Inc. Series E (a)(f) | 648,635 | | 2,893 |
Media - 0.1% |
Turn, Inc. Series E (a)(f) | 1,199,041 | | 7,578 |
TOTAL CONSUMER DISCRETIONARY | | 35,947 |
CONSUMER STAPLES - 0.1% |
Food & Staples Retailing - 0.1% |
Blue Apron, Inc. Series D (f) | 866,669 | | 11,550 |
Convertible Preferred Stocks - continued |
| Shares | | Value (000s) |
FINANCIALS - 0.2% |
Real Estate Management & Development - 0.2% |
Redfin Corp. Series G (f) | 6,064,833 | | $ 22,804 |
WeWork Companies, Inc. Series E (f) | 269,198 | | 8,854 |
| | 31,658 |
HEALTH CARE - 0.2% |
Biotechnology - 0.2% |
23andMe, Inc. Series E (f) | 1,817,170 | | 19,675 |
CytomX Therapeutics, Inc. Series D (f) | 15,388,225 | | 2,283 |
Gensight Biologics Series B (f) | 675,056 | | 2,061 |
Jounce Therapeutics, Inc. Series B (f) | 2,212,389 | | 5,000 |
| | 29,019 |
INDUSTRIALS - 0.1% |
Aerospace & Defense - 0.0% |
Space Exploration Technologies Corp. Series G (f) | 62,037 | | 4,805 |
Professional Services - 0.1% |
YourPeople, Inc. Series C (f) | 335,546 | | 5,000 |
TOTAL INDUSTRIALS | | 9,805 |
INFORMATION TECHNOLOGY - 1.4% |
Internet Software & Services - 0.7% |
Pinterest, Inc. Series G, 8.00% (f) | 27,858 | | 1,000 |
Uber Technologies, Inc.: | | | |
Series D, 8.00% (a)(f) | 2,256,164 | | 89,434 |
Series E, 8.00% (f) | 150,072 | | 5,949 |
| | 96,383 |
IT Services - 0.3% |
AppNexus, Inc. Series E (f) | 1,416,796 | | 39,019 |
Nutanix, Inc. Series E (f) | 311,503 | | 4,959 |
| | 43,978 |
Software - 0.4% |
Cloudera, Inc. Series F (a)(f) | 126,709 | | 4,160 |
Cloudflare, Inc. Series D (f) | 395,787 | | 2,788 |
Dataminr, Inc. Series D (f) | 2,219,446 | | 28,298 |
Delphix Corp. Series D (f) | 427,177 | | 3,845 |
Snapchat, Inc. Series F (f) | 32,552 | | 1,000 |
Taboola.Com Ltd. Series E (f) | 1,918,392 | | 10,590 |
Twilio, Inc. Series E (f) | 351,811 | | 3,979 |
| | 54,660 |
Convertible Preferred Stocks - continued |
| Shares | | Value (000s) |
INFORMATION TECHNOLOGY - continued |
Technology Hardware, Storage & Peripherals - 0.0% |
Pure Storage, Inc. Series E (a)(f) | 184,982 | | $ 3,378 |
TOTAL INFORMATION TECHNOLOGY | | 198,399 |
TELECOMMUNICATION SERVICES - 0.1% |
Wireless Telecommunication Services - 0.1% |
Altiostar Networks, Inc. Series D (f) | 1,220,504 | | 15,000 |
TOTAL CONVERTIBLE PREFERRED STOCKS (Cost $269,616) |
331,378
|
Money Market Funds - 4.3% |
| | | |
Fidelity Cash Central Fund, 0.17% (b) | 61,469,911 | | 61,470 |
Fidelity Securities Lending Cash Central Fund, 0.18% (b)(c) | 519,054,682 | | 519,055 |
TOTAL MONEY MARKET FUNDS (Cost $580,525) |
580,525
|
TOTAL INVESTMENT PORTFOLIO - 104.1% (Cost $10,951,784) | 14,101,155 |
NET OTHER ASSETS (LIABILITIES) - (4.1)% | (554,307) |
NET ASSETS - 100% | $ 13,546,848 |
Legend |
(a) Non-income producing |
(b) Affiliated fund that is generally available only to investment companies and other accounts managed by Fidelity Investments. The rate quoted is the annualized seven-day yield of the fund at period end. A complete unaudited listing of the fund's holdings as of its most recent quarter end is available upon request. In addition, each Fidelity Central Fund's financial statements, which are not covered by the Fund's Report of Independent Registered Public Accounting Firm, are available on the SEC's website or upon request. |
(c) Investment made with cash collateral received from securities on loan. |
(d) Security or a portion of the security is on loan at period end. |
(e) Affiliated company |
(f) Restricted securities - Investment in securities not registered under the Securities Act of 1933 (excluding 144A issues). At the end of the period, the value of restricted securities (excluding 144A issues) amounted to $337,918,000 or 2.5% of net assets. |
Additional information on each restricted holding is as follows: |
Security | Acquisition Date | Acquisition Cost (000s) |
23andMe, Inc. Series E | 6/18/15 | $ 19,675 |
Altiostar Networks, Inc. Series D | 1/7/15 | $ 15,000 |
AppNexus, Inc. Series E | 8/1/14 - 9/17/14 | $ 28,382 |
Blue Apron, Inc. Series D | 5/18/15 | $ 11,550 |
Cloudera, Inc. Series F | 2/5/14 | $ 1,845 |
Cloudflare, Inc. Series D | 11/5/14 | $ 2,424 |
CytomX Therapeutics, Inc. Series D | 6/12/15 | $ 2,283 |
Dataminr, Inc. Series D | 2/18/15 - 3/6/15 | $ 28,298 |
Delphix Corp. Series D | 7/10/15 | $ 3,845 |
Dropbox, Inc. | 5/2/12 | $ 3,000 |
Gensight Biologics Series B | 7/2/15 | $ 2,081 |
Jounce Therapeutics, Inc. Series B | 4/17/15 | $ 5,000 |
Nutanix, Inc. Series E | 8/26/14 | $ 4,173 |
One Kings Lane, Inc. Series E | 1/29/14 | $ 10,000 |
Security | Acquisition Date | Acquisition Cost (000s) |
Pinterest, Inc. Series G, 8.00% | 2/27/15 | $ 1,000 |
Pure Storage, Inc. Series E | 8/22/13 | $ 1,282 |
Redfin Corp. Series G | 12/16/14 | $ 20,000 |
Roku, Inc.
Series F, 8.00% | 5/7/13 | $ 15,000 |
Roku, Inc.
Series G, 8.00% | 10/1/14 | $ 4,140 |
Snapchat, Inc. Series F | 3/25/15 | $ 1,000 |
Space Exploration Technologies Corp. Series G | 1/20/15 | $ 4,805 |
Taboola.Com Ltd. Series E | 12/22/14 | $ 20,000 |
Turn, Inc. Series E | 12/30/13 | $ 10,000 |
Twilio, Inc.
Series E | 4/24/15 | $ 3,979 |
Uber Technologies, Inc. Series D, 8.00% | 6/6/14 | $ 35,000 |
Uber Technologies, Inc. Series E, 8.00% | 12/5/14 | $ 5,000 |
WeWork Companies, Inc. Class A | 6/23/15 | $ 984 |
WeWork Companies, Inc. Series E | 6/23/15 | $ 8,854 |
YourPeople, Inc. Series C | 5/1/15 | $ 5,000 |
Affiliated Central Funds |
Information regarding fiscal year to date income earned by the Fund from investments in Fidelity Central Funds is as follows: |
Fund | Income earned
(Amounts in thousands) |
Fidelity Cash Central Fund | $ 44 |
Fidelity Securities Lending Cash Central Fund | 6,757 |
Total | $ 6,801 |
Other Affiliated Issuers |
An affiliated company is a company in which the Fund has ownership of at least 5% of the voting securities. Fiscal year to date transactions with companies which are or were affiliates are as follows: |
Affiliate
(Amounts in thousands) | Value, beginning of period | Purchases | Sales Proceeds* | Dividend Income | Value,
end of
period |
Accretive Health, Inc. | $ 82,872 | $ - | $ 7,733 | $ - | $ 18,789 |
ASOS PLC | - | 162,163 | 180,696 | - | - |
ASOS PLC ADR | - | 187,227 | 265,148 | - | - |
athenahealth, Inc. | 294,726 | 1,164 | 4,732 | - | 327,395 |
CommVault Systems, Inc. | 159,387 | 5,572 | 161,670 | - | - |
Criteo SA sponsored ADR | - | 193,948 | 7,408 | - | 291,470 |
E2open, Inc. | 25,119 | - | 14,218 | - | - |
Foundation Medicine, Inc. | 35,879 | 11,036 | 106,305 | - | - |
GameLoft SE | 49,492 | - | 696 | - | 36,312 |
Groupon, Inc. Class A | 390,059 | 39,856 | 7,340 | - | 317,266 |
KYTHERA Biopharmaceuticals, Inc. | 42,226 | - | 92,734 | - | - |
Lion Biotechnologies, Inc. | 12,870 | 8,773 | 1,124 | - | 25,788 |
Marketo, Inc. | 56,923 | - | 3,220 | - | - |
Novadaq Technologies, Inc. | 38,683 | 27,409 | 21,282 | - | - |
NVE Corp. | 17,620 | - | 18,136 | 244 | - |
Portola Pharmaceuticals, Inc. | 58,747 | 14,580 | 1,782 | - | 140,217 |
PTC Therapeutics, Inc. | 55,466 | 2,229 | 119,843 | - | - |
Rackspace Hosting, Inc. | 293,484 | 787 | 237,780 | - | - |
Synchronoss Technologies, Inc. | 165,112 | - | 67,747 | - | 127,356 |
Trevena, Inc. | - | 21,605 | 389 | - | 19,522 |
Ubisoft Entertainment SA | 169,602 | 9,886 | 3,294 | - | 204,478 |
Zendesk, Inc. | 668 | 118,015 | 2,206 | - | 106,272 |
Total | $ 1,948,935 | $ 804,250 | $ 1,325,483 | $ 244 | $ 1,614,865 |
* Includes the value of securities delivered through in-kind transactions, if applicable.
See accompanying notes which are an integral part of the financial statements.
Annual Report
Investments - continued
Other Information |
The following is a summary of the inputs used, as of July 31, 2015, involving the Fund's assets and liabilities carried at fair value. The inputs or methodology used for valuing securities may not be an indication of the risk associated with investing in those securities. For more information on valuation inputs, and their aggregation into the levels used in the tables below, please refer to the Investment Valuation section in the accompanying Notes to Financial Statements. |
Valuation Inputs at Reporting Date: |
Description
(Amounts in thousands) | Total | Level 1 | Level 2 | Level 3 |
Investments in Securities: | | | | |
Equities: | | | | |
Consumer Discretionary | $ 2,240,944 | $ 2,204,997 | $ - | $ 35,947 |
Consumer Staples | 867,895 | 856,345 | - | 11,550 |
Energy | 184,919 | 184,919 | - | - |
Financials | 545,960 | 513,318 | - | 32,642 |
Health Care | 2,832,148 | 2,757,383 | 45,746 | 29,019 |
Industrials | 364,448 | 354,643 | - | 9,805 |
Information Technology | 6,396,628 | 6,192,673 | - | 203,955 |
Materials | 20,582 | 20,582 | - | - |
Telecommunication Services | 67,106 | 52,106 | - | 15,000 |
Money Market Funds | 580,525 | 580,525 | - | - |
Total Investments in Securities: | $ 14,101,155 | $ 13,717,491 | $ 45,746 | $ 337,918 |
Valuation Inputs at Reporting Date: |
The following is a reconciliation of Investments in Securities for which Level 3 inputs were used in determining value: |
(Amounts in thousands) | |
Investments in Securities: | |
Equities - Information Technology | |
Beginning Balance | $ 45,831 |
Net Realized Gain (Loss) on Investment Securities | - |
Net Unrealized Gain (Loss) on Investment Securities | 60,023 |
Cost of Purchases | 98,101 |
Proceeds of Sales | - |
Amortization/Accretion | - |
Transfers into Level 3 | - |
Transfers out of Level 3 | - |
Ending Balance | $ 203,955 |
The change in unrealized gain (loss) for the period attributable to Level 3 securities held at July 31, 2015 | $ 60,023 |
Equities - Other Investments in Securities | |
Beginning Balance | $ 47,700 |
Net Realized Gain (Loss) on Investment Securities | - |
Net Unrealized Gain (Loss) on Investment Securities | (3,108) |
Cost of Purchases | 99,371 |
Proceeds of Sales | (10,000) |
Amortization/Accretion | - |
Transfers into Level 3 | - |
Transfers out of Level 3 | - |
Ending Balance | $ 133,963 |
The change in unrealized gain (loss) for the period attributable to Level 3 securities held at July 31, 2015 | $ (3,108) |
The information used in the above reconciliations represents fiscal year to date activity for any Investments in Securities identified as using Level 3 inputs at either the beginning or the end of the current fiscal period. Transfers in or out of Level 3 represent the beginning value of any Security or Instrument where a change in the pricing level occurred from the beginning to the end of the period. The cost of purchases and the proceeds of sales may include securities received or delivered through corporate actions or exchanges. Realized and unrealized gains (losses) disclosed in the reconciliations are included in Net Gain (Loss) on the Fund's Statement of Operations. |
See accompanying notes which are an integral part of the financial statements.
Annual Report
Statement of Assets and Liabilities
Amounts in thousands (except per-share amounts) | | July 31, 2015 |
| | |
Assets | | |
Investment in securities, at value (including securities loaned of $505,388) - See accompanying schedule: Unaffiliated issuers (cost $8,904,710) | $ 11,905,765 | |
Fidelity Central Funds (cost $580,525) | 580,525 | |
Other affiliated issuers (cost $1,466,549) | 1,614,865 | |
Total Investments (cost $10,951,784) | | $ 14,101,155 |
Receivable for investments sold | | 136,937 |
Receivable for fund shares sold | | 12,385 |
Dividends receivable | | 2,414 |
Distributions receivable from Fidelity Central Funds | | 727 |
Other receivables | | 283 |
Total assets | | 14,253,901 |
| | |
Liabilities | | |
Payable for investments purchased | $ 170,398 | |
Payable for fund shares redeemed | 7,515 | |
Accrued management fee | 8,304 | |
Other affiliated payables | 1,548 | |
Other payables and accrued expenses | 233 | |
Collateral on securities loaned, at value | 519,055 | |
Total liabilities | | 707,053 |
| | |
Net Assets | | $ 13,546,848 |
Net Assets consist of: | | |
Paid in capital | | $ 9,853,507 |
Accumulated net investment loss | | (135) |
Accumulated undistributed net realized gain (loss) on investments and foreign currency transactions | | 544,136 |
Net unrealized appreciation (depreciation) on investments and assets and liabilities in foreign currencies | | 3,149,340 |
Net Assets | | $ 13,546,848 |
See accompanying notes which are an integral part of the financial statements.
Annual Report
Statement of Assets and Liabilities - continued
Amounts in thousands (except per-share amounts) | | July 31, 2015 |
OTC: | | |
Net Asset Value, offering price and redemption price per
share ($9,710,415 ÷ 111,634 shares) | | $ 86.98 |
| | |
Class K: | | |
Net Asset Value, offering price and redemption price per
share ($3,836,433 ÷ 43,660 shares) | | $ 87.87 |
See accompanying notes which are an integral part of the financial statements.
Annual Report
Financial Statements - continued
Statement of Operations
Amounts in thousands | Year ended July 31, 2015 |
Investment Income | | |
Dividends (including $244 earned from other affiliated issuers) | | $ 79,884 |
Income from Fidelity Central Funds (including $6,757 from security lending) | | 6,801 |
Total income | | 86,685 |
| | |
Expenses | | |
Management fee | | |
Basic fee | $ 74,469 | |
Performance adjustment | 6,326 | |
Transfer agent fees | 16,107 | |
Accounting and security lending fees | 1,491 | |
Custodian fees and expenses | 356 | |
Independent trustees' compensation | 52 | |
Appreciation in deferred trustee compensation account | 1 | |
Registration fees | 228 | |
Audit | 74 | |
Legal | 47 | |
Interest | 5 | |
Miscellaneous | 79 | |
Total expenses before reductions | 99,235 | |
Expense reductions | (598) | 98,637 |
Net investment income (loss) | | (11,952) |
Realized and Unrealized Gain (Loss) Net realized gain (loss) on: | | |
Investment securities: | | |
Unaffiliated issuers | 1,101,712 | |
Other affiliated issuers | 180,480 | |
Foreign currency transactions | (30) | |
Total net realized gain (loss) | | 1,282,162 |
Change in net unrealized appreciation (depreciation) on: Investment securities | 1,068,364 | |
Assets and liabilities in foreign currencies | (2) | |
Total change in net unrealized appreciation (depreciation) | | 1,068,362 |
Net gain (loss) | | 2,350,524 |
Net increase (decrease) in net assets resulting from operations | | $ 2,338,572 |
See accompanying notes which are an integral part of the financial statements.
Annual Report
Statement of Changes in Net Assets
Amounts in thousands | Year ended
July 31,
2015 | Year ended
July 31,
2014 |
Increase (Decrease) in Net Assets | | |
Operations | | |
Net investment income (loss) | $ (11,952) | $ (4,591) |
Net realized gain (loss) | 1,282,162 | 1,439,912 |
Change in net unrealized appreciation (depreciation) | 1,068,362 | 164,549 |
Net increase (decrease) in net assets resulting from operations | 2,338,572 | 1,599,870 |
Distributions to shareholders from net investment income | - | (7,143) |
Distributions to shareholders from net realized gain | (1,408,892) | (1,239,587) |
Total distributions | (1,408,892) | (1,246,730) |
Share transactions - net increase (decrease) | 1,841,344 | 1,469,555 |
Total increase (decrease) in net assets | 2,771,024 | 1,822,695 |
| | |
Net Assets | | |
Beginning of period | 10,775,824 | 8,953,129 |
End of period (including accumulated net investment loss of $135 and accumulated net investment loss of $142, respectively) | $ 13,546,848 | $ 10,775,824 |
See accompanying notes which are an integral part of the financial statements.
Annual Report
Financial Highlights - Fidelity OTC Portfolio
Years ended July 31, | 2015 | 2014 | 2013 | 2012 | 2011 |
Selected Per-Share Data | | | | | |
Net asset value, beginning of period | $ 81.23 | $ 78.98 | $ 57.53 | $ 59.28 | $ 45.00 |
Income from Investment Operations | | | | | |
Net investment income (loss) B | (.11) | (.06) | .36E | (.08) F | (.27) |
Net realized and unrealized gain (loss) | 16.14 | 12.78 | 21.37 | (1.67) | 14.55 |
Total from investment operations | 16.03 | 12.72 | 21.73 | (1.75) | 14.28 |
Distributions from net investment income | - | (.05) | (.28) | - | - |
Distributions from net realized gain | (10.28) | (10.42) | - | - | - |
Total distributions | (10.28) | (10.47) | (.28) | - | - |
Net asset value, end of period | $ 86.98 | $ 81.23 | $ 78.98 | $ 57.53 | $ 59.28 |
Total ReturnA | 21.34% | 17.96% | 37.93% | (2.95)% | 31.73% |
Ratios to Average Net Assets C, G | | | | | |
Expenses before reductions | .83% | .77% | .76% | .91% | .94% |
Expenses net of fee waivers, if any | .83% | .77% | .76% | .91% | .94% |
Expenses net of all reductions | .83% | .76% | .74% | .90% | .92% |
Net investment income (loss) | (.13)% | (.08)% | .55%E | (.14)% F | (.49)% |
Supplemental Data | | | | | |
Net assets, end of period (in millions) | $ 9,710 | $ 7,870 | $ 6,693 | $ 5,499 | $ 6,374 |
Portfolio turnover rate D | 66% H | 106% | 116% | 149% | 158% |
A Total returns would have been lower if certain expenses had not been reduced during the applicable periods shown.
B Calculated based on average shares outstanding during the period.
C Fees and expenses of any underlying Fidelity Central Funds are not included in the Fund's expense ratio. The Fund indirectly bears its proportionate share of the expenses of any underlying Fidelity Central Funds.
D Amount does not include the portfolio activity of any underlying Fidelity Central Funds.
E Investment income per share reflects a large, non-recurring dividend which amounted to $.10 per share. Excluding this non-recurring dividend, the ratio of net investment income (loss) to average net assets would have been .40%.
F Investment income per share reflects a large, non-recurring dividend which amounted to $.03 per share. Excluding this non-recurring dividend, the ratio of net investment income (loss) to average net assets would have been (.20)%.
G Expense ratios reflect operating expenses of the class. Expenses before reductions do not reflect amounts reimbursed by the investment adviser or reductions from brokerage service arrangements or reductions from other expense offset arrangements and do not represent the amount paid by the class during periods when reimbursements or reductions occur. Expenses net of fee waivers reflect expenses after reimbursement by the investment adviser but prior to reductions from brokerage service arrangements or other expense offset arrangements. Expenses net of all reductions represent the net expenses paid by the class.
H Portfolio turnover rate excludes securities received or delivered in-kind.
See accompanying notes which are an integral part of the financial statements.
Annual Report
Financial Highlights - Class K
Years ended July 31, | 2015 | 2014 | 2013 | 2012 | 2011 |
Selected Per-Share Data | | | | | |
Net asset value, beginning of period | $ 81.96 | $ 79.60 | $ 57.94 | $ 59.61 | $ 45.19 |
Income from Investment Operations | | | | | |
Net investment income (loss) B | (.01) | .04 | .45F | -G,I | (.19) |
Net realized and unrealized gain (loss) | 16.29 | 12.87 | 21.53 | (1.67) | 14.61 |
Total from investment operations | 16.28 | 12.91 | 21.98 | (1.67) | 14.42 |
Distributions from net investment income | - | (.10) | (.32) | - | - |
Distributions from net realized gain | (10.37) | (10.46) | - | - | - |
Total distributions | (10.37) | (10.55) K | (.32) | - | - |
Net asset value, end of period | $ 87.87 | $ 81.96 | $ 79.60 | $ 57.94 | $ 59.61 |
Total ReturnA | 21.49% | 18.10% | 38.11% | (2.80)% | 31.91% |
Ratios to Average Net Assets C, H | | | | | |
Expenses before reductions | .72% | .65% | .62% | .77% | .80% |
Expenses net of fee waivers, if any | .72% | .65% | .62% | .77% | .80% |
Expenses net of all reductions | .71% | .64% | .60% | .76% | .78% |
Net investment income (loss) | (.02)% | .05% | .69% F | -%E,G | (.35)% |
Supplemental Data | | | | | |
Net assets, end of period (in millions) | $ 3,836 | $ 2,906 | $ 2,260 | $ 1,644 | $ 1,363 |
Portfolio turnover rate D | 66% J | 106% | 116% | 149% | 158% |
A Total returns would have been lower if certain expenses had not been reduced during the applicable periods shown.
B Calculated based on average shares outstanding during the period.
C Fees and expenses of any underlying Fidelity Central Funds are not included in the Fund's expense ratio. The Fund indirectly bears its proportionate share of the expenses of any underlying Fidelity Central Funds.
D Amount does not include the portfolio activity of any underlying Fidelity Central Funds.
E Amount represents less than .01%.
F Investment income per share reflects a large, non-recurring dividend which amounted to $.10 per share. Excluding this non-recurring dividend, the ratio of net investment income (loss) to average net assets would have been .53%.
G Investment income per share reflects a large, non-recurring dividend which amounted to $.03 per share. Excluding this non-recurring dividend, the ratio of net investment income (loss) to average net assets would have been (.06)%.
H Expense ratios reflect operating expenses of the class. Expenses before reductions do not reflect amounts reimbursed by the investment adviser or reductions from brokerage service arrangements or reductions from other expense offset arrangements and do not represent the amount paid by the class during periods when reimbursements or reductions occur. Expenses net of fee waivers reflect expenses after reimbursement by the investment adviser but prior to reductions from brokerage service arrangements or other expense offset arrangements. Expenses net of all reductions represent the net expenses paid by the class.
I Amount represents less than $.01 per share.
J Portfolio turnover rate excludes securities received or delivered in-kind.
K Total distributions of $10.55 per share is comprised of distributions from net investment income of $.098 and distributions from net realized gain of $10.456 per share.
See accompanying notes which are an integral part of the financial statements.
Annual Report
For the period ended July 31, 2015
(Amounts in thousands except percentages)
1. Organization.
Fidelity OTC Portfolio (the Fund) is a non-diversified fund of Fidelity Securities Fund (the Trust) and is authorized to issue an unlimited number of shares. The Trust is registered under the Investment Company Act of 1940, as amended (the 1940 Act), as an open-end management investment company organized as a Massachusetts business trust. The Fund offers OTC and Class K shares, each of which has equal rights as to assets and voting privileges. Each class has exclusive voting rights with respect to matters that affect that class.
2. Investments in Fidelity Central Funds.
The Fund invests in Fidelity Central Funds, which are open-end investment companies generally available only to other investment companies and accounts managed by the investment adviser and its affiliates. The Fund's Schedule of Investments lists each of the Fidelity Central Funds held as of period end, if any, as an investment of the Fund, but does not include the underlying holdings of each Fidelity Central Fund. As an Investing Fund, the Fund indirectly bears its proportionate share of the expenses of the underlying Fidelity Central Funds.
The Money Market Central Funds seek preservation of capital and current income and are managed by Fidelity Investments Money Management, Inc. (FIMM), an affiliate of the investment adviser. Annualized expenses of the Money Market Central Funds as of their most recent shareholder report date are less than .01%.
A complete unaudited list of holdings for each Fidelity Central Fund is available upon request or at the Securities and Exchange Commission (the SEC) website at www.sec.gov. In addition, the financial statements of the Fidelity Central Funds, which are not covered by the Fund's Report of Independent Registered Public Accounting Firm, are available on the SEC website or upon request.
3. Significant Accounting Policies.
The financial statements have been prepared in conformity with accounting principles generally accepted in the United States of America (GAAP), which require management to make certain estimates and assumptions at the date of the financial statements. Actual results could differ from those estimates. Subsequent events, if any, through the date that the financial statements were issued have been evaluated in the preparation of the financial statements. The following summarizes the significant accounting policies of the Fund:
Annual Report
3. Significant Accounting Policies - continued
Investment Valuation. Investments are valued as of 4:00 p.m. Eastern time on the last calendar day of the period. The Board of Trustees (the Board) has delegated the day to day responsibility for the valuation of the Fund's investments to the Fidelity Management & Research Company (FMR) Fair Value Committee (the Committee). In accordance with valuation policies and procedures approved by the Board, the Fund attempts to obtain prices from one or more third party pricing vendors or brokers to value its investments. When current market prices, quotations or currency exchange rates are not readily available or reliable, investments will be fair valued in good faith by the Committee, in accordance with procedures adopted by the Board. Factors used in determining fair value vary by investment type and may include market or investment specific events. The frequency with which these procedures are used cannot be predicted and they may be utilized to a significant extent. The Committee oversees the Fund's valuation policies and procedures and reports to the Board on the Committee's activities and fair value determinations. The Board monitors the appropriateness of the procedures used in valuing the Fund's investments and ratifies the fair value determinations of the Committee.
The Fund categorizes the inputs to valuation techniques used to value its investments into a disclosure hierarchy consisting of three levels as shown below:
Level 1 - quoted prices in active markets for identical investments
Level 2 - other significant observable inputs (including quoted prices for similar investments, interest rates, prepayment speeds, etc.)
Level 3 - unobservable inputs (including the Fund's own assumptions based on the best information available)
Valuation techniques used to value the Fund's investments by major category are as follows:
Equity securities, including restricted securities, for which market quotations are readily available, are valued at the last reported sale price or official closing price as reported by a third party pricing vendor on the primary market or exchange on which they are traded and are categorized as Level 1 in the hierarchy. In the event there were no sales during the day or closing prices are not available, securities are valued at the last quoted bid price or may be valued using the last available price and are generally categorized as Level 2 in the hierarchy. For foreign equity securities, when market or security specific events arise, comparisons to the valuation of American Depositary Receipts (ADRs), futures contracts, Exchange-Traded Funds (ETFs) and certain indexes as well as quoted prices for similar securities may be used and would be categorized as Level 2 in the hierarchy. Utilizing these techniques may result in transfers between Level 1 and Level 2.
Annual Report
Notes to Financial Statements - continued
(Amounts in thousands except percentages)
3. Significant Accounting Policies - continued
Investment Valuation - continued
For equity securities, including restricted securities, where observable inputs are limited, assumptions about market activity and risk are used and these securities may be categorized as Level 3 in the hierarchy. Equity securities, including restricted securities, for which observable inputs are not available are valued using alternate valuation approaches, including the market approach and the income approach and are categorized as Level 3 in the hierarchy. The market approach generally consists of using comparable market transactions while the income approach generally consists of using the net present value of estimated future cash flows, adjusted as appropriate for liquidity, credit, market and/or other risk factors.
Investments in open-end mutual funds, including the Fidelity Central Funds, are valued at their closing net asset value (NAV) each business day and are categorized as Level 1 in the hierarchy.
The following provides information on Level 3 securities held by the Fund that were valued at period end based on unobservable inputs. These amounts exclude valuations provided by a broker.
Asset Type | Fair Value at 07/31/15
(000s) | Valuation
Technique(s) | Unobservable
Input | Amount or Range/Weighted Average | Impact to
Valuation from an Increase
in Input* |
Equities | $ 337,918 | Last transaction price | Transaction price | $0.15 - $77.46/$24.61 | Increase |
| | Market comparable | Discount rate
EV/Sales multiple
Discount for lack of marketability
Premium rate | 10.0% - 40.0%/22.6%
1.3 - 8.8/4.4
15.0% - 30.0%/20.1%
15% | Decrease
Increase
Decrease
Increase |
| | Replacement cost | Liquidation preference | $8.34 | Increase |
* Represents the expected directional change in the fair value of the Level 3 investments that would result from an increase in the corresponding input. A decrease to the unobservable input would have the opposite effect. Significant changes in these inputs could result in significantly higher or lower fair value measurements.
Changes in valuation techniques may result in transfers in or out of an assigned level within the disclosure hierarchy. The aggregate value of investments by input level as of July 31, 2015, as well as a roll forward of Level 3 investments, is included at the end of the Fund's Schedule of Investments.
Annual Report
3. Significant Accounting Policies - continued
Foreign Currency. The Fund may use foreign currency contracts to facilitate transactions in foreign-denominated securities. Gains and losses from these transactions may arise from changes in the value of the foreign currency or if the counterparties do not perform under the contracts' terms.
Foreign-denominated assets, including investment securities, and liabilities are translated into U.S. dollars at the exchange rates at period end. Purchases and sales of investment securities, income and dividends received and expenses denominated in foreign currencies are translated into U.S. dollars at the exchange rate in effect on the transaction date.
The effects of exchange rate fluctuations on investments are included with the net realized and unrealized gain (loss) on investment securities. Other foreign currency transactions resulting in realized and unrealized gain (loss) are disclosed separately.
Investment Transactions and Income. For financial reporting purposes, the Fund's investment holdings and NAV include trades executed through the end of the last business day of the period. The NAV per share for processing shareholder transactions is calculated as of the close of business of the New York Stock Exchange (NYSE), normally 4:00 p.m. Eastern time and includes trades executed through the end of the prior business day. Gains and losses on securities sold are determined on the basis of identified cost and may include proceeds received from litigation. Dividend income is recorded on the ex-dividend date, except for certain dividends from foreign securities where the ex-dividend date may have passed, which are recorded as soon as the Fund is informed of the ex-dividend date. Non-cash dividends included in dividend income, if any, are recorded at the fair market value of the securities received. Income and capital gain distributions from Fidelity Central Funds, if any, are recorded on the ex-dividend date. Distributions received on securities that represent a return of capital or capital gain are recorded as a reduction of cost of investments and/or as a realized gain. Subsequent to ex-dividend date the Fund determines the components of these distributions, based upon receipt of tax filings or other correspondence relating to the underlying investment. Interest income is accrued as earned and includes coupon interest and amortization of premium and accretion of discount on debt securities as applicable. Investment income is recorded net of foreign taxes withheld where recovery of such taxes is uncertain.
Class Allocations and Expenses. Investment income, realized and unrealized capital gains and losses, common expenses of the Fund, and certain fund-level expense reductions, if any, are allocated daily on a pro-rata basis to each class based on the relative net assets of each class to the total net assets of the Fund. Each class differs with respect to transfer agent fees incurred. Certain expense reductions may also differ by class. For the reporting period, the allocated portion of income and expenses to each class as a percent
Annual Report
Notes to Financial Statements - continued
(Amounts in thousands except percentages)
3. Significant Accounting Policies - continued
Class Allocations and Expenses - continued
of its average net assets may vary due to the timing of recording these transactions in relation to fluctuating net assets of the classes. Expenses directly attributable to a fund are charged to that fund. Expenses attributable to more than one fund are allocated among the respective funds on the basis of relative net assets or other appropriate methods. Expense estimates are accrued in the period to which they relate and adjustments are made when actual amounts are known.
Deferred Trustee Compensation. Under a Deferred Compensation Plan (the Plan), independent Trustees may elect to defer receipt of a portion of their annual compensation. Deferred amounts are invested in a cross-section of Fidelity funds, are marked-to-market and remain in the Fund until distributed in accordance with the Plan. The investment of deferred amounts and the offsetting payable to the Trustees are included in the accompanying Statement of Assets and Liabilities.
Income Tax Information and Distributions to Shareholders. Each year, the Fund intends to qualify as a regulated investment company under Subchapter M of the Internal Revenue Code, including distributing substantially all of its taxable income and realized gains. As a result, no provision for U.S. Federal income taxes is required. As of July 31, 2015, the Fund did not have any unrecognized tax benefits in the financial statements; nor is the Fund aware of any tax positions for which it is reasonably possible that the total amounts of unrecognized tax benefits will significantly change in the next twelve months. The Fund files a U.S. federal tax return, in addition to state and local tax returns as required. The Fund's federal income tax returns are subject to examination by the Internal Revenue Service (IRS) for a period of three fiscal years after they are filed. State and local tax returns may be subject to examination for an additional fiscal year depending on the jurisdiction. Foreign taxes are provided for based on the Fund's understanding of the tax rules and rates that exist in the foreign markets in which it invests.
Distributions are declared and recorded on the ex-dividend date. Income dividends and capital gain distributions are declared separately for each class. Income and capital gain distributions are determined in accordance with income tax regulations, which may differ from GAAP. In addition, the Fund claimed a portion of the payment made to redeeming shareholders as a distribution for income tax purposes.
Capital accounts within the financial statements are adjusted for permanent book-tax differences. These adjustments have no impact on net assets or the results of operations. Capital accounts are not adjusted for temporary book-tax differences which will reverse in a subsequent period.
Annual Report
3. Significant Accounting Policies - continued
Income Tax Information and Distributions to Shareholders - continued
Book-tax differences are primarily due to redemptions in-kind, foreign currency transactions, passive foreign investment companies (PFIC), net operating losses, partnerships, deferred trustees compensation and losses deferred due to wash sales.
The federal tax cost of investment securities and unrealized appreciation (depreciation) as of period end were as follows:
Gross unrealized appreciation | $ 4,118,286 |
Gross unrealized depreciation | (1,024,672) |
Net unrealized appreciation (depreciation) on securities | $ 3,093,614 |
| |
Tax Cost | $ 11,007,541 |
The tax-based components of distributable earnings as of period end were as follows:
Undistributed ordinary income | $ 274,172 |
Undistributed long-term capital gain | $ 325,721 |
Net unrealized appreciation (depreciation) on securities and other investments | $ 3,093,583 |
The tax character of distributions paid was as follows:
| July 31, 2015 | July 31, 2014 |
Ordinary Income | $ 637,244 | $ 324,481 |
Long-term Capital Gains | 771,648 | 922,249 |
Total | $ 1,408,892 | $ 1,246,730 |
Restricted Securities. The Fund may invest in securities that are subject to legal or contractual restrictions on resale. These securities generally may be resold in transactions exempt from registration or to the public if the securities are registered. Disposal of these securities may involve time-consuming negotiations and expense, and prompt sale at an acceptable price may be difficult. Information regarding restricted securities is included at the end of the Fund's Schedule of Investments.
Annual Report
Notes to Financial Statements - continued
(Amounts in thousands except percentages)
4. Purchases and Sales of Investments.
Purchases and sales of securities, other than short-term securities and in-kind transactions, aggregated $8,803,958 and $8,169,239, respectively.
Redemptions In-Kind. During the period, 2,605 shares of the Fund held by unaffiliated entities were redeemed for cash and investments with a value of $225,764. The net realized gain of $95,853 on investments delivered through in-kind redemptions is included in the accompanying Statement of Operations. The amount of in-kind redemptions is included in share transactions in the accompanying Statement of Changes in Net Assets as well as Note 10: Share Transactions. The Fund recognized no gain or loss for federal income tax purposes.
5. Fees and Other Transactions with Affiliates.
Management Fee. Fidelity Management & Research Company (the investment adviser) and its affiliates provide the Fund with investment management related services for which the Fund pays a monthly management fee. The management fee is the sum of an individual fund fee rate that is based on an annual rate of .35% of the Fund's average net assets and an annualized group fee rate that averaged 25% during the period. The group fee rate is based upon the average net assets of all the mutual funds advised by the investment adviser, including any mutual funds previously advised by the investment adviser that are currently advised by Fidelity SelectCo, LLC, an affiliate of the investment adviser. The group fee rate decreases as assets under management increase and increases as assets under management decrease. In addition, the management fee is subject to a performance adjustment (up to a maximum of ± .20% of the Fund's average net assets over a 36 month performance period). The upward or downward adjustment to the management fee is based on the relative investment performance of OTC as compared to its benchmark index, the Nasdaq Composite Index, over the same 36 month performance period. For the reporting period, the total annual management fee rate, including the performance adjustment, was .65% of the Fund's average net assets. The performance adjustment included in the management fee rate may be higher or lower than the maximum performance adjustment rate due to the difference between the average net assets for the reporting and performance periods.
Transfer Agent Fees. Fidelity Investments Institutional Operations Company, Inc., (FIIOC), an affiliate of the investment adviser, is the transfer, dividend disbursing and shareholder servicing agent for each class of the Fund. FIIOC receives account fees and asset-based fees that vary according to the account size and type of account of the shareholders of OTC. FIIOC receives an asset-based fee of Class K's average net assets. FIIOC pays for typesetting, printing and mailing of shareholder reports, except proxy statements.
Annual Report
5. Fees and Other Transactions with Affiliates - continued
Transfer Agent Fees - continued
For the period, transfer agent fees for each class were as follows:
| Amount | % of
Class-Level Average
Net Assets |
OTC | $ 14,405 | .16 |
Class K | 1,702 | .05 |
| $ 16,107 | |
Accounting and Security Lending Fees. Fidelity Service Company, Inc. (FSC), an affiliate of the investment adviser, maintains the Fund's accounting records. The accounting fee is based on the level of average net assets for each month. Under a separate contract, FSC administers the security lending program. The security lending fee is based on the number and duration of lending transactions.
Brokerage Commissions. The Fund placed a portion of its portfolio transactions with brokerage firms which are affiliates of the investment adviser. Brokerage commissions are included in net realized gain (loss) and change in net unrealized appreciation (depreciation) in the Statement of Operations. The commissions paid to these affiliated firms were $175 for the period.
Interfund Lending Program. Pursuant to an Exemptive Order issued by the SEC, the Fund, along with other registered investment companies having management contracts with FMR or other affiliated entities of FMR, may participate in an interfund lending program. This program provides an alternative credit facility allowing the funds to borrow from, or lend money to, other participating affiliated funds. At period end, there were no interfund loans outstanding. The Fund's activity in this program during the period for which loans were outstanding was as follows:
Borrower or Lender | Average Loan
Balance | Weighted Average Interest Rate | Interest Expense |
Borrower | $ 13,255 | .34% | $ 5 |
6. Committed Line of Credit.
The Fund participates with other funds managed by the investment adviser or an affiliate in a $4.25 billion credit facility (the "line of credit") to be utilized for temporary or emergency purposes to fund shareholder redemptions or for other short-term liquidity purposes. The Fund has agreed to pay commitment fees on its pro-rata portion of the line of credit, which amounted to $18 and is reflected in Miscellaneous expenses on the Statement of Operations. During the period, the Fund did not borrow on this line of credit.
Annual Report
Notes to Financial Statements - continued
(Amounts in thousands except percentages)
7. Security Lending.
The Fund lends portfolio securities through a lending agent from time to time in order to earn additional income. For equity securities, a lending agent is used and may loan securities to certain qualified borrowers, including Fidelity Capital Markets (FCM), a broker-dealer affiliated with the Fund. On the settlement date of the loan, the Fund receives collateral (in the form of U.S. Treasury obligations, letters of credit and/or cash) against the loaned securities and maintains collateral in an amount not less than 100% of the market value of the loaned securities during the period of the loan. The market value of the loaned securities is determined at the close of business of the Fund and any additional required collateral is delivered to the Fund on the next business day. If the borrower defaults on its obligation to return the securities loaned because of insolvency or other reasons, the Fund may apply collateral received from the borrower against the obligation. The Fund may experience delays and costs in recovering the securities loaned. Any cash collateral received is invested in the Fidelity Securities Lending Cash Central Fund. The value of loaned securities and cash collateral at period end are disclosed on the Fund's Statement of Assets and Liabilities. The value of securities loaned to FCM at period end was $34,191. Security lending income represents the income earned on investing cash collateral, less rebates paid to borrowers and any lending agent fees associated with the loan, plus any premium payments received for lending certain types of securities. Security lending income is presented in the Statement of Operations as a component of income from Fidelity Central Funds and includes securities loaned to FCM of $459.
8. Expense Reductions.
Commissions paid to certain brokers with whom the investment adviser, or its affiliates, places trades on behalf of the Fund include an amount in addition to trade execution, which may be rebated back to the Fund to offset certain expenses. This amount totaled $365 for the period. In addition, through arrangements with the Fund's custodian, credits realized as a result of uninvested cash balances were used to reduce the Fund's expenses. During the period, these credits reduced the Fund's custody expenses by $1.
In addition, during the period the investment adviser reimbursed/waived a portion of fund-level operating expenses in the amount of $52 and a portion of class-level operating expenses in the amount of $180.
Annual Report
9. Distributions to Shareholders.
Distributions to shareholders of each class were as follows:
Years ended July 31, | 2015 | 2014 |
From net investment income | | |
OTC | $ - | $ 4,344 |
Class K | - | 2,799 |
Total | $ - | $ 7,143 |
From net realized gain | | |
OTC | $ 1,012,327 | $ 926,740 |
Class K | 396,565 | 312,847 |
Total | $ 1,408,892 | $ 1,239,587 |
10. Share Transactions.
Share transactions for each class were as follows and may contain automatic conversions between classes or exchanges between funds:
| Shares | Dollars |
Years ended July 31, | 2015 | 2014 | 2015 | 2014 |
OTC | | | | |
Shares sold | 22,946 | 26,717 | $ 1,893,100 | $ 2,114,409 |
Reinvestment of distributions | 12,406 | 12,308 | 985,025 | 905,081 |
Shares redeemed | (20,601) | (26,885) | (1,665,615) | (2,095,020) |
Net increase (decrease) | 14,751 | 12,140 | $ 1,212,510 | $ 924,470 |
Class K | | | | |
Shares sold | 16,984 | 11,495 | $ 1,383,593 | $ 915,992 |
Reinvestment of distributions | 4,953 | 4,258 | 396,565 | 315,646 |
Shares redeemed | (13,732)A | (8,692) | (1,151,324)A | (686,553) |
Net increase (decrease) | 8,205 | 7,061 | $ 628,834 | $ 545,085 |
A Amount includes in-kind redemptions (see Note 4: Redemptions In-Kind).
11. Other.
The Fund's organizational documents provide former and current trustees and officers with a limited indemnification against liabilities arising in connection with the performance of their duties to the Fund. In the normal course of business, the Fund may also enter into contracts that provide general indemnifications. The Fund's maximum exposure under these arrangements is unknown as this would be dependent on future claims that may be made against the Fund. The risk of material loss from such claims is considered remote.
Annual Report
To the Trustees of Fidelity Securities Fund and Shareholders of Fidelity OTC Portfolio:
We have audited the accompanying statement of assets and liabilities of Fidelity OTC Portfolio (the Fund), a fund of Fidelity Securities Fund, including the schedule of investments, as of July 31, 2015, and the related statement of operations for the year then ended, the statement of changes in net assets for each of the two years in the period then ended, and the financial highlights for each of the five years in the period then ended. These financial statements and financial highlights are the responsibility of the Fund's management. Our responsibility is to express an opinion on these financial statements and financial highlights based on our audits.
We conducted our audits in accordance with the standards of the Public Company Accounting Oversight Board (United States). Those standards require that we plan and perform the audit to obtain reasonable assurance about whether the financial statements and financial highlights are free of material misstatement. The Fund is not required to have, nor were we engaged to perform, an audit of its internal control over financial reporting. Our audits included consideration of internal control over financial reporting as a basis for designing audit procedures that are appropriate in the circumstances, but not for the purpose of expressing an opinion on the effectiveness of the Fund's internal control over financial reporting. Accordingly, we express no such opinion. An audit also includes examining, on a test basis, evidence supporting the amounts and disclosures in the financial statements, assessing the accounting principles used and significant estimates made by management, as well as evaluating the overall financial statement presentation. Our procedures included confirmation of securities owned as of July 31, 2015, by correspondence with the custodians and brokers; when replies were not received from brokers, we performed other auditing procedures. We believe that our audits provide a reasonable basis for our opinion.
In our opinion, such financial statements and financial highlights referred to above present fairly, in all material respects, the financial position of Fidelity OTC Portfolio as of July 31, 2015, the results of its operations for the year then ended, the changes in its net assets for each of the two years in the period then ended, and the financial highlights for each of the five years in the period then ended, in conformity with accounting principles generally accepted in the United States of America.
DELOITTE & TOUCHE LLP
Boston, Massachusetts
September 24, 2015
Annual Report
The Trustees, Member of the Advisory Board, and officers of the trust and fund, as applicable, are listed below. The Board of Trustees governs the fund and is responsible for protecting the interests of shareholders. The Trustees are experienced executives who meet periodically throughout the year to oversee the fund's activities, review contractual arrangements with companies that provide services to the fund, oversee management of the risks associated with such activities and contractual arrangements, and review the fund's performance. Each of the Trustees oversees 170 funds.
The Trustees hold office without limit in time except that (a) any Trustee may resign; (b) any Trustee may be removed by written instrument, signed by at least two-thirds of the number of Trustees prior to such removal; (c) any Trustee who requests to be retired or who has become incapacitated by illness or injury may be retired by written instrument signed by a majority of the other Trustees; and (d) any Trustee may be removed at any special meeting of shareholders by a two-thirds vote of the outstanding voting securities of the trust. Each Trustee who is not an interested person (as defined in the 1940 Act) of the trust and the fund (Independent Trustee), shall retire not later than the last day of the calendar year in which his or her 75th birthday occurs. The Independent Trustees may waive this mandatory retirement age policy with respect to individual Trustees. The officers and Advisory Board Member hold office without limit in time, except that any officer and Advisory Board Member may resign or may be removed by a vote of a majority of the Trustees at any regular meeting or any special meeting of the Trustees. Except as indicated, each individual has held the office shown or other offices in the same company for the past five years.
Experience, Skills, Attributes, and Qualifications of the Fund's Trustees. The Governance and Nominating Committee has adopted a statement of policy that describes the experience, qualifications, attributes, and skills that are necessary and desirable for potential Independent Trustee candidates (Statement of Policy). The Board believes that each Trustee satisfied at the time he or she was initially elected or appointed a Trustee, and continues to satisfy, the standards contemplated by the Statement of Policy. The Governance and Nominating Committee also engages professional search firms to help identify potential Independent Trustee candidates who have the experience, qualifications, attributes, and skills consistent with the Statement of Policy. From time to time, additional criteria based on the composition and skills of the current Independent Trustees, as well as experience or skills that may be appropriate in light of future changes to board composition, business conditions, and regulatory or other developments, have also been considered by the professional search firms and the Governance and Nominating Committee. In addition, the Board takes into account the Trustees' commitment and participation in Board and committee meetings, as well as their leadership of standing and ad hoc committees throughout their tenure.
In determining that a particular Trustee was and continues to be qualified to serve as a Trustee, the Board has considered a variety of criteria, none of which, in isolation, was controlling. The Board believes that, collectively, the Trustees have balanced and diverse experience, qualifications, attributes, and skills, which allow the Board to operate effectively in governing the fund and protecting the interests of shareholders. Information about the specific experience, skills, attributes, and qualifications of each Trustee, which in each case led to the Board's conclusion that the Trustee should serve (or continue to serve) as a trustee of the fund, is provided below.
Annual Report
Trustees and Officers - continued
Board Structure and Oversight Function. James C. Curvey is an interested person (as defined in the 1940 Act) and currently serves as Chairman. The Trustees have determined that an interested Chairman is appropriate and benefits shareholders because an interested Chairman has a personal and professional stake in the quality and continuity of services provided to the fund. Independent Trustees exercise their informed business judgment to appoint an individual of their choosing to serve as Chairman, regardless of whether the Trustee happens to be independent or a member of management. The Independent Trustees have determined that they can act independently and effectively without having an Independent Trustee serve as Chairman and that a key structural component for assuring that they are in a position to do so is for the Independent Trustees to constitute a substantial majority for the Board. The Independent Trustees also regularly meet in executive session. Ned C. Lautenbach serves as Chairman of the Independent Trustees and as such (i) acts as a liaison between the Independent Trustees and management with respect to matters important to the Independent Trustees and (ii) with management prepares agendas for Board meetings.
Fidelity funds are overseen by different Boards of Trustees. The fund's Board oversees Fidelity's high income and certain equity funds and other Boards oversee Fidelity's investment-grade bond, money market, asset allocation, and sector funds. The asset allocation funds may invest in Fidelity funds overseen by the fund's Board. The use of separate Boards, each with its own committee structure, allows the Trustees of each group of Fidelity funds to focus on the unique issues of the funds they oversee, including common research, investment, and operational issues. On occasion, the separate Boards establish joint committees to address issues of overlapping consequences for the Fidelity funds overseen by each Board.
The Trustees operate using a system of committees to facilitate the timely and efficient consideration of all matters of importance to the Trustees, the fund, and fund shareholders and to facilitate compliance with legal and regulatory requirements and oversight of the fund's activities and associated risks. The Board, acting through its committees, has charged FMR and its affiliates with (i) identifying events or circumstances the occurrence of which could have demonstrably adverse effects on the fund's business and/or reputation; (ii) implementing processes and controls to lessen the possibility that such events or circumstances occur or to mitigate the effects of such events or circumstances if they do occur; and (iii) creating and maintaining a system designed to evaluate continuously business and market conditions in order to facilitate the identification and implementation processes described in (i) and (ii) above. Because the day-to-day operations and activities of the fund are carried out by or through FMR, its affiliates and other service providers, the fund's exposure to risks is mitigated but not eliminated by the processes overseen by the Trustees. While each of the Board's committees has responsibility for overseeing different aspects of the fund's activities, oversight is exercised primarily through the Operations, Audit, and Compliance Committees. In addition, the Independent Trustees have worked with FMR to enhance the Board's oversight of investment and financial risks, legal and regulatory risks, technology risks, and operational risks, including the development of additional risk reporting to the Board. For example, a working group comprised of Independent Trustees and FMR has worked and continues to work to review the Fidelity funds' valuation-related activities, reporting and risk management. Appropriate personnel, including but not limited to the fund's Chief Compliance Officer (CCO), FMR's internal auditor, the independent accountants, the fund's Treasurer and portfolio management personnel, make periodic reports to the Board's committees, as appropriate, including an annual review of FMR's risk management program for the Fidelity funds. The responsibilities of each standing committee, including their oversight responsibilities, are described further under "Standing Committees of the Fund's Trustees."
Annual Report
The fund's Statement of Additional Information (SAI) includes more information about the Trustees. To request a free copy, call Fidelity at 1-800-544-8544.
Interested Trustees*:
Correspondence intended for each Trustee who is an interested person may be sent to Fidelity Investments, 245 Summer Street, Boston, Massachusetts 02210.
Name, Year of Birth; Principal Occupations and Other Relevant Experience+ |
James C. Curvey (1935) |
Year of Election or Appointment: 2007 Trustee Chairman of the Board of Trustees |
| Mr. Curvey also serves as Trustee of other Fidelity funds. Mr. Curvey is a Director of Fidelity Research & Analysis Co. (investment adviser firm, 2009-present), and Vice Chairman (2007-present) and Director of FMR LLC (diversified financial services company). In addition, Mr. Curvey serves as an Overseer for the Boston Symphony Orchestra and a member of the board of Artis-Naples, Naples, Florida, and as a Trustee for Brewster Academy, Wolfeboro, New Hampshire. Previously, Mr. Curvey served as a Director of Fidelity Investments Money Management, Inc. (investment adviser firm, 2009-2014), a Director of FMR (investment adviser firm, 2007-2014), and a Director of FMR Co., Inc. (investment adviser firm, 2007-2014). |
Charles S. Morrison (1960) |
Year of Election or Appointment: 2014 Trustee |
| Mr. Morrison also serves as Trustee of other funds. He serves as a Director of Fidelity Investments Money Management, Inc. (FIMM) (investment adviser firm, 2014-present), Director of Fidelity SelectCo, LLC (investment adviser firm, 2014-present), President, Asset Management (2014-present), and is an employee of Fidelity Investments. Previously, Mr. Morrison served as Vice President of Fidelity's Fixed Income and Asset Allocation Funds (2012-2014), President, Fixed Income (2011-2014), Vice President of Fidelity's Money Market Funds (2005-2009), President, Money Market Group Leader of FMR (investment adviser firm, 2009), and Senior Vice President, Money Market Group of FMR (2004-2009). Mr. Morrison also served as Vice President of Fidelity's Bond Funds (2002-2005), certain Balanced Funds (2002-2005), and certain Asset Allocation Funds (2002-2007), and as Senior Vice President (2002-2005) of Fidelity's Bond Division. |
* Trustees have been determined to be "Interested Trustees" by virtue of, among other things, their affiliation with the trust or various entities under common control with FMR.
+ The information above includes each Trustee's principal occupation during the last five years and other information relating to the experience, attributes, and skills relevant to each Trustee's qualifications to serve as a Trustee, which led to the conclusion that each Trustee should serve as a Trustee for the fund.
Annual Report
Independent Trustees:
Correspondence intended for each Independent Trustee (that is, the Trustees other than the Interested Trustees) may be sent to Fidelity Investments, P.O. Box 55235, Boston, Massachusetts 02205-5235.
Name, Year of Birth; Principal Occupations and Other Relevant Experience+ |
Dennis J. Dirks (1948) |
Year of Election or Appointment: 2005 Trustee |
| Mr. Dirks also serves as Trustee of other Fidelity funds. Prior to his retirement in May 2003, Mr. Dirks was Chief Operating Officer and a member of the Board of The Depository Trust & Clearing Corporation (DTCC). He also served as President, Chief Operating Officer, and Board member of The Depository Trust Company (DTC) and President and Board member of the National Securities Clearing Corporation (NSCC). In addition, Mr. Dirks served as Chief Executive Officer and Board member of the Government Securities Clearing Corporation, Chief Executive Officer and Board member of the Mortgage-Backed Securities Clearing Corporation, as a Trustee and a member of the Finance Committee of Manhattan College (2005-2008), and as a Trustee and a member of the Finance Committee of AHRC of Nassau County (2006-2008). Mr. Dirks is a member of the Independent Directors Council (IDC) Governing Council (2010-present) and Board of Directors for The Brookville Center for Children's Services, Inc. (2009-present). |
Alan J. Lacy (1953) |
Year of Election or Appointment: 2008 Trustee |
| Mr. Lacy also serves as Trustee of other Fidelity funds. Mr. Lacy serves as a member of the Board of Directors of Dave & Buster's Entertainment, Inc. (restaurant and entertainment complexes, 2010-present) and Bristol-Myers Squibb Company (global pharmaceuticals, 2008-present). In addition, Mr. Lacy served as Senior Adviser (2007-2014) of Oak Hill Capital Partners, L.P. (private equity) and also served as Chief Executive Officer (2000-2005) and Vice Chairman (2005-2006) of Sears Holdings Corporation and Sears, Roebuck and Co. (retail). Mr. Lacy is a member of the Board of Trustees of The National Parks Conservation Association (2006-present). Previously, Mr. Lacy served as Chairman of the Board of Trustees of the National Parks Conservation Association (2008-2011) and as a member of the Board of Directors for The Western Union Company (global money transfer, 2006-2011), The Hillman Companies, Inc. (hardware wholesalers, 2010-2014), and Earth Fare, Inc. (retail grocery, 2010-2014). |
Ned C. Lautenbach (1944) |
Year of Election or Appointment: 2000 Trustee Chairman of the Independent Trustees |
| Mr. Lautenbach also serves as Trustee of other Fidelity funds. Mr. Lautenbach currently serves as the Lead Director of the Eaton Corporation Board of Directors (diversified industrial, 1997-present). Mr. Lautenbach is Chairman of the Board of Directors of Artis-Naples in Naples, Florida (2012-present), a member of the Council on Foreign Relations (1994-present), and a member of the Board of Governors, State University System of Florida (2013-present). Previously, Mr. Lautenbach was a Partner/Advisory Partner at Clayton, Dubilier & Rice, LLC (private equity investment, 1998-2010), as well as a Director of Sony Corporation (2006-2007). |
Joseph Mauriello (1944) |
Year of Election or Appointment: 2008 Trustee |
| Mr. Mauriello also serves as Trustee of other Fidelity funds. Prior to his retirement in January 2006, Mr. Mauriello served in numerous senior management positions including Deputy Chairman and Chief Operating Officer (2004-2005), and Vice Chairman of Financial Services (2002-2004) of KPMG LLP US (professional services, 1965-2005). Mr. Mauriello currently serves as a member of the Board of Directors of XL Group plc. (global insurance and re-insurance, 2006-present). Previously, Mr. Mauriello served as a Director of the Hamilton Funds of the Bank of New York (2006-2007) and of Arcadia Resources Inc. (health care services and products, 2007-2012). |
Robert W. Selander (1950) |
Year of Election or Appointment: 2011 Trustee |
| Mr. Selander also serves as Trustee of other Fidelity funds. Mr. Selander serves as a Director of The Western Union Company (global money transfer, 2014-present). Previously, Mr. Selander served as a Member of the Advisory Board of other Fidelity funds (2011), and Executive Vice Chairman (2010), Chief Executive Officer (2009-2010), and President and Chief Executive Officer (1997-2009) of Mastercard, Inc. |
Cornelia M. Small (1944) |
Year of Election or Appointment: 2005 Trustee |
| Ms. Small also serves as Trustee of other Fidelity funds. Ms. Small is a member of the Board of Directors (2009-present) and Chair of the Investment Committee (2010-present) of the Teagle Foundation. Ms. Small also serves on the Investment Committee of the Berkshire Taconic Community Foundation (2008-present). Previously, Ms. Small served as Chairperson (2002-2008) and a member of the Investment Committee and Chairperson (2008-2012) and a member of the Board of Trustees of Smith College. In addition, Ms. Small served as Chief Investment Officer, Director of Global Equity Investments, and a member of the Board of Directors of Scudder, Stevens & Clark and Scudder Kemper Investments. |
William S. Stavropoulos (1939) |
Year of Election or Appointment: 2002 Trustee Vice Chairman of the Independent Trustees |
| Mr. Stavropoulos also serves as Trustee of other Fidelity funds. Mr. Stavropoulos serves as President and Founder of the Michigan Baseball Foundation, the Great Lakes Loons (2007-present). Mr. Stavropoulos is Chairman Emeritus of the Board of Directors of The Dow Chemical Company, where he previously served in numerous senior management positions, including President, CEO (1995-2000; 2002-2004), Chairman of the Executive Committee (2000-2006), and as a member of the Board of Directors (1990-2006). Currently, Mr. Stavropoulos is Chairman of the Board of Directors of Univar Inc. (global distributor of commodity and specialty chemicals), a Director of Teradata Corporation (data warehousing and technology solutions), and Maersk Inc. (industrial conglomerate), and a member of the Advisory Board for Metalmark Capital LLC (private equity investment, 2005-present). Mr. Stavropoulos is an operating advisor to Clayton, Dubilier & Rice, LLC (private equity investment). In addition, Mr. Stavropoulos is a member of the University of Notre Dame Advisory Council for the College of Science, a Trustee of the Rollin L. Gerstacker Foundation, and a Director of the Naples Philharmonic Center for the Arts. Previously, Mr. Stavropoulos served as a Director of Chemical Financial Corporation (bank holding company, 1993-2012) and Tyco International, Ltd. (multinational manufacturing and services, 2007-2012). |
David M. Thomas (1949) |
Year of Election or Appointment: 2008 Trustee |
| Mr. Thomas also serves as Trustee of other Fidelity funds. Mr. Thomas serves as Non-Executive Chairman of the Board of Directors of Fortune Brands Home and Security (home and security products, 2011-present), as a member of the Board of Directors (2004-present) and Presiding Director (2013-present) of Interpublic Group of Companies, Inc. (marketing communication), and as a member of the Board of Trustees of the University of Florida (2013-present). Previously, Mr. Thomas served as Executive Chairman (2005-2006) and Chairman and Chief Executive Officer (2000-2005) of IMS Health, Inc. (pharmaceutical and healthcare information solutions), and a Director of Fortune Brands, Inc. (consumer products, 2000-2011). |
+ The information above includes each Trustee's principal occupation during the last five years and other information relating to the experience, attributes, and skills relevant to each Trustee's qualifications to serve as a Trustee, which led to the conclusion that each Trustee should serve as a Trustee for the fund.
Annual Report
Advisory Board Member and Officers:
Correspondence intended for each officer and Peter S. Lynch may be sent to Fidelity Investments, 245 Summer Street, Boston, Massachusetts 02210. Officers appear below in alphabetical order.
Name, Year of Birth; Principal Occupation |
Peter S. Lynch (1944) |
Year of Election or Appointment: 2003 Member of the Advisory Board |
| Mr. Lynch also serves as Member of the Advisory Board of other Fidelity funds. Mr. Lynch is Vice Chairman and a Director of FMR (investment adviser firm) and FMR Co., Inc. (investment adviser firm). In addition, Mr. Lynch serves as a Trustee of Boston College and as the Chairman of the Inner-City Scholarship Fund. Previously, Mr. Lynch served on the Special Olympics International Board of Directors (1997-2006). |
Elizabeth Paige Baumann (1968) |
Year of Election or Appointment: 2012 Anti-Money Laundering (AML) Officer |
| Ms. Baumann also serves as AML Officer of other funds. She is Chief AML Officer of FMR LLC (diversified financial services company, 2012-present) and is an employee of Fidelity Investments. Previously, Ms. Baumann served as Vice President and Deputy Anti-Money Laundering Officer (2007-2012). |
Marc Bryant (1966) |
Year of Election or Appointment: 2015 Secretary and Chief Legal Officer (CLO) |
| Mr. Bryant also serves as Secretary and Chief Legal Officer (CLO) of other funds. He is Senior Vice President and Deputy General Counsel of FMR LLC (diversified financial services company). Previously, Mr. Bryant served as Secretary and Chief Legal Officer of Fidelity Rutland Square Trust II (2010-2014) and Assistant Secretary of Fidelity's Fixed Income and Asset Allocation Funds (2013-2015). Prior to joining Fidelity Investments, Mr. Bryant served as a Senior Vice President and the Head of Global Retail Legal for AllianceBernstein L.P. 2006-2010), and as the General Counsel for ProFund Advisors LLC (2001-2006). |
William C. Coffey (1969) |
Year of Election or Appointment: 2009 Assistant Secretary |
| Mr. Coffey also serves as Assistant Secretary of other funds. He is Senior Vice President and Deputy General Counsel of FMR LLC (diversified financial services company, 2010-present), and is an employee of Fidelity Investments. Previously, Mr. Coffey served as Vice President and Associate General Counsel of FMR LLC (2005-2009). |
Name, Year of Birth; Principal Occupation |
Jonathan Davis (1968) |
Year of Election or Appointment: 2010 Assistant Treasurer |
| Mr. Davis also serves as Assistant Treasurer of other funds. Mr. Davis is an employee of Fidelity Investments. Previously, Mr. Davis served as Vice President and Associate General Counsel of FMR LLC (diversified financial services company, 2003-2010). |
Adrien E. Deberghes (1967) |
Year of Election or Appointment: 2008 Deputy Treasurer |
| Mr. Deberghes also serves as an officer of other funds. He is an employee of Fidelity Investments (2008-present). Prior to joining Fidelity Investments, Mr. Deberghes was Senior Vice President of Mutual Fund Administration at State Street Corporation (2007-2008), Senior Director of Mutual Fund Administration at Investors Bank & Trust (2005-2007), and Director of Finance for Dunkin' Brands (2000-2005). |
Stephanie J. Dorsey (1969) |
Year of Election or Appointment: 2010 Assistant Treasurer |
| Ms. Dorsey also serves as an officer of other funds. She is an employee of Fidelity Investments (2008-present) and has served in other fund officer roles. Prior to joining Fidelity Investments, Ms. Dorsey served as Treasurer (2004-2008) of the JPMorgan Mutual Funds and Vice President (2004-2008) of JPMorgan Chase Bank. |
Howard J. Galligan III (1966) |
Year of Election or Appointment: 2014 Chief Financial Officer |
| Mr. Galligan also serves as Chief Financial Officer of other funds. Mr. Galligan serves as President of Fidelity Pricing and Cash Management Services (FPCMS) (2014-present) and as a Director of Strategic Advisers, Inc. (investment adviser firm, 2008-present). Previously, Mr. Galligan served as Chief Administrative Officer of Asset Management (2011-2014) and Chief Operating Officer and Senior Vice President of Investment Support for Strategic Advisers, Inc. (2003-2011). |
Name, Year of Birth; Principal Occupation |
Scott C. Goebel (1968) |
Year of Election or Appointment: 2015 Vice President |
| Mr. Goebel serves as an officer of other funds. Mr. Goebel also serves as Secretary of Fidelity SelectCo, LLC (investment adviser firm, 2013-present), Fidelity Investments Money Management, Inc. (FIMM) (investment adviser firm, 2010-present) and Fidelity Research and Analysis Company (FRAC) (investment adviser firm, 2010-present); General Counsel, Secretary, and Senior Vice President of FMR (investment adviser firm, 2008-present) and FMR Co., Inc. (investment adviser firm, 2008-present); Chief Legal Officer of Fidelity Management & Research (Hong Kong) Limited (investment adviser firm, 2008-present); and Assistant Secretary of Fidelity Management & Research (Japan) Limited (investment adviser firm, 2008-present) and FMR Investment Management (U.K.) Limited (investment adviser firm, 2008-present). Previously, Mr. Goebel served as Secretary and CLO of certain Fidelity funds (2008-2015), Assistant Secretary of FIMM (2008-2010), FRAC (2008-2010), and certain funds (2007-2008); and as Vice President and Secretary of Fidelity Distributors Corporation (FDC) (2005-2007). Mr. Goebel has been employed by FMR LLC (diversified financial services company) or an affiliate since 2001. |
Brian B. Hogan (1964) |
Year of Election or Appointment: 2009 Vice President |
| Mr. Hogan also serves as Trustee or Vice President of other funds. Mr. Hogan serves as a Director of Fidelity SelectCo, LLC (investment adviser firm, 2014-present) and President of the Equity Division of FMR (investment adviser firm, 2009-present). Previously, Mr. Hogan served as Senior Vice President, Equity Research of FMR (2006-2009) and as a portfolio manager. |
Chris Maher (1972) |
Year of Election or Appointment: 2013 Assistant Treasurer |
| Mr. Maher serves as Assistant Treasurer of other funds. Mr. Maher is Vice President of Valuation Oversight and is an employee of Fidelity Investments. Previously, Mr. Maher served as Vice President of Asset Management Compliance (2013), Vice President of the Program Management Group of FMR (investment adviser firm, 2010-2013), and Vice President of Valuation Oversight (2008-2010). |
Melissa M. Reilly (1971) |
Year of Election or Appointment: 2014 Vice President of certain Equity Funds |
| Ms. Reilly also serves as Vice President of other funds. Ms. Reilly is an employee of Fidelity Investments (2004-present). |
Kenneth B. Robins (1969) |
Year of Election or Appointment: 2008 President and Treasurer |
| Mr. Robins also serves as an officer of other funds. Mr. Robins serves as Executive Vice President of Fidelity Investments Money Management, Inc. (FIMM) (investment adviser firm, 2013-present) and is an employee of Fidelity Investments (2004-present). Previously, Mr. Robins served in other fund officer roles. |
Stephen Sadoski (1971) |
Year of Election or Appointment: 2012 Deputy Treasurer |
| Mr. Sadoski also serves as Deputy Treasurer of other funds. He is an employee of Fidelity Investments (2012-present) and has served in another fund officer role. Prior to joining Fidelity Investments, Mr. Sadoski served as an assistant chief accountant in the Division of Investment Management of the Securities and Exchange Commission (SEC) (2009-2012) and as a senior manager at Deloitte & Touche LLP (1997-2009). |
Stacie M. Smith (1974) |
Year of Election or Appointment: 2013 Deputy Treasurer |
| Ms. Smith also serves as an officer of other funds. She is an employee of Fidelity Investments (2009-present) and has served in other fund officer roles. Prior to joining Fidelity Investments, Ms. Smith served as Senior Audit Manager of Ernst & Young LLP (1996-2009). |
Renee Stagnone (1975) |
Year of Election or Appointment: 2013 Deputy Treasurer |
| Ms. Stagnone also serves as Deputy Treasurer of other funds. Ms. Stagnone is an employee of Fidelity Investments. |
Linda J. Wondrack (1964) |
Year of Election or Appointment: 2014 Chief Compliance Officer |
| Ms. Wondrack also serves as Chief Compliance Officer of other funds. Ms. Wondrack is Executive Vice President and head of the Ethics Office and Asset Management Compliance for Fidelity Investments (2012- present). Ms. Wondrack also serves as Chief Compliance Officer of Fidelity SelectCo, LLC (investment adviser firm, 2014-present); Chief Compliance Officer of Impresa Management LLC (2013-present); and Chief Compliance Officer of FMR Co., Inc. (investment adviser firm), Fidelity Investments Money Management, Inc. (investment adviser firm), Fidelity Management & Research (Japan) Limited (investment adviser firm), FMR Investment Management (U.K.) Limited (investment adviser firm), Fidelity Management & Research (Hong Kong) (investment adviser firm), Fidelity Management & Research Company (investment adviser firm), Pyramis Global Advisors, LLC (investment adviser firm), and Strategic Advisers, Inc. (investment adviser firm), Ballyrock Investment Advisors LLC, and Northern Neck Investors LLC (2012-present). Previously, Ms. Wondrack served as Senior Vice President and Chief Compliance Officer for Columbia Management Investment Advisers, LLC (2005-2012); Chief Compliance Officer for certain funds within the Columbia Family of Funds (2007-2012); and Senior Vice President of Compliance Risk Management at Bank of America (2005-2010). |
Joseph F. Zambello (1957) |
Year of Election or Appointment: 2011 Deputy Treasurer |
| Mr. Zambello also serves as Deputy Treasurer of other funds. Mr. Zambello is an employee of Fidelity Investments. Previously, Mr. Zambello served as Vice President of the Program Management Group of FMR (investment adviser firm, 2009-2011) and Vice President of the Transfer Agent Oversight Group (2005-2009). |
Annual Report
The Board of Trustees of Fidelity OTC Portfolio voted to pay to shareholders of record at the opening of business on record date, the following distributions per share derived from capital gains realized from sales of portfolio securities:
| Pay Date | Record Date | Capital Gains |
OTC Portfolio | 09/14/15 | 09/11/15 | $3.869 |
The fund hereby designates as a capital gain dividend with respect to the taxable year ended July 31, 2015, $645,715,478, or, if subsequently determined to be different, the net capital gain of such year.
OTC Portfolio designates 8% and 13% of the dividends distributed in September and December, respectively during the fiscal year as qualifying for the dividends-received deduction for corporate shareholders.
OTC Portfolio designates 9% and 14% of the dividends distributed in September and December, respectively during the fiscal year as amounts which may be taken into account as a dividend for the purposes of the maximum rate under section 1(h)(11) of the Internal Revenue Code.
The fund will notify shareholders in January 2016 of amounts for use in preparing 2015 income tax returns.
Annual Report
Fidelity OTC Portfolio
Each year, the Board of Trustees, including the Independent Trustees (together, the Board), votes on the renewal of the management contract with Fidelity Management & Research Company (FMR) and the sub-advisory agreements (together, the Advisory Contracts) for the fund. The Board, assisted by the advice of fund counsel and Independent Trustees' counsel, requests and considers a broad range of information relevant to the renewal of the Advisory Contracts throughout the year.
The Board meets regularly and, at each of its meetings, covers an extensive agenda of topics and materials and considers factors that are relevant to its annual consideration of the renewal of the fund's Advisory Contracts, including the services and support provided to the fund and its shareholders. The Board has established various standing committees (Committees), each composed of and chaired by Independent Trustees with varying backgrounds, to which the Board has assigned specific subject matter responsibilities in order to enhance effective decision-making by the Board. The Board, acting directly and through its Committees, requests and receives information concerning the annual consideration of the renewal of the fund's Advisory Contracts. The Board also meets as needed to consider matters specifically related to the Board's annual consideration of the renewal of the Advisory Contracts. Members of the Board may also meet with trustees of other Fidelity funds through ad hoc joint committees to discuss certain matters relevant to all of the Fidelity funds.
At its July 2015 meeting, the Board unanimously determined to renew the fund's Advisory Contracts. In reaching its determination, the Board considered all factors it believed relevant, including (i) the nature, extent, and quality of the services to be provided to the fund and its shareholders (including the investment performance of the fund); (ii) the competitiveness of the fund's management fee and total expense ratio relative to peer funds; (iii) the total costs of the services to be provided by and the profits to be realized by Fidelity from its relationship with the fund; and (iv) the extent to which (if any) economies of scale exist and would be realized as the fund grows, and whether any economies of scale are appropriately shared with fund shareholders.
In considering whether to renew the Advisory Contracts for the fund, the Board reached a determination, with the assistance of fund counsel and Independent Trustees' counsel and through the exercise of its business judgment, that the renewal of the Advisory Contracts was in the best interests of the fund and its shareholders and that the compensation payable under the Advisory Contracts was fair and reasonable. The Board's decision to renew the Advisory Contracts was not based on any single factor, but rather was based on a comprehensive consideration of all the information provided to the Board at its meetings throughout the year. The Board, in reaching its determination to renew the Advisory Contracts, was aware that shareholders of the fund have a broad range of investment choices available to them, including a wide choice among funds offered by Fidelity's competitors, and that the fund's shareholders, who have the opportunity to review and weigh the disclosure provided by the fund in its prospectus and other public disclosures, have chosen to invest in this fund, which is part of the Fidelity family of funds.
Annual Report
Board Approval of Investment Advisory Contracts and
Management Fees - continued
Nature, Extent, and Quality of Services Provided. The Board considered Fidelity's staffing as it relates to the fund, including the backgrounds of investment personnel of Fidelity, and also considered the fund's investment objective, strategies, and related investment philosophy. The Independent Trustees also had discussions with senior management of Fidelity's investment operations and investment groups. The Board considered the structure of the portfolio manager compensation program and whether this structure provides appropriate incentives to act in the best interests of the fund. Additionally, the Board considered the portfolio managers' investments, if any, in the funds that they manage.
Resources Dedicated to Investment Management and Support Services. The Board and the Fund Oversight and Research Committees reviewed the general qualifications and capabilities of Fidelity's investment staff, including its size, education, experience, and resources, as well as Fidelity's approach to recruiting, training, managing, and compensating investment personnel. The Board noted that Fidelity has continued to increase the resources devoted to non-U.S. offices, including expansion of Fidelity's global investment organization. The Board also noted that Fidelity's analysts have extensive resources, tools and capabilities that allow them to conduct sophisticated quantitative and fundamental analysis, as well as credit analysis of issuers, counterparties and guarantors. Further, the Board considered that Fidelity's investment professionals have sufficient access to global information and data so as to provide competitive investment results over time, and that those professionals also have access to sophisticated tools that permit them to assess portfolio construction and risk and performance attribution characteristics continuously, as well as to transmit new information and research conclusions rapidly around the world. Additionally, in its deliberations, the Board considered Fidelity's trading, risk management, and compliance capabilities and resources, which are integral parts of the investment management process.
Shareholder and Administrative Services. The Board considered (i) the nature, extent, quality, and cost of advisory, administrative, and shareholder services performed by FMR, the sub-advisers (together with FMR, the Investment Advisers), and their affiliates under the Advisory Contracts and under separate agreements covering transfer agency, pricing and bookkeeping, and securities lending services for the fund; (ii) the nature and extent of the supervision of third party service providers, principally custodians and subcustodians; and (iii) the resources devoted to, and the record of compliance with, the fund's compliance policies and procedures. The Board also reviewed the allocation of fund brokerage, including allocations to brokers affiliated with the Investment Advisers, the use of brokerage commissions to pay fund expenses, and the use of "soft" commission dollars to pay for research services.
Annual Report
The Board noted that the growth of fund assets over time across the complex allows Fidelity to reinvest in the development of services designed to enhance the value or convenience of the Fidelity funds as investment vehicles. These services include 24-hour access to account information and market information through telephone representatives and over the Internet, investor education materials and asset allocation tools, and the expanded availability of Fidelity Investor Centers.
In 2014, the Board formed an ad hoc Committee on Transfer Agency Fees to review the variety of transfer agency fee structures throughout the industry and Fidelity's competitive positioning with respect to industry participants.
Investment in a Large Fund Family. The Board considered the benefits to shareholders of investing in a Fidelity fund, including the benefits of investing in a fund that is part of a large family of funds offering a variety of investment disciplines and providing a large variety of mutual fund investor services. The Board noted that Fidelity had taken, or had made recommendations that resulted in the Fidelity funds taking, a number of actions over the previous year that benefited particular funds, including (i) continuing to dedicate additional resources to investment research and to the support of the senior management team that oversees asset management; (ii) continuing efforts to enhance Fidelity's global research capabilities; (iii) launching new funds and making other enhancements to meet client needs; (iv) reducing management fees and total expenses for certain index funds and diversified international funds; (v) continuing to launch dedicated lower cost underlying funds to meet portfolio construction needs related to expanding underlying fund options for Fidelity funds of funds, specifically for the Freedom Fund product lines; (vi) rationalizing product lines and gaining increased efficiencies through fund mergers; (vii) launching active fixed-income exchange-traded funds; (viii) continuing to develop, acquire and implement systems and technology to improve services to the funds and information security and to increase efficiency; (ix) implementing investment enhancements to further strengthen Fidelity's target date product line to increase investors' probability of success in achieving their goals; (x) modifying the eligibility criteria for certain share classes to accommodate roll-over assets from employer-sponsored retirement plans; (xi) launching a new Class W of the Freedom Index Funds to attract and retain Fidelity record-kept retirement plan assets; and (xii) implementing changes to Fidelity's money market product line in response to recent money market regulatory reforms.
Investment Performance. The Board considered whether the fund has operated in accordance with its investment objective, as well as its record of compliance with its investment restrictions and its performance history.
Annual Report
Board Approval of Investment Advisory Contracts and
Management Fees - continued
The Board took into account discussions with representatives of the Investment Advisers about fund investment performance that occur at Board meetings throughout the year. In this regard the Board noted that as part of regularly scheduled fund reviews and other reports to the Board on fund performance, the Board considers annualized return information for the fund, for different time periods, measured against a securities market index ("benchmark index") and a peer group of funds with similar objectives ("peer group"), if any. In its evaluation of fund investment performance, the Board gave particular attention to information indicating changes in performance of certain Fidelity funds for specific time periods and discussed with the Investment Advisers the reasons for any overperformance or underperformance.
In addition to reviewing absolute and relative fund performance, the Independent Trustees periodically consider the appropriateness of fund performance metrics in evaluating the results achieved. In general, the Independent Trustees believe that fund performance should be evaluated based on net performance (after fees and expenses) of both the highest performing and lowest performing fund share classes, where applicable, compared to appropriate benchmark indices, over appropriate time periods that may include full market cycles, and compared to peer groups, as applicable, over the same periods, taking into account relevant factors including the following: general market conditions; issuer-specific information; and fund cash flows and other factors.
The Independent Trustees recognize that shareholders evaluate performance on a net basis over their own holding periods, for which one-, three-, and five-year periods are often used as a proxy. For this reason, the performance information reviewed by the Board also included net cumulative calendar year total return information for the fund and an appropriate benchmark index for the most recent one-, three-, and five-year periods, as shown below. A peer group is not shown below because the fund does not generally utilize a peer group for performance comparison purposes.
Annual Report
Fidelity OTC Portfolio
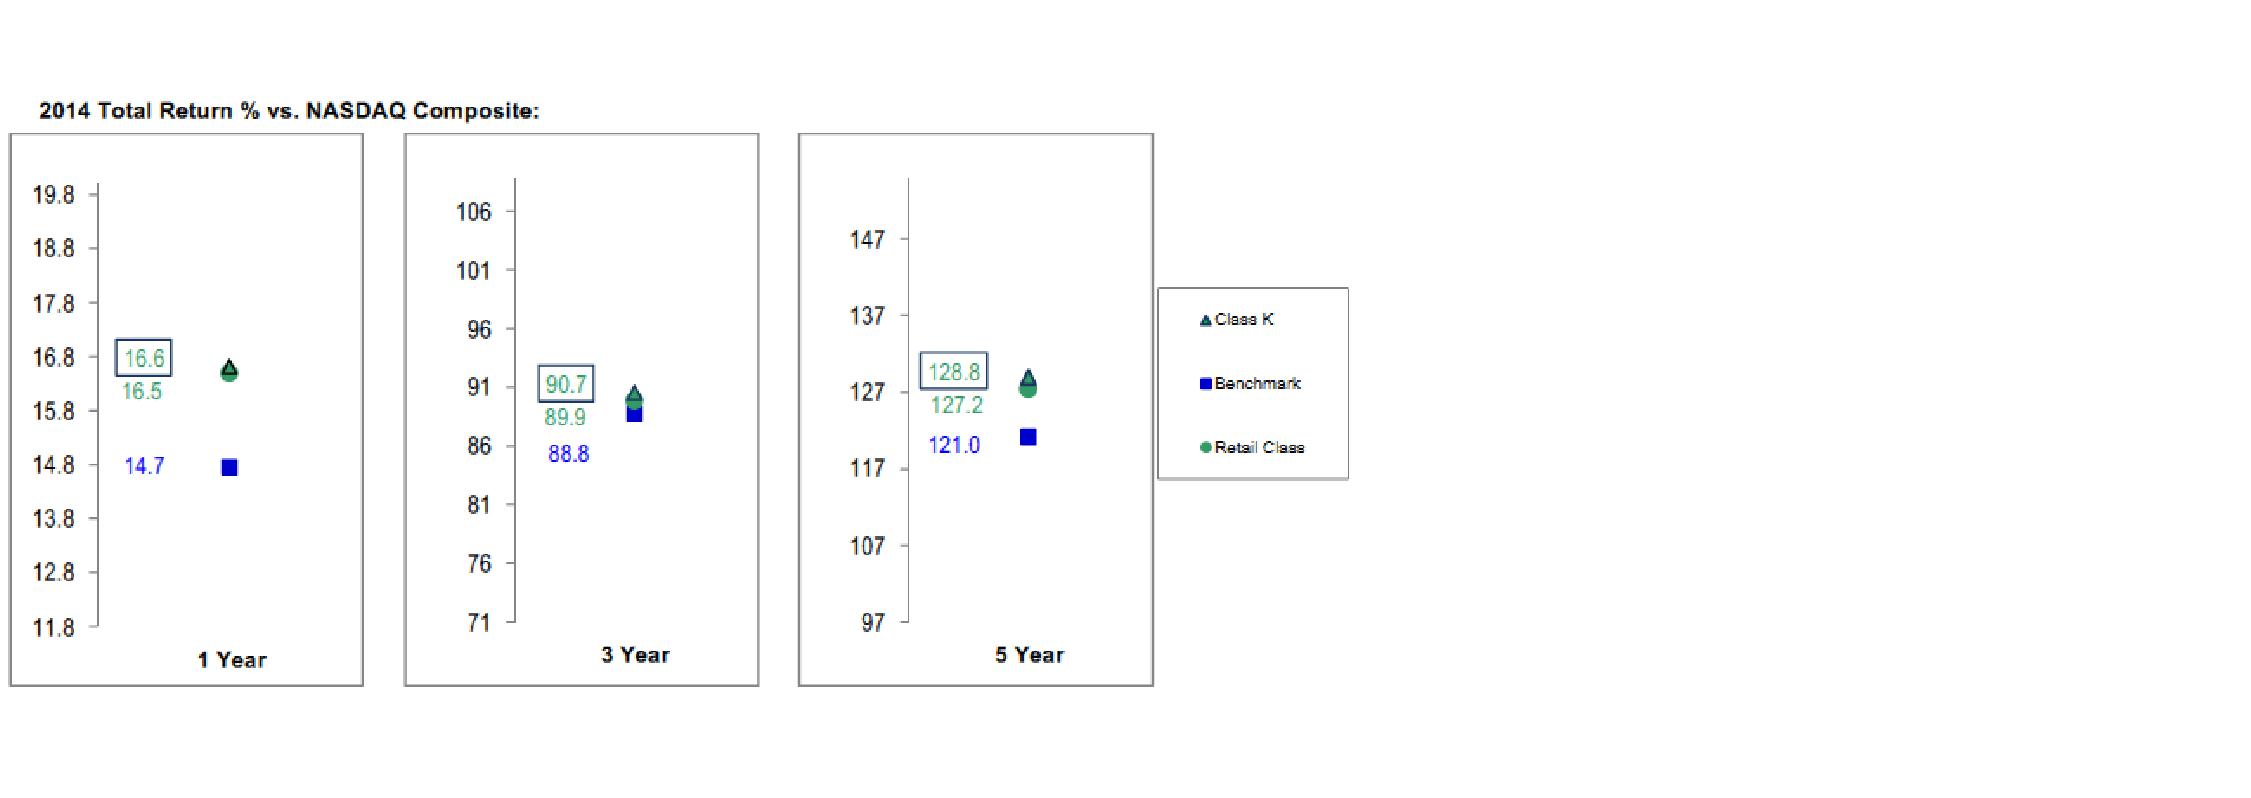
The Board also considered that the fund's management fee is subject to upward or downward adjustment depending upon whether, and to what extent, the fund's investment performance for the performance period exceeds, or is exceeded by, a securities index, thus leading to a performance adjustment for the same period. The Board noted that the performance adjustment provides FMR with a strong economic incentive to seek to achieve superior performance for the fund's shareholders and helps to more closely align the interests of FMR and the shareholders of the fund.
Based on its review, the Board concluded that the nature, extent, and quality of services provided to the fund under the Advisory Contracts should benefit the shareholders of the fund.
Competitiveness of Management Fee and Total Expense Ratio. The Board considered the fund's management fee and total expense ratio compared to "mapped groups" of competitive funds and classes created for the purpose of facilitating the Trustees' competitive analysis of management fees and total expenses. Fidelity creates "mapped groups" by combining similar Lipper investment objective categories that have comparable investment mandates. Combining Lipper investment objective categories aids the Board's management fee and total expense ratio comparisons by broadening the competitive group used for comparison.
Management Fee. The Board considered two proprietary management fee comparisons for the 12-month periods shown in basis points (BP) in the chart below. The group of Lipper funds used by the Board for management fee comparisons is referred to below as the "Total Mapped Group." The Total Mapped Group comparison focuses on a fund's standing in terms of gross management fees before expense reimbursements or caps, and without giving effect to the fund's performance adjustment, relative to the total universe of funds with comparable investment mandates, regardless of whether their management fee structures also are comparable. Funds with comparable investment mandates offer exposure to similar types of securities. Funds with comparable management fee structures have similar management fee contractual arrangements (e.g., flat rate charged for advisory services, all-inclusive fee rate, etc.). "TMG %" represents the percentage of funds in the Total Mapped Group that had management fees that were lower than the fund's. For example, a hypothetical TMG % of 20% would mean that 80% of the funds in the Total Mapped Group had higher, and 20% had lower, management fees than the fund. The fund's actual TMG %s and the number of funds in the Total Mapped Group are in the chart below. The "Asset-Size Peer Group" (ASPG) comparison focuses on a fund's standing relative to a subset of non-Fidelity funds within the Total Mapped Group that are similar in size and management fee structure without taking into account performance adjustments, if any. For example, if a fund is in the first quartile of the ASPG, the fund's management fee ranks in the least expensive or lowest 25% of funds in the ASPG. The ASPG represents at least 15% of the funds in the Total Mapped Group with comparable asset size and management fee structures, subject to a minimum of 50 funds (or all funds in the Total Mapped Group if fewer than 50). Additional information, such as the ASPG quartile in which the fund's management fee rate ranked and the impact of the fund's performance adjustment, is also included in the chart and considered by the Board.
Annual Report
Board Approval of Investment Advisory Contracts and
Management Fees - continued
Fidelity OTC Portfolio
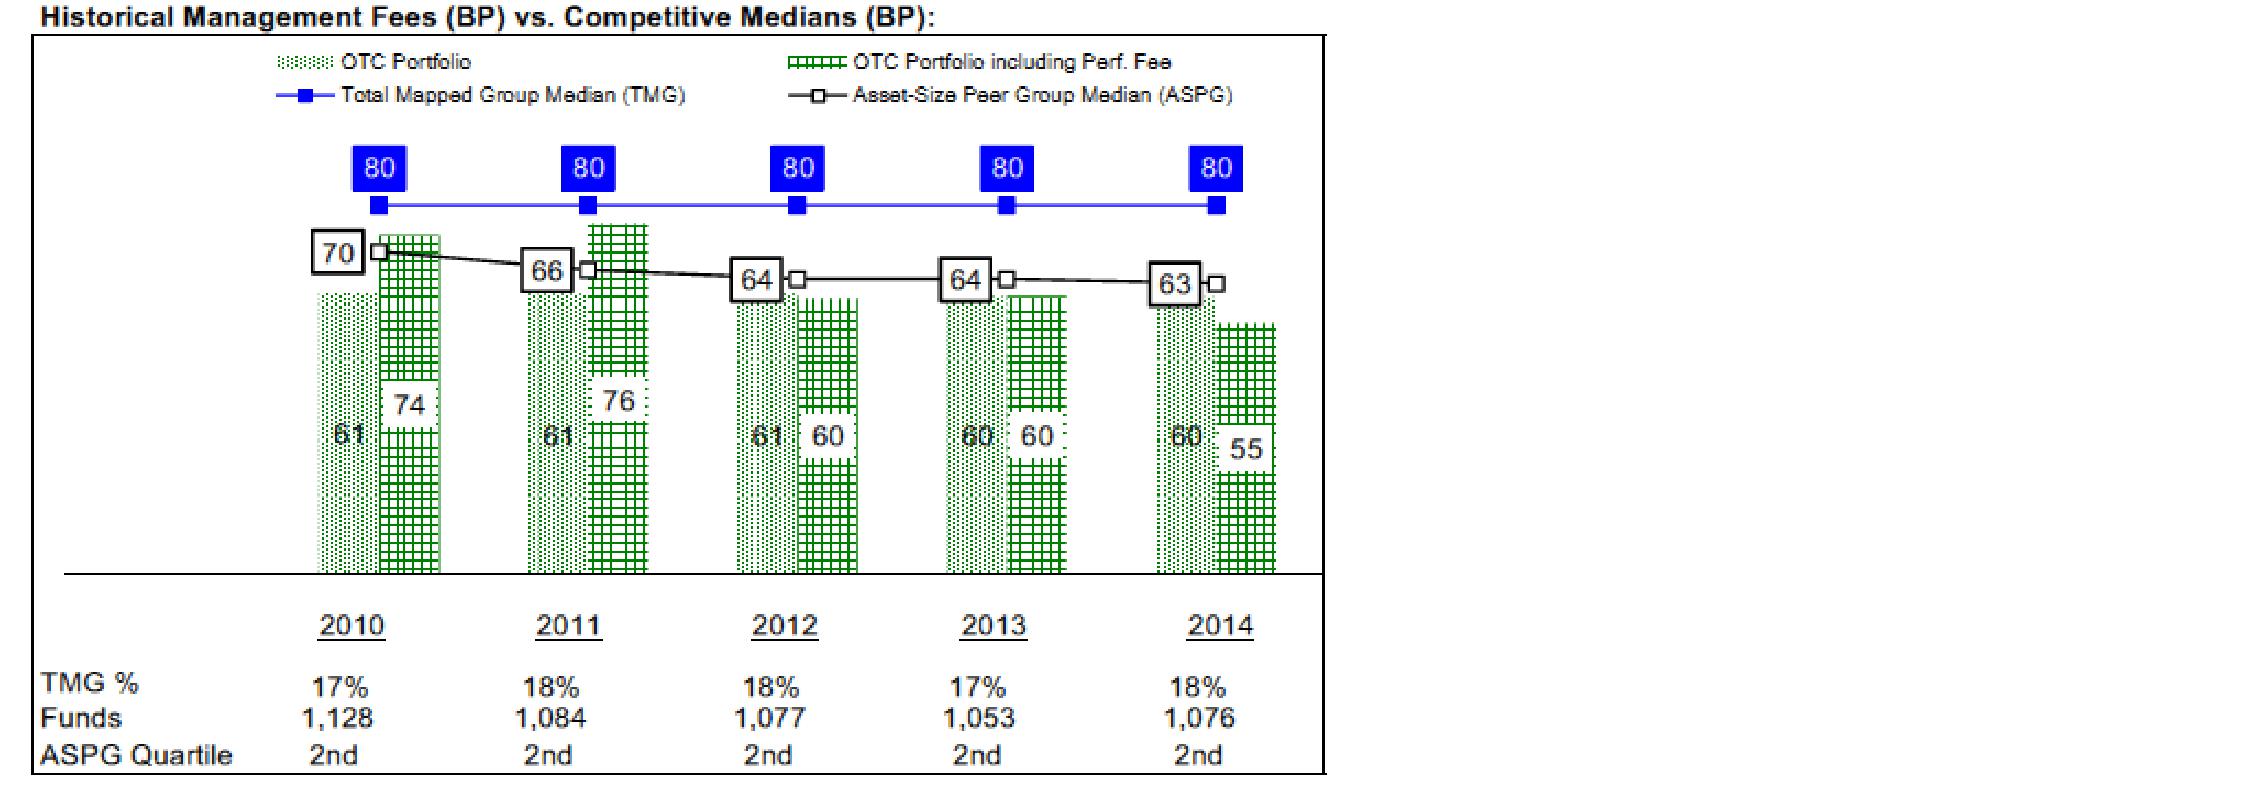
Annual Report
The Board noted that the fund's management fee rate ranked below the median of its Total Mapped Group and below the median of its ASPG for 2014. The Board also noted the effect of the fund's performance adjustment, if any, on the fund's management fee ranking.
The Board noted that, in 2014, the ad hoc Committee on Group Fee was formed by it and other Fidelity fund boards to conduct an in-depth review of the "group fee" component of the management fee of funds with such management fee structures. Committee focus included the mechanics of the group fee, the competitive landscape of group fee structures, Fidelity funds with no group fee component and investment products not included in group fee assets. The Board also considered that, for funds subject to the group fee, FMR agreed to voluntarily waive fees over a specified period of time in amounts designed to account for assets converted from certain funds to certain collective investment trusts.
The Board also noted that, in 2013, the ad hoc Committee on Management Fees was formed to conduct an in-depth review of the management fee rates of Fidelity's active equity mutual funds. The Committee focused on the following areas: (i) standard fee structures; (ii) research consumption and trading evolution; (iii) management fee competitiveness/profitability by category; and (iv) factors that drive institutional pricing.
Based on its review, the Board concluded that the fund's management fee is fair and reasonable in light of the services that the fund receives and the other factors considered.
Total Expense Ratio. In its review of each class's total expense ratio, the Board considered the fund's management fee as well as other fund or class expenses, as applicable, such as transfer agent fees, pricing and bookkeeping fees, and custodial, legal, and audit fees. The Board noted the impact of the fund's performance adjustment. The Board also noted that Fidelity may agree to waive fees and expenses from time to time, and the extent to which, if any, it has done so for the fund. As part of its review, the Board also considered the current and historical total expense ratios of each class of the fund compared to competitive fund median expenses. Each class of the fund is compared to those funds and classes in the Total Mapped Group (used by the Board for management fee comparisons) that have a similar sales load structure.
The Board noted that the total expense ratio of each class ranked below its competitive median for 2014.
Fees Charged to Other Fidelity Clients. The Board also considered Fidelity fee structures and other information with respect to clients of Fidelity, such as other funds advised or subadvised by Fidelity, pension plan clients, and other institutional clients with similar mandates. The Board noted the findings of the 2013 ad hoc joint committee (created with the board of other Fidelity funds), which reviewed and compared Fidelity's institutional investment advisory business with its business of providing services to the Fidelity funds, including the differences in services provided, fees charged, and costs incurred, as well as competition in their respective marketplaces.
Annual Report
Board Approval of Investment Advisory Contracts and
Management Fees - continued
Based on its review of total expense ratios and fees charged to other Fidelity clients, the Board concluded that the total expense ratio of each class of the fund was reasonable in light of the services that the fund and its shareholders receive and the other factors considered.
Costs of the Services and Profitability. The Board considered the revenues earned and the expenses incurred by Fidelity in conducting the business of developing, marketing, distributing, managing, administering and servicing the fund and servicing the fund's shareholders. The Board also considered the level of Fidelity's profits in respect of all the Fidelity funds.
On an annual basis, Fidelity presents to the Board information about the profitability of its relationship with the fund. Fidelity calculates profitability information for each fund, as well as aggregate profitability information for groups of Fidelity funds and all Fidelity funds, using a series of detailed revenue and cost allocation methodologies which originate with the books and records of Fidelity on which Fidelity's audited financial statements are based. The Audit Committee of the Board reviews any significant changes from the prior year's methodologies.
PricewaterhouseCoopers LLP (PwC), independent registered public accounting firm and auditor to Fidelity and certain Fidelity funds, has been engaged annually by the Board as part of the Board's assessment of Fidelity's profitability analysis. PwC's engagement includes the review and assessment of the methodologies used by Fidelity in determining the revenues and expenses attributable to Fidelity's mutual fund business, and completion of agreed-upon procedures in respect of the mathematical accuracy of fund profitability and its conformity to established allocation methodologies. After considering PwC's reports issued under the engagement and information provided by Fidelity, the Board concluded that while other allocation methods may also be reasonable, Fidelity's profitability methodologies are reasonable in all material respects.
The Board also reviewed Fidelity's non-fund businesses and fall-out benefits related to the mutual fund business as well as cases where Fidelity's affiliates may benefit from or be related to the fund's business.
The Board considered the costs of the services provided by and the profits realized by Fidelity in connection with the operation of the fund and was satisfied that the profitability was not excessive.
Economies of Scale. The Board considered whether there have been economies of scale in respect of the management of the Fidelity funds, whether the Fidelity funds (including the fund) have appropriately benefited from any such economies of scale, and whether there is potential for realization of any further economies of scale. The Board considered the extent to which the fund will benefit from economies of scale as assets grow through increased services to the fund, through waivers or reimbursements, or through fee or expense ratio reductions. The Board also noted that in 2013, it and the boards of other Fidelity funds created an ad hoc committee (the Economies of Scale Committee) to analyze whether Fidelity attains economies of scale in respect of the management and servicing of the Fidelity funds, whether the Fidelity funds have appropriately benefited from such economies of scale, and whether there is potential for realization of any further economies of scale.
Annual Report
The Board recognized that the fund's management contract incorporates a "group fee" structure, which provides for lower group fee rates as total group assets increase, and for higher group fee rates as total group assets decrease (with "group assets" defined to include fund assets under FMR's management plus sector fund assets previously under FMR's management and currently managed by Fidelity SelectCo, LLC). FMR calculates the group fee rates based on a tiered asset "breakpoint" schedule that varies based on asset class. The Board considered that the group fee is designed to deliver the benefits of economies of scale to fund shareholders when total Fidelity fund assets increase, even if assets of any particular fund are unchanged or have declined, because some portion of Fidelity's costs are attributable to services provided to all Fidelity funds, and all funds benefit if those costs can be allocated among more assets. The Board concluded that, given the group fee structure, fund shareholders will benefit from lower management fees as group assets increase at the fund complex level, regardless of whether Fidelity achieves any such economies of scale.
The Board concluded, taking into account the analysis of the Economies of Scale Committee, that economies of scale, if any, are being appropriately shared between fund shareholders and Fidelity.
Additional Information Requested by the Board. In order to develop fully the factual basis for consideration of the Fidelity funds' Advisory Contracts, the Board requested and received additional information on certain topics, including: (i) fund performance trends and Fidelity's long-term strategies for certain funds; (ii) the various share classes employed by Fidelity and the attributes of each class, together with similar information on the distribution and servicing payments made by Fidelity or the funds to third-party participants in the distribution channels; (iii) fund profitability, and fund performance in relation to fund profitability; (iv) the methodology with respect to evaluating competitive fund data and peer group classifications and fee comparisons; (v) annual fund profitability margins, with particular focus on certain funds with negative margins; (vi) the realization of fall-out benefits in certain Fidelity business units; (vii) economies of scale and the way in which they are shared with fund shareholders; (viii) Fidelity's group fee structures, including the group fee schedule of breakpoints; (ix) the impact of cost containment measures on the funds; and (x) the transfer agent fee structure.
Annual Report
Board Approval of Investment Advisory Contracts and
Management Fees - continued
Based on its evaluation of all of the conclusions noted above, and after considering all factors it believed relevant, the Board concluded that the advisory fee structures are fair and reasonable, and that the fund's Advisory Contracts should be renewed.
Annual Report
Investment Adviser
Fidelity Management & Research Company
Boston, MA
Investment Sub-Advisers
FMR Co., Inc.
FMR Investment Management
(U.K.) Limited
Fidelity Management & Research
(Hong Kong) Limited
Fidelity Management & Research
(Japan) Limited
General Distributor
Fidelity Distributors Corporation
Smithfield, RI
Transfer and Service Agents
Fidelity Investments Institutional
Operations Company, Inc.
Boston, MA
Fidelity Service Company, Inc.
Boston, MA
Custodian
The Northern Trust Company
Chicago, IL
The Fidelity Telephone Connection
Mutual Fund 24-Hour Service
Exchanges/Redemptions
and Account Assistance 1-800-544-6666
Product Information 1-800-544-6666
Retirement Accounts 1-800-544-4774
(8 a.m. - 9 p.m.)
TDD Service 1-800-544-0118
for the deaf and hearing impaired
(9 a.m. - 9 p.m. Eastern time)
Fidelity Automated Service
Telephone (FAST®)
1-800-544-5555

Automated line for quickest service
(Fidelity Investment logo)(registered trademark)
Corporate Headquarters
245 Summer St., Boston, MA 02210
www.fidelity.com
OTC-UANN-0915
1.789250.112
Fidelity®
OTC
Portfolio -
Class K
Annual Report
July 31, 2015
(Fidelity Cover Art)
Contents
Performance | (Click Here) | How the fund has done over time. |
Management's Discussion of Fund Performance | (Click Here) | The Portfolio Manager's review of fund performance and strategy. |
Shareholder Expense Example | (Click Here) | An example of shareholder expenses. |
Investment Changes | (Click Here) | A summary of major shifts in the fund's investments over the past six months. |
Investments | (Click Here) | A complete list of the fund's investments with their market values. |
Financial Statements | (Click Here) | Statements of assets and liabilities, operations, and changes in net assets, as well as financial highlights. |
Notes | (Click Here) | Notes to the financial statements. |
Report of Independent Registered Public Accounting Firm | (Click Here) | |
Trustees and Officers | (Click Here) | |
Distributions | (Click Here) | |
Board Approval of Investment Advisory Contracts and Management Fees | (Click Here) | |
To view a fund's proxy voting guidelines and proxy voting record for the 12-month period ended June 30, visit http://www.fidelity.com/proxyvotingresults or visit the Securities and Exchange Commission's (SEC) web site at http://www.sec.gov. You may also call 1-800-835-5092 to request a free copy of the proxy voting guidelines.
Standard & Poor's, S&P and S&P 500 are registered service marks of The McGraw-Hill Companies, Inc. and have been licensed for use by Fidelity Distributors Corporation.
Other third-party marks appearing herein are the property of their respective owners.
All other marks appearing herein are registered or unregistered trademarks or service marks of FMR LLC or an affiliated company. © 2015 FMR LLC. All rights reserved.
Annual Report
This report and the financial statements contained herein are submitted for the general information of the shareholders of the fund. This report is not authorized for distribution to prospective investors in the fund unless preceded or accompanied by an effective prospectus.
A fund files its complete schedule of portfolio holdings with the SEC for the first and third quarters of each fiscal year on Form N-Q. Forms N-Q are available on the SEC's web site at http://www.sec.gov. A fund's Forms N-Q may be reviewed and copied at the SEC's Public Reference Room in Washington, DC. Information regarding the operation of the SEC's Public Reference Room may be obtained by calling 1-800-SEC-0330. For a complete list of a fund's portfolio holdings, view the most recent holdings listing, semiannual report, or annual report on Fidelity's web site at http://www.fidelity.com, http://www.advisor.fidelity.com, or http://www.401k.com, as applicable.
NOT FDIC INSURED • MAY LOSE VALUE • NO BANK GUARANTEE
Neither the fund nor Fidelity Distributors Corporation is a bank.
Annual Report
Average annual total return reflects the change in the value of an investment, assuming reinvestment of the class' distributions from dividend income and capital gains (the profits earned upon the sale of securities that have grown in value, if any) and assuming a constant rate of performance each year. The $10,000 table and the fund's returns do not reflect the deduction of taxes that a shareholder would pay on fund distributions or the redemption of fund shares. During periods of reimbursement by Fidelity, a fund's total return will be greater than it would be had the reimbursement not occurred. How a fund did yesterday is no guarantee of how it will do tomorrow.
Average Annual Total Returns
Periods ended July 31, 2015 | Past 1
year | Past 5
years | Past 10
years |
Class KA | 21.49% | 20.50% | 12.30% |
A The initial offering of Class K shares took place on May 9, 2008. Returns prior to May 9, 2008, are those of Fidelity® OTC Portfolio, the original class of the fund.
$10,000 Over 10 Years
Let's say hypothetically that $10,000 was invested in Fidelity® OTC Portfolio - Class K on July 31, 2005. The chart shows how the value of your investment would have changed, and also shows how the Nasdaq Composite Index® performed over the same period. See footnote A above for additional information regarding the performance of Class K.
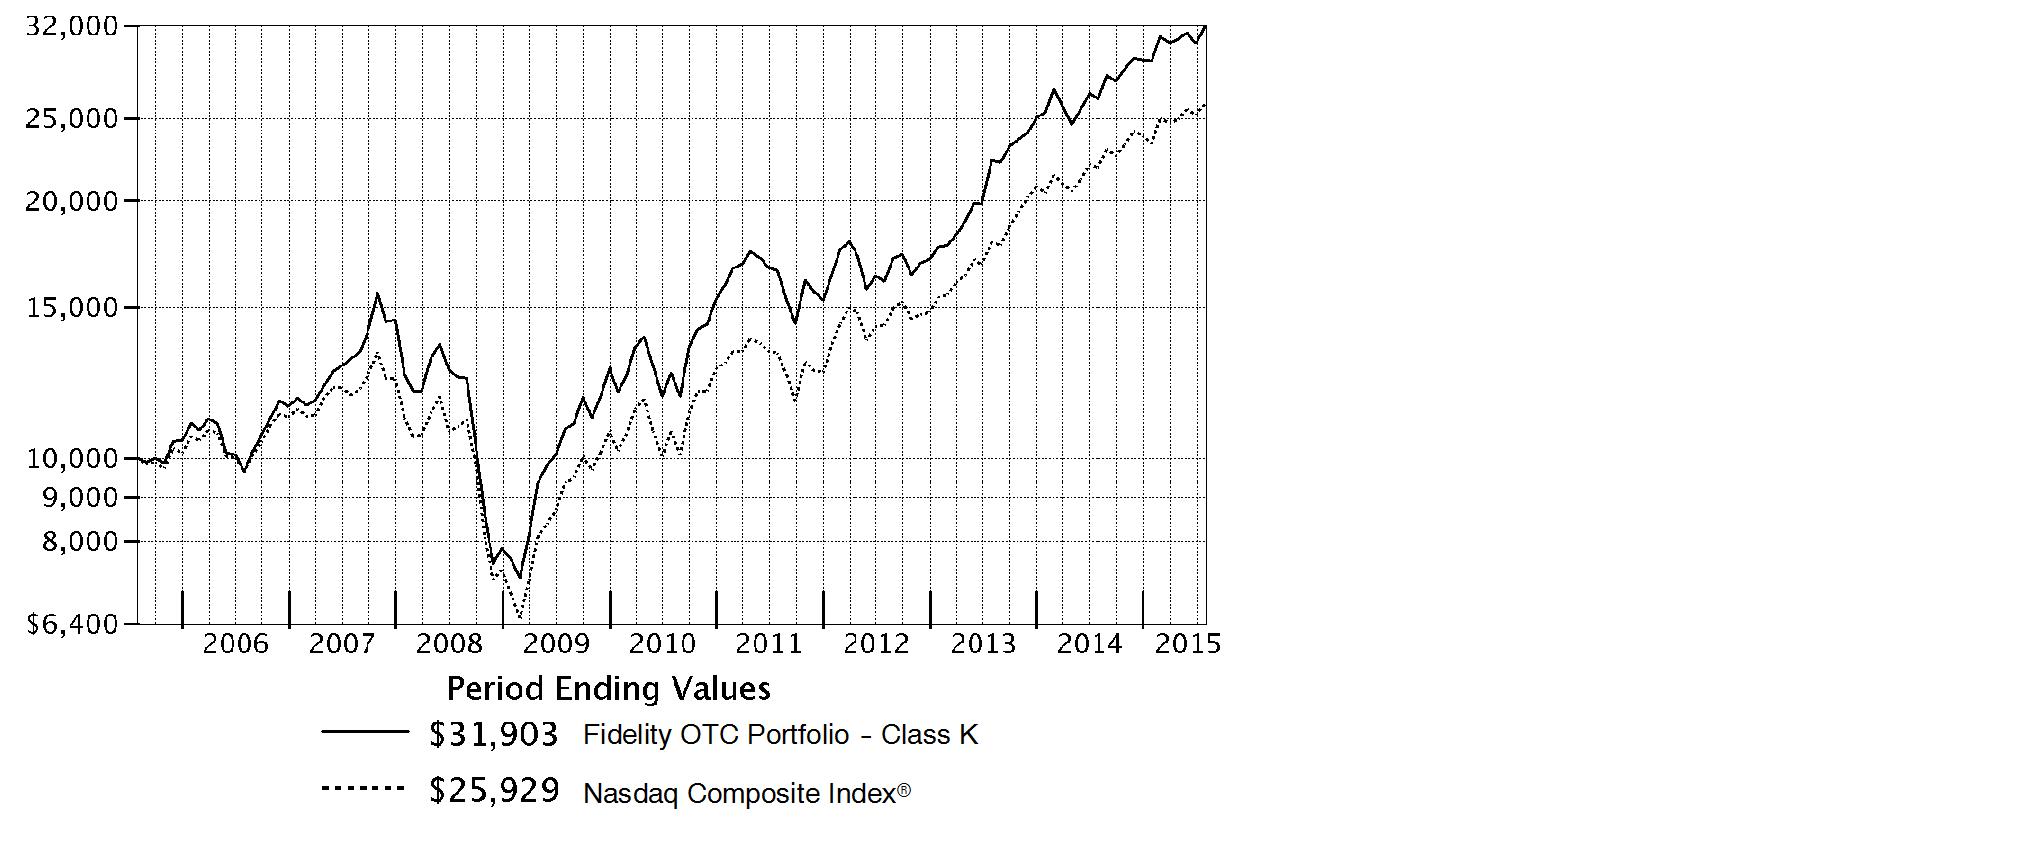
Annual Report
Market Recap: The U.S. equity market gained strongly for the 12 months ending July 31, 2015, as stocks recovered from volatility in late 2014 and early 2015, supported by a still-positive economic backdrop. The S&P 500® Index returned 11.21%, with growth stocks in the index far outpacing value-oriented names on prospects for continued U.S. economic growth. Consequently, the growth-oriented Nasdaq Composite Index® rose 18.71%, outpacing the broader S&P 500®, as well as the 12.03% advance of the smaller-cap Russell 2000® Index. Within the S&P 500®, seven of 10 sectors notched a gain, with significant performance variation. Health care (+27%) led the way, aided by merger activity. Consumer discretionary (+24%) benefited from spending linked to a seven-year low in unemployment. Strong first halves for the consumer staples sector and the real estate segment of financials yielded above-market returns (19% and 12%, respectively) for the full-year period. Conversely, energy (-26%) significantly lagged, due to a roughly 55% decline for U.S. crude-oil prices. Materials (-4%) also lost ground. At period end, investors remained focused on the slowing rate of U.S. earnings growth, the possible effect of a relatively stronger U.S. dollar on exports and inflation, and whether an economic slowdown in China would create ripples for the global economy.
Comments from Portfolio Manager Gavin Baker: For the year, the fund's share classes handily outperformed the benchmark Nasdaq Composite Index®. (For specific class-level results, please see the Performance section of this report.) Both security selection and sector allocation - primarily overweighting health care and underweighting energy and industrials - aided results versus the benchmark. The only notable sector-level detraction came from choices in the consumer staples sector, where several benchmark names not owned in the fund did well, whereas overweighting Keurig Green Mountain detracted substantially. Stock picks in the consumer discretionary and information technology sectors added the most relative value by far. The fund's overweighing in Amazon.com and a non-benchmark stake in U.K.-based fast-fashion e-tailer ASOS ranked the top contributors there. Overweightings in two other retailing names, flash sellers Groupon and Zulily, rated the fund's largest individual detractors. In health care, Synageva Biopharma stock returned 217% while held in the fund; the company received a buyout offer in May from Alexion Pharmaceuticals, another fund holding. Conversely, our holdings in Puma Biotechnology returned about -59%, detracting from relative results.
The views expressed above reflect those of the portfolio manager(s) only through the end of the period as stated on the cover of this report and do not necessarily represent the views of Fidelity or any other person in the Fidelity organization. Any such views are subject to change at any time based upon market or other conditions and Fidelity disclaims any responsibility to update such views. These views may not be relied on as investment advice and, because investment decisions for a Fidelity fund are based on numerous factors, may not be relied on as an indication of trading intent on behalf of any Fidelity fund.
Annual Report
Shareholder Expense Example
As a shareholder of the Fund, you incur two types of costs: (1) transaction costs, and (2) ongoing costs, including management fees and other Fund expenses. This Example is intended to help you understand your ongoing costs (in dollars) of investing in the Fund and to compare these costs with the ongoing costs of investing in other mutual funds.
The Example is based on an investment of $1,000 invested at the beginning of the period and held for the entire period (February 1, 2015 to July 31, 2015).
Actual Expenses
The first line of the accompanying table for each class of the Fund provides information about actual account values and actual expenses. You may use the information in this line, together with the amount you invested, to estimate the expenses that you paid over the period. Simply divide your account value by $1,000.00 (for example, an $8,600 account value divided by $1,000.00 = 8.6), then multiply the result by the number in the first line for a class of the Fund under the heading entitled "Expenses Paid During Period" to estimate the expenses you paid on your account during this period. A small balance maintenance fee of $12.00 that is charged once a year may apply for certain accounts with a value of less than $2,000. This fee is not included in the table below. If it was, the estimate of expenses you paid during the period would be higher, and your ending account value lower, by this amount. In addition, the Fund, as a shareholder in the underlying Fidelity Central Funds, will indirectly bear its pro-rata share of the fees and expenses incurred by the underlying Fidelity Central Funds. These fees and expenses are not included in the Fund's annualized expense ratio used to calculate the expense estimate in the table below.
Hypothetical Example for Comparison Purposes
The second line of the accompanying table for each class of the Fund provides information about hypothetical account values and hypothetical expenses based on a Class' actual expense ratio and an assumed rate of return of 5% per year before expenses, which is not the Class' actual return. The hypothetical account values and expenses may not be used to estimate the actual ending account balance or expenses you paid for the period. You may use this information to compare the ongoing costs of investing in the Fund and other funds. To do so, compare this 5% hypothetical example with the 5% hypothetical examples that appear in the shareholder reports of the other funds. A small balance maintenance fee of $12.00 that is charged once a year may apply for certain accounts with a value of less than $2,000. This fee is not included in the table below. If it was, the estimate of expenses you paid during the period would be higher, and your ending account value lower, by this amount. In addition, the Fund, as a shareholder in the underlying Fidelity Central Funds, will indirectly bear its pro-rata share of the fees and expenses incurred by the underlying Fidelity Central Funds. These fees and expenses are not included in the Fund's annualized expense ratio used to calculate the expense estimate in the table below.
Please note that the expenses shown in the table are meant to highlight your ongoing costs only and do not reflect any transaction costs. Therefore, the second line of the table is useful in comparing ongoing costs only, and will not help you determine the relative total costs of owning different funds.
Annual Report
| Annualized
Expense RatioB | Beginning
Account Value
February 1, 2015 | Ending
Account Value
July 31, 2015 | Expenses Paid
During Period*
February 1, 2015 to July 31, 2015 |
OTC | .89% | | | |
Actual | | $ 1,000.00 | $ 1,094.50 | $ 4.62 |
HypotheticalA | | $ 1,000.00 | $ 1,020.38 | $ 4.46 |
Class K | .78% | | | |
Actual | | $ 1,000.00 | $ 1,095.10 | $ 4.05 |
HypotheticalA | | $ 1,000.00 | $ 1,020.93 | $ 3.91 |
A 5% return per year before expenses
B Annualized expense ratio reflects expenses net of applicable fee waivers.
* Expenses are equal to each Class' annualized expense ratio, multiplied by the average account value over the period, multiplied by 181/365 (to reflect the one-half year period).
Annual Report
Investment Changes (Unaudited)
Top Ten Stocks as of July 31, 2015 |
| % of fund's
net assets | % of fund's net assets
6 months ago |
Apple, Inc. | 9.2 | 10.4 |
Amazon.com, Inc. | 5.7 | 5.8 |
Google, Inc. Class C | 4.0 | 4.3 |
Google, Inc. Class A | 3.9 | 4.2 |
Microsoft Corp. | 3.5 | 2.0 |
Facebook, Inc. Class A | 2.8 | 2.7 |
Activision Blizzard, Inc. | 2.7 | 2.2 |
athenahealth, Inc. | 2.4 | 2.7 |
Groupon, Inc. Class A | 2.4 | 3.9 |
Gilead Sciences, Inc. | 2.3 | 2.3 |
| 38.9 | |
Top Five Market Sectors as of July 31, 2015 |
| % of fund's
net assets | % of fund's net assets
6 months ago |
Information Technology | 47.2 | 49.9 |
Health Care | 20.9 | 20.8 |
Consumer Discretionary | 16.6 | 17.5 |
Consumer Staples | 6.4 | 3.6 |
Financials | 4.0 | 3.1 |
Asset Allocation (% of fund's net assets) |
As of July 31, 2015 * | As of January 31, 2015 ** |
 | Stocks 97.4% | |  | Stocks 98.1% | |
 | Convertible
Securities 2.4% | |  | Convertible
Securities 1.9% | |
 | Short-Term
Investments and
Net Other Assets (Liabilities) 0.2% | |  | Short-Term
Investments and
Net Other Assets (Liabilities) 0.0% | |
* Foreign investments | 9.6% | | ** Foreign investments | 12.4% | |

Annual Report
Investments July 31, 2015
Showing Percentage of Net Assets
Common Stocks - 97.4% |
| Shares | | Value (000s) |
CONSUMER DISCRETIONARY - 16.3% |
Automobiles - 1.9% |
Tesla Motors, Inc. (a)(d) | 963,399 | | $ 256,409 |
Diversified Consumer Services - 0.2% |
2U, Inc. (a) | 793,541 | | 25,465 |
Hotels, Restaurants & Leisure - 1.8% |
Buffalo Wild Wings, Inc. (a) | 220,700 | | 43,165 |
Intrawest Resorts Holdings, Inc. (a) | 751,535 | | 7,493 |
Panera Bread Co. Class A (a) | 531,500 | | 108,490 |
Starbucks Corp. | 1,306,820 | | 75,704 |
Vail Resorts, Inc. | 88,400 | | 9,697 |
Wingstop, Inc. | 7,100 | | 243 |
Wynn Resorts Ltd. | 15 | | 2 |
| | 244,794 |
Household Durables - 0.4% |
Garmin Ltd. (d) | 818,100 | | 34,287 |
GoPro, Inc. Class A (a)(d) | 248,100 | | 15,407 |
| | 49,694 |
Internet & Catalog Retail - 10.2% |
Amazon.com, Inc. (a) | 1,449,898 | | 777,363 |
ASOS PLC ADR (a)(d) | 383,452 | | 20,162 |
Etsy, Inc. (d) | 1,933,875 | | 40,302 |
Groupon, Inc. Class A (a)(d)(e) | 65,822,881 | | 317,266 |
Ocado Group PLC (a) | 245,400 | | 1,521 |
Wayfair LLC Class A (d) | 2,862,168 | | 106,787 |
zulily, Inc. Class A (a)(d) | 8,568,800 | | 113,194 |
| | 1,376,595 |
Leisure Products - 0.0% |
MCBC Holdings, Inc. | 139,300 | | 2,131 |
Media - 0.8% |
Charter Communications, Inc. Class A (a)(d) | 313,100 | | 58,193 |
Liberty Global PLC Class A (a) | 483,600 | | 25,370 |
Liberty LiLac Group Class A (a) | 24,180 | | 1,034 |
Twenty-First Century Fox, Inc. Class A | 738,000 | | 25,454 |
| | 110,051 |
Specialty Retail - 0.4% |
Ross Stores, Inc. | 1,036,000 | | 55,074 |
Ulta Salon, Cosmetics & Fragrance, Inc. (a) | 15 | | 2 |
| | 55,076 |
Common Stocks - continued |
| Shares | | Value (000s) |
CONSUMER DISCRETIONARY - continued |
Textiles, Apparel & Luxury Goods - 0.6% |
lululemon athletica, Inc. (a) | 571,346 | | $ 35,915 |
LVMH Moet Hennessy - Louis Vuitton SA ADR (d) | 1,308,700 | | 48,867 |
| | 84,782 |
TOTAL CONSUMER DISCRETIONARY | | 2,204,997 |
CONSUMER STAPLES - 6.3% |
Beverages - 0.5% |
Monster Beverage Corp. (a) | 446,100 | | 68,499 |
Food & Staples Retailing - 3.0% |
Costco Wholesale Corp. | 1,619,650 | | 235,335 |
Sprouts Farmers Market LLC (a) | 2,677,800 | | 65,660 |
Walgreens Boots Alliance, Inc. | 576,600 | | 55,717 |
Whole Foods Market, Inc. | 1,376,900 | | 50,119 |
| | 406,831 |
Food Products - 2.8% |
Blue Buffalo Pet Products, Inc. | 57,700 | | 1,612 |
Danone SA sponsored ADR | 3,735,524 | | 50,878 |
Diamond Foods, Inc. (a) | 95 | | 3 |
Keurig Green Mountain, Inc. | 2,397,746 | | 179,927 |
Mondelez International, Inc. | 3,292,600 | | 148,595 |
| | 381,015 |
TOTAL CONSUMER STAPLES | | 856,345 |
ENERGY - 1.4% |
Energy Equipment & Services - 0.1% |
Oceaneering International, Inc. | 322,400 | | 12,902 |
Oil, Gas & Consumable Fuels - 1.3% |
Anadarko Petroleum Corp. | 31,300 | | 2,327 |
Carrizo Oil & Gas, Inc. (a) | 26,300 | | 1,003 |
Diamondback Energy, Inc. | 1,007,700 | | 67,818 |
EOG Resources, Inc. | 668,900 | | 51,632 |
Noble Energy, Inc. | 1,397,600 | | 49,237 |
| | 172,017 |
TOTAL ENERGY | | 184,919 |
Common Stocks - continued |
| Shares | | Value (000s) |
FINANCIALS - 3.8% |
Banks - 2.8% |
Bank of America Corp. | 3,728,500 | | $ 66,666 |
Citigroup, Inc. | 1,189,200 | | 69,521 |
Commerce Bancshares, Inc. | 772,295 | | 36,367 |
Fifth Third Bancorp | 533,400 | | 11,239 |
Huntington Bancshares, Inc. | 230,700 | | 2,692 |
JPMorgan Chase & Co. | 759,500 | | 52,049 |
Signature Bank (a) | 270,100 | | 39,324 |
UMB Financial Corp. | 549,500 | | 30,124 |
Wells Fargo & Co. | 1,323,200 | | 76,574 |
| | 384,556 |
Capital Markets - 0.3% |
Carlyle Group LP | 630,500 | | 16,778 |
Northern Trust Corp. | 320,900 | | 24,546 |
| | 41,324 |
Consumer Finance - 0.7% |
Capital One Financial Corp. | 1,075,500 | | 87,438 |
Real Estate Management & Development - 0.0% |
WeWork Companies, Inc. Class A (f) | 29,911 | | 984 |
TOTAL FINANCIALS | | 514,302 |
HEALTH CARE - 20.7% |
Biotechnology - 16.1% |
Acceleron Pharma, Inc. (a) | 164,200 | | 4,703 |
Adaptimmune Therapeutics PLC sponsored ADR | 594,600 | | 8,949 |
Aduro Biotech, Inc. (d) | 55,900 | | 1,466 |
Aduro Biotech, Inc. | 1,938,567 | | 45,746 |
Alexion Pharmaceuticals, Inc. (a) | 1,115,989 | | 220,341 |
Alkermes PLC (a) | 905,536 | | 63,406 |
Alnylam Pharmaceuticals, Inc. (a) | 139,200 | | 17,738 |
Amgen, Inc. | 424,200 | | 74,909 |
Anacor Pharmaceuticals, Inc. (a) | 133,200 | | 19,872 |
Array BioPharma, Inc. (a)(d) | 6,768,400 | | 39,324 |
Avalanche Biotechnologies, Inc. (a) | 996,552 | | 14,669 |
Bellicum Pharmaceuticals, Inc. (d) | 983,400 | | 20,012 |
BioCryst Pharmaceuticals, Inc. (a) | 2,910,964 | | 45,062 |
Biogen, Inc. (a) | 316,100 | | 100,766 |
BioMarin Pharmaceutical, Inc. (a) | 626,756 | | 91,676 |
Blueprint Medicines Corp. | 164,834 | | 4,454 |
Celldex Therapeutics, Inc. (a) | 1,283,885 | | 30,235 |
Common Stocks - continued |
| Shares | | Value (000s) |
HEALTH CARE - continued |
Biotechnology - continued |
Cellectis SA sponsored ADR | 249,800 | | $ 8,870 |
Chiasma, Inc. | 102,900 | | 2,425 |
Chimerix, Inc. (a) | 55,200 | | 2,966 |
Cidara Therapeutics, Inc. | 40,300 | | 563 |
Clovis Oncology, Inc. (a) | 1,053,954 | | 88,985 |
Coherus BioSciences, Inc. | 440,306 | | 15,446 |
Dicerna Pharmaceuticals, Inc. (a) | 316,729 | | 3,870 |
Dyax Corp. (a) | 1,021,100 | | 25,129 |
Exelixis, Inc. (a) | 693,121 | | 3,972 |
Foundation Medicine, Inc. (a) | 5 | | 0 |
Galapagos Genomics NV sponsored ADR | 786,600 | | 47,707 |
Genocea Biosciences, Inc. (a) | 852,070 | | 11,077 |
Gilead Sciences, Inc. | 2,602,199 | | 306,695 |
Heron Therapeutics, Inc. (a) | 242,500 | | 7,842 |
Intercept Pharmaceuticals, Inc. (a) | 310,319 | | 81,865 |
Ironwood Pharmaceuticals, Inc. Class A (a) | 3,166,642 | | 33,091 |
Isis Pharmaceuticals, Inc. (a) | 83,049 | | 4,562 |
Juno Therapeutics, Inc. (d) | 587,724 | | 28,751 |
Karyopharm Therapeutics, Inc. (a) | 616,858 | | 12,658 |
Lion Biotechnologies, Inc. (a)(d)(e) | 3,012,600 | | 25,788 |
Medivation, Inc. (a) | 1,113,004 | | 117,233 |
Novavax, Inc. (a) | 2,849,200 | | 34,361 |
Ophthotech Corp. (a) | 883,500 | | 59,804 |
Otonomy, Inc. | 217,345 | | 5,601 |
OvaScience, Inc. (a)(d) | 977,313 | | 27,853 |
Portola Pharmaceuticals, Inc. (a)(e) | 2,836,107 | | 140,217 |
ProNai Therapeutics, Inc. | 31,600 | | 866 |
PTC Therapeutics, Inc. (a) | 169,766 | | 8,694 |
Puma Biotechnology, Inc. (a) | 946,587 | | 85,761 |
Sage Therapeutics, Inc. | 15,900 | | 1,087 |
Seattle Genetics, Inc. (a)(d) | 1,648,886 | | 78,932 |
Spark Therapeutics, Inc. (d) | 32,300 | | 1,985 |
TESARO, Inc. (a) | 465,800 | | 27,016 |
Trevena, Inc. (a)(e) | 3,354,221 | | 19,522 |
Ultragenyx Pharmaceutical, Inc. (a) | 295,105 | | 35,687 |
uniQure B.V. (a) | 304,700 | | 7,846 |
Versartis, Inc. (a)(d) | 508,600 | | 9,206 |
XOMA Corp. (a)(d) | 1,989,413 | | 1,453 |
| | 2,178,714 |
Common Stocks - continued |
| Shares | | Value (000s) |
HEALTH CARE - continued |
Health Care Equipment & Supplies - 0.5% |
HeartWare International, Inc. (a) | 22,300 | | $ 2,023 |
IDEXX Laboratories, Inc. (a) | 407,204 | | 29,616 |
Inogen, Inc. (a) | 36,400 | | 1,618 |
Novadaq Technologies, Inc. (a) | 2,702,756 | | 31,001 |
| | 64,258 |
Health Care Providers & Services - 0.3% |
Accretive Health, Inc. (a)(e) | 7,198,902 | | 18,789 |
Diplomat Pharmacy, Inc. (d) | 556,700 | | 25,708 |
Teladoc, Inc. (a) | 31,700 | | 1,001 |
| | 45,498 |
Health Care Technology - 2.6% |
athenahealth, Inc. (a)(d)(e) | 2,339,204 | | 327,395 |
Castlight Health, Inc. Class B (a)(d) | 64,300 | | 462 |
Veeva Systems, Inc. Class A (a)(d) | 1,023,800 | | 27,561 |
| | 355,418 |
Life Sciences Tools & Services - 0.0% |
NantKwest, Inc. | 53,100 | | 1,625 |
Pharmaceuticals - 1.2% |
Achaogen, Inc. (a)(d) | 833,100 | | 6,007 |
Flex Pharma, Inc. | 473,196 | | 7,377 |
GW Pharmaceuticals PLC ADR (a) | 128,127 | | 14,672 |
Intra-Cellular Therapies, Inc. (a) | 259,500 | | 7,551 |
Jazz Pharmaceuticals PLC (a) | 134,700 | | 25,895 |
Relypsa, Inc. (a) | 535,600 | | 17,734 |
Shire PLC sponsored ADR | 288,900 | | 77,081 |
Tetraphase Pharmaceuticals, Inc. (a) | 27,300 | | 1,298 |
Theravance, Inc. | 79 | | 1 |
| | 157,616 |
TOTAL HEALTH CARE | | 2,803,129 |
INDUSTRIALS - 2.6% |
Airlines - 1.2% |
American Airlines Group, Inc. | 3,952,500 | | 158,495 |
Commercial Services & Supplies - 0.2% |
Regus PLC | 2,388,800 | | 10,475 |
Stericycle, Inc. (a) | 144,600 | | 20,384 |
| | 30,859 |
Common Stocks - continued |
| Shares | | Value (000s) |
INDUSTRIALS - continued |
Electrical Equipment - 0.7% |
SolarCity Corp. (a)(d) | 1,538,948 | | $ 89,259 |
Professional Services - 0.1% |
TriNet Group, Inc. (a) | 595,100 | | 15,996 |
WageWorks, Inc. (a) | 100,353 | | 5,013 |
| | 21,009 |
Road & Rail - 0.4% |
J.B. Hunt Transport Services, Inc. | 654,080 | | 55,021 |
TOTAL INDUSTRIALS | | 354,643 |
INFORMATION TECHNOLOGY - 45.8% |
Communications Equipment - 2.1% |
Cisco Systems, Inc. | 1,395,000 | | 39,646 |
QUALCOMM, Inc. | 3,874,153 | | 249,457 |
| | 289,103 |
Electronic Equipment & Components - 0.1% |
Littelfuse, Inc. | 73,900 | | 6,799 |
Internet Software & Services - 17.6% |
58.com, Inc. ADR (a) | 25,300 | | 1,503 |
Alibaba Group Holding Ltd. sponsored ADR | 1,699,200 | | 133,115 |
Baidu.com, Inc. sponsored ADR (a) | 101,500 | | 17,525 |
Cornerstone OnDemand, Inc. (a) | 1,653,782 | | 59,635 |
Criteo SA sponsored ADR (a)(e) | 5,475,671 | | 291,470 |
Cvent, Inc. (a) | 170,200 | | 4,582 |
Demandware, Inc. (a) | 11,300 | | 854 |
Dropbox, Inc. (a)(f) | 331,524 | | 5,556 |
Facebook, Inc. Class A (a) | 4,050,038 | | 380,744 |
Google, Inc.: | | | |
Class A (a) | 801,227 | | 526,807 |
Class C | 868,269 | | 543,198 |
JUST EAT Ltd. (a) | 243,200 | | 1,656 |
LinkedIn Corp. Class A (a) | 463,200 | | 94,150 |
Marketo, Inc. (a)(d) | 1,978,078 | | 60,153 |
Opower, Inc. (a)(d) | 1,080,100 | | 10,855 |
Rackspace Hosting, Inc. (a) | 4,642,030 | | 157,968 |
Shopify, Inc. Class A (d) | 16,900 | | 632 |
Twitter, Inc. (a) | 1,194,700 | | 37,048 |
Wix.com Ltd. (a) | 358,405 | | 10,035 |
Common Stocks - continued |
| Shares | | Value (000s) |
INFORMATION TECHNOLOGY - continued |
Internet Software & Services - continued |
Yahoo!, Inc. (a) | 881,400 | | $ 32,321 |
Zillow Group, Inc. (a)(d) | 128,300 | | 10,456 |
| | 2,380,263 |
Semiconductors & Semiconductor Equipment - 4.0% |
Analog Devices, Inc. | 412,700 | | 24,073 |
Applied Micro Circuits Corp. (a) | 450,050 | | 2,795 |
Avago Technologies Ltd. | 237,300 | | 29,696 |
Broadcom Corp. Class A | 52,300 | | 2,647 |
Cirrus Logic, Inc. (a) | 681,630 | | 22,501 |
Intel Corp. | 950,800 | | 27,526 |
Marvell Technology Group Ltd. | 4,577,000 | | 56,938 |
Micron Technology, Inc. (a) | 5,473,900 | | 101,322 |
NVIDIA Corp. | 12,466,961 | | 248,716 |
Qorvo, Inc. (a) | 500,316 | | 28,993 |
| | 545,207 |
Software - 11.6% |
Activision Blizzard, Inc. | 14,492,439 | | 373,760 |
GameLoft SE (a)(e) | 7,635,987 | | 36,312 |
HubSpot, Inc. | 496,180 | | 26,769 |
Interactive Intelligence Group, Inc. (a) | 218,487 | | 9,058 |
Microsoft Corp. | 10,170,539 | | 474,964 |
NetSuite, Inc. (a) | 103,400 | | 10,220 |
Paylocity Holding Corp. (a) | 239,000 | | 8,585 |
Rapid7, Inc. | 21,300 | | 489 |
Salesforce.com, Inc. (a) | 2,180,220 | | 159,810 |
ServiceNow, Inc. (a) | 305,707 | | 24,609 |
Synchronoss Technologies, Inc. (a)(e) | 2,664,361 | | 127,356 |
Ubisoft Entertainment SA (a)(e) | 10,524,882 | | 204,478 |
Xero Ltd. (a)(d) | 650,187 | | 7,597 |
Zendesk, Inc. (a)(d)(e) | 5,151,317 | | 106,272 |
| | 1,570,279 |
Technology Hardware, Storage & Peripherals - 10.4% |
Apple, Inc. | 10,295,120 | | 1,248,795 |
Nimble Storage, Inc. (a)(d) | 2,196,708 | | 60,673 |
SanDisk Corp. | 1,135,000 | | 68,429 |
Seagate Technology LLC | 277,500 | | 14,042 |
Common Stocks - continued |
| Shares | | Value (000s) |
INFORMATION TECHNOLOGY - continued |
Technology Hardware, Storage & Peripherals - continued |
Silicon Graphics International Corp. (a) | 74 | | $ 0 |
Western Digital Corp. | 170,100 | | 14,639 |
| | 1,406,578 |
TOTAL INFORMATION TECHNOLOGY | | 6,198,229 |
MATERIALS - 0.1% |
Chemicals - 0.1% |
Monsanto Co. | 202,000 | | 20,582 |
TELECOMMUNICATION SERVICES - 0.4% |
Diversified Telecommunication Services - 0.1% |
Cogent Communications Group, Inc. | 261,100 | | 8,300 |
Wireless Telecommunication Services - 0.3% |
Vodafone Group PLC sponsored ADR | 1,159,500 | | 43,806 |
TOTAL TELECOMMUNICATION SERVICES | | 52,106 |
TOTAL COMMON STOCKS (Cost $10,101,643) |
13,189,252
|
Convertible Preferred Stocks - 2.4% |
| | | |
CONSUMER DISCRETIONARY - 0.3% |
Household Durables - 0.2% |
Roku, Inc.: | | | |
Series F, 8.00% (a)(f) | 16,562,507 | | 21,366 |
Series G, 8.00% (f) | 3,185,945 | | 4,110 |
| | 25,476 |
Internet & Catalog Retail - 0.0% |
One Kings Lane, Inc. Series E (a)(f) | 648,635 | | 2,893 |
Media - 0.1% |
Turn, Inc. Series E (a)(f) | 1,199,041 | | 7,578 |
TOTAL CONSUMER DISCRETIONARY | | 35,947 |
CONSUMER STAPLES - 0.1% |
Food & Staples Retailing - 0.1% |
Blue Apron, Inc. Series D (f) | 866,669 | | 11,550 |
Convertible Preferred Stocks - continued |
| Shares | | Value (000s) |
FINANCIALS - 0.2% |
Real Estate Management & Development - 0.2% |
Redfin Corp. Series G (f) | 6,064,833 | | $ 22,804 |
WeWork Companies, Inc. Series E (f) | 269,198 | | 8,854 |
| | 31,658 |
HEALTH CARE - 0.2% |
Biotechnology - 0.2% |
23andMe, Inc. Series E (f) | 1,817,170 | | 19,675 |
CytomX Therapeutics, Inc. Series D (f) | 15,388,225 | | 2,283 |
Gensight Biologics Series B (f) | 675,056 | | 2,061 |
Jounce Therapeutics, Inc. Series B (f) | 2,212,389 | | 5,000 |
| | 29,019 |
INDUSTRIALS - 0.1% |
Aerospace & Defense - 0.0% |
Space Exploration Technologies Corp. Series G (f) | 62,037 | | 4,805 |
Professional Services - 0.1% |
YourPeople, Inc. Series C (f) | 335,546 | | 5,000 |
TOTAL INDUSTRIALS | | 9,805 |
INFORMATION TECHNOLOGY - 1.4% |
Internet Software & Services - 0.7% |
Pinterest, Inc. Series G, 8.00% (f) | 27,858 | | 1,000 |
Uber Technologies, Inc.: | | | |
Series D, 8.00% (a)(f) | 2,256,164 | | 89,434 |
Series E, 8.00% (f) | 150,072 | | 5,949 |
| | 96,383 |
IT Services - 0.3% |
AppNexus, Inc. Series E (f) | 1,416,796 | | 39,019 |
Nutanix, Inc. Series E (f) | 311,503 | | 4,959 |
| | 43,978 |
Software - 0.4% |
Cloudera, Inc. Series F (a)(f) | 126,709 | | 4,160 |
Cloudflare, Inc. Series D (f) | 395,787 | | 2,788 |
Dataminr, Inc. Series D (f) | 2,219,446 | | 28,298 |
Delphix Corp. Series D (f) | 427,177 | | 3,845 |
Snapchat, Inc. Series F (f) | 32,552 | | 1,000 |
Taboola.Com Ltd. Series E (f) | 1,918,392 | | 10,590 |
Twilio, Inc. Series E (f) | 351,811 | | 3,979 |
| | 54,660 |
Convertible Preferred Stocks - continued |
| Shares | | Value (000s) |
INFORMATION TECHNOLOGY - continued |
Technology Hardware, Storage & Peripherals - 0.0% |
Pure Storage, Inc. Series E (a)(f) | 184,982 | | $ 3,378 |
TOTAL INFORMATION TECHNOLOGY | | 198,399 |
TELECOMMUNICATION SERVICES - 0.1% |
Wireless Telecommunication Services - 0.1% |
Altiostar Networks, Inc. Series D (f) | 1,220,504 | | 15,000 |
TOTAL CONVERTIBLE PREFERRED STOCKS (Cost $269,616) |
331,378
|
Money Market Funds - 4.3% |
| | | |
Fidelity Cash Central Fund, 0.17% (b) | 61,469,911 | | 61,470 |
Fidelity Securities Lending Cash Central Fund, 0.18% (b)(c) | 519,054,682 | | 519,055 |
TOTAL MONEY MARKET FUNDS (Cost $580,525) |
580,525
|
TOTAL INVESTMENT PORTFOLIO - 104.1% (Cost $10,951,784) | 14,101,155 |
NET OTHER ASSETS (LIABILITIES) - (4.1)% | (554,307) |
NET ASSETS - 100% | $ 13,546,848 |
Legend |
(a) Non-income producing |
(b) Affiliated fund that is generally available only to investment companies and other accounts managed by Fidelity Investments. The rate quoted is the annualized seven-day yield of the fund at period end. A complete unaudited listing of the fund's holdings as of its most recent quarter end is available upon request. In addition, each Fidelity Central Fund's financial statements, which are not covered by the Fund's Report of Independent Registered Public Accounting Firm, are available on the SEC's website or upon request. |
(c) Investment made with cash collateral received from securities on loan. |
(d) Security or a portion of the security is on loan at period end. |
(e) Affiliated company |
(f) Restricted securities - Investment in securities not registered under the Securities Act of 1933 (excluding 144A issues). At the end of the period, the value of restricted securities (excluding 144A issues) amounted to $337,918,000 or 2.5% of net assets. |
Additional information on each restricted holding is as follows: |
Security | Acquisition Date | Acquisition Cost (000s) |
23andMe, Inc. Series E | 6/18/15 | $ 19,675 |
Altiostar Networks, Inc. Series D | 1/7/15 | $ 15,000 |
AppNexus, Inc. Series E | 8/1/14 - 9/17/14 | $ 28,382 |
Blue Apron, Inc. Series D | 5/18/15 | $ 11,550 |
Cloudera, Inc. Series F | 2/5/14 | $ 1,845 |
Cloudflare, Inc. Series D | 11/5/14 | $ 2,424 |
CytomX Therapeutics, Inc. Series D | 6/12/15 | $ 2,283 |
Dataminr, Inc. Series D | 2/18/15 - 3/6/15 | $ 28,298 |
Delphix Corp. Series D | 7/10/15 | $ 3,845 |
Dropbox, Inc. | 5/2/12 | $ 3,000 |
Gensight Biologics Series B | 7/2/15 | $ 2,081 |
Jounce Therapeutics, Inc. Series B | 4/17/15 | $ 5,000 |
Nutanix, Inc. Series E | 8/26/14 | $ 4,173 |
One Kings Lane, Inc. Series E | 1/29/14 | $ 10,000 |
Security | Acquisition Date | Acquisition Cost (000s) |
Pinterest, Inc. Series G, 8.00% | 2/27/15 | $ 1,000 |
Pure Storage, Inc. Series E | 8/22/13 | $ 1,282 |
Redfin Corp. Series G | 12/16/14 | $ 20,000 |
Roku, Inc.
Series F, 8.00% | 5/7/13 | $ 15,000 |
Roku, Inc.
Series G, 8.00% | 10/1/14 | $ 4,140 |
Snapchat, Inc. Series F | 3/25/15 | $ 1,000 |
Space Exploration Technologies Corp. Series G | 1/20/15 | $ 4,805 |
Taboola.Com Ltd. Series E | 12/22/14 | $ 20,000 |
Turn, Inc. Series E | 12/30/13 | $ 10,000 |
Twilio, Inc.
Series E | 4/24/15 | $ 3,979 |
Uber Technologies, Inc. Series D, 8.00% | 6/6/14 | $ 35,000 |
Uber Technologies, Inc. Series E, 8.00% | 12/5/14 | $ 5,000 |
WeWork Companies, Inc. Class A | 6/23/15 | $ 984 |
WeWork Companies, Inc. Series E | 6/23/15 | $ 8,854 |
YourPeople, Inc. Series C | 5/1/15 | $ 5,000 |
Affiliated Central Funds |
Information regarding fiscal year to date income earned by the Fund from investments in Fidelity Central Funds is as follows: |
Fund | Income earned
(Amounts in thousands) |
Fidelity Cash Central Fund | $ 44 |
Fidelity Securities Lending Cash Central Fund | 6,757 |
Total | $ 6,801 |
Other Affiliated Issuers |
An affiliated company is a company in which the Fund has ownership of at least 5% of the voting securities. Fiscal year to date transactions with companies which are or were affiliates are as follows: |
Affiliate
(Amounts in thousands) | Value, beginning of period | Purchases | Sales Proceeds* | Dividend Income | Value,
end of
period |
Accretive Health, Inc. | $ 82,872 | $ - | $ 7,733 | $ - | $ 18,789 |
ASOS PLC | - | 162,163 | 180,696 | - | - |
ASOS PLC ADR | - | 187,227 | 265,148 | - | - |
athenahealth, Inc. | 294,726 | 1,164 | 4,732 | - | 327,395 |
CommVault Systems, Inc. | 159,387 | 5,572 | 161,670 | - | - |
Criteo SA sponsored ADR | - | 193,948 | 7,408 | - | 291,470 |
E2open, Inc. | 25,119 | - | 14,218 | - | - |
Foundation Medicine, Inc. | 35,879 | 11,036 | 106,305 | - | - |
GameLoft SE | 49,492 | - | 696 | - | 36,312 |
Groupon, Inc. Class A | 390,059 | 39,856 | 7,340 | - | 317,266 |
KYTHERA Biopharmaceuticals, Inc. | 42,226 | - | 92,734 | - | - |
Lion Biotechnologies, Inc. | 12,870 | 8,773 | 1,124 | - | 25,788 |
Marketo, Inc. | 56,923 | - | 3,220 | - | - |
Novadaq Technologies, Inc. | 38,683 | 27,409 | 21,282 | - | - |
NVE Corp. | 17,620 | - | 18,136 | 244 | - |
Portola Pharmaceuticals, Inc. | 58,747 | 14,580 | 1,782 | - | 140,217 |
PTC Therapeutics, Inc. | 55,466 | 2,229 | 119,843 | - | - |
Rackspace Hosting, Inc. | 293,484 | 787 | 237,780 | - | - |
Synchronoss Technologies, Inc. | 165,112 | - | 67,747 | - | 127,356 |
Trevena, Inc. | - | 21,605 | 389 | - | 19,522 |
Ubisoft Entertainment SA | 169,602 | 9,886 | 3,294 | - | 204,478 |
Zendesk, Inc. | 668 | 118,015 | 2,206 | - | 106,272 |
Total | $ 1,948,935 | $ 804,250 | $ 1,325,483 | $ 244 | $ 1,614,865 |
* Includes the value of securities delivered through in-kind transactions, if applicable.
See accompanying notes which are an integral part of the financial statements.
Annual Report
Other Information |
The following is a summary of the inputs used, as of July 31, 2015, involving the Fund's assets and liabilities carried at fair value. The inputs or methodology used for valuing securities may not be an indication of the risk associated with investing in those securities. For more information on valuation inputs, and their aggregation into the levels used in the tables below, please refer to the Investment Valuation section in the accompanying Notes to Financial Statements. |
Valuation Inputs at Reporting Date: |
Description
(Amounts in thousands) | Total | Level 1 | Level 2 | Level 3 |
Investments in Securities: | | | | |
Equities: | | | | |
Consumer Discretionary | $ 2,240,944 | $ 2,204,997 | $ - | $ 35,947 |
Consumer Staples | 867,895 | 856,345 | - | 11,550 |
Energy | 184,919 | 184,919 | - | - |
Financials | 545,960 | 513,318 | - | 32,642 |
Health Care | 2,832,148 | 2,757,383 | 45,746 | 29,019 |
Industrials | 364,448 | 354,643 | - | 9,805 |
Information Technology | 6,396,628 | 6,192,673 | - | 203,955 |
Materials | 20,582 | 20,582 | - | - |
Telecommunication Services | 67,106 | 52,106 | - | 15,000 |
Money Market Funds | 580,525 | 580,525 | - | - |
Total Investments in Securities: | $ 14,101,155 | $ 13,717,491 | $ 45,746 | $ 337,918 |
Valuation Inputs at Reporting Date: |
The following is a reconciliation of Investments in Securities for which Level 3 inputs were used in determining value: |
(Amounts in thousands) | |
Investments in Securities: | |
Equities - Information Technology | |
Beginning Balance | $ 45,831 |
Net Realized Gain (Loss) on Investment Securities | - |
Net Unrealized Gain (Loss) on Investment Securities | 60,023 |
Cost of Purchases | 98,101 |
Proceeds of Sales | - |
Amortization/Accretion | - |
Transfers into Level 3 | - |
Transfers out of Level 3 | - |
Ending Balance | $ 203,955 |
The change in unrealized gain (loss) for the period attributable to Level 3 securities held at July 31, 2015 | $ 60,023 |
Equities - Other Investments in Securities | |
Beginning Balance | $ 47,700 |
Net Realized Gain (Loss) on Investment Securities | - |
Net Unrealized Gain (Loss) on Investment Securities | (3,108) |
Cost of Purchases | 99,371 |
Proceeds of Sales | (10,000) |
Amortization/Accretion | - |
Transfers into Level 3 | - |
Transfers out of Level 3 | - |
Ending Balance | $ 133,963 |
The change in unrealized gain (loss) for the period attributable to Level 3 securities held at July 31, 2015 | $ (3,108) |
The information used in the above reconciliations represents fiscal year to date activity for any Investments in Securities identified as using Level 3 inputs at either the beginning or the end of the current fiscal period. Transfers in or out of Level 3 represent the beginning value of any Security or Instrument where a change in the pricing level occurred from the beginning to the end of the period. The cost of purchases and the proceeds of sales may include securities received or delivered through corporate actions or exchanges. Realized and unrealized gains (losses) disclosed in the reconciliations are included in Net Gain (Loss) on the Fund's Statement of Operations. |
See accompanying notes which are an integral part of the financial statements.
Annual Report
Statement of Assets and Liabilities
Amounts in thousands (except per-share amounts) | | July 31, 2015 |
| | |
Assets | | |
Investment in securities, at value (including securities loaned of $505,388) - See accompanying schedule: Unaffiliated issuers (cost $8,904,710) | $ 11,905,765 | |
Fidelity Central Funds (cost $580,525) | 580,525 | |
Other affiliated issuers (cost $1,466,549) | 1,614,865 | |
Total Investments (cost $10,951,784) | | $ 14,101,155 |
Receivable for investments sold | | 136,937 |
Receivable for fund shares sold | | 12,385 |
Dividends receivable | | 2,414 |
Distributions receivable from Fidelity Central Funds | | 727 |
Other receivables | | 283 |
Total assets | | 14,253,901 |
| | |
Liabilities | | |
Payable for investments purchased | $ 170,398 | |
Payable for fund shares redeemed | 7,515 | |
Accrued management fee | 8,304 | |
Other affiliated payables | 1,548 | |
Other payables and accrued expenses | 233 | |
Collateral on securities loaned, at value | 519,055 | |
Total liabilities | | 707,053 |
| | |
Net Assets | | $ 13,546,848 |
Net Assets consist of: | | |
Paid in capital | | $ 9,853,507 |
Accumulated net investment loss | | (135) |
Accumulated undistributed net realized gain (loss) on investments and foreign currency transactions | | 544,136 |
Net unrealized appreciation (depreciation) on investments and assets and liabilities in foreign currencies | | 3,149,340 |
Net Assets | | $ 13,546,848 |
See accompanying notes which are an integral part of the financial statements.
Annual Report
Financial Statements - continued
Statement of Assets and Liabilities - continued
Amounts in thousands (except per-share amounts) | | July 31, 2015 |
OTC: | | |
Net Asset Value, offering price and redemption price per
share ($9,710,415 ÷ 111,634 shares) | | $ 86.98 |
| | |
Class K: | | |
Net Asset Value, offering price and redemption price per
share ($3,836,433 ÷ 43,660 shares) | | $ 87.87 |
See accompanying notes which are an integral part of the financial statements.
Annual Report
Statement of Operations
Amounts in thousands | Year ended July 31, 2015 |
Investment Income | | |
Dividends (including $244 earned from other affiliated issuers) | | $ 79,884 |
Income from Fidelity Central Funds (including $6,757 from security lending) | | 6,801 |
Total income | | 86,685 |
| | |
Expenses | | |
Management fee | | |
Basic fee | $ 74,469 | |
Performance adjustment | 6,326 | |
Transfer agent fees | 16,107 | |
Accounting and security lending fees | 1,491 | |
Custodian fees and expenses | 356 | |
Independent trustees' compensation | 52 | |
Appreciation in deferred trustee compensation account | 1 | |
Registration fees | 228 | |
Audit | 74 | |
Legal | 47 | |
Interest | 5 | |
Miscellaneous | 79 | |
Total expenses before reductions | 99,235 | |
Expense reductions | (598) | 98,637 |
Net investment income (loss) | | (11,952) |
Realized and Unrealized Gain (Loss) Net realized gain (loss) on: | | |
Investment securities: | | |
Unaffiliated issuers | 1,101,712 | |
Other affiliated issuers | 180,480 | |
Foreign currency transactions | (30) | |
Total net realized gain (loss) | | 1,282,162 |
Change in net unrealized appreciation (depreciation) on: Investment securities | 1,068,364 | |
Assets and liabilities in foreign currencies | (2) | |
Total change in net unrealized appreciation (depreciation) | | 1,068,362 |
Net gain (loss) | | 2,350,524 |
Net increase (decrease) in net assets resulting from operations | | $ 2,338,572 |
See accompanying notes which are an integral part of the financial statements.
Annual Report
Financial Statements - continued
Statement of Changes in Net Assets
Amounts in thousands | Year ended
July 31,
2015 | Year ended
July 31,
2014 |
Increase (Decrease) in Net Assets | | |
Operations | | |
Net investment income (loss) | $ (11,952) | $ (4,591) |
Net realized gain (loss) | 1,282,162 | 1,439,912 |
Change in net unrealized appreciation (depreciation) | 1,068,362 | 164,549 |
Net increase (decrease) in net assets resulting from operations | 2,338,572 | 1,599,870 |
Distributions to shareholders from net investment income | - | (7,143) |
Distributions to shareholders from net realized gain | (1,408,892) | (1,239,587) |
Total distributions | (1,408,892) | (1,246,730) |
Share transactions - net increase (decrease) | 1,841,344 | 1,469,555 |
Total increase (decrease) in net assets | 2,771,024 | 1,822,695 |
| | |
Net Assets | | |
Beginning of period | 10,775,824 | 8,953,129 |
End of period (including accumulated net investment loss of $135 and accumulated net investment loss of $142, respectively) | $ 13,546,848 | $ 10,775,824 |
See accompanying notes which are an integral part of the financial statements.
Annual Report
Financial Highlights - Fidelity OTC Portfolio
Years ended July 31, | 2015 | 2014 | 2013 | 2012 | 2011 |
Selected Per-Share Data | | | | | |
Net asset value, beginning of period | $ 81.23 | $ 78.98 | $ 57.53 | $ 59.28 | $ 45.00 |
Income from Investment Operations | | | | | |
Net investment income (loss) B | (.11) | (.06) | .36E | (.08) F | (.27) |
Net realized and unrealized gain (loss) | 16.14 | 12.78 | 21.37 | (1.67) | 14.55 |
Total from investment operations | 16.03 | 12.72 | 21.73 | (1.75) | 14.28 |
Distributions from net investment income | - | (.05) | (.28) | - | - |
Distributions from net realized gain | (10.28) | (10.42) | - | - | - |
Total distributions | (10.28) | (10.47) | (.28) | - | - |
Net asset value, end of period | $ 86.98 | $ 81.23 | $ 78.98 | $ 57.53 | $ 59.28 |
Total ReturnA | 21.34% | 17.96% | 37.93% | (2.95)% | 31.73% |
Ratios to Average Net Assets C, G | | | | | |
Expenses before reductions | .83% | .77% | .76% | .91% | .94% |
Expenses net of fee waivers, if any | .83% | .77% | .76% | .91% | .94% |
Expenses net of all reductions | .83% | .76% | .74% | .90% | .92% |
Net investment income (loss) | (.13)% | (.08)% | .55%E | (.14)% F | (.49)% |
Supplemental Data | | | | | |
Net assets, end of period (in millions) | $ 9,710 | $ 7,870 | $ 6,693 | $ 5,499 | $ 6,374 |
Portfolio turnover rate D | 66% H | 106% | 116% | 149% | 158% |
A Total returns would have been lower if certain expenses had not been reduced during the applicable periods shown.
B Calculated based on average shares outstanding during the period.
C Fees and expenses of any underlying Fidelity Central Funds are not included in the Fund's expense ratio. The Fund indirectly bears its proportionate share of the expenses of any underlying Fidelity Central Funds.
D Amount does not include the portfolio activity of any underlying Fidelity Central Funds.
E Investment income per share reflects a large, non-recurring dividend which amounted to $.10 per share. Excluding this non-recurring dividend, the ratio of net investment income (loss) to average net assets would have been .40%.
F Investment income per share reflects a large, non-recurring dividend which amounted to $.03 per share. Excluding this non-recurring dividend, the ratio of net investment income (loss) to average net assets would have been (.20)%.
G Expense ratios reflect operating expenses of the class. Expenses before reductions do not reflect amounts reimbursed by the investment adviser or reductions from brokerage service arrangements or reductions from other expense offset arrangements and do not represent the amount paid by the class during periods when reimbursements or reductions occur. Expenses net of fee waivers reflect expenses after reimbursement by the investment adviser but prior to reductions from brokerage service arrangements or other expense offset arrangements. Expenses net of all reductions represent the net expenses paid by the class.
H Portfolio turnover rate excludes securities received or delivered in-kind.
See accompanying notes which are an integral part of the financial statements.
Annual Report
Financial Highlights - Class K
Years ended July 31, | 2015 | 2014 | 2013 | 2012 | 2011 |
Selected Per-Share Data | | | | | |
Net asset value, beginning of period | $ 81.96 | $ 79.60 | $ 57.94 | $ 59.61 | $ 45.19 |
Income from Investment Operations | | | | | |
Net investment income (loss) B | (.01) | .04 | .45F | -G,I | (.19) |
Net realized and unrealized gain (loss) | 16.29 | 12.87 | 21.53 | (1.67) | 14.61 |
Total from investment operations | 16.28 | 12.91 | 21.98 | (1.67) | 14.42 |
Distributions from net investment income | - | (.10) | (.32) | - | - |
Distributions from net realized gain | (10.37) | (10.46) | - | - | - |
Total distributions | (10.37) | (10.55) K | (.32) | - | - |
Net asset value, end of period | $ 87.87 | $ 81.96 | $ 79.60 | $ 57.94 | $ 59.61 |
Total ReturnA | 21.49% | 18.10% | 38.11% | (2.80)% | 31.91% |
Ratios to Average Net Assets C, H | | | | | |
Expenses before reductions | .72% | .65% | .62% | .77% | .80% |
Expenses net of fee waivers, if any | .72% | .65% | .62% | .77% | .80% |
Expenses net of all reductions | .71% | .64% | .60% | .76% | .78% |
Net investment income (loss) | (.02)% | .05% | .69% F | -%E,G | (.35)% |
Supplemental Data | | | | | |
Net assets, end of period (in millions) | $ 3,836 | $ 2,906 | $ 2,260 | $ 1,644 | $ 1,363 |
Portfolio turnover rate D | 66% J | 106% | 116% | 149% | 158% |
A Total returns would have been lower if certain expenses had not been reduced during the applicable periods shown.
B Calculated based on average shares outstanding during the period.
C Fees and expenses of any underlying Fidelity Central Funds are not included in the Fund's expense ratio. The Fund indirectly bears its proportionate share of the expenses of any underlying Fidelity Central Funds.
D Amount does not include the portfolio activity of any underlying Fidelity Central Funds.
E Amount represents less than .01%.
F Investment income per share reflects a large, non-recurring dividend which amounted to $.10 per share. Excluding this non-recurring dividend, the ratio of net investment income (loss) to average net assets would have been .53%.
G Investment income per share reflects a large, non-recurring dividend which amounted to $.03 per share. Excluding this non-recurring dividend, the ratio of net investment income (loss) to average net assets would have been (.06)%.
H Expense ratios reflect operating expenses of the class. Expenses before reductions do not reflect amounts reimbursed by the investment adviser or reductions from brokerage service arrangements or reductions from other expense offset arrangements and do not represent the amount paid by the class during periods when reimbursements or reductions occur. Expenses net of fee waivers reflect expenses after reimbursement by the investment adviser but prior to reductions from brokerage service arrangements or other expense offset arrangements. Expenses net of all reductions represent the net expenses paid by the class.
I Amount represents less than $.01 per share.
J Portfolio turnover rate excludes securities received or delivered in-kind.
K Total distributions of $10.55 per share is comprised of distributions from net investment income of $.098 and distributions from net realized gain of $10.456 per share.
See accompanying notes which are an integral part of the financial statements.
Annual Report
For the period ended July 31, 2015
(Amounts in thousands except percentages)
1. Organization.
Fidelity OTC Portfolio (the Fund) is a non-diversified fund of Fidelity Securities Fund (the Trust) and is authorized to issue an unlimited number of shares. The Trust is registered under the Investment Company Act of 1940, as amended (the 1940 Act), as an open-end management investment company organized as a Massachusetts business trust. The Fund offers OTC and Class K shares, each of which has equal rights as to assets and voting privileges. Each class has exclusive voting rights with respect to matters that affect that class.
2. Investments in Fidelity Central Funds.
The Fund invests in Fidelity Central Funds, which are open-end investment companies generally available only to other investment companies and accounts managed by the investment adviser and its affiliates. The Fund's Schedule of Investments lists each of the Fidelity Central Funds held as of period end, if any, as an investment of the Fund, but does not include the underlying holdings of each Fidelity Central Fund. As an Investing Fund, the Fund indirectly bears its proportionate share of the expenses of the underlying Fidelity Central Funds.
The Money Market Central Funds seek preservation of capital and current income and are managed by Fidelity Investments Money Management, Inc. (FIMM), an affiliate of the investment adviser. Annualized expenses of the Money Market Central Funds as of their most recent shareholder report date are less than .01%.
A complete unaudited list of holdings for each Fidelity Central Fund is available upon request or at the Securities and Exchange Commission (the SEC) website at www.sec.gov. In addition, the financial statements of the Fidelity Central Funds, which are not covered by the Fund's Report of Independent Registered Public Accounting Firm, are available on the SEC website or upon request.
3. Significant Accounting Policies.
The financial statements have been prepared in conformity with accounting principles generally accepted in the United States of America (GAAP), which require management to make certain estimates and assumptions at the date of the financial statements. Actual results could differ from those estimates. Subsequent events, if any, through the date that the financial statements were issued have been evaluated in the preparation of the financial statements. The following summarizes the significant accounting policies of the Fund:
Annual Report
3. Significant Accounting Policies - continued
Investment Valuation. Investments are valued as of 4:00 p.m. Eastern time on the last calendar day of the period. The Board of Trustees (the Board) has delegated the day to day responsibility for the valuation of the Fund's investments to the Fidelity Management & Research Company (FMR) Fair Value Committee (the Committee). In accordance with valuation policies and procedures approved by the Board, the Fund attempts to obtain prices from one or more third party pricing vendors or brokers to value its investments. When current market prices, quotations or currency exchange rates are not readily available or reliable, investments will be fair valued in good faith by the Committee, in accordance with procedures adopted by the Board. Factors used in determining fair value vary by investment type and may include market or investment specific events. The frequency with which these procedures are used cannot be predicted and they may be utilized to a significant extent. The Committee oversees the Fund's valuation policies and procedures and reports to the Board on the Committee's activities and fair value determinations. The Board monitors the appropriateness of the procedures used in valuing the Fund's investments and ratifies the fair value determinations of the Committee.
The Fund categorizes the inputs to valuation techniques used to value its investments into a disclosure hierarchy consisting of three levels as shown below:
Level 1 - quoted prices in active markets for identical investments
Level 2 - other significant observable inputs (including quoted prices for similar investments, interest rates, prepayment speeds, etc.)
Level 3 - unobservable inputs (including the Fund's own assumptions based on the best information available)
Valuation techniques used to value the Fund's investments by major category are as follows:
Equity securities, including restricted securities, for which market quotations are readily available, are valued at the last reported sale price or official closing price as reported by a third party pricing vendor on the primary market or exchange on which they are traded and are categorized as Level 1 in the hierarchy. In the event there were no sales during the day or closing prices are not available, securities are valued at the last quoted bid price or may be valued using the last available price and are generally categorized as Level 2 in the hierarchy. For foreign equity securities, when market or security specific events arise, comparisons to the valuation of American Depositary Receipts (ADRs), futures contracts, Exchange-Traded Funds (ETFs) and certain indexes as well as quoted prices for similar securities may be used and would be categorized as Level 2 in the hierarchy. Utilizing these techniques may result in transfers between Level 1 and Level 2.
Annual Report
Notes to Financial Statements - continued
(Amounts in thousands except percentages)
3. Significant Accounting Policies - continued
Investment Valuation - continued
For equity securities, including restricted securities, where observable inputs are limited, assumptions about market activity and risk are used and these securities may be categorized as Level 3 in the hierarchy. Equity securities, including restricted securities, for which observable inputs are not available are valued using alternate valuation approaches, including the market approach and the income approach and are categorized as Level 3 in the hierarchy. The market approach generally consists of using comparable market transactions while the income approach generally consists of using the net present value of estimated future cash flows, adjusted as appropriate for liquidity, credit, market and/or other risk factors.
Investments in open-end mutual funds, including the Fidelity Central Funds, are valued at their closing net asset value (NAV) each business day and are categorized as Level 1 in the hierarchy.
The following provides information on Level 3 securities held by the Fund that were valued at period end based on unobservable inputs. These amounts exclude valuations provided by a broker.
Asset Type | Fair Value at 07/31/15
(000s) | Valuation
Technique(s) | Unobservable
Input | Amount or Range/Weighted Average | Impact to
Valuation from an Increase
in Input* |
Equities | $ 337,918 | Last transaction price | Transaction price | $0.15 - $77.46/$24.61 | Increase |
| | Market comparable | Discount rate
EV/Sales multiple
Discount for lack of marketability
Premium rate | 10.0% - 40.0%/22.6%
1.3 - 8.8/4.4
15.0% - 30.0%/20.1%
15% | Decrease
Increase
Decrease
Increase |
| | Replacement cost | Liquidation preference | $8.34 | Increase |
* Represents the expected directional change in the fair value of the Level 3 investments that would result from an increase in the corresponding input. A decrease to the unobservable input would have the opposite effect. Significant changes in these inputs could result in significantly higher or lower fair value measurements.
Changes in valuation techniques may result in transfers in or out of an assigned level within the disclosure hierarchy. The aggregate value of investments by input level as of July 31, 2015, as well as a roll forward of Level 3 investments, is included at the end of the Fund's Schedule of Investments.
Annual Report
3. Significant Accounting Policies - continued
Foreign Currency. The Fund may use foreign currency contracts to facilitate transactions in foreign-denominated securities. Gains and losses from these transactions may arise from changes in the value of the foreign currency or if the counterparties do not perform under the contracts' terms.
Foreign-denominated assets, including investment securities, and liabilities are translated into U.S. dollars at the exchange rates at period end. Purchases and sales of investment securities, income and dividends received and expenses denominated in foreign currencies are translated into U.S. dollars at the exchange rate in effect on the transaction date.
The effects of exchange rate fluctuations on investments are included with the net realized and unrealized gain (loss) on investment securities. Other foreign currency transactions resulting in realized and unrealized gain (loss) are disclosed separately.
Investment Transactions and Income. For financial reporting purposes, the Fund's investment holdings and NAV include trades executed through the end of the last business day of the period. The NAV per share for processing shareholder transactions is calculated as of the close of business of the New York Stock Exchange (NYSE), normally 4:00 p.m. Eastern time and includes trades executed through the end of the prior business day. Gains and losses on securities sold are determined on the basis of identified cost and may include proceeds received from litigation. Dividend income is recorded on the ex-dividend date, except for certain dividends from foreign securities where the ex-dividend date may have passed, which are recorded as soon as the Fund is informed of the ex-dividend date. Non-cash dividends included in dividend income, if any, are recorded at the fair market value of the securities received. Income and capital gain distributions from Fidelity Central Funds, if any, are recorded on the ex-dividend date. Distributions received on securities that represent a return of capital or capital gain are recorded as a reduction of cost of investments and/or as a realized gain. Subsequent to ex-dividend date the Fund determines the components of these distributions, based upon receipt of tax filings or other correspondence relating to the underlying investment. Interest income is accrued as earned and includes coupon interest and amortization of premium and accretion of discount on debt securities as applicable. Investment income is recorded net of foreign taxes withheld where recovery of such taxes is uncertain.
Class Allocations and Expenses. Investment income, realized and unrealized capital gains and losses, common expenses of the Fund, and certain fund-level expense reductions, if any, are allocated daily on a pro-rata basis to each class based on the relative net assets of each class to the total net assets of the Fund. Each class differs with respect to transfer agent fees incurred. Certain expense reductions may also differ by class. For the reporting period, the allocated portion of income and expenses to each class as a percent
Annual Report
Notes to Financial Statements - continued
(Amounts in thousands except percentages)
3. Significant Accounting Policies - continued
Class Allocations and Expenses - continued
of its average net assets may vary due to the timing of recording these transactions in relation to fluctuating net assets of the classes. Expenses directly attributable to a fund are charged to that fund. Expenses attributable to more than one fund are allocated among the respective funds on the basis of relative net assets or other appropriate methods. Expense estimates are accrued in the period to which they relate and adjustments are made when actual amounts are known.
Deferred Trustee Compensation. Under a Deferred Compensation Plan (the Plan), independent Trustees may elect to defer receipt of a portion of their annual compensation. Deferred amounts are invested in a cross-section of Fidelity funds, are marked-to-market and remain in the Fund until distributed in accordance with the Plan. The investment of deferred amounts and the offsetting payable to the Trustees are included in the accompanying Statement of Assets and Liabilities.
Income Tax Information and Distributions to Shareholders. Each year, the Fund intends to qualify as a regulated investment company under Subchapter M of the Internal Revenue Code, including distributing substantially all of its taxable income and realized gains. As a result, no provision for U.S. Federal income taxes is required. As of July 31, 2015, the Fund did not have any unrecognized tax benefits in the financial statements; nor is the Fund aware of any tax positions for which it is reasonably possible that the total amounts of unrecognized tax benefits will significantly change in the next twelve months. The Fund files a U.S. federal tax return, in addition to state and local tax returns as required. The Fund's federal income tax returns are subject to examination by the Internal Revenue Service (IRS) for a period of three fiscal years after they are filed. State and local tax returns may be subject to examination for an additional fiscal year depending on the jurisdiction. Foreign taxes are provided for based on the Fund's understanding of the tax rules and rates that exist in the foreign markets in which it invests.
Distributions are declared and recorded on the ex-dividend date. Income dividends and capital gain distributions are declared separately for each class. Income and capital gain distributions are determined in accordance with income tax regulations, which may differ from GAAP. In addition, the Fund claimed a portion of the payment made to redeeming shareholders as a distribution for income tax purposes.
Capital accounts within the financial statements are adjusted for permanent book-tax differences. These adjustments have no impact on net assets or the results of operations. Capital accounts are not adjusted for temporary book-tax differences which will reverse in a subsequent period.
Annual Report
3. Significant Accounting Policies - continued
Income Tax Information and Distributions to Shareholders - continued
Book-tax differences are primarily due to redemptions in-kind, foreign currency transactions, passive foreign investment companies (PFIC), net operating losses, partnerships, deferred trustees compensation and losses deferred due to wash sales.
The federal tax cost of investment securities and unrealized appreciation (depreciation) as of period end were as follows:
Gross unrealized appreciation | $ 4,118,286 |
Gross unrealized depreciation | (1,024,672) |
Net unrealized appreciation (depreciation) on securities | $ 3,093,614 |
| |
Tax Cost | $ 11,007,541 |
The tax-based components of distributable earnings as of period end were as follows:
Undistributed ordinary income | $ 274,172 |
Undistributed long-term capital gain | $ 325,721 |
Net unrealized appreciation (depreciation) on securities and other investments | $ 3,093,583 |
The tax character of distributions paid was as follows:
| July 31, 2015 | July 31, 2014 |
Ordinary Income | $ 637,244 | $ 324,481 |
Long-term Capital Gains | 771,648 | 922,249 |
Total | $ 1,408,892 | $ 1,246,730 |
Restricted Securities. The Fund may invest in securities that are subject to legal or contractual restrictions on resale. These securities generally may be resold in transactions exempt from registration or to the public if the securities are registered. Disposal of these securities may involve time-consuming negotiations and expense, and prompt sale at an acceptable price may be difficult. Information regarding restricted securities is included at the end of the Fund's Schedule of Investments.
Annual Report
Notes to Financial Statements - continued
(Amounts in thousands except percentages)
4. Purchases and Sales of Investments.
Purchases and sales of securities, other than short-term securities and in-kind transactions, aggregated $8,803,958 and $8,169,239, respectively.
Redemptions In-Kind. During the period, 2,605 shares of the Fund held by unaffiliated entities were redeemed for cash and investments with a value of $225,764. The net realized gain of $95,853 on investments delivered through in-kind redemptions is included in the accompanying Statement of Operations. The amount of in-kind redemptions is included in share transactions in the accompanying Statement of Changes in Net Assets as well as Note 10: Share Transactions. The Fund recognized no gain or loss for federal income tax purposes.
5. Fees and Other Transactions with Affiliates.
Management Fee. Fidelity Management & Research Company (the investment adviser) and its affiliates provide the Fund with investment management related services for which the Fund pays a monthly management fee. The management fee is the sum of an individual fund fee rate that is based on an annual rate of .35% of the Fund's average net assets and an annualized group fee rate that averaged 25% during the period. The group fee rate is based upon the average net assets of all the mutual funds advised by the investment adviser, including any mutual funds previously advised by the investment adviser that are currently advised by Fidelity SelectCo, LLC, an affiliate of the investment adviser. The group fee rate decreases as assets under management increase and increases as assets under management decrease. In addition, the management fee is subject to a performance adjustment (up to a maximum of ± .20% of the Fund's average net assets over a 36 month performance period). The upward or downward adjustment to the management fee is based on the relative investment performance of OTC as compared to its benchmark index, the Nasdaq Composite Index, over the same 36 month performance period. For the reporting period, the total annual management fee rate, including the performance adjustment, was .65% of the Fund's average net assets. The performance adjustment included in the management fee rate may be higher or lower than the maximum performance adjustment rate due to the difference between the average net assets for the reporting and performance periods.
Transfer Agent Fees. Fidelity Investments Institutional Operations Company, Inc., (FIIOC), an affiliate of the investment adviser, is the transfer, dividend disbursing and shareholder servicing agent for each class of the Fund. FIIOC receives account fees and asset-based fees that vary according to the account size and type of account of the shareholders of OTC. FIIOC receives an asset-based fee of Class K's average net assets. FIIOC pays for typesetting, printing and mailing of shareholder reports, except proxy statements.
Annual Report
5. Fees and Other Transactions with Affiliates - continued
Transfer Agent Fees - continued
For the period, transfer agent fees for each class were as follows:
| Amount | % of
Class-Level Average
Net Assets |
OTC | $ 14,405 | .16 |
Class K | 1,702 | .05 |
| $ 16,107 | |
Accounting and Security Lending Fees. Fidelity Service Company, Inc. (FSC), an affiliate of the investment adviser, maintains the Fund's accounting records. The accounting fee is based on the level of average net assets for each month. Under a separate contract, FSC administers the security lending program. The security lending fee is based on the number and duration of lending transactions.
Brokerage Commissions. The Fund placed a portion of its portfolio transactions with brokerage firms which are affiliates of the investment adviser. Brokerage commissions are included in net realized gain (loss) and change in net unrealized appreciation (depreciation) in the Statement of Operations. The commissions paid to these affiliated firms were $175 for the period.
Interfund Lending Program. Pursuant to an Exemptive Order issued by the SEC, the Fund, along with other registered investment companies having management contracts with FMR or other affiliated entities of FMR, may participate in an interfund lending program. This program provides an alternative credit facility allowing the funds to borrow from, or lend money to, other participating affiliated funds. At period end, there were no interfund loans outstanding. The Fund's activity in this program during the period for which loans were outstanding was as follows:
Borrower or Lender | Average Loan
Balance | Weighted Average Interest Rate | Interest Expense |
Borrower | $ 13,255 | .34% | $ 5 |
6. Committed Line of Credit.
The Fund participates with other funds managed by the investment adviser or an affiliate in a $4.25 billion credit facility (the "line of credit") to be utilized for temporary or emergency purposes to fund shareholder redemptions or for other short-term liquidity purposes. The Fund has agreed to pay commitment fees on its pro-rata portion of the line of credit, which amounted to $18 and is reflected in Miscellaneous expenses on the Statement of Operations. During the period, the Fund did not borrow on this line of credit.
Annual Report
Notes to Financial Statements - continued
(Amounts in thousands except percentages)
7. Security Lending.
The Fund lends portfolio securities through a lending agent from time to time in order to earn additional income. For equity securities, a lending agent is used and may loan securities to certain qualified borrowers, including Fidelity Capital Markets (FCM), a broker-dealer affiliated with the Fund. On the settlement date of the loan, the Fund receives collateral (in the form of U.S. Treasury obligations, letters of credit and/or cash) against the loaned securities and maintains collateral in an amount not less than 100% of the market value of the loaned securities during the period of the loan. The market value of the loaned securities is determined at the close of business of the Fund and any additional required collateral is delivered to the Fund on the next business day. If the borrower defaults on its obligation to return the securities loaned because of insolvency or other reasons, the Fund may apply collateral received from the borrower against the obligation. The Fund may experience delays and costs in recovering the securities loaned. Any cash collateral received is invested in the Fidelity Securities Lending Cash Central Fund. The value of loaned securities and cash collateral at period end are disclosed on the Fund's Statement of Assets and Liabilities. The value of securities loaned to FCM at period end was $34,191. Security lending income represents the income earned on investing cash collateral, less rebates paid to borrowers and any lending agent fees associated with the loan, plus any premium payments received for lending certain types of securities. Security lending income is presented in the Statement of Operations as a component of income from Fidelity Central Funds and includes securities loaned to FCM of $459.
8. Expense Reductions.
Commissions paid to certain brokers with whom the investment adviser, or its affiliates, places trades on behalf of the Fund include an amount in addition to trade execution, which may be rebated back to the Fund to offset certain expenses. This amount totaled $365 for the period. In addition, through arrangements with the Fund's custodian, credits realized as a result of uninvested cash balances were used to reduce the Fund's expenses. During the period, these credits reduced the Fund's custody expenses by $1.
In addition, during the period the investment adviser reimbursed/waived a portion of fund-level operating expenses in the amount of $52 and a portion of class-level operating expenses in the amount of $180.
Annual Report
9. Distributions to Shareholders.
Distributions to shareholders of each class were as follows:
Years ended July 31, | 2015 | 2014 |
From net investment income | | |
OTC | $ - | $ 4,344 |
Class K | - | 2,799 |
Total | $ - | $ 7,143 |
From net realized gain | | |
OTC | $ 1,012,327 | $ 926,740 |
Class K | 396,565 | 312,847 |
Total | $ 1,408,892 | $ 1,239,587 |
10. Share Transactions.
Share transactions for each class were as follows and may contain automatic conversions between classes or exchanges between funds:
| Shares | Dollars |
Years ended July 31, | 2015 | 2014 | 2015 | 2014 |
OTC | | | | |
Shares sold | 22,946 | 26,717 | $ 1,893,100 | $ 2,114,409 |
Reinvestment of distributions | 12,406 | 12,308 | 985,025 | 905,081 |
Shares redeemed | (20,601) | (26,885) | (1,665,615) | (2,095,020) |
Net increase (decrease) | 14,751 | 12,140 | $ 1,212,510 | $ 924,470 |
Class K | | | | |
Shares sold | 16,984 | 11,495 | $ 1,383,593 | $ 915,992 |
Reinvestment of distributions | 4,953 | 4,258 | 396,565 | 315,646 |
Shares redeemed | (13,732)A | (8,692) | (1,151,324)A | (686,553) |
Net increase (decrease) | 8,205 | 7,061 | $ 628,834 | $ 545,085 |
A Amount includes in-kind redemptions (see Note 4: Redemptions In-Kind).
11. Other.
The Fund's organizational documents provide former and current trustees and officers with a limited indemnification against liabilities arising in connection with the performance of their duties to the Fund. In the normal course of business, the Fund may also enter into contracts that provide general indemnifications. The Fund's maximum exposure under these arrangements is unknown as this would be dependent on future claims that may be made against the Fund. The risk of material loss from such claims is considered remote.
Annual Report
To the Trustees of Fidelity Securities Fund and Shareholders of Fidelity OTC Portfolio:
We have audited the accompanying statement of assets and liabilities of Fidelity OTC Portfolio (the Fund), a fund of Fidelity Securities Fund, including the schedule of investments, as of July 31, 2015, and the related statement of operations for the year then ended, the statement of changes in net assets for each of the two years in the period then ended, and the financial highlights for each of the five years in the period then ended. These financial statements and financial highlights are the responsibility of the Fund's management. Our responsibility is to express an opinion on these financial statements and financial highlights based on our audits.
We conducted our audits in accordance with the standards of the Public Company Accounting Oversight Board (United States). Those standards require that we plan and perform the audit to obtain reasonable assurance about whether the financial statements and financial highlights are free of material misstatement. The Fund is not required to have, nor were we engaged to perform, an audit of its internal control over financial reporting. Our audits included consideration of internal control over financial reporting as a basis for designing audit procedures that are appropriate in the circumstances, but not for the purpose of expressing an opinion on the effectiveness of the Fund's internal control over financial reporting. Accordingly, we express no such opinion. An audit also includes examining, on a test basis, evidence supporting the amounts and disclosures in the financial statements, assessing the accounting principles used and significant estimates made by management, as well as evaluating the overall financial statement presentation. Our procedures included confirmation of securities owned as of July 31, 2015, by correspondence with the custodians and brokers; when replies were not received from brokers, we performed other auditing procedures. We believe that our audits provide a reasonable basis for our opinion.
In our opinion, such financial statements and financial highlights referred to above present fairly, in all material respects, the financial position of Fidelity OTC Portfolio as of July 31, 2015, the results of its operations for the year then ended, the changes in its net assets for each of the two years in the period then ended, and the financial highlights for each of the five years in the period then ended, in conformity with accounting principles generally accepted in the United States of America.
DELOITTE & TOUCHE LLP
Boston, Massachusetts
September 24, 2015
Annual Report
The Trustees, Member of the Advisory Board, and officers of the trust and fund, as applicable, are listed below. The Board of Trustees governs the fund and is responsible for protecting the interests of shareholders. The Trustees are experienced executives who meet periodically throughout the year to oversee the fund's activities, review contractual arrangements with companies that provide services to the fund, oversee management of the risks associated with such activities and contractual arrangements, and review the fund's performance. Each of the Trustees oversees 170 funds.
The Trustees hold office without limit in time except that (a) any Trustee may resign; (b) any Trustee may be removed by written instrument, signed by at least two-thirds of the number of Trustees prior to such removal; (c) any Trustee who requests to be retired or who has become incapacitated by illness or injury may be retired by written instrument signed by a majority of the other Trustees; and (d) any Trustee may be removed at any special meeting of shareholders by a two-thirds vote of the outstanding voting securities of the trust. Each Trustee who is not an interested person (as defined in the 1940 Act) of the trust and the fund (Independent Trustee), shall retire not later than the last day of the calendar year in which his or her 75th birthday occurs. The Independent Trustees may waive this mandatory retirement age policy with respect to individual Trustees. The officers and Advisory Board Member hold office without limit in time, except that any officer and Advisory Board Member may resign or may be removed by a vote of a majority of the Trustees at any regular meeting or any special meeting of the Trustees. Except as indicated, each individual has held the office shown or other offices in the same company for the past five years.
Experience, Skills, Attributes, and Qualifications of the Fund's Trustees. The Governance and Nominating Committee has adopted a statement of policy that describes the experience, qualifications, attributes, and skills that are necessary and desirable for potential Independent Trustee candidates (Statement of Policy). The Board believes that each Trustee satisfied at the time he or she was initially elected or appointed a Trustee, and continues to satisfy, the standards contemplated by the Statement of Policy. The Governance and Nominating Committee also engages professional search firms to help identify potential Independent Trustee candidates who have the experience, qualifications, attributes, and skills consistent with the Statement of Policy. From time to time, additional criteria based on the composition and skills of the current Independent Trustees, as well as experience or skills that may be appropriate in light of future changes to board composition, business conditions, and regulatory or other developments, have also been considered by the professional search firms and the Governance and Nominating Committee. In addition, the Board takes into account the Trustees' commitment and participation in Board and committee meetings, as well as their leadership of standing and ad hoc committees throughout their tenure.
In determining that a particular Trustee was and continues to be qualified to serve as a Trustee, the Board has considered a variety of criteria, none of which, in isolation, was controlling. The Board believes that, collectively, the Trustees have balanced and diverse experience, qualifications, attributes, and skills, which allow the Board to operate effectively in governing the fund and protecting the interests of shareholders. Information about the specific experience, skills, attributes, and qualifications of each Trustee, which in each case led to the Board's conclusion that the Trustee should serve (or continue to serve) as a trustee of the fund, is provided below.
Annual Report
Trustees and Officers - continued
Board Structure and Oversight Function. James C. Curvey is an interested person (as defined in the 1940 Act) and currently serves as Chairman. The Trustees have determined that an interested Chairman is appropriate and benefits shareholders because an interested Chairman has a personal and professional stake in the quality and continuity of services provided to the fund. Independent Trustees exercise their informed business judgment to appoint an individual of their choosing to serve as Chairman, regardless of whether the Trustee happens to be independent or a member of management. The Independent Trustees have determined that they can act independently and effectively without having an Independent Trustee serve as Chairman and that a key structural component for assuring that they are in a position to do so is for the Independent Trustees to constitute a substantial majority for the Board. The Independent Trustees also regularly meet in executive session. Ned C. Lautenbach serves as Chairman of the Independent Trustees and as such (i) acts as a liaison between the Independent Trustees and management with respect to matters important to the Independent Trustees and (ii) with management prepares agendas for Board meetings.
Fidelity funds are overseen by different Boards of Trustees. The fund's Board oversees Fidelity's high income and certain equity funds and other Boards oversee Fidelity's investment-grade bond, money market, asset allocation, and sector funds. The asset allocation funds may invest in Fidelity funds overseen by the fund's Board. The use of separate Boards, each with its own committee structure, allows the Trustees of each group of Fidelity funds to focus on the unique issues of the funds they oversee, including common research, investment, and operational issues. On occasion, the separate Boards establish joint committees to address issues of overlapping consequences for the Fidelity funds overseen by each Board.
The Trustees operate using a system of committees to facilitate the timely and efficient consideration of all matters of importance to the Trustees, the fund, and fund shareholders and to facilitate compliance with legal and regulatory requirements and oversight of the fund's activities and associated risks. The Board, acting through its committees, has charged FMR and its affiliates with (i) identifying events or circumstances the occurrence of which could have demonstrably adverse effects on the fund's business and/or reputation; (ii) implementing processes and controls to lessen the possibility that such events or circumstances occur or to mitigate the effects of such events or circumstances if they do occur; and (iii) creating and maintaining a system designed to evaluate continuously business and market conditions in order to facilitate the identification and implementation processes described in (i) and (ii) above. Because the day-to-day operations and activities of the fund are carried out by or through FMR, its affiliates and other service providers, the fund's exposure to risks is mitigated but not eliminated by the processes overseen by the Trustees. While each of the Board's committees has responsibility for overseeing different aspects of the fund's activities, oversight is exercised primarily through the Operations, Audit, and Compliance Committees. In addition, the Independent Trustees have worked with FMR to enhance the Board's oversight of investment and financial risks, legal and regulatory risks, technology risks, and operational risks, including the development of additional risk reporting to the Board. For example, a working group comprised of Independent Trustees and FMR has worked and continues to work to review the Fidelity funds' valuation-related activities, reporting and risk management. Appropriate personnel, including but not limited to the fund's Chief Compliance Officer (CCO), FMR's internal auditor, the independent accountants, the fund's Treasurer and portfolio management personnel, make periodic reports to the Board's committees, as appropriate, including an annual review of FMR's risk management program for the Fidelity funds. The responsibilities of each standing committee, including their oversight responsibilities, are described further under "Standing Committees of the Fund's Trustees."
Annual Report
The fund's Statement of Additional Information (SAI) includes more information about the Trustees. To request a free copy, call Fidelity at 1-800-835-5092.
Interested Trustees*:
Correspondence intended for each Trustee who is an interested person may be sent to Fidelity Investments, 245 Summer Street, Boston, Massachusetts 02210.
Name, Year of Birth; Principal Occupations and Other Relevant Experience+ |
James C. Curvey (1935) |
Year of Election or Appointment: 2007 Trustee Chairman of the Board of Trustees |
| Mr. Curvey also serves as Trustee of other Fidelity funds. Mr. Curvey is a Director of Fidelity Research & Analysis Co. (investment adviser firm, 2009-present), and Vice Chairman (2007-present) and Director of FMR LLC (diversified financial services company). In addition, Mr. Curvey serves as an Overseer for the Boston Symphony Orchestra and a member of the board of Artis-Naples, Naples, Florida, and as a Trustee for Brewster Academy, Wolfeboro, New Hampshire. Previously, Mr. Curvey served as a Director of Fidelity Investments Money Management, Inc. (investment adviser firm, 2009-2014), a Director of FMR (investment adviser firm, 2007-2014), and a Director of FMR Co., Inc. (investment adviser firm, 2007-2014). |
Charles S. Morrison (1960) |
Year of Election or Appointment: 2014 Trustee |
| Mr. Morrison also serves as Trustee of other funds. He serves as a Director of Fidelity Investments Money Management, Inc. (FIMM) (investment adviser firm, 2014-present), Director of Fidelity SelectCo, LLC (investment adviser firm, 2014-present), President, Asset Management (2014-present), and is an employee of Fidelity Investments. Previously, Mr. Morrison served as Vice President of Fidelity's Fixed Income and Asset Allocation Funds (2012-2014), President, Fixed Income (2011-2014), Vice President of Fidelity's Money Market Funds (2005-2009), President, Money Market Group Leader of FMR (investment adviser firm, 2009), and Senior Vice President, Money Market Group of FMR (2004-2009). Mr. Morrison also served as Vice President of Fidelity's Bond Funds (2002-2005), certain Balanced Funds (2002-2005), and certain Asset Allocation Funds (2002-2007), and as Senior Vice President (2002-2005) of Fidelity's Bond Division. |
* Trustees have been determined to be "Interested Trustees" by virtue of, among other things, their affiliation with the trust or various entities under common control with FMR.
+ The information above includes each Trustee's principal occupation during the last five years and other information relating to the experience, attributes, and skills relevant to each Trustee's qualifications to serve as a Trustee, which led to the conclusion that each Trustee should serve as a Trustee for the fund.
Annual Report
Independent Trustees:
Correspondence intended for each Independent Trustee (that is, the Trustees other than the Interested Trustees) may be sent to Fidelity Investments, P.O. Box 55235, Boston, Massachusetts 02205-5235.
Name, Year of Birth; Principal Occupations and Other Relevant Experience+ |
Dennis J. Dirks (1948) |
Year of Election or Appointment: 2005 Trustee |
| Mr. Dirks also serves as Trustee of other Fidelity funds. Prior to his retirement in May 2003, Mr. Dirks was Chief Operating Officer and a member of the Board of The Depository Trust & Clearing Corporation (DTCC). He also served as President, Chief Operating Officer, and Board member of The Depository Trust Company (DTC) and President and Board member of the National Securities Clearing Corporation (NSCC). In addition, Mr. Dirks served as Chief Executive Officer and Board member of the Government Securities Clearing Corporation, Chief Executive Officer and Board member of the Mortgage-Backed Securities Clearing Corporation, as a Trustee and a member of the Finance Committee of Manhattan College (2005-2008), and as a Trustee and a member of the Finance Committee of AHRC of Nassau County (2006-2008). Mr. Dirks is a member of the Independent Directors Council (IDC) Governing Council (2010-present) and Board of Directors for The Brookville Center for Children's Services, Inc. (2009-present). |
Alan J. Lacy (1953) |
Year of Election or Appointment: 2008 Trustee |
| Mr. Lacy also serves as Trustee of other Fidelity funds. Mr. Lacy serves as a member of the Board of Directors of Dave & Buster's Entertainment, Inc. (restaurant and entertainment complexes, 2010-present) and Bristol-Myers Squibb Company (global pharmaceuticals, 2008-present). In addition, Mr. Lacy served as Senior Adviser (2007-2014) of Oak Hill Capital Partners, L.P. (private equity) and also served as Chief Executive Officer (2000-2005) and Vice Chairman (2005-2006) of Sears Holdings Corporation and Sears, Roebuck and Co. (retail). Mr. Lacy is a member of the Board of Trustees of The National Parks Conservation Association (2006-present). Previously, Mr. Lacy served as Chairman of the Board of Trustees of the National Parks Conservation Association (2008-2011) and as a member of the Board of Directors for The Western Union Company (global money transfer, 2006-2011), The Hillman Companies, Inc. (hardware wholesalers, 2010-2014), and Earth Fare, Inc. (retail grocery, 2010-2014). |
Ned C. Lautenbach (1944) |
Year of Election or Appointment: 2000 Trustee Chairman of the Independent Trustees |
| Mr. Lautenbach also serves as Trustee of other Fidelity funds. Mr. Lautenbach currently serves as the Lead Director of the Eaton Corporation Board of Directors (diversified industrial, 1997-present). Mr. Lautenbach is Chairman of the Board of Directors of Artis-Naples in Naples, Florida (2012-present), a member of the Council on Foreign Relations (1994-present), and a member of the Board of Governors, State University System of Florida (2013-present). Previously, Mr. Lautenbach was a Partner/Advisory Partner at Clayton, Dubilier & Rice, LLC (private equity investment, 1998-2010), as well as a Director of Sony Corporation (2006-2007). |
Joseph Mauriello (1944) |
Year of Election or Appointment: 2008 Trustee |
| Mr. Mauriello also serves as Trustee of other Fidelity funds. Prior to his retirement in January 2006, Mr. Mauriello served in numerous senior management positions including Deputy Chairman and Chief Operating Officer (2004-2005), and Vice Chairman of Financial Services (2002-2004) of KPMG LLP US (professional services, 1965-2005). Mr. Mauriello currently serves as a member of the Board of Directors of XL Group plc. (global insurance and re-insurance, 2006-present). Previously, Mr. Mauriello served as a Director of the Hamilton Funds of the Bank of New York (2006-2007) and of Arcadia Resources Inc. (health care services and products, 2007-2012). |
Robert W. Selander (1950) |
Year of Election or Appointment: 2011 Trustee |
| Mr. Selander also serves as Trustee of other Fidelity funds. Mr. Selander serves as a Director of The Western Union Company (global money transfer, 2014-present). Previously, Mr. Selander served as a Member of the Advisory Board of other Fidelity funds (2011), and Executive Vice Chairman (2010), Chief Executive Officer (2009-2010), and President and Chief Executive Officer (1997-2009) of Mastercard, Inc. |
Cornelia M. Small (1944) |
Year of Election or Appointment: 2005 Trustee |
| Ms. Small also serves as Trustee of other Fidelity funds. Ms. Small is a member of the Board of Directors (2009-present) and Chair of the Investment Committee (2010-present) of the Teagle Foundation. Ms. Small also serves on the Investment Committee of the Berkshire Taconic Community Foundation (2008-present). Previously, Ms. Small served as Chairperson (2002-2008) and a member of the Investment Committee and Chairperson (2008-2012) and a member of the Board of Trustees of Smith College. In addition, Ms. Small served as Chief Investment Officer, Director of Global Equity Investments, and a member of the Board of Directors of Scudder, Stevens & Clark and Scudder Kemper Investments. |
William S. Stavropoulos (1939) |
Year of Election or Appointment: 2002 Trustee Vice Chairman of the Independent Trustees |
| Mr. Stavropoulos also serves as Trustee of other Fidelity funds. Mr. Stavropoulos serves as President and Founder of the Michigan Baseball Foundation, the Great Lakes Loons (2007-present). Mr. Stavropoulos is Chairman Emeritus of the Board of Directors of The Dow Chemical Company, where he previously served in numerous senior management positions, including President, CEO (1995-2000; 2002-2004), Chairman of the Executive Committee (2000-2006), and as a member of the Board of Directors (1990-2006). Currently, Mr. Stavropoulos is Chairman of the Board of Directors of Univar Inc. (global distributor of commodity and specialty chemicals), a Director of Teradata Corporation (data warehousing and technology solutions), and Maersk Inc. (industrial conglomerate), and a member of the Advisory Board for Metalmark Capital LLC (private equity investment, 2005-present). Mr. Stavropoulos is an operating advisor to Clayton, Dubilier & Rice, LLC (private equity investment). In addition, Mr. Stavropoulos is a member of the University of Notre Dame Advisory Council for the College of Science, a Trustee of the Rollin L. Gerstacker Foundation, and a Director of the Naples Philharmonic Center for the Arts. Previously, Mr. Stavropoulos served as a Director of Chemical Financial Corporation (bank holding company, 1993-2012) and Tyco International, Ltd. (multinational manufacturing and services, 2007-2012). |
David M. Thomas (1949) |
Year of Election or Appointment: 2008 Trustee |
| Mr. Thomas also serves as Trustee of other Fidelity funds. Mr. Thomas serves as Non-Executive Chairman of the Board of Directors of Fortune Brands Home and Security (home and security products, 2011-present), as a member of the Board of Directors (2004-present) and Presiding Director (2013-present) of Interpublic Group of Companies, Inc. (marketing communication), and as a member of the Board of Trustees of the University of Florida (2013-present). Previously, Mr. Thomas served as Executive Chairman (2005-2006) and Chairman and Chief Executive Officer (2000-2005) of IMS Health, Inc. (pharmaceutical and healthcare information solutions), and a Director of Fortune Brands, Inc. (consumer products, 2000-2011). |
+ The information above includes each Trustee's principal occupation during the last five years and other information relating to the experience, attributes, and skills relevant to each Trustee's qualifications to serve as a Trustee, which led to the conclusion that each Trustee should serve as a Trustee for the fund.
Advisory Board Member and Officers:
Correspondence intended for each officer and Peter S. Lynch may be sent to Fidelity Investments, 245 Summer Street, Boston, Massachusetts 02210. Officers appear below in alphabetical order.
Name, Year of Birth; Principal Occupation |
Peter S. Lynch (1944) |
Year of Election or Appointment: 2003 Member of the Advisory Board |
| Mr. Lynch also serves as Member of the Advisory Board of other Fidelity funds. Mr. Lynch is Vice Chairman and a Director of FMR (investment adviser firm) and FMR Co., Inc. (investment adviser firm). In addition, Mr. Lynch serves as a Trustee of Boston College and as the Chairman of the Inner-City Scholarship Fund. Previously, Mr. Lynch served on the Special Olympics International Board of Directors (1997-2006). |
Elizabeth Paige Baumann (1968) |
Year of Election or Appointment: 2012 Anti-Money Laundering (AML) Officer |
| Ms. Baumann also serves as AML Officer of other funds. She is Chief AML Officer of FMR LLC (diversified financial services company, 2012-present) and is an employee of Fidelity Investments. Previously, Ms. Baumann served as Vice President and Deputy Anti-Money Laundering Officer (2007-2012). |
Marc Bryant (1966) |
Year of Election or Appointment: 2015 Secretary and Chief Legal Officer (CLO) |
| Mr. Bryant also serves as Secretary and Chief Legal Officer (CLO) of other funds. He is Senior Vice President and Deputy General Counsel of FMR LLC (diversified financial services company). Previously, Mr. Bryant served as Secretary and Chief Legal Officer of Fidelity Rutland Square Trust II (2010-2014) and Assistant Secretary of Fidelity's Fixed Income and Asset Allocation Funds (2013-2015). Prior to joining Fidelity Investments, Mr. Bryant served as a Senior Vice President and the Head of Global Retail Legal for AllianceBernstein L.P. 2006-2010), and as the General Counsel for ProFund Advisors LLC (2001-2006). |
William C. Coffey (1969) |
Year of Election or Appointment: 2009 Assistant Secretary |
| Mr. Coffey also serves as Assistant Secretary of other funds. He is Senior Vice President and Deputy General Counsel of FMR LLC (diversified financial services company, 2010-present), and is an employee of Fidelity Investments. Previously, Mr. Coffey served as Vice President and Associate General Counsel of FMR LLC (2005-2009). |
Jonathan Davis (1968) |
Year of Election or Appointment: 2010 Assistant Treasurer |
| Mr. Davis also serves as Assistant Treasurer of other funds. Mr. Davis is an employee of Fidelity Investments. Previously, Mr. Davis served as Vice President and Associate General Counsel of FMR LLC (diversified financial services company, 2003-2010). |
Adrien E. Deberghes (1967) |
Year of Election or Appointment: 2008 Deputy Treasurer |
| Mr. Deberghes also serves as an officer of other funds. He is an employee of Fidelity Investments (2008-present). Prior to joining Fidelity Investments, Mr. Deberghes was Senior Vice President of Mutual Fund Administration at State Street Corporation (2007-2008), Senior Director of Mutual Fund Administration at Investors Bank & Trust (2005-2007), and Director of Finance for Dunkin' Brands (2000-2005). |
Stephanie J. Dorsey (1969) |
Year of Election or Appointment: 2010 Assistant Treasurer |
| Ms. Dorsey also serves as an officer of other funds. She is an employee of Fidelity Investments (2008-present) and has served in other fund officer roles. Prior to joining Fidelity Investments, Ms. Dorsey served as Treasurer (2004-2008) of the JPMorgan Mutual Funds and Vice President (2004-2008) of JPMorgan Chase Bank. |
Howard J. Galligan III (1966) |
Year of Election or Appointment: 2014 Chief Financial Officer |
| Mr. Galligan also serves as Chief Financial Officer of other funds. Mr. Galligan serves as President of Fidelity Pricing and Cash Management Services (FPCMS) (2014-present) and as a Director of Strategic Advisers, Inc. (investment adviser firm, 2008-present). Previously, Mr. Galligan served as Chief Administrative Officer of Asset Management (2011-2014) and Chief Operating Officer and Senior Vice President of Investment Support for Strategic Advisers, Inc. (2003-2011). |
Scott C. Goebel (1968) |
Year of Election or Appointment: 2015 Vice President |
| Mr. Goebel serves as an officer of other funds. Mr. Goebel also serves as Secretary of Fidelity SelectCo, LLC (investment adviser firm, 2013-present), Fidelity Investments Money Management, Inc. (FIMM) (investment adviser firm, 2010-present) and Fidelity Research and Analysis Company (FRAC) (investment adviser firm, 2010-present); General Counsel, Secretary, and Senior Vice President of FMR (investment adviser firm, 2008-present) and FMR Co., Inc. (investment adviser firm, 2008-present); Chief Legal Officer of Fidelity Management & Research (Hong Kong) Limited (investment adviser firm, 2008-present); and Assistant Secretary of Fidelity Management & Research (Japan) Limited (investment adviser firm, 2008-present) and FMR Investment Management (U.K.) Limited (investment adviser firm, 2008-present). Previously, Mr. Goebel served as Secretary and CLO of certain Fidelity funds (2008-2015), Assistant Secretary of FIMM (2008-2010), FRAC (2008-2010), and certain funds (2007-2008); and as Vice President and Secretary of Fidelity Distributors Corporation (FDC) (2005-2007). Mr. Goebel has been employed by FMR LLC (diversified financial services company) or an affiliate since 2001. |
Brian B. Hogan (1964) |
Year of Election or Appointment: 2009 Vice President |
| Mr. Hogan also serves as Trustee or Vice President of other funds. Mr. Hogan serves as a Director of Fidelity SelectCo, LLC (investment adviser firm, 2014-present) and President of the Equity Division of FMR (investment adviser firm, 2009-present). Previously, Mr. Hogan served as Senior Vice President, Equity Research of FMR (2006-2009) and as a portfolio manager. |
Chris Maher (1972) |
Year of Election or Appointment: 2013 Assistant Treasurer |
| Mr. Maher serves as Assistant Treasurer of other funds. Mr. Maher is Vice President of Valuation Oversight and is an employee of Fidelity Investments. Previously, Mr. Maher served as Vice President of Asset Management Compliance (2013), Vice President of the Program Management Group of FMR (investment adviser firm, 2010-2013), and Vice President of Valuation Oversight (2008-2010). |
Melissa M. Reilly (1971) |
Year of Election or Appointment: 2014 Vice President of certain Equity Funds |
| Ms. Reilly also serves as Vice President of other funds. Ms. Reilly is an employee of Fidelity Investments (2004-present). |
Kenneth B. Robins (1969) |
Year of Election or Appointment: 2008 President and Treasurer |
| Mr. Robins also serves as an officer of other funds. Mr. Robins serves as Executive Vice President of Fidelity Investments Money Management, Inc. (FIMM) (investment adviser firm, 2013-present) and is an employee of Fidelity Investments (2004-present). Previously, Mr. Robins served in other fund officer roles. |
Stephen Sadoski (1971) |
Year of Election or Appointment: 2012 Deputy Treasurer |
| Mr. Sadoski also serves as Deputy Treasurer of other funds. He is an employee of Fidelity Investments (2012-present) and has served in another fund officer role. Prior to joining Fidelity Investments, Mr. Sadoski served as an assistant chief accountant in the Division of Investment Management of the Securities and Exchange Commission (SEC) (2009-2012) and as a senior manager at Deloitte & Touche LLP (1997-2009). |
Stacie M. Smith (1974) |
Year of Election or Appointment: 2013 Deputy Treasurer |
| Ms. Smith also serves as an officer of other funds. She is an employee of Fidelity Investments (2009-present) and has served in other fund officer roles. Prior to joining Fidelity Investments, Ms. Smith served as Senior Audit Manager of Ernst & Young LLP (1996-2009). |
Renee Stagnone (1975) |
Year of Election or Appointment: 2013 Deputy Treasurer |
| Ms. Stagnone also serves as Deputy Treasurer of other funds. Ms. Stagnone is an employee of Fidelity Investments. |
Linda J. Wondrack (1964) |
Year of Election or Appointment: 2014 Chief Compliance Officer |
| Ms. Wondrack also serves as Chief Compliance Officer of other funds. Ms. Wondrack is Executive Vice President and head of the Ethics Office and Asset Management Compliance for Fidelity Investments (2012- present). Ms. Wondrack also serves as Chief Compliance Officer of Fidelity SelectCo, LLC (investment adviser firm, 2014-present); Chief Compliance Officer of Impresa Management LLC (2013-present); and Chief Compliance Officer of FMR Co., Inc. (investment adviser firm), Fidelity Investments Money Management, Inc. (investment adviser firm), Fidelity Management & Research (Japan) Limited (investment adviser firm), FMR Investment Management (U.K.) Limited (investment adviser firm), Fidelity Management & Research (Hong Kong) (investment adviser firm), Fidelity Management & Research Company (investment adviser firm), Pyramis Global Advisors, LLC (investment adviser firm), and Strategic Advisers, Inc. (investment adviser firm), Ballyrock Investment Advisors LLC, and Northern Neck Investors LLC (2012-present). Previously, Ms. Wondrack served as Senior Vice President and Chief Compliance Officer for Columbia Management Investment Advisers, LLC (2005-2012); Chief Compliance Officer for certain funds within the Columbia Family of Funds (2007-2012); and Senior Vice President of Compliance Risk Management at Bank of America (2005-2010). |
Joseph F. Zambello (1957) |
Year of Election or Appointment: 2011 Deputy Treasurer |
| Mr. Zambello also serves as Deputy Treasurer of other funds. Mr. Zambello is an employee of Fidelity Investments. Previously, Mr. Zambello served as Vice President of the Program Management Group of FMR (investment adviser firm, 2009-2011) and Vice President of the Transfer Agent Oversight Group (2005-2009). |
Annual Report
The Board of Trustees of Fidelity OTC Portfolio voted to pay shareholders of record at the opening of business on record date, the following distributions per share derived from capital gains realized from sales of portfolio securities:
| Pay Date | Record Date | Capital Gains |
Class K | 09/14/15 | 09/11/15 | $3.923 |
The fund hereby designates as a capital gain dividend with respect to the taxable year ended July 31, 2015, $645,715,478, or, if subsequently determined to be different, the net capital gain of such year.
Class K designates 8% and 13% of the dividends distributed in September and December, respectively during the fiscal year as qualifying for the dividends-received deduction for corporate shareholders.
Class K designates 8% and 14% of the dividends distributed in September and December, respectively during the fiscal year as amounts which may be taken into account as a dividend for the purposes of the maximum rate under section 1(h(11) of the Internal Revenue Code.
The fund will notify shareholders in January 2016 of amounts for use in preparing 2015 income tax returns.
Annual Report
Fidelity OTC Portfolio
Each year, the Board of Trustees, including the Independent Trustees (together, the Board), votes on the renewal of the management contract with Fidelity Management & Research Company (FMR) and the sub-advisory agreements (together, the Advisory Contracts) for the fund. The Board, assisted by the advice of fund counsel and Independent Trustees' counsel, requests and considers a broad range of information relevant to the renewal of the Advisory Contracts throughout the year.
The Board meets regularly and, at each of its meetings, covers an extensive agenda of topics and materials and considers factors that are relevant to its annual consideration of the renewal of the fund's Advisory Contracts, including the services and support provided to the fund and its shareholders. The Board has established various standing committees (Committees), each composed of and chaired by Independent Trustees with varying backgrounds, to which the Board has assigned specific subject matter responsibilities in order to enhance effective decision-making by the Board. The Board, acting directly and through its Committees, requests and receives information concerning the annual consideration of the renewal of the fund's Advisory Contracts. The Board also meets as needed to consider matters specifically related to the Board's annual consideration of the renewal of the Advisory Contracts. Members of the Board may also meet with trustees of other Fidelity funds through ad hoc joint committees to discuss certain matters relevant to all of the Fidelity funds.
At its July 2015 meeting, the Board unanimously determined to renew the fund's Advisory Contracts. In reaching its determination, the Board considered all factors it believed relevant, including (i) the nature, extent, and quality of the services to be provided to the fund and its shareholders (including the investment performance of the fund); (ii) the competitiveness of the fund's management fee and total expense ratio relative to peer funds; (iii) the total costs of the services to be provided by and the profits to be realized by Fidelity from its relationship with the fund; and (iv) the extent to which (if any) economies of scale exist and would be realized as the fund grows, and whether any economies of scale are appropriately shared with fund shareholders.
In considering whether to renew the Advisory Contracts for the fund, the Board reached a determination, with the assistance of fund counsel and Independent Trustees' counsel and through the exercise of its business judgment, that the renewal of the Advisory Contracts was in the best interests of the fund and its shareholders and that the compensation payable under the Advisory Contracts was fair and reasonable. The Board's decision to renew the Advisory Contracts was not based on any single factor, but rather was based on a comprehensive consideration of all the information provided to the Board at its meetings throughout the year. The Board, in reaching its determination to renew the Advisory Contracts, was aware that shareholders of the fund have a broad range of investment choices available to them, including a wide choice among funds offered by Fidelity's competitors, and that the fund's shareholders, who have the opportunity to review and weigh the disclosure provided by the fund in its prospectus and other public disclosures, have chosen to invest in this fund, which is part of the Fidelity family of funds.
Annual Report
Board Approval of Investment Advisory Contracts and
Management Fees - continued
Nature, Extent, and Quality of Services Provided. The Board considered Fidelity's staffing as it relates to the fund, including the backgrounds of investment personnel of Fidelity, and also considered the fund's investment objective, strategies, and related investment philosophy. The Independent Trustees also had discussions with senior management of Fidelity's investment operations and investment groups. The Board considered the structure of the portfolio manager compensation program and whether this structure provides appropriate incentives to act in the best interests of the fund. Additionally, the Board considered the portfolio managers' investments, if any, in the funds that they manage.
Resources Dedicated to Investment Management and Support Services. The Board and the Fund Oversight and Research Committees reviewed the general qualifications and capabilities of Fidelity's investment staff, including its size, education, experience, and resources, as well as Fidelity's approach to recruiting, training, managing, and compensating investment personnel. The Board noted that Fidelity has continued to increase the resources devoted to non-U.S. offices, including expansion of Fidelity's global investment organization. The Board also noted that Fidelity's analysts have extensive resources, tools and capabilities that allow them to conduct sophisticated quantitative and fundamental analysis, as well as credit analysis of issuers, counterparties and guarantors. Further, the Board considered that Fidelity's investment professionals have sufficient access to global information and data so as to provide competitive investment results over time, and that those professionals also have access to sophisticated tools that permit them to assess portfolio construction and risk and performance attribution characteristics continuously, as well as to transmit new information and research conclusions rapidly around the world. Additionally, in its deliberations, the Board considered Fidelity's trading, risk management, and compliance capabilities and resources, which are integral parts of the investment management process.
Shareholder and Administrative Services. The Board considered (i) the nature, extent, quality, and cost of advisory, administrative, and shareholder services performed by FMR, the sub-advisers (together with FMR, the Investment Advisers), and their affiliates under the Advisory Contracts and under separate agreements covering transfer agency, pricing and bookkeeping, and securities lending services for the fund; (ii) the nature and extent of the supervision of third party service providers, principally custodians and subcustodians; and (iii) the resources devoted to, and the record of compliance with, the fund's compliance policies and procedures. The Board also reviewed the allocation of fund brokerage, including allocations to brokers affiliated with the Investment Advisers, the use of brokerage commissions to pay fund expenses, and the use of "soft" commission dollars to pay for research services.
Annual Report
The Board noted that the growth of fund assets over time across the complex allows Fidelity to reinvest in the development of services designed to enhance the value or convenience of the Fidelity funds as investment vehicles. These services include 24-hour access to account information and market information through telephone representatives and over the Internet, investor education materials and asset allocation tools, and the expanded availability of Fidelity Investor Centers.
In 2014, the Board formed an ad hoc Committee on Transfer Agency Fees to review the variety of transfer agency fee structures throughout the industry and Fidelity's competitive positioning with respect to industry participants.
Investment in a Large Fund Family. The Board considered the benefits to shareholders of investing in a Fidelity fund, including the benefits of investing in a fund that is part of a large family of funds offering a variety of investment disciplines and providing a large variety of mutual fund investor services. The Board noted that Fidelity had taken, or had made recommendations that resulted in the Fidelity funds taking, a number of actions over the previous year that benefited particular funds, including (i) continuing to dedicate additional resources to investment research and to the support of the senior management team that oversees asset management; (ii) continuing efforts to enhance Fidelity's global research capabilities; (iii) launching new funds and making other enhancements to meet client needs; (iv) reducing management fees and total expenses for certain index funds and diversified international funds; (v) continuing to launch dedicated lower cost underlying funds to meet portfolio construction needs related to expanding underlying fund options for Fidelity funds of funds, specifically for the Freedom Fund product lines; (vi) rationalizing product lines and gaining increased efficiencies through fund mergers; (vii) launching active fixed-income exchange-traded funds; (viii) continuing to develop, acquire and implement systems and technology to improve services to the funds and information security and to increase efficiency; (ix) implementing investment enhancements to further strengthen Fidelity's target date product line to increase investors' probability of success in achieving their goals; (x) modifying the eligibility criteria for certain share classes to accommodate roll-over assets from employer-sponsored retirement plans; (xi) launching a new Class W of the Freedom Index Funds to attract and retain Fidelity record-kept retirement plan assets; and (xii) implementing changes to Fidelity's money market product line in response to recent money market regulatory reforms.
Investment Performance. The Board considered whether the fund has operated in accordance with its investment objective, as well as its record of compliance with its investment restrictions and its performance history.
Annual Report
Board Approval of Investment Advisory Contracts and
Management Fees - continued
The Board took into account discussions with representatives of the Investment Advisers about fund investment performance that occur at Board meetings throughout the year. In this regard the Board noted that as part of regularly scheduled fund reviews and other reports to the Board on fund performance, the Board considers annualized return information for the fund, for different time periods, measured against a securities market index ("benchmark index") and a peer group of funds with similar objectives ("peer group"), if any. In its evaluation of fund investment performance, the Board gave particular attention to information indicating changes in performance of certain Fidelity funds for specific time periods and discussed with the Investment Advisers the reasons for any overperformance or underperformance.
In addition to reviewing absolute and relative fund performance, the Independent Trustees periodically consider the appropriateness of fund performance metrics in evaluating the results achieved. In general, the Independent Trustees believe that fund performance should be evaluated based on net performance (after fees and expenses) of both the highest performing and lowest performing fund share classes, where applicable, compared to appropriate benchmark indices, over appropriate time periods that may include full market cycles, and compared to peer groups, as applicable, over the same periods, taking into account relevant factors including the following: general market conditions; issuer-specific information; and fund cash flows and other factors.
The Independent Trustees recognize that shareholders evaluate performance on a net basis over their own holding periods, for which one-, three-, and five-year periods are often used as a proxy. For this reason, the performance information reviewed by the Board also included net cumulative calendar year total return information for the fund and an appropriate benchmark index for the most recent one-, three-, and five-year periods, as shown below. A peer group is not shown below because the fund does not generally utilize a peer group for performance comparison purposes.
Annual Report
Fidelity OTC Portfolio

The Board also considered that the fund's management fee is subject to upward or downward adjustment depending upon whether, and to what extent, the fund's investment performance for the performance period exceeds, or is exceeded by, a securities index, thus leading to a performance adjustment for the same period. The Board noted that the performance adjustment provides FMR with a strong economic incentive to seek to achieve superior performance for the fund's shareholders and helps to more closely align the interests of FMR and the shareholders of the fund.
Based on its review, the Board concluded that the nature, extent, and quality of services provided to the fund under the Advisory Contracts should benefit the shareholders of the fund.
Competitiveness of Management Fee and Total Expense Ratio. The Board considered the fund's management fee and total expense ratio compared to "mapped groups" of competitive funds and classes created for the purpose of facilitating the Trustees' competitive analysis of management fees and total expenses. Fidelity creates "mapped groups" by combining similar Lipper investment objective categories that have comparable investment mandates. Combining Lipper investment objective categories aids the Board's management fee and total expense ratio comparisons by broadening the competitive group used for comparison.
Management Fee. The Board considered two proprietary management fee comparisons for the 12-month periods shown in basis points (BP) in the chart below. The group of Lipper funds used by the Board for management fee comparisons is referred to below as the "Total Mapped Group." The Total Mapped Group comparison focuses on a fund's standing in terms of gross management fees before expense reimbursements or caps, and without giving effect to the fund's performance adjustment, relative to the total universe of funds with comparable investment mandates, regardless of whether their management fee structures also are comparable. Funds with comparable investment mandates offer exposure to similar types of securities. Funds with comparable management fee structures have similar management fee contractual arrangements (e.g., flat rate charged for advisory services, all-inclusive fee rate, etc.). "TMG %" represents the percentage of funds in the Total Mapped Group that had management fees that were lower than the fund's. For example, a hypothetical TMG % of 20% would mean that 80% of the funds in the Total Mapped Group had higher, and 20% had lower, management fees than the fund. The fund's actual TMG %s and the number of funds in the Total Mapped Group are in the chart below. The "Asset-Size Peer Group" (ASPG) comparison focuses on a fund's standing relative to a subset of non-Fidelity funds within the Total Mapped Group that are similar in size and management fee structure without taking into account performance adjustments, if any. For example, if a fund is in the first quartile of the ASPG, the fund's management fee ranks in the least expensive or lowest 25% of funds in the ASPG. The ASPG represents at least 15% of the funds in the Total Mapped Group with comparable asset size and management fee structures, subject to a minimum of 50 funds (or all funds in the Total Mapped Group if fewer than 50). Additional information, such as the ASPG quartile in which the fund's management fee rate ranked and the impact of the fund's performance adjustment, is also included in the chart and considered by the Board.
Annual Report
Board Approval of Investment Advisory Contracts and
Management Fees - continued
Fidelity OTC Portfolio

Annual Report
The Board noted that the fund's management fee rate ranked below the median of its Total Mapped Group and below the median of its ASPG for 2014. The Board also noted the effect of the fund's performance adjustment, if any, on the fund's management fee ranking.
The Board noted that, in 2014, the ad hoc Committee on Group Fee was formed by it and other Fidelity fund boards to conduct an in-depth review of the "group fee" component of the management fee of funds with such management fee structures. Committee focus included the mechanics of the group fee, the competitive landscape of group fee structures, Fidelity funds with no group fee component and investment products not included in group fee assets. The Board also considered that, for funds subject to the group fee, FMR agreed to voluntarily waive fees over a specified period of time in amounts designed to account for assets converted from certain funds to certain collective investment trusts.
The Board also noted that, in 2013, the ad hoc Committee on Management Fees was formed to conduct an in-depth review of the management fee rates of Fidelity's active equity mutual funds. The Committee focused on the following areas: (i) standard fee structures; (ii) research consumption and trading evolution; (iii) management fee competitiveness/profitability by category; and (iv) factors that drive institutional pricing.
Based on its review, the Board concluded that the fund's management fee is fair and reasonable in light of the services that the fund receives and the other factors considered.
Total Expense Ratio. In its review of each class's total expense ratio, the Board considered the fund's management fee as well as other fund or class expenses, as applicable, such as transfer agent fees, pricing and bookkeeping fees, and custodial, legal, and audit fees. The Board noted the impact of the fund's performance adjustment. The Board also noted that Fidelity may agree to waive fees and expenses from time to time, and the extent to which, if any, it has done so for the fund. As part of its review, the Board also considered the current and historical total expense ratios of each class of the fund compared to competitive fund median expenses. Each class of the fund is compared to those funds and classes in the Total Mapped Group (used by the Board for management fee comparisons) that have a similar sales load structure.
The Board noted that the total expense ratio of each class ranked below its competitive median for 2014.
Fees Charged to Other Fidelity Clients. The Board also considered Fidelity fee structures and other information with respect to clients of Fidelity, such as other funds advised or subadvised by Fidelity, pension plan clients, and other institutional clients with similar mandates. The Board noted the findings of the 2013 ad hoc joint committee (created with the board of other Fidelity funds), which reviewed and compared Fidelity's institutional investment advisory business with its business of providing services to the Fidelity funds, including the differences in services provided, fees charged, and costs incurred, as well as competition in their respective marketplaces.
Annual Report
Board Approval of Investment Advisory Contracts and
Management Fees - continued
Based on its review of total expense ratios and fees charged to other Fidelity clients, the Board concluded that the total expense ratio of each class of the fund was reasonable in light of the services that the fund and its shareholders receive and the other factors considered.
Costs of the Services and Profitability. The Board considered the revenues earned and the expenses incurred by Fidelity in conducting the business of developing, marketing, distributing, managing, administering and servicing the fund and servicing the fund's shareholders. The Board also considered the level of Fidelity's profits in respect of all the Fidelity funds.
On an annual basis, Fidelity presents to the Board information about the profitability of its relationship with the fund. Fidelity calculates profitability information for each fund, as well as aggregate profitability information for groups of Fidelity funds and all Fidelity funds, using a series of detailed revenue and cost allocation methodologies which originate with the books and records of Fidelity on which Fidelity's audited financial statements are based. The Audit Committee of the Board reviews any significant changes from the prior year's methodologies.
PricewaterhouseCoopers LLP (PwC), independent registered public accounting firm and auditor to Fidelity and certain Fidelity funds, has been engaged annually by the Board as part of the Board's assessment of Fidelity's profitability analysis. PwC's engagement includes the review and assessment of the methodologies used by Fidelity in determining the revenues and expenses attributable to Fidelity's mutual fund business, and completion of agreed-upon procedures in respect of the mathematical accuracy of fund profitability and its conformity to established allocation methodologies. After considering PwC's reports issued under the engagement and information provided by Fidelity, the Board concluded that while other allocation methods may also be reasonable, Fidelity's profitability methodologies are reasonable in all material respects.
The Board also reviewed Fidelity's non-fund businesses and fall-out benefits related to the mutual fund business as well as cases where Fidelity's affiliates may benefit from or be related to the fund's business.
The Board considered the costs of the services provided by and the profits realized by Fidelity in connection with the operation of the fund and was satisfied that the profitability was not excessive.
Economies of Scale. The Board considered whether there have been economies of scale in respect of the management of the Fidelity funds, whether the Fidelity funds (including the fund) have appropriately benefited from any such economies of scale, and whether there is potential for realization of any further economies of scale. The Board considered the extent to which the fund will benefit from economies of scale as assets grow through increased services to the fund, through waivers or reimbursements, or through fee or expense ratio reductions. The Board also noted that in 2013, it and the boards of other Fidelity funds created an ad hoc committee (the Economies of Scale Committee) to analyze whether Fidelity attains economies of scale in respect of the management and servicing of the Fidelity funds, whether the Fidelity funds have appropriately benefited from such economies of scale, and whether there is potential for realization of any further economies of scale.
Annual Report
The Board recognized that the fund's management contract incorporates a "group fee" structure, which provides for lower group fee rates as total group assets increase, and for higher group fee rates as total group assets decrease (with "group assets" defined to include fund assets under FMR's management plus sector fund assets previously under FMR's management and currently managed by Fidelity SelectCo, LLC). FMR calculates the group fee rates based on a tiered asset "breakpoint" schedule that varies based on asset class. The Board considered that the group fee is designed to deliver the benefits of economies of scale to fund shareholders when total Fidelity fund assets increase, even if assets of any particular fund are unchanged or have declined, because some portion of Fidelity's costs are attributable to services provided to all Fidelity funds, and all funds benefit if those costs can be allocated among more assets. The Board concluded that, given the group fee structure, fund shareholders will benefit from lower management fees as group assets increase at the fund complex level, regardless of whether Fidelity achieves any such economies of scale.
The Board concluded, taking into account the analysis of the Economies of Scale Committee, that economies of scale, if any, are being appropriately shared between fund shareholders and Fidelity.
Additional Information Requested by the Board. In order to develop fully the factual basis for consideration of the Fidelity funds' Advisory Contracts, the Board requested and received additional information on certain topics, including: (i) fund performance trends and Fidelity's long-term strategies for certain funds; (ii) the various share classes employed by Fidelity and the attributes of each class, together with similar information on the distribution and servicing payments made by Fidelity or the funds to third-party participants in the distribution channels; (iii) fund profitability, and fund performance in relation to fund profitability; (iv) the methodology with respect to evaluating competitive fund data and peer group classifications and fee comparisons; (v) annual fund profitability margins, with particular focus on certain funds with negative margins; (vi) the realization of fall-out benefits in certain Fidelity business units; (vii) economies of scale and the way in which they are shared with fund shareholders; (viii) Fidelity's group fee structures, including the group fee schedule of breakpoints; (ix) the impact of cost containment measures on the funds; and (x) the transfer agent fee structure.
Annual Report
Board Approval of Investment Advisory Contracts and
Management Fees - continued
Based on its evaluation of all of the conclusions noted above, and after considering all factors it believed relevant, the Board concluded that the advisory fee structures are fair and reasonable, and that the fund's Advisory Contracts should be renewed.
Annual Report
Investment Adviser
Fidelity Management & Research Company
Boston, MA
Investment Sub-Advisers
FMR Co., Inc.
FMR Investment Management
(U.K.) Limited
Fidelity Management & Research
(Hong Kong) Limited
Fidelity Management & Research
(Japan) Limited
General Distributor
Fidelity Distributors Corporation
Smithfield, RI
Transfer and Service Agents
Fidelity Investments Institutional
Operations Company, Inc.
Boston, MA
Fidelity Service Company, Inc.
Boston, MA
Custodian
The Northern Trust Company
Chicago, IL
(Fidelity Investment logo)(registered trademark)
Corporate Headquarters
245 Summer St., Boston, MA 02210
www.fidelity.com
OTC-K-UANN-0915
1.863303.106
Fidelity®
Real Estate Income
Fund
Annual Report
July 31, 2015
(Fidelity Cover Art)
Contents
Performance | (Click Here) | How the fund has done over time. |
Management's Discussion of Fund Performance | (Click Here) | The Portfolio Manager's review of fund performance and strategy. |
Shareholder Expense Example | (Click Here) | An example of shareholder expenses. |
Investment Changes | (Click Here) | A summary of major shifts in the fund's investments over the past six months. |
Investments | (Click Here) | A complete list of the fund's investments with their market values. |
Financial Statements | (Click Here) | Statements of assets and liabilities, operations, and changes in net assets, as well as financial highlights. |
Notes | (Click Here) | Notes to the financial statements. |
Report of Independent Registered Public Accounting Firm | (Click Here) | |
Trustees and Officers | (Click Here) | |
Distributions | (Click Here) | |
Board Approval of Investment Advisory Contracts and Management Fees | (Click Here) | |
To view a fund's proxy voting guidelines and proxy voting record for the 12-month period ended June 30, visit http://www.fidelity.com/proxyvotingresults or visit the Securities and Exchange Commission's (SEC) web site at http://www.sec.gov. You may also call 1-800-544-8544 to request a free copy of the proxy voting guidelines.
Standard & Poor's, S&P and S&P 500 are registered service marks of The McGraw-Hill Companies, Inc. and have been licensed for use by Fidelity Distributors Corporation.
Other third-party marks appearing herein are the property of their respective owners.
All other marks appearing herein are registered or unregistered trademarks or service marks of FMR LLC or an affiliated company. © 2015 FMR LLC. All rights reserved.
Annual Report
This report and the financial statements contained herein are submitted for the general information of the shareholders of the fund. This report is not authorized for distribution to prospective investors in the fund unless preceded or accompanied by an effective prospectus.
A fund files its complete schedule of portfolio holdings with the SEC for the first and third quarters of each fiscal year on Form N-Q. Forms N-Q are available on the SEC's web site at http://www.sec.gov. A fund's Forms N-Q may be reviewed and copied at the SEC's Public Reference Room in Washington, DC. Information regarding the operation of the SEC's Public Reference Room may be obtained by calling 1-800-SEC-0330. For a complete list of a fund's portfolio holdings, view the most recent holdings listing, semiannual report, or annual report on Fidelity's web site at http://www.fidelity.com, http://www.advisor.fidelity.com, or http://www.401k.com, as applicable.
NOT FDIC INSURED • MAY LOSE VALUE • NO BANK GUARANTEE
Neither the fund nor Fidelity Distributors Corporation is a bank.
Annual Report
Average annual total return reflects the change in the value of an investment, assuming reinvestment of the class' distributions from dividend income and capital gains (the profits earned upon the sale of securities that have grown in value, if any) and assuming a constant rate of performance each year. The $10,000 table and the fund's returns do not reflect the deduction of taxes that a shareholder would pay on fund distributions or the redemption of fund shares. During periods of reimbursement by Fidelity, a fund's total return will be greater than it would be had the reimbursement not occurred. How a fund did yesterday is no guarantee of how it will do tomorrow.
Average Annual Total Returns
Periods ended July 31, 2015 | Past 1
year | Past 5
years | Past 10 years |
Fidelity® Real Estate Income Fund | 4.84% | 9.81% | 6.44% |
$10,000 Over 10 Years
Let's say hypothetically that $10,000 was invested in Fidelity® Real Estate Income Fund, a class of the fund, on July 31, 2005. The chart shows how the value of your investment would have changed, and also shows how the S&P 500® Index performed over the same period.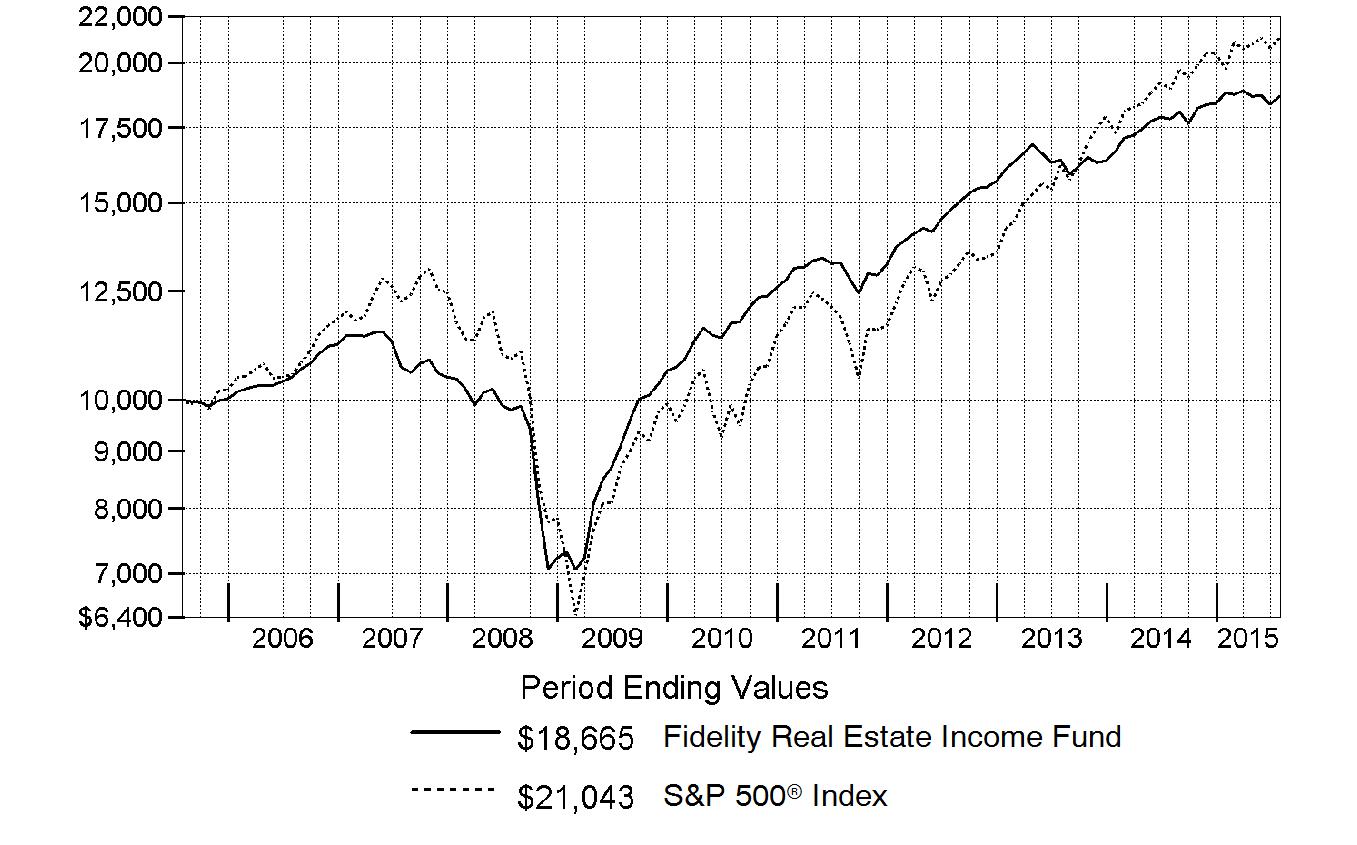
Annual Report
Market Recap: For the 12 months ending July 31, 2015, real estate securities experienced greater volatility than normal for most historical time periods, partly due to the market's reaction to changing interest rate expectations. In the first half of the period, real estate common stocks, as measured by the FTSE® NAREIT® All REITs Index, rose sharply but, with an increase in rates, subsequently gave back much of those gains before enjoying somewhat better results in the period's final weeks. All told, the FTSE® NAREIT® index rose 8.99%. Meanwhile, the MSCI REIT Preferred Index, a proxy for the real estate preferred stock segment, gained 8.93%, a relatively strong result that partly reflected its somewhat low valuations on a historical basis coming into the reporting period. On the market's fixed-income side, The BofA Merrill LynchSM US Real Estate Index - a market-capitalization-weighted measure of investment-grade corporate debt in the domestic real estate sector - rose 3.05%. The market performance took place against a continued solid fundamental backdrop for commercial real estate. The creation of property supply was still moderate, while companies generally experienced growing occupancies or rents, which in turn helped lift cash flows for real estate owners.
Comments from Portfolio Manager Mark Snyderman: For the year, the fund's share classes fell short of my target for a mid- to upper-single-digit return. (For specific class-level results, please see the Performance section of this report.) At the same time, its share classes trailed the 6.69% return of the sector benchmark Fidelity Real Estate Income Composite IndexSM - a 40/40/20 blend of the MSCI REIT Preferred Index, The BofA Merrill LynchSM US Real Estate Index and the FTSE® NAREIT® All REITs Index, respectively. The fund's preferred stocks gained roughly 9%, nearly matching the return of the MSCI preferred stock index. The fund's bond investments also generally did well. Our commercial mortgage-backed securities (CMBS) and high-yield real estate bonds returned approximately 6% and 4%, respectively, outpacing the 3% increase in the BofA Merrill Lynch index. Meanwhile, our investment-grade positions roughly matched that measure. Good credit research helped drive the outperformance from CMBS and high-yield securities, but helped to a lesser extent with our investment-grade holdings. Meanwhile, the fund's real estate investment trust (REIT) common stock investments added 7%, well behind the FTSE NAREIT index. A negative performance factor was the fund's average cash allocation of 7%, a normal level of cash for this fund that hurt during a rising market.
The views expressed above reflect those of the portfolio manager(s) only through the end of the period as stated on the cover of this report and do not necessarily represent the views of Fidelity or any other person in the Fidelity organization. Any such views are subject to change at any time based upon market or other conditions and Fidelity disclaims any responsibility to update such views. These views may not be relied on as investment advice and, because investment decisions for a Fidelity fund are based on numerous factors, may not be relied on as an indication of trading intent on behalf of any Fidelity fund.
Annual Report
Shareholder Expense Example
As a shareholder of the Fund, you incur two types of costs: (1) transaction costs, including sales charges (loads) on purchase payments or redemption proceeds, redemption fees and (2) ongoing costs, including management fees, distribution and/or service (12b-1) fees and other Fund expenses. This Example is intended to help you understand your ongoing costs (in dollars) of investing in the Fund and to compare these costs with the ongoing costs of investing in other mutual funds.
The Example is based on an investment of $1,000 invested at the beginning of the period and held for the entire period (February 1, 2015 to July 31, 2015).
Actual Expenses
The first line of the accompanying table for each class of the Fund provides information about actual account values and actual expenses. You may use the information in this line, together with the amount you invested, to estimate the expenses that you paid over the period. Simply divide your account value by $1,000.00 (for example, an $8,600 account value divided by $1,000.00 = 8.6), then multiply the result by the number in the first line for a class of the Fund under the heading entitled "Expenses Paid During Period" to estimate the expenses you paid on your account during this period. A small balance maintenance fee of $12.00 that is charged once a year may apply for certain accounts with a value of less than $2,000. This fee is not included in the table below. If it was, the estimate of expenses you paid during the period would be higher, and your ending account value lower, by this amount. In addition, the Fund, as a shareholder in the underlying Fidelity Central Funds, will indirectly bear its pro-rata share of the fees and expenses incurred by the underlying Fidelity Central Funds. These fees and expenses are not included in the Fund's annualized expense ratio used to calculate the expense estimate in the table below.
Hypothetical Example for Comparison Purposes
The second line of the accompanying table for each class of the Fund provides information about hypothetical account values and hypothetical expenses based on a Class' actual expense ratio and an assumed rate of return of 5% per year before expenses, which is not the Class' actual return. The hypothetical account values and expenses may not be used to estimate the actual ending account balance or expenses you paid for the period. You may use this information to compare the ongoing costs of investing in the Fund and other funds. To do so, compare this 5% hypothetical example with the 5% hypothetical examples that appear in the shareholder reports of the other funds. A small balance maintenance fee of $12.00 that is charged once a year may apply for certain accounts with a value of less than $2,000. This fee is not included in the table below. If it was, the estimate of expenses you paid during the period would be higher, and your ending account value lower, by this amount. In addition, the Fund, as a shareholder in the underlying Fidelity Central Funds, will indirectly bear its pro-rata share of the fees and expenses incurred by the underlying Fidelity Central Funds. These fees and expenses are not included in the Fund's annualized expense ratio used to calculate the expense estimate in the table below.
Please note that the expenses shown in the table are meant to highlight your ongoing costs only and do not reflect any transaction costs. Therefore, the second line of the table is useful in comparing ongoing costs only, and will not help you determine the relative total costs of owning different funds. In addition, if these transactional costs were included, your costs would have been higher.
Annual Report
Shareholder Expense Example - continued
| Annualized
Expense RatioB | Beginning
Account Value
February 1, 2015 | Ending
Account Value
July 31, 2015 | Expenses Paid
During Period*
February 1, 2015 to July 31, 2015 |
Class A | 1.03% | | | |
Actual | | $ 1,000.00 | $ 992.80 | $ 5.09 |
HypotheticalA | | $ 1,000.00 | $ 1,019.69 | $ 5.16 |
Class T | 1.06% | | | |
Actual | | $ 1,000.00 | $ 991.80 | $ 5.23 |
HypotheticalA | | $ 1,000.00 | $ 1,019.54 | $ 5.31 |
Class C | 1.78% | | | |
Actual | | $ 1,000.00 | $ 988.50 | $ 8.78 |
HypotheticalA | | $ 1,000.00 | $ 1,015.97 | $ 8.90 |
Real Estate Income | .82% | | | |
Actual | | $ 1,000.00 | $ 993.60 | $ 4.05 |
HypotheticalA | | $ 1,000.00 | $ 1,020.73 | $ 4.11 |
Class I | .77% | | | |
Actual | | $ 1,000.00 | $ 993.80 | $ 3.81 |
HypotheticalA | | $ 1,000.00 | $ 1,020.98 | $ 3.86 |
A 5% return per year before expenses
B Annualized expense ratio reflects expenses net of applicable fee waivers.
* Expenses are equal to each Class' annualized expense ratio, multiplied by the average account value over the period, multiplied by 181/365 (to reflect the one-half year period).
Annual Report
Investment Changes (Unaudited)
Top Five Stocks as of July 31, 2015 |
| % of fund's
net assets | % of fund's net assets
6 months ago |
Equity Lifestyle Properties, Inc. | 3.5 | 3.0 |
MFA Financial, Inc. | 3.0 | 2.9 |
Acadia Realty Trust (SBI) | 2.8 | 2.9 |
Ventas, Inc. | 1.5 | 1.4 |
Mid-America Apartment Communities, Inc. | 1.1 | 1.0 |
| 11.9 | |
Top 5 Bonds as of July 31, 2015 |
| % of fund's
net assets | % of fund's net assets
6 months ago |
Realogy Group LLC Tranche B, term loan 3.75% 3/5/20 | 1.0 | 0.9 |
RAIT Financial Trust 4% 10/1/33 | 0.8 | 0.6 |
Standard Pacific Corp. 8.375% 5/15/18 | 0.7 | 0.7 |
IAS Operating Partnership LP 5% 3/15/18 | 0.7 | 0.7 |
iStar Financial, Inc. 5.875% 3/15/16 | 0.6 | 0.6 |
| 3.8 | |
Top Five REIT Sectors as of July 31, 2015 |
| % of fund's
net assets | % of fund's net assets
6 months ago |
REITs - Mortgage | 17.9 | 17.2 |
REITs - Health Care | 7.4 | 7.0 |
REITs - Shopping Centers | 5.6 | 7.2 |
REITs - Management/Investment | 5.2 | 5.6 |
REITs - Apartments | 5.0 | 4.8 |
Asset Allocation (% of fund's net assets) |
As of July 31, 2015* | As of January 31, 2015** |
 | Common Stocks 30.0% | |  | Common Stocks 30.8% | |
 | Preferred Stocks 19.5% | |  | Preferred Stocks 17.6% | |
 | Bonds 31.8% | |  | Bonds 30.7% | |
 | Convertible
Securities 5.2% | |  | Convertible
Securities 5.5% | |
 | Other Investments 7.3% | |  | Other Investments 7.9% | |
 | Short-Term
Investments and
Net Other Assets (Liabilities) 6.2% | |  | Short-Term
Investments and
Net Other Assets (Liabilities) 7.5% | |
* Foreign investments | 0.9% | | ** Foreign investments | 1.3% | |

Annual Report
Investments July 31, 2015
Showing Percentage of Net Assets
Common Stocks - 30.0% |
| Shares | | Value |
CONSUMER DISCRETIONARY - 0.2% |
Household Durables - 0.2% |
Stanley Martin Communities LLC Class B (a)(k) | 4,620 | | $ 7,054,370 |
FINANCIALS - 29.8% |
Capital Markets - 0.5% |
Ellington Financial LLC | 1,114,700 | | 20,354,422 |
Real Estate Investment Trusts - 28.6% |
Acadia Realty Trust (SBI) (g) | 3,730,449 | | 119,299,759 |
AG Mortgage Investment Trust, Inc. | 781,700 | | 14,226,940 |
American Campus Communities, Inc. | 226,000 | | 8,434,320 |
American Tower Corp. | 177,100 | | 16,843,981 |
Annaly Capital Management, Inc. | 1,606,900 | | 15,988,655 |
Anworth Mortgage Asset Corp. | 1,230,410 | | 6,152,050 |
Apartment Investment & Management Co. Class A | 1,049,300 | | 41,006,644 |
Arbor Realty Trust, Inc. (g) | 3,068,975 | | 20,991,789 |
AvalonBay Communities, Inc. | 141,400 | | 24,368,876 |
Boardwalk (REIT) | 136,200 | | 5,994,320 |
CBL & Associates Properties, Inc. | 2,105,673 | | 34,406,697 |
Cedar Shopping Centers, Inc. | 830,510 | | 5,564,417 |
Chambers Street Properties | 528,593 | | 3,922,160 |
Community Healthcare Trust, Inc. | 225,600 | | 4,257,072 |
CYS Investments, Inc. | 1,992,739 | | 15,463,655 |
Douglas Emmett, Inc. | 517,200 | | 15,159,132 |
Dynex Capital, Inc. | 2,039,943 | | 15,034,380 |
EastGroup Properties, Inc. | 111,900 | | 6,736,380 |
Ellington Residential Mortgage REIT | 260,000 | | 3,634,800 |
Equity Lifestyle Properties, Inc. | 2,627,460 | | 152,077,369 |
Equity Residential (SBI) | 77,400 | | 5,790,294 |
Extra Space Storage, Inc. | 355,700 | | 26,151,064 |
First Potomac Realty Trust | 1,381,615 | | 15,681,330 |
Five Oaks Investment Corp. | 479,100 | | 3,631,578 |
Great Ajax Corp. | 500,000 | | 7,020,000 |
Hatteras Financial Corp. | 812,600 | | 13,212,876 |
Lexington Corporate Properties Trust | 4,340,682 | | 37,329,865 |
LTC Properties, Inc. | 253,513 | | 11,121,615 |
MFA Financial, Inc. | 17,223,722 | | 129,694,627 |
Mid-America Apartment Communities, Inc. | 618,300 | | 49,674,222 |
Monmouth Real Estate Investment Corp. Class A (f) | 813,473 | | 8,150,999 |
National Retail Properties, Inc. | 244,200 | | 9,076,914 |
New Senior Investment Group, Inc. | 1,726,825 | | 22,345,116 |
Newcastle Investment Corp. | 1,840,830 | | 9,038,475 |
NorthStar Realty Finance Corp. | 166,600 | | 2,665,600 |
Common Stocks - continued |
| Shares | | Value |
FINANCIALS - continued |
Real Estate Investment Trusts - continued |
Potlatch Corp. | 509,300 | | $ 17,830,593 |
Prologis, Inc. | 108,487 | | 4,405,657 |
Sabra Health Care REIT, Inc. | 900,600 | | 24,631,410 |
Select Income REIT | 361,791 | | 7,261,145 |
Senior Housing Properties Trust (SBI) | 2,597,400 | | 44,857,098 |
Simon Property Group, Inc. | 126,100 | | 23,608,442 |
Store Capital Corp. | 556,800 | | 11,692,800 |
Terreno Realty Corp. | 1,728,064 | | 36,237,502 |
The Macerich Co. | 147,900 | | 11,707,764 |
Two Harbors Investment Corp. | 2,190,580 | | 22,387,728 |
Ventas, Inc. | 940,846 | | 63,121,358 |
VEREIT, Inc. | 885,434 | | 7,756,402 |
Weyerhaeuser Co. | 704,500 | | 21,621,105 |
WP Carey, Inc. | 773,700 | | 47,342,703 |
WP Glimcher, Inc. | 797,563 | | 10,799,003 |
| | 1,235,408,681 |
Real Estate Management & Development - 0.7% |
Brookfield Asset Management, Inc. Class A | 386,400 | | 13,490,097 |
Kennedy-Wilson Holdings, Inc. | 646,921 | | 16,380,040 |
| | 29,870,137 |
TOTAL FINANCIALS | | 1,285,633,240 |
TOTAL COMMON STOCKS (Cost $1,198,611,239) |
1,292,687,610
|
Preferred Stocks - 20.2% |
| | | |
Convertible Preferred Stocks - 0.7% |
FINANCIALS - 0.7% |
Real Estate Investment Trusts - 0.7% |
Alexandria Real Estate Equities, Inc. Series D 7.00% | 195,000 | | 5,478,291 |
Equity Commonwealth 6.50% (a) | 31,237 | | 776,864 |
Lexington Corporate Properties Trust Series C, 6.50% | 468,742 | | 22,543,584 |
| | 28,798,739 |
Preferred Stocks - continued |
| Shares | | Value |
Nonconvertible Preferred Stocks - 19.5% |
CONSUMER DISCRETIONARY - 0.0% |
Hotels, Restaurants & Leisure - 0.0% |
Red Lion Hotels Capital Trust 9.50% | 71,773 | | $ 1,858,203 |
FINANCIALS - 19.5% |
Capital Markets - 0.1% |
Arlington Asset Investment Corp. 6.625% | 182,517 | | 4,471,667 |
Real Estate Investment Trusts - 19.2% |
AG Mortgage Investment Trust, Inc.: | | | |
8.00% | 587,287 | | 14,453,133 |
8.25% | 34,859 | | 871,475 |
Alexandria Real Estate Equities, Inc. Series E, 6.45% | 145,913 | | 3,790,820 |
American Capital Agency Corp.: | | | |
8.00% | 200,000 | | 4,984,000 |
Series B, 7.75% | 360,200 | | 8,615,984 |
American Capital Mortgage Investment Corp. Series A, 8.125% | 248,636 | | 6,034,396 |
American Home Mortgage Investment Corp.: | | | |
Series A, 9.75% (a) | 120,300 | | 1 |
Series B, 9.25% (a) | 124,100 | | 1 |
American Homes 4 Rent: | | | |
Series A, 5.00% | 550,742 | | 13,950,295 |
Series B, 5.00% | 250,029 | | 6,375,740 |
Series C, 5.50% | 810,662 | | 20,866,440 |
Annaly Capital Management, Inc.: | | | |
Series A, 7.875% | 134,900 | | 3,399,480 |
Series C, 7.625% | 325,332 | | 7,960,874 |
Series D, 7.50% | 621,976 | | 15,288,170 |
Anworth Mortgage Asset Corp. Series A, 8.625% | 309,630 | | 7,945,106 |
Apollo Commercial Real Estate Finance, Inc. Series A, 8.625% | 375,101 | | 9,812,642 |
Apollo Residential Mortgage, Inc. Series A, 8.00% | 284,843 | | 6,821,990 |
Arbor Realty Trust, Inc.: | | | |
7.375% (g) | 430,605 | | 10,597,189 |
Series A, 8.25% (g) | 189,089 | | 4,814,206 |
Series B, 7.75% (g) | 240,000 | | 5,940,000 |
Series C, 8.50% (g) | 100,000 | | 2,578,000 |
Armour Residential REIT, Inc. Series B, 7.875% | 153,654 | | 3,475,653 |
Ashford Hospitality Trust, Inc.: | | | |
Series D, 8.45% | 47,000 | | 1,214,010 |
Series E, 9.00% | 140,751 | | 3,701,751 |
Boston Properties, Inc. 5.25% | 10,915 | | 272,220 |
Brandywine Realty Trust Series E, 6.90% | 95,000 | | 2,470,000 |
Preferred Stocks - continued |
| Shares | | Value |
Nonconvertible Preferred Stocks - continued |
FINANCIALS - continued |
Real Estate Investment Trusts - continued |
Campus Crest Communities, Inc. Series A, 8.00% | 582,117 | | $ 14,017,377 |
Capstead Mortgage Corp. Series E, 7.50% | 202,984 | | 5,025,884 |
CBL & Associates Properties, Inc.: | | | |
Series D, 7.375% | 289,876 | | 7,359,952 |
Series E, 6.625% | 222,063 | | 5,649,283 |
Cedar Shopping Centers, Inc. Series B, 7.25% | 399,750 | | 10,209,615 |
Chesapeake Lodging Trust Series A, 7.75% | 266,916 | | 7,086,620 |
Colony Financial, Inc.: | | | |
7.125% | 375,500 | | 8,858,045 |
Series A, 8.50% | 283,920 | | 7,447,222 |
Series B, 7.50% | 108,867 | | 2,739,094 |
Coresite Realty Corp. Series A, 7.25% | 369,799 | | 9,622,170 |
Corporate Office Properties Trust Series L, 7.375% | 167,140 | | 4,374,054 |
CubeSmart Series A, 7.75% | 40,000 | | 1,063,600 |
CYS Investments, Inc.: | | | |
Series A, 7.75% | 117,824 | | 2,762,973 |
Series B, 7.50% | 496,667 | | 11,120,374 |
DDR Corp.: | | | |
Series J, 6.50% | 340,721 | | 8,804,231 |
Series K, 6.25% | 228,888 | | 5,813,755 |
Digital Realty Trust, Inc.: | | | |
Series E, 7.00% | 219,819 | | 5,693,312 |
Series G, 5.875% | 145,444 | | 3,527,017 |
Series H, 7.375% | 50,000 | | 1,356,500 |
DuPont Fabros Technology, Inc. Series B, 7.625% | 381,202 | | 9,720,651 |
Dynex Capital, Inc.: | | | |
Series A, 8.50% | 362,932 | | 9,029,748 |
Series B, 7.625% | 252,120 | | 5,950,032 |
Equity Commonwealth Series E, 7.25% | 648,952 | | 16,639,129 |
Equity Lifestyle Properties, Inc. Series C, 6.75% | 950,148 | | 24,722,851 |
Essex Property Trust, Inc. Series H, 7.125% | 40,000 | | 1,036,000 |
First Potomac Realty Trust 7.75% | 415,296 | | 10,656,495 |
Five Oaks Investment Corp. Series A, 8.75% | 142,000 | | 3,088,500 |
General Growth Properties, Inc. Series A, 6.375% | 166,463 | | 4,264,782 |
Gladstone Commercial Corp. Series C, 7.125% | 232,238 | | 5,910,457 |
Hatteras Financial Corp. Series A, 7.625% | 522,361 | | 12,144,893 |
Health Care REIT, Inc. Series J, 6.50% | 81,600 | | 2,098,752 |
Hersha Hospitality Trust: | | | |
Series B, 8.00% | 162,538 | | 4,170,725 |
Preferred Stocks - continued |
| Shares | | Value |
Nonconvertible Preferred Stocks - continued |
FINANCIALS - continued |
Real Estate Investment Trusts - continued |
Hersha Hospitality Trust: - continued | | | |
Series C, 6.875% | 50,000 | | $ 1,287,500 |
Hospitality Properties Trust Series D, 7.125% | 40,800 | | 1,068,960 |
Hudson Pacific Properties, Inc. 8.375% | 394,069 | | 10,103,929 |
Inland Real Estate Corp.: | | | |
Series A, 8.125% | 466,000 | | 12,102,020 |
Series B, 6.95% | 245,000 | | 6,078,450 |
Invesco Mortgage Capital, Inc.: | | | |
Series A, 7.75% | 123,342 | | 3,045,314 |
Series B, 7.75% | 736,003 | | 17,597,832 |
Investors Real Estate Trust Series B, 7.95% | 126,572 | | 3,270,620 |
iStar Financial, Inc.: | | | |
Series D, 8.00% | 59,478 | | 1,479,218 |
Series E, 7.875% | 224,596 | | 5,507,094 |
Series F, 7.80% | 438,490 | | 10,778,084 |
Series G, 7.65% | 2,950 | | 71,892 |
Kilroy Realty Corp.: | | | |
Series G, 6.875% | 46,760 | | 1,207,811 |
Series H, 6.375% | 143,296 | | 3,668,378 |
Kite Realty Group Trust 8.25% | 96,100 | | 2,473,614 |
LaSalle Hotel Properties: | | | |
Series H, 7.50% | 141,308 | | 3,611,832 |
Series I, 6.375% | 354,698 | | 8,870,997 |
LBA Realty Fund II Series B, 7.625% | 31,240 | | 685,718 |
MFA Financial, Inc.: | | | |
8.00% | 538,930 | | 13,764,272 |
Series B, 7.50% | 616,232 | | 15,418,125 |
Monmouth Real Estate Investment Corp.: | | | |
Series A, 7.625% | 80,000 | | 2,064,000 |
Series B, 7.875% | 95,000 | | 2,541,250 |
National Retail Properties, Inc.: | | | |
5.70% | 376,404 | | 9,274,595 |
Series D, 6.625% | 222,138 | | 5,813,351 |
New York Mortgage Trust, Inc.: | | | |
7.875% | 154,125 | | 3,302,899 |
Series B, 7.75% | 239,697 | | 5,429,137 |
NorthStar Realty Finance Corp.: | | | |
Series A 8.75% | 7,326 | | 187,326 |
Series B, 8.25% | 369,228 | | 9,286,084 |
Preferred Stocks - continued |
| Shares | | Value |
Nonconvertible Preferred Stocks - continued |
FINANCIALS - continued |
Real Estate Investment Trusts - continued |
NorthStar Realty Finance Corp.: - continued | | | |
Series C, 8.875% | 277,101 | | $ 7,199,084 |
Series D, 8.50% | 238,715 | | 6,137,363 |
Series E, 8.75% | 366,972 | | 9,511,914 |
Pebblebrook Hotel Trust: | | | |
Series A, 7.875% | 412,000 | | 10,670,800 |
Series B, 8.00% | 185,085 | | 4,836,271 |
Series C, 6.50% | 204,321 | | 5,179,537 |
Pennsylvania (REIT) 7.375% | 100,510 | | 2,657,484 |
Prologis, Inc. Series Q, 8.54% | 94,446 | | 5,805,482 |
PS Business Parks, Inc.: | | | |
Series R, 6.875% | 116,903 | | 2,964,660 |
Series S, 6.45% | 93,809 | | 2,455,920 |
Series T, 6.00% | 198,899 | | 5,071,925 |
Series U, 5.75% | 600 | | 14,424 |
Public Storage: | | | |
5.875% | 50,000 | | 1,257,000 |
6.375% | 122,000 | | 3,218,360 |
RAIT Financial Trust: | | | |
7.125% | 336,786 | | 8,278,200 |
7.625% | 224,590 | | 5,102,685 |
Regency Centers Corp.: | | | |
Series 6, 6.625% | 152,661 | | 3,961,553 |
Series 7, 6.00% | 176,250 | | 4,348,088 |
Resource Capital Corp. 8.625% | 156,870 | | 3,308,388 |
Retail Properties America, Inc. 7.00% | 394,411 | | 10,333,568 |
Sabra Health Care REIT, Inc. Series A, 7.125% | 298,123 | | 7,742,254 |
Saul Centers, Inc. Series C, 6.875% | 315,478 | | 8,170,880 |
Senior Housing Properties Trust 5.625% | 283,543 | | 6,719,969 |
Stag Industrial, Inc.: | | | |
Series A, 9.00% | 280,000 | | 7,582,400 |
Series B, 6.625% | 80,300 | | 2,032,393 |
Summit Hotel Properties, Inc.: | | | |
Series A, 9.25% | 138,340 | | 3,757,314 |
Series B, 7.875% | 190,173 | | 5,167,000 |
Series C, 7.125% | 153,212 | | 3,998,833 |
Sun Communities, Inc. Series A, 7.125% | 375,000 | | 9,656,250 |
Sunstone Hotel Investors, Inc. Series D, 8.00% | 129,723 | | 3,348,151 |
Taubman Centers, Inc. Series K, 6.25% | 157,322 | | 3,981,820 |
Preferred Stocks - continued |
| Shares | | Value |
Nonconvertible Preferred Stocks - continued |
FINANCIALS - continued |
Real Estate Investment Trusts - continued |
Terreno Realty Corp. Series A, 7.75% | 213,690 | | $ 5,630,732 |
UMH Properties, Inc. Series A, 8.25% | 600,000 | | 15,594,000 |
Urstadt Biddle Properties, Inc.: | | | |
6.75% | 160,000 | | 4,240,000 |
Series F, 7.125% | 210,000 | | 5,441,100 |
VEREIT, Inc. Series F, 6.70% | 1,980,249 | | 48,615,113 |
Wells Fargo Real Estate Investment Corp. 6.375% | 221,000 | | 5,794,620 |
Winthrop Realty Trust 7.75% | 360,000 | | 9,162,000 |
WP Glimcher, Inc.: | | | |
6.875% | 256,115 | | 6,594,961 |
7.50% | 198,527 | | 5,280,818 |
| | 829,011,285 |
Real Estate Management & Development - 0.2% |
Kennedy-Wilson, Inc. 7.75% | 321,574 | | 8,325,551 |
TOTAL FINANCIALS | | 841,808,503 |
TOTAL NONCONVERTIBLE PREFERRED STOCKS | | 843,666,706 |
TOTAL PREFERRED STOCKS (Cost $851,096,847) |
872,465,445
|
Corporate Bonds - 20.0% |
| Principal Amount (e) | | |
Convertible Bonds - 4.5% |
FINANCIALS - 4.5% |
Consumer Finance - 0.1% |
Zais Financial Partners LP 8% 11/15/16 (h) | | $ 2,000,000 | | 1,998,750 |
Diversified Financial Services - 0.4% |
RWT Holdings, Inc. 5.625% 11/15/19 (h) | | 17,620,000 | | 16,879,079 |
Real Estate Investment Trusts - 3.3% |
Apollo Commercial Real Estate Finance, Inc. 5.5% 3/15/19 | | 5,600,000 | | 5,610,500 |
Ares Commercial Real Estate Corp. 7% 12/15/15 | | 14,700,000 | | 15,049,125 |
Blackstone Mortgage Trust, Inc. 5.25% 12/1/18 | | 5,750,000 | | 6,166,875 |
Campus Crest Communities Operating Partnership LP 4.75% 10/15/18 (h) | | 12,900,000 | | 12,359,813 |
Corporate Bonds - continued |
| Principal Amount (e) | | Value |
Convertible Bonds - continued |
FINANCIALS - continued |
Real Estate Investment Trusts - continued |
Colony Financial, Inc.: | | | | |
3.875% 1/15/21 | | $ 9,910,000 | | $ 9,996,713 |
5% 4/15/23 | | 9,000,000 | | 9,376,875 |
PennyMac Corp. 5.375% 5/1/20 | | 12,690,000 | | 11,738,250 |
RAIT Financial Trust 4% 10/1/33 | | 39,190,000 | | 32,748,144 |
Redwood Trust, Inc. 4.625% 4/15/18 | | 14,700,000 | | 14,194,688 |
Resource Capital Corp.: | | | | |
6% 12/1/18 | | 3,490,000 | | 3,127,913 |
8% 1/15/20 | | 15,990,000 | | 14,903,751 |
Spirit Realty Capital, Inc. 3.75% 5/15/21 | | 2,400,000 | | 2,247,000 |
Starwood Property Trust, Inc. 3.75% 10/15/17 | | 3,230,000 | | 3,252,206 |
Starwood Waypoint Residential 4.5% 10/15/17 (h) | | 1,965,000 | | 1,965,000 |
| | 142,736,853 |
Thrifts & Mortgage Finance - 0.7% |
IAS Operating Partnership LP 5% 3/15/18 (h) | | 33,140,000 | | 31,814,400 |
TOTAL FINANCIALS | | 193,429,082 |
Nonconvertible Bonds - 15.5% |
CONSUMER DISCRETIONARY - 5.1% |
Hotels, Restaurants & Leisure - 0.4% |
FelCor Lodging LP: | | | | |
5.625% 3/1/23 | | 2,000,000 | | 2,052,400 |
6% 6/1/25 (h) | | 2,025,000 | | 2,085,750 |
Hilton Worldwide Finance LLC/Hilton Worldwide Finance Corp. 5.625% 10/15/21 | | 4,000,000 | | 4,165,000 |
Times Square Hotel Trust 8.528% 8/1/26 (h) | | 7,916,982 | | 10,093,350 |
| | 18,396,500 |
Household Durables - 4.7% |
Ashton Woods U.S.A. LLC/Ashton Woods Finance Co. 6.875% 2/15/21 (h) | | 12,145,000 | | 11,416,300 |
Brookfield Residential Properties, Inc./Brookfield Residential U.S. Corp. 6.125% 7/1/22 (h) | | 2,620,000 | | 2,554,500 |
Brookfield Residential Properties, Inc.: | | | | |
6.375% 5/15/25 (h) | | 2,000,000 | | 1,945,000 |
6.5% 12/15/20 (h) | | 1,615,000 | | 1,631,150 |
D.R. Horton, Inc.: | | | | |
4.375% 9/15/22 | | 4,175,000 | | 4,133,250 |
Corporate Bonds - continued |
| Principal Amount (e) | | Value |
Nonconvertible Bonds - continued |
CONSUMER DISCRETIONARY - continued |
Household Durables - continued |
D.R. Horton, Inc.: - continued | | | | |
4.75% 5/15/17 | | $ 2,000,000 | | $ 2,090,720 |
5.75% 8/15/23 | | 2,510,000 | | 2,673,150 |
KB Home: | | | | |
8% 3/15/20 | | 8,465,000 | | 9,353,825 |
9.1% 9/15/17 | | 4,985,000 | | 5,558,275 |
Lennar Corp.: | | | | |
4.125% 12/1/18 | | 5,520,000 | | 5,602,800 |
4.5% 6/15/19 | | 1,830,000 | | 1,889,475 |
4.5% 11/15/19 | | 2,000,000 | | 2,067,500 |
6.5% 4/15/16 | | 4,000,000 | | 4,110,000 |
6.95% 6/1/18 | | 14,280,000 | | 15,636,600 |
M/I Homes, Inc. 8.625% 11/15/18 | | 26,055,000 | | 26,836,650 |
Meritage Homes Corp.: | | | | |
6% 6/1/25 (h) | | 4,000,000 | | 4,040,000 |
7% 4/1/22 | | 7,525,000 | | 8,014,125 |
7.15% 4/15/20 | | 7,060,000 | | 7,607,150 |
Ryland Group, Inc.: | | | | |
6.625% 5/1/20 | | 1,555,000 | | 1,730,871 |
8.4% 5/15/17 | | 5,420,000 | | 5,962,000 |
Standard Pacific Corp.: | | | | |
5.875% 11/15/24 | | 3,250,000 | | 3,339,375 |
7% 8/15/15 | | 4,000,000 | | 4,008,000 |
8.375% 5/15/18 | | 27,853,000 | | 31,822,053 |
10.75% 9/15/16 | | 4,910,000 | | 5,364,175 |
Taylor Morrison Communities, Inc./Monarch Communities, Inc. 5.875% 4/15/23 (h) | | 4,100,000 | | 4,105,125 |
TRI Pointe Homes, Inc. 5.875% 6/15/24 | | 3,890,000 | | 3,831,650 |
WCI Communities, Inc. 6.875% 8/15/21 | | 1,845,000 | | 1,914,188 |
William Lyon Homes, Inc.: | | | | |
7% 8/15/22 | | 4,180,000 | | 4,357,650 |
8.5% 11/15/20 | | 15,550,000 | | 16,755,125 |
| | 200,350,682 |
Media - 0.0% |
Outfront Media Capital LLC / Corp. 5.625% 2/15/24 (h) | | 1,300,000 | | 1,326,000 |
TOTAL CONSUMER DISCRETIONARY | | 220,073,182 |
Corporate Bonds - continued |
| Principal Amount (e) | | Value |
Nonconvertible Bonds - continued |
CONSUMER STAPLES - 0.0% |
Food & Staples Retailing - 0.0% |
Ahold Lease Series 2001 A1 pass thru trust certificates 7.82% 1/2/20 | | $ 602,053 | | $ 659,249 |
FINANCIALS - 9.8% |
Diversified Financial Services - 0.2% |
Icahn Enterprises LP/Icahn Enterprises Finance Corp.: | | | | |
5.875% 2/1/22 | | 3,680,000 | | 3,808,800 |
6% 8/1/20 | | 6,000,000 | | 6,315,000 |
| | 10,123,800 |
Real Estate Investment Trusts - 6.5% |
American Campus Communities Operating Partnership LP 4.125% 7/1/24 | | 2,000,000 | | 2,012,724 |
ARC Properties Operating Partnership LP 4.6% 2/6/24 | | 8,640,000 | | 8,337,600 |
CBL & Associates LP 5.25% 12/1/23 | | 1,000,000 | | 1,037,445 |
Commercial Net Lease Realty, Inc. 6.15% 12/15/15 | | 2,526,000 | | 2,572,147 |
Corporate Office Properties LP 3.6% 5/15/23 | | 5,000,000 | | 4,627,530 |
Crown Castle International Corp. 5.25% 1/15/23 | | 4,000,000 | | 4,190,000 |
CTR Partnership LP/CareTrust Capital Corp. 5.875% 6/1/21 | | 4,955,000 | | 5,054,100 |
CubeSmart LP 4.8% 7/15/22 | | 2,000,000 | | 2,165,492 |
DDR Corp.: | | | | |
7.5% 7/15/18 | | 8,756,000 | | 10,062,404 |
7.875% 9/1/20 | | 4,637,000 | | 5,653,741 |
9.625% 3/15/16 | | 3,836,000 | | 4,026,833 |
DuPont Fabros Technology LP 5.875% 9/15/21 | | 1,000,000 | | 1,027,500 |
Equity One, Inc. 6.25% 1/15/17 | | 3,000,000 | | 3,186,708 |
Equity Residential 5.125% 3/15/16 | | 7,201,000 | | 7,372,161 |
HCP, Inc.: | | | | |
3.75% 2/1/16 | | 10,000,000 | | 10,136,310 |
4% 6/1/25 | | 1,000,000 | | 980,250 |
Health Care Property Investors, Inc.: | | | | |
5.625% 5/1/17 | | 2,980,000 | | 3,170,896 |
6% 1/30/17 | | 2,383,000 | | 2,530,122 |
Health Care REIT, Inc.: | | | | |
3.625% 3/15/16 | | 14,685,000 | | 14,900,635 |
4% 6/1/25 | | 1,551,000 | | 1,540,611 |
4.125% 4/1/19 | | 2,000,000 | | 2,114,992 |
6.2% 6/1/16 | | 2,750,000 | | 2,858,477 |
Corporate Bonds - continued |
| Principal Amount (e) | | Value |
Nonconvertible Bonds - continued |
FINANCIALS - continued |
Real Estate Investment Trusts - continued |
Healthcare Realty Trust, Inc.: | | | | |
3.75% 4/15/23 | | $ 4,022,000 | | $ 3,906,625 |
5.75% 1/15/21 | | 3,095,000 | | 3,446,329 |
Highwoods/Forsyth LP: | | | | |
3.625% 1/15/23 | | 1,607,000 | | 1,600,514 |
5.85% 3/15/17 | | 2,800,000 | | 2,980,155 |
Hospitality Properties Trust: | | | | |
5% 8/15/22 | | 3,177,000 | | 3,313,897 |
5.625% 3/15/17 | | 915,000 | | 963,389 |
HRPT Properties Trust: | | | | |
6.25% 8/15/16 | | 9,675,000 | | 9,888,876 |
6.25% 6/15/17 | | 1,055,000 | | 1,109,470 |
6.65% 1/15/18 | | 4,246,000 | | 4,580,037 |
iStar Financial, Inc.: | | | | |
3.875% 7/1/16 | | 2,855,000 | | 2,862,138 |
4% 11/1/17 | | 15,000,000 | | 14,737,500 |
5% 7/1/19 | | 15,000,000 | | 14,719,650 |
5.85% 3/15/17 | | 3,587,000 | | 3,677,321 |
5.875% 3/15/16 | | 27,070,000 | | 27,543,725 |
7.125% 2/15/18 | | 5,725,000 | | 5,975,469 |
9% 6/1/17 | | 9,175,000 | | 9,920,469 |
MPT Operating Partnership LP/MPT Finance Corp.: | | | | |
6.375% 2/15/22 | | 3,610,000 | | 3,840,138 |
6.875% 5/1/21 | | 2,000,000 | | 2,100,000 |
National Retail Properties, Inc. 3.3% 4/15/23 | | 2,000,000 | | 1,948,454 |
Omega Healthcare Investors, Inc.: | | | | |
4.5% 4/1/27 (h) | | 2,462,000 | | 2,374,688 |
4.95% 4/1/24 | | 2,898,000 | | 2,988,968 |
Potlatch Corp. 7.5% 11/1/19 | | 1,000,000 | | 1,125,000 |
Prologis LP 7.625% 7/1/17 | | 4,690,000 | | 5,169,576 |
Reckson Operating Partnership LP/SL Green Realty Corp./SL Green Operating Partnership LP 7.75% 3/15/20 | | 2,000,000 | | 2,377,044 |
Select Income REIT 4.5% 2/1/25 | | 5,000,000 | | 4,882,155 |
Senior Housing Properties Trust: | | | | |
3.25% 5/1/19 | | 2,882,000 | | 2,897,888 |
4.3% 1/15/16 | | 5,000,000 | | 5,029,320 |
4.75% 5/1/24 | | 3,988,000 | | 3,943,582 |
6.75% 4/15/20 | | 13,624,000 | | 15,231,073 |
Corporate Bonds - continued |
| Principal Amount (e) | | Value |
Nonconvertible Bonds - continued |
FINANCIALS - continued |
Real Estate Investment Trusts - continued |
Senior Housing Properties Trust: - continued | | | | |
6.75% 12/15/21 | | $ 8,000,000 | | $ 9,125,216 |
United Dominion Realty Trust, Inc. 5.25% 1/15/16 | | 4,000,000 | | 4,065,028 |
WP Carey, Inc. 4% 2/1/25 | | 5,000,000 | | 4,843,460 |
| | 282,725,832 |
Real Estate Management & Development - 2.7% |
BioMed Realty LP 3.85% 4/15/16 | | 2,000,000 | | 2,033,458 |
CBRE Group, Inc.: | | | | |
5% 3/15/23 | | 6,020,000 | | 6,174,112 |
5.25% 3/15/25 | | 3,295,000 | | 3,426,800 |
Excel Trust LP 4.625% 5/15/24 | | 2,403,000 | | 2,304,431 |
Forestar U.S.A. Real Estate Group 8.5% 6/1/22 (h) | | 16,365,000 | | 17,143,974 |
Host Hotels & Resorts LP 5.25% 3/15/22 | | 2,000,000 | | 2,170,754 |
Howard Hughes Corp. 6.875% 10/1/21 (h) | | 11,715,000 | | 12,417,900 |
Hunt Companies, Inc. 9.625% 3/1/21 (h) | | 5,790,000 | | 5,717,625 |
Kennedy-Wilson, Inc. 5.875% 4/1/24 | | 7,640,000 | | 7,573,150 |
Mid-America Apartments LP: | | | | |
3.75% 6/15/24 | | 1,663,000 | | 1,660,798 |
6.05% 9/1/16 | | 2,500,000 | | 2,616,610 |
Realogy Group LLC/Realogy Co.-Issuer Corp.: | | | | |
4.5% 4/15/19 (h) | | 4,805,000 | | 4,841,038 |
5.25% 12/1/21 (h) | | 6,620,000 | | 6,785,500 |
Regency Centers LP: | | | | |
5.25% 8/1/15 | | 4,509,000 | | 4,509,000 |
5.875% 6/15/17 | | 400,000 | | 430,867 |
Taylor Morrison Communities, Inc./Monarch Communities, Inc.: | | | | |
5.25% 4/15/21 (h) | | 7,000,000 | | 6,982,500 |
5.625% 3/1/24 (h) | | 2,270,000 | | 2,207,575 |
Ventas Realty LP 1.55% 9/26/16 | | 7,000,000 | | 7,023,681 |
Ventas Realty LP/Ventas Capital Corp.: | | | | |
3.125% 11/30/15 | | 13,807,000 | | 13,900,653 |
4% 4/30/19 | | 2,262,000 | | 2,383,734 |
Wells Operating Partnership II LP 5.875% 4/1/18 | | 3,000,000 | | 3,258,156 |
| | 115,562,316 |
Thrifts & Mortgage Finance - 0.4% |
Cantor Commercial Real Estate Co. LP/CCRE Finance Corp. 7.75% 2/15/18 (h) | | 4,755,000 | | 4,986,806 |
Corporate Bonds - continued |
| Principal Amount (e) | | Value |
Nonconvertible Bonds - continued |
FINANCIALS - continued |
Thrifts & Mortgage Finance - continued |
Ocwen Financial Corp. 7.125% 5/15/19 (h)(i) | | $ 11,795,000 | | $ 11,146,275 |
Wrightwood Capital LLC 1.9% 4/20/20 (d) | | 14,028 | | 469,932 |
| | 16,603,013 |
TOTAL FINANCIALS | | 425,014,961 |
HEALTH CARE - 0.4% |
Health Care Providers & Services - 0.4% |
Sabra Health Care LP/Sabra Capital Corp.: | | | | |
5.375% 6/1/23 | | 2,795,000 | | 2,885,838 |
5.5% 2/1/21 | | 12,305,000 | | 12,766,438 |
| | 15,652,276 |
INDUSTRIALS - 0.1% |
Industrial Conglomerates - 0.1% |
Ladder Capital Finance Holdings LLLP/Ladder Capital Finance Corp. 7.375% 10/1/17 | | 3,050,000 | | 3,156,750 |
INFORMATION TECHNOLOGY - 0.1% |
Internet Software & Services - 0.1% |
CyrusOne LP/CyrusOne Finance Corp.: | | | | |
6.375% 11/15/22 (h) | | 1,000,000 | | 1,035,000 |
6.375% 11/15/22 | | 3,000,000 | | 3,105,000 |
| | 4,140,000 |
TOTAL NONCONVERTIBLE BONDS | | 668,696,418 |
TOTAL CORPORATE BONDS (Cost $840,267,812) |
862,125,500
|
Asset-Backed Securities - 1.9% |
|
American Homes 4 Rent: | | | | |
Series 2014-SFR2 Class E, 6.231% 10/17/36 (h) | | 3,000,000 | | 3,108,920 |
Series 2014-SFR3 Class E, 6.418% 12/17/36 (h) | | 9,025,000 | | 9,470,513 |
Series 2015-SFR1: | | | | |
Class E, 5.639% 4/17/52 (h) | | 1,999,310 | | 1,978,922 |
Class F, 6.482% 4/17/52 (h) | | 2,000,000 | | 1,906,026 |
Asset-Backed Securities - continued |
| Principal Amount (e) | | Value |
Capital Trust RE CDO Ltd. Series 2005-1A Class D, 1.688% 3/20/50 (h)(i) | | $ 2,250,000 | | $ 225 |
CapLease CDO Ltd. Series 2005-1A Class A, 4.926% 1/29/40 (h) | | 776,650 | | 802,047 |
Conseco Finance Securitizations Corp. Series 2002-2 Class M2, 9.163% 3/1/33 | | 500,000 | | 419,576 |
Crest Clarendon Street Ltd./Crest Clarendon Corp. Series 2002-1A Class D, 9% 12/28/35 (h) | | 389,442 | | 363,116 |
Deutsche Financial Capital Securitization LLC Series 1997-I Class M, 7.275% 9/15/27 | | 6,178,122 | | 6,045,836 |
Fairfield Street Solar Corp. Series 2004-1A Class E1, 3.6509% 11/28/39 (h)(i) | | 612,703 | | 349,241 |
Green Tree Financial Corp.: | | | | |
Series 1996-4 Class M1, 7.75% 6/15/27 | | 1,586,172 | | 1,566,859 |
Series 1997-3 Class M1, 7.53% 3/15/28 | | 6,781,936 | | 6,397,210 |
Invitation Homes Trust: | | | | |
Series 2013-SFR1 Class F, 3.9% 12/17/30 (h)(i) | | 1,750,000 | | 1,694,089 |
Series 2014-SFR1: | | | | |
Class E, 3.436% 6/17/31 (h)(i) | | 10,000,000 | | 9,810,623 |
Class F, 3.936% 6/17/31 (h)(i) | | 9,504,000 | | 9,193,617 |
Series 2014-SFR3: | | | | |
Class E, 4.686% 12/17/31 (h)(i) | | 4,336,000 | | 4,387,317 |
Class F, 5.186% 12/17/31 (h)(i) | | 2,215,000 | | 2,216,714 |
Series 2015-SFR2 Class E, 3.3353% 6/17/32 (h)(i) | | 2,450,000 | | 2,382,429 |
Series 2015-SFR3 Class F, 4.933% 8/17/32 (h)(i) | | 2,000,000 | | 1,992,967 |
Series 2015-SRF1 Class F, 4.4853% 3/17/32 (h)(i) | | 5,500,000 | | 5,392,112 |
Lehman ABS Manufactured Housing Contract Trust Series 2001-B Class M2, 7.17% 4/15/40 | | 960,803 | | 528,834 |
Merit Securities Corp. Series 13 Class M1, 7.8468% 12/28/33 (i) | | 1,923,000 | | 2,018,381 |
Progress Residential Trust Series 2015-SFR1 Class E, 4.1853% 2/17/32 (h)(i) | | 1,500,000 | | 1,499,999 |
Starwood Waypoint Residential Trust Series 2014-1 Class F, 4.7235% 1/17/32 (h)(i) | | 4,071,000 | | 4,025,884 |
Taberna Preferred Funding III Ltd. Series 2005-3A Class D, 2.9288% 2/5/36 (h)(i) | | 3,915,435 | | 392 |
Wrightwood Capital Real Estate CDO Ltd. Series 2005-1A: | | | | |
Class A1, 0.601% 11/21/40 (h)(i) | | 4,914,554 | | 4,803,976 |
Class F, 2.231% 11/21/40 (h)(i) | | 250,000 | | 175,675 |
TOTAL ASSET-BACKED SECURITIES (Cost $86,327,539) |
82,531,500
|
Collateralized Mortgage Obligations - 0.2% |
| Principal Amount (e) | | Value |
Private Sponsor - 0.2% |
Countrywide Home Loans, Inc.: | | | | |
Series 2002-R2 Class 2B3, 3.6335% 7/25/33 (h)(i) | | $ 165,763 | | $ 91,170 |
Series 2003-R3 Class B2, 5.5% 11/25/33 (h) | | 783,996 | | 50,501 |
FREMF Mortgage Trust: | | | | |
Series 2010-K6 Class B, 5.5325% 12/25/46 (h)(i) | | 4,500,000 | | 4,983,543 |
Series 2010-K7 Class B, 5.6242% 4/25/20 (h)(i) | | 3,200,000 | | 3,584,381 |
Merrill Lynch Mortgage Investors Trust Series 1998-C3 Class F, 6% 12/15/30 (h) | | 861,715 | | 883,892 |
RESI Finance LP/RESI Finance DE Corp. floater Series 2003-B Class B9, 12.1354% 6/10/35 (h)(i) | | 118,172 | | 126,565 |
Residential Funding Securities Corp. Series 2002-RM1 Class BI1, 5.5% 12/25/17 (h) | | 8,914 | | 8,655 |
RESIX Finance Ltd. floater: | | | | |
Series 2003-D Class B8, 6.6815% 12/10/35 (h)(i) | | 137,485 | | 35,398 |
Series 2004-A Class B7, 4.4315% 2/10/36 (h)(i) | | 139,576 | | 46,491 |
Series 2004-B Class B7, 4.1815% 2/10/36 (h)(i) | | 174,502 | | 117,680 |
TOTAL PRIVATE SPONSOR | | 9,928,276 |
U.S. Government Agency - 0.0% |
Fannie Mae REMIC Trust: | | | | |
Series 2001-W3 subordinate REMIC pass thru certificates, Class B3, 7% 9/25/41 (k) | | 94,028 | | 25,838 |
Series 2002-W1 subordinate REMIC pass thru certificates, Class 3B3, 3.0632% 2/25/42 (h)(i) | | 71,471 | | 55,390 |
Series 2003-W1 subordinate REMIC pass thru certificates, Class B3, 4.3375% 12/25/42 (i)(k) | | 143,242 | | 12,573 |
Series 2003-W10 subordinate REMIC pass thru certificates, Class 2B3, 3.0681% 6/25/43 (h)(i) | | 110,753 | | 60,914 |
Series 2003-W4 subordinate REMIC pass thru certificates, Class 2B3, 2.9643% 10/25/42 (h)(i) | | 46,599 | | 26,562 |
TOTAL U.S. GOVERNMENT AGENCY | | 181,277 |
TOTAL COLLATERALIZED MORTGAGE OBLIGATIONS (Cost $9,703,965) |
10,109,553
|
Commercial Mortgage Securities - 14.2% |
|
Americold LLC Trust Series 2010-ARTA Class D, 7.443% 1/14/29 (h) | | 2,000,000 | | 2,270,210 |
Banc of America Commercial Mortgage Trust: | | | | |
Series 2005-1 Class CJ, 5.515% 11/10/42 (i) | | 1,147,536 | | 1,146,303 |
Commercial Mortgage Securities - continued |
| Principal Amount (e) | | Value |
Banc of America Commercial Mortgage Trust: - continued | | | | |
Series 2005-5 Class D, 5.4703% 10/10/45 (i) | | $ 4,000,000 | | $ 4,006,456 |
Series 2005-6 Class AJ, 5.328% 9/10/47 (i) | | 5,000,000 | | 5,043,800 |
Bear Stearns Commercial Mortgage Securities, Inc. Series 2006-PW11 Class AJ, 5.597% 3/11/39 (i) | | 5,700,000 | | 5,778,521 |
Bear Stearns Commercial Mortgage Securities Trust Series 2006-T22 Class B, 5.7657% 4/12/38 (h)(i) | | 2,520,000 | | 2,621,531 |
BLCP Hotel Trust: | | | | |
floater Series 2014-CLRN Class F, 3.2206% 8/15/29 (h)(i) | | 2,500,000 | | 2,413,543 |
Series 2014-CLMZ Class M, 5.9145% 8/15/29 (h)(i) | | 12,513,000 | | 12,426,958 |
Boca Hotel Portfolio Trust Series 2013-BOCA Class E, 3.9373% 8/15/26 (h)(i) | | 2,500,000 | | 2,499,993 |
Carefree Portfolio Trust floater: | | | | |
Series 2014-CARE: | | | | |
Class E, 4.187% 11/15/19 (h)(i) | | 4,073,000 | | 4,094,310 |
Class F, 2.7707% 11/15/19 (h)(i) | | 1,650,000 | | 1,609,238 |
Series 2014-CMZA Class MZA, 6.1635% 11/15/19 (h)(i) | | 15,382,000 | | 15,385,069 |
CGBAM Commercial Mortgage Trust: | | | | |
floater Series 2014-HD Class E, 3.1855% 2/15/31 (h)(i) | | 5,769,000 | | 5,770,575 |
Series 2015-SMRT Class F, 3.912% 4/10/28 (h)(i) | | 5,746,000 | | 5,451,357 |
Citigroup Commercial Mortgage Trust: | | | | |
Series 2013-GC15 Class D, 5.2754% 9/10/46 (h)(i) | | 2,750,000 | | 2,709,498 |
Series 2015-SHP2 Class E, 4.285% 7/15/17 (h)(i) | | 2,933,000 | | 2,933,000 |
COMM Mortgage Trust: | | | | |
sequential payer Series 2013-LC6 Class E, 3.5% 1/10/46 (h) | | 7,300,000 | | 6,117,210 |
Series 2012-CR5 Class D, 4.4801% 12/10/45 (h)(i) | | 2,000,000 | | 2,020,718 |
Series 2013-CR10 Class D, 4.9525% 8/10/46 (h)(i) | | 2,000,000 | | 1,918,880 |
Series 2013-CR12 Class D, 5.2543% 10/10/46 (h)(i) | | 4,500,000 | | 4,470,930 |
Series 2013-CR9 Class D, 4.4002% 7/10/45 (h)(i) | | 4,255,000 | | 4,020,439 |
Series 2013-LC6 Class D, 4.4296% 1/10/46 (h)(i) | | 3,870,000 | | 3,667,556 |
Series 2014-UBS2 Class D, 5.1826% 3/10/47 (h)(i) | | 3,713,000 | | 3,535,021 |
Commercial Mortgage Acceptance Corp. Series 1998-C2 Class J, 5.44% 9/15/30 (h) | | 1,680,484 | | 1,616,863 |
Commercial Mortgage Trust pass-thru certificates: | | | | |
Series 2005-C6 Class AJ, 5.209% 6/10/44 (i) | | 1,447,499 | | 1,447,134 |
Series 2012-CR1: | | | | |
Class C, 5.5378% 5/15/45 (i) | | 1,000,000 | | 1,100,956 |
Class D, 5.5378% 5/15/45 (h)(i) | | 5,550,000 | | 5,714,274 |
Commercial Mortgage Securities - continued |
| Principal Amount (e) | | Value |
Commercial Mortgage Trust pass-thru certificates: - continued | | | | |
Series 2012-CR2: | | | | |
Class D, 5.0191% 8/15/45 (h)(i) | | $ 4,500,000 | | $ 4,736,300 |
Class E, 5.0191% 8/15/45 (h)(i) | | 6,000,000 | | 6,043,332 |
Series 2012-LC4: | | | | |
Class C, 5.8205% 12/10/44 (i) | | 2,000,000 | | 2,236,190 |
Class D, 5.8205% 12/10/44 (h)(i) | | 8,000,000 | | 8,470,736 |
Core Industrial Trust Series 2015-TEXW Class F, 3.8487% 2/10/34 (h)(i) | | 6,565,000 | | 5,980,341 |
Credit Suisse First Boston Mortgage Securities Corp.: | | | | |
Series 1998-C1 Class F, 6% 5/17/40 (h) | | 1,183,604 | | 1,261,774 |
Series 1998-C2 Class F, 6.75% 11/15/30 (h) | | 1,332,466 | | 1,367,232 |
CSMC Trust floater Series 2015-DEAL: | | | | |
Class E, 4.184% 4/15/29 (h)(i) | | 2,000,000 | | 1,991,236 |
Class F, 4.934% 4/15/29 (h)(i) | | 5,053,000 | | 5,030,863 |
DBCCRE Mortgage Trust Series 2014-ARCP Class E, 5.099% 1/10/34 (h)(i) | | 7,503,000 | | 7,060,556 |
DBUBS Mortgage Trust Series 2011-LC1A: | | | | |
Class E, 5.7348% 11/10/46 (h)(i) | | 12,490,000 | | 13,468,979 |
Class G, 4.652% 11/10/46 (h) | | 9,843,000 | | 8,578,056 |
Extended Stay America Trust Series 2013-ESH7 Class C7, 3.9017% 12/5/31 (h) | | 500,000 | | 512,482 |
Freddie Mac: | | | | |
pass-thru certificates: | | | | |
Series K011 Class X3, 2.6623% 12/25/43 (i)(j) | | 12,206,096 | | 1,522,808 |
Series K012 Class X3, 2.365% 1/25/41 (i)(j) | | 21,072,884 | | 2,367,328 |
Series K013 Class X3, 2.9023% 1/25/43 (i)(j) | | 14,360,000 | | 1,971,326 |
Series KAIV Class X2, 3.6147% 6/25/46 (i)(j) | | 7,430,000 | | 1,335,514 |
GAHR Commercial Mortgage Trust Series 2015-NRF: | | | | |
Class EFX, 3.4949% 12/15/19 (h)(i) | | 5,607,000 | | 5,276,864 |
Class FFX, 3.4949% 12/15/19 (h)(i) | | 7,411,000 | | 6,851,876 |
GMAC Commercial Mortgage Securities, Inc. Series 1997-C2 Class G, 6.75% 4/15/29 (i) | | 548,460 | | 580,893 |
GP Portfolio Trust Series 2014-GPP Class E, 4.0355% 2/15/27 (h)(i) | | 2,823,000 | | 2,813,420 |
Greenwich Capital Commercial Funding Corp. Series 2006-GG7 Class A4, 5.8187% 7/10/38 (i) | | 7,789,588 | | 7,937,831 |
GS Mortgage Securities Corp. II Series 2010-C1: | | | | |
Class D, 6.1899% 8/10/43 (h)(i) | | 4,000,000 | | 4,347,640 |
Class E, 4% 8/10/43 (h) | | 3,770,000 | | 3,420,547 |
GS Mortgage Securities Trust: | | | | |
Series 2010-C2 Class D, 5.3958% 12/10/43 (h)(i) | | 3,000,000 | | 3,147,048 |
Commercial Mortgage Securities - continued |
| Principal Amount (e) | | Value |
GS Mortgage Securities Trust: - continued | | | | |
Series 2011-GC5: | | | | |
Class C, 5.475% 8/10/44 (h)(i) | | $ 9,000,000 | | $ 9,855,405 |
Class D, 5.475% 8/10/44 (h)(i) | | 4,000,000 | | 4,179,732 |
Class E, 5.475% 8/10/44 (h)(i) | | 4,049,000 | | 4,014,478 |
Class F, 4.5% 8/10/44 (h) | | 4,500,000 | | 3,713,058 |
Series 2012-GC6: | | | | |
Class C, 5.8223% 1/10/45 (h)(i) | | 3,600,000 | | 3,999,030 |
Class D, 5.8223% 1/10/45 (h)(i) | | 2,000,000 | | 2,089,829 |
Class E, 5% 1/10/45 (h)(i) | | 4,516,000 | | 4,266,125 |
Series 2012-GCJ7: | | | | |
Class C, 5.9069% 5/10/45 (i) | | 6,500,000 | | 7,217,810 |
Class D, 5.9069% 5/10/45 (h)(i) | | 3,000,000 | | 3,125,367 |
Class E, 5% 5/10/45 (h) | | 6,920,000 | | 6,432,541 |
Series 2012-GCJ9 Class D, 5.0153% 11/10/45 (h)(i) | | 2,000,000 | | 1,977,798 |
Series 2013-GC16: | | | | |
Class D, 5.4927% 11/10/46 (h)(i) | | 3,750,000 | | 3,744,701 |
Class F, 3.5% 11/10/46 (h) | | 7,303,000 | | 5,602,621 |
Hilton U.S.A. Trust: | | | | |
floater Series 2014-ORL Class E, 3.436% 7/15/29 (h)(i) | | 7,241,000 | | 7,271,325 |
Series 2013-HLT Class EFX, 5.6086% 11/5/30 (h)(i) | | 5,000,000 | | 5,059,201 |
Invitation Homes Trust floater Series 2013-SFR1 Class E, 2.9% 12/17/30 (h)(i) | | 1,500,000 | | 1,448,935 |
JPMorgan Chase Commercial Mortgage Securities Corp.: | | | | |
Series 2003-C1 Class F, 5.8339% 1/12/37 (h)(i) | | 1,000,000 | | 998,658 |
Series 2009-IWST: | | | | |
Class C, 7.6935% 12/5/27 (h)(i) | | 3,000,000 | | 3,582,123 |
Class D, 7.6935% 12/5/27 (h)(i) | | 9,550,000 | | 11,286,333 |
Series 2010-CNTM Class MZ, 8.5% 8/5/20 (h) | | 9,000,000 | | 9,352,089 |
Series 2010-CNTR: | | | | |
Class D, 6.3899% 8/5/32 (h)(i) | | 4,500,000 | | 5,160,389 |
Class XB, 1.1366% 8/5/32 (h)(i)(j) | | 32,655,000 | | 1,170,705 |
Series 2012-CBX: | | | | |
Class C, 5.4134% 6/15/45 (i) | | 4,530,000 | | 4,889,637 |
Class F, 4% 6/15/45 (h) | | 5,000,000 | | 4,506,520 |
Class G 4% 6/15/45 (h) | | 4,044,000 | | 2,945,493 |
JPMorgan Chase Commercial Mortgage Securities Trust: | | | | |
floater: | | | | |
Series 2014-FBLU Class E, 3.6815% 12/15/28 (h)(i) | | 2,406,000 | | 2,403,763 |
Commercial Mortgage Securities - continued |
| Principal Amount (e) | | Value |
JPMorgan Chase Commercial Mortgage Securities Trust: - continued | | | | |
Series 2014-INN: | | | | |
Class E, 3.787% 6/15/29 (h)(i) | | $ 9,607,000 | | $ 9,570,513 |
Class F, 4.187% 6/15/29 (h)(i) | | 9,618,000 | | 9,453,638 |
Series 2005-LDP5 Class AJ, 5.5334% 12/15/44 (i) | | 3,470,000 | | 3,510,262 |
Series 2011-C4 Class F, 3.873% 7/15/46 (h) | | 1,400,000 | | 1,295,223 |
Series 2013-LC11: | | | | |
Class D, 4.3807% 4/15/46 (i) | | 3,750,000 | | 3,528,146 |
Class F, 3.25% 4/15/46 (h)(i) | | 2,518,000 | | 1,846,495 |
Series 2014-DSTY Class E, 3.9314% 6/10/27 (h)(i) | | 2,525,000 | | 2,365,362 |
JPMorgan Commercial Mortgage Finance Corp. Series 1999-C8 Class H, 6% 7/15/31 (h) | | 984,143 | | 916,870 |
LB-UBS Commercial Mortgage Trust: | | | | |
sequential payer: | | | | |
Series 2005-C7 Class AJ, 5.323% 11/15/40 (i) | | 8,000,000 | | 8,026,504 |
Series 2006-C7 Class AM, 5.378% 11/15/38 | | 2,040,000 | | 2,117,220 |
Series 2005-C1 Class E, 4.924% 2/15/40 | | 1,747,214 | | 1,748,042 |
Series 2006-C4: | | | | |
Class A4, 6.028% 6/15/38 (i) | | 4,743,244 | | 4,858,244 |
Class AJ, 6.048% 6/15/38 (i) | | 7,005,000 | | 7,180,692 |
Class AM, 6.048% 6/15/38 (i) | | 6,700,000 | | 6,948,376 |
LSTAR Commercial Mortgage Trust: | | | | |
Series 2011-1 Class D, 5.4277% 6/25/43 (h)(i) | | 1,060,085 | | 1,060,314 |
Series 2014-2: | | | | |
Class D, 5.183% 1/20/41 (h)(i) | | 3,000,000 | | 2,833,575 |
Class E, 5.183% 1/20/41 (h)(i) | | 4,800,000 | | 4,016,995 |
Mach One Trust LLC Series 2004-1A Class H, 6.1214% 5/28/40 (h)(i) | | 1,384,194 | | 1,385,163 |
Merrill Lynch Financial Asset, Inc. Series 2005-CA16 Class M, 4.384% 7/12/37 | CAD | 220,089 | | 167,336 |
Merrill Lynch Mortgage Trust Series 2006-C1 Class AM, 5.8654% 5/12/39 (i) | | 1,200,000 | | 1,231,040 |
Mezz Capital Commercial Mortgage Trust Series 2004-C1 Class IO, 9.0012% 1/15/37 (h)(i)(j) | | 349,488 | | 22,297 |
Morgan Stanley BAML Trust: | | | | |
Series 2012-C6 Class D, 4.816% 11/15/45 (h)(i) | | 2,000,000 | | 2,046,496 |
Series 2013-C12 Class D, 4.9261% 10/15/46 (h)(i) | | 3,250,000 | | 3,171,243 |
Series 2013-C13: | | | | |
Class D, 5.0578% 11/15/46 (h)(i) | | 3,100,000 | | 3,024,407 |
Class E, 5.0578% 11/15/46 (h)(i) | | 3,379,000 | | 3,073,687 |
Series 2013-C7 Class E, 4.4375% 2/15/46 (h)(i) | | 1,000,000 | | 906,731 |
Series 2013-C9 Class D, 4.2965% 5/15/46 (h)(i) | | 5,000,000 | | 4,677,180 |
Commercial Mortgage Securities - continued |
| Principal Amount (e) | | Value |
Morgan Stanley Capital I Trust: | | | | |
sequential payer: | | | | |
Series 2006-HQ10 Class AM, 5.36% 11/12/41 | | $ 8,200,000 | | $ 8,547,590 |
Series 2012-C4 Class E, 5.7084% 3/15/45 (h)(i) | | 5,630,000 | | 5,833,969 |
Series 1997-RR Class F, 7.4369% 4/30/39 (h)(i) | | 806,029 | | 809,334 |
Series 1998-CF1 Class G, 7.35% 7/15/32 (h) | | 2,640,173 | | 2,565,292 |
Series 2006-IQ12 Class AMFX, 5.37% 12/15/43 | | 7,500,000 | | 7,863,240 |
Series 2011-C1 Class C, 5.418% 9/15/47 (h)(i) | | 4,000,000 | | 4,430,933 |
Series 2011-C2: | | | | |
Class D, 5.4799% 6/15/44 (h)(i) | | 4,610,000 | | 4,940,804 |
Class E, 5.4799% 6/15/44 (h)(i) | | 9,600,000 | | 10,106,544 |
Class F, 5.4799% 6/15/44 (h)(i) | | 4,440,000 | | 4,222,724 |
Class XB, 0.5332% 6/15/44 (h)(i)(j) | | 63,708,222 | | 1,679,731 |
Series 2011-C3: | | | | |
Class C, 5.3554% 7/15/49 (h)(i) | | 2,000,000 | | 2,181,710 |
Class D, 5.3554% 7/15/49 (h)(i) | | 7,400,000 | | 7,891,760 |
Class G, 5.3554% 7/15/49 (h)(i) | | 3,283,000 | | 2,943,758 |
Series 2012-C4 Class D, 5.7084% 3/15/45 (h)(i) | | 6,310,000 | | 6,779,514 |
Motel 6 Trust Series 2015-MTL6: | | | | |
Class E, 5.2785% 2/5/30 (h) | | 3,278,000 | | 3,263,836 |
Class F, 5% 2/5/30 (h) | | 10,728,000 | | 10,372,260 |
Providence Place Group Ltd. Partnership Series 2000-C1 Class A2, 7.75% 7/20/28 (h) | | 4,575,017 | | 5,739,359 |
SCG Trust Series 2013-SRP1 Class D, 3.5172% 11/15/26 (h)(i) | | 1,000,000 | | 999,542 |
TIAA Seasoned Commercial Mortgage Trust sequential payer Series 2007-C4 Class AJ, 5.4862% 8/15/39 (i) | | 1,493,827 | | 1,500,240 |
TimberStar Trust I Series 2006-1 Class F, 7.5296% 10/15/36 (h) | | 10,630,000 | | 10,906,829 |
UBS Commercial Mortgage Trust Series 2012-C1 Class D, 5.727% 5/10/45 (h)(i) | | 3,235,000 | | 3,403,336 |
UBS-Barclays Commercial Mortgage Trust sequential payer Series 2012-C3 Class A1, 0.726% 8/10/49 | | 1,827,170 | | 1,818,809 |
UBS-Citigroup Commercial Mortgage Trust Series 2011-C1 Class B, 6.084% 1/10/45 (h)(i) | | 3,000,000 | | 3,478,836 |
Vornado DP LLC Series 2010-VNO Class D, 6.3555% 9/13/28 (h) | | 2,540,000 | | 2,919,900 |
Wachovia Bank Commercial Mortgage Trust Series 2004-C11 Class D, 5.3146% 1/15/41 (i) | | 5,177,000 | | 5,257,927 |
Wells Fargo Commercial Mortgage Trust Series 2012-LC5 Class D, 4.9366% 10/15/45 (h)(i) | | 9,999,000 | | 10,087,941 |
WF-RBS Commercial Mortgage Trust: | | | | |
sequential payer Series 2011-C4I Class G, 5% 6/15/44 (h) | | 4,000,000 | | 3,319,232 |
Commercial Mortgage Securities - continued |
| Principal Amount (e) | | Value |
WF-RBS Commercial Mortgage Trust: - continued | | | | |
Series 2011-C3: | | | | |
Class C, 5.335% 3/15/44 (h) | | $ 4,900,000 | | $ 5,353,554 |
Class D, 5.7221% 3/15/44 (h)(i) | | 1,000,000 | | 1,079,559 |
Class E, 5% 3/15/44 (h) | | 3,000,000 | | 2,910,177 |
Series 2011-C5: | | | | |
Class F, 5.25% 11/15/44 (h)(i) | | 3,000,000 | | 2,757,525 |
Class G, 5.25% 11/15/44 (h)(i) | | 2,000,000 | | 1,753,606 |
Series 2012-C10 Class E, 4.6057% 12/15/45 (h)(i) | | 4,090,000 | | 3,745,782 |
Series 2012-C7: | | | | |
Class D, 4.9995% 6/15/45 (h)(i) | | 2,380,000 | | 2,495,706 |
Class F, 4.5% 6/15/45 (h) | | 2,000,000 | | 1,855,752 |
Series 2013-C11: | | | | |
Class D, 4.3201% 3/15/45 (h)(i) | | 5,830,000 | | 5,645,300 |
Class E, 4.3201% 3/15/45 (h)(i) | | 4,780,000 | | 4,336,593 |
Series 2013-C13 Class D, 4.1386% 5/15/45 (h)(i) | | 4,000,000 | | 3,825,852 |
WFCG Commercial Mortgage Trust floater Series 2015-BXRP: | | | | |
Class F, 3.9058% 11/15/29 (h)(i) | | 6,182,652 | | 6,140,759 |
Class G, 3.2055% 11/15/29 (h)(i) | | 4,069,869 | | 3,787,233 |
TOTAL COMMERCIAL MORTGAGE SECURITIES (Cost $568,589,435) |
610,929,580
|
Bank Loan Obligations - 7.3% |
|
CONSUMER DISCRETIONARY - 2.9% |
Hotels, Restaurants & Leisure - 2.2% |
Caesars Entertainment Resort Properties LLC Tranche B 1LN, term loan 7% 10/11/20 (i) | | 13,238,103 | | 12,377,626 |
Caesars Growth Properties Holdings, LLC Tranche 1LN, term loan 6.25% 5/8/21 (i) | | 10,194,581 | | 8,627,164 |
Cooper Hotel Group 12% 11/6/17 | | 13,194,963 | | 13,854,711 |
ESH Hospitality, Inc. Tranche B, term loan 5% 6/24/19 (i) | | 14,218,748 | | 14,485,349 |
Four Seasons Holdings, Inc.: | | | | |
Tranche 2LN, term loan 6.25% 12/27/20 (i) | | 2,150,000 | | 2,155,375 |
Tranche B 1LN, term loan 3.5% 6/27/20 (i) | | 1,993,180 | | 1,990,688 |
Hilton Worldwide Finance, LLC Tranche B, term loan 3.5% 10/25/20 (i) | | 18,472,361 | | 18,495,451 |
La Quinta Intermediate Holdings LLC Tranche B LN, Tranche B, term loan 4% 4/14/21 (i) | | 13,181,721 | | 13,198,198 |
Bank Loan Obligations - continued |
| Principal Amount (e) | | Value |
CONSUMER DISCRETIONARY - continued |
Hotels, Restaurants & Leisure - continued |
Playa Resorts Holding BV Tranche B, term loan 4% 8/9/19 (i) | | $ 8,114,819 | | $ 8,135,106 |
Ryman Hospitality Properties, Inc. Tranche B, term loan 3.5% 1/15/21 (i) | | 2,267,100 | | 2,275,602 |
| | 95,595,270 |
Media - 0.2% |
CBS Outdoor Americas Capital LLC/CBS Outdoor Americas Capital Corp. Tranche B, term loan 3% 1/31/21 (i) | | 8,295,000 | | 8,284,631 |
Multiline Retail - 0.4% |
JC Penney Corp., Inc. Tranche B, term loan 6% 5/22/18 (i) | | 15,385,152 | | 15,365,920 |
Specialty Retail - 0.1% |
The Pep Boys - Manny, Moe & Jack Tranche B, term loan 4.25% 10/11/18 (i) | | 6,213,491 | | 6,213,491 |
TOTAL CONSUMER DISCRETIONARY | | 125,459,312 |
CONSUMER STAPLES - 0.3% |
Food & Staples Retailing - 0.3% |
Albertson's LLC: | | | | |
Tranche B 2LN, term loan 5.375% 3/21/19 (i) | | 5,110,539 | | 5,129,703 |
Tranche B 3LN, term loan 5% 8/25/19 (i) | | 8,378,938 | | 8,410,359 |
| | 13,540,062 |
ENERGY - 0.5% |
Oil, Gas & Consumable Fuels - 0.5% |
Moxie Patriot LLC Tranche B, term loan 6.75% 12/19/20 (i) | | 2,000,000 | | 2,007,500 |
Panda Sherman Power, LLC term loan 9% 9/14/18 (i) | | 7,148,245 | | 7,041,022 |
Panda Temple Power, LLC term loan 7.25% 4/3/19 (i) | | 8,580,000 | | 8,065,200 |
TPF II Power, LLC Tranche B, term loan 5.5% 10/2/21 (i) | | 4,211,517 | | 4,232,574 |
| | 21,346,296 |
FINANCIALS - 1.8% |
Real Estate Investment Trusts - 0.3% |
Starwood Property Trust, Inc. Tranche B, term loan 3.5% 4/17/20 (i) | | 10,822,768 | | 10,768,654 |
Real Estate Management & Development - 1.1% |
CityCenter 8.74% 7/12/16 (i) | | 2,654,628 | | 2,654,628 |
Bank Loan Obligations - continued |
| Principal Amount (e) | | Value |
FINANCIALS - continued |
Real Estate Management & Development - continued |
Realogy Corp. Credit-Linked Deposit 4.4463% 10/10/16 (i) | | $ 420,600 | | $ 416,394 |
Realogy Group LLC Tranche B, term loan 3.75% 3/5/20 (i) | | 44,022,253 | | 44,132,309 |
| | 47,203,331 |
Thrifts & Mortgage Finance - 0.4% |
Ocwen Loan Servicing, LLC Tranche B, term loan 5% 2/15/18 (i) | | 18,395,917 | | 18,395,917 |
TOTAL FINANCIALS | | 76,367,902 |
HEALTH CARE - 0.1% |
Health Care Providers & Services - 0.1% |
Community Health Systems, Inc.: | | | | |
Tranche F, term loan 3.5335% 12/31/18 (i) | | 1,995,000 | | 2,004,975 |
Tranche G, term loan 3.75% 12/31/19 (i) | | 880,340 | | 880,340 |
Tranche H, term loan 4% 1/27/21 (i) | | 3,119,660 | | 3,127,459 |
| | 6,012,774 |
INDUSTRIALS - 0.6% |
Commercial Services & Supplies - 0.3% |
Lineage Logistics Holdings, LLC. Tranche B, term loan 4.5% 4/7/21 (i) | | 3,950,000 | | 3,871,000 |
Pilot Travel Centers LLC Tranche B, term loan 4.25% 10/3/21 (i) | | 9,900,000 | | 9,987,120 |
| | 13,858,120 |
Construction & Engineering - 0.3% |
Drumm Investors LLC Tranche B, term loan 6.75% 5/4/18 (i) | | 11,353,592 | | 11,481,320 |
TOTAL INDUSTRIALS | | 25,339,440 |
TELECOMMUNICATION SERVICES - 0.4% |
Wireless Telecommunication Services - 0.4% |
SBA Senior Finance II, LLC: | | | | |
term loan 3.25% 3/24/21 (i) | | 13,855,050 | | 13,768,456 |
Tranche B 2LN, term loan 3.25% 6/10/22 (i) | | 1,500,000 | | 1,488,750 |
| | 15,257,206 |
Bank Loan Obligations - continued |
| Principal Amount (e) | | Value |
UTILITIES - 0.7% |
Electric Utilities - 0.4% |
Calpine Construction Finance Co. LP Tranche B 2LN, term loan 3.25% 1/31/22 (i) | | $ 7,306,278 | | $ 7,260,613 |
Essential Power LLC Tranche B, term loan 4.75% 8/8/19 (i) | | 3,362,398 | | 3,375,007 |
La Frontera Generation, LLC Tranche B, term loan 4.5% 9/30/20 (i) | | 6,066,770 | | 5,983,655 |
Southeast Powergen LLC Tranche B, term loan 4.5% 12/2/21 (i) | | 2,756,150 | | 2,766,486 |
| | 19,385,761 |
Independent Power and Renewable Electricity Producers - 0.3% |
Calpine Corp. Tranche B 4LN, term loan 4% 10/31/20 (i) | | 1,970,000 | | 1,972,463 |
Tempus Public Foundation Generation Holdings LLC Tranche B, term loan 4.75% 12/31/17 (i) | | 11,486,346 | | 10,940,745 |
| | 12,913,208 |
TOTAL UTILITIES | | 32,298,969 |
TOTAL BANK LOAN OBLIGATIONS (Cost $274,172,984) |
315,621,961
|
Preferred Securities - 0.0% |
|
FINANCIALS - 0.0% |
Diversified Financial Services - 0.0% |
Crest Dartmouth Street 2003 1 Ltd. Series 2003-1A Class PS, 6/28/38 (h)(i) | | 1,220,000 | | 394,304 |
Thrifts & Mortgage Finance - 0.0% |
Crest Clarendon Street 2002-1 Ltd. Series 2002-1A Class PS, 12/28/35 (h)(i) | | 500,000 | | 250 |
TOTAL PREFERRED SECURITIES (Cost $1,297,768) |
394,554
|
Money Market Funds - 4.9% |
| Shares | | Value |
Fidelity Cash Central Fund, 0.17% (b) | 212,414,253 | | $ 212,414,253 |
Fidelity Securities Lending Cash Central Fund, 0.18% (b)(c) | 82,000 | | 82,000 |
TOTAL MONEY MARKET FUNDS (Cost $212,496,253) |
212,496,253
|
TOTAL INVESTMENT PORTFOLIO - 98.7% (Cost $4,042,563,842) | 4,259,361,956 |
NET OTHER ASSETS (LIABILITIES) - 1.3% | 57,654,478 |
NET ASSETS - 100% | $ 4,317,016,434 |
Currency Abbreviations |
CAD | - | Canadian dollar |
Legend |
(a) Non-income producing |
(b) Affiliated fund that is generally available only to investment companies and other accounts managed by Fidelity Investments. The rate quoted is the annualized seven-day yield of the fund at period end. A complete unaudited listing of the fund's holdings as of its most recent quarter end is available upon request. In addition, each Fidelity Central Fund's financial statements, which are not covered by the Fund's Report of Independent Registered Public Accounting Firm, are available on the SEC's website or upon request. |
(c) Investment made with cash collateral received from securities on loan. |
(d) Non-income producing - Security is in default. |
(e) Amount is stated in United States dollars unless otherwise noted. |
(f) Security or a portion of the security is on loan at period end. |
(g) Affiliated company |
(h) Security exempt from registration under Rule 144A of the Securities Act of 1933. These securities may be resold in transactions exempt from registration, normally to qualified institutional buyers. At the end of the period, the value of these securities amounted to $753,917,003 or 17.5% of net assets. |
(i) Coupon rates for floating and adjustable rate securities reflect the rates in effect at period end. |
(j) Security represents right to receive monthly interest payments on an underlying pool of mortgages or assets. Principal shown is the outstanding par amount of the pool as of the end of the period. |
(k) Restricted securities - Investment in securities not registered under the Securities Act of 1933 (excluding 144A issues). At the end of the period, the value of restricted securities (excluding 144A issues) amounted to $7,092,781 or 0.2% of net assets. |
Additional information on each restricted holding is as follows: |
Security | Acquisition Date | Acquisition Cost |
Fannie Mae REMIC Trust Series 2001-W3 subordinate REMIC pass thru certificates, Class B3, 7% 9/25/41 | 5/21/03 | $ 57,050 |
Fannie Mae REMIC Trust Series 2003-W1 subordinate REMIC pass thru certificates, Class B3, 4.3375% 12/25/42 | 3/25/03 | $ 94,017 |
Stanley Martin Communities LLC Class B | 8/3/05 - 3/1/07 | $ 4,244,623 |
Affiliated Central Funds |
Information regarding fiscal year to date income earned by the Fund from investments in Fidelity Central Funds is as follows: |
Fund | Income earned |
Fidelity Cash Central Fund | $ 389,159 |
Fidelity Securities Lending Cash Central Fund | 31,537 |
Total | $ 420,696 |
Other Affiliated Issuers |
An affiliated company is a company in which the Fund has ownership of at least 5% of the voting securities. Fiscal year to date transactions with companies which are or were affiliates are as follows: |
Affiliate | Value, beginning of period | Purchases | Sales Proceeds | Dividend Income | Value,
end of
period |
Acadia Realty Trust (SBI) | $ 98,809,206 | $ 6,961,621 | $ - | $ 4,593,982 | $ 119,299,759 |
Arbor Realty Trust, Inc. | 21,697,653 | - | - | 1,657,247 | 20,991,789 |
Arbor Realty Trust, Inc. 7.375% | 8,162,637 | 2,420,000 | - | 793,928 | 10,597,189 |
Arbor Realty Trust, Inc. Series A, 8.25% | 4,727,225 | - | - | 389,996 | 4,814,206 |
Arbor Realty Trust, Inc. Series B, 7.75% | 5,882,400 | - | - | 465,000 | 5,940,000 |
Arbor Realty Trust, Inc. Series C, 8.50% | 2,525,000 | - | - | 212,500 | 2,578,000 |
Total | $ 141,804,121 | $ 9,381,621 | $ - | $ 8,112,653 | $ 164,220,943 |
Other Information |
The following is a summary of the inputs used, as of July 31, 2015, involving the Fund's assets and liabilities carried at fair value. The inputs or methodology used for valuing securities may not be an indication of the risk associated with investing in those securities. For more information on valuation inputs, and their aggregation into the levels used in the tables below, please refer to the Investment Valuation section in the accompanying Notes to Financial Statements. |
Valuation Inputs at Reporting Date: |
Description | Total | Level 1 | Level 2 | Level 3 |
Investments in Securities: | | | | |
Equities: | | | | |
Consumer Discretionary | $ 8,912,573 | $ 1,858,203 | $ - | $ 7,054,370 |
Financials | 2,156,240,482 | 2,122,413,123 | 33,827,357 | 2 |
Corporate Bonds | 862,125,500 | - | 861,655,568 | 469,932 |
Asset-Backed Securities | 82,531,500 | - | 75,507,994 | 7,023,506 |
Collateralized Mortgage Obligations | 10,109,553 | - | 9,587,036 | 522,517 |
Commercial Mortgage Securities | 610,929,580 | - | 610,739,947 | 189,633 |
Bank Loan Obligations | 315,621,961 | - | 296,540,853 | 19,081,108 |
Preferred Securities | 394,554 | - | - | 394,554 |
Money Market Funds | 212,496,253 | 212,496,253 | - | - |
Total Investments in Securities: | $ 4,259,361,956 | $ 2,336,767,579 | $ 1,887,858,755 | $ 34,735,622 |
Valuation Inputs at Reporting Date: |
The following is a reconciliation of Investments in Securities for which Level 3 inputs were used in determining value: |
Investments in Securities: | |
Bank Loan Obligations | |
Beginning Balance | $ 47,410,682 |
Net Realized Gain (Loss) on Investment Securities | 4,312 |
Net Unrealized Gain (Loss) on Investment Securities | (204,947) |
Cost of Purchases | 1,641,773 |
Proceeds of Sales | (30,267,248) |
Amortization/Accretion | (149,892) |
Transfers into Level 3 | 646,428 |
Transfers out of Level 3 | - |
Ending Balance | $ 19,081,108 |
The change in unrealized gain (loss) for the period attributable to Level 3 securities held at July 31, 2015 | $ 139,122 |
Other Investments in Securities: | |
Beginning Balance | $ 31,191,916 |
Net Realized Gain (Loss) on Investment Securities | (4,491,681) |
Net Unrealized Gain (Loss) on Investment Securities | 6,062,436 |
Cost of Purchases | 54,943 |
Proceeds of Sales | (15,938,523) |
Amortization/Accretion | 600,752 |
Transfers into Level 3 | 494,533 |
Transfers out of Level 3 | (2,319,862) |
Ending Balance | $ 15,654,514 |
The change in unrealized gain (loss) for the period attributable to Level 3 securities held at July 31, 2015 | $ 298,525 |
The information used in the above reconciliations represents fiscal year to date activity for any Investments in Securities identified as using Level 3 inputs at either the beginning or the end of the current fiscal period. Transfers in or out of Level 3 represent the beginning value of any Security or Instrument where a change in the pricing level occurred from the beginning to the end of the period. The cost of purchases and the proceeds of sales may include securities received or delivered through corporate actions or exchanges. Realized and unrealized gains (losses) disclosed in the reconciliation are included in Net Gain (Loss) on the Fund's Statement of Operations. |
Other Information |
The composition of credit quality ratings as a percentage of net assets is as follows (Unaudited): |
U.S. Government and U.S. Government Agency Obligations | 0.3% |
AAA,AA,A | 3.1% |
BBB | 9.5% |
BB | 9.6% |
B | 11.7% |
CCC,CC,C | 0.8% |
D | 0.0% |
Not Rated | 8.5% |
Equities | 50.2% |
Short-Term Investments and Net Other Assets | 6.3% |
| 100.0% |
We have used ratings from Moody's Investors Service, Inc. Where Moody's® ratings are not available, we have used S&P® ratings. All ratings are as of the date indicated and do not reflect subsequent changes. |
See accompanying notes which are an integral part of the financial statements.
Annual Report
Statement of Assets and Liabilities
| | July 31, 2015 |
| | |
Assets | | |
Investment in securities, at value (including securities loaned of $80,160) - See accompanying schedule: Unaffiliated issuers (cost $3,699,779,355) | $ 3,882,644,760 | |
Fidelity Central Funds (cost $212,496,253) | 212,496,253 | |
Other affiliated issuers (cost $130,288,234) | 164,220,943 | |
Total Investments (cost $4,042,563,842) | | $ 4,259,361,956 |
Cash | | 230,281 |
Foreign currency held at value (cost $2,357,093) | | 2,310,596 |
Receivable for investments sold | | 49,193,593 |
Receivable for fund shares sold | | 3,081,848 |
Dividends receivable | | 3,389,809 |
Interest receivable | | 18,490,023 |
Distributions receivable from Fidelity Central Funds | | 29,352 |
Other receivables | | 6,569 |
Total assets | | 4,336,094,027 |
| | |
Liabilities | | |
Payable for investments purchased | $ 6,702,493 | |
Payable for fund shares redeemed | 8,923,965 | |
Accrued management fee | 1,972,548 | |
Distribution and service plan fees payable | 357,265 | |
Other affiliated payables | 905,413 | |
Other payables and accrued expenses | 133,909 | |
Collateral on securities loaned, at value | 82,000 | |
Total liabilities | | 19,077,593 |
| | |
Net Assets | | $ 4,317,016,434 |
Net Assets consist of: | | |
Paid in capital | | $ 4,030,305,530 |
Undistributed net investment income | | 34,176,266 |
Accumulated undistributed net realized gain (loss) on investments and foreign currency transactions | | 35,806,504 |
Net unrealized appreciation (depreciation) on investments and assets and liabilities in foreign currencies | | 216,728,134 |
Net Assets | | $ 4,317,016,434 |
See accompanying notes which are an integral part of the financial statements.
Annual Report
Financial Statements - continued
Statement of Assets and Liabilities - continued
| | July 31, 2015 |
Calculation of Maximum Offering Price | | |
Class A: | | |
Net Asset Value and redemption price per share ($495,461,547 ÷ 42,506,436 shares) | | $ 11.66 |
| | |
Maximum offering price per share (100/96.00 of $11.66) | | $ 12.15 |
Class T: | | |
Net Asset Value and redemption price per share ($55,424,226 ÷ 4,752,349 shares) | | $ 11.66 |
| | |
Maximum offering price per share (100/96.00 of $11.66) | | $ 12.15 |
Class C: | | |
Net Asset Value and offering price per share ($291,386,883 ÷ 25,217,545 shares) | | $ 11.55 |
| | |
Real Estate Income: | | |
Net Asset Value, offering price and redemption price per share ($2,561,268,378 ÷ 218,691,778 shares) | | $ 11.71 |
| | |
Class I: | | |
Net Asset Value, offering price and redemption price per share ($913,475,400 ÷ 78,199,250 shares) | | $ 11.68 |
A Redemption price per share is equal to net asset value less any applicable contingent deferred sales charge.
See accompanying notes which are an integral part of the financial statements.
Annual Report
Statement of Operations
| Year ended July 31, 2015 |
Investment Income | | |
Dividends (including $8,112,653 earned from other affiliated issuers) | | $ 124,596,150 |
Interest | | 115,189,589 |
Income from Fidelity Central Funds | | 420,696 |
Total income | | 240,206,435 |
| | |
Expenses | | |
Management fee | $ 24,277,663 | |
Transfer agent fees | 9,546,099 | |
Distribution and service plan fees | 4,138,875 | |
Accounting and security lending fees | 1,344,494 | |
Custodian fees and expenses | 63,073 | |
Independent trustees' compensation | 18,479 | |
Registration fees | 214,976 | |
Audit | 177,427 | |
Legal | 10,279 | |
Miscellaneous | 28,304 | |
Total expenses before reductions | 39,819,669 | |
Expense reductions | (141,701) | 39,677,968 |
Net investment income (loss) | | 200,528,467 |
Realized and Unrealized Gain (Loss) Net realized gain (loss) on: | | |
Investment securities: | | |
Unaffiliated issuers | 54,227,022 | |
Foreign currency transactions | (19,715) | |
Total net realized gain (loss) | | 54,207,307 |
Change in net unrealized appreciation (depreciation) on: Investment securities | (52,090,713) | |
Assets and liabilities in foreign currencies | (93,516) | |
Total change in net unrealized appreciation (depreciation) | | (52,184,229) |
Net gain (loss) | | 2,023,078 |
Net increase (decrease) in net assets resulting from operations | | $ 202,551,545 |
See accompanying notes which are an integral part of the financial statements.
Annual Report
Financial Statements - continued
Statement of Changes in Net Assets
| Year ended
July 31,
2015 | Year ended
July 31,
2014 |
Increase (Decrease) in Net Assets | | |
Operations | | |
Net investment income (loss) | $ 200,528,467 | $ 170,741,524 |
Net realized gain (loss) | 54,207,307 | 105,884,376 |
Change in net unrealized appreciation (depreciation) | (52,184,229) | 30,348,946 |
Net increase (decrease) in net assets resulting from operations | 202,551,545 | 306,974,846 |
Distributions to shareholders from net investment income | (199,452,326) | (172,155,251) |
Distributions to shareholders from net realized gain | (75,677,564) | (78,297,244) |
Total distributions | (275,129,890) | (250,452,495) |
Share transactions - net increase (decrease) | 215,193,161 | (6,051,637) |
Redemption fees | 424,938 | 438,384 |
Total increase (decrease) in net assets | 143,039,754 | 50,909,098 |
| | |
Net Assets | | |
Beginning of period | 4,173,976,680 | 4,123,067,582 |
End of period (including undistributed net investment income of $34,176,266 and undistributed net investment income of $34,654,174, respectively) | $ 4,317,016,434 | $ 4,173,976,680 |
See accompanying notes which are an integral part of the financial statements.
Annual Report
Financial Highlights - Fidelity Real Estate Income Fund Class A
Years ended July 31, | 2015 | 2014 | 2013 | 2012 | 2011 |
Selected Per-Share Data | | | | | |
Net asset value, beginning of period | $ 11.86 | $ 11.67 | $ 11.26 | $ 10.73 | $ 9.94 |
Income from Investment Operations | | | | | |
Net investment income (loss) C | .52 | .49 | .54 | .52 | .53 |
Net realized and unrealized gain (loss) | .02 | .44 | .60 | .61 | .76 |
Total from investment operations | .54 | .93 | 1.14 | 1.13 | 1.29 |
Distributions from net investment income | (.52) | (.50) | (.53) | (.51) | (.50) |
Distributions from net realized gain | (.21) | (.24) | (.20) | (.10) | - |
Total distributions | (.74)I | (.74) | (.73) | (.60)H | (.50) |
Redemption fees added to paid in capitalC, G | - | - | - | - | - |
Net asset value, end of period | $ 11.66 | $ 11.86 | $ 11.67 | $ 11.26 | $ 10.73 |
Total ReturnA, B | 4.65% | 8.49% | 10.45% | 11.24% | 13.27% |
Ratios to Average Net AssetsD, F | | | | | |
Expenses before reductions | 1.04% | 1.06% | 1.08% | 1.12% | 1.13% |
Expenses net of fee waivers, if any | 1.03% | 1.05% | 1.08% | 1.12% | 1.13% |
Expenses net of all reductions | 1.03% | 1.05% | 1.07% | 1.11% | 1.12% |
Net investment income (loss) | 4.40% | 4.28% | 4.62% | 4.89% | 5.00% |
Supplemental Data | | | | | |
Net assets, end of period (000 omitted) | $ 495,462 | $ 442,271 | $ 378,269 | $ 137,352 | $ 60,283 |
Portfolio turnover rateE | 19% | 29% | 26% | 27% | 25% |
A Total returns would have been lower if certain expenses had not been reduced during the applicable periods shown.
B Total returns do not include the effect of the sales charges.
C Calculated based on average shares outstanding during the period.
D Fees and expenses of any underlying Fidelity Central Funds are not included in the Fund's expense ratio. The Fund indirectly bears its proportionate share of the expenses of any underlying Fidelity Central Funds.
E Amount does not include the portfolio activity of any underlying Fidelity Central Funds.
F Expense ratios reflect operating expenses of the class. Expenses before reductions do not reflect amounts reimbursed by the investment adviser or reductions from brokerage service arrangements or reductions from other expense offset arrangements and do not represent the amount paid by the class during periods when reimbursements or reductions occur. Expenses net of fee waivers reflect expenses after reimbursement by the investment adviser but prior to reductions from brokerage service arrangements or other expense offset arrangements. Expenses net of all reductions represent the net expenses paid by the class.
G Amount represents less than $.01 per share.
H Total distributions of $.60 per share is comprised of distributions from net investment income of $.505 and distributions from net realized gain of $.097 per share.
I Total distributions of $.74 per share is comprised of distributions from net investment income of $.523 and distributions from net realized gain of $.212 per share.
See accompanying notes which are an integral part of the financial statements.
Annual Report
Financial Highlights - Fidelity Real Estate Income Fund Class T
Years ended July 31, | 2015 | 2014 | 2013 | 2012 | 2011 |
Selected Per-Share Data | | | | | |
Net asset value, beginning of period | $ 11.86 | $ 11.67 | $ 11.26 | $ 10.72 | $ 9.94 |
Income from Investment Operations | | | | | |
Net investment income (loss) C | .51 | .49 | .54 | .52 | .52 |
Net realized and unrealized gain (loss) | .02 | .43 | .60 | .62 | .76 |
Total from investment operations | .53 | .92 | 1.14 | 1.14 | 1.28 |
Distributions from net investment income | (.52) | (.50) | (.53) | (.50) | (.50) |
Distributions from net realized gain | (.21) | (.24) | (.20) | (.10) | - |
Total distributions | (.73) | (.73) H | (.73) | (.60) | (.50) |
Redemption fees added to paid in capitalC, G | - | - | - | - | - |
Net asset value, end of period | $ 11.66 | $ 11.86 | $ 11.67 | $ 11.26 | $ 10.72 |
Total ReturnA, B | 4.62% | 8.44% | 10.42% | 11.33% | 13.11% |
Ratios to Average Net AssetsD, F | | | | | |
Expenses before reductions | 1.06% | 1.08% | 1.08% | 1.11% | 1.16% |
Expenses net of fee waivers, if any | 1.06% | 1.08% | 1.08% | 1.11% | 1.16% |
Expenses net of all reductions | 1.06% | 1.07% | 1.08% | 1.11% | 1.16% |
Net investment income (loss) | 4.37% | 4.26% | 4.61% | 4.90% | 4.96% |
Supplemental Data | | | | | |
Net assets, end of period (000 omitted) | $ 55,424 | $ 48,164 | $ 46,198 | $ 26,143 | $ 7,626 |
Portfolio turnover rateE | 19% | 29% | 26% | 27% | 25% |
A Total returns would have been lower if certain expenses had not been reduced during the applicable periods shown.
B Total returns do not include the effect of the sales charges.
C Calculated based on average shares outstanding during the period.
D Fees and expenses of any underlying Fidelity Central Funds are not included in the Fund's expense ratio. The Fund indirectly bears its proportionate share of the expenses of any underlying Fidelity Central Funds.
E Amount does not include the portfolio activity of any underlying Fidelity Central Funds.
F Expense ratios reflect operating expenses of the class. Expenses before reductions do not reflect amounts reimbursed by the investment adviser or reductions from brokerage service arrangements or reductions from other expense offset arrangements and do not represent the amount paid by the class during periods when reimbursements or reductions occur. Expenses net of fee waivers reflect expenses after reimbursement by the investment adviser but prior to reductions from brokerage service arrangements or other expense offset arrangements. Expenses net of all reductions represent the net expenses paid by the class.
G Amount represents less than $.01 per share.
H Total distributions of $.73 per share is comprised of distributions from net investment income of $.496 and distributions from net realized gain of $.236 per share.
See accompanying notes which are an integral part of the financial statements.
Annual Report
Financial Highlights - Fidelity Real Estate Income Fund Class C
Years ended July 31, | 2015 | 2014 | 2013 | 2012 | 2011 |
Selected Per-Share Data | | | | | |
Net asset value, beginning of period | $ 11.77 | $ 11.59 | $ 11.20 | $ 10.67 | $ 9.93 |
Income from Investment Operations | | | | | |
Net investment income (loss) C | .43 | .40 | .45 | .44 | .45 |
Net realized and unrealized gain (loss) | .01 | .43 | .60 | .62 | .74 |
Total from investment operations | .44 | .83 | 1.05 | 1.06 | 1.19 |
Distributions from net investment income | (.45) | (.42) | (.46) | (.43) | (.45) |
Distributions from net realized gain | (.21) | (.24) | (.20) | (.10) | - |
Total distributions | (.66) | (.65) H | (.66) | (.53) | (.45) |
Redemption fees added to paid in capitalC, G | - | - | - | - | - |
Net asset value, end of period | $ 11.55 | $ 11.77 | $ 11.59 | $ 11.20 | $ 10.67 |
Total ReturnA, B | 3.82% | 7.66% | 9.66% | 10.49% | 12.25% |
Ratios to Average Net AssetsD, F | | | | | |
Expenses before reductions | 1.79% | 1.79% | 1.81% | 1.87% | 1.89% |
Expenses net of fee waivers, if any | 1.78% | 1.79% | 1.81% | 1.87% | 1.89% |
Expenses net of all reductions | 1.78% | 1.79% | 1.81% | 1.87% | 1.89% |
Net investment income (loss) | 3.65% | 3.54% | 3.88% | 4.14% | 4.23% |
Supplemental Data | | | | | |
Net assets, end of period (000 omitted) | $ 291,387 | $ 246,306 | $ 204,012 | $ 52,780 | $ 21,555 |
Portfolio turnover rateE | 19% | 29% | 26% | 27% | 25% |
A Total returns would have been lower if certain expenses had not been reduced during the applicable periods shown.
B Total returns do not include the effect of the contingent deferred sales charge.
C Calculated based on average shares outstanding during the period.
D Fees and expenses of any underlying Fidelity Central Funds are not included in the Fund's expense ratio. The Fund indirectly bears its proportionate share of the expenses of any underlying Fidelity Central Funds.
E Amount does not include the portfolio activity of any underlying Fidelity Central Funds.
F Expense ratios reflect operating expenses of the class. Expenses before reductions do not reflect amounts reimbursed by the investment adviser or reductions from brokerage service arrangements or reductions from other expense offset arrangements and do not represent the amount paid by the class during periods when reimbursements or reductions occur. Expenses net of fee waivers reflect expenses after reimbursement by the investment adviser but prior to reductions from brokerage service arrangements or other expense offset arrangements. Expenses net of all reductions represent the net expenses paid by the class.
G Amount represents less than $.01 per share.
H Total distributions of $.65 per share is comprised of distributions from net investment income of $.417 and distributions from net realized gain of $.236 per share.
See accompanying notes which are an integral part of the financial statements.
Annual Report
Financial Highlights - Fidelity Real Estate Income Fund
Years ended July 31, | 2015 | 2014 | 2013 | 2012 | 2011 |
Selected Per-Share Data | | | | | |
Net asset value, beginning of period | $ 11.91 | $ 11.71 | $ 11.29 | $ 10.75 | $ 9.95 |
Income from Investment Operations | | | | | |
Net investment income (loss) B | .54 | .52 | .57 | .54 | .55 |
Net realized and unrealized gain (loss) | .02 | .44 | .60 | .62 | .76 |
Total from investment operations | .56 | .96 | 1.17 | 1.16 | 1.31 |
Distributions from net investment income | (.55) | (.53) | (.55) | (.52) | (.51) |
Distributions from net realized gain | (.21) | (.24) | (.20) | (.10) | - |
Total distributions | (.76) | (.76)G | (.75) | (.62) | (.51) |
Redemption fees added to paid in capitalB, F | - | - | - | - | - |
Net asset value, end of period | $ 11.71 | $ 11.91 | $ 11.71 | $ 11.29 | $ 10.75 |
Total ReturnA | 4.84% | 8.78% | 10.71% | 11.50% | 13.41% |
Ratios to Average Net AssetsC, E | | | | | |
Expenses before reductions | .83% | .83% | .84% | .90% | .92% |
Expenses net of fee waivers, if any | .82% | .83% | .84% | .89% | .92% |
Expenses net of all reductions | .82% | .83% | .84% | .89% | .92% |
Net investment income (loss) | 4.61% | 4.50% | 4.85% | 5.12% | 5.21% |
Supplemental Data | | | | | |
Net assets, end of period (000 omitted) | $ 2,561,268 | $ 2,627,382 | $ 2,884,545 | $ 2,252,149 | $ 1,660,063 |
Portfolio turnover rateD | 19% | 29% | 26% | 27% | 25% |
A Total returns would have been lower if certain expenses had not been reduced during the applicable periods shown.
B Calculated based on average shares outstanding during the period.
C Fees and expenses of any underlying Fidelity Central Funds are not included in the Fund's expense ratio. The Fund indirectly bears its proportionate share of the expenses of any underlying Fidelity Central Funds.
D Amount does not include the portfolio activity of any underlying Fidelity Central Funds.
E Expense ratios reflect operating expenses of the class. Expenses before reductions do not reflect amounts reimbursed by the investment adviser or reductions from brokerage service arrangements or reductions from other expense offset arrangements and do not represent the amount paid by the class during periods when reimbursements or reductions occur. Expenses net of fee waivers reflect expenses after reimbursement by the investment adviser but prior to reductions from brokerage service arrangements or other expense offset arrangements. Expenses net of all reductions represent the net expenses paid by the class.
F Amount represents less than $.01 per share.
G Total distributions of $.76 per share is comprised of distributions from net investment income of $.525 and distributions from net realized gain of $.236 per share.
See accompanying notes which are an integral part of the financial statements.
Annual Report
Financial Highlights - Fidelity Real Estate Income Fund Class I
Years ended July 31, | 2015 | 2014 | 2013 | 2012 | 2011 |
Selected Per-Share Data | | | | | |
Net asset value, beginning of period | $ 11.88 | $ 11.69 | $ 11.28 | $ 10.74 | $ 9.95 |
Income from Investment Operations | | | | | |
Net investment income (loss)B | .55 | .52 | .57 | .55 | .55 |
Net realized and unrealized gain (loss) | .02 | .44 | .60 | .62 | .76 |
Total from investment operations | .57 | .96 | 1.17 | 1.17 | 1.31 |
Distributions from net investment income | (.55) | (.53) | (.56) | (.53) | (.52) |
Distributions from net realized gain | (.21) | (.24) | (.20) | (.10) | - |
Total distributions | (.77) G | (.77) | (.76) | (.63) | (.52) |
Redemption fees added to paid in capitalB, F | - | - | - | - | - |
Net asset value, end of period | $ 11.68 | $ 11.88 | $ 11.69 | $ 11.28 | $ 10.74 |
Total ReturnA | 4.92% | 8.76% | 10.72% | 11.62% | 13.44% |
Ratios to Average Net AssetsC, E | | | | | |
Expenses before reductions | .77% | .78% | .80% | .84% | .89% |
Expenses net of fee waivers, if any | .77% | .78% | .80% | .84% | .89% |
Expenses net of all reductions | .77% | .78% | .80% | .84% | .89% |
Net investment income (loss) | 4.66% | 4.55% | 4.89% | 5.17% | 5.24% |
Supplemental Data | | | | | |
Net assets, end of period (000 omitted) | $ 913,475 | $ 809,854 | $ 610,045 | $ 217,435 | $ 43,282 |
Portfolio turnover rateD | 19% | 29% | 26% | 27% | 25% |
A Total returns would have been lower if certain expenses had not been reduced during the applicable periods shown.
B Calculated based on average shares outstanding during the period.
C Fees and expenses of any underlying Fidelity Central Funds are not included in the Fund's expense ratio. The Fund indirectly bears its proportionate share of the expenses of any underlying Fidelity Central Funds.
D Amount does not include the portfolio activity of any underlying Fidelity Central Funds.
E Expense ratios reflect operating expenses of the class. Expenses before reductions do not reflect amounts reimbursed by the investment adviser or reductions from brokerage service arrangements or reductions from other expense offset arrangements and do not represent the amount paid by the class during periods when reimbursements or reductions occur. Expenses net of fee waivers reflect expenses after reimbursement by the investment adviser but prior to reductions from brokerage service arrangements or other expense offset arrangements. Expenses net of all reductions represent the net expenses paid by the class.
F Amount represents less than $.01 per share.
G Total distributions of $.77 per share is comprised of distributions from net investment income of $.554 and distributions from net realized gain of $.212 per share.
See accompanying notes which are an integral part of the financial statements.
Annual Report
For the period ended July 31, 2015
1. Organization.
Fidelity Real Estate Income Fund (the Fund) is a fund of Fidelity Securities Fund (the Trust) and is authorized to issue an unlimited number of shares. The Trust is registered under the Investment Company Act of 1940, as amended (the 1940 Act), as an open-end management investment company organized as a Massachusetts business trust. The Fund offers Class A, Class T, Class C, Real Estate Income and Class I (formerly Institutional Class) shares, each of which has equal rights as to assets and voting privileges. Each class has exclusive voting rights with respect to matters that affect that class.
2. Investments in Fidelity Central Funds.
The Fund invests in Fidelity Central Funds, which are open-end investment companies generally available only to other investment companies and accounts managed by the investment adviser and its affiliates. The Fund's Schedule of Investments lists each of the Fidelity Central Funds held as of period end, if any, as an investment of the Fund, but does not include the underlying holdings of each Fidelity Central Fund. As an Investing Fund, the Fund indirectly bears its proportionate share of the expenses of the underlying Fidelity Central Funds.
The Money Market Central Funds seek preservation of capital and current income and are managed by Fidelity Investments Money Management, Inc. (FIMM), an affiliate of the investment adviser. Annualized expenses of the Money Market Central Funds as of their most recent shareholder report date are less than .01%.
A complete unaudited list of holdings for each Fidelity Central Fund is available upon request or at the Securities and Exchange Commission (the SEC) website at www.sec.gov. In addition, the financial statements of the Fidelity Central Funds, which are not covered by the Fund's Report of Independent Registered Public Accounting Firm, are available on the SEC website or upon request.
3. Significant Accounting Policies.
The financial statements have been prepared in conformity with accounting principles generally accepted in the United States of America (GAAP), which require management to make certain estimates and assumptions at the date of the financial statements. Actual results could differ from those estimates. Subsequent events, if any, through the date that the financial statements were issued have been evaluated in the preparation of the financial statements. The following summarizes the significant accounting policies of the Fund:
Annual Report
Notes to Financial Statements - continued
3. Significant Accounting Policies - continued
Investment Valuation. Investments are valued as of 4:00 p.m. Eastern time on the last calendar day of the period. The Board of Trustees (the Board) has delegated the day to day responsibility for the valuation of the Fund's investments to the Fidelity Management & Research Company (FMR) Fair Value Committee (the Committee). In accordance with valuation policies and procedures approved by the Board, the Fund attempts to obtain prices from one or more third party pricing vendors or brokers to value its investments. When current market prices, quotations or currency exchange rates are not readily available or reliable, investments will be fair valued in good faith by the Committee, in accordance with procedures adopted by the Board. Factors used in determining fair value vary by investment type and may include market or investment specific events, changes in interest rates and credit quality. The frequency with which these procedures are used cannot be predicted and they may be utilized to a significant extent. The Committee oversees the Fund's valuation policies and procedures and reports to the Board on the Committee's activities and fair value determinations. The Board monitors the appropriateness of the procedures used in valuing the Fund's investments and ratifies the fair value determinations of the Committee.
The Fund categorizes the inputs to valuation techniques used to value its investments into a disclosure hierarchy consisting of three levels as shown below:
Level 1 - quoted prices in active markets for identical investments
Level 2 - other significant observable inputs (including quoted prices for similar investments, interest rates, prepayment speeds, etc.)
Level 3 - unobservable inputs (including the Fund's own assumptions based on the best information available)
Valuation techniques used to value the Fund's investments by major category are as follows:
Equity securities, including restricted securities, for which market quotations are readily available, are valued at the last reported sale price or official closing price as reported by a third party pricing vendor on the primary market or exchange on which they are traded and are categorized as Level 1 in the hierarchy. In the event there were no sales during the day or closing prices are not available, securities are valued at the last quoted bid price or may be valued using the last available price and are generally categorized as Level 2 in the hierarchy. For foreign equity securities, when market or security specific events arise, comparisons to the valuation of American Depositary Receipts (ADRs), futures contracts, Exchange-Traded Funds (ETFs) and certain indexes as well as quoted prices for similar securities may be used and would be categorized as Level 2 in the hierarchy. Utilizing these techniques may result in transfers between Level 1 and Level 2.
Annual Report
3. Significant Accounting Policies - continued
Investment Valuation - continued
For equity securities, including restricted securities, where observable inputs are limited, assumptions about market activity and risk are used and these securities may be categorized as Level 3 in the hierarchy.
Debt securities, including restricted securities, are valued based on evaluated prices received from third party pricing vendors or from brokers who make markets in such securities. Corporate bonds, bank loan obligations and preferred securities are valued by pricing vendors who utilize matrix pricing which considers yield or price of bonds of comparable quality, coupon, maturity and type or by broker-supplied prices. Asset backed securities, collateralized mortgage obligations and commercial mortgage securities are valued by pricing vendors who utilize matrix pricing which considers prepayment speed assumptions, attributes of the collateral, yield or price of bonds of comparable quality, coupon, maturity and type or by broker-supplied prices. When independent prices are unavailable or unreliable, debt securities may be valued utilizing pricing methodologies which consider similar factors that would be used by third party pricing vendors. Debt securities are generally categorized as Level 2 in the hierarchy but may be Level 3 depending on the circumstances.
Investments in open-end mutual funds, including the Fidelity Central Funds, are valued at their closing net asset value (NAV) each business day and are categorized as Level 1 in the hierarchy.
Changes in valuation techniques may result in transfers in or out of an assigned level within the disclosure hierarchy. The aggregate value of investments by input level as of July 31, 2015, as well as a roll forward of Level 3 investments, is included at the end of the Fund's Schedule of Investments.
Foreign Currency. The Fund may use foreign currency contracts to facilitate transactions in foreign-denominated securities. Gains and losses from these transactions may arise from changes in the value of the foreign currency or if the counterparties do not perform under the contracts' terms.
Foreign-denominated assets, including investment securities, and liabilities are translated into U.S. dollars at the exchange rates at period end. Purchases and sales of investment securities, income and dividends received and expenses denominated in foreign currencies are translated into U.S. dollars at the exchange rate in effect on the transaction date.
The effects of exchange rate fluctuations on investments are included with the net realized and unrealized gain (loss) on investment securities. Other foreign currency transactions resulting in realized and unrealized gain (loss) are disclosed separately.
Annual Report
Notes to Financial Statements - continued
3. Significant Accounting Policies - continued
Investment Transactions and Income. For financial reporting purposes, the Fund's investment holdings and NAV include trades executed through the end of the last business day of the period. The NAV per share for processing shareholder transactions is calculated as of the close of business of the New York Stock Exchange (NYSE), normally 4:00 p.m. Eastern time and includes trades executed through the end of the prior business day. Gains and losses on securities sold are determined on the basis of identified cost. Dividend income is recorded on the ex-dividend date, except for certain dividends from foreign securities where the ex-dividend date may have passed, which are recorded as soon as the Fund is informed of the ex-dividend date. Non-cash dividends included in dividend income, if any, are recorded at the fair market value of the securities received. Income and capital gain distributions from Fidelity Central Funds, if any, are recorded on the ex-dividend date. Distributions received on securities that represent a return of capital or capital gain are recorded as a reduction of cost of investments and/or as a realized gain. Subsequent to ex-dividend date the Fund determines the components of these distributions, based upon receipt of tax filings or other correspondence relating to the underlying investment. Interest income is accrued as earned and includes coupon interest and amortization of premium and accretion of discount on debt securities as applicable. For certain lower credit quality securitized assets that have contractual cash flows (for example, asset backed securities, collateralized mortgage obligations and commercial mortgage-backed securities), changes in estimated cash flows are periodically evaluated and the estimated yield is adjusted on a prospective basis, resulting in increases or decreases to Interest Income in the accompanying Statement of Operations. Investment income is recorded net of foreign taxes withheld where recovery of such taxes is uncertain. Debt obligations may be placed on non-accrual status and related interest income may be reduced by ceasing current accruals and writing off interest receivables when the collection of all or a portion of interest has become doubtful based on consistently applied procedures. A debt obligation is removed from non-accrual status when the issuer resumes interest payments or when collectability of interest is reasonably assured.
Class Allocations and Expenses. Investment income, realized and unrealized capital gains and losses, common expenses of the Fund, and certain fund-level expense reductions, if any, are allocated daily on a pro-rata basis to each class based on the relative net assets of each class to the total net assets of the Fund. Each class differs with respect to transfer agent and distribution and service plan fees incurred. Certain expense reductions may also differ by class. For the reporting period, the allocated portion of income and expenses to each class as a percent of its average net assets may vary due to the timing of recording these transactions in relation to fluctuating net assets of the classes. Expenses directly attributable to a fund are charged to that fund. Expenses attributable to more than one fund are allocated among the respective funds on the basis of relative
Annual Report
3. Significant Accounting Policies - continued
Class Allocations and Expenses - continued
net assets or other appropriate methods. Expense estimates are accrued in the period to which they relate and adjustments are made when actual amounts are known.
Income Tax Information and Distributions to Shareholders. Each year, the Fund intends to qualify as a regulated investment company under Subchapter M of the Internal Revenue Code, including distributing substantially all of its taxable income and realized gains. As a result, no provision for U.S. Federal income taxes is required. As of July 31, 2015, the Fund did not have any unrecognized tax benefits in the financial statements; nor is the Fund aware of any tax positions for which it is reasonably possible that the total amounts of unrecognized tax benefits will significantly change in the next twelve months. The Fund files a U.S. federal tax return, in addition to state and local tax returns as required. The Fund's federal income tax returns are subject to examination by the Internal Revenue Service (IRS) for a period of three fiscal years after they are filed. State and local tax returns may be subject to examination for an additional fiscal year depending on the jurisdiction. Foreign taxes are provided for based on the Fund's understanding of the tax rules and rates that exist in the foreign markets in which it invests.
Distributions are declared and recorded on the ex-dividend date. Income dividends and capital gain distributions are declared separately for each class. Income and capital gain distributions are determined in accordance with income tax regulations, which may differ from GAAP. In addition, the Fund claimed a portion of the payment made to redeeming shareholders as a distribution for income tax purposes.
Capital accounts within the financial statements are adjusted for permanent book-tax differences. These adjustments have no impact on net assets or the results of operations. Capital accounts are not adjusted for temporary book-tax differences which will reverse in a subsequent period.
Book-tax differences are primarily due to foreign currency transactions, passive foreign investment companies (PFIC), market discount, equity-debt classifications, certain conversion ratio adjustments, partnerships and losses deferred due to wash sales.
The federal tax cost of investment securities and unrealized appreciation (depreciation) as of period end were as follows:
Gross unrealized appreciation | $ 367,906,812 |
Gross unrealized depreciation | (153,634,526) |
Net unrealized appreciation (depreciation) on securities | $ 214,272,286 |
| |
Tax Cost | $ 4,045,089,670 |
Annual Report
Notes to Financial Statements - continued
3. Significant Accounting Policies - continued
Income Tax Information and Distributions to Shareholders - continued
The tax-based components of distributable earnings as of period end were as follows:
Undistributed ordinary income | $ 36,563,408 |
Undistributed long-term capital gain | $ 36,541,226 |
Net unrealized appreciation (depreciation) on securities and other investments | $ 214,202,306 |
The tax character of distributions paid was as follows:
| July 31, 2015 | July 31, 2014 |
Ordinary Income | $ 202,287,403 | $ 185,363,562 |
Long-term Capital Gains | 72,842,487 | 65,088,933 |
Total | $ 275,129,890 | $ 250,452,495 |
Short-Term Trading (Redemption) Fees. Shares held by investors in the Fund less than 90 days may have been subject to a redemption fee equal to .75% of the NAV of shares redeemed. All redemption fees, which reduce the proceeds of the shareholder redemption, are retained by the Fund and accounted for as an addition to paid in capital.
Restricted Securities. The Fund may invest in securities that are subject to legal or contractual restrictions on resale. These securities generally may be resold in transactions exempt from registration or to the public if the securities are registered. Disposal of these securities may involve time-consuming negotiations and expense, and prompt sale at an acceptable price may be difficult. Information regarding restricted securities is included at the end of the Fund's Schedule of Investments.
Loans and Other Direct Debt Instruments. The Fund invests in direct debt instruments which are interests in amounts owed to lenders by corporate or other borrowers. These instruments may be in the form of loans, trade claims or other receivables and may include standby financing commitments such as revolving credit facilities that obligate the Fund to supply additional cash to the borrower on demand. Loans may be acquired through assignment or participation. The Fund did not have any unfunded loan commitments, which are contractual obligations for future funding, at period end.
4. Purchases and Sales of Investments.
Purchases and sales of securities, other than short-term securities and U.S. government securities, aggregated $987,134,266 and $778,719,087, respectively
Annual Report
5. Fees and Other Transactions with Affiliates.
Management Fee. Fidelity Management & Research Company (the investment adviser) and its affiliates provide the Fund with investment management related services for which the Fund pays a monthly management fee. The management fee is the sum of an individual fund fee rate that is based on an annual rate of .30% of the Fund's average net assets and an annualized group fee rate that averaged .25% during the period. The group fee rate is based upon the average net assets of all the mutual funds advised by the investment adviser, including any mutual funds previously advised by the investment adviser that are currently advised by Fidelity SelectCo, LLC, an affiliate of the investment adviser. The group fee rate decreases as assets under management increase and increases as assets under management decrease. For the reporting period, the total annual management fee rate was .55% of the Fund's average net assets.
Distribution and Service Plan Fees. In accordance with Rule 12b-1 of the 1940 Act, the Fund has adopted separate Distribution and Service Plans for each class of shares. Certain classes pay Fidelity Distributors Corporation (FDC), an affiliate of the investment adviser, separate Distribution and Service Fees, each of which is based on an annual percentage of each class' average net assets. In addition, FDC may pay financial intermediaries for selling shares of the Fund and providing shareholder support services.
For the period, the Distribution and Service Fee rates, total fees and amounts retained by FDC were as follows:
| Distribution
Fee | Service
Fee | Total Fees | Retained
by FDC |
Class A | -% | .25% | $ 1,204,578 | $ 56,339 |
Class T | -% | .25% | 133,672 | - |
Class C | .75% | .25% | 2,800,625 | 887,952 |
| | | $ 4,138,875 | $ 944,291 |
Sales Load. FDC may receive a front-end sales charge of up to 4.00% for selling Class A shares and Class T shares, some of which is paid to financial intermediaries for selling shares of the Fund. Depending on the holding period, FDC may receive contingent deferred sales charges levied on Class A, Class T, and Class C redemptions. The deferred sales charges are 1.00% for Class C shares, 1.00% for certain purchases of Class A shares and .25% for certain purchases of Class T shares.
Annual Report
Notes to Financial Statements - continued
5. Fees and Other Transactions with Affiliates - continued
Sales Load - continued
For the period, sales charge amounts retained by FDC were as follows:
| Retained
by FDC |
Class A | $ 68,997 |
Class T | 10,961 |
Class C* | 50,856 |
| $ 130,814 |
* When Class C shares are initially sold, FDC pays commissions from its own resources to financial intermediaries through which the sales are made.
Transfer Agent Fees. Fidelity Investments Institutional Operations Company, Inc., (FIIOC), an affiliate of the investment adviser, is the transfer, dividend disbursing and shareholder servicing agent for each class of the Fund. FIIOC receives account fees and asset-based fees that vary according to the account size and type of account of the shareholders of the respective classes of the Fund. FIIOC pays for typesetting, printing and mailing of shareholder reports, except proxy statements.
For the period, transfer agent fees for each class were as follows:
| Amount | % of
Class-Level Average
Net Assets |
Class A | $ 941,488 | .20 |
Class T | 118,992 | .22 |
Class C | 543,999 | .19 |
Real Estate Income | 6,234,517 | .23 |
Class I | 1,707,103 | .18 |
| $ 9,546,099 | |
Accounting and Security Lending Fees. Fidelity Service Company, Inc. (FSC), an affiliate of the investment adviser, maintains the Fund's accounting records. The accounting fee is based on the level of average net assets for each month. Under a separate contract, FSC administers the security lending program. The security lending fee is based on the number and duration of lending transactions.
Brokerage Commissions. The Fund placed a portion of its portfolio transactions with brokerage firms which are affiliates of the investment adviser. Brokerage commissions are included in net realized gain (loss) and change in net unrealized appreciation (depreciation) in the Statement of Operations. The commissions paid to these affiliated firms were $10,347 for the period.
Annual Report
6. Committed Line of Credit.
The Fund participates with other funds managed by the investment adviser or an affiliate in a $4.25 billion credit facility (the "line of credit") to be utilized for temporary or emergency purposes to fund shareholder redemptions or for other short-term liquidity purposes. The Fund has agreed to pay commitment fees on its pro-rata portion of the line of credit, which amounted to $6,409 and is reflected in Miscellaneous expenses on the Statement of Operations. During the period, the Fund did not borrow on this line of credit.
7. Security Lending.
The Fund lends portfolio securities through a lending agent from time to time in order to earn additional income. For equity securities, a lending agent is used and may loan securities to certain qualified borrowers, including Fidelity Capital Markets (FCM), a broker-dealer affiliated with the Fund. On the settlement date of the loan, the Fund receives collateral (in the form of U.S. Treasury obligations, letters of credit and/or cash) against the loaned securities and maintains collateral in an amount not less than 100% of the market value of the loaned securities during the period of the loan. The market value of the loaned securities is determined at the close of business of the Fund and any additional required collateral is delivered to the Fund on the next business day. If the borrower defaults on its obligation to return the securities loaned because of insolvency or other reasons, the Fund may apply collateral received from the borrower against the obligation. The Fund may experience delays and costs in recovering the securities loaned. Any cash collateral received is invested in the Fidelity Securities Lending Cash Central Fund. The value of loaned securities and cash collateral at period end are disclosed on the Fund's Statement of Assets and Liabilities. Security lending income represents the income earned on investing cash collateral, less rebates paid to borrowers and any lending agent fees associated with the loan, plus any premium payments received for lending certain types of securities. Security lending income is presented in the Statement of Operations as a component of income from Fidelity Central Funds. Total security lending income during the period amounted to $31,537. During the period, there were no securities loaned to FCM.
8. Expense Reductions.
Commissions paid to certain brokers with whom the investment adviser, or its affiliates, places trades on behalf of the Fund include an amount in addition to trade execution, which may be rebated back to the Fund to offset certain expenses. This amount totaled $22,713 for the period. In addition, through arrangements with the Fund's custodian, credits realized as a result of uninvested cash balances were used to reduce the Fund's expenses. During the period, these credits reduced the Fund's custody expenses by $2,498.
Annual Report
Notes to Financial Statements - continued
8. Expense Reductions - continued
In addition, during the period the investment adviser reimbursed/waived a portion of fund-level operating expenses in the amount of $17,421 and a portion of class-level operating expenses as follows:
| Amount |
Class A | $ 9,323 |
Class T | 1,074 |
Class C | 5,166 |
Real Estate Income | 66,942 |
Class I | 16,564 |
| $ 99,069 |
9. Distributions to Shareholders.
Distributions to shareholders of each class were as follows:
Years ended July 31, | 2015 | 2014 |
From net investment income | | |
Class A | $ 21,010,715 | $ 16,638,771 |
Class T | 2,305,119 | 1,842,576 |
Class C | 10,465,476 | 7,530,932 |
Real Estate Income | 122,206,251 | 117,401,887 |
Class I | 43,464,765 | 28,741,085 |
Total | $ 199,452,326 | $ 172,155,251 |
From net realized gain | | |
Class A | $ 7,958,848 | $ 7,591,572 |
Class T | 875,220 | 874,881 |
Class C | 4,645,932 | 4,152,718 |
Real Estate Income | 46,720,433 | 53,508,422 |
Class I | 15,477,131 | 12,169,651 |
Total | $ 75,677,564 | $ 78,297,244 |
10. Share Transactions.
Share transactions for each class were as follows and may contain automatic conversions between classes or exchanges between funds:
| Shares | Dollars |
Years ended July 31, | 2015 | 2014 | 2015 | 2014 |
Class A | | | | |
Shares sold | 17,614,783 | 18,815,698 | $ 207,492,435 | $ 217,399,754 |
Reinvestment of distributions | 2,253,682 | 1,805,230 | 26,209,333 | 20,178,624 |
Shares redeemed | (14,664,043) | (15,738,034) | (171,937,484) | (180,458,692) |
Net increase (decrease) | 5,204,422 | 4,882,894 | $ 61,764,284 | $ 57,119,686 |
Annual Report
10. Share Transactions - continued
| Shares | Dollars |
Years ended July 31, | 2015 | 2014 | 2015 | 2014 |
Class T | | | | |
Shares sold | 1,551,308 | 1,270,924 | $ 18,286,948 | $ 14,645,845 |
Reinvestment of distributions | 251,652 | 211,146 | 2,927,374 | 2,357,016 |
Shares redeemed | (1,110,729) | (1,380,258) | (13,074,996) | (15,703,373) |
Net increase (decrease) | 692,231 | 101,812 | $ 8,139,326 | $ 1,299,488 |
Class C | | | | |
Shares sold | 7,875,459 | 9,015,535 | $ 92,082,413 | $ 103,482,191 |
Reinvestment of distributions | 1,105,279 | 813,525 | 12,763,694 | 9,012,478 |
Shares redeemed | (4,690,719) | (6,508,928) | (54,577,835) | (73,908,752) |
Net increase (decrease) | 4,290,019 | 3,320,132 | $ 50,268,272 | $ 38,585,917 |
Real Estate Income | | | | |
Shares sold | 51,184,144 | 61,717,695 | $ 605,520,317 | $ 711,894,953 |
Reinvestment of distributions | 12,742,585 | 13,609,464 | 148,826,128 | 152,306,330 |
Shares redeemed | (65,882,524) | (100,931,769) | (777,479,294) | (1,156,054,958) |
Net increase (decrease) | (1,955,795) | (25,604,610) | $ (23,132,849) | $ (291,853,675) |
Class I | | | | |
Shares sold | 38,671,974 | 40,192,476 | $ 455,469,590 | $ 465,679,843 |
Reinvestment of distributions | 3,704,065 | 2,412,058 | 43,129,998 | 27,006,597 |
Shares redeemed | (32,342,580) | (26,626,486) | (380,445,460) | (303,889,493) |
Net increase (decrease) | 10,033,459 | 15,978,048 | $ 118,154,128 | $ 188,796,947 |
11. Other.
The Fund's organizational documents provide former and current trustees and officers with a limited indemnification against liabilities arising in connection with the performance of their duties to the Fund. In the normal course of business, the Fund may also enter into contracts that provide general indemnifications. The Fund's maximum exposure under these arrangements is unknown as this would be dependent on future claims that may be made against the Fund. The risk of material loss from such claims is considered remote.
Annual Report
To the Trustees of Fidelity Securities Fund and Shareholders of Fidelity Real Estate Income Fund:
We have audited the accompanying statement of assets and liabilities of Fidelity Real Estate Income Fund (the Fund), a fund of Fidelity Securities Fund, including the schedule of investments, as of July 31, 2015, and the related statement of operations for the year then ended, the statement of changes in net assets for each of the two years in the period then ended, and the financial highlights for each of the five years in the period then ended. These financial statements and financial highlights are the responsibility of the Fund's management. Our responsibility is to express an opinion on these financial statements and financial highlights based on our audits.
We conducted our audits in accordance with the standards of the Public Company Accounting Oversight Board (United States). Those standards require that we plan and perform the audit to obtain reasonable assurance about whether the financial statements and financial highlights are free of material misstatement. The Fund is not required to have, nor were we engaged to perform, an audit of its internal control over financial reporting. Our audits included consideration of internal control over financial reporting as a basis for designing audit procedures that are appropriate in the circumstances, but not for the purpose of expressing an opinion on the effectiveness of the Fund's internal control over financial reporting. Accordingly, we express no such opinion. An audit also includes examining, on a test basis, evidence supporting the amounts and disclosures in the financial statements, assessing the accounting principles used and significant estimates made by management, as well as evaluating the overall financial statement presentation. Our procedures included confirmation of securities owned as of July 31, 2015, by correspondence with the custodians, agent banks and brokers; when replies were not received from brokers, we performed other auditing procedures. We believe that our audits provide a reasonable basis for our opinion.
In our opinion, such financial statements and financial highlights referred to above present fairly, in all material respects, the financial position of Fidelity Real Estate Income Fund as of July 31, 2015, the results of its operations for the year then ended, the changes in its net assets for each of the two years in the period then ended, and the financial highlights for each of the five years in the period then ended, in conformity with accounting principles generally accepted in the United States of America.
DELOITTE & TOUCHE LLP
Boston, Massachusetts
September 24, 2015
Annual Report
The Trustees, Member of the Advisory Board, and officers of the trust and fund, as applicable, are listed below. The Board of Trustees governs the fund and is responsible for protecting the interests of shareholders. The Trustees are experienced executives who meet periodically throughout the year to oversee the fund's activities, review contractual arrangements with companies that provide services to the fund, oversee management of the risks associated with such activities and contractual arrangements, and review the fund's performance. Each of the Trustees oversees 170 funds.
The Trustees hold office without limit in time except that (a) any Trustee may resign; (b) any Trustee may be removed by written instrument, signed by at least two-thirds of the number of Trustees prior to such removal; (c) any Trustee who requests to be retired or who has become incapacitated by illness or injury may be retired by written instrument signed by a majority of the other Trustees; and (d) any Trustee may be removed at any special meeting of shareholders by a two-thirds vote of the outstanding voting securities of the trust. Each Trustee who is not an interested person (as defined in the 1940 Act) of the trust and the fund (Independent Trustee), shall retire not later than the last day of the calendar year in which his or her 75th birthday occurs. The Independent Trustees may waive this mandatory retirement age policy with respect to individual Trustees. The officers and Advisory Board Member hold office without limit in time, except that any officer and Advisory Board Member may resign or may be removed by a vote of a majority of the Trustees at any regular meeting or any special meeting of the Trustees. Except as indicated, each individual has held the office shown or other offices in the same company for the past five years.
Experience, Skills, Attributes, and Qualifications of the Fund's Trustees. The Governance and Nominating Committee has adopted a statement of policy that describes the experience, qualifications, attributes, and skills that are necessary and desirable for potential Independent Trustee candidates (Statement of Policy). The Board believes that each Trustee satisfied at the time he or she was initially elected or appointed a Trustee, and continues to satisfy, the standards contemplated by the Statement of Policy. The Governance and Nominating Committee also engages professional search firms to help identify potential Independent Trustee candidates who have the experience, qualifications, attributes, and skills consistent with the Statement of Policy. From time to time, additional criteria based on the composition and skills of the current Independent Trustees, as well as experience or skills that may be appropriate in light of future changes to board composition, business conditions, and regulatory or other developments, have also been considered by the professional search firms and the Governance and Nominating Committee. In addition, the Board takes into account the Trustees' commitment and participation in Board and committee meetings, as well as their leadership of standing and ad hoc committees throughout their tenure.
In determining that a particular Trustee was and continues to be qualified to serve as a Trustee, the Board has considered a variety of criteria, none of which, in isolation, was controlling. The Board believes that, collectively, the Trustees have balanced and diverse experience, qualifications, attributes, and skills, which allow the Board to operate effectively in governing the fund and protecting the interests of shareholders. Information about the specific experience, skills, attributes, and qualifications of each Trustee, which in each case led to the Board's conclusion that the Trustee should serve (or continue to serve) as a trustee of the fund, is provided below.
Annual Report
Trustees and Officers - continued
Board Structure and Oversight Function. James C. Curvey is an interested person (as defined in the 1940 Act) and currently serves as Chairman. The Trustees have determined that an interested Chairman is appropriate and benefits shareholders because an interested Chairman has a personal and professional stake in the quality and continuity of services provided to the fund. Independent Trustees exercise their informed business judgment to appoint an individual of their choosing to serve as Chairman, regardless of whether the Trustee happens to be independent or a member of management. The Independent Trustees have determined that they can act independently and effectively without having an Independent Trustee serve as Chairman and that a key structural component for assuring that they are in a position to do so is for the Independent Trustees to constitute a substantial majority for the Board. The Independent Trustees also regularly meet in executive session. Ned C. Lautenbach serves as Chairman of the Independent Trustees and as such (i) acts as a liaison between the Independent Trustees and management with respect to matters important to the Independent Trustees and (ii) with management prepares agendas for Board meetings.
Fidelity funds are overseen by different Boards of Trustees. The fund's Board oversees Fidelity's high income and certain equity funds and other Boards oversee Fidelity's investment-grade bond, money market, asset allocation, and sector funds. The asset allocation funds may invest in Fidelity funds overseen by the fund's Board. The use of separate Boards, each with its own committee structure, allows the Trustees of each group of Fidelity funds to focus on the unique issues of the funds they oversee, including common research, investment, and operational issues. On occasion, the separate Boards establish joint committees to address issues of overlapping consequences for the Fidelity funds overseen by each Board.
The Trustees operate using a system of committees to facilitate the timely and efficient consideration of all matters of importance to the Trustees, the fund, and fund shareholders and to facilitate compliance with legal and regulatory requirements and oversight of the fund's activities and associated risks. The Board, acting through its committees, has charged FMR and its affiliates with (i) identifying events or circumstances the occurrence of which could have demonstrably adverse effects on the fund's business and/or reputation; (ii) implementing processes and controls to lessen the possibility that such events or circumstances occur or to mitigate the effects of such events or circumstances if they do occur; and (iii) creating and maintaining a system designed to evaluate continuously business and market conditions in order to facilitate the identification and implementation processes described in (i) and (ii) above. Because the day-to-day operations and activities of the fund are carried out by or through FMR, its affiliates and other service providers, the fund's exposure to risks is mitigated but not eliminated by the processes overseen by the Trustees. While each of the Board's committees has responsibility for overseeing different aspects of the fund's activities, oversight is exercised primarily through the Operations, Audit, and Compliance Committees. In addition, the Independent Trustees have worked with FMR to enhance the Board's oversight of investment and financial risks, legal and regulatory risks, technology risks, and operational risks, including the development of additional risk reporting to the Board. For example, a working group comprised of Independent Trustees and FMR has worked and continues to work to review the Fidelity funds' valuation-related activities, reporting and risk management. Appropriate personnel, including but not limited to the fund's Chief Compliance Officer (CCO), FMR's internal auditor, the independent accountants, the fund's Treasurer and portfolio management personnel, make periodic reports to the Board's committees, as appropriate, including an annual review of FMR's risk management program for the Fidelity funds. The responsibilities of each standing committee, including their oversight responsibilities, are described further under "Standing Committees of the Fund's Trustees."
Annual Report
The fund's Statement of Additional Information (SAI) includes more information about the Trustees. To request a free copy, call Fidelity at 1-800-544-8544.
Interested Trustees*:
Correspondence intended for each Trustee who is an interested person may be sent to Fidelity Investments, 245 Summer Street, Boston, Massachusetts 02210.
Name, Year of Birth; Principal Occupations and Other Relevant Experience+ |
James C. Curvey (1935) |
Year of Election or Appointment: 2007 Trustee Chairman of the Board of Trustees |
| Mr. Curvey also serves as Trustee of other Fidelity funds. Mr. Curvey is a Director of Fidelity Research & Analysis Co. (investment adviser firm, 2009-present), and Vice Chairman (2007-present) and Director of FMR LLC (diversified financial services company). In addition, Mr. Curvey serves as an Overseer for the Boston Symphony Orchestra and a member of the board of Artis-Naples, Naples, Florida, and as a Trustee for Brewster Academy, Wolfeboro, New Hampshire. Previously, Mr. Curvey served as a Director of Fidelity Investments Money Management, Inc. (investment adviser firm, 2009-2014), a Director of FMR (investment adviser firm, 2007-2014), and a Director of FMR Co., Inc. (investment adviser firm, 2007-2014). |
Charles S. Morrison (1960) |
Year of Election or Appointment: 2014 Trustee |
| Mr. Morrison also serves as Trustee of other funds. He serves as a Director of Fidelity Investments Money Management, Inc. (FIMM) (investment adviser firm, 2014-present), Director of Fidelity SelectCo, LLC (investment adviser firm, 2014-present), President, Asset Management (2014-present), and is an employee of Fidelity Investments. Previously, Mr. Morrison served as Vice President of Fidelity's Fixed Income and Asset Allocation Funds (2012-2014), President, Fixed Income (2011-2014), Vice President of Fidelity's Money Market Funds (2005-2009), President, Money Market Group Leader of FMR (investment adviser firm, 2009), and Senior Vice President, Money Market Group of FMR (2004-2009). Mr. Morrison also served as Vice President of Fidelity's Bond Funds (2002-2005), certain Balanced Funds (2002-2005), and certain Asset Allocation Funds (2002-2007), and as Senior Vice President (2002-2005) of Fidelity's Bond Division. |
* Trustees have been determined to be "Interested Trustees" by virtue of, among other things, their affiliation with the trust or various entities under common control with FMR.
+ The information above includes each Trustee's principal occupation during the last five years and other information relating to the experience, attributes, and skills relevant to each Trustee's qualifications to serve as a Trustee, which led to the conclusion that each Trustee should serve as a Trustee for the fund.
Annual Report
Independent Trustees:
Correspondence intended for each Independent Trustee (that is, the Trustees other than the Interested Trustees) may be sent to Fidelity Investments, P.O. Box 55235, Boston, Massachusetts 02205-5235.
Name, Year of Birth; Principal Occupations and Other Relevant Experience+ |
Dennis J. Dirks (1948) |
Year of Election or Appointment: 2005 Trustee |
| Mr. Dirks also serves as Trustee of other Fidelity funds. Prior to his retirement in May 2003, Mr. Dirks was Chief Operating Officer and a member of the Board of The Depository Trust & Clearing Corporation (DTCC). He also served as President, Chief Operating Officer, and Board member of The Depository Trust Company (DTC) and President and Board member of the National Securities Clearing Corporation (NSCC). In addition, Mr. Dirks served as Chief Executive Officer and Board member of the Government Securities Clearing Corporation, Chief Executive Officer and Board member of the Mortgage-Backed Securities Clearing Corporation, as a Trustee and a member of the Finance Committee of Manhattan College (2005-2008), and as a Trustee and a member of the Finance Committee of AHRC of Nassau County (2006-2008). Mr. Dirks is a member of the Independent Directors Council (IDC) Governing Council (2010-present) and Board of Directors for The Brookville Center for Children's Services, Inc. (2009-present). |
Alan J. Lacy (1953) |
Year of Election or Appointment: 2008 Trustee |
| Mr. Lacy also serves as Trustee of other Fidelity funds. Mr. Lacy serves as a member of the Board of Directors of Dave & Buster's Entertainment, Inc. (restaurant and entertainment complexes, 2010-present) and Bristol-Myers Squibb Company (global pharmaceuticals, 2008-present). In addition, Mr. Lacy served as Senior Adviser (2007-2014) of Oak Hill Capital Partners, L.P. (private equity) and also served as Chief Executive Officer (2000-2005) and Vice Chairman (2005-2006) of Sears Holdings Corporation and Sears, Roebuck and Co. (retail). Mr. Lacy is a member of the Board of Trustees of The National Parks Conservation Association (2006-present). Previously, Mr. Lacy served as Chairman of the Board of Trustees of the National Parks Conservation Association (2008-2011) and as a member of the Board of Directors for The Western Union Company (global money transfer, 2006-2011), The Hillman Companies, Inc. (hardware wholesalers, 2010-2014), and Earth Fare, Inc. (retail grocery, 2010-2014). |
Ned C. Lautenbach (1944) |
Year of Election or Appointment: 2000 Trustee Chairman of the Independent Trustees |
| Mr. Lautenbach also serves as Trustee of other Fidelity funds. Mr. Lautenbach currently serves as the Lead Director of the Eaton Corporation Board of Directors (diversified industrial, 1997-present). Mr. Lautenbach is Chairman of the Board of Directors of Artis-Naples in Naples, Florida (2012-present), a member of the Council on Foreign Relations (1994-present), and a member of the Board of Governors, State University System of Florida (2013-present). Previously, Mr. Lautenbach was a Partner/Advisory Partner at Clayton, Dubilier & Rice, LLC (private equity investment, 1998-2010), as well as a Director of Sony Corporation (2006-2007). |
Joseph Mauriello (1944) |
Year of Election or Appointment: 2008 Trustee |
| Mr. Mauriello also serves as Trustee of other Fidelity funds. Prior to his retirement in January 2006, Mr. Mauriello served in numerous senior management positions including Deputy Chairman and Chief Operating Officer (2004-2005), and Vice Chairman of Financial Services (2002-2004) of KPMG LLP US (professional services, 1965-2005). Mr. Mauriello currently serves as a member of the Board of Directors of XL Group plc. (global insurance and re-insurance, 2006-present). Previously, Mr. Mauriello served as a Director of the Hamilton Funds of the Bank of New York (2006-2007) and of Arcadia Resources Inc. (health care services and products, 2007-2012). |
Robert W. Selander (1950) |
Year of Election or Appointment: 2011 Trustee |
| Mr. Selander also serves as Trustee of other Fidelity funds. Mr. Selander serves as a Director of The Western Union Company (global money transfer, 2014-present). Previously, Mr. Selander served as a Member of the Advisory Board of other Fidelity funds (2011), and Executive Vice Chairman (2010), Chief Executive Officer (2009-2010), and President and Chief Executive Officer (1997-2009) of Mastercard, Inc. |
Cornelia M. Small (1944) |
Year of Election or Appointment: 2005 Trustee |
| Ms. Small also serves as Trustee of other Fidelity funds. Ms. Small is a member of the Board of Directors (2009-present) and Chair of the Investment Committee (2010-present) of the Teagle Foundation. Ms. Small also serves on the Investment Committee of the Berkshire Taconic Community Foundation (2008-present). Previously, Ms. Small served as Chairperson (2002-2008) and a member of the Investment Committee and Chairperson (2008-2012) and a member of the Board of Trustees of Smith College. In addition, Ms. Small served as Chief Investment Officer, Director of Global Equity Investments, and a member of the Board of Directors of Scudder, Stevens & Clark and Scudder Kemper Investments. |
William S. Stavropoulos (1939) |
Year of Election or Appointment: 2002 Trustee Vice Chairman of the Independent Trustees |
| Mr. Stavropoulos also serves as Trustee of other Fidelity funds. Mr. Stavropoulos serves as President and Founder of the Michigan Baseball Foundation, the Great Lakes Loons (2007-present). Mr. Stavropoulos is Chairman Emeritus of the Board of Directors of The Dow Chemical Company, where he previously served in numerous senior management positions, including President, CEO (1995-2000; 2002-2004), Chairman of the Executive Committee (2000-2006), and as a member of the Board of Directors (1990-2006). Currently, Mr. Stavropoulos is Chairman of the Board of Directors of Univar Inc. (global distributor of commodity and specialty chemicals), a Director of Teradata Corporation (data warehousing and technology solutions), and Maersk Inc. (industrial conglomerate), and a member of the Advisory Board for Metalmark Capital LLC (private equity investment, 2005-present). Mr. Stavropoulos is an operating advisor to Clayton, Dubilier & Rice, LLC (private equity investment). In addition, Mr. Stavropoulos is a member of the University of Notre Dame Advisory Council for the College of Science, a Trustee of the Rollin L. Gerstacker Foundation, and a Director of the Naples Philharmonic Center for the Arts. Previously, Mr. Stavropoulos served as a Director of Chemical Financial Corporation (bank holding company, 1993-2012) and Tyco International, Ltd. (multinational manufacturing and services, 2007-2012). |
David M. Thomas (1949) |
Year of Election or Appointment: 2008 Trustee |
| Mr. Thomas also serves as Trustee of other Fidelity funds. Mr. Thomas serves as Non-Executive Chairman of the Board of Directors of Fortune Brands Home and Security (home and security products, 2011-present), as a member of the Board of Directors (2004-present) and Presiding Director (2013-present) of Interpublic Group of Companies, Inc. (marketing communication), and as a member of the Board of Trustees of the University of Florida (2013-present). Previously, Mr. Thomas served as Executive Chairman (2005-2006) and Chairman and Chief Executive Officer (2000-2005) of IMS Health, Inc. (pharmaceutical and healthcare information solutions), and a Director of Fortune Brands, Inc. (consumer products, 2000-2011). |
+ The information above includes each Trustee's principal occupation during the last five years and other information relating to the experience, attributes, and skills relevant to each Trustee's qualifications to serve as a Trustee, which led to the conclusion that each Trustee should serve as a Trustee for the fund.
Advisory Board Member and Officers:
Correspondence intended for each officer and Peter S. Lynch may be sent to Fidelity Investments, 245 Summer Street, Boston, Massachusetts 02210. Officers appear below in alphabetical order.
Name, Year of Birth; Principal Occupation |
Peter S. Lynch (1944) |
Year of Election or Appointment: 2003 Member of the Advisory Board |
| Mr. Lynch also serves as Member of the Advisory Board of other Fidelity funds. Mr. Lynch is Vice Chairman and a Director of FMR (investment adviser firm) and FMR Co., Inc. (investment adviser firm). In addition, Mr. Lynch serves as a Trustee of Boston College and as the Chairman of the Inner-City Scholarship Fund. Previously, Mr. Lynch served on the Special Olympics International Board of Directors (1997-2006). |
Christopher S. Bartel (1971) |
Year of Election or Appointment: 2009 Vice President |
| Mr. Bartel also serves as Vice President of other funds. Mr. Bartel serves as a Director, President, and Chief Executive Officer of Fidelity Management & Research (Japan) Limited (investment adviser firm, 2012-present), a Director of Fidelity Management & Research (Hong Kong) (investment adviser firm, 2012-present), and Senior Vice President of Global Equity Research (2010-present). Previously, Mr. Bartel served as Senior Vice President of Equity Research (2009-2010), Managing Director of Research (2006-2009), and an analyst and portfolio manager (2000-2006). |
Elizabeth Paige Baumann (1968) |
Year of Election or Appointment: 2012 Anti-Money Laundering (AML) Officer |
| Ms. Baumann also serves as AML Officer of other funds. She is Chief AML Officer of FMR LLC (diversified financial services company, 2012-present) and is an employee of Fidelity Investments. Previously, Ms. Baumann served as Vice President and Deputy Anti-Money Laundering Officer (2007-2012). |
Marc Bryant (1966) |
Year of Election or Appointment: 2015 Secretary and Chief Legal Officer (CLO) |
| Mr. Bryant also serves as Secretary and Chief Legal Officer (CLO) of other funds. He is Senior Vice President and Deputy General Counsel of FMR LLC (diversified financial services company). Previously, Mr. Bryant served as Secretary and Chief Legal Officer of Fidelity Rutland Square Trust II (2010-2014) and Assistant Secretary of Fidelity's Fixed Income and Asset Allocation Funds (2013-2015). Prior to joining Fidelity Investments, Mr. Bryant served as a Senior Vice President and the Head of Global Retail Legal for AllianceBernstein L.P. (2006-2010), and as the General Counsel for ProFund Advisors LLC (2001-2006). |
William C. Coffey (1969) |
Year of Election or Appointment: 2009 Assistant Secretary |
| Mr. Coffey also serves as Assistant Secretary of other funds. He is Senior Vice President and Deputy General Counsel of FMR LLC (diversified financial services company, 2010-present), and is an employee of Fidelity Investments. Previously, Mr. Coffey served as Vice President and Associate General Counsel of FMR LLC (2005-2009). |
Jonathan Davis (1968) |
Year of Election or Appointment: 2010 Assistant Treasurer |
| Mr. Davis also serves as Assistant Treasurer of other funds. Mr. Davis is an employee of Fidelity Investments. Previously, Mr. Davis served as Vice President and Associate General Counsel of FMR LLC (diversified financial services company, 2003-2010). |
Adrien E. Deberghes (1967) |
Year of Election or Appointment: 2008 Deputy Treasurer |
| Mr. Deberghes also serves as an officer of other funds. He is an employee of Fidelity Investments (2008-present). Prior to joining Fidelity Investments, Mr. Deberghes was Senior Vice President of Mutual Fund Administration at State Street Corporation (2007-2008), Senior Director of Mutual Fund Administration at Investors Bank & Trust (2005-2007), and Director of Finance for Dunkin' Brands (2000-2005). |
Stephanie J. Dorsey (1969) |
Year of Election or Appointment: 2010 Assistant Treasurer |
| Ms. Dorsey also serves as an officer of other funds. She is an employee of Fidelity Investments (2008-present) and has served in other fund officer roles. Prior to joining Fidelity Investments, Ms. Dorsey served as Treasurer (2004-2008) of the JPMorgan Mutual Funds and Vice President (2004-2008) of JPMorgan Chase Bank. |
Howard J. Galligan III (1966) |
Year of Election or Appointment: 2014 Chief Financial Officer |
| Mr. Galligan also serves as Chief Financial Officer of other funds. Mr. Galligan serves as President of Fidelity Pricing and Cash Management Services (FPCMS) (2014-present) and as a Director of Strategic Advisers, Inc. (investment adviser firm, 2008-present). Previously, Mr. Galligan served as Chief Administrative Officer of Asset Management (2011-2014) and Chief Operating Officer and Senior Vice President of Investment Support for Strategic Advisers, Inc. (2003-2011). |
Scott C. Goebel (1968) |
Year of Election or Appointment: 2015 Vice President |
| Mr. Goebel serves as an officer of other funds. Mr. Goebel also serves as Secretary of Fidelity SelectCo, LLC (investment adviser firm, 2013-present), Fidelity Investments Money Management, Inc. (FIMM) (investment adviser firm, 2010-present) and Fidelity Research and Analysis Company (FRAC) (investment adviser firm, 2010-present); General Counsel, Secretary, and Senior Vice President of FMR (investment adviser firm, 2008-present) and FMR Co., Inc. (investment adviser firm, 2008-present); Chief Legal Officer of Fidelity Management & Research (Hong Kong) Limited (investment adviser firm, 2008-present); and Assistant Secretary of Fidelity Management & Research (Japan) Limited (investment adviser firm, 2008-present) and FMR Investment Management (U.K.) Limited (investment adviser firm, 2008-present). Previously, Mr. Goebel served as Secretary and CLO of certain Fidelity funds (2008-2015), Assistant Secretary of FIMM (2008-2010), FRAC (2008-2010), and certain funds (2007-2008); and as Vice President and Secretary of Fidelity Distributors Corporation (FDC) (2005-2007). Mr. Goebel has been employed by FMR LLC (diversified financial services company) or an affiliate since 2001. |
Brian B. Hogan (1964) |
Year of Election or Appointment: 2009 Vice President |
| Mr. Hogan also serves as Trustee or Vice President of other funds. Mr. Hogan serves as a Director of Fidelity SelectCo, LLC (investment adviser firm, 2014-present) and President of the Equity Division of FMR (investment adviser firm, 2009-present). Previously, Mr. Hogan served as Senior Vice President, Equity Research of FMR (2006-2009) and as a portfolio manager. |
Chris Maher (1972) |
Year of Election or Appointment: 2013 Assistant Treasurer |
| Mr. Maher serves as Assistant Treasurer of other funds. Mr. Maher is Vice President of Valuation Oversight and is an employee of Fidelity Investments. Previously, Mr. Maher served as Vice President of Asset Management Compliance (2013), Vice President of the Program Management Group of FMR (investment adviser firm, 2010-2013), and Vice President of Valuation Oversight (2008-2010). |
Kenneth B. Robins (1969) |
Year of Election or Appointment: 2008 President and Treasurer |
| Mr. Robins also serves as an officer of other funds. Mr. Robins serves as Executive Vice President of Fidelity Investments Money Management, Inc. (FIMM) (investment adviser firm, 2013-present) and is an employee of Fidelity Investments (2004-present). Previously, Mr. Robins served in other fund officer roles. |
Stephen Sadoski (1971) |
Year of Election or Appointment: 2012 Deputy Treasurer |
| Mr. Sadoski also serves as Deputy Treasurer of other funds. He is an employee of Fidelity Investments (2012-present) and has served in another fund officer role. Prior to joining Fidelity Investments, Mr. Sadoski served as an assistant chief accountant in the Division of Investment Management of the Securities and Exchange Commission (SEC) (2009-2012) and as a senior manager at Deloitte & Touche LLP (1997-2009). |
Stacie M. Smith (1974) |
Year of Election or Appointment: 2013 Deputy Treasurer |
| Ms. Smith also serves as an officer of other funds. She is an employee of Fidelity Investments (2009-present) and has served in other fund officer roles. Prior to joining Fidelity Investments, Ms. Smith served as Senior Audit Manager of Ernst & Young LLP (1996-2009). |
Renee Stagnone (1975) |
Year of Election or Appointment: 2013 Deputy Treasurer |
| Ms. Stagnone also serves as Deputy Treasurer of other funds. Ms. Stagnone is an employee of Fidelity Investments. |
Linda J. Wondrack (1964) |
Year of Election or Appointment: 2014 Chief Compliance Officer |
| Ms. Wondrack also serves as Chief Compliance Officer of other funds. Ms. Wondrack is Executive Vice President and head of the Ethics Office and Asset Management Compliance for Fidelity Investments (2012- present). Ms. Wondrack also serves as Chief Compliance Officer of Fidelity SelectCo, LLC (investment adviser firm, 2014-present); Chief Compliance Officer of Impresa Management LLC (2013-present); and Chief Compliance Officer of FMR Co., Inc. (investment adviser firm), Fidelity Investments Money Management, Inc. (investment adviser firm), Fidelity Management & Research (Japan) Limited (investment adviser firm), FMR Investment Management (U.K.) Limited (investment adviser firm), Fidelity Management & Research (Hong Kong) (investment adviser firm), Fidelity Management & Research Company (investment adviser firm), Pyramis Global Advisors, LLC (investment adviser firm), and Strategic Advisers, Inc. (investment adviser firm), Ballyrock Investment Advisors LLC, and Northern Neck Investors LLC (2012-present). Previously, Ms. Wondrack served as Senior Vice President and Chief Compliance Officer for Columbia Management Investment Advisers, LLC (2005-2012); Chief Compliance Officer for certain funds within the Columbia Family of Funds (2007-2012); and Senior Vice President of Compliance Risk Management at Bank of America (2005-2010). |
Joseph F. Zambello (1957) |
Year of Election or Appointment: 2011 Deputy Treasurer |
| Mr. Zambello also serves as Deputy Treasurer of other funds. Mr. Zambello is an employee of Fidelity Investments. Previously, Mr. Zambello served as Vice President of the Program Management Group of FMR (investment adviser firm, 2009-2011) and Vice President of the Transfer Agent Oversight Group (2005-2009). |
Annual Report
The Board of Trustees of Fidelity Real Estate Income Fund voted to pay on September 14, 2015, to shareholders of record at the opening of business on September 11, 2015, a distribution of $0.102 per share derived from capital gains realized from sales of portfolio securities and a dividend of $0.126 per share from net investment income.
The fund hereby designates as a capital gain dividend with respect to the taxable year ended July 31, 2015, $49,924,038, or, if subsequently determined to be different, the net capital gain of such year.
A total of 0.04% of the dividends distributed during the fiscal year was derived from interest on U.S. Government securities which is generally exempt from state income tax.
The fund will notify shareholders in January 2016 of amounts for use in preparing 2015 income tax returns.
Annual Report
Fidelity Real Estate Income Fund
Each year, the Board of Trustees, including the Independent Trustees (together, the Board), votes on the renewal of the management contract with Fidelity Management & Research Company (FMR) and the sub-advisory agreements (together, the Advisory Contracts) for the fund. The Board, assisted by the advice of fund counsel and Independent Trustees' counsel, requests and considers a broad range of information relevant to the renewal of the Advisory Contracts throughout the year.
The Board meets regularly and, at each of its meetings, covers an extensive agenda of topics and materials and considers factors that are relevant to its annual consideration of the renewal of the fund's Advisory Contracts, including the services and support provided to the fund and its shareholders. The Board has established various standing committees (Committees), each composed of and chaired by Independent Trustees with varying backgrounds, to which the Board has assigned specific subject matter responsibilities in order to enhance effective decision-making by the Board. The Board, acting directly and through its Committees, requests and receives information concerning the annual consideration of the renewal of the fund's Advisory Contracts. The Board also meets as needed to consider matters specifically related to the Board's annual consideration of the renewal of the Advisory Contracts. Members of the Board may also meet with trustees of other Fidelity funds through ad hoc joint committees to discuss certain matters relevant to all of the Fidelity funds.
At its July 2015 meeting, the Board unanimously determined to renew the fund's Advisory Contracts. In reaching its determination, the Board considered all factors it believed relevant, including (i) the nature, extent, and quality of the services to be provided to the fund and its shareholders (including the investment performance of the fund); (ii) the competitiveness of the fund's management fee and total expense ratio relative to peer funds; (iii) the total costs of the services to be provided by and the profits to be realized by Fidelity from its relationship with the fund; and (iv) the extent to which (if any) economies of scale exist and would be realized as the fund grows, and whether any economies of scale are appropriately shared with fund shareholders.
In considering whether to renew the Advisory Contracts for the fund, the Board reached a determination, with the assistance of fund counsel and Independent Trustees' counsel and through the exercise of its business judgment, that the renewal of the Advisory Contracts was in the best interests of the fund and its shareholders and that the compensation payable under the Advisory Contracts was fair and reasonable. The Board's decision to renew the Advisory Contracts was not based on any single factor, but rather was based on a comprehensive consideration of all the information provided to the Board at its meetings throughout the year. The Board, in reaching its determination to renew the Advisory Contracts, was aware that shareholders of the fund have a broad range of investment choices available to them, including a wide choice among funds offered by Fidelity's competitors, and that the fund's shareholders, who have the opportunity to review and weigh the disclosure provided by the fund in its prospectus and other public disclosures, have chosen to invest in this fund, which is part of the Fidelity family of funds.
Annual Report
Board Approval of Investment Advisory Contracts and
Management Fees - continued
Nature, Extent, and Quality of Services Provided. The Board considered Fidelity's staffing as it relates to the fund, including the backgrounds of investment personnel of Fidelity, and also considered the fund's investment objective, strategies, and related investment philosophy. The Independent Trustees also had discussions with senior management of Fidelity's investment operations and investment groups. The Board considered the structure of the portfolio manager compensation program and whether this structure provides appropriate incentives to act in the best interests of the fund. Additionally, the Board considered the portfolio managers' investments, if any, in the funds that they manage.
Resources Dedicated to Investment Management and Support Services. The Board and the Fund Oversight and Research Committees reviewed the general qualifications and capabilities of Fidelity's investment staff, including its size, education, experience, and resources, as well as Fidelity's approach to recruiting, training, managing, and compensating investment personnel. The Board noted that Fidelity has continued to increase the resources devoted to non-U.S. offices, including expansion of Fidelity's global investment organization. The Board also noted that Fidelity's analysts have extensive resources, tools and capabilities that allow them to conduct sophisticated quantitative and fundamental analysis, as well as credit analysis of issuers, counterparties and guarantors. Further, the Board considered that Fidelity's investment professionals have sufficient access to global information and data so as to provide competitive investment results over time, and that those professionals also have access to sophisticated tools that permit them to assess portfolio construction and risk and performance attribution characteristics continuously, as well as to transmit new information and research conclusions rapidly around the world. Additionally, in its deliberations, the Board considered Fidelity's trading, risk management, and compliance capabilities and resources, which are integral parts of the investment management process.
Shareholder and Administrative Services. The Board considered (i) the nature, extent, quality, and cost of advisory, administrative, and shareholder services performed by FMR, the sub-advisers (together with FMR, the Investment Advisers), and their affiliates under the Advisory Contracts and under separate agreements covering transfer agency, pricing and bookkeeping, and securities lending services for the fund; (ii) the nature and extent of the supervision of third party service providers, principally custodians and subcustodians; and (iii) the resources devoted to, and the record of compliance with, the fund's compliance policies and procedures. The Board also reviewed the allocation of fund brokerage, including allocations to brokers affiliated with the Investment Advisers, the use of brokerage commissions to pay fund expenses, and the use of "soft" commission dollars to pay for research services.
Annual Report
The Board noted that the growth of fund assets over time across the complex allows Fidelity to reinvest in the development of services designed to enhance the value or convenience of the Fidelity funds as investment vehicles. These services include 24-hour access to account information and market information through telephone representatives and over the Internet, investor education materials and asset allocation tools, and the expanded availability of Fidelity Investor Centers.
In 2014, the Board formed an ad hoc Committee on Transfer Agency Fees to review the variety of transfer agency fee structures throughout the industry and Fidelity's competitive positioning with respect to industry participants.
Investment in a Large Fund Family. The Board considered the benefits to shareholders of investing in a Fidelity fund, including the benefits of investing in a fund that is part of a large family of funds offering a variety of investment disciplines and providing a large variety of mutual fund investor services. The Board noted that Fidelity had taken, or had made recommendations that resulted in the Fidelity funds taking, a number of actions over the previous year that benefited particular funds, including (i) continuing to dedicate additional resources to investment research and to the support of the senior management team that oversees asset management; (ii) continuing efforts to enhance Fidelity's global research capabilities; (iii) launching new funds and making other enhancements to meet client needs; (iv) reducing management fees and total expenses for certain index funds and diversified international funds; (v) continuing to launch dedicated lower cost underlying funds to meet portfolio construction needs related to expanding underlying fund options for Fidelity funds of funds, specifically for the Freedom Fund product lines; (vi) rationalizing product lines and gaining increased efficiencies through fund mergers; (vii) launching active fixed-income exchange-traded funds; (viii) continuing to develop, acquire and implement systems and technology to improve services to the funds and information security and to increase efficiency; (ix) implementing investment enhancements to further strengthen Fidelity's target date product line to increase investors' probability of success in achieving their goals; (x) modifying the eligibility criteria for certain share classes to accommodate roll-over assets from employer-sponsored retirement plans; (xi) launching a new Class W of the Freedom Index Funds to attract and retain Fidelity record-kept retirement plan assets; and (xii) implementing changes to Fidelity's money market product line in response to recent money market regulatory reforms.
Investment Performance. The Board considered whether the fund has operated in accordance with its investment objective, as well as its record of compliance with its investment restrictions and its performance history.
Annual Report
Board Approval of Investment Advisory Contracts and
Management Fees - continued
The Board took into account discussions with representatives of the Investment Advisers about fund investment performance that occur at Board meetings throughout the year. In this regard the Board noted that as part of regularly scheduled fund reviews and other reports to the Board on fund performance, the Board considers annualized return information for the fund, for different time periods, measured against a securities market index ("benchmark index") and a peer group of funds with similar objectives ("peer group"), if any. In its evaluation of fund investment performance, the Board gave particular attention to information indicating changes in performance of certain Fidelity funds for specific time periods and discussed with the Investment Advisers the reasons for any overperformance or underperformance.
In addition to reviewing absolute and relative fund performance, the Independent Trustees periodically consider the appropriateness of fund performance metrics in evaluating the results achieved. In general, the Independent Trustees believe that fund performance should be evaluated based on net performance (after fees and expenses) of both the highest performing and lowest performing fund share classes, where applicable, compared to appropriate benchmark indices, over appropriate time periods that may include full market cycles, and compared to peer groups, as applicable, over the same periods, taking into account relevant factors including the following: general market conditions; issuer-specific information; and fund cash flows and other factors.
The Independent Trustees recognize that shareholders evaluate performance on a net basis over their own holding periods, for which one-, three-, and five-year periods are often used as a proxy. For this reason, the performance information reviewed by the Board also included net cumulative calendar year total return information for the fund and an appropriate benchmark index and peer group for the most recent one-, three-, and five-year periods, as shown below. Returns are shown compared to the 25th percentile (top of box, 75% beaten) and 75th percentile (bottom of box, 25% beaten) of the peer universe.
Annual Report
Fidelity Real Estate Income Fund

Based on its review, the Board concluded that the nature, extent, and quality of services provided to the fund under the Advisory Contracts should benefit the shareholders of the fund.
Competitiveness of Management Fee and Total Expense Ratio. The Board considered the fund's management fee and total expense ratio compared to "mapped groups" of competitive funds and classes created for the purpose of facilitating the Trustees' competitive analysis of management fees and total expenses. Fidelity creates "mapped groups" by combining similar Lipper investment objective categories that have comparable investment mandates. Combining Lipper investment objective categories aids the Board's management fee and total expense ratio comparisons by broadening the competitive group used for comparison.
Management Fee. The Board considered two proprietary management fee comparisons for the 12-month periods shown in basis points (BP) in the chart below. The group of Lipper funds used by the Board for management fee comparisons is referred to below as the "Total Mapped Group." The Total Mapped Group is broader than the Lipper peer group used by the Board for performance comparisons because the Total Mapped Group combines several Lipper investment objective categories while the Lipper peer group does not. The Total Mapped Group comparison focuses on a fund's standing in terms of gross management fees before expense reimbursements or caps relative to the total universe of funds with comparable investment mandates, regardless of whether their management fee structures also are comparable. Funds with comparable investment mandates offer exposure to similar types of securities. Funds with comparable management fee structures have similar management fee contractual arrangements (e.g., flat rate charged for advisory services, all-inclusive fee rate, etc.). "TMG %" represents the percentage of funds in the Total Mapped Group that had management fees that were lower than the fund's. For example, a hypothetical TMG % of 20% would mean that 80% of the funds in the Total Mapped Group had higher, and 20% had lower, management fees than the fund. The fund's actual TMG %s and the number of funds in the Total Mapped Group are in the chart below. The "Asset-Size Peer Group" (ASPG) comparison focuses on a fund's standing relative to a subset of non-Fidelity funds within the Total Mapped Group that are similar in size and management fee structure without taking into account performance adjustments, if any. For example, if a fund is in the first quartile of the ASPG, the fund's management fee ranks in the least expensive or lowest 25% of funds in the ASPG. The ASPG represents at least 15% of the funds in the Total Mapped Group with comparable asset size and management fee structures, subject to a minimum of 50 funds (or all funds in the Total Mapped Group if fewer than 50). Additional information, such as the ASPG quartile in which the fund's management fee rate ranked, is also included in the chart and considered by the Board.
Annual Report
Board Approval of Investment Advisory Contracts and
Management Fees - continued
Fidelity Real Estate Income Fund
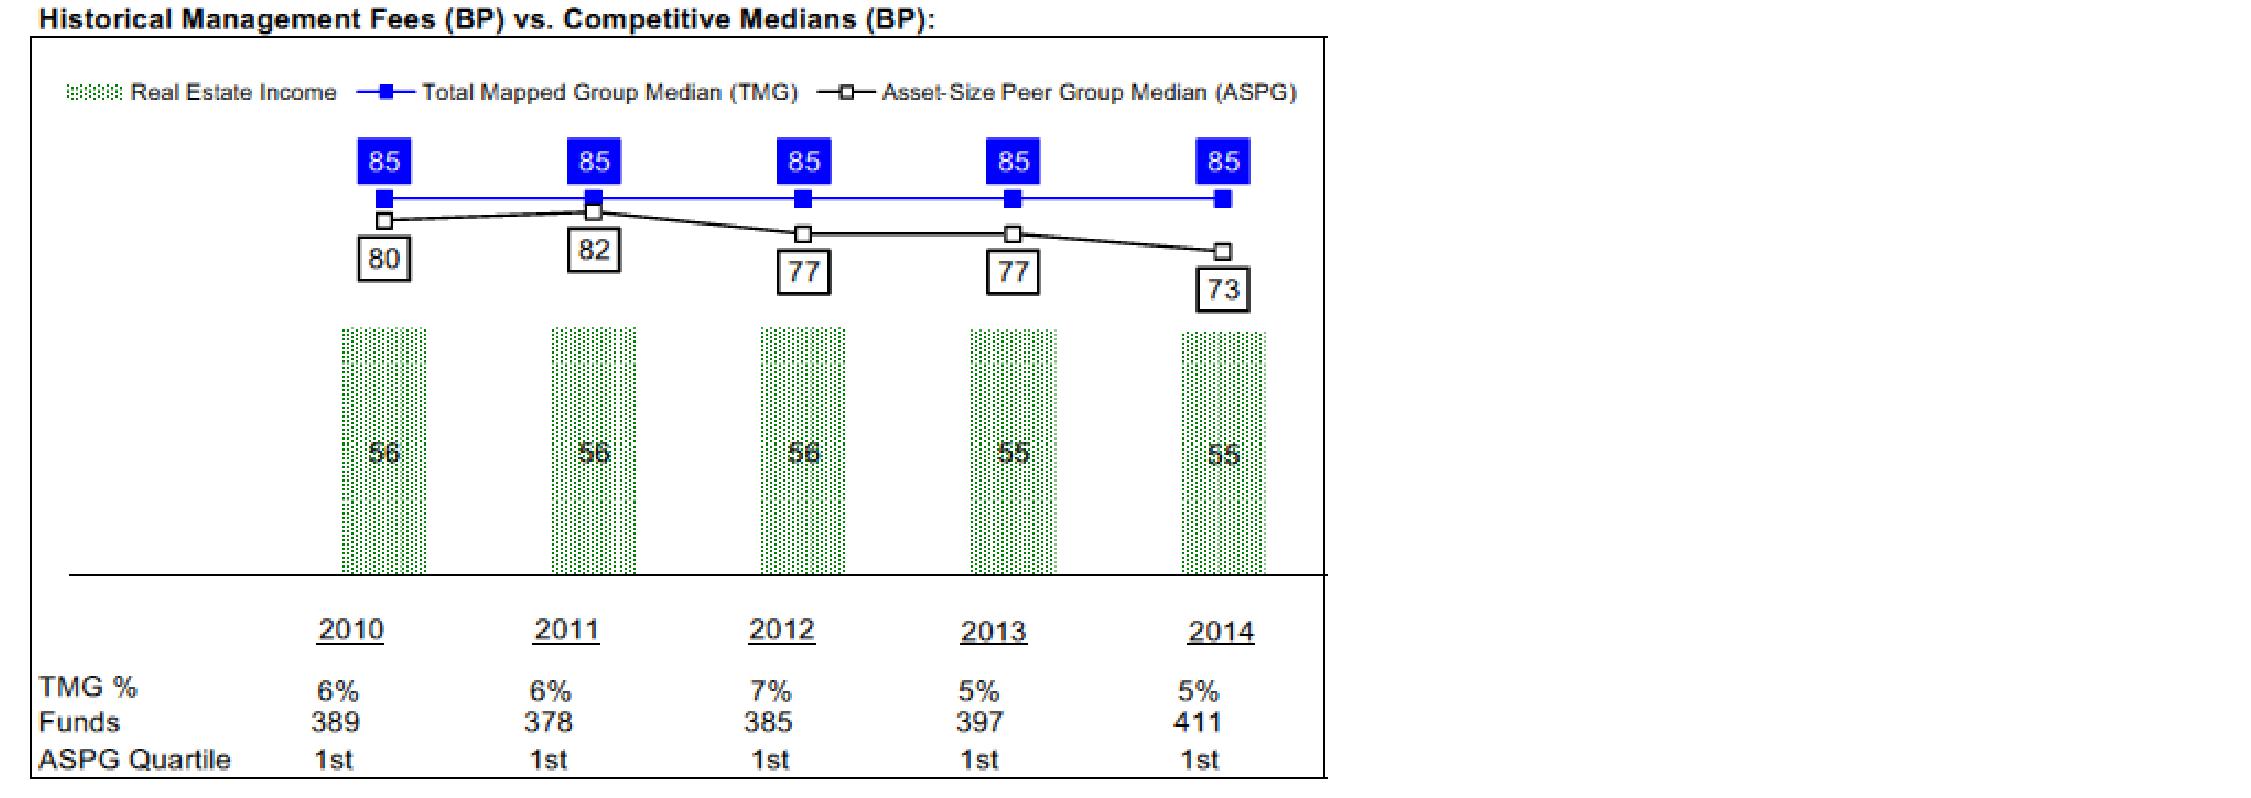
The Board noted that the fund's management fee rate ranked below the median of its Total Mapped Group and below the median of its ASPG for 2014.
The Board noted that, in 2014, the ad hoc Committee on Group Fee was formed by it and other Fidelity fund boards to conduct an in-depth review of the "group fee" component of the management fee of funds with such management fee structures. Committee focus included the mechanics of the group fee, the competitive landscape of group fee structures, Fidelity funds with no group fee component and investment products not included in group fee assets. The Board also considered that, for funds subject to the group fee, FMR agreed to voluntarily waive fees over a specified period of time in amounts designed to account for assets converted from certain funds to certain collective investment trusts.
Annual Report
The Board also noted that, in 2013, the ad hoc Committee on Management Fees was formed to conduct an in-depth review of the management fee rates of Fidelity's active equity mutual funds. The Committee focused on the following areas: (i) standard fee structures; (ii) research consumption and trading evolution; (iii) management fee competitiveness/profitability by category; and (iv) factors that drive institutional pricing.
Based on its review, the Board concluded that the fund's management fee is fair and reasonable in light of the services that the fund receives and the other factors considered.
Total Expense Ratio. In its review of each class's total expense ratio, the Board considered the fund's management fee as well as other fund or class expenses, as applicable, such as transfer agent fees, pricing and bookkeeping fees, and custodial, legal, and audit fees. The Board also noted that Fidelity may agree to waive fees and expenses from time to time, and the extent to which, if any, it has done so for the fund. As part of its review, the Board also considered the current and historical total expense ratios of each class of the fund compared to competitive fund median expenses. Each class of the fund is compared to those funds and classes in the Total Mapped Group (used by the Board for management fee comparisons) that have a similar sales load structure.
The Board noted that the total expense ratio of each class ranked below its competitive median for 2014.
Fees Charged to Other Fidelity Clients. The Board also considered Fidelity fee structures and other information with respect to clients of Fidelity, such as other funds advised or subadvised by Fidelity, pension plan clients, and other institutional clients with similar mandates. The Board noted the findings of the 2013 ad hoc joint committee (created with the board of other Fidelity funds), which reviewed and compared Fidelity's institutional investment advisory business with its business of providing services to the Fidelity funds, including the differences in services provided, fees charged, and costs incurred, as well as competition in their respective marketplaces.
Based on its review of total expense ratios and fees charged to other Fidelity clients, the Board concluded that the total expense ratio of each class of the fund was reasonable in light of the services that the fund and its shareholders receive and the other factors considered.
Annual Report
Board Approval of Investment Advisory Contracts and
Management Fees - continued
Costs of the Services and Profitability. The Board considered the revenues earned and the expenses incurred by Fidelity in conducting the business of developing, marketing, distributing, managing, administering and servicing the fund and servicing the fund's shareholders. The Board also considered the level of Fidelity's profits in respect of all the Fidelity funds.
On an annual basis, Fidelity presents to the Board information about the profitability of its relationship with the fund. Fidelity calculates profitability information for each fund, as well as aggregate profitability information for groups of Fidelity funds and all Fidelity funds, using a series of detailed revenue and cost allocation methodologies which originate with the books and records of Fidelity on which Fidelity's audited financial statements are based. The Audit Committee of the Board reviews any significant changes from the prior year's methodologies.
PricewaterhouseCoopers LLP (PwC), independent registered public accounting firm and auditor to Fidelity and certain Fidelity funds, has been engaged annually by the Board as part of the Board's assessment of Fidelity's profitability analysis. PwC's engagement includes the review and assessment of the methodologies used by Fidelity in determining the revenues and expenses attributable to Fidelity's mutual fund business, and completion of agreed-upon procedures in respect of the mathematical accuracy of fund profitability and its conformity to established allocation methodologies. After considering PwC's reports issued under the engagement and information provided by Fidelity, the Board concluded that while other allocation methods may also be reasonable, Fidelity's profitability methodologies are reasonable in all material respects.
The Board also reviewed Fidelity's non-fund businesses and fall-out benefits related to the mutual fund business as well as cases where Fidelity's affiliates may benefit from or be related to the fund's business.
The Board considered the costs of the services provided by and the profits realized by Fidelity in connection with the operation of the fund and was satisfied that the profitability was not excessive.
Economies of Scale. The Board considered whether there have been economies of scale in respect of the management of the Fidelity funds, whether the Fidelity funds (including the fund) have appropriately benefited from any such economies of scale, and whether there is potential for realization of any further economies of scale. The Board considered the extent to which the fund will benefit from economies of scale as assets grow through increased services to the fund, through waivers or reimbursements, or through fee or expense ratio reductions. The Board also noted that in 2013, it and the boards of other Fidelity funds created an ad hoc committee (the Economies of Scale Committee) to analyze whether Fidelity attains economies of scale in respect of the
Annual Report
management and servicing of the Fidelity funds, whether the Fidelity funds have appropriately benefited from such economies of scale, and whether there is potential for realization of any further economies of scale.
The Board recognized that the fund's management contract incorporates a "group fee" structure, which provides for lower group fee rates as total group assets increase, and for higher group fee rates as total group assets decrease (with "group assets" defined to include fund assets under FMR's management plus sector fund assets previously under FMR's management and currently managed by Fidelity SelectCo, LLC). FMR calculates the group fee rates based on a tiered asset "breakpoint" schedule that varies based on asset class. The Board considered that the group fee is designed to deliver the benefits of economies of scale to fund shareholders when total Fidelity fund assets increase, even if assets of any particular fund are unchanged or have declined, because some portion of Fidelity's costs are attributable to services provided to all Fidelity funds, and all funds benefit if those costs can be allocated among more assets. The Board concluded that, given the group fee structure, fund shareholders will benefit from lower management fees as group assets increase at the fund complex level, regardless of whether Fidelity achieves any such economies of scale.
The Board concluded, taking into account the analysis of the Economies of Scale Committee, that economies of scale, if any, are being appropriately shared between fund shareholders and Fidelity.
Additional Information Requested by the Board. In order to develop fully the factual basis for consideration of the Fidelity funds' Advisory Contracts, the Board requested and received additional information on certain topics, including: (i) fund performance trends and Fidelity's long-term strategies for certain funds; (ii) the various share classes employed by Fidelity and the attributes of each class, together with similar information on the distribution and servicing payments made by Fidelity or the funds to third-party participants in the distribution channels; (iii) fund profitability, and fund performance in relation to fund profitability; (iv) the methodology with respect to evaluating competitive fund data and peer group classifications and fee comparisons; (v) annual fund profitability margins, with particular focus on certain funds with negative margins; (vi) the realization of fall-out benefits in certain Fidelity business units; (vii) economies of scale and the way in which they are shared with fund shareholders; (viii) Fidelity's group fee structures, including the group fee schedule of breakpoints; (ix) the impact of cost containment measures on the funds; and (x) the transfer agent fee structure.
Based on its evaluation of all of the conclusions noted above, and after considering all factors it believed relevant, the Board concluded that the advisory fee structures are fair and reasonable, and that the fund's Advisory Contracts should be renewed.
Annual Report
Investment Adviser
Fidelity Management & Research Company
Boston, MA
Investment Sub-Advisers
FMR Co., Inc.
FMR Investment Management
(U.K.) Limited
Fidelity Management & Research
(Hong Kong) Limited
Fidelity Management & Research
(Japan) Limited
General Distributor
Fidelity Distributors Corporation
Smithfield, RI
Transfer and Service Agents
Fidelity Investments Institutional
Operations Company, Inc.
Boston, MA
Fidelity Service Company, Inc.
Boston, MA
Custodian
The Northern Trust Company
Chicago, IL
The Fidelity Telephone Connection
Mutual Fund 24-Hour Service
Exchanges/Redemptions
and Account Assistance 1-800-544-6666
Product Information 1-800-544-6666
Retirement Accounts 1-800-544-4774
(8 a.m. - 9 p.m.)
TDD Service 1-800-544-0118
for the deaf and hearing impaired
(9 a.m. - 9 p.m. Eastern time)
Fidelity Automated Service
Telephone (FAST®)
1-800-544-5555

Automated line for quickest service
(Fidelity Investment logo)(registered trademark)
Corporate Headquarters
245 Summer St., Boston, MA 02210
www.fidelity.com
REI-UANN-0915
1.789710.112
(Fidelity Investment logo)(registered trademark)
Fidelity Advisor®
Real Estate Income
Fund - Class I
(formerly Institutional Class)
Annual Report
July 31, 2015
(Fidelity Cover Art)
Class I is a class of Fidelity®
Real Estate Income Fund
Contents
Performance | (Click Here) | How the fund has done over time. |
Management's Discussion of Fund Performance | (Click Here) | The Portfolio Manager's review of fund performance and strategy. |
Shareholder Expense Example | (Click Here) | An example of shareholder expenses. |
Investment Changes | (Click Here) | A summary of major shifts in the fund's investments over the past six months. |
Investments | (Click Here) | A complete list of the fund's investments with their market values. |
Financial Statements | (Click Here) | Statements of assets and liabilities, operations, and changes in net assets, as well as financial highlights. |
Notes | (Click Here) | Notes to the financial statements. |
Report of Independent Registered Public Accounting Firm | (Click Here) | |
Trustees and Officers | (Click Here) | |
Distributions | (Click Here) | |
Board Approval of Investment Advisory Contracts and Management Fees | (Click Here) | |
To view a fund's proxy voting guidelines and proxy voting record for the 12-month period ended June 30, visit http://www.fidelity.com/proxyvotingresults or visit the Securities and Exchange Commission's (SEC) web site at http://www.sec.gov. You may also call 1-877-208-0098 to request a free copy of the proxy voting guidelines.
Standard & Poor's, S&P and S&P 500 are registered service marks of The McGraw-Hill Companies, Inc. and have been licensed for use by Fidelity Distributors Corporation.
Other third-party marks appearing herein are the property of their respective owners.
All other marks appearing herein are registered or unregistered trademarks or service marks of FMR LLC or an affiliated company. © 2015 FMR LLC. All rights reserved.
Annual Report
This report and the financial statements contained herein are submitted for the general information of the shareholders of the fund. This report is not authorized for distribution to prospective investors in the fund unless preceded or accompanied by an effective prospectus.
A fund files its complete schedule of portfolio holdings with the SEC for the first and third quarters of each fiscal year on Form N-Q. Forms N-Q are available on the SEC's web site at http://www.sec.gov. A fund's Forms N-Q may be reviewed and copied at the SEC's Public Reference Room in Washington, DC. Information regarding the operation of the SEC's Public Reference Room may be obtained by calling 1-800-SEC-0330. For a complete list of a fund's portfolio holdings, view the most recent holdings listing, semiannual report, or annual report on Fidelity's web site at http://www.fidelity.com, http://www.advisor.fidelity.com, or http://www.401k.com, as applicable.
NOT FDIC INSURED • MAY LOSE VALUE • NO BANK GUARANTEE
Neither the fund nor Fidelity Distributors Corporation is a bank.
Annual Report
Average annual total return reflects the change in the value of an investment, assuming reinvestment of the class' distributions from dividend income and capital gains (the profits earned upon the sale of securities that have grown in value, if any) and assuming a constant rate of performance each year. The $10,000 table and the fund's returns do not reflect the deduction of taxes that a shareholder would pay on fund distributions or the redemption of fund shares. During periods of reimbursement by Fidelity, a fund's total return will be greater than it would be had the reimbursement not occurred. How a fund did yesterday is no guarantee of how it will do tomorrow.
Average Annual Total Returns
Periods ended July 31, 2015 | Past 1
year | Past 5
years | Past 10
years |
Class IA | 4.92% | 9.85% | 6.47% |
A The initial offering of Class I shares took place on April 14, 2010. Returns prior to April 14, 2010 are those of Fidelity® Real Estate Income Fund, the original class of the fund.
$10,000 Over 10 Years
Let's say hypothetically that $10,000 was invested in Fidelity Advisor® Real Estate Income Fund - Class I on July 31, 2005. The chart shows how the value of your investment would have changed, and also shows how the S&P 500® Index performed over the same period. See footnote A above for additional information regarding the performance of Class I.
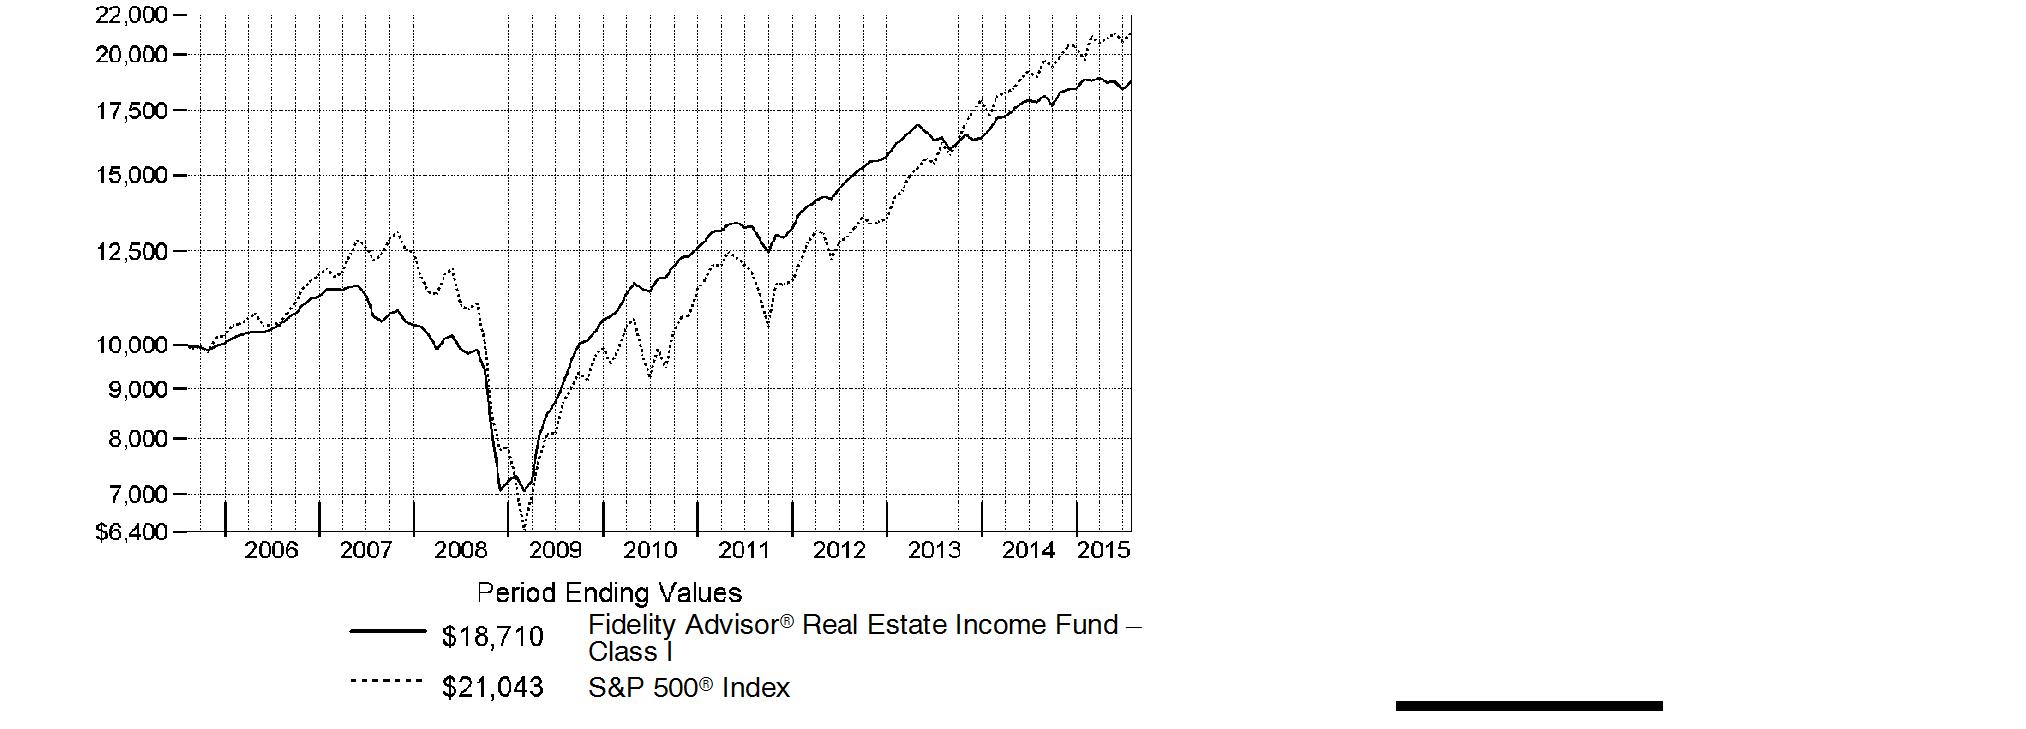
Annual Report
Market Recap: For the 12 months ending July 31, 2015, real estate securities experienced greater volatility than normal for most historical time periods, partly due to the market's reaction to changing interest rate expectations. In the first half of the period, real estate common stocks, as measured by the FTSE® NAREIT® All REITs Index, rose sharply but, with an increase in rates, subsequently gave back much of those gains before enjoying somewhat better results in the period's final weeks. All told, the FTSE® NAREIT® index rose 8.99%. Meanwhile, the MSCI REIT Preferred Index, a proxy for the real estate preferred stock segment, gained 8.93%, a relatively strong result that partly reflected its somewhat low valuations on a historical basis coming into the reporting period. On the market's fixed-income side, The BofA Merrill LynchSM US Real Estate Index - a market-capitalization-weighted measure of investment-grade corporate debt in the domestic real estate sector - rose 3.05%. The market performance took place against a continued solid fundamental backdrop for commercial real estate. The creation of property supply was still moderate, while companies generally experienced growing occupancies or rents, which in turn helped lift cash flows for real estate owners.
Comments from Portfolio Manager Mark Snyderman: For the year, the fund's share classes fell short of my target for a mid- to upper-single-digit return. (For specific class-level results, please see the Performance section of this report.) At the same time, its share classes trailed the 6.69% return of the sector benchmark Fidelity Real Estate Income Composite IndexSM - a 40/40/20 blend of the MSCI REIT Preferred Index, The BofA Merrill LynchSM US Real Estate Index and the FTSE® NAREIT® All REITs Index, respectively. The fund's preferred stocks gained roughly 9%, nearly matching the return of the MSCI preferred stock index. The fund's bond investments also generally did well. Our commercial mortgage-backed securities (CMBS) and high-yield real estate bonds returned approximately 6% and 4%, respectively, outpacing the 3% increase in the BofA Merrill Lynch index. Meanwhile, our investment-grade positions roughly matched that measure. Good credit research helped drive the outperformance from CMBS and high-yield securities, but helped to a lesser extent with our investment-grade holdings. Meanwhile, the fund's real estate investment trust (REIT) common stock investments added 7%, well behind the FTSE NAREIT index. A negative performance factor was the fund's average cash allocation of 7%, a normal level of cash for this fund that hurt during a rising market.
The views expressed above reflect those of the portfolio manager(s) only through the end of the period as stated on the cover of this report and do not necessarily represent the views of Fidelity or any other person in the Fidelity organization. Any such views are subject to change at any time based upon market or other conditions and Fidelity disclaims any responsibility to update such views. These views may not be relied on as investment advice and, because investment decisions for a Fidelity fund are based on numerous factors, may not be relied on as an indication of trading intent on behalf of any Fidelity fund.
Annual Report
Shareholder Expense Example
As a shareholder of the Fund, you incur two types of costs: (1) transaction costs, including sales charges (loads) on purchase payments or redemption proceeds, redemption fees and (2) ongoing costs, including management fees, distribution and/or service (12b-1) fees and other Fund expenses. This Example is intended to help you understand your ongoing costs (in dollars) of investing in the Fund and to compare these costs with the ongoing costs of investing in other mutual funds.
The Example is based on an investment of $1,000 invested at the beginning of the period and held for the entire period (February 1, 2015 to July 31, 2015).
Actual Expenses
The first line of the accompanying table for each class of the Fund provides information about actual account values and actual expenses. You may use the information in this line, together with the amount you invested, to estimate the expenses that you paid over the period. Simply divide your account value by $1,000.00 (for example, an $8,600 account value divided by $1,000.00 = 8.6), then multiply the result by the number in the first line for a class of the Fund under the heading entitled "Expenses Paid During Period" to estimate the expenses you paid on your account during this period. A small balance maintenance fee of $12.00 that is charged once a year may apply for certain accounts with a value of less than $2,000. This fee is not included in the table below. If it was, the estimate of expenses you paid during the period would be higher, and your ending account value lower, by this amount. In addition, the Fund, as a shareholder in the underlying Fidelity Central Funds, will indirectly bear its pro-rata share of the fees and expenses incurred by the underlying Fidelity Central Funds. These fees and expenses are not included in the Fund's annualized expense ratio used to calculate the expense estimate in the table below.
Hypothetical Example for Comparison Purposes
The second line of the accompanying table for each class of the Fund provides information about hypothetical account values and hypothetical expenses based on a Class' actual expense ratio and an assumed rate of return of 5% per year before expenses, which is not the Class' actual return. The hypothetical account values and expenses may not be used to estimate the actual ending account balance or expenses you paid for the period. You may use this information to compare the ongoing costs of investing in the Fund and other funds. To do so, compare this 5% hypothetical example with the 5% hypothetical examples that appear in the shareholder reports of the other funds. A small balance maintenance fee of $12.00 that is charged once a year may apply for certain accounts with a value of less than $2,000. This fee is not included in the table below. If it was, the estimate of expenses you paid during the period would be higher, and your ending account value lower, by this amount. In addition, the Fund, as a shareholder in the underlying Fidelity Central Funds, will indirectly bear its pro-rata share of the fees and expenses incurred by the underlying Fidelity Central Funds. These fees and expenses are not included in the Fund's annualized expense ratio used to calculate the expense estimate in the table below.
Please note that the expenses shown in the table are meant to highlight your ongoing costs only and do not reflect any transaction costs. Therefore, the second line of the table is useful in comparing ongoing costs only, and will not help you determine the relative total costs of owning different funds. In addition, if these transactional costs were included, your costs would have been higher.
Annual Report
| Annualized
Expense RatioB | Beginning
Account Value
February 1, 2015 | Ending
Account Value
July 31, 2015 | Expenses Paid
During Period*
February 1, 2015 to July 31, 2015 |
Class A | 1.03% | | | |
Actual | | $ 1,000.00 | $ 992.80 | $ 5.09 |
HypotheticalA | | $ 1,000.00 | $ 1,019.69 | $ 5.16 |
Class T | 1.06% | | | |
Actual | | $ 1,000.00 | $ 991.80 | $ 5.23 |
HypotheticalA | | $ 1,000.00 | $ 1,019.54 | $ 5.31 |
Class C | 1.78% | | | |
Actual | | $ 1,000.00 | $ 988.50 | $ 8.78 |
HypotheticalA | | $ 1,000.00 | $ 1,015.97 | $ 8.90 |
Real Estate Income | .82% | | | |
Actual | | $ 1,000.00 | $ 993.60 | $ 4.05 |
HypotheticalA | | $ 1,000.00 | $ 1,020.73 | $ 4.11 |
Class I | .77% | | | |
Actual | | $ 1,000.00 | $ 993.80 | $ 3.81 |
HypotheticalA | | $ 1,000.00 | $ 1,020.98 | $ 3.86 |
A 5% return per year before expenses
B Annualized expense ratio reflects expenses net of applicable fee waivers.
* Expenses are equal to each Class' annualized expense ratio, multiplied by the average account value over the period, multiplied by 181/365 (to reflect the one-half year period).
Annual Report
Investment Changes (Unaudited)
Top Five Stocks as of July 31, 2015 |
| % of fund's
net assets | % of fund's net assets
6 months ago |
Equity Lifestyle Properties, Inc. | 3.5 | 3.0 |
MFA Financial, Inc. | 3.0 | 2.9 |
Acadia Realty Trust (SBI) | 2.8 | 2.9 |
Ventas, Inc. | 1.5 | 1.4 |
Mid-America Apartment Communities, Inc. | 1.1 | 1.0 |
| 11.9 | |
Top 5 Bonds as of July 31, 2015 |
| % of fund's
net assets | % of fund's net assets
6 months ago |
Realogy Group LLC Tranche B, term loan 3.75% 3/5/20 | 1.0 | 0.9 |
RAIT Financial Trust 4% 10/1/33 | 0.8 | 0.6 |
Standard Pacific Corp. 8.375% 5/15/18 | 0.7 | 0.7 |
IAS Operating Partnership LP 5% 3/15/18 | 0.7 | 0.7 |
iStar Financial, Inc. 5.875% 3/15/16 | 0.6 | 0.6 |
| 3.8 | |
Top Five REIT Sectors as of July 31, 2015 |
| % of fund's
net assets | % of fund's net assets
6 months ago |
REITs - Mortgage | 17.9 | 17.2 |
REITs - Health Care | 7.4 | 7.0 |
REITs - Shopping Centers | 5.6 | 7.2 |
REITs - Management/Investment | 5.2 | 5.6 |
REITs - Apartments | 5.0 | 4.8 |
Asset Allocation (% of fund's net assets) |
As of July 31, 2015* | As of January 31, 2015** |
 | Common Stocks 30.0% | |  | Common Stocks 30.8% | |
 | Preferred Stocks 19.5% | |  | Preferred Stocks 17.6% | |
 | Bonds 31.8% | |  | Bonds 30.7% | |
 | Convertible
Securities 5.2% | |  | Convertible
Securities 5.5% | |
 | Other Investments 7.3% | |  | Other Investments 7.9% | |
 | Short-Term
Investments and
Net Other Assets (Liabilities) 6.2% | |  | Short-Term
Investments and
Net Other Assets (Liabilities) 7.5% | |
* Foreign investments | 0.9% | | ** Foreign investments | 1.3% | |

Annual Report
Investments July 31, 2015
Showing Percentage of Net Assets
Common Stocks - 30.0% |
| Shares | | Value |
CONSUMER DISCRETIONARY - 0.2% |
Household Durables - 0.2% |
Stanley Martin Communities LLC Class B (a)(k) | 4,620 | | $ 7,054,370 |
FINANCIALS - 29.8% |
Capital Markets - 0.5% |
Ellington Financial LLC | 1,114,700 | | 20,354,422 |
Real Estate Investment Trusts - 28.6% |
Acadia Realty Trust (SBI) (g) | 3,730,449 | | 119,299,759 |
AG Mortgage Investment Trust, Inc. | 781,700 | | 14,226,940 |
American Campus Communities, Inc. | 226,000 | | 8,434,320 |
American Tower Corp. | 177,100 | | 16,843,981 |
Annaly Capital Management, Inc. | 1,606,900 | | 15,988,655 |
Anworth Mortgage Asset Corp. | 1,230,410 | | 6,152,050 |
Apartment Investment & Management Co. Class A | 1,049,300 | | 41,006,644 |
Arbor Realty Trust, Inc. (g) | 3,068,975 | | 20,991,789 |
AvalonBay Communities, Inc. | 141,400 | | 24,368,876 |
Boardwalk (REIT) | 136,200 | | 5,994,320 |
CBL & Associates Properties, Inc. | 2,105,673 | | 34,406,697 |
Cedar Shopping Centers, Inc. | 830,510 | | 5,564,417 |
Chambers Street Properties | 528,593 | | 3,922,160 |
Community Healthcare Trust, Inc. | 225,600 | | 4,257,072 |
CYS Investments, Inc. | 1,992,739 | | 15,463,655 |
Douglas Emmett, Inc. | 517,200 | | 15,159,132 |
Dynex Capital, Inc. | 2,039,943 | | 15,034,380 |
EastGroup Properties, Inc. | 111,900 | | 6,736,380 |
Ellington Residential Mortgage REIT | 260,000 | | 3,634,800 |
Equity Lifestyle Properties, Inc. | 2,627,460 | | 152,077,369 |
Equity Residential (SBI) | 77,400 | | 5,790,294 |
Extra Space Storage, Inc. | 355,700 | | 26,151,064 |
First Potomac Realty Trust | 1,381,615 | | 15,681,330 |
Five Oaks Investment Corp. | 479,100 | | 3,631,578 |
Great Ajax Corp. | 500,000 | | 7,020,000 |
Hatteras Financial Corp. | 812,600 | | 13,212,876 |
Lexington Corporate Properties Trust | 4,340,682 | | 37,329,865 |
LTC Properties, Inc. | 253,513 | | 11,121,615 |
MFA Financial, Inc. | 17,223,722 | | 129,694,627 |
Mid-America Apartment Communities, Inc. | 618,300 | | 49,674,222 |
Monmouth Real Estate Investment Corp. Class A (f) | 813,473 | | 8,150,999 |
National Retail Properties, Inc. | 244,200 | | 9,076,914 |
New Senior Investment Group, Inc. | 1,726,825 | | 22,345,116 |
Newcastle Investment Corp. | 1,840,830 | | 9,038,475 |
NorthStar Realty Finance Corp. | 166,600 | | 2,665,600 |
Common Stocks - continued |
| Shares | | Value |
FINANCIALS - continued |
Real Estate Investment Trusts - continued |
Potlatch Corp. | 509,300 | | $ 17,830,593 |
Prologis, Inc. | 108,487 | | 4,405,657 |
Sabra Health Care REIT, Inc. | 900,600 | | 24,631,410 |
Select Income REIT | 361,791 | | 7,261,145 |
Senior Housing Properties Trust (SBI) | 2,597,400 | | 44,857,098 |
Simon Property Group, Inc. | 126,100 | | 23,608,442 |
Store Capital Corp. | 556,800 | | 11,692,800 |
Terreno Realty Corp. | 1,728,064 | | 36,237,502 |
The Macerich Co. | 147,900 | | 11,707,764 |
Two Harbors Investment Corp. | 2,190,580 | | 22,387,728 |
Ventas, Inc. | 940,846 | | 63,121,358 |
VEREIT, Inc. | 885,434 | | 7,756,402 |
Weyerhaeuser Co. | 704,500 | | 21,621,105 |
WP Carey, Inc. | 773,700 | | 47,342,703 |
WP Glimcher, Inc. | 797,563 | | 10,799,003 |
| | 1,235,408,681 |
Real Estate Management & Development - 0.7% |
Brookfield Asset Management, Inc. Class A | 386,400 | | 13,490,097 |
Kennedy-Wilson Holdings, Inc. | 646,921 | | 16,380,040 |
| | 29,870,137 |
TOTAL FINANCIALS | | 1,285,633,240 |
TOTAL COMMON STOCKS (Cost $1,198,611,239) |
1,292,687,610
|
Preferred Stocks - 20.2% |
| | | |
Convertible Preferred Stocks - 0.7% |
FINANCIALS - 0.7% |
Real Estate Investment Trusts - 0.7% |
Alexandria Real Estate Equities, Inc. Series D 7.00% | 195,000 | | 5,478,291 |
Equity Commonwealth 6.50% (a) | 31,237 | | 776,864 |
Lexington Corporate Properties Trust Series C, 6.50% | 468,742 | | 22,543,584 |
| | 28,798,739 |
Preferred Stocks - continued |
| Shares | | Value |
Nonconvertible Preferred Stocks - 19.5% |
CONSUMER DISCRETIONARY - 0.0% |
Hotels, Restaurants & Leisure - 0.0% |
Red Lion Hotels Capital Trust 9.50% | 71,773 | | $ 1,858,203 |
FINANCIALS - 19.5% |
Capital Markets - 0.1% |
Arlington Asset Investment Corp. 6.625% | 182,517 | | 4,471,667 |
Real Estate Investment Trusts - 19.2% |
AG Mortgage Investment Trust, Inc.: | | | |
8.00% | 587,287 | | 14,453,133 |
8.25% | 34,859 | | 871,475 |
Alexandria Real Estate Equities, Inc. Series E, 6.45% | 145,913 | | 3,790,820 |
American Capital Agency Corp.: | | | |
8.00% | 200,000 | | 4,984,000 |
Series B, 7.75% | 360,200 | | 8,615,984 |
American Capital Mortgage Investment Corp. Series A, 8.125% | 248,636 | | 6,034,396 |
American Home Mortgage Investment Corp.: | | | |
Series A, 9.75% (a) | 120,300 | | 1 |
Series B, 9.25% (a) | 124,100 | | 1 |
American Homes 4 Rent: | | | |
Series A, 5.00% | 550,742 | | 13,950,295 |
Series B, 5.00% | 250,029 | | 6,375,740 |
Series C, 5.50% | 810,662 | | 20,866,440 |
Annaly Capital Management, Inc.: | | | |
Series A, 7.875% | 134,900 | | 3,399,480 |
Series C, 7.625% | 325,332 | | 7,960,874 |
Series D, 7.50% | 621,976 | | 15,288,170 |
Anworth Mortgage Asset Corp. Series A, 8.625% | 309,630 | | 7,945,106 |
Apollo Commercial Real Estate Finance, Inc. Series A, 8.625% | 375,101 | | 9,812,642 |
Apollo Residential Mortgage, Inc. Series A, 8.00% | 284,843 | | 6,821,990 |
Arbor Realty Trust, Inc.: | | | |
7.375% (g) | 430,605 | | 10,597,189 |
Series A, 8.25% (g) | 189,089 | | 4,814,206 |
Series B, 7.75% (g) | 240,000 | | 5,940,000 |
Series C, 8.50% (g) | 100,000 | | 2,578,000 |
Armour Residential REIT, Inc. Series B, 7.875% | 153,654 | | 3,475,653 |
Ashford Hospitality Trust, Inc.: | | | |
Series D, 8.45% | 47,000 | | 1,214,010 |
Series E, 9.00% | 140,751 | | 3,701,751 |
Boston Properties, Inc. 5.25% | 10,915 | | 272,220 |
Brandywine Realty Trust Series E, 6.90% | 95,000 | | 2,470,000 |
Preferred Stocks - continued |
| Shares | | Value |
Nonconvertible Preferred Stocks - continued |
FINANCIALS - continued |
Real Estate Investment Trusts - continued |
Campus Crest Communities, Inc. Series A, 8.00% | 582,117 | | $ 14,017,377 |
Capstead Mortgage Corp. Series E, 7.50% | 202,984 | | 5,025,884 |
CBL & Associates Properties, Inc.: | | | |
Series D, 7.375% | 289,876 | | 7,359,952 |
Series E, 6.625% | 222,063 | | 5,649,283 |
Cedar Shopping Centers, Inc. Series B, 7.25% | 399,750 | | 10,209,615 |
Chesapeake Lodging Trust Series A, 7.75% | 266,916 | | 7,086,620 |
Colony Financial, Inc.: | | | |
7.125% | 375,500 | | 8,858,045 |
Series A, 8.50% | 283,920 | | 7,447,222 |
Series B, 7.50% | 108,867 | | 2,739,094 |
Coresite Realty Corp. Series A, 7.25% | 369,799 | | 9,622,170 |
Corporate Office Properties Trust Series L, 7.375% | 167,140 | | 4,374,054 |
CubeSmart Series A, 7.75% | 40,000 | | 1,063,600 |
CYS Investments, Inc.: | | | |
Series A, 7.75% | 117,824 | | 2,762,973 |
Series B, 7.50% | 496,667 | | 11,120,374 |
DDR Corp.: | | | |
Series J, 6.50% | 340,721 | | 8,804,231 |
Series K, 6.25% | 228,888 | | 5,813,755 |
Digital Realty Trust, Inc.: | | | |
Series E, 7.00% | 219,819 | | 5,693,312 |
Series G, 5.875% | 145,444 | | 3,527,017 |
Series H, 7.375% | 50,000 | | 1,356,500 |
DuPont Fabros Technology, Inc. Series B, 7.625% | 381,202 | | 9,720,651 |
Dynex Capital, Inc.: | | | |
Series A, 8.50% | 362,932 | | 9,029,748 |
Series B, 7.625% | 252,120 | | 5,950,032 |
Equity Commonwealth Series E, 7.25% | 648,952 | | 16,639,129 |
Equity Lifestyle Properties, Inc. Series C, 6.75% | 950,148 | | 24,722,851 |
Essex Property Trust, Inc. Series H, 7.125% | 40,000 | | 1,036,000 |
First Potomac Realty Trust 7.75% | 415,296 | | 10,656,495 |
Five Oaks Investment Corp. Series A, 8.75% | 142,000 | | 3,088,500 |
General Growth Properties, Inc. Series A, 6.375% | 166,463 | | 4,264,782 |
Gladstone Commercial Corp. Series C, 7.125% | 232,238 | | 5,910,457 |
Hatteras Financial Corp. Series A, 7.625% | 522,361 | | 12,144,893 |
Health Care REIT, Inc. Series J, 6.50% | 81,600 | | 2,098,752 |
Hersha Hospitality Trust: | | | |
Series B, 8.00% | 162,538 | | 4,170,725 |
Preferred Stocks - continued |
| Shares | | Value |
Nonconvertible Preferred Stocks - continued |
FINANCIALS - continued |
Real Estate Investment Trusts - continued |
Hersha Hospitality Trust: - continued | | | |
Series C, 6.875% | 50,000 | | $ 1,287,500 |
Hospitality Properties Trust Series D, 7.125% | 40,800 | | 1,068,960 |
Hudson Pacific Properties, Inc. 8.375% | 394,069 | | 10,103,929 |
Inland Real Estate Corp.: | | | |
Series A, 8.125% | 466,000 | | 12,102,020 |
Series B, 6.95% | 245,000 | | 6,078,450 |
Invesco Mortgage Capital, Inc.: | | | |
Series A, 7.75% | 123,342 | | 3,045,314 |
Series B, 7.75% | 736,003 | | 17,597,832 |
Investors Real Estate Trust Series B, 7.95% | 126,572 | | 3,270,620 |
iStar Financial, Inc.: | | | |
Series D, 8.00% | 59,478 | | 1,479,218 |
Series E, 7.875% | 224,596 | | 5,507,094 |
Series F, 7.80% | 438,490 | | 10,778,084 |
Series G, 7.65% | 2,950 | | 71,892 |
Kilroy Realty Corp.: | | | |
Series G, 6.875% | 46,760 | | 1,207,811 |
Series H, 6.375% | 143,296 | | 3,668,378 |
Kite Realty Group Trust 8.25% | 96,100 | | 2,473,614 |
LaSalle Hotel Properties: | | | |
Series H, 7.50% | 141,308 | | 3,611,832 |
Series I, 6.375% | 354,698 | | 8,870,997 |
LBA Realty Fund II Series B, 7.625% | 31,240 | | 685,718 |
MFA Financial, Inc.: | | | |
8.00% | 538,930 | | 13,764,272 |
Series B, 7.50% | 616,232 | | 15,418,125 |
Monmouth Real Estate Investment Corp.: | | | |
Series A, 7.625% | 80,000 | | 2,064,000 |
Series B, 7.875% | 95,000 | | 2,541,250 |
National Retail Properties, Inc.: | | | |
5.70% | 376,404 | | 9,274,595 |
Series D, 6.625% | 222,138 | | 5,813,351 |
New York Mortgage Trust, Inc.: | | | |
7.875% | 154,125 | | 3,302,899 |
Series B, 7.75% | 239,697 | | 5,429,137 |
NorthStar Realty Finance Corp.: | | | |
Series A 8.75% | 7,326 | | 187,326 |
Series B, 8.25% | 369,228 | | 9,286,084 |
Preferred Stocks - continued |
| Shares | | Value |
Nonconvertible Preferred Stocks - continued |
FINANCIALS - continued |
Real Estate Investment Trusts - continued |
NorthStar Realty Finance Corp.: - continued | | | |
Series C, 8.875% | 277,101 | | $ 7,199,084 |
Series D, 8.50% | 238,715 | | 6,137,363 |
Series E, 8.75% | 366,972 | | 9,511,914 |
Pebblebrook Hotel Trust: | | | |
Series A, 7.875% | 412,000 | | 10,670,800 |
Series B, 8.00% | 185,085 | | 4,836,271 |
Series C, 6.50% | 204,321 | | 5,179,537 |
Pennsylvania (REIT) 7.375% | 100,510 | | 2,657,484 |
Prologis, Inc. Series Q, 8.54% | 94,446 | | 5,805,482 |
PS Business Parks, Inc.: | | | |
Series R, 6.875% | 116,903 | | 2,964,660 |
Series S, 6.45% | 93,809 | | 2,455,920 |
Series T, 6.00% | 198,899 | | 5,071,925 |
Series U, 5.75% | 600 | | 14,424 |
Public Storage: | | | |
5.875% | 50,000 | | 1,257,000 |
6.375% | 122,000 | | 3,218,360 |
RAIT Financial Trust: | | | |
7.125% | 336,786 | | 8,278,200 |
7.625% | 224,590 | | 5,102,685 |
Regency Centers Corp.: | | | |
Series 6, 6.625% | 152,661 | | 3,961,553 |
Series 7, 6.00% | 176,250 | | 4,348,088 |
Resource Capital Corp. 8.625% | 156,870 | | 3,308,388 |
Retail Properties America, Inc. 7.00% | 394,411 | | 10,333,568 |
Sabra Health Care REIT, Inc. Series A, 7.125% | 298,123 | | 7,742,254 |
Saul Centers, Inc. Series C, 6.875% | 315,478 | | 8,170,880 |
Senior Housing Properties Trust 5.625% | 283,543 | | 6,719,969 |
Stag Industrial, Inc.: | | | |
Series A, 9.00% | 280,000 | | 7,582,400 |
Series B, 6.625% | 80,300 | | 2,032,393 |
Summit Hotel Properties, Inc.: | | | |
Series A, 9.25% | 138,340 | | 3,757,314 |
Series B, 7.875% | 190,173 | | 5,167,000 |
Series C, 7.125% | 153,212 | | 3,998,833 |
Sun Communities, Inc. Series A, 7.125% | 375,000 | | 9,656,250 |
Sunstone Hotel Investors, Inc. Series D, 8.00% | 129,723 | | 3,348,151 |
Taubman Centers, Inc. Series K, 6.25% | 157,322 | | 3,981,820 |
Preferred Stocks - continued |
| Shares | | Value |
Nonconvertible Preferred Stocks - continued |
FINANCIALS - continued |
Real Estate Investment Trusts - continued |
Terreno Realty Corp. Series A, 7.75% | 213,690 | | $ 5,630,732 |
UMH Properties, Inc. Series A, 8.25% | 600,000 | | 15,594,000 |
Urstadt Biddle Properties, Inc.: | | | |
6.75% | 160,000 | | 4,240,000 |
Series F, 7.125% | 210,000 | | 5,441,100 |
VEREIT, Inc. Series F, 6.70% | 1,980,249 | | 48,615,113 |
Wells Fargo Real Estate Investment Corp. 6.375% | 221,000 | | 5,794,620 |
Winthrop Realty Trust 7.75% | 360,000 | | 9,162,000 |
WP Glimcher, Inc.: | | | |
6.875% | 256,115 | | 6,594,961 |
7.50% | 198,527 | | 5,280,818 |
| | 829,011,285 |
Real Estate Management & Development - 0.2% |
Kennedy-Wilson, Inc. 7.75% | 321,574 | | 8,325,551 |
TOTAL FINANCIALS | | 841,808,503 |
TOTAL NONCONVERTIBLE PREFERRED STOCKS | | 843,666,706 |
TOTAL PREFERRED STOCKS (Cost $851,096,847) |
872,465,445
|
Corporate Bonds - 20.0% |
| Principal Amount (e) | | |
Convertible Bonds - 4.5% |
FINANCIALS - 4.5% |
Consumer Finance - 0.1% |
Zais Financial Partners LP 8% 11/15/16 (h) | | $ 2,000,000 | | 1,998,750 |
Diversified Financial Services - 0.4% |
RWT Holdings, Inc. 5.625% 11/15/19 (h) | | 17,620,000 | | 16,879,079 |
Real Estate Investment Trusts - 3.3% |
Apollo Commercial Real Estate Finance, Inc. 5.5% 3/15/19 | | 5,600,000 | | 5,610,500 |
Ares Commercial Real Estate Corp. 7% 12/15/15 | | 14,700,000 | | 15,049,125 |
Blackstone Mortgage Trust, Inc. 5.25% 12/1/18 | | 5,750,000 | | 6,166,875 |
Campus Crest Communities Operating Partnership LP 4.75% 10/15/18 (h) | | 12,900,000 | | 12,359,813 |
Corporate Bonds - continued |
| Principal Amount (e) | | Value |
Convertible Bonds - continued |
FINANCIALS - continued |
Real Estate Investment Trusts - continued |
Colony Financial, Inc.: | | | | |
3.875% 1/15/21 | | $ 9,910,000 | | $ 9,996,713 |
5% 4/15/23 | | 9,000,000 | | 9,376,875 |
PennyMac Corp. 5.375% 5/1/20 | | 12,690,000 | | 11,738,250 |
RAIT Financial Trust 4% 10/1/33 | | 39,190,000 | | 32,748,144 |
Redwood Trust, Inc. 4.625% 4/15/18 | | 14,700,000 | | 14,194,688 |
Resource Capital Corp.: | | | | |
6% 12/1/18 | | 3,490,000 | | 3,127,913 |
8% 1/15/20 | | 15,990,000 | | 14,903,751 |
Spirit Realty Capital, Inc. 3.75% 5/15/21 | | 2,400,000 | | 2,247,000 |
Starwood Property Trust, Inc. 3.75% 10/15/17 | | 3,230,000 | | 3,252,206 |
Starwood Waypoint Residential 4.5% 10/15/17 (h) | | 1,965,000 | | 1,965,000 |
| | 142,736,853 |
Thrifts & Mortgage Finance - 0.7% |
IAS Operating Partnership LP 5% 3/15/18 (h) | | 33,140,000 | | 31,814,400 |
TOTAL FINANCIALS | | 193,429,082 |
Nonconvertible Bonds - 15.5% |
CONSUMER DISCRETIONARY - 5.1% |
Hotels, Restaurants & Leisure - 0.4% |
FelCor Lodging LP: | | | | |
5.625% 3/1/23 | | 2,000,000 | | 2,052,400 |
6% 6/1/25 (h) | | 2,025,000 | | 2,085,750 |
Hilton Worldwide Finance LLC/Hilton Worldwide Finance Corp. 5.625% 10/15/21 | | 4,000,000 | | 4,165,000 |
Times Square Hotel Trust 8.528% 8/1/26 (h) | | 7,916,982 | | 10,093,350 |
| | 18,396,500 |
Household Durables - 4.7% |
Ashton Woods U.S.A. LLC/Ashton Woods Finance Co. 6.875% 2/15/21 (h) | | 12,145,000 | | 11,416,300 |
Brookfield Residential Properties, Inc./Brookfield Residential U.S. Corp. 6.125% 7/1/22 (h) | | 2,620,000 | | 2,554,500 |
Brookfield Residential Properties, Inc.: | | | | |
6.375% 5/15/25 (h) | | 2,000,000 | | 1,945,000 |
6.5% 12/15/20 (h) | | 1,615,000 | | 1,631,150 |
D.R. Horton, Inc.: | | | | |
4.375% 9/15/22 | | 4,175,000 | | 4,133,250 |
Corporate Bonds - continued |
| Principal Amount (e) | | Value |
Nonconvertible Bonds - continued |
CONSUMER DISCRETIONARY - continued |
Household Durables - continued |
D.R. Horton, Inc.: - continued | | | | |
4.75% 5/15/17 | | $ 2,000,000 | | $ 2,090,720 |
5.75% 8/15/23 | | 2,510,000 | | 2,673,150 |
KB Home: | | | | |
8% 3/15/20 | | 8,465,000 | | 9,353,825 |
9.1% 9/15/17 | | 4,985,000 | | 5,558,275 |
Lennar Corp.: | | | | |
4.125% 12/1/18 | | 5,520,000 | | 5,602,800 |
4.5% 6/15/19 | | 1,830,000 | | 1,889,475 |
4.5% 11/15/19 | | 2,000,000 | | 2,067,500 |
6.5% 4/15/16 | | 4,000,000 | | 4,110,000 |
6.95% 6/1/18 | | 14,280,000 | | 15,636,600 |
M/I Homes, Inc. 8.625% 11/15/18 | | 26,055,000 | | 26,836,650 |
Meritage Homes Corp.: | | | | |
6% 6/1/25 (h) | | 4,000,000 | | 4,040,000 |
7% 4/1/22 | | 7,525,000 | | 8,014,125 |
7.15% 4/15/20 | | 7,060,000 | | 7,607,150 |
Ryland Group, Inc.: | | | | |
6.625% 5/1/20 | | 1,555,000 | | 1,730,871 |
8.4% 5/15/17 | | 5,420,000 | | 5,962,000 |
Standard Pacific Corp.: | | | | |
5.875% 11/15/24 | | 3,250,000 | | 3,339,375 |
7% 8/15/15 | | 4,000,000 | | 4,008,000 |
8.375% 5/15/18 | | 27,853,000 | | 31,822,053 |
10.75% 9/15/16 | | 4,910,000 | | 5,364,175 |
Taylor Morrison Communities, Inc./Monarch Communities, Inc. 5.875% 4/15/23 (h) | | 4,100,000 | | 4,105,125 |
TRI Pointe Homes, Inc. 5.875% 6/15/24 | | 3,890,000 | | 3,831,650 |
WCI Communities, Inc. 6.875% 8/15/21 | | 1,845,000 | | 1,914,188 |
William Lyon Homes, Inc.: | | | | |
7% 8/15/22 | | 4,180,000 | | 4,357,650 |
8.5% 11/15/20 | | 15,550,000 | | 16,755,125 |
| | 200,350,682 |
Media - 0.0% |
Outfront Media Capital LLC / Corp. 5.625% 2/15/24 (h) | | 1,300,000 | | 1,326,000 |
TOTAL CONSUMER DISCRETIONARY | | 220,073,182 |
Corporate Bonds - continued |
| Principal Amount (e) | | Value |
Nonconvertible Bonds - continued |
CONSUMER STAPLES - 0.0% |
Food & Staples Retailing - 0.0% |
Ahold Lease Series 2001 A1 pass thru trust certificates 7.82% 1/2/20 | | $ 602,053 | | $ 659,249 |
FINANCIALS - 9.8% |
Diversified Financial Services - 0.2% |
Icahn Enterprises LP/Icahn Enterprises Finance Corp.: | | | | |
5.875% 2/1/22 | | 3,680,000 | | 3,808,800 |
6% 8/1/20 | | 6,000,000 | | 6,315,000 |
| | 10,123,800 |
Real Estate Investment Trusts - 6.5% |
American Campus Communities Operating Partnership LP 4.125% 7/1/24 | | 2,000,000 | | 2,012,724 |
ARC Properties Operating Partnership LP 4.6% 2/6/24 | | 8,640,000 | | 8,337,600 |
CBL & Associates LP 5.25% 12/1/23 | | 1,000,000 | | 1,037,445 |
Commercial Net Lease Realty, Inc. 6.15% 12/15/15 | | 2,526,000 | | 2,572,147 |
Corporate Office Properties LP 3.6% 5/15/23 | | 5,000,000 | | 4,627,530 |
Crown Castle International Corp. 5.25% 1/15/23 | | 4,000,000 | | 4,190,000 |
CTR Partnership LP/CareTrust Capital Corp. 5.875% 6/1/21 | | 4,955,000 | | 5,054,100 |
CubeSmart LP 4.8% 7/15/22 | | 2,000,000 | | 2,165,492 |
DDR Corp.: | | | | |
7.5% 7/15/18 | | 8,756,000 | | 10,062,404 |
7.875% 9/1/20 | | 4,637,000 | | 5,653,741 |
9.625% 3/15/16 | | 3,836,000 | | 4,026,833 |
DuPont Fabros Technology LP 5.875% 9/15/21 | | 1,000,000 | | 1,027,500 |
Equity One, Inc. 6.25% 1/15/17 | | 3,000,000 | | 3,186,708 |
Equity Residential 5.125% 3/15/16 | | 7,201,000 | | 7,372,161 |
HCP, Inc.: | | | | |
3.75% 2/1/16 | | 10,000,000 | | 10,136,310 |
4% 6/1/25 | | 1,000,000 | | 980,250 |
Health Care Property Investors, Inc.: | | | | |
5.625% 5/1/17 | | 2,980,000 | | 3,170,896 |
6% 1/30/17 | | 2,383,000 | | 2,530,122 |
Health Care REIT, Inc.: | | | | |
3.625% 3/15/16 | | 14,685,000 | | 14,900,635 |
4% 6/1/25 | | 1,551,000 | | 1,540,611 |
4.125% 4/1/19 | | 2,000,000 | | 2,114,992 |
6.2% 6/1/16 | | 2,750,000 | | 2,858,477 |
Corporate Bonds - continued |
| Principal Amount (e) | | Value |
Nonconvertible Bonds - continued |
FINANCIALS - continued |
Real Estate Investment Trusts - continued |
Healthcare Realty Trust, Inc.: | | | | |
3.75% 4/15/23 | | $ 4,022,000 | | $ 3,906,625 |
5.75% 1/15/21 | | 3,095,000 | | 3,446,329 |
Highwoods/Forsyth LP: | | | | |
3.625% 1/15/23 | | 1,607,000 | | 1,600,514 |
5.85% 3/15/17 | | 2,800,000 | | 2,980,155 |
Hospitality Properties Trust: | | | | |
5% 8/15/22 | | 3,177,000 | | 3,313,897 |
5.625% 3/15/17 | | 915,000 | | 963,389 |
HRPT Properties Trust: | | | | |
6.25% 8/15/16 | | 9,675,000 | | 9,888,876 |
6.25% 6/15/17 | | 1,055,000 | | 1,109,470 |
6.65% 1/15/18 | | 4,246,000 | | 4,580,037 |
iStar Financial, Inc.: | | | | |
3.875% 7/1/16 | | 2,855,000 | | 2,862,138 |
4% 11/1/17 | | 15,000,000 | | 14,737,500 |
5% 7/1/19 | | 15,000,000 | | 14,719,650 |
5.85% 3/15/17 | | 3,587,000 | | 3,677,321 |
5.875% 3/15/16 | | 27,070,000 | | 27,543,725 |
7.125% 2/15/18 | | 5,725,000 | | 5,975,469 |
9% 6/1/17 | | 9,175,000 | | 9,920,469 |
MPT Operating Partnership LP/MPT Finance Corp.: | | | | |
6.375% 2/15/22 | | 3,610,000 | | 3,840,138 |
6.875% 5/1/21 | | 2,000,000 | | 2,100,000 |
National Retail Properties, Inc. 3.3% 4/15/23 | | 2,000,000 | | 1,948,454 |
Omega Healthcare Investors, Inc.: | | | | |
4.5% 4/1/27 (h) | | 2,462,000 | | 2,374,688 |
4.95% 4/1/24 | | 2,898,000 | | 2,988,968 |
Potlatch Corp. 7.5% 11/1/19 | | 1,000,000 | | 1,125,000 |
Prologis LP 7.625% 7/1/17 | | 4,690,000 | | 5,169,576 |
Reckson Operating Partnership LP/SL Green Realty Corp./SL Green Operating Partnership LP 7.75% 3/15/20 | | 2,000,000 | | 2,377,044 |
Select Income REIT 4.5% 2/1/25 | | 5,000,000 | | 4,882,155 |
Senior Housing Properties Trust: | | | | |
3.25% 5/1/19 | | 2,882,000 | | 2,897,888 |
4.3% 1/15/16 | | 5,000,000 | | 5,029,320 |
4.75% 5/1/24 | | 3,988,000 | | 3,943,582 |
6.75% 4/15/20 | | 13,624,000 | | 15,231,073 |
Corporate Bonds - continued |
| Principal Amount (e) | | Value |
Nonconvertible Bonds - continued |
FINANCIALS - continued |
Real Estate Investment Trusts - continued |
Senior Housing Properties Trust: - continued | | | | |
6.75% 12/15/21 | | $ 8,000,000 | | $ 9,125,216 |
United Dominion Realty Trust, Inc. 5.25% 1/15/16 | | 4,000,000 | | 4,065,028 |
WP Carey, Inc. 4% 2/1/25 | | 5,000,000 | | 4,843,460 |
| | 282,725,832 |
Real Estate Management & Development - 2.7% |
BioMed Realty LP 3.85% 4/15/16 | | 2,000,000 | | 2,033,458 |
CBRE Group, Inc.: | | | | |
5% 3/15/23 | | 6,020,000 | | 6,174,112 |
5.25% 3/15/25 | | 3,295,000 | | 3,426,800 |
Excel Trust LP 4.625% 5/15/24 | | 2,403,000 | | 2,304,431 |
Forestar U.S.A. Real Estate Group 8.5% 6/1/22 (h) | | 16,365,000 | | 17,143,974 |
Host Hotels & Resorts LP 5.25% 3/15/22 | | 2,000,000 | | 2,170,754 |
Howard Hughes Corp. 6.875% 10/1/21 (h) | | 11,715,000 | | 12,417,900 |
Hunt Companies, Inc. 9.625% 3/1/21 (h) | | 5,790,000 | | 5,717,625 |
Kennedy-Wilson, Inc. 5.875% 4/1/24 | | 7,640,000 | | 7,573,150 |
Mid-America Apartments LP: | | | | |
3.75% 6/15/24 | | 1,663,000 | | 1,660,798 |
6.05% 9/1/16 | | 2,500,000 | | 2,616,610 |
Realogy Group LLC/Realogy Co.-Issuer Corp.: | | | | |
4.5% 4/15/19 (h) | | 4,805,000 | | 4,841,038 |
5.25% 12/1/21 (h) | | 6,620,000 | | 6,785,500 |
Regency Centers LP: | | | | |
5.25% 8/1/15 | | 4,509,000 | | 4,509,000 |
5.875% 6/15/17 | | 400,000 | | 430,867 |
Taylor Morrison Communities, Inc./Monarch Communities, Inc.: | | | | |
5.25% 4/15/21 (h) | | 7,000,000 | | 6,982,500 |
5.625% 3/1/24 (h) | | 2,270,000 | | 2,207,575 |
Ventas Realty LP 1.55% 9/26/16 | | 7,000,000 | | 7,023,681 |
Ventas Realty LP/Ventas Capital Corp.: | | | | |
3.125% 11/30/15 | | 13,807,000 | | 13,900,653 |
4% 4/30/19 | | 2,262,000 | | 2,383,734 |
Wells Operating Partnership II LP 5.875% 4/1/18 | | 3,000,000 | | 3,258,156 |
| | 115,562,316 |
Thrifts & Mortgage Finance - 0.4% |
Cantor Commercial Real Estate Co. LP/CCRE Finance Corp. 7.75% 2/15/18 (h) | | 4,755,000 | | 4,986,806 |
Corporate Bonds - continued |
| Principal Amount (e) | | Value |
Nonconvertible Bonds - continued |
FINANCIALS - continued |
Thrifts & Mortgage Finance - continued |
Ocwen Financial Corp. 7.125% 5/15/19 (h)(i) | | $ 11,795,000 | | $ 11,146,275 |
Wrightwood Capital LLC 1.9% 4/20/20 (d) | | 14,028 | | 469,932 |
| | 16,603,013 |
TOTAL FINANCIALS | | 425,014,961 |
HEALTH CARE - 0.4% |
Health Care Providers & Services - 0.4% |
Sabra Health Care LP/Sabra Capital Corp.: | | | | |
5.375% 6/1/23 | | 2,795,000 | | 2,885,838 |
5.5% 2/1/21 | | 12,305,000 | | 12,766,438 |
| | 15,652,276 |
INDUSTRIALS - 0.1% |
Industrial Conglomerates - 0.1% |
Ladder Capital Finance Holdings LLLP/Ladder Capital Finance Corp. 7.375% 10/1/17 | | 3,050,000 | | 3,156,750 |
INFORMATION TECHNOLOGY - 0.1% |
Internet Software & Services - 0.1% |
CyrusOne LP/CyrusOne Finance Corp.: | | | | |
6.375% 11/15/22 (h) | | 1,000,000 | | 1,035,000 |
6.375% 11/15/22 | | 3,000,000 | | 3,105,000 |
| | 4,140,000 |
TOTAL NONCONVERTIBLE BONDS | | 668,696,418 |
TOTAL CORPORATE BONDS (Cost $840,267,812) |
862,125,500
|
Asset-Backed Securities - 1.9% |
|
American Homes 4 Rent: | | | | |
Series 2014-SFR2 Class E, 6.231% 10/17/36 (h) | | 3,000,000 | | 3,108,920 |
Series 2014-SFR3 Class E, 6.418% 12/17/36 (h) | | 9,025,000 | | 9,470,513 |
Series 2015-SFR1: | | | | |
Class E, 5.639% 4/17/52 (h) | | 1,999,310 | | 1,978,922 |
Class F, 6.482% 4/17/52 (h) | | 2,000,000 | | 1,906,026 |
Asset-Backed Securities - continued |
| Principal Amount (e) | | Value |
Capital Trust RE CDO Ltd. Series 2005-1A Class D, 1.688% 3/20/50 (h)(i) | | $ 2,250,000 | | $ 225 |
CapLease CDO Ltd. Series 2005-1A Class A, 4.926% 1/29/40 (h) | | 776,650 | | 802,047 |
Conseco Finance Securitizations Corp. Series 2002-2 Class M2, 9.163% 3/1/33 | | 500,000 | | 419,576 |
Crest Clarendon Street Ltd./Crest Clarendon Corp. Series 2002-1A Class D, 9% 12/28/35 (h) | | 389,442 | | 363,116 |
Deutsche Financial Capital Securitization LLC Series 1997-I Class M, 7.275% 9/15/27 | | 6,178,122 | | 6,045,836 |
Fairfield Street Solar Corp. Series 2004-1A Class E1, 3.6509% 11/28/39 (h)(i) | | 612,703 | | 349,241 |
Green Tree Financial Corp.: | | | | |
Series 1996-4 Class M1, 7.75% 6/15/27 | | 1,586,172 | | 1,566,859 |
Series 1997-3 Class M1, 7.53% 3/15/28 | | 6,781,936 | | 6,397,210 |
Invitation Homes Trust: | | | | |
Series 2013-SFR1 Class F, 3.9% 12/17/30 (h)(i) | | 1,750,000 | | 1,694,089 |
Series 2014-SFR1: | | | | |
Class E, 3.436% 6/17/31 (h)(i) | | 10,000,000 | | 9,810,623 |
Class F, 3.936% 6/17/31 (h)(i) | | 9,504,000 | | 9,193,617 |
Series 2014-SFR3: | | | | |
Class E, 4.686% 12/17/31 (h)(i) | | 4,336,000 | | 4,387,317 |
Class F, 5.186% 12/17/31 (h)(i) | | 2,215,000 | | 2,216,714 |
Series 2015-SFR2 Class E, 3.3353% 6/17/32 (h)(i) | | 2,450,000 | | 2,382,429 |
Series 2015-SFR3 Class F, 4.933% 8/17/32 (h)(i) | | 2,000,000 | | 1,992,967 |
Series 2015-SRF1 Class F, 4.4853% 3/17/32 (h)(i) | | 5,500,000 | | 5,392,112 |
Lehman ABS Manufactured Housing Contract Trust Series 2001-B Class M2, 7.17% 4/15/40 | | 960,803 | | 528,834 |
Merit Securities Corp. Series 13 Class M1, 7.8468% 12/28/33 (i) | | 1,923,000 | | 2,018,381 |
Progress Residential Trust Series 2015-SFR1 Class E, 4.1853% 2/17/32 (h)(i) | | 1,500,000 | | 1,499,999 |
Starwood Waypoint Residential Trust Series 2014-1 Class F, 4.7235% 1/17/32 (h)(i) | | 4,071,000 | | 4,025,884 |
Taberna Preferred Funding III Ltd. Series 2005-3A Class D, 2.9288% 2/5/36 (h)(i) | | 3,915,435 | | 392 |
Wrightwood Capital Real Estate CDO Ltd. Series 2005-1A: | | | | |
Class A1, 0.601% 11/21/40 (h)(i) | | 4,914,554 | | 4,803,976 |
Class F, 2.231% 11/21/40 (h)(i) | | 250,000 | | 175,675 |
TOTAL ASSET-BACKED SECURITIES (Cost $86,327,539) |
82,531,500
|
Collateralized Mortgage Obligations - 0.2% |
| Principal Amount (e) | | Value |
Private Sponsor - 0.2% |
Countrywide Home Loans, Inc.: | | | | |
Series 2002-R2 Class 2B3, 3.6335% 7/25/33 (h)(i) | | $ 165,763 | | $ 91,170 |
Series 2003-R3 Class B2, 5.5% 11/25/33 (h) | | 783,996 | | 50,501 |
FREMF Mortgage Trust: | | | | |
Series 2010-K6 Class B, 5.5325% 12/25/46 (h)(i) | | 4,500,000 | | 4,983,543 |
Series 2010-K7 Class B, 5.6242% 4/25/20 (h)(i) | | 3,200,000 | | 3,584,381 |
Merrill Lynch Mortgage Investors Trust Series 1998-C3 Class F, 6% 12/15/30 (h) | | 861,715 | | 883,892 |
RESI Finance LP/RESI Finance DE Corp. floater Series 2003-B Class B9, 12.1354% 6/10/35 (h)(i) | | 118,172 | | 126,565 |
Residential Funding Securities Corp. Series 2002-RM1 Class BI1, 5.5% 12/25/17 (h) | | 8,914 | | 8,655 |
RESIX Finance Ltd. floater: | | | | |
Series 2003-D Class B8, 6.6815% 12/10/35 (h)(i) | | 137,485 | | 35,398 |
Series 2004-A Class B7, 4.4315% 2/10/36 (h)(i) | | 139,576 | | 46,491 |
Series 2004-B Class B7, 4.1815% 2/10/36 (h)(i) | | 174,502 | | 117,680 |
TOTAL PRIVATE SPONSOR | | 9,928,276 |
U.S. Government Agency - 0.0% |
Fannie Mae REMIC Trust: | | | | |
Series 2001-W3 subordinate REMIC pass thru certificates, Class B3, 7% 9/25/41 (k) | | 94,028 | | 25,838 |
Series 2002-W1 subordinate REMIC pass thru certificates, Class 3B3, 3.0632% 2/25/42 (h)(i) | | 71,471 | | 55,390 |
Series 2003-W1 subordinate REMIC pass thru certificates, Class B3, 4.3375% 12/25/42 (i)(k) | | 143,242 | | 12,573 |
Series 2003-W10 subordinate REMIC pass thru certificates, Class 2B3, 3.0681% 6/25/43 (h)(i) | | 110,753 | | 60,914 |
Series 2003-W4 subordinate REMIC pass thru certificates, Class 2B3, 2.9643% 10/25/42 (h)(i) | | 46,599 | | 26,562 |
TOTAL U.S. GOVERNMENT AGENCY | | 181,277 |
TOTAL COLLATERALIZED MORTGAGE OBLIGATIONS (Cost $9,703,965) |
10,109,553
|
Commercial Mortgage Securities - 14.2% |
|
Americold LLC Trust Series 2010-ARTA Class D, 7.443% 1/14/29 (h) | | 2,000,000 | | 2,270,210 |
Banc of America Commercial Mortgage Trust: | | | | |
Series 2005-1 Class CJ, 5.515% 11/10/42 (i) | | 1,147,536 | | 1,146,303 |
Commercial Mortgage Securities - continued |
| Principal Amount (e) | | Value |
Banc of America Commercial Mortgage Trust: - continued | | | | |
Series 2005-5 Class D, 5.4703% 10/10/45 (i) | | $ 4,000,000 | | $ 4,006,456 |
Series 2005-6 Class AJ, 5.328% 9/10/47 (i) | | 5,000,000 | | 5,043,800 |
Bear Stearns Commercial Mortgage Securities, Inc. Series 2006-PW11 Class AJ, 5.597% 3/11/39 (i) | | 5,700,000 | | 5,778,521 |
Bear Stearns Commercial Mortgage Securities Trust Series 2006-T22 Class B, 5.7657% 4/12/38 (h)(i) | | 2,520,000 | | 2,621,531 |
BLCP Hotel Trust: | | | | |
floater Series 2014-CLRN Class F, 3.2206% 8/15/29 (h)(i) | | 2,500,000 | | 2,413,543 |
Series 2014-CLMZ Class M, 5.9145% 8/15/29 (h)(i) | | 12,513,000 | | 12,426,958 |
Boca Hotel Portfolio Trust Series 2013-BOCA Class E, 3.9373% 8/15/26 (h)(i) | | 2,500,000 | | 2,499,993 |
Carefree Portfolio Trust floater: | | | | |
Series 2014-CARE: | | | | |
Class E, 4.187% 11/15/19 (h)(i) | | 4,073,000 | | 4,094,310 |
Class F, 2.7707% 11/15/19 (h)(i) | | 1,650,000 | | 1,609,238 |
Series 2014-CMZA Class MZA, 6.1635% 11/15/19 (h)(i) | | 15,382,000 | | 15,385,069 |
CGBAM Commercial Mortgage Trust: | | | | |
floater Series 2014-HD Class E, 3.1855% 2/15/31 (h)(i) | | 5,769,000 | | 5,770,575 |
Series 2015-SMRT Class F, 3.912% 4/10/28 (h)(i) | | 5,746,000 | | 5,451,357 |
Citigroup Commercial Mortgage Trust: | | | | |
Series 2013-GC15 Class D, 5.2754% 9/10/46 (h)(i) | | 2,750,000 | | 2,709,498 |
Series 2015-SHP2 Class E, 4.285% 7/15/17 (h)(i) | | 2,933,000 | | 2,933,000 |
COMM Mortgage Trust: | | | | |
sequential payer Series 2013-LC6 Class E, 3.5% 1/10/46 (h) | | 7,300,000 | | 6,117,210 |
Series 2012-CR5 Class D, 4.4801% 12/10/45 (h)(i) | | 2,000,000 | | 2,020,718 |
Series 2013-CR10 Class D, 4.9525% 8/10/46 (h)(i) | | 2,000,000 | | 1,918,880 |
Series 2013-CR12 Class D, 5.2543% 10/10/46 (h)(i) | | 4,500,000 | | 4,470,930 |
Series 2013-CR9 Class D, 4.4002% 7/10/45 (h)(i) | | 4,255,000 | | 4,020,439 |
Series 2013-LC6 Class D, 4.4296% 1/10/46 (h)(i) | | 3,870,000 | | 3,667,556 |
Series 2014-UBS2 Class D, 5.1826% 3/10/47 (h)(i) | | 3,713,000 | | 3,535,021 |
Commercial Mortgage Acceptance Corp. Series 1998-C2 Class J, 5.44% 9/15/30 (h) | | 1,680,484 | | 1,616,863 |
Commercial Mortgage Trust pass-thru certificates: | | | | |
Series 2005-C6 Class AJ, 5.209% 6/10/44 (i) | | 1,447,499 | | 1,447,134 |
Series 2012-CR1: | | | | |
Class C, 5.5378% 5/15/45 (i) | | 1,000,000 | | 1,100,956 |
Class D, 5.5378% 5/15/45 (h)(i) | | 5,550,000 | | 5,714,274 |
Commercial Mortgage Securities - continued |
| Principal Amount (e) | | Value |
Commercial Mortgage Trust pass-thru certificates: - continued | | | | |
Series 2012-CR2: | | | | |
Class D, 5.0191% 8/15/45 (h)(i) | | $ 4,500,000 | | $ 4,736,300 |
Class E, 5.0191% 8/15/45 (h)(i) | | 6,000,000 | | 6,043,332 |
Series 2012-LC4: | | | | |
Class C, 5.8205% 12/10/44 (i) | | 2,000,000 | | 2,236,190 |
Class D, 5.8205% 12/10/44 (h)(i) | | 8,000,000 | | 8,470,736 |
Core Industrial Trust Series 2015-TEXW Class F, 3.8487% 2/10/34 (h)(i) | | 6,565,000 | | 5,980,341 |
Credit Suisse First Boston Mortgage Securities Corp.: | | | | |
Series 1998-C1 Class F, 6% 5/17/40 (h) | | 1,183,604 | | 1,261,774 |
Series 1998-C2 Class F, 6.75% 11/15/30 (h) | | 1,332,466 | | 1,367,232 |
CSMC Trust floater Series 2015-DEAL: | | | | |
Class E, 4.184% 4/15/29 (h)(i) | | 2,000,000 | | 1,991,236 |
Class F, 4.934% 4/15/29 (h)(i) | | 5,053,000 | | 5,030,863 |
DBCCRE Mortgage Trust Series 2014-ARCP Class E, 5.099% 1/10/34 (h)(i) | | 7,503,000 | | 7,060,556 |
DBUBS Mortgage Trust Series 2011-LC1A: | | | | |
Class E, 5.7348% 11/10/46 (h)(i) | | 12,490,000 | | 13,468,979 |
Class G, 4.652% 11/10/46 (h) | | 9,843,000 | | 8,578,056 |
Extended Stay America Trust Series 2013-ESH7 Class C7, 3.9017% 12/5/31 (h) | | 500,000 | | 512,482 |
Freddie Mac: | | | | |
pass-thru certificates: | | | | |
Series K011 Class X3, 2.6623% 12/25/43 (i)(j) | | 12,206,096 | | 1,522,808 |
Series K012 Class X3, 2.365% 1/25/41 (i)(j) | | 21,072,884 | | 2,367,328 |
Series K013 Class X3, 2.9023% 1/25/43 (i)(j) | | 14,360,000 | | 1,971,326 |
Series KAIV Class X2, 3.6147% 6/25/46 (i)(j) | | 7,430,000 | | 1,335,514 |
GAHR Commercial Mortgage Trust Series 2015-NRF: | | | | |
Class EFX, 3.4949% 12/15/19 (h)(i) | | 5,607,000 | | 5,276,864 |
Class FFX, 3.4949% 12/15/19 (h)(i) | | 7,411,000 | | 6,851,876 |
GMAC Commercial Mortgage Securities, Inc. Series 1997-C2 Class G, 6.75% 4/15/29 (i) | | 548,460 | | 580,893 |
GP Portfolio Trust Series 2014-GPP Class E, 4.0355% 2/15/27 (h)(i) | | 2,823,000 | | 2,813,420 |
Greenwich Capital Commercial Funding Corp. Series 2006-GG7 Class A4, 5.8187% 7/10/38 (i) | | 7,789,588 | | 7,937,831 |
GS Mortgage Securities Corp. II Series 2010-C1: | | | | |
Class D, 6.1899% 8/10/43 (h)(i) | | 4,000,000 | | 4,347,640 |
Class E, 4% 8/10/43 (h) | | 3,770,000 | | 3,420,547 |
GS Mortgage Securities Trust: | | | | |
Series 2010-C2 Class D, 5.3958% 12/10/43 (h)(i) | | 3,000,000 | | 3,147,048 |
Commercial Mortgage Securities - continued |
| Principal Amount (e) | | Value |
GS Mortgage Securities Trust: - continued | | | | |
Series 2011-GC5: | | | | |
Class C, 5.475% 8/10/44 (h)(i) | | $ 9,000,000 | | $ 9,855,405 |
Class D, 5.475% 8/10/44 (h)(i) | | 4,000,000 | | 4,179,732 |
Class E, 5.475% 8/10/44 (h)(i) | | 4,049,000 | | 4,014,478 |
Class F, 4.5% 8/10/44 (h) | | 4,500,000 | | 3,713,058 |
Series 2012-GC6: | | | | |
Class C, 5.8223% 1/10/45 (h)(i) | | 3,600,000 | | 3,999,030 |
Class D, 5.8223% 1/10/45 (h)(i) | | 2,000,000 | | 2,089,829 |
Class E, 5% 1/10/45 (h)(i) | | 4,516,000 | | 4,266,125 |
Series 2012-GCJ7: | | | | |
Class C, 5.9069% 5/10/45 (i) | | 6,500,000 | | 7,217,810 |
Class D, 5.9069% 5/10/45 (h)(i) | | 3,000,000 | | 3,125,367 |
Class E, 5% 5/10/45 (h) | | 6,920,000 | | 6,432,541 |
Series 2012-GCJ9 Class D, 5.0153% 11/10/45 (h)(i) | | 2,000,000 | | 1,977,798 |
Series 2013-GC16: | | | | |
Class D, 5.4927% 11/10/46 (h)(i) | | 3,750,000 | | 3,744,701 |
Class F, 3.5% 11/10/46 (h) | | 7,303,000 | | 5,602,621 |
Hilton U.S.A. Trust: | | | | |
floater Series 2014-ORL Class E, 3.436% 7/15/29 (h)(i) | | 7,241,000 | | 7,271,325 |
Series 2013-HLT Class EFX, 5.6086% 11/5/30 (h)(i) | | 5,000,000 | | 5,059,201 |
Invitation Homes Trust floater Series 2013-SFR1 Class E, 2.9% 12/17/30 (h)(i) | | 1,500,000 | | 1,448,935 |
JPMorgan Chase Commercial Mortgage Securities Corp.: | | | | |
Series 2003-C1 Class F, 5.8339% 1/12/37 (h)(i) | | 1,000,000 | | 998,658 |
Series 2009-IWST: | | | | |
Class C, 7.6935% 12/5/27 (h)(i) | | 3,000,000 | | 3,582,123 |
Class D, 7.6935% 12/5/27 (h)(i) | | 9,550,000 | | 11,286,333 |
Series 2010-CNTM Class MZ, 8.5% 8/5/20 (h) | | 9,000,000 | | 9,352,089 |
Series 2010-CNTR: | | | | |
Class D, 6.3899% 8/5/32 (h)(i) | | 4,500,000 | | 5,160,389 |
Class XB, 1.1366% 8/5/32 (h)(i)(j) | | 32,655,000 | | 1,170,705 |
Series 2012-CBX: | | | | |
Class C, 5.4134% 6/15/45 (i) | | 4,530,000 | | 4,889,637 |
Class F, 4% 6/15/45 (h) | | 5,000,000 | | 4,506,520 |
Class G 4% 6/15/45 (h) | | 4,044,000 | | 2,945,493 |
JPMorgan Chase Commercial Mortgage Securities Trust: | | | | |
floater: | | | | |
Series 2014-FBLU Class E, 3.6815% 12/15/28 (h)(i) | | 2,406,000 | | 2,403,763 |
Commercial Mortgage Securities - continued |
| Principal Amount (e) | | Value |
JPMorgan Chase Commercial Mortgage Securities Trust: - continued | | | | |
Series 2014-INN: | | | | |
Class E, 3.787% 6/15/29 (h)(i) | | $ 9,607,000 | | $ 9,570,513 |
Class F, 4.187% 6/15/29 (h)(i) | | 9,618,000 | | 9,453,638 |
Series 2005-LDP5 Class AJ, 5.5334% 12/15/44 (i) | | 3,470,000 | | 3,510,262 |
Series 2011-C4 Class F, 3.873% 7/15/46 (h) | | 1,400,000 | | 1,295,223 |
Series 2013-LC11: | | | | |
Class D, 4.3807% 4/15/46 (i) | | 3,750,000 | | 3,528,146 |
Class F, 3.25% 4/15/46 (h)(i) | | 2,518,000 | | 1,846,495 |
Series 2014-DSTY Class E, 3.9314% 6/10/27 (h)(i) | | 2,525,000 | | 2,365,362 |
JPMorgan Commercial Mortgage Finance Corp. Series 1999-C8 Class H, 6% 7/15/31 (h) | | 984,143 | | 916,870 |
LB-UBS Commercial Mortgage Trust: | | | | |
sequential payer: | | | | |
Series 2005-C7 Class AJ, 5.323% 11/15/40 (i) | | 8,000,000 | | 8,026,504 |
Series 2006-C7 Class AM, 5.378% 11/15/38 | | 2,040,000 | | 2,117,220 |
Series 2005-C1 Class E, 4.924% 2/15/40 | | 1,747,214 | | 1,748,042 |
Series 2006-C4: | | | | |
Class A4, 6.028% 6/15/38 (i) | | 4,743,244 | | 4,858,244 |
Class AJ, 6.048% 6/15/38 (i) | | 7,005,000 | | 7,180,692 |
Class AM, 6.048% 6/15/38 (i) | | 6,700,000 | | 6,948,376 |
LSTAR Commercial Mortgage Trust: | | | | |
Series 2011-1 Class D, 5.4277% 6/25/43 (h)(i) | | 1,060,085 | | 1,060,314 |
Series 2014-2: | | | | |
Class D, 5.183% 1/20/41 (h)(i) | | 3,000,000 | | 2,833,575 |
Class E, 5.183% 1/20/41 (h)(i) | | 4,800,000 | | 4,016,995 |
Mach One Trust LLC Series 2004-1A Class H, 6.1214% 5/28/40 (h)(i) | | 1,384,194 | | 1,385,163 |
Merrill Lynch Financial Asset, Inc. Series 2005-CA16 Class M, 4.384% 7/12/37 | CAD | 220,089 | | 167,336 |
Merrill Lynch Mortgage Trust Series 2006-C1 Class AM, 5.8654% 5/12/39 (i) | | 1,200,000 | | 1,231,040 |
Mezz Capital Commercial Mortgage Trust Series 2004-C1 Class IO, 9.0012% 1/15/37 (h)(i)(j) | | 349,488 | | 22,297 |
Morgan Stanley BAML Trust: | | | | |
Series 2012-C6 Class D, 4.816% 11/15/45 (h)(i) | | 2,000,000 | | 2,046,496 |
Series 2013-C12 Class D, 4.9261% 10/15/46 (h)(i) | | 3,250,000 | | 3,171,243 |
Series 2013-C13: | | | | |
Class D, 5.0578% 11/15/46 (h)(i) | | 3,100,000 | | 3,024,407 |
Class E, 5.0578% 11/15/46 (h)(i) | | 3,379,000 | | 3,073,687 |
Series 2013-C7 Class E, 4.4375% 2/15/46 (h)(i) | | 1,000,000 | | 906,731 |
Series 2013-C9 Class D, 4.2965% 5/15/46 (h)(i) | | 5,000,000 | | 4,677,180 |
Commercial Mortgage Securities - continued |
| Principal Amount (e) | | Value |
Morgan Stanley Capital I Trust: | | | | |
sequential payer: | | | | |
Series 2006-HQ10 Class AM, 5.36% 11/12/41 | | $ 8,200,000 | | $ 8,547,590 |
Series 2012-C4 Class E, 5.7084% 3/15/45 (h)(i) | | 5,630,000 | | 5,833,969 |
Series 1997-RR Class F, 7.4369% 4/30/39 (h)(i) | | 806,029 | | 809,334 |
Series 1998-CF1 Class G, 7.35% 7/15/32 (h) | | 2,640,173 | | 2,565,292 |
Series 2006-IQ12 Class AMFX, 5.37% 12/15/43 | | 7,500,000 | | 7,863,240 |
Series 2011-C1 Class C, 5.418% 9/15/47 (h)(i) | | 4,000,000 | | 4,430,933 |
Series 2011-C2: | | | | |
Class D, 5.4799% 6/15/44 (h)(i) | | 4,610,000 | | 4,940,804 |
Class E, 5.4799% 6/15/44 (h)(i) | | 9,600,000 | | 10,106,544 |
Class F, 5.4799% 6/15/44 (h)(i) | | 4,440,000 | | 4,222,724 |
Class XB, 0.5332% 6/15/44 (h)(i)(j) | | 63,708,222 | | 1,679,731 |
Series 2011-C3: | | | | |
Class C, 5.3554% 7/15/49 (h)(i) | | 2,000,000 | | 2,181,710 |
Class D, 5.3554% 7/15/49 (h)(i) | | 7,400,000 | | 7,891,760 |
Class G, 5.3554% 7/15/49 (h)(i) | | 3,283,000 | | 2,943,758 |
Series 2012-C4 Class D, 5.7084% 3/15/45 (h)(i) | | 6,310,000 | | 6,779,514 |
Motel 6 Trust Series 2015-MTL6: | | | | |
Class E, 5.2785% 2/5/30 (h) | | 3,278,000 | | 3,263,836 |
Class F, 5% 2/5/30 (h) | | 10,728,000 | | 10,372,260 |
Providence Place Group Ltd. Partnership Series 2000-C1 Class A2, 7.75% 7/20/28 (h) | | 4,575,017 | | 5,739,359 |
SCG Trust Series 2013-SRP1 Class D, 3.5172% 11/15/26 (h)(i) | | 1,000,000 | | 999,542 |
TIAA Seasoned Commercial Mortgage Trust sequential payer Series 2007-C4 Class AJ, 5.4862% 8/15/39 (i) | | 1,493,827 | | 1,500,240 |
TimberStar Trust I Series 2006-1 Class F, 7.5296% 10/15/36 (h) | | 10,630,000 | | 10,906,829 |
UBS Commercial Mortgage Trust Series 2012-C1 Class D, 5.727% 5/10/45 (h)(i) | | 3,235,000 | | 3,403,336 |
UBS-Barclays Commercial Mortgage Trust sequential payer Series 2012-C3 Class A1, 0.726% 8/10/49 | | 1,827,170 | | 1,818,809 |
UBS-Citigroup Commercial Mortgage Trust Series 2011-C1 Class B, 6.084% 1/10/45 (h)(i) | | 3,000,000 | | 3,478,836 |
Vornado DP LLC Series 2010-VNO Class D, 6.3555% 9/13/28 (h) | | 2,540,000 | | 2,919,900 |
Wachovia Bank Commercial Mortgage Trust Series 2004-C11 Class D, 5.3146% 1/15/41 (i) | | 5,177,000 | | 5,257,927 |
Wells Fargo Commercial Mortgage Trust Series 2012-LC5 Class D, 4.9366% 10/15/45 (h)(i) | | 9,999,000 | | 10,087,941 |
WF-RBS Commercial Mortgage Trust: | | | | |
sequential payer Series 2011-C4I Class G, 5% 6/15/44 (h) | | 4,000,000 | | 3,319,232 |
Commercial Mortgage Securities - continued |
| Principal Amount (e) | | Value |
WF-RBS Commercial Mortgage Trust: - continued | | | | |
Series 2011-C3: | | | | |
Class C, 5.335% 3/15/44 (h) | | $ 4,900,000 | | $ 5,353,554 |
Class D, 5.7221% 3/15/44 (h)(i) | | 1,000,000 | | 1,079,559 |
Class E, 5% 3/15/44 (h) | | 3,000,000 | | 2,910,177 |
Series 2011-C5: | | | | |
Class F, 5.25% 11/15/44 (h)(i) | | 3,000,000 | | 2,757,525 |
Class G, 5.25% 11/15/44 (h)(i) | | 2,000,000 | | 1,753,606 |
Series 2012-C10 Class E, 4.6057% 12/15/45 (h)(i) | | 4,090,000 | | 3,745,782 |
Series 2012-C7: | | | | |
Class D, 4.9995% 6/15/45 (h)(i) | | 2,380,000 | | 2,495,706 |
Class F, 4.5% 6/15/45 (h) | | 2,000,000 | | 1,855,752 |
Series 2013-C11: | | | | |
Class D, 4.3201% 3/15/45 (h)(i) | | 5,830,000 | | 5,645,300 |
Class E, 4.3201% 3/15/45 (h)(i) | | 4,780,000 | | 4,336,593 |
Series 2013-C13 Class D, 4.1386% 5/15/45 (h)(i) | | 4,000,000 | | 3,825,852 |
WFCG Commercial Mortgage Trust floater Series 2015-BXRP: | | | | |
Class F, 3.9058% 11/15/29 (h)(i) | | 6,182,652 | | 6,140,759 |
Class G, 3.2055% 11/15/29 (h)(i) | | 4,069,869 | | 3,787,233 |
TOTAL COMMERCIAL MORTGAGE SECURITIES (Cost $568,589,435) |
610,929,580
|
Bank Loan Obligations - 7.3% |
|
CONSUMER DISCRETIONARY - 2.9% |
Hotels, Restaurants & Leisure - 2.2% |
Caesars Entertainment Resort Properties LLC Tranche B 1LN, term loan 7% 10/11/20 (i) | | 13,238,103 | | 12,377,626 |
Caesars Growth Properties Holdings, LLC Tranche 1LN, term loan 6.25% 5/8/21 (i) | | 10,194,581 | | 8,627,164 |
Cooper Hotel Group 12% 11/6/17 | | 13,194,963 | | 13,854,711 |
ESH Hospitality, Inc. Tranche B, term loan 5% 6/24/19 (i) | | 14,218,748 | | 14,485,349 |
Four Seasons Holdings, Inc.: | | | | |
Tranche 2LN, term loan 6.25% 12/27/20 (i) | | 2,150,000 | | 2,155,375 |
Tranche B 1LN, term loan 3.5% 6/27/20 (i) | | 1,993,180 | | 1,990,688 |
Hilton Worldwide Finance, LLC Tranche B, term loan 3.5% 10/25/20 (i) | | 18,472,361 | | 18,495,451 |
La Quinta Intermediate Holdings LLC Tranche B LN, Tranche B, term loan 4% 4/14/21 (i) | | 13,181,721 | | 13,198,198 |
Bank Loan Obligations - continued |
| Principal Amount (e) | | Value |
CONSUMER DISCRETIONARY - continued |
Hotels, Restaurants & Leisure - continued |
Playa Resorts Holding BV Tranche B, term loan 4% 8/9/19 (i) | | $ 8,114,819 | | $ 8,135,106 |
Ryman Hospitality Properties, Inc. Tranche B, term loan 3.5% 1/15/21 (i) | | 2,267,100 | | 2,275,602 |
| | 95,595,270 |
Media - 0.2% |
CBS Outdoor Americas Capital LLC/CBS Outdoor Americas Capital Corp. Tranche B, term loan 3% 1/31/21 (i) | | 8,295,000 | | 8,284,631 |
Multiline Retail - 0.4% |
JC Penney Corp., Inc. Tranche B, term loan 6% 5/22/18 (i) | | 15,385,152 | | 15,365,920 |
Specialty Retail - 0.1% |
The Pep Boys - Manny, Moe & Jack Tranche B, term loan 4.25% 10/11/18 (i) | | 6,213,491 | | 6,213,491 |
TOTAL CONSUMER DISCRETIONARY | | 125,459,312 |
CONSUMER STAPLES - 0.3% |
Food & Staples Retailing - 0.3% |
Albertson's LLC: | | | | |
Tranche B 2LN, term loan 5.375% 3/21/19 (i) | | 5,110,539 | | 5,129,703 |
Tranche B 3LN, term loan 5% 8/25/19 (i) | | 8,378,938 | | 8,410,359 |
| | 13,540,062 |
ENERGY - 0.5% |
Oil, Gas & Consumable Fuels - 0.5% |
Moxie Patriot LLC Tranche B, term loan 6.75% 12/19/20 (i) | | 2,000,000 | | 2,007,500 |
Panda Sherman Power, LLC term loan 9% 9/14/18 (i) | | 7,148,245 | | 7,041,022 |
Panda Temple Power, LLC term loan 7.25% 4/3/19 (i) | | 8,580,000 | | 8,065,200 |
TPF II Power, LLC Tranche B, term loan 5.5% 10/2/21 (i) | | 4,211,517 | | 4,232,574 |
| | 21,346,296 |
FINANCIALS - 1.8% |
Real Estate Investment Trusts - 0.3% |
Starwood Property Trust, Inc. Tranche B, term loan 3.5% 4/17/20 (i) | | 10,822,768 | | 10,768,654 |
Real Estate Management & Development - 1.1% |
CityCenter 8.74% 7/12/16 (i) | | 2,654,628 | | 2,654,628 |
Bank Loan Obligations - continued |
| Principal Amount (e) | | Value |
FINANCIALS - continued |
Real Estate Management & Development - continued |
Realogy Corp. Credit-Linked Deposit 4.4463% 10/10/16 (i) | | $ 420,600 | | $ 416,394 |
Realogy Group LLC Tranche B, term loan 3.75% 3/5/20 (i) | | 44,022,253 | | 44,132,309 |
| | 47,203,331 |
Thrifts & Mortgage Finance - 0.4% |
Ocwen Loan Servicing, LLC Tranche B, term loan 5% 2/15/18 (i) | | 18,395,917 | | 18,395,917 |
TOTAL FINANCIALS | | 76,367,902 |
HEALTH CARE - 0.1% |
Health Care Providers & Services - 0.1% |
Community Health Systems, Inc.: | | | | |
Tranche F, term loan 3.5335% 12/31/18 (i) | | 1,995,000 | | 2,004,975 |
Tranche G, term loan 3.75% 12/31/19 (i) | | 880,340 | | 880,340 |
Tranche H, term loan 4% 1/27/21 (i) | | 3,119,660 | | 3,127,459 |
| | 6,012,774 |
INDUSTRIALS - 0.6% |
Commercial Services & Supplies - 0.3% |
Lineage Logistics Holdings, LLC. Tranche B, term loan 4.5% 4/7/21 (i) | | 3,950,000 | | 3,871,000 |
Pilot Travel Centers LLC Tranche B, term loan 4.25% 10/3/21 (i) | | 9,900,000 | | 9,987,120 |
| | 13,858,120 |
Construction & Engineering - 0.3% |
Drumm Investors LLC Tranche B, term loan 6.75% 5/4/18 (i) | | 11,353,592 | | 11,481,320 |
TOTAL INDUSTRIALS | | 25,339,440 |
TELECOMMUNICATION SERVICES - 0.4% |
Wireless Telecommunication Services - 0.4% |
SBA Senior Finance II, LLC: | | | | |
term loan 3.25% 3/24/21 (i) | | 13,855,050 | | 13,768,456 |
Tranche B 2LN, term loan 3.25% 6/10/22 (i) | | 1,500,000 | | 1,488,750 |
| | 15,257,206 |
Bank Loan Obligations - continued |
| Principal Amount (e) | | Value |
UTILITIES - 0.7% |
Electric Utilities - 0.4% |
Calpine Construction Finance Co. LP Tranche B 2LN, term loan 3.25% 1/31/22 (i) | | $ 7,306,278 | | $ 7,260,613 |
Essential Power LLC Tranche B, term loan 4.75% 8/8/19 (i) | | 3,362,398 | | 3,375,007 |
La Frontera Generation, LLC Tranche B, term loan 4.5% 9/30/20 (i) | | 6,066,770 | | 5,983,655 |
Southeast Powergen LLC Tranche B, term loan 4.5% 12/2/21 (i) | | 2,756,150 | | 2,766,486 |
| | 19,385,761 |
Independent Power and Renewable Electricity Producers - 0.3% |
Calpine Corp. Tranche B 4LN, term loan 4% 10/31/20 (i) | | 1,970,000 | | 1,972,463 |
Tempus Public Foundation Generation Holdings LLC Tranche B, term loan 4.75% 12/31/17 (i) | | 11,486,346 | | 10,940,745 |
| | 12,913,208 |
TOTAL UTILITIES | | 32,298,969 |
TOTAL BANK LOAN OBLIGATIONS (Cost $274,172,984) |
315,621,961
|
Preferred Securities - 0.0% |
|
FINANCIALS - 0.0% |
Diversified Financial Services - 0.0% |
Crest Dartmouth Street 2003 1 Ltd. Series 2003-1A Class PS, 6/28/38 (h)(i) | | 1,220,000 | | 394,304 |
Thrifts & Mortgage Finance - 0.0% |
Crest Clarendon Street 2002-1 Ltd. Series 2002-1A Class PS, 12/28/35 (h)(i) | | 500,000 | | 250 |
TOTAL PREFERRED SECURITIES (Cost $1,297,768) |
394,554
|
Money Market Funds - 4.9% |
| Shares | | Value |
Fidelity Cash Central Fund, 0.17% (b) | 212,414,253 | | $ 212,414,253 |
Fidelity Securities Lending Cash Central Fund, 0.18% (b)(c) | 82,000 | | 82,000 |
TOTAL MONEY MARKET FUNDS (Cost $212,496,253) |
212,496,253
|
TOTAL INVESTMENT PORTFOLIO - 98.7% (Cost $4,042,563,842) | 4,259,361,956 |
NET OTHER ASSETS (LIABILITIES) - 1.3% | 57,654,478 |
NET ASSETS - 100% | $ 4,317,016,434 |
Currency Abbreviations |
CAD | - | Canadian dollar |
Legend |
(a) Non-income producing |
(b) Affiliated fund that is generally available only to investment companies and other accounts managed by Fidelity Investments. The rate quoted is the annualized seven-day yield of the fund at period end. A complete unaudited listing of the fund's holdings as of its most recent quarter end is available upon request. In addition, each Fidelity Central Fund's financial statements, which are not covered by the Fund's Report of Independent Registered Public Accounting Firm, are available on the SEC's website or upon request. |
(c) Investment made with cash collateral received from securities on loan. |
(d) Non-income producing - Security is in default. |
(e) Amount is stated in United States dollars unless otherwise noted. |
(f) Security or a portion of the security is on loan at period end. |
(g) Affiliated company |
(h) Security exempt from registration under Rule 144A of the Securities Act of 1933. These securities may be resold in transactions exempt from registration, normally to qualified institutional buyers. At the end of the period, the value of these securities amounted to $753,917,003 or 17.5% of net assets. |
(i) Coupon rates for floating and adjustable rate securities reflect the rates in effect at period end. |
(j) Security represents right to receive monthly interest payments on an underlying pool of mortgages or assets. Principal shown is the outstanding par amount of the pool as of the end of the period. |
(k) Restricted securities - Investment in securities not registered under the Securities Act of 1933 (excluding 144A issues). At the end of the period, the value of restricted securities (excluding 144A issues) amounted to $7,092,781 or 0.2% of net assets. |
Additional information on each restricted holding is as follows: |
Security | Acquisition Date | Acquisition Cost |
Fannie Mae REMIC Trust Series 2001-W3 subordinate REMIC pass thru certificates, Class B3, 7% 9/25/41 | 5/21/03 | $ 57,050 |
Fannie Mae REMIC Trust Series 2003-W1 subordinate REMIC pass thru certificates, Class B3, 4.3375% 12/25/42 | 3/25/03 | $ 94,017 |
Stanley Martin Communities LLC Class B | 8/3/05 - 3/1/07 | $ 4,244,623 |
Affiliated Central Funds |
Information regarding fiscal year to date income earned by the Fund from investments in Fidelity Central Funds is as follows: |
Fund | Income earned |
Fidelity Cash Central Fund | $ 389,159 |
Fidelity Securities Lending Cash Central Fund | 31,537 |
Total | $ 420,696 |
Other Affiliated Issuers |
An affiliated company is a company in which the Fund has ownership of at least 5% of the voting securities. Fiscal year to date transactions with companies which are or were affiliates are as follows: |
Affiliate | Value, beginning of period | Purchases | Sales Proceeds | Dividend Income | Value,
end of
period |
Acadia Realty Trust (SBI) | $ 98,809,206 | $ 6,961,621 | $ - | $ 4,593,982 | $ 119,299,759 |
Arbor Realty Trust, Inc. | 21,697,653 | - | - | 1,657,247 | 20,991,789 |
Arbor Realty Trust, Inc. 7.375% | 8,162,637 | 2,420,000 | - | 793,928 | 10,597,189 |
Arbor Realty Trust, Inc. Series A, 8.25% | 4,727,225 | - | - | 389,996 | 4,814,206 |
Arbor Realty Trust, Inc. Series B, 7.75% | 5,882,400 | - | - | 465,000 | 5,940,000 |
Arbor Realty Trust, Inc. Series C, 8.50% | 2,525,000 | - | - | 212,500 | 2,578,000 |
Total | $ 141,804,121 | $ 9,381,621 | $ - | $ 8,112,653 | $ 164,220,943 |
Other Information |
The following is a summary of the inputs used, as of July 31, 2015, involving the Fund's assets and liabilities carried at fair value. The inputs or methodology used for valuing securities may not be an indication of the risk associated with investing in those securities. For more information on valuation inputs, and their aggregation into the levels used in the tables below, please refer to the Investment Valuation section in the accompanying Notes to Financial Statements. |
Valuation Inputs at Reporting Date: |
Description | Total | Level 1 | Level 2 | Level 3 |
Investments in Securities: | | | | |
Equities: | | | | |
Consumer Discretionary | $ 8,912,573 | $ 1,858,203 | $ - | $ 7,054,370 |
Financials | 2,156,240,482 | 2,122,413,123 | 33,827,357 | 2 |
Corporate Bonds | 862,125,500 | - | 861,655,568 | 469,932 |
Asset-Backed Securities | 82,531,500 | - | 75,507,994 | 7,023,506 |
Collateralized Mortgage Obligations | 10,109,553 | - | 9,587,036 | 522,517 |
Commercial Mortgage Securities | 610,929,580 | - | 610,739,947 | 189,633 |
Bank Loan Obligations | 315,621,961 | - | 296,540,853 | 19,081,108 |
Preferred Securities | 394,554 | - | - | 394,554 |
Money Market Funds | 212,496,253 | 212,496,253 | - | - |
Total Investments in Securities: | $ 4,259,361,956 | $ 2,336,767,579 | $ 1,887,858,755 | $ 34,735,622 |
Valuation Inputs at Reporting Date: |
The following is a reconciliation of Investments in Securities for which Level 3 inputs were used in determining value: |
Investments in Securities: | |
Bank Loan Obligations | |
Beginning Balance | $ 47,410,682 |
Net Realized Gain (Loss) on Investment Securities | 4,312 |
Net Unrealized Gain (Loss) on Investment Securities | (204,947) |
Cost of Purchases | 1,641,773 |
Proceeds of Sales | (30,267,248) |
Amortization/Accretion | (149,892) |
Transfers into Level 3 | 646,428 |
Transfers out of Level 3 | - |
Ending Balance | $ 19,081,108 |
The change in unrealized gain (loss) for the period attributable to Level 3 securities held at July 31, 2015 | $ 139,122 |
Other Investments in Securities: | |
Beginning Balance | $ 31,191,916 |
Net Realized Gain (Loss) on Investment Securities | (4,491,681) |
Net Unrealized Gain (Loss) on Investment Securities | 6,062,436 |
Cost of Purchases | 54,943 |
Proceeds of Sales | (15,938,523) |
Amortization/Accretion | 600,752 |
Transfers into Level 3 | 494,533 |
Transfers out of Level 3 | (2,319,862) |
Ending Balance | $ 15,654,514 |
The change in unrealized gain (loss) for the period attributable to Level 3 securities held at July 31, 2015 | $ 298,525 |
The information used in the above reconciliations represents fiscal year to date activity for any Investments in Securities identified as using Level 3 inputs at either the beginning or the end of the current fiscal period. Transfers in or out of Level 3 represent the beginning value of any Security or Instrument where a change in the pricing level occurred from the beginning to the end of the period. The cost of purchases and the proceeds of sales may include securities received or delivered through corporate actions or exchanges. Realized and unrealized gains (losses) disclosed in the reconciliation are included in Net Gain (Loss) on the Fund's Statement of Operations. |
Other Information |
The composition of credit quality ratings as a percentage of net assets is as follows (Unaudited): |
U.S. Government and U.S. Government Agency Obligations | 0.3% |
AAA,AA,A | 3.1% |
BBB | 9.5% |
BB | 9.6% |
B | 11.7% |
CCC,CC,C | 0.8% |
D | 0.0% |
Not Rated | 8.5% |
Equities | 50.2% |
Short-Term Investments and Net Other Assets | 6.3% |
| 100.0% |
We have used ratings from Moody's Investors Service, Inc. Where Moody's® ratings are not available, we have used S&P® ratings. All ratings are as of the date indicated and do not reflect subsequent changes. |
See accompanying notes which are an integral part of the financial statements.
Annual Report
Statement of Assets and Liabilities
| | July 31, 2015 |
| | |
Assets | | |
Investment in securities, at value (including securities loaned of $80,160) - See accompanying schedule: Unaffiliated issuers (cost $3,699,779,355) | $ 3,882,644,760 | |
Fidelity Central Funds (cost $212,496,253) | 212,496,253 | |
Other affiliated issuers (cost $130,288,234) | 164,220,943 | |
Total Investments (cost $4,042,563,842) | | $ 4,259,361,956 |
Cash | | 230,281 |
Foreign currency held at value (cost $2,357,093) | | 2,310,596 |
Receivable for investments sold | | 49,193,593 |
Receivable for fund shares sold | | 3,081,848 |
Dividends receivable | | 3,389,809 |
Interest receivable | | 18,490,023 |
Distributions receivable from Fidelity Central Funds | | 29,352 |
Other receivables | | 6,569 |
Total assets | | 4,336,094,027 |
| | |
Liabilities | | |
Payable for investments purchased | $ 6,702,493 | |
Payable for fund shares redeemed | 8,923,965 | |
Accrued management fee | 1,972,548 | |
Distribution and service plan fees payable | 357,265 | |
Other affiliated payables | 905,413 | |
Other payables and accrued expenses | 133,909 | |
Collateral on securities loaned, at value | 82,000 | |
Total liabilities | | 19,077,593 |
| | |
Net Assets | | $ 4,317,016,434 |
Net Assets consist of: | | |
Paid in capital | | $ 4,030,305,530 |
Undistributed net investment income | | 34,176,266 |
Accumulated undistributed net realized gain (loss) on investments and foreign currency transactions | | 35,806,504 |
Net unrealized appreciation (depreciation) on investments and assets and liabilities in foreign currencies | | 216,728,134 |
Net Assets | | $ 4,317,016,434 |
See accompanying notes which are an integral part of the financial statements.
Annual Report
Statement of Assets and Liabilities - continued
| | July 31, 2015 |
Calculation of Maximum Offering Price | | |
Class A: | | |
Net Asset Value and redemption price per share ($495,461,547 ÷ 42,506,436 shares) | | $ 11.66 |
| | |
Maximum offering price per share (100/96.00 of $11.66) | | $ 12.15 |
Class T: | | |
Net Asset Value and redemption price per share ($55,424,226 ÷ 4,752,349 shares) | | $ 11.66 |
| | |
Maximum offering price per share (100/96.00 of $11.66) | | $ 12.15 |
Class C: | | |
Net Asset Value and offering price per share ($291,386,883 ÷ 25,217,545 shares) | | $ 11.55 |
| | |
Real Estate Income: | | |
Net Asset Value, offering price and redemption price per share ($2,561,268,378 ÷ 218,691,778 shares) | | $ 11.71 |
| | |
Class I: | | |
Net Asset Value, offering price and redemption price per share ($913,475,400 ÷ 78,199,250 shares) | | $ 11.68 |
A Redemption price per share is equal to net asset value less any applicable contingent deferred sales charge.
See accompanying notes which are an integral part of the financial statements.
Annual Report
Financial Statements - continued
Statement of Operations
| Year ended July 31, 2015 |
Investment Income | | |
Dividends (including $8,112,653 earned from other affiliated issuers) | | $ 124,596,150 |
Interest | | 115,189,589 |
Income from Fidelity Central Funds | | 420,696 |
Total income | | 240,206,435 |
| | |
Expenses | | |
Management fee | $ 24,277,663 | |
Transfer agent fees | 9,546,099 | |
Distribution and service plan fees | 4,138,875 | |
Accounting and security lending fees | 1,344,494 | |
Custodian fees and expenses | 63,073 | |
Independent trustees' compensation | 18,479 | |
Registration fees | 214,976 | |
Audit | 177,427 | |
Legal | 10,279 | |
Miscellaneous | 28,304 | |
Total expenses before reductions | 39,819,669 | |
Expense reductions | (141,701) | 39,677,968 |
Net investment income (loss) | | 200,528,467 |
Realized and Unrealized Gain (Loss) Net realized gain (loss) on: | | |
Investment securities: | | |
Unaffiliated issuers | 54,227,022 | |
Foreign currency transactions | (19,715) | |
Total net realized gain (loss) | | 54,207,307 |
Change in net unrealized appreciation (depreciation) on: Investment securities | (52,090,713) | |
Assets and liabilities in foreign currencies | (93,516) | |
Total change in net unrealized appreciation (depreciation) | | (52,184,229) |
Net gain (loss) | | 2,023,078 |
Net increase (decrease) in net assets resulting from operations | | $ 202,551,545 |
See accompanying notes which are an integral part of the financial statements.
Annual Report
Statement of Changes in Net Assets
| Year ended
July 31,
2015 | Year ended
July 31,
2014 |
Increase (Decrease) in Net Assets | | |
Operations | | |
Net investment income (loss) | $ 200,528,467 | $ 170,741,524 |
Net realized gain (loss) | 54,207,307 | 105,884,376 |
Change in net unrealized appreciation (depreciation) | (52,184,229) | 30,348,946 |
Net increase (decrease) in net assets resulting from operations | 202,551,545 | 306,974,846 |
Distributions to shareholders from net investment income | (199,452,326) | (172,155,251) |
Distributions to shareholders from net realized gain | (75,677,564) | (78,297,244) |
Total distributions | (275,129,890) | (250,452,495) |
Share transactions - net increase (decrease) | 215,193,161 | (6,051,637) |
Redemption fees | 424,938 | 438,384 |
Total increase (decrease) in net assets | 143,039,754 | 50,909,098 |
| | |
Net Assets | | |
Beginning of period | 4,173,976,680 | 4,123,067,582 |
End of period (including undistributed net investment income of $34,176,266 and undistributed net investment income of $34,654,174, respectively) | $ 4,317,016,434 | $ 4,173,976,680 |
See accompanying notes which are an integral part of the financial statements.
Annual Report
Financial Highlights - Fidelity Real Estate Income Fund Class A
Years ended July 31, | 2015 | 2014 | 2013 | 2012 | 2011 |
Selected Per-Share Data | | | | | |
Net asset value, beginning of period | $ 11.86 | $ 11.67 | $ 11.26 | $ 10.73 | $ 9.94 |
Income from Investment Operations | | | | | |
Net investment income (loss) C | .52 | .49 | .54 | .52 | .53 |
Net realized and unrealized gain (loss) | .02 | .44 | .60 | .61 | .76 |
Total from investment operations | .54 | .93 | 1.14 | 1.13 | 1.29 |
Distributions from net investment income | (.52) | (.50) | (.53) | (.51) | (.50) |
Distributions from net realized gain | (.21) | (.24) | (.20) | (.10) | - |
Total distributions | (.74)I | (.74) | (.73) | (.60)H | (.50) |
Redemption fees added to paid in capitalC, G | - | - | - | - | - |
Net asset value, end of period | $ 11.66 | $ 11.86 | $ 11.67 | $ 11.26 | $ 10.73 |
Total ReturnA, B | 4.65% | 8.49% | 10.45% | 11.24% | 13.27% |
Ratios to Average Net AssetsD, F | | | | | |
Expenses before reductions | 1.04% | 1.06% | 1.08% | 1.12% | 1.13% |
Expenses net of fee waivers, if any | 1.03% | 1.05% | 1.08% | 1.12% | 1.13% |
Expenses net of all reductions | 1.03% | 1.05% | 1.07% | 1.11% | 1.12% |
Net investment income (loss) | 4.40% | 4.28% | 4.62% | 4.89% | 5.00% |
Supplemental Data | | | | | |
Net assets, end of period (000 omitted) | $ 495,462 | $ 442,271 | $ 378,269 | $ 137,352 | $ 60,283 |
Portfolio turnover rateE | 19% | 29% | 26% | 27% | 25% |
A Total returns would have been lower if certain expenses had not been reduced during the applicable periods shown.
B Total returns do not include the effect of the sales charges.
C Calculated based on average shares outstanding during the period.
D Fees and expenses of any underlying Fidelity Central Funds are not included in the Fund's expense ratio. The Fund indirectly bears its proportionate share of the expenses of any underlying Fidelity Central Funds.
E Amount does not include the portfolio activity of any underlying Fidelity Central Funds.
F Expense ratios reflect operating expenses of the class. Expenses before reductions do not reflect amounts reimbursed by the investment adviser or reductions from brokerage service arrangements or reductions from other expense offset arrangements and do not represent the amount paid by the class during periods when reimbursements or reductions occur. Expenses net of fee waivers reflect expenses after reimbursement by the investment adviser but prior to reductions from brokerage service arrangements or other expense offset arrangements. Expenses net of all reductions represent the net expenses paid by the class.
G Amount represents less than $.01 per share.
H Total distributions of $.60 per share is comprised of distributions from net investment income of $.505 and distributions from net realized gain of $.097 per share.
I Total distributions of $.74 per share is comprised of distributions from net investment income of $.523 and distributions from net realized gain of $.212 per share.
See accompanying notes which are an integral part of the financial statements.
Annual Report
Financial Highlights - Fidelity Real Estate Income Fund Class T
Years ended July 31, | 2015 | 2014 | 2013 | 2012 | 2011 |
Selected Per-Share Data | | | | | |
Net asset value, beginning of period | $ 11.86 | $ 11.67 | $ 11.26 | $ 10.72 | $ 9.94 |
Income from Investment Operations | | | | | |
Net investment income (loss) C | .51 | .49 | .54 | .52 | .52 |
Net realized and unrealized gain (loss) | .02 | .43 | .60 | .62 | .76 |
Total from investment operations | .53 | .92 | 1.14 | 1.14 | 1.28 |
Distributions from net investment income | (.52) | (.50) | (.53) | (.50) | (.50) |
Distributions from net realized gain | (.21) | (.24) | (.20) | (.10) | - |
Total distributions | (.73) | (.73) H | (.73) | (.60) | (.50) |
Redemption fees added to paid in capitalC, G | - | - | - | - | - |
Net asset value, end of period | $ 11.66 | $ 11.86 | $ 11.67 | $ 11.26 | $ 10.72 |
Total ReturnA, B | 4.62% | 8.44% | 10.42% | 11.33% | 13.11% |
Ratios to Average Net AssetsD, F | | | | | |
Expenses before reductions | 1.06% | 1.08% | 1.08% | 1.11% | 1.16% |
Expenses net of fee waivers, if any | 1.06% | 1.08% | 1.08% | 1.11% | 1.16% |
Expenses net of all reductions | 1.06% | 1.07% | 1.08% | 1.11% | 1.16% |
Net investment income (loss) | 4.37% | 4.26% | 4.61% | 4.90% | 4.96% |
Supplemental Data | | | | | |
Net assets, end of period (000 omitted) | $ 55,424 | $ 48,164 | $ 46,198 | $ 26,143 | $ 7,626 |
Portfolio turnover rateE | 19% | 29% | 26% | 27% | 25% |
A Total returns would have been lower if certain expenses had not been reduced during the applicable periods shown.
B Total returns do not include the effect of the sales charges.
C Calculated based on average shares outstanding during the period.
D Fees and expenses of any underlying Fidelity Central Funds are not included in the Fund's expense ratio. The Fund indirectly bears its proportionate share of the expenses of any underlying Fidelity Central Funds.
E Amount does not include the portfolio activity of any underlying Fidelity Central Funds.
F Expense ratios reflect operating expenses of the class. Expenses before reductions do not reflect amounts reimbursed by the investment adviser or reductions from brokerage service arrangements or reductions from other expense offset arrangements and do not represent the amount paid by the class during periods when reimbursements or reductions occur. Expenses net of fee waivers reflect expenses after reimbursement by the investment adviser but prior to reductions from brokerage service arrangements or other expense offset arrangements. Expenses net of all reductions represent the net expenses paid by the class.
G Amount represents less than $.01 per share.
H Total distributions of $.73 per share is comprised of distributions from net investment income of $.496 and distributions from net realized gain of $.236 per share.
See accompanying notes which are an integral part of the financial statements.
Annual Report
Financial Highlights - Fidelity Real Estate Income Fund Class C
Years ended July 31, | 2015 | 2014 | 2013 | 2012 | 2011 |
Selected Per-Share Data | | | | | |
Net asset value, beginning of period | $ 11.77 | $ 11.59 | $ 11.20 | $ 10.67 | $ 9.93 |
Income from Investment Operations | | | | | |
Net investment income (loss) C | .43 | .40 | .45 | .44 | .45 |
Net realized and unrealized gain (loss) | .01 | .43 | .60 | .62 | .74 |
Total from investment operations | .44 | .83 | 1.05 | 1.06 | 1.19 |
Distributions from net investment income | (.45) | (.42) | (.46) | (.43) | (.45) |
Distributions from net realized gain | (.21) | (.24) | (.20) | (.10) | - |
Total distributions | (.66) | (.65) H | (.66) | (.53) | (.45) |
Redemption fees added to paid in capitalC, G | - | - | - | - | - |
Net asset value, end of period | $ 11.55 | $ 11.77 | $ 11.59 | $ 11.20 | $ 10.67 |
Total ReturnA, B | 3.82% | 7.66% | 9.66% | 10.49% | 12.25% |
Ratios to Average Net AssetsD, F | | | | | |
Expenses before reductions | 1.79% | 1.79% | 1.81% | 1.87% | 1.89% |
Expenses net of fee waivers, if any | 1.78% | 1.79% | 1.81% | 1.87% | 1.89% |
Expenses net of all reductions | 1.78% | 1.79% | 1.81% | 1.87% | 1.89% |
Net investment income (loss) | 3.65% | 3.54% | 3.88% | 4.14% | 4.23% |
Supplemental Data | | | | | |
Net assets, end of period (000 omitted) | $ 291,387 | $ 246,306 | $ 204,012 | $ 52,780 | $ 21,555 |
Portfolio turnover rateE | 19% | 29% | 26% | 27% | 25% |
A Total returns would have been lower if certain expenses had not been reduced during the applicable periods shown.
B Total returns do not include the effect of the contingent deferred sales charge.
C Calculated based on average shares outstanding during the period.
D Fees and expenses of any underlying Fidelity Central Funds are not included in the Fund's expense ratio. The Fund indirectly bears its proportionate share of the expenses of any underlying Fidelity Central Funds.
E Amount does not include the portfolio activity of any underlying Fidelity Central Funds.
F Expense ratios reflect operating expenses of the class. Expenses before reductions do not reflect amounts reimbursed by the investment adviser or reductions from brokerage service arrangements or reductions from other expense offset arrangements and do not represent the amount paid by the class during periods when reimbursements or reductions occur. Expenses net of fee waivers reflect expenses after reimbursement by the investment adviser but prior to reductions from brokerage service arrangements or other expense offset arrangements. Expenses net of all reductions represent the net expenses paid by the class.
G Amount represents less than $.01 per share.
H Total distributions of $.65 per share is comprised of distributions from net investment income of $.417 and distributions from net realized gain of $.236 per share.
See accompanying notes which are an integral part of the financial statements.
Annual Report
Financial Highlights - Fidelity Real Estate Income Fund
Years ended July 31, | 2015 | 2014 | 2013 | 2012 | 2011 |
Selected Per-Share Data | | | | | |
Net asset value, beginning of period | $ 11.91 | $ 11.71 | $ 11.29 | $ 10.75 | $ 9.95 |
Income from Investment Operations | | | | | |
Net investment income (loss) B | .54 | .52 | .57 | .54 | .55 |
Net realized and unrealized gain (loss) | .02 | .44 | .60 | .62 | .76 |
Total from investment operations | .56 | .96 | 1.17 | 1.16 | 1.31 |
Distributions from net investment income | (.55) | (.53) | (.55) | (.52) | (.51) |
Distributions from net realized gain | (.21) | (.24) | (.20) | (.10) | - |
Total distributions | (.76) | (.76)G | (.75) | (.62) | (.51) |
Redemption fees added to paid in capitalB, F | - | - | - | - | - |
Net asset value, end of period | $ 11.71 | $ 11.91 | $ 11.71 | $ 11.29 | $ 10.75 |
Total ReturnA | 4.84% | 8.78% | 10.71% | 11.50% | 13.41% |
Ratios to Average Net AssetsC, E | | | | | |
Expenses before reductions | .83% | .83% | .84% | .90% | .92% |
Expenses net of fee waivers, if any | .82% | .83% | .84% | .89% | .92% |
Expenses net of all reductions | .82% | .83% | .84% | .89% | .92% |
Net investment income (loss) | 4.61% | 4.50% | 4.85% | 5.12% | 5.21% |
Supplemental Data | | | | | |
Net assets, end of period (000 omitted) | $ 2,561,268 | $ 2,627,382 | $ 2,884,545 | $ 2,252,149 | $ 1,660,063 |
Portfolio turnover rateD | 19% | 29% | 26% | 27% | 25% |
A Total returns would have been lower if certain expenses had not been reduced during the applicable periods shown.
B Calculated based on average shares outstanding during the period.
C Fees and expenses of any underlying Fidelity Central Funds are not included in the Fund's expense ratio. The Fund indirectly bears its proportionate share of the expenses of any underlying Fidelity Central Funds.
D Amount does not include the portfolio activity of any underlying Fidelity Central Funds.
E Expense ratios reflect operating expenses of the class. Expenses before reductions do not reflect amounts reimbursed by the investment adviser or reductions from brokerage service arrangements or reductions from other expense offset arrangements and do not represent the amount paid by the class during periods when reimbursements or reductions occur. Expenses net of fee waivers reflect expenses after reimbursement by the investment adviser but prior to reductions from brokerage service arrangements or other expense offset arrangements. Expenses net of all reductions represent the net expenses paid by the class.
F Amount represents less than $.01 per share.
G Total distributions of $.76 per share is comprised of distributions from net investment income of $.525 and distributions from net realized gain of $.236 per share.
See accompanying notes which are an integral part of the financial statements.
Annual Report
Financial Highlights - Fidelity Real Estate Income Fund Class I
Years ended July 31, | 2015 | 2014 | 2013 | 2012 | 2011 |
Selected Per-Share Data | | | | | |
Net asset value, beginning of period | $ 11.88 | $ 11.69 | $ 11.28 | $ 10.74 | $ 9.95 |
Income from Investment Operations | | | | | |
Net investment income (loss)B | .55 | .52 | .57 | .55 | .55 |
Net realized and unrealized gain (loss) | .02 | .44 | .60 | .62 | .76 |
Total from investment operations | .57 | .96 | 1.17 | 1.17 | 1.31 |
Distributions from net investment income | (.55) | (.53) | (.56) | (.53) | (.52) |
Distributions from net realized gain | (.21) | (.24) | (.20) | (.10) | - |
Total distributions | (.77) G | (.77) | (.76) | (.63) | (.52) |
Redemption fees added to paid in capitalB, F | - | - | - | - | - |
Net asset value, end of period | $ 11.68 | $ 11.88 | $ 11.69 | $ 11.28 | $ 10.74 |
Total ReturnA | 4.92% | 8.76% | 10.72% | 11.62% | 13.44% |
Ratios to Average Net AssetsC, E | | | | | |
Expenses before reductions | .77% | .78% | .80% | .84% | .89% |
Expenses net of fee waivers, if any | .77% | .78% | .80% | .84% | .89% |
Expenses net of all reductions | .77% | .78% | .80% | .84% | .89% |
Net investment income (loss) | 4.66% | 4.55% | 4.89% | 5.17% | 5.24% |
Supplemental Data | | | | | |
Net assets, end of period (000 omitted) | $ 913,475 | $ 809,854 | $ 610,045 | $ 217,435 | $ 43,282 |
Portfolio turnover rateD | 19% | 29% | 26% | 27% | 25% |
A Total returns would have been lower if certain expenses had not been reduced during the applicable periods shown.
B Calculated based on average shares outstanding during the period.
C Fees and expenses of any underlying Fidelity Central Funds are not included in the Fund's expense ratio. The Fund indirectly bears its proportionate share of the expenses of any underlying Fidelity Central Funds.
D Amount does not include the portfolio activity of any underlying Fidelity Central Funds.
E Expense ratios reflect operating expenses of the class. Expenses before reductions do not reflect amounts reimbursed by the investment adviser or reductions from brokerage service arrangements or reductions from other expense offset arrangements and do not represent the amount paid by the class during periods when reimbursements or reductions occur. Expenses net of fee waivers reflect expenses after reimbursement by the investment adviser but prior to reductions from brokerage service arrangements or other expense offset arrangements. Expenses net of all reductions represent the net expenses paid by the class.
F Amount represents less than $.01 per share.
G Total distributions of $.77 per share is comprised of distributions from net investment income of $.554 and distributions from net realized gain of $.212 per share.
See accompanying notes which are an integral part of the financial statements.
Annual Report
For the period ended July 31, 2015
1. Organization.
Fidelity Real Estate Income Fund (the Fund) is a fund of Fidelity Securities Fund (the Trust) and is authorized to issue an unlimited number of shares. The Trust is registered under the Investment Company Act of 1940, as amended (the 1940 Act), as an open-end management investment company organized as a Massachusetts business trust. The Fund offers Class A, Class T, Class C, Real Estate Income and Class I (formerly Institutional Class) shares, each of which has equal rights as to assets and voting privileges. Each class has exclusive voting rights with respect to matters that affect that class.
2. Investments in Fidelity Central Funds.
The Fund invests in Fidelity Central Funds, which are open-end investment companies generally available only to other investment companies and accounts managed by the investment adviser and its affiliates. The Fund's Schedule of Investments lists each of the Fidelity Central Funds held as of period end, if any, as an investment of the Fund, but does not include the underlying holdings of each Fidelity Central Fund. As an Investing Fund, the Fund indirectly bears its proportionate share of the expenses of the underlying Fidelity Central Funds.
The Money Market Central Funds seek preservation of capital and current income and are managed by Fidelity Investments Money Management, Inc. (FIMM), an affiliate of the investment adviser. Annualized expenses of the Money Market Central Funds as of their most recent shareholder report date are less than .01%.
A complete unaudited list of holdings for each Fidelity Central Fund is available upon request or at the Securities and Exchange Commission (the SEC) website at www.sec.gov. In addition, the financial statements of the Fidelity Central Funds, which are not covered by the Fund's Report of Independent Registered Public Accounting Firm, are available on the SEC website or upon request.
3. Significant Accounting Policies.
The financial statements have been prepared in conformity with accounting principles generally accepted in the United States of America (GAAP), which require management to make certain estimates and assumptions at the date of the financial statements. Actual results could differ from those estimates. Subsequent events, if any, through the date that the financial statements were issued have been evaluated in the preparation of the financial statements. The following summarizes the significant accounting policies of the Fund:
Annual Report
Notes to Financial Statements - continued
3. Significant Accounting Policies - continued
Investment Valuation. Investments are valued as of 4:00 p.m. Eastern time on the last calendar day of the period. The Board of Trustees (the Board) has delegated the day to day responsibility for the valuation of the Fund's investments to the Fidelity Management & Research Company (FMR) Fair Value Committee (the Committee). In accordance with valuation policies and procedures approved by the Board, the Fund attempts to obtain prices from one or more third party pricing vendors or brokers to value its investments. When current market prices, quotations or currency exchange rates are not readily available or reliable, investments will be fair valued in good faith by the Committee, in accordance with procedures adopted by the Board. Factors used in determining fair value vary by investment type and may include market or investment specific events, changes in interest rates and credit quality. The frequency with which these procedures are used cannot be predicted and they may be utilized to a significant extent. The Committee oversees the Fund's valuation policies and procedures and reports to the Board on the Committee's activities and fair value determinations. The Board monitors the appropriateness of the procedures used in valuing the Fund's investments and ratifies the fair value determinations of the Committee.
The Fund categorizes the inputs to valuation techniques used to value its investments into a disclosure hierarchy consisting of three levels as shown below:
Level 1 - quoted prices in active markets for identical investments
Level 2 - other significant observable inputs (including quoted prices for similar investments, interest rates, prepayment speeds, etc.)
Level 3 - unobservable inputs (including the Fund's own assumptions based on the best information available)
Valuation techniques used to value the Fund's investments by major category are as follows:
Equity securities, including restricted securities, for which market quotations are readily available, are valued at the last reported sale price or official closing price as reported by a third party pricing vendor on the primary market or exchange on which they are traded and are categorized as Level 1 in the hierarchy. In the event there were no sales during the day or closing prices are not available, securities are valued at the last quoted bid price or may be valued using the last available price and are generally categorized as Level 2 in the hierarchy. For foreign equity securities, when market or security specific events arise, comparisons to the valuation of American Depositary Receipts (ADRs), futures contracts, Exchange-Traded Funds (ETFs) and certain indexes as well as quoted prices for similar securities may be used and would be categorized as Level 2 in the hierarchy. Utilizing these techniques may result in transfers between Level 1 and Level 2.
Annual Report
3. Significant Accounting Policies - continued
Investment Valuation - continued
For equity securities, including restricted securities, where observable inputs are limited, assumptions about market activity and risk are used and these securities may be categorized as Level 3 in the hierarchy.
Debt securities, including restricted securities, are valued based on evaluated prices received from third party pricing vendors or from brokers who make markets in such securities. Corporate bonds, bank loan obligations and preferred securities are valued by pricing vendors who utilize matrix pricing which considers yield or price of bonds of comparable quality, coupon, maturity and type or by broker-supplied prices. Asset backed securities, collateralized mortgage obligations and commercial mortgage securities are valued by pricing vendors who utilize matrix pricing which considers prepayment speed assumptions, attributes of the collateral, yield or price of bonds of comparable quality, coupon, maturity and type or by broker-supplied prices. When independent prices are unavailable or unreliable, debt securities may be valued utilizing pricing methodologies which consider similar factors that would be used by third party pricing vendors. Debt securities are generally categorized as Level 2 in the hierarchy but may be Level 3 depending on the circumstances.
Investments in open-end mutual funds, including the Fidelity Central Funds, are valued at their closing net asset value (NAV) each business day and are categorized as Level 1 in the hierarchy.
Changes in valuation techniques may result in transfers in or out of an assigned level within the disclosure hierarchy. The aggregate value of investments by input level as of July 31, 2015, as well as a roll forward of Level 3 investments, is included at the end of the Fund's Schedule of Investments.
Foreign Currency. The Fund may use foreign currency contracts to facilitate transactions in foreign-denominated securities. Gains and losses from these transactions may arise from changes in the value of the foreign currency or if the counterparties do not perform under the contracts' terms.
Foreign-denominated assets, including investment securities, and liabilities are translated into U.S. dollars at the exchange rates at period end. Purchases and sales of investment securities, income and dividends received and expenses denominated in foreign currencies are translated into U.S. dollars at the exchange rate in effect on the transaction date.
The effects of exchange rate fluctuations on investments are included with the net realized and unrealized gain (loss) on investment securities. Other foreign currency transactions resulting in realized and unrealized gain (loss) are disclosed separately.
Annual Report
Notes to Financial Statements - continued
3. Significant Accounting Policies - continued
Investment Transactions and Income. For financial reporting purposes, the Fund's investment holdings and NAV include trades executed through the end of the last business day of the period. The NAV per share for processing shareholder transactions is calculated as of the close of business of the New York Stock Exchange (NYSE), normally 4:00 p.m. Eastern time and includes trades executed through the end of the prior business day. Gains and losses on securities sold are determined on the basis of identified cost. Dividend income is recorded on the ex-dividend date, except for certain dividends from foreign securities where the ex-dividend date may have passed, which are recorded as soon as the Fund is informed of the ex-dividend date. Non-cash dividends included in dividend income, if any, are recorded at the fair market value of the securities received. Income and capital gain distributions from Fidelity Central Funds, if any, are recorded on the ex-dividend date. Distributions received on securities that represent a return of capital or capital gain are recorded as a reduction of cost of investments and/or as a realized gain. Subsequent to ex-dividend date the Fund determines the components of these distributions, based upon receipt of tax filings or other correspondence relating to the underlying investment. Interest income is accrued as earned and includes coupon interest and amortization of premium and accretion of discount on debt securities as applicable. For certain lower credit quality securitized assets that have contractual cash flows (for example, asset backed securities, collateralized mortgage obligations and commercial mortgage-backed securities), changes in estimated cash flows are periodically evaluated and the estimated yield is adjusted on a prospective basis, resulting in increases or decreases to Interest Income in the accompanying Statement of Operations. Investment income is recorded net of foreign taxes withheld where recovery of such taxes is uncertain. Debt obligations may be placed on non-accrual status and related interest income may be reduced by ceasing current accruals and writing off interest receivables when the collection of all or a portion of interest has become doubtful based on consistently applied procedures. A debt obligation is removed from non-accrual status when the issuer resumes interest payments or when collectability of interest is reasonably assured.
Class Allocations and Expenses. Investment income, realized and unrealized capital gains and losses, common expenses of the Fund, and certain fund-level expense reductions, if any, are allocated daily on a pro-rata basis to each class based on the relative net assets of each class to the total net assets of the Fund. Each class differs with respect to transfer agent and distribution and service plan fees incurred. Certain expense reductions may also differ by class. For the reporting period, the allocated portion of income and expenses to each class as a percent of its average net assets may vary due to the timing of recording these transactions in relation to fluctuating net assets of the classes. Expenses directly attributable to a fund are charged to that fund. Expenses attributable to more than one fund are allocated among the respective funds on the basis of relative
Annual Report
3. Significant Accounting Policies - continued
Class Allocations and Expenses - continued
net assets or other appropriate methods. Expense estimates are accrued in the period to which they relate and adjustments are made when actual amounts are known.
Income Tax Information and Distributions to Shareholders. Each year, the Fund intends to qualify as a regulated investment company under Subchapter M of the Internal Revenue Code, including distributing substantially all of its taxable income and realized gains. As a result, no provision for U.S. Federal income taxes is required. As of July 31, 2015, the Fund did not have any unrecognized tax benefits in the financial statements; nor is the Fund aware of any tax positions for which it is reasonably possible that the total amounts of unrecognized tax benefits will significantly change in the next twelve months. The Fund files a U.S. federal tax return, in addition to state and local tax returns as required. The Fund's federal income tax returns are subject to examination by the Internal Revenue Service (IRS) for a period of three fiscal years after they are filed. State and local tax returns may be subject to examination for an additional fiscal year depending on the jurisdiction. Foreign taxes are provided for based on the Fund's understanding of the tax rules and rates that exist in the foreign markets in which it invests.
Distributions are declared and recorded on the ex-dividend date. Income dividends and capital gain distributions are declared separately for each class. Income and capital gain distributions are determined in accordance with income tax regulations, which may differ from GAAP. In addition, the Fund claimed a portion of the payment made to redeeming shareholders as a distribution for income tax purposes.
Capital accounts within the financial statements are adjusted for permanent book-tax differences. These adjustments have no impact on net assets or the results of operations. Capital accounts are not adjusted for temporary book-tax differences which will reverse in a subsequent period.
Book-tax differences are primarily due to foreign currency transactions, passive foreign investment companies (PFIC), market discount, equity-debt classifications, certain conversion ratio adjustments, partnerships and losses deferred due to wash sales.
The federal tax cost of investment securities and unrealized appreciation (depreciation) as of period end were as follows:
Gross unrealized appreciation | $ 367,906,812 |
Gross unrealized depreciation | (153,634,526) |
Net unrealized appreciation (depreciation) on securities | $ 214,272,286 |
| |
Tax Cost | $ 4,045,089,670 |
Annual Report
Notes to Financial Statements - continued
3. Significant Accounting Policies - continued
Income Tax Information and Distributions to Shareholders - continued
The tax-based components of distributable earnings as of period end were as follows:
Undistributed ordinary income | $ 36,563,408 |
Undistributed long-term capital gain | $ 36,541,226 |
Net unrealized appreciation (depreciation) on securities and other investments | $ 214,202,306 |
The tax character of distributions paid was as follows:
| July 31, 2015 | July 31, 2014 |
Ordinary Income | $ 202,287,403 | $ 185,363,562 |
Long-term Capital Gains | 72,842,487 | 65,088,933 |
Total | $ 275,129,890 | $ 250,452,495 |
Short-Term Trading (Redemption) Fees. Shares held by investors in the Fund less than 90 days may have been subject to a redemption fee equal to .75% of the NAV of shares redeemed. All redemption fees, which reduce the proceeds of the shareholder redemption, are retained by the Fund and accounted for as an addition to paid in capital.
Restricted Securities. The Fund may invest in securities that are subject to legal or contractual restrictions on resale. These securities generally may be resold in transactions exempt from registration or to the public if the securities are registered. Disposal of these securities may involve time-consuming negotiations and expense, and prompt sale at an acceptable price may be difficult. Information regarding restricted securities is included at the end of the Fund's Schedule of Investments.
Loans and Other Direct Debt Instruments. The Fund invests in direct debt instruments which are interests in amounts owed to lenders by corporate or other borrowers. These instruments may be in the form of loans, trade claims or other receivables and may include standby financing commitments such as revolving credit facilities that obligate the Fund to supply additional cash to the borrower on demand. Loans may be acquired through assignment or participation. The Fund did not have any unfunded loan commitments, which are contractual obligations for future funding, at period end.
4. Purchases and Sales of Investments.
Purchases and sales of securities, other than short-term securities and U.S. government securities, aggregated $987,134,266 and $778,719,087, respectively
Annual Report
5. Fees and Other Transactions with Affiliates.
Management Fee. Fidelity Management & Research Company (the investment adviser) and its affiliates provide the Fund with investment management related services for which the Fund pays a monthly management fee. The management fee is the sum of an individual fund fee rate that is based on an annual rate of .30% of the Fund's average net assets and an annualized group fee rate that averaged .25% during the period. The group fee rate is based upon the average net assets of all the mutual funds advised by the investment adviser, including any mutual funds previously advised by the investment adviser that are currently advised by Fidelity SelectCo, LLC, an affiliate of the investment adviser. The group fee rate decreases as assets under management increase and increases as assets under management decrease. For the reporting period, the total annual management fee rate was .55% of the Fund's average net assets.
Distribution and Service Plan Fees. In accordance with Rule 12b-1 of the 1940 Act, the Fund has adopted separate Distribution and Service Plans for each class of shares. Certain classes pay Fidelity Distributors Corporation (FDC), an affiliate of the investment adviser, separate Distribution and Service Fees, each of which is based on an annual percentage of each class' average net assets. In addition, FDC may pay financial intermediaries for selling shares of the Fund and providing shareholder support services.
For the period, the Distribution and Service Fee rates, total fees and amounts retained by FDC were as follows:
| Distribution
Fee | Service
Fee | Total Fees | Retained
by FDC |
Class A | -% | .25% | $ 1,204,578 | $ 56,339 |
Class T | -% | .25% | 133,672 | - |
Class C | .75% | .25% | 2,800,625 | 887,952 |
| | | $ 4,138,875 | $ 944,291 |
Sales Load. FDC may receive a front-end sales charge of up to 4.00% for selling Class A shares and Class T shares, some of which is paid to financial intermediaries for selling shares of the Fund. Depending on the holding period, FDC may receive contingent deferred sales charges levied on Class A, Class T, and Class C redemptions. The deferred sales charges are 1.00% for Class C shares, 1.00% for certain purchases of Class A shares and .25% for certain purchases of Class T shares.
Annual Report
Notes to Financial Statements - continued
5. Fees and Other Transactions with Affiliates - continued
Sales Load - continued
For the period, sales charge amounts retained by FDC were as follows:
| Retained
by FDC |
Class A | $ 68,997 |
Class T | 10,961 |
Class C* | 50,856 |
| $ 130,814 |
* When Class C shares are initially sold, FDC pays commissions from its own resources to financial intermediaries through which the sales are made.
Transfer Agent Fees. Fidelity Investments Institutional Operations Company, Inc., (FIIOC), an affiliate of the investment adviser, is the transfer, dividend disbursing and shareholder servicing agent for each class of the Fund. FIIOC receives account fees and asset-based fees that vary according to the account size and type of account of the shareholders of the respective classes of the Fund. FIIOC pays for typesetting, printing and mailing of shareholder reports, except proxy statements.
For the period, transfer agent fees for each class were as follows:
| Amount | % of
Class-Level Average
Net Assets |
Class A | $ 941,488 | .20 |
Class T | 118,992 | .22 |
Class C | 543,999 | .19 |
Real Estate Income | 6,234,517 | .23 |
Class I | 1,707,103 | .18 |
| $ 9,546,099 | |
Accounting and Security Lending Fees. Fidelity Service Company, Inc. (FSC), an affiliate of the investment adviser, maintains the Fund's accounting records. The accounting fee is based on the level of average net assets for each month. Under a separate contract, FSC administers the security lending program. The security lending fee is based on the number and duration of lending transactions.
Brokerage Commissions. The Fund placed a portion of its portfolio transactions with brokerage firms which are affiliates of the investment adviser. Brokerage commissions are included in net realized gain (loss) and change in net unrealized appreciation (depreciation) in the Statement of Operations. The commissions paid to these affiliated firms were $10,347 for the period.
Annual Report
6. Committed Line of Credit.
The Fund participates with other funds managed by the investment adviser or an affiliate in a $4.25 billion credit facility (the "line of credit") to be utilized for temporary or emergency purposes to fund shareholder redemptions or for other short-term liquidity purposes. The Fund has agreed to pay commitment fees on its pro-rata portion of the line of credit, which amounted to $6,409 and is reflected in Miscellaneous expenses on the Statement of Operations. During the period, the Fund did not borrow on this line of credit.
7. Security Lending.
The Fund lends portfolio securities through a lending agent from time to time in order to earn additional income. For equity securities, a lending agent is used and may loan securities to certain qualified borrowers, including Fidelity Capital Markets (FCM), a broker-dealer affiliated with the Fund. On the settlement date of the loan, the Fund receives collateral (in the form of U.S. Treasury obligations, letters of credit and/or cash) against the loaned securities and maintains collateral in an amount not less than 100% of the market value of the loaned securities during the period of the loan. The market value of the loaned securities is determined at the close of business of the Fund and any additional required collateral is delivered to the Fund on the next business day. If the borrower defaults on its obligation to return the securities loaned because of insolvency or other reasons, the Fund may apply collateral received from the borrower against the obligation. The Fund may experience delays and costs in recovering the securities loaned. Any cash collateral received is invested in the Fidelity Securities Lending Cash Central Fund. The value of loaned securities and cash collateral at period end are disclosed on the Fund's Statement of Assets and Liabilities. Security lending income represents the income earned on investing cash collateral, less rebates paid to borrowers and any lending agent fees associated with the loan, plus any premium payments received for lending certain types of securities. Security lending income is presented in the Statement of Operations as a component of income from Fidelity Central Funds. Total security lending income during the period amounted to $31,537. During the period, there were no securities loaned to FCM.
8. Expense Reductions.
Commissions paid to certain brokers with whom the investment adviser, or its affiliates, places trades on behalf of the Fund include an amount in addition to trade execution, which may be rebated back to the Fund to offset certain expenses. This amount totaled $22,713 for the period. In addition, through arrangements with the Fund's custodian, credits realized as a result of uninvested cash balances were used to reduce the Fund's expenses. During the period, these credits reduced the Fund's custody expenses by $2,498.
Annual Report
Notes to Financial Statements - continued
8. Expense Reductions - continued
In addition, during the period the investment adviser reimbursed/waived a portion of fund-level operating expenses in the amount of $17,421 and a portion of class-level operating expenses as follows:
| Amount |
Class A | $ 9,323 |
Class T | 1,074 |
Class C | 5,166 |
Real Estate Income | 66,942 |
Class I | 16,564 |
| $ 99,069 |
9. Distributions to Shareholders.
Distributions to shareholders of each class were as follows:
Years ended July 31, | 2015 | 2014 |
From net investment income | | |
Class A | $ 21,010,715 | $ 16,638,771 |
Class T | 2,305,119 | 1,842,576 |
Class C | 10,465,476 | 7,530,932 |
Real Estate Income | 122,206,251 | 117,401,887 |
Class I | 43,464,765 | 28,741,085 |
Total | $ 199,452,326 | $ 172,155,251 |
From net realized gain | | |
Class A | $ 7,958,848 | $ 7,591,572 |
Class T | 875,220 | 874,881 |
Class C | 4,645,932 | 4,152,718 |
Real Estate Income | 46,720,433 | 53,508,422 |
Class I | 15,477,131 | 12,169,651 |
Total | $ 75,677,564 | $ 78,297,244 |
10. Share Transactions.
Share transactions for each class were as follows and may contain automatic conversions between classes or exchanges between funds:
| Shares | Dollars |
Years ended July 31, | 2015 | 2014 | 2015 | 2014 |
Class A | | | | |
Shares sold | 17,614,783 | 18,815,698 | $ 207,492,435 | $ 217,399,754 |
Reinvestment of distributions | 2,253,682 | 1,805,230 | 26,209,333 | 20,178,624 |
Shares redeemed | (14,664,043) | (15,738,034) | (171,937,484) | (180,458,692) |
Net increase (decrease) | 5,204,422 | 4,882,894 | $ 61,764,284 | $ 57,119,686 |
Annual Report
10. Share Transactions - continued
| Shares | Dollars |
Years ended July 31, | 2015 | 2014 | 2015 | 2014 |
Class T | | | | |
Shares sold | 1,551,308 | 1,270,924 | $ 18,286,948 | $ 14,645,845 |
Reinvestment of distributions | 251,652 | 211,146 | 2,927,374 | 2,357,016 |
Shares redeemed | (1,110,729) | (1,380,258) | (13,074,996) | (15,703,373) |
Net increase (decrease) | 692,231 | 101,812 | $ 8,139,326 | $ 1,299,488 |
Class C | | | | |
Shares sold | 7,875,459 | 9,015,535 | $ 92,082,413 | $ 103,482,191 |
Reinvestment of distributions | 1,105,279 | 813,525 | 12,763,694 | 9,012,478 |
Shares redeemed | (4,690,719) | (6,508,928) | (54,577,835) | (73,908,752) |
Net increase (decrease) | 4,290,019 | 3,320,132 | $ 50,268,272 | $ 38,585,917 |
Real Estate Income | | | | |
Shares sold | 51,184,144 | 61,717,695 | $ 605,520,317 | $ 711,894,953 |
Reinvestment of distributions | 12,742,585 | 13,609,464 | 148,826,128 | 152,306,330 |
Shares redeemed | (65,882,524) | (100,931,769) | (777,479,294) | (1,156,054,958) |
Net increase (decrease) | (1,955,795) | (25,604,610) | $ (23,132,849) | $ (291,853,675) |
Class I | | | | |
Shares sold | 38,671,974 | 40,192,476 | $ 455,469,590 | $ 465,679,843 |
Reinvestment of distributions | 3,704,065 | 2,412,058 | 43,129,998 | 27,006,597 |
Shares redeemed | (32,342,580) | (26,626,486) | (380,445,460) | (303,889,493) |
Net increase (decrease) | 10,033,459 | 15,978,048 | $ 118,154,128 | $ 188,796,947 |
11. Other.
The Fund's organizational documents provide former and current trustees and officers with a limited indemnification against liabilities arising in connection with the performance of their duties to the Fund. In the normal course of business, the Fund may also enter into contracts that provide general indemnifications. The Fund's maximum exposure under these arrangements is unknown as this would be dependent on future claims that may be made against the Fund. The risk of material loss from such claims is considered remote.
Annual Report
To the Trustees of Fidelity Securities Fund and Shareholders of Fidelity Real Estate Income Fund:
We have audited the accompanying statement of assets and liabilities of Fidelity Real Estate Income Fund (the Fund), a fund of Fidelity Securities Fund, including the schedule of investments, as of July 31, 2015, and the related statement of operations for the year then ended, the statement of changes in net assets for each of the two years in the period then ended, and the financial highlights for each of the five years in the period then ended. These financial statements and financial highlights are the responsibility of the Fund's management. Our responsibility is to express an opinion on these financial statements and financial highlights based on our audits.
We conducted our audits in accordance with the standards of the Public Company Accounting Oversight Board (United States). Those standards require that we plan and perform the audit to obtain reasonable assurance about whether the financial statements and financial highlights are free of material misstatement. The Fund is not required to have, nor were we engaged to perform, an audit of its internal control over financial reporting. Our audits included consideration of internal control over financial reporting as a basis for designing audit procedures that are appropriate in the circumstances, but not for the purpose of expressing an opinion on the effectiveness of the Fund's internal control over financial reporting. Accordingly, we express no such opinion. An audit also includes examining, on a test basis, evidence supporting the amounts and disclosures in the financial statements, assessing the accounting principles used and significant estimates made by management, as well as evaluating the overall financial statement presentation. Our procedures included confirmation of securities owned as of July 31, 2015, by correspondence with the custodians, agent banks and brokers; when replies were not received from brokers, we performed other auditing procedures. We believe that our audits provide a reasonable basis for our opinion.
In our opinion, such financial statements and financial highlights referred to above present fairly, in all material respects, the financial position of Fidelity Real Estate Income Fund as of July 31, 2015, the results of its operations for the year then ended, the changes in its net assets for each of the two years in the period then ended, and the financial highlights for each of the five years in the period then ended, in conformity with accounting principles generally accepted in the United States of America.
DELOITTE & TOUCHE LLP
Boston, Massachusetts
September 24, 2015
Annual Report
The Trustees, Member of the Advisory Board, and officers of the trust and fund, as applicable, are listed below. The Board of Trustees governs the fund and is responsible for protecting the interests of shareholders. The Trustees are experienced executives who meet periodically throughout the year to oversee the fund's activities, review contractual arrangements with companies that provide services to the fund, oversee management of the risks associated with such activities and contractual arrangements, and review the fund's performance. Each of the Trustees oversees 170 funds.
The Trustees hold office without limit in time except that (a) any Trustee may resign; (b) any Trustee may be removed by written instrument, signed by at least two-thirds of the number of Trustees prior to such removal; (c) any Trustee who requests to be retired or who has become incapacitated by illness or injury may be retired by written instrument signed by a majority of the other Trustees; and (d) any Trustee may be removed at any special meeting of shareholders by a two-thirds vote of the outstanding voting securities of the trust. Each Trustee who is not an interested person (as defined in the 1940 Act) of the trust and the fund (Independent Trustee), shall retire not later than the last day of the calendar year in which his or her 75th birthday occurs. The Independent Trustees may waive this mandatory retirement age policy with respect to individual Trustees. The officers and Advisory Board Member hold office without limit in time, except that any officer and Advisory Board Member may resign or may be removed by a vote of a majority of the Trustees at any regular meeting or any special meeting of the Trustees. Except as indicated, each individual has held the office shown or other offices in the same company for the past five years.
Experience, Skills, Attributes, and Qualifications of the Fund's Trustees. The Governance and Nominating Committee has adopted a statement of policy that describes the experience, qualifications, attributes, and skills that are necessary and desirable for potential Independent Trustee candidates (Statement of Policy). The Board believes that each Trustee satisfied at the time he or she was initially elected or appointed a Trustee, and continues to satisfy, the standards contemplated by the Statement of Policy. The Governance and Nominating Committee also engages professional search firms to help identify potential Independent Trustee candidates who have the experience, qualifications, attributes, and skills consistent with the Statement of Policy. From time to time, additional criteria based on the composition and skills of the current Independent Trustees, as well as experience or skills that may be appropriate in light of future changes to board composition, business conditions, and regulatory or other developments, have also been considered by the professional search firms and the Governance and Nominating Committee. In addition, the Board takes into account the Trustees' commitment and participation in Board and committee meetings, as well as their leadership of standing and ad hoc committees throughout their tenure.
In determining that a particular Trustee was and continues to be qualified to serve as a Trustee, the Board has considered a variety of criteria, none of which, in isolation, was controlling. The Board believes that, collectively, the Trustees have balanced and diverse experience, qualifications, attributes, and skills, which allow the Board to operate effectively in governing the fund and protecting the interests of shareholders. Information about the specific experience, skills, attributes, and qualifications of each Trustee, which in each case led to the Board's conclusion that the Trustee should serve (or continue to serve) as a trustee of the fund, is provided below.
Annual Report
Trustees and Officers - continued
Board Structure and Oversight Function. James C. Curvey is an interested person (as defined in the 1940 Act) and currently serves as Chairman. The Trustees have determined that an interested Chairman is appropriate and benefits shareholders because an interested Chairman has a personal and professional stake in the quality and continuity of services provided to the fund. Independent Trustees exercise their informed business judgment to appoint an individual of their choosing to serve as Chairman, regardless of whether the Trustee happens to be independent or a member of management. The Independent Trustees have determined that they can act independently and effectively without having an Independent Trustee serve as Chairman and that a key structural component for assuring that they are in a position to do so is for the Independent Trustees to constitute a substantial majority for the Board. The Independent Trustees also regularly meet in executive session. Ned C. Lautenbach serves as Chairman of the Independent Trustees and as such (i) acts as a liaison between the Independent Trustees and management with respect to matters important to the Independent Trustees and (ii) with management prepares agendas for Board meetings.
Fidelity funds are overseen by different Boards of Trustees. The fund's Board oversees Fidelity's high income and certain equity funds and other Boards oversee Fidelity's investment-grade bond, money market, asset allocation, and sector funds. The asset allocation funds may invest in Fidelity funds overseen by the fund's Board. The use of separate Boards, each with its own committee structure, allows the Trustees of each group of Fidelity funds to focus on the unique issues of the funds they oversee, including common research, investment, and operational issues. On occasion, the separate Boards establish joint committees to address issues of overlapping consequences for the Fidelity funds overseen by each Board.
The Trustees operate using a system of committees to facilitate the timely and efficient consideration of all matters of importance to the Trustees, the fund, and fund shareholders and to facilitate compliance with legal and regulatory requirements and oversight of the fund's activities and associated risks. The Board, acting through its committees, has charged FMR and its affiliates with (i) identifying events or circumstances the occurrence of which could have demonstrably adverse effects on the fund's business and/or reputation; (ii) implementing processes and controls to lessen the possibility that such events or circumstances occur or to mitigate the effects of such events or circumstances if they do occur; and (iii) creating and maintaining a system designed to evaluate continuously business and market conditions in order to facilitate the identification and implementation processes described in (i) and (ii) above. Because the day-to-day operations and activities of the fund are carried out by or through FMR, its affiliates and other service providers, the fund's exposure to risks is mitigated but not eliminated by the processes overseen by the Trustees. While each of the Board's committees has responsibility for overseeing different aspects of the fund's activities, oversight is exercised primarily through the Operations, Audit, and Compliance Committees. In addition, the Independent Trustees have worked with FMR to enhance the Board's oversight of investment and financial risks, legal and regulatory risks, technology risks, and operational risks, including the development of additional risk reporting to the Board. For example, a working group comprised of Independent Trustees and FMR has worked and continues to work to review the Fidelity funds' valuation-related activities, reporting and risk management. Appropriate personnel, including but not limited to the fund's Chief Compliance Officer (CCO), FMR's internal auditor, the independent accountants, the fund's Treasurer and portfolio management personnel, make periodic reports to the Board's committees, as appropriate, including an annual review of FMR's risk management program for the Fidelity funds. The responsibilities of each standing committee, including their oversight responsibilities, are described further under "Standing Committees of the Fund's Trustees."
Annual Report
The fund's Statement of Additional Information (SAI) includes more information about the Trustees. To request a free copy, call Fidelity at 1-877-208-0098.
Interested Trustees*:
Correspondence intended for each Trustee who is an interested person may be sent to Fidelity Investments, 245 Summer Street, Boston, Massachusetts 02210.
Name, Year of Birth; Principal Occupations and Other Relevant Experience+ |
James C. Curvey (1935) |
Year of Election or Appointment: 2007 Trustee Chairman of the Board of Trustees |
| Mr. Curvey also serves as Trustee of other Fidelity funds. Mr. Curvey is a Director of Fidelity Research & Analysis Co. (investment adviser firm, 2009-present), and Vice Chairman (2007-present) and Director of FMR LLC (diversified financial services company). In addition, Mr. Curvey serves as an Overseer for the Boston Symphony Orchestra and a member of the board of Artis-Naples, Naples, Florida, and as a Trustee for Brewster Academy, Wolfeboro, New Hampshire. Previously, Mr. Curvey served as a Director of Fidelity Investments Money Management, Inc. (investment adviser firm, 2009-2014), a Director of FMR (investment adviser firm, 2007-2014), and a Director of FMR Co., Inc. (investment adviser firm, 2007-2014). |
Charles S. Morrison (1960) |
Year of Election or Appointment: 2014 Trustee |
| Mr. Morrison also serves as Trustee of other funds. He serves as a Director of Fidelity Investments Money Management, Inc. (FIMM) (investment adviser firm, 2014-present), Director of Fidelity SelectCo, LLC (investment adviser firm, 2014-present), President, Asset Management (2014-present), and is an employee of Fidelity Investments. Previously, Mr. Morrison served as Vice President of Fidelity's Fixed Income and Asset Allocation Funds (2012-2014), President, Fixed Income (2011-2014), Vice President of Fidelity's Money Market Funds (2005-2009), President, Money Market Group Leader of FMR (investment adviser firm, 2009), and Senior Vice President, Money Market Group of FMR (2004-2009). Mr. Morrison also served as Vice President of Fidelity's Bond Funds (2002-2005), certain Balanced Funds (2002-2005), and certain Asset Allocation Funds (2002-2007), and as Senior Vice President (2002-2005) of Fidelity's Bond Division. |
* Trustees have been determined to be "Interested Trustees" by virtue of, among other things, their affiliation with the trust or various entities under common control with FMR.
+ The information above includes each Trustee's principal occupation during the last five years and other information relating to the experience, attributes, and skills relevant to each Trustee's qualifications to serve as a Trustee, which led to the conclusion that each Trustee should serve as a Trustee for the fund.
Annual Report
Independent Trustees:
Correspondence intended for each Independent Trustee (that is, the Trustees other than the Interested Trustees) may be sent to Fidelity Investments, P.O. Box 55235, Boston, Massachusetts 02205-5235.
Name, Year of Birth; Principal Occupations and Other Relevant Experience+ |
Dennis J. Dirks (1948) |
Year of Election or Appointment: 2005 Trustee |
| Mr. Dirks also serves as Trustee of other Fidelity funds. Prior to his retirement in May 2003, Mr. Dirks was Chief Operating Officer and a member of the Board of The Depository Trust & Clearing Corporation (DTCC). He also served as President, Chief Operating Officer, and Board member of The Depository Trust Company (DTC) and President and Board member of the National Securities Clearing Corporation (NSCC). In addition, Mr. Dirks served as Chief Executive Officer and Board member of the Government Securities Clearing Corporation, Chief Executive Officer and Board member of the Mortgage-Backed Securities Clearing Corporation, as a Trustee and a member of the Finance Committee of Manhattan College (2005-2008), and as a Trustee and a member of the Finance Committee of AHRC of Nassau County (2006-2008). Mr. Dirks is a member of the Independent Directors Council (IDC) Governing Council (2010-present) and Board of Directors for The Brookville Center for Children's Services, Inc. (2009-present). |
Alan J. Lacy (1953) |
Year of Election or Appointment: 2008 Trustee |
| Mr. Lacy also serves as Trustee of other Fidelity funds. Mr. Lacy serves as a member of the Board of Directors of Dave & Buster's Entertainment, Inc. (restaurant and entertainment complexes, 2010-present) and Bristol-Myers Squibb Company (global pharmaceuticals, 2008-present). In addition, Mr. Lacy served as Senior Adviser (2007-2014) of Oak Hill Capital Partners, L.P. (private equity) and also served as Chief Executive Officer (2000-2005) and Vice Chairman (2005-2006) of Sears Holdings Corporation and Sears, Roebuck and Co. (retail). Mr. Lacy is a member of the Board of Trustees of The National Parks Conservation Association (2006-present). Previously, Mr. Lacy served as Chairman of the Board of Trustees of the National Parks Conservation Association (2008-2011) and as a member of the Board of Directors for The Western Union Company (global money transfer, 2006-2011), The Hillman Companies, Inc. (hardware wholesalers, 2010-2014), and Earth Fare, Inc. (retail grocery, 2010-2014). |
Ned C. Lautenbach (1944) |
Year of Election or Appointment: 2000 Trustee Chairman of the Independent Trustees |
| Mr. Lautenbach also serves as Trustee of other Fidelity funds. Mr. Lautenbach currently serves as the Lead Director of the Eaton Corporation Board of Directors (diversified industrial, 1997-present). Mr. Lautenbach is Chairman of the Board of Directors of Artis-Naples in Naples, Florida (2012-present), a member of the Council on Foreign Relations (1994-present), and a member of the Board of Governors, State University System of Florida (2013-present). Previously, Mr. Lautenbach was a Partner/Advisory Partner at Clayton, Dubilier & Rice, LLC (private equity investment, 1998-2010), as well as a Director of Sony Corporation (2006-2007). |
Joseph Mauriello (1944) |
Year of Election or Appointment: 2008 Trustee |
| Mr. Mauriello also serves as Trustee of other Fidelity funds. Prior to his retirement in January 2006, Mr. Mauriello served in numerous senior management positions including Deputy Chairman and Chief Operating Officer (2004-2005), and Vice Chairman of Financial Services (2002-2004) of KPMG LLP US (professional services, 1965-2005). Mr. Mauriello currently serves as a member of the Board of Directors of XL Group plc. (global insurance and re-insurance, 2006-present). Previously, Mr. Mauriello served as a Director of the Hamilton Funds of the Bank of New York (2006-2007) and of Arcadia Resources Inc. (health care services and products, 2007-2012). |
Robert W. Selander (1950) |
Year of Election or Appointment: 2011 Trustee |
| Mr. Selander also serves as Trustee of other Fidelity funds. Mr. Selander serves as a Director of The Western Union Company (global money transfer, 2014-present). Previously, Mr. Selander served as a Member of the Advisory Board of other Fidelity funds (2011), and Executive Vice Chairman (2010), Chief Executive Officer (2009-2010), and President and Chief Executive Officer (1997-2009) of Mastercard, Inc. |
Cornelia M. Small (1944) |
Year of Election or Appointment: 2005 Trustee |
| Ms. Small also serves as Trustee of other Fidelity funds. Ms. Small is a member of the Board of Directors (2009-present) and Chair of the Investment Committee (2010-present) of the Teagle Foundation. Ms. Small also serves on the Investment Committee of the Berkshire Taconic Community Foundation (2008-present). Previously, Ms. Small served as Chairperson (2002-2008) and a member of the Investment Committee and Chairperson (2008-2012) and a member of the Board of Trustees of Smith College. In addition, Ms. Small served as Chief Investment Officer, Director of Global Equity Investments, and a member of the Board of Directors of Scudder, Stevens & Clark and Scudder Kemper Investments. |
William S. Stavropoulos (1939) |
Year of Election or Appointment: 2002 Trustee Vice Chairman of the Independent Trustees |
| Mr. Stavropoulos also serves as Trustee of other Fidelity funds. Mr. Stavropoulos serves as President and Founder of the Michigan Baseball Foundation, the Great Lakes Loons (2007-present). Mr. Stavropoulos is Chairman Emeritus of the Board of Directors of The Dow Chemical Company, where he previously served in numerous senior management positions, including President, CEO (1995-2000; 2002-2004), Chairman of the Executive Committee (2000-2006), and as a member of the Board of Directors (1990-2006). Currently, Mr. Stavropoulos is Chairman of the Board of Directors of Univar Inc. (global distributor of commodity and specialty chemicals), a Director of Teradata Corporation (data warehousing and technology solutions), and Maersk Inc. (industrial conglomerate), and a member of the Advisory Board for Metalmark Capital LLC (private equity investment, 2005-present). Mr. Stavropoulos is an operating advisor to Clayton, Dubilier & Rice, LLC (private equity investment). In addition, Mr. Stavropoulos is a member of the University of Notre Dame Advisory Council for the College of Science, a Trustee of the Rollin L. Gerstacker Foundation, and a Director of the Naples Philharmonic Center for the Arts. Previously, Mr. Stavropoulos served as a Director of Chemical Financial Corporation (bank holding company, 1993-2012) and Tyco International, Ltd. (multinational manufacturing and services, 2007-2012). |
David M. Thomas (1949) |
Year of Election or Appointment: 2008 Trustee |
| Mr. Thomas also serves as Trustee of other Fidelity funds. Mr. Thomas serves as Non-Executive Chairman of the Board of Directors of Fortune Brands Home and Security (home and security products, 2011-present), as a member of the Board of Directors (2004-present) and Presiding Director (2013-present) of Interpublic Group of Companies, Inc. (marketing communication), and as a member of the Board of Trustees of the University of Florida (2013-present). Previously, Mr. Thomas served as Executive Chairman (2005-2006) and Chairman and Chief Executive Officer (2000-2005) of IMS Health, Inc. (pharmaceutical and healthcare information solutions), and a Director of Fortune Brands, Inc. (consumer products, 2000-2011). |
+ The information above includes each Trustee's principal occupation during the last five years and other information relating to the experience, attributes, and skills relevant to each Trustee's qualifications to serve as a Trustee, which led to the conclusion that each Trustee should serve as a Trustee for the fund.
Advisory Board Member and Officers:
Correspondence intended for each officer and Peter S. Lynch may be sent to Fidelity Investments, 245 Summer Street, Boston, Massachusetts 02210. Officers appear below in alphabetical order.
Name, Year of Birth; Principal Occupation |
Peter S. Lynch (1944) |
Year of Election or Appointment: 2003 Member of the Advisory Board |
| Mr. Lynch also serves as Member of the Advisory Board of other Fidelity funds. Mr. Lynch is Vice Chairman and a Director of FMR (investment adviser firm) and FMR Co., Inc. (investment adviser firm). In addition, Mr. Lynch serves as a Trustee of Boston College and as the Chairman of the Inner-City Scholarship Fund. Previously, Mr. Lynch served on the Special Olympics International Board of Directors (1997-2006). |
Christopher S. Bartel (1971) |
Year of Election or Appointment: 2009 Vice President |
| Mr. Bartel also serves as Vice President of other funds. Mr. Bartel serves as a Director, President, and Chief Executive Officer of Fidelity Management & Research (Japan) Limited (investment adviser firm, 2012-present), a Director of Fidelity Management & Research (Hong Kong) (investment adviser firm, 2012-present), and Senior Vice President of Global Equity Research (2010-present). Previously, Mr. Bartel served as Senior Vice President of Equity Research (2009-2010), Managing Director of Research (2006-2009), and an analyst and portfolio manager (2000-2006). |
Elizabeth Paige Baumann (1968) |
Year of Election or Appointment: 2012 Anti-Money Laundering (AML) Officer |
| Ms. Baumann also serves as AML Officer of other funds. She is Chief AML Officer of FMR LLC (diversified financial services company, 2012-present) and is an employee of Fidelity Investments. Previously, Ms. Baumann served as Vice President and Deputy Anti-Money Laundering Officer (2007-2012). |
Marc Bryant (1966) |
Year of Election or Appointment: 2015 Secretary and Chief Legal Officer (CLO) |
| Mr. Bryant also serves as Secretary and Chief Legal Officer (CLO) of other funds. He is Senior Vice President and Deputy General Counsel of FMR LLC (diversified financial services company). Previously, Mr. Bryant served as Secretary and Chief Legal Officer of Fidelity Rutland Square Trust II (2010-2014) and Assistant Secretary of Fidelity's Fixed Income and Asset Allocation Funds (2013-2015). Prior to joining Fidelity Investments, Mr. Bryant served as a Senior Vice President and the Head of Global Retail Legal for AllianceBernstein L.P. (2006-2010), and as the General Counsel for ProFund Advisors LLC (2001-2006). |
William C. Coffey (1969) |
Year of Election or Appointment: 2009 Assistant Secretary |
| Mr. Coffey also serves as Assistant Secretary of other funds. He is Senior Vice President and Deputy General Counsel of FMR LLC (diversified financial services company, 2010-present), and is an employee of Fidelity Investments. Previously, Mr. Coffey served as Vice President and Associate General Counsel of FMR LLC (2005-2009). |
Jonathan Davis (1968) |
Year of Election or Appointment: 2010 Assistant Treasurer |
| Mr. Davis also serves as Assistant Treasurer of other funds. Mr. Davis is an employee of Fidelity Investments. Previously, Mr. Davis served as Vice President and Associate General Counsel of FMR LLC (diversified financial services company, 2003-2010). |
Adrien E. Deberghes (1967) |
Year of Election or Appointment: 2008 Deputy Treasurer |
| Mr. Deberghes also serves as an officer of other funds. He is an employee of Fidelity Investments (2008-present). Prior to joining Fidelity Investments, Mr. Deberghes was Senior Vice President of Mutual Fund Administration at State Street Corporation (2007-2008), Senior Director of Mutual Fund Administration at Investors Bank & Trust (2005-2007), and Director of Finance for Dunkin' Brands (2000-2005). |
Stephanie J. Dorsey (1969) |
Year of Election or Appointment: 2010 Assistant Treasurer |
| Ms. Dorsey also serves as an officer of other funds. She is an employee of Fidelity Investments (2008-present) and has served in other fund officer roles. Prior to joining Fidelity Investments, Ms. Dorsey served as Treasurer (2004-2008) of the JPMorgan Mutual Funds and Vice President (2004-2008) of JPMorgan Chase Bank. |
Howard J. Galligan III (1966) |
Year of Election or Appointment: 2014 Chief Financial Officer |
| Mr. Galligan also serves as Chief Financial Officer of other funds. Mr. Galligan serves as President of Fidelity Pricing and Cash Management Services (FPCMS) (2014-present) and as a Director of Strategic Advisers, Inc. (investment adviser firm, 2008-present). Previously, Mr. Galligan served as Chief Administrative Officer of Asset Management (2011-2014) and Chief Operating Officer and Senior Vice President of Investment Support for Strategic Advisers, Inc. (2003-2011). |
Scott C. Goebel (1968) |
Year of Election or Appointment: 2015 Vice President |
| Mr. Goebel serves as an officer of other funds. Mr. Goebel also serves as Secretary of Fidelity SelectCo, LLC (investment adviser firm, 2013- present), Fidelity Investments Money Management, Inc. (FIMM) (investment adviser firm, 2010-present) and Fidelity Research and Analysis Company (FRAC) (investment adviser firm, 2010-present); General Counsel, Secretary, and Senior Vice President of FMR (investment adviser firm, 2008-present) and FMR Co., Inc. (investment adviser firm, 2008-present); Chief Legal Officer of Fidelity Management & Research (Hong Kong) Limited (investment adviser firm, 2008-present); and Assistant Secretary of Fidelity Management & Research (Japan) Limited (investment adviser firm, 2008-present) and FMR Investment Management (U.K.) Limited (investment adviser firm, 2008-present). Previously, Mr. Goebel served as Secretary and CLO of certain Fidelity funds (2008- 2015), Assistant Secretary of FIMM (2008-2010), FRAC (2008-2010), and certain funds (2007-2008); and as Vice President and Secretary of Fidelity Distributors Corporation (FDC) (2005-2007). Mr. Goebel has been employed by FMR LLC (diversified financial services company) or an affiliate since 2001. |
Brian B. Hogan (1964) |
Year of Election or Appointment: 2009 Vice President |
| Mr. Hogan also serves as Trustee or Vice President of other funds. Mr. Hogan serves as a Director of Fidelity SelectCo, LLC (investment adviser firm, 2014-present) and President of the Equity Division of FMR (investment adviser firm, 2009-present). Previously, Mr. Hogan served as Senior Vice President, Equity Research of FMR (2006-2009) and as a portfolio manager. |
Chris Maher (1972) |
Year of Election or Appointment: 2013 Assistant Treasurer |
| Mr. Maher serves as Assistant Treasurer of other funds. Mr. Maher is Vice President of Valuation Oversight and is an employee of Fidelity Investments. Previously, Mr. Maher served as Vice President of Asset Management Compliance (2013), Vice President of the Program Management Group of FMR (investment adviser firm, 2010-2013), and Vice President of Valuation Oversight (2008-2010). |
Kenneth B. Robins (1969) |
Year of Election or Appointment: 2008 President and Treasurer |
| Mr. Robins also serves as an officer of other funds. Mr. Robins serves as Executive Vice President of Fidelity Investments Money Management, Inc. (FIMM) (investment adviser firm, 2013-present) and is an employee of Fidelity Investments (2004-present). Previously, Mr. Robins served in other fund officer roles. |
Stephen Sadoski (1971) |
Year of Election or Appointment: 2012 Deputy Treasurer |
| Mr. Sadoski also serves as Deputy Treasurer of other funds. He is an employee of Fidelity Investments (2012-present) and has served in another fund officer role. Prior to joining Fidelity Investments, Mr. Sadoski served as an assistant chief accountant in the Division of Investment Management of the Securities and Exchange Commission (SEC) (2009-2012) and as a senior manager at Deloitte & Touche LLP (1997-2009). |
Stacie M. Smith (1974) |
Year of Election or Appointment: 2013 Deputy Treasurer |
| Ms. Smith also serves as an officer of other funds. She is an employee of Fidelity Investments (2009-present) and has served in other fund officer roles. Prior to joining Fidelity Investments, Ms. Smith served as Senior Audit Manager of Ernst & Young LLP (1996-2009). |
Renee Stagnone (1975) |
Year of Election or Appointment: 2013 Deputy Treasurer |
| Ms. Stagnone also serves as Deputy Treasurer of other funds. Ms. Stagnone is an employee of Fidelity Investments. |
Linda J. Wondrack (1964) |
Year of Election or Appointment: 2014 Chief Compliance Officer |
| Ms. Wondrack also serves as Chief Compliance Officer of other funds. Ms. Wondrack is Executive Vice President and head of the Ethics Office and Asset Management Compliance for Fidelity Investments (2012-present). Ms. Wondrack also serves as Chief Compliance Officer of Fidelity SelectCo, LLC (investment adviser firm, 2014-present); Chief Compliance Officer of Impresa Management LLC (2013-present); and Chief Compliance Officer of FMR Co., Inc. (investment adviser firm), Fidelity Investments Money Management, Inc. (investment adviser firm), Fidelity Management & Research (Japan) Limited (investment adviser firm), FMR Investment Management (U.K.) Limited (investment adviser firm), Fidelity Management & Research (Hong Kong) (investment adviser firm), Fidelity Management & Research Company (investment adviser firm), Pyramis Global Advisors, LLC (investment adviser firm), and Strategic Advisers, Inc. (investment adviser firm), Ballyrock Investment Advisors LLC, and Northern Neck Investors LLC (2012-present). Previously, Ms. Wondrack served as Senior Vice President and Chief Compliance Officer for Columbia Management Investment Advisers, LLC (2005-2012); Chief Compliance Officer for certain funds within the Columbia Family of Funds (2007-2012); and Senior Vice President of Compliance Risk Management at Bank of America (2005-2010). |
Joseph F. Zambello (1957) |
Year of Election or Appointment: 2011 Deputy Treasurer |
| Mr. Zambello also serves as Deputy Treasurer of other funds. Mr. Zambello is an employee of Fidelity Investments. Previously, Mr. Zambello served as Vice President of the Program Management Group of FMR (investment adviser firm, 2009-2011) and Vice President of the Transfer Agent Oversight Group (2005-2009). |
Annual Report
The Board of Trustees of Fidelity Advisor Real Estate Income Fund voted to pay to shareholders of record at the opening of business, the following distributions per share derived from capital gains realized from sales of portfolio securities, and dividends derived from net investment income:
| Pay Date | Record Date | Dividends | Capital Gains |
Class I | 09/14/15 | 09/11/15 | $0.127 | $0.102 |
The fund hereby designates as a capital gain dividend with respect to the taxable year ended July 31, 2015, $49,924,038, or, if subsequently determined to be different, the net capital gain of such year.
A total of 0.04% of the dividends distributed during the fiscal year was derived from interest on U.S. Government securities which is generally exempt from state income tax.
The fund will notify shareholders in January 2016 of amounts for use in preparing 2015 income tax returns.
Annual Report
Fidelity Real Estate Income Fund
Each year, the Board of Trustees, including the Independent Trustees (together, the Board), votes on the renewal of the management contract with Fidelity Management & Research Company (FMR) and the sub-advisory agreements (together, the Advisory Contracts) for the fund. The Board, assisted by the advice of fund counsel and Independent Trustees' counsel, requests and considers a broad range of information relevant to the renewal of the Advisory Contracts throughout the year.
The Board meets regularly and, at each of its meetings, covers an extensive agenda of topics and materials and considers factors that are relevant to its annual consideration of the renewal of the fund's Advisory Contracts, including the services and support provided to the fund and its shareholders. The Board has established various standing committees (Committees), each composed of and chaired by Independent Trustees with varying backgrounds, to which the Board has assigned specific subject matter responsibilities in order to enhance effective decision-making by the Board. The Board, acting directly and through its Committees, requests and receives information concerning the annual consideration of the renewal of the fund's Advisory Contracts. The Board also meets as needed to consider matters specifically related to the Board's annual consideration of the renewal of the Advisory Contracts. Members of the Board may also meet with trustees of other Fidelity funds through ad hoc joint committees to discuss certain matters relevant to all of the Fidelity funds.
At its July 2015 meeting, the Board unanimously determined to renew the fund's Advisory Contracts. In reaching its determination, the Board considered all factors it believed relevant, including (i) the nature, extent, and quality of the services to be provided to the fund and its shareholders (including the investment performance of the fund); (ii) the competitiveness of the fund's management fee and total expense ratio relative to peer funds; (iii) the total costs of the services to be provided by and the profits to be realized by Fidelity from its relationship with the fund; and (iv) the extent to which (if any) economies of scale exist and would be realized as the fund grows, and whether any economies of scale are appropriately shared with fund shareholders.
In considering whether to renew the Advisory Contracts for the fund, the Board reached a determination, with the assistance of fund counsel and Independent Trustees' counsel and through the exercise of its business judgment, that the renewal of the Advisory Contracts was in the best interests of the fund and its shareholders and that the compensation payable under the Advisory Contracts was fair and reasonable. The Board's decision to renew the Advisory Contracts was not based on any single factor, but rather was based on a comprehensive consideration of all the information provided to the Board at its meetings throughout the year. The Board, in reaching its determination to renew the Advisory Contracts, was aware that shareholders of the fund have a broad range of investment choices available to them, including a wide choice among funds offered by Fidelity's competitors, and that the fund's shareholders, who have the opportunity to review and weigh the disclosure provided by the fund in its prospectus and other public disclosures, have chosen to invest in this fund, which is part of the Fidelity family of funds.
Annual Report
Board Approval of Investment Advisory Contracts and
Management Fees - continued
Nature, Extent, and Quality of Services Provided. The Board considered Fidelity's staffing as it relates to the fund, including the backgrounds of investment personnel of Fidelity, and also considered the fund's investment objective, strategies, and related investment philosophy. The Independent Trustees also had discussions with senior management of Fidelity's investment operations and investment groups. The Board considered the structure of the portfolio manager compensation program and whether this structure provides appropriate incentives to act in the best interests of the fund. Additionally, the Board considered the portfolio managers' investments, if any, in the funds that they manage.
Resources Dedicated to Investment Management and Support Services. The Board and the Fund Oversight and Research Committees reviewed the general qualifications and capabilities of Fidelity's investment staff, including its size, education, experience, and resources, as well as Fidelity's approach to recruiting, training, managing, and compensating investment personnel. The Board noted that Fidelity has continued to increase the resources devoted to non-U.S. offices, including expansion of Fidelity's global investment organization. The Board also noted that Fidelity's analysts have extensive resources, tools and capabilities that allow them to conduct sophisticated quantitative and fundamental analysis, as well as credit analysis of issuers, counterparties and guarantors. Further, the Board considered that Fidelity's investment professionals have sufficient access to global information and data so as to provide competitive investment results over time, and that those professionals also have access to sophisticated tools that permit them to assess portfolio construction and risk and performance attribution characteristics continuously, as well as to transmit new information and research conclusions rapidly around the world. Additionally, in its deliberations, the Board considered Fidelity's trading, risk management, and compliance capabilities and resources, which are integral parts of the investment management process.
Shareholder and Administrative Services. The Board considered (i) the nature, extent, quality, and cost of advisory, administrative, and shareholder services performed by FMR, the sub-advisers (together with FMR, the Investment Advisers), and their affiliates under the Advisory Contracts and under separate agreements covering transfer agency, pricing and bookkeeping, and securities lending services for the fund; (ii) the nature and extent of the supervision of third party service providers, principally custodians and subcustodians; and (iii) the resources devoted to, and the record of compliance with, the fund's compliance policies and procedures. The Board also reviewed the allocation of fund brokerage, including allocations to brokers affiliated with the Investment Advisers, the use of brokerage commissions to pay fund expenses, and the use of "soft" commission dollars to pay for research services.
Annual Report
The Board noted that the growth of fund assets over time across the complex allows Fidelity to reinvest in the development of services designed to enhance the value or convenience of the Fidelity funds as investment vehicles. These services include 24-hour access to account information and market information through telephone representatives and over the Internet, investor education materials and asset allocation tools, and the expanded availability of Fidelity Investor Centers.
In 2014, the Board formed an ad hoc Committee on Transfer Agency Fees to review the variety of transfer agency fee structures throughout the industry and Fidelity's competitive positioning with respect to industry participants.
Investment in a Large Fund Family. The Board considered the benefits to shareholders of investing in a Fidelity fund, including the benefits of investing in a fund that is part of a large family of funds offering a variety of investment disciplines and providing a large variety of mutual fund investor services. The Board noted that Fidelity had taken, or had made recommendations that resulted in the Fidelity funds taking, a number of actions over the previous year that benefited particular funds, including (i) continuing to dedicate additional resources to investment research and to the support of the senior management team that oversees asset management; (ii) continuing efforts to enhance Fidelity's global research capabilities; (iii) launching new funds and making other enhancements to meet client needs; (iv) reducing management fees and total expenses for certain index funds and diversified international funds; (v) continuing to launch dedicated lower cost underlying funds to meet portfolio construction needs related to expanding underlying fund options for Fidelity funds of funds, specifically for the Freedom Fund product lines; (vi) rationalizing product lines and gaining increased efficiencies through fund mergers; (vii) launching active fixed-income exchange-traded funds; (viii) continuing to develop, acquire and implement systems and technology to improve services to the funds and information security and to increase efficiency; (ix) implementing investment enhancements to further strengthen Fidelity's target date product line to increase investors' probability of success in achieving their goals; (x) modifying the eligibility criteria for certain share classes to accommodate roll-over assets from employer-sponsored retirement plans; (xi) launching a new Class W of the Freedom Index Funds to attract and retain Fidelity record-kept retirement plan assets; and (xii) implementing changes to Fidelity's money market product line in response to recent money market regulatory reforms.
Investment Performance. The Board considered whether the fund has operated in accordance with its investment objective, as well as its record of compliance with its investment restrictions and its performance history.
Annual Report
Board Approval of Investment Advisory Contracts and
Management Fees - continued
The Board took into account discussions with representatives of the Investment Advisers about fund investment performance that occur at Board meetings throughout the year. In this regard the Board noted that as part of regularly scheduled fund reviews and other reports to the Board on fund performance, the Board considers annualized return information for the fund, for different time periods, measured against a securities market index ("benchmark index") and a peer group of funds with similar objectives ("peer group"), if any. In its evaluation of fund investment performance, the Board gave particular attention to information indicating changes in performance of certain Fidelity funds for specific time periods and discussed with the Investment Advisers the reasons for any overperformance or underperformance.
In addition to reviewing absolute and relative fund performance, the Independent Trustees periodically consider the appropriateness of fund performance metrics in evaluating the results achieved. In general, the Independent Trustees believe that fund performance should be evaluated based on net performance (after fees and expenses) of both the highest performing and lowest performing fund share classes, where applicable, compared to appropriate benchmark indices, over appropriate time periods that may include full market cycles, and compared to peer groups, as applicable, over the same periods, taking into account relevant factors including the following: general market conditions; issuer-specific information; and fund cash flows and other factors.
The Independent Trustees recognize that shareholders evaluate performance on a net basis over their own holding periods, for which one-, three-, and five-year periods are often used as a proxy. For this reason, the performance information reviewed by the Board also included net cumulative calendar year total return information for the fund and an appropriate benchmark index and peer group for the most recent one-, three-, and five-year periods, as shown below. Returns are shown compared to the 25th percentile (top of box, 75% beaten) and 75th percentile (bottom of box, 25% beaten) of the peer universe.
Annual Report
Fidelity Real Estate Income Fund
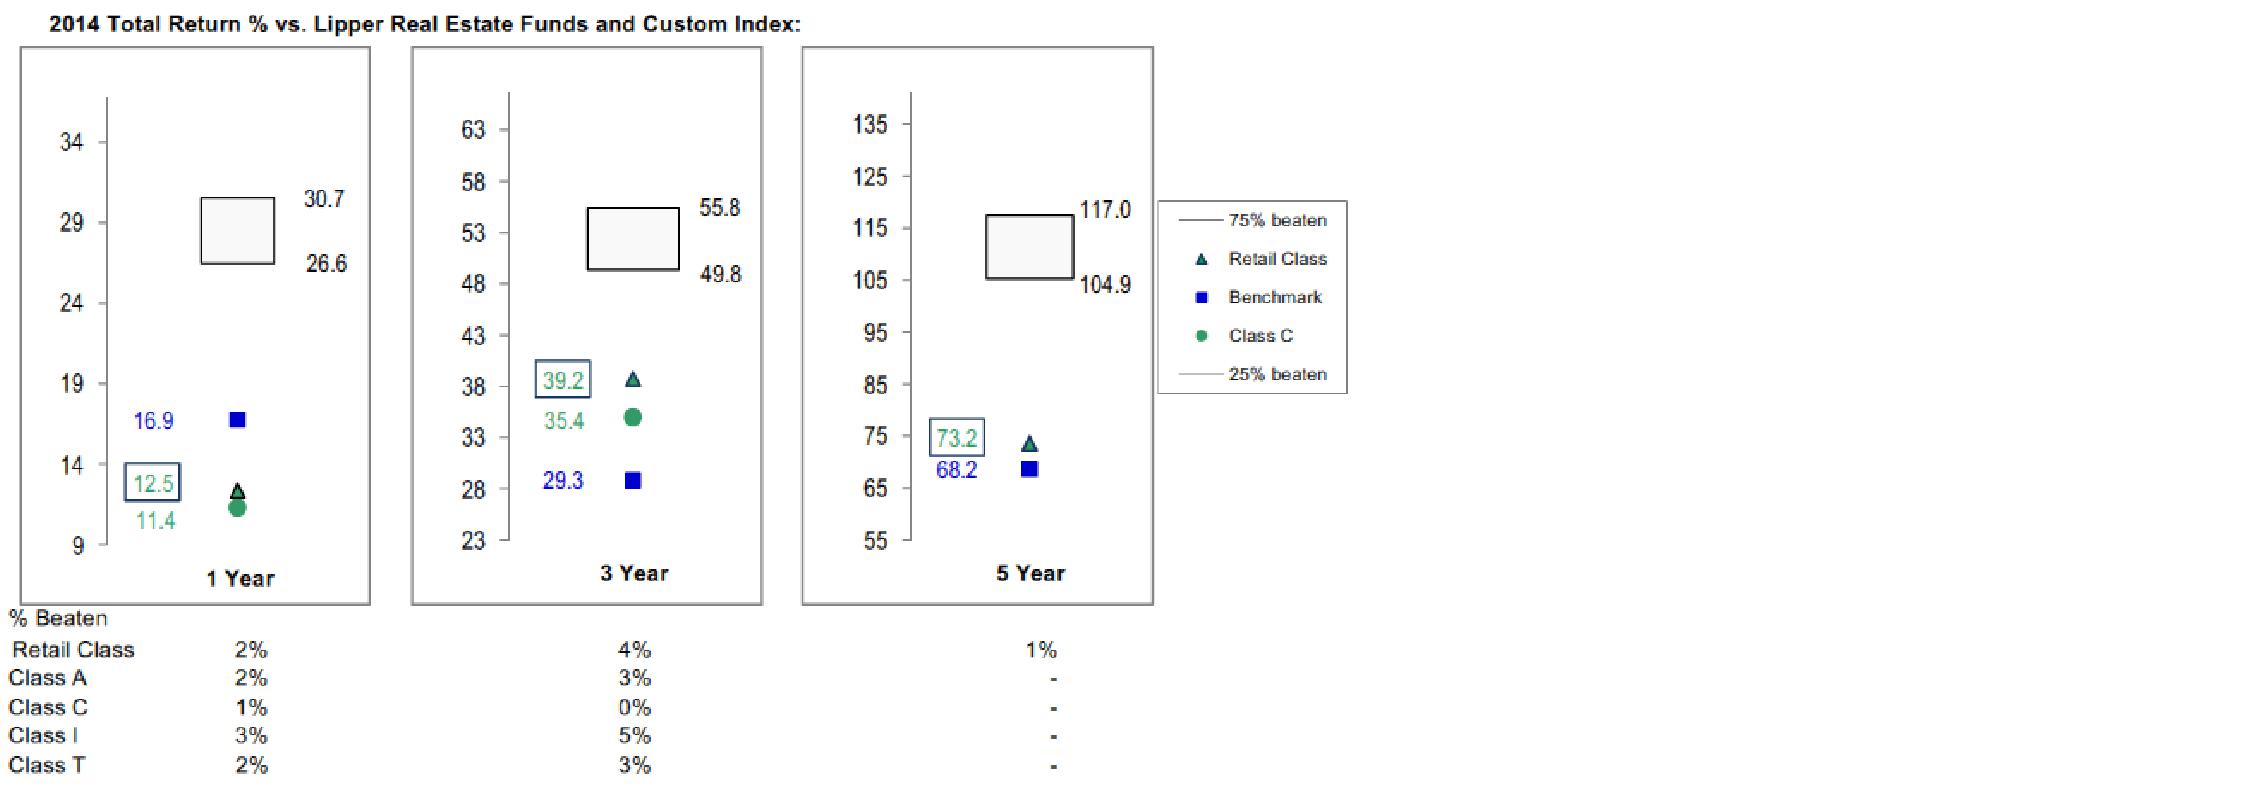
Based on its review, the Board concluded that the nature, extent, and quality of services provided to the fund under the Advisory Contracts should benefit the shareholders of the fund.
Competitiveness of Management Fee and Total Expense Ratio. The Board considered the fund's management fee and total expense ratio compared to "mapped groups" of competitive funds and classes created for the purpose of facilitating the Trustees' competitive analysis of management fees and total expenses. Fidelity creates "mapped groups" by combining similar Lipper investment objective categories that have comparable investment mandates. Combining Lipper investment objective categories aids the Board's management fee and total expense ratio comparisons by broadening the competitive group used for comparison.
Management Fee. The Board considered two proprietary management fee comparisons for the 12-month periods shown in basis points (BP) in the chart below. The group of Lipper funds used by the Board for management fee comparisons is referred to below as the "Total Mapped Group." The Total Mapped Group is broader than the Lipper peer group used by the Board for performance comparisons because the Total Mapped Group combines several Lipper investment objective categories while the Lipper peer group does not. The Total Mapped Group comparison focuses on a fund's standing in terms of gross management fees before expense reimbursements or caps relative to the total universe of funds with comparable investment mandates, regardless of whether their management fee structures also are comparable. Funds with comparable investment mandates offer exposure to similar types of securities. Funds with comparable management fee structures have similar management fee contractual arrangements (e.g., flat rate charged for advisory services, all-inclusive fee rate, etc.). "TMG %" represents the percentage of funds in the Total Mapped Group that had management fees that were lower than the fund's. For example, a hypothetical TMG % of 20% would mean that 80% of the funds in the Total Mapped Group had higher, and 20% had lower, management fees than the fund. The fund's actual TMG %s and the number of funds in the Total Mapped Group are in the chart below. The "Asset-Size Peer Group" (ASPG) comparison focuses on a fund's standing relative to a subset of non-Fidelity funds within the Total Mapped Group that are similar in size and management fee structure without taking into account performance adjustments, if any. For example, if a fund is in the first quartile of the ASPG, the fund's management fee ranks in the least expensive or lowest 25% of funds in the ASPG. The ASPG represents at least 15% of the funds in the Total Mapped Group with comparable asset size and management fee structures, subject to a minimum of 50 funds (or all funds in the Total Mapped Group if fewer than 50). Additional information, such as the ASPG quartile in which the fund's management fee rate ranked, is also included in the chart and considered by the Board.
Annual Report
Board Approval of Investment Advisory Contracts and
Management Fees - continued
Fidelity Real Estate Income Fund

The Board noted that the fund's management fee rate ranked below the median of its Total Mapped Group and below the median of its ASPG for 2014.
The Board noted that, in 2014, the ad hoc Committee on Group Fee was formed by it and other Fidelity fund boards to conduct an in-depth review of the "group fee" component of the management fee of funds with such management fee structures. Committee focus included the mechanics of the group fee, the competitive landscape of group fee structures, Fidelity funds with no group fee component and investment products not included in group fee assets. The Board also considered that, for funds subject to the group fee, FMR agreed to voluntarily waive fees over a specified period of time in amounts designed to account for assets converted from certain funds to certain collective investment trusts.
Annual Report
The Board also noted that, in 2013, the ad hoc Committee on Management Fees was formed to conduct an in-depth review of the management fee rates of Fidelity's active equity mutual funds. The Committee focused on the following areas: (i) standard fee structures; (ii) research consumption and trading evolution; (iii) management fee competitiveness/profitability by category; and (iv) factors that drive institutional pricing.
Based on its review, the Board concluded that the fund's management fee is fair and reasonable in light of the services that the fund receives and the other factors considered.
Total Expense Ratio. In its review of each class's total expense ratio, the Board considered the fund's management fee as well as other fund or class expenses, as applicable, such as transfer agent fees, pricing and bookkeeping fees, and custodial, legal, and audit fees. The Board also noted that Fidelity may agree to waive fees and expenses from time to time, and the extent to which, if any, it has done so for the fund. As part of its review, the Board also considered the current and historical total expense ratios of each class of the fund compared to competitive fund median expenses. Each class of the fund is compared to those funds and classes in the Total Mapped Group (used by the Board for management fee comparisons) that have a similar sales load structure.
The Board noted that the total expense ratio of each class ranked below its competitive median for 2014.
Fees Charged to Other Fidelity Clients. The Board also considered Fidelity fee structures and other information with respect to clients of Fidelity, such as other funds advised or subadvised by Fidelity, pension plan clients, and other institutional clients with similar mandates. The Board noted the findings of the 2013 ad hoc joint committee (created with the board of other Fidelity funds), which reviewed and compared Fidelity's institutional investment advisory business with its business of providing services to the Fidelity funds, including the differences in services provided, fees charged, and costs incurred, as well as competition in their respective marketplaces.
Based on its review of total expense ratios and fees charged to other Fidelity clients, the Board concluded that the total expense ratio of each class of the fund was reasonable in light of the services that the fund and its shareholders receive and the other factors considered.
Annual Report
Board Approval of Investment Advisory Contracts and
Management Fees - continued
Costs of the Services and Profitability. The Board considered the revenues earned and the expenses incurred by Fidelity in conducting the business of developing, marketing, distributing, managing, administering and servicing the fund and servicing the fund's shareholders. The Board also considered the level of Fidelity's profits in respect of all the Fidelity funds.
On an annual basis, Fidelity presents to the Board information about the profitability of its relationship with the fund. Fidelity calculates profitability information for each fund, as well as aggregate profitability information for groups of Fidelity funds and all Fidelity funds, using a series of detailed revenue and cost allocation methodologies which originate with the books and records of Fidelity on which Fidelity's audited financial statements are based. The Audit Committee of the Board reviews any significant changes from the prior year's methodologies.
PricewaterhouseCoopers LLP (PwC), independent registered public accounting firm and auditor to Fidelity and certain Fidelity funds, has been engaged annually by the Board as part of the Board's assessment of Fidelity's profitability analysis. PwC's engagement includes the review and assessment of the methodologies used by Fidelity in determining the revenues and expenses attributable to Fidelity's mutual fund business, and completion of agreed-upon procedures in respect of the mathematical accuracy of fund profitability and its conformity to established allocation methodologies. After considering PwC's reports issued under the engagement and information provided by Fidelity, the Board concluded that while other allocation methods may also be reasonable, Fidelity's profitability methodologies are reasonable in all material respects.
The Board also reviewed Fidelity's non-fund businesses and fall-out benefits related to the mutual fund business as well as cases where Fidelity's affiliates may benefit from or be related to the fund's business.
The Board considered the costs of the services provided by and the profits realized by Fidelity in connection with the operation of the fund and was satisfied that the profitability was not excessive.
Economies of Scale. The Board considered whether there have been economies of scale in respect of the management of the Fidelity funds, whether the Fidelity funds (including the fund) have appropriately benefited from any such economies of scale, and whether there is potential for realization of any further economies of scale. The Board considered the extent to which the fund will benefit from economies of scale as assets grow through increased services to the fund, through waivers or reimbursements, or through fee or expense ratio reductions. The Board also noted that in 2013, it and the boards of other Fidelity funds created an ad hoc committee (the Economies of Scale Committee) to analyze whether Fidelity attains economies of scale in respect of the
Annual Report
management and servicing of the Fidelity funds, whether the Fidelity funds have appropriately benefited from such economies of scale, and whether there is potential for realization of any further economies of scale.
The Board recognized that the fund's management contract incorporates a "group fee" structure, which provides for lower group fee rates as total group assets increase, and for higher group fee rates as total group assets decrease (with "group assets" defined to include fund assets under FMR's management plus sector fund assets previously under FMR's management and currently managed by Fidelity SelectCo, LLC). FMR calculates the group fee rates based on a tiered asset "breakpoint" schedule that varies based on asset class. The Board considered that the group fee is designed to deliver the benefits of economies of scale to fund shareholders when total Fidelity fund assets increase, even if assets of any particular fund are unchanged or have declined, because some portion of Fidelity's costs are attributable to services provided to all Fidelity funds, and all funds benefit if those costs can be allocated among more assets. The Board concluded that, given the group fee structure, fund shareholders will benefit from lower management fees as group assets increase at the fund complex level, regardless of whether Fidelity achieves any such economies of scale.
The Board concluded, taking into account the analysis of the Economies of Scale Committee, that economies of scale, if any, are being appropriately shared between fund shareholders and Fidelity.
Additional Information Requested by the Board. In order to develop fully the factual basis for consideration of the Fidelity funds' Advisory Contracts, the Board requested and received additional information on certain topics, including: (i) fund performance trends and Fidelity's long-term strategies for certain funds; (ii) the various share classes employed by Fidelity and the attributes of each class, together with similar information on the distribution and servicing payments made by Fidelity or the funds to third-party participants in the distribution channels; (iii) fund profitability, and fund performance in relation to fund profitability; (iv) the methodology with respect to evaluating competitive fund data and peer group classifications and fee comparisons; (v) annual fund profitability margins, with particular focus on certain funds with negative margins; (vi) the realization of fall-out benefits in certain Fidelity business units; (vii) economies of scale and the way in which they are shared with fund shareholders; (viii) Fidelity's group fee structures, including the group fee schedule of breakpoints; (ix) the impact of cost containment measures on the funds; and (x) the transfer agent fee structure.
Based on its evaluation of all of the conclusions noted above, and after considering all factors it believed relevant, the Board concluded that the advisory fee structures are fair and reasonable, and that the fund's Advisory Contracts should be renewed.
Annual Report
Investment Adviser
Fidelity Management & Research Company
Boston, MA
Investment Sub-Advisers
FMR Co., Inc.
Fidelity Management & Research
(Hong Kong) Limited
Fidelity Management & Research
(Japan) Inc.
FMR Investment Management
(U.K.) Limited
General Distributor
Fidelity Distributors Corporation
Smithfield, RI
Transfer and Service Agents
Fidelity Investments Institutional
Operations Company, Inc.
Boston, MA
Fidelity Service Company, Inc.
Boston, MA
Custodian
The Northern Trust Company
Chicago, IL
(Fidelity Investment logo)(registered trademark)
REII-UANN-0915
1.907540.105
Fidelity®
Series Real Estate Income
Fund
Fidelity Series Real Estate Income
Fund Class F
Annual Report
July 31, 2015
(Fidelity Cover Art)
Contents
Performance | (Click Here) | How the fund has done over time. |
Management's Discussion of Fund Performance | (Click Here) | The Portfolio Manager's review of fund performance and strategy. |
Shareholder Expense Example | (Click Here) | An example of shareholder expenses. |
Investment Changes | (Click Here) | A summary of major shifts in the fund's investments over the past six months. |
Investments | (Click Here) | A complete list of the fund's investments with their market values. |
Financial Statements | (Click Here) | Statements of assets and liabilities, operations, and changes in net assets, as well as financial highlights. |
Notes | (Click Here) | Notes to the financial statements. |
Report of Independent Registered Public Accounting Firm | (Click Here) | |
Trustees and Officers | (Click Here) | |
Distributions | (Click Here) | |
Board Approval of Investment Advisory Contracts and Management Fees | (Click Here) | |
To view a fund's proxy voting guidelines and proxy voting record for the 12-month period ended June 30, visit http://www.fidelity.com/proxyvotingresults or visit the Securities and Exchange Commission's (SEC) web site at http://www.sec.gov. You may also call 1-800-544-8544 for Fidelity® Series Real Estate Income Fund or 1-800-835-5092 for Class F of the fund to request a free copy of the proxy voting guidelines.
Standard & Poor's, S&P and S&P 500 are registered service marks of The McGraw-Hill Companies, Inc. and have been licensed for use by Fidelity Distributors Corporation.
Other third-party marks appearing herein are the property of their respective owners.
All other marks appearing herein are registered or unregistered trademarks or service marks of FMR LLC or an affiliated company. © 2015 FMR LLC. All rights reserved.
Annual Report
This report and the financial statements contained herein are submitted for the general information of the shareholders of the fund. This report is not authorized for distribution to prospective investors in the fund unless preceded or accompanied by an effective prospectus.
A fund files its complete schedule of portfolio holdings with the SEC for the first and third quarters of each fiscal year on Form N-Q. Forms N-Q are available on the SEC's web site at http://www.sec.gov. A fund's Forms N-Q may be reviewed and copied at the SEC's Public Reference Room in Washington, DC. Information regarding the operation of the SEC's Public Reference Room may be obtained by calling 1-800-SEC-0330. For a complete list of a fund's portfolio holdings, view the most recent holdings listing, semiannual report, or annual report on Fidelity's web site at http://www.fidelity.com, http://www.advisor.fidelity.com, or http://www.401k.com, as applicable.
NOT FDIC INSURED • MAY LOSE VALUE • NO BANK GUARANTEE
Neither the fund nor Fidelity Distributors Corporation is a bank.
Annual Report
Average annual total return reflects the change in the value of an investment, assuming reinvestment of the class' distributions from dividend income and capital gains (the profits earned upon the sale of securities that have grown in value, if any) and assuming a constant rate of performance each year. The $10,000 table and the fund's returns do not reflect the deduction of taxes that a shareholder would pay on fund distributions or the redemption of fund shares. During periods of reimbursement by Fidelity, a fund's total return will be greater than it would be had the reimbursement not occurred. How a fund did yesterday is no guarantee of how it will do tomorrow.
Average Annual Total Returns
Periods ended July 31, 2015 | Past 1
year | Life of
fund A |
Fidelity® Series Real Estate Income Fund | 5.05% | 10.16% |
Class F | 5.22% | 10.37% |
A From October 20, 2011.
$10,000 Over Life of Fund
Let's say hypothetically that $10,000 was invested in Fidelity Series Real Estate Income Fund, a class of the fund, on October 20, 2011, when the fund started. The chart shows how the value of your investment would have changed, and also shows how the S&P 500® Index performed over the same period.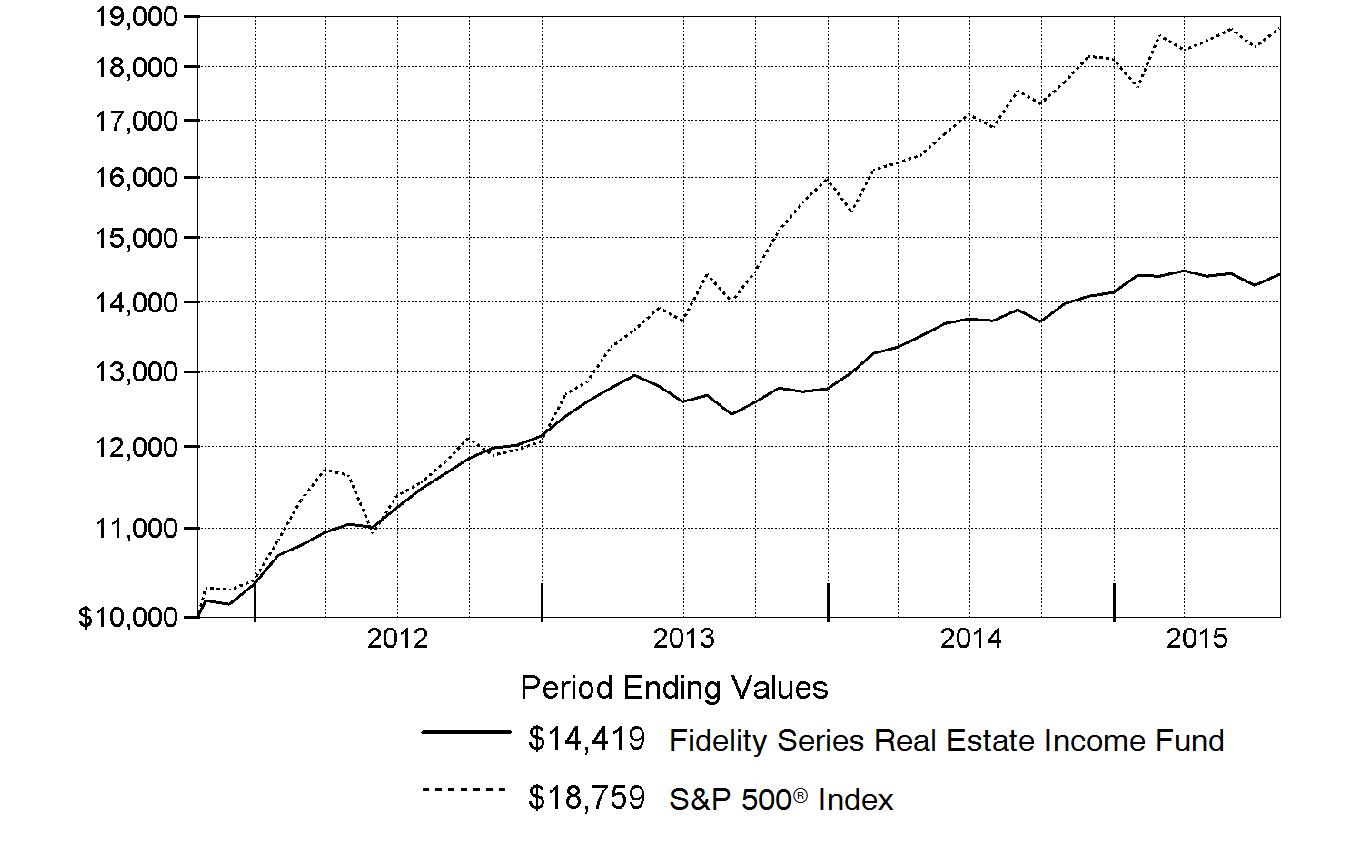
Annual Report
Market Recap: For the 12 months ending July 31, 2015, real estate securities experienced greater volatility than normal for most historical time periods, partly due to the market's reaction to changing interest rate expectations. In the first half of the period, real estate common stocks, as measured by the FTSE® NAREIT® All REITs Index, rose sharply but, with an increase in rates, subsequently gave back much of those gains before enjoying somewhat better results in the period's final weeks. All told, the FTSE® NAREIT® index rose 8.99%. Meanwhile, the MSCI REIT Preferred Index, a proxy for the real estate preferred stock segment, gained 8.93%, a relatively strong result that partly reflected their somewhat low valuations on a historical basis coming into the reporting period. On the market's fixed-income side, The BofA Merrill LynchSM US Real Estate Index - a market-capitalization-weighted measure of investment-grade corporate debt in the domestic real estate sector - rose 3.05%. The market performance took place against a continued solid fundamental backdrop for commercial real estate. The creation of property supply was still moderate, while companies generally experienced growing occupancies or rents, which in turn helped lift cash flows for real estate owners.
Comments from Portfolio Manager Mark Snyderman: For the year, the fund's share classes fell short of my target for a mid- to upper-single-digit return. (For specific class-level results, please see the Performance section of this report.) At the same time, its share classes trailed the 6.03% return of the sector benchmark Fidelity Series Real Estate Income Composite IndexSM - a 40/50/10 blend of the MSCI REIT Preferred Index, The BofA Merrill LynchSM US Real Estate Index and the FTSE® NAREIT® All REITs Index, respectively. The fund's preferred stocks gained 8%, nearly matching the return of the MSCI preferred stock index. I tend to favor preferreds with higher coupons and lower interest-rate sensitivity. Thus, I was somewhat surprised that my preferred stock holdings kept pace with the index gain, given that rates overall fell this past year. The fund's bond investments also generally did well. Our commercial mortgage backed securities (CMBS) holdings and high-yield real estate bonds returned 6% and approximately 4%, respectively, outpacing the 3% increase in the BofA Merrill Lynch index. Meanwhile, our investment-grade positions beat that measure only slightly. Good credit research helped drive the outperformance from CMBS and high-yield securities, but helped to a lesser extent with our investment-grade holdings. Meanwhile, the fund's real estate common stock investments added roughly 8%, behind the 9% increase in the FTSE NAREIT index. A negative performance factor was the fund's average cash allocation of 5%, a normal level of cash for this fund that nevertheless hurt during a rising market.
The views expressed above reflect those of the portfolio manager(s) only through the end of the period as stated on the cover of this report and do not necessarily represent the views of Fidelity or any other person in the Fidelity organization. Any such views are subject to change at any time based upon market or other conditions and Fidelity disclaims any responsibility to update such views. These views may not be relied on as investment advice and, because investment decisions for a Fidelity fund are based on numerous factors, may not be relied on as an indication of trading intent on behalf of any Fidelity fund.
Annual Report
Shareholder Expense Example
As a shareholder of the Fund, you incur two types of costs: (1) transaction costs, and (2) ongoing costs, including management fees and other Fund expenses. This Example is intended to help you understand your ongoing costs (in dollars) of investing in the Fund and to compare these costs with the ongoing costs of investing in other mutual funds.
The Example is based on an investment of $1,000 invested at the beginning of the period and held for the entire period (February 1, 2015 to July 31, 2015).
Actual Expenses
The first line of the accompanying table for each class of the Fund provides information about actual account values and actual expenses. You may use the information in this line, together with the amount you invested, to estimate the expenses that you paid over the period. Simply divide your account value by $1,000.00 (for example, an $8,600 account value divided by $1,000.00 = 8.6), then multiply the result by the number in the first line for a class of the Fund under the heading entitled "Expenses Paid During Period" to estimate the expenses you paid on your account during this period. In addition, the Fund, as a shareholder in the underlying Fidelity Central Funds, will indirectly bear its pro-rata share of the fees and expenses incurred by the underlying Fidelity Central Funds. These fees and expenses are not included in the Fund's annualized expense ratio used to calculate the expense estimate in the table below.
Hypothetical Example for Comparison Purposes
The second line of the accompanying table for each class of the Fund provides information about hypothetical account values and hypothetical expenses based on a Class' actual expense ratio and an assumed rate of return of 5% per year before expenses, which is not the Class' actual return. The hypothetical account values and expenses may not be used to estimate the actual ending account balance or expenses you paid for the period. You may use this information to compare the ongoing costs of investing in the Fund and other funds. To do so, compare this 5% hypothetical example with the 5% hypothetical examples that appear in the shareholder reports of the other funds. In addition, the Fund, as a shareholder in the underlying Fidelity Central Funds, will indirectly bear its pro-rata share of the fees and expenses incurred by the underlying Fidelity Central Funds. These fees and expenses are not included in the Fund's annualized expense ratio used to calculate the expense estimate in the table below.
Please note that the expenses shown in the table are meant to highlight your ongoing costs only and do not reflect any transaction costs. Therefore, the second line of the table is useful in comparing ongoing costs only, and will not help you determine the relative total costs of owning different funds.
Annual Report
Shareholder Expense Example - continued
| Annualized
Expense RatioB | Beginning
Account Value
February 1, 2015 | Ending
Account Value
July 31, 2015 | Expenses Paid
During Period*
February 1, 2015 to July 31, 2015 |
Series Real Estate Income | .76% | | | |
Actual | | $ 1,000.00 | $ 1,001.00 | $ 3.77 |
HypotheticalA | | $ 1,000.00 | $ 1,021.03 | $ 3.81 |
Class F | .61% | | | |
Actual | | $ 1,000.00 | $ 1,002.60 | $ 3.03 |
HypotheticalA | | $ 1,000.00 | $ 1,021.77 | $ 3.06 |
A 5% return per year before expenses
B Annualized expense ratio reflects expenses net of applicable fee waivers.
* Expenses are equal to each Class' annualized expense ratio, multiplied by the average account value over the period, multiplied by 181/365 (to reflect the one-half year period).
Annual Report
Investment Changes (Unaudited)
Top Five Stocks as of July 31, 2015 |
| % of fund's
net assets | % of fund's net assets
6 months ago |
Equity Lifestyle Properties, Inc. | 2.1 | 1.9 |
Acadia Realty Trust (SBI) | 1.8 | 1.9 |
MFA Financial, Inc. | 1.5 | 1.5 |
Stag Industrial, Inc. Series A, 9.00% | 0.9 | 0.9 |
VEREIT, Inc. Series F, 6.70% | 0.8 | 0.1 |
| 7.1 | |
Top 5 Bonds as of July 31, 2015 |
| % of fund's
net assets | % of fund's net assets
6 months ago |
Standard Pacific Corp. 8.375% 5/15/18 | 1.1 | 1.0 |
Blackstone Mortgage Trust, Inc. 5.25% 12/1/18 | 1.0 | 1.0 |
M/I Homes, Inc. 8.625% 11/15/18 | 0.8 | 0.8 |
iStar Financial, Inc. 5.875% 3/15/16 | 0.8 | 0.8 |
Realogy Group LLC Tranche B, term loan 3.75% 3/5/20 | 0.8 | 0.8 |
| 4.5 | |
Top Five REIT Sectors as of July 31, 2015 |
| % of fund's
net assets | % of fund's net assets
6 months ago |
REITs - Mortgage | 16.5 | 16.2 |
REITs - Shopping Centers | 5.0 | 7.1 |
REITs - Health Care | 4.7 | 5.2 |
REITs - Office Property | 4.6 | 4.2 |
REITs - Management/Investment | 4.3 | 4.9 |
Asset Allocation (% of fund's net assets) |
As of July 31, 2015* | As of January 31, 2015** |
 | Common Stocks 14.7% | |  | Common Stocks 16.4% | |
 | Preferred Stocks 24.2% | |  | Preferred Stocks 23.9% | |
 | Bonds 42.4% | |  | Bonds 41.7% | |
 | Convertible
Securities 6.1% | |  | Convertible
Securities 6.1% | |
 | Other Investments 6.9% | |  | Other Investments 7.6% | |
 | Short-Term
Investments and
Net Other Assets (Liabilities) 5.7% | |  | Short-Term
Investments and
Net Other Assets (Liabilities) 4.3% | |
* Foreign investments | 0.3% | | ** Foreign investments | 0.9% | |

Annual Report
Investments July 31, 2015
Showing Percentage of Net Assets
Common Stocks - 14.7% |
| Shares | | Value |
FINANCIALS - 14.7% |
Capital Markets - 0.2% |
Ellington Financial LLC | 56,200 | | $ 1,026,212 |
Real Estate Investment Trusts - 14.3% |
Acadia Realty Trust (SBI) | 456,500 | | 14,598,870 |
American Campus Communities, Inc. | 22,800 | | 850,896 |
American Tower Corp. | 16,100 | | 1,531,271 |
Annaly Capital Management, Inc. | 140,500 | | 1,397,975 |
Anworth Mortgage Asset Corp. | 207,100 | | 1,035,500 |
Apartment Investment & Management Co. Class A | 96,400 | | 3,767,312 |
Arbor Realty Trust, Inc. | 224,900 | | 1,538,316 |
AvalonBay Communities, Inc. | 13,000 | | 2,240,420 |
CBL & Associates Properties, Inc. | 209,100 | | 3,416,694 |
Cedar Shopping Centers, Inc. | 41,700 | | 279,390 |
Chambers Street Properties | 47,100 | | 349,482 |
Community Healthcare Trust, Inc. | 21,100 | | 398,157 |
CYS Investments, Inc. | 178,800 | | 1,387,488 |
Douglas Emmett, Inc. | 47,800 | | 1,401,018 |
Dynex Capital, Inc. | 228,300 | | 1,682,571 |
EastGroup Properties, Inc. | 9,500 | | 571,900 |
Equity Lifestyle Properties, Inc. | 294,400 | | 17,039,862 |
Equity Residential (SBI) | 6,700 | | 501,227 |
Extra Space Storage, Inc. | 29,800 | | 2,190,896 |
First Potomac Realty Trust | 120,400 | | 1,366,540 |
Five Oaks Investment Corp. | 15,700 | | 119,006 |
Hatteras Financial Corp. | 70,600 | | 1,147,956 |
Lexington Corporate Properties Trust | 400,900 | | 3,447,740 |
LTC Properties, Inc. | 24,900 | | 1,092,363 |
MFA Financial, Inc. | 1,657,400 | | 12,480,222 |
Mid-America Apartment Communities, Inc. | 59,100 | | 4,748,094 |
Monmouth Real Estate Investment Corp. Class A | 78,100 | | 782,562 |
National Retail Properties, Inc. | 25,000 | | 929,250 |
New Senior Investment Group, Inc. | 156,499 | | 2,025,097 |
Newcastle Investment Corp. | 153,599 | | 754,171 |
NorthStar Realty Finance Corp. | 12,300 | | 196,800 |
Potlatch Corp. | 45,400 | | 1,589,454 |
Prologis, Inc. | 9,800 | | 397,978 |
Sabra Health Care REIT, Inc. | 92,800 | | 2,538,080 |
Select Income REIT | 34,400 | | 690,408 |
Senior Housing Properties Trust (SBI) | 242,200 | | 4,182,794 |
Simon Property Group, Inc. | 10,800 | | 2,021,976 |
Store Capital Corp. | 48,300 | | 1,014,300 |
Terreno Realty Corp. | 181,061 | | 3,796,849 |
Common Stocks - continued |
| Shares | | Value |
FINANCIALS - continued |
Real Estate Investment Trusts - continued |
The Macerich Co. | 13,500 | | $ 1,068,660 |
Two Harbors Investment Corp. | 188,600 | | 1,927,492 |
Ventas, Inc. | 88,400 | | 5,930,756 |
VEREIT, Inc. | 85,800 | | 751,608 |
Weyerhaeuser Co. | 66,100 | | 2,028,609 |
WP Carey, Inc. | 71,300 | | 4,362,847 |
WP Glimcher, Inc. | 74,750 | | 1,012,115 |
| | 118,582,972 |
Real Estate Management & Development - 0.2% |
Kennedy-Wilson Holdings, Inc. | 71,600 | | 1,812,912 |
TOTAL FINANCIALS | | 121,422,096 |
HEALTH CARE - 0.0% |
Health Care Providers & Services - 0.0% |
Chartwell Retirement Residence (a)(c) | 14,700 | | 134,428 |
TOTAL COMMON STOCKS (Cost $100,372,670) |
121,556,524
|
Preferred Stocks - 24.8% |
| | | |
Convertible Preferred Stocks - 0.6% |
FINANCIALS - 0.6% |
Real Estate Investment Trusts - 0.6% |
Lexington Corporate Properties Trust Series C, 6.50% | 67,619 | | 3,252,055 |
Weyerhaeuser Co. Series A, 6.375% | 32,000 | | 1,642,000 |
| | 4,894,055 |
Nonconvertible Preferred Stocks - 24.2% |
CONSUMER DISCRETIONARY - 0.1% |
Hotels, Restaurants & Leisure - 0.1% |
Red Lion Hotels Capital Trust 9.50% | 50,927 | | 1,318,500 |
FINANCIALS - 24.1% |
Capital Markets - 0.1% |
Arlington Asset Investment Corp. 6.625% | 31,528 | | 772,436 |
Real Estate Investment Trusts - 23.8% |
AG Mortgage Investment Trust, Inc.: | | | |
8.00% | 132,104 | | 3,251,079 |
Preferred Stocks - continued |
| Shares | | Value |
Nonconvertible Preferred Stocks - continued |
FINANCIALS - continued |
Real Estate Investment Trusts - continued |
AG Mortgage Investment Trust, Inc.: - continued | | | |
8.25% | 300 | | $ 7,500 |
Alexandria Real Estate Equities, Inc. Series E, 6.45% | 24,001 | | 623,546 |
American Capital Agency Corp.: | | | |
8.00% | 120,000 | | 2,990,400 |
Series B, 7.75% | 16,000 | | 382,720 |
American Capital Mortgage Investment Corp. Series A, 8.125% | 33,100 | | 803,337 |
American Homes 4 Rent: | | | |
Series A, 5.00% | 235,896 | | 5,975,246 |
Series B, 5.00% | 97,663 | | 2,490,407 |
Series C, 5.50% | 90,810 | | 2,337,449 |
Annaly Capital Management, Inc.: | | | |
Series A, 7.875% | 150,300 | | 3,787,560 |
Series C, 7.625% | 24,839 | | 607,810 |
Series D, 7.50% | 83,513 | | 2,052,750 |
Anworth Mortgage Asset Corp. Series A, 8.625% | 178,800 | | 4,588,008 |
Apollo Commercial Real Estate Finance, Inc. Series A, 8.625% | 61,725 | | 1,614,726 |
Apollo Residential Mortgage, Inc. Series A, 8.00% | 50,238 | | 1,203,200 |
Arbor Realty Trust, Inc.: | | | |
7.375% | 20,000 | | 492,200 |
Series A, 8.25% | 41,922 | | 1,067,334 |
Series B, 7.75% | 40,000 | | 990,000 |
Series C, 8.50% | 15,000 | | 386,700 |
Armour Residential REIT, Inc. Series B, 7.875% | 25,701 | | 581,357 |
Ashford Hospitality Trust, Inc.: | | | |
Series D, 8.45% | 51,709 | | 1,335,643 |
Series E, 9.00% | 35,948 | | 945,432 |
Brandywine Realty Trust Series E, 6.90% | 21,000 | | 546,000 |
Campus Crest Communities, Inc. Series A, 8.00% | 132,676 | | 3,194,838 |
Capstead Mortgage Corp. Series E, 7.50% | 37,016 | | 916,516 |
CBL & Associates Properties, Inc.: | | | |
Series D, 7.375% | 67,200 | | 1,706,208 |
Series E, 6.625% | 45,505 | | 1,157,647 |
Cedar Shopping Centers, Inc. Series B, 7.25% | 109,018 | | 2,784,320 |
Chesapeake Lodging Trust Series A, 7.75% | 64,034 | | 1,700,103 |
Colony Financial, Inc.: | | | |
7.125% | 76,150 | | 1,796,379 |
Series A, 8.50% | 77,829 | | 2,041,455 |
Preferred Stocks - continued |
| Shares | | Value |
Nonconvertible Preferred Stocks - continued |
FINANCIALS - continued |
Real Estate Investment Trusts - continued |
Colony Financial, Inc.: - continued | | | |
Series B, 7.50% | 4,300 | | $ 108,188 |
Coresite Realty Corp. Series A, 7.25% | 42,600 | | 1,108,452 |
Corporate Office Properties Trust Series L, 7.375% | 136,869 | | 3,581,862 |
CubeSmart Series A, 7.75% | 40,000 | | 1,063,600 |
CYS Investments, Inc.: | | | |
Series A, 7.75% | 10,014 | | 234,828 |
Series B, 7.50% | 113,333 | | 2,537,526 |
DDR Corp.: | | | |
Series J, 6.50% | 70,181 | | 1,813,477 |
Series K, 6.25% | 25,489 | | 647,421 |
Digital Realty Trust, Inc.: | | | |
Series E, 7.00% | 40,181 | | 1,040,688 |
Series F, 6.625% | 20,000 | | 511,200 |
Series G, 5.875% | 28,270 | | 685,548 |
Series H, 7.375% | 10,000 | | 271,300 |
DuPont Fabros Technology, Inc. Series B, 7.625% | 73,798 | | 1,881,849 |
Dynex Capital, Inc.: | | | |
Series A, 8.50% | 96,313 | | 2,396,267 |
Series B, 7.625% | 47,335 | | 1,117,106 |
Equity Commonwealth Series E, 7.25% | 200,160 | | 5,132,102 |
Equity Lifestyle Properties, Inc. Series C, 6.75% | 182,313 | | 4,743,784 |
Essex Property Trust, Inc. Series H, 7.125% | 8,100 | | 209,790 |
First Potomac Realty Trust 7.75% | 107,746 | | 2,764,762 |
Five Oaks Investment Corp. Series A, 8.75% | 48,000 | | 1,044,000 |
General Growth Properties, Inc. Series A, 6.375% | 34,690 | | 888,758 |
Gladstone Commercial Corp. Series C, 7.125% | 67,762 | | 1,724,543 |
Hatteras Financial Corp. Series A, 7.625% | 89,188 | | 2,073,621 |
Health Care REIT, Inc. Series J, 6.50% | 33,400 | | 859,048 |
Hersha Hospitality Trust Series B, 8.00% | 18,928 | | 485,692 |
Hospitality Properties Trust Series D, 7.125% | 40,200 | | 1,053,240 |
Hudson Pacific Properties, Inc. 8.375% | 84,787 | | 2,173,939 |
Inland Real Estate Corp.: | | | |
Series A, 8.125% | 207,500 | | 5,388,775 |
Series B, 6.95% | 46,000 | | 1,141,260 |
Invesco Mortgage Capital, Inc.: | | | |
Series A, 7.75% | 30,151 | | 744,428 |
Series B, 7.75% | 134,598 | | 3,218,238 |
Investors Real Estate Trust Series B, 7.95% | 33,428 | | 863,780 |
Preferred Stocks - continued |
| Shares | | Value |
Nonconvertible Preferred Stocks - continued |
FINANCIALS - continued |
Real Estate Investment Trusts - continued |
iStar Financial, Inc.: | | | |
Series D, 8.00% | 12,210 | | $ 303,663 |
Series E, 7.875% | 31,383 | | 769,511 |
Series F, 7.80% | 133,676 | | 3,285,756 |
Series G, 7.65% | 84,000 | | 2,047,080 |
Kilroy Realty Corp.: | | | |
Series G, 6.875% | 20,300 | | 524,349 |
Series H, 6.375% | 31,704 | | 811,622 |
Kite Realty Group Trust 8.25% | 4,100 | | 105,534 |
LaSalle Hotel Properties: | | | |
Series H, 7.50% | 37,192 | | 950,628 |
Series I, 6.375% | 47,339 | | 1,183,948 |
LBA Realty Fund II Series B, 7.625% | 118,900 | | 2,609,855 |
MFA Financial, Inc.: | | | |
8.00% | 108,747 | | 2,777,398 |
Series B, 7.50% | 188,749 | | 4,722,500 |
Monmouth Real Estate Investment Corp. Series B, 7.875% | 30,000 | | 802,500 |
National Retail Properties, Inc.: | | | |
5.70% | 46,124 | | 1,136,495 |
Series D, 6.625% | 46,667 | | 1,221,275 |
New York Mortgage Trust, Inc.: | | | |
7.875% | 92,000 | | 1,971,560 |
Series B, 7.75% | 70,013 | | 1,585,794 |
NorthStar Realty Finance Corp.: | | | |
Series A 8.75% | 1,500 | | 38,355 |
Series B, 8.25% | 76,584 | | 1,926,088 |
Series C, 8.875% | 105,295 | | 2,735,564 |
Series D, 8.50% | 45,035 | | 1,157,850 |
Series E, 8.75% | 70,920 | | 1,838,246 |
Pebblebrook Hotel Trust: | | | |
Series A, 7.875% | 119,000 | | 3,082,100 |
Series B, 8.00% | 37,400 | | 977,262 |
Series C, 6.50% | 71,026 | | 1,800,509 |
Pennsylvania (REIT) 7.375% | 55,408 | | 1,464,988 |
Prologis, Inc. Series Q, 8.54% | 15,800 | | 971,207 |
PS Business Parks, Inc.: | | | |
Series R, 6.875% | 1,100 | | 27,896 |
Series S, 6.45% | 5,665 | | 148,310 |
Series T, 6.00% | 26,000 | | 663,000 |
Preferred Stocks - continued |
| Shares | | Value |
Nonconvertible Preferred Stocks - continued |
FINANCIALS - continued |
Real Estate Investment Trusts - continued |
PS Business Parks, Inc.: - continued | | | |
Series U, 5.75% | 102,483 | | $ 2,463,691 |
Public Storage 6.375% | 24,000 | | 633,120 |
RAIT Financial Trust: | | | |
7.125% | 62,863 | | 1,545,173 |
7.625% | 46,080 | | 1,046,938 |
Regency Centers Corp.: | | | |
Series 6, 6.625% | 31,239 | | 810,652 |
Series 7, 6.00% | 32,000 | | 789,440 |
Retail Properties America, Inc. 7.00% | 83,617 | | 2,190,765 |
Sabra Health Care REIT, Inc. Series A, 7.125% | 80,000 | | 2,077,600 |
Saul Centers, Inc. Series C, 6.875% | 69,596 | | 1,802,536 |
Senior Housing Properties Trust 5.625% | 42,353 | | 1,003,766 |
Stag Industrial, Inc. Series A, 9.00% | 280,000 | | 7,582,400 |
Summit Hotel Properties, Inc. Series A, 9.25% | 173,700 | | 4,717,692 |
Sun Communities, Inc. Series A, 7.125% | 59,000 | | 1,519,250 |
Sunstone Hotel Investors, Inc. Series D, 8.00% | 32,939 | | 850,156 |
Taubman Centers, Inc. Series K, 6.25% | 19,561 | | 495,089 |
Terreno Realty Corp. Series A, 7.75% | 81,048 | | 2,135,615 |
UMH Properties, Inc. Series A, 8.25% | 96,000 | | 2,495,040 |
Urstadt Biddle Properties, Inc.: | | | |
6.75% | 33,500 | | 887,750 |
Series F, 7.125% | 30,000 | | 777,300 |
VEREIT, Inc. Series F, 6.70% | 253,683 | | 6,227,918 |
Wells Fargo Real Estate Investment Corp. 6.375% | 37,000 | | 970,140 |
Winthrop Realty Trust 7.75% | 60,000 | | 1,527,000 |
WP Glimcher, Inc.: | | | |
6.875% | 3,183 | | 81,962 |
7.50% | 53,575 | | 1,425,095 |
| | 197,563,873 |
Real Estate Management & Development - 0.2% |
Kennedy-Wilson, Inc. 7.75% | 55,054 | | 1,425,348 |
TOTAL FINANCIALS | | 199,761,657 |
TOTAL NONCONVERTIBLE PREFERRED STOCKS | | 201,080,157 |
TOTAL PREFERRED STOCKS (Cost $198,159,211) |
205,974,212
|
Corporate Bonds - 25.4% |
| Principal Amount | | Value |
Convertible Bonds - 5.5% |
FINANCIALS - 5.5% |
Consumer Finance - 0.4% |
Zais Financial Partners LP 8% 11/15/16 (c) | | $ 3,000,000 | | $ 2,998,125 |
Diversified Financial Services - 0.7% |
RWT Holdings, Inc. 5.625% 11/15/19 (c) | | 6,090,000 | | 5,833,916 |
Real Estate Investment Trusts - 3.7% |
Apollo Commercial Real Estate Finance, Inc. 5.5% 3/15/19 | | 1,180,000 | | 1,182,213 |
Ares Commercial Real Estate Corp. 7% 12/15/15 | | 2,300,000 | | 2,354,625 |
Blackstone Mortgage Trust, Inc. 5.25% 12/1/18 | | 7,750,000 | | 8,311,875 |
Campus Crest Communities Operating Partnership LP 4.75% 10/15/18 (c) | | 3,000,000 | | 2,874,375 |
Colony Financial, Inc. 3.875% 1/15/21 | | 1,090,000 | | 1,099,538 |
PennyMac Corp. 5.375% 5/1/20 | | 3,322,000 | | 3,072,850 |
RAIT Financial Trust 4% 10/1/33 | | 7,370,000 | | 6,158,556 |
Redwood Trust, Inc. 4.625% 4/15/18 | | 2,200,000 | | 2,124,375 |
Resource Capital Corp.: | | | | |
6% 12/1/18 | | 690,000 | | 618,413 |
8% 1/15/20 | | 1,650,000 | | 1,537,911 |
Spirit Realty Capital, Inc. 3.75% 5/15/21 | | 500,000 | | 468,125 |
Starwood Property Trust, Inc. 3.75% 10/15/17 | | 650,000 | | 654,469 |
Starwood Waypoint Residential 4.5% 10/15/17 (c) | | 390,000 | | 390,000 |
| | 30,847,325 |
Thrifts & Mortgage Finance - 0.7% |
IAS Operating Partnership LP 5% 3/15/18 (c) | | 6,370,000 | | 6,115,200 |
TOTAL FINANCIALS | | 45,794,566 |
Nonconvertible Bonds - 19.9% |
CONSUMER DISCRETIONARY - 6.6% |
Hotels, Restaurants & Leisure - 0.8% |
FelCor Lodging LP 6% 6/1/25 (c) | | 1,380,000 | | 1,421,400 |
Hilton Worldwide Finance LLC/Hilton Worldwide Finance Corp. 5.625% 10/15/21 | | 1,555,000 | | 1,619,144 |
Times Square Hotel Trust 8.528% 8/1/26 (c) | | 2,466,876 | | 3,145,017 |
| | 6,185,561 |
Household Durables - 5.8% |
Ashton Woods U.S.A. LLC/Ashton Woods Finance Co. 6.875% 2/15/21 (c) | | 2,100,000 | | 1,974,000 |
Corporate Bonds - continued |
| Principal Amount | | Value |
Nonconvertible Bonds - continued |
CONSUMER DISCRETIONARY - continued |
Household Durables - continued |
Brookfield Residential Properties, Inc./Brookfield Residential U.S. Corp. 6.125% 7/1/22 (c) | | $ 850,000 | | $ 828,750 |
Brookfield Residential Properties, Inc.: | | | | |
6.375% 5/15/25 (c) | | 2,000,000 | | 1,945,000 |
6.5% 12/15/20 (c) | | 395,000 | | 398,950 |
D.R. Horton, Inc.: | | | | |
4.375% 9/15/22 | | 825,000 | | 816,750 |
5.75% 8/15/23 | | 490,000 | | 521,850 |
6.5% 4/15/16 | | 811,000 | | 831,275 |
KB Home: | | | | |
8% 3/15/20 | | 2,395,000 | | 2,646,475 |
9.1% 9/15/17 | | 1,185,000 | | 1,321,275 |
Lennar Corp.: | | | | |
4.125% 12/1/18 | | 1,220,000 | | 1,238,300 |
4.5% 6/15/19 | | 400,000 | | 413,000 |
6.95% 6/1/18 | | 1,720,000 | | 1,883,400 |
M/I Homes, Inc. 8.625% 11/15/18 | | 6,764,000 | | 6,966,920 |
Meritage Homes Corp.: | | | | |
6% 6/1/25 (c) | | 2,085,000 | | 2,105,850 |
7% 4/1/22 | | 2,005,000 | | 2,135,325 |
7.15% 4/15/20 | | 1,940,000 | | 2,090,350 |
Ryland Group, Inc.: | | | | |
6.625% 5/1/20 | | 445,000 | | 495,330 |
8.4% 5/15/17 | | 1,446,000 | | 1,590,600 |
Standard Pacific Corp.: | | | | |
5.875% 11/15/24 | | 630,000 | | 647,325 |
8.375% 5/15/18 | | 7,732,000 | | 8,833,810 |
10.75% 9/15/16 | | 1,914,000 | | 2,091,045 |
Taylor Morrison Communities, Inc./Monarch Communities, Inc. 5.875% 4/15/23 (c) | | 760,000 | | 760,950 |
William Lyon Homes, Inc.: | | | | |
7% 8/15/22 | | 820,000 | | 854,850 |
8.5% 11/15/20 | | 4,320,000 | | 4,654,800 |
| | 48,046,180 |
Corporate Bonds - continued |
| Principal Amount | | Value |
Nonconvertible Bonds - continued |
CONSUMER DISCRETIONARY - continued |
Media - 0.0% |
Outfront Media Capital LLC / Corp. 5.625% 2/15/24 (c) | | $ 240,000 | | $ 244,800 |
TOTAL CONSUMER DISCRETIONARY | | 54,476,541 |
FINANCIALS - 11.9% |
Diversified Financial Services - 0.6% |
Icahn Enterprises LP/Icahn Enterprises Finance Corp.: | | | | |
5.875% 2/1/22 | | 820,000 | | 848,700 |
6% 8/1/20 | | 3,500,000 | | 3,683,750 |
| | 4,532,450 |
Real Estate Investment Trusts - 8.5% |
American Campus Communities Operating Partnership LP 4.125% 7/1/24 | | 1,000,000 | | 1,006,362 |
ARC Properties Operating Partnership LP 4.6% 2/6/24 | | 305,000 | | 294,325 |
CBL & Associates LP 5.25% 12/1/23 | | 2,000,000 | | 2,074,890 |
Commercial Net Lease Realty, Inc. 6.15% 12/15/15 | | 917,000 | | 933,753 |
Crown Castle International Corp. 5.25% 1/15/23 | | 1,500,000 | | 1,571,250 |
CTR Partnership LP/CareTrust Capital Corp. 5.875% 6/1/21 | | 1,590,000 | | 1,621,800 |
CubeSmart LP 4.8% 7/15/22 | | 1,000,000 | | 1,082,746 |
DCT Industrial Operating Partnership LP 4.5% 10/15/23 | | 2,000,000 | | 2,051,400 |
DDR Corp.: | | | | |
7.5% 7/15/18 | | 2,407,000 | | 2,766,127 |
9.625% 3/15/16 | | 2,254,000 | | 2,366,132 |
DuPont Fabros Technology LP 5.875% 9/15/21 | | 2,000,000 | | 2,055,000 |
Equity One, Inc.: | | | | |
6% 9/15/16 | | 811,000 | | 849,554 |
6.25% 1/15/17 | | 811,000 | | 861,473 |
HCP, Inc. 4% 6/1/25 | | 2,000,000 | | 1,960,500 |
Health Care Property Investors, Inc. 6.3% 9/15/16 | | 3,850,000 | | 4,046,531 |
Health Care REIT, Inc.: | | | | |
4% 6/1/25 | | 1,010,000 | | 1,003,235 |
4.125% 4/1/19 | | 1,000,000 | | 1,057,496 |
Healthcare Realty Trust, Inc. 3.75% 4/15/23 | | 801,000 | | 778,023 |
Highwoods/Forsyth LP: | | | | |
3.625% 1/15/23 | | 393,000 | | 391,414 |
5.85% 3/15/17 | | 2,593,000 | | 2,759,836 |
Corporate Bonds - continued |
| Principal Amount | | Value |
Nonconvertible Bonds - continued |
FINANCIALS - continued |
Real Estate Investment Trusts - continued |
Hospitality Properties Trust: | | | | |
5% 8/15/22 | | $ 823,000 | | $ 858,463 |
5.625% 3/15/17 | | 1,248,000 | | 1,313,999 |
6.7% 1/15/18 | | 811,000 | | 876,278 |
HRPT Properties Trust 6.25% 8/15/16 | | 4,000,000 | | 4,088,424 |
iStar Financial, Inc.: | | | | |
3.875% 7/1/16 | | 525,000 | | 526,313 |
4% 11/1/17 | | 2,500,000 | | 2,456,250 |
5% 7/1/19 | | 2,500,000 | | 2,453,275 |
5.85% 3/15/17 | | 825,000 | | 845,774 |
5.875% 3/15/16 | | 6,800,000 | | 6,919,000 |
7.125% 2/15/18 | | 1,010,000 | | 1,054,188 |
9% 6/1/17 | | 2,430,000 | | 2,627,438 |
Lexington Corporate Properties Trust 4.25% 6/15/23 | | 2,500,000 | | 2,531,403 |
MPT Operating Partnership LP/MPT Finance Corp. 6.375% 2/15/22 | | 1,685,000 | | 1,792,419 |
National Retail Properties, Inc. 6.875% 10/15/17 | | 1,621,000 | | 1,789,326 |
Omega Healthcare Investors, Inc.: | | | | |
4.5% 4/1/27 (c) | | 455,000 | | 438,864 |
4.95% 4/1/24 | | 627,000 | | 646,682 |
Potlatch Corp. 7.5% 11/1/19 | | 811,000 | | 912,375 |
Prologis LP 7.625% 7/1/17 | | 1,268,000 | | 1,397,659 |
Reckson Operating Partnership LP/SL Green Realty Corp./SL Green Operating Partnership LP 7.75% 3/15/20 | | 811,000 | | 963,891 |
Senior Housing Properties Trust: | | | | |
4.75% 5/1/24 | | 849,000 | | 839,544 |
6.75% 4/15/20 | | 576,000 | | 643,944 |
6.75% 12/15/21 | | 2,000,000 | | 2,281,304 |
United Dominion Realty Trust, Inc. 5.25% 1/15/16 | | 811,000 | | 824,184 |
| | 70,612,844 |
Real Estate Management & Development - 2.5% |
Brandywine Operating Partnership LP 6% 4/1/16 | | 811,000 | | 834,362 |
CBRE Group, Inc.: | | | | |
5% 3/15/23 | | 1,225,000 | | 1,256,360 |
5.25% 3/15/25 | | 625,000 | | 650,000 |
Excel Trust LP 4.625% 5/15/24 | | 501,000 | | 480,449 |
First Industrial LP 5.75% 1/15/16 | | 811,000 | | 825,470 |
Forestar U.S.A. Real Estate Group 8.5% 6/1/22 (c) | | 2,130,000 | | 2,231,388 |
Corporate Bonds - continued |
| Principal Amount | | Value |
Nonconvertible Bonds - continued |
FINANCIALS - continued |
Real Estate Management & Development - continued |
Host Hotels & Resorts LP 6% 10/1/21 | | $ 485,000 | | $ 552,204 |
Howard Hughes Corp. 6.875% 10/1/21 (c) | | 1,615,000 | | 1,711,900 |
Hunt Companies, Inc. 9.625% 3/1/21 (c) | | 1,210,000 | | 1,194,875 |
Kennedy-Wilson, Inc. 5.875% 4/1/24 | | 1,530,000 | | 1,516,613 |
Mid-America Apartments LP: | | | | |
3.75% 6/15/24 | | 337,000 | | 336,554 |
6.05% 9/1/16 | | 1,216,000 | | 1,272,719 |
Realogy Group LLC/Realogy Co.-Issuer Corp.: | | | | |
4.5% 4/15/19 (c) | | 1,005,000 | | 1,012,538 |
5.25% 12/1/21 (c) | | 1,280,000 | | 1,312,000 |
Regency Centers LP: | | | | |
5.25% 8/1/15 | | 3,250,000 | | 3,250,000 |
5.875% 6/15/17 | | 486,000 | | 523,504 |
Taylor Morrison Communities, Inc./Monarch Communities, Inc. 5.625% 3/1/24 (c) | | 495,000 | | 481,388 |
Ventas Realty LP/Ventas Capital Corp.: | | | | |
3.125% 11/30/15 | | 552,000 | | 555,744 |
4% 4/30/19 | | 597,000 | | 629,129 |
| | 20,627,197 |
Thrifts & Mortgage Finance - 0.3% |
Cantor Commercial Real Estate Co. LP/CCRE Finance Corp. 7.75% 2/15/18 (c) | | 1,025,000 | | 1,074,969 |
Ocwen Financial Corp. 7.125% 5/15/19 (c)(e) | | 1,845,000 | | 1,743,525 |
| | 2,818,494 |
TOTAL FINANCIALS | | 98,590,985 |
HEALTH CARE - 1.0% |
Health Care Providers & Services - 1.0% |
Sabra Health Care LP/Sabra Capital Corp.: | | | | |
5.375% 6/1/23 | | 3,500,000 | | 3,613,750 |
5.5% 2/1/21 | | 4,450,000 | | 4,616,875 |
| | 8,230,625 |
INDUSTRIALS - 0.1% |
Industrial Conglomerates - 0.1% |
Ladder Capital Finance Holdings LLLP/Ladder Capital Finance Corp. 7.375% 10/1/17 | | 785,000 | | 812,475 |
Corporate Bonds - continued |
| Principal Amount | | Value |
Nonconvertible Bonds - continued |
INFORMATION TECHNOLOGY - 0.1% |
Internet Software & Services - 0.1% |
CyrusOne LP/CyrusOne Finance Corp. 6.375% 11/15/22 (c) | | $ 1,000,000 | | $ 1,035,000 |
MATERIALS - 0.2% |
Paper & Forest Products - 0.2% |
Plum Creek Timberlands LP 5.875% 11/15/15 | | 1,621,000 | | 1,643,446 |
TOTAL NONCONVERTIBLE BONDS | | 164,789,072 |
TOTAL CORPORATE BONDS (Cost $203,479,483) |
210,583,638
|
Asset-Backed Securities - 1.8% |
|
American Homes 4 Rent: | | | | |
Series 2014-SFR3 Class E, 6.418% 12/17/36 (c) | | 1,740,000 | | 1,825,894 |
Series 2015-SFR1 Class E, 5.639% 4/17/52 (c) | | 367,586 | | 363,838 |
Conseco Finance Securitizations Corp.: | | | | |
Series 2002-1 Class M2, 9.546% 12/1/33 | | 1,216,000 | | 1,295,052 |
Series 2002-2 Class M2, 9.163% 3/1/33 | | 2,026,000 | | 1,700,123 |
Deutsche Financial Capital Securitization LLC Series 1997-I Class M, 7.275% 9/15/27 | | 1,058,085 | | 1,035,429 |
Invitation Homes Trust: | | | | |
Series 2013-SFR1 Class F, 3.9% 12/17/30 (c)(e) | | 1,750,000 | | 1,694,089 |
Series 2014-SFR1 Class F, 3.936% 6/17/31 (c)(e) | | 756,000 | | 731,310 |
Series 2014-SFR3: | | | | |
Class E, 4.686% 12/17/31 (c)(e) | | 842,000 | | 851,965 |
Class F, 5.186% 12/17/31 (c)(e) | | 426,000 | | 426,330 |
Series 2015-SFR2 Class E, 3.3353% 6/17/32 (c)(e) | | 450,000 | | 437,589 |
Series 2015-SFR3 Class F, 4.933% 8/17/32 (c)(e) | | 2,000,000 | | 1,992,967 |
Lehman ABS Manufactured Housing Contract Trust Series 2001-B Class M2, 7.17% 4/15/40 | | 3,232,141 | | 1,778,999 |
Residential Asset Securities Corp. Series 2003-KS10 Class MI3, 6.41% 12/25/33 | | 212,363 | | 195,256 |
Starwood Waypoint Residential Trust Series 2014-1 Class F, 4.7235% 1/17/32 (c)(e) | | 780,000 | | 771,356 |
TOTAL ASSET-BACKED SECURITIES (Cost $14,444,996) |
15,100,197
|
Collateralized Mortgage Obligations - 0.5% |
| Principal Amount | | Value |
Private Sponsor - 0.5% |
FREMF Mortgage Trust: | | | | |
Series 2010-K6 Class B, 5.5325% 12/25/46 (c)(e) | | $ 811,000 | | $ 898,145 |
Series 2010-K7 Class B, 5.6242% 4/25/20 (c)(e) | | 2,605,000 | | 2,917,910 |
Merrill Lynch Mortgage Investors Trust Series 1998-C3 Class F, 6% 12/15/30 (c) | | 98,153 | | 100,679 |
TOTAL COLLATERALIZED MORTGAGE OBLIGATIONS (Cost $3,384,952) |
3,916,734
|
Commercial Mortgage Securities - 20.2% |
|
Aventura Mall Trust Series 2013-AVM Class E, 3.8674% 12/5/32 (c)(e) | | 2,000,000 | | 1,951,079 |
Banc of America Commercial Mortgage Trust Series 2005-1 Class CJ, 5.515% 11/10/42 (e) | | 376,636 | | 376,231 |
Bear Stearns Commercial Mortgage Securities, Inc. Series 2006-PW11 Class AJ, 5.597% 3/11/39 (e) | | 2,432,000 | | 2,465,503 |
BLCP Hotel Trust: | | | | |
floater Series 2014-CLRN Class F, 3.2206% 8/15/29 (c)(e) | | 500,000 | | 482,709 |
Series 2014-CLMZ Class M, 5.9145% 8/15/29 (c)(e) | | 2,487,000 | | 2,469,899 |
Boca Hotel Portfolio Trust Series 2013-BOCA Class E, 3.9373% 8/15/26 (c)(e) | | 1,500,000 | | 1,499,996 |
Carefree Portfolio Trust floater: | | | | |
Series 2014-CARE Class E, 4.187% 11/15/19 (c)(e) | | 777,000 | | 781,065 |
Series 2014-CMZA Class MZA, 6.1635% 11/15/19 (c)(e) | | 3,708,000 | | 3,708,740 |
CGBAM Commercial Mortgage Trust Series 2015-SMRT Class F, 3.912% 4/10/28 (c)(e) | | 1,063,000 | | 1,008,491 |
Chase Commercial Mortgage Securities Corp. Series 1998-1 Class H, 6.34% 5/18/30 (c) | | 1,621,000 | | 1,706,944 |
Citigroup Commercial Mortgage Trust: | | | | |
Series 2013-GC15 Class D, 5.2754% 9/10/46 (c)(e) | | 2,000,000 | | 1,970,544 |
Series 2015-SHP2 Class E, 4.285% 7/15/17 (c)(e) | | 567,000 | | 567,000 |
COMM Mortgage Trust: | | | | |
sequential payer Series 2013-LC6 Class E, 3.5% 1/10/46 (c) | | 2,000,000 | | 1,675,948 |
Series 2013-CR10 Class D, 4.9525% 8/10/46 (c)(e) | | 1,300,000 | | 1,247,272 |
Series 2013-CR12 Class D, 5.2543% 10/10/46 (c)(e) | | 2,900,000 | | 2,881,266 |
Series 2013-CR9 Class D, 4.4002% 7/10/45 (c)(e) | | 2,397,000 | | 2,264,863 |
Series 2013-LC6 Class D, 4.4296% 1/10/46 (c)(e) | | 1,912,000 | | 1,811,981 |
Series 2014-UBS2 Class D, 5.1826% 3/10/47 (c)(e) | | 537,000 | | 511,259 |
Commercial Mortgage Securities - continued |
| Principal Amount | | Value |
COMM Mortgage Trust pass-thru certificates Series 2005-LP5 Class F, 5.138% 5/10/43 (c)(e) | | $ 2,000,000 | | $ 2,023,048 |
Commercial Mortgage Acceptance Corp. Series 1998-C2 Class J, 5.44% 9/15/30 (c) | | 1,120,323 | | 1,077,909 |
Commercial Mortgage Trust pass-thru certificates: | | | | |
Series 2005-C6 Class AJ, 5.209% 6/10/44 (e) | | 578,999 | | 578,853 |
Series 2012-CR1: | | | | |
Class C, 5.5378% 5/15/45 (e) | | 3,000,000 | | 3,302,868 |
Class D, 5.5378% 5/15/45 (c)(e) | | 1,350,000 | | 1,389,959 |
Series 2012-CR2 Class D, 5.0191% 8/15/45 (c)(e) | | 500,000 | | 526,256 |
Series 2012-LC4: | | | | |
Class C, 5.8205% 12/10/44 (e) | | 780,000 | | 872,114 |
Class D, 5.8205% 12/10/44 (c)(e) | | 2,830,000 | | 2,996,523 |
Core Industrial Trust Series 2015-TEXW Class F, 3.8487% 2/10/34 (c)(e) | | 1,212,000 | | 1,104,063 |
Credit Suisse First Boston Mortgage Securities Corp. Series 1998-C2 Class F, 6.75% 11/15/30 (c) | | 360,210 | | 369,608 |
CSMC Trust floater Series 2015-DEAL: | | | | |
Class E, 4.184% 4/15/29 (c)(e) | | 2,000,000 | | 1,991,236 |
Class F, 4.934% 4/15/29 (c)(e) | | 2,947,000 | | 2,934,089 |
DBCCRE Mortgage Trust Series 2014-ARCP Class E, 5.099% 1/10/34 (c)(e) | | 1,397,000 | | 1,314,620 |
DBUBS Mortgage Trust Series 2011-LC1A: | | | | |
Class E, 5.7348% 11/10/46 (c)(e) | | 2,450,000 | | 2,642,033 |
Class G, 4.652% 11/10/46 (c) | | 2,157,000 | | 1,879,800 |
Extended Stay America Trust Series 2013-ESH7 Class C7, 3.9017% 12/5/31 (c) | | 2,000,000 | | 2,049,927 |
Freddie Mac pass-thru certificates: | | | | |
Series K011 Class X3, 2.6623% 12/25/43 (d)(e) | | 4,947,000 | | 617,178 |
Series K012 Class X3, 2.365% 1/25/41 (d)(e) | | 2,846,999 | | 319,832 |
Series K013 Class X3, 2.9023% 1/25/43 (d)(e) | | 4,806,000 | | 659,763 |
GAHR Commercial Mortgage Trust Series 2015-NRF: | | | | |
Class EFX, 3.4949% 12/15/19 (c)(e) | | 2,254,000 | | 2,121,286 |
Class FFX, 3.4949% 12/15/19 (c)(e) | | 1,355,000 | | 1,252,772 |
GCCFC Commercial Mortgage Trust Series 2005-GG3 Class B, 4.894% 8/10/42 (e) | | 83,421 | | 83,441 |
GMAC Commercial Mortgage Securities, Inc. Series 1997-C2 Class G, 6.75% 4/15/29 (e) | | 480,890 | | 509,327 |
GP Portfolio Trust Series 2014-GPP Class E, 4.0355% 2/15/27 (c)(e) | | 615,000 | | 612,913 |
GS Mortgage Securities Trust: | | | | |
Series 2010-C2 Class D, 5.3958% 12/10/43 (c)(e) | | 2,000,000 | | 2,098,032 |
Series 2012-GC6: | | | | |
Class C, 5.8223% 1/10/45 (c)(e) | | 2,400,000 | | 2,666,020 |
Commercial Mortgage Securities - continued |
| Principal Amount | | Value |
GS Mortgage Securities Trust: - continued | | | | |
Series 2012-GC6: | | | | |
Class D, 5.8223% 1/10/45 (c)(e) | | $ 1,786,000 | | $ 1,866,217 |
Class E, 5% 1/10/45 (c)(e) | | 831,000 | | 785,020 |
Series 2012-GCJ7: | | | | |
Class C, 5.9069% 5/10/45 (e) | | 3,500,000 | | 3,886,513 |
Class D, 5.9069% 5/10/45 (c)(e) | | 2,500,000 | | 2,604,472 |
Class E, 5% 5/10/45 (c) | | 1,760,000 | | 1,636,022 |
Series 2012-GCJ9 Class D, 5.0153% 11/10/45 (c)(e) | | 843,000 | | 833,642 |
Series 2013-GC16: | | | | |
Class D, 5.4927% 11/10/46 (c)(e) | | 3,250,000 | | 3,245,408 |
Class F, 3.5% 11/10/46 (c) | | 1,428,000 | | 1,095,514 |
Hilton U.S.A. Trust: | | | | |
floater Series 2014-ORL Class E, 3.436% 7/15/29 (c)(e) | | 639,000 | | 641,676 |
Series 2013-HLT Class EFX, 5.6086% 11/5/30 (c)(e) | | 4,250,000 | | 4,300,320 |
Invitation Homes Trust floater Series 2013-SFR1 Class E, 2.9% 12/17/30 (c)(e) | | 1,500,000 | | 1,448,935 |
JPMorgan Chase Commercial Mortgage Securities Corp.: | | | | |
Series 2003-C1 Class F, 5.8339% 1/12/37 (c)(e) | | 756,000 | | 754,985 |
Series 2009-IWST Class D, 7.6935% 12/5/27 (c)(e) | | 2,779,000 | | 3,284,264 |
Series 2010-CNTM Class MZ, 8.5% 8/5/20 (c) | | 2,620,000 | | 2,722,497 |
Series 2010-CNTR Class D, 6.3899% 8/5/32 (c)(e) | | 1,216,000 | | 1,394,452 |
Series 2012-CBX: | | | | |
Class C, 5.4134% 6/15/45 (e) | | 1,240,000 | | 1,338,444 |
Class G 4% 6/15/45 (c) | | 805,000 | | 586,331 |
JPMorgan Chase Commercial Mortgage Securities Trust: | | | | |
floater: | | | | |
Series 2014-FBLU Class E, 3.6815% 12/15/28 (c)(e) | | 2,076,000 | | 2,074,070 |
Series 2014-INN: | | | | |
Class E, 3.787% 6/15/29 (c)(e) | | 1,059,000 | | 1,054,978 |
Class F, 4.187% 6/15/29 (c)(e) | | 1,255,000 | | 1,233,553 |
Series 2005-LDP2 Class C, 4.911% 7/15/42 (e) | | 4,000,000 | | 4,010,064 |
Series 2011-C4 Class E, 5.5963% 7/15/46 (c)(e) | | 1,390,000 | | 1,468,049 |
Series 2013-LC11 Class F, 3.25% 4/15/46 (c)(e) | | 482,000 | | 353,459 |
LB-UBS Commercial Mortgage Trust: | | | | |
sequential payer Series 2005-C7 Class AJ, 5.323% 11/15/40 (e) | | 1,240,000 | | 1,244,108 |
Series 2005-C1 Class E, 4.924% 2/15/40 | | 436,803 | | 437,010 |
Series 2006-C4 Class AJ, 6.048% 6/15/38 (e) | | 2,511,000 | | 2,573,978 |
LSTAR Commercial Mortgage Trust Series 2011-1 Class D, 5.4277% 6/25/43 (c)(e) | | 352,835 | | 352,911 |
Commercial Mortgage Securities - continued |
| Principal Amount | | Value |
Mach One Trust LLC Series 2004-1A Class H, 6.1214% 5/28/40 (c)(e) | | $ 263,192 | | $ 263,376 |
Morgan Stanley BAML Trust: | | | | |
Series 2012-C6 Class D, 4.816% 11/15/45 (c)(e) | | 2,000,000 | | 2,046,496 |
Series 2013-C12 Class D, 4.9261% 10/15/46 (c)(e) | | 1,500,000 | | 1,463,651 |
Series 2013-C13: | | | | |
Class D, 5.0578% 11/15/46 (c)(e) | | 2,500,000 | | 2,439,038 |
Class E, 5.0578% 11/15/46 (c)(e) | | 621,000 | | 564,889 |
Series 2013-C7 Class E, 4.4375% 2/15/46 (c)(e) | | 1,490,000 | | 1,351,029 |
Morgan Stanley Capital I Trust: | | | | |
sequential payer: | | | | |
Series 2006-HQ10 Class AM, 5.36% 11/12/41 | | 3,769,000 | | 3,928,764 |
Series 2012-C4 Class E, 5.7084% 3/15/45 (c)(e) | | 2,250,000 | | 2,331,515 |
Series 1997-RR Class F, 7.4369% 4/30/39 (c)(e) | | 171,620 | | 172,323 |
Series 1998-CF1 Class G, 7.35% 7/15/32 (c) | | 1,799,550 | | 1,748,512 |
Series 2006-IQ12 Class AMFX, 5.37% 12/15/43 | | 3,242,000 | | 3,399,017 |
Series 2011-C1 Class C, 5.418% 9/15/47 (c)(e) | | 2,000,000 | | 2,215,467 |
Series 2011-C2: | | | | |
Class D, 5.4799% 6/15/44 (c)(e) | | 1,532,000 | | 1,641,933 |
Class E, 5.4799% 6/15/44 (c)(e) | | 1,946,000 | | 2,048,681 |
Class F, 5.4799% 6/15/44 (c)(e) | | 1,467,000 | | 1,395,211 |
Class XB, 0.5332% 6/15/44 (c)(d)(e) | | 51,641,000 | | 1,361,567 |
Series 2011-C3: | | | | |
Class C, 5.3554% 7/15/49 (c)(e) | | 2,000,000 | | 2,181,710 |
Class G, 5.3554% 7/15/49 (c)(e) | | 606,000 | | 543,380 |
Series 2012-C4 Class D, 5.7084% 3/15/45 (c)(e) | | 1,640,000 | | 1,762,029 |
Motel 6 Trust Series 2015-MTL6: | | | | |
Class E, 5.2785% 2/5/30 (c) | | 594,000 | | 591,433 |
Class F, 5% 2/5/30 (c) | | 1,975,000 | | 1,909,509 |
Providence Place Group Ltd. Partnership Series 2000-C1 Class A2, 7.75% 7/20/28 (c) | | 1,256,605 | | 1,576,411 |
SCG Trust Series 2013-SRP1 Class D, 3.5172% 11/15/26 (c)(e) | | 1,000,000 | | 999,542 |
TimberStar Trust I Series 2006-1 Class F, 7.5296% 10/15/36 (c) | | 2,026,000 | | 2,078,762 |
UBS Commercial Mortgage Trust Series 2012-C1 Class D, 5.727% 5/10/45 (c)(e) | | 645,000 | | 678,563 |
UBS-BAMLL Trust Series 12-WRM Class D, 4.3793% 6/10/30 (c)(e) | | 1,460,000 | | 1,419,136 |
WF-RBS Commercial Mortgage Trust: | | | | |
Series 2011-C3: | | | | |
Class C, 5.335% 3/15/44 (c) | | 2,100,000 | | 2,294,380 |
Class D, 5.7221% 3/15/44 (c)(e) | | 1,000,000 | | 1,079,559 |
Commercial Mortgage Securities - continued |
| Principal Amount | | Value |
WF-RBS Commercial Mortgage Trust: - continued | | | | |
Series 2011-C5: | | | | |
Class C, 5.8224% 11/15/44 (c)(e) | | $ 1,250,000 | | $ 1,398,298 |
Class F, 5.25% 11/15/44 (c)(e) | | 2,000,000 | | 1,838,350 |
Class G, 5.25% 11/15/44 (c)(e) | | 1,000,000 | | 876,803 |
Series 2012-C10 Class E, 4.6057% 12/15/45 (c)(e) | | 910,000 | | 833,413 |
Series 2012-C7 Class D, 4.9995% 6/15/45 (c)(e) | | 620,000 | | 650,142 |
WFCG Commercial Mortgage Trust floater Series 2015-BXRP: | | | | |
Class F, 3.9058% 11/15/29 (c)(e) | | 1,142,436 | | 1,134,695 |
Class G, 3.2055% 11/15/29 (c)(e) | | 749,091 | | 697,070 |
TOTAL COMMERCIAL MORTGAGE SECURITIES (Cost $153,717,193) |
167,515,806
|
Bank Loan Obligations - 6.9% |
|
CONSUMER DISCRETIONARY - 2.6% |
Hotels, Restaurants & Leisure - 1.9% |
Caesars Entertainment Resort Properties LLC Tranche B 1LN, term loan 7% 10/11/20 (e) | | 3,201,250 | | 2,993,169 |
Caesars Growth Properties Holdings, LLC Tranche 1LN, term loan 6.25% 5/8/21 (e) | | 2,536,931 | | 2,146,878 |
Cooper Hotel Group 12% 11/6/17 | | 2,309,118 | | 2,424,574 |
ESH Hospitality, Inc. Tranche B, term loan 5% 6/24/19 (e) | | 2,091,280 | | 2,130,491 |
Four Seasons Holdings, Inc. Tranche 2LN, term loan 6.25% 12/27/20 (e) | | 405,000 | | 406,013 |
Hilton Worldwide Finance, LLC Tranche B, term loan 3.5% 10/25/20 (e) | | 3,461,265 | | 3,465,591 |
La Quinta Intermediate Holdings LLC Tranche B LN, Tranche B, term loan 4% 4/14/21 (e) | | 2,033,441 | | 2,035,983 |
Playa Resorts Holding BV Tranche B, term loan 4% 8/9/19 (e) | | 237,582 | | 238,176 |
| | 15,840,875 |
Media - 0.2% |
CBS Outdoor Americas Capital LLC/CBS Outdoor Americas Capital Corp. Tranche B, term loan 3% 1/31/21 (e) | | 1,705,000 | | 1,702,869 |
Multiline Retail - 0.3% |
JC Penney Corp., Inc. Tranche B, term loan 6% 5/22/18 (e) | | 2,589,767 | | 2,586,530 |
Bank Loan Obligations - continued |
| Principal Amount | | Value |
CONSUMER DISCRETIONARY - continued |
Specialty Retail - 0.2% |
The Pep Boys - Manny, Moe & Jack Tranche B, term loan 4.25% 10/11/18 (e) | | $ 1,326,000 | | $ 1,326,000 |
TOTAL CONSUMER DISCRETIONARY | | 21,456,274 |
CONSUMER STAPLES - 0.1% |
Food & Staples Retailing - 0.1% |
Albertson's LLC Tranche B 3LN, term loan 5% 8/25/19 (e) | | 1,259,063 | | 1,263,784 |
ENERGY - 0.3% |
Oil, Gas & Consumable Fuels - 0.3% |
Moxie Patriot LLC Tranche B, term loan 6.75% 12/19/20 (e) | | 2,000,000 | | 2,007,500 |
TPF II Power, LLC Tranche B, term loan 5.5% 10/2/21 (e) | | 835,383 | | 839,560 |
| | 2,847,060 |
FINANCIALS - 1.5% |
Real Estate Investment Trusts - 0.3% |
Starwood Property Trust, Inc. Tranche B, term loan 3.5% 4/17/20 (e) | | 2,449,875 | | 2,437,625 |
Real Estate Management & Development - 0.8% |
Realogy Corp. Credit-Linked Deposit 4.4463% 10/10/16 (e) | | 76,076 | | 75,316 |
Realogy Group LLC Tranche B, term loan 3.75% 3/5/20 (e) | | 6,858,841 | | 6,875,988 |
| | 6,951,304 |
Thrifts & Mortgage Finance - 0.4% |
Ocwen Loan Servicing, LLC Tranche B, term loan 5% 2/15/18 (e) | | 3,165,283 | | 3,165,283 |
TOTAL FINANCIALS | | 12,554,212 |
HEALTH CARE - 0.4% |
Health Care Providers & Services - 0.4% |
Community Health Systems, Inc.: | | | | |
Tranche F, term loan 3.5335% 12/31/18 (e) | | 997,500 | | 1,002,488 |
Tranche G, term loan 3.75% 12/31/19 (e) | | 440,170 | | 440,170 |
Tranche H, term loan 4% 1/27/21 (e) | | 1,559,830 | | 1,563,730 |
| | 3,006,388 |
Bank Loan Obligations - continued |
| Principal Amount | | Value |
INDUSTRIALS - 0.6% |
Commercial Services & Supplies - 0.2% |
Pilot Travel Centers LLC Tranche B, term loan 4.25% 10/3/21 (e) | | $ 1,980,000 | | $ 1,997,424 |
Construction & Engineering - 0.4% |
Drumm Investors LLC Tranche B, term loan 6.75% 5/4/18 (e) | | 3,056,973 | | 3,091,364 |
TOTAL INDUSTRIALS | | 5,088,788 |
TELECOMMUNICATION SERVICES - 0.5% |
Wireless Telecommunication Services - 0.5% |
SBA Senior Finance II, LLC: | | | | |
term loan 3.25% 3/24/21 (e) | | 2,390,850 | | 2,375,907 |
Tranche B 2LN, term loan 3.25% 6/10/22 (e) | | 1,500,000 | | 1,488,750 |
| | 3,864,657 |
UTILITIES - 0.9% |
Electric Utilities - 0.5% |
Calpine Construction Finance Co. LP Tranche B 2LN, term loan 3.25% 1/31/22 (e) | | 984,969 | | 978,813 |
Essential Power LLC Tranche B, term loan 4.75% 8/8/19 (e) | | 984,445 | | 988,137 |
La Frontera Generation, LLC Tranche B, term loan 4.5% 9/30/20 (e) | | 1,699,130 | | 1,675,852 |
Southeast Powergen LLC Tranche B, term loan 4.5% 12/2/21 (e) | | 532,325 | | 534,321 |
| | 4,177,123 |
Independent Power and Renewable Electricity Producers - 0.4% |
Calpine Corp. Tranche B 4LN, term loan 4% 10/31/20 (e) | | 1,970,000 | | 1,972,463 |
Tempus Public Foundation Generation Holdings LLC Tranche B, term loan 4.75% 12/31/17 (e) | | 1,293,351 | | 1,231,917 |
| | 3,204,380 |
TOTAL UTILITIES | | 7,381,503 |
TOTAL BANK LOAN OBLIGATIONS (Cost $57,474,562) |
57,462,666
|
Money Market Funds - 3.9% |
| Shares | | Value |
Fidelity Cash Central Fund, 0.17% (b)
(Cost $32,482,012) | 32,482,012 | | $ 32,482,012 |
TOTAL INVESTMENT PORTFOLIO - 98.2% (Cost $763,515,079) | 814,591,789 |
NET OTHER ASSETS (LIABILITIES) - 1.8% | | 14,592,812 |
NET ASSETS - 100% | $ 829,184,601 |
Legend |
(a) Non-income producing |
(b) Affiliated fund that is generally available only to investment companies and other accounts managed by Fidelity Investments. The rate quoted is the annualized seven-day yield of the fund at period end. A complete unaudited listing of the fund's holdings as of its most recent quarter end is available upon request. In addition, each Fidelity Central Fund's financial statements, which are not covered by the Fund's Report of Independent Registered Public Accounting Firm, are available on the SEC's website or upon request. |
(c) Security exempt from registration under Rule 144A of the Securities Act of 1933. These securities may be resold in transactions exempt from registration, normally to qualified institutional buyers. At the end of the period, the value of these securities amounted to $193,332,078 or 23.3% of net assets. |
(d) Security represents right to receive monthly interest payments on an underlying pool of mortgages or assets. Principal shown is the outstanding par amount of the pool as of the end of the period. |
(e) Coupon rates for floating and adjustable rate securities reflect the rates in effect at period end. |
Affiliated Central Funds |
Information regarding fiscal year to date income earned by the Fund from investments in Fidelity Central Funds is as follows: |
Fund | Income earned |
Fidelity Cash Central Fund | $ 51,533 |
Fidelity Securities Lending Cash Central Fund | 865 |
Total | $ 52,398 |
Other Information |
The following is a summary of the inputs used, as of July 31, 2015, involving the Fund's assets and liabilities carried at fair value. The inputs or methodology used for valuing securities may not be an indication of the risk associated with investing in those securities. For more information on valuation inputs, and their aggregation into the levels used in the tables below, please refer to the Investment Valuation section in the accompanying Notes to Financial Statements. |
Valuation Inputs at Reporting Date: |
Description | Total | Level 1 | Level 2 | Level 3 |
Investments in Securities: | | | | |
Equities: | | | | |
Consumer Discretionary | $ 1,318,500 | $ 1,318,500 | $ - | $ - |
Financials | 326,077,808 | 320,212,546 | 5,865,262 | - |
Health Care | 134,428 | 134,428 | - | - |
Corporate Bonds | 210,583,638 | - | 210,583,638 | - |
Asset-Backed Securities | 15,100,197 | - | 13,125,942 | 1,974,255 |
Collateralized Mortgage Obligations | 3,916,734 | - | 3,916,734 | - |
Commercial Mortgage Securities | 167,515,806 | - | 167,515,806 | - |
Bank Loan Obligations | 57,462,666 | - | 54,556,763 | 2,905,903 |
Money Market Funds | 32,482,012 | 32,482,012 | - | - |
Total Investments in Securities: | $ 814,591,789 | $ 354,147,486 | $ 455,564,145 | $ 4,880,158 |
Valuation Inputs at Reporting Date: |
The following is a reconciliation of Investments in Securities for which Level 3 inputs were used in determining value: |
Investments in Securities: | |
Bank Loan Obligations | |
Beginning Balance | $ 12,296,701 |
Net Realized Gain (Loss) on Investment Securities | 755 |
Net Unrealized Gain (Loss) on Investment Securities | (122,208) |
Cost of Purchases | 305,330 |
Proceeds of Sales | (9,664,442) |
Amortization/Accretion | (27,156) |
Transfers into Level 3 | 116,923 |
Transfers out of Level 3 | - |
Ending Balance | $ 2,905,903 |
The change in unrealized gain (loss) for the period attributable to Level 3 securities held at July 31, 2015 | $ 25,249 |
Other Investments in Securities: | |
Beginning Balance | $ 2,707,064 |
Net Realized Gain (Loss) on Investment Securities | (1,091,178) |
Net Unrealized Gain (Loss) on Investment Securities | 1,332,759 |
Cost of Purchases | - |
Proceeds of Sales | (1,271,360) |
Amortization/Accretion | (41,479) |
Transfers into Level 3 | 1,802,177 |
Transfers out of Level 3 | (1,463,728) |
Ending Balance | $ 1,974,255 |
The change in unrealized gain (loss) for the period attributable to Level 3 securities held at July 31, 2015 | $ 240,650 |
The information used in the above reconciliation represents fiscal year to date activity for any Investments in Securities identified as using Level 3 inputs at either the beginning or the end of the current fiscal period. Transfers in or out of Level 3 represent the beginning value of any Security or Instrument where a change in the pricing level occurred from the beginning to the end of the period. The cost of purchases and the proceeds of sales may include securities received or delivered through corporate actions or exchanges. Realized and unrealized gains (losses) disclosed in the reconciliation are included in Net Gain (Loss) on the Fund's Statement of Operations. |
Other Information |
The composition of credit quality ratings as a percentage of net assets is as follows (Unaudited): |
U.S. Government and U.S. Government Agency Obligations | 0.6% |
AAA,AA,A | 4.3% |
BBB | 13.6% |
BB | 12.3% |
B | 13.1% |
CCC,CC,C | 1.0% |
Not Rated | 9.9% |
Equities | 39.5% |
Short-Term Investments and Net Other Assets | 5.7% |
| 100.0% |
We have used ratings from Moody's Investors Service, Inc. Where Moody's® ratings are not available, we have used S&P® ratings. All ratings are as of the date indicated and do not reflect subsequent changes. |
See accompanying notes which are an integral part of the financial statements.
Annual Report
Statement of Assets and Liabilities
| | July 31, 2015 |
Assets | | |
Investment in securities, at value - See accompanying schedule: Unaffiliated issuers (cost $731,033,067) | $ 782,109,777 | |
Fidelity Central Funds (cost $32,482,012) | 32,482,012 | |
Total Investments (cost $763,515,079) | | $ 814,591,789 |
Cash | | 49,890 |
Receivable for investments sold | | 12,100,056 |
Receivable for fund shares sold | | 112,313 |
Dividends receivable | | 449,579 |
Interest receivable | | 4,489,659 |
Distributions receivable from Fidelity Central Funds | | 4,094 |
Other receivables | | 672 |
Total assets | | 831,798,052 |
| | |
Liabilities | | |
Payable for investments purchased | $ 851,577 | |
Payable for fund shares redeemed | 1,223,718 | |
Accrued management fee | 378,065 | |
Other affiliated payables | 83,285 | |
Other payables and accrued expenses | 76,806 | |
Total liabilities | | 2,613,451 |
| | |
Net Assets | | $ 829,184,601 |
Net Assets consist of: | | |
Paid in capital | | $ 763,824,966 |
Undistributed net investment income | | 7,902,882 |
Accumulated undistributed net realized gain (loss) on investments and foreign currency transactions | | 6,380,048 |
Net unrealized appreciation (depreciation) on investments and assets and liabilities in foreign currencies | | 51,076,705 |
Net Assets | | $ 829,184,601 |
See accompanying notes which are an integral part of the financial statements.
Annual Report
Financial Statements - continued
Statement of Assets and Liabilities - continued
| | July 31, 2015 |
Series Real Estate Income: | | |
Net Asset Value, offering price and redemption price per share ($401,861,206 ÷ 36,094,897 shares) | | $ 11.13 |
| | |
Class F: | | |
Net Asset Value, offering price and redemption price per share ($427,323,395 ÷ 38,371,765 shares) | | $ 11.14 |
See accompanying notes which are an integral part of the financial statements.
Annual Report
Statement of Operations
| Year ended July 31, 2015 |
Investment Income | | |
Dividends | | $ 19,393,806 |
Interest | | 29,184,633 |
Income from Fidelity Central Funds | | 52,398 |
Total income | | 48,630,837 |
| | |
Expenses | | |
Management fee | $ 4,611,305 | |
Transfer agent fees | 660,838 | |
Accounting and security lending fees | 366,112 | |
Custodian fees and expenses | 16,117 | |
Independent trustees' compensation | 3,530 | |
Audit | 88,218 | |
Legal | 1,997 | |
Miscellaneous | 5,948 | |
Total expenses before reductions | 5,754,065 | |
Expense reductions | (15,241) | 5,738,824 |
Net investment income (loss) | | 42,892,013 |
Realized and Unrealized Gain (Loss) Net realized gain (loss) on: | | |
Investment securities: | | |
Unaffiliated issuers | 10,016,559 | |
Foreign currency transactions | (752) | |
Total net realized gain (loss) | | 10,015,807 |
Change in net unrealized appreciation (depreciation) on investment securities | | (10,965,973) |
Net gain (loss) | | (950,166) |
Net increase (decrease) in net assets resulting from operations | | $ 41,941,847 |
See accompanying notes which are an integral part of the financial statements.
Annual Report
Financial Statements - continued
Statement of Changes in Net Assets
| Year ended
July 31,
2015 | Year ended
July 31,
2014 |
Increase (Decrease) in Net Assets | | |
Operations | | |
Net investment income (loss) | $ 42,892,013 | $ 42,642,966 |
Net realized gain (loss) | 10,015,807 | 24,118,024 |
Change in net unrealized appreciation (depreciation) | (10,965,973) | (161,306) |
Net increase (decrease) in net assets resulting from operations | 41,941,847 | 66,599,684 |
Distributions to shareholders from net investment income | (45,472,455) | (42,834,154) |
Distributions to shareholders from net realized gain | (20,829,892) | (17,262,908) |
Total distributions | (66,302,347) | (60,097,062) |
Share transactions - net increase (decrease) | 24,549,288 | 15,810,740 |
Total increase (decrease) in net assets | 188,788 | 22,313,362 |
| | |
Net Assets | | |
Beginning of period | 828,995,813 | 806,682,451 |
End of period (including undistributed net investment income of $7,902,882 and undistributed net investment income of $9,105,015, respectively) | $ 829,184,601 | $ 828,995,813 |
See accompanying notes which are an integral part of the financial statements.
Annual Report
Financial Highlights - Series Real Estate Income
Years ended July 31, | 2015 | 2014 | 2013 | 2012G |
Selected Per-Share Data | | | | |
Net asset value, beginning of period | $ 11.47 | $ 11.41 | $ 11.10 | $ 10.00 |
Income from Investment Operations | | | | |
Net investment income (loss) D | .56 | .58 | .67 | .47 |
Net realized and unrealized gain (loss) | (.01) | .31 | .46 | .97 |
Total from investment operations | .55 | .89 | 1.13 | 1.44 |
Distributions from net investment income | (.61) | (.59) | (.66) | (.33) |
Distributions from net realized gain | (.29) | (.24) | (.16) | (.01) |
Total distributions | (.89)I | (.83) | (.82) | (.34) |
Net asset value, end of period | $ 11.13 | $ 11.47 | $ 11.41 | $ 11.10 |
Total ReturnB, C | 5.05% | 8.33% | 10.50% | 14.67% |
Ratios to Average Net AssetsE, H | | | | |
Expenses before reductions | .77% | .77% | .79% | .80%A |
Expenses net of fee waivers, if any | .77% | .77% | .79% | .80%A |
Expenses net of all reductions | .77% | .77% | .79% | .80%A |
Net investment income (loss) | 5.03% | 5.15% | 5.85% | 5.70%A |
Supplemental Data | | | | |
Net assets, end of period (000 omitted) | $ 401,861 | $ 409,084 | $ 415,192 | $ 416,151 |
Portfolio turnover rateF | 19% | 33% | 25% | 29% A |
A Annualized
B Total returns for periods of less than one year are not annualized.
C Total returns would have been lower if certain expenses had not been reduced during the applicable periods shown.
D Calculated based on average shares outstanding during the period.
E Fees and expenses of any underlying Fidelity Central Funds are not included in the Fund's expense ratio. The Fund indirectly bears its proportionate share of the expenses of any underlying Fidelity Central Funds.
F Amount does not include the portfolio activity of any underlying Fidelity Central Funds.
G For the period October 20, 2011 (commencement of operations) to July 31, 2012.
H Expense ratios reflect operating expenses of the class. Expenses before reductions do not reflect amounts reimbursed by the investment adviser or reductions from brokerage service arrangements or reductions from other expense offset arrangements and do not represent the amount paid by the class during periods when reimbursements or reductions occur. Expense ratios before reductions for start-up periods may not be representative of longer-term operating periods. Expenses net of fee waivers reflect expenses after reimbursement by the investment adviser but prior to reductions from brokerage service arrangements or other expense offset arrangements. Expenses net of all reductions represent the net expenses paid by the class.
I Total distributions of $.89 per share is comprised of distributions from net investment income of $.606 and distributions from net realized gain of $.288 per share.
See accompanying notes which are an integral part of the financial statements.
Annual Report
Financial Highlights - Class F
Years ended July 31, | 2015 | 2014 | 2013 | 2012G |
Selected Per-Share Data | | | | |
Net asset value, beginning of period | $ 11.48 | $ 11.41 | $ 11.11 | $ 10.00 |
Income from Investment Operations | | | | |
Net investment income (loss) D | .58 | .60 | .69 | .48 |
Net realized and unrealized gain (loss) | (.01) | .32 | .45 | .98 |
Total from investment operations | .57 | .92 | 1.14 | 1.46 |
Distributions from net investment income | (.62) | (.60) | (.68) | (.34) |
Distributions from net realized gain | (.29) | (.24) | (.16) | (.01) |
Total distributions | (.91) | (.85)I | (.84) | (.35) |
Net asset value, end of period | $ 11.14 | $ 11.48 | $ 11.41 | $ 11.11 |
Total ReturnB, C | 5.22% | 8.60% | 10.60% | 14.89% |
Ratios to Average Net AssetsE, H | | | | |
Expenses before reductions | .61% | .61% | .61% | .62%A |
Expenses net of fee waivers, if any | .61% | .61% | .61% | .62%A |
Expenses net of all reductions | .61% | .61% | .61% | .62%A |
Net investment income (loss) | 5.19% | 5.32% | 6.02% | 5.88%A |
Supplemental Data | | | | |
Net assets, end of period (000 omitted) | $ 427,323 | $ 419,911 | $ 391,490 | $ 286,854 |
Portfolio turnover rateF | 19% | 33% | 25% | 29%A |
A Annualized
B Total returns for periods of less than one year are not annualized.
C Total returns would have been lower if certain expenses had not been reduced during the applicable periods shown.
D Calculated based on average shares outstanding during the period.
E Fees and expenses of any underlying Fidelity Central Funds are not included in the Fund's expense ratio. The Fund indirectly bears its proportionate share of the expenses of any underlying Fidelity Central Funds.
F Amount does not include the portfolio activity of any underlying Fidelity Central Funds.
G For the period October 20, 2011 (commencement of operations) to July 31, 2012.
H Expense ratios reflect operating expenses of the class. Expenses before reductions do not reflect amounts reimbursed by the investment adviser or reductions from brokerage service arrangements or reductions from other expense offset arrangements and do not represent the amount paid by the class during periods when reimbursements or reductions occur. Expense ratios before reductions for start-up periods may not be representative of longer-term operating periods. Expenses net of fee waivers reflect expenses after reimbursement by the investment adviser but prior to reductions from brokerage service arrangements or other expense offset arrangements. Expenses net of all reductions represent the net expenses paid by the class.
I Total distributions of $.85 per share is comprised of distributions from net investment income of $.604 and distributions from net realized gain of $.242 per share.
See accompanying notes which are an integral part of the financial statements.
Annual Report
For the period ended July 31, 2015
1. Organization.
Fidelity Series Real Estate Income Fund (the Fund) is a fund of Fidelity Securities Fund (the Trust) and is authorized to issue an unlimited number of shares. Shares of the Fund are only available for purchase by mutual funds for which Fidelity Management & Research Company (FMR) or an affiliate serves as an investment manager. The Trust is registered under the Investment Company Act of 1940, as amended (the 1940 Act), as an open-end management investment company organized as a Massachusetts business trust. The Fund offers Series Real Estate Income and Class F shares, each of which has equal rights as to assets and voting privileges. Each class has exclusive voting rights with respect to matters that affect that class.
2. Investments in Fidelity Central Funds.
The Fund invests in Fidelity Central Funds, which are open-end investment companies generally available only to other investment companies and accounts managed by the investment adviser and its affiliates. The Fund's Schedule of Investments lists each of the Fidelity Central Funds held as of period end, if any, as an investment of the Fund, but does not include the underlying holdings of each Fidelity Central Fund. As an Investing Fund, the Fund indirectly bears its proportionate share of the expenses of the underlying Fidelity Central Funds.
The Money Market Central Funds seek preservation of capital and current income and are managed by Fidelity Investments Money Management, Inc. (FIMM), an affiliate of the investment adviser. Annualized expenses of the Money Market Central Funds as of their most recent shareholder report date are less than .01%.
A complete unaudited list of holdings for each Fidelity Central Fund is available upon request or at the Securities and Exchange Commission (the SEC) website at www.sec.gov. In addition, the financial statements of the Fidelity Central Funds, which are not covered by the Fund's Report of Independent Registered Public Accounting Firm, are available on the SEC website or upon request.
3. Significant Accounting Policies.
The financial statements have been prepared in conformity with accounting principles generally accepted in the United States of America (GAAP), which require management to make certain estimates and assumptions at the date of the financial statements. Actual results could differ from those estimates. Subsequent events, if any, through the date that the financial statements were issued have been evaluated in the preparation of the financial statements. The following summarizes the significant accounting policies of the Fund:
Annual Report
3. Significant Accounting Policies - continued
Investment Valuation. Investments are valued as of 4:00 p.m. Eastern time on the last calendar day of the period. The Board of Trustees (the Board) has delegated the day to day responsibility for the valuation of the Fund's investments to the FMR Fair Value Committee (the Committee). In accordance with valuation policies and procedures approved by the Board, the Fund attempts to obtain prices from one or more third party pricing vendors or brokers to value its investments. When current market prices, quotations or currency exchange rates are not readily available or reliable, investments will be fair valued in good faith by the Committee, in accordance with procedures adopted by the Board. Factors used in determining fair value vary by investment type and may include market or investment specific events, changes in interest rates and credit quality. The frequency with which these procedures are used cannot be predicted and they may be utilized to a significant extent. The Committee oversees the Fund's valuation policies and procedures and reports to the Board on the Committee's activities and fair value determinations. The Board monitors the appropriateness of the procedures used in valuing the Fund's investments and ratifies the fair value determinations of the Committee.
The Fund categorizes the inputs to valuation techniques used to value its investments into a disclosure hierarchy consisting of three levels as shown below:
Level 1 - quoted prices in active markets for identical investments
Level 2 - other significant observable inputs (including quoted prices for similar investments, interest rates, prepayment speeds, etc.)
Level 3 - unobservable inputs (including the Fund's own assumptions based on the best information available)
Valuation techniques used to value the Fund's investments by major category are as follows:
Equity securities, including restricted securities, for which market quotations are readily available, are valued at the last reported sale price or official closing price as reported by a third party pricing vendor on the primary market or exchange on which they are traded and are categorized as Level 1 in the hierarchy. In the event there were no sales during the day or closing prices are not available, securities are valued at the last quoted bid price or may be valued using the last available price and are generally categorized as Level 2 in the hierarchy. For foreign equity securities, when market or security specific events arise, comparisons to the valuation of American Depositary Receipts (ADRs), futures contracts, Exchange-Traded Funds (ETFs) and certain indexes as well as quoted prices for similar securities may be used and would be categorized as Level 2 in the hierarchy. Utilizing these techniques may result in transfers between Level 1 and Level 2.
Annual Report
Notes to Financial Statements - continued
3. Significant Accounting Policies - continued
Investment Valuation - continued
For equity securities, including restricted securities, where observable inputs are limited, assumptions about market activity and risk are used and these securities may be categorized as Level 3 in the hierarchy.
Debt securities, including restricted securities, are valued based on evaluated prices received from third party pricing vendors or from brokers who make markets in such securities. Corporate bonds and bank loan obligations are valued by pricing vendors who utilize matrix pricing which considers yield or price of bonds of comparable quality, coupon, maturity and type or by broker-supplied prices. Asset backed securities, collateralized mortgage obligations and commercial mortgage securities are valued by pricing vendors who utilize matrix pricing which considers prepayment speed assumptions, attributes of the collateral, yield or price of bonds of comparable quality, coupon, maturity and type or by broker-supplied prices. When independent prices are unavailable or unreliable, debt securities may be valued utilizing pricing methodologies which consider similar factors that would be used by third party pricing vendors. Debt securities are generally categorized as Level 2 in the hierarchy but may be Level 3 depending on the circumstances.
Investments in open-end mutual funds, including the Fidelity Central Funds, are valued at their closing net asset value (NAV) each business day and are categorized as Level 1 in the hierarchy.
Changes in valuation techniques may result in transfers in or out of an assigned level within the disclosure hierarchy. The aggregate value of investments by input level as of July 31, 2015, as well as a roll forward of Level 3 investments, is included at the end of the Fund's Schedule of Investments.
Foreign Currency. The Fund may use foreign currency contracts to facilitate transactions in foreign-denominated securities. Gains and losses from these transactions may arise from changes in the value of the foreign currency or if the counterparties do not perform under the contracts' terms.
Foreign-denominated assets, including investment securities, and liabilities are translated into U.S. dollars at the exchange rates at period end. Purchases and sales of investment securities, income and dividends received and expenses denominated in foreign currencies are translated into U.S. dollars at the exchange rate in effect on the transaction date.
The effects of exchange rate fluctuations on investments are included with the net realized and unrealized gain (loss) on investment securities. Other foreign currency transactions resulting in realized and unrealized gain (loss) are disclosed separately.
Annual Report
3. Significant Accounting Policies - continued
Investment Transactions and Income. For financial reporting purposes, the Fund's investment holdings and NAV include trades executed through the end of the last business day of the period. The NAV per share for processing shareholder transactions is calculated as of the close of business of the New York Stock Exchange (NYSE), normally 4:00 p.m. Eastern time and includes trades executed through the end of the prior business day. Gains and losses on securities sold are determined on the basis of identified cost. Dividend income is recorded on the ex-dividend date, except for certain dividends from foreign securities where the ex-dividend date may have passed, which are recorded as soon as the Fund is informed of the ex-dividend date. Non-cash dividends included in dividend income, if any, are recorded at the fair market value of the securities received. Income and capital gain distributions from Fidelity Central Funds, if any, are recorded on the ex-dividend date. Distributions received on securities that represent a return of capital or capital gain are recorded as a reduction of cost of investments and/or as a realized gain. Subsequent to ex-dividend date the Fund determines the components of these distributions, based upon receipt of tax filings or other correspondence relating to the underlying investment. Interest income is accrued as earned and includes coupon interest and amortization of premium and accretion of discount on debt securities as applicable. Investment income is recorded net of foreign taxes withheld where recovery of such taxes is uncertain.
Class Allocations and Expenses. Investment income, realized and unrealized capital gains and losses, common expenses of the Fund, and certain fund-level expense reductions, if any, are allocated daily on a pro-rata basis to each class based on the relative net assets of each class to the total net assets of the Fund. Each class differs with respect to transfer agent fees incurred. Certain expense reductions may also differ by class. For the reporting period, the allocated portion of income and expenses to each class as a percent of its average net assets may vary due to the timing of recording these transactions in relation to fluctuating net assets of the classes. Expenses directly attributable to a fund are charged to that fund. Expenses attributable to more than one fund are allocated among the respective funds on the basis of relative net assets or other appropriate methods. Expense estimates are accrued in the period to which they relate and adjustments are made when actual amounts are known.
Income Tax Information and Distributions to Shareholders. Each year, the Fund intends to qualify as a regulated investment company under Subchapter M of the Internal Revenue Code, including distributing substantially all of its taxable income and realized gains. As a result, no provision for U.S. Federal income taxes is required. As of July 31, 2015, the Fund did not have any unrecognized tax benefits in the financial statements; nor is the Fund aware of any tax positions for which it is reasonably possible that the total amounts of unrecognized tax benefits will significantly change in the next
Annual Report
Notes to Financial Statements - continued
3. Significant Accounting Policies - continued
Income Tax Information and Distributions to Shareholders - continued
twelve months. The Fund files a U.S. federal tax return, in addition to state and local tax returns as required. The Fund's federal income tax returns are subject to examination by the Internal Revenue Service (IRS) for a period of three fiscal years after they are filed. State and local tax returns may be subject to examination for an additional fiscal year depending on the jurisdiction. Foreign taxes are provided for based on the Fund's understanding of the tax rules and rates that exist in the foreign markets in which it invests.
Distributions are declared and recorded on the ex-dividend date. Income dividends and capital gain distributions are declared separately for each class. Income and capital gain distributions are determined in accordance with income tax regulations, which may differ from GAAP.
Capital accounts within the financial statements are adjusted for permanent book-tax differences. These adjustments have no impact on net assets or the results of operations. Capital accounts are not adjusted for temporary book-tax differences which will reverse in a subsequent period.
Book-tax differences are primarily due to foreign currency transactions, passive foreign investment companies (PFIC), equity-debt classifications, certain conversion ratio adjustments, partnerships and losses deferred due to wash sales.
The federal tax cost of investment securities and unrealized appreciation (depreciation) as of period end were as follows:
Gross unrealized appreciation | $ 63,509,337 |
Gross unrealized depreciation | (12,526,172) |
Net unrealized appreciation (depreciation) on securities | $ 50,983,165 |
| |
Tax Cost | $ 763,608,624 |
The tax-based components of distributable earnings as of period end were as follows:
Undistributed ordinary income | $ 8,470,195 |
Undistributed long-term capital gain | $ 6,020,793 |
Net unrealized appreciation (depreciation) on securities and other investments | $ 50,983,160 |
Annual Report
3. Significant Accounting Policies - continued
Income Tax Information and Distributions to Shareholders - continued
The tax character of distributions paid was as follows:
| July 31, 2015 | July 31, 2014 |
Ordinary Income | $ 49,227,807 | $ 47,449,028 |
Long-term Capital Gains | 17,074,540 | 12,648,034 |
Total | $ 66,302,347 | $ 60,097,062 |
Restricted Securities. The Fund may invest in securities that are subject to legal or contractual restrictions on resale. These securities generally may be resold in transactions exempt from registration or to the public if the securities are registered. Disposal of these securities may involve time-consuming negotiations and expense, and prompt sale at an acceptable price may be difficult. Information regarding restricted securities is included at the end of the Fund's Schedule of Investments.
Loans and Other Direct Debt Instruments. The Fund invests in direct debt instruments which are interests in amounts owed to lenders by corporate or other borrowers. These instruments may be in the form of loans, trade claims or other receivables and may include standby financing commitments such as revolving credit facilities that obligate the Fund to supply additional cash to the borrower on demand. Loans may be acquired through assignment or participation. The Fund did not have any unfunded loan commitments, which are contractual obligations for future funding, at period end.
4. Purchases and Sales of Investments.
Purchases and sales of securities, other than short-term securities, aggregated $162,233,147 and $154,510,215, respectively.
Annual Report
Notes to Financial Statements - continued
5. Fees and Other Transactions with Affiliates.
Management Fee. Fidelity Management & Research Company (the investment adviser) and its affiliates provide the Fund with investment management related services for which the Fund pays a monthly management fee. The management fee is the sum of an individual fund fee rate that is based on an annual rate of .30% of the Fund's average net assets and an annualized group fee rate that averaged .25% during the period. The group fee rate is based upon the average net assets of all the mutual funds advised by the investment adviser, including any mutual funds previously advised by the investment adviser that are currently advised by Fidelity SelectCo, LLC, an affiliate of the investment adviser. The group fee rate decreases as assets under management increase and increases as assets under management decrease. For the reporting period, the total annual management fee rate was .55% of the Fund's average net assets.
Transfer Agent Fees. Fidelity Investments Institutional Operations Company, Inc., (FIIOC), an affiliate of the investment adviser, is the transfer, dividend disbursing and shareholder servicing agent for each class of the Fund. FIIOC receives account fees and asset-based fees that vary according to the account size and type of account of the shareholders of Series Real Estate Income. FIIOC receives no fees for providing transfer agency services to Class F. FIIOC pays for typesetting, printing and mailing of shareholder reports, except proxy statements.
For the period, transfer agent fees for each applicable class were as follows:
| Amount | % of
Class-Level Average
Net Assets |
Series Real Estate Income | $ 660,838 | .16 |
Accounting and Security Lending Fees. Fidelity Service Company, Inc. (FSC), an affiliate of the investment adviser, maintains the Fund's accounting records. The accounting fee is based on the level of average net assets for each month. Under a separate contract, FSC administers the security lending program. The security lending fee is based on the number and duration of lending transactions.
Brokerage Commissions. The Fund placed a portion of its portfolio transactions with brokerage firms which are affiliates of the investment adviser. Brokerage commissions are included in net realized gain (loss) and change in net unrealized appreciation (depreciation) in the Statement of Operations. The commissions paid to these affiliated firms were $670 for the period.
Annual Report
6. Committed Line of Credit.
The Fund participates with other funds managed by the investment adviser or an affiliate in a $4.25 billion credit facility (the "line of credit") to be utilized for temporary or emergency purposes to fund shareholder redemptions or for other short-term liquidity purposes. The Fund has agreed to pay commitment fees on its pro-rata portion of the line of credit, which amounted to $1,220 and is reflected in Miscellaneous expenses on the Statement of Operations. During the period, the Fund did not borrow on this line of credit.
7. Security Lending.
The Fund lends portfolio securities through a lending agent from time to time in order to earn additional income. For equity securities, a lending agent is used and may loan securities to certain qualified borrowers, including Fidelity Capital Markets (FCM), a broker-dealer affiliated with the Fund. On the settlement date of the loan, the Fund receives collateral (in the form of U.S. Treasury obligations, letters of credit and/or cash) against the loaned securities and maintains collateral in an amount not less than 100% of the market value of the loaned securities during the period of the loan. The market value of the loaned securities is determined at the close of business of the Fund and any additional required collateral is delivered to the Fund on the next business day. If the borrower defaults on its obligation to return the securities loaned because of insolvency or other reasons, the Fund may apply collateral received from the borrower against the obligation. The Fund may experience delays and costs in recovering the securities loaned. Any cash collateral received is invested in the Fidelity Securities Lending Cash Central Fund. At period end, there were no security loans outstanding. Security lending income represents the income earned on investing cash collateral, less rebates paid to borrowers and any lending agent fees associated with the loan, plus any premium payments received for lending certain types of securities. Security lending income is presented in the Statement of Operations as a component of income from Fidelity Central Funds. Total security lending income during the period amounted to $865. During the period, there were no securities loaned to FCM.
8. Expense Reductions.
Commissions paid to certain brokers with whom the investment adviser, or its affiliates, places trades on behalf of the Fund include an amount in addition to trade execution, which may be rebated back to the Fund to offset certain expenses. This amount totaled $1,667 for the period. In addition, through arrangements with the Fund's custodian, credits realized as a result of uninvested cash balances were used to reduce the Fund's expenses. During the period, these credits reduced the Fund's custody expenses by $824.
Annual Report
Notes to Financial Statements - continued
8. Expense Reductions - continued
In addition, during the period the investment adviser reimbursed/waived a portion of fund-level operating expenses in the amount of $3,284 and a portion of class-level operating expenses as follows:
| Amount |
Series Real Estate Income | $ 9,466 |
9. Distributions to Shareholders.
Distributions to shareholders of each class were as follows:
Years ended July 31, | 2015 | 2014 |
From net investment income | | |
Series Real Estate Income | $ 21,727,712 | $ 21,286,598 |
Class F | 23,744,743 | 21,547,556 |
Total | $ 45,472,455 | $ 42,834,154 |
From net realized gain | | |
Series Real Estate Income | $ 10,207,221 | $ 8,798,960 |
Class F | 10,622,671 | 8,463,948 |
Total | $ 20,829,892 | $ 17,262,908 |
10. Share Transactions.
Transactions for each class of shares were as follows:
| Shares | Dollars |
Years ended July 31, | 2015 | 2014 | 2015 | 2014 |
Series Real Estate Income | | | | |
Shares sold | 2,035,991 | 5,096,461 | $ 22,922,397 | $ 56,759,758 |
Reinvestment of distributions | 2,871,749 | 2,752,035 | 31,934,933 | 30,085,558 |
Shares redeemed | (4,463,283) | (8,601,530) | (50,201,779) | (95,963,309) |
Net increase (decrease) | 444,457 | (753,034) | $ 4,655,551 | $ (9,117,993) |
Class F | | | | |
Shares sold | 4,231,772 | 7,066,532 | $ 47,649,383 | $ 79,103,585 |
Reinvestment of distributions | 3,090,749 | 2,743,696 | 34,367,414 | 30,011,504 |
Shares redeemed | (5,535,580) | (7,540,879) | (62,123,060) | (84,186,356) |
Net increase (decrease) | 1,786,941 | 2,269,349 | $ 19,893,737 | $ 24,928,733 |
Annual Report
11. Other.
The Fund's organizational documents provide former and current trustees and officers with a limited indemnification against liabilities arising in connection with the performance of their duties to the Fund. In the normal course of business, the Fund may also enter into contracts that provide general indemnifications. The Fund's maximum exposure under these arrangements is unknown as this would be dependent on future claims that may be made against the Fund. The risk of material loss from such claims is considered remote.
At the end of the period, mutual funds managed by the investment adviser or its affiliates were the owners of record of all of the outstanding shares of the Fund.
Annual Report
To the Trustees of Fidelity Securities Fund and Shareholders of Fidelity Series Real Estate Income Fund:
We have audited the accompanying statement of assets and liabilities of Fidelity Series Real Estate Income Fund (the Fund), a fund of Fidelity Securities Fund, including the schedule of investments, as of July 31, 2015, and the related statement of operations for the year then ended, the statement of changes in net assets for each of the two years in the period then ended, and the financial highlights for each of the periods presented. These financial statements and financial highlights are the responsibility of the Fund's management. Our responsibility is to express an opinion on these financial statements and financial highlights based on our audits.
We conducted our audits in accordance with the standards of the Public Company Accounting Oversight Board (United States). Those standards require that we plan and perform the audit to obtain reasonable assurance about whether the financial statements and financial highlights are free of material misstatement. The Fund is not required to have, nor were we engaged to perform, an audit of its internal control over financial reporting. Our audits included consideration of internal control over financial reporting as a basis for designing audit procedures that are appropriate in the circumstances, but not for the purpose of expressing an opinion on the effectiveness of the Fund's internal control over financial reporting. Accordingly, we express no such opinion. An audit also includes examining, on a test basis, evidence supporting the amounts and disclosures in the financial statements, assessing the accounting principles used and significant estimates made by management, as well as evaluating the overall financial statement presentation. Our procedures included confirmation of securities owned as of July 31, 2015, by correspondence with the custodians, agent banks and brokers; when replies were not received from brokers, we performed other auditing procedures. We believe that our audits provide a reasonable basis for our opinion.
In our opinion, such financial statements and financial highlights referred to above present fairly, in all material respects, the financial position of Fidelity Series Real Estate Income Fund as of July 31, 2015, the results of its operations for the year then ended, the changes in its net assets for each of the two years in the period then ended, and the financial highlights for each of the periods presented, in conformity with accounting principles generally accepted in the United States of America.
DELOITTE & TOUCHE LLP
Boston, Massachusetts
September 24, 2015
Annual Report
The Trustees, Member of the Advisory Board, and officers of the trust and fund, as applicable, are listed below. The Board of Trustees governs the fund and is responsible for protecting the interests of shareholders. The Trustees are experienced executives who meet periodically throughout the year to oversee the fund's activities, review contractual arrangements with companies that provide services to the fund, oversee management of the risks associated with such activities and contractual arrangements, and review the fund's performance. Each of the Trustees oversees 170 funds.
The Trustees hold office without limit in time except that (a) any Trustee may resign; (b) any Trustee may be removed by written instrument, signed by at least two-thirds of the number of Trustees prior to such removal; (c) any Trustee who requests to be retired or who has become incapacitated by illness or injury may be retired by written instrument signed by a majority of the other Trustees; and (d) any Trustee may be removed at any special meeting of shareholders by a two-thirds vote of the outstanding voting securities of the trust. Each Trustee who is not an interested person (as defined in the 1940 Act) of the trust and the fund (Independent Trustee), shall retire not later than the last day of the calendar year in which his or her 75th birthday occurs. The Independent Trustees may waive this mandatory retirement age policy with respect to individual Trustees. The officers and Advisory Board Member hold office without limit in time, except that any officer and Advisory Board Member may resign or may be removed by a vote of a majority of the Trustees at any regular meeting or any special meeting of the Trustees. Except as indicated, each individual has held the office shown or other offices in the same company for the past five years.
Experience, Skills, Attributes, and Qualifications of the Fund's Trustees. The Governance and Nominating Committee has adopted a statement of policy that describes the experience, qualifications, attributes, and skills that are necessary and desirable for potential Independent Trustee candidates (Statement of Policy). The Board believes that each Trustee satisfied at the time he or she was initially elected or appointed a Trustee, and continues to satisfy, the standards contemplated by the Statement of Policy. The Governance and Nominating Committee also engages professional search firms to help identify potential Independent Trustee candidates who have the experience, qualifications, attributes, and skills consistent with the Statement of Policy. From time to time, additional criteria based on the composition and skills of the current Independent Trustees, as well as experience or skills that may be appropriate in light of future changes to board composition, business conditions, and regulatory or other developments, have also been considered by the professional search firms and the Governance and Nominating Committee. In addition, the Board takes into account the Trustees' commitment and participation in Board and committee meetings, as well as their leadership of standing and ad hoc committees throughout their tenure.
In determining that a particular Trustee was and continues to be qualified to serve as a Trustee, the Board has considered a variety of criteria, none of which, in isolation, was controlling. The Board believes that, collectively, the Trustees have balanced and diverse experience, qualifications, attributes, and skills, which allow the Board to operate effectively in governing the fund and protecting the interests of shareholders. Information about the specific experience, skills, attributes, and qualifications of each Trustee, which in each case led to the Board's conclusion that the Trustee should serve (or continue to serve) as a trustee of the fund, is provided below.
Annual Report
Trustees and Officers - continued
Board Structure and Oversight Function. James C. Curvey is an interested person (as defined in the 1940 Act) and currently serves as Chairman. The Trustees have determined that an interested Chairman is appropriate and benefits shareholders because an interested Chairman has a personal and professional stake in the quality and continuity of services provided to the fund. Independent Trustees exercise their informed business judgment to appoint an individual of their choosing to serve as Chairman, regardless of whether the Trustee happens to be independent or a member of management. The Independent Trustees have determined that they can act independently and effectively without having an Independent Trustee serve as Chairman and that a key structural component for assuring that they are in a position to do so is for the Independent Trustees to constitute a substantial majority for the Board. The Independent Trustees also regularly meet in executive session. Ned C. Lautenbach serves as Chairman of the Independent Trustees and as such (i) acts as a liaison between the Independent Trustees and management with respect to matters important to the Independent Trustees and (ii) with management prepares agendas for Board meetings.
Fidelity funds are overseen by different Boards of Trustees. The fund's Board oversees Fidelity's high income and certain equity funds and other Boards oversee Fidelity's investment-grade bond, money market, asset allocation, and sector funds. The asset allocation funds may invest in Fidelity funds overseen by the fund's Board. The use of separate Boards, each with its own committee structure, allows the Trustees of each group of Fidelity funds to focus on the unique issues of the funds they oversee, including common research, investment, and operational issues. On occasion, the separate Boards establish joint committees to address issues of overlapping consequences for the Fidelity funds overseen by each Board.
The Trustees operate using a system of committees to facilitate the timely and efficient consideration of all matters of importance to the Trustees, the fund, and fund shareholders and to facilitate compliance with legal and regulatory requirements and oversight of the fund's activities and associated risks. The Board, acting through its committees, has charged FMR and its affiliates with (i) identifying events or circumstances the occurrence of which could have demonstrably adverse effects on the fund's business and/or reputation; (ii) implementing processes and controls to lessen the possibility that such events or circumstances occur or to mitigate the effects of such events or circumstances if they do occur; and (iii) creating and maintaining a system designed to evaluate continuously business and market conditions in order to facilitate the identification and implementation processes described in (i) and (ii) above. Because the day-to-day operations and activities of the fund are carried out by or through FMR, its affiliates and other service providers, the fund's exposure to risks is mitigated but not eliminated by the processes overseen by the Trustees. While each of the Board's committees has responsibility for overseeing different aspects of the fund's activities, oversight is exercised primarily through the Operations, Audit, and Compliance Committees. In addition, the Independent Trustees have worked with FMR to enhance the Board's oversight of investment and financial risks, legal and regulatory risks, technology risks, and operational risks, including the development of additional risk reporting to the Board. For example, a working group comprised of Independent Trustees and FMR has worked and continues to work to review the Fidelity funds' valuation-related activities, reporting and risk management. Appropriate personnel, including but not limited to the fund's Chief Compliance Officer (CCO), FMR's internal auditor, the independent accountants, the fund's Treasurer and portfolio management personnel, make periodic reports to the Board's committees, as appropriate, including an annual review of FMR's risk management program for the Fidelity funds. The responsibilities of each standing committee, including their oversight responsibilities, are described further under "Standing Committees of the Fund's Trustees."
Annual Report
The fund's Statements of Additional Information (SAIs) includes more information about the Trustees. To request a free copy, call Fidelity at 1-800-544-8544 for Fidelity Series Real Estate Income Fund or 1-800-835-5092 for Class F.
Interested Trustees*:
Correspondence intended for each Trustee who is an interested person may be sent to Fidelity Investments, 245 Summer Street, Boston, Massachusetts 02210.
Name, Year of Birth; Principal Occupations and Other Relevant Experience+ |
James C. Curvey (1935) |
Year of Election or Appointment: 2008 Trustee Chairman of the Board of Trustees |
| Mr. Curvey also serves as Trustee of other Fidelity funds. Mr. Curvey is a Director of Fidelity Research & Analysis Co. (investment adviser firm, 2009-present), and Vice Chairman (2007-present) and Director of FMR LLC (diversified financial services company). In addition, Mr. Curvey serves as an Overseer for the Boston Symphony Orchestra and a member of the board of Artis-Naples, Naples, Florida, and as a Trustee for Brewster Academy, Wolfeboro, New Hampshire. Previously, Mr. Curvey served as a Director of Fidelity Investments Money Management, Inc. (investment adviser firm, 2009-2014), a Director of FMR (investment adviser firm, 2007-2014), and a Director of FMR Co., Inc. (investment adviser firm, 2007-2014). |
Charles S. Morrison (1960) |
Year of Election or Appointment: 2014 Trustee |
| Mr. Morrison also serves as Trustee of other funds. He serves as a Director of Fidelity Investments Money Management, Inc. (FIMM) (investment adviser firm, 2014-present), Director of Fidelity SelectCo, LLC (investment adviser firm, 2014-present), President, Asset Management (2014-present), and is an employee of Fidelity Investments. Previously, Mr. Morrison served as Vice President of Fidelity's Fixed Income and Asset Allocation Funds (2012-2014), President, Fixed Income (2011-2014), Vice President of Fidelity's Money Market Funds (2005-2009), President, Money Market Group Leader of FMR (investment adviser firm, 2009), and Senior Vice President, Money Market Group of FMR (2004-2009). Mr. Morrison also served as Vice President of Fidelity's Bond Funds (2002-2005), certain Balanced Funds (2002-2005), and certain Asset Allocation Funds (2002-2007), and as Senior Vice President (2002-2005) of Fidelity's Bond Division. |
* Trustees have been determined to be "Interested Trustees" by virtue of, among other things, their affiliation with the trust or various entities under common control with FMR.
+ The information above includes each Trustee's principal occupation during the last five years and other information relating to the experience, attributes, and skills relevant to each Trustee's qualifications to serve as a Trustee, which led to the conclusion that each Trustee should serve as a Trustee for the fund.
Annual Report
Independent Trustees:
Correspondence intended for each Independent Trustee (that is, the Trustees other than the Interested Trustees) may be sent to Fidelity Investments, P.O. Box 55235, Boston, Massachusetts 02205-5235.
Name, Year of Birth; Principal Occupations and Other Relevant Experience+ |
Dennis J. Dirks (1948) |
Year of Election or Appointment: 2005 Trustee |
| Mr. Dirks also serves as Trustee of other Fidelity funds. Prior to his retirement in May 2003, Mr. Dirks was Chief Operating Officer and a member of the Board of The Depository Trust & Clearing Corporation (DTCC). He also served as President, Chief Operating Officer, and Board member of The Depository Trust Company (DTC) and President and Board member of the National Securities Clearing Corporation (NSCC). In addition, Mr. Dirks served as Chief Executive Officer and Board member of the Government Securities Clearing Corporation, Chief Executive Officer and Board member of the Mortgage-Backed Securities Clearing Corporation, as a Trustee and a member of the Finance Committee of Manhattan College (2005-2008), and as a Trustee and a member of the Finance Committee of AHRC of Nassau County (2006-2008). Mr. Dirks is a member of the Independent Directors Council (IDC) Governing Council (2010-present) and Board of Directors for The Brookville Center for Children's Services, Inc. (2009-present). |
Alan J. Lacy (1953) |
Year of Election or Appointment: 2008 Trustee |
| Mr. Lacy also serves as Trustee of other Fidelity funds. Mr. Lacy serves as a member of the Board of Directors of Dave & Buster's Entertainment, Inc. (restaurant and entertainment complexes, 2010-present) and Bristol-Myers Squibb Company (global pharmaceuticals, 2008-present). In addition, Mr. Lacy served as Senior Adviser (2007-2014) of Oak Hill Capital Partners, L.P. (private equity) and also served as Chief Executive Officer (2000-2005) and Vice Chairman (2005-2006) of Sears Holdings Corporation and Sears, Roebuck and Co. (retail). Mr. Lacy is a member of the Board of Trustees of The National Parks Conservation Association (2006-present). Previously, Mr. Lacy served as Chairman of the Board of Trustees of the National Parks Conservation Association (2008-2011) and as a member of the Board of Directors for The Western Union Company (global money transfer, 2006-2011), The Hillman Companies, Inc. (hardware wholesalers, 2010-2014), and Earth Fare, Inc. (retail grocery, 2010-2014). |
Ned C. Lautenbach (1944) |
Year of Election or Appointment: 2000 Trustee Chairman of the Independent Trustees |
| Mr. Lautenbach also serves as Trustee of other Fidelity funds. Mr. Lautenbach currently serves as the Lead Director of the Eaton Corporation Board of Directors (diversified industrial, 1997-present). Mr. Lautenbach is Chairman of the Board of Directors of Artis-Naples in Naples, Florida (2012-present), a member of the Council on Foreign Relations (1994-present), and a member of the Board of Governors, State University System of Florida (2013-present). Previously, Mr. Lautenbach was a Partner/Advisory Partner at Clayton, Dubilier & Rice, LLC (private equity investment, 1998-2010), as well as a Director of Sony Corporation (2006-2007). |
Joseph Mauriello (1944) |
Year of Election or Appointment: 2008 Trustee |
| Mr. Mauriello also serves as Trustee of other Fidelity funds. Prior to his retirement in January 2006, Mr. Mauriello served in numerous senior management positions including Deputy Chairman and Chief Operating Officer (2004-2005), and Vice Chairman of Financial Services (2002-2004) of KPMG LLP US (professional services, 1965-2005). Mr. Mauriello currently serves as a member of the Board of Directors of XL Group plc. (global insurance and re-insurance, 2006-present). Previously, Mr. Mauriello served as a Director of the Hamilton Funds of the Bank of New York (2006-2007) and of Arcadia Resources Inc. (health care services and products, 2007-2012). |
Robert W. Selander (1950) |
Year of Election or Appointment: 2011 Trustee |
| Mr. Selander also serves as Trustee of other Fidelity funds. Mr. Selander serves as a Director of The Western Union Company (global money transfer, 2014-present). Previously, Mr. Selander served as a Member of the Advisory Board of other Fidelity funds (2011), and Executive Vice Chairman (2010), Chief Executive Officer (2009-2010), and President and Chief Executive Officer (1997-2009) of Mastercard, Inc. |
Cornelia M. Small (1944) |
Year of Election or Appointment: 2005 Trustee |
| Ms. Small also serves as Trustee of other Fidelity funds. Ms. Small is a member of the Board of Directors (2009-present) and Chair of the Investment Committee (2010-present) of the Teagle Foundation. Ms. Small also serves on the Investment Committee of the Berkshire Taconic Community Foundation (2008-present). Previously, Ms. Small served as Chairperson (2002-2008) and a member of the Investment Committee and Chairperson (2008-2012) and a member of the Board of Trustees of Smith College. In addition, Ms. Small served as Chief Investment Officer, Director of Global Equity Investments, and a member of the Board of Directors of Scudder, Stevens & Clark and Scudder Kemper Investments. |
William S. Stavropoulos (1939) |
Year of Election or Appointment: 2002 Trustee Vice Chairman of the Independent Trustees |
| Mr. Stavropoulos also serves as Trustee of other Fidelity funds. Mr. Stavropoulos serves as President and Founder of the Michigan Baseball Foundation, the Great Lakes Loons (2007-present). Mr. Stavropoulos is Chairman Emeritus of the Board of Directors of The Dow Chemical Company, where he previously served in numerous senior management positions, including President, CEO (1995-2000; 2002-2004), Chairman of the Executive Committee (2000-2006), and as a member of the Board of Directors (1990-2006). Currently, Mr. Stavropoulos is Chairman of the Board of Directors of Univar Inc. (global distributor of commodity and specialty chemicals), a Director of Teradata Corporation (data warehousing and technology solutions), and Maersk Inc. (industrial conglomerate), and a member of the Advisory Board for Metalmark Capital LLC (private equity investment, 2005-present). Mr. Stavropoulos is an operating advisor to Clayton, Dubilier & Rice, LLC (private equity investment). In addition, Mr. Stavropoulos is a member of the University of Notre Dame Advisory Council for the College of Science, a Trustee of the Rollin L. Gerstacker Foundation, and a Director of the Naples Philharmonic Center for the Arts. Previously, Mr. Stavropoulos served as a Director of Chemical Financial Corporation (bank holding company, 1993-2012) and Tyco International, Ltd. (multinational manufacturing and services, 2007-2012). |
David M. Thomas (1949) |
Year of Election or Appointment: 2008 Trustee |
| Mr. Thomas also serves as Trustee of other Fidelity funds. Mr. Thomas serves as Non-Executive Chairman of the Board of Directors of Fortune Brands Home and Security (home and security products, 2011-present), as a member of the Board of Directors (2004-present) and Presiding Director (2013-present) of Interpublic Group of Companies, Inc. (marketing communication), and as a member of the Board of Trustees of the University of Florida (2013-present). Previously, Mr. Thomas served as Executive Chairman (2005-2006) and Chairman and Chief Executive Officer (2000-2005) of IMS Health, Inc. (pharmaceutical and healthcare information solutions), and a Director of Fortune Brands, Inc. (consumer products, 2000-2011). |
+ The information above includes each Trustee's principal occupation during the last five years and other information relating to the experience, attributes, and skills relevant to each Trustee's qualifications to serve as a Trustee, which led to the conclusion that each Trustee should serve as a Trustee for the fund.
Advisory Board Member and Officers:
Correspondence intended for each officer and Peter S. Lynch may be sent to Fidelity Investments, 245 Summer Street, Boston, Massachusetts 02210. Officers appear below in alphabetical order.
Name, Year of Birth; Principal Occupation |
Peter S. Lynch (1944) |
Year of Election or Appointment: 2003 Member of the Advisory Board |
| Mr. Lynch also serves as Member of the Advisory Board of other Fidelity funds. Mr. Lynch is Vice Chairman and a Director of FMR (investment adviser firm) and FMR Co., Inc. (investment adviser firm). In addition, Mr. Lynch serves as a Trustee of Boston College and as the Chairman of the Inner-City Scholarship Fund. Previously, Mr. Lynch served on the Special Olympics International Board of Directors (1997-2006). |
Christopher S. Bartel (1971) |
Year of Election or Appointment: 2011 Vice President |
| Mr. Bartel also serves as Vice President of other funds. Mr. Bartel serves as a Director, President, and Chief Executive Officer of Fidelity Management & Research (Japan) Limited (investment adviser firm, 2012- present), a Director of Fidelity Management & Research (Hong Kong) (investment adviser firm, 2012-present), and Senior Vice President of Global Equity Research (2010-present). Previously, Mr. Bartel served as Senior Vice President of Equity Research (2009-2010), Managing Director of Research (2006-2009), and an analyst and portfolio manager (2000-2006). |
Elizabeth Paige Baumann (1968) |
Year of Election or Appointment: 2012 Anti-Money Laundering (AML) Officer |
| Ms. Baumann also serves as AML Officer of other funds. She is Chief AML Officer of FMR LLC (diversified financial services company, 2012-present) and is an employee of Fidelity Investments. Previously, Ms. Baumann served as Vice President and Deputy Anti-Money Laundering Officer (2007-2012). |
Marc Bryant (1966) |
Year of Election or Appointment: 2015 Secretary and Chief Legal Officer (CLO) |
<R> | Mr. Bryant also serves as Secretary and Chief Legal Officer (CLO) of other funds. He is Senior Vice President and Deputy General Counsel of FMR LLC (diversified financial services company). Previously, Mr. Bryant served as Secretary and Chief Legal Officer of Fidelity Rutland Square Trust II (2010-2014) and Assistant Secretary of Fidelity's Fixed Income and Asset Allocation Funds (2013-2015). Prior to joining Fidelity Investments, Mr. Bryant served as a Senior Vice President and the Head of Global Retail Legal for AllianceBernstein L.P. (2006-2010), and as the General Counsel for ProFund Advisors LLC (2001-2006).</R> |
William C. Coffey (1969) |
Year of Election or Appointment: 2009 Assistant Secretary |
| Mr. Coffey also serves as Assistant Secretary of other funds. He is Senior Vice President and Deputy General Counsel of FMR LLC (diversified financial services company, 2010-present), and is an employee of Fidelity Investments. Previously, Mr. Coffey served as Vice President and Associate General Counsel of FMR LLC (2005-2009). |
Jonathan Davis (1968) |
Year of Election or Appointment: 2010 Assistant Treasurer |
| Mr. Davis also serves as Assistant Treasurer of other funds. Mr. Davis is an employee of Fidelity Investments. Previously, Mr. Davis served as Vice President and Associate General Counsel of FMR LLC (diversified financial services company, 2003-2010). |
Adrien E. Deberghes (1967) |
Year of Election or Appointment: 2008 Deputy Treasurer |
| Mr. Deberghes also serves as an officer of other funds. He is an employee of Fidelity Investments (2008-present). Prior to joining Fidelity Investments, Mr. Deberghes was Senior Vice President of Mutual Fund Administration at State Street Corporation (2007-2008), Senior Director of Mutual Fund Administration at Investors Bank & Trust (2005-2007), and Director of Finance for Dunkin' Brands (2000-2005). |
Stephanie J. Dorsey (1969) |
Year of Election or Appointment: 2010 Assistant Treasurer |
| Ms. Dorsey also serves as an officer of other funds. She is an employee of Fidelity Investments (2008-present) and has served in other fund officer roles. Prior to joining Fidelity Investments, Ms. Dorsey served as Treasurer (2004-2008) of the JPMorgan Mutual Funds and Vice President (2004-2008) of JPMorgan Chase Bank. |
Howard J. Galligan III (1966) |
Year of Election or Appointment: 2014 Chief Financial Officer |
| Mr. Galligan also serves as Chief Financial Officer of other funds. Mr. Galligan serves as President of Fidelity Pricing and Cash Management Services (FPCMS) (2014-present) and as a Director of Strategic Advisers, Inc. (investment adviser firm, 2008-present). Previously, Mr. Galligan served as Chief Administrative Officer of Asset Management (2011-2014) and Chief Operating Officer and Senior Vice President of Investment Support for Strategic Advisers, Inc. (2003-2011). |
Scott C. Goebel (1968) |
Year of Election or Appointment: 2015 Vice President |
| Mr. Goebel serves as an officer of other funds. Mr. Goebel also serves as Secretary of Fidelity SelectCo, LLC (investment adviser firm, 2013-present), Fidelity Investments Money Management, Inc. (FIMM) (investment adviser firm, 2010-present) and Fidelity Research and Analysis Company (FRAC) (investment adviser firm, 2010-present); General Counsel, Secretary, and Senior Vice President of FMR (investment adviser firm, 2008-present) and FMR Co., Inc. (investment adviser firm, 2008-present); Chief Legal Officer of Fidelity Management & Research (Hong Kong) Limited (investment adviser firm, 2008-present); and Assistant Secretary of Fidelity Management & Research (Japan) Limited (investment adviser firm, 2008-present) and FMR Investment Management (U.K.) Limited (investment adviser firm, 2008-present). Previously, Mr. Goebel served as Secretary and CLO of certain Fidelity funds (2008-2015), Assistant Secretary of FIMM (2008-2010), FRAC (2008-2010), and certain funds (2007-2008); and as Vice President and Secretary of Fidelity Distributors Corporation (FDC) (2005-2007). Mr. Goebel has been employed by FMR LLC (diversified financial services company) or an affiliate since 2001. |
Brian B. Hogan (1964) |
Year of Election or Appointment: 2011 Vice President |
| Mr. Hogan also serves as Trustee or Vice President of other funds. Mr. Hogan serves as a Director of Fidelity SelectCo, LLC (investment adviser firm, 2014-present) and President of the Equity Division of FMR (investment adviser firm, 2009-present). Previously, Mr. Hogan served as Senior Vice President, Equity Research of FMR (2006-2009) and as a portfolio manager. |
Chris Maher (1972) |
Year of Election or Appointment: 2013 Assistant Treasurer |
| Mr. Maher serves as Assistant Treasurer of other funds. Mr. Maher is Vice President of Valuation Oversight and is an employee of Fidelity Investments. Previously, Mr. Maher served as Vice President of Asset Management Compliance (2013), Vice President of the Program Management Group of FMR (investment adviser firm, 2010-2013), and Vice President of Valuation Oversight (2008-2010). |
Kenneth B. Robins (1969) |
Year of Election or Appointment: 2008 President and Treasurer |
| Mr. Robins also serves as an officer of other funds. Mr. Robins serves as Executive Vice President of Fidelity Investments Money Management, Inc. (FIMM) (investment adviser firm, 2013-present) and is an employee of Fidelity Investments (2004-present). Previously, Mr. Robins served in other fund officer roles. |
Stephen Sadoski (1971) |
Year of Election or Appointment: 2012 Deputy Treasurer |
| Mr. Sadoski also serves as Deputy Treasurer of other funds. He is an employee of Fidelity Investments (2012-present) and has served in another fund officer role. Prior to joining Fidelity Investments, Mr. Sadoski served as an assistant chief accountant in the Division of Investment Management of the Securities and Exchange Commission (SEC) (2009-2012) and as a senior manager at Deloitte & Touche LLP (1997-2009). |
Stacie M. Smith (1974) |
Year of Election or Appointment: 2013 Deputy Treasurer |
| Ms. Smith also serves as an officer of other funds. She is an employee of Fidelity Investments (2009-present) and has served in other fund officer roles. Prior to joining Fidelity Investments, Ms. Smith served as Senior Audit Manager of Ernst & Young LLP (1996-2009). |
Renee Stagnone (1975) |
Year of Election or Appointment: 2013 Deputy Treasurer |
| Ms. Stagnone also serves as Deputy Treasurer of other funds. Ms. Stagnone is an employee of Fidelity Investments. |
Linda J. Wondrack (1964) |
Year of Election or Appointment: 2014 Chief Compliance Officer |
| Ms. Wondrack also serves as Chief Compliance Officer of other funds. Ms. Wondrack is Executive Vice President and head of the Ethics Office and Asset Management Compliance for Fidelity Investments (2012- present). Ms. Wondrack also serves as Chief Compliance Officer of Fidelity SelectCo, LLC (investment adviser firm, 2014-present); Chief Compliance Officer of Impresa Management LLC (2013-present); and Chief Compliance Officer of FMR Co., Inc. (investment adviser firm), Fidelity Investments Money Management, Inc. (investment adviser firm), Fidelity Management & Research (Japan) Limited (investment adviser firm), FMR Investment Management (U.K.) Limited (investment adviser firm), Fidelity Management & Research (Hong Kong) (investment adviser firm), Fidelity Management & Research Company (investment adviser firm), Pyramis Global Advisors, LLC (investment adviser firm), and Strategic Advisers, Inc. (investment adviser firm), Ballyrock Investment Advisors LLC, and Northern Neck Investors LLC (2012-present). Previously, Ms. Wondrack served as Senior Vice President and Chief Compliance Officer for Columbia Management Investment Advisers, LLC (2005-2012); Chief Compliance Officer for certain funds within the Columbia Family of Funds (2007-2012); and Senior Vice President of Compliance Risk Management at Bank of America (2005-2010). |
Joseph F. Zambello (1957) |
Year of Election or Appointment: 2011 Deputy Treasurer |
| Mr. Zambello also serves as Deputy Treasurer of other funds. Mr. Zambello is an employee of Fidelity Investments. Previously, Mr. Zambello served as Vice President of the Program Management Group of FMR (investment adviser firm, 2009-2011) and Vice President of the Transfer Agent Oversight Group (2005-2009). |
Annual Report
The Board of Trustees of Fidelity Series Real Estate Income Fund voted to pay shareholders of record at the opening of business on record date, the following distributions per share derived from capital gains realized from sales of portfolio securities, and dividends derived from net investment income:
| Pay Date | Record Date | Dividends | Capital Gains |
Real Estate Income | 09/14/15 | 09/11/15 | $0.137 | $0.086 |
Class F | 09/14/15 | 09/11/15 | $0.141 | $0.086 |
The fund hereby designates as a capital gain dividend with respect to the taxable year ended July 31, 2015, $7,899,714, or, if subsequently determined to be different, the net capital gain of such year.
A total of 0.03% of the dividends distributed during the fiscal year was derived from interest on U.S. Government securities which is generally exempt from state income tax.
The fund will notify shareholders in January 2016 of amounts for use in preparing 2015 income tax returns.
Annual Report
Fidelity Series Real Estate Income Fund
Each year, the Board of Trustees, including the Independent Trustees (together, the Board), votes on the renewal of the management contract with Fidelity Management & Research Company (FMR) and the sub-advisory agreements (together, the Advisory Contracts) for the fund. The Board, assisted by the advice of fund counsel and Independent Trustees' counsel, requests and considers a broad range of information relevant to the renewal of the Advisory Contracts throughout the year.
The Board meets regularly and, at each of its meetings, covers an extensive agenda of topics and materials and considers factors that are relevant to its annual consideration of the renewal of the fund's Advisory Contracts, including the services and support provided to the fund and its shareholders. The Board has established various standing committees (Committees), each composed of and chaired by Independent Trustees with varying backgrounds, to which the Board has assigned specific subject matter responsibilities in order to enhance effective decision-making by the Board. The Board, acting directly and through its Committees, requests and receives information concerning the annual consideration of the renewal of the fund's Advisory Contracts. The Board also meets as needed to consider matters specifically related to the Board's annual consideration of the renewal of the Advisory Contracts. Members of the Board may also meet with trustees of other Fidelity funds through ad hoc joint committees to discuss certain matters relevant to all of the Fidelity funds.
At its July 2015 meeting, the Board unanimously determined to renew the fund's Advisory Contracts. In reaching its determination, the Board considered all factors it believed relevant, including (i) the nature, extent, and quality of the services to be provided to the fund and its shareholders (including the investment performance of the fund); (ii) the competitiveness of the fund's management fee and total expense ratio relative to peer funds; (iii) the total costs of the services to be provided by and the profits to be realized by Fidelity from its relationship with the fund; and (iv) the extent to which (if any) economies of scale exist and would be realized as the fund grows, and whether any economies of scale are appropriately shared with fund shareholders.
In considering whether to renew the Advisory Contracts for the fund, the Board reached a determination, with the assistance of fund counsel and Independent Trustees' counsel and through the exercise of its business judgment, that the renewal of the Advisory Contracts was in the best interests of the fund and its shareholders and that the compensation payable under the Advisory Contracts was fair and reasonable. The Board's decision to renew the Advisory Contracts was not based on any single factor, but rather was based on a comprehensive consideration of all the information provided to the Board at its meetings throughout the year. The Board, in reaching its determination to renew the Advisory Contracts, was aware that shareholders of the fund have a broad range of investment choices available to them, including a wide choice among funds offered by Fidelity's competitors, and that the fund's shareholders, who have the opportunity to review and weigh the disclosure provided by the fund in its prospectus and other public disclosures, have chosen to invest in this fund, which is part of the Fidelity family of funds.
Annual Report
Board Approval of Investment Advisory Contracts and
Management Fees - continued
Nature, Extent, and Quality of Services Provided. The Board considered Fidelity's staffing as it relates to the fund, including the backgrounds of investment personnel of Fidelity, and also considered the fund's investment objective, strategies, and related investment philosophy. The Independent Trustees also had discussions with senior management of Fidelity's investment operations and investment groups. The Board considered the structure of the portfolio manager compensation program and whether this structure provides appropriate incentives to act in the best interests of the fund. Additionally, the Board considered the portfolio managers' investments, if any, in the funds that they manage.
Resources Dedicated to Investment Management and Support Services. The Board and the Fund Oversight and Research Committees reviewed the general qualifications and capabilities of Fidelity's investment staff, including its size, education, experience, and resources, as well as Fidelity's approach to recruiting, training, managing, and compensating investment personnel. The Board noted that Fidelity has continued to increase the resources devoted to non-U.S. offices, including expansion of Fidelity's global investment organization. The Board also noted that Fidelity's analysts have extensive resources, tools and capabilities that allow them to conduct sophisticated quantitative and fundamental analysis, as well as credit analysis of issuers, counterparties and guarantors. Further, the Board considered that Fidelity's investment professionals have sufficient access to global information and data so as to provide competitive investment results over time, and that those professionals also have access to sophisticated tools that permit them to assess portfolio construction and risk and performance attribution characteristics continuously, as well as to transmit new information and research conclusions rapidly around the world. Additionally, in its deliberations, the Board considered Fidelity's trading, risk management, and compliance capabilities and resources, which are integral parts of the investment management process.
Shareholder and Administrative Services. The Board considered (i) the nature, extent, quality, and cost of advisory, administrative, and shareholder services performed by FMR, the sub-advisers (together with FMR, the Investment Advisers), and their affiliates under the Advisory Contracts and under separate agreements covering transfer agency, pricing and bookkeeping, and securities lending services for the fund; (ii) the nature and extent of the supervision of third party service providers, principally custodians and subcustodians; and (iii) the resources devoted to, and the record of compliance with, the fund's compliance policies and procedures. The Board also reviewed the allocation of fund brokerage, including allocations to brokers affiliated with the Investment Advisers, the use of brokerage commissions to pay fund expenses, and the use of "soft" commission dollars to pay for research services.
Annual Report
The Board noted that the growth of fund assets over time across the complex allows Fidelity to reinvest in the development of services designed to enhance the value or convenience of the Fidelity funds as investment vehicles. These services include 24-hour access to account information and market information through telephone representatives and over the Internet, investor education materials and asset allocation tools, and the expanded availability of Fidelity Investor Centers.
In 2014, the Board formed an ad hoc Committee on Transfer Agency Fees to review the variety of transfer agency fee structures throughout the industry and Fidelity's competitive positioning with respect to industry participants.
Investment in a Large Fund Family. The Board considered the benefits to shareholders of investing in a Fidelity fund, including the benefits of investing in a fund that is part of a large family of funds offering a variety of investment disciplines and providing a large variety of mutual fund investor services. The Board noted that Fidelity had taken, or had made recommendations that resulted in the Fidelity funds taking, a number of actions over the previous year that benefited particular funds, including (i) continuing to dedicate additional resources to investment research and to the support of the senior management team that oversees asset management; (ii) continuing efforts to enhance Fidelity's global research capabilities; (iii) launching new funds and making other enhancements to meet client needs; (iv) reducing management fees and total expenses for certain index funds and diversified international funds; (v) continuing to launch dedicated lower cost underlying funds to meet portfolio construction needs related to expanding underlying fund options for Fidelity funds of funds, specifically for the Freedom Fund product lines; (vi) rationalizing product lines and gaining increased efficiencies through fund mergers; (vii) launching active fixed-income exchange-traded funds; (viii) continuing to develop, acquire and implement systems and technology to improve services to the funds and information security and to increase efficiency; (ix) implementing investment enhancements to further strengthen Fidelity's target date product line to increase investors' probability of success in achieving their goals; (x) modifying the eligibility criteria for certain share classes to accommodate roll-over assets from employer-sponsored retirement plans; (xi) launching a new Class W of the Freedom Index Funds to attract and retain Fidelity record-kept retirement plan assets; and (xii) implementing changes to Fidelity's money market product line in response to recent money market regulatory reforms.
Investment Performance. The Board considered whether the fund has operated in accordance with its investment objective, as well as its record of compliance with its investment restrictions and its performance history.
Annual Report
Board Approval of Investment Advisory Contracts and
Management Fees - continued
The Board took into account discussions with representatives of the Investment Advisers about fund investment performance that occur at Board meetings throughout the year. In this regard the Board noted that as part of regularly scheduled fund reviews and other reports to the Board on fund performance, the Board considers annualized return information for the fund, for different time periods, measured against a securities market index ("benchmark index") and a peer group of funds with similar objectives ("peer group"), if any. In its evaluation of fund investment performance, the Board gave particular attention to information indicating changes in performance of certain Fidelity funds for specific time periods and discussed with the Investment Advisers the reasons for any overperformance or underperformance.
In addition to reviewing absolute and relative fund performance, the Independent Trustees periodically consider the appropriateness of fund performance metrics in evaluating the results achieved. In general, the Independent Trustees believe that fund performance should be evaluated based on net performance (after fees and expenses) of both the highest performing and lowest performing fund share classes, where applicable, compared to appropriate benchmark indices, over appropriate time periods that may include full market cycles, and compared to peer groups, as applicable, over the same periods, taking into account relevant factors including the following: general market conditions; issuer-specific information; and fund cash flows and other factors.
The Independent Trustees recognize that shareholders evaluate performance on a net basis over their own holding periods, for which one-, three-, and five-year periods are often used as a proxy. For this reason, the performance information reviewed by the Board also included net cumulative calendar year total return information for the fund and an appropriate benchmark index and peer group for the most recent one- and three-year periods, as shown below. Returns are shown compared to the 25th percentile (top of box, 75% beaten) and 75th percentile (bottom of box, 25% beaten) of the peer universe.
Annual Report
Fidelity Series Real Estate Income Fund
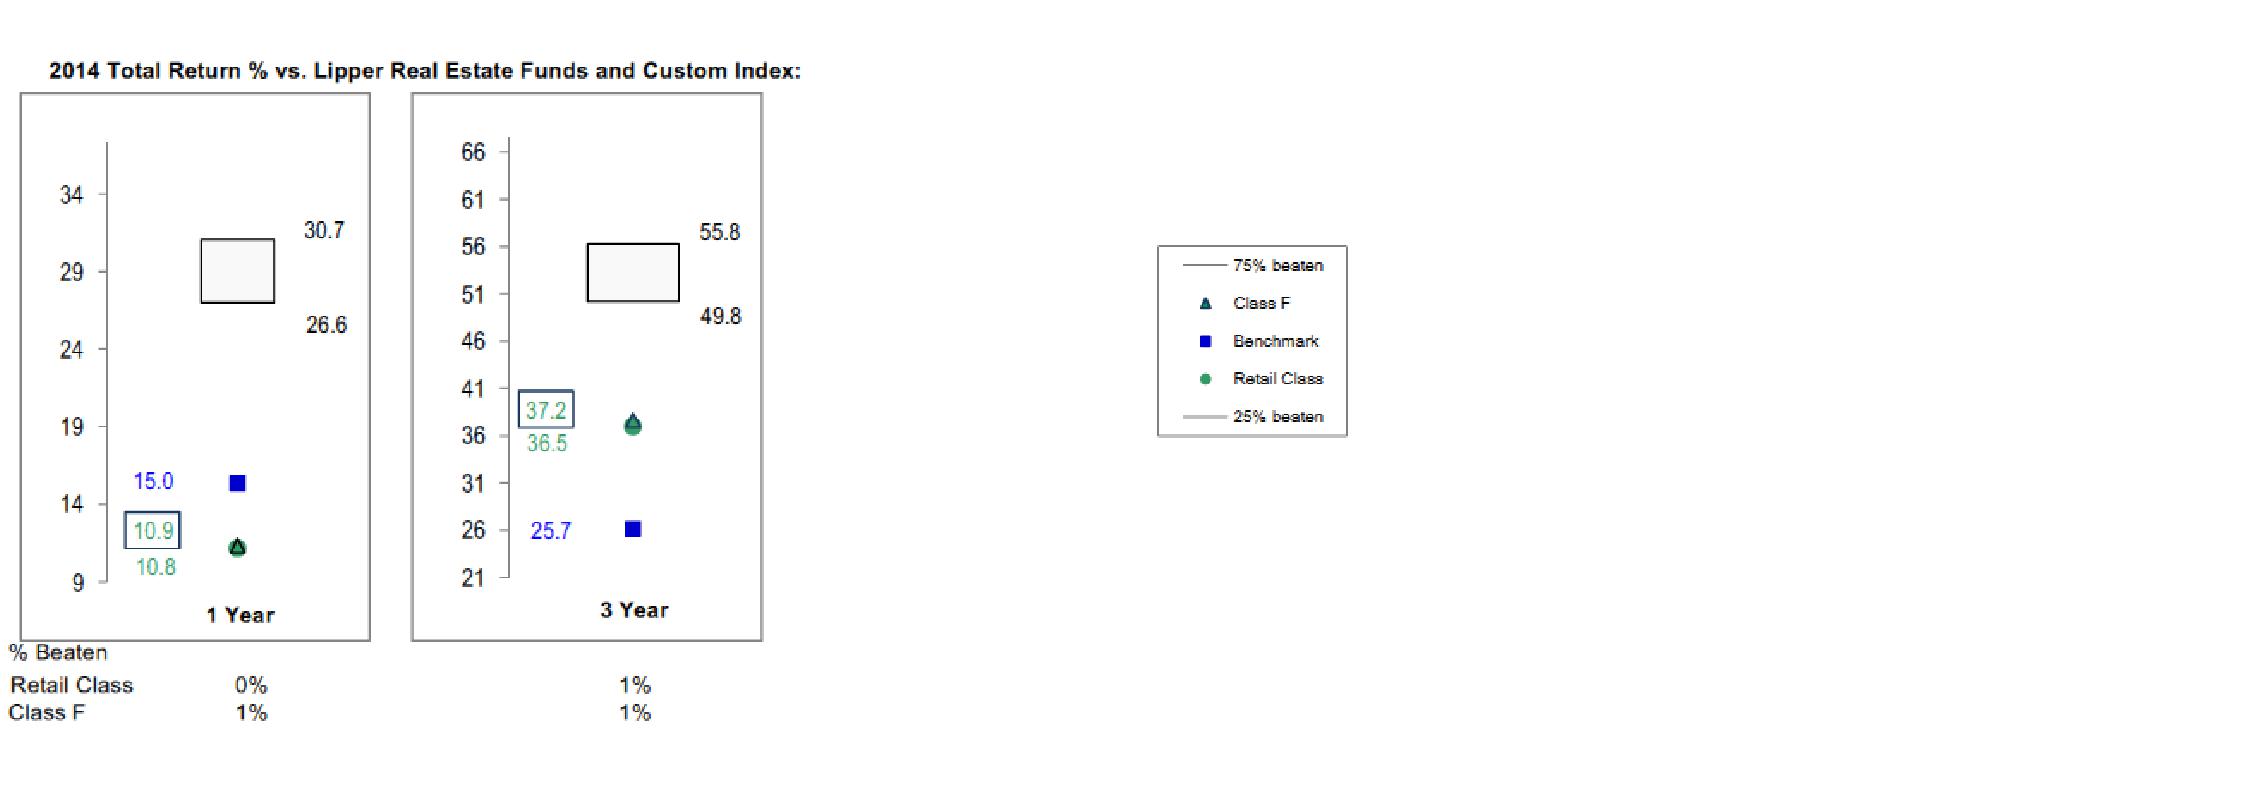
Based on its review, the Board concluded that the nature, extent, and quality of services provided to the fund under the Advisory Contracts should benefit the shareholders of the fund.
Competitiveness of Management Fee and Total Expense Ratio. The Board considered the fund's management fee and total expense ratio compared to "mapped groups" of competitive funds and classes created for the purpose of facilitating the Trustees' competitive analysis of management fees and total expenses. Fidelity creates "mapped groups" by combining similar Lipper investment objective categories that have comparable investment mandates. Combining Lipper investment objective categories aids the Board's management fee and total expense ratio comparisons by broadening the competitive group used for comparison.
Management Fee. The Board considered two proprietary management fee comparisons for the 12-month (or shorter) periods shown in basis points (BP) in the chart below. The group of Lipper funds used by the Board for management fee comparisons is referred to below as the "Total Mapped Group." The Total Mapped Group is broader than the Lipper peer group used by the Board for performance comparisons because the Total Mapped Group combines several Lipper investment objective categories while the Lipper peer group does not. The Total Mapped Group comparison focuses on a fund's standing in terms of gross management fees before expense reimbursements or caps relative to the total universe of funds with comparable investment mandates, regardless of whether their management fee structures also are comparable. Funds with comparable investment mandates offer exposure to similar types of securities. Funds with comparable management fee structures have similar management fee contractual arrangements (e.g., flat rate charged for advisory services, all-inclusive fee rate, etc.). "TMG %" represents the percentage of funds in the Total Mapped Group that had management fees that were lower than the fund's. For example, a hypothetical TMG % of 20% would mean that 80% of the funds in the Total Mapped Group had higher, and 20% had lower, management fees than the fund. The fund's actual TMG %s and the number of funds in the Total Mapped Group are in the chart below. The "Asset-Size Peer Group" (ASPG) comparison focuses on a fund's standing relative to a subset of non-Fidelity funds within the Total Mapped Group that are similar in size and management fee structure without taking into account performance adjustments, if any. For example, if a fund is in the first quartile of the ASPG, the fund's management fee ranks in the least expensive or lowest 25% of funds in the ASPG. The ASPG represents at least 15% of the funds in the Total Mapped Group with comparable asset size and management fee structures, subject to a minimum of 50 funds (or all funds in the Total Mapped Group if fewer than 50). Additional information, such as the ASPG quartile in which the fund's management fee rate ranked, is also included in the chart and considered by the Board.
Annual Report
Board Approval of Investment Advisory Contracts and
Management Fees - continued
Fidelity Series Real Estate Income Fund
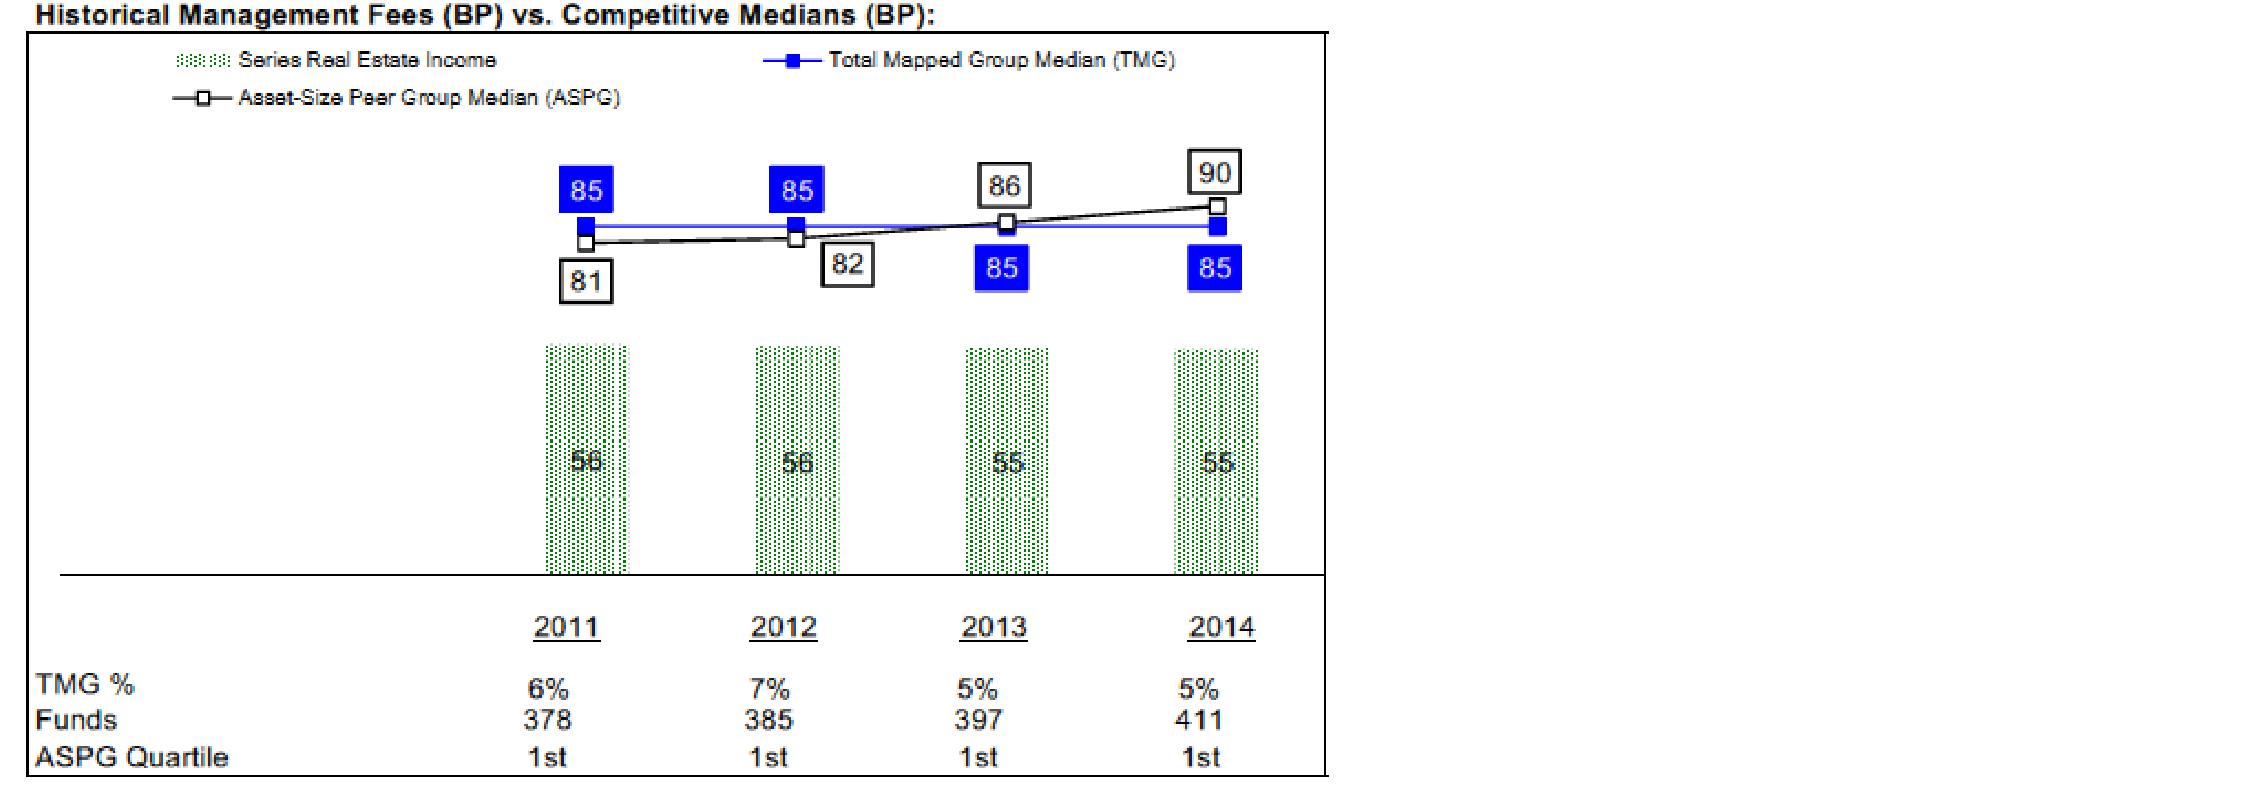
The Board noted that the fund's management fee rate ranked below the median of its Total Mapped Group and below the median of its ASPG for 2014.
The Board noted that, in 2014, the ad hoc Committee on Group Fee was formed by it and other Fidelity fund boards to conduct an in-depth review of the "group fee" component of the management fee of funds with such management fee structures. Committee focus included the mechanics of the group fee, the competitive landscape of group fee structures, Fidelity funds with no group fee component and investment products not included in group fee assets. The Board also considered that, for funds subject to the group fee, FMR agreed to voluntarily waive fees over a specified period of time in amounts designed to account for assets converted from certain funds to certain collective investment trusts.
Annual Report
The Board also noted that, in 2013, the ad hoc Committee on Management Fees was formed to conduct an in-depth review of the management fee rates of Fidelity's active equity mutual funds. The Committee focused on the following areas: (i) standard fee structures; (ii) research consumption and trading evolution; (iii) management fee competitiveness/profitability by category; and (iv) factors that drive institutional pricing.
Based on its review, the Board concluded that the fund's management fee is fair and reasonable in light of the services that the fund receives and the other factors considered.
Total Expense Ratio. In its review of each class's total expense ratio, the Board considered the fund's management fee as well as other fund or class expenses, as applicable, such as transfer agent fees, pricing and bookkeeping fees, and custodial, legal, and audit fees. The Board also noted that Fidelity may agree to waive fees and expenses from time to time, and the extent to which, if any, it has done so for the fund. As part of its review, the Board also considered the current and historical total expense ratios of each class of the fund compared to competitive fund median expenses. Each class of the fund is compared to those funds and classes in the Total Mapped Group (used by the Board for management fee comparisons) that have a similar sales load structure.
The Board noted that the total expense ratio of each class ranked below its competitive median for 2014.
Fees Charged to Other Fidelity Clients. The Board also considered Fidelity fee structures and other information with respect to clients of Fidelity, such as other funds advised or subadvised by Fidelity, pension plan clients, and other institutional clients with similar mandates. The Board noted the findings of the 2013 ad hoc joint committee (created with the board of other Fidelity funds), which reviewed and compared Fidelity's institutional investment advisory business with its business of providing services to the Fidelity funds, including the differences in services provided, fees charged, and costs incurred, as well as competition in their respective marketplaces.
Based on its review of total expense ratios and fees charged to other Fidelity clients, the Board concluded that the total expense ratio of each class of the fund was reasonable in light of the services that the fund and its shareholders receive and the other factors considered.
Costs of the Services and Profitability. The Board considered the revenues earned and the expenses incurred by Fidelity in conducting the business of developing, marketing, distributing, managing, administering and servicing the fund and servicing the fund's shareholders. The Board also considered the level of Fidelity's profits in respect of all the Fidelity funds.
Annual Report
Board Approval of Investment Advisory Contracts and
Management Fees - continued
On an annual basis, Fidelity presents to the Board information about the profitability of its relationship with the fund. Fidelity calculates profitability information for each fund, as well as aggregate profitability information for groups of Fidelity funds and all Fidelity funds, using a series of detailed revenue and cost allocation methodologies which originate with the books and records of Fidelity on which Fidelity's audited financial statements are based. The Audit Committee of the Board reviews any significant changes from the prior year's methodologies.
PricewaterhouseCoopers LLP (PwC), independent registered public accounting firm and auditor to Fidelity and certain Fidelity funds, has been engaged annually by the Board as part of the Board's assessment of Fidelity's profitability analysis. PwC's engagement includes the review and assessment of the methodologies used by Fidelity in determining the revenues and expenses attributable to Fidelity's mutual fund business, and completion of agreed-upon procedures in respect of the mathematical accuracy of fund profitability and its conformity to established allocation methodologies. After considering PwC's reports issued under the engagement and information provided by Fidelity, the Board concluded that while other allocation methods may also be reasonable, Fidelity's profitability methodologies are reasonable in all material respects.
The Board also reviewed Fidelity's non-fund businesses and fall-out benefits related to the mutual fund business as well as cases where Fidelity's affiliates may benefit from or be related to the fund's business.
The Board considered the costs of the services provided by and the profits realized by Fidelity in connection with the operation of the fund and was satisfied that the profitability was not excessive.
Economies of Scale. The Board considered whether there have been economies of scale in respect of the management of the Fidelity funds, whether the Fidelity funds (including the fund) have appropriately benefited from any such economies of scale, and whether there is potential for realization of any further economies of scale. The Board considered the extent to which the fund will benefit from economies of scale as assets grow through increased services to the fund, through waivers or reimbursements, or through fee or expense ratio reductions. The Board also noted that in 2013, it and the boards of other Fidelity funds created an ad hoc committee (the Economies of Scale Committee) to analyze whether Fidelity attains economies of scale in respect of the management and servicing of the Fidelity funds, whether the Fidelity funds have appropriately benefited from such economies of scale, and whether there is potential for realization of any further economies of scale.
Annual Report
The Board recognized that the fund's management contract incorporates a "group fee" structure, which provides for lower group fee rates as total group assets increase, and for higher group fee rates as total group assets decrease (with "group assets" defined to include fund assets under FMR's management plus sector fund assets previously under FMR's management and currently managed by Fidelity SelectCo, LLC). FMR calculates the group fee rates based on a tiered asset "breakpoint" schedule that varies based on asset class. The Board considered that the group fee is designed to deliver the benefits of economies of scale to fund shareholders when total Fidelity fund assets increase, even if assets of any particular fund are unchanged or have declined, because some portion of Fidelity's costs are attributable to services provided to all Fidelity funds, and all funds benefit if those costs can be allocated among more assets. The Board also considered that although the fund is offered only to other Fidelity funds, it continues to incur investment management expenses. The Board further noted that the fund may continue to realize benefits from the group fee structure, even though assets may not be expected to grow significantly at the fund level. The Board concluded that, given the group fee structure, fund shareholders will benefit from lower management fees as group assets increase at the fund complex level, regardless of whether Fidelity achieves any such economies of scale.
The Board concluded, taking into account the analysis of the Economies of Scale Committee, that economies of scale, if any, are being appropriately shared between fund shareholders and Fidelity.
Additional Information Requested by the Board. In order to develop fully the factual basis for consideration of the Fidelity funds' Advisory Contracts, the Board requested and received additional information on certain topics, including: (i) fund performance trends and Fidelity's long-term strategies for certain funds; (ii) the various share classes employed by Fidelity and the attributes of each class, together with similar information on the distribution and servicing payments made by Fidelity or the funds to third-party participants in the distribution channels; (iii) fund profitability, and fund performance in relation to fund profitability; (iv) the methodology with respect to evaluating competitive fund data and peer group classifications and fee comparisons; (v) annual fund profitability margins, with particular focus on certain funds with negative margins; (vi) the realization of fall-out benefits in certain Fidelity business units; (vii) economies of scale and the way in which they are shared with fund shareholders; (viii) Fidelity's group fee structures, including the group fee schedule of breakpoints; (ix) the impact of cost containment measures on the funds; and (x) the transfer agent fee structure.
Based on its evaluation of all of the conclusions noted above, and after considering all factors it believed relevant, the Board concluded that the advisory fee structures are fair and reasonable, and that the fund's Advisory Contracts should be renewed.
Annual Report
Investment Adviser
Fidelity Management & Research Company
Boston, MA
Investment Sub-Advisers
FMR Co., Inc.
FMR Investment Management
(U.K.) Limited
Fidelity Management & Research
(Hong Kong) Limited
Fidelity Management & Research
(Japan) Limited
General Distributor
Fidelity Distributors Corporation
Smithfield, RI
Transfer and Service Agents
Fidelity Investments Institutional Operations Company, Inc.
Boston, MA
Fidelity Service Company, Inc.
Boston, MA
Custodian
The Northern Trust Company
Chicago, IL
(Fidelity Investment logo)(registered trademark)
Corporate Headquarters
245 Summer St., Boston, MA 02210
www.fidelity.com
SRE-ANN-0915
1.924310.103
(Fidelity Investment logo)(registered trademark)
Fidelity Advisor®
Real Estate Income
Fund - Class A, Class T, and Class C
Annual Report
July 31, 2015
(Fidelity Cover Art)
Class A, Class T, and
Class C are classes of Fidelity® Real Estate Income Fund
Contents
Performance | (Click Here) | How the fund has done over time. |
Management's Discussion of Fund Performance | (Click Here) | The Portfolio Manager's review of fund performance and strategy. |
Shareholder Expense Example | (Click Here) | An example of shareholder expenses. |
Investment Changes | (Click Here) | A summary of major shifts in the fund's investments over the past six months. |
Investments | (Click Here) | A complete list of the fund's investments with their market values. |
Financial Statements | (Click Here) | Statements of assets and liabilities, operations, and changes in net assets, as well as financial highlights. |
Notes | (Click Here) | Notes to the financial statements. |
Report of Independent Registered Public Accounting Firm | (Click Here) | |
Trustees and Officers | (Click Here) | |
Distributions | (Click Here) | |
Board Approval of Investment Advisory Contracts and Management Fees | (Click Here) | |
To view a fund's proxy voting guidelines and proxy voting record for the 12-month period ended June 30, visit http://www.fidelity.com/proxyvotingresults or visit the Securities and Exchange Commission's (SEC) web site at http://www.sec.gov. You may also call 1-877-208-0098 to request a free copy of the proxy voting guidelines.
Standard & Poor's, S&P and S&P 500 are registered service marks of The McGraw-Hill Companies, Inc. and have been licensed for use by Fidelity Distributors Corporation.
Other third-party marks appearing herein are the property of their respective owners.
All other marks appearing herein are registered or unregistered trademarks or service marks of FMR LLC or an affiliated company. © 2015 FMR LLC. All rights reserved.
Annual Report
Notes to Financial Statements - continued
This report and the financial statements contained herein are submitted for the general information of the shareholders of the fund. This report is not authorized for distribution to prospective investors in the fund unless preceded or accompanied by an effective prospectus.
A fund files its complete schedule of portfolio holdings with the SEC for the first and third quarters of each fiscal year on Form N-Q. Forms N-Q are available on the SEC's web site at http://www.sec.gov. A fund's Forms N-Q may be reviewed and copied at the SEC's Public Reference Room in Washington, DC. Information regarding the operation of the SEC's Public Reference Room may be obtained by calling 1-800-SEC-0330. For a complete list of a fund's portfolio holdings, view the most recent holdings listing, semiannual report, or annual report on Fidelity's web site at http://www.fidelity.com, http://www.advisor.fidelity.com, or http://www.401k.com, as applicable.
NOT FDIC INSURED • MAY LOSE VALUE • NO BANK GUARANTEE
Neither the fund nor Fidelity Distributors Corporation is a bank.
Annual Report
Average annual total return reflects the change in the value of an investment, assuming reinvestment of the class' distributions from dividend income and capital gains (the profits earned upon the sale of securities that have grown in value, if any) and assuming a constant rate of performance each year. The $10,000 table and the fund's returns do not reflect the deduction of taxes that a shareholder would pay on fund distributions or the redemption of fund shares. During periods of reimbursement by Fidelity, a fund's total return will be greater than it would be had the reimbursement not occurred. How a fund did yesterday is no guarantee of how it will do tomorrow.
Average Annual Total Returns
Periods ended July 31, 2015 | Past 1
year | Past 5
years | Past 10
years |
Class A (incl. 4.00% sales charge) A | 0.46% | 8.69% | 5.89% |
Class T (incl. 4.00% sales charge) B | 0.44% | 8.66% | 5.87% |
Class C (incl. contingent deferred sales charge)C | 2.84% | 8.74% | 5.89% |
A Class A shares bear a 0.25% 12b-1 fee. The initial offering of Class A shares took place on April 14, 2010. Returns prior to April 14, 2010 are those of Fidelity® Real Estate Income Fund, the original class of the fund, which has no 12b-1 fee. Had Class A's 12b-1 fee been reflected, returns prior to April 14, 2010 would have been lower.
B Class T shares bear a 0.25% 12b-1 fee. The initial offering of Class T shares took place on April 14, 2010. Returns prior to April 14, 2010 are those of Fidelity® Real Estate Income Fund, the original class of the fund, which has no 12b-1 fee. Had Class T's 12b-1 fee been reflected, returns prior to April 14, 2010 would have been lower.
C Class C shares bear a 1.00% 12b-1 fee. The initial offering of Class C shares took place on April 14, 2010. Returns prior to April 14, 2010 are those of Fidelity Real Estate Income Fund, the original class of the fund, which has no 12b-1 fee. Had Class C's 12b-1 fee been reflected, returns prior to April 14, 2010 would have been lower. Class C shares' contingent deferred sales charges included in the past one year, past five years, and past ten years total return figures are 1%, 0%, and 0%, respectively.
Annual Report
Performance - continued
$10,000 Over 10 Years
Let's say hypothetically that $10,000 was invested in Fidelity Advisor® Real Estate Income Fund - Class A on July 31, 2005, and the current 4.00% sales charge was paid. The chart shows how the value of your investment would have changed, and also shows how the S&P 500® Index performed over the same period. See footnote A on the previous page for additional information regarding the performance of Class A.
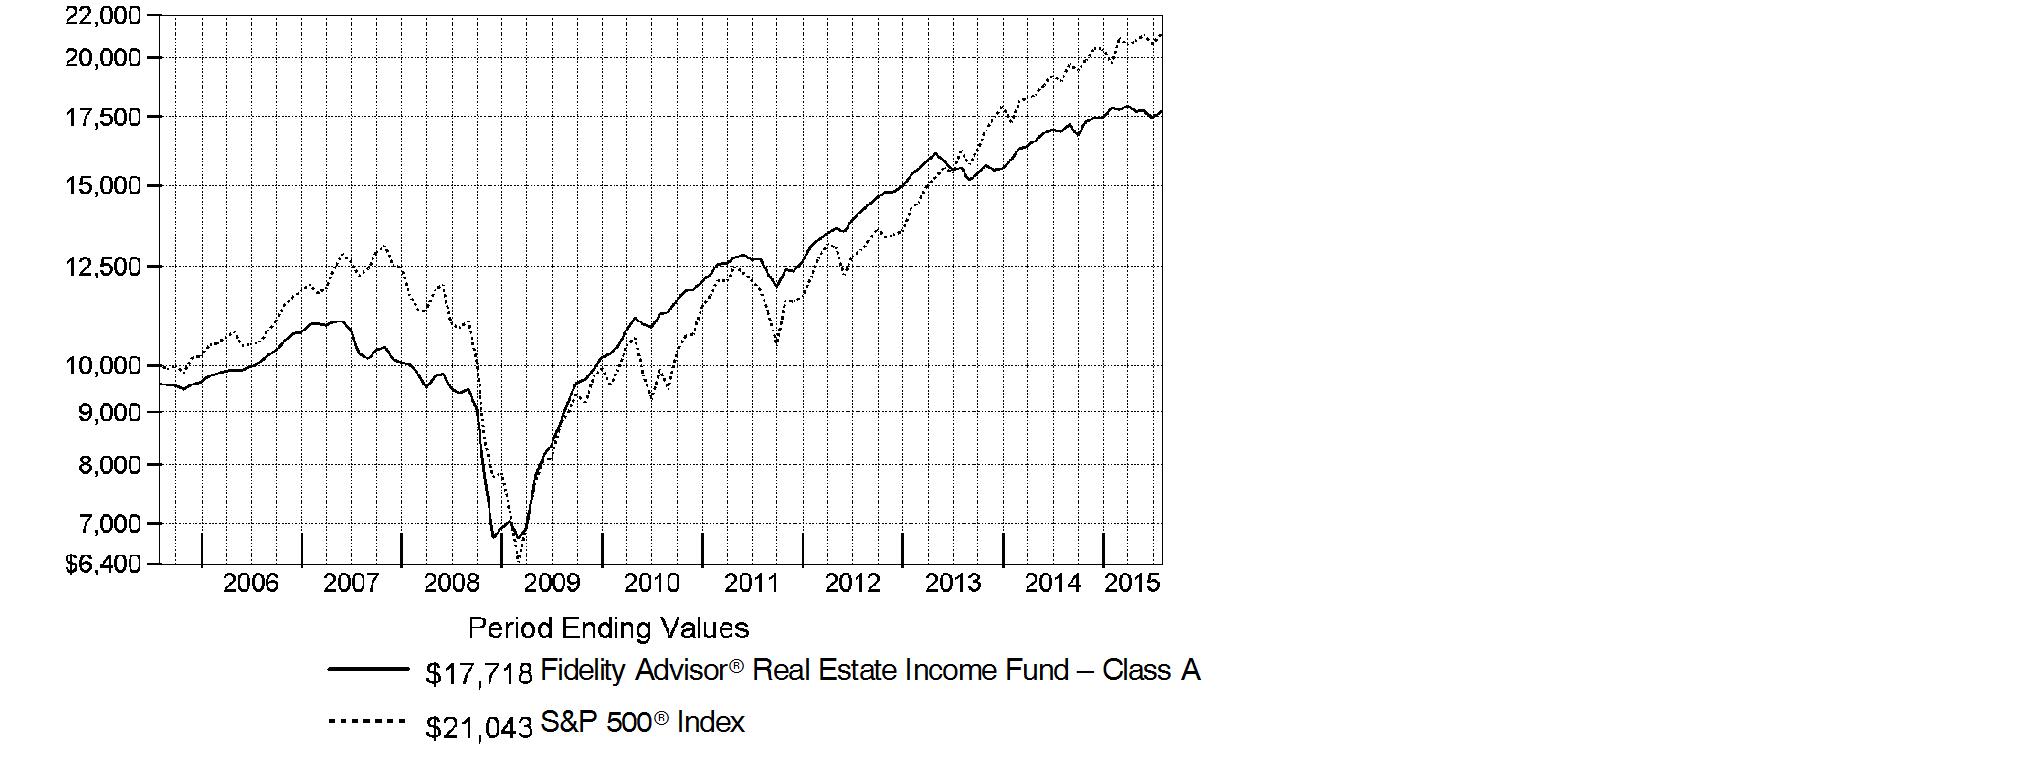
Annual Report
Market Recap: For the 12 months ending July 31, 2015, real estate securities experienced greater volatility than normal for most historical time periods, partly due to the market's reaction to changing interest rate expectations. In the first half of the period, real estate common stocks, as measured by the FTSE® NAREIT® All REITs Index, rose sharply but, with an increase in rates, subsequently gave back much of those gains before enjoying somewhat better results in the period's final weeks. All told, the FTSE® NAREIT® index rose 8.99%. Meanwhile, the MSCI REIT Preferred Index, a proxy for the real estate preferred stock segment, gained 8.93%, a relatively strong result that partly reflected its somewhat low valuations on a historical basis coming into the reporting period. On the market's fixed-income side, The BofA Merrill LynchSM US Real Estate Index - a market-capitalization-weighted measure of investment-grade corporate debt in the domestic real estate sector - rose 3.05%. The market performance took place against a continued solid fundamental backdrop for commercial real estate. The creation of property supply was still moderate, while companies generally experienced growing occupancies or rents, which in turn helped lift cash flows for real estate owners.
Comments from Portfolio Manager Mark Snyderman: For the year, the fund's share classes fell short of my target for a mid- to upper-single-digit return. (For specific class-level results, please see the Performance section of this report.) At the same time, its share classes trailed the 6.69% return of the sector benchmark Fidelity Real Estate Income Composite IndexSM - a 40/40/20 blend of the MSCI REIT Preferred Index, The BofA Merrill LynchSM US Real Estate Index and the FTSE® NAREIT® All REITs Index, respectively. The fund's preferred stocks gained roughly 9%, nearly matching the return of the MSCI preferred stock index. The fund's bond investments also generally did well. Our commercial mortgage-backed securities (CMBS) and high-yield real estate bonds returned approximately 6% and 4%, respectively, outpacing the 3% increase in the BofA Merrill Lynch index. Meanwhile, our investment-grade positions roughly matched that measure. Good credit research helped drive the outperformance from CMBS and high-yield securities, but helped to a lesser extent with our investment-grade holdings. Meanwhile, the fund's real estate investment trust (REIT) common stock investments added 7%, well behind the FTSE NAREIT index. A negative performance factor was the fund's average cash allocation of 7%, a normal level of cash for this fund that hurt during a rising market.
The views expressed above reflect those of the portfolio manager(s) only through the end of the period as stated on the cover of this report and do not necessarily represent the views of Fidelity or any other person in the Fidelity organization. Any such views are subject to change at any time based upon market or other conditions and Fidelity disclaims any responsibility to update such views. These views may not be relied on as investment advice and, because investment decisions for a Fidelity fund are based on numerous factors, may not be relied on as an indication of trading intent on behalf of any Fidelity fund.
Annual Report
Shareholder Expense Example
As a shareholder of the Fund, you incur two types of costs: (1) transaction costs, including sales charges (loads) on purchase payments or redemption proceeds, redemption fees and (2) ongoing costs, including management fees, distribution and/or service (12b-1) fees and other Fund expenses. This Example is intended to help you understand your ongoing costs (in dollars) of investing in the Fund and to compare these costs with the ongoing costs of investing in other mutual funds.
The Example is based on an investment of $1,000 invested at the beginning of the period and held for the entire period (February 1, 2015 to July 31, 2015).
Actual Expenses
The first line of the accompanying table for each class of the Fund provides information about actual account values and actual expenses. You may use the information in this line, together with the amount you invested, to estimate the expenses that you paid over the period. Simply divide your account value by $1,000.00 (for example, an $8,600 account value divided by $1,000.00 = 8.6), then multiply the result by the number in the first line for a class of the Fund under the heading entitled "Expenses Paid During Period" to estimate the expenses you paid on your account during this period. A small balance maintenance fee of $12.00 that is charged once a year may apply for certain accounts with a value of less than $2,000. This fee is not included in the table below. If it was, the estimate of expenses you paid during the period would be higher, and your ending account value lower, by this amount. In addition, the Fund, as a shareholder in the underlying Fidelity Central Funds, will indirectly bear its pro-rata share of the fees and expenses incurred by the underlying Fidelity Central Funds. These fees and expenses are not included in the Fund's annualized expense ratio used to calculate the expense estimate in the table below.
Hypothetical Example for Comparison Purposes
The second line of the accompanying table for each class of the Fund provides information about hypothetical account values and hypothetical expenses based on a Class' actual expense ratio and an assumed rate of return of 5% per year before expenses, which is not the Class' actual return. The hypothetical account values and expenses may not be used to estimate the actual ending account balance or expenses you paid for the period. You may use this information to compare the ongoing costs of investing in the Fund and other funds. To do so, compare this 5% hypothetical example with the 5% hypothetical examples that appear in the shareholder reports of the other funds. A small balance maintenance fee of $12.00 that is charged once a year may apply for certain accounts with a value of less than $2,000. This fee is not included in the table below. If it was, the estimate of expenses you paid during the period would be higher, and your ending account value lower, by this amount. In addition, the Fund, as a shareholder in the underlying Fidelity Central Funds, will indirectly bear its pro-rata share of the fees and expenses incurred by the underlying Fidelity Central Funds. These fees and expenses are not included in the Fund's annualized expense ratio used to calculate the expense estimate in the table below.
Please note that the expenses shown in the table are meant to highlight your ongoing costs only and do not reflect any transaction costs. Therefore, the second line of the table is useful in comparing ongoing costs only, and will not help you determine the relative total costs of owning different funds. In addition, if these transactional costs were included, your costs would have been higher.
Annual Report
Shareholder Expense Example - continued
| Annualized
Expense RatioB | Beginning
Account Value
February 1, 2015 | Ending
Account Value
July 31, 2015 | Expenses Paid
During Period*
February 1, 2015 to July 31, 2015 |
Class A | 1.03% | | | |
Actual | | $ 1,000.00 | $ 992.80 | $ 5.09 |
HypotheticalA | | $ 1,000.00 | $ 1,019.69 | $ 5.16 |
Class T | 1.06% | | | |
Actual | | $ 1,000.00 | $ 991.80 | $ 5.23 |
HypotheticalA | | $ 1,000.00 | $ 1,019.54 | $ 5.31 |
Class C | 1.78% | | | |
Actual | | $ 1,000.00 | $ 988.50 | $ 8.78 |
HypotheticalA | | $ 1,000.00 | $ 1,015.97 | $ 8.90 |
Real Estate Income | .82% | | | |
Actual | | $ 1,000.00 | $ 993.60 | $ 4.05 |
HypotheticalA | | $ 1,000.00 | $ 1,020.73 | $ 4.11 |
Class I | .77% | | | |
Actual | | $ 1,000.00 | $ 993.80 | $ 3.81 |
HypotheticalA | | $ 1,000.00 | $ 1,020.98 | $ 3.86 |
A 5% return per year before expenses
B Annualized expense ratio reflects expenses net of applicable fee waivers.
* Expenses are equal to each Class' annualized expense ratio, multiplied by the average account value over the period, multiplied by 181/365 (to reflect the one-half year period).
Annual Report
Investment Changes (Unaudited)
Top Five Stocks as of July 31, 2015 |
| % of fund's
net assets | % of fund's net assets
6 months ago |
Equity Lifestyle Properties, Inc. | 3.5 | 3.0 |
MFA Financial, Inc. | 3.0 | 2.9 |
Acadia Realty Trust (SBI) | 2.8 | 2.9 |
Ventas, Inc. | 1.5 | 1.4 |
Mid-America Apartment Communities, Inc. | 1.1 | 1.0 |
| 11.9 | |
Top 5 Bonds as of July 31, 2015 |
| % of fund's
net assets | % of fund's net assets
6 months ago |
Realogy Group LLC Tranche B, term loan 3.75% 3/5/20 | 1.0 | 0.9 |
RAIT Financial Trust 4% 10/1/33 | 0.8 | 0.6 |
Standard Pacific Corp. 8.375% 5/15/18 | 0.7 | 0.7 |
IAS Operating Partnership LP 5% 3/15/18 | 0.7 | 0.7 |
iStar Financial, Inc. 5.875% 3/15/16 | 0.6 | 0.6 |
| 3.8 | |
Top Five REIT Sectors as of July 31, 2015 |
| % of fund's
net assets | % of fund's net assets
6 months ago |
REITs - Mortgage | 17.9 | 17.2 |
REITs - Health Care | 7.4 | 7.0 |
REITs - Shopping Centers | 5.6 | 7.2 |
REITs - Management/Investment | 5.2 | 5.6 |
REITs - Apartments | 5.0 | 4.8 |
Asset Allocation (% of fund's net assets) |
As of July 31, 2015* | As of January 31, 2015** |
 | Common Stocks 30.0% | |  | Common Stocks 30.8% | |
 | Preferred Stocks 19.5% | |  | Preferred Stocks 17.6% | |
 | Bonds 31.8% | |  | Bonds 30.7% | |
 | Convertible
Securities 5.2% | |  | Convertible
Securities 5.5% | |
 | Other Investments 7.3% | |  | Other Investments 7.9% | |
 | Short-Term
Investments and
Net Other Assets (Liabilities) 6.2% | |  | Short-Term
Investments and
Net Other Assets (Liabilities) 7.5% | |
* Foreign investments | 0.9% | | ** Foreign investments | 1.3% | |

Annual Report
Investments July 31, 2015
Showing Percentage of Net Assets
Common Stocks - 30.0% |
| Shares | | Value |
CONSUMER DISCRETIONARY - 0.2% |
Household Durables - 0.2% |
Stanley Martin Communities LLC Class B (a)(k) | 4,620 | | $ 7,054,370 |
FINANCIALS - 29.8% |
Capital Markets - 0.5% |
Ellington Financial LLC | 1,114,700 | | 20,354,422 |
Real Estate Investment Trusts - 28.6% |
Acadia Realty Trust (SBI) (g) | 3,730,449 | | 119,299,759 |
AG Mortgage Investment Trust, Inc. | 781,700 | | 14,226,940 |
American Campus Communities, Inc. | 226,000 | | 8,434,320 |
American Tower Corp. | 177,100 | | 16,843,981 |
Annaly Capital Management, Inc. | 1,606,900 | | 15,988,655 |
Anworth Mortgage Asset Corp. | 1,230,410 | | 6,152,050 |
Apartment Investment & Management Co. Class A | 1,049,300 | | 41,006,644 |
Arbor Realty Trust, Inc. (g) | 3,068,975 | | 20,991,789 |
AvalonBay Communities, Inc. | 141,400 | | 24,368,876 |
Boardwalk (REIT) | 136,200 | | 5,994,320 |
CBL & Associates Properties, Inc. | 2,105,673 | | 34,406,697 |
Cedar Shopping Centers, Inc. | 830,510 | | 5,564,417 |
Chambers Street Properties | 528,593 | | 3,922,160 |
Community Healthcare Trust, Inc. | 225,600 | | 4,257,072 |
CYS Investments, Inc. | 1,992,739 | | 15,463,655 |
Douglas Emmett, Inc. | 517,200 | | 15,159,132 |
Dynex Capital, Inc. | 2,039,943 | | 15,034,380 |
EastGroup Properties, Inc. | 111,900 | | 6,736,380 |
Ellington Residential Mortgage REIT | 260,000 | | 3,634,800 |
Equity Lifestyle Properties, Inc. | 2,627,460 | | 152,077,369 |
Equity Residential (SBI) | 77,400 | | 5,790,294 |
Extra Space Storage, Inc. | 355,700 | | 26,151,064 |
First Potomac Realty Trust | 1,381,615 | | 15,681,330 |
Five Oaks Investment Corp. | 479,100 | | 3,631,578 |
Great Ajax Corp. | 500,000 | | 7,020,000 |
Hatteras Financial Corp. | 812,600 | | 13,212,876 |
Lexington Corporate Properties Trust | 4,340,682 | | 37,329,865 |
LTC Properties, Inc. | 253,513 | | 11,121,615 |
MFA Financial, Inc. | 17,223,722 | | 129,694,627 |
Mid-America Apartment Communities, Inc. | 618,300 | | 49,674,222 |
Monmouth Real Estate Investment Corp. Class A (f) | 813,473 | | 8,150,999 |
National Retail Properties, Inc. | 244,200 | | 9,076,914 |
New Senior Investment Group, Inc. | 1,726,825 | | 22,345,116 |
Newcastle Investment Corp. | 1,840,830 | | 9,038,475 |
NorthStar Realty Finance Corp. | 166,600 | | 2,665,600 |
Common Stocks - continued |
| Shares | | Value |
FINANCIALS - continued |
Real Estate Investment Trusts - continued |
Potlatch Corp. | 509,300 | | $ 17,830,593 |
Prologis, Inc. | 108,487 | | 4,405,657 |
Sabra Health Care REIT, Inc. | 900,600 | | 24,631,410 |
Select Income REIT | 361,791 | | 7,261,145 |
Senior Housing Properties Trust (SBI) | 2,597,400 | | 44,857,098 |
Simon Property Group, Inc. | 126,100 | | 23,608,442 |
Store Capital Corp. | 556,800 | | 11,692,800 |
Terreno Realty Corp. | 1,728,064 | | 36,237,502 |
The Macerich Co. | 147,900 | | 11,707,764 |
Two Harbors Investment Corp. | 2,190,580 | | 22,387,728 |
Ventas, Inc. | 940,846 | | 63,121,358 |
VEREIT, Inc. | 885,434 | | 7,756,402 |
Weyerhaeuser Co. | 704,500 | | 21,621,105 |
WP Carey, Inc. | 773,700 | | 47,342,703 |
WP Glimcher, Inc. | 797,563 | | 10,799,003 |
| | 1,235,408,681 |
Real Estate Management & Development - 0.7% |
Brookfield Asset Management, Inc. Class A | 386,400 | | 13,490,097 |
Kennedy-Wilson Holdings, Inc. | 646,921 | | 16,380,040 |
| | 29,870,137 |
TOTAL FINANCIALS | | 1,285,633,240 |
TOTAL COMMON STOCKS (Cost $1,198,611,239) |
1,292,687,610
|
Preferred Stocks - 20.2% |
| | | |
Convertible Preferred Stocks - 0.7% |
FINANCIALS - 0.7% |
Real Estate Investment Trusts - 0.7% |
Alexandria Real Estate Equities, Inc. Series D 7.00% | 195,000 | | 5,478,291 |
Equity Commonwealth 6.50% (a) | 31,237 | | 776,864 |
Lexington Corporate Properties Trust Series C, 6.50% | 468,742 | | 22,543,584 |
| | 28,798,739 |
Preferred Stocks - continued |
| Shares | | Value |
Nonconvertible Preferred Stocks - 19.5% |
CONSUMER DISCRETIONARY - 0.0% |
Hotels, Restaurants & Leisure - 0.0% |
Red Lion Hotels Capital Trust 9.50% | 71,773 | | $ 1,858,203 |
FINANCIALS - 19.5% |
Capital Markets - 0.1% |
Arlington Asset Investment Corp. 6.625% | 182,517 | | 4,471,667 |
Real Estate Investment Trusts - 19.2% |
AG Mortgage Investment Trust, Inc.: | | | |
8.00% | 587,287 | | 14,453,133 |
8.25% | 34,859 | | 871,475 |
Alexandria Real Estate Equities, Inc. Series E, 6.45% | 145,913 | | 3,790,820 |
American Capital Agency Corp.: | | | |
8.00% | 200,000 | | 4,984,000 |
Series B, 7.75% | 360,200 | | 8,615,984 |
American Capital Mortgage Investment Corp. Series A, 8.125% | 248,636 | | 6,034,396 |
American Home Mortgage Investment Corp.: | | | |
Series A, 9.75% (a) | 120,300 | | 1 |
Series B, 9.25% (a) | 124,100 | | 1 |
American Homes 4 Rent: | | | |
Series A, 5.00% | 550,742 | | 13,950,295 |
Series B, 5.00% | 250,029 | | 6,375,740 |
Series C, 5.50% | 810,662 | | 20,866,440 |
Annaly Capital Management, Inc.: | | | |
Series A, 7.875% | 134,900 | | 3,399,480 |
Series C, 7.625% | 325,332 | | 7,960,874 |
Series D, 7.50% | 621,976 | | 15,288,170 |
Anworth Mortgage Asset Corp. Series A, 8.625% | 309,630 | | 7,945,106 |
Apollo Commercial Real Estate Finance, Inc. Series A, 8.625% | 375,101 | | 9,812,642 |
Apollo Residential Mortgage, Inc. Series A, 8.00% | 284,843 | | 6,821,990 |
Arbor Realty Trust, Inc.: | | | |
7.375% (g) | 430,605 | | 10,597,189 |
Series A, 8.25% (g) | 189,089 | | 4,814,206 |
Series B, 7.75% (g) | 240,000 | | 5,940,000 |
Series C, 8.50% (g) | 100,000 | | 2,578,000 |
Armour Residential REIT, Inc. Series B, 7.875% | 153,654 | | 3,475,653 |
Ashford Hospitality Trust, Inc.: | | | |
Series D, 8.45% | 47,000 | | 1,214,010 |
Series E, 9.00% | 140,751 | | 3,701,751 |
Boston Properties, Inc. 5.25% | 10,915 | | 272,220 |
Brandywine Realty Trust Series E, 6.90% | 95,000 | | 2,470,000 |
Preferred Stocks - continued |
| Shares | | Value |
Nonconvertible Preferred Stocks - continued |
FINANCIALS - continued |
Real Estate Investment Trusts - continued |
Campus Crest Communities, Inc. Series A, 8.00% | 582,117 | | $ 14,017,377 |
Capstead Mortgage Corp. Series E, 7.50% | 202,984 | | 5,025,884 |
CBL & Associates Properties, Inc.: | | | |
Series D, 7.375% | 289,876 | | 7,359,952 |
Series E, 6.625% | 222,063 | | 5,649,283 |
Cedar Shopping Centers, Inc. Series B, 7.25% | 399,750 | | 10,209,615 |
Chesapeake Lodging Trust Series A, 7.75% | 266,916 | | 7,086,620 |
Colony Financial, Inc.: | | | |
7.125% | 375,500 | | 8,858,045 |
Series A, 8.50% | 283,920 | | 7,447,222 |
Series B, 7.50% | 108,867 | | 2,739,094 |
Coresite Realty Corp. Series A, 7.25% | 369,799 | | 9,622,170 |
Corporate Office Properties Trust Series L, 7.375% | 167,140 | | 4,374,054 |
CubeSmart Series A, 7.75% | 40,000 | | 1,063,600 |
CYS Investments, Inc.: | | | |
Series A, 7.75% | 117,824 | | 2,762,973 |
Series B, 7.50% | 496,667 | | 11,120,374 |
DDR Corp.: | | | |
Series J, 6.50% | 340,721 | | 8,804,231 |
Series K, 6.25% | 228,888 | | 5,813,755 |
Digital Realty Trust, Inc.: | | | |
Series E, 7.00% | 219,819 | | 5,693,312 |
Series G, 5.875% | 145,444 | | 3,527,017 |
Series H, 7.375% | 50,000 | | 1,356,500 |
DuPont Fabros Technology, Inc. Series B, 7.625% | 381,202 | | 9,720,651 |
Dynex Capital, Inc.: | | | |
Series A, 8.50% | 362,932 | | 9,029,748 |
Series B, 7.625% | 252,120 | | 5,950,032 |
Equity Commonwealth Series E, 7.25% | 648,952 | | 16,639,129 |
Equity Lifestyle Properties, Inc. Series C, 6.75% | 950,148 | | 24,722,851 |
Essex Property Trust, Inc. Series H, 7.125% | 40,000 | | 1,036,000 |
First Potomac Realty Trust 7.75% | 415,296 | | 10,656,495 |
Five Oaks Investment Corp. Series A, 8.75% | 142,000 | | 3,088,500 |
General Growth Properties, Inc. Series A, 6.375% | 166,463 | | 4,264,782 |
Gladstone Commercial Corp. Series C, 7.125% | 232,238 | | 5,910,457 |
Hatteras Financial Corp. Series A, 7.625% | 522,361 | | 12,144,893 |
Health Care REIT, Inc. Series J, 6.50% | 81,600 | | 2,098,752 |
Hersha Hospitality Trust: | | | |
Series B, 8.00% | 162,538 | | 4,170,725 |
Preferred Stocks - continued |
| Shares | | Value |
Nonconvertible Preferred Stocks - continued |
FINANCIALS - continued |
Real Estate Investment Trusts - continued |
Hersha Hospitality Trust: - continued | | | |
Series C, 6.875% | 50,000 | | $ 1,287,500 |
Hospitality Properties Trust Series D, 7.125% | 40,800 | | 1,068,960 |
Hudson Pacific Properties, Inc. 8.375% | 394,069 | | 10,103,929 |
Inland Real Estate Corp.: | | | |
Series A, 8.125% | 466,000 | | 12,102,020 |
Series B, 6.95% | 245,000 | | 6,078,450 |
Invesco Mortgage Capital, Inc.: | | | |
Series A, 7.75% | 123,342 | | 3,045,314 |
Series B, 7.75% | 736,003 | | 17,597,832 |
Investors Real Estate Trust Series B, 7.95% | 126,572 | | 3,270,620 |
iStar Financial, Inc.: | | | |
Series D, 8.00% | 59,478 | | 1,479,218 |
Series E, 7.875% | 224,596 | | 5,507,094 |
Series F, 7.80% | 438,490 | | 10,778,084 |
Series G, 7.65% | 2,950 | | 71,892 |
Kilroy Realty Corp.: | | | |
Series G, 6.875% | 46,760 | | 1,207,811 |
Series H, 6.375% | 143,296 | | 3,668,378 |
Kite Realty Group Trust 8.25% | 96,100 | | 2,473,614 |
LaSalle Hotel Properties: | | | |
Series H, 7.50% | 141,308 | | 3,611,832 |
Series I, 6.375% | 354,698 | | 8,870,997 |
LBA Realty Fund II Series B, 7.625% | 31,240 | | 685,718 |
MFA Financial, Inc.: | | | |
8.00% | 538,930 | | 13,764,272 |
Series B, 7.50% | 616,232 | | 15,418,125 |
Monmouth Real Estate Investment Corp.: | | | |
Series A, 7.625% | 80,000 | | 2,064,000 |
Series B, 7.875% | 95,000 | | 2,541,250 |
National Retail Properties, Inc.: | | | |
5.70% | 376,404 | | 9,274,595 |
Series D, 6.625% | 222,138 | | 5,813,351 |
New York Mortgage Trust, Inc.: | | | |
7.875% | 154,125 | | 3,302,899 |
Series B, 7.75% | 239,697 | | 5,429,137 |
NorthStar Realty Finance Corp.: | | | |
Series A 8.75% | 7,326 | | 187,326 |
Series B, 8.25% | 369,228 | | 9,286,084 |
Preferred Stocks - continued |
| Shares | | Value |
Nonconvertible Preferred Stocks - continued |
FINANCIALS - continued |
Real Estate Investment Trusts - continued |
NorthStar Realty Finance Corp.: - continued | | | |
Series C, 8.875% | 277,101 | | $ 7,199,084 |
Series D, 8.50% | 238,715 | | 6,137,363 |
Series E, 8.75% | 366,972 | | 9,511,914 |
Pebblebrook Hotel Trust: | | | |
Series A, 7.875% | 412,000 | | 10,670,800 |
Series B, 8.00% | 185,085 | | 4,836,271 |
Series C, 6.50% | 204,321 | | 5,179,537 |
Pennsylvania (REIT) 7.375% | 100,510 | | 2,657,484 |
Prologis, Inc. Series Q, 8.54% | 94,446 | | 5,805,482 |
PS Business Parks, Inc.: | | | |
Series R, 6.875% | 116,903 | | 2,964,660 |
Series S, 6.45% | 93,809 | | 2,455,920 |
Series T, 6.00% | 198,899 | | 5,071,925 |
Series U, 5.75% | 600 | | 14,424 |
Public Storage: | | | |
5.875% | 50,000 | | 1,257,000 |
6.375% | 122,000 | | 3,218,360 |
RAIT Financial Trust: | | | |
7.125% | 336,786 | | 8,278,200 |
7.625% | 224,590 | | 5,102,685 |
Regency Centers Corp.: | | | |
Series 6, 6.625% | 152,661 | | 3,961,553 |
Series 7, 6.00% | 176,250 | | 4,348,088 |
Resource Capital Corp. 8.625% | 156,870 | | 3,308,388 |
Retail Properties America, Inc. 7.00% | 394,411 | | 10,333,568 |
Sabra Health Care REIT, Inc. Series A, 7.125% | 298,123 | | 7,742,254 |
Saul Centers, Inc. Series C, 6.875% | 315,478 | | 8,170,880 |
Senior Housing Properties Trust 5.625% | 283,543 | | 6,719,969 |
Stag Industrial, Inc.: | | | |
Series A, 9.00% | 280,000 | | 7,582,400 |
Series B, 6.625% | 80,300 | | 2,032,393 |
Summit Hotel Properties, Inc.: | | | |
Series A, 9.25% | 138,340 | | 3,757,314 |
Series B, 7.875% | 190,173 | | 5,167,000 |
Series C, 7.125% | 153,212 | | 3,998,833 |
Sun Communities, Inc. Series A, 7.125% | 375,000 | | 9,656,250 |
Sunstone Hotel Investors, Inc. Series D, 8.00% | 129,723 | | 3,348,151 |
Taubman Centers, Inc. Series K, 6.25% | 157,322 | | 3,981,820 |
Preferred Stocks - continued |
| Shares | | Value |
Nonconvertible Preferred Stocks - continued |
FINANCIALS - continued |
Real Estate Investment Trusts - continued |
Terreno Realty Corp. Series A, 7.75% | 213,690 | | $ 5,630,732 |
UMH Properties, Inc. Series A, 8.25% | 600,000 | | 15,594,000 |
Urstadt Biddle Properties, Inc.: | | | |
6.75% | 160,000 | | 4,240,000 |
Series F, 7.125% | 210,000 | | 5,441,100 |
VEREIT, Inc. Series F, 6.70% | 1,980,249 | | 48,615,113 |
Wells Fargo Real Estate Investment Corp. 6.375% | 221,000 | | 5,794,620 |
Winthrop Realty Trust 7.75% | 360,000 | | 9,162,000 |
WP Glimcher, Inc.: | | | |
6.875% | 256,115 | | 6,594,961 |
7.50% | 198,527 | | 5,280,818 |
| | 829,011,285 |
Real Estate Management & Development - 0.2% |
Kennedy-Wilson, Inc. 7.75% | 321,574 | | 8,325,551 |
TOTAL FINANCIALS | | 841,808,503 |
TOTAL NONCONVERTIBLE PREFERRED STOCKS | | 843,666,706 |
TOTAL PREFERRED STOCKS (Cost $851,096,847) |
872,465,445
|
Corporate Bonds - 20.0% |
| Principal Amount (e) | | |
Convertible Bonds - 4.5% |
FINANCIALS - 4.5% |
Consumer Finance - 0.1% |
Zais Financial Partners LP 8% 11/15/16 (h) | | $ 2,000,000 | | 1,998,750 |
Diversified Financial Services - 0.4% |
RWT Holdings, Inc. 5.625% 11/15/19 (h) | | 17,620,000 | | 16,879,079 |
Real Estate Investment Trusts - 3.3% |
Apollo Commercial Real Estate Finance, Inc. 5.5% 3/15/19 | | 5,600,000 | | 5,610,500 |
Ares Commercial Real Estate Corp. 7% 12/15/15 | | 14,700,000 | | 15,049,125 |
Blackstone Mortgage Trust, Inc. 5.25% 12/1/18 | | 5,750,000 | | 6,166,875 |
Campus Crest Communities Operating Partnership LP 4.75% 10/15/18 (h) | | 12,900,000 | | 12,359,813 |
Corporate Bonds - continued |
| Principal Amount (e) | | Value |
Convertible Bonds - continued |
FINANCIALS - continued |
Real Estate Investment Trusts - continued |
Colony Financial, Inc.: | | | | |
3.875% 1/15/21 | | $ 9,910,000 | | $ 9,996,713 |
5% 4/15/23 | | 9,000,000 | | 9,376,875 |
PennyMac Corp. 5.375% 5/1/20 | | 12,690,000 | | 11,738,250 |
RAIT Financial Trust 4% 10/1/33 | | 39,190,000 | | 32,748,144 |
Redwood Trust, Inc. 4.625% 4/15/18 | | 14,700,000 | | 14,194,688 |
Resource Capital Corp.: | | | | |
6% 12/1/18 | | 3,490,000 | | 3,127,913 |
8% 1/15/20 | | 15,990,000 | | 14,903,751 |
Spirit Realty Capital, Inc. 3.75% 5/15/21 | | 2,400,000 | | 2,247,000 |
Starwood Property Trust, Inc. 3.75% 10/15/17 | | 3,230,000 | | 3,252,206 |
Starwood Waypoint Residential 4.5% 10/15/17 (h) | | 1,965,000 | | 1,965,000 |
| | 142,736,853 |
Thrifts & Mortgage Finance - 0.7% |
IAS Operating Partnership LP 5% 3/15/18 (h) | | 33,140,000 | | 31,814,400 |
TOTAL FINANCIALS | | 193,429,082 |
Nonconvertible Bonds - 15.5% |
CONSUMER DISCRETIONARY - 5.1% |
Hotels, Restaurants & Leisure - 0.4% |
FelCor Lodging LP: | | | | |
5.625% 3/1/23 | | 2,000,000 | | 2,052,400 |
6% 6/1/25 (h) | | 2,025,000 | | 2,085,750 |
Hilton Worldwide Finance LLC/Hilton Worldwide Finance Corp. 5.625% 10/15/21 | | 4,000,000 | | 4,165,000 |
Times Square Hotel Trust 8.528% 8/1/26 (h) | | 7,916,982 | | 10,093,350 |
| | 18,396,500 |
Household Durables - 4.7% |
Ashton Woods U.S.A. LLC/Ashton Woods Finance Co. 6.875% 2/15/21 (h) | | 12,145,000 | | 11,416,300 |
Brookfield Residential Properties, Inc./Brookfield Residential U.S. Corp. 6.125% 7/1/22 (h) | | 2,620,000 | | 2,554,500 |
Brookfield Residential Properties, Inc.: | | | | |
6.375% 5/15/25 (h) | | 2,000,000 | | 1,945,000 |
6.5% 12/15/20 (h) | | 1,615,000 | | 1,631,150 |
D.R. Horton, Inc.: | | | | |
4.375% 9/15/22 | | 4,175,000 | | 4,133,250 |
Corporate Bonds - continued |
| Principal Amount (e) | | Value |
Nonconvertible Bonds - continued |
CONSUMER DISCRETIONARY - continued |
Household Durables - continued |
D.R. Horton, Inc.: - continued | | | | |
4.75% 5/15/17 | | $ 2,000,000 | | $ 2,090,720 |
5.75% 8/15/23 | | 2,510,000 | | 2,673,150 |
KB Home: | | | | |
8% 3/15/20 | | 8,465,000 | | 9,353,825 |
9.1% 9/15/17 | | 4,985,000 | | 5,558,275 |
Lennar Corp.: | | | | |
4.125% 12/1/18 | | 5,520,000 | | 5,602,800 |
4.5% 6/15/19 | | 1,830,000 | | 1,889,475 |
4.5% 11/15/19 | | 2,000,000 | | 2,067,500 |
6.5% 4/15/16 | | 4,000,000 | | 4,110,000 |
6.95% 6/1/18 | | 14,280,000 | | 15,636,600 |
M/I Homes, Inc. 8.625% 11/15/18 | | 26,055,000 | | 26,836,650 |
Meritage Homes Corp.: | | | | |
6% 6/1/25 (h) | | 4,000,000 | | 4,040,000 |
7% 4/1/22 | | 7,525,000 | | 8,014,125 |
7.15% 4/15/20 | | 7,060,000 | | 7,607,150 |
Ryland Group, Inc.: | | | | |
6.625% 5/1/20 | | 1,555,000 | | 1,730,871 |
8.4% 5/15/17 | | 5,420,000 | | 5,962,000 |
Standard Pacific Corp.: | | | | |
5.875% 11/15/24 | | 3,250,000 | | 3,339,375 |
7% 8/15/15 | | 4,000,000 | | 4,008,000 |
8.375% 5/15/18 | | 27,853,000 | | 31,822,053 |
10.75% 9/15/16 | | 4,910,000 | | 5,364,175 |
Taylor Morrison Communities, Inc./Monarch Communities, Inc. 5.875% 4/15/23 (h) | | 4,100,000 | | 4,105,125 |
TRI Pointe Homes, Inc. 5.875% 6/15/24 | | 3,890,000 | | 3,831,650 |
WCI Communities, Inc. 6.875% 8/15/21 | | 1,845,000 | | 1,914,188 |
William Lyon Homes, Inc.: | | | | |
7% 8/15/22 | | 4,180,000 | | 4,357,650 |
8.5% 11/15/20 | | 15,550,000 | | 16,755,125 |
| | 200,350,682 |
Media - 0.0% |
Outfront Media Capital LLC / Corp. 5.625% 2/15/24 (h) | | 1,300,000 | | 1,326,000 |
TOTAL CONSUMER DISCRETIONARY | | 220,073,182 |
Corporate Bonds - continued |
| Principal Amount (e) | | Value |
Nonconvertible Bonds - continued |
CONSUMER STAPLES - 0.0% |
Food & Staples Retailing - 0.0% |
Ahold Lease Series 2001 A1 pass thru trust certificates 7.82% 1/2/20 | | $ 602,053 | | $ 659,249 |
FINANCIALS - 9.8% |
Diversified Financial Services - 0.2% |
Icahn Enterprises LP/Icahn Enterprises Finance Corp.: | | | | |
5.875% 2/1/22 | | 3,680,000 | | 3,808,800 |
6% 8/1/20 | | 6,000,000 | | 6,315,000 |
| | 10,123,800 |
Real Estate Investment Trusts - 6.5% |
American Campus Communities Operating Partnership LP 4.125% 7/1/24 | | 2,000,000 | | 2,012,724 |
ARC Properties Operating Partnership LP 4.6% 2/6/24 | | 8,640,000 | | 8,337,600 |
CBL & Associates LP 5.25% 12/1/23 | | 1,000,000 | | 1,037,445 |
Commercial Net Lease Realty, Inc. 6.15% 12/15/15 | | 2,526,000 | | 2,572,147 |
Corporate Office Properties LP 3.6% 5/15/23 | | 5,000,000 | | 4,627,530 |
Crown Castle International Corp. 5.25% 1/15/23 | | 4,000,000 | | 4,190,000 |
CTR Partnership LP/CareTrust Capital Corp. 5.875% 6/1/21 | | 4,955,000 | | 5,054,100 |
CubeSmart LP 4.8% 7/15/22 | | 2,000,000 | | 2,165,492 |
DDR Corp.: | | | | |
7.5% 7/15/18 | | 8,756,000 | | 10,062,404 |
7.875% 9/1/20 | | 4,637,000 | | 5,653,741 |
9.625% 3/15/16 | | 3,836,000 | | 4,026,833 |
DuPont Fabros Technology LP 5.875% 9/15/21 | | 1,000,000 | | 1,027,500 |
Equity One, Inc. 6.25% 1/15/17 | | 3,000,000 | | 3,186,708 |
Equity Residential 5.125% 3/15/16 | | 7,201,000 | | 7,372,161 |
HCP, Inc.: | | | | |
3.75% 2/1/16 | | 10,000,000 | | 10,136,310 |
4% 6/1/25 | | 1,000,000 | | 980,250 |
Health Care Property Investors, Inc.: | | | | |
5.625% 5/1/17 | | 2,980,000 | | 3,170,896 |
6% 1/30/17 | | 2,383,000 | | 2,530,122 |
Health Care REIT, Inc.: | | | | |
3.625% 3/15/16 | | 14,685,000 | | 14,900,635 |
4% 6/1/25 | | 1,551,000 | | 1,540,611 |
4.125% 4/1/19 | | 2,000,000 | | 2,114,992 |
6.2% 6/1/16 | | 2,750,000 | | 2,858,477 |
Corporate Bonds - continued |
| Principal Amount (e) | | Value |
Nonconvertible Bonds - continued |
FINANCIALS - continued |
Real Estate Investment Trusts - continued |
Healthcare Realty Trust, Inc.: | | | | |
3.75% 4/15/23 | | $ 4,022,000 | | $ 3,906,625 |
5.75% 1/15/21 | | 3,095,000 | | 3,446,329 |
Highwoods/Forsyth LP: | | | | |
3.625% 1/15/23 | | 1,607,000 | | 1,600,514 |
5.85% 3/15/17 | | 2,800,000 | | 2,980,155 |
Hospitality Properties Trust: | | | | |
5% 8/15/22 | | 3,177,000 | | 3,313,897 |
5.625% 3/15/17 | | 915,000 | | 963,389 |
HRPT Properties Trust: | | | | |
6.25% 8/15/16 | | 9,675,000 | | 9,888,876 |
6.25% 6/15/17 | | 1,055,000 | | 1,109,470 |
6.65% 1/15/18 | | 4,246,000 | | 4,580,037 |
iStar Financial, Inc.: | | | | |
3.875% 7/1/16 | | 2,855,000 | | 2,862,138 |
4% 11/1/17 | | 15,000,000 | | 14,737,500 |
5% 7/1/19 | | 15,000,000 | | 14,719,650 |
5.85% 3/15/17 | | 3,587,000 | | 3,677,321 |
5.875% 3/15/16 | | 27,070,000 | | 27,543,725 |
7.125% 2/15/18 | | 5,725,000 | | 5,975,469 |
9% 6/1/17 | | 9,175,000 | | 9,920,469 |
MPT Operating Partnership LP/MPT Finance Corp.: | | | | |
6.375% 2/15/22 | | 3,610,000 | | 3,840,138 |
6.875% 5/1/21 | | 2,000,000 | | 2,100,000 |
National Retail Properties, Inc. 3.3% 4/15/23 | | 2,000,000 | | 1,948,454 |
Omega Healthcare Investors, Inc.: | | | | |
4.5% 4/1/27 (h) | | 2,462,000 | | 2,374,688 |
4.95% 4/1/24 | | 2,898,000 | | 2,988,968 |
Potlatch Corp. 7.5% 11/1/19 | | 1,000,000 | | 1,125,000 |
Prologis LP 7.625% 7/1/17 | | 4,690,000 | | 5,169,576 |
Reckson Operating Partnership LP/SL Green Realty Corp./SL Green Operating Partnership LP 7.75% 3/15/20 | | 2,000,000 | | 2,377,044 |
Select Income REIT 4.5% 2/1/25 | | 5,000,000 | | 4,882,155 |
Senior Housing Properties Trust: | | | | |
3.25% 5/1/19 | | 2,882,000 | | 2,897,888 |
4.3% 1/15/16 | | 5,000,000 | | 5,029,320 |
4.75% 5/1/24 | | 3,988,000 | | 3,943,582 |
6.75% 4/15/20 | | 13,624,000 | | 15,231,073 |
Corporate Bonds - continued |
| Principal Amount (e) | | Value |
Nonconvertible Bonds - continued |
FINANCIALS - continued |
Real Estate Investment Trusts - continued |
Senior Housing Properties Trust: - continued | | | | |
6.75% 12/15/21 | | $ 8,000,000 | | $ 9,125,216 |
United Dominion Realty Trust, Inc. 5.25% 1/15/16 | | 4,000,000 | | 4,065,028 |
WP Carey, Inc. 4% 2/1/25 | | 5,000,000 | | 4,843,460 |
| | 282,725,832 |
Real Estate Management & Development - 2.7% |
BioMed Realty LP 3.85% 4/15/16 | | 2,000,000 | | 2,033,458 |
CBRE Group, Inc.: | | | | |
5% 3/15/23 | | 6,020,000 | | 6,174,112 |
5.25% 3/15/25 | | 3,295,000 | | 3,426,800 |
Excel Trust LP 4.625% 5/15/24 | | 2,403,000 | | 2,304,431 |
Forestar U.S.A. Real Estate Group 8.5% 6/1/22 (h) | | 16,365,000 | | 17,143,974 |
Host Hotels & Resorts LP 5.25% 3/15/22 | | 2,000,000 | | 2,170,754 |
Howard Hughes Corp. 6.875% 10/1/21 (h) | | 11,715,000 | | 12,417,900 |
Hunt Companies, Inc. 9.625% 3/1/21 (h) | | 5,790,000 | | 5,717,625 |
Kennedy-Wilson, Inc. 5.875% 4/1/24 | | 7,640,000 | | 7,573,150 |
Mid-America Apartments LP: | | | | |
3.75% 6/15/24 | | 1,663,000 | | 1,660,798 |
6.05% 9/1/16 | | 2,500,000 | | 2,616,610 |
Realogy Group LLC/Realogy Co.-Issuer Corp.: | | | | |
4.5% 4/15/19 (h) | | 4,805,000 | | 4,841,038 |
5.25% 12/1/21 (h) | | 6,620,000 | | 6,785,500 |
Regency Centers LP: | | | | |
5.25% 8/1/15 | | 4,509,000 | | 4,509,000 |
5.875% 6/15/17 | | 400,000 | | 430,867 |
Taylor Morrison Communities, Inc./Monarch Communities, Inc.: | | | | |
5.25% 4/15/21 (h) | | 7,000,000 | | 6,982,500 |
5.625% 3/1/24 (h) | | 2,270,000 | | 2,207,575 |
Ventas Realty LP 1.55% 9/26/16 | | 7,000,000 | | 7,023,681 |
Ventas Realty LP/Ventas Capital Corp.: | | | | |
3.125% 11/30/15 | | 13,807,000 | | 13,900,653 |
4% 4/30/19 | | 2,262,000 | | 2,383,734 |
Wells Operating Partnership II LP 5.875% 4/1/18 | | 3,000,000 | | 3,258,156 |
| | 115,562,316 |
Thrifts & Mortgage Finance - 0.4% |
Cantor Commercial Real Estate Co. LP/CCRE Finance Corp. 7.75% 2/15/18 (h) | | 4,755,000 | | 4,986,806 |
Corporate Bonds - continued |
| Principal Amount (e) | | Value |
Nonconvertible Bonds - continued |
FINANCIALS - continued |
Thrifts & Mortgage Finance - continued |
Ocwen Financial Corp. 7.125% 5/15/19 (h)(i) | | $ 11,795,000 | | $ 11,146,275 |
Wrightwood Capital LLC 1.9% 4/20/20 (d) | | 14,028 | | 469,932 |
| | 16,603,013 |
TOTAL FINANCIALS | | 425,014,961 |
HEALTH CARE - 0.4% |
Health Care Providers & Services - 0.4% |
Sabra Health Care LP/Sabra Capital Corp.: | | | | |
5.375% 6/1/23 | | 2,795,000 | | 2,885,838 |
5.5% 2/1/21 | | 12,305,000 | | 12,766,438 |
| | 15,652,276 |
INDUSTRIALS - 0.1% |
Industrial Conglomerates - 0.1% |
Ladder Capital Finance Holdings LLLP/Ladder Capital Finance Corp. 7.375% 10/1/17 | | 3,050,000 | | 3,156,750 |
INFORMATION TECHNOLOGY - 0.1% |
Internet Software & Services - 0.1% |
CyrusOne LP/CyrusOne Finance Corp.: | | | | |
6.375% 11/15/22 (h) | | 1,000,000 | | 1,035,000 |
6.375% 11/15/22 | | 3,000,000 | | 3,105,000 |
| | 4,140,000 |
TOTAL NONCONVERTIBLE BONDS | | 668,696,418 |
TOTAL CORPORATE BONDS (Cost $840,267,812) |
862,125,500
|
Asset-Backed Securities - 1.9% |
|
American Homes 4 Rent: | | | | |
Series 2014-SFR2 Class E, 6.231% 10/17/36 (h) | | 3,000,000 | | 3,108,920 |
Series 2014-SFR3 Class E, 6.418% 12/17/36 (h) | | 9,025,000 | | 9,470,513 |
Series 2015-SFR1: | | | | |
Class E, 5.639% 4/17/52 (h) | | 1,999,310 | | 1,978,922 |
Class F, 6.482% 4/17/52 (h) | | 2,000,000 | | 1,906,026 |
Asset-Backed Securities - continued |
| Principal Amount (e) | | Value |
Capital Trust RE CDO Ltd. Series 2005-1A Class D, 1.688% 3/20/50 (h)(i) | | $ 2,250,000 | | $ 225 |
CapLease CDO Ltd. Series 2005-1A Class A, 4.926% 1/29/40 (h) | | 776,650 | | 802,047 |
Conseco Finance Securitizations Corp. Series 2002-2 Class M2, 9.163% 3/1/33 | | 500,000 | | 419,576 |
Crest Clarendon Street Ltd./Crest Clarendon Corp. Series 2002-1A Class D, 9% 12/28/35 (h) | | 389,442 | | 363,116 |
Deutsche Financial Capital Securitization LLC Series 1997-I Class M, 7.275% 9/15/27 | | 6,178,122 | | 6,045,836 |
Fairfield Street Solar Corp. Series 2004-1A Class E1, 3.6509% 11/28/39 (h)(i) | | 612,703 | | 349,241 |
Green Tree Financial Corp.: | | | | |
Series 1996-4 Class M1, 7.75% 6/15/27 | | 1,586,172 | | 1,566,859 |
Series 1997-3 Class M1, 7.53% 3/15/28 | | 6,781,936 | | 6,397,210 |
Invitation Homes Trust: | | | | |
Series 2013-SFR1 Class F, 3.9% 12/17/30 (h)(i) | | 1,750,000 | | 1,694,089 |
Series 2014-SFR1: | | | | |
Class E, 3.436% 6/17/31 (h)(i) | | 10,000,000 | | 9,810,623 |
Class F, 3.936% 6/17/31 (h)(i) | | 9,504,000 | | 9,193,617 |
Series 2014-SFR3: | | | | |
Class E, 4.686% 12/17/31 (h)(i) | | 4,336,000 | | 4,387,317 |
Class F, 5.186% 12/17/31 (h)(i) | | 2,215,000 | | 2,216,714 |
Series 2015-SFR2 Class E, 3.3353% 6/17/32 (h)(i) | | 2,450,000 | | 2,382,429 |
Series 2015-SFR3 Class F, 4.933% 8/17/32 (h)(i) | | 2,000,000 | | 1,992,967 |
Series 2015-SRF1 Class F, 4.4853% 3/17/32 (h)(i) | | 5,500,000 | | 5,392,112 |
Lehman ABS Manufactured Housing Contract Trust Series 2001-B Class M2, 7.17% 4/15/40 | | 960,803 | | 528,834 |
Merit Securities Corp. Series 13 Class M1, 7.8468% 12/28/33 (i) | | 1,923,000 | | 2,018,381 |
Progress Residential Trust Series 2015-SFR1 Class E, 4.1853% 2/17/32 (h)(i) | | 1,500,000 | | 1,499,999 |
Starwood Waypoint Residential Trust Series 2014-1 Class F, 4.7235% 1/17/32 (h)(i) | | 4,071,000 | | 4,025,884 |
Taberna Preferred Funding III Ltd. Series 2005-3A Class D, 2.9288% 2/5/36 (h)(i) | | 3,915,435 | | 392 |
Wrightwood Capital Real Estate CDO Ltd. Series 2005-1A: | | | | |
Class A1, 0.601% 11/21/40 (h)(i) | | 4,914,554 | | 4,803,976 |
Class F, 2.231% 11/21/40 (h)(i) | | 250,000 | | 175,675 |
TOTAL ASSET-BACKED SECURITIES (Cost $86,327,539) |
82,531,500
|
Collateralized Mortgage Obligations - 0.2% |
| Principal Amount (e) | | Value |
Private Sponsor - 0.2% |
Countrywide Home Loans, Inc.: | | | | |
Series 2002-R2 Class 2B3, 3.6335% 7/25/33 (h)(i) | | $ 165,763 | | $ 91,170 |
Series 2003-R3 Class B2, 5.5% 11/25/33 (h) | | 783,996 | | 50,501 |
FREMF Mortgage Trust: | | | | |
Series 2010-K6 Class B, 5.5325% 12/25/46 (h)(i) | | 4,500,000 | | 4,983,543 |
Series 2010-K7 Class B, 5.6242% 4/25/20 (h)(i) | | 3,200,000 | | 3,584,381 |
Merrill Lynch Mortgage Investors Trust Series 1998-C3 Class F, 6% 12/15/30 (h) | | 861,715 | | 883,892 |
RESI Finance LP/RESI Finance DE Corp. floater Series 2003-B Class B9, 12.1354% 6/10/35 (h)(i) | | 118,172 | | 126,565 |
Residential Funding Securities Corp. Series 2002-RM1 Class BI1, 5.5% 12/25/17 (h) | | 8,914 | | 8,655 |
RESIX Finance Ltd. floater: | | | | |
Series 2003-D Class B8, 6.6815% 12/10/35 (h)(i) | | 137,485 | | 35,398 |
Series 2004-A Class B7, 4.4315% 2/10/36 (h)(i) | | 139,576 | | 46,491 |
Series 2004-B Class B7, 4.1815% 2/10/36 (h)(i) | | 174,502 | | 117,680 |
TOTAL PRIVATE SPONSOR | | 9,928,276 |
U.S. Government Agency - 0.0% |
Fannie Mae REMIC Trust: | | | | |
Series 2001-W3 subordinate REMIC pass thru certificates, Class B3, 7% 9/25/41 (k) | | 94,028 | | 25,838 |
Series 2002-W1 subordinate REMIC pass thru certificates, Class 3B3, 3.0632% 2/25/42 (h)(i) | | 71,471 | | 55,390 |
Series 2003-W1 subordinate REMIC pass thru certificates, Class B3, 4.3375% 12/25/42 (i)(k) | | 143,242 | | 12,573 |
Series 2003-W10 subordinate REMIC pass thru certificates, Class 2B3, 3.0681% 6/25/43 (h)(i) | | 110,753 | | 60,914 |
Series 2003-W4 subordinate REMIC pass thru certificates, Class 2B3, 2.9643% 10/25/42 (h)(i) | | 46,599 | | 26,562 |
TOTAL U.S. GOVERNMENT AGENCY | | 181,277 |
TOTAL COLLATERALIZED MORTGAGE OBLIGATIONS (Cost $9,703,965) |
10,109,553
|
Commercial Mortgage Securities - 14.2% |
|
Americold LLC Trust Series 2010-ARTA Class D, 7.443% 1/14/29 (h) | | 2,000,000 | | 2,270,210 |
Banc of America Commercial Mortgage Trust: | | | | |
Series 2005-1 Class CJ, 5.515% 11/10/42 (i) | | 1,147,536 | | 1,146,303 |
Commercial Mortgage Securities - continued |
| Principal Amount (e) | | Value |
Banc of America Commercial Mortgage Trust: - continued | | | | |
Series 2005-5 Class D, 5.4703% 10/10/45 (i) | | $ 4,000,000 | | $ 4,006,456 |
Series 2005-6 Class AJ, 5.328% 9/10/47 (i) | | 5,000,000 | | 5,043,800 |
Bear Stearns Commercial Mortgage Securities, Inc. Series 2006-PW11 Class AJ, 5.597% 3/11/39 (i) | | 5,700,000 | | 5,778,521 |
Bear Stearns Commercial Mortgage Securities Trust Series 2006-T22 Class B, 5.7657% 4/12/38 (h)(i) | | 2,520,000 | | 2,621,531 |
BLCP Hotel Trust: | | | | |
floater Series 2014-CLRN Class F, 3.2206% 8/15/29 (h)(i) | | 2,500,000 | | 2,413,543 |
Series 2014-CLMZ Class M, 5.9145% 8/15/29 (h)(i) | | 12,513,000 | | 12,426,958 |
Boca Hotel Portfolio Trust Series 2013-BOCA Class E, 3.9373% 8/15/26 (h)(i) | | 2,500,000 | | 2,499,993 |
Carefree Portfolio Trust floater: | | | | |
Series 2014-CARE: | | | | |
Class E, 4.187% 11/15/19 (h)(i) | | 4,073,000 | | 4,094,310 |
Class F, 2.7707% 11/15/19 (h)(i) | | 1,650,000 | | 1,609,238 |
Series 2014-CMZA Class MZA, 6.1635% 11/15/19 (h)(i) | | 15,382,000 | | 15,385,069 |
CGBAM Commercial Mortgage Trust: | | | | |
floater Series 2014-HD Class E, 3.1855% 2/15/31 (h)(i) | | 5,769,000 | | 5,770,575 |
Series 2015-SMRT Class F, 3.912% 4/10/28 (h)(i) | | 5,746,000 | | 5,451,357 |
Citigroup Commercial Mortgage Trust: | | | | |
Series 2013-GC15 Class D, 5.2754% 9/10/46 (h)(i) | | 2,750,000 | | 2,709,498 |
Series 2015-SHP2 Class E, 4.285% 7/15/17 (h)(i) | | 2,933,000 | | 2,933,000 |
COMM Mortgage Trust: | | | | |
sequential payer Series 2013-LC6 Class E, 3.5% 1/10/46 (h) | | 7,300,000 | | 6,117,210 |
Series 2012-CR5 Class D, 4.4801% 12/10/45 (h)(i) | | 2,000,000 | | 2,020,718 |
Series 2013-CR10 Class D, 4.9525% 8/10/46 (h)(i) | | 2,000,000 | | 1,918,880 |
Series 2013-CR12 Class D, 5.2543% 10/10/46 (h)(i) | | 4,500,000 | | 4,470,930 |
Series 2013-CR9 Class D, 4.4002% 7/10/45 (h)(i) | | 4,255,000 | | 4,020,439 |
Series 2013-LC6 Class D, 4.4296% 1/10/46 (h)(i) | | 3,870,000 | | 3,667,556 |
Series 2014-UBS2 Class D, 5.1826% 3/10/47 (h)(i) | | 3,713,000 | | 3,535,021 |
Commercial Mortgage Acceptance Corp. Series 1998-C2 Class J, 5.44% 9/15/30 (h) | | 1,680,484 | | 1,616,863 |
Commercial Mortgage Trust pass-thru certificates: | | | | |
Series 2005-C6 Class AJ, 5.209% 6/10/44 (i) | | 1,447,499 | | 1,447,134 |
Series 2012-CR1: | | | | |
Class C, 5.5378% 5/15/45 (i) | | 1,000,000 | | 1,100,956 |
Class D, 5.5378% 5/15/45 (h)(i) | | 5,550,000 | | 5,714,274 |
Commercial Mortgage Securities - continued |
| Principal Amount (e) | | Value |
Commercial Mortgage Trust pass-thru certificates: - continued | | | | |
Series 2012-CR2: | | | | |
Class D, 5.0191% 8/15/45 (h)(i) | | $ 4,500,000 | | $ 4,736,300 |
Class E, 5.0191% 8/15/45 (h)(i) | | 6,000,000 | | 6,043,332 |
Series 2012-LC4: | | | | |
Class C, 5.8205% 12/10/44 (i) | | 2,000,000 | | 2,236,190 |
Class D, 5.8205% 12/10/44 (h)(i) | | 8,000,000 | | 8,470,736 |
Core Industrial Trust Series 2015-TEXW Class F, 3.8487% 2/10/34 (h)(i) | | 6,565,000 | | 5,980,341 |
Credit Suisse First Boston Mortgage Securities Corp.: | | | | |
Series 1998-C1 Class F, 6% 5/17/40 (h) | | 1,183,604 | | 1,261,774 |
Series 1998-C2 Class F, 6.75% 11/15/30 (h) | | 1,332,466 | | 1,367,232 |
CSMC Trust floater Series 2015-DEAL: | | | | |
Class E, 4.184% 4/15/29 (h)(i) | | 2,000,000 | | 1,991,236 |
Class F, 4.934% 4/15/29 (h)(i) | | 5,053,000 | | 5,030,863 |
DBCCRE Mortgage Trust Series 2014-ARCP Class E, 5.099% 1/10/34 (h)(i) | | 7,503,000 | | 7,060,556 |
DBUBS Mortgage Trust Series 2011-LC1A: | | | | |
Class E, 5.7348% 11/10/46 (h)(i) | | 12,490,000 | | 13,468,979 |
Class G, 4.652% 11/10/46 (h) | | 9,843,000 | | 8,578,056 |
Extended Stay America Trust Series 2013-ESH7 Class C7, 3.9017% 12/5/31 (h) | | 500,000 | | 512,482 |
Freddie Mac: | | | | |
pass-thru certificates: | | | | |
Series K011 Class X3, 2.6623% 12/25/43 (i)(j) | | 12,206,096 | | 1,522,808 |
Series K012 Class X3, 2.365% 1/25/41 (i)(j) | | 21,072,884 | | 2,367,328 |
Series K013 Class X3, 2.9023% 1/25/43 (i)(j) | | 14,360,000 | | 1,971,326 |
Series KAIV Class X2, 3.6147% 6/25/46 (i)(j) | | 7,430,000 | | 1,335,514 |
GAHR Commercial Mortgage Trust Series 2015-NRF: | | | | |
Class EFX, 3.4949% 12/15/19 (h)(i) | | 5,607,000 | | 5,276,864 |
Class FFX, 3.4949% 12/15/19 (h)(i) | | 7,411,000 | | 6,851,876 |
GMAC Commercial Mortgage Securities, Inc. Series 1997-C2 Class G, 6.75% 4/15/29 (i) | | 548,460 | | 580,893 |
GP Portfolio Trust Series 2014-GPP Class E, 4.0355% 2/15/27 (h)(i) | | 2,823,000 | | 2,813,420 |
Greenwich Capital Commercial Funding Corp. Series 2006-GG7 Class A4, 5.8187% 7/10/38 (i) | | 7,789,588 | | 7,937,831 |
GS Mortgage Securities Corp. II Series 2010-C1: | | | | |
Class D, 6.1899% 8/10/43 (h)(i) | | 4,000,000 | | 4,347,640 |
Class E, 4% 8/10/43 (h) | | 3,770,000 | | 3,420,547 |
GS Mortgage Securities Trust: | | | | |
Series 2010-C2 Class D, 5.3958% 12/10/43 (h)(i) | | 3,000,000 | | 3,147,048 |
Commercial Mortgage Securities - continued |
| Principal Amount (e) | | Value |
GS Mortgage Securities Trust: - continued | | | | |
Series 2011-GC5: | | | | |
Class C, 5.475% 8/10/44 (h)(i) | | $ 9,000,000 | | $ 9,855,405 |
Class D, 5.475% 8/10/44 (h)(i) | | 4,000,000 | | 4,179,732 |
Class E, 5.475% 8/10/44 (h)(i) | | 4,049,000 | | 4,014,478 |
Class F, 4.5% 8/10/44 (h) | | 4,500,000 | | 3,713,058 |
Series 2012-GC6: | | | | |
Class C, 5.8223% 1/10/45 (h)(i) | | 3,600,000 | | 3,999,030 |
Class D, 5.8223% 1/10/45 (h)(i) | | 2,000,000 | | 2,089,829 |
Class E, 5% 1/10/45 (h)(i) | | 4,516,000 | | 4,266,125 |
Series 2012-GCJ7: | | | | |
Class C, 5.9069% 5/10/45 (i) | | 6,500,000 | | 7,217,810 |
Class D, 5.9069% 5/10/45 (h)(i) | | 3,000,000 | | 3,125,367 |
Class E, 5% 5/10/45 (h) | | 6,920,000 | | 6,432,541 |
Series 2012-GCJ9 Class D, 5.0153% 11/10/45 (h)(i) | | 2,000,000 | | 1,977,798 |
Series 2013-GC16: | | | | |
Class D, 5.4927% 11/10/46 (h)(i) | | 3,750,000 | | 3,744,701 |
Class F, 3.5% 11/10/46 (h) | | 7,303,000 | | 5,602,621 |
Hilton U.S.A. Trust: | | | | |
floater Series 2014-ORL Class E, 3.436% 7/15/29 (h)(i) | | 7,241,000 | | 7,271,325 |
Series 2013-HLT Class EFX, 5.6086% 11/5/30 (h)(i) | | 5,000,000 | | 5,059,201 |
Invitation Homes Trust floater Series 2013-SFR1 Class E, 2.9% 12/17/30 (h)(i) | | 1,500,000 | | 1,448,935 |
JPMorgan Chase Commercial Mortgage Securities Corp.: | | | | |
Series 2003-C1 Class F, 5.8339% 1/12/37 (h)(i) | | 1,000,000 | | 998,658 |
Series 2009-IWST: | | | | |
Class C, 7.6935% 12/5/27 (h)(i) | | 3,000,000 | | 3,582,123 |
Class D, 7.6935% 12/5/27 (h)(i) | | 9,550,000 | | 11,286,333 |
Series 2010-CNTM Class MZ, 8.5% 8/5/20 (h) | | 9,000,000 | | 9,352,089 |
Series 2010-CNTR: | | | | |
Class D, 6.3899% 8/5/32 (h)(i) | | 4,500,000 | | 5,160,389 |
Class XB, 1.1366% 8/5/32 (h)(i)(j) | | 32,655,000 | | 1,170,705 |
Series 2012-CBX: | | | | |
Class C, 5.4134% 6/15/45 (i) | | 4,530,000 | | 4,889,637 |
Class F, 4% 6/15/45 (h) | | 5,000,000 | | 4,506,520 |
Class G 4% 6/15/45 (h) | | 4,044,000 | | 2,945,493 |
JPMorgan Chase Commercial Mortgage Securities Trust: | | | | |
floater: | | | | |
Series 2014-FBLU Class E, 3.6815% 12/15/28 (h)(i) | | 2,406,000 | | 2,403,763 |
Commercial Mortgage Securities - continued |
| Principal Amount (e) | | Value |
JPMorgan Chase Commercial Mortgage Securities Trust: - continued | | | | |
Series 2014-INN: | | | | |
Class E, 3.787% 6/15/29 (h)(i) | | $ 9,607,000 | | $ 9,570,513 |
Class F, 4.187% 6/15/29 (h)(i) | | 9,618,000 | | 9,453,638 |
Series 2005-LDP5 Class AJ, 5.5334% 12/15/44 (i) | | 3,470,000 | | 3,510,262 |
Series 2011-C4 Class F, 3.873% 7/15/46 (h) | | 1,400,000 | | 1,295,223 |
Series 2013-LC11: | | | | |
Class D, 4.3807% 4/15/46 (i) | | 3,750,000 | | 3,528,146 |
Class F, 3.25% 4/15/46 (h)(i) | | 2,518,000 | | 1,846,495 |
Series 2014-DSTY Class E, 3.9314% 6/10/27 (h)(i) | | 2,525,000 | | 2,365,362 |
JPMorgan Commercial Mortgage Finance Corp. Series 1999-C8 Class H, 6% 7/15/31 (h) | | 984,143 | | 916,870 |
LB-UBS Commercial Mortgage Trust: | | | | |
sequential payer: | | | | |
Series 2005-C7 Class AJ, 5.323% 11/15/40 (i) | | 8,000,000 | | 8,026,504 |
Series 2006-C7 Class AM, 5.378% 11/15/38 | | 2,040,000 | | 2,117,220 |
Series 2005-C1 Class E, 4.924% 2/15/40 | | 1,747,214 | | 1,748,042 |
Series 2006-C4: | | | | |
Class A4, 6.028% 6/15/38 (i) | | 4,743,244 | | 4,858,244 |
Class AJ, 6.048% 6/15/38 (i) | | 7,005,000 | | 7,180,692 |
Class AM, 6.048% 6/15/38 (i) | | 6,700,000 | | 6,948,376 |
LSTAR Commercial Mortgage Trust: | | | | |
Series 2011-1 Class D, 5.4277% 6/25/43 (h)(i) | | 1,060,085 | | 1,060,314 |
Series 2014-2: | | | | |
Class D, 5.183% 1/20/41 (h)(i) | | 3,000,000 | | 2,833,575 |
Class E, 5.183% 1/20/41 (h)(i) | | 4,800,000 | | 4,016,995 |
Mach One Trust LLC Series 2004-1A Class H, 6.1214% 5/28/40 (h)(i) | | 1,384,194 | | 1,385,163 |
Merrill Lynch Financial Asset, Inc. Series 2005-CA16 Class M, 4.384% 7/12/37 | CAD | 220,089 | | 167,336 |
Merrill Lynch Mortgage Trust Series 2006-C1 Class AM, 5.8654% 5/12/39 (i) | | 1,200,000 | | 1,231,040 |
Mezz Capital Commercial Mortgage Trust Series 2004-C1 Class IO, 9.0012% 1/15/37 (h)(i)(j) | | 349,488 | | 22,297 |
Morgan Stanley BAML Trust: | | | | |
Series 2012-C6 Class D, 4.816% 11/15/45 (h)(i) | | 2,000,000 | | 2,046,496 |
Series 2013-C12 Class D, 4.9261% 10/15/46 (h)(i) | | 3,250,000 | | 3,171,243 |
Series 2013-C13: | | | | |
Class D, 5.0578% 11/15/46 (h)(i) | | 3,100,000 | | 3,024,407 |
Class E, 5.0578% 11/15/46 (h)(i) | | 3,379,000 | | 3,073,687 |
Series 2013-C7 Class E, 4.4375% 2/15/46 (h)(i) | | 1,000,000 | | 906,731 |
Series 2013-C9 Class D, 4.2965% 5/15/46 (h)(i) | | 5,000,000 | | 4,677,180 |
Commercial Mortgage Securities - continued |
| Principal Amount (e) | | Value |
Morgan Stanley Capital I Trust: | | | | |
sequential payer: | | | | |
Series 2006-HQ10 Class AM, 5.36% 11/12/41 | | $ 8,200,000 | | $ 8,547,590 |
Series 2012-C4 Class E, 5.7084% 3/15/45 (h)(i) | | 5,630,000 | | 5,833,969 |
Series 1997-RR Class F, 7.4369% 4/30/39 (h)(i) | | 806,029 | | 809,334 |
Series 1998-CF1 Class G, 7.35% 7/15/32 (h) | | 2,640,173 | | 2,565,292 |
Series 2006-IQ12 Class AMFX, 5.37% 12/15/43 | | 7,500,000 | | 7,863,240 |
Series 2011-C1 Class C, 5.418% 9/15/47 (h)(i) | | 4,000,000 | | 4,430,933 |
Series 2011-C2: | | | | |
Class D, 5.4799% 6/15/44 (h)(i) | | 4,610,000 | | 4,940,804 |
Class E, 5.4799% 6/15/44 (h)(i) | | 9,600,000 | | 10,106,544 |
Class F, 5.4799% 6/15/44 (h)(i) | | 4,440,000 | | 4,222,724 |
Class XB, 0.5332% 6/15/44 (h)(i)(j) | | 63,708,222 | | 1,679,731 |
Series 2011-C3: | | | | |
Class C, 5.3554% 7/15/49 (h)(i) | | 2,000,000 | | 2,181,710 |
Class D, 5.3554% 7/15/49 (h)(i) | | 7,400,000 | | 7,891,760 |
Class G, 5.3554% 7/15/49 (h)(i) | | 3,283,000 | | 2,943,758 |
Series 2012-C4 Class D, 5.7084% 3/15/45 (h)(i) | | 6,310,000 | | 6,779,514 |
Motel 6 Trust Series 2015-MTL6: | | | | |
Class E, 5.2785% 2/5/30 (h) | | 3,278,000 | | 3,263,836 |
Class F, 5% 2/5/30 (h) | | 10,728,000 | | 10,372,260 |
Providence Place Group Ltd. Partnership Series 2000-C1 Class A2, 7.75% 7/20/28 (h) | | 4,575,017 | | 5,739,359 |
SCG Trust Series 2013-SRP1 Class D, 3.5172% 11/15/26 (h)(i) | | 1,000,000 | | 999,542 |
TIAA Seasoned Commercial Mortgage Trust sequential payer Series 2007-C4 Class AJ, 5.4862% 8/15/39 (i) | | 1,493,827 | | 1,500,240 |
TimberStar Trust I Series 2006-1 Class F, 7.5296% 10/15/36 (h) | | 10,630,000 | | 10,906,829 |
UBS Commercial Mortgage Trust Series 2012-C1 Class D, 5.727% 5/10/45 (h)(i) | | 3,235,000 | | 3,403,336 |
UBS-Barclays Commercial Mortgage Trust sequential payer Series 2012-C3 Class A1, 0.726% 8/10/49 | | 1,827,170 | | 1,818,809 |
UBS-Citigroup Commercial Mortgage Trust Series 2011-C1 Class B, 6.084% 1/10/45 (h)(i) | | 3,000,000 | | 3,478,836 |
Vornado DP LLC Series 2010-VNO Class D, 6.3555% 9/13/28 (h) | | 2,540,000 | | 2,919,900 |
Wachovia Bank Commercial Mortgage Trust Series 2004-C11 Class D, 5.3146% 1/15/41 (i) | | 5,177,000 | | 5,257,927 |
Wells Fargo Commercial Mortgage Trust Series 2012-LC5 Class D, 4.9366% 10/15/45 (h)(i) | | 9,999,000 | | 10,087,941 |
WF-RBS Commercial Mortgage Trust: | | | | |
sequential payer Series 2011-C4I Class G, 5% 6/15/44 (h) | | 4,000,000 | | 3,319,232 |
Commercial Mortgage Securities - continued |
| Principal Amount (e) | | Value |
WF-RBS Commercial Mortgage Trust: - continued | | | | |
Series 2011-C3: | | | | |
Class C, 5.335% 3/15/44 (h) | | $ 4,900,000 | | $ 5,353,554 |
Class D, 5.7221% 3/15/44 (h)(i) | | 1,000,000 | | 1,079,559 |
Class E, 5% 3/15/44 (h) | | 3,000,000 | | 2,910,177 |
Series 2011-C5: | | | | |
Class F, 5.25% 11/15/44 (h)(i) | | 3,000,000 | | 2,757,525 |
Class G, 5.25% 11/15/44 (h)(i) | | 2,000,000 | | 1,753,606 |
Series 2012-C10 Class E, 4.6057% 12/15/45 (h)(i) | | 4,090,000 | | 3,745,782 |
Series 2012-C7: | | | | |
Class D, 4.9995% 6/15/45 (h)(i) | | 2,380,000 | | 2,495,706 |
Class F, 4.5% 6/15/45 (h) | | 2,000,000 | | 1,855,752 |
Series 2013-C11: | | | | |
Class D, 4.3201% 3/15/45 (h)(i) | | 5,830,000 | | 5,645,300 |
Class E, 4.3201% 3/15/45 (h)(i) | | 4,780,000 | | 4,336,593 |
Series 2013-C13 Class D, 4.1386% 5/15/45 (h)(i) | | 4,000,000 | | 3,825,852 |
WFCG Commercial Mortgage Trust floater Series 2015-BXRP: | | | | |
Class F, 3.9058% 11/15/29 (h)(i) | | 6,182,652 | | 6,140,759 |
Class G, 3.2055% 11/15/29 (h)(i) | | 4,069,869 | | 3,787,233 |
TOTAL COMMERCIAL MORTGAGE SECURITIES (Cost $568,589,435) |
610,929,580
|
Bank Loan Obligations - 7.3% |
|
CONSUMER DISCRETIONARY - 2.9% |
Hotels, Restaurants & Leisure - 2.2% |
Caesars Entertainment Resort Properties LLC Tranche B 1LN, term loan 7% 10/11/20 (i) | | 13,238,103 | | 12,377,626 |
Caesars Growth Properties Holdings, LLC Tranche 1LN, term loan 6.25% 5/8/21 (i) | | 10,194,581 | | 8,627,164 |
Cooper Hotel Group 12% 11/6/17 | | 13,194,963 | | 13,854,711 |
ESH Hospitality, Inc. Tranche B, term loan 5% 6/24/19 (i) | | 14,218,748 | | 14,485,349 |
Four Seasons Holdings, Inc.: | | | | |
Tranche 2LN, term loan 6.25% 12/27/20 (i) | | 2,150,000 | | 2,155,375 |
Tranche B 1LN, term loan 3.5% 6/27/20 (i) | | 1,993,180 | | 1,990,688 |
Hilton Worldwide Finance, LLC Tranche B, term loan 3.5% 10/25/20 (i) | | 18,472,361 | | 18,495,451 |
La Quinta Intermediate Holdings LLC Tranche B LN, Tranche B, term loan 4% 4/14/21 (i) | | 13,181,721 | | 13,198,198 |
Bank Loan Obligations - continued |
| Principal Amount (e) | | Value |
CONSUMER DISCRETIONARY - continued |
Hotels, Restaurants & Leisure - continued |
Playa Resorts Holding BV Tranche B, term loan 4% 8/9/19 (i) | | $ 8,114,819 | | $ 8,135,106 |
Ryman Hospitality Properties, Inc. Tranche B, term loan 3.5% 1/15/21 (i) | | 2,267,100 | | 2,275,602 |
| | 95,595,270 |
Media - 0.2% |
CBS Outdoor Americas Capital LLC/CBS Outdoor Americas Capital Corp. Tranche B, term loan 3% 1/31/21 (i) | | 8,295,000 | | 8,284,631 |
Multiline Retail - 0.4% |
JC Penney Corp., Inc. Tranche B, term loan 6% 5/22/18 (i) | | 15,385,152 | | 15,365,920 |
Specialty Retail - 0.1% |
The Pep Boys - Manny, Moe & Jack Tranche B, term loan 4.25% 10/11/18 (i) | | 6,213,491 | | 6,213,491 |
TOTAL CONSUMER DISCRETIONARY | | 125,459,312 |
CONSUMER STAPLES - 0.3% |
Food & Staples Retailing - 0.3% |
Albertson's LLC: | | | | |
Tranche B 2LN, term loan 5.375% 3/21/19 (i) | | 5,110,539 | | 5,129,703 |
Tranche B 3LN, term loan 5% 8/25/19 (i) | | 8,378,938 | | 8,410,359 |
| | 13,540,062 |
ENERGY - 0.5% |
Oil, Gas & Consumable Fuels - 0.5% |
Moxie Patriot LLC Tranche B, term loan 6.75% 12/19/20 (i) | | 2,000,000 | | 2,007,500 |
Panda Sherman Power, LLC term loan 9% 9/14/18 (i) | | 7,148,245 | | 7,041,022 |
Panda Temple Power, LLC term loan 7.25% 4/3/19 (i) | | 8,580,000 | | 8,065,200 |
TPF II Power, LLC Tranche B, term loan 5.5% 10/2/21 (i) | | 4,211,517 | | 4,232,574 |
| | 21,346,296 |
FINANCIALS - 1.8% |
Real Estate Investment Trusts - 0.3% |
Starwood Property Trust, Inc. Tranche B, term loan 3.5% 4/17/20 (i) | | 10,822,768 | | 10,768,654 |
Real Estate Management & Development - 1.1% |
CityCenter 8.74% 7/12/16 (i) | | 2,654,628 | | 2,654,628 |
Bank Loan Obligations - continued |
| Principal Amount (e) | | Value |
FINANCIALS - continued |
Real Estate Management & Development - continued |
Realogy Corp. Credit-Linked Deposit 4.4463% 10/10/16 (i) | | $ 420,600 | | $ 416,394 |
Realogy Group LLC Tranche B, term loan 3.75% 3/5/20 (i) | | 44,022,253 | | 44,132,309 |
| | 47,203,331 |
Thrifts & Mortgage Finance - 0.4% |
Ocwen Loan Servicing, LLC Tranche B, term loan 5% 2/15/18 (i) | | 18,395,917 | | 18,395,917 |
TOTAL FINANCIALS | | 76,367,902 |
HEALTH CARE - 0.1% |
Health Care Providers & Services - 0.1% |
Community Health Systems, Inc.: | | | | |
Tranche F, term loan 3.5335% 12/31/18 (i) | | 1,995,000 | | 2,004,975 |
Tranche G, term loan 3.75% 12/31/19 (i) | | 880,340 | | 880,340 |
Tranche H, term loan 4% 1/27/21 (i) | | 3,119,660 | | 3,127,459 |
| | 6,012,774 |
INDUSTRIALS - 0.6% |
Commercial Services & Supplies - 0.3% |
Lineage Logistics Holdings, LLC. Tranche B, term loan 4.5% 4/7/21 (i) | | 3,950,000 | | 3,871,000 |
Pilot Travel Centers LLC Tranche B, term loan 4.25% 10/3/21 (i) | | 9,900,000 | | 9,987,120 |
| | 13,858,120 |
Construction & Engineering - 0.3% |
Drumm Investors LLC Tranche B, term loan 6.75% 5/4/18 (i) | | 11,353,592 | | 11,481,320 |
TOTAL INDUSTRIALS | | 25,339,440 |
TELECOMMUNICATION SERVICES - 0.4% |
Wireless Telecommunication Services - 0.4% |
SBA Senior Finance II, LLC: | | | | |
term loan 3.25% 3/24/21 (i) | | 13,855,050 | | 13,768,456 |
Tranche B 2LN, term loan 3.25% 6/10/22 (i) | | 1,500,000 | | 1,488,750 |
| | 15,257,206 |
Bank Loan Obligations - continued |
| Principal Amount (e) | | Value |
UTILITIES - 0.7% |
Electric Utilities - 0.4% |
Calpine Construction Finance Co. LP Tranche B 2LN, term loan 3.25% 1/31/22 (i) | | $ 7,306,278 | | $ 7,260,613 |
Essential Power LLC Tranche B, term loan 4.75% 8/8/19 (i) | | 3,362,398 | | 3,375,007 |
La Frontera Generation, LLC Tranche B, term loan 4.5% 9/30/20 (i) | | 6,066,770 | | 5,983,655 |
Southeast Powergen LLC Tranche B, term loan 4.5% 12/2/21 (i) | | 2,756,150 | | 2,766,486 |
| | 19,385,761 |
Independent Power and Renewable Electricity Producers - 0.3% |
Calpine Corp. Tranche B 4LN, term loan 4% 10/31/20 (i) | | 1,970,000 | | 1,972,463 |
Tempus Public Foundation Generation Holdings LLC Tranche B, term loan 4.75% 12/31/17 (i) | | 11,486,346 | | 10,940,745 |
| | 12,913,208 |
TOTAL UTILITIES | | 32,298,969 |
TOTAL BANK LOAN OBLIGATIONS (Cost $274,172,984) |
315,621,961
|
Preferred Securities - 0.0% |
|
FINANCIALS - 0.0% |
Diversified Financial Services - 0.0% |
Crest Dartmouth Street 2003 1 Ltd. Series 2003-1A Class PS, 6/28/38 (h)(i) | | 1,220,000 | | 394,304 |
Thrifts & Mortgage Finance - 0.0% |
Crest Clarendon Street 2002-1 Ltd. Series 2002-1A Class PS, 12/28/35 (h)(i) | | 500,000 | | 250 |
TOTAL PREFERRED SECURITIES (Cost $1,297,768) |
394,554
|
Money Market Funds - 4.9% |
| Shares | | Value |
Fidelity Cash Central Fund, 0.17% (b) | 212,414,253 | | $ 212,414,253 |
Fidelity Securities Lending Cash Central Fund, 0.18% (b)(c) | 82,000 | | 82,000 |
TOTAL MONEY MARKET FUNDS (Cost $212,496,253) |
212,496,253
|
TOTAL INVESTMENT PORTFOLIO - 98.7% (Cost $4,042,563,842) | 4,259,361,956 |
NET OTHER ASSETS (LIABILITIES) - 1.3% | 57,654,478 |
NET ASSETS - 100% | $ 4,317,016,434 |
Currency Abbreviations |
CAD | - | Canadian dollar |
Legend |
(a) Non-income producing |
(b) Affiliated fund that is generally available only to investment companies and other accounts managed by Fidelity Investments. The rate quoted is the annualized seven-day yield of the fund at period end. A complete unaudited listing of the fund's holdings as of its most recent quarter end is available upon request. In addition, each Fidelity Central Fund's financial statements, which are not covered by the Fund's Report of Independent Registered Public Accounting Firm, are available on the SEC's website or upon request. |
(c) Investment made with cash collateral received from securities on loan. |
(d) Non-income producing - Security is in default. |
(e) Amount is stated in United States dollars unless otherwise noted. |
(f) Security or a portion of the security is on loan at period end. |
(g) Affiliated company |
(h) Security exempt from registration under Rule 144A of the Securities Act of 1933. These securities may be resold in transactions exempt from registration, normally to qualified institutional buyers. At the end of the period, the value of these securities amounted to $753,917,003 or 17.5% of net assets. |
(i) Coupon rates for floating and adjustable rate securities reflect the rates in effect at period end. |
(j) Security represents right to receive monthly interest payments on an underlying pool of mortgages or assets. Principal shown is the outstanding par amount of the pool as of the end of the period. |
(k) Restricted securities - Investment in securities not registered under the Securities Act of 1933 (excluding 144A issues). At the end of the period, the value of restricted securities (excluding 144A issues) amounted to $7,092,781 or 0.2% of net assets. |
Additional information on each restricted holding is as follows: |
Security | Acquisition Date | Acquisition Cost |
Fannie Mae REMIC Trust Series 2001-W3 subordinate REMIC pass thru certificates, Class B3, 7% 9/25/41 | 5/21/03 | $ 57,050 |
Fannie Mae REMIC Trust Series 2003-W1 subordinate REMIC pass thru certificates, Class B3, 4.3375% 12/25/42 | 3/25/03 | $ 94,017 |
Stanley Martin Communities LLC Class B | 8/3/05 - 3/1/07 | $ 4,244,623 |
Affiliated Central Funds |
Information regarding fiscal year to date income earned by the Fund from investments in Fidelity Central Funds is as follows: |
Fund | Income earned |
Fidelity Cash Central Fund | $ 389,159 |
Fidelity Securities Lending Cash Central Fund | 31,537 |
Total | $ 420,696 |
Other Affiliated Issuers |
An affiliated company is a company in which the Fund has ownership of at least 5% of the voting securities. Fiscal year to date transactions with companies which are or were affiliates are as follows: |
Affiliate | Value, beginning of period | Purchases | Sales Proceeds | Dividend Income | Value,
end of
period |
Acadia Realty Trust (SBI) | $ 98,809,206 | $ 6,961,621 | $ - | $ 4,593,982 | $ 119,299,759 |
Arbor Realty Trust, Inc. | 21,697,653 | - | - | 1,657,247 | 20,991,789 |
Arbor Realty Trust, Inc. 7.375% | 8,162,637 | 2,420,000 | - | 793,928 | 10,597,189 |
Arbor Realty Trust, Inc. Series A, 8.25% | 4,727,225 | - | - | 389,996 | 4,814,206 |
Arbor Realty Trust, Inc. Series B, 7.75% | 5,882,400 | - | - | 465,000 | 5,940,000 |
Arbor Realty Trust, Inc. Series C, 8.50% | 2,525,000 | - | - | 212,500 | 2,578,000 |
Total | $ 141,804,121 | $ 9,381,621 | $ - | $ 8,112,653 | $ 164,220,943 |
Other Information |
The following is a summary of the inputs used, as of July 31, 2015, involving the Fund's assets and liabilities carried at fair value. The inputs or methodology used for valuing securities may not be an indication of the risk associated with investing in those securities. For more information on valuation inputs, and their aggregation into the levels used in the tables below, please refer to the Investment Valuation section in the accompanying Notes to Financial Statements. |
Valuation Inputs at Reporting Date: |
Description | Total | Level 1 | Level 2 | Level 3 |
Investments in Securities: | | | | |
Equities: | | | | |
Consumer Discretionary | $ 8,912,573 | $ 1,858,203 | $ - | $ 7,054,370 |
Financials | 2,156,240,482 | 2,122,413,123 | 33,827,357 | 2 |
Corporate Bonds | 862,125,500 | - | 861,655,568 | 469,932 |
Asset-Backed Securities | 82,531,500 | - | 75,507,994 | 7,023,506 |
Collateralized Mortgage Obligations | 10,109,553 | - | 9,587,036 | 522,517 |
Commercial Mortgage Securities | 610,929,580 | - | 610,739,947 | 189,633 |
Bank Loan Obligations | 315,621,961 | - | 296,540,853 | 19,081,108 |
Preferred Securities | 394,554 | - | - | 394,554 |
Money Market Funds | 212,496,253 | 212,496,253 | - | - |
Total Investments in Securities: | $ 4,259,361,956 | $ 2,336,767,579 | $ 1,887,858,755 | $ 34,735,622 |
Valuation Inputs at Reporting Date: |
The following is a reconciliation of Investments in Securities for which Level 3 inputs were used in determining value: |
Investments in Securities: | |
Bank Loan Obligations | |
Beginning Balance | $ 47,410,682 |
Net Realized Gain (Loss) on Investment Securities | 4,312 |
Net Unrealized Gain (Loss) on Investment Securities | (204,947) |
Cost of Purchases | 1,641,773 |
Proceeds of Sales | (30,267,248) |
Amortization/Accretion | (149,892) |
Transfers into Level 3 | 646,428 |
Transfers out of Level 3 | - |
Ending Balance | $ 19,081,108 |
The change in unrealized gain (loss) for the period attributable to Level 3 securities held at July 31, 2015 | $ 139,122 |
Other Investments in Securities: | |
Beginning Balance | $ 31,191,916 |
Net Realized Gain (Loss) on Investment Securities | (4,491,681) |
Net Unrealized Gain (Loss) on Investment Securities | 6,062,436 |
Cost of Purchases | 54,943 |
Proceeds of Sales | (15,938,523) |
Amortization/Accretion | 600,752 |
Transfers into Level 3 | 494,533 |
Transfers out of Level 3 | (2,319,862) |
Ending Balance | $ 15,654,514 |
The change in unrealized gain (loss) for the period attributable to Level 3 securities held at July 31, 2015 | $ 298,525 |
The information used in the above reconciliations represents fiscal year to date activity for any Investments in Securities identified as using Level 3 inputs at either the beginning or the end of the current fiscal period. Transfers in or out of Level 3 represent the beginning value of any Security or Instrument where a change in the pricing level occurred from the beginning to the end of the period. The cost of purchases and the proceeds of sales may include securities received or delivered through corporate actions or exchanges. Realized and unrealized gains (losses) disclosed in the reconciliation are included in Net Gain (Loss) on the Fund's Statement of Operations. |
Other Information |
The composition of credit quality ratings as a percentage of net assets is as follows (Unaudited): |
U.S. Government and U.S. Government Agency Obligations | 0.3% |
AAA,AA,A | 3.1% |
BBB | 9.5% |
BB | 9.6% |
B | 11.7% |
CCC,CC,C | 0.8% |
D | 0.0% |
Not Rated | 8.5% |
Equities | 50.2% |
Short-Term Investments and Net Other Assets | 6.3% |
| 100.0% |
We have used ratings from Moody's Investors Service, Inc. Where Moody's® ratings are not available, we have used S&P® ratings. All ratings are as of the date indicated and do not reflect subsequent changes. |
See accompanying notes which are an integral part of the financial statements.
Annual Report
Statement of Assets and Liabilities
| | July 31, 2015 |
| | |
Assets | | |
Investment in securities, at value (including securities loaned of $80,160) - See accompanying schedule: Unaffiliated issuers (cost $3,699,779,355) | $ 3,882,644,760 | |
Fidelity Central Funds (cost $212,496,253) | 212,496,253 | |
Other affiliated issuers (cost $130,288,234) | 164,220,943 | |
Total Investments (cost $4,042,563,842) | | $ 4,259,361,956 |
Cash | | 230,281 |
Foreign currency held at value (cost $2,357,093) | | 2,310,596 |
Receivable for investments sold | | 49,193,593 |
Receivable for fund shares sold | | 3,081,848 |
Dividends receivable | | 3,389,809 |
Interest receivable | | 18,490,023 |
Distributions receivable from Fidelity Central Funds | | 29,352 |
Other receivables | | 6,569 |
Total assets | | 4,336,094,027 |
| | |
Liabilities | | |
Payable for investments purchased | $ 6,702,493 | |
Payable for fund shares redeemed | 8,923,965 | |
Accrued management fee | 1,972,548 | |
Distribution and service plan fees payable | 357,265 | |
Other affiliated payables | 905,413 | |
Other payables and accrued expenses | 133,909 | |
Collateral on securities loaned, at value | 82,000 | |
Total liabilities | | 19,077,593 |
| | |
Net Assets | | $ 4,317,016,434 |
Net Assets consist of: | | |
Paid in capital | | $ 4,030,305,530 |
Undistributed net investment income | | 34,176,266 |
Accumulated undistributed net realized gain (loss) on investments and foreign currency transactions | | 35,806,504 |
Net unrealized appreciation (depreciation) on investments and assets and liabilities in foreign currencies | | 216,728,134 |
Net Assets | | $ 4,317,016,434 |
See accompanying notes which are an integral part of the financial statements.
Annual Report
Financial Statements - continued
Statement of Assets and Liabilities - continued
| | July 31, 2015 |
Calculation of Maximum Offering Price | | |
Class A: | | |
Net Asset Value and redemption price per share ($495,461,547 ÷ 42,506,436 shares) | | $ 11.66 |
| | |
Maximum offering price per share (100/96.00 of $11.66) | | $ 12.15 |
Class T: | | |
Net Asset Value and redemption price per share ($55,424,226 ÷ 4,752,349 shares) | | $ 11.66 |
| | |
Maximum offering price per share (100/96.00 of $11.66) | | $ 12.15 |
Class C: | | |
Net Asset Value and offering price per share ($291,386,883 ÷ 25,217,545 shares) | | $ 11.55 |
| | |
Real Estate Income: | | |
Net Asset Value, offering price and redemption price per share ($2,561,268,378 �� 218,691,778 shares) | | $ 11.71 |
| | |
Class I: | | |
Net Asset Value, offering price and redemption price per share ($913,475,400 ÷ 78,199,250 shares) | | $ 11.68 |
A Redemption price per share is equal to net asset value less any applicable contingent deferred sales charge.
See accompanying notes which are an integral part of the financial statements.
Annual Report
Statement of Operations
| Year ended July 31, 2015 |
Investment Income | | |
Dividends (including $8,112,653 earned from other affiliated issuers) | | $ 124,596,150 |
Interest | | 115,189,589 |
Income from Fidelity Central Funds | | 420,696 |
Total income | | 240,206,435 |
| | |
Expenses | | |
Management fee | $ 24,277,663 | |
Transfer agent fees | 9,546,099 | |
Distribution and service plan fees | 4,138,875 | |
Accounting and security lending fees | 1,344,494 | |
Custodian fees and expenses | 63,073 | |
Independent trustees' compensation | 18,479 | |
Registration fees | 214,976 | |
Audit | 177,427 | |
Legal | 10,279 | |
Miscellaneous | 28,304 | |
Total expenses before reductions | 39,819,669 | |
Expense reductions | (141,701) | 39,677,968 |
Net investment income (loss) | | 200,528,467 |
Realized and Unrealized Gain (Loss) Net realized gain (loss) on: | | |
Investment securities: | | |
Unaffiliated issuers | 54,227,022 | |
Foreign currency transactions | (19,715) | |
Total net realized gain (loss) | | 54,207,307 |
Change in net unrealized appreciation (depreciation) on: Investment securities | (52,090,713) | |
Assets and liabilities in foreign currencies | (93,516) | |
Total change in net unrealized appreciation (depreciation) | | (52,184,229) |
Net gain (loss) | | 2,023,078 |
Net increase (decrease) in net assets resulting from operations | | $ 202,551,545 |
See accompanying notes which are an integral part of the financial statements.
Annual Report
Financial Statements - continued
Statement of Changes in Net Assets
| Year ended
July 31,
2015 | Year ended
July 31,
2014 |
Increase (Decrease) in Net Assets | | |
Operations | | |
Net investment income (loss) | $ 200,528,467 | $ 170,741,524 |
Net realized gain (loss) | 54,207,307 | 105,884,376 |
Change in net unrealized appreciation (depreciation) | (52,184,229) | 30,348,946 |
Net increase (decrease) in net assets resulting from operations | 202,551,545 | 306,974,846 |
Distributions to shareholders from net investment income | (199,452,326) | (172,155,251) |
Distributions to shareholders from net realized gain | (75,677,564) | (78,297,244) |
Total distributions | (275,129,890) | (250,452,495) |
Share transactions - net increase (decrease) | 215,193,161 | (6,051,637) |
Redemption fees | 424,938 | 438,384 |
Total increase (decrease) in net assets | 143,039,754 | 50,909,098 |
| | |
Net Assets | | |
Beginning of period | 4,173,976,680 | 4,123,067,582 |
End of period (including undistributed net investment income of $34,176,266 and undistributed net investment income of $34,654,174, respectively) | $ 4,317,016,434 | $ 4,173,976,680 |
See accompanying notes which are an integral part of the financial statements.
Annual Report
Financial Highlights - Fidelity Real Estate Income Fund Class A
Years ended July 31, | 2015 | 2014 | 2013 | 2012 | 2011 |
Selected Per-Share Data | | | | | |
Net asset value, beginning of period | $ 11.86 | $ 11.67 | $ 11.26 | $ 10.73 | $ 9.94 |
Income from Investment Operations | | | | | |
Net investment income (loss) C | .52 | .49 | .54 | .52 | .53 |
Net realized and unrealized gain (loss) | .02 | .44 | .60 | .61 | .76 |
Total from investment operations | .54 | .93 | 1.14 | 1.13 | 1.29 |
Distributions from net investment income | (.52) | (.50) | (.53) | (.51) | (.50) |
Distributions from net realized gain | (.21) | (.24) | (.20) | (.10) | - |
Total distributions | (.74)I | (.74) | (.73) | (.60)H | (.50) |
Redemption fees added to paid in capitalC, G | - | - | - | - | - |
Net asset value, end of period | $ 11.66 | $ 11.86 | $ 11.67 | $ 11.26 | $ 10.73 |
Total ReturnA, B | 4.65% | 8.49% | 10.45% | 11.24% | 13.27% |
Ratios to Average Net AssetsD, F | | | | | |
Expenses before reductions | 1.04% | 1.06% | 1.08% | 1.12% | 1.13% |
Expenses net of fee waivers, if any | 1.03% | 1.05% | 1.08% | 1.12% | 1.13% |
Expenses net of all reductions | 1.03% | 1.05% | 1.07% | 1.11% | 1.12% |
Net investment income (loss) | 4.40% | 4.28% | 4.62% | 4.89% | 5.00% |
Supplemental Data | | | | | |
Net assets, end of period (000 omitted) | $ 495,462 | $ 442,271 | $ 378,269 | $ 137,352 | $ 60,283 |
Portfolio turnover rateE | 19% | 29% | 26% | 27% | 25% |
A Total returns would have been lower if certain expenses had not been reduced during the applicable periods shown.
B Total returns do not include the effect of the sales charges.
C Calculated based on average shares outstanding during the period.
D Fees and expenses of any underlying Fidelity Central Funds are not included in the Fund's expense ratio. The Fund indirectly bears its proportionate share of the expenses of any underlying Fidelity Central Funds.
E Amount does not include the portfolio activity of any underlying Fidelity Central Funds.
F Expense ratios reflect operating expenses of the class. Expenses before reductions do not reflect amounts reimbursed by the investment adviser or reductions from brokerage service arrangements or reductions from other expense offset arrangements and do not represent the amount paid by the class during periods when reimbursements or reductions occur. Expenses net of fee waivers reflect expenses after reimbursement by the investment adviser but prior to reductions from brokerage service arrangements or other expense offset arrangements. Expenses net of all reductions represent the net expenses paid by the class.
G Amount represents less than $.01 per share.
H Total distributions of $.60 per share is comprised of distributions from net investment income of $.505 and distributions from net realized gain of $.097 per share.
I Total distributions of $.74 per share is comprised of distributions from net investment income of $.523 and distributions from net realized gain of $.212 per share.
See accompanying notes which are an integral part of the financial statements.
Annual Report
Financial Highlights - Fidelity Real Estate Income Fund Class T
Years ended July 31, | 2015 | 2014 | 2013 | 2012 | 2011 |
Selected Per-Share Data | | | | | |
Net asset value, beginning of period | $ 11.86 | $ 11.67 | $ 11.26 | $ 10.72 | $ 9.94 |
Income from Investment Operations | | | | | |
Net investment income (loss) C | .51 | .49 | .54 | .52 | .52 |
Net realized and unrealized gain (loss) | .02 | .43 | .60 | .62 | .76 |
Total from investment operations | .53 | .92 | 1.14 | 1.14 | 1.28 |
Distributions from net investment income | (.52) | (.50) | (.53) | (.50) | (.50) |
Distributions from net realized gain | (.21) | (.24) | (.20) | (.10) | - |
Total distributions | (.73) | (.73) H | (.73) | (.60) | (.50) |
Redemption fees added to paid in capitalC, G | - | - | - | - | - |
Net asset value, end of period | $ 11.66 | $ 11.86 | $ 11.67 | $ 11.26 | $ 10.72 |
Total ReturnA, B | 4.62% | 8.44% | 10.42% | 11.33% | 13.11% |
Ratios to Average Net AssetsD, F | | | | | |
Expenses before reductions | 1.06% | 1.08% | 1.08% | 1.11% | 1.16% |
Expenses net of fee waivers, if any | 1.06% | 1.08% | 1.08% | 1.11% | 1.16% |
Expenses net of all reductions | 1.06% | 1.07% | 1.08% | 1.11% | 1.16% |
Net investment income (loss) | 4.37% | 4.26% | 4.61% | 4.90% | 4.96% |
Supplemental Data | | | | | |
Net assets, end of period (000 omitted) | $ 55,424 | $ 48,164 | $ 46,198 | $ 26,143 | $ 7,626 |
Portfolio turnover rateE | 19% | 29% | 26% | 27% | 25% |
A Total returns would have been lower if certain expenses had not been reduced during the applicable periods shown.
B Total returns do not include the effect of the sales charges.
C Calculated based on average shares outstanding during the period.
D Fees and expenses of any underlying Fidelity Central Funds are not included in the Fund's expense ratio. The Fund indirectly bears its proportionate share of the expenses of any underlying Fidelity Central Funds.
E Amount does not include the portfolio activity of any underlying Fidelity Central Funds.
F Expense ratios reflect operating expenses of the class. Expenses before reductions do not reflect amounts reimbursed by the investment adviser or reductions from brokerage service arrangements or reductions from other expense offset arrangements and do not represent the amount paid by the class during periods when reimbursements or reductions occur. Expenses net of fee waivers reflect expenses after reimbursement by the investment adviser but prior to reductions from brokerage service arrangements or other expense offset arrangements. Expenses net of all reductions represent the net expenses paid by the class.
G Amount represents less than $.01 per share.
H Total distributions of $.73 per share is comprised of distributions from net investment income of $.496 and distributions from net realized gain of $.236 per share.
See accompanying notes which are an integral part of the financial statements.
Annual Report
Financial Highlights - Fidelity Real Estate Income Fund Class C
Years ended July 31, | 2015 | 2014 | 2013 | 2012 | 2011 |
Selected Per-Share Data | | | | | |
Net asset value, beginning of period | $ 11.77 | $ 11.59 | $ 11.20 | $ 10.67 | $ 9.93 |
Income from Investment Operations | | | | | |
Net investment income (loss) C | .43 | .40 | .45 | .44 | .45 |
Net realized and unrealized gain (loss) | .01 | .43 | .60 | .62 | .74 |
Total from investment operations | .44 | .83 | 1.05 | 1.06 | 1.19 |
Distributions from net investment income | (.45) | (.42) | (.46) | (.43) | (.45) |
Distributions from net realized gain | (.21) | (.24) | (.20) | (.10) | - |
Total distributions | (.66) | (.65) H | (.66) | (.53) | (.45) |
Redemption fees added to paid in capitalC, G | - | - | - | - | - |
Net asset value, end of period | $ 11.55 | $ 11.77 | $ 11.59 | $ 11.20 | $ 10.67 |
Total ReturnA, B | 3.82% | 7.66% | 9.66% | 10.49% | 12.25% |
Ratios to Average Net AssetsD, F | | | | | |
Expenses before reductions | 1.79% | 1.79% | 1.81% | 1.87% | 1.89% |
Expenses net of fee waivers, if any | 1.78% | 1.79% | 1.81% | 1.87% | 1.89% |
Expenses net of all reductions | 1.78% | 1.79% | 1.81% | 1.87% | 1.89% |
Net investment income (loss) | 3.65% | 3.54% | 3.88% | 4.14% | 4.23% |
Supplemental Data | | | | | |
Net assets, end of period (000 omitted) | $ 291,387 | $ 246,306 | $ 204,012 | $ 52,780 | $ 21,555 |
Portfolio turnover rateE | 19% | 29% | 26% | 27% | 25% |
A Total returns would have been lower if certain expenses had not been reduced during the applicable periods shown.
B Total returns do not include the effect of the contingent deferred sales charge.
C Calculated based on average shares outstanding during the period.
D Fees and expenses of any underlying Fidelity Central Funds are not included in the Fund's expense ratio. The Fund indirectly bears its proportionate share of the expenses of any underlying Fidelity Central Funds.
E Amount does not include the portfolio activity of any underlying Fidelity Central Funds.
F Expense ratios reflect operating expenses of the class. Expenses before reductions do not reflect amounts reimbursed by the investment adviser or reductions from brokerage service arrangements or reductions from other expense offset arrangements and do not represent the amount paid by the class during periods when reimbursements or reductions occur. Expenses net of fee waivers reflect expenses after reimbursement by the investment adviser but prior to reductions from brokerage service arrangements or other expense offset arrangements. Expenses net of all reductions represent the net expenses paid by the class.
G Amount represents less than $.01 per share.
H Total distributions of $.65 per share is comprised of distributions from net investment income of $.417 and distributions from net realized gain of $.236 per share.
See accompanying notes which are an integral part of the financial statements.
Annual Report
Financial Highlights - Fidelity Real Estate Income Fund
Years ended July 31, | 2015 | 2014 | 2013 | 2012 | 2011 |
Selected Per-Share Data | | | | | |
Net asset value, beginning of period | $ 11.91 | $ 11.71 | $ 11.29 | $ 10.75 | $ 9.95 |
Income from Investment Operations | | | | | |
Net investment income (loss) B | .54 | .52 | .57 | .54 | .55 |
Net realized and unrealized gain (loss) | .02 | .44 | .60 | .62 | .76 |
Total from investment operations | .56 | .96 | 1.17 | 1.16 | 1.31 |
Distributions from net investment income | (.55) | (.53) | (.55) | (.52) | (.51) |
Distributions from net realized gain | (.21) | (.24) | (.20) | (.10) | - |
Total distributions | (.76) | (.76)G | (.75) | (.62) | (.51) |
Redemption fees added to paid in capitalB, F | - | - | - | - | - |
Net asset value, end of period | $ 11.71 | $ 11.91 | $ 11.71 | $ 11.29 | $ 10.75 |
Total ReturnA | 4.84% | 8.78% | 10.71% | 11.50% | 13.41% |
Ratios to Average Net AssetsC, E | | | | | |
Expenses before reductions | .83% | .83% | .84% | .90% | .92% |
Expenses net of fee waivers, if any | .82% | .83% | .84% | .89% | .92% |
Expenses net of all reductions | .82% | .83% | .84% | .89% | .92% |
Net investment income (loss) | 4.61% | 4.50% | 4.85% | 5.12% | 5.21% |
Supplemental Data | | | | | |
Net assets, end of period (000 omitted) | $ 2,561,268 | $ 2,627,382 | $ 2,884,545 | $ 2,252,149 | $ 1,660,063 |
Portfolio turnover rateD | 19% | 29% | 26% | 27% | 25% |
A Total returns would have been lower if certain expenses had not been reduced during the applicable periods shown.
B Calculated based on average shares outstanding during the period.
C Fees and expenses of any underlying Fidelity Central Funds are not included in the Fund's expense ratio. The Fund indirectly bears its proportionate share of the expenses of any underlying Fidelity Central Funds.
D Amount does not include the portfolio activity of any underlying Fidelity Central Funds.
E Expense ratios reflect operating expenses of the class. Expenses before reductions do not reflect amounts reimbursed by the investment adviser or reductions from brokerage service arrangements or reductions from other expense offset arrangements and do not represent the amount paid by the class during periods when reimbursements or reductions occur. Expenses net of fee waivers reflect expenses after reimbursement by the investment adviser but prior to reductions from brokerage service arrangements or other expense offset arrangements. Expenses net of all reductions represent the net expenses paid by the class.
F Amount represents less than $.01 per share.
G Total distributions of $.76 per share is comprised of distributions from net investment income of $.525 and distributions from net realized gain of $.236 per share.
See accompanying notes which are an integral part of the financial statements.
Annual Report
Financial Highlights - Fidelity Real Estate Income Fund Class I
Years ended July 31, | 2015 | 2014 | 2013 | 2012 | 2011 |
Selected Per-Share Data | | | | | |
Net asset value, beginning of period | $ 11.88 | $ 11.69 | $ 11.28 | $ 10.74 | $ 9.95 |
Income from Investment Operations | | | | | |
Net investment income (loss)B | .55 | .52 | .57 | .55 | .55 |
Net realized and unrealized gain (loss) | .02 | .44 | .60 | .62 | .76 |
Total from investment operations | .57 | .96 | 1.17 | 1.17 | 1.31 |
Distributions from net investment income | (.55) | (.53) | (.56) | (.53) | (.52) |
Distributions from net realized gain | (.21) | (.24) | (.20) | (.10) | - |
Total distributions | (.77) G | (.77) | (.76) | (.63) | (.52) |
Redemption fees added to paid in capitalB, F | - | - | - | - | - |
Net asset value, end of period | $ 11.68 | $ 11.88 | $ 11.69 | $ 11.28 | $ 10.74 |
Total ReturnA | 4.92% | 8.76% | 10.72% | 11.62% | 13.44% |
Ratios to Average Net AssetsC, E | | | | | |
Expenses before reductions | .77% | .78% | .80% | .84% | .89% |
Expenses net of fee waivers, if any | .77% | .78% | .80% | .84% | .89% |
Expenses net of all reductions | .77% | .78% | .80% | .84% | .89% |
Net investment income (loss) | 4.66% | 4.55% | 4.89% | 5.17% | 5.24% |
Supplemental Data | | | | | |
Net assets, end of period (000 omitted) | $ 913,475 | $ 809,854 | $ 610,045 | $ 217,435 | $ 43,282 |
Portfolio turnover rateD | 19% | 29% | 26% | 27% | 25% |
A Total returns would have been lower if certain expenses had not been reduced during the applicable periods shown.
B Calculated based on average shares outstanding during the period.
C Fees and expenses of any underlying Fidelity Central Funds are not included in the Fund's expense ratio. The Fund indirectly bears its proportionate share of the expenses of any underlying Fidelity Central Funds.
D Amount does not include the portfolio activity of any underlying Fidelity Central Funds.
E Expense ratios reflect operating expenses of the class. Expenses before reductions do not reflect amounts reimbursed by the investment adviser or reductions from brokerage service arrangements or reductions from other expense offset arrangements and do not represent the amount paid by the class during periods when reimbursements or reductions occur. Expenses net of fee waivers reflect expenses after reimbursement by the investment adviser but prior to reductions from brokerage service arrangements or other expense offset arrangements. Expenses net of all reductions represent the net expenses paid by the class.
F Amount represents less than $.01 per share.
G Total distributions of $.77 per share is comprised of distributions from net investment income of $.554 and distributions from net realized gain of $.212 per share.
See accompanying notes which are an integral part of the financial statements.
Annual Report
For the period ended July 31, 2015
1. Organization.
Fidelity Real Estate Income Fund (the Fund) is a fund of Fidelity Securities Fund (the Trust) and is authorized to issue an unlimited number of shares. The Trust is registered under the Investment Company Act of 1940, as amended (the 1940 Act), as an open-end management investment company organized as a Massachusetts business trust. The Fund offers Class A, Class T, Class C, Real Estate Income and Class I (formerly Institutional Class) shares, each of which has equal rights as to assets and voting privileges. Each class has exclusive voting rights with respect to matters that affect that class.
2. Investments in Fidelity Central Funds.
The Fund invests in Fidelity Central Funds, which are open-end investment companies generally available only to other investment companies and accounts managed by the investment adviser and its affiliates. The Fund's Schedule of Investments lists each of the Fidelity Central Funds held as of period end, if any, as an investment of the Fund, but does not include the underlying holdings of each Fidelity Central Fund. As an Investing Fund, the Fund indirectly bears its proportionate share of the expenses of the underlying Fidelity Central Funds.
The Money Market Central Funds seek preservation of capital and current income and are managed by Fidelity Investments Money Management, Inc. (FIMM), an affiliate of the investment adviser. Annualized expenses of the Money Market Central Funds as of their most recent shareholder report date are less than .01%.
A complete unaudited list of holdings for each Fidelity Central Fund is available upon request or at the Securities and Exchange Commission (the SEC) website at www.sec.gov. In addition, the financial statements of the Fidelity Central Funds, which are not covered by the Fund's Report of Independent Registered Public Accounting Firm, are available on the SEC website or upon request.
3. Significant Accounting Policies.
The financial statements have been prepared in conformity with accounting principles generally accepted in the United States of America (GAAP), which require management to make certain estimates and assumptions at the date of the financial statements. Actual results could differ from those estimates. Subsequent events, if any, through the date that the financial statements were issued have been evaluated in the preparation of the financial statements. The following summarizes the significant accounting policies of the Fund:
Annual Report
Notes to Financial Statements - continued
3. Significant Accounting Policies - continued
Investment Valuation. Investments are valued as of 4:00 p.m. Eastern time on the last calendar day of the period. The Board of Trustees (the Board) has delegated the day to day responsibility for the valuation of the Fund's investments to the Fidelity Management & Research Company (FMR) Fair Value Committee (the Committee). In accordance with valuation policies and procedures approved by the Board, the Fund attempts to obtain prices from one or more third party pricing vendors or brokers to value its investments. When current market prices, quotations or currency exchange rates are not readily available or reliable, investments will be fair valued in good faith by the Committee, in accordance with procedures adopted by the Board. Factors used in determining fair value vary by investment type and may include market or investment specific events, changes in interest rates and credit quality. The frequency with which these procedures are used cannot be predicted and they may be utilized to a significant extent. The Committee oversees the Fund's valuation policies and procedures and reports to the Board on the Committee's activities and fair value determinations. The Board monitors the appropriateness of the procedures used in valuing the Fund's investments and ratifies the fair value determinations of the Committee.
The Fund categorizes the inputs to valuation techniques used to value its investments into a disclosure hierarchy consisting of three levels as shown below:
Level 1 - quoted prices in active markets for identical investments
Level 2 - other significant observable inputs (including quoted prices for similar investments, interest rates, prepayment speeds, etc.)
Level 3 - unobservable inputs (including the Fund's own assumptions based on the best information available)
Valuation techniques used to value the Fund's investments by major category are as follows:
Equity securities, including restricted securities, for which market quotations are readily available, are valued at the last reported sale price or official closing price as reported by a third party pricing vendor on the primary market or exchange on which they are traded and are categorized as Level 1 in the hierarchy. In the event there were no sales during the day or closing prices are not available, securities are valued at the last quoted bid price or may be valued using the last available price and are generally categorized as Level 2 in the hierarchy. For foreign equity securities, when market or security specific events arise, comparisons to the valuation of American Depositary Receipts (ADRs), futures contracts, Exchange-Traded Funds (ETFs) and certain indexes as well as quoted prices for similar securities may be used and would be categorized as Level 2 in the hierarchy. Utilizing these techniques may result in transfers between Level 1 and Level 2.
Annual Report
3. Significant Accounting Policies - continued
Investment Valuation - continued
For equity securities, including restricted securities, where observable inputs are limited, assumptions about market activity and risk are used and these securities may be categorized as Level 3 in the hierarchy.
Debt securities, including restricted securities, are valued based on evaluated prices received from third party pricing vendors or from brokers who make markets in such securities. Corporate bonds, bank loan obligations and preferred securities are valued by pricing vendors who utilize matrix pricing which considers yield or price of bonds of comparable quality, coupon, maturity and type or by broker-supplied prices. Asset backed securities, collateralized mortgage obligations and commercial mortgage securities are valued by pricing vendors who utilize matrix pricing which considers prepayment speed assumptions, attributes of the collateral, yield or price of bonds of comparable quality, coupon, maturity and type or by broker-supplied prices. When independent prices are unavailable or unreliable, debt securities may be valued utilizing pricing methodologies which consider similar factors that would be used by third party pricing vendors. Debt securities are generally categorized as Level 2 in the hierarchy but may be Level 3 depending on the circumstances.
Investments in open-end mutual funds, including the Fidelity Central Funds, are valued at their closing net asset value (NAV) each business day and are categorized as Level 1 in the hierarchy.
Changes in valuation techniques may result in transfers in or out of an assigned level within the disclosure hierarchy. The aggregate value of investments by input level as of July 31, 2015, as well as a roll forward of Level 3 investments, is included at the end of the Fund's Schedule of Investments.
Foreign Currency. The Fund may use foreign currency contracts to facilitate transactions in foreign-denominated securities. Gains and losses from these transactions may arise from changes in the value of the foreign currency or if the counterparties do not perform under the contracts' terms.
Foreign-denominated assets, including investment securities, and liabilities are translated into U.S. dollars at the exchange rates at period end. Purchases and sales of investment securities, income and dividends received and expenses denominated in foreign currencies are translated into U.S. dollars at the exchange rate in effect on the transaction date.
The effects of exchange rate fluctuations on investments are included with the net realized and unrealized gain (loss) on investment securities. Other foreign currency transactions resulting in realized and unrealized gain (loss) are disclosed separately.
Annual Report
Notes to Financial Statements - continued
3. Significant Accounting Policies - continued
Investment Transactions and Income. For financial reporting purposes, the Fund's investment holdings and NAV include trades executed through the end of the last business day of the period. The NAV per share for processing shareholder transactions is calculated as of the close of business of the New York Stock Exchange (NYSE), normally 4:00 p.m. Eastern time and includes trades executed through the end of the prior business day. Gains and losses on securities sold are determined on the basis of identified cost. Dividend income is recorded on the ex-dividend date, except for certain dividends from foreign securities where the ex-dividend date may have passed, which are recorded as soon as the Fund is informed of the ex-dividend date. Non-cash dividends included in dividend income, if any, are recorded at the fair market value of the securities received. Income and capital gain distributions from Fidelity Central Funds, if any, are recorded on the ex-dividend date. Distributions received on securities that represent a return of capital or capital gain are recorded as a reduction of cost of investments and/or as a realized gain. Subsequent to ex-dividend date the Fund determines the components of these distributions, based upon receipt of tax filings or other correspondence relating to the underlying investment. Interest income is accrued as earned and includes coupon interest and amortization of premium and accretion of discount on debt securities as applicable. For certain lower credit quality securitized assets that have contractual cash flows (for example, asset backed securities, collateralized mortgage obligations and commercial mortgage-backed securities), changes in estimated cash flows are periodically evaluated and the estimated yield is adjusted on a prospective basis, resulting in increases or decreases to Interest Income in the accompanying Statement of Operations. Investment income is recorded net of foreign taxes withheld where recovery of such taxes is uncertain. Debt obligations may be placed on non-accrual status and related interest income may be reduced by ceasing current accruals and writing off interest receivables when the collection of all or a portion of interest has become doubtful based on consistently applied procedures. A debt obligation is removed from non-accrual status when the issuer resumes interest payments or when collectability of interest is reasonably assured.
Class Allocations and Expenses. Investment income, realized and unrealized capital gains and losses, common expenses of the Fund, and certain fund-level expense reductions, if any, are allocated daily on a pro-rata basis to each class based on the relative net assets of each class to the total net assets of the Fund. Each class differs with respect to transfer agent and distribution and service plan fees incurred. Certain expense reductions may also differ by class. For the reporting period, the allocated portion of income and expenses to each class as a percent of its average net assets may vary due to the timing of recording these transactions in relation to fluctuating net assets of the classes. Expenses directly attributable to a fund are charged to that fund. Expenses attributable to more than one fund are allocated among the respective funds on the basis of relative
Annual Report
3. Significant Accounting Policies - continued
Class Allocations and Expenses - continued
net assets or other appropriate methods. Expense estimates are accrued in the period to which they relate and adjustments are made when actual amounts are known.
Income Tax Information and Distributions to Shareholders. Each year, the Fund intends to qualify as a regulated investment company under Subchapter M of the Internal Revenue Code, including distributing substantially all of its taxable income and realized gains. As a result, no provision for U.S. Federal income taxes is required. As of July 31, 2015, the Fund did not have any unrecognized tax benefits in the financial statements; nor is the Fund aware of any tax positions for which it is reasonably possible that the total amounts of unrecognized tax benefits will significantly change in the next twelve months. The Fund files a U.S. federal tax return, in addition to state and local tax returns as required. The Fund's federal income tax returns are subject to examination by the Internal Revenue Service (IRS) for a period of three fiscal years after they are filed. State and local tax returns may be subject to examination for an additional fiscal year depending on the jurisdiction. Foreign taxes are provided for based on the Fund's understanding of the tax rules and rates that exist in the foreign markets in which it invests.
Distributions are declared and recorded on the ex-dividend date. Income dividends and capital gain distributions are declared separately for each class. Income and capital gain distributions are determined in accordance with income tax regulations, which may differ from GAAP. In addition, the Fund claimed a portion of the payment made to redeeming shareholders as a distribution for income tax purposes.
Capital accounts within the financial statements are adjusted for permanent book-tax differences. These adjustments have no impact on net assets or the results of operations. Capital accounts are not adjusted for temporary book-tax differences which will reverse in a subsequent period.
Book-tax differences are primarily due to foreign currency transactions, passive foreign investment companies (PFIC), market discount, equity-debt classifications, certain conversion ratio adjustments, partnerships and losses deferred due to wash sales.
The federal tax cost of investment securities and unrealized appreciation (depreciation) as of period end were as follows:
Gross unrealized appreciation | $ 367,906,812 |
Gross unrealized depreciation | (153,634,526) |
Net unrealized appreciation (depreciation) on securities | $ 214,272,286 |
| |
Tax Cost | $ 4,045,089,670 |
Annual Report
Notes to Financial Statements - continued
3. Significant Accounting Policies - continued
Income Tax Information and Distributions to Shareholders - continued
The tax-based components of distributable earnings as of period end were as follows:
Undistributed ordinary income | $ 36,563,408 |
Undistributed long-term capital gain | $ 36,541,226 |
Net unrealized appreciation (depreciation) on securities and other investments | $ 214,202,306 |
The tax character of distributions paid was as follows:
| July 31, 2015 | July 31, 2014 |
Ordinary Income | $ 202,287,403 | $ 185,363,562 |
Long-term Capital Gains | 72,842,487 | 65,088,933 |
Total | $ 275,129,890 | $ 250,452,495 |
Short-Term Trading (Redemption) Fees. Shares held by investors in the Fund less than 90 days may have been subject to a redemption fee equal to .75% of the NAV of shares redeemed. All redemption fees, which reduce the proceeds of the shareholder redemption, are retained by the Fund and accounted for as an addition to paid in capital.
Restricted Securities. The Fund may invest in securities that are subject to legal or contractual restrictions on resale. These securities generally may be resold in transactions exempt from registration or to the public if the securities are registered. Disposal of these securities may involve time-consuming negotiations and expense, and prompt sale at an acceptable price may be difficult. Information regarding restricted securities is included at the end of the Fund's Schedule of Investments.
Loans and Other Direct Debt Instruments. The Fund invests in direct debt instruments which are interests in amounts owed to lenders by corporate or other borrowers. These instruments may be in the form of loans, trade claims or other receivables and may include standby financing commitments such as revolving credit facilities that obligate the Fund to supply additional cash to the borrower on demand. Loans may be acquired through assignment or participation. The Fund did not have any unfunded loan commitments, which are contractual obligations for future funding, at period end.
4. Purchases and Sales of Investments.
Purchases and sales of securities, other than short-term securities and U.S. government securities, aggregated $987,134,266 and $778,719,087, respectively
Annual Report
5. Fees and Other Transactions with Affiliates.
Management Fee. Fidelity Management & Research Company (the investment adviser) and its affiliates provide the Fund with investment management related services for which the Fund pays a monthly management fee. The management fee is the sum of an individual fund fee rate that is based on an annual rate of .30% of the Fund's average net assets and an annualized group fee rate that averaged .25% during the period. The group fee rate is based upon the average net assets of all the mutual funds advised by the investment adviser, including any mutual funds previously advised by the investment adviser that are currently advised by Fidelity SelectCo, LLC, an affiliate of the investment adviser. The group fee rate decreases as assets under management increase and increases as assets under management decrease. For the reporting period, the total annual management fee rate was .55% of the Fund's average net assets.
Distribution and Service Plan Fees. In accordance with Rule 12b-1 of the 1940 Act, the Fund has adopted separate Distribution and Service Plans for each class of shares. Certain classes pay Fidelity Distributors Corporation (FDC), an affiliate of the investment adviser, separate Distribution and Service Fees, each of which is based on an annual percentage of each class' average net assets. In addition, FDC may pay financial intermediaries for selling shares of the Fund and providing shareholder support services.
For the period, the Distribution and Service Fee rates, total fees and amounts retained by FDC were as follows:
| Distribution
Fee | Service
Fee | Total Fees | Retained
by FDC |
Class A | -% | .25% | $ 1,204,578 | $ 56,339 |
Class T | -% | .25% | 133,672 | - |
Class C | .75% | .25% | 2,800,625 | 887,952 |
| | | $ 4,138,875 | $ 944,291 |
Sales Load. FDC may receive a front-end sales charge of up to 4.00% for selling Class A shares and Class T shares, some of which is paid to financial intermediaries for selling shares of the Fund. Depending on the holding period, FDC may receive contingent deferred sales charges levied on Class A, Class T, and Class C redemptions. The deferred sales charges are 1.00% for Class C shares, 1.00% for certain purchases of Class A shares and .25% for certain purchases of Class T shares.
Annual Report
Notes to Financial Statements - continued
5. Fees and Other Transactions with Affiliates - continued
Sales Load - continued
For the period, sales charge amounts retained by FDC were as follows:
| Retained
by FDC |
Class A | $ 68,997 |
Class T | 10,961 |
Class C* | 50,856 |
| $ 130,814 |
* When Class C shares are initially sold, FDC pays commissions from its own resources to financial intermediaries through which the sales are made.
Transfer Agent Fees. Fidelity Investments Institutional Operations Company, Inc., (FIIOC), an affiliate of the investment adviser, is the transfer, dividend disbursing and shareholder servicing agent for each class of the Fund. FIIOC receives account fees and asset-based fees that vary according to the account size and type of account of the shareholders of the respective classes of the Fund. FIIOC pays for typesetting, printing and mailing of shareholder reports, except proxy statements.
For the period, transfer agent fees for each class were as follows:
| Amount | % of
Class-Level Average
Net Assets |
Class A | $ 941,488 | .20 |
Class T | 118,992 | .22 |
Class C | 543,999 | .19 |
Real Estate Income | 6,234,517 | .23 |
Class I | 1,707,103 | .18 |
| $ 9,546,099 | |
Accounting and Security Lending Fees. Fidelity Service Company, Inc. (FSC), an affiliate of the investment adviser, maintains the Fund's accounting records. The accounting fee is based on the level of average net assets for each month. Under a separate contract, FSC administers the security lending program. The security lending fee is based on the number and duration of lending transactions.
Brokerage Commissions. The Fund placed a portion of its portfolio transactions with brokerage firms which are affiliates of the investment adviser. Brokerage commissions are included in net realized gain (loss) and change in net unrealized appreciation (depreciation) in the Statement of Operations. The commissions paid to these affiliated firms were $10,347 for the period.
Annual Report
6. Committed Line of Credit.
The Fund participates with other funds managed by the investment adviser or an affiliate in a $4.25 billion credit facility (the "line of credit") to be utilized for temporary or emergency purposes to fund shareholder redemptions or for other short-term liquidity purposes. The Fund has agreed to pay commitment fees on its pro-rata portion of the line of credit, which amounted to $6,409 and is reflected in Miscellaneous expenses on the Statement of Operations. During the period, the Fund did not borrow on this line of credit.
7. Security Lending.
The Fund lends portfolio securities through a lending agent from time to time in order to earn additional income. For equity securities, a lending agent is used and may loan securities to certain qualified borrowers, including Fidelity Capital Markets (FCM), a broker-dealer affiliated with the Fund. On the settlement date of the loan, the Fund receives collateral (in the form of U.S. Treasury obligations, letters of credit and/or cash) against the loaned securities and maintains collateral in an amount not less than 100% of the market value of the loaned securities during the period of the loan. The market value of the loaned securities is determined at the close of business of the Fund and any additional required collateral is delivered to the Fund on the next business day. If the borrower defaults on its obligation to return the securities loaned because of insolvency or other reasons, the Fund may apply collateral received from the borrower against the obligation. The Fund may experience delays and costs in recovering the securities loaned. Any cash collateral received is invested in the Fidelity Securities Lending Cash Central Fund. The value of loaned securities and cash collateral at period end are disclosed on the Fund's Statement of Assets and Liabilities. Security lending income represents the income earned on investing cash collateral, less rebates paid to borrowers and any lending agent fees associated with the loan, plus any premium payments received for lending certain types of securities. Security lending income is presented in the Statement of Operations as a component of income from Fidelity Central Funds. Total security lending income during the period amounted to $31,537. During the period, there were no securities loaned to FCM.
8. Expense Reductions.
Commissions paid to certain brokers with whom the investment adviser, or its affiliates, places trades on behalf of the Fund include an amount in addition to trade execution, which may be rebated back to the Fund to offset certain expenses. This amount totaled $22,713 for the period. In addition, through arrangements with the Fund's custodian, credits realized as a result of uninvested cash balances were used to reduce the Fund's expenses. During the period, these credits reduced the Fund's custody expenses by $2,498.
Annual Report
Notes to Financial Statements - continued
8. Expense Reductions - continued
In addition, during the period the investment adviser reimbursed/waived a portion of fund-level operating expenses in the amount of $17,421 and a portion of class-level operating expenses as follows:
| Amount |
Class A | $ 9,323 |
Class T | 1,074 |
Class C | 5,166 |
Real Estate Income | 66,942 |
Class I | 16,564 |
| $ 99,069 |
9. Distributions to Shareholders.
Distributions to shareholders of each class were as follows:
Years ended July 31, | 2015 | 2014 |
From net investment income | | |
Class A | $ 21,010,715 | $ 16,638,771 |
Class T | 2,305,119 | 1,842,576 |
Class C | 10,465,476 | 7,530,932 |
Real Estate Income | 122,206,251 | 117,401,887 |
Class I | 43,464,765 | 28,741,085 |
Total | $ 199,452,326 | $ 172,155,251 |
From net realized gain | | |
Class A | $ 7,958,848 | $ 7,591,572 |
Class T | 875,220 | 874,881 |
Class C | 4,645,932 | 4,152,718 |
Real Estate Income | 46,720,433 | 53,508,422 |
Class I | 15,477,131 | 12,169,651 |
Total | $ 75,677,564 | $ 78,297,244 |
10. Share Transactions.
Share transactions for each class were as follows and may contain automatic conversions between classes or exchanges between funds:
| Shares | Dollars |
Years ended July 31, | 2015 | 2014 | 2015 | 2014 |
Class A | | | | |
Shares sold | 17,614,783 | 18,815,698 | $ 207,492,435 | $ 217,399,754 |
Reinvestment of distributions | 2,253,682 | 1,805,230 | 26,209,333 | 20,178,624 |
Shares redeemed | (14,664,043) | (15,738,034) | (171,937,484) | (180,458,692) |
Net increase (decrease) | 5,204,422 | 4,882,894 | $ 61,764,284 | $ 57,119,686 |
Annual Report
10. Share Transactions - continued
| Shares | Dollars |
Years ended July 31, | 2015 | 2014 | 2015 | 2014 |
Class T | | | | |
Shares sold | 1,551,308 | 1,270,924 | $ 18,286,948 | $ 14,645,845 |
Reinvestment of distributions | 251,652 | 211,146 | 2,927,374 | 2,357,016 |
Shares redeemed | (1,110,729) | (1,380,258) | (13,074,996) | (15,703,373) |
Net increase (decrease) | 692,231 | 101,812 | $ 8,139,326 | $ 1,299,488 |
Class C | | | | |
Shares sold | 7,875,459 | 9,015,535 | $ 92,082,413 | $ 103,482,191 |
Reinvestment of distributions | 1,105,279 | 813,525 | 12,763,694 | 9,012,478 |
Shares redeemed | (4,690,719) | (6,508,928) | (54,577,835) | (73,908,752) |
Net increase (decrease) | 4,290,019 | 3,320,132 | $ 50,268,272 | $ 38,585,917 |
Real Estate Income | | | | |
Shares sold | 51,184,144 | 61,717,695 | $ 605,520,317 | $ 711,894,953 |
Reinvestment of distributions | 12,742,585 | 13,609,464 | 148,826,128 | 152,306,330 |
Shares redeemed | (65,882,524) | (100,931,769) | (777,479,294) | (1,156,054,958) |
Net increase (decrease) | (1,955,795) | (25,604,610) | $ (23,132,849) | $ (291,853,675) |
Class I | | | | |
Shares sold | 38,671,974 | 40,192,476 | $ 455,469,590 | $ 465,679,843 |
Reinvestment of distributions | 3,704,065 | 2,412,058 | 43,129,998 | 27,006,597 |
Shares redeemed | (32,342,580) | (26,626,486) | (380,445,460) | (303,889,493) |
Net increase (decrease) | 10,033,459 | 15,978,048 | $ 118,154,128 | $ 188,796,947 |
11. Other.
The Fund's organizational documents provide former and current trustees and officers with a limited indemnification against liabilities arising in connection with the performance of their duties to the Fund. In the normal course of business, the Fund may also enter into contracts that provide general indemnifications. The Fund's maximum exposure under these arrangements is unknown as this would be dependent on future claims that may be made against the Fund. The risk of material loss from such claims is considered remote.
Annual Report
To the Trustees of Fidelity Securities Fund and Shareholders of Fidelity Real Estate Income Fund:
We have audited the accompanying statement of assets and liabilities of Fidelity Real Estate Income Fund (the Fund), a fund of Fidelity Securities Fund, including the schedule of investments, as of July 31, 2015, and the related statement of operations for the year then ended, the statement of changes in net assets for each of the two years in the period then ended, and the financial highlights for each of the five years in the period then ended. These financial statements and financial highlights are the responsibility of the Fund's management. Our responsibility is to express an opinion on these financial statements and financial highlights based on our audits.
We conducted our audits in accordance with the standards of the Public Company Accounting Oversight Board (United States). Those standards require that we plan and perform the audit to obtain reasonable assurance about whether the financial statements and financial highlights are free of material misstatement. The Fund is not required to have, nor were we engaged to perform, an audit of its internal control over financial reporting. Our audits included consideration of internal control over financial reporting as a basis for designing audit procedures that are appropriate in the circumstances, but not for the purpose of expressing an opinion on the effectiveness of the Fund's internal control over financial reporting. Accordingly, we express no such opinion. An audit also includes examining, on a test basis, evidence supporting the amounts and disclosures in the financial statements, assessing the accounting principles used and significant estimates made by management, as well as evaluating the overall financial statement presentation. Our procedures included confirmation of securities owned as of July 31, 2015, by correspondence with the custodians, agent banks and brokers; when replies were not received from brokers, we performed other auditing procedures. We believe that our audits provide a reasonable basis for our opinion.
In our opinion, such financial statements and financial highlights referred to above present fairly, in all material respects, the financial position of Fidelity Real Estate Income Fund as of July 31, 2015, the results of its operations for the year then ended, the changes in its net assets for each of the two years in the period then ended, and the financial highlights for each of the five years in the period then ended, in conformity with accounting principles generally accepted in the United States of America.
DELOITTE & TOUCHE LLP
Boston, Massachusetts
September 24, 2015
Annual Report
The Trustees, Member of the Advisory Board, and officers of the trust and fund, as applicable, are listed below. The Board of Trustees governs the fund and is responsible for protecting the interests of shareholders. The Trustees are experienced executives who meet periodically throughout the year to oversee the fund's activities, review contractual arrangements with companies that provide services to the fund, oversee management of the risks associated with such activities and contractual arrangements, and review the fund's performance. Each of the Trustees oversees 170 funds.
The Trustees hold office without limit in time except that (a) any Trustee may resign; (b) any Trustee may be removed by written instrument, signed by at least two-thirds of the number of Trustees prior to such removal; (c) any Trustee who requests to be retired or who has become incapacitated by illness or injury may be retired by written instrument signed by a majority of the other Trustees; and (d) any Trustee may be removed at any special meeting of shareholders by a two-thirds vote of the outstanding voting securities of the trust. Each Trustee who is not an interested person (as defined in the 1940 Act) of the trust and the fund (Independent Trustee), shall retire not later than the last day of the calendar year in which his or her 75th birthday occurs. The Independent Trustees may waive this mandatory retirement age policy with respect to individual Trustees. The officers and Advisory Board Member hold office without limit in time, except that any officer and Advisory Board Member may resign or may be removed by a vote of a majority of the Trustees at any regular meeting or any special meeting of the Trustees. Except as indicated, each individual has held the office shown or other offices in the same company for the past five years.
Experience, Skills, Attributes, and Qualifications of the Fund's Trustees. The Governance and Nominating Committee has adopted a statement of policy that describes the experience, qualifications, attributes, and skills that are necessary and desirable for potential Independent Trustee candidates (Statement of Policy). The Board believes that each Trustee satisfied at the time he or she was initially elected or appointed a Trustee, and continues to satisfy, the standards contemplated by the Statement of Policy. The Governance and Nominating Committee also engages professional search firms to help identify potential Independent Trustee candidates who have the experience, qualifications, attributes, and skills consistent with the Statement of Policy. From time to time, additional criteria based on the composition and skills of the current Independent Trustees, as well as experience or skills that may be appropriate in light of future changes to board composition, business conditions, and regulatory or other developments, have also been considered by the professional search firms and the Governance and Nominating Committee. In addition, the Board takes into account the Trustees' commitment and participation in Board and committee meetings, as well as their leadership of standing and ad hoc committees throughout their tenure.
In determining that a particular Trustee was and continues to be qualified to serve as a Trustee, the Board has considered a variety of criteria, none of which, in isolation, was controlling. The Board believes that, collectively, the Trustees have balanced and diverse experience, qualifications, attributes, and skills, which allow the Board to operate effectively in governing the fund and protecting the interests of shareholders. Information about the specific experience, skills, attributes, and qualifications of each Trustee, which in each case led to the Board's conclusion that the Trustee should serve (or continue to serve) as a trustee of the fund, is provided below.
Annual Report
Trustees and Officers - continued
Board Structure and Oversight Function. James C. Curvey is an interested person (as defined in the 1940 Act) and currently serves as Chairman. The Trustees have determined that an interested Chairman is appropriate and benefits shareholders because an interested Chairman has a personal and professional stake in the quality and continuity of services provided to the fund. Independent Trustees exercise their informed business judgment to appoint an individual of their choosing to serve as Chairman, regardless of whether the Trustee happens to be independent or a member of management. The Independent Trustees have determined that they can act independently and effectively without having an Independent Trustee serve as Chairman and that a key structural component for assuring that they are in a position to do so is for the Independent Trustees to constitute a substantial majority for the Board. The Independent Trustees also regularly meet in executive session. Ned C. Lautenbach serves as Chairman of the Independent Trustees and as such (i) acts as a liaison between the Independent Trustees and management with respect to matters important to the Independent Trustees and (ii) with management prepares agendas for Board meetings.
Fidelity funds are overseen by different Boards of Trustees. The fund's Board oversees Fidelity's high income and certain equity funds and other Boards oversee Fidelity's investment-grade bond, money market, asset allocation, and sector funds. The asset allocation funds may invest in Fidelity funds overseen by the fund's Board. The use of separate Boards, each with its own committee structure, allows the Trustees of each group of Fidelity funds to focus on the unique issues of the funds they oversee, including common research, investment, and operational issues. On occasion, the separate Boards establish joint committees to address issues of overlapping consequences for the Fidelity funds overseen by each Board.
The Trustees operate using a system of committees to facilitate the timely and efficient consideration of all matters of importance to the Trustees, the fund, and fund shareholders and to facilitate compliance with legal and regulatory requirements and oversight of the fund's activities and associated risks. The Board, acting through its committees, has charged FMR and its affiliates with (i) identifying events or circumstances the occurrence of which could have demonstrably adverse effects on the fund's business and/or reputation; (ii) implementing processes and controls to lessen the possibility that such events or circumstances occur or to mitigate the effects of such events or circumstances if they do occur; and (iii) creating and maintaining a system designed to evaluate continuously business and market conditions in order to facilitate the identification and implementation processes described in (i) and (ii) above. Because the day-to-day operations and activities of the fund are carried out by or through FMR, its affiliates and other service providers, the fund's exposure to risks is mitigated but not eliminated by the processes overseen by the Trustees. While each of the Board's committees has responsibility for overseeing different aspects of the fund's activities, oversight is exercised primarily through the Operations, Audit, and Compliance Committees. In addition, the Independent Trustees have worked with FMR to enhance the Board's oversight of investment and financial risks, legal and regulatory risks, technology risks, and operational risks, including the development of additional risk reporting to the Board. For example, a working group comprised of Independent Trustees and FMR has worked and continues to work to review the Fidelity funds' valuation-related activities, reporting and risk management. Appropriate personnel, including but not limited to the fund's Chief Compliance Officer (CCO), FMR's internal auditor, the independent accountants, the fund's Treasurer and portfolio management personnel, make periodic reports to the Board's committees, as appropriate, including an annual review of FMR's risk management program for the Fidelity funds. The responsibilities of each standing committee, including their oversight responsibilities, are described further under "Standing Committees of the Fund's Trustees."
Annual Report
The fund's Statement of Additional Information (SAI) includes more information about the Trustees. To request a free copy, call Fidelity at 1-877-208-0098.
Interested Trustees*:
Correspondence intended for each Trustee who is an interested person may be sent to Fidelity Investments, 245 Summer Street, Boston, Massachusetts 02210.
Name, Year of Birth; Principal Occupations and Other Relevant Experience+ |
James C. Curvey (1935) |
Year of Election or Appointment: 2007 Trustee Chairman of the Board of Trustees |
| Mr. Curvey also serves as Trustee of other Fidelity funds. Mr. Curvey is a Director of Fidelity Research & Analysis Co. (investment adviser firm, 2009-present), and Vice Chairman (2007-present) and Director of FMR LLC (diversified financial services company). In addition, Mr. Curvey serves as an Overseer for the Boston Symphony Orchestra and a member of the board of Artis-Naples, Naples, Florida, and as a Trustee for Brewster Academy, Wolfeboro, New Hampshire. Previously, Mr. Curvey served as a Director of Fidelity Investments Money Management, Inc. (investment adviser firm, 2009-2014), a Director of FMR (investment adviser firm, 2007-2014), and a Director of FMR Co., Inc. (investment adviser firm, 2007-2014). |
Charles S. Morrison (1960) |
Year of Election or Appointment: 2014 Trustee |
| Mr. Morrison also serves as Trustee of other funds. He serves as a Director of Fidelity Investments Money Management, Inc. (FIMM) (investment adviser firm, 2014-present), Director of Fidelity SelectCo, LLC (investment adviser firm, 2014-present), President, Asset Management (2014-present), and is an employee of Fidelity Investments. Previously, Mr. Morrison served as Vice President of Fidelity's Fixed Income and Asset Allocation Funds (2012-2014), President, Fixed Income (2011-2014), Vice President of Fidelity's Money Market Funds (2005-2009), President, Money Market Group Leader of FMR (investment adviser firm, 2009), and Senior Vice President, Money Market Group of FMR (2004-2009). Mr. Morrison also served as Vice President of Fidelity's Bond Funds (2002-2005), certain Balanced Funds (2002-2005), and certain Asset Allocation Funds (2002-2007), and as Senior Vice President (2002-2005) of Fidelity's Bond Division. |
* Trustees have been determined to be "Interested Trustees" by virtue of, among other things, their affiliation with the trust or various entities under common control with FMR.
+ The information above includes each Trustee's principal occupation during the last five years and other information relating to the experience, attributes, and skills relevant to each Trustee's qualifications to serve as a Trustee, which led to the conclusion that each Trustee should serve as a Trustee for the fund.
Annual Report
Independent Trustees:
Correspondence intended for each Independent Trustee (that is, the Trustees other than the Interested Trustees) may be sent to Fidelity Investments, P.O. Box 55235, Boston, Massachusetts 02205-5235.
Name, Year of Birth; Principal Occupations and Other Relevant Experience+ |
Dennis J. Dirks (1948) |
Year of Election or Appointment: 2005 Trustee |
| Mr. Dirks also serves as Trustee of other Fidelity funds. Prior to his retirement in May 2003, Mr. Dirks was Chief Operating Officer and a member of the Board of The Depository Trust & Clearing Corporation (DTCC). He also served as President, Chief Operating Officer, and Board member of The Depository Trust Company (DTC) and President and Board member of the National Securities Clearing Corporation (NSCC). In addition, Mr. Dirks served as Chief Executive Officer and Board member of the Government Securities Clearing Corporation, Chief Executive Officer and Board member of the Mortgage-Backed Securities Clearing Corporation, as a Trustee and a member of the Finance Committee of Manhattan College (2005-2008), and as a Trustee and a member of the Finance Committee of AHRC of Nassau County (2006-2008). Mr. Dirks is a member of the Independent Directors Council (IDC) Governing Council (2010-present) and Board of Directors for The Brookville Center for Children's Services, Inc. (2009-present). |
Alan J. Lacy (1953) |
Year of Election or Appointment: 2008 Trustee |
| Mr. Lacy also serves as Trustee of other Fidelity funds. Mr. Lacy serves as a member of the Board of Directors of Dave & Buster's Entertainment, Inc. (restaurant and entertainment complexes, 2010-present) and Bristol-Myers Squibb Company (global pharmaceuticals, 2008-present). In addition, Mr. Lacy served as Senior Adviser (2007-2014) of Oak Hill Capital Partners, L.P. (private equity) and also served as Chief Executive Officer (2000-2005) and Vice Chairman (2005-2006) of Sears Holdings Corporation and Sears, Roebuck and Co. (retail). Mr. Lacy is a member of the Board of Trustees of The National Parks Conservation Association (2006-present). Previously, Mr. Lacy served as Chairman of the Board of Trustees of the National Parks Conservation Association (2008-2011) and as a member of the Board of Directors for The Western Union Company (global money transfer, 2006-2011), The Hillman Companies, Inc. (hardware wholesalers, 2010-2014), and Earth Fare, Inc. (retail grocery, 2010-2014). |
Ned C. Lautenbach (1944) |
Year of Election or Appointment: 2000 Trustee Chairman of the Independent Trustees |
| Mr. Lautenbach also serves as Trustee of other Fidelity funds. Mr. Lautenbach currently serves as the Lead Director of the Eaton Corporation Board of Directors (diversified industrial, 1997-present). Mr. Lautenbach is Chairman of the Board of Directors of Artis-Naples in Naples, Florida (2012-present), a member of the Council on Foreign Relations (1994-present), and a member of the Board of Governors, State University System of Florida (2013-present). Previously, Mr. Lautenbach was a Partner/Advisory Partner at Clayton, Dubilier & Rice, LLC (private equity investment, 1998-2010), as well as a Director of Sony Corporation (2006-2007). |
Joseph Mauriello (1944) |
Year of Election or Appointment: 2008 Trustee |
| Mr. Mauriello also serves as Trustee of other Fidelity funds. Prior to his retirement in January 2006, Mr. Mauriello served in numerous senior management positions including Deputy Chairman and Chief Operating Officer (2004-2005), and Vice Chairman of Financial Services (2002-2004) of KPMG LLP US (professional services, 1965-2005). Mr. Mauriello currently serves as a member of the Board of Directors of XL Group plc. (global insurance and re-insurance, 2006-present). Previously, Mr. Mauriello served as a Director of the Hamilton Funds of the Bank of New York (2006-2007) and of Arcadia Resources Inc. (health care services and products, 2007-2012). |
Robert W. Selander (1950) |
Year of Election or Appointment: 2011 Trustee |
| Mr. Selander also serves as Trustee of other Fidelity funds. Mr. Selander serves as a Director of The Western Union Company (global money transfer, 2014-present). Previously, Mr. Selander served as a Member of the Advisory Board of other Fidelity funds (2011), and Executive Vice Chairman (2010), Chief Executive Officer (2009-2010), and President and Chief Executive Officer (1997-2009) of Mastercard, Inc. |
Cornelia M. Small (1944) |
Year of Election or Appointment: 2005 Trustee |
| Ms. Small also serves as Trustee of other Fidelity funds. Ms. Small is a member of the Board of Directors (2009-present) and Chair of the Investment Committee (2010-present) of the Teagle Foundation. Ms. Small also serves on the Investment Committee of the Berkshire Taconic Community Foundation (2008-present). Previously, Ms. Small served as Chairperson (2002-2008) and a member of the Investment Committee and Chairperson (2008-2012) and a member of the Board of Trustees of Smith College. In addition, Ms. Small served as Chief Investment Officer, Director of Global Equity Investments, and a member of the Board of Directors of Scudder, Stevens & Clark and Scudder Kemper Investments. |
William S. Stavropoulos (1939) |
Year of Election or Appointment: 2002 Trustee Vice Chairman of the Independent Trustees |
| Mr. Stavropoulos also serves as Trustee of other Fidelity funds. Mr. Stavropoulos serves as President and Founder of the Michigan Baseball Foundation, the Great Lakes Loons (2007-present). Mr. Stavropoulos is Chairman Emeritus of the Board of Directors of The Dow Chemical Company, where he previously served in numerous senior management positions, including President, CEO (1995-2000; 2002-2004), Chairman of the Executive Committee (2000-2006), and as a member of the Board of Directors (1990-2006). Currently, Mr. Stavropoulos is Chairman of the Board of Directors of Univar Inc. (global distributor of commodity and specialty chemicals), a Director of Teradata Corporation (data warehousing and technology solutions), and Maersk Inc. (industrial conglomerate), and a member of the Advisory Board for Metalmark Capital LLC (private equity investment, 2005-present). Mr. Stavropoulos is an operating advisor to Clayton, Dubilier & Rice, LLC (private equity investment). In addition, Mr. Stavropoulos is a member of the University of Notre Dame Advisory Council for the College of Science, a Trustee of the Rollin L. Gerstacker Foundation, and a Director of the Naples Philharmonic Center for the Arts. Previously, Mr. Stavropoulos served as a Director of Chemical Financial Corporation (bank holding company, 1993-2012) and Tyco International, Ltd. (multinational manufacturing and services, 2007-2012). |
David M. Thomas (1949) |
Year of Election or Appointment: 2008 Trustee |
| Mr. Thomas also serves as Trustee of other Fidelity funds. Mr. Thomas serves as Non-Executive Chairman of the Board of Directors of Fortune Brands Home and Security (home and security products, 2011-present), as a member of the Board of Directors (2004-present) and Presiding Director (2013-present) of Interpublic Group of Companies, Inc. (marketing communication), and as a member of the Board of Trustees of the University of Florida (2013-present). Previously, Mr. Thomas served as Executive Chairman (2005-2006) and Chairman and Chief Executive Officer (2000-2005) of IMS Health, Inc. (pharmaceutical and healthcare information solutions), and a Director of Fortune Brands, Inc. (consumer products, 2000-2011). |
+ The information above includes each Trustee's principal occupation during the last five years and other information relating to the experience, attributes, and skills relevant to each Trustee's qualifications to serve as a Trustee, which led to the conclusion that each Trustee should serve as a Trustee for the fund.
Advisory Board Member and Officers:
Correspondence intended for each officer and Peter S. Lynch may be sent to Fidelity Investments, 245 Summer Street, Boston, Massachusetts 02210. Officers appear below in alphabetical order.
Name, Year of Birth; Principal Occupation |
Peter S. Lynch (1944) |
Year of Election or Appointment: 2003 Member of the Advisory Board |
| Mr. Lynch also serves as Member of the Advisory Board of other Fidelity funds. Mr. Lynch is Vice Chairman and a Director of FMR (investment adviser firm) and FMR Co., Inc. (investment adviser firm). In addition, Mr. Lynch serves as a Trustee of Boston College and as the Chairman of the Inner-City Scholarship Fund. Previously, Mr. Lynch served on the Special Olympics International Board of Directors (1997-2006). |
Christopher S. Bartel (1971) |
Year of Election or Appointment: 2009 Vice President |
| Mr. Bartel also serves as Vice President of other funds. Mr. Bartel serves as a Director, President, and Chief Executive Officer of Fidelity Management & Research (Japan) Limited (investment adviser firm, 2012-present), a Director of Fidelity Management & Research (Hong Kong) (investment adviser firm, 2012-present), and Senior Vice President of Global Equity Research (2010-present). Previously, Mr. Bartel served as Senior Vice President of Equity Research (2009-2010), Managing Director of Research (2006-2009), and an analyst and portfolio manager (2000-2006). |
Elizabeth Paige Baumann (1968) |
Year of Election or Appointment: 2012 Anti-Money Laundering (AML) Officer |
| Ms. Baumann also serves as AML Officer of other funds. She is Chief AML Officer of FMR LLC (diversified financial services company, 2012-present) and is an employee of Fidelity Investments. Previously, Ms. Baumann served as Vice President and Deputy Anti-Money Laundering Officer (2007-2012). |
Marc Bryant (1966) |
Year of Election or Appointment: 2015 Secretary and Chief Legal Officer (CLO) |
| Mr. Bryant also serves as Secretary and Chief Legal Officer (CLO) of other funds. He is Senior Vice President and Deputy General Counsel of FMR LLC (diversified financial services company). Previously, Mr. Bryant served as Secretary and Chief Legal Officer of Fidelity Rutland Square Trust II (2010-2014) and Assistant Secretary of Fidelity's Fixed Income and Asset Allocation Funds (2013-2015). Prior to joining Fidelity Investments, Mr. Bryant served as a Senior Vice President and the Head of Global Retail Legal for AllianceBernstein L.P. (2006-2010), and as the General Counsel for ProFund Advisors LLC (2001-2006). |
William C. Coffey (1969) |
Year of Election or Appointment: 2009 Assistant Secretary |
| Mr. Coffey also serves as Assistant Secretary of other funds. He is Senior Vice President and Deputy General Counsel of FMR LLC (diversified financial services company, 2010-present), and is an employee of Fidelity Investments. Previously, Mr. Coffey served as Vice President and Associate General Counsel of FMR LLC (2005-2009). |
Jonathan Davis (1968) |
Year of Election or Appointment: 2010 Assistant Treasurer |
| Mr. Davis also serves as Assistant Treasurer of other funds. Mr. Davis is an employee of Fidelity Investments. Previously, Mr. Davis served as Vice President and Associate General Counsel of FMR LLC (diversified financial services company, 2003-2010). |
Adrien E. Deberghes (1967) |
Year of Election or Appointment: 2008 Deputy Treasurer |
| Mr. Deberghes also serves as an officer of other funds. He is an employee of Fidelity Investments (2008-present). Prior to joining Fidelity Investments, Mr. Deberghes was Senior Vice President of Mutual Fund Administration at State Street Corporation (2007-2008), Senior Director of Mutual Fund Administration at Investors Bank & Trust (2005-2007), and Director of Finance for Dunkin' Brands (2000-2005). |
Stephanie J. Dorsey (1969) |
Year of Election or Appointment: 2010 Assistant Treasurer |
| Ms. Dorsey also serves as an officer of other funds. She is an employee of Fidelity Investments (2008-present) and has served in other fund officer roles. Prior to joining Fidelity Investments, Ms. Dorsey served as Treasurer (2004-2008) of the JPMorgan Mutual Funds and Vice President (2004-2008) of JPMorgan Chase Bank. |
Howard J. Galligan III (1966) |
Year of Election or Appointment: 2014 Chief Financial Officer |
| Mr. Galligan also serves as Chief Financial Officer of other funds. Mr. Galligan serves as President of Fidelity Pricing and Cash Management Services (FPCMS) (2014-present) and as a Director of Strategic Advisers, Inc. (investment adviser firm, 2008-present). Previously, Mr. Galligan served as Chief Administrative Officer of Asset Management (2011-2014) and Chief Operating Officer and Senior Vice President of Investment Support for Strategic Advisers, Inc. (2003-2011). |
Scott C. Goebel (1968) |
Year of Election or Appointment: 2015 Vice President |
| Mr. Goebel serves as an officer of other funds. Mr. Goebel also serves as Secretary of Fidelity SelectCo, LLC (investment adviser firm, 2013- present), Fidelity Investments Money Management, Inc. (FIMM) (investment adviser firm, 2010-present) and Fidelity Research and Analysis Company (FRAC) (investment adviser firm, 2010-present); General Counsel, Secretary, and Senior Vice President of FMR (investment adviser firm, 2008-present) and FMR Co., Inc. (investment adviser firm, 2008-present); Chief Legal Officer of Fidelity Management & Research (Hong Kong) Limited (investment adviser firm, 2008-present); and Assistant Secretary of Fidelity Management & Research (Japan) Limited (investment adviser firm, 2008-present) and FMR Investment Management (U.K.) Limited (investment adviser firm, 2008-present). Previously, Mr. Goebel served as Secretary and CLO of certain Fidelity funds (2008- 2015), Assistant Secretary of FIMM (2008-2010), FRAC (2008-2010), and certain funds (2007-2008); and as Vice President and Secretary of Fidelity Distributors Corporation (FDC) (2005-2007). Mr. Goebel has been employed by FMR LLC (diversified financial services company) or an affiliate since 2001. |
Brian B. Hogan (1964) |
Year of Election or Appointment: 2009 Vice President |
| Mr. Hogan also serves as Trustee or Vice President of other funds. Mr. Hogan serves as a Director of Fidelity SelectCo, LLC (investment adviser firm, 2014-present) and President of the Equity Division of FMR (investment adviser firm, 2009-present). Previously, Mr. Hogan served as Senior Vice President, Equity Research of FMR (2006-2009) and as a portfolio manager. |
Chris Maher (1972) |
Year of Election or Appointment: 2013 Assistant Treasurer |
| Mr. Maher serves as Assistant Treasurer of other funds. Mr. Maher is Vice President of Valuation Oversight and is an employee of Fidelity Investments. Previously, Mr. Maher served as Vice President of Asset Management Compliance (2013), Vice President of the Program Management Group of FMR (investment adviser firm, 2010-2013), and Vice President of Valuation Oversight (2008-2010). |
Kenneth B. Robins (1969) |
Year of Election or Appointment: 2008 President and Treasurer |
| Mr. Robins also serves as an officer of other funds. Mr. Robins serves as Executive Vice President of Fidelity Investments Money Management, Inc. (FIMM) (investment adviser firm, 2013-present) and is an employee of Fidelity Investments (2004-present). Previously, Mr. Robins served in other fund officer roles. |
Stephen Sadoski (1971) |
Year of Election or Appointment: 2012 Deputy Treasurer |
| Mr. Sadoski also serves as Deputy Treasurer of other funds. He is an employee of Fidelity Investments (2012-present) and has served in another fund officer role. Prior to joining Fidelity Investments, Mr. Sadoski served as an assistant chief accountant in the Division of Investment Management of the Securities and Exchange Commission (SEC) (2009-2012) and as a senior manager at Deloitte & Touche LLP (1997-2009). |
Stacie M. Smith (1974) |
Year of Election or Appointment: 2013 Deputy Treasurer |
| Ms. Smith also serves as an officer of other funds. She is an employee of Fidelity Investments (2009-present) and has served in other fund officer roles. Prior to joining Fidelity Investments, Ms. Smith served as Senior Audit Manager of Ernst & Young LLP (1996-2009). |
Renee Stagnone (1975) |
Year of Election or Appointment: 2013 Deputy Treasurer |
| Ms. Stagnone also serves as Deputy Treasurer of other funds. Ms. Stagnone is an employee of Fidelity Investments. |
Linda J. Wondrack (1964) |
Year of Election or Appointment: 2014 Chief Compliance Officer |
| Ms. Wondrack also serves as Chief Compliance Officer of other funds. Ms. Wondrack is Executive Vice President and head of the Ethics Office and Asset Management Compliance for Fidelity Investments (2012-present). Ms. Wondrack also serves as Chief Compliance Officer of Fidelity SelectCo, LLC (investment adviser firm, 2014-present); Chief Compliance Officer of Impresa Management LLC (2013-present); and Chief Compliance Officer of FMR Co., Inc. (investment adviser firm), Fidelity Investments Money Management, Inc. (investment adviser firm), Fidelity Management & Research (Japan) Limited (investment adviser firm), FMR Investment Management (U.K.) Limited (investment adviser firm), Fidelity Management & Research (Hong Kong) (investment adviser firm), Fidelity Management & Research Company (investment adviser firm), Pyramis Global Advisors, LLC (investment adviser firm), and Strategic Advisers, Inc. (investment adviser firm), Ballyrock Investment Advisors LLC, and Northern Neck Investors LLC (2012-present). Previously, Ms. Wondrack served as Senior Vice President and Chief Compliance Officer for Columbia Management Investment Advisers, LLC (2005-2012); Chief Compliance Officer for certain funds within the Columbia Family of Funds (2007-2012); and Senior Vice President of Compliance Risk Management at Bank of America (2005-2010). |
Joseph F. Zambello (1957) |
Year of Election or Appointment: 2011 Deputy Treasurer |
| Mr. Zambello also serves as Deputy Treasurer of other funds. Mr. Zambello is an employee of Fidelity Investments. Previously, Mr. Zambello served as Vice President of the Program Management Group of FMR (investment adviser firm, 2009-2011) and Vice President of the Transfer Agent Oversight Group (2005-2009). |
Annual Report
The Board of Trustees of Fidelity Advisor Real Estate Income Fund voted to pay to shareholders of record at the opening of business, the following distributions per share derived from capital gains realized from sales of portfolio securities, and dividends derived from net investment income:
| Pay Date | Record Date | Dividends | Capital Gains |
Class A | 09/14/15 | 09/11/15 | $0.120 | $0.102 |
Class T | 09/14/15 | 09/11/15 | $0.119 | $0.102 |
Class C | 09/14/15 | 09/11/15 | $0.099 | $0.102 |
The fund hereby designates as a capital gain dividend with respect to the taxable year ended July 31, 2015, $49,924,038, or, if subsequently determined to be different, the net capital gain of such year.
A total of 0.04% of the dividends distributed during the fiscal year was derived from interest on U.S. Government securities which is generally exempt from state income tax.
The fund will notify shareholders in January 2016 of amounts for use in preparing 2015 income tax returns.
Annual Report
Fidelity Real Estate Income Fund
Each year, the Board of Trustees, including the Independent Trustees (together, the Board), votes on the renewal of the management contract with Fidelity Management & Research Company (FMR) and the sub-advisory agreements (together, the Advisory Contracts) for the fund. The Board, assisted by the advice of fund counsel and Independent Trustees' counsel, requests and considers a broad range of information relevant to the renewal of the Advisory Contracts throughout the year.
The Board meets regularly and, at each of its meetings, covers an extensive agenda of topics and materials and considers factors that are relevant to its annual consideration of the renewal of the fund's Advisory Contracts, including the services and support provided to the fund and its shareholders. The Board has established various standing committees (Committees), each composed of and chaired by Independent Trustees with varying backgrounds, to which the Board has assigned specific subject matter responsibilities in order to enhance effective decision-making by the Board. The Board, acting directly and through its Committees, requests and receives information concerning the annual consideration of the renewal of the fund's Advisory Contracts. The Board also meets as needed to consider matters specifically related to the Board's annual consideration of the renewal of the Advisory Contracts. Members of the Board may also meet with trustees of other Fidelity funds through ad hoc joint committees to discuss certain matters relevant to all of the Fidelity funds.
At its July 2015 meeting, the Board unanimously determined to renew the fund's Advisory Contracts. In reaching its determination, the Board considered all factors it believed relevant, including (i) the nature, extent, and quality of the services to be provided to the fund and its shareholders (including the investment performance of the fund); (ii) the competitiveness of the fund's management fee and total expense ratio relative to peer funds; (iii) the total costs of the services to be provided by and the profits to be realized by Fidelity from its relationship with the fund; and (iv) the extent to which (if any) economies of scale exist and would be realized as the fund grows, and whether any economies of scale are appropriately shared with fund shareholders.
In considering whether to renew the Advisory Contracts for the fund, the Board reached a determination, with the assistance of fund counsel and Independent Trustees' counsel and through the exercise of its business judgment, that the renewal of the Advisory Contracts was in the best interests of the fund and its shareholders and that the compensation payable under the Advisory Contracts was fair and reasonable. The Board's decision to renew the Advisory Contracts was not based on any single factor, but rather was based on a comprehensive consideration of all the information provided to the Board at its meetings throughout the year. The Board, in reaching its determination to renew the Advisory Contracts, was aware that shareholders of the fund have a broad range of investment choices available to them, including a wide choice among funds offered by Fidelity's competitors, and that the fund's shareholders, who have the opportunity to review and weigh the disclosure provided by the fund in its prospectus and other public disclosures, have chosen to invest in this fund, which is part of the Fidelity family of funds.
Annual Report
Board Approval of Investment Advisory Contracts and
Management Fees - continued
Nature, Extent, and Quality of Services Provided. The Board considered Fidelity's staffing as it relates to the fund, including the backgrounds of investment personnel of Fidelity, and also considered the fund's investment objective, strategies, and related investment philosophy. The Independent Trustees also had discussions with senior management of Fidelity's investment operations and investment groups. The Board considered the structure of the portfolio manager compensation program and whether this structure provides appropriate incentives to act in the best interests of the fund. Additionally, the Board considered the portfolio managers' investments, if any, in the funds that they manage.
Resources Dedicated to Investment Management and Support Services. The Board and the Fund Oversight and Research Committees reviewed the general qualifications and capabilities of Fidelity's investment staff, including its size, education, experience, and resources, as well as Fidelity's approach to recruiting, training, managing, and compensating investment personnel. The Board noted that Fidelity has continued to increase the resources devoted to non-U.S. offices, including expansion of Fidelity's global investment organization. The Board also noted that Fidelity's analysts have extensive resources, tools and capabilities that allow them to conduct sophisticated quantitative and fundamental analysis, as well as credit analysis of issuers, counterparties and guarantors. Further, the Board considered that Fidelity's investment professionals have sufficient access to global information and data so as to provide competitive investment results over time, and that those professionals also have access to sophisticated tools that permit them to assess portfolio construction and risk and performance attribution characteristics continuously, as well as to transmit new information and research conclusions rapidly around the world. Additionally, in its deliberations, the Board considered Fidelity's trading, risk management, and compliance capabilities and resources, which are integral parts of the investment management process.
Shareholder and Administrative Services. The Board considered (i) the nature, extent, quality, and cost of advisory, administrative, and shareholder services performed by FMR, the sub-advisers (together with FMR, the Investment Advisers), and their affiliates under the Advisory Contracts and under separate agreements covering transfer agency, pricing and bookkeeping, and securities lending services for the fund; (ii) the nature and extent of the supervision of third party service providers, principally custodians and subcustodians; and (iii) the resources devoted to, and the record of compliance with, the fund's compliance policies and procedures. The Board also reviewed the allocation of fund brokerage, including allocations to brokers affiliated with the Investment Advisers, the use of brokerage commissions to pay fund expenses, and the use of "soft" commission dollars to pay for research services.
Annual Report
The Board noted that the growth of fund assets over time across the complex allows Fidelity to reinvest in the development of services designed to enhance the value or convenience of the Fidelity funds as investment vehicles. These services include 24-hour access to account information and market information through telephone representatives and over the Internet, investor education materials and asset allocation tools, and the expanded availability of Fidelity Investor Centers.
In 2014, the Board formed an ad hoc Committee on Transfer Agency Fees to review the variety of transfer agency fee structures throughout the industry and Fidelity's competitive positioning with respect to industry participants.
Investment in a Large Fund Family. The Board considered the benefits to shareholders of investing in a Fidelity fund, including the benefits of investing in a fund that is part of a large family of funds offering a variety of investment disciplines and providing a large variety of mutual fund investor services. The Board noted that Fidelity had taken, or had made recommendations that resulted in the Fidelity funds taking, a number of actions over the previous year that benefited particular funds, including (i) continuing to dedicate additional resources to investment research and to the support of the senior management team that oversees asset management; (ii) continuing efforts to enhance Fidelity's global research capabilities; (iii) launching new funds and making other enhancements to meet client needs; (iv) reducing management fees and total expenses for certain index funds and diversified international funds; (v) continuing to launch dedicated lower cost underlying funds to meet portfolio construction needs related to expanding underlying fund options for Fidelity funds of funds, specifically for the Freedom Fund product lines; (vi) rationalizing product lines and gaining increased efficiencies through fund mergers; (vii) launching active fixed-income exchange-traded funds; (viii) continuing to develop, acquire and implement systems and technology to improve services to the funds and information security and to increase efficiency; (ix) implementing investment enhancements to further strengthen Fidelity's target date product line to increase investors' probability of success in achieving their goals; (x) modifying the eligibility criteria for certain share classes to accommodate roll-over assets from employer-sponsored retirement plans; (xi) launching a new Class W of the Freedom Index Funds to attract and retain Fidelity record-kept retirement plan assets; and (xii) implementing changes to Fidelity's money market product line in response to recent money market regulatory reforms.
Investment Performance. The Board considered whether the fund has operated in accordance with its investment objective, as well as its record of compliance with its investment restrictions and its performance history.
Annual Report
Board Approval of Investment Advisory Contracts and
Management Fees - continued
The Board took into account discussions with representatives of the Investment Advisers about fund investment performance that occur at Board meetings throughout the year. In this regard the Board noted that as part of regularly scheduled fund reviews and other reports to the Board on fund performance, the Board considers annualized return information for the fund, for different time periods, measured against a securities market index ("benchmark index") and a peer group of funds with similar objectives ("peer group"), if any. In its evaluation of fund investment performance, the Board gave particular attention to information indicating changes in performance of certain Fidelity funds for specific time periods and discussed with the Investment Advisers the reasons for any overperformance or underperformance.
In addition to reviewing absolute and relative fund performance, the Independent Trustees periodically consider the appropriateness of fund performance metrics in evaluating the results achieved. In general, the Independent Trustees believe that fund performance should be evaluated based on net performance (after fees and expenses) of both the highest performing and lowest performing fund share classes, where applicable, compared to appropriate benchmark indices, over appropriate time periods that may include full market cycles, and compared to peer groups, as applicable, over the same periods, taking into account relevant factors including the following: general market conditions; issuer-specific information; and fund cash flows and other factors.
The Independent Trustees recognize that shareholders evaluate performance on a net basis over their own holding periods, for which one-, three-, and five-year periods are often used as a proxy. For this reason, the performance information reviewed by the Board also included net cumulative calendar year total return information for the fund and an appropriate benchmark index and peer group for the most recent one-, three-, and five-year periods, as shown below. Returns are shown compared to the 25th percentile (top of box, 75% beaten) and 75th percentile (bottom of box, 25% beaten) of the peer universe.
Annual Report
Fidelity Real Estate Income Fund

Based on its review, the Board concluded that the nature, extent, and quality of services provided to the fund under the Advisory Contracts should benefit the shareholders of the fund.
Competitiveness of Management Fee and Total Expense Ratio. The Board considered the fund's management fee and total expense ratio compared to "mapped groups" of competitive funds and classes created for the purpose of facilitating the Trustees' competitive analysis of management fees and total expenses. Fidelity creates "mapped groups" by combining similar Lipper investment objective categories that have comparable investment mandates. Combining Lipper investment objective categories aids the Board's management fee and total expense ratio comparisons by broadening the competitive group used for comparison.
Management Fee. The Board considered two proprietary management fee comparisons for the 12-month periods shown in basis points (BP) in the chart below. The group of Lipper funds used by the Board for management fee comparisons is referred to below as the "Total Mapped Group." The Total Mapped Group is broader than the Lipper peer group used by the Board for performance comparisons because the Total Mapped Group combines several Lipper investment objective categories while the Lipper peer group does not. The Total Mapped Group comparison focuses on a fund's standing in terms of gross management fees before expense reimbursements or caps relative to the total universe of funds with comparable investment mandates, regardless of whether their management fee structures also are comparable. Funds with comparable investment mandates offer exposure to similar types of securities. Funds with comparable management fee structures have similar management fee contractual arrangements (e.g., flat rate charged for advisory services, all-inclusive fee rate, etc.). "TMG %" represents the percentage of funds in the Total Mapped Group that had management fees that were lower than the fund's. For example, a hypothetical TMG % of 20% would mean that 80% of the funds in the Total Mapped Group had higher, and 20% had lower, management fees than the fund. The fund's actual TMG %s and the number of funds in the Total Mapped Group are in the chart below. The "Asset-Size Peer Group" (ASPG) comparison focuses on a fund's standing relative to a subset of non-Fidelity funds within the Total Mapped Group that are similar in size and management fee structure without taking into account performance adjustments, if any. For example, if a fund is in the first quartile of the ASPG, the fund's management fee ranks in the least expensive or lowest 25% of funds in the ASPG. The ASPG represents at least 15% of the funds in the Total Mapped Group with comparable asset size and management fee structures, subject to a minimum of 50 funds (or all funds in the Total Mapped Group if fewer than 50). Additional information, such as the ASPG quartile in which the fund's management fee rate ranked, is also included in the chart and considered by the Board.
Annual Report
Board Approval of Investment Advisory Contracts and
Management Fees - continued
Fidelity Real Estate Income Fund

The Board noted that the fund's management fee rate ranked below the median of its Total Mapped Group and below the median of its ASPG for 2014.
The Board noted that, in 2014, the ad hoc Committee on Group Fee was formed by it and other Fidelity fund boards to conduct an in-depth review of the "group fee" component of the management fee of funds with such management fee structures. Committee focus included the mechanics of the group fee, the competitive landscape of group fee structures, Fidelity funds with no group fee component and investment products not included in group fee assets. The Board also considered that, for funds subject to the group fee, FMR agreed to voluntarily waive fees over a specified period of time in amounts designed to account for assets converted from certain funds to certain collective investment trusts.
Annual Report
The Board also noted that, in 2013, the ad hoc Committee on Management Fees was formed to conduct an in-depth review of the management fee rates of Fidelity's active equity mutual funds. The Committee focused on the following areas: (i) standard fee structures; (ii) research consumption and trading evolution; (iii) management fee competitiveness/profitability by category; and (iv) factors that drive institutional pricing.
Based on its review, the Board concluded that the fund's management fee is fair and reasonable in light of the services that the fund receives and the other factors considered.
Total Expense Ratio. In its review of each class's total expense ratio, the Board considered the fund's management fee as well as other fund or class expenses, as applicable, such as transfer agent fees, pricing and bookkeeping fees, and custodial, legal, and audit fees. The Board also noted that Fidelity may agree to waive fees and expenses from time to time, and the extent to which, if any, it has done so for the fund. As part of its review, the Board also considered the current and historical total expense ratios of each class of the fund compared to competitive fund median expenses. Each class of the fund is compared to those funds and classes in the Total Mapped Group (used by the Board for management fee comparisons) that have a similar sales load structure.
The Board noted that the total expense ratio of each class ranked below its competitive median for 2014.
Fees Charged to Other Fidelity Clients. The Board also considered Fidelity fee structures and other information with respect to clients of Fidelity, such as other funds advised or subadvised by Fidelity, pension plan clients, and other institutional clients with similar mandates. The Board noted the findings of the 2013 ad hoc joint committee (created with the board of other Fidelity funds), which reviewed and compared Fidelity's institutional investment advisory business with its business of providing services to the Fidelity funds, including the differences in services provided, fees charged, and costs incurred, as well as competition in their respective marketplaces.
Based on its review of total expense ratios and fees charged to other Fidelity clients, the Board concluded that the total expense ratio of each class of the fund was reasonable in light of the services that the fund and its shareholders receive and the other factors considered.
Annual Report
Board Approval of Investment Advisory Contracts and
Management Fees - continued
Costs of the Services and Profitability. The Board considered the revenues earned and the expenses incurred by Fidelity in conducting the business of developing, marketing, distributing, managing, administering and servicing the fund and servicing the fund's shareholders. The Board also considered the level of Fidelity's profits in respect of all the Fidelity funds.
On an annual basis, Fidelity presents to the Board information about the profitability of its relationship with the fund. Fidelity calculates profitability information for each fund, as well as aggregate profitability information for groups of Fidelity funds and all Fidelity funds, using a series of detailed revenue and cost allocation methodologies which originate with the books and records of Fidelity on which Fidelity's audited financial statements are based. The Audit Committee of the Board reviews any significant changes from the prior year's methodologies.
PricewaterhouseCoopers LLP (PwC), independent registered public accounting firm and auditor to Fidelity and certain Fidelity funds, has been engaged annually by the Board as part of the Board's assessment of Fidelity's profitability analysis. PwC's engagement includes the review and assessment of the methodologies used by Fidelity in determining the revenues and expenses attributable to Fidelity's mutual fund business, and completion of agreed-upon procedures in respect of the mathematical accuracy of fund profitability and its conformity to established allocation methodologies. After considering PwC's reports issued under the engagement and information provided by Fidelity, the Board concluded that while other allocation methods may also be reasonable, Fidelity's profitability methodologies are reasonable in all material respects.
The Board also reviewed Fidelity's non-fund businesses and fall-out benefits related to the mutual fund business as well as cases where Fidelity's affiliates may benefit from or be related to the fund's business.
The Board considered the costs of the services provided by and the profits realized by Fidelity in connection with the operation of the fund and was satisfied that the profitability was not excessive.
Economies of Scale. The Board considered whether there have been economies of scale in respect of the management of the Fidelity funds, whether the Fidelity funds (including the fund) have appropriately benefited from any such economies of scale, and whether there is potential for realization of any further economies of scale. The Board considered the extent to which the fund will benefit from economies of scale as assets grow through increased services to the fund, through waivers or reimbursements, or through fee or expense ratio reductions. The Board also noted that in 2013, it and the boards of other Fidelity funds created an ad hoc committee (the Economies of Scale Committee) to analyze whether Fidelity attains economies of scale in respect of the
Annual Report
management and servicing of the Fidelity funds, whether the Fidelity funds have appropriately benefited from such economies of scale, and whether there is potential for realization of any further economies of scale.
The Board recognized that the fund's management contract incorporates a "group fee" structure, which provides for lower group fee rates as total group assets increase, and for higher group fee rates as total group assets decrease (with "group assets" defined to include fund assets under FMR's management plus sector fund assets previously under FMR's management and currently managed by Fidelity SelectCo, LLC). FMR calculates the group fee rates based on a tiered asset "breakpoint" schedule that varies based on asset class. The Board considered that the group fee is designed to deliver the benefits of economies of scale to fund shareholders when total Fidelity fund assets increase, even if assets of any particular fund are unchanged or have declined, because some portion of Fidelity's costs are attributable to services provided to all Fidelity funds, and all funds benefit if those costs can be allocated among more assets. The Board concluded that, given the group fee structure, fund shareholders will benefit from lower management fees as group assets increase at the fund complex level, regardless of whether Fidelity achieves any such economies of scale.
The Board concluded, taking into account the analysis of the Economies of Scale Committee, that economies of scale, if any, are being appropriately shared between fund shareholders and Fidelity.
Additional Information Requested by the Board. In order to develop fully the factual basis for consideration of the Fidelity funds' Advisory Contracts, the Board requested and received additional information on certain topics, including: (i) fund performance trends and Fidelity's long-term strategies for certain funds; (ii) the various share classes employed by Fidelity and the attributes of each class, together with similar information on the distribution and servicing payments made by Fidelity or the funds to third-party participants in the distribution channels; (iii) fund profitability, and fund performance in relation to fund profitability; (iv) the methodology with respect to evaluating competitive fund data and peer group classifications and fee comparisons; (v) annual fund profitability margins, with particular focus on certain funds with negative margins; (vi) the realization of fall-out benefits in certain Fidelity business units; (vii) economies of scale and the way in which they are shared with fund shareholders; (viii) Fidelity's group fee structures, including the group fee schedule of breakpoints; (ix) the impact of cost containment measures on the funds; and (x) the transfer agent fee structure.
Based on its evaluation of all of the conclusions noted above, and after considering all factors it believed relevant, the Board concluded that the advisory fee structures are fair and reasonable, and that the fund's Advisory Contracts should be renewed.
Annual Report
Investment Adviser
Fidelity Management & Research Company
Boston, MA
Investment Sub-Advisers
FMR Co., Inc.
Fidelity Management & Research
(Hong Kong) Limited
Fidelity Management & Research
(Japan) Inc.
FMR Investment Management
(U.K.) Limited
General Distributor
Fidelity Distributors Corporation
Smithfield, RI
Transfer and Service Agents
Fidelity Investments Institutional Operations Company, Inc.
Boston, MA
Fidelity Service Company, Inc.
Boston, MA
Custodian
The Northern Trust Company
Chicago, IL
(Fidelity Investment logo)(registered trademark)
REIA-UANN-0915
1.907548.105
Fidelity®
Series Blue Chip Growth
Fund
Fidelity Series Blue Chip Growth
Fund
Class F
Annual Report
July 31, 2015
(Fidelity Cover Art)
Contents
Performance | (Click Here) | How the fund has done over time. |
Management's Discussion of Fund Performance | (Click Here) | The Portfolio Manager's review of fund performance and strategy. |
Shareholder Expense Example | (Click Here) | An example of shareholder expenses. |
Investment Changes | (Click Here) | A summary of major shifts in the fund's investments over the past six months. |
Investments | (Click Here) | A complete list of the fund's investments with their market values. |
Financial Statements | (Click Here) | Statements of assets and liabilities, operations, and changes in net assets, as well as financial highlights. |
Notes | (Click Here) | Notes to the financial statements. |
Report of Independent Registered Public Accounting Firm | (Click Here) | |
Trustees and Officers | (Click Here) | |
Distributions | (Click Here) | |
Board Approval of Investment Advisory Contracts and Management Fees | (Click Here) | |
To view a fund's proxy voting guidelines and proxy voting record for the 12-month period ended June 30, visit http://www.fidelity.com/proxyvotingresults or visit the Securities and Exchange Commission's (SEC) web site at http://www.sec.gov. You may also call 1-800-544-8544 for Fidelity® Series Blue Chip Growth Fund or 1-800-835-5092 for Class F of the fund to request a free copy of the proxy voting guidelines.
Standard & Poor's, S&P and S&P 500 are registered service marks of The McGraw-Hill Companies, Inc. and have been licensed for use by Fidelity Distributors Corporation.
Other third-party marks appearing herein are the property of their respective owners.
All other marks appearing herein are registered or unregistered trademarks or service marks of FMR LLC or an affiliated company. © 2015 FMR LLC. All rights reserved.
Annual Report
This report and the financial statements contained herein are submitted for the general information of the shareholders of the fund. This report is not authorized for distribution to prospective investors in the fund unless preceded or accompanied by an effective prospectus.
A fund files its complete schedule of portfolio holdings with the SEC for the first and third quarters of each fiscal year on Form N-Q. Forms N-Q are available on the SEC's web site at http://www.sec.gov. A fund's Forms N-Q may be reviewed and copied at the SEC's Public Reference Room in Washington, DC. Information regarding the operation of the SEC's Public Reference Room may be obtained by calling 1-800-SEC-0330. For a complete list of a fund's portfolio holdings, view the most recent holdings listing, semiannual report, or annual report on Fidelity's web site at http://www.fidelity.com, http://www.advisor.fidelity.com, or http://www.401k.com, as applicable.
NOT FDIC INSURED • MAY LOSE VALUE • NO BANK GUARANTEE
Neither the fund nor Fidelity Distributors Corporation is a bank.
Annual Report
Average annual total return reflects the change in the value of an investment, assuming reinvestment of the class' distributions from dividend income and capital gains (the profits earned upon the sale of securities that have grown in value, if any) and assuming a constant rate of performance each year. The $10,000 table and the fund's returns do not reflect the deduction of taxes that a shareholder would pay on fund distributions or the redemption of fund shares. During periods of reimbursement by Fidelity, a fund's total return will be greater than it would be had the reimbursement not occurred. How a fund did yesterday is no guarantee of how it will do tomorrow.
Average Annual Total Returns
Periods ended July 31, 2015 | Past 1
year | Life of
fundA |
Series Blue Chip Growth Fund | 20.74% | 19.01% |
Class F | 21.00% | 19.24% |
A From November 7, 2013.
$10,000 Over Life of Fund
Let's say hypothetically that $10,000 was invested in Fidelity ® Series Blue Chip Growth Fund, a class of the fund, on November 7, 2013, when the fund started. The chart shows how the value of your investment would have changed, and also shows how the Russell 1000® Growth Index performed over the same period.
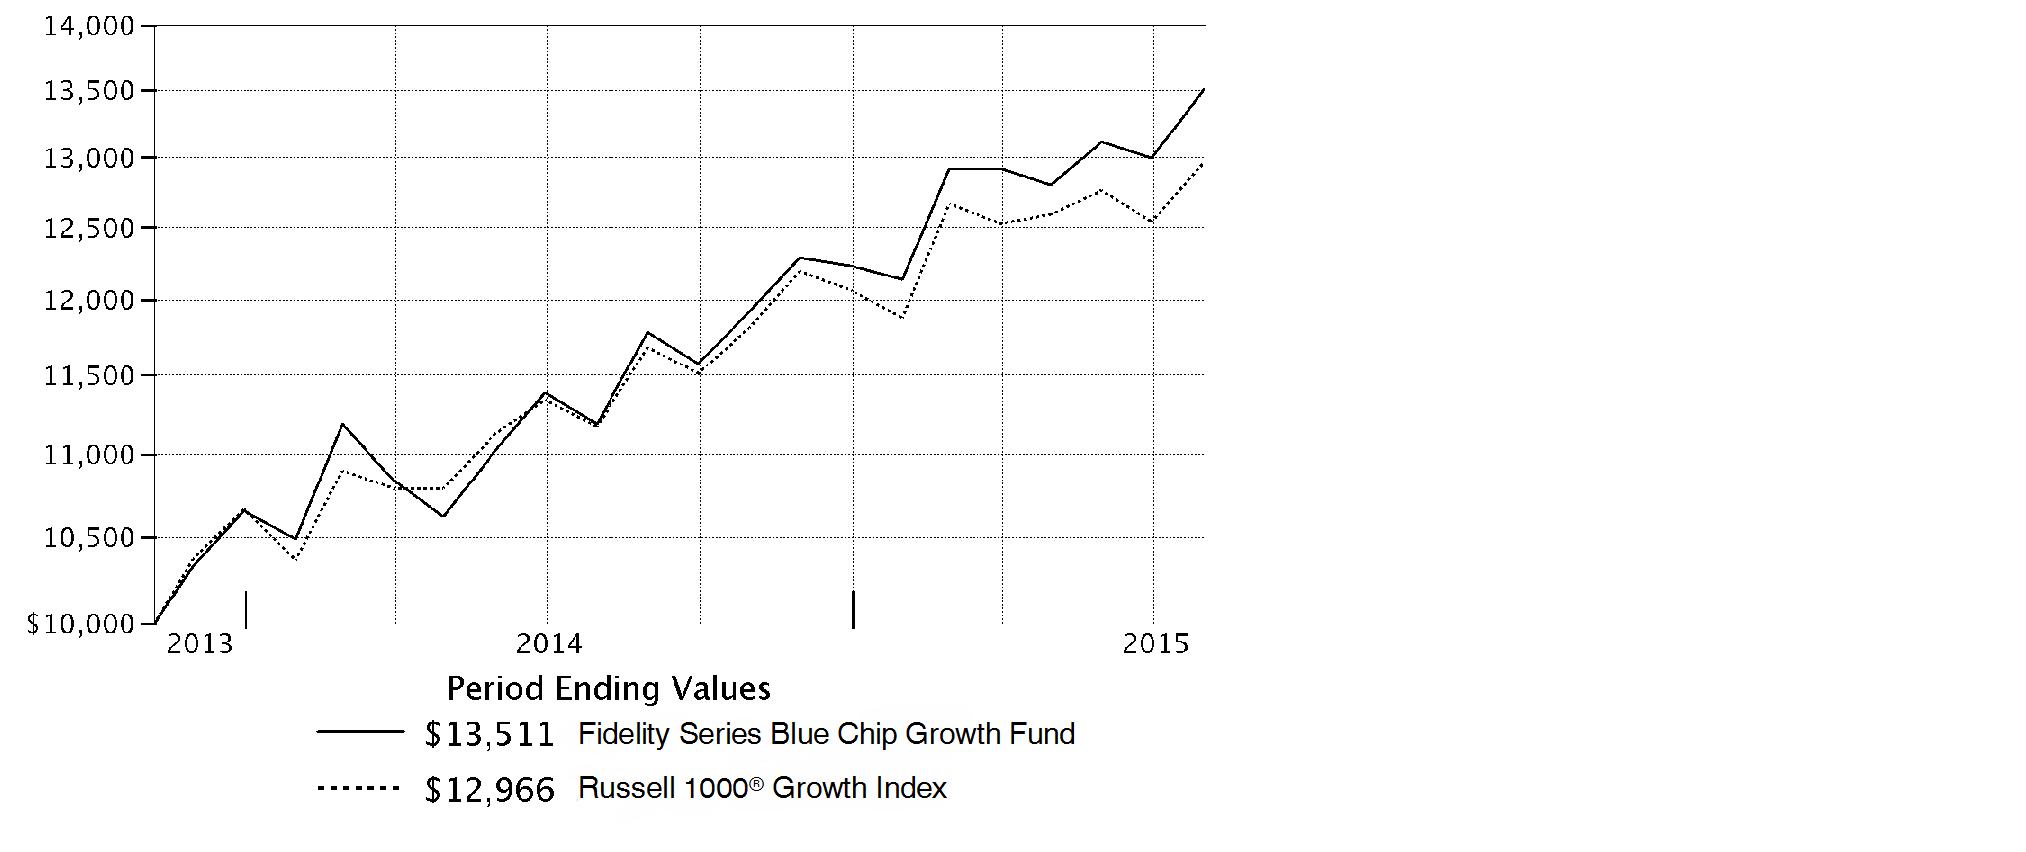
Annual Report
Market Recap: The U.S. equity market gained strongly for the 12 months ending July 31, 2015, as stocks recovered from volatility in late 2014 and early 2015, supported by a still-positive economic backdrop. The S&P 500® Index returned 11.21%, with growth stocks in the index far outpacing value-oriented names on prospects for continued U.S. economic growth. Consequently, the growth-oriented Nasdaq Composite Index® rose 18.71%, outpacing the broader S&P 500®, as well as the 12.03% advance of the smaller-cap Russell 2000® Index. Within the S&P 500®, seven of 10 sectors notched a gain, with significant performance variation. Health care (+27%) led the way, aided by merger activity. Consumer discretionary (+24%) benefited from spending linked to a seven-year low in unemployment. Strong first halves for the consumer staples sector and the real estate segment of financials yielded above-market returns (19% and 12%, respectively) for the full-year period. Conversely, energy (-26%) significantly lagged, due to a roughly 55% decline for U.S. crude-oil prices. Materials (-4%) also lost ground. At period end, investors remained focused on the slowing rate of U.S. earnings growth, the possible effect of a relatively stronger U.S. dollar on exports and inflation, and whether an economic slowdown in China would create ripples for the global economy.
Comments from Portfolio Manager Sonu Kalra: For the year, the fund's share classes handily outperformed the 16.08% gain of the benchmark Russell 1000® Growth Index. (For specific class-level results, please see the Performance section of this report.) Versus the benchmark, both stock selection and sector positioning provided a strong lift. Picks within information technology, health care and consumer discretionary were particularly helpful. The last category produced the largest individual contributor for the year: e-commerce giant Amazon.com. The fund held a substantial overweighting in the stock, which also was one of the fund's largest holdings. Strong first-quarter revenue growth of 15%, as well as profitability that exceeded investors' expectations, helped to lift the stock. In addition, for the first time Amazon provided financials for its decade-old cloud division, which included revenue growth of nearly 50% from the same period a year earlier. The firm also reported that it was on pace to generate at least $5 billion in sales this year. Turning to detractors, picks in consumer staples dragged on results the most, especially an overweighting in Keurig Green Mountain. The stock was hurt by lower-than-expected revenue related to a double-digit sales slide for its home-brewing machines. In addition, Keurig announced downside earnings guidance for consecutive quarters.
The views expressed above reflect those of the portfolio manager(s) only through the end of the period as stated on the cover of this report and do not necessarily represent the views of Fidelity or any other person in the Fidelity organization. Any such views are subject to change at any time based upon market or other conditions and Fidelity disclaims any responsibility to update such views. These views may not be relied on as investment advice and, because investment decisions for a Fidelity fund are based on numerous factors, may not be relied on as an indication of trading intent on behalf of any Fidelity fund.
Annual Report
Shareholder Expense Example
As a shareholder of the Fund, you incur two types of costs: (1) transaction costs and (2) ongoing costs, including management fees and other Fund expenses. This Example is intended to help you understand your ongoing costs (in dollars) of investing in the Fund and to compare these costs with the ongoing costs of investing in other mutual funds.
The Example is based on an investment of $1,000 invested at the beginning of the period and held for the entire period (February 1, 2015 to July 31, 2015).
Actual Expenses
The first line of the accompanying table for each class of the Fund provides information about actual account values and actual expenses. You may use the information in this line, together with the amount you invested, to estimate the expenses that you paid over the period. Simply divide your account value by $1,000.00 (for example, an $8,600 account value divided by $1,000.00 = 8.6), then multiply the result by the number in the first line for a class of the Fund under the heading entitled "Expenses Paid During Period" to estimate the expenses you paid on your account during this period. In addition, the Fund, as a shareholder in the underlying Fidelity Central Funds, will indirectly bear its pro-rata share of the fees and expenses incurred by the underlying Fidelity Central Funds. These fees and expenses are not included in the Fund's annualized expense ratio used to calculate the expense estimate in the table below.
Hypothetical Example for Comparison Purposes
The second line of the accompanying table for each class of the Fund provides information about hypothetical account values and hypothetical expenses based on a Class' actual expense ratio and an assumed rate of return of 5% per year before expenses, which is not the Class' actual return. The hypothetical account values and expenses may not be used to estimate the actual ending account balance or expenses you paid for the period. You may use this information to compare the ongoing costs of investing in the Fund and other funds. To do so, compare this 5% hypothetical example with the 5% hypothetical examples that appear in the shareholder reports of the other funds. In addition, the Fund, as a shareholder in the underlying Fidelity Central Funds, will indirectly bear its pro-rata share of the fees and expenses incurred by the underlying Fidelity Central Funds. These fees and expenses are not included in the Fund's annualized expense ratio used to calculate the expense estimate in the table below.
Please note that the expenses shown in the table are meant to highlight your ongoing costs only and do not reflect any transaction costs. Therefore, the second line of the table is useful in comparing ongoing costs only, and will not help you determine the relative total costs of owning different funds.
Annual Report
| Annualized
Expense Ratio B | Beginning
Account Value
February 1, 2015 | Ending
Account Value
July 31, 2015 | Expenses Paid
During Period*
February 1, 2015
to July 31, 2015 |
Series Blue Chip Growth | .81% | | | |
Actual | | $ 1,000.00 | $ 1,113.30 | $ 4.24 |
HypotheticalA | | $ 1,000.00 | $ 1,020.78 | $ 4.06 |
Class F | .66% | | | |
Actual | | $ 1,000.00 | $ 1,115.00 | $ 3.46 |
HypotheticalA | | $ 1,000.00 | $ 1,021.52 | $ 3.31 |
A 5% return per year before expenses
B Annualized expense ratio reflects expenses net of applicable fee waivers.
* Expenses are equal to each Class' annualized expense ratio, multiplied by the average account value over the period, multiplied by 181/365 (to reflect the one-half year period).
Annual Report
Investment Changes (Unaudited)
Top Ten Stocks as of July 31, 2015 |
| % of fund's
net assets | % of fund's net assets
6 months ago |
Apple, Inc. | 6.2 | 6.6 |
Google, Inc. Class A | 4.9 | 2.7 |
Amazon.com, Inc. | 3.8 | 3.0 |
Facebook, Inc. Class A | 3.0 | 2.5 |
Gilead Sciences, Inc. | 2.1 | 2.6 |
The Walt Disney Co. | 1.9 | 1.5 |
Salesforce.com, Inc. | 1.8 | 1.4 |
Visa, Inc. Class A | 1.8 | 1.7 |
Allergan PLC | 1.8 | 1.6 |
Home Depot, Inc. | 1.7 | 1.9 |
| 29.0 | |
Top Five Market Sectors as of July 31, 2015 |
| % of fund's
net assets | % of fund's net assets
6 months ago |
Information Technology | 34.5 | 33.4 |
Consumer Discretionary | 24.9 | 23.4 |
Health Care | 18.4 | 16.8 |
Consumer Staples | 9.6 | 9.7 |
Industrials | 5.5 | 8.4 |
Asset Allocation (% of fund's net assets) |
As of July 31, 2015* | As of January 31, 2015** |
 | Stocks 97.3% | |  | Stocks 98.5% | |
 | Convertible
Securities 2.6% | |  | Convertible
Securities 1.5% | |
 | Short-Term
Investments and
Net Other Assets (Liabilities) 0.1% | |  | Short-Term
Investments and
Net Other Assets (Liabilities) 0.0%† | |
* Foreign investments | 12.3% | | ** Foreign investments | 11.6% | |
† Amount represents less than 0.1% |

Annual Report
Investments July 31, 2015
Showing Percentage of Net Assets
Common Stocks - 97.3% |
| Shares | | Value |
CONSUMER DISCRETIONARY - 24.7% |
Auto Components - 0.1% |
Magna International, Inc. Class A (sub. vtg.) | 158,250 | | $ 8,598,268 |
Automobiles - 1.3% |
General Motors Co. | 160,100 | | 5,044,751 |
Renault SA | 78,400 | | 7,213,693 |
Tesla Motors, Inc. (a)(d) | 298,037 | | 79,322,548 |
| | 91,580,992 |
Diversified Consumer Services - 0.0% |
2U, Inc. (a) | 11,700 | | 375,453 |
Houghton Mifflin Harcourt Co. (a) | 71,900 | | 1,878,747 |
| | 2,254,200 |
Hotels, Restaurants & Leisure - 5.2% |
Buffalo Wild Wings, Inc. (a) | 159,114 | | 31,119,516 |
Chipotle Mexican Grill, Inc. (a) | 85,400 | | 63,386,442 |
Dave & Buster's Entertainment, Inc. | 289,500 | | 11,232,600 |
Domino's Pizza, Inc. | 129,500 | | 14,742,280 |
Hilton Worldwide Holdings, Inc. | 606,500 | | 16,284,525 |
Las Vegas Sands Corp. | 93,900 | | 5,262,156 |
McDonald's Corp. | 804,000 | | 80,287,440 |
Panera Bread Co. Class A (a) | 48,144 | | 9,827,153 |
Papa John's International, Inc. | 149,700 | | 11,311,332 |
Starbucks Corp. | 1,541,320 | | 89,288,668 |
Starwood Hotels & Resorts Worldwide, Inc. | 33,100 | | 2,630,126 |
Whitbread PLC | 100,307 | | 8,129,846 |
Wingstop, Inc. | 70,900 | | 2,430,452 |
Yum! Brands, Inc. | 128,700 | | 11,294,712 |
Zoe's Kitchen, Inc. (a)(d) | 119,000 | | 5,337,150 |
| | 362,564,398 |
Household Durables - 1.7% |
D.R. Horton, Inc. | 355,500 | | 10,554,795 |
GoPro, Inc. Class A (a)(d) | 548,600 | | 34,068,060 |
Jarden Corp. (a) | 200,800 | | 11,044,000 |
Sony Corp. (a) | 535,900 | | 15,190,848 |
Sony Corp. sponsored ADR (a) | 275,500 | | 7,810,425 |
Tempur Sealy International, Inc. (a) | 58,400 | | 4,412,120 |
TRI Pointe Homes, Inc. (a) | 375,900 | | 5,563,320 |
Whirlpool Corp. | 149,500 | | 26,570,635 |
| | 115,214,203 |
Internet & Catalog Retail - 5.6% |
Amazon.com, Inc. (a) | 494,780 | | 265,276,297 |
Common Stocks - continued |
| Shares | | Value |
CONSUMER DISCRETIONARY - continued |
Internet & Catalog Retail - continued |
Ctrip.com International Ltd. sponsored ADR (a) | 114,743 | | $ 8,213,304 |
Groupon, Inc. Class A (a)(d) | 3,186,600 | | 15,359,412 |
JD.com, Inc. sponsored ADR (a) | 157,100 | | 5,189,013 |
Jumei International Holding Ltd. sponsored ADR (a) | 98,800 | | 1,848,548 |
MakeMyTrip Ltd. (a) | 78,500 | | 1,146,100 |
Netflix, Inc. (a) | 272,446 | | 31,143,302 |
Priceline Group, Inc. (a) | 36,400 | | 45,265,948 |
The Honest Co., Inc. (g) | 71,609 | | 3,276,470 |
Vipshop Holdings Ltd. ADR (a) | 356,850 | | 6,955,007 |
| | 383,673,401 |
Leisure Products - 0.1% |
Hasbro, Inc. | 26,400 | | 2,078,736 |
MCBC Holdings, Inc. | 25,100 | | 384,030 |
Spin Master Corp. (a) | 148,900 | | 2,076,642 |
| | 4,539,408 |
Media - 2.2% |
Comcast Corp. Class A | 63,000 | | 3,931,830 |
DreamWorks Animation SKG, Inc. Class A (a)(d) | 55,300 | | 1,333,283 |
Liberty Global PLC Class C (a) | 26,500 | | 1,302,210 |
Liberty LiLac Group Class C (a) | 1,440 | | 61,272 |
Live Nation Entertainment, Inc. (a) | 29,200 | | 765,624 |
Naspers Ltd. Class N | 64,200 | | 8,982,747 |
Starz Series A (a) | 89,300 | | 3,612,185 |
The Walt Disney Co. | 1,102,817 | | 132,338,040 |
| | 152,327,191 |
Multiline Retail - 1.3% |
B&M European Value Retail S.A. | 1,451,607 | | 8,086,040 |
Burlington Stores, Inc. (a) | 141,000 | | 7,760,640 |
Dollar Tree, Inc. (a) | 195,000 | | 15,215,850 |
Ollie's Bargain Outlet Holdings, Inc. | 27,100 | | 531,702 |
Target Corp. | 681,741 | | 55,800,501 |
| | 87,394,733 |
Specialty Retail - 4.7% |
Abercrombie & Fitch Co. Class A | 33,900 | | 681,051 |
Advance Auto Parts, Inc. | 4,700 | | 818,787 |
Boot Barn Holdings, Inc. | 62,400 | | 1,971,840 |
Finish Line, Inc. Class A | 78,800 | | 2,166,212 |
Five Below, Inc. (a) | 245,300 | | 9,044,211 |
H&M Hennes & Mauritz AB (B Shares) | 85,069 | | 3,384,320 |
Common Stocks - continued |
| Shares | | Value |
CONSUMER DISCRETIONARY - continued |
Specialty Retail - continued |
Home Depot, Inc. | 1,002,300 | | $ 117,299,169 |
Inditex SA | 184,686 | | 6,323,269 |
L Brands, Inc. | 303,514 | | 24,499,650 |
Michaels Companies, Inc. (a) | 181,700 | | 4,604,278 |
Office Depot, Inc. (a) | 149,800 | | 1,198,400 |
Restoration Hardware Holdings, Inc. (a)(d) | 789,618 | | 80,114,642 |
Ross Stores, Inc. | 395,376 | | 21,018,188 |
Signet Jewelers Ltd. | 17,000 | | 2,060,740 |
Staples, Inc. | 85,900 | | 1,263,589 |
Tiffany & Co., Inc. | 63,200 | | 6,048,240 |
TJX Companies, Inc. | 511,400 | | 35,705,948 |
Ulta Salon, Cosmetics & Fragrance, Inc. (a) | 52,800 | | 8,766,384 |
| | 326,968,918 |
Textiles, Apparel & Luxury Goods - 2.5% |
Columbia Sportswear Co. | 256,400 | | 18,342,856 |
Crocs, Inc. (a) | 315,300 | | 4,959,669 |
G-III Apparel Group Ltd. (a) | 104,800 | | 7,569,704 |
Hanesbrands, Inc. | 344,300 | | 10,683,629 |
Kate Spade & Co. (a) | 93,956 | | 1,890,395 |
lululemon athletica, Inc. (a) | 382,523 | | 24,045,396 |
NIKE, Inc. Class B | 283,200 | | 32,630,304 |
PVH Corp. | 140,800 | | 16,338,432 |
Skechers U.S.A., Inc. Class A (sub. vtg.) (a) | 259,500 | | 39,041,775 |
Tory Burch LLC unit (f)(g) | 106,817 | | 7,600,030 |
Under Armour, Inc. Class A (sub. vtg.) (a) | 89,400 | | 8,880,102 |
| | 171,982,292 |
TOTAL CONSUMER DISCRETIONARY | | 1,707,098,004 |
CONSUMER STAPLES - 9.4% |
Beverages - 2.4% |
Anheuser-Busch InBev SA NV ADR | 120,500 | | 14,405,775 |
Coca-Cola Bottling Co. Consolidated | 10,400 | | 1,684,800 |
Constellation Brands, Inc. Class A (sub. vtg.) | 75,500 | | 9,061,510 |
Kweichow Moutai Co. Ltd. | 105,820 | | 3,524,578 |
Monster Beverage Corp. (a) | 337,881 | | 51,881,628 |
PepsiCo, Inc. | 307,986 | | 29,674,451 |
The Coca-Cola Co. | 1,310,381 | | 53,830,451 |
| | 164,063,193 |
Common Stocks - continued |
| Shares | | Value |
CONSUMER STAPLES - continued |
Food & Staples Retailing - 2.6% |
Costco Wholesale Corp. | 250,300 | | $ 36,368,590 |
CVS Health Corp. | 533,800 | | 60,036,486 |
Kroger Co. | 871,818 | | 34,210,138 |
Rite Aid Corp. (a) | 549,300 | | 4,894,263 |
Sprouts Farmers Market LLC (a) | 425,823 | | 10,441,180 |
Tesco PLC | 2,310,000 | | 7,768,392 |
United Natural Foods, Inc. (a) | 24,800 | | 1,129,144 |
Wal-Mart de Mexico SA de CV Series V | 526,700 | | 1,279,444 |
Walgreens Boots Alliance, Inc. | 121,300 | | 11,721,219 |
Whole Foods Market, Inc. | 334,360 | | 12,170,704 |
| | 180,019,560 |
Food Products - 2.4% |
Associated British Foods PLC | 321,600 | | 16,191,787 |
Blue Buffalo Pet Products, Inc. | 83,700 | | 2,338,578 |
China Modern Dairy Holdings Ltd. | 3,575,000 | | 1,157,495 |
Edita Food Industries SAE GDR (a)(e) | 48,500 | | 1,081,487 |
Freshpet, Inc. (d) | 140,600 | | 2,322,712 |
Keurig Green Mountain, Inc. | 896,500 | | 67,273,360 |
Mead Johnson Nutrition Co. Class A | 199,900 | | 17,669,161 |
Mondelez International, Inc. | 827,200 | | 37,331,536 |
Pinnacle Foods, Inc. | 18,200 | | 818,090 |
The Hain Celestial Group, Inc. (a) | 218,500 | | 14,853,630 |
WhiteWave Foods Co. (a) | 156,529 | | 8,080,027 |
| | 169,117,863 |
Personal Products - 1.9% |
AMOREPACIFIC Group, Inc. | 27,308 | | 4,555,080 |
Edgewell Personal Care Co. (a) | 105,800 | | 10,126,118 |
Estee Lauder Companies, Inc. Class A | 224,200 | | 19,978,462 |
Herbalife Ltd. (a) | 1,026,438 | | 51,824,855 |
Nu Skin Enterprises, Inc. Class A (d) | 1,047,000 | | 41,513,550 |
| | 127,998,065 |
Tobacco - 0.1% |
Imperial Tobacco Group PLC | 67,743 | | 3,559,862 |
Reynolds American, Inc. | 35,600 | | 3,054,124 |
| | 6,613,986 |
TOTAL CONSUMER STAPLES | | 647,812,667 |
Common Stocks - continued |
| Shares | | Value |
ENERGY - 1.2% |
Energy Equipment & Services - 0.0% |
U.S. Silica Holdings, Inc. (d) | 50,800 | | $ 1,144,016 |
Oil, Gas & Consumable Fuels - 1.2% |
Anadarko Petroleum Corp. | 108,478 | | 8,065,339 |
Cimarex Energy Co. | 128,230 | | 13,351,308 |
Continental Resources, Inc. (a) | 172,664 | | 5,768,704 |
EOG Resources, Inc. | 208,726 | | 16,111,560 |
Memorial Resource Development Corp. (a) | 97,100 | | 1,485,630 |
Noble Energy, Inc. | 124,905 | | 4,400,403 |
PDC Energy, Inc. (a) | 17,400 | | 816,930 |
Pioneer Natural Resources Co. | 108,900 | | 13,805,253 |
Rice Energy, Inc. (a) | 192,000 | | 3,465,600 |
SM Energy Co. | 199,100 | | 7,380,637 |
Whiting Petroleum Corp. (a) | 337,500 | | 6,915,375 |
| | 81,566,739 |
TOTAL ENERGY | | 82,710,755 |
FINANCIALS - 3.9% |
Banks - 2.2% |
Bank of America Corp. | 1,780,900 | | 31,842,492 |
Citigroup, Inc. | 638,789 | | 37,343,605 |
Gree Electric Applicances, Inc. ELS (BNP Paribas Arbitrage Warrant Program) warrants 12/10/15 (e) | 565,800 | | 2,032,771 |
Hangzhou Hikvision Digital Technology Co. Ltd. ELS (BNP Paribas Arbitrage Warrant Program) warrants 11/06/2015 (a)(e) | 1,017,100 | | 5,409,417 |
HDFC Bank Ltd. sponsored ADR | 229,000 | | 14,305,630 |
ICICI Bank Ltd. sponsored ADR | 524,700 | | 5,283,729 |
JPMorgan Chase & Co. | 724,072 | | 49,620,654 |
Regions Financial Corp. | 284,200 | | 2,952,838 |
| | 148,791,136 |
Capital Markets - 1.3% |
Ameriprise Financial, Inc. | 60,662 | | 7,623,394 |
Bank of New York Mellon Corp. | 78,500 | | 3,406,900 |
BlackRock, Inc. Class A | 54,000 | | 18,161,280 |
Charles Schwab Corp. | 229,700 | | 8,011,936 |
Fairfax India Holdings Corp. (a) | 427,900 | | 4,856,665 |
Goldman Sachs Group, Inc. | 7,900 | | 1,620,053 |
Invesco Ltd. | 200,592 | | 7,742,851 |
Morgan Stanley | 404,000 | | 15,691,360 |
Northern Trust Corp. | 72,500 | | 5,545,525 |
Common Stocks - continued |
| Shares | | Value |
FINANCIALS - continued |
Capital Markets - continued |
State Street Corp. | 60,600 | | $ 4,639,536 |
The Blackstone Group LP | 255,600 | | 10,032,300 |
Weifu High-Technology Co. Ltd. ELS (UBS Warrant Programme) warrants 6/17/16 (e) | 664,500 | | 2,691,280 |
| | 90,023,080 |
Consumer Finance - 0.1% |
Springleaf Holdings, Inc. (a) | 78,400 | | 3,959,984 |
Synchrony Financial (d) | 50,100 | | 1,721,436 |
| | 5,681,420 |
Diversified Financial Services - 0.1% |
McGraw Hill Financial, Inc. | 34,700 | | 3,530,725 |
Moody's Corp. | 39,100 | | 4,317,813 |
| | 7,848,538 |
Insurance - 0.0% |
American International Group, Inc. | 12,100 | | 775,852 |
Real Estate Investment Trusts - 0.1% |
Extra Space Storage, Inc. | 84,200 | | 6,190,384 |
Lamar Advertising Co. Class A | 68,700 | | 4,125,435 |
| | 10,315,819 |
Real Estate Management & Development - 0.1% |
Realogy Holdings Corp. (a) | 97,295 | | 4,428,868 |
TOTAL FINANCIALS | | 267,864,713 |
HEALTH CARE - 18.3% |
Biotechnology - 10.8% |
Acceleron Pharma, Inc. (a) | 20,600 | | 589,984 |
Aduro Biotech, Inc. | 32,000 | | 839,040 |
Agios Pharmaceuticals, Inc. (a) | 97,900 | | 10,786,622 |
Alexion Pharmaceuticals, Inc. (a) | 178,304 | | 35,204,342 |
Alkermes PLC (a) | 361,500 | | 25,312,230 |
Alnylam Pharmaceuticals, Inc. (a) | 339,100 | | 43,211,513 |
Amgen, Inc. | 412,198 | | 72,790,045 |
Ascendis Pharma A/S ADR | 125,100 | | 2,505,753 |
Avalanche Biotechnologies, Inc. (a) | 40,500 | | 596,160 |
BioCryst Pharmaceuticals, Inc. (a) | 356,473 | | 5,518,202 |
Biogen, Inc. (a) | 296,400 | | 94,486,392 |
BioMarin Pharmaceutical, Inc. (a) | 98,100 | | 14,349,087 |
bluebird bio, Inc. (a) | 94,500 | | 15,670,935 |
Common Stocks - continued |
| Shares | | Value |
HEALTH CARE - continued |
Biotechnology - continued |
Calithera Biosciences, Inc. | 121,000 | | $ 895,400 |
Catabasis Pharmaceuticals, Inc. | 176,100 | | 2,289,300 |
Celgene Corp. (a) | 622,400 | | 81,690,000 |
Cellectis SA sponsored ADR | 25,300 | | 898,403 |
Chiasma, Inc. | 95,140 | | 2,018,205 |
Chiasma, Inc. | 53,000 | | 1,249,210 |
Chiasma, Inc. warrants (a) | 23,784 | | 346,388 |
Chimerix, Inc. (a) | 31,200 | | 1,676,688 |
China Biologic Products, Inc. (a) | 19,900 | | 2,434,964 |
Cidara Therapeutics, Inc. | 23,100 | | 322,938 |
Coherus BioSciences, Inc. | 126,100 | | 4,423,588 |
DBV Technologies SA sponsored ADR (a) | 38,700 | | 1,686,933 |
Dicerna Pharmaceuticals, Inc. (a) | 78,600 | | 960,492 |
Dyax Corp. (a) | 52,500 | | 1,292,025 |
Esperion Therapeutics, Inc. (a) | 14,600 | | 905,200 |
Exelixis, Inc. (a) | 1,012,000 | | 5,798,760 |
Gilead Sciences, Inc. | 1,204,335 | | 141,942,923 |
Incyte Corp. (a) | 13,500 | | 1,407,780 |
Intercept Pharmaceuticals, Inc. (a) | 51,300 | | 13,533,453 |
Intrexon Corp. (a)(d) | 165,100 | | 10,772,775 |
Ironwood Pharmaceuticals, Inc. Class A (a) | 442,916 | | 4,628,472 |
Isis Pharmaceuticals, Inc. (a) | 62,200 | | 3,416,646 |
Kite Pharma, Inc. (a) | 34,300 | | 2,496,011 |
Merrimack Pharmaceuticals, Inc. (a) | 813,200 | | 8,213,320 |
Neurocrine Biosciences, Inc. (a) | 198,100 | | 9,928,772 |
Novavax, Inc. (a) | 153,100 | | 1,846,386 |
ProNai Therapeutics, Inc. | 97,000 | | 2,657,800 |
Prothena Corp. PLC (a) | 36,100 | | 2,381,517 |
Radius Health, Inc. (a) | 30,500 | | 2,388,760 |
Regeneron Pharmaceuticals, Inc. (a) | 114,680 | | 63,493,729 |
Retrophin, Inc. (a)(d) | 77,900 | | 2,472,546 |
Sage Therapeutics, Inc. | 9,100 | | 622,076 |
Seattle Genetics, Inc. (a) | 141,700 | | 6,783,179 |
Seres Therapeutics, Inc. | 17,900 | | 677,515 |
Spark Therapeutics, Inc. | 7,700 | | 473,088 |
Ultragenyx Pharmaceutical, Inc. (a) | 24,400 | | 2,950,692 |
uniQure B.V. (a) | 146,459 | | 3,771,319 |
Versartis, Inc. (a) | 77,300 | | 1,399,130 |
Vertex Pharmaceuticals, Inc. (a) | 161,900 | | 21,856,500 |
Common Stocks - continued |
| Shares | | Value |
HEALTH CARE - continued |
Biotechnology - continued |
Xencor, Inc. (a) | 37,200 | | $ 832,908 |
ZIOPHARM Oncology, Inc. (a)(d) | 375,608 | | 5,018,123 |
| | 746,714,219 |
Health Care Equipment & Supplies - 0.8% |
Boston Scientific Corp. (a) | 943,200 | | 16,355,088 |
Glaukos Corp. | 63,700 | | 2,025,023 |
Hologic, Inc. (a) | 52,200 | | 2,174,652 |
Intuitive Surgical, Inc. (a) | 36,700 | | 19,567,339 |
Invuity, Inc. | 171,200 | | 2,016,736 |
Medtronic PLC | 89,125 | | 6,986,509 |
Nevro Corp. | 14,600 | | 741,242 |
Novadaq Technologies, Inc. (a) | 183,199 | | 2,101,293 |
St. Jude Medical, Inc. | 19,700 | | 1,454,254 |
Zeltiq Aesthetics, Inc. (a) | 150,200 | | 5,159,370 |
| | 58,581,506 |
Health Care Providers & Services - 1.1% |
Adeptus Health, Inc. Class A (a) | 100,767 | | 11,073,286 |
AmerisourceBergen Corp. | 49,300 | | 5,213,475 |
AmSurg Corp. (a) | 52,400 | | 3,759,176 |
Cardinal Health, Inc. | 100,200 | | 8,514,996 |
Cigna Corp. | 43,700 | | 6,295,422 |
Diplomat Pharmacy, Inc. | 44,300 | | 2,045,774 |
Express Scripts Holding Co. (a) | 15,500 | | 1,396,085 |
HCA Holdings, Inc. (a) | 241,650 | | 22,475,867 |
McKesson Corp. | 44,600 | | 9,837,422 |
Teladoc, Inc. (a) | 18,100 | | 571,417 |
UnitedHealth Group, Inc. | 33,500 | | 4,066,900 |
| | 75,249,820 |
Health Care Technology - 0.3% |
athenahealth, Inc. (a) | 36,700 | | 5,136,532 |
Castlight Health, Inc. Class B (a) | 252,000 | | 1,809,360 |
Cerner Corp. (a) | 165,000 | | 11,833,800 |
Evolent Health, Inc. | 81,500 | | 1,738,395 |
| | 20,518,087 |
Life Sciences Tools & Services - 0.2% |
Illumina, Inc. (a) | 45,938 | | 10,074,203 |
Lonza Group AG | 15,327 | | 2,222,201 |
| | 12,296,404 |
Common Stocks - continued |
| Shares | | Value |
HEALTH CARE - continued |
Pharmaceuticals - 5.1% |
AbbVie, Inc. | 330,100 | | $ 23,110,301 |
Achaogen, Inc. (a) | 161,500 | | 1,164,415 |
Allergan PLC (a) | 363,672 | | 120,429,983 |
Bristol-Myers Squibb Co. | 716,500 | | 47,031,060 |
CSPC Pharmaceutical Group Ltd. | 786,000 | | 719,864 |
Dermira, Inc. | 133,300 | | 3,009,914 |
Eli Lilly & Co. | 117,800 | | 9,955,278 |
Endo Health Solutions, Inc. (a) | 25,300 | | 2,214,762 |
GW Pharmaceuticals PLC ADR (a) | 90,969 | | 10,416,860 |
Jazz Pharmaceuticals PLC (a) | 73,600 | | 14,148,864 |
Mallinckrodt PLC (a) | 66,800 | | 8,280,528 |
Relypsa, Inc. (a) | 41,600 | | 1,377,376 |
Shire PLC sponsored ADR | 83,500 | | 22,278,635 |
Tetraphase Pharmaceuticals, Inc. (a) | 82,500 | | 3,922,875 |
Teva Pharmaceutical Industries Ltd. sponsored ADR | 394,400 | | 27,221,488 |
Valeant Pharmaceuticals International, Inc. (Canada) (a) | 192,500 | | 49,355,125 |
ZS Pharma, Inc. (a) | 81,400 | | 4,862,022 |
| | 349,499,350 |
TOTAL HEALTH CARE | | 1,262,859,386 |
INDUSTRIALS - 5.4% |
Aerospace & Defense - 1.3% |
General Dynamics Corp. | 14,400 | | 2,147,184 |
Honeywell International, Inc. | 326,200 | | 34,267,310 |
Huntington Ingalls Industries, Inc. | 26,300 | | 3,087,883 |
The Boeing Co. | 329,300 | | 47,475,181 |
TransDigm Group, Inc. (a) | 6,200 | | 1,403,060 |
| | 88,380,618 |
Air Freight & Logistics - 0.4% |
FedEx Corp. | 93,912 | | 16,098,395 |
United Parcel Service, Inc. Class B | 14,200 | | 1,453,512 |
XPO Logistics, Inc. (a)(d) | 173,200 | | 7,508,220 |
| | 25,060,127 |
Airlines - 1.0% |
American Airlines Group, Inc. | 582,334 | | 23,351,593 |
Delta Air Lines, Inc. | 175,700 | | 7,790,538 |
Southwest Airlines Co. | 193,600 | | 7,008,320 |
Spirit Airlines, Inc. (a) | 383,600 | | 22,946,952 |
Common Stocks - continued |
| Shares | | Value |
INDUSTRIALS - continued |
Airlines - continued |
United Continental Holdings, Inc. (a) | 107,200 | | $ 6,045,008 |
Wizz Air Holdings PLC | 108,003 | | 2,781,251 |
| | 69,923,662 |
Building Products - 0.4% |
A.O. Smith Corp. | 90,051 | | 6,467,463 |
Caesarstone Sdot-Yam Ltd. | 138,900 | | 9,964,686 |
Continental Building Products, Inc. (a) | 330,500 | | 7,019,820 |
Lennox International, Inc. | 7,100 | | 838,297 |
Toto Ltd. | 170,000 | | 2,770,807 |
| | 27,061,073 |
Commercial Services & Supplies - 0.2% |
Interface, Inc. | 410,100 | | 10,650,297 |
Construction & Engineering - 0.0% |
Beijing Urban Consolidated & Development Group Ltd.
(H Shares) | 896,000 | | 796,337 |
Electrical Equipment - 0.4% |
Acuity Brands, Inc. | 61,200 | | 12,312,828 |
SolarCity Corp. (a)(d) | 262,426 | | 15,220,708 |
| | 27,533,536 |
Industrial Conglomerates - 0.5% |
Danaher Corp. | 177,400 | | 16,242,744 |
General Electric Co. | 834,000 | | 21,767,400 |
| | 38,010,144 |
Machinery - 0.2% |
Ingersoll-Rand PLC | 148,100 | | 9,093,340 |
Manitowoc Co., Inc. | 43,600 | | 770,412 |
Middleby Corp. (a) | 13,600 | | 1,668,720 |
Pentair PLC | 20,400 | | 1,240,524 |
Rational AG | 2,100 | | 820,475 |
Zhengzhou Yutong Bus Co. Ltd. | 608,856 | | 1,898,217 |
| | 15,491,688 |
Professional Services - 0.3% |
Equifax, Inc. | 7,400 | | 755,762 |
Huron Consulting Group, Inc. (a) | 66,899 | | 5,115,767 |
Manpower, Inc. | 139,600 | | 12,631,008 |
Verisk Analytics, Inc. (a) | 37,000 | | 2,890,070 |
WageWorks, Inc. (a) | 22,200 | | 1,108,890 |
| | 22,501,497 |
Common Stocks - continued |
| Shares | | Value |
INDUSTRIALS - continued |
Road & Rail - 0.3% |
Canadian Pacific Railway Ltd. | 56,800 | | $ 9,143,764 |
J.B. Hunt Transport Services, Inc. | 175,800 | | 14,788,296 |
| | 23,932,060 |
Trading Companies & Distributors - 0.4% |
HD Supply Holdings, Inc. (a) | 589,200 | | 21,093,360 |
United Rentals, Inc. (a) | 51,200 | | 3,429,888 |
| | 24,523,248 |
Transportation Infrastructure - 0.0% |
Qingdao Port International Co. Ltd. | 1,180,000 | | 758,020 |
TOTAL INDUSTRIALS | | 374,622,307 |
INFORMATION TECHNOLOGY - 32.6% |
Communications Equipment - 0.3% |
CommScope Holding Co., Inc. (a) | 67,600 | | 2,120,612 |
Palo Alto Networks, Inc. (a) | 47,697 | | 8,863,534 |
QUALCOMM, Inc. | 153,900 | | 9,909,621 |
| | 20,893,767 |
Electronic Equipment & Components - 0.2% |
Fitbit, Inc. (d) | 226,600 | | 10,786,160 |
Jabil Circuit, Inc. | 197,600 | | 4,001,400 |
| | 14,787,560 |
Internet Software & Services - 12.0% |
58.com, Inc. ADR (a) | 61,700 | | 3,664,363 |
Akamai Technologies, Inc. (a) | 157,336 | | 12,069,245 |
Alibaba Group Holding Ltd. sponsored ADR | 419,600 | | 32,871,464 |
Baidu.com, Inc. sponsored ADR (a) | 4,300 | | 742,438 |
Criteo SA sponsored ADR (a) | 22,800 | | 1,213,644 |
eBay, Inc. (a) | 86,500 | | 2,432,380 |
Facebook, Inc. Class A (a) | 2,192,855 | | 206,150,299 |
Gogo, Inc. (a)(d) | 535,100 | | 9,754,873 |
Google, Inc.: | | | |
Class A (a) | 516,613 | | 339,673,048 |
Class C | 158,453 | | 99,129,781 |
HomeAway, Inc. (a) | 367,400 | | 11,036,696 |
JUST EAT Ltd. (a) | 1,102,488 | | 7,506,614 |
NetEase, Inc. sponsored ADR | 59,000 | | 8,179,170 |
New Relic, Inc. | 8,700 | | 302,760 |
Rackspace Hosting, Inc. (a) | 397,595 | | 13,530,158 |
Common Stocks - continued |
| Shares | | Value |
INFORMATION TECHNOLOGY - continued |
Internet Software & Services - continued |
Tencent Holdings Ltd. | 1,053,700 | | $ 19,631,105 |
Twitter, Inc. (a) | 1,287,000 | | 39,909,870 |
Yahoo!, Inc. (a) | 331,633 | | 12,160,982 |
Youku Tudou, Inc. ADR (a) | 210,900 | | 4,091,460 |
| | 824,050,350 |
IT Services - 4.3% |
Alliance Data Systems Corp. (a) | 12,800 | | 3,520,512 |
Cognizant Technology Solutions Corp. Class A (a) | 1,149,248 | | 72,517,549 |
EOH Holdings Ltd. | 78,500 | | 1,069,441 |
MasterCard, Inc. Class A | 867,400 | | 84,484,760 |
PayPal Holdings, Inc. (a) | 84,500 | | 3,270,150 |
Sabre Corp. | 347,700 | | 9,248,820 |
Total System Services, Inc. | 60,500 | | 2,796,310 |
Visa, Inc. Class A | 1,607,448 | | 121,105,132 |
| | 298,012,674 |
Semiconductors & Semiconductor Equipment - 4.5% |
Ambarella, Inc. (a)(d) | 61,800 | | 7,160,766 |
Analog Devices, Inc. | 1,103,888 | | 64,389,787 |
Atmel Corp. | 386,500 | | 3,200,220 |
Avago Technologies Ltd. | 359,800 | | 45,025,372 |
Broadcom Corp. Class A | 496,500 | | 25,127,865 |
Cavium, Inc. (a) | 346,555 | | 23,496,429 |
Cirrus Logic, Inc. (a) | 816,100 | | 26,939,461 |
Maxim Integrated Products, Inc. | 80,000 | | 2,723,200 |
Micron Technology, Inc. (a) | 74,300 | | 1,375,293 |
Monolithic Power Systems, Inc. | 47,256 | | 2,443,608 |
NVIDIA Corp. | 543,220 | | 10,837,239 |
NXP Semiconductors NV (a) | 864,869 | | 83,883,644 |
Qorvo, Inc. (a) | 145,487 | | 8,430,972 |
Skyworks Solutions, Inc. | 81,400 | | 7,787,538 |
| | 312,821,394 |
Software - 5.0% |
Activision Blizzard, Inc. | 2,441,428 | | 62,964,428 |
Adobe Systems, Inc. (a) | 289,820 | | 23,762,342 |
Appirio, Inc. (g) | 43,764 | | 217,069 |
Citrix Systems, Inc. (a) | 20,800 | | 1,572,688 |
Electronic Arts, Inc. (a) | 634,700 | | 45,412,785 |
HubSpot, Inc. | 17,800 | | 960,310 |
Intuit, Inc. | 66,800 | | 7,065,436 |
Micro Focus International PLC | 38,300 | | 836,161 |
Common Stocks - continued |
| Shares | | Value |
INFORMATION TECHNOLOGY - continued |
Software - continued |
Mobileye NV (a) | 80,300 | | $ 4,826,030 |
Nintendo Co. Ltd. | 97,600 | | 17,175,584 |
Paycom Software, Inc. (a) | 59,200 | | 1,894,400 |
Playtech Ltd. | 58,834 | | 832,875 |
Qlik Technologies, Inc. (a) | 286,800 | | 11,603,928 |
Rapid7, Inc. | 11,900 | | 273,462 |
Red Hat, Inc. (a) | 140,500 | | 11,110,740 |
Salesforce.com, Inc. (a) | 1,678,704 | | 123,049,003 |
Splunk, Inc. (a) | 36,300 | | 2,538,822 |
Tableau Software, Inc. (a) | 130,100 | | 13,626,674 |
Take-Two Interactive Software, Inc. (a) | 75,400 | | 2,381,132 |
Workday, Inc. Class A (a) | 26,200 | | 2,209,446 |
Zendesk, Inc. (a) | 211,000 | | 4,352,930 |
Zynga, Inc. (a) | 1,915,259 | | 4,749,842 |
| | 343,416,087 |
Technology Hardware, Storage & Peripherals - 6.3% |
Apple, Inc. | 3,510,634 | | 425,839,899 |
Nimble Storage, Inc. (a) | 222,900 | | 6,156,498 |
SanDisk Corp. | 36,900 | | 2,224,701 |
| | 434,221,098 |
TOTAL INFORMATION TECHNOLOGY | | 2,248,202,930 |
MATERIALS - 1.8% |
Chemicals - 1.5% |
Agrium, Inc. | 44,800 | | 4,583,278 |
Air Products & Chemicals, Inc. | 23,000 | | 3,277,730 |
Ashland, Inc. | 49,900 | | 5,704,568 |
CF Industries Holdings, Inc. | 747,600 | | 44,257,920 |
E.I. du Pont de Nemours & Co. | 361,000 | | 20,129,360 |
Eastman Chemical Co. | 18,200 | | 1,426,880 |
Monsanto Co. | 167,700 | | 17,086,953 |
Potash Corp. of Saskatchewan, Inc. | 177,500 | | 4,828,879 |
PPG Industries, Inc. | 24,300 | | 2,633,634 |
Syngenta AG sponsored ADR | 17,200 | | 1,416,420 |
| | 105,345,622 |
Construction Materials - 0.1% |
Eagle Materials, Inc. | 71,200 | | 5,492,368 |
Common Stocks - continued |
| Shares | | Value |
MATERIALS - continued |
Containers & Packaging - 0.2% |
Sealed Air Corp. | 162,700 | | $ 8,650,759 |
WestRock Co. | 23,600 | | 1,488,216 |
| | 10,138,975 |
Metals & Mining - 0.0% |
Compass Minerals International, Inc. | 1,100 | | 88,000 |
TOTAL MATERIALS | | 121,064,965 |
TOTAL COMMON STOCKS (Cost $5,091,927,150) |
6,712,235,727
|
Preferred Stocks - 2.6% |
| | | |
Convertible Preferred Stocks - 2.6% |
CONSUMER DISCRETIONARY - 0.2% |
Internet & Catalog Retail - 0.2% |
Meituan Corp. Series D (g) | 790,926 | | 6,145,495 |
The Honest Co., Inc. Series C (g) | 167,087 | | 7,645,066 |
| | 13,790,561 |
CONSUMER STAPLES - 0.2% |
Food & Staples Retailing - 0.1% |
Blue Apron, Inc. Series D (g) | 285,138 | | 3,800,006 |
Food Products - 0.1% |
BLUE BOTTLE Coffee, Inc. Series C (g) | 234,006 | | 7,797,080 |
Tobacco - 0.0% |
PAX Labs, Inc. Series C (g) | 945,100 | | 3,638,635 |
TOTAL CONSUMER STAPLES | | 15,235,721 |
FINANCIALS - 0.1% |
Consumer Finance - 0.1% |
Oportun Finance Corp. Series H (g) | 1,527,120 | | 4,348,169 |
HEALTH CARE - 0.1% |
Biotechnology - 0.1% |
CytomX Therapeutics, Inc. Series D (g) | 8,684,393 | | 1,288,260 |
Gensight Biologics Series B (g) | 386,177 | | 1,179,051 |
Preferred Stocks - continued |
| Shares | | Value |
Convertible Preferred Stocks - continued |
HEALTH CARE - continued |
Biotechnology - continued |
Immunocore Ltd. Series A (g) | 4,035 | | $ 762,011 |
Pronutria Biosciences, Inc. Series C (g) | 248,015 | | 2,499,991 |
| | 5,729,313 |
INDUSTRIALS - 0.1% |
Aerospace & Defense - 0.0% |
Space Exploration Technologies Corp. Series G (g) | 42,650 | | 3,303,669 |
Professional Services - 0.1% |
YourPeople, Inc. Series C (g) | 253,888 | | 3,783,205 |
TOTAL INDUSTRIALS | | 7,086,874 |
INFORMATION TECHNOLOGY - 1.9% |
Internet Software & Services - 1.5% |
Uber Technologies, Inc.: | | | |
Series D, 8.00% (a)(g) | 2,578,476 | | 102,210,789 |
Series E, 8.00% (g) | 47,420 | | 1,879,729 |
| | 104,090,518 |
IT Services - 0.2% |
AppNexus, Inc. Series E (g) | 307,049 | | 8,456,129 |
Nutanix, Inc. Series E (g) | 230,044 | | 3,662,300 |
| | 12,118,429 |
Software - 0.2% |
Appirio, Inc. Series E (g) | 306,351 | | 1,519,501 |
Cloudflare, Inc. Series D (g) | 323,080 | | 2,275,872 |
Dataminr, Inc. Series D (g) | 115,901 | | 1,477,738 |
Delphix Corp. Series D (g) | 242,876 | | 2,185,884 |
Snapchat, Inc. Series F (g) | 247,231 | | 7,594,936 |
Taboola.Com Ltd. Series E (g) | 289,958 | | 1,600,568 |
| | 16,654,499 |
TOTAL INFORMATION TECHNOLOGY | | 132,863,446 |
TOTAL CONVERTIBLE PREFERRED STOCKS | | 179,054,084 |
Preferred Stocks - continued |
| Shares | | Value |
Nonconvertible Preferred Stocks - 0.0% |
CONSUMER DISCRETIONARY - 0.0% |
Automobiles - 0.0% |
Volkswagen AG | 14,800 | | $ 2,964,748 |
TOTAL PREFERRED STOCKS (Cost $114,511,923) |
182,018,832
|
Money Market Funds - 2.5% |
| | | |
Fidelity Cash Central Fund, 0.17% (b) | 8,927,416 | | 8,927,416 |
Fidelity Securities Lending Cash Central Fund, 0.18% (b)(c) | 159,839,079 | | 159,839,079 |
TOTAL MONEY MARKET FUNDS (Cost $168,766,495) |
168,766,495
|
TOTAL INVESTMENT PORTFOLIO - 102.4% (Cost $5,375,205,568) | | 7,063,021,054 |
NET OTHER ASSETS (LIABILITIES) - (2.4)% | | (167,068,004) |
NET ASSETS - 100% | $ 6,895,953,050 |
Security Type Abbreviations |
ELS | - | Equity-Linked Security |
Legend |
(a) Non-income producing |
(b) Affiliated fund that is generally available only to investment companies and other accounts managed by Fidelity Investments. The rate quoted is the annualized seven-day yield of the fund at period end. A complete unaudited listing of the fund's holdings as of its most recent quarter end is available upon request. In addition, each Fidelity Central Fund's financial statements, which are not covered by the Fund's Report of Independent Registered Public Accounting Firm, are available on the SEC's website or upon request. |
(c) Investment made with cash collateral received from securities on loan. |
(d) Security or a portion of the security is on loan at period end. |
(e) Security exempt from registration under Rule 144A of the Securities Act of 1933. These securities may be resold in transactions exempt from registration, normally to qualified institutional buyers. At the end of the period, the value of these securities amounted to $11,214,955 or 0.2% of net assets. |
(f) Investment is owned by an entity that is treated as a corporation for U.S. tax purposes and is wholly-owned by the Fund. |
(g) Restricted securities - Investment in securities not registered under the Securities Act of 1933 (excluding 144A issues). At the end of the period, the value of restricted securities (excluding 144A issues) amounted to $190,147,653 or 2.8% of net assets. |
Additional information on each restricted holding is as follows: |
Security | Acquisition Date | Acquisition Cost |
Appirio, Inc. | 2/12/15 | $ 312,497 |
Appirio, Inc. Series E | 2/12/15 | $ 2,187,499 |
AppNexus, Inc. Series E | 8/1/14 | $ 6,150,867 |
Blue Apron, Inc. Series D | 5/18/15 | $ 3,800,006 |
BLUE BOTTLE Coffee, Inc.
Series C | 5/29/15 | $ 7,797,080 |
Cloudflare, Inc. Series D | 11/5/14 - 6/24/15 | $ 2,010,032 |
CytomX Therapeutics, Inc. Series D | 6/12/15 | $ 1,288,260 |
Dataminr, Inc. Series D | 3/6/15 | $ 1,477,738 |
Security | Acquisition Date | Acquisition Cost |
Delphix Corp. Series D | 7/10/15 | $ 2,185,884 |
Gensight Biologics Series B | 7/2/15 | $ 1,190,323 |
Immunocore Ltd. Series A | 7/27/15 | $ 759,303 |
Meituan Corp. Series D | 1/26/15 | $ 4,999,997 |
Nutanix, Inc. Series E | 8/26/14 | $ 3,081,784 |
Oportun Finance Corp. Series H | 2/6/15 | $ 4,348,169 |
PAX Labs, Inc. Series C | 5/22/15 | $ 3,638,635 |
Pronutria Biosciences, Inc. Series C | 1/30/15 | $ 2,499,991 |
Snapchat, Inc. Series F | 3/25/15 | $ 7,594,936 |
Space Exploration Technologies Corp. Series G | 1/20/15 | $ 3,303,669 |
Taboola.Com Ltd. Series E | 12/22/14 | $ 3,022,928 |
The Honest Co., Inc. | 8/21/14 | $ 1,937,546 |
The Honest Co., Inc. Series C | 8/21/14 | $ 4,520,923 |
Tory Burch LLC unit | 5/14/15 | $ 7,600,030 |
Uber Technologies, Inc. Series D, 8.00% | 6/6/14 | $ 40,000,027 |
Uber Technologies, Inc. Series E, 8.00% | 12/5/14 | $ 1,579,919 |
YourPeople, Inc. Series C | 5/1/15 | $ 3,783,205 |
Affiliated Central Funds |
Information regarding fiscal year to date income earned by the Fund from investments in Fidelity Central Funds is as follows: |
Fund | Income earned |
Fidelity Cash Central Fund | $ 26,214 |
Fidelity Securities Lending Cash Central Fund | 2,974,795 |
Total | $ 3,001,009 |
Other Information |
The following is a summary of the inputs used, as of July 31, 2015, involving the Fund's assets and liabilities carried at fair value. The inputs or methodology used for valuing securities may not be an indication of the risk associated with investing in those securities. For more information on valuation inputs, and their aggregation into the levels used in the tables below, please refer to the Investment Valuation section in the accompanying Notes to Financial Statements. |
Valuation Inputs at Reporting Date: |
Description | Total | Level 1 | Level 2 | Level 3 |
Investments in Securities: | | | | |
Equities: | | | | |
Consumer Discretionary | $ 1,723,853,313 | $ 1,683,995,404 | $ 15,190,848 | $ 24,667,061 |
Consumer Staples | 663,048,388 | 640,044,275 | 7,768,392 | 15,235,721 |
Energy | 82,710,755 | 82,710,755 | - | - |
Financials | 272,212,882 | 257,731,245 | 4,724,051 | 9,757,586 |
Health Care | 1,268,588,699 | 1,260,494,793 | 2,018,205 | 6,075,701 |
Industrials | 381,709,181 | 374,622,307 | - | 7,086,874 |
Information Technology | 2,381,066,376 | 2,228,354,756 | 19,631,105 | 133,080,515 |
Materials | 121,064,965 | 121,064,965 | - | - |
Money Market Funds | 168,766,495 | 168,766,495 | - | - |
Total Investments in Securities: | $ 7,063,021,054 | $ 6,817,784,995 | $ 49,332,601 | $ 195,903,458 |
Valuation Inputs at Reporting Date: |
The following is a reconciliation of Investments in Securities for which Level 3 inputs were used in determining value: |
Investments in Securities: | |
Equities - Information Technology | |
Beginning Balance | $ 40,000,027 |
Net Realized Gain (Loss) on Investment Securities | - |
Net Unrealized Gain (Loss) on Investment Securities | 63,476,403 |
Cost of Purchases | 29,604,085 |
Proceeds of Sales | - |
Amortization/Accretion | - |
Transfers into Level 3 | - |
Transfers out of Level 3 | - |
Ending Balance | $ 133,080,515 |
The change in unrealized gain (loss) for the period attributable to Level 3 securities held at July 31, 2015 | $ 63,476,403 |
Equities - Other Investments in Securities | |
Beginning Balance | $ - |
Net Realized Gain (Loss) on Investment Securities | - |
Net Unrealized Gain (Loss) on Investment Securities | 4,989,113 |
Cost of Purchases | 57,833,830 |
Proceeds of Sales | - |
Amortization/Accretion | - |
Transfers into Level 3 | - |
Transfers out of Level 3 | - |
Ending Balance | $ 62,822,943 |
The change in unrealized gain (loss) for the period attributable to Level 3 securities held at July 31, 2015 | $ 4,989,113 |
The information used in the above reconciliations represents fiscal year to date activity for any Investments in Securities identified as using Level 3 inputs at either the beginning or the end of the current fiscal period. Transfers in or out of Level 3 represent the beginning value of any Security or Instrument where a change in the pricing level occurred from the beginning to the end of the period. The cost of purchases and the proceeds of sales may include securities received or delivered through corporate actions or exchanges. Realized and unrealized gains (losses) disclosed in the reconciliations are included in Net Gain (Loss) on the Fund's Statement of Operations. |
Distribution of investments by country or territory of incorporation, as a percentage of total net assets, is as follows (Unaudited): |
United States of America | 87.7% |
Ireland | 2.8% |
Cayman Islands | 2.4% |
Netherlands | 1.5% |
Canada | 1.2% |
Others (Individually Less Than 1%) | 4.4% |
| 100.0% |
See accompanying notes which are an integral part of the financial statements.
Annual Report
Statement of Assets and Liabilities
| | July 31, 2015 |
| | |
Assets | | |
Investment in securities, at value (including securities loaned of $156,825,754) - See accompanying schedule: Unaffiliated issuers (cost $5,206,439,073) | $ 6,894,254,559 | |
Fidelity Central Funds (cost $168,766,495) | 168,766,495 | |
Total Investments (cost $5,375,205,568) | | $ 7,063,021,054 |
Foreign currency held at value (cost $859,454) | | 859,454 |
Receivable for investments sold | | 564,291,216 |
Receivable for fund shares sold | | 652,539 |
Dividends receivable | | 1,589,607 |
Distributions receivable from Fidelity Central Funds | | 188,254 |
Other receivables | | 111,355 |
Total assets | | 7,630,713,479 |
| | |
Liabilities | | |
Payable to custodian bank | $ 1,180,779 | |
Payable for investments purchased | 54,875,347 | |
Payable for fund shares redeemed | 514,090,166 | |
Accrued management fee | 4,164,468 | |
Other affiliated payables | 507,467 | |
Other payables and accrued expenses | 103,123 | |
Collateral on securities loaned, at value | 159,839,079 | |
Total liabilities | | 734,760,429 |
| | |
Net Assets | | $ 6,895,953,050 |
Net Assets consist of: | | |
Paid in capital | | $ 4,579,269,332 |
Undistributed net investment income | | 12,115,675 |
Accumulated undistributed net realized gain (loss) on investments and foreign currency transactions | | 616,748,889 |
Net unrealized appreciation (depreciation) on investments and assets and liabilities in foreign currencies | | 1,687,819,154 |
Net Assets | | $ 6,895,953,050 |
See accompanying notes which are an integral part of the financial statements.
Annual Report
Financial Statements - continued
Statement of Assets and Liabilities - continued
| | July 31, 2015 |
| | |
Series Blue Chip Growth:
Net Asset Value, offering price and redemption price per share ($2,831,292,501 ÷ 211,893,058 shares) | | $ 13.36 |
| | |
Class F:
Net Asset Value, offering price and redemption price per share ($4,064,660,549 ÷ 303,878,209 shares) | | $ 13.38 |
See accompanying notes which are an integral part of the financial statements.
Annual Report
Statement of Operations
| Year ended July 31, 2015 |
| | |
Investment Income | | |
Dividends | | $ 76,138,940 |
Interest | | 8 |
Income from Fidelity Central Funds | | 3,001,009 |
Total income | | 79,139,957 |
| | |
Expenses | | |
Management fee | | |
Basic fee | $ 44,126,553 | |
Performance adjustment | 4,104,244 | |
Transfer agent fees | 5,405,074 | |
Accounting and security lending fees | 1,236,207 | |
Custodian fees and expenses | 263,653 | |
Independent trustees' compensation | 33,960 | |
Audit | 76,591 | |
Legal | 19,261 | |
Interest | 60,939 | |
Miscellaneous | 57,580 | |
Total expenses before reductions | 55,384,062 | |
Expense reductions | (328,583) | 55,055,479 |
Net investment income (loss) | | 24,084,478 |
Realized and Unrealized Gain (Loss) Net realized gain (loss) on: | | |
Investment securities: | | |
Unaffiliated issuers | 648,816,824 | |
Foreign currency transactions | (112,827) | |
Total net realized gain (loss) | | 648,703,997 |
Change in net unrealized appreciation (depreciation) on: Investment securities | 876,320,034 | |
Assets and liabilities in foreign currencies | 3,518 | |
Total change in net unrealized appreciation (depreciation) | | 876,323,552 |
Net gain (loss) | | 1,525,027,549 |
Net increase (decrease) in net assets resulting from operations | | $ 1,549,112,027 |
See accompanying notes which are an integral part of the financial statements.
Annual Report
Financial Statements - continued
Statement of Changes in Net Assets
| Year ended
July 31,
2015 | For the period
November 7, 2013 (commencement of operations) to
July 31, 2014 |
Increase (Decrease) in Net Assets | | |
Operations | | |
Net investment income (loss) | $ 24,084,478 | $ 20,153,236 |
Net realized gain (loss) | 648,703,997 | 37,350,557 |
Change in net unrealized appreciation (depreciation) | 876,323,552 | 811,495,602 |
Net increase (decrease) in net assets resulting from operations | 1,549,112,027 | 868,999,395 |
Distributions to shareholders from net investment income | (23,623,473) | (7,849,502) |
Distributions to shareholders from net realized gain | (69,954,848) | - |
Total distributions | (93,578,321) | (7,849,502) |
Share transactions - net increase (decrease) | (2,451,650,515) | 7,030,919,966 |
Total increase (decrease) in net assets | (996,116,809) | 7,892,069,859 |
| | |
Net Assets | | |
Beginning of period | 7,892,069,859 | - |
End of period (including undistributed net investment income of $12,115,675 and undistributed net investment income of $11,955,287, respectively) | $ 6,895,953,050 | $ 7,892,069,859 |
See accompanying notes which are an integral part of the financial statements.
Annual Report
Financial Highlights - Series Blue Chip Growth
Years ended July 31, | 2015 | 2014 G |
Selected Per-Share Data | | |
Net asset value, beginning of period | $ 11.18 | $ 10.00 |
Income from Investment Operations | | |
Net investment income (loss) D | .03 | .02 |
Net realized and unrealized gain (loss) | 2.27 | 1.17 |
Total from investment operations | 2.30 | 1.19 |
Distributions from net investment income | (.02) | (.01) |
Distributions from net realized gain | (.10) | - |
Total distributions | (.12) | (.01) |
Net asset value, end of period | $ 13.36 | $ 11.18 |
Total ReturnB, C | 20.74% | 11.90% |
Ratios to Average Net Assets E, H | | |
Expenses before reductions | .79% | .74%A |
Expenses net of fee waivers, if any | .78% | .74%A |
Expenses net of all reductions | .78% | .74%A |
Net investment income (loss) | .20% | .26%A |
Supplemental Data | | |
Net assets, end of period (000 omitted) | $ 2,831,293 | $ 3,288,708 |
Portfolio turnover rate F | 57% | 67% A, I |
A Annualized
B Total returns for periods of less than one year are not annualized.
C Total returns would have been lower if certain expenses had not been reduced during the applicable periods shown.
D Calculated based on average shares outstanding during the period.
E Fees and expenses of any underlying Fidelity Central Funds are not included in the Fund's expense ratio. The Fund indirectly bears its proportionate share of the expenses of any underlying Fidelity Central Funds.
F Amount does not include the portfolio activity of any underlying Fidelity Central Funds.
G For the period November 7, 2013 (commencement of operations) to July 31, 2014.
H Expense ratios reflect operating expenses of the class. Expenses before reductions do not reflect amounts reimbursed by the investment adviser or reductions from brokerage service arrangements or reductions from other expense offset arrangements and do not represent the amount paid by the class during periods when reimbursements or reductions occur. Expense ratios before reductions for start-up periods may not be representative of long-term operating periods. Expenses net of fee waivers reflect expenses after reimbursement by the investment adviser but prior to reductions from brokerage service arrangements or other expense offset arrangements. Expenses net of all reductions represent the net expenses paid by the class.
I Portfolio turnover rate excludes securities received or delivered in-kind.
See accompanying notes which are an integral part of the financial statements.
Annual Report
Financial Highlights - Class F
Years ended July 31, | 2015 | 2014 G |
Selected Per-Share Data | | |
Net asset value, beginning of period | $ 11.19 | $ 10.00 |
Income from Investment Operations | | |
Net investment income (loss) D | .05 | .03 |
Net realized and unrealized gain (loss) | 2.28 | 1.17 |
Total from investment operations | 2.33 | 1.20 |
Distributions from net investment income | (.04) | (.01) |
Distributions from net realized gain | (.10) | - |
Total distributions | (.14) | (.01) |
Net asset value, end of period | $ 13.38 | $ 11.19 |
Total ReturnB, C | 21.00% | 12.03% |
Ratios to Average Net Assets E, H | | |
Expenses before reductions | .62% | .57%A |
Expenses net of fee waivers, if any | .62% | .57%A |
Expenses net of all reductions | .62% | .57%A |
Net investment income (loss) | .37% | .43%A |
Supplemental Data | | |
Net assets, end of period (000 omitted) | $ 4,064,661 | $ 4,603,361 |
Portfolio turnover rate F | 57% | 67% A, I |
A Annualized
B Total returns for periods of less than one year are not annualized.
C Total returns would have been lower if certain expenses had not been reduced during the applicable periods shown.
D Calculated based on average shares outstanding during the period.
E Fees and expenses of any underlying Fidelity Central Funds are not included in the Fund's expense ratio. The Fund indirectly bears its proportionate share of the expenses of any underlying Fidelity Central Funds.
F Amount does not include the portfolio activity of any underlying Fidelity Central Funds.
G For the period November 7, 2013 (commencement of operations) to July 31, 2014.
H Expense ratios reflect operating expenses of the class. Expenses before reductions do not reflect amounts reimbursed by the investment adviser or reductions from brokerage service arrangements or reductions from other expense offset arrangements and do not represent the amount paid by the class during periods when reimbursements or reductions occur. Expense ratios before reductions for start-up periods may not be representative of long-term operating periods. Expenses net of fee waivers reflect expenses after reimbursement by the investment adviser but prior to reductions from brokerage service arrangements or other expense offset arrangements. Expenses net of all reductions represent the net expenses paid by the class.
I Portfolio turnover rate excludes securities received or delivered in-kind.
See accompanying notes which are an integral part of the financial statements.
Annual Report
For the period ended July 31, 2015
1. Organization.
Fidelity Series Blue Chip Growth Fund (the Fund) is a fund of Fidelity Securities Fund (the Trust) and is authorized to issue an unlimited number of shares. Shares of the Fund are only available for purchase by mutual funds for which Fidelity Management & Research Company (FMR) or an affiliate serves as an investment manager. The Trust is registered under the Investment Company Act of 1940, as amended (the 1940 Act), as an open-end management investment company organized as a Massachusetts business trust. The Fund offers Series Blue Chip Growth and Class F shares, each of which has equal rights as to assets and voting privileges. Each class has exclusive voting rights with respect to matters that affect that class.
2. Investments in Fidelity Central Funds.
The Fund invests in Fidelity Central Funds, which are open-end investment companies generally available only to other investment companies and accounts managed by the investment adviser and its affiliates. The Fund's Schedule of Investments lists each of the Fidelity Central Funds held as of period end, if any, as an investment of the Fund, but does not include the underlying holdings of each Fidelity Central Fund. As an Investing Fund, the Fund indirectly bears its proportionate share of the expenses of the underlying Fidelity Central Funds.
The Money Market Central Funds seek preservation of capital and current income and are managed by Fidelity Investments Money Management, Inc. (FIMM), an affiliate of the investment adviser. Annualized expenses of the Money Market Central Funds as of their most recent shareholder report date are less than .01%.
A complete unaudited list of holdings for each Fidelity Central Fund is available upon request or at the Securities and Exchange Commission (the SEC) website at www.sec.gov. In addition, the financial statements of the Fidelity Central Funds, which are not covered by the Fund's Report of Independent Registered Public Accounting Firm, are available on the SEC website or upon request.
3. Significant Accounting Policies.
The financial statements have been prepared in conformity with accounting principles generally accepted in the United States of America (GAAP), which require management to make certain estimates and assumptions at the date of the financial statements. Actual results could differ from those estimates. Subsequent events, if any, through the date that the financial statements were issued have been evaluated in the preparation of
Annual Report
3. Significant Accounting Policies - continued
the financial statements. The following summarizes the significant accounting policies of the Fund:
Investment Valuation. Investments are valued as of 4:00 p.m. Eastern time on the last calendar day of the period. The Board of Trustees (the Board) has delegated the day to day responsibility for the valuation of the Fund's investments to the FMR Fair Value Committee (the Committee). In accordance with valuation policies and procedures approved by the Board, the Fund attempts to obtain prices from one or more third party pricing vendors or brokers to value its investments. When current market prices, quotations or currency exchange rates are not readily available or reliable, investments will be fair valued in good faith by the Committee, in accordance with procedures adopted by the Board. Factors used in determining fair value vary by investment type and may include market or investment specific events. The frequency with which these procedures are used cannot be predicted and they may be utilized to a significant extent. The Committee oversees the Fund's valuation policies and procedures and reports to the Board on the Committee's activities and fair value determinations. The Board monitors the appropriateness of the procedures used in valuing the Fund's investments and ratifies the fair value determinations of the Committee.
The Fund categorizes the inputs to valuation techniques used to value its investments into a disclosure hierarchy consisting of three levels as shown below:
Level 1 - quoted prices in active markets for identical investments
Level 2 - other significant observable inputs (including quoted prices for similar investments, interest rates, prepayment speeds, etc.)
Level 3 - unobservable inputs (including the Fund's own assumptions based on the best information available)
Valuation techniques used to value the Fund's investments by major category are as follows:
Equity securities, including restricted securities, for which market quotations are readily available, are valued at the last reported sale price or official closing price as reported by a third party pricing vendor on the primary market or exchange on which they are traded and are categorized as Level 1 in the hierarchy. In the event there were no sales during the day or closing prices are not available, securities are valued at the last quoted bid price or may be valued using the last available price and are generally categorized as Level 2 in the hierarchy. For foreign equity securities, when market or security specific events arise, comparisons to the valuation of American Depositary Receipts (ADRs), futures contracts, Exchange-Traded Funds (ETFs) and certain indexes as well as quoted prices for similar securities may be used and would be categorized as Level 2 in the
Annual Report
Notes to Financial Statements - continued
3. Significant Accounting Policies - continued
Investment Valuation - continued
hierarchy. Utilizing these techniques may result in transfers between Level 1 and Level 2. For equity securities, including restricted securities, where observable inputs are limited, assumptions about market activity and risk are used and these securities may be categorized as Level 3 in the hierarchy. Equity securities, including restricted securities, for which observable inputs are not available are valued using alternate valuation approaches, including the market approach and the income approach and are categorized as Level 3 in the hierarchy. The market approach generally consists of using comparable market transactions while the income approach generally consists of using the net present value of estimated future cash flows, adjusted as appropriate for liquidity, credit, market and/or other risk factors.
Investments in open-end mutual funds, including the Fidelity Central Funds, are valued at their closing net asset value (NAV) each business day and are categorized as Level 1 in the hierarchy.
The following provides information on Level 3 securities held by the Fund that were valued at period end based on unobservable inputs. These amounts exclude valuations provided by a broker.
Asset Type | Fair Value at 07/31/15 | Valuation
Technique(s) | Unobservable
Input | Amount or Range/Weighted Average | Impact to
Valuation from
an Increase
in Input* |
Equities | $195,903,458 | Adjusted
transaction
price | Proxy movement | 2.0% | Increase |
| | Black scholes | Discount for lack of
marketability | 10.0% | Decrease |
| | Last
transaction
price | Transaction price | $0.15 - $120.93
/$36.93 | Increase |
| | Market
comparable | Discount rate | 10.0% - 30.0%
/17.3% | Decrease |
| | | EV/Sales multiple | 2.2 - 7.4 / 6.1 | Increase |
| | | EV/GMV multiple | 0.4 | Increase |
| | | Premium rate | 15.0% | Increase |
| | | P/E multiple | 14.0 | Increase |
* Represents the expected directional change in the fair value of the Level 3 investments that would result from an increase in the corresponding input. A decrease to the unobservable input would have the opposite effect. Significant changes in these inputs could result in significantly higher or lower fair value measurements.
Changes in valuation techniques may result in transfers in or out of an assigned level within the disclosure hierarchy. The aggregate value of investments by input level as of
Annual Report
3. Significant Accounting Policies - continued
Investment Valuation - continued
July 31, 2015, as well as a roll forward of Level 3 investments, is included at the end of the Fund's Schedule of Investments.
Foreign Currency. The Fund may use foreign currency contracts to facilitate transactions in foreign-denominated securities. Gains and losses from these transactions may arise from changes in the value of the foreign currency or if the counterparties do not perform under the contracts' terms.
Foreign-denominated assets, including investment securities, and liabilities are translated into U.S. dollars at the exchange rates at period end. Purchases and sales of investment securities, income and dividends received and expenses denominated in foreign currencies are translated into U.S. dollars at the exchange rate in effect on the transaction date.
The effects of exchange rate fluctuations on investments are included with the net realized and unrealized gain (loss) on investment securities. Other foreign currency transactions resulting in realized and unrealized gain (loss) are disclosed separately.
Investment Transactions and Income. For financial reporting purposes, the Fund's investment holdings and NAV include trades executed through the end of the last business day of the period. The NAV per share for processing shareholder transactions is calculated as of the close of business of the New York Stock Exchange (NYSE), normally 4:00 p.m. Eastern time and includes trades executed through the end of the prior business day. Gains and losses on securities sold are determined on the basis of identified cost. Dividend income is recorded on the ex-dividend date, except for certain dividends from foreign securities where the ex-dividend date may have passed, which are recorded as soon as the Fund is informed of the ex-dividend date. Non-cash dividends included in dividend income, if any, are recorded at the fair market value of the securities received. Income and capital gain distributions from Fidelity Central Funds, if any, are recorded on the ex-dividend date. Distributions received on securities that represent a return of capital or capital gain are recorded as a reduction of cost of investments and/or as a realized gain. Subsequent to ex-dividend date the Fund determines the components of these distributions, based upon receipt of tax filings or other correspondence relating to the underlying investment. Interest income is accrued as earned and includes coupon interest and amortization of premium and accretion of discount on debt securities as applicable. Investment income is recorded net of foreign taxes withheld where recovery of such taxes is uncertain.
Class Allocations and Expenses. Investment income, realized and unrealized capital gains and losses, common expenses of the Fund, and certain fund-level expense reductions, if any, are allocated daily on a pro-rata basis to each class based on the relative net
Annual Report
Notes to Financial Statements - continued
3. Significant Accounting Policies - continued
Class Allocations and Expenses - continued
assets of each class to the total net assets of the Fund. Each class differs with respect to transfer agent fees incurred. Certain expense reductions may also differ by class. For the reporting period, the allocated portion of income and expenses to each class as a percent of its average net assets may vary due to the timing of recording these transactions in relation to fluctuating net assets of the classes. Expenses directly attributable to a fund are charged to that fund. Expenses attributable to more than one fund are allocated among the respective funds on the basis of relative net assets or other appropriate methods. Expense estimates are accrued in the period to which they relate and adjustments are made when actual amounts are known.
Income Tax Information and Distributions to Shareholders. Each year, the Fund intends to qualify as a regulated investment company under Subchapter M of the Internal Revenue Code, including distributing substantially all of its taxable income and realized gains. As a result, no provision for U.S. Federal income taxes is required. As of July 31, 2015, the Fund did not have any unrecognized tax benefits in the financial statements; nor is the Fund aware of any tax positions for which it is reasonably possible that the total amounts of unrecognized tax benefits will significantly change in the next twelve months. The Fund files a U.S. federal tax return, in addition to state and local tax returns as required. The Fund's federal income tax returns are subject to examination by the Internal Revenue Service (IRS) for a period of three fiscal years after they are filed. State and local tax returns may be subject to examination for an additional fiscal year depending on the jurisdiction. Foreign taxes are provided for based on the Fund's understanding of the tax rules and rates that exist in the foreign markets in which it invests.
Distributions are declared and recorded on the ex-dividend date. Income dividends and capital gain distributions are declared separately for each class. Income and capital gain distributions are determined in accordance with income tax regulations, which may differ from GAAP.
Capital accounts within the financial statements are adjusted for permanent book-tax differences. These adjustments have no impact on net assets or the results of operations. Capital accounts are not adjusted for temporary book-tax differences which will reverse in a subsequent period.
Book-tax differences are primarily due to foreign currency transactions, passive foreign investment companies (PFIC), partnerships and losses deferred due to wash sales.
Annual Report
3. Significant Accounting Policies - continued
Income Tax Information and Distributions to Shareholders - continued
The federal tax cost of investment securities and unrealized appreciation (depreciation) as of period end were as follows:
Gross unrealized appreciation | $ 1,787,786,693 |
Gross unrealized depreciation | (135,156,179) |
Net unrealized appreciation (depreciation) on securities | $ 1,652,630,514 |
| |
Tax Cost | $ 5,410,390,540 |
The tax-based components of distributable earnings as of period end were as follows:
Undistributed ordinary income | $ 46,282,335 |
Undistributed long-term capital gain | $ 617,763,981 |
Net unrealized appreciation (depreciation) on securities and other investments | $ 1,652,637,401 |
The tax character of distributions paid was as follows:
| July 31, 2015 | July 31, 2014 |
Ordinary Income | $ 93,578,321 | $ 7,849,502 |
Restricted Securities. The Fund may invest in securities that are subject to legal or contractual restrictions on resale. These securities generally may be resold in transactions exempt from registration or to the public if the securities are registered. Disposal of these securities may involve time-consuming negotiations and expense, and prompt sale at an acceptable price may be difficult. Information regarding restricted securities is included at the end of the Fund's Schedule of Investments.
4. Purchases and Sales of Investments.
Purchases and sales of securities other than short-term securities, aggregated $4,487,720,147 and $6,975,906,724, respectively.
5. Fees and Other Transactions with Affiliates.
Management Fee. Fidelity Management & Research Company (the investment adviser) and its affiliates provide the Fund with investment management related services for which the Fund pays a monthly management fee. The management fee is the sum of an individual fund fee rate that is based on an annual rate of .30% of the Fund's average net assets and an annualized group fee rate that averaged .25% during the period. The group fee rate is based upon the average net assets of all the mutual funds advised by the investment adviser, including any mutual funds previously advised by the
Annual Report
Notes to Financial Statements - continued
5. Fees and Other Transactions with Affiliates - continued
Management Fee - continued
investment adviser that are currently advised by Fidelity SelectCo, LLC, an affiliate of the investment adviser. The group fee rate decreases as assets under management increase and increases as assets under management decrease. In addition, the management fee is subject to a performance adjustment (up to a maximum of ± .20% of the Fund's average net assets over a 36 month performance period). The upward or downward adjustment to the management fee is based on the relative investment performance of Series Blue Chip Growth as compared to its benchmark index, the Russell 1000® Growth Index, over the same 36 month performance period. The Fund's performance adjustment took effect in November, 2014. Subsequent months will be added until the performance period includes 36 months. For the reporting period, the total annual management fee rate, including the performance adjustment, was .60% of the Fund's average net assets. The performance adjustment included in the management fee rate may be higher or lower than the maximum performance adjustment rate due to the difference between the average net assets for the reporting and performance periods.
Transfer Agent Fees. Fidelity Investments Institutional Operations Company, Inc., (FIIOC), an affiliate of the investment adviser, is the transfer, dividend disbursing and shareholder servicing agent for each class of the Fund. FIIOC receives account fees and asset-based fees that vary according to the account size and type of account of the shareholders of Series Blue Chip Growth. FIIOC receives no fees for providing transfer agency services to Class F. FIIOC pays for typesetting, printing and mailing of shareholder reports, except proxy statements.
For the period, transfer agent fees for each applicable class were as follows:
| Amount | % of
Class-Level
Average
Net Assets |
Series Blue Chip Growth | $ 5,405,074 | .16 |
Accounting and Security Lending Fees. Fidelity Service Company, Inc. (FSC), an affiliate of the investment adviser, maintains the Fund's accounting records. The accounting fee is based on the level of average net assets for each month. Under a separate contract, FSC administers the security lending program. The security lending fee is based on the number and duration of lending transactions.
Brokerage Commissions. The Fund placed a portion of its portfolio transactions with brokerage firms which are affiliates of the investment adviser. Brokerage commissions are included in net realized gain (loss) and change in net unrealized appreciation
Annual Report
5. Fees and Other Transactions with Affiliates - continued
Brokerage Commissions - continued
(depreciation) in the Statement of Operations. The commissions paid to these affiliated firms were $71,196 for the period.
Interfund Lending Program. Pursuant to an Exemptive Order issued by the SEC, the Fund, along with other registered investment companies having management contracts with FMR or other affiliated entities of FMR, may participate in an interfund lending program. This program provides an alternative credit facility allowing the funds to borrow from, or lend money to, other participating affiliated funds. At period end, there were no interfund loans outstanding. The Fund's activity in this program during the period for which loans were outstanding was as follows:
Borrower or Lender | Average Loan
Balance | Weighted Average Interest Rate | Interest Expense |
Borrower | $ 63,812,129 | .35% | $ 42,897 |
Other. During the period, the investment adviser reimbursed the Fund for certain losses in the amount of $13,651.
6. Committed Line of Credit.
The Fund participates with other funds managed by the investment adviser or an affiliate in a $4.25 billion credit facility (the "line of credit") to be utilized for temporary or emergency purposes to fund shareholder redemptions or for other short-term liquidity purposes. The Fund has agreed to pay commitment fees on its pro-rata portion of the line of credit, which amounted to $11,771 and is reflected in Miscellaneous expenses on the Statement of Operations. During the period, the Fund did not borrow on this line of credit.
7. Security Lending.
The Fund lends portfolio securities through a lending agent from time to time in order to earn additional income. For equity securities, a lending agent is used and may loan securities to certain qualified borrowers, including Fidelity Capital Markets (FCM), a broker-dealer affiliated with the Fund. On the settlement date of the loan, the Fund receives collateral (in the form of U.S. Treasury obligations, letters of credit and/or cash) against the loaned securities and maintains collateral in an amount not less than 100% of the market value of the loaned securities during the period of the loan. The market value of the loaned securities is determined at the close of business of the Fund and any additional required collateral is delivered to the Fund on the next business day. If the borrower defaults on its obligation to return the securities loaned because of insolvency
Annual Report
Notes to Financial Statements - continued
7. Security Lending - continued
or other reasons, the Fund may apply collateral received from the borrower against the obligation. The Fund may experience delays and costs in recovering the securities loaned. Any cash collateral received is invested in the Fidelity Securities Lending Cash Central Fund. The value of loaned securities and cash collateral at period end are disclosed on the Fund's Statement of Assets and Liabilities. Security lending income represents the income earned on investing cash collateral, less rebates paid to borrowers and any lending agent fees associated with the loan, plus any premium payments received for lending certain types of securities. Security lending income is presented in the Statement of Operations as a component of income from Fidelity Central Funds. Total security lending income during the period amounted to $2,974,795. During the period, there were no securities loaned to FCM.
8. Bank Borrowings.
The Fund is permitted to have bank borrowings for temporary or emergency purposes to fund shareholder redemptions or for other short-term liquidity requirements. The Fund has established borrowing arrangements with certain banks. The interest rate on the borrowings is the bank's base rate, as revised from time to time. The average loan balance during the period for which loans were outstanding amounted to $299,429,333. The weighted average interest rate was .72%. The interest expense amounted to $18,042 under the bank borrowing program. At period end, there were no bank borrowings outstanding.
9. Expense Reductions.
Commissions paid to certain brokers with whom the investment adviser, or its affiliates, places trades on behalf of the Fund include an amount in addition to trade execution, which may be rebated back to the Fund to offset certain expenses. This amount totaled $249,348 for the period.
In addition, during the period the investment adviser reimbursed/waived a portion of fund-level operating expenses in the amount of $29,785 and a portion of class-level operating expenses as follows:
| Amount |
Series Blue Chip Growth | $ 49,450 |
Annual Report
10. Distributions to Shareholders.
Distributions to shareholders of each class were as follows:
Years ended July 31, | 2015 | 2014 A |
From net investment income | | |
Series Blue Chip Growth | $ 6,705,207 | $ 2,859,214 |
Class F | 16,918,266 | 4,990,288 |
Total | $ 23,623,473 | $ 7,849,502 |
From net realized gain | | |
Series Blue Chip Growth | $ 29,046,969 | $ - |
Class F | 40,907,879 | - |
Total | $ 69,954,848 | $ - |
A For the period November 7, 2013 (commencement of operations) to July 31 2014.
11. Share Transactions.
Transactions for each class of shares were as follows:
| Shares | Dollars |
Years ended July 31, | 2015 | 2014 A | 2015 | 2014 A |
Series Blue Chip Growth | | | | |
Shares sold | 26,920,810 | 343,560,306 B | $ 331,819,807 | $ 3,450,544,092 B |
Reinvestment of distributions | 3,044,141 | 280,041 | 35,752,176 | 2,859,214 |
Shares redeemed | (112,224,694) | (49,687,546) | (1,422,685,058) | (532,601,253) |
Net increase (decrease) | (82,259,743) | 294,152,801 | $ (1,055,113,075) | $ 2,920,802,053 |
Class F | | | | |
Shares sold | 62,307,299 | 468,726,617 B | $ 764,020,110 | $ 4,729,291,768 B |
Reinvestment of distributions | 4,922,720 | 488,765 | 57,826,145 | 4,990,288 |
Shares redeemed | (174,704,050) | (57,863,142) | (2,218,383,695) | (624,164,143) |
Net increase (decrease) | (107,474,031) | 411,352,240 | $ (1,396,537,440) | $ 4,110,117,913 |
A For the period November 7, 2013 (commencement of operations) to July 31,2014.
B Amount includes in-kind exchanges.
Annual Report
Notes to Financial Statements - continued
12. Other.
The Fund's organizational documents provide former and current trustees and officers with a limited indemnification against liabilities arising in connection with the performance of their duties to the Fund. In the normal course of business, the Fund may also enter into contracts that provide general indemnifications. The Fund's maximum exposure under these arrangements is unknown as this would be dependent on future claims that may be made against the Fund. The risk of material loss from such claims is considered remote.
At the end of the period, mutual funds managed by the investment adviser or its affiliates were the owners of record of all of the outstanding shares of the Fund.
Annual Report
To the Trustees of Fidelity Securities Fund and Shareholders of Fidelity Series Blue Chip Growth Fund:
We have audited the accompanying statement of assets and liabilities of Fidelity Series Blue Chip Growth Fund (the Fund), a fund of Fidelity Securities Fund, including the schedule of investments, as of July 31, 2015, and the related statement of operations for the year then ended, and the statement of changes in net assets and financial highlights for the year then ended and for the period from November 7, 2013 (commencement of operations) to July 31, 2014. These financial statements and financial highlights are the responsibility of the Fund's management. Our responsibility is to express an opinion on these financial statements and financial highlights based on our audits.
We conducted our audits in accordance with the standards of the Public Company Accounting Oversight Board (United States). Those standards require that we plan and perform the audit to obtain reasonable assurance about whether the financial statements and financial highlights are free of material misstatement. The Fund is not required to have, nor were we engaged to perform, an audit of its internal control over financial reporting. Our audits included consideration of internal control over financial reporting as a basis for designing audit procedures that are appropriate in the circumstances, but not for the purpose of expressing an opinion on the effectiveness of the Fund's internal control over financial reporting. Accordingly, we express no such opinion. An audit also includes examining, on a test basis, evidence supporting the amounts and disclosures in the financial statements, assessing the accounting principles used and significant estimates made by management, as well as evaluating the overall financial statement presentation. Our procedures included confirmation of securities owned as of July 31, 2015, by correspondence with the custodians and brokers; when replies were not received from brokers, we performed other auditing procedures. We believe that our audits provide a reasonable basis for our opinion.
In our opinion, such financial statements and financial highlights referred to above present fairly, in all material respects, the financial position of Fidelity Series Blue Chip Growth Fund as of July 31, 2015, the results of its operations for the year then ended, and the changes in its net assets, and the financial highlights for the year then ended and for the period from November 7, 2013 (commencement of operations) to July 31, 2014, in conformity with accounting principles generally accepted in the United States of America.
DELOITTE & TOUCHE LLP
Boston, Massachusetts
September 24, 2015
Annual Report
The Trustees, Member of the Advisory Board, and officers of the trust and fund, as applicable, are listed below. The Board of Trustees governs the fund and is responsible for protecting the interests of shareholders. The Trustees are experienced executives who meet periodically throughout the year to oversee the fund's activities, review contractual arrangements with companies that provide services to the fund, oversee management of the risks associated with such activities and contractual arrangements, and review the fund's performance. Each of the Trustees oversees 170 funds.
The Trustees hold office without limit in time except that (a) any Trustee may resign; (b) any Trustee may be removed by written instrument, signed by at least two-thirds of the number of Trustees prior to such removal; (c) any Trustee who requests to be retired or who has become incapacitated by illness or injury may be retired by written instrument signed by a majority of the other Trustees; and (d) any Trustee may be removed at any special meeting of shareholders by a two-thirds vote of the outstanding voting securities of the trust. Each Trustee who is not an interested person (as defined in the 1940 Act) of the trust and the fund (Independent Trustee), shall retire not later than the last day of the calendar year in which his or her 75th birthday occurs. The Independent Trustees may waive this mandatory retirement age policy with respect to individual Trustees. The officers and Advisory Board Member hold office without limit in time, except that any officer and Advisory Board Member may resign or may be removed by a vote of a majority of the Trustees at any regular meeting or any special meeting of the Trustees. Except as indicated, each individual has held the office shown or other offices in the same company for the past five years.
Experience, Skills, Attributes, and Qualifications of the Fund's Trustees. The Governance and Nominating Committee has adopted a statement of policy that describes the experience, qualifications, attributes, and skills that are necessary and desirable for potential Independent Trustee candidates (Statement of Policy). The Board believes that each Trustee satisfied at the time he or she was initially elected or appointed a Trustee, and continues to satisfy, the standards contemplated by the Statement of Policy. The Governance and Nominating Committee also engages professional search firms to help identify potential Independent Trustee candidates who have the experience, qualifications, attributes, and skills consistent with the Statement of Policy. From time to time, additional criteria based on the composition and skills of the current Independent Trustees, as well as experience or skills that may be appropriate in light of future changes to board composition, business conditions, and regulatory or other developments, have also been considered by the professional search firms and the Governance and Nominating Committee. In addition, the Board takes into account the Trustees' commitment and participation in Board and committee meetings, as well as their leadership of standing and ad hoc committees throughout their tenure.
In determining that a particular Trustee was and continues to be qualified to serve as a Trustee, the Board has considered a variety of criteria, none of which, in isolation, was controlling. The Board believes that, collectively, the Trustees have balanced and diverse experience, qualifications, attributes, and skills, which allow the Board to operate effectively in governing the fund and protecting the interests of shareholders. Information about the specific experience, skills, attributes, and qualifications of each Trustee, which in each case led to the Board's conclusion that the Trustee should serve (or continue to serve) as a trustee of the fund, is provided below.
Annual Report
Trustees and Officers - continued
Board Structure and Oversight Function. James C. Curvey is an interested person (as defined in the 1940 Act) and currently serves as Chairman. The Trustees have determined that an interested Chairman is appropriate and benefits shareholders because an interested Chairman has a personal and professional stake in the quality and continuity of services provided to the fund. Independent Trustees exercise their informed business judgment to appoint an individual of their choosing to serve as Chairman, regardless of whether the Trustee happens to be independent or a member of management. The Independent Trustees have determined that they can act independently and effectively without having an Independent Trustee serve as Chairman and that a key structural component for assuring that they are in a position to do so is for the Independent Trustees to constitute a substantial majority for the Board. The Independent Trustees also regularly meet in executive session. Ned C. Lautenbach serves as Chairman of the Independent Trustees and as such (i) acts as a liaison between the Independent Trustees and management with respect to matters important to the Independent Trustees and (ii) with management prepares agendas for Board meetings.
Fidelity funds are overseen by different Boards of Trustees. The fund's Board oversees Fidelity's high income and certain equity funds and other Boards oversee Fidelity's investment-grade bond, money market, asset allocation, and sector funds. The asset allocation funds may invest in Fidelity funds overseen by the fund's Board. The use of separate Boards, each with its own committee structure, allows the Trustees of each group of Fidelity funds to focus on the unique issues of the funds they oversee, including common research, investment, and operational issues. On occasion, the separate Boards establish joint committees to address issues of overlapping consequences for the Fidelity funds overseen by each Board.
The Trustees operate using a system of committees to facilitate the timely and efficient consideration of all matters of importance to the Trustees, the fund, and fund shareholders and to facilitate compliance with legal and regulatory requirements and oversight of the fund's activities and associated risks. The Board, acting through its committees, has charged FMR and its affiliates with (i) identifying events or circumstances the occurrence of which could have demonstrably adverse effects on the fund's business and/or reputation; (ii) implementing processes and controls to lessen the possibility that such events or circumstances occur or to mitigate the effects of such events or circumstances if they do occur; and (iii) creating and maintaining a system designed to evaluate continuously business and market conditions in order to facilitate the identification and implementation processes described in (i) and (ii) above. Because the day-to-day operations and activities of the fund are carried out by or through FMR, its affiliates and other service providers, the fund's exposure to risks is mitigated but not eliminated by the processes overseen by the Trustees. While each of the Board's committees has responsibility for overseeing different aspects of the fund's activities, oversight is exercised primarily through the Operations, Audit, and Compliance Committees. In addition, the Independent Trustees have worked with FMR to enhance the Board's oversight of investment and financial risks, legal and regulatory risks, technology risks, and operational risks, including the development of additional risk reporting to the Board. For example, a working group comprised of Independent Trustees and FMR has worked and continues to work to review the Fidelity funds' valuation-related activities, reporting and risk management. Appropriate personnel, including but not limited to the fund's Chief Compliance Officer (CCO), FMR's internal auditor, the independent accountants, the fund's Treasurer and portfolio management personnel, make periodic reports to the Board's committees, as appropriate, including an annual review of FMR's risk management program for the Fidelity funds. The responsibilities of each standing committee, including their oversight responsibilities, are described further under "Standing Committees of the Fund's Trustees."
Annual Report
The fund's Statement of Additional Information (SAI) includes more information about the Trustees. To request a free copy, call Fidelity at 1-800-544-8544 for Fidelity Series Blue Chip Growth Fund, or 1-800-835-5092 for Class F.
Interested Trustees*:
Correspondence intended for each Trustee who is an interested person may be sent to Fidelity Investments, 245 Summer Street, Boston, Massachusetts 02210.
Name, Year of Birth; Principal Occupations and Other Relevant Experience+ |
James C. Curvey (1935) |
Year of Election or Appointment: 2007 Trustee Chairman of the Board of Trustees |
| Mr. Curvey also serves as Trustee of other Fidelity funds. Mr. Curvey is a Director of Fidelity Research & Analysis Co. (investment adviser firm, 2009-present), and Vice Chairman (2007-present) and Director of FMR LLC (diversified financial services company). In addition, Mr. Curvey serves as an Overseer for the Boston Symphony Orchestra and a member of the board of Artis-Naples, Naples, Florida, and as a Trustee for Brewster Academy, Wolfeboro, New Hampshire. Previously, Mr. Curvey served as a Director of Fidelity Investments Money Management, Inc. (investment adviser firm, 2009-2014), a Director of FMR (investment adviser firm, 2007-2014), and a Director of FMR Co., Inc. (investment adviser firm, 2007-2014). |
Charles S. Morrison (1960) |
Year of Election or Appointment: 2014 Trustee |
| Mr. Morrison also serves as Trustee of other funds. He serves as a Director of Fidelity Investments Money Management, Inc. (FIMM) (investment adviser firm, 2014-present), Director of Fidelity SelectCo, LLC (investment adviser firm, 2014-present), President, Asset Management (2014-present), and is an employee of Fidelity Investments. Previously, Mr. Morrison served as Vice President of Fidelity's Fixed Income and Asset Allocation Funds (2012-2014), President, Fixed Income (2011-2014), Vice President of Fidelity's Money Market Funds (2005-2009), President, Money Market Group Leader of FMR (investment adviser firm, 2009), and Senior Vice President, Money Market Group of FMR (2004-2009). Mr. Morrison also served as Vice President of Fidelity's Bond Funds (2002-2005), certain Balanced Funds (2002-2005), and certain Asset Allocation Funds (2002-2007), and as Senior Vice President (2002-2005) of Fidelity's Bond Division. |
* Trustees have been determined to be "Interested Trustees" by virtue of, among other things, their affiliation with the trust or various entities under common control with FMR.
+ The information above includes each Trustee's principal occupation during the last five years and other information relating to the experience, attributes, and skills relevant to each Trustee's qualifications to serve as a Trustee, which led to the conclusion that each Trustee should serve as a Trustee for the fund.
Annual Report
Independent Trustees:
Correspondence intended for each Independent Trustee (that is, the Trustees other than the Interested Trustees) may be sent to Fidelity Investments, P.O. Box 55235, Boston, Massachusetts 02205-5235.
Name, Year of Birth; Principal Occupations and Other Relevant Experience+ |
Dennis J. Dirks (1948) |
Year of Election or Appointment: 2005 Trustee |
| Mr. Dirks also serves as Trustee of other Fidelity funds. Prior to his retirement in May 2003, Mr. Dirks was Chief Operating Officer and a member of the Board of The Depository Trust & Clearing Corporation (DTCC). He also served as President, Chief Operating Officer, and Board member of The Depository Trust Company (DTC) and President and Board member of the National Securities Clearing Corporation (NSCC). In addition, Mr. Dirks served as Chief Executive Officer and Board member of the Government Securities Clearing Corporation, Chief Executive Officer and Board member of the Mortgage-Backed Securities Clearing Corporation, as a Trustee and a member of the Finance Committee of Manhattan College (2005-2008), and as a Trustee and a member of the Finance Committee of AHRC of Nassau County (2006-2008). Mr. Dirks is a member of the Independent Directors Council (IDC) Governing Council (2010-present) and Board of Directors for The Brookville Center for Children's Services, Inc. (2009-present). |
Alan J. Lacy (1953) |
Year of Election or Appointment: 2008 Trustee |
| Mr. Lacy also serves as Trustee of other Fidelity funds. Mr. Lacy serves as a member of the Board of Directors of Dave & Buster's Entertainment, Inc. (restaurant and entertainment complexes, 2010-present) and Bristol-Myers Squibb Company (global pharmaceuticals, 2008-present). In addition, Mr. Lacy served as Senior Adviser (2007-2014) of Oak Hill Capital Partners, L.P. (private equity) and also served as Chief Executive Officer (2000-2005) and Vice Chairman (2005-2006) of Sears Holdings Corporation and Sears, Roebuck and Co. (retail). Mr. Lacy is a member of the Board of Trustees of The National Parks Conservation Association (2006-present). Previously, Mr. Lacy served as Chairman of the Board of Trustees of the National Parks Conservation Association (2008-2011) and as a member of the Board of Directors for The Western Union Company (global money transfer, 2006-2011), The Hillman Companies, Inc. (hardware wholesalers, 2010-2014), and Earth Fare, Inc. (retail grocery, 2010-2014). |
Ned C. Lautenbach (1944) |
Year of Election or Appointment: 2000 Trustee Chairman of the Independent Trustees |
| Mr. Lautenbach also serves as Trustee of other Fidelity funds. Mr. Lautenbach currently serves as the Lead Director of the Eaton Corporation Board of Directors (diversified industrial, 1997-present). Mr. Lautenbach is Chairman of the Board of Directors of Artis-Naples in Naples, Florida (2012-present), a member of the Council on Foreign Relations (1994-present), and a member of the Board of Governors, State University System of Florida (2013-present). Previously, Mr. Lautenbach was a Partner/Advisory Partner at Clayton, Dubilier & Rice, LLC (private equity investment, 1998-2010), as well as a Director of Sony Corporation (2006-2007). |
Joseph Mauriello (1944) |
Year of Election or Appointment: 2008 Trustee |
| Mr. Mauriello also serves as Trustee of other Fidelity funds. Prior to his retirement in January 2006, Mr. Mauriello served in numerous senior management positions including Deputy Chairman and Chief Operating Officer (2004-2005), and Vice Chairman of Financial Services (2002-2004) of KPMG LLP US (professional services, 1965-2005). Mr. Mauriello currently serves as a member of the Board of Directors of XL Group plc. (global insurance and re-insurance, 2006-present). Previously, Mr. Mauriello served as a Director of the Hamilton Funds of the Bank of New York (2006-2007) and of Arcadia Resources Inc. (health care services and products, 2007-2012). |
Robert W. Selander (1950) |
Year of Election or Appointment: 2011 Trustee |
| Mr. Selander also serves as Trustee of other Fidelity funds. Mr. Selander serves as a Director of The Western Union Company (global money transfer, 2014-present). Previously, Mr. Selander served as a Member of the Advisory Board of other Fidelity funds (2011), and Executive Vice Chairman (2010), Chief Executive Officer (2009-2010), and President and Chief Executive Officer (1997-2009) of Mastercard, Inc. |
Cornelia M. Small (1944) |
Year of Election or Appointment: 2005 Trustee |
| Ms. Small also serves as Trustee of other Fidelity funds. Ms. Small is a member of the Board of Directors (2009-present) and Chair of the Investment Committee (2010-present) of the Teagle Foundation. Ms. Small also serves on the Investment Committee of the Berkshire Taconic Community Foundation (2008-present). Previously, Ms. Small served as Chairperson (2002-2008) and a member of the Investment Committee and Chairperson (2008-2012) and a member of the Board of Trustees of Smith College. In addition, Ms. Small served as Chief Investment Officer, Director of Global Equity Investments, and a member of the Board of Directors of Scudder, Stevens & Clark and Scudder Kemper Investments. |
William S. Stavropoulos (1939) |
Year of Election or Appointment: 2002 Trustee Vice Chairman of the Independent Trustees |
| Mr. Stavropoulos also serves as Trustee of other Fidelity funds. Mr. Stavropoulos serves as President and Founder of the Michigan Baseball Foundation, the Great Lakes Loons (2007-present). Mr. Stavropoulos is Chairman Emeritus of the Board of Directors of The Dow Chemical Company, where he previously served in numerous senior management positions, including President, CEO (1995-2000; 2002-2004), Chairman of the Executive Committee (2000-2006), and as a member of the Board of Directors (1990-2006). Currently, Mr. Stavropoulos is Chairman of the Board of Directors of Univar Inc. (global distributor of commodity and specialty chemicals), a Director of Teradata Corporation (data warehousing and technology solutions), and Maersk Inc. (industrial conglomerate), and a member of the Advisory Board for Metalmark Capital LLC (private equity investment, 2005-present). Mr. Stavropoulos is an operating advisor to Clayton, Dubilier & Rice, LLC (private equity investment). In addition, Mr. Stavropoulos is a member of the University of Notre Dame Advisory Council for the College of Science, a Trustee of the Rollin L. Gerstacker Foundation, and a Director of the Naples Philharmonic Center for the Arts. Previously, Mr. Stavropoulos served as a Director of Chemical Financial Corporation (bank holding company, 1993-2012) and Tyco International, Ltd. (multinational manufacturing and services, 2007-2012). |
David M. Thomas (1949) |
Year of Election or Appointment: 2008 Trustee |
| Mr. Thomas also serves as Trustee of other Fidelity funds. Mr. Thomas serves as Non-Executive Chairman of the Board of Directors of Fortune Brands Home and Security (home and security products, 2011-present), as a member of the Board of Directors (2004-present) and Presiding Director (2013-present) of Interpublic Group of Companies, Inc. (marketing communication), and as a member of the Board of Trustees of the University of Florida (2013-present). Previously, Mr. Thomas served as Executive Chairman (2005-2006) and Chairman and Chief Executive Officer (2000-2005) of IMS Health, Inc. (pharmaceutical and healthcare information solutions), and a Director of Fortune Brands, Inc. (consumer products, 2000-2011). |
+ The information above includes each Trustee's principal occupation during the last five years and other information relating to the experience, attributes, and skills relevant to each Trustee's qualifications to serve as a Trustee, which led to the conclusion that each Trustee should serve as a Trustee for the fund.
Advisory Board Member and Officers:
Correspondence intended for each officer and Peter S. Lynch may be sent to Fidelity Investments, 245 Summer Street, Boston, Massachusetts 02210. Officers appear below in alphabetical order.
Name, Year of Birth; Principal Occupation |
Peter S. Lynch (1944) |
Year of Election or Appointment: 2003 Member of the Advisory Board |
| Mr. Lynch also serves as Member of the Advisory Board of other Fidelity funds. Mr. Lynch is Vice Chairman and a Director of FMR (investment adviser firm) and FMR Co., Inc. (investment adviser firm). In addition, Mr. Lynch serves as a Trustee of Boston College and as the Chairman of the Inner-City Scholarship Fund. Previously, Mr. Lynch served on the Special Olympics International Board of Directors (1997-2006). |
Elizabeth Paige Baumann (1968) |
Year of Election or Appointment: 2012 Anti-Money Laundering (AML) Officer |
| Ms. Baumann also serves as AML Officer of other funds. She is Chief AML Officer of FMR LLC (diversified financial services company, 2012-present) and is an employee of Fidelity Investments. Previously, Ms. Baumann served as Vice President and Deputy Anti-Money Laundering Officer (2007-2012). |
Marc Bryant (1966) |
Year of Election or Appointment: 2015 Secretary and Chief Legal Officer (CLO) |
<R> | Mr. Bryant also serves as Secretary and Chief Legal Officer (CLO) of other funds. He is Senior Vice President and Deputy General Counsel of FMR LLC (diversified financial services company). Previously, Mr. Bryant served as Secretary and Chief Legal Officer of Fidelity Rutland Square Trust II (2010-2014) and Assistant Secretary of Fidelity's Fixed Income and Asset Allocation Funds (2013-2015). Prior to joining Fidelity Investments, Mr. Bryant served as a Senior Vice President and the Head of Global Retail Legal for AllianceBernstein L.P. (2006-2010), and as the General Counsel for ProFund Advisors LLC (2001-2006).</R> |
William C. Coffey (1969) |
Year of Election or Appointment: 2009 Assistant Secretary |
| Mr. Coffey also serves as Assistant Secretary of other funds. He is Senior Vice President and Deputy General Counsel of FMR LLC (diversified financial services company, 2010-present), and is an employee of Fidelity Investments. Previously, Mr. Coffey served as Vice President and Associate General Counsel of FMR LLC (2005-2009). |
Jonathan Davis (1968) |
Year of Election or Appointment: 2010 Assistant Treasurer |
| Mr. Davis also serves as Assistant Treasurer of other funds. Mr. Davis is an employee of Fidelity Investments. Previously, Mr. Davis served as Vice President and Associate General Counsel of FMR LLC (diversified financial services company, 2003-2010). |
Adrien E. Deberghes (1967) |
Year of Election or Appointment: 2008 Deputy Treasurer |
| Mr. Deberghes also serves as an officer of other funds. He is an employee of Fidelity Investments (2008-present). Prior to joining Fidelity Investments, Mr. Deberghes was Senior Vice President of Mutual Fund Administration at State Street Corporation (2007-2008), Senior Director of Mutual Fund Administration at Investors Bank & Trust (2005-2007), and Director of Finance for Dunkin' Brands (2000-2005). |
Stephanie J. Dorsey (1969) |
Year of Election or Appointment: 2010 Assistant Treasurer |
| Ms. Dorsey also serves as an officer of other funds. She is an employee of Fidelity Investments (2008-present) and has served in other fund officer roles. Prior to joining Fidelity Investments, Ms. Dorsey served as Treasurer (2004-2008) of the JPMorgan Mutual Funds and Vice President (2004-2008) of JPMorgan Chase Bank. |
Howard J. Galligan III (1966) |
Year of Election or Appointment: 2014 Chief Financial Officer |
| Mr. Galligan also serves as Chief Financial Officer of other funds. Mr. Galligan serves as President of Fidelity Pricing and Cash Management Services (FPCMS) (2014-present) and as a Director of Strategic Advisers, Inc. (investment adviser firm, 2008-present). Previously, Mr. Galligan served as Chief Administrative Officer of Asset Management (2011-2014) and Chief Operating Officer and Senior Vice President of Investment Support for Strategic Advisers, Inc. (2003-2011). |
Scott C. Goebel (1968) |
Year of Election or Appointment: 2015 Vice President |
| Mr. Goebel serves as an officer of other funds. Mr. Goebel also serves as Secretary of Fidelity SelectCo, LLC (investment adviser firm, 2013-present), Fidelity Investments Money Management, Inc. (FIMM) (investment adviser firm, 2010-present) and Fidelity Research and Analysis Company (FRAC) (investment adviser firm, 2010-present); General Counsel, Secretary, and Senior Vice President of FMR (investment adviser firm, 2008-present) and FMR Co., Inc. (investment adviser firm, 2008-present); Chief Legal Officer of Fidelity Management & Research (Hong Kong) Limited (investment adviser firm, 2008-present); and Assistant Secretary of Fidelity Management & Research (Japan) Limited (investment adviser firm, 2008-present) and FMR Investment Management (U.K.) Limited (investment adviser firm, 2008-present). Previously, Mr. Goebel served as Secretary and CLO of certain Fidelity funds (2008-2015), Assistant Secretary of FIMM (2008-2010), FRAC (2008-2010), and certain funds (2007-2008); and as Vice President and Secretary of Fidelity Distributors Corporation (FDC) (2005-2007). Mr. Goebel has been employed by FMR LLC (diversified financial services company) or an affiliate since 2001. |
Brian B. Hogan (1964) |
Year of Election or Appointment: 2009 Vice President |
| Mr. Hogan also serves as Trustee or Vice President of other funds. Mr. Hogan serves as a Director of Fidelity SelectCo, LLC (investment adviser firm, 2014-present) and President of the Equity Division of FMR (investment adviser firm, 2009-present). Previously, Mr. Hogan served as Senior Vice President, Equity Research of FMR (2006-2009) and as a portfolio manager. |
Chris Maher (1972) |
Year of Election or Appointment: 2013 Assistant Treasurer |
| Mr. Maher serves as Assistant Treasurer of other funds. Mr. Maher is Vice President of Valuation Oversight and is an employee of Fidelity Investments. Previously, Mr. Maher served as Vice President of Asset Management Compliance (2013), Vice President of the Program Management Group of FMR (investment adviser firm, 2010-2013), and Vice President of Valuation Oversight (2008-2010). |
Melissa M. Reilly (1971) |
Year of Election or Appointment: 2014 Vice President of certain Equity Funds |
| Ms. Reilly also serves as Vice President of other funds. Ms. Reilly is an employee of Fidelity Investments (2004-present). |
Kenneth B. Robins (1969) |
Year of Election or Appointment: 2008 President and Treasurer |
| Mr. Robins also serves as an officer of other funds. Mr. Robins serves as Executive Vice President of Fidelity Investments Money Management, Inc. (FIMM) (investment adviser firm, 2013-present) and is an employee of Fidelity Investments (2004-present). Previously, Mr. Robins served in other fund officer roles. |
Stephen Sadoski (1971) |
Year of Election or Appointment: 2012 Deputy Treasurer |
| Mr. Sadoski also serves as Deputy Treasurer of other funds. He is an employee of Fidelity Investments (2012-present) and has served in another fund officer role. Prior to joining Fidelity Investments, Mr. Sadoski served as an assistant chief accountant in the Division of Investment Management of the Securities and Exchange Commission (SEC) (2009-2012) and as a senior manager at Deloitte & Touche LLP (1997-2009). |
Stacie M. Smith (1974) |
Year of Election or Appointment: 2013 Deputy Treasurer |
| Ms. Smith also serves as an officer of other funds. She is an employee of Fidelity Investments (2009-present) and has served in other fund officer roles. Prior to joining Fidelity Investments, Ms. Smith served as Senior Audit Manager of Ernst & Young LLP (1996-2009). |
Renee Stagnone (1975) |
Year of Election or Appointment: 2013 Deputy Treasurer |
| Ms. Stagnone also serves as Deputy Treasurer of other funds. Ms. Stagnone is an employee of Fidelity Investments. |
Linda J. Wondrack (1964) |
Year of Election or Appointment: 2014 Chief Compliance Officer |
| Ms. Wondrack also serves as Chief Compliance Officer of other funds. Ms. Wondrack is Executive Vice President and head of the Ethics Office and Asset Management Compliance for Fidelity Investments (2012-present). Ms. Wondrack also serves as Chief Compliance Officer of Fidelity SelectCo, LLC (investment adviser firm, 2014-present); Chief Compliance Officer of Impresa Management LLC (2013-present); and Chief Compliance Officer of FMR Co., Inc. (investment adviser firm), Fidelity Investments Money Management, Inc. (investment adviser firm), Fidelity Management & Research (Japan) Limited (investment adviser firm), FMR Investment Management (U.K.) Limited (investment adviser firm), Fidelity Management & Research (Hong Kong) (investment adviser firm), Fidelity Management & Research Company (investment adviser firm), Pyramis Global Advisors, LLC (investment adviser firm), and Strategic Advisers, Inc. (investment adviser firm), Ballyrock Investment Advisors LLC, and Northern Neck Investors LLC (2012-present). Previously, Ms. Wondrack served as Senior Vice President and Chief Compliance Officer for Columbia Management Investment Advisers, LLC (2005-2012); Chief Compliance Officer for certain funds within the Columbia Family of Funds (2007-2012); and Senior Vice President of Compliance Risk Management at Bank of America (2005-2010). |
Joseph F. Zambello (1957) |
Year of Election or Appointment: 2011 Deputy Treasurer |
| Mr. Zambello also serves as Deputy Treasurer of other funds. Mr. Zambello is an employee of Fidelity Investments. Previously, Mr. Zambello served as Vice President of the Program Management Group of FMR (investment adviser firm, 2009-2011) and Vice President of the Transfer Agent Oversight Group (2005-2009). |
Annual Report
The Board of Trustees of Fidelity Series Blue Chip Growth Fund voted to pay to shareholders of record at the opening of business on record date, the following distributions per share derived from capital gains realized from sales of portfolio securities; and dividends derived from net investment income:
| Pay Date | Record Date | Dividends | Capital Gains |
Series Blue Chip Growth | 09/14/15 | 09/11/15 | $0.015 | $1.298 |
Class F | 09/14/15 | 09/11/15 | $0.030 | $1.298 |
Series Blue Chip Growth and Class F hereby designate as a capital gain dividend with respect to the taxable year ended July 31, 2015, $617,763,981, or, if subsequently determined to be different, the net capital gain of such year.
Series Blue Chip Growth designates 78% and 100%; Class F designates 69% and 85%; of the dividends distributed in September and December, 2015 as indicated in the Corporate Qualifying memo distributed by the Tax department, respectively during the fiscal year as qualifying for the dividends-received deduction for corporate shareholders.
Series Blue Chip Growth designates 84% and 100%; Class F designates 75% and 94%; of the dividends distributed in September and December, 2015 as indicated in the Qualified Dividend memo distributed by the Tax department, respectively during the fiscal year as amounts which can be taken into account as a dividend for the purposes of the maximum rate under section 1(h)(11) of the Internal Revenue Code.
The fund will notify shareholders in January 2016 of amounts for use in preparing 2015 income tax returns.
Annual Report
Fidelity Series Blue Chip Growth Fund
Each year, the Board of Trustees, including the Independent Trustees (together, the Board), votes on the renewal of the management contract with Fidelity Management & Research Company (FMR) and the sub-advisory agreements (together, the Advisory Contracts) for the fund. The Board, assisted by the advice of fund counsel and Independent Trustees' counsel, requests and considers a broad range of information relevant to the renewal of the Advisory Contracts throughout the year.
The Board meets regularly and, at each of its meetings, covers an extensive agenda of topics and materials and considers factors that are relevant to its annual consideration of the renewal of the fund's Advisory Contracts, including the services and support provided to the fund and its shareholders. The Board has established various standing committees (Committees), each composed of and chaired by Independent Trustees with varying backgrounds, to which the Board has assigned specific subject matter responsibilities in order to enhance effective decision-making by the Board. The Board, acting directly and through its Committees, requests and receives information concerning the annual consideration of the renewal of the fund's Advisory Contracts. The Board also meets as needed to consider matters specifically related to the Board's annual consideration of the renewal of the Advisory Contracts. Members of the Board may also meet with trustees of other Fidelity funds through ad hoc joint committees to discuss certain matters relevant to all of the Fidelity funds.
At its July 2015 meeting, the Board unanimously determined to renew the fund's Advisory Contracts. In reaching its determination, the Board considered all factors it believed relevant, including (i) the nature, extent, and quality of the services to be provided to the fund and its shareholders (including the investment performance of the fund); (ii) the competitiveness of the fund's management fee and total expense ratio relative to peer funds; (iii) the total costs of the services to be provided by and the profits to be realized by Fidelity from its relationship with the fund; and (iv) the extent to which (if any) economies of scale exist and would be realized as the fund grows, and whether any economies of scale are appropriately shared with fund shareholders.
In considering whether to renew the Advisory Contracts for the fund, the Board reached a determination, with the assistance of fund counsel and Independent Trustees' counsel and through the exercise of its business judgment, that the renewal of the Advisory Contracts was in the best interests of the fund and its shareholders and that the compensation payable under the Advisory Contracts was fair and reasonable. The Board's decision to renew the Advisory Contracts was not based on any single factor, but rather was based on a comprehensive consideration of all the information provided to the Board at its meetings throughout the year. The Board, in reaching its determination to renew the Advisory Contracts, was aware that shareholders of the fund have a broad range of investment choices available to them, including a wide choice among funds offered by Fidelity's competitors, and that the fund's shareholders, who have the opportunity to review and weigh the disclosure provided by the fund in its prospectus and other public disclosures, have chosen to invest in this fund, which is part of the Fidelity family of funds.
Annual Report
Board Approval of Investment Advisory Contracts and
Management Fees - continued
Nature, Extent, and Quality of Services Provided. The Board considered Fidelity's staffing as it relates to the fund, including the backgrounds of investment personnel of Fidelity, and also considered the fund's investment objective, strategies, and related investment philosophy. The Independent Trustees also had discussions with senior management of Fidelity's investment operations and investment groups. The Board considered the structure of the portfolio manager compensation program and whether this structure provides appropriate incentives to act in the best interests of the fund. Additionally, the Board considered the portfolio managers' investments, if any, in the funds that they manage.
Resources Dedicated to Investment Management and Support Services. The Board and the Fund Oversight and Research Committees reviewed the general qualifications and capabilities of Fidelity's investment staff, including its size, education, experience, and resources, as well as Fidelity's approach to recruiting, training, managing, and compensating investment personnel. The Board noted that Fidelity has continued to increase the resources devoted to non-U.S. offices, including expansion of Fidelity's global investment organization. The Board also noted that Fidelity's analysts have extensive resources, tools and capabilities that allow them to conduct sophisticated quantitative and fundamental analysis, as well as credit analysis of issuers, counterparties and guarantors. Further, the Board considered that Fidelity's investment professionals have sufficient access to global information and data so as to provide competitive investment results over time, and that those professionals also have access to sophisticated tools that permit them to assess portfolio construction and risk and performance attribution characteristics continuously, as well as to transmit new information and research conclusions rapidly around the world. Additionally, in its deliberations, the Board considered Fidelity's trading, risk management, and compliance capabilities and resources, which are integral parts of the investment management process.
Shareholder and Administrative Services. The Board considered (i) the nature, extent, quality, and cost of advisory, administrative, and shareholder services performed by FMR, the sub-advisers (together with FMR, the Investment Advisers), and their affiliates under the Advisory Contracts and under separate agreements covering transfer agency, pricing and bookkeeping, and securities lending services for the fund; (ii) the nature and extent of the supervision of third party service providers, principally custodians and subcustodians; and (iii) the resources devoted to, and the record of compliance with, the fund's compliance policies and procedures. The Board also reviewed the allocation of fund brokerage, including allocations to brokers affiliated with the Investment Advisers, the use of brokerage commissions to pay fund expenses, and the use of "soft" commission dollars to pay for research services.
Annual Report
The Board noted that the growth of fund assets over time across the complex allows Fidelity to reinvest in the development of services designed to enhance the value or convenience of the Fidelity funds as investment vehicles. These services include 24-hour access to account information and market information through telephone representatives and over the Internet, investor education materials and asset allocation tools, and the expanded availability of Fidelity Investor Centers.
In 2014, the Board formed an ad hoc Committee on Transfer Agency Fees to review the variety of transfer agency fee structures throughout the industry and Fidelity's competitive positioning with respect to industry participants.
Investment in a Large Fund Family. The Board considered the benefits to shareholders of investing in a Fidelity fund, including the benefits of investing in a fund that is part of a large family of funds offering a variety of investment disciplines and providing a large variety of mutual fund investor services. The Board noted that Fidelity had taken, or had made recommendations that resulted in the Fidelity funds taking, a number of actions over the previous year that benefited particular funds, including (i) continuing to dedicate additional resources to investment research and to the support of the senior management team that oversees asset management; (ii) continuing efforts to enhance Fidelity's global research capabilities; (iii) launching new funds and making other enhancements to meet client needs; (iv) reducing management fees and total expenses for certain index funds and diversified international funds; (v) continuing to launch dedicated lower cost underlying funds to meet portfolio construction needs related to expanding underlying fund options for Fidelity funds of funds, specifically for the Freedom Fund product lines; (vi) rationalizing product lines and gaining increased efficiencies through fund mergers; (vii) launching active fixed-income exchange-traded funds; (viii) continuing to develop, acquire and implement systems and technology to improve services to the funds and information security and to increase efficiency; (ix) implementing investment enhancements to further strengthen Fidelity's target date product line to increase investors' probability of success in achieving their goals; (x) modifying the eligibility criteria for certain share classes to accommodate roll-over assets from employer-sponsored retirement plans; (xi) launching a new Class W of the Freedom Index Funds to attract and retain Fidelity record-kept retirement plan assets; and (xii) implementing changes to Fidelity's money market product line in response to recent money market regulatory reforms.
Investment Performance. The Board considered whether the fund has operated in accordance with its investment objective, as well as its record of compliance with its investment restrictions and its performance history.
Annual Report
Board Approval of Investment Advisory Contracts and
Management Fees - continued
The Board took into account discussions with representatives of the Investment Advisers about fund investment performance that occur at Board meetings throughout the year. In this regard the Board noted that as part of regularly scheduled fund reviews and other reports to the Board on fund performance, the Board considers annualized return information for the fund, for different time periods, measured against a securities market index ("benchmark index") and a peer group of funds with similar objectives ("peer group"), if any. In its evaluation of fund investment performance, the Board gave particular attention to information indicating changes in performance of certain Fidelity funds for specific time periods and discussed with the Investment Advisers the reasons for any overperformance or underperformance.
In addition to reviewing absolute and relative fund performance, the Independent Trustees periodically consider the appropriateness of fund performance metrics in evaluating the results achieved. In general, the Independent Trustees believe that fund performance should be evaluated based on net performance (after fees and expenses) of both the highest performing and lowest performing fund share classes, where applicable, compared to appropriate benchmark indices, over appropriate time periods that may include full market cycles, and compared to peer groups, as applicable, over the same periods, taking into account relevant factors including the following: general market conditions; issuer-specific information; and fund cash flows and other factors.
The Independent Trustees recognize that shareholders evaluate performance on a net basis over their own holding periods, for which one-, three-, and five-year periods are often used as a proxy. For this reason, the performance information reviewed by the Board also included net cumulative calendar year total return information for the fund and an appropriate benchmark index and peer group for the most recent one-year period, as shown below. Returns are shown compared to the 25th percentile (top of box, 75% beaten) and 75th percentile (bottom of box, 25% beaten) of the peer universe.
Annual Report
Fidelity Series Blue Chip Growth Fund
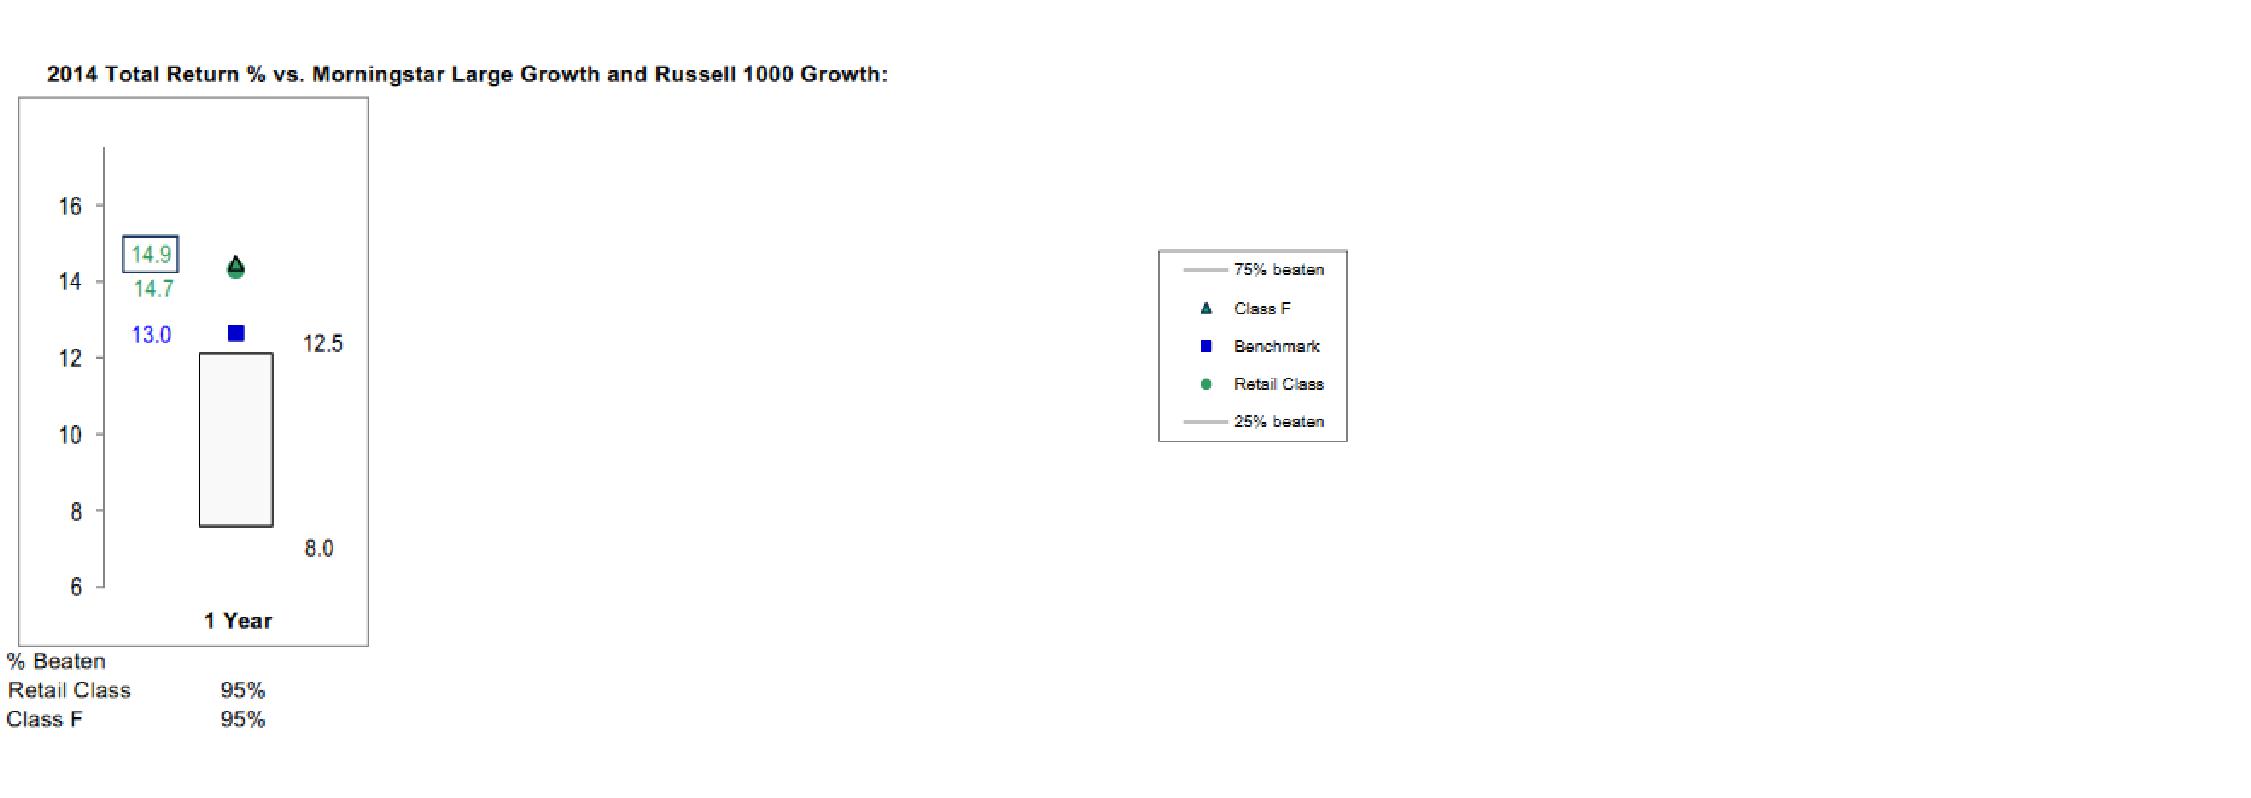
The Board also considered that the fund's management fee is subject to upward or downward adjustment depending upon whether, and to what extent, the fund's investment performance for the performance period exceeds, or is exceeded by, a securities index, thus leading to a performance adjustment for the same period. The Board noted that the performance adjustment provides FMR with a strong economic incentive to seek to achieve superior performance for the fund's shareholders and helps to more closely align the interests of FMR and the shareholders of the fund.
Based on its review, the Board concluded that the nature, extent, and quality of services provided to the fund under the Advisory Contracts should benefit the shareholders of the fund.
Competitiveness of Management Fee and Total Expense Ratio. The Board considered the fund's management fee and total expense ratio compared to "mapped groups" of competitive funds and classes created for the purpose of facilitating the Trustees' competitive analysis of management fees and total expenses. Fidelity creates "mapped groups" by combining similar Lipper investment objective categories that have comparable investment mandates. Combining Lipper investment objective categories aids the Board's management fee and total expense ratio comparisons by broadening the competitive group used for comparison.
Management Fee. The Board considered two proprietary management fee comparisons for the 12-month period shown in basis points (BP) in the chart below. The group of Lipper funds used by the Board for management fee comparisons is referred to below as the "Total Mapped Group." The Total Mapped Group comparison focuses on a fund's standing in terms of gross management fees before expense reimbursements or caps, and without giving effect to the fund's performance adjustment, relative to the total universe of funds with comparable investment mandates, regardless of whether their management fee structures also are comparable. Funds with comparable investment mandates offer exposure to similar types of securities. Funds with comparable management fee structures have similar management fee contractual arrangements (e.g., flat rate charged for advisory services, all-inclusive fee rate, etc.). "TMG %" represents the percentage of funds in the Total Mapped Group that had management fees that were lower than the fund's. For example, a hypothetical TMG % of 20% would mean that 80% of the funds in the Total Mapped Group had higher, and 20% had lower, management fees than the fund. The fund's actual TMG % and the number of funds in the Total Mapped Group are in the chart below. The "Asset-Size Peer Group" (ASPG) comparison focuses on a fund's standing relative to a subset of non-Fidelity funds within the Total Mapped Group that are similar in size and management fee structure without taking into account performance adjustments, if any. For example, if a fund is in the first quartile of the ASPG, the fund's management fee ranks in the least expensive or lowest 25% of funds in the ASPG. The ASPG represents at least 15% of the funds in the Total Mapped Group with comparable asset size and management fee structures, subject to a minimum of 50 funds (or all funds in the Total Mapped Group if fewer than 50). Additional information, such as the ASPG quartile in which the fund's management fee rate ranked and the impact of the fund's performance adjustment, is also included in the chart and considered by the Board.
Annual Report
Board Approval of Investment Advisory Contracts and
Management Fees - continued
Fidelity Series Blue Chip Growth Fund
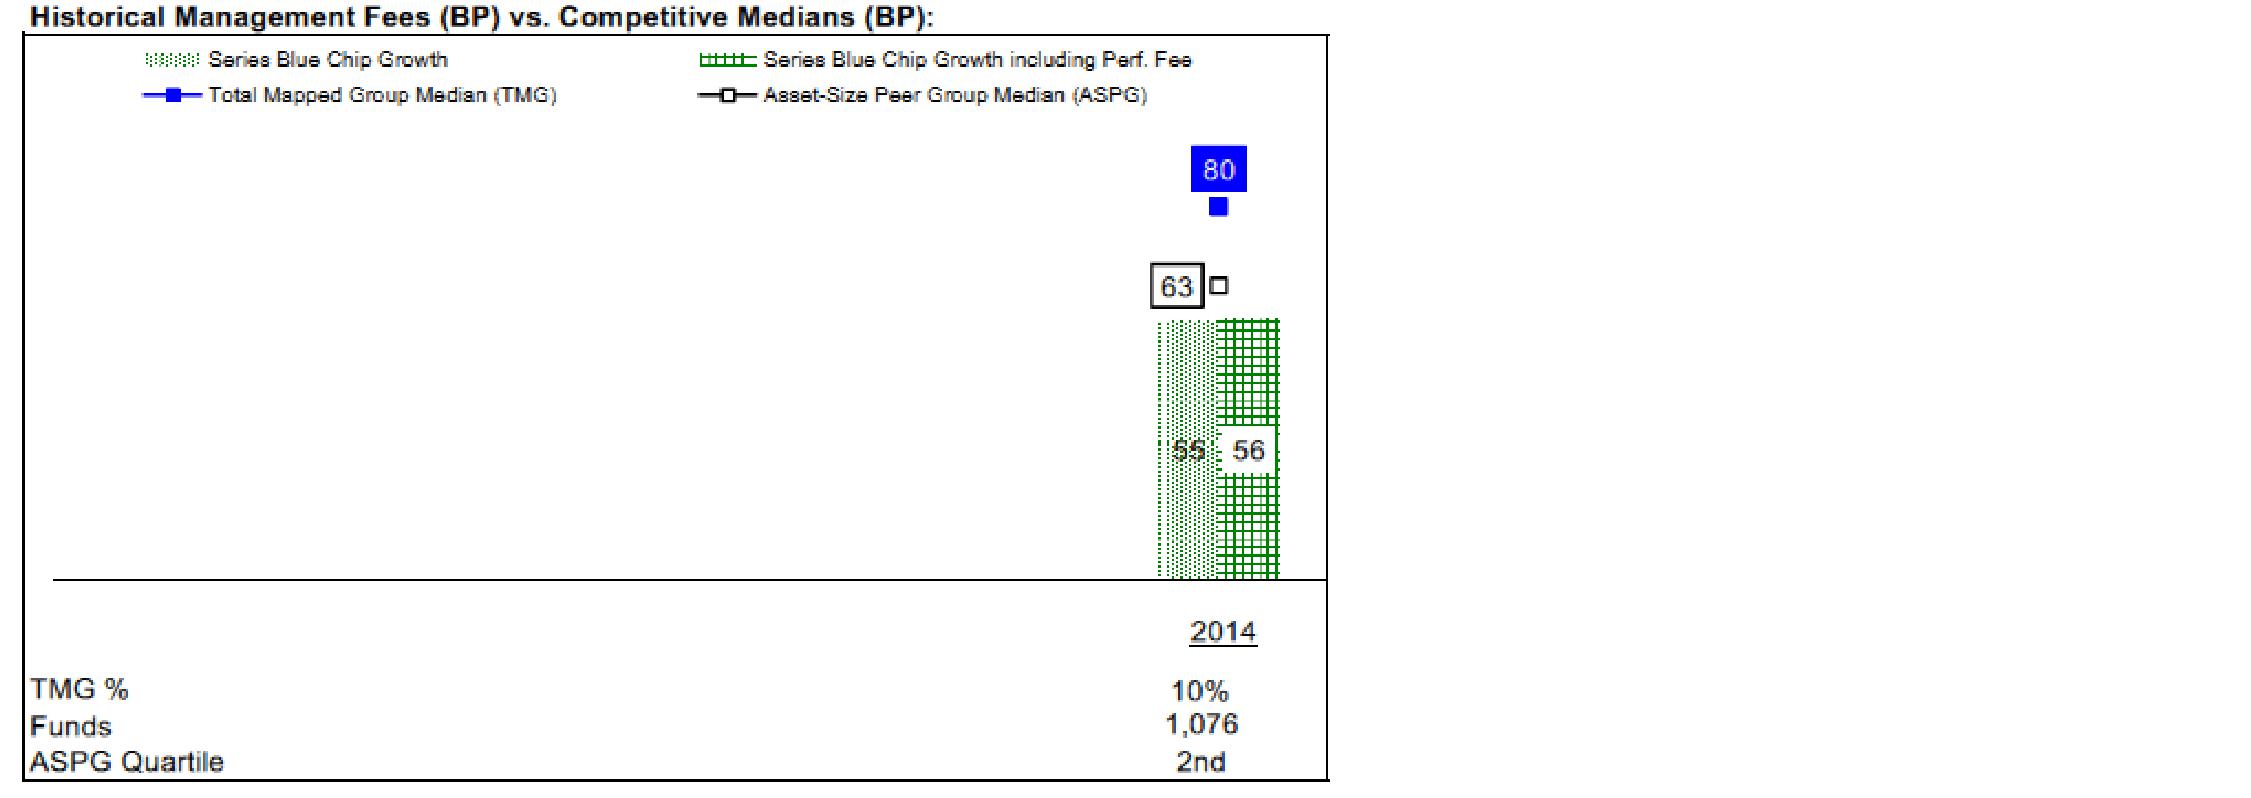
Annual Report
The Board noted that the fund's management fee rate ranked below the median of its Total Mapped Group and below the median of its ASPG for 2014. The Board also noted the effect of the fund's performance adjustment, if any, on the fund's management fee ranking.
The Board noted that, in 2014, the ad hoc Committee on Group Fee was formed by it and other Fidelity fund boards to conduct an in-depth review of the "group fee" component of the management fee of funds with such management fee structures. Committee focus included the mechanics of the group fee, the competitive landscape of group fee structures, Fidelity funds with no group fee component and investment products not included in group fee assets. The Board also considered that, for funds subject to the group fee, FMR agreed to voluntarily waive fees over a specified period of time in amounts designed to account for assets converted from certain funds to certain collective investment trusts.
The Board also noted that, in 2013, the ad hoc Committee on Management Fees was formed to conduct an in-depth review of the management fee rates of Fidelity's active equity mutual funds. The Committee focused on the following areas: (i) standard fee structures; (ii) research consumption and trading evolution; (iii) management fee competitiveness/profitability by category; and (iv) factors that drive institutional pricing.
Based on its review, the Board concluded that the fund's management fee is fair and reasonable in light of the services that the fund receives and the other factors considered.
Total Expense Ratio. In its review of each class's total expense ratio, the Board considered the fund's management fee as well as other fund or class expenses, as applicable, such as transfer agent fees, pricing and bookkeeping fees, and custodial, legal, and audit fees. The Board noted the impact of the fund's performance adjustment. The Board also noted that Fidelity may agree to waive fees and expenses from time to time, and the extent to which, if any, it has done so for the fund. As part of its review, the Board also considered the current total expense ratios of each class of the fund compared to competitive fund median expenses. Each class of the fund is compared to those funds and classes in the Total Mapped Group (used by the Board for management fee comparisons) that have a similar sales load structure.
The Board noted that the total expense ratio of each class ranked below its competitive median for 2014.
Fees Charged to Other Fidelity Clients. The Board also considered Fidelity fee structures and other information with respect to clients of Fidelity, such as other funds advised or subadvised by Fidelity, pension plan clients, and other institutional clients with similar mandates. The Board noted the findings of the 2013 ad hoc joint committee (created with the board of other Fidelity funds), which reviewed and compared Fidelity's institutional investment advisory business with its business of providing services to the Fidelity funds, including the differences in services provided, fees charged, and costs incurred, as well as competition in their respective marketplaces.
Annual Report
Board Approval of Investment Advisory Contracts and
Management Fees - continued
Based on its review of total expense ratios and fees charged to other Fidelity clients, the Board concluded that the total expense ratio of each class of the fund was reasonable in light of the services that the fund and its shareholders receive and the other factors considered.
Costs of the Services and Profitability. The Board considered the revenues earned and the expenses incurred by Fidelity in conducting the business of developing, marketing, distributing, managing, administering and servicing the fund and servicing the fund's shareholders. The Board also considered the level of Fidelity's profits in respect of all the Fidelity funds.
On an annual basis, Fidelity presents to the Board information about the profitability of its relationship with the fund. Fidelity calculates profitability information for each fund, as well as aggregate profitability information for groups of Fidelity funds and all Fidelity funds, using a series of detailed revenue and cost allocation methodologies which originate with the books and records of Fidelity on which Fidelity's audited financial statements are based. The Audit Committee of the Board reviews any significant changes from the prior year's methodologies.
PricewaterhouseCoopers LLP (PwC), independent registered public accounting firm and auditor to Fidelity and certain Fidelity funds, has been engaged annually by the Board as part of the Board's assessment of Fidelity's profitability analysis. PwC's engagement includes the review and assessment of the methodologies used by Fidelity in determining the revenues and expenses attributable to Fidelity's mutual fund business, and completion of agreed-upon procedures in respect of the mathematical accuracy of fund profitability and its conformity to established allocation methodologies. After considering PwC's reports issued under the engagement and information provided by Fidelity, the Board concluded that while other allocation methods may also be reasonable, Fidelity's profitability methodologies are reasonable in all material respects.
The Board also reviewed Fidelity's non-fund businesses and fall-out benefits related to the mutual fund business as well as cases where Fidelity's affiliates may benefit from or be related to the fund's business.
The Board considered the costs of the services provided by and the profits realized by Fidelity in connection with the operation of the fund and was satisfied that the profitability was not excessive.
Economies of Scale. The Board considered whether there have been economies of scale in respect of the management of the Fidelity funds, whether the Fidelity funds (including the fund) have appropriately benefited from any such economies of scale, and whether there is potential for realization of any further economies of scale. The Board considered the extent to which the fund will benefit from economies of scale as assets grow through increased services to the fund, through waivers or reimbursements, or through fee or expense ratio reductions. The Board also noted that in 2013, it and the boards of other Fidelity funds created an ad hoc committee (the Economies of Scale Committee) to analyze whether Fidelity attains economies of scale in respect of the management and servicing of the Fidelity funds, whether the Fidelity funds have appropriately benefited from such economies of scale, and whether there is potential for realization of any further economies of scale.
Annual Report
The Board recognized that the fund's management contract incorporates a "group fee" structure, which provides for lower group fee rates as total group assets increase, and for higher group fee rates as total group assets decrease (with "group assets" defined to include fund assets under FMR's management plus sector fund assets previously under FMR's management and currently managed by Fidelity SelectCo, LLC). FMR calculates the group fee rates based on a tiered asset "breakpoint" schedule that varies based on asset class. The Board considered that the group fee is designed to deliver the benefits of economies of scale to fund shareholders when total Fidelity fund assets increase, even if assets of any particular fund are unchanged or have declined, because some portion of Fidelity's costs are attributable to services provided to all Fidelity funds, and all funds benefit if those costs can be allocated among more assets. The Board also considered that although the fund is offered only to other Fidelity funds, it continues to incur investment management expenses. The Board further noted that the fund may continue to realize benefits from the group fee structure, even though assets may not be expected to grow significantly at the fund level. The Board concluded that, given the group fee structure, fund shareholders will benefit from lower management fees as group assets increase at the fund complex level, regardless of whether Fidelity achieves any such economies of scale.
The Board concluded, taking into account the analysis of the Economies of Scale Committee, that economies of scale, if any, are being appropriately shared between fund shareholders and Fidelity.
Additional Information Requested by the Board. In order to develop fully the factual basis for consideration of the Fidelity funds' Advisory Contracts, the Board requested and received additional information on certain topics, including: (i) fund performance trends and Fidelity's long-term strategies for certain funds; (ii) the various share classes employed by Fidelity and the attributes of each class, together with similar information on the distribution and servicing payments made by Fidelity or the funds to third-party participants in the distribution channels; (iii) fund profitability, and fund performance in relation to fund profitability; (iv) the methodology with respect to evaluating competitive fund data and peer group classifications and fee comparisons; (v) annual fund profitability margins, with particular focus on certain funds with negative margins; (vi) the realization of fall-out benefits in certain Fidelity business units; (vii) economies of scale and the way in which they are shared with fund shareholders; (viii) Fidelity's group fee structures, including the group fee schedule of breakpoints; (ix) the impact of cost containment measures on the funds; and (x) the transfer agent fee structure.
Annual Report
Board Approval of Investment Advisory Contracts and
Management Fees - continued
Based on its evaluation of all of the conclusions noted above, and after considering all factors it believed relevant, the Board concluded that the advisory fee structures are fair and reasonable, and that the fund's Advisory Contracts should be renewed.
Annual Report
Investment Adviser
Fidelity Management & Research Company
Boston, MA
Investment Sub-Advisers
FMR Co., Inc.
Fidelity Management & Research
(Hong Kong) Limited
Fidelity Management & Research
(Japan) Limited
General Distributor
Fidelity Distributors Corporation
Smithfield, RI
Transfer and Service Agents
Fidelity Investments Institutional Operations Company, Inc.
Boston, MA
Fidelity Service Company, Inc.
Boston, MA
Custodian
State Street Bank and Trust Company
Quincy, MA
(Fidelity Investment logo)(registered trademark)
Corporate Headquarters
245 Summer St., Boston, MA 02210
www.fidelity.com
XS1-ANN-0915
1.967985.101
Item 2. Code of Ethics
As of the end of the period, July 31, 2015, Fidelity Securities Fund (the trust) has adopted a code of ethics, as defined in Item 2 of Form N-CSR, that applies to its President and Treasurer and its Chief Financial Officer. A copy of the code of ethics is filed as an exhibit to this Form N-CSR.
Item 3. Audit Committee Financial Expert
The Board of Trustees of the trust has determined that Joseph Mauriello is an audit committee financial expert, as defined in Item 3 of Form N-CSR. Mr. Mauriello is independent for purposes of Item 3 of Form N-CSR.
Item 4. Principal Accountant Fees and Services
Fees and Services
The following table presents fees billed by Deloitte & Touche LLP, the member firms of Deloitte Touche Tohmatsu, and their respective affiliates (collectively, "Deloitte Entities") in each of the last two fiscal years for services rendered to Fidelity Blue Chip Growth Fund, Fidelity OTC Portfolio, Fidelity Real Estate Income Fund, Fidelity Series Blue Chip Growth Fund, Fidelity Series Real Estate Equity Fund, Fidelity Series Real Estate Income Fund, and Fidelity Series Small Cap Opportunities Fund (the "Funds"):
Services Billed by Deloitte Entities
July 31, 2015 FeesA
| Audit Fees | Audit-Related Fees | Tax Fees | All Other Fees |
Fidelity Blue Chip Growth Fund | $51,000 | $- | $5,300 | $4,700 |
Fidelity OTC Portfolio | $47,000 | $- | $5,800 | $3,300 |
Fidelity Real Estate Income Fund | $160,000 | $- | $7,600 | $1,600 |
Fidelity Series Blue Chip Growth Fund | $48,000 | $- | $6,800 | $2,400 |
Fidelity Series Real Estate Equity Fund | $39,000 | $- | $5,800 | $900 |
Fidelity Series Real Estate Income Fund | $76,000 | $- | $6,300 | $800 |
Fidelity Series Small Cap Opportunities Fund | $59,000 | $- | $5,900 | $1,800 |
July 31, 2014 FeesA,B
| Audit Fees | Audit-Related Fees | Tax Fees | All Other Fees |
Fidelity Blue Chip Growth Fund | $52,000 | $- | $5,300 | $4,200 |
Fidelity OTC Portfolio | $44,000 | $- | $5,800 | $2,600 |
Fidelity Real Estate Income Fund | $154,000 | $- | $6,800 | $1,400 |
Fidelity Series Blue Chip Growth Fund | $38,000 | $- | $5,000 | $1,400 |
Fidelity Series Real Estate Equity Fund | $38,000 | $- | $5,800 | $800 |
Fidelity Series Real Estate Income Fund | $74,000 | $- | $5,800 | $700 |
Fidelity Series Small Cap Opportunities Fund | $47,000 | $- | $4,800 | $1,500 |
A Amounts may reflect rounding.
B Fidelity Series Blue Chip Growth Fund commenced operations on November 7, 2013.
The following table presents fees billed by PricewaterhouseCoopers LLP ("PwC") in each of the last two fiscal years for services rendered to Fidelity Blue Chip Value Fund, Fidelity Dividend Growth Fund, Fidelity Growth & Income Portfolio, Fidelity Leveraged Company Stock Fund, Fidelity Small Cap Growth Fund, and Fidelity Small Cap Value Fund (the "Funds"):
Services Billed by PwC
July 31, 2015 FeesA
| Audit Fees | Audit-Related Fees | Tax Fees | All Other Fees |
Fidelity Blue Chip Value Fund | $52,000 | $- | $5,800 | $1,800 |
Fidelity Dividend Growth Fund | $67,000 | $- | $5,000 | $4,700 |
Fidelity Growth & Income Portfolio | $74,000 | $- | $11,100 | $4,400 |
Fidelity Leveraged Company Stock Fund | $56,000 | $- | $4,400 | $3,500 |
Fidelity Small Cap Growth Fund | $52,000 | $- | $6,000 | $2,100 |
Fidelity Small Cap Value Fund | $54,000 | $- | $6,400 | $2,700 |
July 31, 2014 FeesA
| Audit Fees | Audit-Related Fees | Tax Fees | All Other Fees |
Fidelity Blue Chip Value Fund | $51,000 | $- | $3,400 | $1,700 |
Fidelity Dividend Growth Fund | $66,000 | $- | $4,400 | $4,600 |
Fidelity Growth & Income Portfolio | $72,000 | $- | $6,100 | $4,200 |
Fidelity Leveraged Company Stock Fund | $56,000 | $- | $4,500 | $3,500 |
Fidelity Small Cap Growth Fund | $52,000 | $- | $3,600 | $2,200 |
Fidelity Small Cap Value Fund | $54,000 | $- | $3,400 | $2,800 |
A Amounts may reflect rounding.
The following table presents fees billed by PwC and Deloitte Entities that were required to be approved by the Audit Committee for services that relate directly to the operations and financial reporting of the Funds and that are rendered on behalf of Fidelity Management & Research Company ("FMR") and entities controlling, controlled by, or under common control with FMR (not including any sub-adviser whose role is primarily portfolio management and is subcontracted with or overseen by another investment adviser) that provide ongoing services to the Funds ("Fund Service Providers"):
Services Billed by Deloitte Entities
| July 31, 2015A | July 31, 2014A,B |
Audit-Related Fees | $- | $355,000 |
Tax Fees | $- | $- |
All Other Fees | $175,000 | $745,000 |
A Amounts may reflect rounding.
B May include amounts billed prior to the Fidelity Series Blue Chip Growth Fund's commencement of operations.
Services Billed by PwC
| July 31, 2015A | July 31, 2014A |
Audit-Related Fees | $4,480,000 | $5,975,000 |
Tax Fees | $- | $50,000 |
All Other Fees | $- | $- |
A Amounts may reflect rounding.
"Audit-Related Fees" represent fees billed for assurance and related services that are reasonably related to the performance of the fund audit or the review of the fund's financial statements and that are not reported under Audit Fees.
"Tax Fees" represent fees billed for tax compliance, tax advice or tax planning that relate directly to the operations and financial reporting of the fund.
"All Other Fees" represent fees billed for services provided to the fund or Fund Service Provider, a significant portion of which are assurance related, that relate directly to the operations and financial reporting of the fund, excluding those services that are reported under Audit Fees, Audit-Related Fees or Tax Fees.
Assurance services must be performed by an independent public accountant.
* * *
The aggregate non-audit fees billed by PwC and Deloitte Entities for services rendered to the Funds, FMR (not including any sub-adviser whose role is primarily portfolio management and is subcontracted with or overseen by another investment adviser), and any Fund Service Provider for each of the last two fiscal years of the Funds are as follows:
Billed By | July 31, 2015 A | July 31, 2014 A, B |
PwC | $5,815,000 | $7,230,000 |
Deloitte Entities | $595,000 | $1,985,000 |
A Amounts may reflect rounding.
B May include amounts billed prior to the Fidelity Series Blue Chip Growth Fund's commencement of operations.
The trust's Audit Committee has considered non-audit services that were not pre-approved that were provided by PwC and Deloitte Entities to Fund Service Providers to be compatible with maintaining the independence of PwC and Deloitte Entities in their audits of the Funds, taking into account representations from PwC and Deloitte Entities, in accordance with Public Company Accounting Oversight Board rules, regarding their independence from the Funds and their related entities and FMR's review of the appropriateness and permissibility under applicable law of such non-audit services prior to their provision to the Fund Service Providers.
Audit Committee Pre-Approval Policies and Procedures
The trust's Audit Committee must pre-approve all audit and non-audit services provided by a fund's independent registered public accounting firm relating to the operations or financial reporting of the fund. Prior to the commencement of any audit or non-audit services to a fund, the Audit Committee reviews the services to determine whether they are appropriate and permissible under applicable law.
The Audit Committee has adopted policies and procedures to, among other purposes, provide a framework for the Committee's consideration of non-audit services by the audit firms that audit the Fidelity funds. The policies and procedures require that any non-audit service provided by a fund audit firm to a Fidelity fund and any non-audit service provided by a fund auditor to a Fund Service Provider that relates directly to the operations and financial reporting of a Fidelity fund ("Covered Service") are subject to approval by the Audit Committee before such service is provided.
All Covered Services must be approved in advance of provision of the service either: (i) by formal resolution of the Audit Committee, or (ii) by oral or written approval of the service by the Chair of the Audit Committee (or if the Chair is unavailable, such other member of the Audit Committee as may be designated by the Chair to act in the Chair's absence). The approval contemplated by (ii) above is permitted where the Treasurer determines that action on such an engagement is necessary before the next meeting of the Audit Committee.
Non-audit services provided by a fund audit firm to a Fund Service Provider that do not relate directly to the operations and financial reporting of a Fidelity fund are reported to the Audit Committee on a periodic basis.
Non-Audit Services Approved Pursuant to Rule 2-01(c)(7)(i)(C) and (ii) of Regulation S-X ("De Minimis Exception")
There were no non-audit services approved or required to be approved by the Audit Committee pursuant to the De Minimis Exception during the Funds' last two fiscal years relating to services provided to (i) the Funds or (ii) any Fund Service Provider that relate directly to the operations and financial reporting of the Funds.
Item 5. Audit Committee of Listed Registrants
Not applicable.
Item 6. Investments
(a) Not applicable.
(b) Not applicable
Item 7. Disclosure of Proxy Voting Policies and Procedures for Closed-End Management Investment Companies
Not applicable.
Item 8. Portfolio Managers of Closed-End Management Investment Companies
Not applicable.
Item 9. Purchase of Equity Securities by Closed-End Management Investment Company and Affiliated Purchasers
Not applicable.
Item 10. Submission of Matters to a Vote of Security Holders
There were no material changes to the procedures by which shareholders may recommend nominees to the trust's Board of Trustees.
Item 11. Controls and Procedures
(a)(i) The President and Treasurer and the Chief Financial Officer have concluded that the trust's disclosure controls and procedures (as defined in Rule 30a-3(c) under the Investment Company Act) provide reasonable assurances that material information relating to the trust is made known to them by the appropriate persons, based on their evaluation of these controls and procedures as of a date within 90 days of the filing date of this report.
(a)(ii) There was no change in the trust's internal control over financial reporting (as defined in Rule 30a-3(d) under the Investment Company Act) that occurred during the second fiscal quarter of the period covered by this report that has materially affected, or is reasonably likely to materially affect, the trust's internal control over financial reporting.
Item 12. Exhibits
(a) | (1) | Code of Ethics pursuant to Item 2 of Form N-CSR is filed and attached hereto as EX-99.CODE ETH. |
(a) | (2) | Certification pursuant to Rule 30a-2(a) under the Investment Company Act of 1940 (17 CFR 270.30a-2(a)) is filed and attached hereto as Exhibit 99.CERT. |
(a) | (3) | Not applicable. |
(b) | | Certification pursuant to Rule 30a-2(b) under the Investment Company Act of 1940 (17 CFR 270.30a-2(b)) is furnished and attached hereto as Exhibit 99.906CERT. |
SIGNATURES
Pursuant to the requirements of the Securities Exchange Act of 1934 and the Investment Company Act of 1940, the registrant has duly caused this report to be signed on its behalf by the undersigned, thereunto duly authorized.
Fidelity Securities Fund
By: | /s/Kenneth B. Robins |
| Kenneth B. Robins |
| President and Treasurer |
| |
Date: | September 28, 2015 |
Pursuant to the requirements of the Securities Exchange Act of 1934 and the Investment Company Act of 1940, this report has been signed below by the following persons on behalf of the registrant and in the capacities and on the dates indicated.
By: | /s/Kenneth B. Robins |
| Kenneth B. Robins |
| President and Treasurer |
| |
Date: | September 28, 2015 |
By: | /s/Howard J. Galligan III |
| Howard J. Galligan III |
| Chief Financial Officer |
| |
Date: | September 28, 2015 |