UNITED STATES
SECURITIES AND EXCHANGE COMMISSION
Washington, D.C. 20549
FORM N-CSR
CERTIFIED SHAREHOLDER REPORT OF REGISTERED
MANAGEMENT INVESTMENT COMPANIES
Investment Company Act file number 811-4118
Fidelity Securities Fund
(Exact name of registrant as specified in charter)
82 Devonshire St., Boston, Massachusetts 02109
(Address of principal executive offices) (Zip code)
Eric D. Roiter, Secretary
82 Devonshire St.
Boston, Massachusetts 02109
(Name and address of agent for service)
Registrant's telephone number, including area code: 617-563-7000
Date of fiscal year end: | July 31 |
| |
Date of reporting period: | July 31, 2006 |
This report on Form N-CSR relates solely to the Registrant's Fidelity Blue Chip Growth Fund, Fidelity Blue Chip Value Fund, Fidelity Dividend Growth Fund, Fidelity Growth & Income Portfolio, Fidelity International Real Estate Fund, Fidelity Leveraged Company Stock Fund, Fidelity OTC Portfolio, and Fidelity Real Estate Income Fund series (each, a "Fund" and collectively, the "Funds").
Item 1. Reports to Stockholders
Fidelity®
Blue Chip Growth
Fund
Annual Report
July 31, 2006
(2_fidelity_logos) (Registered_Trademark)
Contents
Chairman's Message | <Click Here> | Ned Johnson's message to shareholders. |
Performance | <Click Here> | How the fund has done over time. |
Management's Discussion | <Click Here> | The managers' review of fund performance, strategy and outlook |
Shareholder Expense Example | <Click Here> | An example of shareholder expenses. |
Investment Changes | <Click Here> | A summary of major shifts in the fund's investments over the past six months. |
Investments | <Click Here> | A complete list of the fund's investments with their market values. |
Financial Statements | <Click Here> | Statements of assets and liabilities, operations, and changes in net assets,
as well as financial highlights. |
Notes | <Click Here> | Notes to the financial statements. |
Report of Independent Registered Public Accounting Firm | <Click Here> | |
Trustees and Officers | <Click Here> | |
Distributions | <Click Here> | |
Proxy Voting Results | <Click Here> | |
Board Approval of Investment Advisory Contracts and Management Fees | <Click Here> | |
To view a fund's proxy voting guidelines and proxy voting record for the 12-month period ended June 30, visit www.fidelity.com/proxyvotingresults or visit the Securities and Exchange Commission's (SEC) web site at www.sec.gov. You may also call 1-800-544-8544 to request a free copy of the proxy voting guidelines.
Standard & Poor's, S&P and S&P 500 are registered service marks of The McGraw-Hill Companies, Inc. and have been licensed for use by Fidelity Distributors Corporation.
Other third party marks appearing herein are the property of their respective owners.
All other marks appearing herein are registered or unregistered trademarks or service marks of FMR Corp. or an affiliated company.
Annual Report
This report and the financial statements contained herein are submitted for the general information of the shareholders of the fund. This report is not authorized for distribution to prospective investors in the fund unless preceded or accompanied by an effective prospectus.
A fund files its complete schedule of portfolio holdings with the SEC for the first and third quarters of each fiscal year on Form N-Q. Forms N-Q are available on the SEC's web site at http://www.sec.gov. A fund's Forms N-Q may be reviewed and copied at the SEC's Public Reference Room in Washington, DC. Information regarding the operation of the SEC's Public Reference Room may be obtained by calling 1-800-SEC-0330. For a complete list of a fund's portfolio holdings, view the most recent quarterly holdings report, semiannual report, or annual report on Fidelity's web site at http://www.fidelity.com/holdings.
NOT FDIC INSURED · MAY LOSE VALUE · NO BANK GUARANTEE
Neither the fund nor Fidelity Distributors Corporation is a bank.
Annual Report
Chairman's Message
(photo_of_Edward_C_Johnson_3d)
Dear Shareholder:
Although many securities markets made gains in early 2006, inflation concerns led to mixed results through the year's mid-point. Financial markets are always unpredictable. There are, however, a number of time-tested principles that can put the historical odds in your favor.
One of the basic tenets is to invest for the long term. Over time, riding out the markets' inevitable ups and downs has proven much more effective than selling into panic or chasing the hottest trend. Even missing only a few of the markets' best days can significantly diminish investor returns. Patience also affords the benefits of compounding - of earning interest on additional income or reinvested dividends and capital gains. There are tax advantages and cost benefits to consider as well. The more you sell, the more taxes you pay, and the more you trade, the higher the costs. While staying the course doesn't eliminate risk, it can considerably lessen the effect of short-term declines.
You can further manage your investing risk through diversification. And today, more than ever, geographic diversification should be taken into account. Studies indicate that asset allocation is the single most important determinant of a portfolio's long-term success. The right mix of stocks, bonds and cash - aligned to your particular risk tolerance and investment objective - is very important. Age-appropriate rebalancing is also an essential aspect of asset allocation. For younger investors, an emphasis on equities - which historically have been the best performing asset class over time - is encouraged. As investors near their specific goal, such as retirement or sending a child to college, consideration may be given to replacing volatile assets (e.g. common stocks) with more-stable fixed investments (bonds or savings plans).
A third investment principle - investing regularly - can help lower the average cost of your purchases. Investing a certain amount of money each month or quarter helps ensure you won't pay for all your shares at market highs. This strategy - known as dollar cost averaging - also reduces unconstructive "emotion" from investing, helping shareholders avoid selling weak performers just prior to an upswing, or chasing a hot performer just before a correction.
We invite you to contact us via the Internet, through our Investor Centers or over the phone. It is our privilege to provide you the information you need to make the investments that are right for you.
Sincerely,
/s/Edward C. Johnson 3d
Edward C. Johnson 3d
Annual Report
Performance: The Bottom Line
Average annual total return reflects the change in the value of an investment, assuming reinvestment of the fund's dividend income and capital gains (the profits earned upon the sale of securities that have grown in value) and assuming a constant rate of performance each year. The $10,000 table and the fund's returns do not reflect the deduction of taxes that a shareholder would pay on fund distributions or the redemption of fund shares. During periods of reimbursement by Fidelity, a fund's total return will be greater than it would be had the reimbursement not occurred. How a fund did yesterday is no guarantee of how it will do tomorrow.
Average Annual Total Returns
Periods ended July 31, 2006 | Past 1
year | Past 5
years | Past 10
years |
Fidelity® Blue Chip Growth Fund | -1.97% | -1.11% | 6.15% |
$10,000 Over 10 Years
Let's say hypothetically that $10,000 was invested in Fidelity® Blue Chip Growth Fund on July 31, 1996. The chart shows how the value of your investment would have changed, and also shows how the Russell 1000® Growth Index and the Standard & Poor's 500 IndexSM (S&P 500®) performed over the same period.
Going forward, the fund's performance will be compared to the Russell 1000 Growth Index rather than both the Russell 1000 Growth Index and the S&P 500 Index because the Russell 1000 Growth Index conforms more closely to the fund's investment strategy.
Annual Report
Management's Discussion of Fund Performance
Comments from John McDowell and Brian Hanson, Portfolio Managers of Fidelity® Blue Chip Growth Fund
As measured by the Dow Jones Wilshire 5000 Composite IndexSM - the broadest measure of U.S. equity market performance - stocks did well for most of the 12-month period ending July 31, 2006, before faltering. For the one-year time frame as a whole, the Dow Jones Wilshire benchmark rose 5.43%. That was nearly identical to the 5.38% gain of the Standard & Poor's 500SM Index, a broad market proxy that's a reflection of larger-cap stocks. Stocks were resilient early on, bouncing back quickly after Hurricanes Katrina and Rita caused energy prices to spike to record-high levels. Buoyed by strong corporate earnings and solid economic growth, the S&P 500® ran off six consecutive months of positive returns from November through April. However, stocks pulled back for most of the remainder of the period. A slowdown in economic expansion and consumer spending, reaccelerating energy prices and continued interest rate hikes by the Federal Reserve Board cooled equity performance. Among other widely quoted market yardsticks, the Dow Jones Industrial AverageSM returned 7.59%, while the NASDAQ Composite® Index dropped 3.47%.
The fund fell 1.97% for the 12 months ending July 31, 2006, lagging the S&P 500 and the -0.76% return of the Russell 1000® Growth Index. Unfavorable stock selection in technology and industrials, along with an underweighting in the latter group, were the primary reasons for the fund's shortfall. Among the notable detractors were such technology stocks as EMC, Flextronics and Apple Computer, while not owning such industrial-sector stalwarts as Caterpillar, the heavy equipment maker, also hurt. Flextronics was not held at period end. Overweighting the energy sector, as well as underweighting the consumer discretionary area, provided the biggest boosts to performance relative to the index. Favorable stock picking in the energy and consumer staples sectors helped as well, with oil field services stocks such as Schlumberger and consumer products maker Colgate-Palmolive providing some of the upside strength, while an underweighting in semiconductor giant Intel also was beneficial.
Note to shareholders: In connection with shareholder approval on May 17, 2006, of an amended management contract for the fund, the fund's primary benchmark changed to the Russell 1000 Growth Index from the S&P 500. Fidelity believes the Russell index conforms more closely to the fund's growth-oriented investment strategy. The change became effective on June 1, 2006. Going forward, the fund will compare its performance only to the Russell index.
The views expressed above reflect those of the portfolio manager(s) only through the end of the period as stated on the cover of this report and do not necessarily represent the views of Fidelity or any other person in the Fidelity organization. Any such views are subject to change at any time based upon market or other conditions and Fidelity disclaims any responsibility to update such views. These views may not be relied on as investment advice and, because investment decisions for a Fidelity fund are based on numerous factors, may not be relied on as an indication of trading intent on behalf of any Fidelity fund.
Annual Report
Shareholder Expense Example
As a shareholder of the Fund, you incur two types of costs: (1) transaction costs, and (2) ongoing costs, including management fees and other Fund expenses. This Example is intended to help you understand your ongoing costs (in dollars) of investing in the Fund and to compare these costs with the ongoing costs of investing in other mutual funds.
The Example is based on an investment of $1,000 invested at the beginning of the period and held for the entire period (February 1, 2006 to July 31, 2006).
Actual Expenses
The first line of the accompanying table provides information about actual account values and actual expenses. You may use the information in this line, together with the amount you invested, to estimate the expenses that you paid over the period. Simply divide your account value by $1,000.00 (for example, an $8,600 account value divided by $1,000.00 = 8.6), then multiply the result by the number in the first line under the heading entitled "Expenses Paid During Period" to estimate the expenses you paid on your account during this period. A small balance maintenance fee of $12.00 that is charged once a year may apply for certain accounts with a value of less than $2,000. This fee is not included in the table below. If it was, the estimate of expenses you paid during the period would be higher, and your ending account value lower, by this amount.
Hypothetical Example for Comparison Purposes
The second line of the accompanying table provides information about hypothetical account values and hypothetical expenses based on the Fund's actual expense ratio and an assumed rate of return of 5% per year before expenses, which is not the Fund's actual return. The hypothetical account values and expenses may not be used to estimate the actual ending account balance or expenses you paid for the period. You may use this information to compare the ongoing costs of investing in the Fund and other funds. To do so, compare this 5% hypothetical example with the 5% hypothetical examples that appear in the shareholder reports of the other funds. A small balance maintenance fee of $12.00 that is charged once a year may apply for certain accounts with a value of less than $2,000. This fee is not included in the table below. If it was, the estimate of expenses you paid during the period would be higher, and your ending account value lower, by this amount.
Please note that the expenses shown in the table are meant to highlight your ongoing costs only and do not reflect any transaction costs. Therefore, the second line of the table is useful in comparing ongoing costs only, and will not help you determine the relative total costs of owning different funds.
| Beginning
Account Value
February 1, 2006 | Ending
Account Value
July 31, 2006 | Expenses Paid
During Period*
February 1, 2006
to July 31, 2006 |
Actual | $ 1,000.00 | $ 942.20 | $ 3.03 |
Hypothetical (5% return per year before expenses) | $ 1,000.00 | $ 1,021.67 | $ 3.16 |
* Expenses are equal to the Fund's annualized expense ratio of .63%; multiplied by the average account value over the period, multiplied by 181/365 (to reflect the one-half year period).
Annual Report
Investment Changes
Top Ten Stocks as of July 31, 2006 |
| % of fund's
net assets | % of fund's net assets
6 months ago |
Johnson & Johnson | 4.5 | 3.1 |
General Electric Co. | 4.3 | 3.6 |
American International Group, Inc. | 3.1 | 2.9 |
Microsoft Corp. | 2.9 | 5.0 |
Wal-Mart Stores, Inc. | 2.3 | 2.6 |
Wyeth | 2.2 | 2.0 |
UnitedHealth Group, Inc. | 2.0 | 2.0 |
Apple Computer, Inc. | 1.9 | 1.3 |
Altria Group, Inc. | 1.8 | 1.5 |
Schlumberger Ltd. (NY Shares) | 1.8 | 1.8 |
| 26.8 | |
Top Five Market Sectors as of July 31, 2006 |
| % of fund's
net assets | % of fund's net assets
6 months ago |
Health Care | 25.0 | 22.8 |
Information Technology | 22.9 | 24.4 |
Consumer Staples | 12.8 | 10.4 |
Financials | 10.1 | 11.7 |
Industrials | 9.3 | 7.7 |
Asset Allocation (% of fund's net assets) |
As of July 31, 2006 * | As of January 31, 2006 ** |
 | Stocks 98.7% | | | Stocks 98.8% | |
 | Short-Term
Investments and
Net Other Assets 1.3% | | | Short-Term
Investments and
Net Other Assets 1.2% | |
* Foreign investments | 9.3% | | ** Foreign investments | 9.7% | |

Annual Report
Investments July 31, 2006
Showing Percentage of Net Assets
Common Stocks - 98.7% |
| Shares | | Value (Note 1) (000s) |
CONSUMER DISCRETIONARY - 7.6% |
Hotels, Restaurants & Leisure - 0.3% |
Carnival Corp. unit | 573,900 | | $ 22,359 |
Jack in the Box, Inc. (a) | 200,000 | | 7,888 |
McDonald's Corp. | 711,400 | | 25,176 |
| | 55,423 |
Household Durables - 0.4% |
Sony Corp. sponsored ADR | 1,591,800 | | 73,207 |
Internet & Catalog Retail - 0.0% |
GSI Commerce, Inc. (a) | 474,800 | | 6,096 |
Media - 1.6% |
McGraw-Hill Companies, Inc. | 2,206,100 | | 124,203 |
News Corp. Class B | 5,738,100 | | 115,451 |
Omnicom Group, Inc. | 676,100 | | 59,842 |
Univision Communications, Inc. Class A (a) | 558,100 | | 18,641 |
| | 318,137 |
Multiline Retail - 1.9% |
Federated Department Stores, Inc. | 2,454,200 | | 86,167 |
Target Corp. | 6,194,300 | | 284,442 |
| | 370,609 |
Specialty Retail - 3.4% |
Best Buy Co., Inc. | 4,615,800 | | 209,280 |
Home Depot, Inc. | 5,509,600 | | 191,238 |
O'Reilly Automotive, Inc. (a) | 1,036,300 | | 29,379 |
Staples, Inc. | 7,886,900 | | 170,515 |
Urban Outfitters, Inc. (a) | 3,541,400 | | 51,669 |
| | 652,081 |
Textiles, Apparel & Luxury Goods - 0.0% |
Carter's, Inc. (a) | 186,900 | | 4,076 |
TOTAL CONSUMER DISCRETIONARY | | 1,479,629 |
CONSUMER STAPLES - 12.8% |
Beverages - 1.6% |
PepsiCo, Inc. | 4,974,762 | | 315,300 |
Food & Staples Retailing - 4.1% |
CVS Corp. | 2,771,700 | | 90,690 |
Safeway, Inc. | 300,000 | | 8,424 |
Common Stocks - continued |
| Shares | | Value (Note 1) (000s) |
CONSUMER STAPLES - continued |
Food & Staples Retailing - continued |
Wal-Mart Stores, Inc. | 10,301,755 | | $ 458,428 |
Walgreen Co. | 5,081,300 | | 237,703 |
| | 795,245 |
Food Products - 1.5% |
Archer-Daniels-Midland Co. | 230,000 | | 10,120 |
Bunge Ltd. | 282,000 | | 15,392 |
Cosan SA Industria E Comercio | 130,700 | | 8,461 |
Global Bio-Chem Technology Group Co. Ltd. | 35,330,000 | | 11,867 |
Nestle SA sponsored ADR | 1,933,700 | | 157,790 |
Unilever NV (NY Shares) | 3,468,100 | | 82,125 |
| | 285,755 |
Household Products - 2.4% |
Colgate-Palmolive Co. | 4,961,500 | | 294,316 |
Procter & Gamble Co. | 3,270,130 | | 183,781 |
| | 478,097 |
Personal Products - 1.4% |
Avon Products, Inc. | 9,113,100 | | 264,189 |
Tobacco - 1.8% |
Altria Group, Inc. | 4,485,200 | | 358,681 |
TOTAL CONSUMER STAPLES | | 2,497,267 |
ENERGY - 6.5% |
Energy Equipment & Services - 5.0% |
Baker Hughes, Inc. | 2,711,600 | | 216,792 |
Diamond Offshore Drilling, Inc. | 986,000 | | 77,825 |
Halliburton Co. | 2,849,300 | | 95,053 |
National Oilwell Varco, Inc. (a) | 94,973 | | 6,367 |
Schlumberger Ltd. (NY Shares) | 5,310,300 | | 354,994 |
Transocean, Inc. (a) | 1,382,800 | | 106,794 |
Weatherford International Ltd. (a) | 2,492,800 | | 116,763 |
| | 974,588 |
Oil, Gas & Consumable Fuels - 1.5% |
BP PLC sponsored ADR | 142,100 | | 10,305 |
EOG Resources, Inc. | 1,565,800 | | 116,104 |
Hess Corp. | 390,000 | | 20,631 |
Tesoro Corp. | 235,000 | | 17,578 |
Common Stocks - continued |
| Shares | | Value (Note 1) (000s) |
ENERGY - continued |
Oil, Gas & Consumable Fuels - continued |
Valero Energy Corp. | 1,999,700 | | $ 134,840 |
VeraSun Energy Corp. | 140,000 | | 3,430 |
| | 302,888 |
TOTAL ENERGY | | 1,277,476 |
FINANCIALS - 10.1% |
Capital Markets - 2.2% |
Goldman Sachs Group, Inc. | 165,000 | | 25,204 |
Nomura Holdings, Inc. sponsored ADR | 5,478,000 | | 97,618 |
SBI E*TRADE Securities Co. Ltd. (d) | 6,000 | | 8,007 |
State Street Corp. | 2,942,600 | | 176,733 |
UBS AG (NY Shares) | 2,199,400 | | 119,647 |
| | 427,209 |
Commercial Banks - 1.1% |
Mitsubishi UFJ Financial Group, Inc. sponsored ADR | 8,738,700 | | 121,905 |
Wells Fargo & Co. | 1,187,500 | | 85,904 |
| | 207,809 |
Consumer Finance - 1.9% |
American Express Co. | 4,983,429 | | 259,437 |
SLM Corp. | 2,385,600 | | 119,996 |
| | 379,433 |
Diversified Financial Services - 0.1% |
The NASDAQ Stock Market, Inc. (a) | 1,023,000 | | 28,163 |
Insurance - 4.7% |
AFLAC, Inc. | 1,943,800 | | 85,799 |
AMBAC Financial Group, Inc. | 1,216,600 | | 101,112 |
American International Group, Inc. | 9,999,955 | | 606,697 |
Hartford Financial Services Group, Inc. | 115,000 | | 9,757 |
Prudential Financial, Inc. | 1,552,900 | | 122,120 |
| | 925,485 |
Thrifts & Mortgage Finance - 0.1% |
Fannie Mae | 403,900 | | 19,351 |
TOTAL FINANCIALS | | 1,987,450 |
Common Stocks - continued |
| Shares | | Value (Note 1) (000s) |
HEALTH CARE - 25.0% |
Biotechnology - 4.4% |
Alnylam Pharmaceuticals, Inc. (a) | 282,300 | | $ 3,605 |
Amgen, Inc. (a) | 4,635,700 | | 323,294 |
Biogen Idec, Inc. (a) | 1,650,650 | | 69,525 |
Cephalon, Inc. (a) | 664,500 | | 43,684 |
Genentech, Inc. (a) | 3,649,400 | | 294,945 |
Gilead Sciences, Inc. (a) | 2,114,900 | | 130,024 |
| | 865,077 |
Health Care Equipment & Supplies - 3.7% |
Baxter International, Inc. | 5,087,200 | | 213,662 |
Becton, Dickinson & Co. | 1,331,900 | | 87,799 |
C.R. Bard, Inc. | 2,654,700 | | 188,404 |
Cytyc Corp. (a) | 1,250,500 | | 30,762 |
Medtronic, Inc. | 2,161,400 | | 109,194 |
St. Jude Medical, Inc. (a) | 2,598,800 | | 95,896 |
| | 725,717 |
Health Care Providers & Services - 5.0% |
Acibadem Saglik Hizmetleri AS | 1,500,000 | | 15,124 |
Aetna, Inc. | 1,939,000 | | 61,059 |
Cardinal Health, Inc. | 2,288,575 | | 153,335 |
McKesson Corp. | 372,600 | | 18,775 |
Medco Health Solutions, Inc. (a) | 1,832,000 | | 108,693 |
Omnicare, Inc. | 1,471,800 | | 66,614 |
UnitedHealth Group, Inc. | 7,955,400 | | 380,507 |
WellPoint, Inc. (a) | 2,322,000 | | 172,989 |
| | 977,096 |
Life Sciences Tools & Services - 0.9% |
Fisher Scientific International, Inc. (a) | 636,500 | | 47,171 |
Millipore Corp. (a) | 1,346,000 | | 84,327 |
Waters Corp. (a) | 1,396,500 | | 56,810 |
| | 188,308 |
Pharmaceuticals - 11.0% |
Allergan, Inc. | 1,282,000 | | 138,264 |
Barr Pharmaceuticals, Inc. (a) | 1,332,300 | | 66,295 |
Johnson & Johnson | 13,956,204 | | 872,956 |
Merck & Co., Inc. | 5,599,200 | | 225,480 |
Nastech Pharmaceutical Co., Inc. (a)(d)(e) | 2,095,100 | | 28,514 |
Novartis AG sponsored ADR | 4,345,700 | | 244,315 |
Pfizer, Inc. | 581,000 | | 15,100 |
Common Stocks - continued |
| Shares | | Value (Note 1) (000s) |
HEALTH CARE - continued |
Pharmaceuticals - continued |
Schering-Plough Corp. | 6,129,700 | | $ 125,291 |
Wyeth | 8,881,000 | | 430,462 |
| | 2,146,677 |
TOTAL HEALTH CARE | | 4,902,875 |
INDUSTRIALS - 9.3% |
Aerospace & Defense - 2.5% |
Honeywell International, Inc. | 5,807,200 | | 224,739 |
Rockwell Collins, Inc. | 1,617,400 | | 86,321 |
United Technologies Corp. | 2,911,900 | | 181,091 |
| | 492,151 |
Air Freight & Logistics - 0.6% |
FedEx Corp. | 1,080,900 | | 113,181 |
Construction & Engineering - 0.9% |
Fluor Corp. | 1,864,700 | | 163,777 |
Jacobs Engineering Group, Inc. (a) | 212,000 | | 17,594 |
| | 181,371 |
Electrical Equipment - 0.2% |
Roper Industries, Inc. | 562,200 | | 25,411 |
Vestas Wind Systems AS (a) | 360,700 | | 9,725 |
| | 35,136 |
Industrial Conglomerates - 4.7% |
3M Co. | 1,126,800 | | 79,327 |
General Electric Co. | 25,403,600 | | 830,444 |
| | 909,771 |
Machinery - 0.1% |
Deere & Co. | 288,800 | | 20,958 |
Road & Rail - 0.3% |
Burlington Northern Santa Fe Corp. | 915,400 | | 63,080 |
TOTAL INDUSTRIALS | | 1,815,648 |
INFORMATION TECHNOLOGY - 22.9% |
Communications Equipment - 4.7% |
Alcatel SA sponsored ADR (a)(d) | 10,277,800 | | 115,934 |
AudioCodes Ltd. (a)(e) | 3,433,500 | | 33,305 |
Avaya, Inc. (a) | 1,208,600 | | 11,192 |
Common Stocks - continued |
| Shares | | Value (Note 1) (000s) |
INFORMATION TECHNOLOGY - continued |
Communications Equipment - continued |
Cisco Systems, Inc. (a) | 12,039,100 | | $ 214,898 |
CommScope, Inc. (a) | 581,500 | | 18,160 |
Corning, Inc. | 6,603,500 | | 125,929 |
Harris Corp. | 2,088,300 | | 95,122 |
Lucent Technologies, Inc. (a) | 9,800,000 | | 20,874 |
QUALCOMM, Inc. | 7,233,500 | | 255,053 |
Sonus Networks, Inc. (a) | 5,896,178 | | 26,415 |
| | 916,882 |
Computers & Peripherals - 3.7% |
Apple Computer, Inc. (a) | 5,596,000 | | 380,304 |
EMC Corp. (a) | 15,618,000 | | 158,523 |
Hewlett-Packard Co. | 4,555,400 | | 145,363 |
Intermec, Inc. (a) | 1,113,373 | | 27,166 |
Rackable Systems, Inc. (a) | 551,600 | | 11,760 |
| | 723,116 |
Electronic Equipment & Instruments - 0.6% |
Hon Hai Precision Industry Co. Ltd. (Foxconn) | 1,682,000 | | 9,965 |
Jabil Circuit, Inc. | 3,294,900 | | 76,112 |
National Instruments Corp. | 793,158 | | 22,010 |
| | 108,087 |
Internet Software & Services - 3.2% |
aQuantive, Inc. (a)(d) | 1,112,000 | | 22,796 |
eBay, Inc. (a) | 3,449,300 | | 83,025 |
Google, Inc. Class A (sub. vtg.) (a) | 893,600 | | 345,466 |
Yahoo! Japan Corp. | 32,000 | | 13,537 |
Yahoo!, Inc. (a) | 6,292,164 | | 170,769 |
| | 635,593 |
IT Services - 1.8% |
Affiliated Computer Services, Inc. Class A (a) | 1,303,800 | | 66,403 |
Cognizant Technology Solutions Corp. Class A (a) | 1,316,300 | | 86,204 |
First Data Corp. | 4,917,400 | | 200,876 |
| | 353,483 |
Office Electronics - 0.0% |
Zebra Technologies Corp. Class A (a) | 200,000 | | 6,270 |
Semiconductors & Semiconductor Equipment - 4.3% |
Advanced Analogic Technologies, Inc. | 500,000 | | 4,705 |
Altera Corp. (a) | 2,846,100 | | 49,266 |
Analog Devices, Inc. | 3,161,300 | | 102,205 |
Common Stocks - continued |
| Shares | | Value (Note 1) (000s) |
INFORMATION TECHNOLOGY - continued |
Semiconductors & Semiconductor Equipment - continued |
Applied Materials, Inc. | 8,793,200 | | $ 138,405 |
Cree, Inc. (a)(d) | 704,700 | | 13,904 |
Cypress Semiconductor Corp. (a) | 850,000 | | 12,912 |
Intel Corp. | 8,787,640 | | 158,178 |
KLA-Tencor Corp. | 1,782,200 | | 75,191 |
Linear Technology Corp. | 235,000 | | 7,602 |
Marvell Technology Group Ltd. (a) | 2,993,200 | | 55,524 |
Microchip Technology, Inc. | 2,131,800 | | 68,772 |
PMC-Sierra, Inc. (a) | 2,732,100 | | 13,961 |
Renewable Energy Corp. AS | 1,840,700 | | 24,748 |
Saifun Semiconductors Ltd. | 549,900 | | 14,435 |
Samsung Electronics Co. Ltd. | 121,380 | | 77,264 |
Silicon Laboratories, Inc. (a) | 143,300 | | 5,291 |
Teradyne, Inc. (a) | 1,448,900 | | 19,039 |
| | 841,402 |
Software - 4.6% |
Autodesk, Inc. (a) | 1,055,600 | | 36,007 |
Citrix Systems, Inc. (a) | 1,568,300 | | 49,825 |
Cognos, Inc. (a) | 300,000 | | 9,375 |
Electronic Arts, Inc. (a) | 1,875,300 | | 88,345 |
Hyperion Solutions Corp. (a) | 635,000 | | 19,787 |
Microsoft Corp. | 23,745,200 | | 570,597 |
Oracle Corp. (a) | 8,595,000 | | 128,667 |
| | 902,603 |
TOTAL INFORMATION TECHNOLOGY | | 4,487,436 |
MATERIALS - 2.5% |
Chemicals - 1.9% |
Monsanto Co. | 3,933,000 | | 169,080 |
Potash Corp. of Saskatchewan, Inc. | 840,800 | | 79,456 |
Praxair, Inc. | 2,117,700 | | 116,135 |
Tokuyama Corp. | 551,600 | | 7,327 |
| | 371,998 |
Common Stocks - continued |
| Shares | | Value (Note 1) (000s) |
MATERIALS - continued |
Metals & Mining - 0.6% |
Allegheny Technologies, Inc. | 1,505,000 | | $ 96,154 |
Oregon Steel Mills, Inc. (a) | 300,000 | | 13,872 |
| | 110,026 |
TOTAL MATERIALS | | 482,024 |
TELECOMMUNICATION SERVICES - 2.0% |
Diversified Telecommunication Services - 1.4% |
AT&T, Inc. | 6,195,900 | | 185,815 |
Cbeyond, Inc. (d) | 350,000 | | 6,258 |
Verizon Communications, Inc. | 2,254,100 | | 76,234 |
| | 268,307 |
Wireless Telecommunication Services - 0.6% |
American Tower Corp. Class A (a) | 3,452,300 | | 116,688 |
TOTAL TELECOMMUNICATION SERVICES | | 384,995 |
TOTAL COMMON STOCKS (Cost $17,709,000) | 19,314,800 |
Convertible Preferred Stocks - 0.0% |
| | | |
INFORMATION TECHNOLOGY - 0.0% |
Communications Equipment - 0.0% |
Chorum Technologies, Inc. Series E (a)(f) | 132,000 | | 0 |
TOTAL CONVERTIBLE PREFERRED STOCKS (Cost $1,980) | 0 |
Money Market Funds - 1.8% |
| Shares | | Value (Note 1)
(000s) |
Fidelity Cash Central Fund, 5.3% (b) | 333,836,053 | | $ 333,836 |
Fidelity Securities Lending Cash Central Fund, 5.32% (b)(c) | 21,559,254 | | 21,559 |
TOTAL MONEY MARKET FUNDS (Cost $355,395) | 355,395 |
| | | |
TOTAL INVESTMENT PORTFOLIO - 100.5% (Cost $18,066,375) | | 19,670,195 |
| | | |
NET OTHER ASSETS - (0.5)% | | (99,337) |
NET ASSETS - 100% | $ 19,570,858 |
Legend |
(a) Non-income producing |
(b) Affiliated fund that is available only to investment companies and other accounts managed by Fidelity Investments. The rate quoted is the annualized seven-day yield of the fund at period end. A complete unaudited listing of the fund's holdings as of its most recent quarter end is available upon request. |
(c) Investment made with cash collateral received from securities on loan. |
(d) Security or a portion of the security is on loan at period end. |
(e) Affiliated company |
(f) Restricted securities - Investment in securities not registered under the Securities Act of 1933 (excluding 144A issues). At the end of the period, the value of restricted securities (excluding 144A issues) amounted to $0 or 0.0% of net assets. |
Additional information on each holding is as follows: |
Security | Acquisition Date | Acquisition Cost (000s) |
Chorum Technologies, Inc. Series E | 9/19/00 | $ 1,980 |
Affiliated Central Funds |
Information regarding fiscal year to date income earned by the fund from the affiliated Central funds is as follows: |
Fund | Income earned
(Amounts in
thousands) |
Fidelity Cash Central Fund | $ 10,434 |
Fidelity Securities Lending Cash Central Fund | 1,425 |
Total | $ 11,859 |
Other Affiliated Issuers |
An affiliated company is a company in which the fund has ownership of at least 5% of the voting securities. Fiscal year to date transactions with companies which are or were affiliates are as follows: |
Affiliates
(Amounts in thousands) | Value, beginning of period | Purchases | Sales Proceeds | Dividend Income | Value, end of period |
AudioCodes Ltd. | $ 16,894 | $ 18,573 | $ - | $ - | $ 33,305 |
Nastech Pharmaceutical Co., Inc. | 20,455 | 11,022 | - | - | 28,514 |
Total | $ 37,349 | $ 29,595 | $ - | $ - | $ 61,819 |
See accompanying notes which are an integral part of the financial statements.
Annual Report
Financial Statements
Statement of Assets and Liabilities
Amounts in thousands (except per-share amount) | July 31, 2006 |
Assets | | |
Investment in securities, at value (including securities loaned of $20,683) - See accompanying schedule: Unaffiliated issuers (cost $17,644,437) | $ 19,252,981 | |
Affiliated Central Funds (cost $355,395) | 355,395 | |
Other affiliated issuers (cost $66,543) | 61,819 | |
Total Investments (cost $18,066,375) | | $ 19,670,195 |
Receivable for investments sold | | 76,982 |
Receivable for fund shares sold | | 15,602 |
Dividends receivable | | 7,292 |
Interest receivable | | 1,280 |
Prepaid expenses | | 34 |
Other receivables | | 473 |
Total assets | | 19,771,858 |
| | |
Liabilities | | |
Payable to custodian bank | $ 220 | |
Payable for investments purchased | 84,816 | |
Payable for fund shares redeemed | 82,932 | |
Accrued management fee | 5,543 | |
Other affiliated payables | 4,716 | |
Other payables and accrued expenses | 1,214 | |
Collateral on securities loaned, at value | 21,559 | |
Total liabilities | | 201,000 |
| | |
Net Assets | | $ 19,570,858 |
Net Assets consist of: | | |
Paid in capital | | $ 17,379,814 |
Undistributed net investment income | | 58,948 |
Accumulated undistributed net realized gain (loss) on investments and foreign currency transactions | | 528,275 |
Net unrealized appreciation (depreciation) on investments and assets and liabilities in foreign currencies | | 1,603,821 |
Net Assets, for 471,100 shares outstanding | | $ 19,570,858 |
Net Asset Value, offering price and redemption price per share ($19,570,858 ÷ 471,100 shares) | | $ 41.54 |
See accompanying notes which are an integral part of the financial statements.
Annual Report
Financial Statements - continued
Statement of Operations
Amounts in thousands | Year ended July 31, 2006 |
Investment Income | | |
Dividends | | $ 236,666 |
Interest | | 207 |
Income from affiliated Central Funds | | 11,859 |
Total income | | 248,732 |
| | |
Expenses | | |
Management fee
Basic fee | $ 122,546 | |
Performance adjustment | (43,118) | |
Transfer agent fees | 52,626 | |
Accounting and security lending fees | 1,718 | |
Independent trustees' compensation | 89 | |
Appreciation in deferred trustee compensation account | 14 | |
Custodian fees and expenses | 419 | |
Registration fees | 60 | |
Audit | 161 | |
Legal | 274 | |
Interest | 21 | |
Miscellaneous | 1,886 | |
Total expenses before reductions | 136,696 | |
Expense reductions | (4,249) | 132,447 |
Net investment income (loss) | | 116,285 |
Realized and Unrealized Gain (Loss) Net realized gain (loss) on: | | |
Investment securities: | | |
Unaffiliated issuers | 1,816,959 | |
Foreign currency transactions | 934 | |
Total net realized gain (loss) | | 1,817,893 |
Change in net unrealized appreciation (depreciation) on: Investment securities | (2,279,587) | |
Assets and liabilities in foreign currencies | (1) | |
Total change in net unrealized appreciation (depreciation) | | (2,279,588) |
Net gain (loss) | | (461,695) |
Net increase (decrease) in net assets resulting from operations | | $ (345,410) |
See accompanying notes which are an integral part of the financial statements.
Annual Report
Statement of Changes in Net Assets
Amounts in thousands | Year ended
July 31,
2006 | Year ended
July 31,
2005 |
Increase (Decrease) in Net Assets | | |
Operations | | |
Net investment income (loss) | $ 116,285 | $ 236,112 |
Net realized gain (loss) | 1,817,893 | 1,609,034 |
Change in net unrealized appreciation (depreciation) | (2,279,588) | 529,332 |
Net increase (decrease) in net assets resulting
from operations | (345,410) | 2,374,478 |
Distributions to shareholders from net investment income | (120,771) | (220,167) |
Share transactions
Proceeds from sales of shares | 3,136,779 | 3,792,068 |
Reinvestment of distributions | 118,853 | 214,432 |
Cost of shares redeemed | (6,099,360) | (5,382,182) |
Net increase (decrease) in net assets resulting from share transactions | (2,843,728) | (1,375,682) |
Total increase (decrease) in net assets | (3,309,909) | 778,629 |
| | |
Net Assets | | |
Beginning of period | 22,880,767 | 22,102,138 |
End of period (including undistributed net investment income of $58,948 and undistributed net investment income of $63,702, respectively) | $ 19,570,858 | $ 22,880,767 |
Other Information Shares | | |
Sold | 73,088 | 94,109 |
Issued in reinvestment of distributions | 2,760 | 5,283 |
Redeemed | (141,905) | (133,003) |
Net increase (decrease) | (66,057) | (33,611) |
See accompanying notes which are an integral part of the financial statements.
Annual Report
Financial Highlights
Years ended July 31, | 2006 | 2005 | 2004 | 2003 | 2002 |
Selected Per-Share Data | | | | | |
Net asset value, beginning
of period | $ 42.60 | $ 38.72 | $ 36.13 | $ 33.24 | $ 45.08 |
Income from Investment Operations | | | | | |
Net investment income (loss) B | .23 | .42 C | .19 | .21 | .10 |
Net realized and unrealized gain (loss) | (1.06) | 3.85 | 2.62 | 2.81 | (11.88) |
Total from investment operations | (.83) | 4.27 | 2.81 | 3.02 | (11.78) |
Distributions from net
investment income | (.23) | (.39) | (.22) | (.13) | (.06) |
Net asset value, end of period | $ 41.54 | $ 42.60 | $ 38.72 | $ 36.13 | $ 33.24 |
Total Return A | (1.97)% | 11.08% | 7.79% | 9.13% | (26.16)% |
Ratios to Average Net Assets D | | | | | |
Expenses before reductions | .63% | .66% | .68% | .71% | .76% |
Expenses net of fee waivers, if any | .63% | .66% | .68% | .71% | .76% |
Expenses net of all reductions | .61% | .64% | .67% | .69% | .74% |
Net investment income (loss) | .54% | 1.05% C | .48% | .64% | .25% |
Supplemental Data | | | | | |
Net assets, end of period
(in millions) | $ 19,571 | $ 22,881 | $ 22,102 | $ 19,936 | $ 17,021 |
Portfolio turnover rate | 48% | 29% | 23% | 24% | 33% |
A Total returns would have been lower had certain expenses not been reduced during the periods shown.
B Calculated based on average shares outstanding during the period.
C Investment income per share reflects a special dividend which amounted to $.20 per share. Excluding the special dividend, the ratio of net investment income (loss) to average net assets would have been .56%.
D Expense ratios reflect operating expenses of the Fund. Expenses before reductions do not reflect amounts reimbursed by the investment adviser or reductions from brokerage service arrangements or other expense offset arrangements and do not represent the amount paid by the Fund during periods when reimbursements or reductions occur. Expenses net of fee waivers reflect expenses after reimbursement by the investment adviser but prior to reductions from brokerage service arrangements or other expense offset arrangements. Expenses net of all reductions represent the net expenses paid by the Fund.
See accompanying notes which are an integral part of the financial statements.
Annual Report
Notes to Financial Statements
For the period ended July 31, 2006
(Amounts in thousands except ratios)
1. Significant Accounting Policies.
Fidelity Blue Chip Growth Fund (the Fund) is a fund of Fidelity Securities Fund (the trust) and is authorized to issue an unlimited number of shares. The trust is registered under the Investment Company Act of 1940, as amended (the 1940 Act), as an open-end management investment company organized as a Massachusetts business trust. The Fund may invest in affiliated money market central funds (Money Market Central Funds), which are open-end investment companies available to investment companies and other accounts managed by Fidelity Management & Research Company (FMR) and its affiliates. The financial statements have been prepared in conformity with accounting principles generally accepted in the United States of America, which require management to make certain estimates and assumptions at the date of the financial statements. The following summarizes the significant accounting policies of the Fund:
Security Valuation. Investments are valued and net asset value (NAV) per share is calculated (NAV calculation) as of the close of business of the New York Stock Exchange (NYSE), normally 4:00 p.m. Eastern time. Wherever possible, the Fund uses independent pricing services approved by the Board of Trustees to value its investments.
Equity securities, including restricted securities, for which market quotations are readily available, are valued at the last reported sale price or official closing price as reported by an independent pricing service on the primary market or exchange on which they are traded. In the event there were no sales during the day or closing prices are not available, securities are valued at the last quoted bid price. Investments in open-end mutual funds are valued at their closing net asset value each business day. Short-term securities with remaining maturities of sixty days or less for which quotations are not readily available are valued at amortized cost, which approximates value.
When current market prices or quotations are not readily available or do not accurately reflect fair value, valuations may be determined in accordance with procedures adopted by the Board of Trustees. For example, when developments occur between the close of a market and the close of the NYSE that may materially affect the value of some or all of the securities, or when trading in a security is halted, those securities may be fair valued. Factors used in the determination of fair value may include monitoring news to identify significant market or security specific events such as changes in the value of U.S. securities markets, reviewing developments in foreign markets and evaluating the performance of ADRs, futures contracts and exchange-traded funds. Because the Fund's utilization of fair value pricing depends on market activity, the frequency with which fair value pricing is used can not be predicted and may be utilized to a significant extent. The value of securities used for NAV calculation under fair value pricing may differ from published prices for the same securities.
Annual Report
Notes to Financial Statements - continued
(Amounts in thousands except ratios)
1. Significant Accounting Policies - continued
Foreign Currency. The Fund uses foreign currency contracts to facilitate transactions in foreign-denominated securities. Losses from these transactions may arise from changes in the value of the foreign currency or if the counterparties do not perform under the contracts' terms.
Foreign-denominated assets, including investment securities, and liabilities are translated into U.S. dollars at the exchange rate at period end. Purchases and sales of investment securities, income and dividends received and expenses denominated in foreign currencies are translated into U.S. dollars at the exchange rate in effect on the transaction date.
The effects of exchange rate fluctuations on investments are included with the net realized and unrealized gain (loss) on investment securities. Other foreign currency transactions resulting in realized and unrealized gain (loss) are disclosed separately.
Investment Transactions and Income. Security transactions are accounted for as of trade date. Gains and losses on securities sold are determined on the basis of identified cost and may include proceeds received from litigation. Dividend income is recorded on the ex-dividend date, except for certain dividends from foreign securities where the ex-dividend date may have passed, which are recorded as soon as the Fund is informed of the ex-dividend date. Non-cash dividends included in dividend income, if any, are recorded at the fair market value of the securities received. Distributions received on securities that represent a return of capital or capital gain are recorded as a reduction of cost of investments and/or as a realized gain. The Fund estimates the components of distributions received that may be considered return of capital distributions or capital gain distributions. Interest income is accrued as earned. Interest income includes coupon interest and amortization of premium and accretion of discount on debt securities. Investment income is recorded net of foreign taxes withheld where recovery of such taxes is uncertain.
Expenses. Most expenses of the trust can be directly attributed to a fund. Expenses which cannot be directly attributed are apportioned among each Fund in the trust. Expense estimates are accrued in the period to which they relate and adjustments are made when actual amounts are known.
Deferred Trustee Compensation. Under a Deferred Compensation Plan (the Plan), Independent Trustees must defer receipt of a portion of, and may elect to defer receipt of an additional portion of, their annual compensation. Deferred amounts are invested in a cross-section of Fidelity funds, are marked-to-market and remain in the Fund until distributed in accordance with the Plan. The investment of deferred amounts and the offsetting payable to the Trustees are included in the accompanying Statement of Assets and Liabilities.
Annual Report
1. Significant Accounting Policies - continued
Income Tax Information and Distributions to Shareholders. Each year, the Fund intends to qualify as a regulated investment company by distributing all of its taxable income and realized gains under Subchapter M of the Internal Revenue Code. As a result, no provision for income taxes is required in the accompanying financial statements. Foreign taxes are provided for based on the Fund's understanding of the tax rules and rates that exist in the foreign markets in which it invests.
Distributions are recorded on the ex-dividend date. Income and capital gain distributions are determined in accordance with income tax regulations, which may differ from generally accepted accounting principles. In addition, the Fund will claim a portion of the payment made to redeeming shareholders as a distribution for income tax purposes.
Capital accounts within the financial statements are adjusted for permanent book-tax differences. These adjustments have no impact on net assets or the results of operations. Temporary book-tax differences will reverse in a subsequent period.
Book-tax differences are primarily due to foreign currency transactions, deferred trustees compensation, capital loss carryforwards and losses deferred due to wash sales.
The tax-basis components of distributable earnings and the federal tax cost as of period end were as follows:
Unrealized appreciation | $ 2,804,024 |
Unrealized depreciation | (1,202,923) |
Net unrealized appreciation (depreciation) | 1,601,101 |
Undistributed ordinary income | 48,064 |
Undistributed long-term capital gain | 429,637 |
Cost for federal income tax purposes | $ 18,069,094 |
The tax character of distributions paid was as follows:
| July 31,2006 | July 31,2005 |
Ordinary Income | $ 120,771 | $ 220,167 |
New Accounting Pronouncement. In July 2006, Financial Accounting Standards Board Interpretation No. 48, Accounting for Uncertainty in Income Taxes - an interpretation of FASB Statement 109 (FIN 48) was issued and is effective for fiscal years beginning after December 15, 2006. FIN 48 sets forth a threshold for financial statement recognition, measurement and disclosure of a tax position taken or expected to be taken on a tax return. Management is currently evaluating the impact, if any, the adoption of FIN 48 will have on the Fund's net assets and results of operations.
Annual Report
Notes to Financial Statements - continued
(Amounts in thousands except ratios)
2. Operating Policies.
Repurchase Agreements. FMR has received an Exemptive Order from the Securities and Exchange Commission (the SEC) which permits the Fund and other affiliated entities of FMR to transfer uninvested cash balances into joint trading accounts which are then invested in repurchase agreements. The Fund may also invest directly with institutions in repurchase agreements. Repurchase agreements are collateralized by government or non-government securities. Upon settlement date, collateral is held in segregated accounts with custodian banks and may be obtained in the event of a default of the counterparty. The Fund monitors, on a daily basis, the value of the collateral to ensure it is at least equal to the principal amount of the repurchase agreement (including accrued interest). In the event of a default by the counterparty, realization of the collateral proceeds could be delayed, during which time the value of the collateral may decline.
Restricted Securities. The Fund may invest in securities that are subject to legal or contractual restrictions on resale. These securities generally may be resold in transactions exempt from registration or to the public if the securities are registered. Disposal of these securities may involve time-consuming negotiations and expense, and prompt sale at an acceptable price may be difficult. Information regarding restricted securities is included at the end of the Fund's Schedule of Investments.
3. Purchases and Sales of Investments.
Purchases and sales of securities, other than short-term securities, aggregated $10,142,750 and $13,064,923, respectively.
4. Fees and Other Transactions with Affiliates.
Management Fee. FMR and its affiliates provide the Fund with investment management related services for which the Fund pays a monthly management fee. The management fee is the sum of an individual fund fee rate that is based on an annual rate of .30% of the Fund's average net assets and a group fee rate that averaged ..27% during the period. The group fee rate is based upon the average net assets of all the mutual funds advised by FMR. The group fee rate decreases as assets under management increase and increases as assets under management decrease. In addition, the management fee is subject to a performance adjustment (up to a maximum of ± .20% of the Fund's average net assets over a 36 month performance period). The upward or downward adjustment to the management fee is based on the Fund's relative investment performance as compared to an appropriate benchmark index. For the period, the total annual management fee rate, including the performance adjustment, was .37% of the Fund's average net assets.
Annual Report
4. Fees and Other Transactions with Affiliates - continued
Transfer Agent Fees. Fidelity Service Company, Inc. (FSC), an affiliate of FMR, is the Fund's transfer, dividend disbursing and shareholder servicing agent. FSC receives account fees and asset-based fees that vary according to account size and type of account. FSC pays for typesetting, printing and mailing of shareholder reports, except proxy statements. For the period, the transfer agent fees were equivalent to an annual rate of .24% of average net assets.
Accounting and Security Lending Fees. FSC maintains the Fund's accounting records. The accounting fee is based on the level of average net assets for the month. Under a separate contract, FSC administers the security lending program. The security lending fee is based on the number and duration of lending transactions.
Affiliated Central Funds. The Fund may invest in Money Market Central Funds which seek preservation of capital and current income and are managed by Fidelity Investments Money Management, Inc. (FIMM), an affiliate of FMR.
The Money Market Central Funds do not pay a management fee.
Brokerage Commissions. The Fund placed a portion of its portfolio transactions with brokerage firms which are affiliates of the investment adviser. The commissions paid to these affiliated firms were $113 for the period.
Interfund Lending Program. Pursuant to an Exemptive Order issued by the SEC, the Fund, along with other registered investment companies having management contracts with FMR, may participate in an interfund lending program. This program provides an alternative credit facility allowing the Funds to borrow from, or lend money to, other participating affiliated funds. At period end, there were no interfund loans outstanding. The Fund's activity in this program during the period for which loans were outstanding was as follows:
| Average Daily
Loan Balance | Weighted Average Interest Rate | Interest
Expense |
Borrower | $ 57,828 | 4.40% | $ 21 |
5. Committed Line of Credit.
The Fund participates with other funds managed by FMR in a $4.2 billion credit facility (the "line of credit") to be utilized for temporary or emergency purposes to fund shareholder redemptions or for other short-term liquidity purposes. The Fund has agreed to pay commitment fees on its pro rata portion of the line of credit, which amounts to $63 and is reflected in Miscellaneous Expense on the Statement of Operations. During the period, there were no borrowings on this line of credit.
Annual Report
Notes to Financial Statements - continued
(Amounts in thousands except ratios)
6. Security Lending.
The Fund lends portfolio securities from time to time in order to earn additional income. On the settlement date of the loan, the Fund receives collateral (in the form of U.S. Treasury obligations, letters of credit and/or cash) against the loaned securities and maintains collateral in an amount not less than 100% of the market value of the loaned securities during the period of the loan. The market value of the loaned securities is determined at the close of business of the Fund and any additional required collateral is delivered to the Fund on the next business day. If the borrower defaults on its obligation to return the securities loaned because of insolvency or other reasons, a fund could experience delays and costs in recovering the securities loaned or in gaining access to the collateral. Any cash collateral received is invested in the Fidelity Securities Lending Cash Central Fund. The value of loaned securities and cash collateral at period end are disclosed on the Fund's Statement of Assets and Liabilities. Security lending income represents the income earned on investing cash collateral, less fees and expenses associated with the loan, plus any premium payments that may be received on the loan of certain types of securities. Security lending income is presented in the Statement of Operations as a component of income from affiliated central funds. Net income from lending portfolio securities during the period amounted to $1,425.
7. Expense Reductions.
Many of the brokers with whom FMR places trades on behalf of the Fund provided services to the Fund in addition to trade execution. These services included payments of certain expenses on behalf of the Fund totaling $2,910 for the period. In addition, through arrangements with the Fund's custodian and transfer agent, credits realized as a result of uninvested cash balances were used to reduce the Fund's expenses. During the period, these credits reduced the Fund's custody and transfer agent expenses by $4 and $1,335, respectively.
8. Other.
The Fund's organizational documents provide former and current trustees and officers with a limited indemnification against liabilities arising in connection with the performance of their duties to the Fund. In the normal course of business, the Fund may also enter into contracts that provide general indemnifications. The Fund's maximum exposure under these arrangements is unknown as this would be dependent on future claims that may be made against the Fund. The risk of material loss from such claims is considered remote.
Annual Report
Report of Independent Registered Public Accounting Firm
To the Trustees of Fidelity Securities Fund and Shareholders of Fidelity Blue Chip Growth Fund:
We have audited the accompanying statement of assets and liabilities of Fidelity Blue Chip Growth Fund (the Fund), a fund of Fidelity Securities Fund, including the schedule of investments as of July 31, 2006, and the related statement of operations for the year then ended, the statement of changes in net assets for each of the two years in the period then ended, and the financial highlights for each of the five years in the period then ended. These financial statements and financial highlights are the responsibility of the Fund's management. Our responsibility is to express an opinion on these financial statements and financial highlights based on our audits.
We conducted our audits in accordance with standards of the Public Company Accounting Oversight Board (United States). Those standards require that we plan and perform the audit to obtain reasonable assurance about whether the financial statements and financial highlights are free of material misstatement. The Fund is not required to have, nor were we engaged to perform, an audit of its internal control over financial reporting. Our audits included consideration of internal control over financial reporting as a basis for designing audit procedures that are appropriate in the circumstances, but not for the purpose of expressing an opinion on the effectiveness of the Fund's internal control over financial reporting. Accordingly, we express no such opinion. An audit also includes examining, on a test basis, evidence supporting the amounts and disclosures in the financial statements, assessing the accounting principles used and significant estimates made by management, as well as evaluating the overall financial statement presentation. Our procedures included confirmation of securities owned as of July 31, 2006, by correspondence with the custodians and brokers; where replies were not received from brokers, we performed other auditing procedures. We believe that our audits provide a reasonable basis for our opinion.
In our opinion, the financial statements and financial highlights referred to above present fairly, in all material respects, the financial position of Fidelity Blue Chip Growth Fund as of July 31, 2006, the results of its operations for the year then ended, the changes in its net assets for each of the two years in the period then ended, and its financial highlights for each of the five years in the period then ended, in conformity with accounting principles generally accepted in the United States of America.
/s/ Delolitte & Touche LLP
DELOITTE & TOUCHE LLP
Boston, Massachusetts
September 8, 2006
Annual Report
Trustees and Officers
The Trustees, Members of the Advisory Board, and executive officers of the trust and fund, as applicable, are listed below. The Board of Trustees governs the fund and is responsible for protecting the interests of shareholders. The Trustees are experienced executives who meet periodically throughout the year to oversee the fund's activities, review contractual arrangements with companies that provide services to the fund, and review the fund's performance. Except for William O. McCoy and Albert R. Gamper, Jr., each of the Trustees oversees 345 funds advised by FMR or an affiliate. Mr. McCoy oversees 347 funds advised by FMR or an affiliate. Mr. Gamper oversees 292 funds advised by FMR or an affiliate.
The Trustees hold office without limit in time except that (a) any Trustee may resign; (b) any Trustee may be removed by written instrument, signed by at least two-thirds of the number of Trustees prior to such removal; (c) any Trustee who requests to be retired or who has become incapacitated by illness or injury may be retired by written instrument signed by a majority of the other Trustees; and (d) any Trustee may be removed at any special meeting of shareholders by a two-thirds vote of the outstanding voting securities of the trust. Each Trustee who is not an interested person (as defined in the 1940 Act) (Independent Trustee), shall retire not later than the last day of the calendar year in which his or her 72nd birthday occurs. The Independent Trustees may waive this mandatory retirement age policy with respect to individual Trustees. The executive officers and Advisory Board Members hold office without limit in time, except that any officer and Advisory Board Member may resign or may be removed by a vote of a majority of the Trustees at any regular meeting or any special meeting of the Trustees. Except as indicated, each individual has held the office shown or other offices in the same company for the past five years.
The fund's Statement of Additional Information (SAI) includes more information about the Trustees. To request a free copy, call Fidelity at 1-800-544-8544.
Interested Trustees*:
Correspondence intended for each Trustee who is an interested person may be sent to Fidelity Investments, 82 Devonshire Street, Boston, Massachusetts 02109.
Name, Age; Principal Occupation |
Edward C. Johnson 3d (76) |
| Year of Election or Appointment: 1984 Mr. Johnson is Chairman of the Board of Trustees. Mr. Johnson serves as President (2006-present), Chief Executive Officer, Chairman, and a Director of FMR Corp.; Chairman and a Director of FMR; Chairman and a Director of Fidelity Research & Analysis Company (FRAC); Chairman and a Director of Fidelity Investments Money Management, Inc.; and Chairman (2001-present) and a Director (1999-present) of FMR Co., Inc. In addition, Mr. Johnson serves as Chairman and Director of Fidelity International Limited (FIL). |
Stephen P. Jonas (53) |
| Year of Election or Appointment: 2005 Mr. Jonas is Senior Vice President of Blue Chip Growth (2005-present). He also serves as Senior Vice President of other Fidelity funds (2005-present). Mr. Jonas is Executive Director of FMR (2005-present) and FMR Co., Inc. (2005-present). He also serves as a Director of Fidelity Investments Money Management, Inc. (2005-present) and FMR Corp. (2003-present). Previously, Mr. Jonas served as President of Fidelity Enterprise Operations and Risk Services (2004-2005), Chief Administrative Officer (2002-2004), and Chief Financial Officer of FMR Corp. (1998-2002). In addition, he serves on the Boards of Boston Ballet (2003-present) and Simmons College (2003-present). |
Robert L. Reynolds (54) |
| Year of Election or Appointment: 2003 Mr. Reynolds is President and a Director of FMR (2005-present), Fidelity Investments Money Management, Inc. (2005-present), and FMR Co., Inc. (2005-present). Mr. Reynolds also serves as a Director (2003-present) and Chief Operating Officer (2000-present) of FMR Corp. and a Director of Strategic Advisers, Inc. (2005-present). He also serves on the Board at Fidelity Investments Canada, Ltd. (2000-present). Previously, Mr. Reynolds served as President of Fidelity Investments Institutional Retirement Group (1996-2000). |
* Trustees have been determined to be "Interested Trustees" by virtue of, among other things, their affiliation with the trust or various entities under common control with FMR.
Annual Report
Independent Trustees:
Correspondence intended for each Independent Trustee (that is, the Trustees other than the Interested Trustees) may be sent to Fidelity Investments, P.O. Box 55235, Boston, Massachusetts 02205-5235.
Name, Age; Principal Occupation |
Dennis J. Dirks (58) |
| Year of Election or Appointment: 2005 Prior to his retirement in May 2003, Mr. Dirks was Chief Operating Officer and a member of the Board of The Depository Trust & Clearing Corporation (DTCC) (1999-2003). He also served as President, Chief Operating Officer, and Board member of The Depository Trust Company (DTC) (1999-2003) and President and Board member of the National Securities Clearing Corporation (NSCC) (1999-2003). In addition, Mr. Dirks served as Chief Executive Officer and Board member of the Government Securities Clearing Corporation (2001-2003) and Chief Executive Officer and Board member of the Mortgage-Backed Securities Clearing Corporation (2001-2003). Mr. Dirks also serves as a Trustee and a member of the Finance Committee of Manhattan College (2005-present) and a Trustee and a member of the Finance Committee of AHRC of Nassau County (2006-present). |
Albert R. Gamper, Jr. (64) |
| Year of Election or Appointment: 2006 Mr. Gamper also serves as a Trustee (2006-present) or Member of the Advisory Board (2005-present) of other investment companies advised by FMR. Prior to his retirement in December 2004, Mr. Gamper served as Chairman of the Board of CIT Group Inc. (commercial finance). During his tenure with CIT Group Inc. Mr. Gamper served in numerous senior management positions, including Chairman (1987-1989; 1999-2001; 2002-2004), Chief Executive Officer (1987-2004), and President (1989-2002). He currently serves as a member of the Board of Directors of Public Service Enterprise Group (utilities, 2001-present), Chairman of the Board of Governors, Rutgers University (2004-present), and Chairman of the Board of Saint Barnabas Health Care System. |
Robert M. Gates (62) |
| Year of Election or Appointment: 1997 Dr. Gates is Chairman of the Independent Trustees (2006-present). Dr. Gates is President of Texas A&M University (2002-present). He was Director of the Central Intelligence Agency (CIA) from 1991 to 1993. From 1989 to 1991, Dr. Gates served as Assistant to the President of the United States and Deputy National Security Advisor. Dr. Gates is a Director of NACCO Industries, Inc. (mining and manufacturing), Parker Drilling Co., Inc. (drilling and rental tools for the energy industry, 2001-present), and Brinker International (restaurant management, 2003-present). Previously, Dr. Gates served as a Director of LucasVarity PLC (automotive components and diesel engines), a Director of TRW Inc. (automotive, space, defense, and information technology), and Dean of the George Bush School of Government and Public Service at Texas A&M University (1999-2001). |
George H. Heilmeier (70) |
| Year of Election or Appointment: 2004 Dr. Heilmeier is Chairman Emeritus of Telcordia Technologies (communication software and systems), where prior to his retirement, he served as company Chairman and Chief Executive Officer. He currently serves on the Boards of Directors of The Mitre Corporation (systems engineering and information technology support for the government), and HRL Laboratories (private research and development, 2004-present). He is Chairman of the General Motors Science & Technology Advisory Board and a Life Fellow of the Institute of Electrical and Electronics Engineers (IEEE). Dr. Heilmeier is a member of the Defense Science Board and the National Security Agency Advisory Board. He is also a member of the National Academy of Engineering, the American Academy of Arts and Sciences, and the Board of Overseers of the School of Engineering and Applied Science of the University of Pennsylvania. Previously, Dr. Heilmeier served as a Director of TRW Inc. (automotive, space, defense, and information technology, 1992-2002), Compaq (1994-2002), Automatic Data Processing, Inc. (ADP) (technology-based business outsourcing, 1995-2002), INET Technologies Inc. (telecommunications network surveillance, 2001-2004), and Teletech Holdings (customer management services). He is the recipient of the 2005 Kyoto Prize in Advanced Technology for his invention of the liquid crystal display. |
Marie L. Knowles (59) |
| Year of Election or Appointment: 2001 Prior to Ms. Knowles' retirement in June 2000, she served as Executive Vice President and Chief Financial Officer of Atlantic Richfield Company (ARCO) (diversified energy, 1996-2000). From 1993 to 1996, she was a Senior Vice President of ARCO and President of ARCO Transportation Company. She served as a Director of ARCO from 1996 to 1998. She currently serves as a Director of Phelps Dodge Corporation (copper mining and manufacturing) and McKesson Corporation (healthcare service, 2002-present). Ms. Knowles is a Trustee of the Brookings Institution and the Catalina Island Conservancy and also serves as a member of the Advisory Board for the School of Engineering of the University of Southern California. |
Ned C. Lautenbach (62) |
| Year of Election or Appointment: 2000 Mr. Lautenbach has been a partner of Clayton, Dubilier & Rice, Inc. (private equity investment firm) since September 1998. Previously, Mr. Lautenbach was with the International Business Machines Corporation (IBM) from 1968 until his retirement in 1998. Mr. Lautenbach serves as a Director of Italtel Holding S.p.A. (telecommunications (Milan, Italy), 2004-present) and Eaton Corporation (diversified industrial) as well as the Philharmonic Center for the Arts in Naples, Florida. He also is a member of the Board of Trustees of Fairfield University (2005-present), as well as a member of the Council on Foreign Relations. |
William O. McCoy (72) |
| Year of Election or Appointment: 1997 Prior to his retirement in December 1994, Mr. McCoy was Vice Chairman of the Board of BellSouth Corporation (telecommunications) and President of BellSouth Enterprises. He is currently a Director of Duke Realty Corporation (real estate). He is also a partner of Franklin Street Partners (private investment management firm). In addition, Mr. McCoy served as the Interim Chancellor (1999-2000) and a member of the Board of Visitors for the University of North Carolina at Chapel Hill and currently serves as Chairman of the Board of Directors of the University of North Carolina Health Care System. He also served as Vice President of Finance for the University of North Carolina (16-school system). |
Cornelia M. Small (62) |
| Year of Election or Appointment: 2005 Ms. Small is a member (2000-present) and Chairperson (2002-present) of the Investment Committee, and a member (2002-present) of the Board of Trustees of Smith College. Previously, she served as Chief Investment Officer (1999-2000), Director of Global Equity Investments (1996-1999), and a member of the Board of Directors of Scudder, Stevens & Clark (1990-1997) and Scudder Kemper Investments (1997-1999). In addition, Ms. Small served as Co-Chair (2000-2003) of the Annual Fund for the Fletcher School of Law and Diplomacy. |
William S. Stavropoulos (67) |
| Year of Election or Appointment: 2002 Mr. Stavropoulos is Chairman Emeritus of the Board of Directors of The Dow Chemical Company. Since joining The Dow Chemical Company in 1967, Mr. Stavropoulos served in numerous senior management positions, including President (1993-2000; 2002-2003), CEO (1995-2000; 2002-2004), and Chairman of the Executive Committee (2000-2004). Currently, he is a Director of NCR Corporation (data warehousing and technology solutions), BellSouth Corporation (telecommunications), Chemical Financial Corporation, Maersk Inc. (industrial conglomerate, 2002-present), and Metalmark Capital (private equity investment firm, 2005-present). He also serves as a member of the Board of Trustees of the American Enterprise Institute for Public Policy Research. In addition, Mr. Stavropoulos is a member of The Business Council, J.P. Morgan International Council and the University of Notre Dame Advisory Council for the College of Science. |
Kenneth L. Wolfe (67) |
| Year of Election or Appointment: 2005 Prior to his retirement in 2001, Mr. Wolfe was Chairman and Chief Executive Officer of Hershey Foods Corporation (1993-2001). He currently serves as a member of the boards of Adelphia Communications Corporation (2003-present), Bausch & Lomb, Inc., and Revlon Inc. (2004-present). |
Annual Report
Advisory Board Members and Executive Officers:
Correspondence intended for Mr. Keyes may be sent to Fidelity Investments, P.O. Box 55235, Boston, Massachusetts 02205-5235. Correspondence intended for each executive officer and Mr. Lynch may be sent to Fidelity Investments, 82 Devonshire Street, Boston, Massachusetts 02109.
Name, Age; Principal Occupation |
James H. Keyes (65) |
| Year of Election or Appointment: 2006 Member of the Advisory Board of Fidelity Securities Fund. Prior to his retirement in 2003, Mr. Keyes was Chairman, President, and Chief Executive Officer of Johnson Controls, Inc. (automotive supplier, 1993-2003). He currently serves as a member of the boards of LSI Logic Corporation (semiconductor technologies, 1984-present), Navistar International Corporation (manufacture and sale of trucks, buses, and diesel engines, 2002-present), and Pitney Bowes, Inc. (integrated mail, messaging, and document management solutions, 1998-present). |
Peter S. Lynch (62) |
| Year of Election or Appointment: 2003 Member of the Advisory Board of Fidelity Securities Fund. Mr. Lynch is Vice Chairman and a Director of FMR, and Vice Chairman (2001-present) and a Director (1999-present) of FMR Co., Inc. Previously, Mr. Lynch served as a Trustee of the Fidelity funds (1990-2003). In addition, he serves as the Chairman of the Inner-City Scholarship Fund. |
Dwight D. Churchill (52) |
| Year of Election or Appointment: 2005 Vice President of Blue Chip Growth. Mr. Churchill also serves as Vice President of certain Equity Funds (2005-present). Mr. Churchill is Executive Vice President of FMR (2005-present) and FMR Co., Inc. (2005-present). Previously, Mr. Churchill served as Senior Vice President of Fidelity Investments Money Management, Inc. (2005-2006), Head of Fidelity's Fixed-Income Division (2000-2005), Vice President of Fidelity's Money Market Funds (2000-2005), Vice President of Fidelity's Bond Funds, and Senior Vice President of FMR. |
Bruce T. Herring (40) |
| Year of Election or Appointment: 2006 Vice President of Blue Chip Growth. Mr. Herring also serves as Vice President of certain Equity Funds (2006-present). Mr. Herring is Senior Vice President of FMR (2006-present) and Vice President of FMR Co., Inc. (2001-present). Previously, Mr. Herring served as a portfolio manager for Fidelity U.S. Equity Funds (2001-2005). |
John B. McDowell (47) |
| Year of Election or Appointment: 1996 Vice President of Blue Chip Growth. Prior to assuming his current responsibilities, Mr. McDowell has worked as a research analyst and manager. Mr. McDowell also serves as Senior Vice President of FMR (1999) and FMR Co., Inc. (2001). |
Brian J. Hanson (32) |
| Year of Election or Appointment: 2005 Vice President of Blue Chip Growth. Mr. Hanson also serves as Vice President of other funds advised by FMR. Prior to assuming his current responsibilities, Mr. Hanson has worked as a research analyst and portfolio manager. Mr. Hanson also serves as Vice President of FMR (2004) and FMR Co., Inc. (2004). |
Eric D. Roiter (57) |
| Year of Election or Appointment: 1998 Secretary of Blue Chip Growth. He also serves as Secretary of other Fidelity funds; Vice President, General Counsel, and Secretary of FMR Co., Inc. (2001-present) and FMR; Assistant Secretary of Fidelity Management & Research (U.K.) Inc. (2001-present), Fidelity Research & Analysis Company (2001-present), and Fidelity Investments Money Management, Inc. (2001-present). Mr. Roiter is an Adjunct Member, Faculty of Law, at Boston College Law School (2003-present). Previously, Mr. Roiter served as Vice President and Secretary of Fidelity Distributors Corporation (FDC) (1998-2005). |
Stuart Fross (46) |
| Year of Election or Appointment: 2003 Assistant Secretary of Blue Chip Growth. Mr. Fross also serves as Assistant Secretary of other Fidelity funds (2003-present), Vice President and Secretary of FDC (2005-present), and is an employee of FMR. |
Christine Reynolds (47) |
| Year of Election or Appointment: 2004 President and Treasurer of Blue Chip Growth. Ms. Reynolds also serves as President and Treasurer of other Fidelity funds (2004-present) and is a Vice President (2003-present) and an employee (2002-present) of FMR. Before joining Fidelity Investments, Ms. Reynolds worked at PricewaterhouseCoopers LLP (PwC) (1980-2002), where she was most recently an audit partner with PwC's investment management practice. |
R. Stephen Ganis (40) |
| Year of Election or Appointment: 2006 Anti-Money Laundering (AML) officer of Blue Chip Growth. Mr. Ganis also serves as AML officer of other Fidelity funds (2006-present) and FMR Corp. (2003-present). Before joining Fidelity Investments, Mr. Ganis practiced law at Goodwin Procter, LLP (2000-2002). |
Joseph B. Hollis (58) |
| Year of Election or Appointment: 2006 Chief Financial Officer of Blue Chip Growth. Mr. Hollis also serves as Chief Financial Officer of other Fidelity funds. Mr. Hollis is President of Fidelity Pricing and Cash Management Services (FPCMS) (2005-present). Mr. Hollis also serves as President and Director of Fidelity Service Company, Inc. (2006-present). Previously, Mr. Hollis served as Senior Vice President of Cash Management Services (1999-2002) and Investment Management Operations (2002-2005). |
Kenneth A. Rathgeber (59) |
| Year of Election or Appointment: 2004 Chief Compliance Officer of Blue Chip Growth. Mr. Rathgeber also serves as Chief Compliance Officer of other Fidelity funds (2004-present) and Executive Vice President of Risk Oversight for Fidelity Investments (2002-present). He is Chief Compliance Officer of FMR (2005-present), FMR Co., Inc. (2005-present), Fidelity Management & Research (U.K.) Inc. (2005-present), Fidelity Research & Analysis Company (2005-present), Fidelity Investments Money Management, Inc. (2005-present), and Strategic Advisers, Inc. (2005-present). Previously, Mr. Rathgeber served as Executive Vice President and Chief Operating Officer for Fidelity Investments Institutional Services Company, Inc. (1998-2002). |
Bryan A. Mehrmann (45) |
| Year of Election or Appointment: 2005 Deputy Treasurer of Blue Chip Growth. Mr. Mehrmann also serves as Deputy Treasurer of other Fidelity funds (2005-present) and is an employee of FMR. Previously, Mr. Mehrmann served as Vice President of Fidelity Investments Institutional Services Group (FIIS)/Fidelity Investments Institutional Operations Corporation, Inc. (FIIOC) Client Services (1998-2004). |
Kimberley H. Monasterio (42) |
| Year of Election or Appointment: 2004 Deputy Treasurer of Blue Chip Growth. Ms. Monasterio also serves as Deputy Treasurer of other Fidelity funds (2004) and is an employee of FMR (2004). Before joining Fidelity Investments, Ms. Monasterio served as Treasurer (2000-2004) and Chief Financial Officer (2002-2004) of the Franklin Templeton Funds and Senior Vice President of Franklin Templeton Services, LLC (2000-2004). |
Kenneth B. Robins (36) |
| Year of Election or Appointment: 2005 Deputy Treasurer of Blue Chip Growth. Mr. Robins also serves as Deputy Treasurer of other Fidelity funds (2005-present) and is an employee of FMR (2004-present). Before joining Fidelity Investments, Mr. Robins worked at KPMG LLP, where he was a partner in KPMG's department of professional practice (2002-2004) and a Senior Manager (1999-2000). In addition, Mr. Robins served as Assistant Chief Accountant, United States Securities and Exchange Commission (2000-2002). |
Robert G. Byrnes (39) |
| Year of Election or Appointment: 2005 Assistant Treasurer of Blue Chip Growth. Mr. Byrnes also serves as Assistant Treasurer of other Fidelity funds (2005-present) and is an employee of FMR (2005-present). Previously, Mr. Byrnes served as Vice President of FPCMS (2003-2005). Before joining Fidelity Investments, Mr. Byrnes worked at Deutsche Asset Management where he served as Vice President of the Investment Operations Group (2000-2003). |
John H. Costello (59) |
| Year of Election or Appointment: 1987 Assistant Treasurer of Blue Chip Growth. Mr. Costello also serves as Assistant Treasurer of other Fidelity funds and is an employee of FMR. |
Peter L. Lydecker (52) |
| Year of Election or Appointment: 2004 Assistant Treasurer of Blue Chip Growth. Mr. Lydecker also serves as Assistant Treasurer of other Fidelity funds (2004) and is an employee of FMR. |
Mark Osterheld (51) |
| Year of Election or Appointment: 2002 Assistant Treasurer of Blue Chip Growth. Mr. Osterheld also serves as Assistant Treasurer of other Fidelity funds (2002) and is an employee of FMR. |
Gary W. Ryan (47) |
| Year of Election or Appointment: 2005 Assistant Treasurer of Blue Chip Growth. Mr. Ryan also serves as Assistant Treasurer of other Fidelity funds (2005-present) and is an employee of FMR (2005-present). Previously, Mr. Ryan served as Vice President of Fund Reporting in FPCMS (1999-2005). |
Salvatore Schiavone (40) |
| Year of Election or Appointment: 2005 Assistant Treasurer of Blue Chip Growth. Mr. Schiavone also serves as Assistant Treasurer of other Fidelity funds (2005-present) and is an employee of FMR (2005-present). Before joining Fidelity Investments, Mr. Schiavone worked at Deutsche Asset Management, where he most recently served as Assistant Treasurer (2003-2005) of the Scudder Funds and Vice President and Head of Fund Reporting (1996-2003). |
Annual Report
Distributions
The Board of Trustees of Fidelity Blue Chip Growth Fund voted to pay on September 11, 2006, to shareholders of record at the opening of business on September 8, 2006, a distribution of $.93 per share derived from capital gains realized from sales of portfolio securities and a dividend of $.11 per share from net investment income.
The fund hereby designates as a capital gain dividend with respect to the taxable year ended July 31, 2006, $530,061,000, or, if subsequently determined to be different, the net capital gain of such year.
The fund designates 100% of the dividends distributed during the fiscal year as qualifying for the dividends-received deduction for corporate shareholders.
The fund designates 100% of the dividends distributed during the fiscal year as amounts which may be taken into account as a dividend for the purposes of the maximum rate under section 1(h)(11) of the Internal Revenue Code.
The fund will notify shareholders in January 2007 of amounts for use in preparing 2006 income tax returns.
Annual Report
Proxy Voting Results
A special meeting of the fund's shareholders was held on May 17, 2006. The results of votes taken among shareholders on the proposals before them are reported below. Each vote reported represents one dollar of net asset value held on the record date for the meeting.
PROPOSAL 1 |
To elect a Board of Trustees. A |
| # of
Votes | % of
Votes |
Dennis J. Dirks |
Affirmative | 43,119,905,166.54 | 95.455 |
Withheld | 2,053,001,967.67 | 4.545 |
TOTAL | 45,172,907,134.21 | 100.000 |
Albert R. Gamper, Jr. |
Affirmative | 43,068,780,128.62 | 95.342 |
Withheld | 2,104,127,005.59 | 4.658 |
TOTAL | 45,172,907,134.21 | 100.000 |
Robert M. Gates |
Affirmative | 43,032,117,662.60 | 95.261 |
Withheld | 2,140,789,471.61 | 4.739 |
TOTAL | 45,172,907,134.21 | 100.000 |
George H. Heilmeier |
Affirmative | 43,023,368,882.30 | 95.242 |
Withheld | 2,149,538,251.91 | 4.758 |
TOTAL | 45,172,907,134.21 | 100.000 |
Edward C. Johnson 3d |
Affirmative | 42,881,915,819.70 | 94.928 |
Withheld | 2,290,991,314.51 | 5.072 |
TOTAL | 45,172,907,134.21 | 100.000 |
Stephen P. Jonas |
Affirmative | 43,081,912,066.37 | 95.371 |
Withheld | 2,090,995,067.84 | 4.629 |
TOTAL | 45,172,907,134.21 | 100.000 |
James H. KeyesB |
Affirmative | 43,049,050,093.79 | 95.298 |
Withheld | 2,123,857,040.42 | 4.702 |
TOTAL | 45,172,907,134.21 | 100.000 |
Marie L. Knowles |
Affirmative | 43,090,434,696.02 | 95.390 |
Withheld | 2,082,472,438.19 | 4.610 |
TOTAL | 45,172,907,134.21 | 100.000 |
| # of
Votes | % of
Votes |
Ned C. Lautenbach |
Affirmative | 43,082,185,255.05 | 95.372 |
Withheld | 2,090,721,879.16 | 4.628 |
TOTAL | 45,172,907,134.21 | 100.000 |
William O. McCoy |
Affirmative | 42,960,162,066.32 | 95.102 |
Withheld | 2,212,745,067.89 | 4.898 |
TOTAL | 45,172,907,134.21 | 100.000 |
Robert L. Reynolds |
Affirmative | 43,087,560,419.66 | 95.384 |
Withheld | 2,085,346,714.55 | 4.616 |
TOTAL | 45,172,907,134.21 | 100.000 |
Cornelia M. Small |
Affirmative | 43,092,070,014.53 | 95.394 |
Withheld | 2,080,837,119.68 | 4.606 |
TOTAL | 45,172,907,134.21 | 100.000 |
William S. Stavropoulos |
Affirmative | 43,002,032,676.43 | 95.194 |
Withheld | 2,170,874,457.78 | 4.806 |
TOTAL | 45,172,907,134.21 | 100.000 |
Kenneth L. Wolfe |
Affirmative | 43,047,241,852.81 | 95.294 |
Withheld | 2,125,665,281.40 | 4.706 |
TOTAL | 45,172,907,134.21 | 100.000 |
PROPOSAL 2 |
To approve a change in the performance adjustment index for Fidelity Blue Chip Growth Fund. |
| # of
Votes | % of
Votes |
Affirmative | 9,297,043,385.87 | 82.153 |
Against | 1,226,294,411.37 | 10.836 |
Abstain | 629,893,621.26 | 5.566 |
Broker
Non-Votes | 163,474,631.25 | 1.445 |
TOTAL | 11,316,706,049.75 | 100.000 |
PROPOSAL 3 |
To authorize the Trustees to change the performance adjustment index for Fidelity Blue Chip Growth Fund in the future without a shareholder vote. |
| # of
Votes | % of
Votes |
Affirmative | 8,155,268,166.30 | 72.064 |
Against | 2,494,671,602.72 | 22.044 |
Abstain | 503,291,649.48 | 4.447 |
Broker
Non-Votes | 163,474,631.25 | 1.445 |
TOTAL | 11,316,706,049.75 | 100.000 |
A Denotes trust-wide proposal and voting results. B Effective on or about January 1, 2007. |
Annual Report
Board Approval of Investment Advisory Contracts and Management Fees
Fidelity Blue Chip Growth Fund
Each year, typically in July, the Board of Trustees, including the Independent Trustees (together, the Board), votes on the renewal of the management contract and sub-advisory agreements (together, the Advisory Contracts) for the fund. The Board, assisted by the advice of fund counsel and Independent Trustees' counsel, requests and considers a broad range of information throughout the year.
The Board meets regularly each month except August and takes into account throughout the year matters bearing on Advisory Contracts. The Board, acting directly and through its separate committees, considers at each of its meetings factors that are relevant to the annual renewal of the fund's Advisory Contracts, including the services and support provided to the fund and its shareholders. At the time of the renewal, the Board had 12 standing committees, each composed of Independent Trustees with varying backgrounds, to which the Board has assigned specific subject matter responsibilities in order to enhance effective decision-making by the Board. Each committee has adopted a written charter outlining the structure and purposes of the committee. One such committee, the Equity Contract Committee, meets periodically as needed throughout the year to consider matters specifically related to the annual renewal of Advisory Contracts. The committee requests and receives information on, and makes recommendations to the Independent Trustees concerning, the approval and annual review of the Advisory Contracts.
At its July 2006 meeting, the Board of Trustees, including the Independent Trustees, unanimously determined to renew the Advisory Contracts for the fund. In reaching its determination, the Board considered all factors it believed relevant, including (i) the nature, extent, and quality of the services to be provided to the fund and its shareholders (including the investment performance of the fund); (ii) the competitiveness of the management fee and total expenses of the fund; (iii) the total costs of the services to be provided by and the profits to be realized by the investment adviser and its affiliates from the relationship with the fund; (iv) the extent to which economies of scale would be realized as the fund grows; and (v) whether fee levels reflect these economies of scale, if any, for the benefit of fund shareholders.
In determining whether to renew the Advisory Contracts for the fund, the Board ultimately reached a determination, with the assistance of fund counsel and Independent Trustees' counsel, that the renewal of the Advisory Contracts and the compensation to be received by Fidelity under the management contract is consistent with Fidelity's fiduciary duty under applicable law. In addition to evaluating the specific factors noted above, the Board, in reaching its determination, is aware that shareholders in the fund have a broad range of investment choices available to them, including a wide choice among mutual funds offered by competitors to Fidelity, and that the fund's shareholders, with the opportunity to review and weigh the disclosure provided by the fund in its prospectus and other public disclosures, have chosen to invest in this fund, managed by Fidelity.
Annual Report
Nature, Extent, and Quality of Services Provided. The Board considered staffing within the investment adviser, FMR, and the sub-advisers (together, the Investment Advisers), including the background of the fund's portfolio manager and the fund's investment objective and discipline. The Independent Trustees also had discussions with senior management of Fidelity's investment operations and investment groups. The Board considered the structure of the portfolio manager compensation program and whether this structure provides appropriate incentives.
Resources Dedicated to Investment Management and Support Services. The Board reviewed the size, education, and experience of the Investment Advisers' investment staff, their use of technology, and the Investment Advisers' approach to recruiting, training, and retaining portfolio managers and other research, advisory, and management personnel. The Board considered Fidelity's extensive global research capabilities that enable the Investment Advisers to aggregate data from various sources in an effort to produce positive investment results. The Board noted that Fidelity's analysts have access to a variety of technological tools that enable them to perform both fundamental and quantitative analysis and to specialize in various disciplines. The Board also considered that Fidelity's portfolio managers and analysts have access to daily portfolio attribution that allows for monitoring of a fund's portfolio, as well as an electronic communication system that provides immediate real-time access to research concerning issuers and credit enhancers.
Shareholder and Administrative Services. The Board considered (i) the nature, extent, quality, and cost of administrative, distribution, and shareholder services performed by the Investment Advisers and their affiliates under the Advisory Contracts and under separate agreements covering transfer agency, pricing and bookkeeping, and securities lending services for the fund; (ii) the nature and extent of the Investment Advisers' supervision of third party service providers, principally custodians and subcustodians; and (iii) the resources devoted to, and the record of compliance with, the fund's compliance policies and procedures. The Board reviewed the allocation of fund brokerage, including allocations to brokers affiliated with the Investment Advisers, the use of brokerage commissions to pay fund expenses, and the use of "soft" commission dollars to pay for research services. The Board also considered that Fidelity voluntarily pays for market data out of its own resources.
The Board noted that the growth of fund assets across the complex allows Fidelity to reinvest in the development of services designed to enhance the value or convenience of the Fidelity funds as investment vehicles. These services include 24-hour access to account information and market information through phone representatives and over the Internet, and investor education materials and asset allocation tools.
Annual Report
Board Approval of Investment Advisory Contracts and
Management Fees - continued
Investment in a Large Fund Family. The Board considered the benefits to shareholders of investing in a Fidelity fund, including the benefits of investing in a fund that is part of a large family of funds offering a variety of investment disciplines and providing for a large variety of mutual fund investor services. For example, fund shareholders are offered the privilege of exchanging shares of the fund for shares of other Fidelity funds, as set forth in the fund's prospectus, without paying a sales charge. The Board noted that, since the last Advisory Contract renewals in July 2005, Fidelity has taken a number of actions that benefited particular funds, including (i) dedicating additional resources to investment research and to restructure the investment research teams; (ii) voluntarily entering into contractual arrangements with certain brokers pursuant to which Fidelity pays for research products and services separately out of its own resources, rather than bundling with fund commissions; (iii) launching the Fidelity Advantage Class of its five Spartan stock index funds and three Spartan bond index funds, which is a lower-fee class available to shareholders with higher account balances; (iv) contractually agreeing to impose expense limitations on Fidelity U.S. Bond Index Fund and reducing the fund's initial investment minimum; and (v) offering shareholders of each of the Fidelity Institutional Money Market Funds the privilege of exchanging shares of the fund for shares of other Fidelity funds.
Investment Performance and Compliance. The Board considered whether the fund has operated within its investment objective, as well as its record of compliance with its investment restrictions. It also reviewed the fund's absolute investment performance, as well as the fund's relative investment performance measured against (i) a broad-based securities market index, and (ii) a peer group of mutual funds deemed appropriate by the Board over multiple periods. The following charts considered by the Board show, over the one-, three-, and five-year periods ended December 31, 2005, the fund's cumulative total returns, the cumulative total returns of a broad-based securities market index ("benchmark"), and a range of cumulative total returns of a peer group of mutual funds identified by Lipper Inc. as having an investment objective similar to that of the fund. The box within each chart shows the 25th percentile return (bottom of box) and the 75th percentile return (top of box) of the Lipper peer group. Returns shown above the box are in the first quartile and returns shown below the box are in the fourth quartile. The percentage beaten number noted below each chart corresponds to the percentile box and represents the percentage of funds in the Lipper peer group whose performance was equal to or lower than that of the fund.
Annual Report
Fidelity Blue Chip Growth Fund
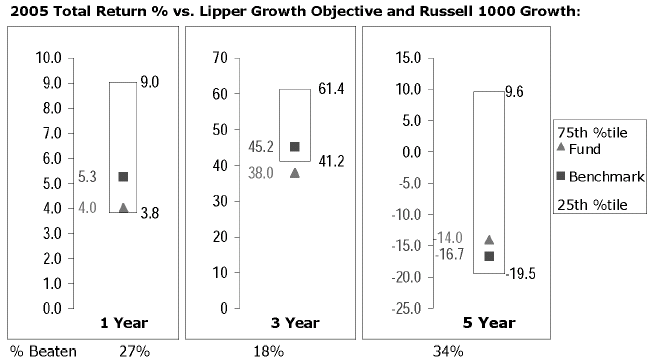
The Board reviewed the fund's relative investment performance against its Lipper peer group and stated that the performance of the fund was in the third quartile for the one- and five-year periods and the fourth quartile for the three-year period. The Board also stated that the relative investment performance of the fund was lower than its benchmark for the one- and three-year periods, although the fund's five-year cumulative total return was higher than its benchmark. The Board discussed with FMR actions to be taken by FMR to improve the fund's disappointing performance. The Board also reviewed the fund's relative investment performance against a peer group defined by Morningstar. The Board will continue to closely monitor the performance of the fund in the coming year.
The Board also considered that the fund's management fee is subject to upward or downward adjustment depending upon whether, and to what extent, the fund's investment performance for the performance period exceeds, or is exceeded by, the record (over the same period) of a Board-approved performance adjustment index. The Board realizes that the performance adjustment provides FMR with a strong economic incentive to seek to achieve superior performance for the fund's shareholders and helps to more closely align the interests of FMR and the fund's shareholders.
The Board considered that FMR has taken steps to refocus and strengthen equity research, equity portfolio management, and compliance. The Board noted with favor FMR's reorganization of its senior management team in 2005 and FMR's dedication of additional resources to investment research, and participated in the process that led to those changes.
Annual Report
Board Approval of Investment Advisory Contracts and
Management Fees - continued
Based on its review, and giving particular weight to the nature and quality of the resources dedicated by the Investment Advisers to maintain and improve relative performance, the Board concluded that the nature, extent, and quality of the services provided to the fund will benefit the fund's shareholders, particularly in light of the Board's view that the fund's shareholders benefit from investing in a fund that is part of a large family of funds offering a variety of investment disciplines and services.
Competitiveness of Management Fee and Total Fund Expenses. The Board considered the fund's management fee and total expenses compared to "mapped groups" of competitive funds and classes. Fidelity creates "mapped groups" by combining similar Lipper investment objective categories that have comparable management fee characteristics. Combining Lipper investment objective categories aids the Board's management fee and total expense comparisons by broadening the competitive group used for comparison and by reducing the number of universes to which various Fidelity funds are compared.
The Board considered two proprietary management fee comparisons for the 12-month periods shown in the chart below. The group of Lipper funds used by the Board for management fee comparisons is referred to below as the "Total Mapped Group" and, for the reasons explained above, is broader than the Lipper peer group used by the Board for performance comparisons. The Total Mapped Group comparison focuses on a fund's standing relative to the total universe of comparable funds available to investors, in terms of gross management fees before expense reimbursements or caps, and without giving effect to the fund's performance adjustment. "TMG %" represents the percentage of funds in the Total Mapped Group that had management fees that were lower than the fund's. For example, a TMG % of 9% means that 91% of the funds in the Total Mapped Group had higher management fees than the fund. The "Asset-Size Peer Group" (ASPG) comparison focuses on a fund's standing relative to non-Fidelity funds similar in size to the fund within the Total Mapped Group. The ASPG represents at least 15% of the funds in the Total Mapped Group with comparable asset size and management fee characteristics, subject to a minimum of 50 funds (or all funds in the Total Mapped Group if fewer than 50). Additional information, such as the ASPG quartile in which the fund's management fee ranked and the impact of the fund's performance adjustment, is also included in the chart and considered by the Board.
Annual Report
Fidelity Blue Chip Growth Fund
The Board noted that the fund's management fee ranked below the median of its Total Mapped Group and below the median of its ASPG for 2005. The Board also noted the effect of the fund's negative performance adjustment on the fund's management fee ranking. The Board noted that the performance adjustment for each year represents calculations for rolling 36-month periods that differ from the periods shown in the performance charts above.
Furthermore, the Board considered that, on May 17, 2006, after the periods shown in the chart above, shareholders approved a prospective change in the index used to calculate the fund's performance adjustment from the S&P 500 Index to the Russell 1000 Growth Index.
Based on its review, the Board concluded that the fund's management fee was fair and reasonable in light of the services that the fund receives and the other factors considered.
In its review of the fund's total expenses, the Board considered the fund's management fee as well as other fund expenses, such as transfer agent fees, pricing and bookkeeping fees, and custodial, legal, and audit fees. The Board also noted the effects of any waivers and reimbursements on fees and expenses, as well as the fund's negative performance adjustment. As part of its review, the Board also considered current and historical total expenses of the fund compared to competitive fund median expenses. The fund is compared to those funds and classes in the Total Mapped Group (used by the Board for management fee comparisons) that have a similar sales load structure.
Annual Report
Board Approval of Investment Advisory Contracts and
Management Fees - continued
The Board noted that the fund's total expenses ranked below its competitive median for 2005.
In its review of total expenses, the Board also considered Fidelity fee structures and other information on clients that FMR and its affiliates service in other competitive markets, such as other mutual funds advised or subadvised by FMR or its affiliates, pension plan clients, and other institutional clients.
Based on its review, the Board concluded that the fund's total expenses were reasonable in light of the services that the fund and its shareholders receive and the other factors considered.
Costs of the Services and Profitability. The Board considered the revenues earned and the expenses incurred by Fidelity in conducting the business of developing, marketing, distributing, managing, administering and servicing the fund and its shareholders. The Board also considered the level of Fidelity's profits in respect of all the Fidelity funds.
On an annual basis, FMR presents to the Board Fidelity's profitability for the fund. Fidelity calculates the profitability for each fund, as well as aggregate profitability for groups of Fidelity funds and all Fidelity funds, using a series of detailed revenue and cost allocation methodologies which originate with the audited books and records of Fidelity. The Audit Committee of the Board reviews any significant changes from the prior year's methodologies.
PricewaterhouseCoopers LLP (PwC), independent registered accounting firm and auditor to Fidelity and certain Fidelity funds, has been engaged annually by the Board as part of the Board's assessment of the results of Fidelity's profitability analysis. PwC's engagement includes the review and assessment of Fidelity's methodologies used in determining the revenues and expenses attributable to Fidelity's mutual fund business, and completion of agreed-upon procedures surrounding the mathematical accuracy of fund profitability and its conformity to allocation methodologies. After considering PwC's reports issued under the engagement and information provided by Fidelity, the Board believes that while other allocation methods may also be reasonable, Fidelity's profitability methodologies are reasonable in all material respects.
The Board has also reviewed Fidelity's non-fund businesses and any fall-out benefits related to the mutual fund business as well as cases where Fidelity's affiliates may benefit from or be related to the fund's business.
The Board considered the costs of the services provided by and the profits realized by Fidelity in connection with the operation of the fund and determined that the amount of profit is a fair entrepreneurial profit for the management of the fund.
Annual Report
Economies of Scale. The Board considered whether there have been economies of scale in respect of the management of the Fidelity funds, whether the Fidelity funds (including the fund) have appropriately benefited from any such economies of scale, and whether there is potential for realization of any further economies of scale. The Board considered the extent to which the fund will benefit from economies of scale through increased services to the fund, through waivers or reimbursements, or through fee or expense reductions, including reductions that occur through operation of the transfer agent agreement. The transfer agent fee varies in part based on the number of accounts in the fund. If the number of accounts decreases or the average account size increases, the overall transfer agent fee rate decreases.
The Board recognized that the fund's management contract incorporates a "group fee" structure, which provides for lower fee rates as total fund assets under FMR's management increase, and for higher fee rates as total fund assets under FMR's management decrease. The Board considered that the group fee is designed to deliver the benefits of economies of scale to fund shareholders when total fund assets increase, even if assets of any particular fund are unchanged or have declined, because some portion of Fidelity's costs are attributable to services provided to all Fidelity funds, and all funds benefit if those costs can be allocated among more assets. The Board concluded that, given the group fee structure, fund shareholders will achieve a certain level of economies of scale as assets under FMR's management increase at the fund complex level, regardless of whether Fidelity achieves any such economies of scale.
The Board further concluded that any potential economies of scale are being shared between fund shareholders and Fidelity in an appropriate manner.
Additional Information Requested by the Board. In order to develop fully the factual basis for consideration of the Advisory Contracts, the Board requested additional information on several topics, including (i) Fidelity's fund profitability methodology and profitability trends within certain funds; (ii) portfolio manager compensation; (iii) the extent to which any economies of scale exist and are shared between the funds and Fidelity; (iv) the total expenses of certain funds and classes relative to competitors, including the extent to which the expenses of certain funds have been or could be capped; (v) fund performance trends; and (vi) Fidelity's fee structures, including use of performance fees.
Based on its evaluation of all of the conclusions noted above, and after considering all material factors, the Board ultimately concluded that the advisory fee structures are fair and reasonable, and that the fund's Advisory Contracts should be renewed.
Annual Report
Managing Your Investments
Fidelity offers several ways to conveniently manage your personal investments via your telephone or PC. You can access your account information, conduct trades and research your investments 24 hours a day.
By Phone
Fidelity Automated Service Telephone provides a single toll-free number to access account balances, positions, quotes and trading. It's easy to navigate the service, and on your first call, the system will help you create a personal identification number (PIN) for security.
(phone_graphic)
Fidelity Automated
Service Telephone (FAST®)
1-800-544-5555
Press
1 For mutual fund and brokerage trading.
2 For quotes.*
3 For account balances and holdings.
4 To review orders and mutual
fund activity.
5 To change your PIN.
*0 To speak to a Fidelity representative.
By PC
Fidelity's web site on the Internet provides a wide range of information, including daily financial news, fund performance, interactive planning tools and news about Fidelity products and services.
(computer_graphic)
Fidelity's Web Site
www.fidelity.com
* When you call the quotes line, please remember that a fund's yield and return will vary and, except for money market funds, share price will also vary. This means that you may have a gain or loss when you sell your shares. There is no assurance that money market funds will be able to maintain a stable $1 share price; an investment in a money market fund is not insured or guaranteed by the U.S. government. Total returns are historical and include changes in share price, reinvestment of dividends and capital gains, and the effects of any sales charges.
Annual Report
To Write Fidelity
We'll give your correspondence immediate attention and send you written confirmation upon completion of your request.
(letter_graphic)
Making Changes
To Your Account
(such as changing name, address, bank, etc.)
Fidelity Investments
P.O. Box 770001
Cincinnati, OH 45277-0002
(letter_graphic)
For Non-Retirement
Accounts
Buying shares
Fidelity Investments
P.O. Box 770001
Cincinnati, OH 45277-0003
Overnight Express
Fidelity Investments
Attn: Distribution Services
100 Crosby Parkway - KC1H
Covington, KY 41015
Selling shares
Fidelity Investments
P.O. Box 770001
Cincinnati, OH 45277-0035
Overnight Express
Fidelity Investments
Attn: Distribution Services
100 Crosby Parkway - KC1H
Covington, KY 41015
General Correspondence
Fidelity Investments
P.O. Box 500
Merrimack, NH 03054-0500
(letter_graphic)
For Retirement
Accounts
Buying shares
Fidelity Investments
P.O. Box 770001
Cincinnati, OH 45277-0003
Selling shares
Fidelity Investments
P.O. Box 770001
Cincinnati, OH 45277-0035
Overnight Express
Fidelity Investments
Attn: Distribution Services
100 Crosby Parkway - KC1H
Covington, KY 41015
General Correspondence
Fidelity Investments
P.O. Box 500
Merrimack, NH 03054-0500
Annual Report
To Visit Fidelity
For directions and hours,
please call 1-800-544-9797.
Arizona
7001 West Ray Road
Chandler, AZ
15445 N. Scottsdale Road
Scottsdale, AZ
California
815 East Birch Street
Brea, CA
1411 Chapin Avenue
Burlingame, CA
851 East Hamilton Avenue
Campbell, CA
19200 Von Karman Avenue
Irvine, CA
601 Larkspur Landing Circle
Larkspur, CA
10100 Santa Monica Blvd.
Los Angeles, CA
27101 Puerta Real
Mission Viejo, CA
73-575 El Paseo
Palm Desert, CA
251 University Avenue
Palo Alto, CA
123 South Lake Avenue
Pasadena, CA
16995 Bernardo Ctr. Drive
Rancho Bernardo, CA
1220 Roseville Parkway
Roseville, CA
1740 Arden Way
Sacramento, CA
7676 Hazard Center Drive
San Diego, CA
11943 El Camino Real
San Diego, CA
8 Montgomery Street
San Francisco, CA
3793 State Street
Santa Barbara, CA
1200 Wilshire Boulevard
Santa Monica, CA
21701 Hawthorne Boulevard
Torrance, CA
2001 North Main Street
Walnut Creek, CA
6300 Canoga Avenue
Woodland Hills, CA
Colorado
1625 Broadway
Denver, CO
9185 Westview Road
Lone Tree, CO
Connecticut
48 West Putnam Avenue
Greenwich, CT
265 Church Street
New Haven, CT
300 Atlantic Street
Stamford, CT
29 South Main Street
West Hartford, CT
Delaware
400 Delaware Avenue
Wilmington, DE
Florida
4400 N. Federal Highway
Boca Raton, FL
121 Alhambra Plaza
Coral Gables, FL
2948 N. Federal Highway
Ft. Lauderdale, FL
4671 Town Center Parkway
Jacksonville, FL
1907 West State Road 434
Longwood, FL
8880 Tamiami Trail, North
Naples, FL
3501 PGA Boulevard
Palm Beach Gardens, FL
3550 Tamiami Trail, South
Sarasota, FL
1502 N. Westshore Blvd.
Tampa, FL
2465 State Road 7
Wellington, FL
Georgia
3445 Peachtree Road, N.E.
Atlanta, GA
1000 Abernathy Road
Atlanta, GA
Illinois
One North LaSalle Street
Chicago, IL
875 North Michigan Ave.
Chicago, IL
1415 West 22nd Street
Oak Brook, IL
1572 East Golf Road
Schaumburg, IL
3232 Lake Avenue
Wilmette, IL
Indiana
4729 East 82nd Street
Indianapolis, IN
Kansas
5400 College Boulevard
Overland Park, KS
Maine
Three Canal Plaza
Portland, ME
Maryland
7315 Wisconsin Avenue
Bethesda, MD
One W. Pennsylvania Ave.
Towson, MD
Massachusetts
801 Boylston Street
Boston, MA
155 Congress Street
Boston, MA
300 Granite Street
Braintree, MA
44 Mall Road
Burlington, MA
238 Main Street
Cambridge, MA
405 Cochituate Road
Framingham, MA
416 Belmont Street
Worcester, MA
Annual Report
Michigan
500 E. Eisenhower Pkwy.
Ann Arbor, MI
280 Old N. Woodward Ave.
Birmingham, MI
43420 Grand River Avenue
Novi, MI
29155 Northwestern Hwy.
Southfield, MI
Minnesota
7600 France Avenue South
Edina, MN
Missouri
1524 South Lindbergh Blvd.
St. Louis, MO
Nevada
2225 Village Walk Drive
Henderson, NV
New Jersey
150 Essex Street
Millburn, NJ
56 South Street
Morristown, NJ
396 Route 17, North
Paramus, NJ
3518 Route 1 North
Princeton, NJ
530 Broad Street
Shrewsbury, NJ
New York
1055 Franklin Avenue
Garden City, NY
37 West Jericho Turnpike
Huntington Station, NY
1271 Avenue of the Americas
New York, NY
980 Madison Avenue
New York, NY
61 Broadway
New York, NY
350 Park Avenue
New York, NY
200 Fifth Avenue
New York, NY
733 Third Avenue
New York, NY
11 Penn Plaza
New York, NY
2070 Broadway
New York, NY
1075 Northern Blvd.
Roslyn, NY
799 Central Park Avenue
Scarsdale, NY
North Carolina
4611 Sharon Road
Charlotte, NC
7011 Fayetteville Road
Durham, NC
Ohio
3805 Edwards Road
Cincinnati, OH
1324 Polaris Parkway
Columbus, OH
28699 Chagrin Boulevard
Woodmere Village, OH
Oregon
7493 SW Bridgeport Road
Tigard, OR
Pennsylvania
600 West DeKalb Pike
King of Prussia, PA
1735 Market Street
Philadelphia, PA
12001 Perry Highway
Wexford, PA
Rhode Island
47 Providence Place
Providence, RI
Tennessee
6150 Poplar Avenue
Memphis, TN
Texas
10000 Research Boulevard
Austin, TX
4001 Northwest Parkway
Dallas, TX
12532 Memorial Drive
Houston, TX
2701 Drexel Drive
Houston, TX
6560 Fannin Street
Houston, TX
6500 N. MacArthur Blvd.
Irving, TX
6005 West Park Boulevard
Plano, TX
14100 San Pedro
San Antonio, TX
1576 East Southlake Blvd.
Southlake, TX
19740 IH 45 North
Spring, TX
Utah
279 West South Temple
Salt Lake City, UT
Virginia
1861 International Drive
McLean, VA
Washington
411 108th Avenue, N.E.
Bellevue, WA
1518 6th Avenue
Seattle, WA
Washington, DC
1900 K Street, N.W.
Washington, DC
Wisconsin
595 North Barker Road
Brookfield, WI
Fidelity Brokerage Services, Inc., 100 Summer St., Boston, MA 02110 Member NYSE/SIPC
Annual Report
Investment Adviser
Fidelity Management & Research Company
Boston, MA
Investment Sub-Advisers
FMR Co., Inc.
Fidelity Research & Analysis Company (formerly Fidelity Management &
Research (Far East) Inc.)
Fidelity Management & Research
(U.K.) Inc.
Fidelity Investments Japan Limited
Fidelity International Investment
Advisors
Fidelity International Investment
Advisors (U.K.) Limited
General Distributor
Fidelity Distributors Corporation
Boston, MA
Transfer and Service Agent
Fidelity Service Company, Inc.
Boston, MA
Custodian
Citibank, N.A.
New York, NY
The Fidelity Telephone Connection
Mutual Fund 24-Hour Service
Exchanges/Redemptions
and Account Assistance 1-800-544-6666
Product Information 1-800-544-6666
Retirement Accounts 1-800-544-4774
(8 a.m. - 9 p.m.)
TDD Service 1-800-544-0118
for the deaf and hearing impaired
(9 a.m. - 9 p.m. Eastern time)
Fidelity Automated Service
Telephone (FAST®) (automated graphic) 1-800-544-5555
(automated graphic) Automated line for quickest service
BCF-UANN-0906
1.789244.103
(Fidelity Investment logo)(registered trademark)
Corporate Headquarters
82 Devonshire St., Boston, MA 02109
www.fidelity.com
Fidelity®
Blue Chip Value
Fund
Annual Report
July 31, 2006
(2_fidelity_logos) (Registered_Trademark)
Contents
Chairman's Message | <Click Here> | Ned Johnson's message to shareholders. |
Performance | <Click Here> | How the fund has done over time. |
Management's Discussion | <Click Here> | The manager's review of fund performance, strategy and outlook |
Shareholder Expense Example | <Click Here> | An example of shareholder expenses. |
Investment Changes | <Click Here> | A summary of major shifts in the fund's investments over the past 6 months. |
Investments | <Click Here> | A complete list of the fund's investments with their market values. |
Financial Statements | <Click Here> | Statements of assets and liabilities, operations, and changes in net assets,
as well as financial highlights. |
Notes | <Click Here> | Notes to the financial statements. |
Report of Independent Registered Public Accounting Firm | <Click Here> | |
Trustees and Officers | <Click Here> | |
Distributions | <Click Here> | |
Proxy Voting Results | <Click Here> | |
Board Approval of Investment Advisory Contracts and Management Fees | <Click Here> | |
To view a fund's proxy voting guidelines and proxy voting record for the 12-month period ended June 30, visit www.fidelity.com/proxyvotingresults or visit the Securities and Exchange Commission's (SEC) web site at www.sec.gov. You may also call 1-800-544-8544 to request a free copy of the proxy voting guidelines.
Standard & Poor's, S&P and S&P 500 are registered service marks of The McGraw-Hill Companies, Inc. and have been licensed for use by Fidelity Distributors Corporation.
Other third party marks appearing herein are the property of their respective owners.
All other marks appearing herein are registered or unregistered trademarks or service marks of FMR Corp. or an affiliated company.
Annual Report
This report and the financial statements contained herein are submitted for the general information of the shareholders of the fund. This report is not authorized for distribution to prospective investors in the fund unless preceded or accompanied by an effective prospectus.
A fund files its complete schedule of portfolio holdings with the SEC for the first and third quarters of each fiscal year on Form N-Q. Forms N-Q are available on the SEC's web site at http://www.sec.gov. A fund's Forms N-Q may be reviewed and copied at the SEC's Public Reference Room in Washington, DC. Information regarding the operation of the SEC's Public Reference Room may be obtained by calling 1-800-SEC-0330. For a complete list of a fund's portfolio holdings, view the most recent quarterly holdings report, semiannual report, or annual report on Fidelity's web site at http://www.fidelity.com/holdings.
NOT FDIC INSURED · MAY LOSE VALUE · NO BANK GUARANTEE
Neither the fund nor Fidelity Distributors Corporation is a bank.
Annual Report
Chairman's Message
(photo_of_Edward_C_Johnson_3d)
Dear Shareholder:
Although many securities markets made gains in early 2006, inflation concerns led to mixed results through the year's mid-point. Financial markets are always unpredictable. There are, however, a number of time-tested principles that can put the historical odds in your favor.
One of the basic tenets is to invest for the long term. Over time, riding out the markets' inevitable ups and downs has proven much more effective than selling into panic or chasing the hottest trend. Even missing only a few of the markets' best days can significantly diminish investor returns. Patience also affords the benefits of compounding - of earning interest on additional income or reinvested dividends and capital gains. There are tax advantages and cost benefits to consider as well. The more you sell, the more taxes you pay, and the more you trade, the higher the costs. While staying the course doesn't eliminate risk, it can considerably lessen the effect of short-term declines.
You can further manage your investing risk through diversification. And today, more than ever, geographic diversification should be taken into account. Studies indicate that asset allocation is the single most important determinant of a portfolio's long-term success. The right mix of stocks, bonds and cash - aligned to your particular risk tolerance and investment objective - is very important. Age-appropriate rebalancing is also an essential aspect of asset allocation. For younger investors, an emphasis on equities - which historically have been the best performing asset class over time - is encouraged. As investors near their specific goal, such as retirement or sending a child to college, consideration may be given to replacing volatile assets (e.g. common stocks) with more-stable fixed investments (bonds or savings plans).
A third investment principle - investing regularly - can help lower the average cost of your purchases. Investing a certain amount of money each month or quarter helps ensure you won't pay for all your shares at market highs. This strategy - known as dollar cost averaging - also reduces unconstructive "emotion" from investing, helping shareholders avoid selling weak performers just prior to an upswing, or chasing a hot performer just before a correction.
We invite you to contact us via the Internet, through our Investor Centers or over the phone. It is our privilege to provide you the information you need to make the investments that are right for you.
Sincerely,
/s/Edward C. Johnson 3d
Edward C. Johnson 3d
Annual Report
Performance: The Bottom Line
Average annual total return reflects the change in the value of an investment, assuming reinvestment of the fund's dividend income and capital gains (the profits earned upon the sale of securities that have grown in value) and assuming a constant rate of performance each year. The $10,000 table and the fund's returns do not reflect the deduction of taxes that a shareholder would pay on fund distributions or the redemption of fund shares. During periods of reimbursement by Fidelity, a fund's total return will be greater than it would be had the reimbursement not occurred. How a fund did yesterday is no guarantee of how it will do tomorrow.
Average Annual Total Returns
Periods ended July 31, 2006 | Past 1
year | Life of
FundA |
Fidelity® Blue Chip Value Fund | 8.05% | 12.78% |
A From June 17, 2003.
$10,000 Over Life of Fund
Let's say hypothetically that $10,000 was invested in Fidelity® Blue Chip Value Fund on June 17, 2003, when the fund started. The chart shows how the value of your investment would have changed, and also shows how the Russell 1000® Value Index performed over the same period.

Annual Report
Management's Discussion of Fund Performance
Comments from Brian Hogan, Portfolio Manager of Fidelity® Blue Chip Value Fund
As measured by the Dow Jones Wilshire 5000 Composite IndexSM - the broadest measure of U.S equity market performance - stocks did well for most of the 12-month period ending July 31, 2006, before faltering. For the one-year time frame as a whole, the Dow Jones Wilshire benchmark rose 5.43%. That was nearly identical to the 5.38% gain of the Standard & Poor's 500SM Index, a broad market proxy that's a reflection of larger-cap stocks. Stocks were resilient early on, bouncing back quickly after Hurricanes Katrina and Rita caused energy prices to spike to record-high levels. Buoyed by strong corporate earnings and solid economic growth, the S&P 500® ran off six consecutive months of positive returns from November through April. However, stocks pulled back for most of the remainder of the period. A slowdown in economic expansion and consumer spending, reaccelerating energy prices and continued interest rate hikes by the Federal Reserve Board cooled equity performance. Among other widely quoted market yardsticks, the Dow Jones Industrial AverageSM returned 7.59%, while the NASDAQ Composite® Index dropped 3.47%.
The fund gained 8.05% during the past year, underperforming the Russell 1000® Value Index, which returned 11.59%. Disappointing security and market selection were to blame for the fund's shortfall versus the index. Specifically, my picks in technology, materials and retailing detracted, as did unfavorable industry positioning within financials and industrials. These losses were offset somewhat by good stock selection in media, energy and pockets of health care, as well as our underweightings in banks and utilities. In terms of individual securities, industrial conglomerate Honeywell hurt the most, as the stock continued to be weighed down by "legacy" cost issues despite meeting or beating Wall Street expectations for earnings throughout the year. Tyco International also took away from results, as the company was unable to increase prices enough to offset rising raw material costs. Not owning telecommunication provider BellSouth - an index component - detracted as well. Helping the fund was biotechnology company Cephalon, whose settlement of patent litigation with several generic drug manufacturers over its sleep-disorder drug, Provigil, relieved pressure on the stock and boosted its value. Another contributor was Schlumberger, a provider of oil field services, which experienced increased oil and natural gas exploration activity caused by continued high energy prices.
The views expressed above reflect those of the portfolio manager(s) only through the end of the period as stated on the cover of this report and do not necessarily represent the views of Fidelity or any other person in the Fidelity organization. Any such views are subject to change at any time based upon market or other conditions and Fidelity disclaims any responsibility to update such views. These views may not be relied on as investment advice and, because investment decisions for a Fidelity fund are based on numerous factors, may not be relied on as an indication of trading intent on behalf of any Fidelity fund.
Annual Report
Shareholder Expense Example
As a shareholder of the Fund, you incur two types of costs: (1) transaction costs, and (2) ongoing costs, including management fees and other Fund expenses. This Example is intended to help you understand your ongoing costs (in dollars) of investing in the Fund and to compare these costs with the ongoing costs of investing in other mutual funds.
The Example is based on an investment of $1,000 invested at the beginning of the period and held for the entire period (February 1, 2006 to July 31, 2006).
Actual Expenses
The first line of the accompanying table provides information about actual account values and actual expenses. You may use the information in this line, together with the amount you invested, to estimate the expenses that you paid over the period. Simply divide your account value by $1,000.00 (for example, an $8,600 account value divided by $1,000.00 = 8.6), then multiply the result by the number in the first line under the heading entitled "Expenses Paid During Period" to estimate the expenses you paid on your account during this period. A small balance maintenance fee of $12.00 that is charged once a year may apply for certain accounts with a value of less than $2,000. This fee is not included in the table below. If it was, the estimate of expenses you paid during the period would be higher, and your ending account value lower, by this amount.
Hypothetical Example for Comparison Purposes
The second line of the accompanying table provides information about hypothetical account values and hypothetical expenses based on the Fund's actual expense ratio and an assumed rate of return of 5% per year before expenses, which is not the Fund's actual return. The hypothetical account values and expenses may not be used to estimate the actual ending account balance or expenses you paid for the period. You may use this information to compare the ongoing costs of investing in the Fund and other funds. To do so, compare this 5% hypothetical example with the 5% hypothetical examples that appear in the shareholder reports of the other funds. A small balance maintenance fee of $12.00 that is charged once a year may apply for certain accounts with a value of less than $2,000. This fee is not included in the table below. If it was, the estimate of expenses you paid during the period would be higher, and your ending account value lower, by this amount.
Please note that the expenses shown in the table are meant to highlight your ongoing costs only and do not reflect any transaction costs. Therefore, the second line of the table is useful in comparing ongoing costs only, and will not help you determine the relative total costs of owning different funds.
| Beginning
Account Value
February 1, 2006 | Ending
Account Value
July 31, 2006 | Expenses Paid
During Period*
February 1, 2006
to July 31, 2006 |
Actual | $ 1,000.00 | $ 987.30 | $ 4.58 |
Hypothetical (5% return per year before expenses) | $ 1,000.00 | $ 1,020.18 | $ 4.66 |
* Expenses are equal to the Fund's annualized expense ratio of .93%; multiplied by the average account value over the period, multiplied by 181/365 (to reflect the one-half year period).
Annual Report
Investment Changes
Top Ten Stocks as of July 31, 2006 |
| % of fund's
net assets | % of fund's net assets
6 months ago |
Honeywell International, Inc. | 4.0 | 3.6 |
General Electric Co. | 3.8 | 2.7 |
American International Group, Inc. | 3.5 | 3.9 |
AT&T, Inc. | 2.8 | 0.9 |
JPMorgan Chase & Co. | 2.8 | 1.7 |
Exxon Mobil Corp. | 2.7 | 2.6 |
Pfizer, Inc. | 2.5 | 1.8 |
Bank of America Corp. | 2.3 | 1.4 |
Citigroup, Inc. | 1.7 | 1.1 |
Merck & Co., Inc. | 1.7 | 1.0 |
| 27.8 | |
Top Five Market Sectors as of July 31, 2006 |
| % of fund's
net assets | % of fund's net assets
6 months ago |
Financials | 24.5 | 23.2 |
Industrials | 14.6 | 13.3 |
Energy | 12.2 | 14.3 |
Health Care | 12.0 | 12.9 |
Consumer Discretionary | 9.4 | 10.1 |
Asset Allocation (% of fund's net assets) |
As of July 31, 2006 * | As of January 31, 2006 ** |
| Stocks 98.3% | | | Stocks 97.8% | |
| Short-Term
Investments and
Net Other Assets 1.7% | | | Short-Term
Investments and
Net Other Assets 2.2% | |
* Foreign
investments | 9.2% | | ** Foreign investments | 9.0% | |

Annual Report
Investments July 31, 2006
Showing Percentage of Net Assets
Common Stocks - 98.3% |
| Shares | | Value (Note 1) |
CONSUMER DISCRETIONARY - 9.4% |
Auto Components - 0.1% |
Tenneco, Inc. (a) | 8,200 | | $ 190,486 |
Automobiles - 0.4% |
General Motors Corp. (d) | 26,300 | | 847,649 |
Hyundai Motor Co. | 2,720 | | 208,168 |
Renault SA | 900 | | 98,350 |
| | 1,154,167 |
Diversified Consumer Services - 0.3% |
Apollo Group, Inc. Class A (a) | 9,000 | | 425,880 |
Service Corp. International (SCI) | 44,000 | | 330,440 |
| | 756,320 |
Hotels, Restaurants & Leisure - 0.7% |
Gaylord Entertainment Co. (a) | 11,700 | | 447,174 |
McDonald's Corp. | 38,800 | | 1,373,132 |
| | 1,820,306 |
Household Durables - 0.7% |
Sony Corp. sponsored ADR | 33,500 | | 1,540,665 |
Whirlpool Corp. | 6,100 | | 470,859 |
| | 2,011,524 |
Internet & Catalog Retail - 0.2% |
Coldwater Creek, Inc. (a) | 20,850 | | 415,541 |
Expedia, Inc. (a) | 8,850 | | 118,590 |
| | 534,131 |
Leisure Equipment & Products - 0.9% |
Eastman Kodak Co. (d) | 106,900 | | 2,378,525 |
Leapfrog Enterprises, Inc. Class A (a)(d) | 8,200 | | 81,836 |
| | 2,460,361 |
Media - 2.7% |
CBS Corp. Class B | 11,320 | | 310,508 |
Clear Channel Communications, Inc. | 21,500 | | 622,425 |
Clear Channel Outdoor Holding, Inc. Class A | 10,500 | | 215,460 |
Comcast Corp. Class A (a) | 41,600 | | 1,430,208 |
Lamar Advertising Co. Class A (a) | 6,796 | | 333,276 |
Live Nation, Inc. (a) | 12,100 | | 253,616 |
News Corp. Class A | 48,632 | | 935,680 |
Sun TV Ltd. | 92 | | 2,293 |
The Walt Disney Co. | 77,300 | | 2,295,037 |
Common Stocks - continued |
| Shares | | Value (Note 1) |
CONSUMER DISCRETIONARY - continued |
Media - continued |
Univision Communications, Inc. Class A (a) | 19,600 | | $ 654,640 |
Viacom, Inc. Class B (non-vtg.) (a) | 9,220 | | 321,317 |
| | 7,374,460 |
Multiline Retail - 1.3% |
99 Cents Only Stores (a) | 22,700 | | 234,945 |
Family Dollar Stores, Inc. | 18,600 | | 422,592 |
Federated Department Stores, Inc. | 38,500 | | 1,351,735 |
Kohl's Corp. (a) | 18,000 | | 1,019,340 |
Lotte Shopping Co. Ltd. GDR (e) | 16,700 | | 286,575 |
Saks, Inc. | 22,800 | | 367,992 |
| | 3,683,179 |
Specialty Retail - 1.8% |
Best Buy Co., Inc. | 29,300 | | 1,328,462 |
Casual Male Retail Group, Inc. (a) | 14,400 | | 160,560 |
Circuit City Stores, Inc. | 13,700 | | 335,650 |
Eddie Bauer Holdings, Inc. (a) | 8,000 | | 104,000 |
Gymboree Corp. (a) | 11,400 | | 382,128 |
Home Depot, Inc. | 42,300 | | 1,468,233 |
OfficeMax, Inc. | 3,700 | | 152,107 |
Staples, Inc. | 22,700 | | 490,774 |
TJX Companies, Inc. | 15,400 | | 375,298 |
Urban Outfitters, Inc. (a) | 500 | | 7,295 |
| | 4,804,507 |
Textiles, Apparel & Luxury Goods - 0.3% |
Deckers Outdoor Corp. (a) | 14,200 | | 605,488 |
VF Corp. | 4,000 | | 271,280 |
| | 876,768 |
TOTAL CONSUMER DISCRETIONARY | | 25,666,209 |
CONSUMER STAPLES - 6.6% |
Beverages - 0.6% |
Diageo PLC sponsored ADR | 4,900 | | 344,568 |
The Coca-Cola Co. | 30,400 | | 1,352,800 |
| | 1,697,368 |
Food & Staples Retailing - 1.9% |
Carrefour SA | 3,600 | | 224,451 |
CVS Corp. | 23,300 | | 762,376 |
Kroger Co. | 107,900 | | 2,474,147 |
Common Stocks - continued |
| Shares | | Value (Note 1) |
CONSUMER STAPLES - continued |
Food & Staples Retailing - continued |
Safeway, Inc. | 25,300 | | $ 710,424 |
Wal-Mart Stores, Inc. | 20,900 | | 930,050 |
| | 5,101,448 |
Food Products - 0.5% |
McCormick & Co., Inc. (non-vtg.) | 18,100 | | 634,586 |
Nestle SA (Reg.) | 1,446 | | 473,814 |
Tyson Foods, Inc. Class A | 17,700 | | 250,455 |
| | 1,358,855 |
Household Products - 1.4% |
Colgate-Palmolive Co. | 66,100 | | 3,921,052 |
Personal Products - 1.1% |
Alberto-Culver Co. | 5,900 | | 287,566 |
Avon Products, Inc. | 88,700 | | 2,571,413 |
| | 2,858,979 |
Tobacco - 1.1% |
Altria Group, Inc. | 36,500 | | 2,918,905 |
TOTAL CONSUMER STAPLES | | 17,856,607 |
ENERGY - 12.2% |
Energy Equipment & Services - 4.8% |
FMC Technologies, Inc. (a) | 19,900 | | 1,254,098 |
GlobalSantaFe Corp. | 15,400 | | 845,922 |
Halliburton Co. | 81,300 | | 2,712,168 |
National Oilwell Varco, Inc. (a) | 49,357 | | 3,308,893 |
Noble Corp. | 7,600 | | 545,300 |
Pride International, Inc. (a) | 40,600 | | 1,212,722 |
Schlumberger Ltd. (NY Shares) | 23,600 | | 1,577,660 |
Smith International, Inc. | 36,000 | | 1,604,520 |
| | 13,061,283 |
Oil, Gas & Consumable Fuels - 7.4% |
Anadarko Petroleum Corp. | 20,900 | | 955,966 |
Chevron Corp. | 36,400 | | 2,394,392 |
ConocoPhillips | 11,000 | | 755,040 |
CONSOL Energy, Inc. | 14,200 | | 584,472 |
El Paso Corp. | 63,700 | | 1,019,200 |
EOG Resources, Inc. | 9,600 | | 711,840 |
Exxon Mobil Corp. | 110,100 | | 7,458,174 |
Hess Corp. | 9,200 | | 486,680 |
Common Stocks - continued |
| Shares | | Value (Note 1) |
ENERGY - continued |
Oil, Gas & Consumable Fuels - continued |
Hugoton Royalty Trust | 1,150 | | $ 35,765 |
Massey Energy Co. | 15,000 | | 400,800 |
Occidental Petroleum Corp. | 9,500 | | 1,023,625 |
OMI Corp. | 18,200 | | 401,492 |
Quicksilver Resources, Inc. (a) | 39,850 | | 1,409,096 |
Ultra Petroleum Corp. (a) | 6,700 | | 392,352 |
Valero Energy Corp. | 22,200 | | 1,496,946 |
XTO Energy, Inc. | 13,500 | | 634,365 |
| | 20,160,205 |
TOTAL ENERGY | | 33,221,488 |
FINANCIALS - 24.5% |
Capital Markets - 3.4% |
Bear Stearns Companies, Inc. | 2,400 | | 340,488 |
Charles Schwab Corp. | 32,500 | | 516,100 |
Investors Financial Services Corp. | 11,500 | | 515,430 |
KKR Private Equity Investors, L.P. Restricted Depositary Units (f) | 7,700 | | 180,950 |
Lehman Brothers Holdings, Inc. | 15,100 | | 980,745 |
Merrill Lynch & Co., Inc. | 6,749 | | 491,462 |
Morgan Stanley | 44,500 | | 2,959,250 |
Nomura Holdings, Inc. | 45,000 | | 801,900 |
State Street Corp. | 22,000 | | 1,321,320 |
TradeStation Group, Inc. (a) | 21,200 | | 309,944 |
UBS AG (NY Shares) | 14,800 | | 805,120 |
| | 9,222,709 |
Commercial Banks - 2.2% |
Bank of China Ltd. (H Shares) | 208,000 | | 91,819 |
Kookmin Bank sponsored ADR | 8,300 | | 715,792 |
Mizuho Financial Group, Inc. | 65 | | 545,966 |
Standard Chartered PLC (United Kingdom) | 10,700 | | 270,639 |
UCBH Holdings, Inc. | 29,300 | | 488,724 |
Wachovia Corp. | 39,656 | | 2,126,751 |
Wells Fargo & Co. | 22,400 | | 1,620,416 |
| | 5,860,107 |
Consumer Finance - 0.3% |
Capital One Financial Corp. | 10,800 | | 835,380 |
Diversified Financial Services - 6.8% |
Bank of America Corp. | 123,816 | | 6,380,238 |
Citigroup, Inc. | 98,100 | | 4,739,211 |
Common Stocks - continued |
| Shares | | Value (Note 1) |
FINANCIALS - continued |
Diversified Financial Services - continued |
IntercontinentalExchange, Inc. | 300 | | $ 17,880 |
JPMorgan Chase & Co. | 163,952 | | 7,479,490 |
| | 18,616,819 |
Insurance - 8.2% |
ACE Ltd. | 57,380 | | 2,956,791 |
Allied World Assurance Holdings Ltd. | 1,500 | | 52,350 |
American International Group, Inc. | 158,500 | | 9,616,195 |
Aspen Insurance Holdings Ltd. | 19,100 | | 450,760 |
Endurance Specialty Holdings Ltd. | 6,100 | | 185,196 |
Hartford Financial Services Group, Inc. | 35,400 | | 3,003,336 |
Hilb Rogal & Hobbs Co. | 9,700 | | 392,850 |
Muenchener Rueckversicherungs-Gesellschaft AG (Reg.) | 2,600 | | 358,115 |
Navigators Group, Inc. (a) | 2,500 | | 106,275 |
PartnerRe Ltd. | 27,400 | | 1,702,362 |
Platinum Underwriters Holdings Ltd. | 20,400 | | 577,116 |
Scottish Re Group Ltd. | 16,900 | | 67,431 |
Swiss Reinsurance Co. (Reg.) | 4,532 | | 325,911 |
W.R. Berkley Corp. | 49,350 | | 1,776,600 |
XL Capital Ltd. Class A | 13,200 | | 840,840 |
| | 22,412,128 |
Real Estate Investment Trusts - 1.5% |
Annaly Mortgage Management, Inc. | 17,000 | | 217,770 |
Equity Lifestyle Properties, Inc. | 6,000 | | 257,820 |
Equity Office Properties Trust | 15,200 | | 576,232 |
Equity Residential (SBI) | 51,200 | | 2,381,312 |
General Growth Properties, Inc. | 15,100 | | 689,164 |
| | 4,122,298 |
Thrifts & Mortgage Finance - 2.1% |
Doral Financial Corp. | 48,722 | | 249,457 |
Fannie Mae | 72,940 | | 3,494,555 |
Freddie Mac | 15,000 | | 867,900 |
Golden West Financial Corp., Delaware | 6,220 | | 458,165 |
Hudson City Bancorp, Inc. | 39,200 | | 508,424 |
W Holding Co., Inc. | 6,732 | | 35,478 |
| | 5,613,979 |
TOTAL FINANCIALS | | 66,683,420 |
Common Stocks - continued |
| Shares | | Value (Note 1) |
HEALTH CARE - 12.0% |
Biotechnology - 1.5% |
Alkermes, Inc. (a) | 5,400 | | $ 92,664 |
Alnylam Pharmaceuticals, Inc. (a) | 39,300 | | 501,861 |
Amgen, Inc. (a) | 2,100 | | 146,454 |
Biogen Idec, Inc. (a) | 15,000 | | 631,800 |
Cephalon, Inc. (a) | 42,400 | | 2,787,376 |
ONYX Pharmaceuticals, Inc. (a) | 4,600 | | 72,266 |
| | 4,232,421 |
Health Care Equipment & Supplies - 2.0% |
Aspect Medical Systems, Inc. (a) | 4,000 | | 58,600 |
Baxter International, Inc. | 91,640 | | 3,848,880 |
C.R. Bard, Inc. | 7,400 | | 525,178 |
Cooper Companies, Inc. | 3,100 | | 137,020 |
Hologic, Inc. (a) | 2,900 | | 130,239 |
Inverness Medical Innovations, Inc. (a) | 16,400 | | 487,736 |
Varian Medical Systems, Inc. (a) | 5,700 | | 258,324 |
| | 5,445,977 |
Health Care Providers & Services - 0.2% |
Brookdale Senior Living, Inc. | 6,600 | | 306,900 |
Chemed Corp. | 6,570 | | 241,645 |
| | 548,545 |
Health Care Technology - 0.3% |
Emdeon Corp. (a) | 22,800 | | 274,284 |
IMS Health, Inc. | 8,300 | | 227,752 |
WebMD Health Corp. Class A (d) | 7,000 | | 297,570 |
| | 799,606 |
Life Sciences Tools & Services - 1.7% |
Dionex Corp. (a) | 5,900 | | 326,565 |
Illumina, Inc. (a) | 7,200 | | 275,256 |
PerkinElmer, Inc. | 14,900 | | 268,647 |
Thermo Electron Corp. (a) | 47,000 | | 1,739,470 |
Varian, Inc. (a) | 13,500 | | 607,230 |
Waters Corp. (a) | 32,400 | | 1,318,032 |
| | 4,535,200 |
Pharmaceuticals - 6.3% |
Allergan, Inc. | 2,900 | | 312,765 |
Bristol-Myers Squibb Co. | 54,300 | | 1,301,571 |
Johnson & Johnson | 20,300 | | 1,269,765 |
Merck & Co., Inc. | 113,700 | | 4,578,699 |
Pfizer, Inc. | 261,700 | | 6,801,583 |
Common Stocks - continued |
| Shares | | Value (Note 1) |
HEALTH CARE - continued |
Pharmaceuticals - continued |
Schering-Plough Corp. | 89,110 | | $ 1,821,408 |
Wyeth | 24,700 | | 1,197,209 |
| | 17,283,000 |
TOTAL HEALTH CARE | | 32,844,749 |
INDUSTRIALS - 14.6% |
Aerospace & Defense - 5.9% |
EADS NV | 11,200 | | 322,608 |
General Dynamics Corp. | 13,000 | | 871,260 |
Goodrich Corp. | 19,100 | | 771,067 |
Hexcel Corp. (a) | 67,700 | | 972,849 |
Honeywell International, Inc. | 283,360 | | 10,966,029 |
L-3 Communications Holdings, Inc. | 5,400 | | 397,710 |
Raytheon Co. | 17,700 | | 797,739 |
Rockwell Collins, Inc. | 8,100 | | 432,297 |
United Technologies Corp. | 8,500 | | 528,615 |
| | 16,060,174 |
Air Freight & Logistics - 0.1% |
EGL, Inc. (a) | 5,940 | | 260,825 |
Airlines - 0.6% |
ACE Aviation Holdings, Inc. Class A (a) | 9,200 | | 233,659 |
AirTran Holdings, Inc. (a) | 33,700 | | 422,598 |
JetBlue Airways Corp. (a) | 21,950 | | 234,646 |
Southwest Airlines Co. | 31,800 | | 572,082 |
UAL Corp. (a) | 10,105 | | 264,145 |
| | 1,727,130 |
Building Products - 0.5% |
Masco Corp. | 50,400 | | 1,347,192 |
Commercial Services & Supplies - 0.7% |
Allied Waste Industries, Inc. | 13,600 | | 138,176 |
Cintas Corp. | 7,500 | | 264,750 |
Robert Half International, Inc. | 15,530 | | 502,551 |
The Brink's Co. | 15,500 | | 853,895 |
| | 1,759,372 |
Construction & Engineering - 0.9% |
Chicago Bridge & Iron Co. NV (NY Shares) | 16,400 | | 397,864 |
Common Stocks - continued |
| Shares | | Value (Note 1) |
INDUSTRIALS - continued |
Construction & Engineering - continued |
Fluor Corp. | 15,500 | | $ 1,361,365 |
Jacobs Engineering Group, Inc. (a) | 9,500 | | 788,405 |
| | 2,547,634 |
Electrical Equipment - 0.2% |
ABB Ltd. sponsored ADR | 42,700 | | 552,111 |
Industrial Conglomerates - 5.0% |
General Electric Co. | 322,250 | | 10,534,353 |
Smiths Group PLC | 31,400 | | 528,791 |
Textron, Inc. | 8,800 | | 791,208 |
Tyco International Ltd. | 71,840 | | 1,874,306 |
| | 13,728,658 |
Machinery - 0.5% |
Atlas Copco AB (A Shares) | 4,800 | | 119,545 |
Deere & Co. | 10,200 | | 740,214 |
Flowserve Corp. (a) | 6,800 | | 352,240 |
| | 1,211,999 |
Trading Companies & Distributors - 0.1% |
Interline Brands, Inc. (a) | 16,500 | | 359,700 |
Transportation Infrastructure - 0.1% |
Grupo Aeroportuario del Pacifico SA de CV sponsored ADR | 7,900 | | 236,447 |
TOTAL INDUSTRIALS | | 39,791,242 |
INFORMATION TECHNOLOGY - 6.9% |
Communications Equipment - 1.2% |
Alcatel SA sponsored ADR (a) | 38,400 | | 433,152 |
Comverse Technology, Inc. (a) | 8,400 | | 162,792 |
Dycom Industries, Inc. (a) | 20,100 | | 361,599 |
Lucent Technologies, Inc. (a) | 138,700 | | 295,431 |
MasTec, Inc. (a) | 27,300 | | 356,811 |
Motorola, Inc. | 11,400 | | 259,464 |
Nokia Corp. sponsored ADR | 47,900 | | 950,815 |
Nortel Networks Corp. | 212,800 | | 417,089 |
| | 3,237,153 |
Computers & Peripherals - 1.4% |
Dell, Inc. (a) | 36,100 | | 782,648 |
Hewlett-Packard Co. | 53,500 | | 1,707,185 |
Common Stocks - continued |
| Shares | | Value (Note 1) |
INFORMATION TECHNOLOGY - continued |
Computers & Peripherals - continued |
Imation Corp. | 12,900 | | $ 525,288 |
Seagate Technology | 28,800 | | 668,160 |
| | 3,683,281 |
Electronic Equipment & Instruments - 1.1% |
Agilent Technologies, Inc. (a) | 25,300 | | 719,532 |
Amphenol Corp. Class A | 4,700 | | 263,576 |
Jabil Circuit, Inc. | 11,600 | | 267,960 |
Molex, Inc. | 14,500 | | 459,940 |
Symbol Technologies, Inc. | 79,800 | | 881,790 |
Vishay Intertechnology, Inc. (a) | 33,200 | | 465,796 |
| | 3,058,594 |
Internet Software & Services - 0.6% |
eBay, Inc. (a) | 10,400 | | 250,328 |
Google, Inc. Class A (sub. vtg.) (a) | 3,500 | | 1,353,100 |
| | 1,603,428 |
IT Services - 0.7% |
First Data Corp. | 17,700 | | 723,045 |
Infosys Technologies Ltd. sponsored ADR | 13,300 | | 546,497 |
Mastercard, Inc. Class A | 5,700 | | 261,459 |
Paychex, Inc. | 9,400 | | 321,292 |
Satyam Computer Services Ltd. sponsored ADR | 2,900 | | 102,225 |
| | 1,954,518 |
Office Electronics - 0.1% |
Zebra Technologies Corp. Class A (a) | 13,000 | | 407,550 |
Semiconductors & Semiconductor Equipment - 1.0% |
Applied Materials, Inc. | 16,900 | | 266,006 |
Freescale Semiconductor, Inc. Class A (a) | 24,100 | | 689,983 |
Intel Corp. | 22,700 | | 408,600 |
Marvell Technology Group Ltd. (a) | 18,800 | | 348,740 |
Micron Technology, Inc. (a) | 26,100 | | 406,899 |
Samsung Electronics Co. Ltd. | 690 | | 439,219 |
Teradyne, Inc. (a) | 21,400 | | 281,196 |
| | 2,840,643 |
Software - 0.8% |
BEA Systems, Inc. (a) | 34,959 | | 410,419 |
Electronic Arts, Inc. (a) | 5,500 | | 259,105 |
Common Stocks - continued |
| Shares | | Value (Note 1) |
INFORMATION TECHNOLOGY - continued |
Software - continued |
NAVTEQ Corp. (a) | 6,700 | | $ 188,806 |
Symantec Corp. (a) | 73,400 | | 1,274,958 |
| | 2,133,288 |
TOTAL INFORMATION TECHNOLOGY | | 18,918,455 |
MATERIALS - 5.2% |
Chemicals - 2.2% |
Ashland, Inc. | 4,900 | | 325,899 |
Chemtura Corp. | 34,500 | | 297,045 |
Cytec Industries, Inc. | 11,900 | | 635,579 |
E.I. du Pont de Nemours & Co. | 16,900 | | 670,254 |
Ecolab, Inc. | 29,200 | | 1,257,644 |
Georgia Gulf Corp. | 10,300 | | 262,238 |
Lyondell Chemical Co. | 18,018 | | 401,261 |
NOVA Chemicals Corp. | 14,800 | | 436,571 |
Praxair, Inc. | 22,500 | | 1,233,900 |
Rohm & Haas Co. | 8,300 | | 382,796 |
| | 5,903,187 |
Containers & Packaging - 0.5% |
Ball Corp. | 5,500 | | 210,650 |
Owens-Illinois, Inc. | 20,100 | | 304,113 |
Packaging Corp. of America | 16,700 | | 382,931 |
Smurfit-Stone Container Corp. | 62,569 | | 633,198 |
| | 1,530,892 |
Metals & Mining - 2.5% |
Alcoa, Inc. | 35,200 | | 1,054,240 |
Aleris International, Inc. (a) | 8,600 | | 352,084 |
Allegheny Technologies, Inc. | 5,620 | | 359,062 |
Freeport-McMoRan Copper & Gold, Inc. Class B | 17,900 | | 976,624 |
Mittal Steel Co. NV Class A (NY Shares) (d) | 23,700 | | 810,777 |
Newmont Mining Corp. | 47,300 | | 2,423,179 |
Oregon Steel Mills, Inc. (a) | 17,900 | | 827,696 |
| | 6,803,662 |
TOTAL MATERIALS | | 14,237,741 |
TELECOMMUNICATION SERVICES - 5.1% |
Diversified Telecommunication Services - 4.1% |
AT&T, Inc. | 255,400 | | 7,659,446 |
Common Stocks - continued |
| Shares | | Value (Note 1) |
TELECOMMUNICATION SERVICES - continued |
Diversified Telecommunication Services - continued |
Covad Communications Group, Inc. (a) | 122,712 | | $ 196,339 |
TELUS Corp. | 11,700 | | 505,594 |
Verizon Communications, Inc. | 83,600 | | 2,827,352 |
| | 11,188,731 |
Wireless Telecommunication Services - 1.0% |
American Tower Corp. Class A (a) | 34,700 | | 1,172,860 |
Sprint Nextel Corp. | 75,339 | | 1,491,712 |
| | 2,664,572 |
TOTAL TELECOMMUNICATION SERVICES | | 13,853,303 |
UTILITIES - 1.8% |
Electric Utilities - 1.0% |
Exelon Corp. | 31,600 | | 1,829,640 |
PPL Corp. | 29,400 | | 1,000,188 |
| | 2,829,828 |
Independent Power Producers & Energy Traders - 0.5% |
AES Corp. (a) | 19,400 | | 385,284 |
Mirant Corp. (a) | 31,500 | | 836,955 |
| | 1,222,239 |
Multi-Utilities - 0.3% |
CMS Energy Corp. (a) | 62,300 | | 872,823 |
TOTAL UTILITIES | | 4,924,890 |
TOTAL COMMON STOCKS (Cost $241,019,707) | 267,998,104 |
Money Market Funds - 3.0% |
| Shares | | Value (Note 1) |
Fidelity Cash Central Fund, 5.3% (b) | 5,324,720 | | $ 5,324,720 |
Fidelity Securities Lending Cash Central Fund, 5.32% (b)(c) | 2,921,425 | | 2,921,425 |
TOTAL MONEY MARKET FUNDS (Cost $8,246,145) | 8,246,145 |
TOTAL INVESTMENT PORTFOLIO - 101.3% (Cost $249,265,852) | | 276,244,249 |
NET OTHER ASSETS - (1.3)% | | (3,542,738) |
NET ASSETS - 100% | $ 272,701,511 |
Legend |
(a) Non-income producing |
(b) Affiliated fund that is available only to investment companies and other accounts managed by Fidelity Investments. The rate quoted is the annualized seven-day yield of the fund at period end. A complete unaudited listing of the fund's holdings as of its most recent quarter end is available upon request. |
(c) Investment made with cash collateral received from securities on loan. |
(d) Security or a portion of the security is on loan at period end. |
(e) Security exempt from registration under Rule 144A of the Securities Act of 1933. These securities may be resold in transactions exempt from registration, normally to qualified institutional buyers. At the period end, the value of these securities amounted to $286,575 or 0.1% of net assets. |
(f) Restricted securities - Investment in securities not registered under the Securities Act of 1933 (excluding 144A issues). At the end of the period, the value of restricted securities (excluding 144A issues) amounted to $180,950 or 0.1% of net assets. |
Additional information on each holding is as follows: |
Security | Acquisition Date | Acquisition Cost |
KKR Private Equity Investors, L.P. Restricted Depositary Units | 5/3/06 | $ 192,500 |
Affiliated Central Funds |
Information regarding fiscal year to date income earned by the fund from the affiliated Central funds is as follows: |
Fund | Income earned |
Fidelity Cash Central Fund | $ 209,377 |
Fidelity Securities Lending Cash Central Fund | 34,153 |
Total | $ 243,530 |
See accompanying notes which are an integral part of the financial statements.
Annual Report
Financial Statements
Statement of Assets and Liabilities
| July 31, 2006 |
Assets | | |
Investment in securities, at value (including securities loaned of $2,887,486) - See accompanying schedule: Unaffiliated issuers (cost $241,019,707) | $ 267,998,104 | |
Affiliated Central Funds (cost $8,246,145) | 8,246,145 | |
Total Investments (cost $249,265,852) | | $ 276,244,249 |
Cash | | 86,612 |
Receivable for investments sold | | 1,010,263 |
Receivable for fund shares sold | | 850,254 |
Dividends receivable | | 228,625 |
Interest receivable | | 27,159 |
Prepaid expenses | | 270 |
Other receivables | | 14,217 |
Total assets | | 278,461,649 |
| | |
Liabilities | | |
Payable for investments purchased | $ 2,362,914 | |
Payable for fund shares redeemed | 228,315 | |
Accrued management fee | 113,267 | |
Other affiliated payables | 74,126 | |
Other payables and accrued expenses | 60,091 | |
Collateral on securities loaned, at value | 2,921,425 | |
Total liabilities | | 5,760,138 |
| | |
Net Assets | | $ 272,701,511 |
Net Assets consist of: | | |
Paid in capital | | $ 238,939,780 |
Undistributed net investment income | | 1,126,551 |
Accumulated undistributed net realized gain (loss) on investments and foreign currency transactions | | 5,656,508 |
Net unrealized appreciation (depreciation) on investments and assets and liabilities in foreign currencies | | 26,978,672 |
Net Assets, for 19,552,044 shares outstanding | | $ 272,701,511 |
Net Asset Value, offering price and redemption price per share ($272,701,511 ÷ 19,552,044 shares) | | $ 13.95 |
See accompanying notes which are an integral part of the financial statements.
Annual Report
Statement of Operations
| Year ended July 31, 2006 |
Investment Income | | |
Dividends | | $ 3,682,533 |
Interest | | 94 |
Income from affiliated Central Funds | | 243,530 |
Total income | | 3,926,157 |
| | |
Expenses | | |
Management fee
Basic fee | $ 1,321,700 | |
Performance adjustment | (39,897) | |
Transfer agent fees | 687,942 | |
Accounting and security lending fees | 87,563 | |
Independent trustees' compensation | 904 | |
Custodian fees and expenses | 31,982 | |
Registration fees | 35,503 | |
Audit | 44,031 | |
Legal | 4,038 | |
Miscellaneous | 20,701 | |
Total expenses before reductions | 2,194,467 | |
Expense reductions | (38,707) | 2,155,760 |
Net investment income (loss) | | 1,770,397 |
Realized and Unrealized Gain (Loss) Net realized gain (loss) on: | | |
Investment securities: | | |
Unaffiliated issuers | 8,882,166 | |
Foreign currency transactions | 1,456 | |
Total net realized gain (loss) | | 8,883,622 |
Change in net unrealized appreciation (depreciation) on: Investment securities | 4,670,761 | |
Assets and liabilities in foreign currencies | 274 | |
Total change in net unrealized appreciation (depreciation) | | 4,671,035 |
Net gain (loss) | | 13,554,657 |
Net increase (decrease) in net assets resulting from operations | | $ 15,325,054 |
See accompanying notes which are an integral part of the financial statements.
Annual Report
Financial Statements - continued
Statement of Changes in Net Assets
| Year ended
July 31,
2006 | Year ended
July 31,
2005 |
Increase (Decrease) in Net Assets | | |
Operations | | |
Net investment income (loss) | $ 1,770,397 | $ 1,039,907 |
Net realized gain (loss) | 8,883,622 | 603,411 |
Change in net unrealized appreciation (depreciation) | 4,671,035 | 17,741,384 |
Net increase (decrease) in net assets resulting
from operations | 15,325,054 | 19,384,702 |
Distributions to shareholders from net investment income | (1,177,122) | (665,959) |
Distributions to shareholders from net realized gain | (3,435,206) | (480,889) |
Total distributions | (4,612,328) | (1,146,848) |
Share transactions
Proceeds from sales of shares | 153,895,657 | 147,890,874 |
Reinvestment of distributions | 4,472,639 | 1,111,333 |
Cost of shares redeemed | (78,450,120) | (53,710,260) |
Net increase (decrease) in net assets resulting from share transactions | 79,918,176 | 95,291,947 |
Total increase (decrease) in net assets | 90,630,902 | 113,529,801 |
| | |
Net Assets | | |
Beginning of period | 182,070,609 | 68,540,808 |
End of period (including undistributed net investment income of $1,126,551 and undistributed net investment income of $540,880, respectively) | $ 272,701,511 | $ 182,070,609 |
Other Information Shares | | |
Sold | 11,169,831 | 12,009,001 |
Issued in reinvestment of distributions | 332,759 | 95,055 |
Redeemed | (5,729,799) | (4,420,951) |
Net increase (decrease) | 5,772,791 | 7,683,105 |
See accompanying notes which are an integral part of the financial statements.
Annual Report
Financial Highlights
Years ended July 31, | 2006 | 2005 | 2004 | 2003 E |
Selected Per-Share Data | | | | |
Net asset value, beginning of period | $ 13.21 | $ 11.24 | $ 9.73 | $ 10.00 |
Income from Investment Operations | | | | |
Net investment income (loss) D | .10 | .11 | .05 | - G |
Net realized and unrealized gain (loss) | .95 | 2.03 | 1.52 | (.27) |
Total from investment operations | 1.05 | 2.14 | 1.57 | (.27) |
Distributions from net investment income | (.08) | (.09) | (.02) | - |
Distributions from net realized gain | (.23) | (.08) | (.04) | - |
Total distributions | (.31) | (.17) | (.06) | - |
Net asset value, end of period | $ 13.95 | $ 13.21 | $ 11.24 | $ 9.73 |
Total Return B, C | 8.05% | 19.20% | 16.16% | (2.70)% |
Ratios to Average Net Assets F | | | | |
Expenses before reductions | .94% | .97% | 1.17% | 3.37% A |
Expenses net of fee waivers, if any | .94% | .97% | 1.17% | 1.50% A |
Expenses net of all reductions | .93% | .93% | 1.13% | 1.50% A |
Net investment income (loss) | .76% | .85% | .50% | .41% A |
Supplemental Data | | | | |
Net assets, end of period (000 omitted) | $ 272,702 | $ 182,071 | $ 68,541 | $ 18,582 |
Portfolio turnover rate | 74% | 81% | 111% | 84% A |
A Annualized
B Total returns for periods of less than one year are not annualized.
C Total returns would have been lower had certain expenses not been reduced during the periods shown.
D Calculated based on average shares outstanding during the period.
E For the period June 17, 2003 (commencement of operations) to July 31, 2003.
F Expense ratios reflect operating expenses of the Fund. Expenses before reductions do not reflect amounts reimbursed by the investment adviser or reductions from brokerage service arrangements or other expense offset arrangements and do not represent the amount paid by the Fund during periods when reimbursements or reductions occur. Expense ratios before reductions for start-up periods may not be representative of longer term operating periods. Expenses net of fee waivers reflect expenses after reimbursement by the investment adviser but prior to reductions from brokerage service arrangements or other expense offset arrangements. Expenses net of all reductions represent the net expenses paid by the Fund.
G Amount represents less than $.01 per share.
See accompanying notes which are an integral part of the financial statements.
Annual Report
Notes to Financial Statements
For the period ended July 31, 2006
1. Significant Accounting Policies.
Fidelity Blue Chip Value Fund (the Fund) is a non-diversified fund of Fidelity Securities Fund (the trust) and is authorized to issue an unlimited number of shares. The trust is registered under the Investment Company Act of 1940, as amended (the 1940 Act), as an open-end management investment company organized as a Massachusetts business trust. The Fund may invest in affiliated money market central funds (Money Market Central Funds), which are open-end investment companies available to investment companies and other accounts managed by Fidelity Management & Research Company (FMR) and its affiliates. The financial statements have been prepared in conformity with accounting principles generally accepted in the United States of America, which require management to make certain estimates and assumptions at the date of the financial statements. The following summarizes the significant accounting policies of the Fund:
Security Valuation. Investments are valued and net asset value (NAV) per share is calculated (NAV calculation) as of the close of business of the New York Stock Exchange (NYSE), normally 4:00 p.m. Eastern time. Wherever possible, the Fund uses independent pricing services approved by the Board of Trustees to value its investments.
Equity securities, including restricted securities, for which market quotations are readily available, are valued at the last reported sale price or official closing price as reported by an independent pricing service on the primary market or exchange on which they are traded. In the event there were no sales during the day or closing prices are not available, securities are valued at the last quoted bid price. Investments in open-end mutual funds are valued at their closing net asset value each business day. Short-term securities with remaining maturities of sixty days or less for which quotations are not readily available are valued at amortized cost, which approximates value.
When current market prices or quotations are not readily available or do not accurately reflect fair value, valuations may be determined in accordance with procedures adopted by the Board of Trustees. For example, when developments occur between the close of a market and the close of the NYSE that may materially affect the value of some or all of the securities, or when trading in a security is halted, those securities may be fair valued. Factors used in the determination of fair value may include monitoring news to identify significant market or security specific events such as changes in the value of U.S. securities markets, reviewing developments in foreign markets and evaluating the performance of ADRs, futures contracts and exchange-traded funds. Because the Fund's utilization of fair value pricing depends on market activity, the frequency with which fair value pricing is used can not be predicted and may be utilized to a significant extent. The value of securities used for NAV calculation under fair value pricing may differ from published prices for the same securities.
Foreign Currency. The Fund uses foreign currency contracts to facilitate transactions in foreign-denominated securities. Losses from these transactions may arise from
Annual Report
1. Significant Accounting Policies - continued
Foreign Currency - continued
changes in the value of the foreign currency or if the counterparties do not perform under the contracts' terms.
Foreign-denominated assets, including investment securities, and liabilities are translated into U.S. dollars at the exchange rate at period end. Purchases and sales of investment securities, income and dividends received and expenses denominated in foreign currencies are translated into U.S. dollars at the exchange rate in effect on the transaction date.
The effects of exchange rate fluctuations on investments are included with the net realized and unrealized gain (loss) on investment securities. Other foreign currency transactions resulting in realized and unrealized gain (loss) are disclosed separately.
Investment Transactions and Income. Security transactions are accounted for as of trade date. Gains and losses on securities sold are determined on the basis of identified cost. Dividend income is recorded on the ex-dividend date, except for certain dividends from foreign securities where the ex-dividend date may have passed, which are recorded as soon as the Fund is informed of the ex-dividend date. Non-cash dividends included in dividend income, if any, are recorded at the fair market value of the securities received. Distributions received on securities that represent a return of capital or capital gain are recorded as a reduction of cost of investments and/or as a realized gain. The Fund estimates the components of distributions received that may be considered return of capital distributions or capital gain distributions. Interest income is accrued as earned. Interest income includes coupon interest and amortization of premium and accretion of discount on debt securities. Investment income is recorded net of foreign taxes withheld where recovery of such taxes is uncertain.
Expenses. Most expenses of the trust can be directly attributed to a fund. Expenses which cannot be directly attributed are apportioned among each Fund in the trust. Expense estimates are accrued in the period to which they relate and adjustments are made when actual amounts are known.
Income Tax Information and Distributions to Shareholders. Each year, the Fund intends to qualify as a regulated investment company by distributing all of its taxable income and realized gains under Subchapter M of the Internal Revenue Code. As a result, no provision for income taxes is required in the accompanying financial statements. Foreign taxes are provided for based on the Fund's understanding of the tax rules and rates that exist in the foreign markets in which it invests.
Distributions are recorded on the ex-dividend date. Income and capital gain distributions are determined in accordance with income tax regulations, which may differ from
Annual Report
Notes to Financial Statements - continued
1. Significant Accounting Policies - continued
Income Tax Information and Distributions to Shareholders - continued
generally accepted accounting principles. In addition, the Fund will claim a portion of the payment made to redeeming shareholders as a distribution for income tax purposes.
Capital accounts within the financial statements are adjusted for permanent book-tax differences. These adjustments have no impact on net assets or the results of operations. Temporary book-tax differences will reverse in a subsequent period.
Book-tax differences are primarily due to foreign currency transactions, partnerships and losses deferred due to wash sales.
The tax-basis components of distributable earnings and the federal tax cost as of period end were as follows:
Unrealized appreciation | $ 35,144,509 |
Unrealized depreciation | (8,941,511) |
Net unrealized appreciation (depreciation) | 26,202,998 |
Undistributed ordinary income | 989,530 |
Undistributed long-term capital gain | 5,653,332 |
Cost for federal income tax purposes | $ 250,041,251 |
The tax character of distributions paid was as follows:
| July 31, 2006 | July 31, 2005 |
Ordinary Income | $ 1,482,715 | $ 922,433 |
Long-term Capital Gains | 3,129,613 | 224,415 |
Total | $ 4,612,328 | $ 1,146,848 |
New Accounting Pronouncement. In July 2006, Financial Accounting Standards Board Interpretation No. 48, Accounting for Uncertainty in Income Taxes - an interpretation of FASB Statement 109 (FIN 48) was issued and is effective for fiscal years beginning after December 15, 2006. FIN 48 sets forth a threshold for financial statement recognition, measurement and disclosure of a tax position taken or expected to be taken on a tax return. Management is currently evaluating the impact, if any, the adoption of FIN 48 will have on the Fund's net assets and results of operations.
2. Operating Policies.
Repurchase Agreements. FMR has received an Exemptive Order from the Securities and Exchange Commission (the SEC) which permits the Fund and other affiliated entities of FMR to transfer uninvested cash balances into joint trading accounts which are then invested in repurchase agreements. The Fund may also invest directly with institutions in repurchase agreements. Repurchase agreements are collateralized by
Annual Report
2. Operating Policies - continued
Repurchase Agreements - continued
government or non-government securities. Upon settlement date, collateral is held in segregated accounts with custodian banks and may be obtained in the event of a default of the counterparty. The Fund monitors, on a daily basis, the value of the collateral to ensure it is at least equal to the principal amount of the repurchase agreement (including accrued interest). In the event of a default by the counterparty, realization of the collateral proceeds could be delayed, during which time the value of the collateral may decline.
Restricted Securities. The Fund may invest in securities that are subject to legal or contractual restrictions on resale. These securities generally may be resold in transactions exempt from registration or to the public if the securities are registered. Disposal of these securities may involve time-consuming negotiations and expense, and prompt sale at an acceptable price may be difficult. Information regarding restricted securities is included at the end of the Fund's Schedule of Investments.
3. Purchases and Sales of Investments.
Purchases and sales of securities, other than short-term securities, aggregated $242,294,326 and $169,931,567, respectively.
4. Fees and Other Transactions with Affiliates.
Management Fee. FMR and its affiliates provide the Fund with investment management related services for which the Fund pays a monthly management fee. The management fee is the sum of an individual fund fee rate that is based on an annual rate of .30% of the Fund's average net assets and a group fee rate that averaged ..27% during the period. The group fee rate is based upon the average net assets of all the mutual funds advised by FMR. The group fee rate decreases as assets under management increase and increases as assets under management decrease. In addition, the management fee is subject to a performance adjustment (up to a maximum of ± .20% of the Fund's average net assets over a 36 month performance period). The upward or downward adjustment to the management fee is based on the Fund's relative investment performance as compared to an appropriate benchmark index. For the period, the total annual management fee rate, including the performance adjustment, was .55% of the Fund's average net assets.
Transfer Agent Fees. Fidelity Service Company, Inc. (FSC), an affiliate of FMR, is the Fund's transfer, dividend disbursing and shareholder servicing agent. FSC receives account fees and asset-based fees that vary according to account size and type of account. FSC pays for typesetting, printing and mailing of shareholder reports, except
Annual Report
Notes to Financial Statements - continued
4. Fees and Other Transactions with Affiliates - continued
Transfer Agent Fees - continued
proxy statements. For the period, the transfer agent fees were equivalent to an annual rate of .30% of average net assets.
Accounting and Security Lending Fees. FSC maintains the Fund's accounting records. The accounting fee is based on the level of average net assets for the month. Under a separate contract, FSC administers the security lending program. The security lending fee is based on the number and duration of lending transactions.
Affiliated Central Funds. The Fund may invest in Money Market Central Funds which seek preservation of capital and current income and are managed by Fidelity Investments Money Management, Inc. (FIMM), an affiliate of FMR.
The Money Market Central Funds do not pay a management fee.
Brokerage Commissions. The Fund placed a portion of its portfolio transactions with brokerage firms which are affiliates of the investment adviser. The commissions paid to these affiliated firms were $5,010 for the period.
5. Committed Line of Credit.
The Fund participates with other funds managed by FMR in a $4.2 billion credit facility (the "line of credit") to be utilized for temporary or emergency purposes to fund shareholder redemptions or for other short-term liquidity purposes. The Fund has agreed to pay commitment fees on its pro rata portion of the line of credit, which amounts to $640 and is reflected in Miscellaneous Expense on the Statement of Operations. During the period, there were no borrowings on this line of credit.
6. Security Lending.
The Fund lends portfolio securities from time to time in order to earn additional income. On the settlement date of the loan, the Fund receives collateral (in the form of U.S. Treasury obligations, letters of credit and/or cash) against the loaned securities and maintains collateral in an amount not less than 100% of the market value of the loaned securities during the period of the loan. The market value of the loaned securities is determined at the close of business of the Fund and any additional required collateral is delivered to the Fund on the next business day. If the borrower defaults on its obligation to return the securities loaned because of insolvency or other reasons, a fund could experience delays and costs in recovering the securities loaned or in gaining access to the collateral. Any cash collateral received is invested in the Fidelity Securities Lending Cash Central Fund. The value of loaned securities and cash collateral at period end are disclosed on the Fund's Statement of Assets and Liabilities. Security lending income
Annual Report
6. Security Lending - continued
represents the income earned on investing cash collateral, less fees and expenses associated with the loan, plus any premium payments that may be received on the loan of certain types of securities. Security lending income is presented in the Statement of Operations as a component of income from affiliated central funds. Net income from lending portfolio securities during the period amounted to $34,153.
7. Expense Reductions.
Many of the brokers with whom FMR places trades on behalf of the Fund provided services to the Fund in addition to trade execution. These services included payments of certain expenses on behalf of the Fund totaling $36,050 for the period. In addition, through arrangements with the Fund's custodian and transfer agent, credits realized as a result of uninvested cash balances were used to reduce the Fund's expenses. During the period, these credits reduced the Fund's custody and transfer agent expenses by $599 and $2,058, respectively.
8. Other.
The Fund's organizational documents provide former and current trustees and officers with a limited indemnification against liabilities arising in connection with the performance of their duties to the Fund. In the normal course of business, the Fund may also enter into contracts that provide general indemnifications. The Fund's maximum exposure under these arrangements is unknown as this would be dependent on future claims that may be made against the Fund. The risk of material loss from such claims is considered remote.
Annual Report
Report of Independent Registered Public Accounting Firm
To the Trustees of Fidelity Securities Fund and the Shareholders of Fidelity Blue Chip Value Fund:
In our opinion, the accompanying statement of assets and liabilities, including the schedule of investments, and the related statements of operations and of changes in net assets and the financial highlights present fairly, in all material respects, the financial position of Fidelity Blue Chip Value Fund (a fund of Fidelity Securities Fund) at July 31, 2006, and the results of its operations for the year then ended, the changes in its net assets for each of the two years in the period then ended and the financial highlights for the periods indicated, in conformity with accounting principles generally accepted in the United States of America. These financial statements and financial highlights (hereafter referred to as "financial statements") are the responsibility of the Fidelity Blue Chip Value Fund's management; our responsibility is to express an opinion on these financial statements based on our audits. We conducted our audits of these financial statements in accordance with the standards of the Public Company Accounting Oversight Board (United States). Those standards require that we plan and perform the audit to obtain reasonable assurance about whether the financial statements are free of material misstatement. An audit includes examining, on a test basis, evidence supporting the amounts and disclosures in the financial statements, assessing the accounting principles used and significant estimates made by management, and evaluating the overall financial statement presentation. We believe that our audits, which included confirmation of securities at July 31, 2006 by correspondence with the custodian and brokers, provide a reasonable basis for our opinion.
/s/ PricewaterhouseCoopers LLP
PricewaterhouseCoopers LLP
Boston, Massachusetts
September 8, 2006
Annual Report
Trustees and Officers
The Trustees, Members of the Advisory Board, and executive officers of the trust and fund, as applicable, are listed below. The Board of Trustees governs the fund and is responsible for protecting the interests of shareholders. The Trustees are experienced executives who meet periodically throughout the year to oversee the fund's activities, review contractual arrangements with companies that provide services to the fund, and review the fund's performance. Except for William O. McCoy and Albert R. Gamper, Jr., each of the Trustees oversees 345 funds advised by FMR or an affiliate. Mr. McCoy oversees 347 funds advised by FMR or an affiliate. Mr. Gamper oversees 292 funds advised by FMR or an affiliate.
The Trustees hold office without limit in time except that (a) any Trustee may resign; (b) any Trustee may be removed by written instrument, signed by at least two-thirds of the number of Trustees prior to such removal; (c) any Trustee who requests to be retired or who has become incapacitated by illness or injury may be retired by written instrument signed by a majority of the other Trustees; and (d) any Trustee may be removed at any special meeting of shareholders by a two-thirds vote of the outstanding voting securities of the trust. Each Trustee who is not an interested person (as defined in the 1940 Act) (Independent Trustee), shall retire not later than the last day of the calendar year in which his or her 72nd birthday occurs. The Independent Trustees may waive this mandatory retirement age policy with respect to individual Trustees. The executive officers and Advisory Board Members hold office without limit in time, except that any officer and Advisory Board Member may resign or may be removed by a vote of a majority of the Trustees at any regular meeting or any special meeting of the Trustees. Except as indicated, each individual has held the office shown or other offices in the same company for the past five years.
The fund's Statement of Additional Information (SAI) includes more information about the Trustees. To request a free copy, call Fidelity at 1-800-544-8544.
Interested Trustees*:
Correspondence intended for each Trustee who is an interested person may be sent to Fidelity Investments, 82 Devonshire Street, Boston, Massachusetts 02109.
Name, Age; Principal Occupation |
Edward C. Johnson 3d (76) |
| Year of Election or Appointment: 1984 Mr. Johnson is Chairman of the Board of Trustees. Mr. Johnson serves as President (2006-present), Chief Executive Officer, Chairman, and a Director of FMR Corp.; Chairman and a Director of FMR; Chairman and a Director of Fidelity Research & Analysis Company (FRAC); Chairman and a Director of Fidelity Investments Money Management, Inc.; and Chairman (2001-present) and a Director (1999-present) of FMR Co., Inc. In addition, Mr. Johnson serves as Chairman and Director of Fidelity International Limited (FIL). |
Stephen P. Jonas (53) |
| Year of Election or Appointment: 2005 Mr. Jonas is Senior Vice President of Blue Chip Value (2005-present). He also serves as Senior Vice President of other Fidelity funds (2005-present). Mr. Jonas is Executive Director of FMR (2005-present) and FMR Co., Inc. (2005-present). He also serves as a Director of Fidelity Investments Money Management, Inc. (2005-present) and FMR Corp. (2003-present). Previously, Mr. Jonas served as President of Fidelity Enterprise Operations and Risk Services (2004-2005), Chief Administrative Officer (2002-2004), and Chief Financial Officer of FMR Corp. (1998-2002). In addition, he serves on the Boards of Boston Ballet (2003-present) and Simmons College (2003-present). |
Robert L. Reynolds (54) |
| Year of Election or Appointment: 2003 Mr. Reynolds is President and a Director of FMR (2005-present), Fidelity Investments Money Management, Inc. (2005-present), and FMR Co., Inc. (2005-present). Mr. Reynolds also serves as a Director (2003-present) and Chief Operating Officer (2000-present) of FMR Corp. and a Director of Strategic Advisers, Inc. (2005-present). He also serves on the Board at Fidelity Investments Canada, Ltd. (2000-present). Previously, Mr. Reynolds served as President of Fidelity Investments Institutional Retirement Group (1996-2000). |
* Trustees have been determined to be "Interested Trustees" by virtue of, among other things, their affiliation with the trust or various entities under common control with FMR.
Annual Report
Independent Trustees:
Correspondence intended for each Independent Trustee (that is, the Trustees other than the Interested Trustees) may be sent to Fidelity Investments, P.O. Box 55235, Boston, Massachusetts 02205-5235.
Name, Age; Principal Occupation |
Dennis J. Dirks (58) |
| Year of Election or Appointment: 2005 Prior to his retirement in May 2003, Mr. Dirks was Chief Operating Officer and a member of the Board of The Depository Trust & Clearing Corporation (DTCC) (1999-2003). He also served as President, Chief Operating Officer, and Board member of The Depository Trust Company (DTC) (1999-2003) and President and Board member of the National Securities Clearing Corporation (NSCC) (1999-2003). In addition, Mr. Dirks served as Chief Executive Officer and Board member of the Government Securities Clearing Corporation (2001-2003) and Chief Executive Officer and Board member of the Mortgage-Backed Securities Clearing Corporation (2001-2003). Mr. Dirks also serves as a Trustee and a member of the Finance Committee of Manhattan College (2005-present) and a Trustee and a member of the Finance Committee of AHRC of Nassau County (2006-present). |
Albert R. Gamper, Jr. (64) |
| Year of Election or Appointment: 2006 Mr. Gamper also serves as a Trustee (2006-present) or Member of the Advisory Board (2005-present) of other investment companies advised by FMR. Prior to his retirement in December 2004, Mr. Gamper served as Chairman of the Board of CIT Group Inc. (commercial finance). During his tenure with CIT Group Inc. Mr. Gamper served in numerous senior management positions, including Chairman (1987-1989; 1999-2001; 2002-2004), Chief Executive Officer (1987-2004), and President (1989-2002). He currently serves as a member of the Board of Directors of Public Service Enterprise Group (utilities, 2001-present), Chairman of the Board of Governors, Rutgers University (2004-present), and Chairman of the Board of Saint Barnabas Health Care System. |
Robert M. Gates (62) |
| Year of Election or Appointment: 1997 Dr. Gates is Chairman of the Independent Trustees (2006-present). Dr. Gates is President of Texas A&M University (2002-present). He was Director of the Central Intelligence Agency (CIA) from 1991 to 1993. From 1989 to 1991, Dr. Gates served as Assistant to the President of the United States and Deputy National Security Advisor. Dr. Gates is a Director of NACCO Industries, Inc. (mining and manufacturing), Parker Drilling Co., Inc. (drilling and rental tools for the energy industry, 2001-present), and Brinker International (restaurant management, 2003-present). Previously, Dr. Gates served as a Director of LucasVarity PLC (automotive components and diesel engines), a Director of TRW Inc. (automotive, space, defense, and information technology), and Dean of the George Bush School of Government and Public Service at Texas A&M University (1999-2001). |
George H. Heilmeier (70) |
| Year of Election or Appointment: 2004 Dr. Heilmeier is Chairman Emeritus of Telcordia Technologies (communication software and systems), where prior to his retirement, he served as company Chairman and Chief Executive Officer. He currently serves on the Boards of Directors of The Mitre Corporation (systems engineering and information technology support for the government), and HRL Laboratories (private research and development, 2004-present). He is Chairman of the General Motors Science & Technology Advisory Board and a Life Fellow of the Institute of Electrical and Electronics Engineers (IEEE). Dr. Heilmeier is a member of the Defense Science Board and the National Security Agency Advisory Board. He is also a member of the National Academy of Engineering, the American Academy of Arts and Sciences, and the Board of Overseers of the School of Engineering and Applied Science of the University of Pennsylvania. Previously, Dr. Heilmeier served as a Director of TRW Inc. (automotive, space, defense, and information technology, 1992-2002), Compaq (1994-2002), Automatic Data Processing, Inc. (ADP) (technology-based business outsourcing, 1995-2002), INET Technologies Inc. (telecommunications network surveillance, 2001-2004), and Teletech Holdings (customer management services). He is the recipient of the 2005 Kyoto Prize in Advanced Technology for his invention of the liquid crystal display. |
Marie L. Knowles (59) |
| Year of Election or Appointment: 2001 Prior to Ms. Knowles' retirement in June 2000, she served as Executive Vice President and Chief Financial Officer of Atlantic Richfield Company (ARCO) (diversified energy, 1996-2000). From 1993 to 1996, she was a Senior Vice President of ARCO and President of ARCO Transportation Company. She served as a Director of ARCO from 1996 to 1998. She currently serves as a Director of Phelps Dodge Corporation (copper mining and manufacturing) and McKesson Corporation (healthcare service, 2002-present). Ms. Knowles is a Trustee of the Brookings Institution and the Catalina Island Conservancy and also serves as a member of the Advisory Board for the School of Engineering of the University of Southern California. |
Ned C. Lautenbach (62) |
| Year of Election or Appointment: 2000 Mr. Lautenbach has been a partner of Clayton, Dubilier & Rice, Inc. (private equity investment firm) since September 1998. Previously, Mr. Lautenbach was with the International Business Machines Corporation (IBM) from 1968 until his retirement in 1998. Mr. Lautenbach serves as a Director of Italtel Holding S.p.A. (telecommunications (Milan, Italy), 2004-present) and Eaton Corporation (diversified industrial) as well as the Philharmonic Center for the Arts in Naples, Florida. He also is a member of the Board of Trustees of Fairfield University (2005-present), as well as a member of the Council on Foreign Relations. |
William O. McCoy (72) |
| Year of Election or Appointment: 1997 Prior to his retirement in December 1994, Mr. McCoy was Vice Chairman of the Board of BellSouth Corporation (telecommunications) and President of BellSouth Enterprises. He is currently a Director of Duke Realty Corporation (real estate). He is also a partner of Franklin Street Partners (private investment management firm). In addition, Mr. McCoy served as the Interim Chancellor (1999-2000) and a member of the Board of Visitors for the University of North Carolina at Chapel Hill and currently serves as Chairman of the Board of Directors of the University of North Carolina Health Care System. He also served as Vice President of Finance for the University of North Carolina (16-school system). |
Cornelia M. Small (62) |
| Year of Election or Appointment: 2005 Ms. Small is a member (2000-present) and Chairperson (2002-present) of the Investment Committee, and a member (2002-present) of the Board of Trustees of Smith College. Previously, she served as Chief Investment Officer (1999-2000), Director of Global Equity Investments (1996-1999), and a member of the Board of Directors of Scudder, Stevens & Clark (1990-1997) and Scudder Kemper Investments (1997-1999). In addition, Ms. Small served as Co-Chair (2000-2003) of the Annual Fund for the Fletcher School of Law and Diplomacy. |
William S. Stavropoulos (67) |
| Year of Election or Appointment: 2002 Mr. Stavropoulos is Chairman Emeritus of the Board of Directors of The Dow Chemical Company. Since joining The Dow Chemical Company in 1967, Mr. Stavropoulos served in numerous senior management positions, including President (1993-2000; 2002-2003), CEO (1995-2000; 2002-2004), and Chairman of the Executive Committee (2000-2004). Currently, he is a Director of NCR Corporation (data warehousing and technology solutions), BellSouth Corporation (telecommunications), Chemical Financial Corporation, Maersk Inc. (industrial conglomerate, 2002-present), and Metalmark Capital (private equity investment firm, 2005-present). He also serves as a member of the Board of Trustees of the American Enterprise Institute for Public Policy Research. In addition, Mr. Stavropoulos is a member of The Business Council, J.P. Morgan International Council and the University of Notre Dame Advisory Council for the College of Science. |
Kenneth L. Wolfe (67) |
| Year of Election or Appointment: 2005 Prior to his retirement in 2001, Mr. Wolfe was Chairman and Chief Executive Officer of Hershey Foods Corporation (1993-2001). He currently serves as a member of the boards of Adelphia Communications Corporation (2003-present), Bausch & Lomb, Inc., and Revlon Inc. (2004-present). |
Annual Report
Advisory Board Members and Executive Officers:
Correspondence intended for Mr. Keyes may be sent to Fidelity Investments, P.O. Box 55235, Boston, Massachusetts 02205-5235. Correspondence intended for each executive officer and Mr. Lynch may be sent to Fidelity Investments, 82 Devonshire Street, Boston, Massachusetts 02109.
Name, Age; Principal Occupation |
James H. Keyes (65) |
| Year of Election or Appointment: 2006 Member of the Advisory Board of Fidelity Securities Fund. Prior to his retirement in 2003, Mr. Keyes was Chairman, President, and Chief Executive Officer of Johnson Controls, Inc. (automotive supplier, 1993-2003). He currently serves as a member of the boards of LSI Logic Corporation (semiconductor technologies, 1984-present), Navistar International Corporation (manufacture and sale of trucks, buses, and diesel engines, 2002-present), and Pitney Bowes, Inc. (integrated mail, messaging, and document management solutions, 1998-present). |
Peter S. Lynch (62) |
| Year of Election or Appointment: 2003 Member of the Advisory Board of Fidelity Securities Fund. Mr. Lynch is Vice Chairman and a Director of FMR, and Vice Chairman (2001-present) and a Director (1999-present) of FMR Co., Inc. Previously, Mr. Lynch served as a Trustee of the Fidelity funds (1990-2003). In addition, he serves as the Chairman of the Inner-City Scholarship Fund. |
Dwight D. Churchill (52) |
| Year of Election or Appointment: 2005 Vice President of Blue Chip Value. Mr. Churchill also serves as Vice President of certain Equity Funds (2005-present). Mr. Churchill is Executive Vice President of FMR (2005-present) and FMR Co., Inc. (2005-present). Previously, Mr. Churchill served as Senior Vice President of Fidelity Investments Money Management, Inc. (2005-2006), Head of Fidelity's Fixed-Income Division (2000-2005), Vice President of Fidelity's Money Market Funds (2000-2005), Vice President of Fidelity's Bond Funds, and Senior Vice President of FMR. |
Bruce T. Herring (40) |
| Year of Election or Appointment: 2006 Vice President of Blue Chip Value. Mr. Herring also serves as Vice President of certain Equity Funds (2006-present). Mr. Herring is Senior Vice President of FMR (2006-present) and Vice President of FMR Co., Inc. (2001-present). Previously, Mr. Herring served as a portfolio manager for Fidelity U.S. Equity Funds (2001-2005). |
Eric D. Roiter (57) |
| Year of Election or Appointment: 2003 Secretary of Blue Chip Value. He also serves as Secretary of other Fidelity funds; Vice President, General Counsel, and Secretary of FMR Co., Inc. (2001-present) and FMR; Assistant Secretary of Fidelity Management & Research (U.K.) Inc. (2001-present), Fidelity Research & Analysis Company (2001-present), and Fidelity Investments Money Management, Inc. (2001-present). Mr. Roiter is an Adjunct Member, Faculty of Law, at Boston College Law School (2003-present). Previously, Mr. Roiter served as Vice President and Secretary of Fidelity Distributors Corporation (FDC) (1998-2005). |
Stuart Fross (46) |
| Year of Election or Appointment: 2003 Assistant Secretary of Blue Chip Value. Mr. Fross also serves as Assistant Secretary of other Fidelity funds (2003-present), Vice President and Secretary of FDC (2005-present), and is an employee of FMR. |
Christine Reynolds (47) |
| Year of Election or Appointment: 2004 President and Treasurer of Blue Chip Value. Ms. Reynolds also serves as President and Treasurer of other Fidelity funds (2004-present) and is a Vice President (2003-present) and an employee (2002-present) of FMR. Before joining Fidelity Investments, Ms. Reynolds worked at PricewaterhouseCoopers LLP (PwC) (1980-2002), where she was most recently an audit partner with PwC's investment management practice. |
R. Stephen Ganis (40) |
| Year of Election or Appointment: 2006 Anti-Money Laundering (AML) officer of Blue Chip Value. Mr. Ganis also serves as AML officer of other Fidelity funds (2006-present) and FMR Corp. (2003-present). Before joining Fidelity Investments, Mr. Ganis practiced law at Goodwin Procter, LLP (2000-2002). |
Joseph B. Hollis (58) |
| Year of Election or Appointment: 2006 Chief Financial Officer of Blue Chip Value. Mr. Hollis also serves as Chief Financial Officer of other Fidelity funds. Mr. Hollis is President of Fidelity Pricing and Cash Management Services (FPCMS) (2005-present). Mr. Hollis also serves as President and Director of Fidelity Service Company, Inc. (2006-present). Previously, Mr. Hollis served as Senior Vice President of Cash Management Services (1999-2002) and Investment Management Operations (2002-2005). |
Kenneth A. Rathgeber (59) |
| Year of Election or Appointment: 2004 Chief Compliance Officer of Blue Chip Value. Mr. Rathgeber also serves as Chief Compliance Officer of other Fidelity funds (2004-present) and Executive Vice President of Risk Oversight for Fidelity Investments (2002-present). He is Chief Compliance Officer of FMR (2005-present), FMR Co., Inc. (2005-present), Fidelity Management & Research (U.K.) Inc. (2005-present), Fidelity Research & Analysis Company (2005-present), Fidelity Investments Money Management, Inc. (2005-present), and Strategic Advisers, Inc. (2005-present). Previously, Mr. Rathgeber served as Executive Vice President and Chief Operating Officer for Fidelity Investments Institutional Services Company, Inc. (1998-2002). |
Bryan A. Mehrmann (45) |
| Year of Election or Appointment: 2005 Deputy Treasurer of Blue Chip Value. Mr. Mehrmann also serves as Deputy Treasurer of other Fidelity funds (2005-present) and is an employee of FMR. Previously, Mr. Mehrmann served as Vice President of Fidelity Investments Institutional Services Group (FIIS)/Fidelity Investments Institutional Operations Corporation, Inc. (FIIOC) Client Services (1998-2004). |
Kimberley H. Monasterio (42) |
| Year of Election or Appointment: 2004 Deputy Treasurer of Blue Chip Value. Ms. Monasterio also serves as Deputy Treasurer of other Fidelity funds (2004) and is an employee of FMR (2004). Before joining Fidelity Investments, Ms. Monasterio served as Treasurer (2000-2004) and Chief Financial Officer (2002-2004) of the Franklin Templeton Funds and Senior Vice President of Franklin Templeton Services, LLC (2000-2004). |
Kenneth B. Robins (36) |
| Year of Election or Appointment: 2005 Deputy Treasurer of Blue Chip Value. Mr. Robins also serves as Deputy Treasurer of other Fidelity funds (2005-present) and is an employee of FMR (2004-present). Before joining Fidelity Investments, Mr. Robins worked at KPMG LLP, where he was a partner in KPMG's department of professional practice (2002-2004) and a Senior Manager (1999-2000). In addition, Mr. Robins served as Assistant Chief Accountant, United States Securities and Exchange Commission (2000-2002). |
Robert G. Byrnes (39) |
| Year of Election or Appointment: 2005 Assistant Treasurer of Blue Chip Value. Mr. Byrnes also serves as Assistant Treasurer of other Fidelity funds (2005-present) and is an employee of FMR (2005-present). Previously, Mr. Byrnes served as Vice President of FPCMS (2003-2005). Before joining Fidelity Investments, Mr. Byrnes worked at Deutsche Asset Management where he served as Vice President of the Investment Operations Group (2000-2003). |
John H. Costello (59) |
| Year of Election or Appointment: 2003 Assistant Treasurer of Blue Chip Value. Mr. Costello also serves as Assistant Treasurer of other Fidelity funds and is an employee of FMR. |
Peter L. Lydecker (52) |
| Year of Election or Appointment: 2004 Assistant Treasurer of Blue Chip Value. Mr. Lydecker also serves as Assistant Treasurer of other Fidelity funds (2004) and is an employee of FMR. |
Mark Osterheld (51) |
| Year of Election or Appointment: 2003 Assistant Treasurer of Blue Chip Value. Mr. Osterheld also serves as Assistant Treasurer of other Fidelity funds (2002) and is an employee of FMR. |
Gary W. Ryan (47) |
| Year of Election or Appointment: 2005 Assistant Treasurer of Blue Chip Value. Mr. Ryan also serves as Assistant Treasurer of other Fidelity funds (2005-present) and is an employee of FMR (2005-present). Previously, Mr. Ryan served as Vice President of Fund Reporting in FPCMS (1999-2005). |
Salvatore Schiavone (40) |
| Year of Election or Appointment: 2005 Assistant Treasurer of Blue Chip Value. Mr. Schiavone also serves as Assistant Treasurer of other Fidelity funds (2005-present) and is an employee of FMR (2005-present). Before joining Fidelity Investments, Mr. Schiavone worked at Deutsche Asset Management, where he most recently served as Assistant Treasurer (2003-2005) of the Scudder Funds and Vice President and Head of Fund Reporting (1996-2003). |
Annual Report
Distributions
The Board of Trustees of Fidelity Blue Chip Value Fund voted to pay on September 11, 2006, to shareholders of record at the opening of business on September 8, 2006, a distribution of $0.32 per share derived from capital gains realized from sales of portfolio securities and a dividend of $0.06 per share from net investment income.
The fund hereby designates as a capital gain dividend with respect to the taxable year ended July 31, 2006, $8,588,960, or, if subsequently determined to be different, the net capital gain of such year.
The fund designates 100% of the dividends distributed during the fiscal year as qualifying for the dividends-received deduction for corporate shareholders.
The fund designates 100% of the dividends distributed in September and December during the fiscal year as amounts which may be taken into account as a dividend for the purposes of the maximum rate under section 1(h)(11) of the Internal Revenue Code.
The fund will notify shareholders in January 2007 of amounts for use in preparing 2006 income tax returns.
Annual Report
Proxy Voting Results
A special meeting of the funds' shareholders was held on May 17, 2006. The results of votes taken among shareholders on the proposal before them are reported below. Each vote reported represents one dollar of net asset value held on the record date for the meeting.
PROPOSAL 1 |
To elect a Board of Trustees. A |
| # of
Votes | % of
Votes |
Dennis J. Dirks |
Affirmative | 43,119,905,166.54 | 95.455 |
Withheld | 2,053,001,967.67 | 4.545 |
TOTAL | 45,172,907,134.21 | 100.000 |
Albert R. Gamper, Jr. |
Affirmative | 43,068,780,128.62 | 95.342 |
Withheld | 2,104,127,005.59 | 4.658 |
TOTAL | 45,172,907,134.21 | 100.000 |
Robert M. Gates |
Affirmative | 43,032,117,662.60 | 95.261 |
Withheld | 2,140,789,471.61 | 4.739 |
TOTAL | 45,172,907,134.21 | 100.000 |
George H. Heilmeier |
Affirmative | 43,023,368,882.30 | 95.242 |
Withheld | 2,149,538,251.91 | 4.758 |
TOTAL | 45,172,907,134.21 | 100.000 |
Edward C. Johnson 3d |
Affirmative | 42,881,915,819.70 | 94.928 |
Withheld | 2,290,991,314.51 | 5.072 |
TOTAL | 45,172,907,134.21 | 100.000 |
Stephen P. Jonas |
Affirmative | 43,081,912,066.37 | 95.371 |
Withheld | 2,090,995,067.84 | 4.629 |
TOTAL | 45,172,907,134.21 | 100.000 |
James H. KeyesB |
Affirmative | 43,049,050,093.79 | 95.298 |
Withheld | 2,123,857,040.42 | 4.702 |
TOTAL | 45,172,907,134.21 | 100.000 |
Marie L. Knowles |
Affirmative | 43,090,434,696.02 | 95.390 |
Withheld | 2,082,472,438.19 | 4.610 |
TOTAL | 45,172,907,134.21 | 100.000 |
| # of
Votes | % of
Votes |
Ned C. Lautenbach |
Affirmative | 43,082,185,255.05 | 95.372 |
Withheld | 2,090,721,879.16 | 4.628 |
TOTAL | 45,172,907,134.21 | 100.000 |
William O. McCoy |
Affirmative | 42,960,162,066.32 | 95.102 |
Withheld | 2,212,745,067.89 | 4.898 |
TOTAL | 45,172,907,134.21 | 100.000 |
Robert L. Reynolds |
Affirmative | 43,087,560,419.66 | 95.384 |
Withheld | 2,085,346,714.55 | 4.616 |
TOTAL | 45,172,907,134.21 | 100.000 |
Cornelia M. Small |
Affirmative | 43,092,070,014.53 | 95.394 |
Withheld | 2,080,837,119.68 | 4.606 |
TOTAL | 45,172,907,134.21 | 100.000 |
William S. Stavropoulos |
Affirmative | 43,002,032,676.43 | 95.194 |
Withheld | 2,170,874,457.78 | 4.806 |
TOTAL | 45,172,907,134.21 | 100.000 |
Kenneth L. Wolfe |
Affirmative | 43,047,241,852.81 | 95.294 |
Withheld | 2,125,665,281.40 | 4.706 |
TOTAL | 45,172,907,134.21 | 100.000 |
A Denotes trust-wide proposal and voting results. B Effective on or about January 1, 2007. |
Annual Report
Board Approval of Investment Advisory Contracts and Management Fees
Fidelity Blue Chip Value Fund
Each year, typically in July, the Board of Trustees, including the Independent Trustees (together, the Board), votes on the renewal of the management contract and sub-advisory agreements (together, the Advisory Contracts) for the fund. The Board, assisted by the advice of fund counsel and Independent Trustees' counsel, requests and considers a broad range of information throughout the year.
The Board meets regularly each month except August and takes into account throughout the year matters bearing on Advisory Contracts. The Board, acting directly and through its separate committees, considers at each of its meetings factors that are relevant to the annual renewal of the fund's Advisory Contracts, including the services and support provided to the fund and its shareholders. At the time of the renewal, the Board had 12 standing committees, each composed of Independent Trustees with varying backgrounds, to which the Board has assigned specific subject matter responsibilities in order to enhance effective decision-making by the Board. Each committee has adopted a written charter outlining the structure and purposes of the committee. One such committee, the Equity Contract Committee, meets periodically as needed throughout the year to consider matters specifically related to the annual renewal of Advisory Contracts. The committee requests and receives information on, and makes recommendations to the Independent Trustees concerning, the approval and annual review of the Advisory Contracts.
At its July 2006 meeting, the Board of Trustees, including the Independent Trustees, unanimously determined to renew the Advisory Contracts for the fund. In reaching its determination, the Board considered all factors it believed relevant, including (i) the nature, extent, and quality of the services to be provided to the fund and its shareholders (including the investment performance of the fund); (ii) the competitiveness of the management fee and total expenses of the fund; (iii) the total costs of the services to be provided by and the profits to be realized by the investment adviser and its affiliates from the relationship with the fund; (iv) the extent to which economies of scale would be realized as the fund grows; and (v) whether fee levels reflect these economies of scale, if any, for the benefit of fund shareholders.
In determining whether to renew the Advisory Contracts for the fund, the Board ultimately reached a determination, with the assistance of fund counsel and Independent Trustees' counsel, that the renewal of the Advisory Contracts and the compensation to be received by Fidelity under the management contract is consistent with Fidelity's fiduciary duty under applicable law. In addition to evaluating the specific factors noted above, the Board, in reaching its determination, is aware that shareholders in the fund have a broad range of investment choices available to them, including a wide choice among mutual funds offered by competitors to Fidelity, and that the fund's shareholders, with the opportunity to review and weigh the disclosure provided by the fund in its prospectus and other public disclosures, have chosen to invest in this fund, managed by Fidelity.
Annual Report
Board Approval of Investment Advisory Contracts and
Management Fees - continued
Nature, Extent, and Quality of Services Provided. The Board considered staffing within the investment adviser, FMR, and the sub-advisers (together, the Investment Advisers), including the background of the fund's portfolio manager and the fund's investment objective and discipline. The Independent Trustees also had discussions with senior management of Fidelity's investment operations and investment groups. The Board considered the structure of the portfolio manager compensation program and whether this structure provides appropriate incentives.
Resources Dedicated to Investment Management and Support Services. The Board reviewed the size, education, and experience of the Investment Advisers' investment staff, their use of technology, and the Investment Advisers' approach to recruiting, training, and retaining portfolio managers and other research, advisory, and management personnel. The Board considered Fidelity's extensive global research capabilities that enable the Investment Advisers to aggregate data from various sources in an effort to produce positive investment results. The Board noted that Fidelity's analysts have access to a variety of technological tools that enable them to perform both fundamental and quantitative analysis and to specialize in various disciplines. The Board also considered that Fidelity's portfolio managers and analysts have access to daily portfolio attribution that allows for monitoring of a fund's portfolio, as well as an electronic communication system that provides immediate real-time access to research concerning issuers and credit enhancers.
Shareholder and Administrative Services. The Board considered (i) the nature, extent, quality, and cost of administrative, distribution, and shareholder services performed by the Investment Advisers and their affiliates under the Advisory Contracts and under separate agreements covering transfer agency, pricing and bookkeeping, and securities lending services for the fund; (ii) the nature and extent of the Investment Advisers' supervision of third party service providers, principally custodians and subcustodians; and (iii) the resources devoted to, and the record of compliance with, the fund's compliance policies and procedures. The Board reviewed the allocation of fund brokerage, including allocations to brokers affiliated with the Investment Advisers, the use of brokerage commissions to pay fund expenses, and the use of "soft" commission dollars to pay for research services. The Board also considered that Fidelity voluntarily pays for market data out of its own resources.
The Board noted that the growth of fund assets across the complex allows Fidelity to reinvest in the development of services designed to enhance the value or convenience of the Fidelity funds as investment vehicles. These services include 24-hour access to account information and market information through phone representatives and over the Internet, and investor education materials and asset allocation tools.
Annual Report
Investment in a Large Fund Family. The Board considered the benefits to shareholders of investing in a Fidelity fund, including the benefits of investing in a fund that is part of a large family of funds offering a variety of investment disciplines and providing for a large variety of mutual fund investor services. For example, fund shareholders are offered the privilege of exchanging shares of the fund for shares of other Fidelity funds, as set forth in the fund's prospectus, without paying a sales charge. The Board noted that, since the last Advisory Contract renewals in July 2005, Fidelity has taken a number of actions that benefited particular funds, including (i) dedicating additional resources to investment research and to restructure the investment research teams; (ii) voluntarily entering into contractual arrangements with certain brokers pursuant to which Fidelity pays for research products and services separately out of its own resources, rather than bundling with fund commissions; (iii) launching the Fidelity Advantage Class of its five Spartan stock index funds and three Spartan bond index funds, which is a lower-fee class available to shareholders with higher account balances; (iv) contractually agreeing to impose expense limitations on Fidelity U.S. Bond Index Fund and reducing the fund's initial investment minimum; and (v) offering shareholders of each of the Fidelity Institutional Money Market Funds the privilege of exchanging shares of the fund for shares of other Fidelity funds.
Investment Performance and Compliance. The Board considered whether the fund has operated within its investment objective, as well as its record of compliance with its investment restrictions. It also reviewed the fund's absolute investment performance, as well as the fund's relative investment performance measured against (i) a broad-based securities market index, and (ii) a peer group of mutual funds. Because the fund had been in existence less than three calendar years, the following chart considered by the Board shows, for the one-year period ended December 31, 2005, the fund's total return, the total return of a broad-based securities market index ("benchmark"), and a range of total returns of a peer group of mutual funds identified by Lipper Inc. as having an investment objective similar to that of the fund. The box within the chart shows the 25th percentile return (bottom of box) and the 75th percentile return (top of box) of the Lipper peer group. Returns shown above the box are in the first quartile and returns shown below the box are in the fourth quartile. The percentage beaten number noted below the chart corresponds to the percentile box and represents the percentage of funds in the Lipper peer group whose performance was equal to or lower than that of the fund.
Annual Report
Board Approval of Investment Advisory Contracts and
Management Fees - continued
Fidelity Blue Chip Value Fund
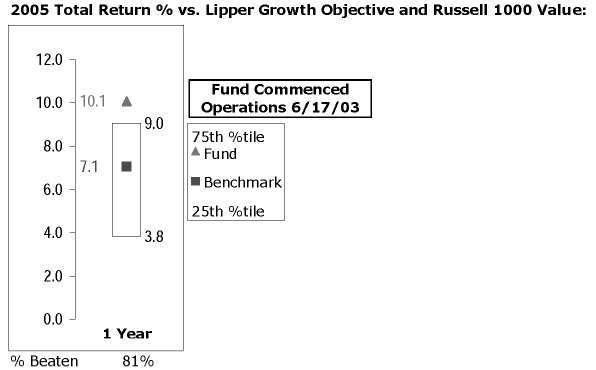
The Board reviewed the fund's relative investment performance against its Lipper peer group and stated that the performance of the fund was in the first quartile for the period shown. The Board noted that FMR does not consider that Lipper peer group to be a meaningful comparison for the fund, however, because the peer group includes funds with different investment mandates (some broader, some narrower) than the fund. For example, the peer group includes funds that are not limited to a particular investment style, funds that focus on growth-oriented stocks, and funds that (like the fund) focus their investments on value-oriented securities. The Board also stated that the relative investment performance of the fund compared favorably to its benchmark for the period shown. The Board stated that it is difficult to evaluate in any comprehensive fashion the performance of the fund, in light of its relatively recent launch. The Board also reviewed the fund's relative investment performance against a peer group defined by Morningstar.
The Board also considered that the fund's management fee is subject to upward or downward adjustment depending upon whether, and to what extent, the fund's investment performance for the performance period exceeds, or is exceeded by, the record (over the same period) of a Board-approved performance adjustment index. The Board realizes that the performance adjustment provides FMR with a strong economic incentive to seek to achieve superior performance for the fund's shareholders and helps to more closely align the interests of FMR and the fund's shareholders.
The Board considered that FMR has taken steps to refocus and strengthen equity research, equity portfolio management, and compliance. The Board noted with favor FMR's reorganization of its senior management team in 2005 and FMR's dedication of additional resources to investment research, and participated in the process that led to those changes.
Annual Report
Based on its review, and giving particular weight to the nature and quality of the resources dedicated by the Investment Advisers to maintain and improve relative performance, the Board concluded that the nature, extent, and quality of the services provided to the fund will benefit the fund's shareholders, particularly in light of the Board's view that the fund's shareholders benefit from investing in a fund that is part of a large family of funds offering a variety of investment disciplines and services.
Competitiveness of Management Fee and Total Fund Expenses. The Board considered the fund's management fee and total expenses compared to "mapped groups" of competitive funds and classes. Fidelity creates "mapped groups" by combining similar Lipper investment objective categories that have comparable management fee characteristics. Combining Lipper investment objective categories aids the Board's management fee and total expense comparisons by broadening the competitive group used for comparison and by reducing the number of universes to which various Fidelity funds are compared.
The Board considered two proprietary management fee comparisons for the 12-month (or shorter) periods shown in the chart below. The group of Lipper funds used by the Board for management fee comparisons is referred to below as the "Total Mapped Group" and, for the reasons explained above, is broader than the Lipper peer group used by the Board for performance comparisons. The Total Mapped Group comparison focuses on a fund's standing relative to the total universe of comparable funds available to investors, in terms of gross management fees before expense reimbursements or caps, and without giving effect to the fund's performance adjustment. "TMG %" represents the percentage of funds in the Total Mapped Group that had management fees that were lower than the fund's. For example, a TMG % of 9% means that 91% of the funds in the Total Mapped Group had higher management fees than the fund. The "Asset-Size Peer Group" (ASPG) comparison focuses on a fund's standing relative to non-Fidelity funds similar in size to the fund within the Total Mapped Group. The ASPG represents at least 15% of the funds in the Total Mapped Group with comparable asset size and management fee characteristics, subject to a minimum of 50 funds (or all funds in the Total Mapped Group if fewer than 50). Additional information, such as the ASPG quartile in which the fund's management fee ranked and the impact of the fund's performance adjustment, is also included in the chart and considered by the Board.
Annual Report
Board Approval of Investment Advisory Contracts and
Management Fees - continued
Fidelity Blue Chip Value Fund
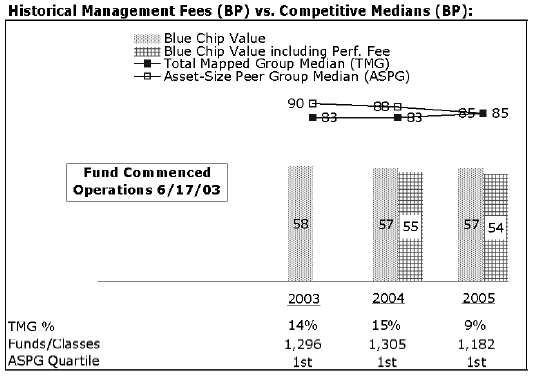
The Board noted that the fund's management fee ranked below the median of its Total Mapped Group and below the median of its ASPG for 2005. The Board also noted the effect of the fund's negative performance adjustment on the fund's management fee ranking. The Board noted that the performance adjustment for each year represents calculations for periods beginning August 1, 2004, which differ from the period shown in the performance chart above.
Based on its review, the Board concluded that the fund's management fee was fair and reasonable in light of the services that the fund receives and the other factors considered.
In its review of the fund's total expenses, the Board considered the fund's management fee as well as other fund expenses, such as transfer agent fees, pricing and bookkeeping fees, and custodial, legal, and audit fees. The Board also noted the effects of any waivers and reimbursements on fees and expenses, as well as the fund's negative performance adjustment. As part of its review, the Board also considered current and historical total expenses of the fund compared to competitive fund median expenses. The fund is compared to those funds and classes in the Total Mapped Group (used by the Board for management fee comparisons) that have a similar sales load structure.
The Board noted that the fund's total expenses ranked below its competitive median for 2005.
In its review of total expenses, the Board also considered Fidelity fee structures and other information on clients that FMR and its affiliates service in other competitive markets, such as other mutual funds advised or subadvised by FMR or its affiliates, pension plan clients, and other institutional clients.
Annual Report
Based on its review, the Board concluded that the fund's total expenses were reasonable in light of the services that the fund and its shareholders receive and the other factors considered.
Costs of the Services and Profitability. The Board considered the revenues earned and the expenses incurred by Fidelity in conducting the business of developing, marketing, distributing, managing, administering and servicing the fund and its shareholders. The Board also considered the level of Fidelity's profits in respect of all the Fidelity funds.
On an annual basis, FMR presents to the Board Fidelity's profitability for the fund. Fidelity calculates the profitability for each fund, as well as aggregate profitability for groups of Fidelity funds and all Fidelity funds, using a series of detailed revenue and cost allocation methodologies which originate with the audited books and records of Fidelity. The Audit Committee of the Board reviews any significant changes from the prior year's methodologies.
PricewaterhouseCoopers LLP (PwC), independent registered accounting firm and auditor to Fidelity and certain Fidelity funds, has been engaged annually by the Board as part of the Board's assessment of the results of Fidelity's profitability analysis. PwC's engagement includes the review and assessment of Fidelity's methodologies used in determining the revenues and expenses attributable to Fidelity's mutual fund business, and completion of agreed-upon procedures surrounding the mathematical accuracy of fund profitability and its conformity to allocation methodologies. After considering PwC's reports issued under the engagement and information provided by Fidelity, the Board believes that while other allocation methods may also be reasonable, Fidelity's profitability methodologies are reasonable in all material respects.
The Board has also reviewed Fidelity's non-fund businesses and any fall-out benefits related to the mutual fund business as well as cases where Fidelity's affiliates may benefit from or be related to the fund's business.
The Board considered the costs of the services provided by and the profits realized by Fidelity in connection with the operation of the fund and determined that the amount of profit is a fair entrepreneurial profit for the management of the fund.
Economies of Scale. The Board considered whether there have been economies of scale in respect of the management of the Fidelity funds, whether the Fidelity funds (including the fund) have appropriately benefited from any such economies of scale, and whether there is potential for realization of any further economies of scale. The Board considered the extent to which the fund will benefit from economies of scale through increased services to the fund, through waivers or reimbursements, or through fee or expense reductions, including reductions that occur through operation of the transfer agent agreement. The transfer agent fee varies in part based on the number of accounts in the fund. If the number of accounts decreases or the average account size increases, the overall transfer agent fee rate decreases.
Annual Report
Board Approval of Investment Advisory Contracts and
Management Fees - continued
The Board recognized that the fund's management contract incorporates a "group fee" structure, which provides for lower fee rates as total fund assets under FMR's management increase, and for higher fee rates as total fund assets under FMR's management decrease. The Board considered that the group fee is designed to deliver the benefits of economies of scale to fund shareholders when total fund assets increase, even if assets of any particular fund are unchanged or have declined, because some portion of Fidelity's costs are attributable to services provided to all Fidelity funds, and all funds benefit if those costs can be allocated among more assets. The Board concluded that, given the group fee structure, fund shareholders will achieve a certain level of economies of scale as assets under FMR's management increase at the fund complex level, regardless of whether Fidelity achieves any such economies of scale.
The Board further concluded that any potential economies of scale are being shared between fund shareholders and Fidelity in an appropriate manner.
Additional Information Requested by the Board. In order to develop fully the factual basis for consideration of the Advisory Contracts, the Board requested additional information on several topics, including (i) Fidelity's fund profitability methodology and profitability trends within certain funds; (ii) portfolio manager compensation; (iii) the extent to which any economies of scale exist and are shared between the funds and Fidelity; (iv) the total expenses of certain funds and classes relative to competitors, including the extent to which the expenses of certain funds have been or could be capped; (v) fund performance trends; and (vi) Fidelity's fee structures, including use of performance fees.
Based on its evaluation of all of the conclusions noted above, and after considering all material factors, the Board ultimately concluded that the advisory fee structures are fair and reasonable, and that the fund's Advisory Contracts should be renewed.
Annual Report
Managing Your Investments
Fidelity offers several ways to conveniently manage your personal investments via your telephone or PC. You can access your account information, conduct trades and research your investments 24 hours a day.
By Phone
Fidelity Automated Service Telephone provides a single toll-free number to access account balances, positions, quotes and trading. It's easy to navigate the service, and on your first call, the system will help you create a personal identification number (PIN) for security.
(phone_graphic)
Fidelity Automated
Service Telephone (FAST®)
1-800-544-5555
Press
1 For mutual fund and brokerage trading.
2 For quotes.*
3 For account balances and holdings.
4 To review orders and mutual
fund activity.
5 To change your PIN.
*0 To speak to a Fidelity representative.
By PC
Fidelity's web site on the Internet provides a wide range of information, including daily financial news, fund performance, interactive planning tools and news about Fidelity products and services.
(computer_graphic)
Fidelity's Web Site
www.fidelity.com
* When you call the quotes line, please remember that a fund's yield and return will vary and, except for money market funds, share price will also vary. This means that you may have a gain or loss when you sell your shares. There is no assurance that money market funds will be able to maintain a stable $1 share price; an investment in a money market fund is not insured or guaranteed by the U.S. government. Total returns are historical and include changes in share price, reinvestment of dividends and capital gains, and the effects of any sales charges.
Annual Report
To Visit Fidelity
For directions and hours,
please call 1-800-544-9797.
Arizona
7001 West Ray Road
Chandler, AZ
15445 N. Scottsdale Road
Scottsdale, AZ
California
815 East Birch Street
Brea, CA
1411 Chapin Avenue
Burlingame, CA
851 East Hamilton Avenue
Campbell, CA
19200 Von Karman Avenue
Irvine, CA
601 Larkspur Landing Circle
Larkspur, CA
10100 Santa Monica Blvd.
Los Angeles, CA
27101 Puerta Real
Mission Viejo, CA
73-575 El Paseo
Palm Desert, CA
251 University Avenue
Palo Alto, CA
123 South Lake Avenue
Pasadena, CA
16995 Bernardo Ctr. Drive
Rancho Bernardo, CA
1220 Roseville Parkway
Roseville, CA
1740 Arden Way
Sacramento, CA
7676 Hazard Center Drive
San Diego, CA
11943 El Camino Real
San Diego, CA
8 Montgomery Street
San Francisco, CA
3793 State Street
Santa Barbara, CA
1200 Wilshire Boulevard
Santa Monica, CA
21701 Hawthorne Boulevard
Torrance, CA
2001 North Main Street
Walnut Creek, CA
6300 Canoga Avenue
Woodland Hills, CA
Colorado
1625 Broadway
Denver, CO
9185 Westview Road
Lone Tree, CO
Connecticut
48 West Putnam Avenue
Greenwich, CT
265 Church Street
New Haven, CT
300 Atlantic Street
Stamford, CT
29 South Main Street
West Hartford, CT
Delaware
400 Delaware Avenue
Wilmington, DE
Florida
4400 N. Federal Highway
Boca Raton, FL
121 Alhambra Plaza
Coral Gables, FL
2948 N. Federal Highway
Ft. Lauderdale, FL
4671 Town Center Parkway
Jacksonville, FL
1907 West State Road 434
Longwood, FL
8880 Tamiami Trail, North
Naples, FL
3501 PGA Boulevard
Palm Beach Gardens, FL
3550 Tamiami Trail, South
Sarasota, FL
1502 N. Westshore Blvd.
Tampa, FL
2465 State Road 7
Wellington, FL
Georgia
3445 Peachtree Road, N.E.
Atlanta, GA
1000 Abernathy Road
Atlanta, GA
Illinois
One North LaSalle Street
Chicago, IL
875 North Michigan Ave.
Chicago, IL
1415 West 22nd Street
Oak Brook, IL
1572 East Golf Road
Schaumburg, IL
3232 Lake Avenue
Wilmette, IL
Indiana
4729 East 82nd Street
Indianapolis, IN
Kansas
5400 College Boulevard
Overland Park, KS
Maine
Three Canal Plaza
Portland, ME
Maryland
7315 Wisconsin Avenue
Bethesda, MD
One W. Pennsylvania Ave.
Towson, MD
Massachusetts
801 Boylston Street
Boston, MA
155 Congress Street
Boston, MA
300 Granite Street
Braintree, MA
44 Mall Road
Burlington, MA
238 Main Street
Cambridge, MA
405 Cochituate Road
Framingham, MA
416 Belmont Street
Worcester, MA
Annual Report
Michigan
500 E. Eisenhower Pkwy.
Ann Arbor, MI
280 Old N. Woodward Ave.
Birmingham, MI
43420 Grand River Avenue
Novi, MI
29155 Northwestern Hwy.
Southfield, MI
Minnesota
7600 France Avenue South
Edina, MN
Missouri
1524 South Lindbergh Blvd.
St. Louis, MO
Nevada
2225 Village Walk Drive
Henderson, NV
New Jersey
150 Essex Street
Millburn, NJ
56 South Street
Morristown, NJ
396 Route 17, North
Paramus, NJ
3518 Route 1 North
Princeton, NJ
530 Broad Street
Shrewsbury, NJ
New York
1055 Franklin Avenue
Garden City, NY
37 West Jericho Turnpike
Huntington Station, NY
1271 Avenue of the Americas
New York, NY
980 Madison Avenue
New York, NY
61 Broadway
New York, NY
350 Park Avenue
New York, NY
200 Fifth Avenue
New York, NY
733 Third Avenue
New York, NY
11 Penn Plaza
New York, NY
2070 Broadway
New York, NY
1075 Northern Blvd.
Roslyn, NY
799 Central Park Avenue
Scarsdale, NY
North Carolina
4611 Sharon Road
Charlotte, NC
7011 Fayetteville Road
Durham, NC
Ohio
3805 Edwards Road
Cincinnati, OH
1324 Polaris Parkway
Columbus, OH
28699 Chagrin Boulevard
Woodmere Village, OH
Oregon
7493 SW Bridgeport Road
Tigard, OR
Pennsylvania
600 West DeKalb Pike
King of Prussia, PA
1735 Market Street
Philadelphia, PA
12001 Perry Highway
Wexford, PA
Rhode Island
47 Providence Place
Providence, RI
Tennessee
6150 Poplar Avenue
Memphis, TN
Texas
10000 Research Boulevard
Austin, TX
4001 Northwest Parkway
Dallas, TX
12532 Memorial Drive
Houston, TX
2701 Drexel Drive
Houston, TX
6560 Fannin Street
Houston, TX
6500 N. MacArthur Blvd.
Irving, TX
6005 West Park Boulevard
Plano, TX
14100 San Pedro
San Antonio, TX
1576 East Southlake Blvd.
Southlake, TX
19740 IH 45 North
Spring, TX
Utah
279 West South Temple
Salt Lake City, UT
Virginia
1861 International Drive
McLean, VA
Washington
411 108th Avenue, N.E.
Bellevue, WA
1518 6th Avenue
Seattle, WA
Washington, DC
1900 K Street, N.W.
Washington, DC
Wisconsin
595 North Barker Road
Brookfield, WI
Fidelity Brokerage Services, Inc., 100 Summer St., Boston, MA 02110 Member NYSE/SIPC
Annual Report
Investment Adviser
Fidelity Management & Research Company
Boston, MA
Investment Sub-Advisers
FMR Co., Inc.
Fidelity Research & Analysis Company
(formerly Fidelity Management &
Research (Far East) Inc.)
Fidelity Management & Research
(U.K.) Inc.
Fidelity Investments Japan Limited
Fidelity International Investment
Advisors
Fidelity International Investment
Advisors (U.K.) Limited
General Distributor
Fidelity Distributors Corporation
Boston, MA
Transfer and Service Agent
Fidelity Service Company, Inc.
Boston, MA
Custodian
Brown Brothers Harriman & Co.
Boston, MA
The Fidelity Telephone Connection
Mutual Fund 24-Hour Service
Exchanges/Redemptions
and Account Assistance 1-800-544-6666
Product Information 1-800-544-6666
Retirement Accounts 1-800-544-4774
(8 a.m. - 9 p.m.)
TDD Service 1-800-544-0118
for the deaf and hearing impaired
(9 a.m. - 9 p.m. Eastern time)
Fidelity Automated Service
Telephone (FAST®) (automated graphic) 1-800-544-5555
(automated graphic) Automated line for quickest service
BCV-UANN-0906
1.789709.103
(Fidelity Investment logo)(registered trademark)
Corporate Headquarters
82 Devonshire St., Boston, MA 02109
www.fidelity.com
Fidelity®
Dividend Growth
Fund
Annual Report
July 31, 2006
(2_fidelity_logos) (Registered_Trademark)
Contents
Chairman's Message | <Click Here> | Ned Johnson's message to shareholders. |
Performance | <Click Here> | How the fund has done over time. |
Management's Discussion | <Click Here> | The manager's review of fund performance, strategy and outlook |
Shareholder Expense Example | <Click Here> | An example of shareholder expenses. |
Investment Changes | <Click Here> | A summary of major shifts in the fund's investments over the past six months. |
Investments | <Click Here> | A complete list of the fund's investments with their market values. |
Financial Statements | <Click Here> | Statements of assets and liabilities, operations, and changes in net assets,
as well as financial highlights. |
Notes | <Click Here> | Notes to the financial statements. |
Report of Independent Registered Public Accounting Firm | <Click Here> | |
Trustees and Officers | <Click Here> | |
Distributions | <Click Here> | |
Proxy Voting Results | <Click Here> | |
Board Approval of Investment Advisory Contracts and Management Fees | <Click Here> | |
To view a fund's proxy voting guidelines and proxy voting record for the 12-month period ended June 30, visit www.fidelity.com/proxyvotingresults or visit the Securities and Exchange Commission's (SEC) web site at www.sec.gov. You may also call 1-800-544-8544 to request a free copy of the proxy voting guidelines.
Standard & Poor's, S&P and S&P 500 are registered service marks of The McGraw-Hill Companies, Inc. and have been licensed for use by Fidelity Distributors Corporation.
Other third party marks appearing herein are the property of their respective owners.
All other marks appearing herein are registered or unregistered trademarks or service marks of FMR Corp. or an affiliated company.
Annual Report
This report and the financial statements contained herein are submitted for the general information of the shareholders of the fund. This report is not authorized for distribution to prospective investors in the fund unless preceded or accompanied by an effective prospectus.
A fund files its complete schedule of portfolio holdings with the SEC for the first and third quarters of each fiscal year on Form N-Q. Forms N-Q are available on the SEC's web site at http://www.sec.gov. A fund's Forms N-Q may be reviewed and copied at the SEC's Public Reference Room in Washington, DC. Information regarding the operation of the SEC's Public Reference Room may be obtained by calling 1-800-SEC-0330. For a complete list of a fund's portfolio holdings, view the most recent quarterly holdings report, semiannual report, or annual report on Fidelity's web site at http://www.fidelity.com/holdings.
NOT FDIC INSURED · MAY LOSE VALUE · NO BANK GUARANTEE
Neither the fund nor Fidelity Distributors Corporation is a bank.
Annual Report
Chairman's Message
(photo_of_Edward_C_Johnson_3d)
Dear Shareholder:
Although many securities markets made gains in early 2006, inflation concerns led to mixed results through the year's mid-point. Financial markets are always unpredictable. There are, however, a number of time-tested principles that can put the historical odds in your favor.
One of the basic tenets is to invest for the long term. Over time, riding out the markets' inevitable ups and downs has proven much more effective than selling into panic or chasing the hottest trend. Even missing only a few of the markets' best days can significantly diminish investor returns. Patience also affords the benefits of compounding - of earning interest on additional income or reinvested dividends and capital gains. There are tax advantages and cost benefits to consider as well. The more you sell, the more taxes you pay, and the more you trade, the higher the costs. While staying the course doesn't eliminate risk, it can considerably lessen the effect of short-term declines.
You can further manage your investing risk through diversification. And today, more than ever, geographic diversification should be taken into account. Studies indicate that asset allocation is the single most important determinant of a portfolio's long-term success. The right mix of stocks, bonds and cash - aligned to your particular risk tolerance and investment objective - is very important. Age-appropriate rebalancing is also an essential aspect of asset allocation. For younger investors, an emphasis on equities - which historically have been the best performing asset class over time - is encouraged. As investors near their specific goal, such as retirement or sending a child to college, consideration may be given to replacing volatile assets (e.g. common stocks) with more-stable fixed investments (bonds or savings plans).
A third investment principle - investing regularly - can help lower the average cost of your purchases. Investing a certain amount of money each month or quarter helps ensure you won't pay for all your shares at market highs. This strategy - known as dollar cost averaging - also reduces unconstructive "emotion" from investing, helping shareholders avoid selling weak performers just prior to an upswing, or chasing a hot performer just before a correction.
We invite you to contact us via the Internet, through our Investor Centers or over the phone. It is our privilege to provide you the information you need to make the investments that are right for you.
Sincerely,
/s/Edward C. Johnson 3d
Edward C. Johnson 3d
Annual Report
Performance: The Bottom Line
Average annual total return reflects the change in the value of an investment, assuming reinvestment of the fund's dividend income and capital gains (the profits earned upon the sale of securities that have grown in value) and assuming a constant rate of performance each year. The $10,000 table and the fund's returns do not reflect the deduction of taxes that a shareholder would pay on fund distributions or the redemption of fund shares. During periods of reimbursement by Fidelity, a fund's total return will be greater than it would be had the reimbursement not occurred. How a fund did yesterday is no guarantee of how it will do tomorrow.
Average Annual Total Returns
Periods ended July 31, 2006 | Past 1
year | Past 5
years | Past 10
years |
Fidelity® Dividend Growth Fund | 4.73% | 1.32% | 10.40% |
$10,000 Over 10 Years
Let's say hypothetically that $10,000 was invested in Fidelity® Dividend Growth Fund on July 31, 1996. The chart shows how the value of your investment would have changed, and also shows how the Standard & Poor's 500SM Index performed over the same period.

Annual Report
Management's Discussion of Fund Performance
Comments from Charles Mangum, Portfolio Manager of Fidelity® Dividend Growth Fund
As measured by the Dow Jones Wilshire 5000 Composite IndexSM - the broadest measure of U.S. equity market performance - stocks did well for most of the 12-month period ending July 31, 2006, before faltering. For the one-year time frame as a whole, the Dow Jones Wilshire benchmark rose 5.43%. That was nearly identical to the 5.38% gain of the Standard & Poor's 500SM Index, a broad market proxy that's a reflection of larger-cap stocks. Stocks were resilient early on, bouncing back quickly after Hurricanes Katrina and Rita caused energy prices to spike to record-high levels. Buoyed by strong corporate earnings and solid economic growth, the S&P 500® ran off six consecutive months of positive returns from November through April. However, stocks pulled back for most of the remainder of the period. A slowdown in economic expansion and consumer spending, reaccelerating energy prices and continued interest rate hikes by the Federal Reserve Board cooled equity performance. Among other widely quoted market yardsticks, the Dow Jones Industrial AverageSM returned 7.59%, while the NASDAQ Composite® Index dropped 3.47%.
The fund returned 4.73% during the 12-month period ending July 31, 2006, slightly underperforming the S&P 500 index. The fund fell short of the index in large part due to its being underexposed to the booming energy sector, which I continued to underweight in the belief that energy prices were artificially high and would eventually come down. In particular, a big underweighting in Exxon Mobil hurt. Being underweighted in real estate and diversified financials, the strongest groups within the financials sector, also detracted, especially our sizable underweighting in diversified financials firm JPMorgan Chase, which was no longer held at period end. Unfavorable security selection in pockets of consumer discretionary, industrials and information technology also hampered results, where positions in such stocks as Home Depot, Clear Channel Communications and Symantec detracted the most. On the upside, opportune stock picking in telecommunication services, combined with a double weighting in that sector, helped returns, with AT&T and Qwest Communications making strong contributions. Favorable security selection in the health care equipment and services group also helped, notably with our large stake in health care products supplier Cardinal Health.
The views expressed above reflect those of the portfolio manager(s) only through the end of the period as stated on the cover of this report and do not necessarily represent the views of Fidelity or any other person in the Fidelity organization. Any such views are subject to change at any time based upon market or other conditions and Fidelity disclaims any responsibility to update such views. These views may not be relied on as investment advice and, because investment decisions for a Fidelity fund are based on numerous factors, may not be relied on as an indication of trading intent on behalf of any Fidelity fund.
Annual Report
Shareholder Expense Example
As a shareholder of the Fund, you incur two types of costs: (1) transaction costs, and (2) ongoing costs, including management fees and other Fund expenses. This Example is intended to help you understand your ongoing costs (in dollars) of investing in the Fund and to compare these costs with the ongoing costs of investing in other mutual funds.
The Example is based on an investment of $1,000 invested at the beginning of the period and held for the entire period (February 1, 2006 to July 31, 2006).
Actual Expenses
The first line of the accompanying table provides information about actual account values and actual expenses. You may use the information in this line, together with the amount you invested, to estimate the expenses that you paid over the period. Simply divide your account value by $1,000.00 (for example, an $8,600 account value divided by $1,000.00 = 8.6), then multiply the result by the number in the first line under the heading entitled "Expenses Paid During Period" to estimate the expenses you paid on your account during this period. A small balance maintenance fee of $12.00 that is charged once a year may apply for certain accounts with a value of less than $2,000. This fee is not included in the table below. If it was, the estimate of expenses you paid during the period would be higher, and your ending account value lower, by this amount.
Hypothetical Example for Comparison Purposes
The second line of the accompanying table provides information about hypothetical account values and hypothetical expenses based on the Fund's actual expense ratio and an assumed rate of return of 5% per year before expenses, which is not the Fund's actual return. The hypothetical account values and expenses may not be used to estimate the actual ending account balance or expenses you paid for the period. You may use this information to compare the ongoing costs of investing in the Fund and other funds. To do so, compare this 5% hypothetical example with the 5% hypothetical examples that appear in the shareholder reports of the other funds. A small balance maintenance fee of $12.00 that is charged once a year may apply for certain accounts with a value of less than $2,000. This fee is not included in the table below. If it was, the estimate of expenses you paid during the period would be higher, and your ending account value lower, by this amount.
Please note that the expenses shown in the table are meant to highlight your ongoing costs only and do not reflect any transaction costs. Therefore, the second line of the table is useful in comparing ongoing costs only, and will not help you determine the relative total costs of owning different funds.
| Beginning
Account Value
February 1, 2006 | Ending
Account Value
July 31, 2006 | Expenses Paid
During Period*
February 1, 2006
to July 31, 2006 |
Actual | $ 1,000.00 | $ 1,004.80 | $ 2.98 |
Hypothetical (5% return per year before expenses) | $ 1,000.00 | $ 1,021.82 | $ 3.01 |
* Expenses are equal to the Fund's annualized expense ratio of .60%; multiplied by the average account value over the period, multiplied by 181/365 (to reflect the one-half year period).
Annual Report
Investment Changes
Top Ten Stocks as of July 31, 2006 |
| % of fund's
net assets | % of fund's net assets
6 months ago |
Cardinal Health, Inc. | 7.9 | 7.9 |
American International Group, Inc. | 5.9 | 6.0 |
AT&T, Inc. | 5.8 | 4.8 |
Wyeth | 5.4 | 4.9 |
Home Depot, Inc. | 5.2 | 5.7 |
Johnson & Johnson | 5.1 | 3.0 |
Wal-Mart Stores, Inc. | 4.6 | 4.1 |
General Electric Co. | 4.5 | 3.0 |
Bank of America Corp. | 4.4 | 3.1 |
Clear Channel Communications, Inc. | 4.1 | 3.8 |
| 52.9 | |
Top Five Market Sectors as of July 31, 2006 |
| % of fund's
net assets | % of fund's net assets
6 months ago |
Health Care | 22.4 | 19.6 |
Financials | 20.7 | 21.0 |
Consumer Discretionary | 12.7 | 12.6 |
Information Technology | 11.8 | 15.8 |
Consumer Staples | 8.9 | 9.2 |
Asset Allocation (% of fund's net assets) |
As of July 31, 2006 * | As of January 31, 2006 ** |
| Stocks 96.4% | | | Stocks 97.8% | |
 | Convertible
Securities 0.5% | | | Convertible
Securities 0.4% | |
| Short-Term
Investments and
Net Other Assets 3.1% | | | Short-Term
Investments and
Net Other Assets 1.8% | |
* Foreign
investments | 3.1% | | ** Foreign investments | 3.4% | |

Annual Report
Investments July 31, 2006
Showing Percentage of Net Assets
Common Stocks - 96.4% |
| Shares | | Value (Note 1) (000s) |
CONSUMER DISCRETIONARY - 12.7% |
Automobiles - 0.3% |
Harley-Davidson, Inc. | 882,700 | | $ 50,314 |
Hotels, Restaurants & Leisure - 0.4% |
Carnival Corp. unit | 728,700 | | 28,390 |
McDonald's Corp. | 634,100 | | 22,441 |
Royal Caribbean Cruises Ltd. | 376,500 | | 12,763 |
| | 63,594 |
Media - 5.6% |
Clear Channel Communications, Inc. | 22,044,842 | | 638,198 |
Clear Channel Outdoor Holding, Inc. Class A (e) | 2,261,800 | | 46,412 |
E.W. Scripps Co. Class A | 446,900 | | 19,096 |
News Corp. Class A | 2,776,100 | | 53,412 |
Omnicom Group, Inc. | 558,800 | | 49,459 |
Viacom, Inc. Class B (non-vtg.) (a) | 1,872,200 | | 65,246 |
| | 871,823 |
Multiline Retail - 0.8% |
Target Corp. (d) | 2,838,375 | | 130,338 |
Specialty Retail - 5.6% |
Home Depot, Inc. | 23,271,100 | | 807,740 |
TJX Companies, Inc. | 2,177,300 | | 53,061 |
| | 860,801 |
TOTAL CONSUMER DISCRETIONARY | | 1,976,870 |
CONSUMER STAPLES - 8.9% |
Food & Staples Retailing - 6.5% |
CVS Corp. | 9,042,000 | | 295,854 |
Wal-Mart Stores, Inc. | 16,071,844 | | 715,197 |
| | 1,011,051 |
Household Products - 0.1% |
Colgate-Palmolive Co. | 154,000 | | 9,135 |
Personal Products - 0.8% |
Alberto-Culver Co. | 2,116,645 | | 103,165 |
Avon Products, Inc. | 824,200 | | 23,894 |
| | 127,059 |
Tobacco - 1.5% |
Altria Group, Inc. | 2,847,500 | | 227,715 |
TOTAL CONSUMER STAPLES | | 1,374,960 |
Common Stocks - continued |
| Shares | | Value (Note 1) (000s) |
ENERGY - 4.8% |
Energy Equipment & Services - 3.2% |
Diamond Offshore Drilling, Inc. | 2,468,800 | | $ 194,862 |
ENSCO International, Inc. | 2,049,094 | | 94,709 |
GlobalSantaFe Corp. | 3,244,379 | | 178,214 |
Transocean, Inc. (a) | 301,600 | | 23,293 |
| | 491,078 |
Oil, Gas & Consumable Fuels - 1.6% |
Chesapeake Energy Corp. | 1,593,900 | | 52,439 |
ConocoPhillips | 855,800 | | 58,742 |
Exxon Mobil Corp. | 218,600 | | 14,808 |
Houston Exploration Co. (a) | 411,500 | | 26,278 |
Quicksilver Resources, Inc. (a) | 882,600 | | 31,209 |
Ultra Petroleum Corp. (a) | 545,800 | | 31,962 |
XTO Energy, Inc. | 777,800 | | 36,549 |
| | 251,987 |
TOTAL ENERGY | | 743,065 |
FINANCIALS - 20.7% |
Capital Markets - 1.7% |
Goldman Sachs Group, Inc. | 456,900 | | 69,791 |
KKR Private Equity Investors, L.P. Restricted Depositary Units (f) | 1,967,700 | | 46,241 |
Merrill Lynch & Co., Inc. | 1,808,600 | | 131,702 |
Nuveen Investments, Inc. Class A | 279,400 | | 13,269 |
| | 261,003 |
Commercial Banks - 1.1% |
Synovus Financial Corp. | 442,800 | | 12,514 |
Wachovia Corp. | 2,942,053 | | 157,782 |
Wells Fargo & Co. | 87,100 | | 6,301 |
| | 176,597 |
Consumer Finance - 0.1% |
Capital One Financial Corp. (d) | 284,600 | | 22,014 |
Diversified Financial Services - 5.2% |
Bank of America Corp. | 13,245,703 | | 682,551 |
Citigroup, Inc. | 2,581,539 | | 124,714 |
| | 807,265 |
Insurance - 11.5% |
ACE Ltd. | 2,536,500 | | 130,706 |
AFLAC, Inc. | 89,100 | | 3,933 |
Common Stocks - continued |
| Shares | | Value (Note 1) (000s) |
FINANCIALS - continued |
Insurance - continued |
AMBAC Financial Group, Inc. | 289,700 | | $ 24,077 |
American International Group, Inc. | 15,167,600 | | 920,218 |
Hartford Financial Services Group, Inc. | 4,116,820 | | 349,271 |
MBIA, Inc. | 1,146,600 | | 67,432 |
MetLife, Inc. | 2,302,300 | | 119,720 |
Swiss Reinsurance Co. (Reg.) | 622,512 | | 44,767 |
The Chubb Corp. | 2,024,100 | | 102,055 |
Transatlantic Holdings, Inc. | 281,500 | | 16,524 |
| | 1,778,703 |
Thrifts & Mortgage Finance - 1.1% |
Fannie Mae | 2,239,334 | | 107,286 |
Golden West Financial Corp., Delaware | 750,600 | | 55,289 |
| | 162,575 |
TOTAL FINANCIALS | | 3,208,157 |
HEALTH CARE - 22.4% |
Biotechnology - 1.3% |
Amgen, Inc. (a) | 1,797,524 | | 125,359 |
Biogen Idec, Inc. (a) | 1,926,715 | | 81,153 |
| | 206,512 |
Health Care Providers & Services - 7.9% |
Cardinal Health, Inc. | 18,126,470 | | 1,214,478 |
UnitedHealth Group, Inc. | 39,200 | | 1,875 |
| | 1,216,353 |
Pharmaceuticals - 13.2% |
Eli Lilly & Co. | 388,800 | | 22,072 |
Johnson & Johnson | 12,579,700 | | 786,860 |
Merck & Co., Inc. | 1,025,900 | | 41,313 |
Pfizer, Inc. | 13,638,900 | | 354,475 |
Wyeth | 17,408,560 | | 843,793 |
| | 2,048,513 |
TOTAL HEALTH CARE | | 3,471,378 |
INDUSTRIALS - 6.9% |
Aerospace & Defense - 0.8% |
Honeywell International, Inc. | 1,662,700 | | 64,346 |
Common Stocks - continued |
| Shares | | Value (Note 1) (000s) |
INDUSTRIALS - continued |
Aerospace & Defense - continued |
Lockheed Martin Corp. | 818,800 | | $ 65,242 |
Raytheon Co. warrants 6/16/11 (a) | 46,526 | | 600 |
| | 130,188 |
Industrial Conglomerates - 5.3% |
3M Co. | 1,214,500 | | 85,501 |
General Electric Co. | 21,239,380 | | 694,315 |
Tyco International Ltd. | 1,764,400 | | 46,033 |
| | 825,849 |
Machinery - 0.7% |
Ingersoll-Rand Co. Ltd. Class A | 3,157,300 | | 113,031 |
Road & Rail - 0.1% |
Burlington Northern Santa Fe Corp. | 91,800 | | 6,326 |
TOTAL INDUSTRIALS | | 1,075,394 |
INFORMATION TECHNOLOGY - 11.8% |
Communications Equipment - 2.5% |
Cisco Systems, Inc. (a) | 10,252,200 | | 183,002 |
Comverse Technology, Inc. (a) | 438,131 | | 8,491 |
Juniper Networks, Inc. (a) | 2,827,590 | | 38,031 |
Motorola, Inc. | 6,682,900 | | 152,103 |
| | 381,627 |
Computers & Peripherals - 2.3% |
Dell, Inc. (a) | 5,297,100 | | 114,841 |
EMC Corp. (a) | 3,302,200 | | 33,517 |
International Business Machines Corp. | 2,641,200 | | 204,455 |
| | 352,813 |
IT Services - 0.2% |
First Data Corp. | 959,500 | | 39,196 |
Semiconductors & Semiconductor Equipment - 2.7% |
Analog Devices, Inc. | 537,300 | | 17,371 |
Applied Materials, Inc. | 5,978,400 | | 94,100 |
Intel Corp. | 10,759,200 | | 193,666 |
KLA-Tencor Corp. | 665,500 | | 28,077 |
Lam Research Corp. (a) | 891,300 | | 37,069 |
Linear Technology Corp. | 215,400 | | 6,968 |
Novellus Systems, Inc. (a) | 722,700 | | 18,292 |
Common Stocks - continued |
| Shares | | Value (Note 1) (000s) |
INFORMATION TECHNOLOGY - continued |
Semiconductors & Semiconductor Equipment - continued |
Taiwan Semiconductor Manufacturing Co. Ltd. sponsored ADR | 2,346,240 | | $ 20,342 |
Xilinx, Inc. | 145,500 | | 2,952 |
| | 418,837 |
Software - 4.1% |
BEA Systems, Inc. (a) | 3,182,800 | | 37,366 |
Microsoft Corp. | 15,349,087 | | 368,839 |
Oracle Corp. (a) | 7,429,900 | | 111,226 |
Symantec Corp. (a) | 7,201,437 | | 125,089 |
| | 642,520 |
TOTAL INFORMATION TECHNOLOGY | | 1,834,993 |
MATERIALS - 0.1% |
Chemicals - 0.1% |
Praxair, Inc. | 387,700 | | 21,261 |
TELECOMMUNICATION SERVICES - 8.1% |
Diversified Telecommunication Services - 7.6% |
AT&T, Inc. | 29,823,591 | | 894,409 |
BellSouth Corp. | 3,788,300 | | 148,388 |
Qwest Communications International, Inc. (a) | 17,135,200 | | 136,910 |
Verizon Communications, Inc. | 236,050 | | 7,983 |
| | 1,187,690 |
Wireless Telecommunication Services - 0.5% |
Sprint Nextel Corp. | 3,622,586 | | 71,727 |
TOTAL TELECOMMUNICATION SERVICES | | 1,259,417 |
TOTAL COMMON STOCKS (Cost $13,183,718) | 14,965,495 |
Convertible Bonds - 0.5% |
| Principal Amount (000s) | | Value (Note 1) (000s) |
TELECOMMUNICATION SERVICES - 0.5% |
Diversified Telecommunication Services - 0.5% |
Qwest Communications International, Inc. 3.5% 11/15/25 (Cost $49,860) | | $ 49,860 | | $ 75,403 |
Money Market Funds - 3.2% |
| | Shares | | |
Fidelity Cash Central Fund, 5.3% (b) | | 484,041,101 | | 484,041 |
Fidelity Securities Lending Cash Central Fund, 5.32% (b)(c) | | 14,753,275 | | 14,753 |
TOTAL MONEY MARKET FUNDS (Cost $498,794) | | 498,794 |
TOTAL INVESTMENT PORTFOLIO - 100.1% (Cost $13,732,372) | | | 15,539,692 |
NET OTHER ASSETS - (0.1)% | | | (17,090) |
NET ASSETS - 100% | | $ 15,522,602 |
Legend |
(a) Non-income producing |
(b) Affiliated fund that is available only to investment companies and other accounts managed by Fidelity Investments. The rate quoted is the annualized seven-day yield of the fund at period end. A complete unaudited listing of the fund's holdings as of its most recent quarter end is available upon request. |
(c) Investment made with cash collateral received from securities on loan. |
(d) Security or a portion of the security is on loan at period end. |
(e) Affiliated company |
(f) Restricted securities - Investment in securities not registered under the Securities Act of 1933 (excluding 144A issues). At the end of the period, the value of restricted securities (excluding 144A issues) amounted to $46,241,000 or 0.3% of net assets. |
Additional information on each holding is as follows: |
Security | Acquisition Date | Acquisition Cost (000s) |
KKR Private Equity Investors, L.P. Restricted Depositary Units | 5/3/06 | $ 49,193 |
Affiliated Central Funds |
Information regarding fiscal year to date income earned by the fund from the affiliated Central funds is as follows: |
Fund | Income earned
(Amounts in
thousands) |
Fidelity Cash Central Fund | $ 15,130 |
Fidelity Securities Lending Cash Central Fund | 219 |
Total | $ 15,349 |
Other Affiliated Issuers |
An affiliated company is a company in which the fund has ownership of at least 5% of the voting securities. Fiscal year to date transactions with companies which are or were affiliates are as follows: |
Affiliate
(Amounts in thousands) | Value, beginning of period | Purchases | Sales Proceeds | Dividend Income | Value,
end of
period |
Clear Channel Outdoor Holding, Inc. Class A | $ - | $ 45,102 | $ 3,260 | $ - | $ 46,412 |
See accompanying notes which are an integral part of the financial statements.
Annual Report
Financial Statements
Statement of Assets and Liabilities
Amounts in thousands (except per-share amount) | July 31, 2006 |
| | |
Assets | | |
Investment in securities, at value (including securities loaned of $14,344) - See accompanying schedule: Unaffiliated issuers (cost $13,191,369) | $ 14,994,486 | |
Affiliated Central Funds (cost $498,794) | 498,794 | |
Other affiliated issuers (cost $42,209) | 46,412 | |
Total Investments (cost $13,732,372) | | $ 15,539,692 |
Receivable for investments sold | | 18,156 |
Receivable for fund shares sold | | 12,299 |
Dividends receivable | | 12,756 |
Interest receivable | | 2,128 |
Prepaid expenses | | 26 |
Other receivables | | 208 |
Total assets | | 15,585,265 |
| | |
Liabilities | | |
Payable for investments purchased | $ 18,068 | |
Payable for fund shares redeemed | 21,309 | |
Accrued management fee | 4,288 | |
Other affiliated payables | 3,284 | |
Other payables and accrued expenses | 961 | |
Collateral on securities loaned, at value | 14,753 | |
Total liabilities | | 62,663 |
| | |
Net Assets | | $ 15,522,602 |
Net Assets consist of: | | |
Paid in capital | | $ 13,417,518 |
Undistributed net investment income | | 115,144 |
Accumulated undistributed net realized gain (loss) on investments and foreign currency transactions | | 182,620 |
Net unrealized appreciation (depreciation) on investments and assets and liabilities in foreign currencies | | 1,807,320 |
Net Assets, for 526,260 shares outstanding | | $ 15,522,602 |
Net Asset Value, offering price and redemption price per share ($15,522,602 ÷ 526,260 shares) | | $ 29.50 |
See accompanying notes which are an integral part of the financial statements.
Annual Report
Statement of Operations
Amounts in thousands | Year ended July 31, 2006 |
| | |
Investment Income | | |
Dividends | | $ 277,540 |
Interest | | 1,375 |
Income from affiliated Central Funds | | 15,349 |
Total income | | 294,264 |
| | |
Expenses | | |
Management fee
Basic fee | $ 92,727 | |
Performance adjustment | (34,397) | |
Transfer agent fees | 37,011 | |
Accounting and security lending fees | 1,498 | |
Independent trustees' compensation | 67 | |
Appreciation in deferred trustee compensation account | 10 | |
Custodian fees and expenses | 255 | |
Registration fees | 96 | |
Audit | 142 | |
Legal | 161 | |
Miscellaneous | 1,039 | |
Total expenses before reductions | 96,609 | |
Expense reductions | (2,263) | 96,346 |
Net investment income (loss) | | 197,918 |
Realized and Unrealized Gain (Loss) Net realized gain (loss) on: | | |
Investment securities: | | |
Unaffiliated issuers | 445,915 | |
Other affiliated issuers | 367 | |
Foreign currency transactions | 77 | |
Total net realized gain (loss) | | 446,359 |
Change in net unrealized appreciation (depreciation) on Investment securities | | 101,276 |
Net gain (loss) | | 547,635 |
Net increase (decrease) in net assets resulting from operations | | $ 745,553 |
See accompanying notes which are an integral part of the financial statements.
Annual Report
Financial Statements - continued
Statement of Changes in Net Assets
Amounts in thousands | Year ended
July 31,
2006 | Year ended
July 31,
2005 |
Increase (Decrease) in Net Assets | | |
Operations | | |
Net investment income (loss) | $ 197,918 | $ 299,381 |
Net realized gain (loss) | 446,359 | 255,956 |
Change in net unrealized appreciation (depreciation) | 101,276 | 1,193,521 |
Net increase (decrease) in net assets resulting
from operations | 745,553 | 1,748,858 |
Distributions to shareholders from net investment income | (179,291) | (269,023) |
Distributions to shareholders from net realized gain | (217,913) | - |
Total distributions | (397,204) | (269,023) |
Share transactions
Proceeds from sales of shares | 2,158,432 | 3,009,735 |
Reinvestment of distributions | 386,764 | 260,163 |
Cost of shares redeemed | (4,769,535) | (5,738,004) |
Net increase (decrease) in net assets resulting from share transactions | (2,224,339) | (2,468,106) |
Total increase (decrease) in net assets | (1,875,990) | (988,271) |
| | |
Net Assets | | |
Beginning of period | 17,398,592 | 18,386,863 |
End of period (including undistributed net investment income of $115,144 and undistributed net investment income of $111,008, respectively) | $ 15,522,602 | $ 17,398,592 |
Other Information Shares | | |
Sold | 74,177 | 109,723 |
Issued in reinvestment of distributions | 13,484 | 9,419 |
Redeemed | (164,415) | (207,836) |
Net increase (decrease) | (76,754) | (88,694) |
See accompanying notes which are an integral part of the financial statements.
Annual Report
Financial Highlights
Years ended July 31, | 2006 | 2005 | 2004 | 2003 | 2002 |
Selected Per-Share Data | | | | | |
Net asset value, beginning of period | $ 28.85 | $ 26.58 | $ 24.76 | $ 22.20 | $ 29.75 |
Income from Investment Operations | | | | | |
Net investment income (loss)B | .35 | .45 C | .20 | .22 | .24 |
Net realized and unrealized gain (loss) | .99 | 2.21 | 1.84 | 2.56 | (7.31) |
Total from investment operations | 1.34 | 2.66 | 2.04 | 2.78 | (7.07) |
Distributions from net investment income | (.31) | (.39) | (.22) | (.22) | (.15) |
Distributions from net realized gain | (.38) | - | - | - | (.33) |
Total distributions | (.69) | (.39) | (.22) | (.22) | (.48) |
Net asset value, end of period | $ 29.50 | $ 28.85 | $ 26.58 | $ 24.76 | $ 22.20 |
Total Return A | 4.73% | 10.08% | 8.27% | 12.63% | (24.04)% |
Ratios to Average Net Assets D | | | | |
Expenses before reductions | .60% | .68% | .90% | 1.05% | .98% |
Expenses net of fee waivers, if any | .60% | .68% | .90% | 1.05% | .98% |
Expenses net of all reductions | .59% | .66% | .89% | 1.02% | .95% |
Net investment income (loss) | 1.21% | 1.64% C | .75% | .94% | .90% |
Supplemental Data | | | | | |
Net assets, end of period (in millions) | $ 15,523 | $ 17,399 | $ 18,387 | $ 15,737 | $ 12,648 |
Portfolio turnover rate | 30% | 26% | 37% | 51% | 81% |
A Total returns would have been lower had certain expenses not been reduced during the periods shown.
B Calculated based on average shares outstanding during the period.
C Investment income per share reflects a special dividend which amounted to $.16 per share. Excluding the special dividend, the ratio of net investment income (loss) to average net assets would have been 1.06%.
D Expense ratios reflect operating expenses of the Fund. Expenses before reductions do not reflect amounts reimbursed by the investment adviser or reductions from brokerage service arrangements or other expense offset arrangements and do not represent the amount paid by the Fund during periods when reimbursements or reductions occur. Expenses net of fee waivers reflect expenses after reimbursement by the investment adviser but prior to reductions from brokerage service arrangements or other expense offset arrangements. Expenses net of all reductions represent the net expenses paid by the Fund.
See accompanying notes which are an integral part of the financial statements.
Annual Report
Notes to Financial Statements
For the period ended July 31, 2006
(Amounts in thousands except ratios)
1. Significant Accounting Policies.
Fidelity Dividend Growth Fund (the Fund) is a fund of Fidelity Securities Fund (the trust) and is authorized to issue an unlimited number of shares. The trust is registered under the Investment Company Act of 1940, as amended (the 1940 Act), as an open-end management investment company organized as a Massachusetts business trust. The Fund may invest in affiliated money market central funds (Money Market Central Funds), which are open-end investment companies available to investment companies and other accounts managed by Fidelity Management & Research Company (FMR) and its affiliates. The financial statements have been prepared in conformity with accounting principles generally accepted in the United States of America, which require management to make certain estimates and assumptions at the date of the financial statements. The following summarizes the significant accounting policies of the Fund:
Security Valuation. Investments are valued and net asset value (NAV) per share is calculated (NAV calculation) as of the close of business of the New York Stock Exchange (NYSE), normally 4:00 p.m. Eastern time. Wherever possible, the Fund uses independent pricing services approved by the Board of Trustees to value its investments.
Equity securities, including restricted securities, for which market quotations are readily available, are valued at the last reported sale price or official closing price as reported by an independent pricing service on the primary market or exchange on which they are traded. In the event there were no sales during the day or closing prices are not available, securities are valued at the last quoted bid price. Debt securities, including restricted securities, for which quotations are readily available, are valued by independent pricing services or by dealers who make markets in such securities. Pricing services consider yield or price of bonds of comparable quality, coupon, maturity and type as well as dealer supplied prices. Investments in open-end mutual funds are valued at their closing net asset value each business day. Short-term securities with remaining maturities of sixty days or less for which quotations are not readily available are valued at amortized cost, which approximates value.
When current market prices or quotations are not readily available or do not accurately reflect fair value, valuations may be determined in accordance with procedures adopted by the Board of Trustees. For example, when developments occur between the close of a market and the close of the NYSE that may materially affect the value of some or all of the securities, or when trading in a security is halted, those securities may be fair valued. Factors used in the determination of fair value may include monitoring news to identify significant market or security specific events such as changes in the value of U.S. securities markets, reviewing developments in foreign markets and evaluating the performance of ADRs, futures contracts and exchange-traded funds. Because the Fund's utilization of fair value pricing depends on market activity, the frequency with which fair value pricing is used can not be predicted and may be utilized to a significant extent. The
Annual Report
1. Significant Accounting Policies - continued
Security Valuation - continued
value of securities used for NAV calculation under fair value pricing may differ from published prices for the same securities.
Foreign Currency. The Fund uses foreign currency contracts to facilitate transactions in foreign-denominated securities. Losses from these transactions may arise from changes in the value of the foreign currency or if the counterparties do not perform under the contracts' terms.
Foreign-denominated assets, including investment securities, and liabilities are translated into U.S. dollars at the exchange rate at period end. Purchases and sales of investment securities, income and dividends received and expenses denominated in foreign currencies are translated into U.S. dollars at the exchange rate in effect on the transaction date.
The effects of exchange rate fluctuations on investments are included with the net realized and unrealized gain (loss) on investment securities. Other foreign currency transactions resulting in realized and unrealized gain (loss) are disclosed separately.
Investment Transactions and Income. Security transactions are accounted for as of trade date. Gains and losses on securities sold are determined on the basis of identified cost and may include proceeds received from litigation. Dividend income is recorded on the ex-dividend date, except for certain dividends from foreign securities where the ex-dividend date may have passed, which are recorded as soon as the Fund is informed of the ex-dividend date. Non-cash dividends included in dividend income, if any, are recorded at the fair market value of the securities received. Distributions received on securities that represent a return of capital or capital gain are recorded as a reduction of cost of investments and/or as a realized gain. The Fund estimates the components of distributions received that may be considered return of capital distributions or capital gain distributions. Interest income is accrued as earned. Interest income includes coupon interest and amortization of premium and accretion of discount on debt securities. Investment income is recorded net of foreign taxes withheld where recovery of such taxes is uncertain.
Expenses. Most expenses of the trust can be directly attributed to a fund. Expenses which cannot be directly attributed are apportioned among each Fund in the trust. Expense estimates are accrued in the period to which they relate and adjustments are made when actual amounts are known.
Deferred Trustee Compensation. Under a Deferred Compensation Plan (the Plan), Independent Trustees must defer receipt of a portion of, and may elect to defer receipt of an additional portion of, their annual compensation. Deferred amounts are invested in a
Annual Report
Notes to Financial Statements - continued
(Amounts in thousands except ratios)
1. Significant Accounting Policies - continued
Deferred Trustee Compensation - continued
cross-section of Fidelity funds, are marked-to-market and remain in the Fund until distributed in accordance with the Plan. The investment of deferred amounts and the offsetting payable to the Trustees are included in the accompanying Statement of Assets and Liabilities.
Income Tax Information and Distributions to Shareholders. Each year, the Fund intends to qualify as a regulated investment company by distributing all of its taxable income and realized gains under Subchapter M of the Internal Revenue Code. As a result, no provision for income taxes is required in the accompanying financial statements. Foreign taxes are provided for based on the Fund's understanding of the tax rules and rates that exist in the foreign markets in which it invests.
Distributions are recorded on the ex-dividend date. Income and capital gain distributions are determined in accordance with income tax regulations, which may differ from generally accepted accounting principles. In addition, the Fund will claim a portion of the payment made to redeeming shareholders as a distribution for income tax purposes.
Capital accounts within the financial statements are adjusted for permanent book-tax differences. These adjustments have no impact on net assets or the results of operations. Temporary book-tax differences will reverse in a subsequent period.
Book-tax differences are primarily due to foreign currency transactions, partnerships, deferred trustees compensation and losses deferred due to wash sales.
The tax-basis components of distributable earnings and the federal tax cost as of period end were as follows:
Unrealized appreciation | $ 2,560,363 | |
Unrealized depreciation | (826,659) | |
Net unrealized appreciation (depreciation) | 1,733,704 | |
Undistributed ordinary income | 134,379 | |
Undistributed long-term capital gain | 206,895 | |
Cost for federal income tax purposes | $ 13,805,988 | |
The tax character of distributions paid was as follows:
| July 31, 2006 | July 31, 2005 |
Ordinary Income | $ 253,177 | $ 269,023 |
Long-term Capital Gains | 144,027 | - |
Total | $ 397,204 | $ 269,023 |
Annual Report
1. Significant Accounting Policies - continued
New Accounting Pronouncement. In July 2006, Financial Accounting Standards Board Interpretation No. 48, Accounting for Uncertainty in Income Taxes - an interpretation of FASB Statement 109 (FIN 48) was issued and is effective for fiscal years beginning after December 15, 2006. FIN 48 sets forth a threshold for financial statement recognition, measurement and disclosure of a tax position taken or expected to be taken on a tax return. Management is currently evaluating the impact, if any, the adoption of FIN 48 will have on the Fund's net assets and results of operations.
2. Operating Policies.
Repurchase Agreements. FMR has received an Exemptive Order from the Securities and Exchange Commission (the SEC) which permits the Fund and other affiliated entities of FMR to transfer uninvested cash balances into joint trading accounts which are then invested in repurchase agreements. The Fund may also invest directly with institutions in repurchase agreements. Repurchase agreements are collateralized by government or non-government securities. Upon settlement date, collateral is held in segregated accounts with custodian banks and may be obtained in the event of a default of the counterparty. The Fund monitors, on a daily basis, the value of the collateral to ensure it is at least equal to the principal amount of the repurchase agreement (including accrued interest). In the event of a default by the counterparty, realization of the collateral proceeds could be delayed, during which time the value of the collateral may decline.
Restricted Securities. The Fund may invest in securities that are subject to legal or contractual restrictions on resale. These securities generally may be resold in transactions exempt from registration or to the public if the securities are registered. Disposal of these securities may involve time-consuming negotiations and expense, and prompt sale at an acceptable price may be difficult. Information regarding restricted securities is included at the end of the fund's Schedule of Investments.
3. Purchases and Sales of Investments.
Purchases and sales of securities, other than short-term securities, aggregated $4,720,534 and $7,261,625, respectively.
4. Fees and Other Transactions with Affiliates.
Management Fee. FMR and its affiliates provide the Fund with investment management related services for which the Fund pays a monthly management fee. The management fee is the sum of an individual fund fee rate that is based on an annual rate of .30% of the Fund's average net assets and a group fee rate that averaged ..27% during the period. The group fee rate is based upon the average net assets of all the mutual funds
Annual Report
Notes to Financial Statements - continued
(Amounts in thousands except ratios)
4. Fees and Other Transactions with Affiliates - continued
Management Fee - continued
advised by FMR. The group fee rate decreases as assets under management increase and increases as assets under management decrease. In addition, the management fee is subject to a performance adjustment (up to a maximum of ± .20% of the Fund's average net assets over a 36 month performance period). The upward or downward adjustment to the management fee is based on the Fund's relative investment performance as compared to an appropriate benchmark index. For the period, the total annual management fee rate, including the performance adjustment, was .36% of the Fund's average net assets.
Transfer Agent Fees. Fidelity Service Company, Inc. (FSC), an affiliate of FMR, is the Fund's transfer, dividend disbursing and shareholder servicing agent. FSC receives account fees and asset-based fees that vary according to account size and type of account. FSC pays for typesetting, printing and mailing of shareholder reports, except proxy statements. For the period, the transfer agent fees were equivalent to an annual rate of .23% of average net assets.
Accounting and Security Lending Fees. FSC maintains the Fund's accounting records. The accounting fee is based on the level of average net assets for the month. Under a separate contract, FSC administers the security lending program. The security lending fee is based on the number and duration of lending transactions.
Affiliated Central Funds. The Fund may invest in Money Market Central Funds which seek preservation of capital and current income and are managed by Fidelity Investments Money Management, Inc. (FIMM), an affiliate of FMR.
The Money Market Central Funds do not pay a management fee.
Brokerage Commissions. The Fund placed a portion of its portfolio transactions with brokerage firms which are affiliates of the investment adviser. The commissions paid to these affiliated firms were $74 for the period.
5. Committed Line of Credit.
The Fund participates with other funds managed by FMR in a $4.2 billion credit facility (the "line of credit") to be utilized for temporary or emergency purposes to fund shareholder redemptions or for other short-term liquidity purposes. The Fund has agreed to pay commitment fees on its pro rata portion of the line of credit, which amounts to $48 and is reflected in Miscellaneous Expense on the Statement of Operations. During the period, there were no borrowings on this line of credit.
Annual Report
6. Security Lending.
The Fund lends portfolio securities from time to time in order to earn additional income. On the settlement date of the loan, the Fund receives collateral (in the form of U.S. Treasury obligations, letters of credit and/or cash) against the loaned securities and maintains collateral in an amount not less than 100% of the market value of the loaned securities during the period of the loan. The market value of the loaned securities is determined at the close of business of the Fund and any additional required collateral is delivered to the Fund on the next business day. If the borrower defaults on its obligation to return the securities loaned because of insolvency or other reasons, a fund could experience delays and costs in recovering the securities loaned or in gaining access to the collateral. Any cash collateral received is invested in the Fidelity Securities Lending Cash Central Fund. The value of loaned securities and cash collateral at period end are disclosed on the Fund's Statement of Assets and Liabilities. Security lending income represents the income earned on investing cash collateral, less fees and expenses associated with the loan, plus any premium payments that may be received on the loan of certain types of securities. Security lending income is presented in the Statement of Operations as a component of income from affiliated central funds. Net income from lending portfolio securities during the period amounted to $219.
7. Expense Reductions.
Many of the brokers with whom FMR places trades on behalf of the Fund provided services to the Fund in addition to trade execution. These services included payments of certain expenses on behalf of the Fund totaling $1,475 for the period. In addition, through arrangements with the Fund's transfer agent, credits realized as a result of uninvested cash balances were used to reduce the Fund's expenses. During the period, these credits reduced the Fund's transfer agent expense by $788.
8. Other.
The Fund's organizational documents provide former and current trustees and officers with a limited indemnification against liabilities arising in connection with the performance of their duties to the Fund. In the normal course of business, the Fund may also enter into contracts that provide general indemnifications. The Fund's maximum exposure under these arrangements is unknown as this would be dependent on future claims that may be made against the Fund. The risk of material loss from such claims is considered remote.
Annual Report
Report of Independent Registered Public Accounting Firm
To the Trustees of Fidelity Securities Fund and the Shareholders of Fidelity Dividend Growth Fund:
In our opinion, the accompanying statement of assets and liabilities, including the schedule of investments, and the related statements of operations and of changes in net assets and the financial highlights present fairly, in all material respects, the financial position of Fidelity Dividend Growth Fund (a fund of Fidelity Securities Fund) at July 31, 2006, and the results of its operations for the year then ended, the changes in its net assets for each of the two years in the period then ended and the financial highlights for each of the five years in the period then ended, in conformity with accounting principles generally accepted in the United States of America. These financial statements and financial highlights (hereafter referred to as "financial statements") are the responsibility of the Fidelity Dividend Growth Fund's management; our responsibility is to express an opinion on these financial statements based on our audits. We conducted our audits of these financial statements in accordance with the standards of the Public Company Accounting Oversight Board (United States). Those standards require that we plan and perform the audit to obtain reasonable assurance about whether the financial statements are free of material misstatement. An audit includes examining, on a test basis, evidence supporting the amounts and disclosures in the financial statements, assessing the accounting principles used and significant estimates made by management, and evaluating the overall financial statement presentation. We believe that our audits, which included confirmation of securities at July 31, 2006 by correspondence with the custodian and brokers, provide a reasonable basis for our opinion.
/s/ PricewaterhouseCoopers LLP
PricewaterhouseCoopers LLP
Boston, Massachusetts
September 8, 2006
Annual Report
Trustees and Officers
The Trustees, Members of the Advisory Board, and executive officers of the trust and fund, as applicable, are listed below. The Board of Trustees governs the fund and is responsible for protecting the interests of shareholders. The Trustees are experienced executives who meet periodically throughout the year to oversee the fund's activities, review contractual arrangements with companies that provide services to the fund, and review the fund's performance. Except for William O. McCoy and Albert R. Gamper, Jr., each of the Trustees oversees 345 funds advised by FMR or an affiliate. Mr. McCoy oversees 347 funds advised by FMR or an affiliate. Mr. Gamper oversees 290 funds advised by FMR or an affiliate.
The Trustees hold office without limit in time except that (a) any Trustee may resign; (b) any Trustee may be removed by written instrument, signed by at least two-thirds of the number of Trustees prior to such removal; (c) any Trustee who requests to be retired or who has become incapacitated by illness or injury may be retired by written instrument signed by a majority of the other Trustees; and (d) any Trustee may be removed at any special meeting of shareholders by a two-thirds vote of the outstanding voting securities of the trust. Each Trustee who is not an interested person (as defined in the 1940 Act) (Independent Trustee), shall retire not later than the last day of the calendar year in which his or her 72nd birthday occurs. The Independent Trustees may waive this mandatory retirement age policy with respect to individual Trustees. The executive officers and Advisory Board Members hold office without limit in time, except that any officer and Advisory Board Member may resign or may be removed by a vote of a majority of the Trustees at any regular meeting or any special meeting of the Trustees. Except as indicated, each individual has held the office shown or other offices in the same company for the past five years.
The fund's Statement of Additional Information (SAI) includes more information about the Trustees. To request a free copy, call Fidelity at 1-800-544-8544.
Interested Trustees*:
Correspondence intended for each Trustee who is an interested person may be sent to Fidelity Investments, 82 Devonshire Street, Boston, Massachusetts 02109.
Name, Age; Principal Occupation |
Edward C. Johnson 3d (76) |
| Year of Election or Appointment: 1984 Mr. Johnson is Chairman of the Board of Trustees. Mr. Johnson serves as President (2006-present), Chief Executive Officer, Chairman, and a Director of FMR Corp.; Chairman and a Director of FMR; Chairman and a Director of Fidelity Research & Analysis Company (FRAC); Chairman and a Director of Fidelity Investments Money Management, Inc.; and Chairman (2001-present) and a Director (1999-present) of FMR Co., Inc. In addition, Mr. Johnson serves as Chairman and Director of Fidelity International Limited (FIL). |
Stephen P. Jonas (53) |
| Year of Election or Appointment: 2005 Mr. Jonas is Senior Vice President of Dividend Growth (2005-present). He also serves as Senior Vice President of other Fidelity funds (2005-present). Mr. Jonas is Executive Director of FMR (2005-present) and FMR Co., Inc. (2005-present). He also serves as a Director of Fidelity Investments Money Management, Inc. (2005-present) and FMR Corp. (2003-present). Previously, Mr. Jonas served as President of Fidelity Enterprise Operations and Risk Services (2004-2005), Chief Administrative Officer (2002-2004), and Chief Financial Officer of FMR Corp. (1998-2002). In addition, he serves on the Boards of Boston Ballet (2003-present) and Simmons College (2003-present). |
Robert L. Reynolds (54) |
| Year of Election or Appointment: 2003 Mr. Reynolds is President and a Director of FMR (2005-present), Fidelity Investments Money Management, Inc. (2005-present), and FMR Co., Inc. (2005-present). Mr. Reynolds also serves as a Director (2003-present) and Chief Operating Officer (2000-present) of FMR Corp. and a Director of Strategic Advisers, Inc. (2005-present). He also serves on the Board at Fidelity Investments Canada, Ltd. (2000-present). Previously, Mr. Reynolds served as President of Fidelity Investments Institutional Retirement Group (1996-2000). |
* Trustees have been determined to be "Interested Trustees" by virtue of, among other things, their affiliation with the trust or various entities under common control with FMR.
Annual Report
Independent Trustees:
Correspondence intended for each Independent Trustee (that is, the Trustees other than the Interested Trustees) may be sent to Fidelity Investments, P.O. Box 55235, Boston, Massachusetts 02205-5235.
Name, Age; Principal Occupation |
Dennis J. Dirks (58) |
| Year of Election or Appointment: 2005 Prior to his retirement in May 2003, Mr. Dirks was Chief Operating Officer and a member of the Board of The Depository Trust & Clearing Corporation (DTCC) (1999-2003). He also served as President, Chief Operating Officer, and Board member of The Depository Trust Company (DTC) (1999-2003) and President and Board member of the National Securities Clearing Corporation (NSCC) (1999-2003). In addition, Mr. Dirks served as Chief Executive Officer and Board member of the Government Securities Clearing Corporation (2001-2003) and Chief Executive Officer and Board member of the Mortgage-Backed Securities Clearing Corporation (2001-2003). Mr. Dirks also serves as a Trustee and a member of the Finance Committee of Manhattan College (2005-present) and a Trustee and a member of the Finance Committee of AHRC of Nassau County (2006-present). |
Albert R. Gamper, Jr. (64) |
| Year of Election or Appointment: 2006 Mr. Gamper also serves as a Trustee (2006-present) or Member of the Advisory Board (2005-present) of other investment companies advised by FMR. Prior to his retirement in December 2004, Mr. Gamper served as Chairman of the Board of CIT Group Inc. (commercial finance). During his tenure with CIT Group Inc. Mr. Gamper served in numerous senior management positions, including Chairman (1987-1989; 1999-2001; 2002-2004), Chief Executive Officer (1987-2004), and President (1989-2002). He currently serves as a member of the Board of Directors of Public Service Enterprise Group (utilities, 2001-present), Chairman of the Board of Governors, Rutgers University (2004-present), and Chairman of the Board of Saint Barnabas Health Care System. |
Robert M. Gates (62) |
| Year of Election or Appointment: 1997 Dr. Gates is Chairman of the Independent Trustees (2006-present). Dr. Gates is President of Texas A&M University (2002-present). He was Director of the Central Intelligence Agency (CIA) from 1991 to 1993. From 1989 to 1991, Dr. Gates served as Assistant to the President of the United States and Deputy National Security Advisor. Dr. Gates is a Director of NACCO Industries, Inc. (mining and manufacturing), Parker Drilling Co., Inc. (drilling and rental tools for the energy industry, 2001-present), and Brinker International (restaurant management, 2003-present). Previously, Dr. Gates served as a Director of LucasVarity PLC (automotive components and diesel engines), a Director of TRW Inc. (automotive, space, defense, and information technology), and Dean of the George Bush School of Government and Public Service at Texas A&M University (1999-2001). |
George H. Heilmeier (70) |
| Year of Election or Appointment: 2004 Dr. Heilmeier is Chairman Emeritus of Telcordia Technologies (communication software and systems), where prior to his retirement, he served as company Chairman and Chief Executive Officer. He currently serves on the Boards of Directors of The Mitre Corporation (systems engineering and information technology support for the government), and HRL Laboratories (private research and development, 2004-present). He is Chairman of the General Motors Science & Technology Advisory Board and a Life Fellow of the Institute of Electrical and Electronics Engineers (IEEE). Dr. Heilmeier is a member of the Defense Science Board and the National Security Agency Advisory Board. He is also a member of the National Academy of Engineering, the American Academy of Arts and Sciences, and the Board of Overseers of the School of Engineering and Applied Science of the University of Pennsylvania. Previously, Dr. Heilmeier served as a Director of TRW Inc. (automotive, space, defense, and information technology, 1992-2002), Compaq (1994-2002), Automatic Data Processing, Inc. (ADP) (technology-based business outsourcing, 1995-2002), INET Technologies Inc. (telecommunications network surveillance, 2001-2004), and Teletech Holdings (customer management services). He is the recipient of the 2005 Kyoto Prize in Advanced Technology for his invention of the liquid crystal display. |
Marie L. Knowles (59) |
| Year of Election or Appointment: 2001 Prior to Ms. Knowles' retirement in June 2000, she served as Executive Vice President and Chief Financial Officer of Atlantic Richfield Company (ARCO) (diversified energy, 1996-2000). From 1993 to 1996, she was a Senior Vice President of ARCO and President of ARCO Transportation Company. She served as a Director of ARCO from 1996 to 1998. She currently serves as a Director of Phelps Dodge Corporation (copper mining and manufacturing) and McKesson Corporation (healthcare service, 2002-present). Ms. Knowles is a Trustee of the Brookings Institution and the Catalina Island Conservancy and also serves as a member of the Advisory Board for the School of Engineering of the University of Southern California. |
Ned C. Lautenbach (62) |
| Year of Election or Appointment: 2000 Mr. Lautenbach has been a partner of Clayton, Dubilier & Rice, Inc. (private equity investment firm) since September 1998. Previously, Mr. Lautenbach was with the International Business Machines Corporation (IBM) from 1968 until his retirement in 1998. Mr. Lautenbach serves as a Director of Italtel Holding S.p.A. (telecommunications (Milan, Italy), 2004-present) and Eaton Corporation (diversified industrial) as well as the Philharmonic Center for the Arts in Naples, Florida. He also is a member of the Board of Trustees of Fairfield University (2005-present), as well as a member of the Council on Foreign Relations. |
William O. McCoy (72) |
| Year of Election or Appointment: 1997 Prior to his retirement in December 1994, Mr. McCoy was Vice Chairman of the Board of BellSouth Corporation (telecommunications) and President of BellSouth Enterprises. He is currently a Director of Duke Realty Corporation (real estate). He is also a partner of Franklin Street Partners (private investment management firm). In addition, Mr. McCoy served as the Interim Chancellor (1999-2000) and a member of the Board of Visitors for the University of North Carolina at Chapel Hill and currently serves as Chairman of the Board of Directors of the University of North Carolina Health Care System. He also served as Vice President of Finance for the University of North Carolina (16-school system). |
Cornelia M. Small (62) |
| Year of Election or Appointment: 2005 Ms. Small is a member (2000-present) and Chairperson (2002-present) of the Investment Committee, and a member (2002-present) of the Board of Trustees of Smith College. Previously, she served as Chief Investment Officer (1999-2000), Director of Global Equity Investments (1996-1999), and a member of the Board of Directors of Scudder, Stevens & Clark (1990-1997) and Scudder Kemper Investments (1997-1999). In addition, Ms. Small served as Co-Chair (2000-2003) of the Annual Fund for the Fletcher School of Law and Diplomacy. |
William S. Stavropoulos (67) |
| Year of Election or Appointment: 2002 Mr. Stavropoulos is Chairman Emeritus of the Board of Directors of The Dow Chemical Company. Since joining The Dow Chemical Company in 1967, Mr. Stavropoulos served in numerous senior management positions, including President (1993-2000; 2002-2003), CEO (1995-2000; 2002-2004), and Chairman of the Executive Committee (2000-2004). Currently, he is a Director of NCR Corporation (data warehousing and technology solutions), BellSouth Corporation (telecommunications), Chemical Financial Corporation, Maersk Inc. (industrial conglomerate, 2002-present), and Metalmark Capital (private equity investment firm, 2005-present). He also serves as a member of the Board of Trustees of the American Enterprise Institute for Public Policy Research. In addition, Mr. Stavropoulos is a member of The Business Council, J.P. Morgan International Council and the University of Notre Dame Advisory Council for the College of Science. |
Kenneth L. Wolfe (67) |
| Year of Election or Appointment: 2005 Prior to his retirement in 2001, Mr. Wolfe was Chairman and Chief Executive Officer of Hershey Foods Corporation (1993-2001). He currently serves as a member of the boards of Adelphia Communications Corporation (2003-present), Bausch & Lomb, Inc., and Revlon Inc. (2004-present). |
Annual Report
Advisory Board Members and Executive Officers:
Correspondence intended for Mr. Keyes may be sent to Fidelity Investments, P.O. Box 55235, Boston, Massachusetts 02205-5235. Correspondence intended for each executive officer and Mr. Lynch may be sent to Fidelity Investments, 82 Devonshire Street, Boston, Massachusetts 02109.
Name, Age; Principal Occupation |
James H. Keyes (65) |
| Year of Election or Appointment: 2006 Member of the Advisory Board of Fidelity Securities Fund. Prior to his retirement in 2003, Mr. Keyes was Chairman, President, and Chief Executive Officer of Johnson Controls, Inc. (automotive supplier, 1993-2003). He currently serves as a member of the boards of LSI Logic Corporation (semiconductor technologies, 1984-present), Navistar International Corporation (manufacture and sale of trucks, buses, and diesel engines, 2002-present), and Pitney Bowes, Inc. (integrated mail, messaging, and document management solutions, 1998-present). |
Peter S. Lynch (62) |
| Year of Election or Appointment: 2003 Member of the Advisory Board of Fidelity Securities Fund. Mr. Lynch is Vice Chairman and a Director of FMR, and Vice Chairman (2001-present) and a Director (1999-present) of FMR Co., Inc. Previously, Mr. Lynch served as a Trustee of the Fidelity funds (1990-2003). In addition, he serves as the Chairman of the Inner-City Scholarship Fund. |
Philip L. Bullen (46) |
| Year of Election or Appointment: 2006 Vice President of Dividend Growth. Mr. Bullen also serves as Vice President of certain Equity Funds (2006-present). Mr. Bullen is Senior Vice President of FMR (2001-present) and FMR Co., Inc. (2001-present). Previously, Mr. Bullen served as President and a Director of Fidelity Research & Analysis Company (2001-2005), President and a Director of Fidelity Management & Research (U.K.) Inc. (2002-2006), and a Director of Strategic Advisers, Inc. (2002-2005). |
Dwight D. Churchill (52) |
| Year of Election or Appointment: 2005 Vice President of Dividend Growth. Mr. Churchill also serves as Vice President of certain Equity Funds (2005-present). Mr. Churchill is Executive Vice President of FMR (2005-present) and FMR Co., Inc. (2005-present). Previously, Mr. Churchill served as Senior Vice President of Fidelity Investments Money Management, Inc. (2005-2006), Head of Fidelity's Fixed-Income Division (2000-2005), Vice President of Fidelity's Money Market Funds (2000-2005), Vice President of Fidelity's Bond Funds, and Senior Vice President of FMR. |
Charles Mangum (41) |
| Year of Election or Appointment: 1997
Vice President of Dividend Growth. Mr. Mangum also serves as Vice President of other funds advised by FMR. Prior to assuming his current responsibilities, Mr. Mangum worked as a research analyst and portfolio manager. |
Eric D. Roiter (57) |
| Year of Election or Appointment: 1998 Secretary of Dividend Growth. He also serves as Secretary of other Fidelity funds; Vice President, General Counsel, and Secretary of FMR Co., Inc. (2001-present) and FMR; Assistant Secretary of Fidelity Management & Research (U.K.) Inc. (2001-present), Fidelity Research & Analysis Company (2001-present), and Fidelity Investments Money Management, Inc. (2001-present). Mr. Roiter is an Adjunct Member, Faculty of Law, at Boston College Law School (2003-present). Previously, Mr. Roiter served as Vice President and Secretary of Fidelity Distributors Corporation (FDC) (1998-2005). |
Stuart Fross (46) |
| Year of Election or Appointment: 2003 Assistant Secretary of Dividend Growth. Mr. Fross also serves as Assistant Secretary of other Fidelity funds (2003-present), Vice President and Secretary of FDC (2005-present), and is an employee of FMR. |
Christine Reynolds (47) |
| Year of Election or Appointment: 2004 President and Treasurer of Dividend Growth. Ms. Reynolds also serves as President and Treasurer of other Fidelity funds (2004-present) and is a Vice President (2003-present) and an employee (2002-present) of FMR. Before joining Fidelity Investments, Ms. Reynolds worked at PricewaterhouseCoopers LLP (PwC) (1980-2002), where she was most recently an audit partner with PwC's investment management practice. |
R. Stephen Ganis (40) |
| Year of Election or Appointment: 2006 Anti-Money Laundering (AML) officer of Dividend Growth. Mr. Ganis also serves as AML officer of other Fidelity funds (2006-present) and FMR Corp. (2003-present). Before joining Fidelity Investments, Mr. Ganis practiced law at Goodwin Procter, LLP (2000-2002). |
Joseph B. Hollis (58) |
| Year of Election or Appointment: 2006 Chief Financial Officer of Dividend Growth. Mr. Hollis also serves as Chief Financial Officer of other Fidelity funds. Mr. Hollis is President of Fidelity Pricing and Cash Management Services (FPCMS) (2005-present). Mr. Hollis also serves as President and Director of Fidelity Service Company, Inc. (2006-present). Previously, Mr. Hollis served as Senior Vice President of Cash Management Services (1999-2002) and Investment Management Operations (2002-2005). |
Kenneth A. Rathgeber (59) |
| Year of Election or Appointment: 2004 Chief Compliance Officer of Dividend Growth. Mr. Rathgeber also serves as Chief Compliance Officer of other Fidelity funds (2004-present) and Executive Vice President of Risk Oversight for Fidelity Investments (2002-present). He is Chief Compliance Officer of FMR (2005-present), FMR Co., Inc. (2005-present), Fidelity Management & Research (U.K.) Inc. (2005-present), Fidelity Research & Analysis Company (2005-present), Fidelity Investments Money Management, Inc. (2005-present), and Strategic Advisers, Inc. (2005-present). Previously, Mr. Rathgeber served as Executive Vice President and Chief Operating Officer for Fidelity Investments Institutional Services Company, Inc. (1998-2002). |
Bryan A. Mehrmann (45) |
| Year of Election or Appointment: 2005 Deputy Treasurer of Dividend Growth. Mr. Mehrmann also serves as Deputy Treasurer of other Fidelity funds (2005-present) and is an employee of FMR. Previously, Mr. Mehrmann served as Vice President of Fidelity Investments Institutional Services Group (FIIS)/Fidelity Investments Institutional Operations Corporation, Inc. (FIIOC) Client Services (1998-2004). |
Kimberley H. Monasterio (42) |
| Year of Election or Appointment: 2004 Deputy Treasurer of Dividend Growth. Ms. Monasterio also serves as Deputy Treasurer of other Fidelity funds (2004) and is an employee of FMR (2004). Before joining Fidelity Investments, Ms. Monasterio served as Treasurer (2000-2004) and Chief Financial Officer (2002-2004) of the Franklin Templeton Funds and Senior Vice President of Franklin Templeton Services, LLC (2000-2004). |
Kenneth B. Robins (36) |
| Year of Election or Appointment: 2005 Deputy Treasurer of Dividend Growth. Mr. Robins also serves as Deputy Treasurer of other Fidelity funds (2005-present) and is an employee of FMR (2004-present). Before joining Fidelity Investments, Mr. Robins worked at KPMG LLP, where he was a partner in KPMG's department of professional practice (2002-2004) and a Senior Manager (1999-2000). In addition, Mr. Robins served as Assistant Chief Accountant, United States Securities and Exchange Commission (2000-2002). |
Robert G. Byrnes (39) |
| Year of Election or Appointment: 2005 Assistant Treasurer of Dividend Growth. Mr. Byrnes also serves as Assistant Treasurer of other Fidelity funds (2005-present) and is an employee of FMR (2005-present). Previously, Mr. Byrnes served as Vice President of FPCMS (2003-2005). Before joining Fidelity Investments, Mr. Byrnes worked at Deutsche Asset Management where he served as Vice President of the Investment Operations Group (2000-2003). |
John H. Costello (59) |
| Year of Election or Appointment: 1993 Assistant Treasurer of Dividend Growth. Mr. Costello also serves as Assistant Treasurer of other Fidelity funds and is an employee of FMR. |
Peter L. Lydecker (52) |
| Year of Election or Appointment: 2004 Assistant Treasurer of Dividend Growth. Mr. Lydecker also serves as Assistant Treasurer of other Fidelity funds (2004) and is an employee of FMR. |
Mark Osterheld (51) |
| Year of Election or Appointment: 2002 Assistant Treasurer of Dividend Growth. Mr. Osterheld also serves as Assistant Treasurer of other Fidelity funds (2002) and is an employee of FMR. |
Gary W. Ryan (47) |
| Year of Election or Appointment: 2005 Assistant Treasurer of Dividend Growth. Mr. Ryan also serves as Assistant Treasurer of other Fidelity funds (2005-present) and is an employee of FMR (2005-present). Previously, Mr. Ryan served as Vice President of Fund Reporting in FPCMS (1999-2005). |
Salvatore Schiavone (40) |
| Year of Election or Appointment: 2005 Assistant Treasurer of Dividend Growth. Mr. Schiavone also serves as Assistant Treasurer of other Fidelity funds (2005-present) and is an employee of FMR (2005-present). Before joining Fidelity Investments, Mr. Schiavone worked at Deutsche Asset Management, where he most recently served as Assistant Treasurer (2003-2005) of the Scudder Funds and Vice President and Head of Fund Reporting (1996-2003). |
Annual Report
Distributions
The Board of Trustees of Fidelity Dividend Growth Fund voted to pay on September 11, 2006, to shareholders of record at the opening of business on September 8, 2006, a distribution of $0.46 per share derived from capital gains realized from sales of portfolio securities and a dividend of $0.20 per share from net investment income.
The fund hereby designates as a capital gain dividend with respect to the taxable year ended July 31, 2006, $294,565,168, or, if subsequently determined to be different, the net capital gain of such year.
The fund designates 100% and 76.33% of the dividends distributed in September and December, respectively during the fiscal year as qualifying for the dividends-received deduction for corporate shareholders.
The fund designates 100% and 77.59% of the dividends distributed in September and December, respectively during the fiscal year as amounts which may be taken into account as a dividend for the purposes of the maximum rate under section 1(h)(11) of the Internal Revenue Code.
The fund will notify shareholders in January 2007 of amounts for use in preparing 2006 income tax returns.
Annual Report
Proxy Voting Results
A special meeting of the funds' shareholders was held on May 17, 2006. The results of votes taken among shareholders on the proposal before them are reported below. Each vote reported represents one dollar of net asset value held on the record date for the meeting.
PROPOSAL 1 |
To elect a Board of Trustees. A |
| # of
Votes | % of
Votes |
Dennis J. Dirks |
Affirmative | 43,119,905,166.54 | 95.455 |
Withheld | 2,053,001,967.67 | 4.545 |
TOTAL | 45,172,907,134.21 | 100.000 |
Albert R. Gamper, Jr. |
Affirmative | 43,068,780,128.62 | 95.342 |
Withheld | 2,104,127,005.59 | 4.658 |
TOTAL | 45,172,907,134.21 | 100.000 |
Robert M. Gates |
Affirmative | 43,032,117,662.60 | 95.261 |
Withheld | 2,140,789,471.61 | 4.739 |
TOTAL | 45,172,907,134.21 | 100.000 |
George H. Heilmeier |
Affirmative | 43,023,368,882.30 | 95.242 |
Withheld | 2,149,538,251.91 | 4.758 |
TOTAL | 45,172,907,134.21 | 100.000 |
Edward C. Johnson 3d |
Affirmative | 42,881,915,819.70 | 94.928 |
Withheld | 2,290,991,314.51 | 5.072 |
TOTAL | 45,172,907,134.21 | 100.000 |
Stephen P. Jonas |
Affirmative | 43,081,912,066.37 | 95.371 |
Withheld | 2,090,995,067.84 | 4.629 |
TOTAL | 45,172,907,134.21 | 100.000 |
James H. KeyesB |
Affirmative | 43,049,050,093.79 | 95.298 |
Withheld | 2,123,857,040.42 | 4.702 |
TOTAL | 45,172,907,134.21 | 100.000 |
Marie L. Knowles |
Affirmative | 43,090,434,696.02 | 95.390 |
Withheld | 2,082,472,438.19 | 4.610 |
TOTAL | 45,172,907,134.21 | 100.000 |
| # of
Votes | % of
Votes |
Ned C. Lautenbach |
Affirmative | 43,082,185,255.05 | 95.372 |
Withheld | 2,090,721,879.16 | 4.628 |
TOTAL | 45,172,907,134.21 | 100.000 |
William O. McCoy |
Affirmative | 42,960,162,066.32 | 95.102 |
Withheld | 2,212,745,067.89 | 4.898 |
TOTAL | 45,172,907,134.21 | 100.000 |
Robert L. Reynolds |
Affirmative | 43,087,560,419.66 | 95.384 |
Withheld | 2,085,346,714.55 | 4.616 |
TOTAL | 45,172,907,134.21 | 100.000 |
Cornelia M. Small |
Affirmative | 43,092,070,014.53 | 95.394 |
Withheld | 2,080,837,119.68 | 4.606 |
TOTAL | 45,172,907,134.21 | 100.000 |
William S. Stavropoulos |
Affirmative | 43,002,032,676.43 | 95.194 |
Withheld | 2,170,874,457.78 | 4.806 |
TOTAL | 45,172,907,134.21 | 100.000 |
Kenneth L. Wolfe |
Affirmative | 43,047,241,852.81 | 95.294 |
Withheld | 2,125,665,281.40 | 4.706 |
TOTAL | 45,172,907,134.21 | 100.000 |
A Denotes trust-wide proposal and voting results. B Effective on or about January 1, 2007. |
Annual Report
Board Approval of Investment Advisory Contracts and Management Fees
Fidelity Dividend Growth Fund
Each year, typically in July, the Board of Trustees, including the Independent Trustees (together, the Board), votes on the renewal of the management contract and sub-advisory agreements (together, the Advisory Contracts) for the fund. The Board, assisted by the advice of fund counsel and Independent Trustees' counsel, requests and considers a broad range of information throughout the year.
The Board meets regularly each month except August and takes into account throughout the year matters bearing on Advisory Contracts. The Board, acting directly and through its separate committees, considers at each of its meetings factors that are relevant to the annual renewal of the fund's Advisory Contracts, including the services and support provided to the fund and its shareholders. At the time of the renewal, the Board had 12 standing committees, each composed of Independent Trustees with varying backgrounds, to which the Board has assigned specific subject matter responsibilities in order to enhance effective decision-making by the Board. Each committee has adopted a written charter outlining the structure and purposes of the committee. One such committee, the Equity Contract Committee, meets periodically as needed throughout the year to consider matters specifically related to the annual renewal of Advisory Contracts. The committee requests and receives information on, and makes recommendations to the Independent Trustees concerning, the approval and annual review of the Advisory Contracts.
At its July 2006 meeting, the Board of Trustees, including the Independent Trustees, unanimously determined to renew the Advisory Contracts for the fund. In reaching its determination, the Board considered all factors it believed relevant, including (i) the nature, extent, and quality of the services to be provided to the fund and its shareholders (including the investment performance of the fund); (ii) the competitiveness of the management fee and total expenses of the fund; (iii) the total costs of the services to be provided by and the profits to be realized by the investment adviser and its affiliates from the relationship with the fund; (iv) the extent to which economies of scale would be realized as the fund grows; and (v) whether fee levels reflect these economies of scale, if any, for the benefit of fund shareholders.
In determining whether to renew the Advisory Contracts for the fund, the Board ultimately reached a determination, with the assistance of fund counsel and Independent Trustees' counsel, that the renewal of the Advisory Contracts and the compensation to be received by Fidelity under the management contract is consistent with Fidelity's fiduciary duty under applicable law. In addition to evaluating the specific factors noted above, the Board, in reaching its determination, is aware that shareholders in the fund have a broad range of investment choices available to them, including a wide choice among mutual funds offered by competitors to Fidelity, and that the fund's shareholders, with the opportunity to review and weigh the disclosure provided by the fund in its prospectus and other public disclosures, have chosen to invest in this fund, managed by Fidelity.
Annual Report
Nature, Extent, and Quality of Services Provided. The Board considered staffing within the investment adviser, FMR, and the sub-advisers (together, the Investment Advisers), including the background of the fund's portfolio manager and the fund's investment objective and discipline. The Independent Trustees also had discussions with senior management of Fidelity's investment operations and investment groups. The Board considered the structure of the portfolio manager compensation program and whether this structure provides appropriate incentives.
Resources Dedicated to Investment Management and Support Services. The Board reviewed the size, education, and experience of the Investment Advisers' investment staff, their use of technology, and the Investment Advisers' approach to recruiting, training, and retaining portfolio managers and other research, advisory, and management personnel. The Board considered Fidelity's extensive global research capabilities that enable the Investment Advisers to aggregate data from various sources in an effort to produce positive investment results. The Board noted that Fidelity's analysts have access to a variety of technological tools that enable them to perform both fundamental and quantitative analysis and to specialize in various disciplines. The Board also considered that Fidelity's portfolio managers and analysts have access to daily portfolio attribution that allows for monitoring of a fund's portfolio, as well as an electronic communication system that provides immediate real-time access to research concerning issuers and credit enhancers.
Shareholder and Administrative Services. The Board considered (i) the nature, extent, quality, and cost of administrative, distribution, and shareholder services performed by the Investment Advisers and their affiliates under the Advisory Contracts and under separate agreements covering transfer agency, pricing and bookkeeping, and securities lending services for the fund; (ii) the nature and extent of the Investment Advisers' supervision of third party service providers, principally custodians and subcustodians; and (iii) the resources devoted to, and the record of compliance with, the fund's compliance policies and procedures. The Board reviewed the allocation of fund brokerage, including allocations to brokers affiliated with the Investment Advisers, the use of brokerage commissions to pay fund expenses, and the use of "soft" commission dollars to pay for research services. The Board also considered that Fidelity voluntarily pays for market data out of its own resources.
The Board noted that the growth of fund assets across the complex allows Fidelity to reinvest in the development of services designed to enhance the value or convenience of the Fidelity funds as investment vehicles. These services include 24-hour access to account information and market information through phone representatives and over the Internet, and investor education materials and asset allocation tools.
Annual Report
Board Approval of Investment Advisory Contracts and
Management Fees - continued
Investment in a Large Fund Family. The Board considered the benefits to shareholders of investing in a Fidelity fund, including the benefits of investing in a fund that is part of a large family of funds offering a variety of investment disciplines and providing for a large variety of mutual fund investor services. For example, fund shareholders are offered the privilege of exchanging shares of the fund for shares of other Fidelity funds, as set forth in the fund's prospectus, without paying a sales charge. The Board noted that, since the last Advisory Contract renewals in July 2005, Fidelity has taken a number of actions that benefited particular funds, including (i) dedicating additional resources to investment research and to restructure the investment research teams; (ii) voluntarily entering into contractual arrangements with certain brokers pursuant to which Fidelity pays for research products and services separately out of its own resources, rather than bundling with fund commissions; (iii) launching the Fidelity Advantage Class of its five Spartan stock index funds and three Spartan bond index funds, which is a lower-fee class available to shareholders with higher account balances; (iv) contractually agreeing to impose expense limitations on Fidelity U.S. Bond Index Fund and reducing the fund's initial investment minimum; and (v) offering shareholders of each of the Fidelity Institutional Money Market Funds the privilege of exchanging shares of the fund for shares of other Fidelity funds.
Investment Performance and Compliance. The Board considered whether the fund has operated within its investment objective, as well as its record of compliance with its investment restrictions. It also reviewed the fund's absolute investment performance, as well as the fund's relative investment performance measured against (i) a broad-based securities market index, and (ii) a peer group of mutual funds deemed appropriate by the Board over multiple periods. The following charts considered by the Board show, over the one-, three-, and five-year periods ended December 31, 2005, the fund's cumulative total returns, the cumulative total returns of a broad-based securities market index ("benchmark"), and a range of cumulative total returns of a peer group of mutual funds identified by Lipper Inc. as having an investment objective similar to that of the fund. The box within each chart shows the 25th percentile return (bottom of box) and the 75th percentile return (top of box) of the Lipper peer group. Returns shown above the box are in the first quartile and returns shown below the box are in the fourth quartile. The percentage beaten number noted below each chart corresponds to the percentile box and represents the percentage of funds in the Lipper peer group whose performance was equal to or lower than that of the fund.
Annual Report
Fidelity Dividend Growth Fund
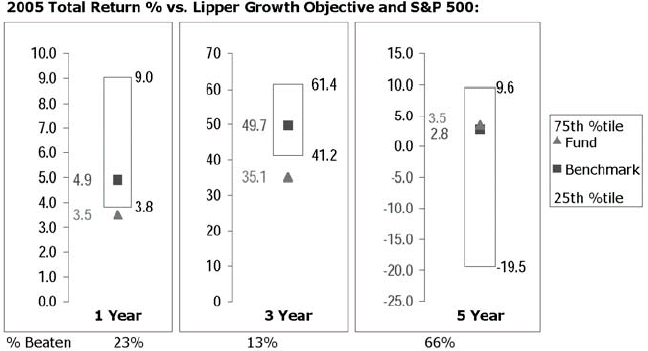
The Board reviewed the fund's relative investment performance against its Lipper peer group and stated that the performance of the fund was in the fourth quartile for the one- and three-year periods and the second quartile for the five-year period. The Board also stated that the relative investment performance of the fund was lower than its benchmark for the one- and three-year periods, although the fund's five-year cumulative total return was higher than its benchmark. The Board discussed with FMR actions to be taken by FMR to improve the fund's more recent disappointing performance. The Board also reviewed the fund's relative investment performance against a peer group defined by Morningstar. The Board will continue to closely monitor the performance of the fund in the coming year.
The Board also considered that the fund's management fee is subject to upward or downward adjustment depending upon whether, and to what extent, the fund's investment performance for the performance period exceeds, or is exceeded by, the record (over the same period) of a Board-approved performance adjustment index. The Board realizes that the performance adjustment provides FMR with a strong economic incentive to seek to achieve superior performance for the fund's shareholders and helps to more closely align the interests of FMR and the fund's shareholders.
The Board considered that FMR has taken steps to refocus and strengthen equity research, equity portfolio management, and compliance. The Board noted with favor FMR's reorganization of its senior management team in 2005 and FMR's dedication of additional resources to investment research, and participated in the process that led to those changes.
Annual Report
Board Approval of Investment Advisory Contracts and
Management Fees - continued
Based on its review, and giving particular weight to the nature and quality of the resources dedicated by the Investment Advisers to maintain and improve relative performance, the Board concluded that the nature, extent, and quality of the services provided to the fund will benefit the fund's shareholders, particularly in light of the Board's view that the fund's shareholders benefit from investing in a fund that is part of a large family of funds offering a variety of investment disciplines and services.
Competitiveness of Management Fee and Total Fund Expenses. The Board considered the fund's management fee and total expenses compared to "mapped groups" of competitive funds and classes. Fidelity creates "mapped groups" by combining similar Lipper investment objective categories that have comparable management fee characteristics. Combining Lipper investment objective categories aids the Board's management fee and total expense comparisons by broadening the competitive group used for comparison and by reducing the number of universes to which various Fidelity funds are compared.
The Board considered two proprietary management fee comparisons for the 12-month periods shown in the chart below. The group of Lipper funds used by the Board for management fee comparisons is referred to below as the "Total Mapped Group" and, for the reasons explained above, is broader than the Lipper peer group used by the Board for performance comparisons. The Total Mapped Group comparison focuses on a fund's standing relative to the total universe of comparable funds available to investors, in terms of gross management fees before expense reimbursements or caps, and without giving effect to the fund's performance adjustment. "TMG %" represents the percentage of funds in the Total Mapped Group that had management fees that were lower than the fund's. For example, a TMG % of 9% means that 91% of the funds in the Total Mapped Group had higher management fees than the fund. The "Asset-Size Peer Group" (ASPG) comparison focuses on a fund's standing relative to non-Fidelity funds similar in size to the fund within the Total Mapped Group. The ASPG represents at least 15% of the funds in the Total Mapped Group with comparable asset size and management fee characteristics, subject to a minimum of 50 funds (or all funds in the Total Mapped Group if fewer than 50). Additional information, such as the ASPG quartile in which the fund's management fee ranked and the impact of the fund's performance adjustment, is also included in the chart and considered by the Board.
Annual Report
Fidelity Dividend Growth Fund
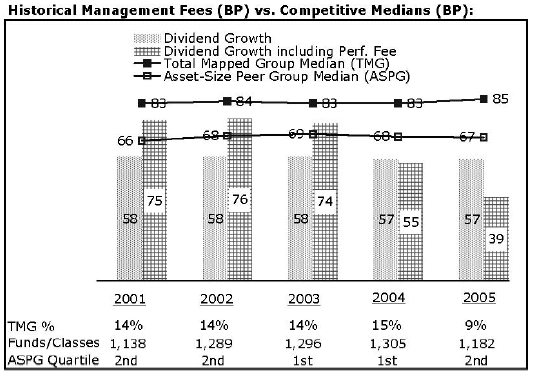
The Board noted that the fund's management fee ranked below the median of its Total Mapped Group and below the median of its ASPG for 2005. The Board also noted the effect of the fund's negative performance adjustment on the fund's management fee ranking. The Board noted that the performance adjustment for each year represents calculations for rolling 36-month periods that differ from the periods shown in the performance charts above.
Based on its review, the Board concluded that the fund's management fee was fair and reasonable in light of the services that the fund receives and the other factors considered.
In its review of the fund's total expenses, the Board considered the fund's management fee as well as other fund expenses, such as transfer agent fees, pricing and bookkeeping fees, and custodial, legal, and audit fees. The Board also noted the effects of any waivers and reimbursements on fees and expenses, as well as the fund's negative performance adjustment. As part of its review, the Board also considered current and historical total expenses of the fund compared to competitive fund median expenses. The fund is compared to those funds and classes in the Total Mapped Group (used by the Board for management fee comparisons) that have a similar sales load structure.
The Board noted that the fund's total expenses ranked below its competitive median for 2005.
In its review of total expenses, the Board also considered Fidelity fee structures and other information on clients that FMR and its affiliates service in other competitive markets, such as other mutual funds advised or subadvised by FMR or its affiliates, pension plan clients, and other institutional clients.
Annual Report
Board Approval of Investment Advisory Contracts and
Management Fees - continued
Based on its review, the Board concluded that the fund's total expenses were reasonable in light of the services that the fund and its shareholders receive and the other factors considered.
Costs of the Services and Profitability. The Board considered the revenues earned and the expenses incurred by Fidelity in conducting the business of developing, marketing, distributing, managing, administering and servicing the fund and its shareholders. The Board also considered the level of Fidelity's profits in respect of all the Fidelity funds.
On an annual basis, FMR presents to the Board Fidelity's profitability for the fund. Fidelity calculates the profitability for each fund, as well as aggregate profitability for groups of Fidelity funds and all Fidelity funds, using a series of detailed revenue and cost allocation methodologies which originate with the audited books and records of Fidelity. The Audit Committee of the Board reviews any significant changes from the prior year's methodologies.
PricewaterhouseCoopers LLP (PwC), independent registered accounting firm and auditor to Fidelity and certain Fidelity funds, has been engaged annually by the Board as part of the Board's assessment of the results of Fidelity's profitability analysis. PwC's engagement includes the review and assessment of Fidelity's methodologies used in determining the revenues and expenses attributable to Fidelity's mutual fund business, and completion of agreed-upon procedures surrounding the mathematical accuracy of fund profitability and its conformity to allocation methodologies. After considering PwC's reports issued under the engagement and information provided by Fidelity, the Board believes that while other allocation methods may also be reasonable, Fidelity's profitability methodologies are reasonable in all material respects.
The Board has also reviewed Fidelity's non-fund businesses and any fall-out benefits related to the mutual fund business as well as cases where Fidelity's affiliates may benefit from or be related to the fund's business.
The Board considered the costs of the services provided by and the profits realized by Fidelity in connection with the operation of the fund and determined that the amount of profit is a fair entrepreneurial profit for the management of the fund.
Economies of Scale. The Board considered whether there have been economies of scale in respect of the management of the Fidelity funds, whether the Fidelity funds (including the fund) have appropriately benefited from any such economies of scale, and whether there is potential for realization of any further economies of scale. The Board considered the extent to which the fund will benefit from economies of scale through increased services to the fund, through waivers or reimbursements, or through fee or expense reductions, including reductions that occur through operation of the transfer agent agreement. The transfer agent fee varies in part based on the number of accounts in the fund. If the number of accounts decreases or the average account size increases, the overall transfer agent fee rate decreases.
Annual Report
The Board recognized that the fund's management contract incorporates a "group fee" structure, which provides for lower fee rates as total fund assets under FMR's management increase, and for higher fee rates as total fund assets under FMR's management decrease. The Board considered that the group fee is designed to deliver the benefits of economies of scale to fund shareholders when total fund assets increase, even if assets of any particular fund are unchanged or have declined, because some portion of Fidelity's costs are attributable to services provided to all Fidelity funds, and all funds benefit if those costs can be allocated among more assets. The Board concluded that, given the group fee structure, fund shareholders will achieve a certain level of economies of scale as assets under FMR's management increase at the fund complex level, regardless of whether Fidelity achieves any such economies of scale.
The Board further concluded that any potential economies of scale are being shared between fund shareholders and Fidelity in an appropriate manner.
Additional Information Requested by the Board. In order to develop fully the factual basis for consideration of the Advisory Contracts, the Board requested additional information on several topics, including (i) Fidelity's fund profitability methodology and profitability trends within certain funds; (ii) portfolio manager compensation; (iii) the extent to which any economies of scale exist and are shared between the funds and Fidelity; (iv) the total expenses of certain funds and classes relative to competitors, including the extent to which the expenses of certain funds have been or could be capped; (v) fund performance trends; and (vi) Fidelity's fee structures, including use of performance fees.
Based on its evaluation of all of the conclusions noted above, and after considering all material factors, the Board ultimately concluded that the advisory fee structures are fair and reasonable, and that the fund's Advisory Contracts should be renewed.
Annual Report
Investment Adviser
Fidelity Management & Research Company
Boston, MA
Investment Sub Advisers
FMR Co., Inc.
Fidelity Research & Analysis Company (formerly Fidelity Management &
Research (Far East) Inc.)
Fidelity Management & Research
(U.K.) Inc.
Fidelity International Investment
Advisors
Fidelity Investments Japan Limited
Fidelity International Investment
Advisors (U.K.) Limited
General Distributor
Fidelity Distributors Corporation
Boston, MA
Transfer and Service Agent
Fidelity Service Company, Inc.
Boston, MA
Custodian
Citibank, N.A.,
New York, NY
The Fidelity Telephone Connection
Mutual Fund 24-Hour Service
Exchanges/Redemptions
and Account Assistance 1-800-544-6666
Product Information 1-800-544-6666
Retirement Accounts 1-800-544-4774
(8 a.m. - 9 p.m.)
TDD Service 1-800-544-0118
for the deaf and hearing impaired
(9 a.m. - 9 p.m. Eastern time)
Fidelity Automated Service
Telephone (FAST ®) (automated graphic) 1-800-544-5555
(automated graphic) Automated line for quickest service
DGF-UANN-0906
1.789245.103
(Fidelity Investment logo)(registered trademark)
Corporate Headquarters
82 Devonshire St., Boston, MA 02109
www.fidelity.com
Fidelity®
Growth & Income
Portfolio
Annual Report
July 31, 2006
(2_fidelity_logos) (Registered_Trademark)
Contents
Chairman's Message | <Click Here> | Ned Johnson's message to shareholders. |
Performance | <Click Here> | How the fund has done over time. |
Management's Discussion | <Click Here> | The manager's review of fund performance, strategy and outlook |
Shareholder Expense Example | <Click Here> | An example of shareholder expenses. |
Investment Changes | <Click Here> | A summary of major shifts in the fund's investments over the past six months. |
Investments | <Click Here> | A complete list of the fund's investments with their market values. |
Financial Statements | <Click Here> | Statements of assets and liabilities, operations, and changes in net assets,
as well as financial highlights. |
Notes | <Click Here> | Notes to the financial statements. |
Report of Independent Registered Public Accounting Firm | <Click Here> | |
Trustees and Officers | <Click Here> | |
Distributions | <Click Here> | |
Proxy Voting Results | <Click Here> | |
Board Approval of Investment Advisory Contracts and Management Fees | <Click Here> | |
To view a fund's proxy voting guidelines and proxy voting record for the 12-month period ended June 30, visit www.fidelity.com/proxyvotingresults or visit the Securities and Exchange Commission's (SEC) web site at www.sec.gov. You may also call 1-800-544-8544 to request a free copy of the proxy voting guidelines.
Standard & Poor's, S&P and S&P 500 are registered service marks of The McGraw-Hill Companies, Inc. and have been licensed for use by Fidelity Distributors Corporation.
Other third party marks appearing herein are the property of their respective owners.
All other marks appearing herein are registered or unregistered trademarks or service marks of FMR Corp. or an affiliated company.
Annual Report
This report and the financial statements contained herein are submitted for the general information of the shareholders of the fund. This report is not authorized for distribution to prospective investors in the fund unless preceded or accompanied by an effective prospectus.
A fund files its complete schedule of portfolio holdings with the SEC for the first and third quarters of each fiscal year on Form N-Q. Forms N-Q are available on the SEC's web site at http://www.sec.gov. A fund's Forms N-Q may be reviewed and copied at the SEC's Public Reference Room in Washington, DC. Information regarding the operation of the SEC's Public Reference Room may be obtained by calling 1-800-SEC-0330. For a complete list of a fund's portfolio holdings, view the most recent quarterly holdings report, semiannual report, or annual report on Fidelity's web site at http://www.fidelity.com/holdings.
NOT FDIC INSURED · MAY LOSE VALUE · NO BANK GUARANTEE
Neither the fund nor Fidelity Distributors Corporation is a bank.
Annual Report
Chairman's Message
(photo_of_Edward_C_Johnson_3d)
Dear Shareholder:
Although many securities markets made gains in early 2006, inflation concerns led to mixed results through the year's mid-point. Financial markets are always unpredictable. There are, however, a number of time-tested principles that can put the historical odds in your favor.
One of the basic tenets is to invest for the long term. Over time, riding out the markets' inevitable ups and downs has proven much more effective than selling into panic or chasing the hottest trend. Even missing only a few of the markets' best days can significantly diminish investor returns. Patience also affords the benefits of compounding - of earning interest on additional income or reinvested dividends and capital gains. There are tax advantages and cost benefits to consider as well. The more you sell, the more taxes you pay, and the more you trade, the higher the costs. While staying the course doesn't eliminate risk, it can considerably lessen the effect of short-term declines.
You can further manage your investing risk through diversification. And today, more than ever, geographic diversification should be taken into account. Studies indicate that asset allocation is the single most important determinant of a portfolio's long-term success. The right mix of stocks, bonds and cash - aligned to your particular risk tolerance and investment objective - is very important. Age-appropriate rebalancing is also an essential aspect of asset allocation. For younger investors, an emphasis on equities - which historically have been the best performing asset class over time - is encouraged. As investors near their specific goal, such as retirement or sending a child to college, consideration may be given to replacing volatile assets (e.g. common stocks) with more-stable fixed investments (bonds or savings plans).
A third investment principle - investing regularly - can help lower the average cost of your purchases. Investing a certain amount of money each month or quarter helps ensure you won't pay for all your shares at market highs. This strategy - known as dollar cost averaging - also reduces unconstructive "emotion" from investing, helping shareholders avoid selling weak performers just prior to an upswing, or chasing a hot performer just before a correction.
We invite you to contact us via the Internet, through our Investor Centers or over the phone. It is our privilege to provide you the information you need to make the investments that are right for you.
Sincerely,
/s/Edward C. Johnson 3d
Edward C. Johnson 3d
Annual Report
Performance: The Bottom Line
Average annual total return reflects the change in the value of an investment, assuming reinvestment of the fund's dividend income and capital gains (the profits earned upon the sale of securities that have grown in value) and assuming a constant rate of performance each year. The $10,000 table and the fund's returns do not reflect the deduction of taxes that a shareholder would pay on fund distributions or the redemption of fund shares. During periods of reimbursement by Fidelity, a fund's total return will be greater than it would be had the reimbursement not occurred. How a fund did yesterday is no guarantee of how it will do tomorrow.
Average Annual Total Returns
Periods ended July 31, 2006 | Past 1
year | Past 5
years | Past 10
years |
Fidelity® Growth & Income Portfolio | 1.22% | 1.27% | 7.47% |
$10,000 Over 10 Years
Let's say hypothetically that $10,000 was invested in Fidelity ® Growth & Income Portfolio on July 31, 1996. The chart shows how the value of your investment would have changed, and also shows how the Standard & Poor's 500SM Index performed over the same period.
Annual Report
Management's Discussion of Fund Performance
Comments from Timothy Cohen, Portfolio Manager of Fidelity® Growth & Income Portfolio
As measured by the Dow Jones Wilshire 5000 Composite IndexSM - the broadest measure of U.S. equity market performance - stocks did well for most of the 12-month period ending July 31, 2006, before faltering. For the one-year time frame as a whole, the Dow Jones Wilshire benchmark rose 5.43%. That was nearly identical to the 5.38% gain of the Standard & Poor's 500SM Index, a broad market proxy that's a reflection of larger-cap stocks. Stocks were resilient early on, bouncing back quickly after Hurricanes Katrina and Rita caused energy prices to spike to record-high levels. Buoyed by strong corporate earnings and solid economic growth, the S&P 500® ran off six consecutive months of positive returns from November through April. However, stocks pulled back for most of the remainder of the period. A slowdown in economic expansion and consumer spending, reaccelerating energy prices and continued interest rate hikes by the Federal Reserve Board cooled equity performance. Among other widely quoted market yardsticks, the Dow Jones Industrial AverageSM returned 7.59%, while the NASDAQ Composite® Index dropped 3.47%.
Growth & Income Portfolio returned 1.22% for the 12 months ending July 31, 2006, trailing the S&P 500 index. The fund underperformed mainly as a result of weak performance from several of our individual holdings, particularly in the consumer discretionary and information technology sectors. The fund's return also was hobbled by unfavorable positioning relative to the index in a few areas, notably our limited exposure to the robust telecommunication services sector, untimely trading in the insurance group and an overweighting in software/services. Among the individual holdings that detracted the most were online auctioneer eBay, home improvement retailer Home Depot, personal computer maker Dell and insurance giant American International Group. On the upside, performance was aided by our overexposure to energy and health care, as well as by some favorable stock picks within diversified financials, notably Bank of America and UBS, the Swiss banking and asset management firm. Favorable currency movements also imparted a modest boost.
The views expressed above reflect those of the portfolio manager(s) only through the end of the period as stated on the cover of this report and do not necessarily represent the views of Fidelity or any other person in the Fidelity organization. Any such views are subject to change at any time based upon market or other conditions and Fidelity disclaims any responsibility to update such views. These views may not be relied on as investment advice and, because investment decisions for a Fidelity fund are based on numerous factors, may not be relied on as an indication of trading intent on behalf of any Fidelity fund.
Annual Report
Shareholder Expense Example
As a shareholder of the Fund, you incur two types of costs: (1) transaction costs, and (2) ongoing costs, including management fees and other Fund expenses. This Example is intended to help you understand your ongoing costs (in dollars) of investing in the Fund and to compare these costs with the ongoing costs of investing in other mutual funds.
The Example is based on an investment of $1,000 invested at the beginning of the period and held for the entire period (February 1, 2006 to July 31, 2006).
Actual Expenses
The first line of the accompanying table provides information about actual account values and actual expenses. You may use the information in this line, together with the amount you invested, to estimate the expenses that you paid over the period. Simply divide your account value by $1,000.00 (for example, an $8,600 account value divided by $1,000.00 = 8.6), then multiply the result by the number in the first line under the heading entitled "Expenses Paid During Period" to estimate the expenses you paid on your account during this period. A small balance maintenance fee of $12.00 that is charged once a year may apply for certain accounts with a value of less than $2,000. This fee is not included in the table below. If it was, the estimate of expenses you paid during the period would be higher, and your ending account value lower, by this amount.
Hypothetical Example for Comparison Purposes
The second line of the accompanying table provides information about hypothetical account values and hypothetical expenses based on the Fund's actual expense ratio and an assumed rate of return of 5% per year before expenses, which is not the Fund's actual return. The hypothetical account values and expenses may not be used to estimate the actual ending account balance or expenses you paid for the period. You may use this information to compare the ongoing costs of investing in the Fund and other funds. To do so, compare this 5% hypothetical example with the 5% hypothetical examples that appear in the shareholder reports of the other funds. A small balance maintenance fee of $12.00 that is charged once a year may apply for certain accounts with a value of less than $2,000. This fee is not included in the table below. If it was, the estimate of expenses you paid during the period would be higher, and your ending account value lower, by this amount.
Please note that the expenses shown in the table are meant to highlight your ongoing costs only and do not reflect any transaction costs. Therefore, the second line of the table is useful in comparing ongoing costs only, and will not help you determine the relative total costs of owning different funds.
| Beginning
Account Value
February 1, 2006 | Ending
Account Value
July 31, 2006 | Expenses Paid
During Period*
February 1, 2006
to July 31, 2006 |
Actual | $ 1,000.00 | $ 969.40 | $ 3.37 |
Hypothetical (5% return per year before expenses) | $ 1,000.00 | $ 1,021.37 | $ 3.46 |
* Expenses are equal to the Fund's annualized expense ratio of .69%; multiplied by the average account value over the period, multiplied by 181/365 (to reflect the one-half year period).
Annual Report
Investment Changes
Top Ten Stocks as of July 31, 2006 |
| % of fund's
net assets | % of fund's net assets
6 months ago |
General Electric Co. | 7.2 | 5.7 |
American International Group, Inc. | 6.5 | 6.2 |
Bank of America Corp. | 5.2 | 4.4 |
Home Depot, Inc. | 4.7 | 4.3 |
Johnson & Johnson | 4.7 | 3.2 |
UnitedHealth Group, Inc. | 3.2 | 3.1 |
Wal-Mart Stores, Inc. | 3.0 | 3.5 |
Google, Inc. Class A (sub. vtg.) | 2.9 | 1.8 |
eBay, Inc. | 2.4 | 1.9 |
Honeywell International, Inc. | 2.2 | 1.9 |
| 42.0 | |
Top Five Market Sectors as of July 31, 2006 |
| % of fund's
net assets | % of fund's net assets
6 months ago |
Financials | 24.1 | 26.5 |
Health Care | 15.1 | 10.6 |
Information Technology | 15.0 | 14.6 |
Energy | 14.0 | 14.1 |
Consumer Discretionary | 13.3 | 14.8 |
Asset Allocation (% of fund's net assets) |
As of July 31, 2006 * | As of January 31, 2006 ** |
| Stocks 99.7% | | | Stocks 98.9% | |
| Convertible
Securities 0.0% | | | Convertible
Securities 0.4% | |
| Short-Term
Investments and
Net Other Assets 0.3% | | | Short-Term
Investments and
Net Other Assets 0.7% | |
* Foreign investments | 15.3% | | ** Foreign investments | 15.3% | |

Annual Report
Investments July 31, 2006
Showing Percentage of Net Assets
Common Stocks - 99.7% |
| Shares | | Value (Note 1) (000s) |
CONSUMER DISCRETIONARY - 13.3% |
Diversified Consumer Services - 1.4% |
Apollo Group, Inc. Class A (a)(d)(e) | 8,894,148 | | $ 420,871 |
Hotels, Restaurants & Leisure - 0.1% |
Carnival Corp. unit | 903,600 | | 35,204 |
Household Durables - 1.4% |
D.R. Horton, Inc. | 5,473,351 | | 117,294 |
Hovnanian Enterprises, Inc. Class A | 178,000 | | 4,875 |
KB Home | 2,402,686 | | 102,162 |
Ryland Group, Inc. | 2,091,200 | | 85,426 |
Standard Pacific Corp. (e) | 3,721,300 | | 83,097 |
| | 392,854 |
Media - 1.6% |
Clear Channel Communications, Inc. | 6,815,800 | | 197,317 |
Clear Channel Outdoor Holding, Inc. Class A (e) | 2,441,500 | | 50,100 |
McGraw-Hill Companies, Inc. | 3,652,100 | | 205,613 |
| | 453,030 |
Multiline Retail - 1.1% |
Target Corp. | 6,830,800 | | 313,670 |
Specialty Retail - 7.7% |
Best Buy Co., Inc. | 8,778,163 | | 398,002 |
Chico's FAS, Inc. (a) | 7,036,800 | | 159,384 |
Home Depot, Inc. | 39,197,610 | | 1,360,549 |
Staples, Inc. | 14,364,808 | | 310,567 |
| | 2,228,502 |
TOTAL CONSUMER DISCRETIONARY | | 3,844,131 |
CONSUMER STAPLES - 4.5% |
Food & Staples Retailing - 3.7% |
CVS Corp. | 6,323,700 | | 206,911 |
Wal-Mart Stores, Inc. | 19,592,800 | | 871,880 |
| | 1,078,791 |
Food Products - 0.8% |
Nestle SA (Reg.) | 686,715 | | 225,018 |
TOTAL CONSUMER STAPLES | | 1,303,809 |
ENERGY - 14.0% |
Energy Equipment & Services - 6.1% |
Baker Hughes, Inc. | 1,827,400 | | 146,101 |
Common Stocks - continued |
| Shares | | Value (Note 1) (000s) |
ENERGY - continued |
Energy Equipment & Services - continued |
ENSCO International, Inc. | 889,800 | | $ 41,127 |
GlobalSantaFe Corp. | 1,683,800 | | 92,491 |
Halliburton Co. | 10,586,520 | | 353,166 |
National Oilwell Varco, Inc. (a) | 2,655,801 | | 178,045 |
Noble Corp. | 2,743,000 | | 196,810 |
Pride International, Inc. (a) | 3,100,450 | | 92,610 |
Schlumberger Ltd. (NY Shares) | 7,469,400 | | 499,329 |
Weatherford International Ltd. (a) | 3,123,900 | | 146,323 |
| | 1,746,002 |
Oil, Gas & Consumable Fuels - 7.9% |
Apache Corp. | 3,716,970 | | 261,935 |
ConocoPhillips | 9,274,800 | | 636,622 |
Hess Corp. | 1,779,600 | | 94,141 |
Occidental Petroleum Corp. | 3,442,020 | | 370,878 |
Peabody Energy Corp. | 4,161,976 | | 207,683 |
Plains Exploration & Production Co. (a) | 2,731,400 | | 120,072 |
Valero Energy Corp. | 5,272,800 | | 355,545 |
XTO Energy, Inc. | 4,911,700 | | 230,801 |
| | 2,277,677 |
TOTAL ENERGY | | 4,023,679 |
FINANCIALS - 24.1% |
Capital Markets - 1.3% |
AP Alternative Assets, L.P. Restricted Depositary Units (a)(f) | 4,454,200 | | 89,084 |
KKR Private Equity Investors, L.P. Restricted Depositary Units (g) | 6,496,500 | | 152,668 |
UBS AG (NY Shares) | 2,627,600 | | 142,941 |
| | 384,693 |
Commercial Banks - 4.3% |
Erste Bank der Oesterreichischen Sparkassen AG | 2,583,500 | | 149,030 |
HSBC Holdings PLC sponsored ADR | 2,495,000 | | 226,945 |
Standard Chartered PLC (United Kingdom) | 10,097,886 | | 255,410 |
Wachovia Corp. | 11,023,013 | | 591,164 |
| | 1,222,549 |
Diversified Financial Services - 5.8% |
African Bank Investments Ltd. | 16,742,559 | | 59,645 |
Common Stocks - continued |
| Shares | | Value (Note 1) (000s) |
FINANCIALS - continued |
Diversified Financial Services - continued |
Bank of America Corp. | 28,914,159 | | $ 1,489,947 |
JPMorgan Chase & Co. | 2,846,192 | | 129,843 |
| | 1,679,435 |
Insurance - 12.2% |
ACE Ltd. | 4,145,028 | | 213,593 |
AMBAC Financial Group, Inc. | 576,918 | | 47,948 |
American International Group, Inc. | 31,023,970 | | 1,882,224 |
Berkshire Hathaway, Inc. Class A (a) | 2,846 | | 260,694 |
Hartford Financial Services Group, Inc. | 4,424,080 | | 375,339 |
Markel Corp. (a) | 238,500 | | 81,245 |
Max Re Capital Ltd. | 2,378,443 | | 53,515 |
RenaissanceRe Holdings Ltd. (e) | 3,631,400 | | 188,143 |
W.R. Berkley Corp. | 2,450,450 | | 88,216 |
White Mountains Insurance Group Ltd. | 145,900 | | 71,564 |
XL Capital Ltd. Class A | 4,020,193 | | 256,086 |
| | 3,518,567 |
Thrifts & Mortgage Finance - 0.5% |
Golden West Financial Corp., Delaware | 1,912,600 | | 140,882 |
TOTAL FINANCIALS | | 6,946,126 |
HEALTH CARE - 15.1% |
Biotechnology - 2.5% |
Amgen, Inc. (a) | 4,716,690 | | 328,942 |
Celgene Corp. (a) | 1,240,400 | | 59,403 |
Cephalon, Inc. (a)(d) | 2,275,335 | | 149,581 |
Genentech, Inc. (a) | 1,069,030 | | 86,399 |
MannKind Corp. (a)(d) | 851,904 | | 15,581 |
Vertex Pharmaceuticals, Inc. (a) | 2,480,620 | | 83,150 |
| | 723,056 |
Health Care Equipment & Supplies - 0.6% |
Advanced Medical Optics, Inc. (a) | 892,726 | | 43,967 |
C.R. Bard, Inc. | 1,872,520 | | 132,893 |
| | 176,860 |
Health Care Providers & Services - 3.2% |
UnitedHealth Group, Inc. | 19,216,162 | | 919,109 |
Life Sciences Tools & Services - 0.4% |
Illumina, Inc. (a)(e) | 2,837,920 | | 108,494 |
Common Stocks - continued |
| Shares | | Value (Note 1) (000s) |
HEALTH CARE - continued |
Pharmaceuticals - 8.4% |
Allergan, Inc. | 3,119,620 | | $ 336,451 |
Elan Corp. PLC sponsored ADR (a) | 9,173,325 | | 140,719 |
Johnson & Johnson | 21,565,200 | | 1,348,903 |
Novartis AG sponsored ADR | 3,544,350 | | 199,263 |
Roche Holding AG (participation certificate) | 955,160 | | 169,975 |
Teva Pharmaceutical Industries Ltd. sponsored ADR | 7,435,400 | | 245,963 |
| | 2,441,274 |
TOTAL HEALTH CARE | | 4,368,793 |
INDUSTRIALS - 11.7% |
Aerospace & Defense - 2.2% |
Honeywell International, Inc. | 16,580,738 | | 641,675 |
Commercial Services & Supplies - 1.2% |
Robert Half International, Inc. (e) | 10,309,627 | | 333,620 |
Industrial Conglomerates - 7.7% |
General Electric Co. (d) | 62,974,439 | | 2,058,634 |
Smiths Group PLC | 8,909,210 | | 150,035 |
| | 2,208,669 |
Machinery - 0.6% |
ITT Industries, Inc. | 3,479,200 | | 175,874 |
TOTAL INDUSTRIALS | | 3,359,838 |
INFORMATION TECHNOLOGY - 15.0% |
Communications Equipment - 1.9% |
CSR PLC (a) | 3,559,557 | | 75,471 |
Motorola, Inc. | 12,929,421 | | 294,274 |
Research In Motion Ltd. (a) | 2,811,800 | | 184,538 |
| | 554,283 |
Computers & Peripherals - 2.6% |
Dell, Inc. (a) | 22,088,774 | | 478,885 |
EMC Corp. (a) | 13,346,600 | | 135,468 |
NCR Corp. (a) | 3,827,300 | | 123,009 |
| | 737,362 |
Common Stocks - continued |
| Shares | | Value (Note 1) (000s) |
INFORMATION TECHNOLOGY - continued |
Internet Software & Services - 5.3% |
eBay, Inc. (a) | 28,504,665 | | $ 686,107 |
Google, Inc. Class A (sub. vtg.) (a) | 2,160,210 | | 835,137 |
| | 1,521,244 |
IT Services - 0.7% |
Infosys Technologies Ltd. sponsored ADR (d) | 2,672,600 | | 109,817 |
Satyam Computer Services Ltd. sponsored ADR | 2,670,000 | | 94,118 |
| | 203,935 |
Office Electronics - 0.4% |
Zebra Technologies Corp. Class A (a)(e) | 4,171,769 | | 130,785 |
Semiconductors & Semiconductor Equipment - 3.6% |
Applied Materials, Inc. | 9,254,851 | | 145,671 |
ARM Holdings PLC | 68,288,426 | | 148,296 |
Broadcom Corp. Class A (a) | 9,432,848 | | 226,294 |
KLA-Tencor Corp. | 2,313,700 | | 97,615 |
Linear Technology Corp. | 6,414,900 | | 207,522 |
Marvell Technology Group Ltd. (a) | 1,510,200 | | 28,014 |
Maxim Integrated Products, Inc. | 6,674,142 | | 196,086 |
| | 1,049,498 |
Software - 0.5% |
Symantec Corp. (a) | 8,275,800 | | 143,751 |
TOTAL INFORMATION TECHNOLOGY | | 4,340,858 |
MATERIALS - 2.0% |
Chemicals - 1.2% |
Praxair, Inc. | 6,419,390 | | 352,039 |
Metals & Mining - 0.8% |
Mittal Steel Co. NV Class A (NY Shares) (d) | 6,843,900 | | 234,130 |
TOTAL MATERIALS | | 586,169 |
TOTAL COMMON STOCKS (Cost $26,059,336) | 28,773,403 |
Money Market Funds - 1.4% |
| Shares | | Value (Note 1) (000s) |
Fidelity Cash Central Fund, 5.3% (b) | 122,456,122 | | $ 122,456 |
Fidelity Securities Lending Cash Central Fund, 5.32% (b)(c) | 288,186,150 | | 288,186 |
TOTAL MONEY MARKET FUNDS (Cost $410,642) | 410,642 |
Cash Equivalents - 0.4% |
| Maturity Amount (000s) | | |
Investments in repurchase agreements (Collateralized by U.S. Treasury Obligations, in a joint trading account at 5.25%, dated 7/31/06 due 8/1/06)
(Cost $95,365) | $ 95,379 | | 95,365 |
TOTAL INVESTMENT PORTFOLIO - 101.5% (Cost $26,565,343) | | 29,279,410 |
NET OTHER ASSETS - (1.5)% | | (418,659) |
NET ASSETS - 100% | $ 28,860,751 |
Legend |
(a) Non-income producing |
(b) Affiliated fund that is available only to investment companies and other accounts managed by Fidelity Investments. The rate quoted is the annualized seven-day yield of the fund at period end. A complete unaudited listing of the fund's holdings as of its most recent quarter end is available upon request. |
(c) Investment made with cash collateral received from securities on loan. |
(d) Security or a portion of the security is on loan at period end. |
(e) Affiliated company |
(f) Security exempt from registration under Rule 144A of the Securities Act of 1933. These securities may be resold in transactions exempt from registration, normally to qualified institutional buyers. At the period end, the value of these securities amounted to $89,084,000 or 0.3% of net assets. |
(g) Restricted securities - Investment in securities not registered under the Securities Act of 1933 (excluding 144A issues). At the end of the period, the value of restricted securities (excluding 144A issues) amounted to $152,668,000 or 0.5% of net assets. |
Additional information on each holding is as follows: |
Security | Acquisition Date | Acquisition Cost (000s) |
KKR Private Equity Investors, L.P. Restricted Depositary Units | 5/3/06 - 7/18/06 | $ 152,207 |
Affiliated Central Funds |
Information regarding fiscal year to date income earned by the fund from the affiliated Central funds is as follows: |
Fund | Income earned
(Amounts in thousands) |
Fidelity Cash Central Fund | $ 16,387 |
Fidelity Securities Lending Cash Central Fund | 6,770 |
Total | $ 23,157 |
Other Affiliated Issuers |
An affiliated company is a company in which the fund has ownership of at least 5% of the voting securities. Fiscal year to date transactions with companies which are or were affiliates are as follows: |
Affiliates
(Amounts in thousands) | Value, beginning of period | Purchases | Sales Proceeds | Dividend Income | Value, end of period |
Apollo Group, Inc. Class A | $ 140,628 | $ 627,272 | $ 163,485 | $ - | $ 420,871 |
Clear Channel Outdoor Holding, Inc. Class A | - | 44,865 | - | - | 50,100 |
Equity Lifestyle Properties, Inc. | 64,607 | - | 60,094 | 32 | - |
Illumina, Inc. | - | 60,947 | - | - | 108,494 |
RenaissanceRe Holdings Ltd. | - | 140,794 | - | 1,845 | 188,143 |
Robert Half International, Inc. | 41,898 | 329,121 | - | 1,638 | 333,620 |
SLM Corp. | 1,373,570 | 24,501 | 1,438,843 | 5,933 | - |
Standard Pacific Corp. | - | 91,033 | - | - | 83,097 |
Zebra Technologies Corp. Class A | - | 229,819 | 62,795 | - | 130,785 |
Total | $ 1,620,703 | $ 1,548,352 | $ 1,725,217 | $ 9,448 | $ 1,315,110 |
Other Information |
Distribution of investments by country of issue, as a percentage of total net assets, is as follows: |
United States of America | 84.7% |
United Kingdom | 3.8% |
Switzerland | 2.6% |
Netherlands Antilles | 1.8% |
Cayman Islands | 1.7% |
Bermuda | 1.2% |
Others (individually less than 1%) | 4.2% |
| 100.0% |
See accompanying notes which are an integral part of the financial statements.
Annual Report
Financial Statements
Statement of Assets and Liabilities
Amounts in thousands (except per-share amount) | July 31, 2006 |
Assets | | |
Investment in securities, at value (including securities loaned of $284,162 and repurchase agreements of $95,365) - See accompanying schedule: Unaffiliated issuers (cost $24,725,301) | $ 27,553,658 | |
Affiliated Central Funds (cost $410,642) | 410,642 | |
Other affiliated issuers (cost $1,429,400) | 1,315,110 | |
Total Investments (cost $26,565,343) | | $ 29,279,410 |
Cash | | 1 |
Receivable for investments sold | | 367,715 |
Receivable for fund shares sold | | 18,590 |
Dividends receivable | | 4,483 |
Interest receivable | | 315 |
Prepaid expenses | | 48 |
Other receivables | | 3,079 |
Total assets | | 29,673,641 |
| | |
Liabilities | | |
Payable for investments purchased | $ 469,240 | |
Payable for fund shares redeemed | 37,117 | |
Accrued management fee | 11,154 | |
Other affiliated payables | 5,959 | |
Other payables and accrued expenses | 1,234 | |
Collateral on securities loaned, at value | 288,186 | |
Total liabilities | | 812,890 |
| | |
Net Assets | | $ 28,860,751 |
Net Assets consist of: | | |
Paid in capital | | $ 20,475,221 |
Distributions in excess of net investment income | | (790) |
Accumulated undistributed net realized gain (loss) on investments and foreign currency transactions | | 5,672,252 |
Net unrealized appreciation (depreciation) on investments and assets and liabilities in foreign currencies | | 2,714,068 |
Net Assets, for 844,904 shares outstanding | | $ 28,860,751 |
Net Asset Value, offering price and redemption price per share ($28,860,751 ÷ 844,904 shares) | | $ 34.16 |
See accompanying notes which are an integral part of the financial statements.
Annual Report
Financial Statements - continued
Statement of Operations
Amounts in thousands | Year ended July 31, 2006 |
Investment Income | | |
Dividends (including $9,448 received from other affiliated issuers) | | $ 464,093 |
Interest | | 895 |
Income from affiliated Central Funds | | 23,157 |
Total income | | 488,145 |
| | |
Expenses | | |
Management fee | $ 143,602 | |
Transfer agent fees | 62,412 | |
Accounting and security lending fees | 1,965 | |
Independent trustees' compensation | 126 | |
Appreciation in deferred trustee compensation account | 32 | |
Custodian fees and expenses | 527 | |
Registration fees | 84 | |
Audit | 239 | |
Legal | 309 | |
Interest | 119 | |
Miscellaneous | 1,305 | |
Total expenses before reductions | 210,720 | |
Expense reductions | (9,706) | 201,014 |
Net investment income (loss) | | 287,131 |
Realized and Unrealized Gain (Loss) Net realized gain (loss) on: | | |
Investment securities: | | |
Unaffiliated issuers | 7,181,488 | |
Other affiliated issuers | 1,168,423 | |
Foreign currency transactions | (324) | |
Futures contracts | 43,534 | |
Total net realized gain (loss) | | 8,393,121 |
Change in net unrealized appreciation (depreciation) on: Investment securities | (8,258,353) | |
Assets and liabilities in foreign currencies | 1 | |
Total change in net unrealized appreciation (depreciation) | | (8,258,352) |
Net gain (loss) | | 134,769 |
Net increase (decrease) in net assets resulting from operations | | $ 421,900 |
See accompanying notes which are an integral part of the financial statements.
Annual Report
Statement of Changes in Net Assets
Amounts in thousands | Year ended
July 31, 2006 | Year ended
July 31, 2005 |
Increase (Decrease) in Net Assets | | |
Operations | | |
Net investment income (loss) | $ 287,131 | $ 504,318 |
Net realized gain (loss) | 8,393,121 | 1,192,005 |
Change in net unrealized appreciation (depreciation) | (8,258,352) | 1,570,053 |
Net increase (decrease) in net assets resulting
from operations | 421,900 | 3,266,376 |
Distributions to shareholders from net investment income | (320,403) | (507,409) |
Distributions to shareholders from net realized gain | (3,635,165) | (283,191) |
Total distributions | (3,955,568) | (790,600) |
Share transactions
Proceeds from sales of shares | 3,926,843 | 3,564,106 |
Reinvestment of distributions | 3,859,564 | 768,803 |
Cost of shares redeemed | (7,181,012) | (4,795,421) |
Net increase (decrease) in net assets resulting from share transactions | 605,395 | (462,512) |
Total increase (decrease) in net assets | (2,928,273) | 2,013,264 |
| | |
Net Assets | | |
Beginning of period | 31,789,024 | 29,775,760 |
End of period (including distributions in excess of net investment income of $790 and undistributed net investment income of $33,293, respectively) | $ 28,860,751 | $ 31,789,024 |
Other Information Shares | | |
Sold | 109,956 | 95,778 |
Issued in reinvestment of distributions | 108,570 | 20,723 |
Redeemed | (201,011) | (128,848) |
Net increase (decrease) | 17,515 | (12,347) |
See accompanying notes which are an integral part of the financial statements.
Annual Report
Financial Highlights
Years ended July 31, | 2006 | 2005 | 2004 | 2003 | 2002 |
Selected Per-Share Data | | | | | |
Net asset value, beginning of period | $ 38.42 | $ 35.46 | $ 32.84 | $ 31.61 | $ 39.10 |
Income from Investment Operations | | | | | |
Net investment income (loss) B | .34 | .60 C | .40 | .40 | .34 |
Net realized and unrealized gain (loss) | .18 | 3.31 | 2.63 | 1.20 | (7.12) |
Total from investment operations | .52 | 3.91 | 3.03 | 1.60 | (6.78) |
Distributions from net investment income | (.38) | (.61) | (.41) | (.37) | (.33) |
Distributions from net realized gain | (4.40) | (.34) | - | - | (.38) |
Total distributions | (4.78) | (.95) | (.41) | (.37) | (.71) |
Net asset value, end of period | $ 34.16 | $ 38.42 | $ 35.46 | $ 32.84 | $ 31.61 |
Total Return A | 1.22% | 11.15% | 9.24% | 5.15% | (17.56)% |
Ratios to Average Net Assets D | | | | | |
Expenses before reductions | .69% | .69% | .70% | .73% | .69% |
Expenses net of fee waivers, if any | .69% | .69% | .70% | .73% | .69% |
Expenses net of all reductions | .65% | .68% | .69% | .71% | .68% |
Net investment income (loss) | .94% | 1.63% C | 1.13% | 1.29% | .94% |
Supplemental Data | | | | | |
Net assets, end of period (in millions) | $ 28,861 | $ 31,789 | $ 29,776 | $ 28,263 | $ 27,849 |
Portfolio turnover rate | 120% | 31% | 30% | 33% | 36% |
A Total returns would have been lower had certain expenses not been reduced during the periods shown.
B Calculated based on average shares outstanding during the period.
C Investment income per share reflects a special dividend which amounted to $.13 per share. Excluding the special dividend, the ratio of net investment income (loss) to average net assets would have been 1.27%.
D Expense ratios reflect operating expenses of the Fund. Expenses before reductions do not reflect amounts reimbursed by the investment adviser or reductions from brokerage service arrangements or other expense offset arrangements and do not represent the amount paid by the Fund during periods when reimbursements or reductions occur. Expenses net of fee waivers reflect expenses after reimbursement by the investment adviser but prior to reductions from brokerage service arrangements or other expense offset arrangements. Expenses net of all reductions represent the net expenses paid by the Fund.
See accompanying notes which are an integral part of the financial statements.
Annual Report
Notes to Financial Statements
For the period ended July 31, 2006
(Amounts in thousands except ratios)
1. Significant Accounting Policies.
Fidelity Growth & Income Portfolio (the Fund) is a fund of Fidelity Securities Fund (the trust) and is authorized to issue an unlimited number of shares. The trust is registered under the Investment Company Act of 1940, as amended (the 1940 Act), as an open-end management investment company organized as a Massachusetts business trust. The financial statements have been prepared in conformity with accounting principles generally accepted in the United States of America, which require management to make certain estimates and assumptions at the date of the financial statements. The following summarizes the significant accounting policies of the Fund:
Security Valuation. Investments are valued and net asset value (NAV) per share is calculated (NAV calculation) as of the close of business of the New York Stock Exchange (NYSE), normally 4:00 p.m. Eastern time. Wherever possible, the Fund uses independent pricing services approved by the Board of Trustees to value its investments.
Equity securities, including restricted securities, for which market quotations are readily available, are valued at the last reported sale price or official closing price as reported by an independent pricing service on the primary market or exchange on which they are traded. In the event there were no sales during the day or closing prices are not available, securities are valued at the last quoted bid price. Investments in open-end mutual funds are valued at their closing net asset value each business day. Short-term securities with remaining maturities of sixty days or less for which quotations are not readily available are valued at amortized cost, which approximates value.
When current market prices or quotations are not readily available or do not accurately reflect fair value, valuations may be determined in accordance with procedures adopted by the Board of Trustees. For example, when developments occur between the close of a market and the close of the NYSE that may materially affect the value of some or all of the securities, or when trading in a security is halted, those securities may be fair valued. Factors used in the determination of fair value may include monitoring news to identify significant market or security specific events such as changes in the value of U.S. securities markets, reviewing developments in foreign markets and evaluating the performance of ADRs, futures contracts and exchange-traded funds. Because the Fund's utilization of fair value pricing depends on market activity, the frequency with which fair value pricing is used can not be predicted and may be utilized to a significant extent. The value of securities used for NAV calculation under fair value pricing may differ from published prices for the same securities.
Foreign Currency. The Fund uses foreign currency contracts to facilitate transactions in foreign-denominated securities. Losses from these transactions may arise from changes in the value of the foreign currency or if the counterparties do not perform under the contracts' terms.
Annual Report
Notes to Financial Statements - continued
(Amounts in thousands except ratios)
1. Significant Accounting Policies - continued
Foreign Currency - continued
Foreign-denominated assets, including investment securities, and liabilities are translated into U.S. dollars at the exchange rate at period end. Purchases and sales of investment securities, income and dividends received and expenses denominated in foreign currencies are translated into U.S. dollars at the exchange rate in effect on the transaction date.
The effects of exchange rate fluctuations on investments are included with the net realized and unrealized gain (loss) on investment securities. Other foreign currency transactions resulting in realized and unrealized gain (loss) are disclosed separately.
Investment Transactions and Income. Security transactions are accounted for as of trade date. Gains and losses on securities sold are determined on the basis of identified cost and may include proceeds received from litigation. Dividend income is recorded on the ex-dividend date, except for certain dividends from foreign securities where the ex-dividend date may have passed, which are recorded as soon as the Fund is informed of the ex-dividend date. Non-cash dividends included in dividend income, if any, are recorded at the fair market value of the securities received. Distributions received on securities that represent a return of capital or capital gain are recorded as a reduction of cost of investments and/or as a realized gain. The Fund estimates the components of distributions received that may be considered return of capital distributions or capital gain distributions. Interest income is accrued as earned. Interest income includes coupon interest and amortization of premium and accretion of discount on debt securities. Investment income is recorded net of foreign taxes withheld where recovery of such taxes is uncertain.
Expenses. Most expenses of the trust can be directly attributed to a fund. Expenses which cannot be directly attributed are apportioned among each Fund in the trust. Expense estimates are accrued in the period to which they relate and adjustments are made when actual amounts are known.
Deferred Trustee Compensation. Under a Deferred Compensation Plan (the Plan), Independent Trustees must defer receipt of a portion of, and may elect to defer receipt of an additional portion of, their annual compensation. Deferred amounts are invested in a cross-section of Fidelity funds, are marked-to-market and remain in the Fund until distributed in accordance with the Plan. The investment of deferred amounts and the offsetting payable to the Trustees are included in the accompanying Statement of Assets and Liabilities.
Income Tax Information and Distributions to Shareholders. Each year, the Fund intends to qualify as a regulated investment company by distributing all of its taxable
Annual Report
1. Significant Accounting Policies - continued
Income Tax Information and Distributions to Shareholders - continued
income and realized gains under Subchapter M of the Internal Revenue Code. As a result, no provision for income taxes is required in the accompanying financial statements. Foreign taxes are provided for based on the Fund's understanding of the tax rules and rates that exist in the foreign markets in which it invests.
Distributions are recorded on the ex-dividend date. Income and capital gain distributions are determined in accordance with income tax regulations, which may differ from generally accepted accounting principles. In addition, the Fund will claim a portion of the payment made to redeeming shareholders as a distribution for income tax purposes.
Capital accounts within the financial statements are adjusted for permanent book-tax differences. These adjustments have no impact on net assets or the results of operations. Temporary book-tax differences will reverse in a subsequent period.
Book-tax differences are primarily due to foreign currency transactions, deferred trustees compensation and losses deferred due to wash sales.
The tax-basis components of distributable earnings and the federal tax cost as of period end were as follows:
Unrealized appreciation | $ 4,188,096 |
Unrealized depreciation | (1,486,893) |
Net unrealized appreciation (depreciation) | 2,701,203 |
Undistributed ordinary income | 73,568 |
Undistributed long-term capital gain | 4,757,058 |
Cost for federal income tax purposes | $ 26,578,207 |
The tax character of distributions paid was as follows:
| July 31, 2006 | July 31, 2005 |
Ordinary Income | $ 320,403 | $ 507,409 |
Long-term Capital Gains | 3,635,165 | 283,191 |
Total | $ 3,955,568 | $ 790,600 |
New Accounting Pronouncement. In July 2006, Financial Accounting Standards Board Interpretation No. 48, Accounting for Uncertainty in Income Taxes - an interpretation of FASB Statement 109 (FIN 48) was issued and is effective for fiscal years beginning after December 15, 2006. FIN 48 sets forth a threshold for financial statement recognition, measurement and disclosure of a tax position taken or expected to be taken on a tax return. Management is currently evaluating the impact, if any, the adoption of FIN 48 will have on the Fund's net assets and results of operations.
Annual Report
Notes to Financial Statements - continued
(Amounts in thousands except ratios)
2. Operating Policies.
Repurchase Agreements. FMR has received an Exemptive Order from the Securities and Exchange Commission (the SEC) which permits the Fund and other affiliated entities of FMR to transfer uninvested cash balances into joint trading accounts which are then invested in repurchase agreements. The Fund may also invest directly with institutions in repurchase agreements. Repurchase agreements are collateralized by government or non-government securities. Upon settlement date, collateral is held in segregated accounts with custodian banks and may be obtained in the event of a default of the counterparty. The Fund monitors, on a daily basis, the value of the collateral to ensure it is at least equal to the principal amount of the repurchase agreement (including accrued interest). In the event of a default by the counterparty, realization of the collateral proceeds could be delayed, during which time the value of the collateral may decline.
Futures Contracts. The Fund may use futures contracts to manage its exposure to the stock and bond markets and to fluctuations in interest rates and currency values. Buying futures tends to increase a fund's exposure to the underlying instrument, while selling futures tends to decrease a fund's exposure to the underlying instrument or hedge other fund investments. Upon entering into a futures contract, a fund is required to deposit with a clearing broker, no later than the following business day, an amount ("initial margin") equal to a certain percentage of the face value of the contract. The initial margin may be in the form of cash or securities and is transferred to a segregated account on settlement date. Subsequent payments ("variation margin") are made or received by a fund depending on the daily fluctuations in the value of the futures contract and are accounted for as unrealized gains or losses. Realized gains (losses) are recorded upon the expiration or closing of the futures contract. Securities deposited to meet margin requirements are identified in the Schedule of Investments. Losses may arise from changes in the value of the underlying instruments or if the counterparties do not perform under the contract's terms. Futures contracts are valued at the settlement price established each day by the board of trade or exchange on which they are traded.
Restricted Securities. The Fund may invest in securities that are subject to legal or contractual restrictions on resale. These securities generally may be resold in transactions exempt from registration or to the public if the securities are registered. Disposal of these securities may involve time-consuming negotiations and expense, and prompt sale at an acceptable price may be difficult. Information regarding restricted securities is included at the end of the fund's Schedule of Investments.
3. Purchases and Sales of Investments.
Purchases and sales of securities, other than short-term securities, aggregated $36,300,079 and $39,092,417, respectively.
Annual Report
4. Fees and Other Transactions with Affiliates.
Management Fee. FMR and its affiliates provide the Fund with investment management related services for which the Fund pays a monthly management fee. The management fee is the sum of an individual fund fee rate that is based on an annual rate of .20% of the Fund's average net assets and a group fee rate that averaged ..27% during the period. The group fee rate is based upon the average net assets of all the mutual funds advised by FMR. The group fee rate decreases as assets under management increase and increases as assets under management decrease. For the period, the total annual management fee rate was .47% of the Fund's average net assets.
Transfer Agent Fees. Fidelity Service Company, Inc. (FSC), an affiliate of FMR, is the Fund's transfer, dividend disbursing and shareholder servicing agent. FSC receives account fees and asset-based fees that vary according to account size and type of account. FSC pays for typesetting, printing and mailing of shareholder reports, except proxy statements. For the period, the transfer agent fees were equivalent to an annual rate of .20% of average net assets.
Accounting and Security Lending Fees. FSC maintains the Fund's accounting records. The accounting fee is based on the level of average net assets for the month. Under a separate contract, FSC administers the security lending program. The security lending fee is based on the number and duration of lending transactions.
Affiliated Central Funds. The Fund may invest in Money Market Central Funds which seek preservation of capital and current income and are managed by Fidelity Investments Money Management, Inc. (FIMM), an affiliate of FMR.
The Money Market Central Funds do not pay a management fee.
Brokerage Commissions. The Fund placed a portion of its portfolio transactions with brokerage firms which are affiliates of the investment adviser. The commissions paid to these affiliated firms were $414 for the period.
Interfund Lending Program. Pursuant to an Exemptive Order issued by the SEC, the Fund, along with other registered investment companies having management contracts with FMR, may participate in an interfund lending program. This program provides an alternative credit facility allowing the Funds to borrow from, or lend money to, other participating affiliated funds. The Fund's activity in this program during the period for which loans were outstanding was as follows:
Borrower or Lender | Average Daily
Loan Balance | Weighted Average
Interest Rate | Interest
Expense |
Borrower | $ 54,285 | 4.86% | $ 117 |
Annual Report
Notes to Financial Statements - continued
(Amounts in thousands except ratios)
5. Committed Line of Credit.
The Fund participates with other funds managed by FMR in a $4.2 billion credit facility (the "line of credit") to be utilized for temporary or emergency purposes to fund shareholder redemptions or for other short-term liquidity purposes. The Fund has agreed to pay commitment fees on its pro rata portion of the line of credit, which amounts to $89 and is reflected in Miscellaneous Expense on the Statement of Operations. During the period, there were no borrowings on this line of credit.
6. Security Lending.
The Fund lends portfolio securities from time to time in order to earn additional income. On the settlement date of the loan, the Fund receives collateral (in the form of U.S. Treasury obligations, letters of credit and/or cash) against the loaned securities and maintains collateral in an amount not less than 100% of the market value of the loaned securities during the period of the loan. The market value of the loaned securities is determined at the close of business of the Fund and any additional required collateral is delivered to the Fund on the next business day. If the borrower defaults on its obligation to return the securities loaned because of insolvency or other reasons, a fund could experience delays and costs in recovering the securities loaned or in gaining access to the collateral. Any cash collateral received is invested in the Fidelity Securities Lending Cash Central Fund. The value of loaned securities and cash collateral at period end are disclosed on the Fund's Statement of Assets and Liabilities. Security lending income represents the income earned on investing cash collateral, less fees and expenses associated with the loan, plus any premium payments that may be received on the loan of certain types of securities. Security lending income is presented in the Statement of Operations as a component of income from affiliated central funds. Net income from lending portfolio securities during the period amounted to $6,770.
7. Bank Borrowings.
The Fund is permitted to have bank borrowings for temporary or emergency purposes to fund shareholder redemptions. The Fund has established borrowing arrangements with certain banks. The interest rate on the borrowings is the bank's base rate, as revised from time to time. The average daily loan balance during the period for which loans were outstanding amounted to $5,498. The weighted average interest rate was 3.75%.
8. Expense Reductions.
Many of the brokers with whom FMR places trades on behalf of the Fund provided services to the Fund in addition to trade execution. These services included payments of certain expenses on behalf of the Fund totaling $8,699 for the period. In addition,
Annual Report
8. Expense Reductions - continued
through arrangements with the Fund's custodian and transfer agent, credits realized as a result of uninvested cash balances were used to reduce the Fund's expenses. During the period, these credits reduced the Fund's custody and transfer agent expenses by $20 and $987, respectively.
9. Other.
The Fund's organizational documents provide former and current trustees and officers with a limited indemnification against liabilities arising in connection with the performance of their duties to the Fund. In the normal course of business, the Fund may also enter into contracts that provide general indemnifications. The Fund's maximum exposure under these arrangements is unknown as this would be dependent on future claims that may be made against the Fund. The risk of material loss from such claims is considered remote.
Annual Report
Report of Independent Registered Public Accounting Firm
To the Trustees of Fidelity Securities Fund and the Shareholders of Fidelity Growth & Income Portfolio:
In our opinion, the accompanying statement of assets and liabilities, including the schedule of investments, and the related statements of operations and of changes in net assets and the financial highlights present fairly, in all material respects, the financial position of Fidelity Growth & Income Portfolio (a fund of Fidelity Securities Fund) at July 31, 2006, and the results of its operations for the year then ended, the changes in its net assets for each of the two years in the period then ended and the financial highlights for each of the five years in the period then ended, in conformity with accounting principles generally accepted in the United States of America. These financial statements and financial highlights (hereafter referred to as "financial statements") are the responsibility of the Fidelity Growth & Income Portfolio's management; our responsibility is to express an opinion on these financial statements based on our audits. We conducted our audits of these financial statements in accordance with the standards of the Public Company Accounting Oversight Board (United States). Those standards require that we plan and perform the audit to obtain reasonable assurance about whether the financial statements are free of material misstatement. An audit includes examining, on a test basis, evidence supporting the amounts and disclosures in the financial statements, assessing the accounting principles used and significant estimates made by management, and evaluating the overall financial statement presentation. We believe that our audits, which included confirmation of securities at July 31, 2006 by correspondence with the custodian and brokers, provide a reasonable basis for our opinion.
/s/ PricewaterhouseCoopers LLP
PricewaterhouseCoopers LLP
Boston, Massachusetts
September12, 2006
Annual Report
Trustees and Officers
The Trustees, Members of the Advisory Board, and executive officers of the trust and fund, as applicable, are listed below. The Board of Trustees governs the fund and is responsible for protecting the interests of shareholders. The Trustees are experienced executives who meet periodically throughout the year to oversee the fund's activities, review contractual arrangements with companies that provide services to the fund, and review the fund's performance. Except for William O. McCoy and Albert R. Gamper, Jr., each of the Trustees oversees 345 funds advised by FMR or an affiliate. Mr. McCoy oversees 347 funds advised by FMR or an affiliate. Mr. Gamper oversees 292 funds advised by FMR or an affiliate.
The Trustees hold office without limit in time except that (a) any Trustee may resign; (b) any Trustee may be removed by written instrument, signed by at least two-thirds of the number of Trustees prior to such removal; (c) any Trustee who requests to be retired or who has become incapacitated by illness or injury may be retired by written instrument signed by a majority of the other Trustees; and (d) any Trustee may be removed at any special meeting of shareholders by a two-thirds vote of the outstanding voting securities of the trust. Each Trustee who is not an interested person (as defined in the 1940 Act) (Independent Trustee), shall retire not later than the last day of the calendar year in which his or her 72nd birthday occurs. The Independent Trustees may waive this mandatory retirement age policy with respect to individual Trustees. The executive officers and Advisory Board Members hold office without limit in time, except that any officer and Advisory Board Member may resign or may be removed by a vote of a majority of the Trustees at any regular meeting or any special meeting of the Trustees. Except as indicated, each individual has held the office shown or other offices in the same company for the past five years.
The fund's Statement of Additional Information (SAI) includes more information about the Trustees. To request a free copy, call Fidelity at 1-800-544-8544.
Interested Trustees*:
Correspondence intended for each Trustee who is an interested person may be sent to Fidelity Investments, 82 Devonshire Street, Boston, Massachusetts 02109.
Name, Age; Principal Occupation |
Edward C. Johnson 3d (76) |
| Year of Election or Appointment: 1984 Mr. Johnson is Chairman of the Board of Trustees. Mr. Johnson serves as President (2006-present), Chief Executive Officer, Chairman, and a Director of FMR Corp.; Chairman and a Director of FMR; Chairman and a Director of Fidelity Research & Analysis Company (FRAC); Chairman and a Director of Fidelity Investments Money Management, Inc.; and Chairman (2001-present) and a Director (1999-present) of FMR Co., Inc. In addition, Mr. Johnson serves as Chairman and Director of Fidelity International Limited (FIL). |
Stephen P. Jonas (53) |
| Year of Election or Appointment: 2005 Mr. Jonas is Senior Vice President of Growth & Income (2005-present). He also serves as Senior Vice President of other Fidelity funds (2005-present). Mr. Jonas is Executive Director of FMR (2005-present) and FMR Co., Inc. (2005-present). He also serves as a Director of Fidelity Investments Money Management, Inc. (2005-present) and FMR Corp. (2003-present). Previously, Mr. Jonas served as President of Fidelity Enterprise Operations and Risk Services (2004-2005), Chief Administrative Officer (2002-2004), and Chief Financial Officer of FMR Corp. (1998-2002). In addition, he serves on the Boards of Boston Ballet (2003-present) and Simmons College (2003-present). |
Robert L. Reynolds (54) |
| Year of Election or Appointment: 2003 Mr. Reynolds is President and a Director of FMR (2005-present), Fidelity Investments Money Management, Inc. (2005-present), and FMR Co., Inc. (2005-present). Mr. Reynolds also serves as a Director (2003-present) and Chief Operating Officer (2000-present) of FMR Corp. and a Director of Strategic Advisers, Inc. (2005-present). He also serves on the Board at Fidelity Investments Canada, Ltd. (2000-present). Previously, Mr. Reynolds served as President of Fidelity Investments Institutional Retirement Group (1996-2000). |
* Trustees have been determined to be "Interested Trustees" by virtue of, among other things, their affiliation with the trust or various entities under common control with FMR.
Annual Report
Independent Trustees:
Correspondence intended for each Independent Trustee (that is, the Trustees other than the Interested Trustees) may be sent to Fidelity Investments, P.O. Box 55235, Boston, Massachusetts 02205-5235.
Name, Age; Principal Occupation |
Dennis J. Dirks (58) |
| Year of Election or Appointment: 2005 Prior to his retirement in May 2003, Mr. Dirks was Chief Operating Officer and a member of the Board of The Depository Trust & Clearing Corporation (DTCC) (1999-2003). He also served as President, Chief Operating Officer, and Board member of The Depository Trust Company (DTC) (1999-2003) and President and Board member of the National Securities Clearing Corporation (NSCC) (1999-2003). In addition, Mr. Dirks served as Chief Executive Officer and Board member of the Government Securities Clearing Corporation (2001-2003) and Chief Executive Officer and Board member of the Mortgage-Backed Securities Clearing Corporation (2001-2003). Mr. Dirks also serves as a Trustee and a member of the Finance Committee of Manhattan College (2005-present) and a Trustee and a member of the Finance Committee of AHRC of Nassau County (2006-present). |
Albert R. Gamper, Jr. (64) |
| Year of Election or Appointment: 2006 Mr. Gamper also serves as a Trustee (2006-present) or Member of the Advisory Board (2005-present) of other investment companies advised by FMR. Prior to his retirement in December 2004, Mr. Gamper served as Chairman of the Board of CIT Group Inc. (commercial finance). During his tenure with CIT Group Inc. Mr. Gamper served in numerous senior management positions, including Chairman (1987-1989; 1999-2001; 2002-2004), Chief Executive Officer (1987-2004), and President (1989-2002). He currently serves as a member of the Board of Directors of Public Service Enterprise Group (utilities, 2001-present), Chairman of the Board of Governors, Rutgers University (2004-present), and Chairman of the Board of Saint Barnabas Health Care System. |
Robert M. Gates (62) |
| Year of Election or Appointment: 1997 Dr. Gates is Chairman of the Independent Trustees (2006-present). Dr. Gates is President of Texas A&M University (2002-present). He was Director of the Central Intelligence Agency (CIA) from 1991 to 1993. From 1989 to 1991, Dr. Gates served as Assistant to the President of the United States and Deputy National Security Advisor. Dr. Gates is a Director of NACCO Industries, Inc. (mining and manufacturing), Parker Drilling Co., Inc. (drilling and rental tools for the energy industry, 2001-present), and Brinker International (restaurant management, 2003-present). Previously, Dr. Gates served as a Director of LucasVarity PLC (automotive components and diesel engines), a Director of TRW Inc. (automotive, space, defense, and information technology), and Dean of the George Bush School of Government and Public Service at Texas A&M University (1999-2001). |
George H. Heilmeier (70) |
| Year of Election or Appointment: 2004 Dr. Heilmeier is Chairman Emeritus of Telcordia Technologies (communication software and systems), where prior to his retirement, he served as company Chairman and Chief Executive Officer. He currently serves on the Boards of Directors of The Mitre Corporation (systems engineering and information technology support for the government), and HRL Laboratories (private research and development, 2004-present). He is Chairman of the General Motors Science & Technology Advisory Board and a Life Fellow of the Institute of Electrical and Electronics Engineers (IEEE). Dr. Heilmeier is a member of the Defense Science Board and the National Security Agency Advisory Board. He is also a member of the National Academy of Engineering, the American Academy of Arts and Sciences, and the Board of Overseers of the School of Engineering and Applied Science of the University of Pennsylvania. Previously, Dr. Heilmeier served as a Director of TRW Inc. (automotive, space, defense, and information technology, 1992-2002), Compaq (1994-2002), Automatic Data Processing, Inc. (ADP) (technology-based business outsourcing, 1995-2002), INET Technologies Inc. (telecommunications network surveillance, 2001-2004), and Teletech Holdings (customer management services). He is the recipient of the 2005 Kyoto Prize in Advanced Technology for his invention of the liquid crystal display. |
Marie L. Knowles (59) |
| Year of Election or Appointment: Prior to Ms. Knowles' retirement in June 2000, she served as Executive Vice President and Chief Financial Officer of Atlantic Richfield Company (ARCO) (diversified energy, 1996-2000). From 1993 to 1996, she was a Senior Vice President of ARCO and President of ARCO Transportation Company. She served as a Director of ARCO from 1996 to 1998. She currently serves as a Director of Phelps Dodge Corporation (copper mining and manufacturing) and McKesson Corporation (healthcare service, 2002-present). Ms. Knowles is a Trustee of the Brookings Institution and the Catalina Island Conservancy and also serves as a member of the Advisory Board for the School of Engineering of the University of Southern California. |
Ned C. Lautenbach (62) |
| Year of Election or Appointment: 2000 Mr. Lautenbach has been a partner of Clayton, Dubilier & Rice, Inc. (private equity investment firm) since September 1998. Previously, Mr. Lautenbach was with the International Business Machines Corporation (IBM) from 1968 until his retirement in 1998. Mr. Lautenbach serves as a Director of Italtel Holding S.p.A. (telecommunications (Milan, Italy), 2004-present) and Eaton Corporation (diversified industrial) as well as the Philharmonic Center for the Arts in Naples, Florida. He also is a member of the Board of Trustees of Fairfield University (2005-present), as well as a member of the Council on Foreign Relations. |
William O. McCoy (72) |
| Year of Election or Appointment: 1997 Prior to his retirement in December 1994, Mr. McCoy was Vice Chairman of the Board of BellSouth Corporation (telecommunications) and President of BellSouth Enterprises. He is currently a Director of Duke Realty Corporation (real estate). He is also a partner of Franklin Street Partners (private investment management firm). In addition, Mr. McCoy served as the Interim Chancellor (1999-2000) and a member of the Board of Visitors for the University of North Carolina at Chapel Hill and currently serves as Chairman of the Board of Directors of the University of North Carolina Health Care System. He also served as Vice President of Finance for the University of North Carolina (16-school system). |
Cornelia M. Small (62) |
| Year of Election or Appointment: 2005 Ms. Small is a member (2000-present) and Chairperson (2002-present) of the Investment Committee, and a member (2002-present) of the Board of Trustees of Smith College. Previously, she served as Chief Investment Officer (1999-2000), Director of Global Equity Investments (1996-1999), and a member of the Board of Directors of Scudder, Stevens & Clark (1990-1997) and Scudder Kemper Investments (1997-1999). In addition, Ms. Small served as Co-Chair (2000-2003) of the Annual Fund for the Fletcher School of Law and Diplomacy. |
William S. Stavropoulos (67) |
| Year of Election or Appointment: 2001 Mr. Stavropoulos is Chairman Emeritus of the Board of Directors of The Dow Chemical Company. Since joining The Dow Chemical Company in 1967, Mr. Stavropoulos served in numerous senior management positions, including President (1993-2000; 2002-2003), CEO (1995-2000; 2002-2004), and Chairman of the Executive Committee (2000-2004). Currently, he is a Director of NCR Corporation (data warehousing and technology solutions), BellSouth Corporation (telecommunications), Chemical Financial Corporation, Maersk Inc. (industrial conglomerate, 2002-present), and Metalmark Capital (private equity investment firm, 2005-present). He also serves as a member of the Board of Trustees of the American Enterprise Institute for Public Policy Research. In addition, Mr. Stavropoulos is a member of The Business Council, J.P. Morgan International Council and the University of Notre Dame Advisory Council for the College of Science. |
Kenneth L. Wolfe (67) |
| Year of Election or Appointment: 2005 Prior to his retirement in 2001, Mr. Wolfe was Chairman and Chief Executive Officer of Hershey Foods Corporation (1993-2001). He currently serves as a member of the boards of Adelphia Communications Corporation (2003-present), Bausch & Lomb, Inc., and Revlon Inc. (2004-present). |
Annual Report
Advisory Board Members and Executive Officers:
Correspondence intended for Mr. Keyes may be sent to Fidelity Investments, P.O. Box 55235, Boston, Massachusetts 02205-5235. Correspondence intended for each executive officer and Mr. Lynch may be sent to Fidelity Investments, 82 Devonshire Street, Boston, Massachusetts 02109.
Name, Age; Principal Occupation |
James H. Keyes (65) |
| Year of Election or Appointment: 2006 Member of the Advisory Board of Fidelity Securities Fund. Prior to his retirement in 2003, Mr. Keyes was Chairman, President, and Chief Executive Officer of Johnson Controls, Inc. (automotive supplier, 1993-2003). He currently serves as a member of the boards of LSI Logic Corporation (semiconductor technologies, 1984-present), Navistar International Corporation (manufacture and sale of trucks, buses, and diesel engines, 2002-present), and Pitney Bowes, Inc. (integrated mail, messaging, and document management solutions, 1998-present). |
Peter S. Lynch (62) |
| Year of Election or Appointment: 2003 Member of the Advisory Board of Fidelity Securities Fund. Mr. Lynch is Vice Chairman and a Director of FMR, and Vice Chairman (2001-present) and a Director (1999-present) of FMR Co., Inc. Previously, Mr. Lynch served as a Trustee of the Fidelity funds (1990-2003). In addition, he serves as the Chairman of the Inner-City Scholarship Fund. |
Philip L. Bullen (46) |
| Year of Election or Appointment: 2006 Vice President of Growth & Income. Mr. Bullen also serves as Vice President of certain Equity Funds (2006-present). Mr. Bullen is Senior Vice President of FMR (2001-present) and FMR Co., Inc. (2001-present). Previously, Mr. Bullen served as President and a Director of Fidelity Research & Analysis Company (2001-2005), President and a Director of Fidelity Management & Research (U.K.) Inc. (2002-2006), and a Director of Strategic Advisers, Inc. (2002-2005). |
Dwight D. Churchill (52) |
| Year of Election or Appointment: 2005 Vice President of Growth & Income. Mr. Churchill also serves as Vice President of certain Equity Funds (2005-present). Mr. Churchill is Executive Vice President of FMR (2005-present) and FMR Co., Inc. (2005-present). Previously, Mr. Churchill served as Senior Vice President of Fidelity Investments Money Management, Inc. (2005-2006), Head of Fidelity's Fixed-Income Division (2000-2005), Vice President of Fidelity's Money Market Funds (2000-2005), Vice President of Fidelity's Bond Funds, and Senior Vice President of FMR. |
Timothy M. Cohen (36) |
| Year of Election or Appointment: 2005 Vice President of Growth & Income. Prior to assuming his current responsibilities, Mr. Cohen worked as an analyst and portfolio manager. Mr. Cohen also serves as Vice President of FMR (2003) and FMR Co., Inc. (2003). |
Eric D. Roiter (57) |
| Year of Election or Appointment: 1998 Secretary of Fidelity Growth & Income Portfolio. He also serves as Secretary of other Fidelity funds; Vice President, General Counsel, and Secretary of FMR Co., Inc. (2001-present) and FMR; Assistant Secretary of Fidelity Management & Research (U.K.) Inc. (2001-present), Fidelity Research & Analysis Company (2001-present), and Fidelity Investments Money Management, Inc. (2001-present). Mr. Roiter is an Adjunct Member, Faculty of Law, at Boston College Law School (2003-present). Previously, Mr. Roiter served as Vice President and Secretary of Fidelity Distributors Corporation (FDC) (1998-2005). |
Stuart Fross (46) |
| Year of Election or Appointment: 2003 Assistant Secretary of Growth & Income. Mr. Fross also serves as Assistant Secretary of other Fidelity funds (2003-present), Vice President and Secretary of FDC (2005-present), and is an employee of FMR. |
Christine Reynolds (47) |
| Year of Election or Appointment: 2004 President and Treasurer of Growth & Income. Ms. Reynolds also serves as President and Treasurer of other Fidelity funds (2004-present) and is a Vice President (2003-present) and an employee (2002-present) of FMR. Before joining Fidelity Investments, Ms. Reynolds worked at PricewaterhouseCoopers LLP (PwC) (1980-2002), where she was most recently an audit partner with PwC's investment management practice. |
R. Stephen Ganis (40) |
| Year of Election or Appointment: 2006 Anti-Money Laundering (AML) officer of Growth & Income. Mr. Ganis also serves as AML officer of other Fidelity funds (2006-present) and FMR Corp. (2003-present). Before joining Fidelity Investments, Mr. Ganis practiced law at Goodwin Procter, LLP (2000-2002). |
Joseph B. Hollis (58) |
| Year of Election or Appointment: 2006 Chief Financial Officer of Growth & Income. Mr. Hollis also serves as Chief Financial Officer of other Fidelity funds. Mr. Hollis is President of Fidelity Pricing and Cash Management Services (FPCMS) (2005-present). Mr. Hollis also serves as President and Director of Fidelity Service Company, Inc. (2006-present). Previously, Mr. Hollis served as Senior Vice President of Cash Management Services (1999-2002) and Investment Management Operations (2002-2005). |
Kenneth A. Rathgeber (59) |
| Year of Election or Appointment: 2004 Chief Compliance Officer of Growth & Income. Mr. Rathgeber also serves as Chief Compliance Officer of other Fidelity funds (2004-present) and Executive Vice President of Risk Oversight for Fidelity Investments (2002-present). He is Chief Compliance Officer of FMR (2005-present), FMR Co., Inc. (2005-present), Fidelity Management & Research (U.K.) Inc. (2005-present), Fidelity Research & Analysis Company (2005-present), Fidelity Investments Money Management, Inc. (2005-present), and Strategic Advisers, Inc. (2005-present). Previously, Mr. Rathgeber served as Executive Vice President and Chief Operating Officer for Fidelity Investments Institutional Services Company, Inc. (1998-2002). |
Bryan A. Mehrmann (45) |
| Year of Election or Appointment: 2005 Deputy Treasurer of Growth & Income. Mr. Mehrmann also serves as Deputy Treasurer of other Fidelity funds (2005-present) and is an employee of FMR. Previously, Mr. Mehrmann served as Vice President of Fidelity Investments Institutional Services Group (FIIS)/Fidelity Investments Institutional Operations Corporation, Inc. (FIIOC) Client Services (1998-2004). |
Kimberley H. Monasterio (42) |
| Year of Election or Appointment: 2004 Deputy Treasurer of Growth & Income. Ms. Monasterio also serves as Deputy Treasurer of other Fidelity funds (2004) and is an employee of FMR (2004). Before joining Fidelity Investments, Ms. Monasterio served as Treasurer (2000-2004) and Chief Financial Officer (2002-2004) of the Franklin Templeton Funds and Senior Vice President of Franklin Templeton Services, LLC (2000-2004). |
Kenneth B. Robins (36) |
| Year of Election or Appointment: 2005 Deputy Treasurer of Growth & Income. Mr. Robins also serves as Deputy Treasurer of other Fidelity funds (2005-present) and is an employee of FMR (2004-present). Before joining Fidelity Investments, Mr. Robins worked at KPMG LLP, where he was a partner in KPMG's department of professional practice (2002-2004) and a Senior Manager (1999-2000). In addition, Mr. Robins served as Assistant Chief Accountant, United States Securities and Exchange Commission (2000-2002). |
Robert G. Byrnes (39) |
| Year of Election or Appointment: 2005 Assistant Treasurer of Growth & Income. Mr. Byrnes also serves as Assistant Treasurer of other Fidelity funds (2005-present) and is an employee of FMR (2005-present). Previously, Mr. Byrnes served as Vice President of FPCMS (2003-2005). Before joining Fidelity Investments, Mr. Byrnes worked at Deutsche Asset Management where he served as Vice President of the Investment Operations Group (2000-2003). |
John H. Costello (59) |
| Year of Election or Appointment: 1986 Assistant Treasurer of Growth & Income. Mr. Costello also serves as Assistant Treasurer of other Fidelity funds and is an employee of FMR. |
Peter L. Lydecker (52) |
| Year of Election or Appointment: 2004 Assistant Treasurer of Growth & Income. Mr. Lydecker also serves as Assistant Treasurer of other Fidelity funds (2004) and is an employee of FMR. |
Mark Osterheld (51) |
| Year of Election or Appointment: 2002 Assistant Treasurer of Growth & Income. Mr. Osterheld also serves as Assistant Treasurer of other Fidelity funds (2002) and is an employee of FMR. |
Gary W. Ryan (47) |
| Year of Election or Appointment: 2005 Assistant Treasurer of Growth & Income. Mr. Ryan also serves as Assistant Treasurer of other Fidelity funds (2005-present) and is an employee of FMR (2005-present). Previously, Mr. Ryan served as Vice President of Fund Reporting in FPCMS (1999-2005). |
Salvatore Schiavone (40) |
| Year of Election or Appointment: 2005 Assistant Treasurer of Growth & Income. Mr. Schiavone also serves as Assistant Treasurer of other Fidelity funds (2005-present) and is an employee of FMR (2005-present). Before joining Fidelity Investments, Mr. Schiavone worked at Deutsche Asset Management, where he most recently served as Assistant Treasurer (2003-2005) of the Scudder Funds and Vice President and Head of Fund Reporting (1996-2003). |
Annual Report
Distributions
The Board of Trustees of Fidelity Growth & Income Portfolio voted to pay on September 7, 2006, to shareholders of record at the opening of business on September 6, 2006, a distribution of $5.80 per share derived from capital gains realized from sales of portfolio securities.
The fund hereby designates as a capital gain dividend with respect to the taxable year ended July 31, 2006, $7,454,123,000, or, if subsequently determined to be different, the net capital gain of such year.
A total of 0.08% of the dividends distributed during the fiscal year was derived from interest on U.S. Government securities which is generally exempt from state income tax.
The fund designates 100% of the dividends distributed during the fiscal year as qualifying for the dividends-received deduction for corporate shareholders.
The fund designates 100% of the dividends distributed during the fiscal year as amounts which may be taken into account as a dividend for the purposes of the maximum rate under section 1(h)(11) of the Internal Revenue Code.
The fund will notify shareholders in January 2007 of amounts for use in preparing 2006 income tax returns.
Annual Report
Proxy Voting Results
A special meeting of the fund's shareholders was held on May 17, 2006. The results of votes taken among shareholders on the proposal before them are reported below. Each vote reported represents one dollar of net asset value held on the record date for the meeting.
PROPOSAL 1 |
To elect a Board of Trustees. A |
| # of
Votes | % of
Votes |
Dennis J. Dirks |
Affirmative | 43,119,905,166.54 | 95.455 |
Withheld | 2,053,001,967.67 | 4.545 |
TOTAL | 45,172,907,134.21 | 100.000 |
Albert R. Gamper, Jr. |
Affirmative | 43,068,780,128.62 | 95.342 |
Withheld | 2,104,127,005.59 | 4.658 |
TOTAL | 45,172,907,134.21 | 100.000 |
Robert M. Gates |
Affirmative | 43,032,117,662.60 | 95.261 |
Withheld | 2,140,789,471.61 | 4.739 |
TOTAL | 45,172,907,134.21 | 100.000 |
George H. Heilmeier |
Affirmative | 43,023,368,882.30 | 95.242 |
Withheld | 2,149,538,251.91 | 4.758 |
TOTAL | 45,172,907,134.21 | 100.000 |
Edward C. Johnson 3d |
Affirmative | 42,881,915,819.70 | 94.928 |
Withheld | 2,290,991,314.51 | 5.072 |
TOTAL | 45,172,907,134.21 | 100.000 |
Stephen P. Jonas |
Affirmative | 43,081,912,066.37 | 95.371 |
Withheld | 2,090,995,067.84 | 4.629 |
TOTAL | 45,172,907,134.21 | 100.000 |
James H. KeyesB |
Affirmative | 43,049,050,093.79 | 95.298 |
Withheld | 2,123,857,040.42 | 4.702 |
TOTAL | 45,172,907,134.21 | 100.000 |
Marie L. Knowles |
Affirmative | 43,090,434,696.02 | 95.390 |
Withheld | 2,082,472,438.19 | 4.610 |
TOTAL | 45,172,907,134.21 | 100.000 |
| # of
Votes | % of
Votes |
Ned C. Lautenbach |
Affirmative | 43,082,185,255.05 | 95.372 |
Withheld | 2,090,721,879.16 | 4.628 |
TOTAL | 45,172,907,134.21 | 100.000 |
William O. McCoy |
Affirmative | 42,960,162,066.32 | 95.102 |
Withheld | 2,212,745,067.89 | 4.898 |
TOTAL | 45,172,907,134.21 | 100.000 |
Robert L. Reynolds |
Affirmative | 43,087,560,419.66 | 95.384 |
Withheld | 2,085,346,714.55 | 4.616 |
TOTAL | 45,172,907,134.21 | 100.000 |
Cornelia M. Small |
Affirmative | 43,092,070,014.53 | 95.394 |
Withheld | 2,080,837,119.68 | 4.606 |
TOTAL | 45,172,907,134.21 | 100.000 |
William S. Stavropoulos |
Affirmative | 43,002,032,676.43 | 95.194 |
Withheld | 2,170,874,457.78 | 4.806 |
TOTAL | 45,172,907,134.21 | 100.000 |
Kenneth L. Wolfe |
Affirmative | 43,047,241,852.81 | 95.294 |
Withheld | 2,125,665,281.40 | 4.706 |
TOTAL | 45,172,907,134.21 | 100.000 |
A Denotes trust-wide proposal and voting results. B Effective on or about January 1, 2007. |
Annual Report
Board Approval of Investment Advisory Contracts and Management Fees
Fidelity Growth & Income Portfolio
Each year, typically in July, the Board of Trustees, including the Independent Trustees (together, the Board), votes on the renewal of the management contract and sub-advisory agreements (together, the Advisory Contracts) for the fund. The Board, assisted by the advice of fund counsel and Independent Trustees' counsel, requests and considers a broad range of information throughout the year.
The Board meets regularly each month except August and takes into account throughout the year matters bearing on Advisory Contracts. The Board, acting directly and through its separate committees, considers at each of its meetings factors that are relevant to the annual renewal of the fund's Advisory Contracts, including the services and support provided to the fund and its shareholders. At the time of the renewal, the Board had 12 standing committees, each composed of Independent Trustees with varying backgrounds, to which the Board has assigned specific subject matter responsibilities in order to enhance effective decision-making by the Board. Each committee has adopted a written charter outlining the structure and purposes of the committee. One such committee, the Equity Contract Committee, meets periodically as needed throughout the year to consider matters specifically related to the annual renewal of Advisory Contracts. The committee requests and receives information on, and makes recommendations to the Independent Trustees concerning, the approval and annual review of the Advisory Contracts.
At its July 2006 meeting, the Board of Trustees, including the Independent Trustees, unanimously determined to renew the Advisory Contracts for the fund. In reaching its determination, the Board considered all factors it believed relevant, including (i) the nature, extent, and quality of the services to be provided to the fund and its shareholders (including the investment performance of the fund); (ii) the competitiveness of the management fee and total expenses of the fund; (iii) the total costs of the services to be provided by and the profits to be realized by the investment adviser and its affiliates from the relationship with the fund; (iv) the extent to which economies of scale would be realized as the fund grows; and (v) whether fee levels reflect these economies of scale, if any, for the benefit of fund shareholders.
In determining whether to renew the Advisory Contracts for the fund, the Board ultimately reached a determination, with the assistance of fund counsel and Independent Trustees' counsel, that the renewal of the Advisory Contracts and the compensation to be received by Fidelity under the management contract is consistent with Fidelity's fiduciary duty under applicable law. In addition to evaluating the specific factors noted above, the Board, in reaching its determination, is aware that shareholders in the fund have a broad range of investment choices available to them, including a wide choice among mutual funds offered by competitors to Fidelity, and that the fund's shareholders, with the opportunity to review and weigh the disclosure provided by the fund in its prospectus and other public disclosures, have chosen to invest in this fund, managed by Fidelity.
Annual Report
Nature, Extent, and Quality of Services Provided. The Board considered staffing within the investment adviser, FMR, and the sub-advisers (together, the Investment Advisers), including the background of the fund's portfolio manager and the fund's investment objective and discipline. The Independent Trustees also had discussions with senior management of Fidelity's investment operations and investment groups. The Board considered the structure of the portfolio manager compensation program and whether this structure provides appropriate incentives.
Resources Dedicated to Investment Management and Support Services. The Board reviewed the size, education, and experience of the Investment Advisers' investment staff, their use of technology, and the Investment Advisers' approach to recruiting, training, and retaining portfolio managers and other research, advisory, and management personnel. The Board considered Fidelity's extensive global research capabilities that enable the Investment Advisers to aggregate data from various sources in an effort to produce positive investment results. The Board noted that Fidelity's analysts have access to a variety of technological tools that enable them to perform both fundamental and quantitative analysis and to specialize in various disciplines. The Board also considered that Fidelity's portfolio managers and analysts have access to daily portfolio attribution that allows for monitoring of a fund's portfolio, as well as an electronic communication system that provides immediate real-time access to research concerning issuers and credit enhancers.
Shareholder and Administrative Services. The Board considered (i) the nature, extent, quality, and cost of administrative, distribution, and shareholder services performed by the Investment Advisers and their affiliates under the Advisory Contracts and under separate agreements covering transfer agency, pricing and bookkeeping, and securities lending services for the fund; (ii) the nature and extent of the Investment Advisers' supervision of third party service providers, principally custodians and subcustodians; and (iii) the resources devoted to, and the record of compliance with, the fund's compliance policies and procedures. The Board reviewed the allocation of fund brokerage, including allocations to brokers affiliated with the Investment Advisers, the use of brokerage commissions to pay fund expenses, and the use of "soft" commission dollars to pay for research services. The Board also considered that Fidelity voluntarily pays for market data out of its own resources.
The Board noted that the growth of fund assets across the complex allows Fidelity to reinvest in the development of services designed to enhance the value or convenience of the Fidelity funds as investment vehicles. These services include 24-hour access to account information and market information through phone representatives and over the Internet, and investor education materials and asset allocation tools.
Annual Report
Board Approval of Investment Advisory Contracts and
Management Fees - continued
Investment in a Large Fund Family. The Board considered the benefits to shareholders of investing in a Fidelity fund, including the benefits of investing in a fund that is part of a large family of funds offering a variety of investment disciplines and providing for a large variety of mutual fund investor services. For example, fund shareholders are offered the privilege of exchanging shares of the fund for shares of other Fidelity funds, as set forth in the fund's prospectus, without paying a sales charge. The Board noted that, since the last Advisory Contract renewals in July 2005, Fidelity has taken a number of actions that benefited particular funds, including (i) dedicating additional resources to investment research and to restructure the investment research teams; (ii) voluntarily entering into contractual arrangements with certain brokers pursuant to which Fidelity pays for research products and services separately out of its own resources, rather than bundling with fund commissions; (iii) launching the Fidelity Advantage Class of its five Spartan stock index funds and three Spartan bond index funds, which is a lower-fee class available to shareholders with higher account balances; (iv) contractually agreeing to impose expense limitations on Fidelity U.S. Bond Index Fund and reducing the fund's initial investment minimum; and (v) offering shareholders of each of the Fidelity Institutional Money Market Funds the privilege of exchanging shares of the fund for shares of other Fidelity funds.
Investment Performance and Compliance. The Board considered whether the fund has operated within its investment objective, as well as its record of compliance with its investment restrictions. It also reviewed the fund's absolute investment performance, as well as the fund's relative investment performance measured against (i) a broad-based securities market index, and (ii) a peer group of mutual funds deemed appropriate by the Board over multiple periods. The following charts considered by the Board show, over the one-, three-, and five-year periods ended December 31, 2005, the fund's cumulative total returns, the cumulative total returns of a broad-based securities market index ("benchmark"), and a range of cumulative total returns of a peer group of mutual funds identified by Lipper Inc. as having an investment objective similar to that of the fund. The box within each chart shows the 25th percentile return (bottom of box) and the 75th percentile return (top of box) of the Lipper peer group. Returns shown above the box are in the first quartile and returns shown below the box are in the fourth quartile. The percentage beaten number noted below each chart corresponds to the percentile box and represents the percentage of funds in the Lipper peer group whose performance was equal to or lower than that of the fund.
Annual Report
Fidelity Growth & Income Portfolio
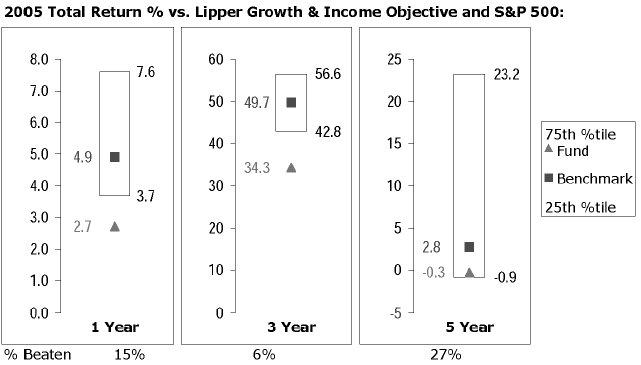
The Board reviewed the fund's relative investment performance against its Lipper peer group and stated that the performance of the fund was in the fourth quartile for the one- and three-year periods and the third quartile for the five-year period. The Board also stated that the relative investment performance of the fund was lower than its benchmark for all the periods shown. The Board discussed with FMR actions to be taken by FMR to improve the fund's disappointing performance. The Board also reviewed the fund's relative investment performance against a peer group defined by Morningstar. The Board will continue to closely monitor the performance of the fund in the coming year.
The Board considered that FMR has taken steps to refocus and strengthen equity research, equity portfolio management, and compliance. The Board noted with favor FMR's reorganization of its senior management team in 2005 and FMR's dedication of additional resources to investment research, and participated in the process that led to those changes.
Based on its review, and giving particular weight to the nature and quality of the resources dedicated by the Investment Advisers to maintain and improve relative performance, the Board concluded that the nature, extent, and quality of the services provided to the fund will benefit the fund's shareholders, particularly in light of the Board's view that the fund's shareholders benefit from investing in a fund that is part of a large family of funds offering a variety of investment disciplines and services.
Competitiveness of Management Fee and Total Fund Expenses. The Board considered the fund's management fee and total expenses compared to "mapped groups" of competitive funds and classes. Fidelity creates "mapped groups" by combining similar Lipper investment objective categories that have comparable management fee characteristics. Combining Lipper investment objective categories aids the Board's management fee and total expense comparisons by broadening the competitive group used for comparison and by reducing the number of universes to which various Fidelity funds are compared.
Annual Report
Board Approval of Investment Advisory Contracts and
Management Fees - continued
The Board considered two proprietary management fee comparisons for the 12-month periods shown in the chart below. The group of Lipper funds used by the Board for management fee comparisons is referred to below as the "Total Mapped Group" and, for the reasons explained above, is broader than the Lipper peer group used by the Board for performance comparisons. The Total Mapped Group comparison focuses on a fund's standing relative to the total universe of comparable funds available to investors, in terms of gross management fees before expense reimbursements or caps. "TMG %" represents the percentage of funds in the Total Mapped Group that had management fees that were lower than the fund's. For example, a TMG % of 10% means that 90% of the funds in the Total Mapped Group had higher management fees than the fund. The "Asset-Size Peer Group" (ASPG) comparison focuses on a fund's standing relative to non-Fidelity funds similar in size to the fund within the Total Mapped Group. The ASPG represents at least 15% of the funds in the Total Mapped Group with comparable asset size and management fee characteristics, subject to a minimum of 50 funds (or all funds in the Total Mapped Group if fewer than 50). Additional information, such as the ASPG quartile in which the fund's management fee ranked, is also included in the chart and considered by the Board.
Fidelity Growth & Income Portfolio
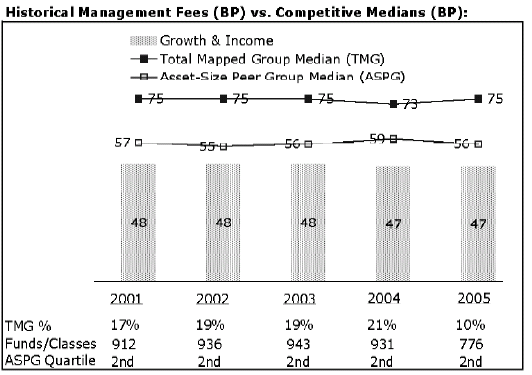
Annual Report
The Board noted that the fund's management fee ranked below the median of its Total Mapped Group and below the median of its ASPG for 2005.
Based on its review, the Board concluded that the fund's management fee was fair and reasonable in light of the services that the fund receives and the other factors considered.
In its review of the fund's total expenses, the Board considered the fund's management fee as well as other fund expenses, such as transfer agent fees, pricing and bookkeeping fees, and custodial, legal, and audit fees. The Board also noted the effects of any waivers and reimbursements on fees and expenses. As part of its review, the Board also considered current and historical total expenses of the fund compared to competitive fund median expenses. The fund is compared to those funds and classes in the Total Mapped Group (used by the Board for management fee comparisons) that have a similar sales load structure.
The Board noted that the fund's total expenses ranked below its competitive median for 2005.
In its review of total expenses, the Board also considered Fidelity fee structures and other information on clients that FMR and its affiliates service in other competitive markets, such as other mutual funds advised or subadvised by FMR or its affiliates, pension plan clients, and other institutional clients.
Based on its review, the Board concluded that the fund's total expenses were reasonable in light of the services that the fund and its shareholders receive and the other factors considered.
Costs of the Services and Profitability. The Board considered the revenues earned and the expenses incurred by Fidelity in conducting the business of developing, marketing, distributing, managing, administering and servicing the fund and its shareholders. The Board also considered the level of Fidelity's profits in respect of all the Fidelity funds.
On an annual basis, FMR presents to the Board Fidelity's profitability for the fund. Fidelity calculates the profitability for each fund, as well as aggregate profitability for groups of Fidelity funds and all Fidelity funds, using a series of detailed revenue and cost allocation methodologies which originate with the audited books and records of Fidelity. The Audit Committee of the Board reviews any significant changes from the prior year's methodologies.
PricewaterhouseCoopers LLP (PwC), independent registered accounting firm and auditor to Fidelity and certain Fidelity funds, has been engaged annually by the Board as part of the Board's assessment of the results of Fidelity's profitability analysis. PwC's engagement includes the review and assessment of Fidelity's methodologies used in determining the revenues and expenses attributable to Fidelity's mutual fund business, and completion of agreed-upon procedures surrounding the mathematical accuracy of fund profitability and its conformity to allocation methodologies. After considering PwC's reports issued under the engagement and information provided by Fidelity, the Board believes that while other allocation methods may also be reasonable, Fidelity's profitability methodologies are reasonable in all material respects.
Annual Report
Board Approval of Investment Advisory Contracts and
Management Fees - continued
The Board has also reviewed Fidelity's non-fund businesses and any fall-out benefits related to the mutual fund business as well as cases where Fidelity's affiliates may benefit from or be related to the fund's business.
The Board considered the costs of the services provided by and the profits realized by Fidelity in connection with the operation of the fund and determined that the amount of profit is a fair entrepreneurial profit for the management of the fund.
Economies of Scale. The Board considered whether there have been economies of scale in respect of the management of the Fidelity funds, whether the Fidelity funds (including the fund) have appropriately benefited from any such economies of scale, and whether there is potential for realization of any further economies of scale. The Board considered the extent to which the fund will benefit from economies of scale through increased services to the fund, through waivers or reimbursements, or through fee or expense reductions, including reductions that occur through operation of the transfer agent agreement. The transfer agent fee varies in part based on the number of accounts in the fund. If the number of accounts decreases or the average account size increases, the overall transfer agent fee rate decreases.
The Board recognized that the fund's management contract incorporates a "group fee" structure, which provides for lower fee rates as total fund assets under FMR's management increase, and for higher fee rates as total fund assets under FMR's management decrease. The Board considered that the group fee is designed to deliver the benefits of economies of scale to fund shareholders when total fund assets increase, even if assets of any particular fund are unchanged or have declined, because some portion of Fidelity's costs are attributable to services provided to all Fidelity funds, and all funds benefit if those costs can be allocated among more assets. The Board concluded that, given the group fee structure, fund shareholders will achieve a certain level of economies of scale as assets under FMR's management increase at the fund complex level, regardless of whether Fidelity achieves any such economies of scale.
The Board further concluded that any potential economies of scale are being shared between fund shareholders and Fidelity in an appropriate manner.
Additional Information Requested by the Board. In order to develop fully the factual basis for consideration of the Advisory Contracts, the Board requested additional information on several topics, including (i) Fidelity's fund profitability methodology and profitability trends within certain funds; (ii) portfolio manager compensation; (iii) the extent to which any economies of scale exist and are shared between the funds and Fidelity; (iv) the total expenses of certain funds and classes relative to competitors, including the extent to which the expenses of certain funds have been or could be capped; (v) fund performance trends; and (vi) Fidelity's fee structures, including use of performance fees.
Annual Report
Based on its evaluation of all of the conclusions noted above, and after considering all material factors, the Board ultimately concluded that the advisory fee structures are fair and reasonable, and that the fund's Advisory Contracts should be renewed.
Annual Report
Annual Report
Fidelity®
International Real Estate
Fund
Annual Report
July 31, 2006
(2_fidelity_logos) (Registered_Trademark)
Contents
Chairman's Message | <Click Here> | Ned Johnson's message to shareholders. |
Performance | <Click Here> | How the fund has done over time. |
Management's Discussion | <Click Here> | The manager's review of fund performance, strategy and outlook |
Shareholder Expense Example | <Click Here> | An example of shareholder expenses. |
Investment Changes | <Click Here> | A summary of major shifts in the fund's investments over the past six months. |
Investments | <Click Here> | A complete list of the fund's investments with their market values. |
Financial Statements | <Click Here> | Statements of assets and liabilities, operations, and changes in net assets,
as well as financial highlights. |
Notes | <Click Here> | Notes to the financial statements. |
Report of Independent Registered Public Accounting Firm | <Click Here> | |
Trustees and Officers | <Click Here> | |
Distributions | <Click Here> | |
Proxy Voting Results | <Click Here> | |
Board Approval of Investment Advisory Contracts and Management Fees | <Click Here> | |
To view a fund's proxy voting guidelines and proxy voting record for the 12-month period ended June 30, visit www.fidelity.com/proxyvotingresults or visit the Securities and Exchange Commission's (SEC) web site at www.sec.gov. You may also call 1-800-544-8544 to request a free copy of the proxy voting guidelines.
Standard & Poor's, S&P and S&P 500 are registered service marks of The McGraw-Hill Companies, Inc. and have been licensed for use by Fidelity Distributors Corporation.
Other third party marks appearing herein are the property of their respective owners.
All other marks appearing herein are registered or unregistered trademarks or service marks of FMR Corp. or an affiliated company.
Annual Report
This report and the financial statements contained herein are submitted for the general information of the shareholders of the fund. This report is not authorized for distribution to prospective investors in the fund unless preceded or accompanied by an effective prospectus.
A fund files its complete schedule of portfolio holdings with the SEC for the first and third quarters of each fiscal year on Form N-Q. Forms N-Q are available on the SEC's web site at http://www.sec.gov. A fund's Forms N-Q may be reviewed and copied at the SEC's Public Reference Room in Washington, DC. Information regarding the operation of the SEC's Public Reference Room may be obtained by calling 1-800-SEC-0330. For a complete list of a fund's portfolio holdings, view the most recent quarterly holdings report, semiannual report, or annual report on Fidelity's web site at http://www.fidelity.com/holdings.
NOT FDIC INSURED · MAY LOSE VALUE · NO BANK GUARANTEE
Neither the fund nor Fidelity Distributors Corporation is a bank.
Annual Report
Chairman's Message
(photo_of_Edward_C_Johnson_3d)
Dear Shareholder:
Although many securities markets made gains in early 2006, inflation concerns led to mixed results through the year's mid-point. Financial markets are always unpredictable. There are, however, a number of time-tested principles that can put the historical odds in your favor.
One of the basic tenets is to invest for the long term. Over time, riding out the markets' inevitable ups and downs has proven much more effective than selling into panic or chasing the hottest trend. Even missing only a few of the markets' best days can significantly diminish investor returns. Patience also affords the benefits of compounding - of earning interest on additional income or reinvested dividends and capital gains. There are tax advantages and cost benefits to consider as well. The more you sell, the more taxes you pay, and the more you trade, the higher the costs. While staying the course doesn't eliminate risk, it can considerably lessen the effect of short-term declines.
You can further manage your investing risk through diversification. And today, more than ever, geographic diversification should be taken into account. Studies indicate that asset allocation is the single most important determinant of a portfolio's long-term success. The right mix of stocks, bonds and cash - aligned to your particular risk tolerance and investment objective - is very important. Age-appropriate rebalancing is also an essential aspect of asset allocation. For younger investors, an emphasis on equities - which historically have been the best performing asset class over time - is encouraged. As investors near their specific goal, such as retirement or sending a child to college, consideration may be given to replacing volatile assets (e.g. common stocks) with more-stable fixed investments (bonds or savings plans).
A third investment principle - investing regularly - can help lower the average cost of your purchases. Investing a certain amount of money each month or quarter helps ensure you won't pay for all your shares at market highs. This strategy - known as dollar cost averaging - also reduces unconstructive "emotion" from investing, helping shareholders avoid selling weak performers just prior to an upswing, or chasing a hot performer just before a correction.
We invite you to contact us via the Internet, through our Investor Centers or over the phone. It is our privilege to provide you the information you need to make the investments that are right for you.
Sincerely,
/s/Edward C. Johnson 3d
Edward C. Johnson 3d
Annual Report
Performance: The Bottom Line
Average annual total return reflects the change in the value of an investment, assuming reinvestment of the fund's dividend income and capital gains (the profits earned upon the sale of securities that have grown in value) and assuming a constant rate of performance each year. The $10,000 table and the fund's returns do not reflect the deduction of taxes that a shareholder would pay on fund distributions or the redemption of fund shares. During periods of reimbursement by Fidelity, a fund's total return will be greater than it would be had the reimbursement not occurred. How a fund did yesterday is no guarantee of how it will do tomorrow.
Average Annual Total Returns
Periods ended July 31, 2006 | Past 1
year | Life of FundA |
Fidelity® International Real Estate Fund | 27.85% | 26.21% |
A From September 8, 2004.
$10,000 Over Life of Fund
Let's say hypothetically that $10,000 was invested in Fidelity® International Real Estate Fund on September 8, 2004, when the fund started. The chart shows how the value of your investment would have changed, and also shows how the Morgan Stanley Capital International Europe, Australasia and Far East (MSCI® EAFE®) Index performed over the same period.
Annual Report
Management's Discussion of Fund Performance
Comments from Matthew Lentz, Portfolio Manager of Fidelity® International Real Estate Fund
Foreign real estate securities performed exceptionally well during the year ending July 31, 2006. During that period, international real estate investment trusts (REITs), as measured by the EPRA/NAREIT Global Real Estate ex North America Index, returned 33.52%. That result easily outpaced the U.S. REIT market - as measured by the Dow Jones Wilshire Real Estate Securities IndexSM, which returned 17.33% during the period - as well as the performance of global equities in general. The broad international stock market, as measured by the Morgan Stanley Capital InternationalSM Europe, Australasia, Far East (MSCI® EAFE®) Index , gained 24.20%. Investors' continued demand for yield was a major driver of REIT performance. On a regional basis, the U.K. and Japanese markets - major index components - performed especially well for the year overall. However, Japan stumbled in the second half of the period after its central bank hinted at an increase in short-term interest rates. The prospect of the REIT structure becoming available in the United Kingdom and Germany was welcomed by investors.
The fund returned 27.85% during the past year, trailing its sector benchmark, the EPRA/NAREIT index, but outperforming the MSCI EAFE. The principal detractors from performance versus the sector index were stock selection in Japan and Hong Kong, as well as in the office sector. In addition, an overweighting in diversified REITs hurt, as did the fund's relatively large cash position. Our investments in Japanese property developers, such as Sumitomo Realty and Mitsubishi Estate, were among the top detractors partly because the fund was underweighted in these stocks during the first half of the period when they registered their biggest gains. Japanese condominium developer Joint Corporation and Italian developer Pirelli & Company Real Estate also disappointed. Other notable detractors were Australia's CFS Retail Property Trust and China Overseas Land & Investment, the latter of which we underweighted. Conversely, performance benefited from stock selection in the U.K., as well as in retail- and industrial-related securities. Underweighting the lagging Australian market contributed as well, while favorable currency movements helped bolster the fund's absolute return. Although many Japanese-developer stocks underperformed the index during the period's second half, one of these companies - Mitsui Fudosan - was among our biggest contributors, based on its strength during the first half of the year. Overweighting British Land Company and Australia's Macquarie Goodman also contributed, as did underweighting Tokyu Land Corporation. A number of stocks I've mentioned were sold prior to the period's end.
The views expressed above reflect those of the portfolio manager(s) only through the end of the period as stated on the cover of this report and do not necessarily represent the views of Fidelity or any other person in the Fidelity organization. Any such views are subject to change at any time based upon market or other conditions and Fidelity disclaims any responsibility to update such views. These views may not be relied on as investment advice and, because investment decisions for a Fidelity fund are based on numerous factors, may not be relied on as an indication of trading intent on behalf of any Fidelity fund.
Annual Report
Shareholder Expense Example
As a shareholder of the Fund, you incur two types of costs: (1) transaction costs, including redemption fees, and (2) ongoing costs, including management fees and other Fund expenses. This Example is intended to help you understand your ongoing costs (in dollars) of investing in the Fund and to compare these costs with the ongoing costs of investing in other mutual funds.
The Example is based on an investment of $1,000 invested at the beginning of the period and held for the entire period (February 1, 2006 to July 31, 2006).
Actual Expenses
The first line of the accompanying table provides information about actual account values and actual expenses. You may use the information in this line, together with the amount you invested, to estimate the expenses that you paid over the period. Simply divide your account value by $1,000.00 (for example, an $8,600 account value divided by $1,000.00 = 8.6), then multiply the result by the number in the first line under the heading entitled "Expenses Paid During Period" to estimate the expenses you paid on your account during this period. A small balance maintenance fee of $12.00 that is charged once a year may apply for certain accounts with a value of less than $2,000. This fee is not included in the table below. If it was, the estimate of expenses you paid during the period would be higher, and your ending account value lower, by this amount.
Hypothetical Example for Comparison Purposes
The second line of the accompanying table provides information about hypothetical account values and hypothetical expenses based on the Fund's actual expense ratio and an assumed rate of return of 5% per year before expenses, which is not the Fund's actual return. The hypothetical account values and expenses may not be used to estimate the actual ending account balance or expenses you paid for the period. You may use this information to compare the ongoing costs of investing in the Fund and other funds. To do so, compare this 5% hypothetical example with the 5% hypothetical examples that appear in the shareholder reports of the other funds. A small balance maintenance fee of $12.00 that is charged once a year may apply for certain accounts with a value of less than $2,000. This fee is not included in the table below. If it was, the estimate of expenses you paid during the period would be higher, and your ending account value lower, by this amount.
Please note that the expenses shown in the table are meant to highlight your ongoing costs only and do not reflect any transaction costs. Therefore, the second line of the table is useful in comparing ongoing costs only, and will not help you determine the relative total costs of owning different funds. In addition, if these transactional costs were included, your costs would have been higher.
| Beginning
Account Value
February 1, 2006 | Ending
Account Value
July 31, 2006 | Expenses Paid
During Period*
February 1, 2006
to July 31, 2006 |
Actual | $ 1,000.00 | $ 1,073.80 | $ 5.76 |
Hypothetical (5% return per year before expenses) | $ 1,000.00 | $ 1,019.24 | $ 5.61 |
* Expenses are equal to the Fund's annualized expense ratio of 1.12%; multiplied by the average account value over the period, multiplied by 181/365 (to reflect the one-half year period).
Annual Report
Investment Changes
Top Ten Stocks as of July 31, 2006 |
| % of fund's
net assets | % of fund's net assets
6 months ago |
Mitsubishi Estate Co. Ltd. | 10.2 | 6.5 |
British Land Co. PLC | 10.1 | 3.3 |
Unibail (Reg.) | 8.3 | 1.8 |
Tokyu Land Corp. | 7.0 | 0.0 |
Kerry Properties Ltd. | 4.7 | 1.5 |
Derwent Valley Holdings PLC | 4.3 | 1.5 |
Hong Kong Land Holdings Ltd. | 4.1 | 1.9 |
The GPT Group unit | 4.1 | 0.0 |
Stockland unit | 3.8 | 2.2 |
CapitaLand Ltd. | 3.5 | 2.1 |
| 60.1 | |
Top Five Countries as of July 31, 2006 |
(excluding cash equivalents) | % of fund's
net assets | % of fund's net assets
6 months ago |
Japan | 23.0 | 21.2 |
Australia | 16.1 | 15.8 |
Hong Kong | 15.9 | 10.8 |
United Kingdom | 15.4 | 20.2 |
France | 10.3 | 3.8 |
Percentages are adjusted for the effect of open futures contracts, if applicable. |
Top Five REIT Sectors as of July 31, 2006 |
| % of fund's
net assets | % of fund's net assets
6 months ago |
REITs - Management/Investment | 24.4 | 24.3 |
REITs - Shopping Centers | 3.0 | 0.9 |
REITs - Apartments | 2.3 | 0.2 |
REITs - Office Buildings | 2.0 | 2.8 |
REITs - Industrial Buildings | 1.6 | 1.3 |
Asset Allocation (% of fund's net assets) |
As of July 31, 2006* | As of January 31, 2006** |
 | Stocks and Investment Companies 95.5% | | | Stocks 85.7% | |
 | Short-Term
Investments and
Net Other Assets 4.5% | | | Short-Term
Investments and
Net Other Assets 14.3% | |
* Foreign investments | 95.5% | | ** Foreign investments | 85.7% | |

Annual Report
Investments July 31, 2006
Showing Percentage of Net Assets
Common Stocks - 94.5% |
| Shares | | Value (Note 1) |
Australia - 15.1% |
Aspen Group Ltd. | 3,724,100 | | $ 4,280,387 |
Charter Hall Group unit (a) | 6,613,198 | | 7,119,645 |
FKP Property Group unit | 2,205,600 | | 8,500,906 |
Macquarie Goodman Group unit | 2,784,340 | | 12,736,998 |
Stockland unit | 3,224,200 | | 16,898,516 |
The GPT Group unit | 5,267,830 | | 18,244,866 |
TOTAL AUSTRALIA | | 67,781,318 |
Austria - 3.0% |
Immoeast Immobilien Anlagen AG (a) | 1,165,300 | | 13,351,809 |
Brazil - 0.4% |
Gafisa SA (a) | 82,500 | | 834,862 |
Rossi Residencial SA | 137,900 | | 1,074,669 |
TOTAL BRAZIL | | 1,909,531 |
France - 10.3% |
Societe de la Tour Eiffel | 71,700 | | 9,158,599 |
Unibail (Reg.) | 199,900 | | 37,101,231 |
TOTAL FRANCE | | 46,259,830 |
Greece - 1.1% |
Babis Vovos International Technical SA | 197,530 | | 4,667,827 |
Hong Kong - 15.9% |
Hong Kong Land Holdings Ltd. | 4,737,900 | | 18,477,810 |
Hopson Development Holdings Ltd. | 2,126,000 | | 4,104,194 |
Kerry Properties Ltd. | 6,299,000 | | 20,753,195 |
Link (REIT) | 6,453,500 | | 13,554,667 |
New World Development Co. Ltd. | 8,231,000 | | 14,088,918 |
TOTAL HONG KONG | | 70,978,784 |
Italy - 2.1% |
Risanamento Spa | 1,204,000 | | 9,264,487 |
Japan - 23.0% |
Japan Excellent, Inc. | 2,000 | | 10,292,194 |
Japan Logistics Fund, Inc. | 982 | | 7,263,288 |
Mitsubishi Estate Co. Ltd. | 2,201,000 | | 45,594,200 |
NTT Urban Development Co. | 1,126 | | 8,485,512 |
Tokyu Land Corp. | 4,101,000 | | 31,441,596 |
TOTAL JAPAN | | 103,076,790 |
Korea (South) - 0.0% |
Macquarie Central Office Corporate Restructuring REIT | 11,070 | | 76,493 |
Common Stocks - continued |
| Shares | | Value (Note 1) |
Netherlands - 2.9% |
VastNed Offices/Industrial NV | 364,011 | | $ 12,995,896 |
Singapore - 3.5% |
CapitaLand Ltd. | 6,104,900 | | 15,853,368 |
Thailand - 1.8% |
Ticon Industrial Connection PCL (For. Reg.) | 17,138,900 | | 8,148,447 |
United Kingdom - 15.4% |
British Land Co. PLC | 1,773,300 | | 45,283,420 |
Derwent Valley Holdings PLC | 611,300 | | 19,264,510 |
Helical Bar PLC | 591,200 | | 4,428,609 |
TOTAL UNITED KINGDOM | | 68,976,539 |
TOTAL COMMON STOCKS (Cost $384,350,793) | 423,341,119 |
Investment Companies - 1.0% |
| | | |
Australia - 1.0% |
Tishman Speyer Office Fund
(Cost $4,260,002) | 2,537,800 | | 4,316,988 |
Money Market Funds - 3.2% |
| | | |
Fidelity Cash Central Fund, 5.3% (b)
(Cost $14,277,277) | 14,277,277 | | 14,277,277 |
TOTAL INVESTMENT PORTFOLIO - 98.7% (Cost $402,888,072) | | 441,935,384 |
NET OTHER ASSETS - 1.3% | | 5,918,445 |
NET ASSETS - 100% | $ 447,853,829 |
Legend |
(a) Non-income producing |
(b) Affiliated fund that is available only to investment companies and other accounts managed by Fidelity Investments. The rate quoted is the annualized seven-day yield of the fund at period end. A complete unaudited listing of the fund's holdings as of its most recent quarter end is available upon request. |
Affiliated Central Funds |
Information regarding fiscal year to date income earned by the fund from the affiliated Central funds is as follows: |
Fund | Income earned |
Fidelity Cash Central Fund | $ 735,638 |
Fidelity Securities Lending Cash Central Fund | 79,223 |
Total | $ 814,861 |
See accompanying notes which are an integral part of the financial statements.
Annual Report
Financial Statements
Statement of Assets and Liabilities
| July 31, 2006 |
| | |
Assets | | |
Investment in securities, at value - See accompanying schedule: Unaffiliated issuers (cost $388,610,795) | $ 427,658,107 | |
Affiliated Central Funds (cost $14,277,277) | 14,277,277 | |
Total Investments (cost $402,888,072) | | $ 441,935,384 |
Foreign currency held at value (cost $111,876) | | 112,504 |
Receivable for investments sold | | 16,148,973 |
Receivable for fund shares sold | | 2,049,002 |
Dividends receivable | | 1,825,973 |
Interest receivable | | 52,012 |
Prepaid expenses | | 268 |
Other receivables | | 416,261 |
Total assets | | 462,540,377 |
| | |
Liabilities | | |
Payable for investments purchased | $ 13,857,355 | |
Payable for fund shares redeemed | 366,482 | |
Accrued management fee | 256,483 | |
Other affiliated payables | 102,099 | |
Other payables and accrued expenses | 104,129 | |
Total liabilities | | 14,686,548 |
| | |
Net Assets | | $ 447,853,829 |
Net Assets consist of: | | |
Paid in capital | | $ 389,974,412 |
Undistributed net investment income | | 5,544,851 |
Accumulated undistributed net realized gain (loss) on investments and foreign currency transactions | | 13,237,245 |
Net unrealized appreciation (depreciation) on investments and assets and liabilities in foreign currencies | | 39,097,321 |
Net Assets, for 30,488,230 shares outstanding | | $ 447,853,829 |
Net Asset Value, offering price and redemption price per share ($447,853,829 ÷ 30,488,230 shares) | | $ 14.69 |
See accompanying notes which are an integral part of the financial statements.
Annual Report
Financial Statements - continued
Statement of Operations
| Year ended July 31, 2006 |
| | |
Investment Income | | |
Dividends | | $ 8,831,394 |
Interest | | 8,386 |
Income from affiliated Central Funds | | 814,861 |
| | 9,654,641 |
Less foreign taxes withheld | | (840,021) |
Total income | | 8,814,620 |
| | |
Expenses | | |
Management fee | $ 2,017,405 | |
Transfer agent fees | 663,844 | |
Accounting and security lending fees | 141,384 | |
Independent trustees' compensation | 1,029 | |
Custodian fees and expenses | 160,762 | |
Registration fees | 62,797 | |
Audit | 63,353 | |
Legal | 4,743 | |
Interest | 3,472 | |
Miscellaneous | 18,275 | |
Total expenses before reductions | 3,137,064 | |
Expense reductions | (587,835) | 2,549,229 |
Net investment income (loss) | | 6,265,391 |
Realized and Unrealized Gain (Loss) Net realized gain (loss) on: | | |
Investment securities: | | |
Unaffiliated issuers | 18,760,414 | |
Foreign currency transactions | (367,607) | |
Total net realized gain (loss) | | 18,392,807 |
Change in net unrealized appreciation (depreciation) on: Investment securities | 28,553,544 | |
Assets and liabilities in foreign currencies | 65,179 | |
Total change in net unrealized appreciation (depreciation) | | 28,618,723 |
Net gain (loss) | | 47,011,530 |
Net increase (decrease) in net assets resulting from operations | | $ 53,276,921 |
See accompanying notes which are an integral part of the financial statements.
Annual Report
Statement of Changes in Net Assets
| Year ended
July 31,
2006 | For the period
September 8, 2004 (commencement
of operations) to July 31, 2005 |
Increase (Decrease) in Net Assets | | |
Operations | | |
Net investment income (loss) | $ 6,265,391 | $ 2,301,593 |
Net realized gain (loss) | 18,392,807 | 1,208,383 |
Change in net unrealized appreciation (depreciation) | 28,618,723 | 10,478,598 |
Net increase (decrease) in net assets resulting
from operations | 53,276,921 | 13,988,574 |
Distributions to shareholders from net investment income | (3,273,462) | (284,922) |
Distributions to shareholders from net realized gain | (5,444,196) | (284,922) |
Total distributions | (8,717,658) | (569,844) |
Share transactions
Proceeds from sales of shares | 327,866,574 | 198,883,069 |
Reinvestment of distributions | 7,986,974 | 534,380 |
Cost of shares redeemed | (93,822,712) | (51,974,181) |
Net increase (decrease) in net assets resulting from share transactions | 242,030,836 | 147,443,268 |
Redemption fees | 283,977 | 117,755 |
Total increase (decrease) in net assets | 286,874,076 | 160,979,753 |
| | |
Net Assets | | |
Beginning of period | 160,979,753 | - |
End of period (including undistributed net investment income of $5,544,851 and undistributed net investment income of $2,726,894, respectively) | $ 447,853,829 | $ 160,979,753 |
Other Information Shares | | |
Sold | 23,490,365 | 17,760,569 |
Issued in reinvestment of distributions | 646,412 | 46,067 |
Redeemed | (6,968,124) | (4,487,059) |
Net increase (decrease) | 17,168,653 | 13,319,577 |
See accompanying notes which are an integral part of the financial statements.
Annual Report
Financial Highlights
Years ended July 31, | 2006 | 2005 E |
Selected Per-Share Data | | |
Net asset value, beginning of period | $ 12.09 | $ 10.00 |
Income from Investment Operations | | |
Net investment income (loss) D | .30 | .23 |
Net realized and unrealized gain (loss) | 2.93 | 1.91 |
Total from investment operations | 3.23 | 2.14 |
Distributions from net investment income | (.24) | (.03) |
Distributions from net realized gain | (.40) | (.03) |
Total distributions | (.64) | (.06) |
Redemption fees added to paid in capital D | .01 | .01 |
Net asset value, end of period | $ 14.69 | $ 12.09 |
Total Return B, C | 27.85% | 21.53% |
Ratios to Average Net Assets F | | |
Expenses before reductions | 1.12% | 1.29% A |
Expenses net of fee waivers, if any | 1.12% | 1.29% A |
Expenses net of all reductions | .91% | 1.27% A |
Net investment income (loss) | 2.23% | 2.21% A |
Supplemental Data | | |
Net assets, end of period (000 omitted) | $ 447,854 | $ 160,980 |
Portfolio turnover rate | 234% | 36% A |
A Annualized
B Total returns for periods of less than one year are not annualized.
C Total returns would have been lower had certain expenses not been reduced during the periods shown.
D Calculated based on average shares outstanding during the period.
E For the period September 8, 2004 (commencement of operations) to July 31, 2005.
F Expense ratios reflect operating expenses of the Fund. Expenses before reductions do not reflect amounts reimbursed by the investment adviser or reductions from brokerage service arrangements or other expense offset arrangements and do not represent the amount paid by the Fund during periods when reimbursements or reductions occur. Expense ratios before reductions for start-up periods may not be representative of longer term operating periods. Expenses net of fee waivers reflect expenses after reimbursement by the investment adviser but prior to reductions from brokerage service arrangements or other expense offset arrangements. Expenses net of all reductions represent the net expenses paid by the Fund.
See accompanying notes which are an integral part of the financial statements.
Annual Report
Notes to Financial Statements
For the period ended July 31, 2006
1. Significant Accounting Policies.
Fidelity International Real Estate Fund (the Fund) is a non-diversified fund of Fidelity Securities Fund (the trust) and is authorized to issue an unlimited number of shares. The trust is registered under the Investment Company Act of 1940, as amended (the 1940 Act), as an open-end management investment company organized as a Massachusetts business trust. The Fund may invest in affiliated money market central funds (Money Market Central Funds), which are open-end investment companies available to investment companies and other accounts managed by Fidelity Management & Research Company (FMR) and its affiliates. The financial statements have been prepared in conformity with accounting principles generally accepted in the United States of America, which require management to make certain estimates and assumptions at the date of the financial statements. The following summarizes the significant accounting policies of the Fund:
Security Valuation. Investments are valued and net asset value (NAV) per share is calculated (NAV calculation) as of the close of business of the New York Stock Exchange (NYSE), normally 4:00 p.m. Eastern time. Wherever possible, the Fund uses independent pricing services approved by the Board of Trustees to value its investments.
Equity securities, including restricted securities, for which market quotations are readily available, are valued at the last reported sale price or official closing price as reported by an independent pricing service on the primary market or exchange on which they are traded. In the event there were no sales during the day or closing prices are not available, securities are valued at the last quoted bid price. Investments in open-end mutual funds are valued at their closing net asset value each business day. Short-term securities with remaining maturities of sixty days or less for which quotations are not readily available are valued at amortized cost, which approximates value.
When current market prices or quotations are not readily available or do not accurately reflect fair value, valuations may be determined in accordance with procedures adopted by the Board of Trustees. For example, when developments occur between the close of a market and the close of the NYSE that may materially affect the value of some or all of the securities, or when trading in a security is halted, those securities may be fair valued. Factors used in the determination of fair value may include monitoring news to identify significant market or security specific events such as changes in the value of U.S. securities markets, reviewing developments in foreign markets and evaluating the performance of ADRs, futures contracts and exchange-traded funds. Because the Fund's utilization of fair value pricing depends on market activity, the frequency with which fair value pricing is used can not be predicted and may be utilized to a significant extent. The value of securities used for NAV calculation under fair value pricing may differ from published prices for the same securities.
Annual Report
Notes to Financial Statements - continued
1. Significant Accounting Policies - continued
Foreign Currency. The Fund uses foreign currency contracts to facilitate transactions in foreign-denominated securities. Losses from these transactions may arise from changes in the value of the foreign currency or if the counterparties do not perform under the contracts' terms.
Foreign-denominated assets, including investment securities, and liabilities are translated into U.S. dollars at the exchange rate at period end. Purchases and sales of investment securities, income and dividends received and expenses denominated in foreign currencies are translated into U.S. dollars at the exchange rate in effect on the transaction date.
The effects of exchange rate fluctuations on investments are included with the net realized and unrealized gain (loss) on investment securities. Other foreign currency transactions resulting in realized and unrealized gain (loss) are disclosed separately.
Investment Transactions and Income. Security transactions are accounted for as of trade date. Gains and losses on securities sold are determined on the basis of identified cost. Dividend income is recorded on the ex-dividend date, except for certain dividends from foreign securities where the ex-dividend date may have passed, which are recorded as soon as the Fund is informed of the ex-dividend date. Non-cash dividends included in dividend income, if any, are recorded at the fair market value of the securities received. Distributions received on securities that represent a return of capital or capital gain are recorded as a reduction of cost of investments and/or as a realized gain. The Fund estimates the components of distributions received that may be considered return of capital distributions or capital gain distributions. Interest income is accrued as earned. Interest income includes coupon interest and amortization of premium and accretion of discount on debt securities. Investment income is recorded net of foreign taxes withheld where recovery of such taxes is uncertain.
Expenses. Most expenses of the trust can be directly attributed to a fund. Expenses which cannot be directly attributed are apportioned among each Fund in the trust. Expense estimates are accrued in the period to which they relate and adjustments are made when actual amounts are known.
Income Tax Information and Distributions to Shareholders. Each year, the Fund intends to qualify as a regulated investment company by distributing all of its taxable income and realized gains under Subchapter M of the Internal Revenue Code. As a result, no provision for income taxes is required in the accompanying financial statements. Foreign taxes are provided for based on the Fund's understanding of the tax rules and rates that exist in the foreign markets in which it invests.
Annual Report
1. Significant Accounting Policies - continued
Income Tax Information and Distributions to Shareholders - continued
Distributions are recorded on the ex-dividend date. Income and capital gain distributions are determined in accordance with income tax regulations, which may differ from generally accepted accounting principles. In addition, the Fund will claim a portion of the payment made to redeeming shareholders as a distribution for income tax purposes.
Capital accounts within the financial statements are adjusted for permanent book-tax differences. These adjustments have no impact on net assets or the results of operations. Temporary book-tax differences will reverse in a subsequent period.
Book-tax differences are primarily due to foreign currency transactions passive foreign investment companies (PFIC) and losses deferred due to wash sales.
The tax-basis components of distributable earnings and the federal tax cost as of period end were as follows:
Unrealized appreciation | $ 31,289,540 | |
Unrealized depreciation | (5,348,991) | |
Net unrealized appreciation (depreciation) | 25,940,549 | |
Undistributed ordinary income | 21,511,851 | |
Undistributed long-term capital gain | 8,066,694 | |
| | |
Cost for federal income tax purposes | $ 415,994,835 | |
The tax character of distributions paid was as follows:
| July 31, 2006 | July 31, 2005 |
Ordinary Income | $ 8,431,124 | $ 569,844 |
Long-term Capital Gains | 286,534 | - |
Total | $ 8,717,658 | $ 569,844 |
New Accounting Pronouncement. In July 2006, Financial Accounting Standards Board Interpretation No. 48, Accounting for Uncertainty in Income Taxes - an interpretation of FASB Statement 109 (FIN 48) was issued and is effective for fiscal years beginning after December 15, 2006. FIN 48 sets forth a threshold for financial statement recognition, measurement and disclosure of a tax position taken or expected to be taken on a tax return. Management is currently evaluating the impact, if any, the adoption of FIN 48 will have on the Fund's net assets and results of operations.
Short-Term Trading (Redemption) Fees. Shares held in the Fund less than 90 days are subject to a redemption fee equal to 1.50% of the proceeds of the redeemed shares. All redemption fees, including any estimated redemption fees paid by FMR, are retained by the Fund and accounted for as an addition to paid in capital.
Annual Report
Notes to Financial Statements - continued
2. Operating Policies.
Repurchase Agreements. FMR has received an Exemptive Order from the Securities and Exchange Commission (the SEC) which permits the Fund and other affiliated entities of FMR to transfer uninvested cash balances into joint trading accounts which are then invested in repurchase agreements. The Fund may also invest directly with institutions in repurchase agreements. Repurchase agreements are collateralized by government or non-government securities. Upon settlement date, collateral is held in segregated accounts with custodian banks and may be obtained in the event of a default of the counterparty. The Fund monitors, on a daily basis, the value of the collateral to ensure it is at least equal to the principal amount of the repurchase agreement (including accrued interest). In the event of a default by the counterparty, realization of the collateral proceeds could be delayed, during which time the value of the collateral may decline.
3. Purchases and Sales of Investments.
Purchases and sales of securities, other than short-term securities, aggregated $846,990,536 and $624,489,784, respectively.
4. Fees and Other Transactions with Affiliates.
Management Fee. FMR and its affiliates provide the Fund with investment management related services for which the Fund pays a monthly management fee. The management fee is the sum of an individual fund fee rate that is based on an annual rate of .45% of the Fund's average net assets and a group fee rate that averaged ..27% during the period. The group fee rate is based upon the average net assets of all the mutual funds advised by FMR. The group fee rate decreases as assets under management increase and increases as assets under management decrease. For the period, the total annual management fee rate was .72% of the Fund's average net assets.
Transfer Agent Fees. Fidelity Service Company, Inc. (FSC), an affiliate of FMR, is the Fund's transfer, dividend disbursing and shareholder servicing agent. FSC receives account fees and asset-based fees that vary according to account size and type of account. FSC pays for typesetting, printing and mailing of shareholder reports, except proxy statements. For the period, the transfer agent fees were equivalent to an annual rate of .24% of average net assets.
Accounting and Security Lending Fees. FSC maintains the Fund's accounting records. The accounting fee is based on the level of average net assets for the month. Under a separate contract, FSC administers the security lending program. The security lending fee is based on the number and duration of lending transactions.
Annual Report
4. Fees and Other Transactions with Affiliates - continued
Affiliated Central Funds. The Fund may invest in Money Market Central Funds which seek preservation of capital and current income and are managed by Fidelity Investments Money Management, Inc. (FIMM), an affiliate of FMR.
The Money Market Central Funds do not pay a management fee.
Brokerage Commissions. The Fund placed a portion of its portfolio transactions with brokerage firms which are affiliates of the investment adviser. The commissions paid to these affiliated firms were $19 for the period.
Interfund Lending Program. Pursuant to an Exemptive Order issued by the SEC, the Fund, along with other registered investment companies having management contracts with FMR, may participate in an interfund lending program. This program provides an alternative credit facility allowing the Funds to borrow from, or lend money to, other participating affiliated funds. At period end, there were no interfund loans outstanding. The Fund's activity in this program during the period for which loans were outstanding was as follows:
Borrower or Lender | Average Daily Loan Balance | Weighted Average Interest Rate | Interest Expense |
Borrower | $ 12,187,500 | 5.13% | $ 3,472 |
5. Committed Line of Credit.
The Fund participates with other funds managed by FMR in a $4.2 billion credit facility (the "line of credit") to be utilized for temporary or emergency purposes to fund shareholder redemptions or for other short-term liquidity purposes. The Fund has agreed to pay commitment fees on its pro rata portion of the line of credit, which amounts to $563 and is reflected in Miscellaneous Expense on the Statement of Operations. During the period, there were no borrowings on this line of credit.
6. Security Lending.
The Fund lends portfolio securities from time to time in order to earn additional income. On the settlement date of the loan, the Fund receives collateral (in the form of U.S. Treasury obligations, letters of credit and/or cash) against the loaned securities and maintains collateral in an amount not less than 100% of the market value of the loaned securities during the period of the loan. The market value of the loaned securities is determined at the close of business of the Fund and any additional required collateral is delivered to the Fund on the next business day. If the borrower defaults on its obligation to return the securities loaned because of insolvency or other reasons, a fund could experience delays and costs in recovering the securities loaned or in gaining access to
Annual Report
Notes to Financial Statements - continued
6. Security Lending - continued
the collateral. Any cash collateral received is invested in the Fidelity Securities Lending Cash Central Fund. At period end, there were no security loans outstanding. Security lending income represents the income earned on investing cash collateral, less fees and expenses associated with the loan, plus any premium payments that may be received on the loan of certain types of securities. Security lending income is presented in the Statement of Operations as a component of income from affiliated central funds. Net income from lending portfolio securities during the period amounted to $79,223.
7. Expense Reductions.
Many of the brokers with whom FMR places trades on behalf of the Fund provided services to the Fund in addition to trade execution. These services included payments of certain expenses on behalf of the Fund totaling $587,835 for the period.
8. Other.
The Fund's organizational documents provide former and current trustees and officers with a limited indemnification against liabilities arising in connection with the performance of their duties to the Fund. In the normal course of business, the Fund may also enter into contracts that provide general indemnifications. The Fund's maximum exposure under these arrangements is unknown as this would be dependent on future claims that may be made against the Fund. The risk of material loss from such claims is considered remote.
Annual Report
Report of Independent Registered Public Accounting Firm
To the Trustees of Fidelity Securities Fund and the Shareholders of Fidelity International Real Estate Fund:
In our opinion, the accompanying statement of assets and liabilities, including the schedule of investments, and the related statements of operations and of changes in net assets and the financial highlights present fairly, in all material respects, the financial position of Fidelity International Real Estate Fund (a fund of Fidelity Securities Fund) at July 31, 2006, and the results of its operations for the year then ended, the changes in its net assets for each of the two years in the period then ended and the financial highlights for each of the two years in the period then ended, in conformity with accounting principles generally accepted in the United States of America. These financial statements and financial highlights (hereafter referred to as "financial statements") are the responsibility of the Fidelity International Real Estate Fund's management; our responsibility is to express an opinion on these financial statements based on our audits. We conducted our audits of these financial statements in accordance with the standards of the Public Company Accounting Oversight Board (United States). Those standards require that we plan and perform the audit to obtain reasonable assurance about whether the financial statements are free of material misstatement. An audit includes examining, on a test basis, evidence supporting the amounts and disclosures in the financial statements, assessing the accounting principles used and significant estimates made by management, and evaluating the overall financial statement presentation. We believe that our audits, which included confirmation of securities at July 31, 2006 by correspondence with the custodian and brokers, provide a reasonable basis for our opinion.
/s/ PricewaterhouseCoopers LLP
PricewaterhouseCoopers LLP
Boston, Massachusetts
September 12, 2006
Annual Report
Trustees and Officers
The Trustees, Members of the Advisory Board, and executive officers of the trust and fund, as applicable, are listed below. The Board of Trustees governs the fund and is responsible for protecting the interests of shareholders. The Trustees are experienced executives who meet periodically throughout the year to oversee the fund's activities, review contractual arrangements with companies that provide services to the fund, and review the fund's performance. Except for William O. McCoy and Albert R. Gamper, Jr., each of the Trustees oversees 345 funds advised by FMR or an affiliate. Mr. McCoy oversees 347 funds advised by FMR or an affiliate. Mr. Gamper oversees 292 funds advised by FMR or an affiliate.
The Trustees hold office without limit in time except that (a) any Trustee may resign; (b) any Trustee may be removed by written instrument, signed by at least two-thirds of the number of Trustees prior to such removal; (c) any Trustee who requests to be retired or who has become incapacitated by illness or injury may be retired by written instrument signed by a majority of the other Trustees; and (d) any Trustee may be removed at any special meeting of shareholders by a two-thirds vote of the outstanding voting securities of the trust. Each Trustee who is not an interested person (as defined in the 1940 Act) (Independent Trustee), shall retire not later than the last day of the calendar year in which his or her 72nd birthday occurs. The Independent Trustees may waive this mandatory retirement age policy with respect to individual Trustees. The executive officers and Advisory Board Members hold office without limit in time, except that any officer and Advisory Board Member may resign or may be removed by a vote of a majority of the Trustees at any regular meeting or any special meeting of the Trustees. Except as indicated, each individual has held the office shown or other offices in the same company for the past five years.
The fund's Statement of Additional Information (SAI) includes more information about the Trustees. To request a free copy, call Fidelity at 1-800-544-8544.
Interested Trustees*:
Correspondence intended for each Trustee who is an interested person may be sent to Fidelity Investments, 82 Devonshire Street, Boston, Massachusetts 02109.
Name, Age; Principal Occupation |
Edward C. Johnson 3d (76) |
| Year of Election or Appointment: 1984 Mr. Johnson is Chairman of the Board of Trustees. Mr. Johnson serves as President (2006-present), Chief Executive Officer, Chairman, and a Director of FMR Corp.; Chairman and a Director of FMR; Chairman and a Director of Fidelity Research & Analysis Company (FRAC); Chairman and a Director of Fidelity Investments Money Management, Inc.; and Chairman (2001-present) and a Director (1999-present) of FMR Co., Inc. In addition, Mr. Johnson serves as Chairman and Director of Fidelity International Limited (FIL). |
Stephen P. Jonas (53) |
| Year of Election or Appointment: 2005 Mr. Jonas is Senior Vice President of International Real Estate (2005-present). He also serves as Senior Vice President of other Fidelity funds (2005-present). Mr. Jonas is Executive Director of FMR (2005-present) and FMR Co., Inc. (2005-present). He also serves as a Director of Fidelity Investments Money Management, Inc. (2005-present) and FMR Corp. (2003-present). Previously, Mr. Jonas served as President of Fidelity Enterprise Operations and Risk Services (2004-2005), Chief Administrative Officer (2002-2004), and Chief Financial Officer of FMR Corp. (1998-2002). In addition, he serves on the Boards of Boston Ballet (2003-present) and Simmons College (2003-present). |
Robert L. Reynolds (54) |
| Year of Election or Appointment: 2003 Mr. Reynolds is President and a Director of FMR (2005-present), Fidelity Investments Money Management, Inc. (2005-present), and FMR Co., Inc. (2005-present). Mr. Reynolds also serves as a Director (2003-present) and Chief Operating Officer (2000-present) of FMR Corp. and a Director of Strategic Advisers, Inc. (2005-present). He also serves on the Board at Fidelity Investments Canada, Ltd. (2000-present). Previously, Mr. Reynolds served as President of Fidelity Investments Institutional Retirement Group (1996-2000). |
* Trustees have been determined to be "Interested Trustees" by virtue of, among other things, their affiliation with the trust or various entities under common control with FMR.
Annual Report
Independent Trustees:
Correspondence intended for each Independent Trustee (that is, the Trustees other than the Interested Trustees) may be sent to Fidelity Investments, P.O. Box 55235, Boston, Massachusetts 02205-5235.
Name, Age; Principal Occupation |
Dennis J. Dirks (58) |
| Year of Election or Appointment: 2005 Prior to his retirement in May 2003, Mr. Dirks was Chief Operating Officer and a member of the Board of The Depository Trust & Clearing Corporation (DTCC) (1999-2003). He also served as President, Chief Operating Officer, and Board member of The Depository Trust Company (DTC) (1999-2003) and President and Board member of the National Securities Clearing Corporation (NSCC) (1999-2003). In addition, Mr. Dirks served as Chief Executive Officer and Board member of the Government Securities Clearing Corporation (2001-2003) and Chief Executive Officer and Board member of the Mortgage-Backed Securities Clearing Corporation (2001-2003). Mr. Dirks also serves as a Trustee and a member of the Finance Committee of Manhattan College (2005-present) and a Trustee and a member of the Finance Committee of AHRC of Nassau County (2006-present). |
Albert R. Gamper, Jr. (64) |
| Year of Election or Appointment: 2006 Mr. Gamper also serves as a Trustee (2006-present) or Member of the Advisory Board (2005-present) of other investment companies advised by FMR. Prior to his retirement in December 2004, Mr. Gamper served as Chairman of the Board of CIT Group Inc. (commercial finance). During his tenure with CIT Group Inc. Mr. Gamper served in numerous senior management positions, including Chairman (1987-1989; 1999-2001; 2002-2004), Chief Executive Officer (1987-2004), and President (1989-2002). He currently serves as a member of the Board of Directors of Public Service Enterprise Group (utilities, 2001-present), Chairman of the Board of Governors, Rutgers University (2004-present), and Chairman of the Board of Saint Barnabas Health Care System. |
Robert M. Gates (62) |
| Year of Election or Appointment: 1997 Dr. Gates is Chairman of the Independent Trustees (2006-present). Dr. Gates is President of Texas A&M University (2002-present). He was Director of the Central Intelligence Agency (CIA) from 1991 to 1993. From 1989 to 1991, Dr. Gates served as Assistant to the President of the United States and Deputy National Security Advisor. Dr. Gates is a Director of NACCO Industries, Inc. (mining and manufacturing), Parker Drilling Co., Inc. (drilling and rental tools for the energy industry, 2001-present), and Brinker International (restaurant management, 2003-present). Previously, Dr. Gates served as a Director of LucasVarity PLC (automotive components and diesel engines), a Director of TRW Inc. (automotive, space, defense, and information technology), and Dean of the George Bush School of Government and Public Service at Texas A&M University (1999-2001). |
George H. Heilmeier (70) |
| Year of Election or Appointment: 2004 Dr. Heilmeier is Chairman Emeritus of Telcordia Technologies (communication software and systems), where prior to his retirement, he served as company Chairman and Chief Executive Officer. He currently serves on the Boards of Directors of The Mitre Corporation (systems engineering and information technology support for the government), and HRL Laboratories (private research and development, 2004-present). He is Chairman of the General Motors Science & Technology Advisory Board and a Life Fellow of the Institute of Electrical and Electronics Engineers (IEEE). Dr. Heilmeier is a member of the Defense Science Board and the National Security Agency Advisory Board. He is also a member of the National Academy of Engineering, the American Academy of Arts and Sciences, and the Board of Overseers of the School of Engineering and Applied Science of the University of Pennsylvania. Previously, Dr. Heilmeier served as a Director of TRW Inc. (automotive, space, defense, and information technology, 1992-2002), Compaq (1994-2002), Automatic Data Processing, Inc. (ADP) (technology-based business outsourcing, 1995-2002), INET Technologies Inc. (telecommunications network surveillance, 2001-2004), and Teletech Holdings (customer management services). He is the recipient of the 2005 Kyoto Prize in Advanced Technology for his invention of the liquid crystal display. |
Marie L. Knowles (59) |
| Year of Election or Appointment: 2001 Prior to Ms. Knowles' retirement in June 2000, she served as Executive Vice President and Chief Financial Officer of Atlantic Richfield Company (ARCO) (diversified energy, 1996-2000). From 1993 to 1996, she was a Senior Vice President of ARCO and President of ARCO Transportation Company. She served as a Director of ARCO from 1996 to 1998. She currently serves as a Director of Phelps Dodge Corporation (copper mining and manufacturing) and McKesson Corporation (healthcare service, 2002-present). Ms. Knowles is a Trustee of the Brookings Institution and the Catalina Island Conservancy and also serves as a member of the Advisory Board for the School of Engineering of the University of Southern California. |
Ned C. Lautenbach (62) |
| Year of Election or Appointment: 2000 Mr. Lautenbach has been a partner of Clayton, Dubilier & Rice, Inc. (private equity investment firm) since September 1998. Previously, Mr. Lautenbach was with the International Business Machines Corporation (IBM) from 1968 until his retirement in 1998. Mr. Lautenbach serves as a Director of Italtel Holding S.p.A. (telecommunications (Milan, Italy), 2004-present) and Eaton Corporation (diversified industrial) as well as the Philharmonic Center for the Arts in Naples, Florida. He also is a member of the Board of Trustees of Fairfield University (2005-present), as well as a member of the Council on Foreign Relations. |
William O. McCoy (72) |
| Year of Election or Appointment: 1997 Prior to his retirement in December 1994, Mr. McCoy was Vice Chairman of the Board of BellSouth Corporation (telecommunications) and President of BellSouth Enterprises. He is currently a Director of Duke Realty Corporation (real estate). He is also a partner of Franklin Street Partners (private investment management firm). In addition, Mr. McCoy served as the Interim Chancellor (1999-2000) and a member of the Board of Visitors for the University of North Carolina at Chapel Hill and currently serves as Chairman of the Board of Directors of the University of North Carolina Health Care System. He also served as Vice President of Finance for the University of North Carolina (16-school system). |
Cornelia M. Small (62) |
| Year of Election or Appointment: 2005 Ms. Small is a member (2000-present) and Chairperson (2002-present) of the Investment Committee, and a member (2002-present) of the Board of Trustees of Smith College. Previously, she served as Chief Investment Officer (1999-2000), Director of Global Equity Investments (1996-1999), and a member of the Board of Directors of Scudder, Stevens & Clark (1990-1997) and Scudder Kemper Investments (1997-1999). In addition, Ms. Small served as Co-Chair (2000-2003) of the Annual Fund for the Fletcher School of Law and Diplomacy. |
William S. Stavropoulos (67) |
| Year of Election or Appointment: 2002 Mr. Stavropoulos is Chairman Emeritus of the Board of Directors of The Dow Chemical Company. Since joining The Dow Chemical Company in 1967, Mr. Stavropoulos served in numerous senior management positions, including President (1993-2000; 2002-2003), CEO (1995-2000; 2002-2004), and Chairman of the Executive Committee (2000-2004). Currently, he is a Director of NCR Corporation (data warehousing and technology solutions), BellSouth Corporation (telecommunications), Chemical Financial Corporation, Maersk Inc. (industrial conglomerate, 2002-present), and Metalmark Capital (private equity investment firm, 2005-present). He also serves as a member of the Board of Trustees of the American Enterprise Institute for Public Policy Research. In addition, Mr. Stavropoulos is a member of The Business Council, J.P. Morgan International Council and the University of Notre Dame Advisory Council for the College of Science. |
Kenneth L. Wolfe (67) |
| Year of Election or Appointment: 2005 Prior to his retirement in 2001, Mr. Wolfe was Chairman and Chief Executive Officer of Hershey Foods Corporation (1993-2001). He currently serves as a member of the boards of Adelphia Communications Corporation (2003-present), Bausch & Lomb, Inc., and Revlon Inc. (2004-present). |
Annual Report
Advisory Board Members and Executive Officers:
Correspondence intended for Mr. Keyes may be sent to Fidelity Investments, P.O. Box 55235, Boston, Massachusetts 02205-5235. Correspondence intended for each executive officer and Mr. Lynch may be sent to Fidelity Investments, 82 Devonshire Street, Boston, Massachusetts 02109.
Name, Age; Principal Occupation |
James H. Keyes (65) |
| Year of Election or Appointment: 2006 Member of the Advisory Board of Fidelity Securities Fund. Prior to his retirement in 2003, Mr. Keyes was Chairman, President, and Chief Executive Officer of Johnson Controls, Inc. (automotive supplier, 1993-2003). He currently serves as a member of the boards of LSI Logic Corporation (semiconductor technologies, 1984-present), Navistar International Corporation (manufacture and sale of trucks, buses, and diesel engines, 2002-present), and Pitney Bowes, Inc. (integrated mail, messaging, and document management solutions, 1998-present). |
Peter S. Lynch (62) |
| Year of Election or Appointment: 2003 Member of the Advisory Board of Fidelity Securities Fund. Mr. Lynch is Vice Chairman and a Director of FMR, and Vice Chairman (2001-present) and a Director (1999-present) of FMR Co., Inc. Previously, Mr. Lynch served as a Trustee of the Fidelity funds (1990-2003). In addition, he serves as the Chairman of the Inner-City Scholarship Fund. |
Dwight D. Churchill (52) |
| Year of Election or Appointment: 2005 Vice President of International Real Estate. Mr. Churchill also serves as Vice President of certain Equity Funds (2005-present). Mr. Churchill is Executive Vice President of FMR (2005-present) and FMR Co., Inc. (2005-present). Previously, Mr. Churchill served as Senior Vice President of Fidelity Investments Money Management, Inc. (2005-2006), Head of Fidelity's Fixed-Income Division (2000-2005), Vice President of Fidelity's Money Market Funds (2000-2005), Vice President of Fidelity's Bond Funds, and Senior Vice President of FMR. |
Matthew Lentz (32) |
| Year of Election or Appointment: 2006 Vice President of International Real Estate. Prior to assuming his current responsibilities, Mr. Lentz has worked as a research analyst and portfolio manager. |
Eric D. Roiter (57) |
| Year of Election or Appointment: 2004 Secretary of International Real Estate. He also serves as Secretary of other Fidelity funds; Vice President, General Counsel, and Secretary of FMR Co., Inc. (2001-present) and FMR; Assistant Secretary of Fidelity Management & Research (U.K.) Inc. (2001-present), Fidelity Research & Analysis Company (2001-present), and Fidelity Investments Money Management, Inc. (2001-present). Mr. Roiter is an Adjunct Member, Faculty of Law, at Boston College Law School (2003-present). Previously, Mr. Roiter served as Vice President and Secretary of Fidelity Distributors Corporation (FDC) (1998-2005). |
Stuart Fross (46) |
| Year of Election or Appointment: 2004 Assistant Secretary of International Real Estate. Mr. Fross also serves as Assistant Secretary of other Fidelity funds (2003-present), Vice President and Secretary of FDC (2005-present), and is an employee of FMR. |
Christine Reynolds (47) |
| Year of Election or Appointment: 2004 President and Treasurer of International Real Estate. Ms. Reynolds also serves as President and Treasurer of other Fidelity funds (2004-present) and is a Vice President (2003-present) and an employee (2002-present) of FMR. Before joining Fidelity Investments, Ms. Reynolds worked at PricewaterhouseCoopers LLP (PwC) (1980-2002), where she was most recently an audit partner with PwC's investment management practice. |
R. Stephen Ganis (40) |
| Year of Election or Appointment: 2006 Anti-Money Laundering (AML) officer of International Real Estate. Mr. Ganis also serves as AML officer of other Fidelity funds (2006-present) and FMR Corp. (2003-present). Before joining Fidelity Investments, Mr. Ganis practiced law at Goodwin Procter, LLP (2000-2002). |
Joseph B. Hollis (58) |
| Year of Election or Appointment: 2006 Chief Financial Officer of International Real Estate. Mr. Hollis also serves as Chief Financial Officer of other Fidelity funds. Mr. Hollis is President of Fidelity Pricing and Cash Management Services (FPCMS) (2005-present). Mr. Hollis also serves as President and Director of Fidelity Service Company, Inc. (2006-present). Previously, Mr. Hollis served as Senior Vice President of Cash Management Services (1999-2002) and Investment Management Operations (2002-2005). |
Kenneth A. Rathgeber (59) |
| Year of Election or Appointment: 2004 Chief Compliance Officer of International Real Estate. Mr. Rathgeber also serves as Chief Compliance Officer of other Fidelity funds (2004-present) and Executive Vice President of Risk Oversight for Fidelity Investments (2002-present). He is Chief Compliance Officer of FMR (2005-present), FMR Co., Inc. (2005-present), Fidelity Management & Research (U.K.) Inc. (2005-present), Fidelity Research & Analysis Company (2005-present), Fidelity Investments Money Management, Inc. (2005-present), and Strategic Advisers, Inc. (2005-present). Previously, Mr. Rathgeber served as Executive Vice President and Chief Operating Officer for Fidelity Investments Institutional Services Company, Inc. (1998-2002). |
Bryan A. Mehrmann (45) |
| Year of Election or Appointment: 2005 Deputy Treasurer of International Real Estate. Mr. Mehrmann also serves as Deputy Treasurer of other Fidelity funds (2005-present) and is an employee of FMR. Previously, Mr. Mehrmann served as Vice President of Fidelity Investments Institutional Services Group (FIIS)/Fidelity Investments Institutional Operations Corporation, Inc. (FIIOC) Client Services (1998-2004). |
Kimberley H. Monasterio (42) |
| Year of Election or Appointment: 2004 Deputy Treasurer of International Real Estate. Ms. Monasterio also serves as Deputy Treasurer of other Fidelity funds (2004) and is an employee of FMR (2004). Before joining Fidelity Investments, Ms. Monasterio served as Treasurer (2000-2004) and Chief Financial Officer (2002-2004) of the Franklin Templeton Funds and Senior Vice President of Franklin Templeton Services, LLC (2000-2004). |
Kenneth B. Robins (36) |
| Year of Election or Appointment: 2005 Deputy Treasurer of International Real Estate. Mr. Robins also serves as Deputy Treasurer of other Fidelity funds (2005-present) and is an employee of FMR (2004-present). Before joining Fidelity Investments, Mr. Robins worked at KPMG LLP, where he was a partner in KPMG's department of professional practice (2002-2004) and a Senior Manager (1999-2000). In addition, Mr. Robins served as Assistant Chief Accountant, United States Securities and Exchange Commission (2000-2002). |
Robert G. Byrnes (39) |
| Year of Election or Appointment: 2005 Assistant Treasurer of International Real Estate. Mr. Byrnes also serves as Assistant Treasurer of other Fidelity funds (2005-present) and is an employee of FMR (2005-present). Previously, Mr. Byrnes served as Vice President of FPCMS (2003-2005). Before joining Fidelity Investments, Mr. Byrnes worked at Deutsche Asset Management where he served as Vice President of the Investment Operations Group (2000-2003). |
John H. Costello (59) |
| Year of Election or Appointment: 2004 Assistant Treasurer of International Real Estate. Mr. Costello also serves as Assistant Treasurer of other Fidelity funds and is an employee of FMR. |
Peter L. Lydecker (52) |
| Year of Election or Appointment: 2004 Assistant Treasurer of International Real Estate. Mr. Lydecker also serves as Assistant Treasurer of other Fidelity funds (2004) and is an employee of FMR. |
Mark Osterheld (51) |
| Year of Election or Appointment: 2004 Assistant Treasurer of International Real Estate. Mr. Osterheld also serves as Assistant Treasurer of other Fidelity funds (2002) and is an employee of FMR. |
Gary W. Ryan (47) |
| Year of Election or Appointment: 2005 Assistant Treasurer of International Real Estate. Mr. Ryan also serves as Assistant Treasurer of other Fidelity funds (2005-present) and is an employee of FMR (2005-present). Previously, Mr. Ryan served as Vice President of Fund Reporting in FPCMS (1999-2005). |
Salvatore Schiavone (40) |
| Year of Election or Appointment: 2005 Assistant Treasurer of International Real Estate. Mr. Schiavone also serves as Assistant Treasurer of other Fidelity funds (2005-present) and is an employee of FMR (2005-present). Before joining Fidelity Investments, Mr. Schiavone worked at Deutsche Asset Management, where he most recently served as Assistant Treasurer (2003-2005) of the Scudder Funds and Vice President and Head of Fund Reporting (1996-2003). |
Annual Report
Distributions
The Board of Trustees of Fidelity International Real Estate Fund voted to pay on September 11, 2006, to shareholders of record at the opening of business on September 8, 2006, a distribution of $0.71 per share derived from capital gains realized from sales of portfolio securities and a dividend of $0.16 per share from net investment income.
The fund hereby designates as a capital gain dividend with respect to the taxable year ended July 31, 2006, $8,353,228, or, if subsequently determined to be different, the net capital gain of such year.
The fund designates 22% and 18% of the dividends distributed in September and December, respectively during the fiscal year as amounts which may be taken into account as a dividend for the purposes of the maximum rate under section 1(h)(11) of the Internal Revenue Code.
The amounts per share which represent income derived from sources within, and taxes paid to, foreign countries or possessions of the United States are as follows:
Pay Date | Income | Taxes |
9/12/05 | $0.203 | 0.0267 |
12/19/05 | $0.074 | 0.0092 |
The fund will notify shareholders in January 2007 of amounts for use in preparing 20006 income tax returns.
Annual Report
Proxy Voting Results
A special meeting of the funds' shareholders was held on May 17, 2006. The results of votes taken among shareholders on the proposal before them are reported below. Each vote reported represents one dollar of net asset value held on the record date for the meeting.
PROPOSAL 1 |
To elect a Board of Trustees. A |
| # of
Votes | % of
Votes |
Dennis J. Dirks |
Affirmative | 43,119,905,166.54 | 95.455 |
Withheld | 2,053,001,967.67 | 4.545 |
TOTAL | 45,172,907,134.21 | 100.000 |
Albert R. Gamper, Jr. |
Affirmative | 43,068,780,128.62 | 95.342 |
Withheld | 2,104,127,005.59 | 4.658 |
TOTAL | 45,172,907,134.21 | 100.000 |
Robert M. Gates |
Affirmative | 43,032,117,662.60 | 95.261 |
Withheld | 2,140,789,471.61 | 4.739 |
TOTAL | 45,172,907,134.21 | 100.000 |
George H. Heilmeier |
Affirmative | 43,023,368,882.30 | 95.242 |
Withheld | 2,149,538,251.91 | 4.758 |
TOTAL | 45,172,907,134.21 | 100.000 |
Edward C. Johnson 3d |
Affirmative | 42,881,915,819.70 | 94.928 |
Withheld | 2,290,991,314.51 | 5.072 |
TOTAL | 45,172,907,134.21 | 100.000 |
Stephen P. Jonas |
Affirmative | 43,081,912,066.37 | 95.371 |
Withheld | 2,090,995,067.84 | 4.629 |
TOTAL | 45,172,907,134.21 | 100.000 |
James H. KeyesB |
Affirmative | 43,049,050,093.79 | 95.298 |
Withheld | 2,123,857,040.42 | 4.702 |
TOTAL | 45,172,907,134.21 | 100.000 |
Marie L. Knowles |
Affirmative | 43,090,434,696.02 | 95.390 |
Withheld | 2,082,472,438.19 | 4.610 |
TOTAL | 45,172,907,134.21 | 100.000 |
| # of
Votes | % of
Votes |
Ned C. Lautenbach |
Affirmative | 43,082,185,255.05 | 95.372 |
Withheld | 2,090,721,879.16 | 4.628 |
TOTAL | 45,172,907,134.21 | 100.000 |
William O. McCoy |
Affirmative | 42,960,162,066.32 | 95.102 |
Withheld | 2,212,745,067.89 | 4.898 |
TOTAL | 45,172,907,134.21 | 100.000 |
Robert L. Reynolds |
Affirmative | 43,087,560,419.66 | 95.384 |
Withheld | 2,085,346,714.55 | 4.616 |
TOTAL | 45,172,907,134.21 | 100.000 |
Cornelia M. Small |
Affirmative | 43,092,070,014.53 | 95.394 |
Withheld | 2,080,837,119.68 | 4.606 |
TOTAL | 45,172,907,134.21 | 100.000 |
William S. Stavropoulos |
Affirmative | 43,002,032,676.43 | 95.194 |
Withheld | 2,170,874,457.78 | 4.806 |
TOTAL | 45,172,907,134.21 | 100.000 |
Kenneth L. Wolfe |
Affirmative | 43,047,241,852.81 | 95.294 |
Withheld | 2,125,665,281.40 | 4.706 |
TOTAL | 45,172,907,134.21 | 100.000 |
A Denotes trust-wide proposal and voting results. B Effective on or about January 1, 2007. |
Annual Report
Board Approval of Investment Advisory Contracts and Management Fees
Fidelity International Real Estate Fund
Each year, typically in July, the Board of Trustees, including the Independent Trustees (together, the Board), votes on the renewal of the management contract and sub-advisory agreements (together, the Advisory Contracts) for the fund. The Board, assisted by the advice of fund counsel and Independent Trustees' counsel, requests and considers a broad range of information throughout the year.
The Board meets regularly each month except August and takes into account throughout the year matters bearing on Advisory Contracts. The Board, acting directly and through its separate committees, considers at each of its meetings factors that are relevant to the annual renewal of the fund's Advisory Contracts, including the services and support provided to the fund and its shareholders. At the time of the renewal, the Board had 12 standing committees, each composed of Independent Trustees with varying backgrounds, to which the Board has assigned specific subject matter responsibilities in order to enhance effective decision-making by the Board. Each committee has adopted a written charter outlining the structure and purposes of the committee. One such committee, the Equity Contract Committee, meets periodically as needed throughout the year to consider matters specifically related to the annual renewal of Advisory Contracts. The committee requests and receives information on, and makes recommendations to the Independent Trustees concerning, the approval and annual review of the Advisory Contracts.
At its July 2006 meeting, the Board of Trustees, including the Independent Trustees, unanimously determined to renew the Advisory Contracts for the fund. In reaching its determination, the Board considered all factors it believed relevant, including (i) the nature, extent, and quality of the services to be provided to the fund and its shareholders (including the investment performance of the fund); (ii) the competitiveness of the management fee and total expenses of the fund; (iii) the total costs of the services to be provided by and the profits to be realized by the investment adviser and its affiliates from the relationship with the fund; (iv) the extent to which economies of scale would be realized as the fund grows; and (v) whether fee levels reflect these economies of scale, if any, for the benefit of fund shareholders.
In determining whether to renew the Advisory Contracts for the fund, the Board ultimately reached a determination, with the assistance of fund counsel and Independent Trustees' counsel, that the renewal of the Advisory Contracts and the compensation to be received by Fidelity under the management contract is consistent with Fidelity's fiduciary duty under applicable law. In addition to evaluating the specific factors noted above, the Board, in reaching its determination, is aware that shareholders in the fund have a broad range of investment choices available to them, including a wide choice among mutual funds offered by competitors to Fidelity, and that the fund's shareholders, with the opportunity to review and weigh the disclosure provided by the fund in its prospectus and other public disclosures, have chosen to invest in this fund, managed by Fidelity.
Annual Report
Nature, Extent, and Quality of Services Provided. The Board considered staffing within the investment adviser, FMR, and the sub-advisers (together, the Investment Advisers), including the background of the fund's portfolio manager and the fund's investment objective and discipline. The Independent Trustees also had discussions with senior management of Fidelity's investment operations and investment groups. The Board considered the structure of the portfolio manager compensation program and whether this structure provides appropriate incentives.
Resources Dedicated to Investment Management and Support Services. The Board reviewed the size, education, and experience of the Investment Advisers' investment staff, their use of technology, and the Investment Advisers' approach to recruiting, training, and retaining portfolio managers and other research, advisory, and management personnel. The Board considered Fidelity's extensive global research capabilities that enable the Investment Advisers to aggregate data from various sources in an effort to produce positive investment results. The Board noted that Fidelity's analysts have access to a variety of technological tools that enable them to perform both fundamental and quantitative analysis and to specialize in various disciplines. The Board also considered that Fidelity's portfolio managers and analysts have access to daily portfolio attribution that allows for monitoring of a fund's portfolio, as well as an electronic communication system that provides immediate real-time access to research concerning issuers and credit enhancers.
Shareholder and Administrative Services. The Board considered (i) the nature, extent, quality, and cost of administrative, distribution, and shareholder services performed by the Investment Advisers and their affiliates under the Advisory Contracts and under separate agreements covering transfer agency, pricing and bookkeeping, and securities lending services for the fund; (ii) the nature and extent of the Investment Advisers' supervision of third party service providers, principally custodians and subcustodians; and (iii) the resources devoted to, and the record of compliance with, the fund's compliance policies and procedures. The Board reviewed the allocation of fund brokerage, including allocations to brokers affiliated with the Investment Advisers, the use of brokerage commissions to pay fund expenses, and the use of "soft" commission dollars to pay for research services. The Board also considered that Fidelity voluntarily pays for market data out of its own resources.
The Board noted that the growth of fund assets across the complex allows Fidelity to reinvest in the development of services designed to enhance the value or convenience of the Fidelity funds as investment vehicles. These services include 24-hour access to account information and market information through phone representatives and over the Internet, and investor education materials and asset allocation tools.
Annual Report
Board Approval of Investment Advisory Contracts and
Management Fees - continued
Investment in a Large Fund Family. The Board considered the benefits to shareholders of investing in a Fidelity fund, including the benefits of investing in a fund that is part of a large family of funds offering a variety of investment disciplines and providing for a large variety of mutual fund investor services. For example, fund shareholders are offered the privilege of exchanging shares of the fund for shares of other Fidelity funds, as set forth in the fund's prospectus, without paying a sales charge. The Board noted that, since the last Advisory Contract renewals in July 2005, Fidelity has taken a number of actions that benefited particular funds, including (i) dedicating additional resources to investment research and to restructure the investment research teams; (ii) voluntarily entering into contractual arrangements with certain brokers pursuant to which Fidelity pays for research products and services separately out of its own resources, rather than bundling with fund commissions; (iii) launching the Fidelity Advantage Class of its five Spartan stock index funds and three Spartan bond index funds, which is a lower-fee class available to shareholders with higher account balances; (iv) contractually agreeing to impose expense limitations on Fidelity U.S. Bond Index Fund and reducing the fund's initial investment minimum; and (v) offering shareholders of each of the Fidelity Institutional Money Market Funds the privilege of exchanging shares of the fund for shares of other Fidelity funds.
Investment Performance and Compliance. The Board considered whether the fund has operated within its investment objective, as well as its record of compliance with its investment restrictions. It also reviewed the fund's absolute investment performance, as well as the fund's relative investment performance measured against (i) a broad-based securities market index, and (ii) a peer group of mutual funds. Because the fund had been in existence less than three calendar years, the following chart considered by the Board shows, for the one-year period ended December 31, 2005, the fund's total return, the total return of a broad-based securities market index ("benchmark"), and a range of total returns of a peer group of mutual funds identified by Lipper Inc. as having an investment objective similar to that of the fund. The box within the chart shows the 25th percentile return (bottom of box) and the 75th percentile return (top of box) of the Lipper peer group. Returns shown above the box are in the first quartile and returns shown below the box are in the fourth quartile. The percentage beaten number noted below the chart corresponds to the percentile box and represents the percentage of funds in the Lipper peer group whose performance was equal to or lower than that of the fund.
Annual Report
Fidelity International Real Estate Fund
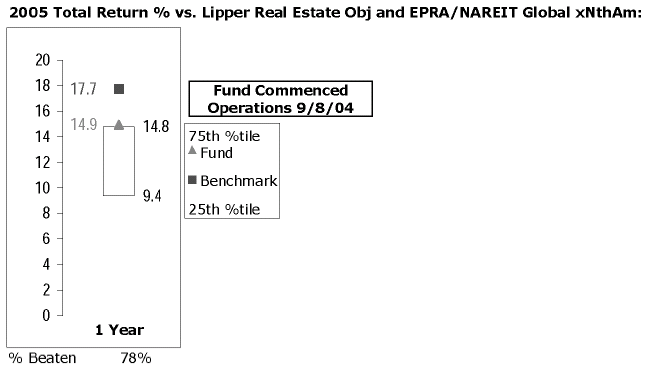
The Board reviewed the fund's relative investment performance against its Lipper peer group and stated that the performance of the fund was in the first quartile for the period shown. The Board noted that FMR does not consider that Lipper peer group to be a meaningful comparison for the fund, however, because the peer group mainly comprises funds that invest in U.S. real estate securities, while the fund invests primarily in non-U.S. real estate securities. The Board also stated that the relative investment performance of the fund was lower than its benchmark for the period shown. The Board stated that it is difficult to evaluate in any comprehensive fashion the performance of the fund, in light of its relatively recent launch.
The Board considered that FMR has taken steps to refocus and strengthen equity research, equity portfolio management, and compliance. The Board noted with favor FMR's reorganization of its senior management team in 2005 and FMR's dedication of additional resources to investment research, and participated in the process that led to those changes.
Based on its review, and giving particular weight to the nature and quality of the resources dedicated by the Investment Advisers to maintain and improve relative performance, the Board concluded that the nature, extent, and quality of the services provided to the fund will benefit the fund's shareholders, particularly in light of the Board's view that the fund's shareholders benefit from investing in a fund that is part of a large family of funds offering a variety of investment disciplines and services.
Competitiveness of Management Fee and Total Fund Expenses. The Board considered the fund's management fee and total expenses compared to "mapped groups" of competitive funds and classes. Fidelity creates "mapped groups" by combining similar Lipper investment objective categories that have comparable management fee characteristics. Combining Lipper investment objective categories aids the Board's management fee and total expense comparisons by broadening the competitive group used for comparison and by reducing the number of universes to which various Fidelity funds are compared.
Annual Report
Board Approval of Investment Advisory Contracts and
Management Fees - continued
The Board considered two proprietary management fee comparisons for the 12-month (or shorter) periods shown in the chart below. The group of Lipper funds used by the Board for management fee comparisons is referred to below as the "Total Mapped Group" and, for the reasons explained above, is broader than the Lipper peer group used by the Board for performance comparisons. The Total Mapped Group comparison focuses on a fund's standing relative to the total universe of comparable funds available to investors, in terms of gross management fees before expense reimbursements or caps. "TMG %" represents the percentage of funds in the Total Mapped Group that had management fees that were lower than the fund's. For example, a TMG % of 41% means that 59% of the funds in the Total Mapped Group had higher management fees than the fund. The "Asset-Size Peer Group" (ASPG) comparison focuses on a fund's standing relative to non-Fidelity funds similar in size to the fund within the Total Mapped Group. The ASPG represents at least 15% of the funds in the Total Mapped Group with comparable asset size and management fee characteristics, subject to a minimum of 50 funds (or all funds in the Total Mapped Group if fewer than 50). Additional information, such as the ASPG quartile in which the fund's management fee ranked, is also included in the chart and considered by the Board.
Fidelity International Real Estate Fund
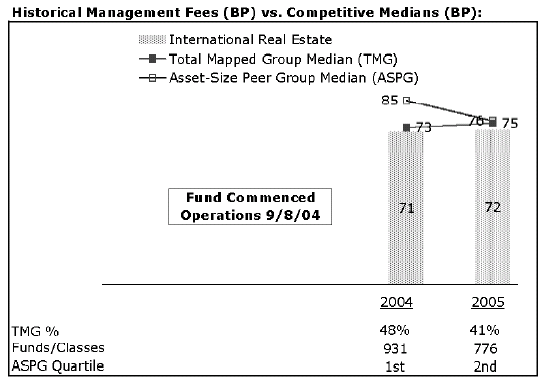
Annual Report
The Board noted that the fund's management fee ranked below the median of its Total Mapped Group and below the median of its ASPG for 2005.
Based on its review, the Board concluded that the fund's management fee was fair and reasonable in light of the services that the fund receives and the other factors considered.
In its review of the fund's total expenses, the Board considered the fund's management fee as well as other fund expenses, such as transfer agent fees, pricing and bookkeeping fees, and custodial, legal, and audit fees. The Board also noted the effects of any waivers and reimbursements on fees and expenses. As part of its review, the Board also considered current and historical total expenses of the fund compared to competitive fund median expenses. The fund is compared to those funds and classes in the Total Mapped Group (used by the Board for management fee comparisons) that have a similar sales load structure.
The Board noted that the fund's total expenses ranked above its competitive median for 2005. The Board considered that, despite the fund's international focus, Lipper categorizes the fund in the real estate objective, rather than in an international objective. If the fund were compared to a mapped group that comprises funds that have an international focus, the fund would be below median.
In its review of total expenses, the Board also considered Fidelity fee structures and other information on clients that FMR and its affiliates service in other competitive markets, such as other mutual funds advised or subadvised by FMR or its affiliates, pension plan clients, and other institutional clients.
Based on its review, the Board concluded that the fund's total expenses were reasonable, although above the median of the universe presented for comparison, in light of the services that the fund and its shareholders receive and the other factors considered.
Costs of the Services and Profitability. The Board considered the revenues earned and the expenses incurred by Fidelity in conducting the business of developing, marketing, distributing, managing, administering and servicing the fund and its shareholders. The Board also considered the level of Fidelity's profits in respect of all the Fidelity funds.
On an annual basis, FMR presents to the Board Fidelity's profitability for the fund. Fidelity calculates the profitability for each fund, as well as aggregate profitability for groups of Fidelity funds and all Fidelity funds, using a series of detailed revenue and cost allocation methodologies which originate with the audited books and records of Fidelity. The Audit Committee of the Board reviews any significant changes from the prior year's methodologies.
Annual Report
Board Approval of Investment Advisory Contracts and
Management Fees - continued
PricewaterhouseCoopers LLP (PwC), independent registered accounting firm and auditor to Fidelity and certain Fidelity funds, has been engaged annually by the Board as part of the Board's assessment of the results of Fidelity's profitability analysis. PwC's engagement includes the review and assessment of Fidelity's methodologies used in determining the revenues and expenses attributable to Fidelity's mutual fund business, and completion of agreed-upon procedures surrounding the mathematical accuracy of fund profitability and its conformity to allocation methodologies. After considering PwC's reports issued under the engagement and information provided by Fidelity, the Board believes that while other allocation methods may also be reasonable, Fidelity's profitability methodologies are reasonable in all material respects.
The Board has also reviewed Fidelity's non-fund businesses and any fall-out benefits related to the mutual fund business as well as cases where Fidelity's affiliates may benefit from or be related to the fund's business.
The Board considered the costs of the services provided by and the profits realized by Fidelity in connection with the operation of the fund and determined that the amount of profit is a fair entrepreneurial profit for the management of the fund.
Economies of Scale. The Board considered whether there have been economies of scale in respect of the management of the Fidelity funds, whether the Fidelity funds (including the fund) have appropriately benefited from any such economies of scale, and whether there is potential for realization of any further economies of scale. The Board considered the extent to which the fund will benefit from economies of scale through increased services to the fund, through waivers or reimbursements, or through fee or expense reductions, including reductions that occur through operation of the transfer agent agreement. The transfer agent fee varies in part based on the number of accounts in the fund. If the number of accounts decreases or the average account size increases, the overall transfer agent fee rate decreases.
The Board recognized that the fund's management contract incorporates a "group fee" structure, which provides for lower fee rates as total fund assets under FMR's management increase, and for higher fee rates as total fund assets under FMR's management decrease. The Board considered that the group fee is designed to deliver the benefits of economies of scale to fund shareholders when total fund assets increase, even if assets of any particular fund are unchanged or have declined, because some portion of Fidelity's costs are attributable to services provided to all Fidelity funds, and all funds benefit if those costs can be allocated among more assets. The Board concluded that, given the group fee structure, fund shareholders will achieve a certain level of economies of scale as assets under FMR's management increase at the fund complex level, regardless of whether Fidelity achieves any such economies of scale.
The Board further concluded that any potential economies of scale are being shared between fund shareholders and Fidelity in an appropriate manner.
Annual Report
Additional Information Requested by the Board. In order to develop fully the factual basis for consideration of the Advisory Contracts, the Board requested additional information on several topics, including (i) Fidelity's fund profitability methodology and profitability trends within certain funds; (ii) portfolio manager compensation; (iii) the extent to which any economies of scale exist and are shared between the funds and Fidelity; (iv) the total expenses of certain funds and classes relative to competitors, including the extent to which the expenses of certain funds have been or could be capped; (v) fund performance trends; and (vi) Fidelity's fee structures, including use of performance fees.
Based on its evaluation of all of the conclusions noted above, and after considering all material factors, the Board ultimately concluded that the advisory fee structures are fair and reasonable, and that the fund's Advisory Contracts should be renewed.
Annual Report
Managing Your Investments
Fidelity offers several ways to conveniently manage your personal investments via your telephone or PC. You can access your account information, conduct trades and research your investments 24 hours a day.
By Phone
Fidelity Automated Service Telephone provides a single toll-free number to access account balances, positions, quotes and trading. It's easy to navigate the service, and on your first call, the system will help you create a personal identification number (PIN) for security.
(phone_graphic)
Fidelity Automated
Service Telephone (FAST®)
1-800-544-5555
Press
1 For mutual fund and brokerage trading.
2 For quotes.*
3 For account balances and holdings.
4 To review orders and mutual
fund activity.
5 To change your PIN.
*0 To speak to a Fidelity representative.
By PC
Fidelity's web site on the Internet provides a wide range of information, including daily financial news, fund performance, interactive planning tools and news about Fidelity products and services.
(computer_graphic)
Fidelity's Web Site
www.fidelity.com
* When you call the quotes line, please remember that a fund's yield and return will vary and, except for money market funds, share price will also vary. This means that you may have a gain or loss when you sell your shares. There is no assurance that money market funds will be able to maintain a stable $1 share price; an investment in a money market fund is not insured or guaranteed by the U.S. government. Total returns are historical and include changes in share price, reinvestment of dividends and capital gains, and the effects of any sales charges.
Annual Report
To Write Fidelity
We'll give your correspondence immediate attention and send you written confirmation upon completion of your request.
(letter_graphic)
Making Changes
To Your Account
(such as changing name, address, bank, etc.)
Fidelity Investments
P.O. Box 770001
Cincinnati, OH 45277-0002
(letter_graphic)
For Non-Retirement
Accounts
Buying shares
Fidelity Investments
P.O. Box 770001
Cincinnati, OH 45277-0003
Overnight Express
Fidelity Investments
Attn: Distribution Services
100 Crosby Parkway - KC1H
Covington, KY 41015
Selling shares
Fidelity Investments
P.O. Box 770001
Cincinnati, OH 45277-0035
Overnight Express
Fidelity Investments
Attn: Distribution Services
100 Crosby Parkway - KC1H
Covington, KY 41015
General Correspondence
Fidelity Investments
P.O. Box 500
Merrimack, NH 03054-0500
(letter_graphic)
For Retirement
Accounts
Buying shares
Fidelity Investments
P.O. Box 770001
Cincinnati, OH 45277-0003
Selling shares
Fidelity Investments
P.O. Box 770001
Cincinnati, OH 45277-0035
Overnight Express
Fidelity Investments
Attn: Distribution Services
100 Crosby Parkway - KC1H
Covington, KY 41015
General Correspondence
Fidelity Investments
P.O. Box 500
Merrimack, NH 03054-0500
Annual Report
To Visit Fidelity
For directions and hours,
please call 1-800-544-9797.
Arizona
7001 West Ray Road
Chandler, AZ
15445 N. Scottsdale Road
Scottsdale, AZ
California
815 East Birch Street
Brea, CA
1411 Chapin Avenue
Burlingame, CA
851 East Hamilton Avenue
Campbell, CA
19200 Von Karman Avenue
Irvine, CA
601 Larkspur Landing Circle
Larkspur, CA
10100 Santa Monica Blvd.
Los Angeles, CA
27101 Puerta Real
Mission Viejo, CA
73-575 El Paseo
Palm Desert, CA
251 University Avenue
Palo Alto, CA
123 South Lake Avenue
Pasadena, CA
16995 Bernardo Ctr. Drive
Rancho Bernardo, CA
1220 Roseville Parkway
Roseville, CA
1740 Arden Way
Sacramento, CA
7676 Hazard Center Drive
San Diego, CA
11943 El Camino Real
San Diego, CA
8 Montgomery Street
San Francisco, CA
3793 State Street
Santa Barbara, CA
1200 Wilshire Boulevard
Santa Monica, CA
21701 Hawthorne Boulevard
Torrance, CA
2001 North Main Street
Walnut Creek, CA
6300 Canoga Avenue
Woodland Hills, CA
Colorado
1625 Broadway
Denver, CO
9185 Westview Road
Lone Tree, CO
Connecticut
48 West Putnam Avenue
Greenwich, CT
265 Church Street
New Haven, CT
300 Atlantic Street
Stamford, CT
29 South Main Street
West Hartford, CT
Delaware
400 Delaware Avenue
Wilmington, DE
Florida
4400 N. Federal Highway
Boca Raton, FL
121 Alhambra Plaza
Coral Gables, FL
2948 N. Federal Highway
Ft. Lauderdale, FL
4671 Town Center Parkway
Jacksonville, FL
1907 West State Road 434
Longwood, FL
8880 Tamiami Trail, North
Naples, FL
3501 PGA Boulevard
Palm Beach Gardens, FL
3550 Tamiami Trail, South
Sarasota, FL
1502 N. Westshore Blvd.
Tampa, FL
2465 State Road 7
Wellington, FL
Georgia
3445 Peachtree Road, N.E.
Atlanta, GA
1000 Abernathy Road
Atlanta, GA
Illinois
One North LaSalle Street
Chicago, IL
875 North Michigan Ave.
Chicago, IL
1415 West 22nd Street
Oak Brook, IL
1572 East Golf Road
Schaumburg, IL
3232 Lake Avenue
Wilmette, IL
Indiana
4729 East 82nd Street
Indianapolis, IN
Kansas
5400 College Boulevard
Overland Park, KS
Maine
Three Canal Plaza
Portland, ME
Maryland
7315 Wisconsin Avenue
Bethesda, MD
One W. Pennsylvania Ave.
Towson, MD
Massachusetts
801 Boylston Street
Boston, MA
155 Congress Street
Boston, MA
300 Granite Street
Braintree, MA
44 Mall Road
Burlington, MA
238 Main Street
Cambridge, MA
405 Cochituate Road
Framingham, MA
416 Belmont Street
Worcester, MA
Annual Report
Michigan
500 E. Eisenhower Pkwy.
Ann Arbor, MI
280 Old N. Woodward Ave.
Birmingham, MI
43420 Grand River Avenue
Novi, MI
29155 Northwestern Hwy.
Southfield, MI
Minnesota
7600 France Avenue South
Edina, MN
Missouri
1524 South Lindbergh Blvd.
St. Louis, MO
Nevada
2225 Village Walk Drive
Henderson, NV
New Jersey
150 Essex Street
Millburn, NJ
56 South Street
Morristown, NJ
396 Route 17, North
Paramus, NJ
3518 Route 1 North
Princeton, NJ
530 Broad Street
Shrewsbury, NJ
New York
1055 Franklin Avenue
Garden City, NY
37 West Jericho Turnpike
Huntington Station, NY
1271 Avenue of the Americas
New York, NY
980 Madison Avenue
New York, NY
61 Broadway
New York, NY
350 Park Avenue
New York, NY
200 Fifth Avenue
New York, NY
733 Third Avenue
New York, NY
11 Penn Plaza
New York, NY
2070 Broadway
New York, NY
1075 Northern Blvd.
Roslyn, NY
799 Central Park Avenue
Scarsdale, NY
North Carolina
4611 Sharon Road
Charlotte, NC
7011 Fayetteville Road
Durham, NC
Ohio
3805 Edwards Road
Cincinnati, OH
1324 Polaris Parkway
Columbus, OH
28699 Chagrin Boulevard
Woodmere Village, OH
Oregon
7493 SW Bridgeport Road
Tigard, OR
Pennsylvania
600 West DeKalb Pike
King of Prussia, PA
1735 Market Street
Philadelphia, PA
12001 Perry Highway
Wexford, PA
Rhode Island
47 Providence Place
Providence, RI
Tennessee
6150 Poplar Avenue
Memphis, TN
Texas
10000 Research Boulevard
Austin, TX
4001 Northwest Parkway
Dallas, TX
12532 Memorial Drive
Houston, TX
2701 Drexel Drive
Houston, TX
6560 Fannin Street
Houston, TX
6500 N. MacArthur Blvd.
Irving, TX
6005 West Park Boulevard
Plano, TX
14100 San Pedro
San Antonio, TX
1576 East Southlake Blvd.
Southlake, TX
19740 IH 45 North
Spring, TX
Utah
279 West South Temple
Salt Lake City, UT
Virginia
1861 International Drive
McLean, VA
Washington
411 108th Avenue, N.E.
Bellevue, WA
1518 6th Avenue
Seattle, WA
Washington, DC
1900 K Street, N.W.
Washington, DC
Wisconsin
595 North Barker Road
Brookfield, WI
Fidelity Brokerage Services, Inc., 100 Summer St., Boston, MA 02110 Member NYSE/SIPC
Annual Report
Investment Adviser
Fidelity Management & Research Company
Boston, MA
Investment Sub-Advisers
FMR Co., Inc.
Fidelity Research & Analysis Company
(formerly Fidelity Management &
Research (Far East) Inc.)
Fidelity Management & Research
(U.K.) Inc.
Fidelity Investments Japan Limited
Fidelity International Investment
Advisers
Fidelity International Investment
Advisers (U.K.) Limited
General Distributor
Fidelity Distributors Corporation
Boston, MA
Transfer and Service Agent
Fidelity Service Company, Inc.
Boston, MA
Custodian
Mellon Bank, N.A.
Pittsburgh, PA
The Fidelity Telephone Connection
Mutual Fund 24-Hour Service
Exchanges/Redemptions
and Account Assistance 1-800-544-6666
Product Information 1-800-544-6666
Retirement Accounts 1-800-544-4774
(8 a.m. - 9 p.m.)
TDD Service 1-800-544-0118
for the deaf and hearing impaired
(9 a.m. - 9 p.m. Eastern time)
Fidelity Automated Service
Telephone (FAST®) (automated graphic) 1-800-544-5555
(automated graphic) Automated line for quickest service
IRE-UANN-0906
1.801327.101
(Fidelity Investment logo)(registered trademark)
Corporate Headquarters
82 Devonshire St., Boston, MA 02109
www.fidelity.com
Fidelity®
Leveraged Company Stock
Fund
Annual Report
July 31, 2006
(2_fidelity_logos) (Registered_Trademark)
Contents
Chairman's Message | <Click Here> | Ned Johnson's message to shareholders. |
Performance | <Click Here> | How the fund has done over time. |
Management's Discussion | <Click Here> | The manager's review of fund performance, strategy and outlook |
Shareholder Expense Example | <Click Here> | An example of shareholder expenses. |
Investment Changes | <Click Here> | A summary of major shifts in the fund's investments over the last six months. |
Investments | <Click Here> | A complete list of the fund's investments with their market values. |
Financial Statements | <Click Here> | Statements of assets and liabilities, operations, and changes in net assets,
as well as financial highlights. |
Notes | <Click Here> | Notes to the financial statements. |
Report of Independent Registered Public Accounting Firm | <Click Here> | |
Trustees and Officers | <Click Here> | |
Distributions | <Click Here> | |
Proxy Voting Results | <Click Here> | |
Board Approval of Investment Advisory Contracts and Management Fees | <Click Here> | |
To view a fund's proxy voting guidelines and proxy voting record for the 12-month period ended June 30, visit www.fidelity.com/proxyvotingresults or visit the Securities and Exchange Commission's (SEC) web site at www.sec.gov. You may also call 1-800-544-8544 to request a free copy of the proxy voting guidelines.
Standard & Poor's, S&P and S&P 500 are registered service marks of The McGraw-Hill Companies, Inc. and have been licensed for use by Fidelity Distributors Corporation.
Other third party marks appearing herein are the property of their respective owners.
All other marks appearing herein are registered or unregistered trademarks or service marks of FMR Corp. or an affiliated company.
Annual Report
This report and the financial statements contained herein are submitted for the general information of the shareholders of the fund. This report is not authorized for distribution to prospective investors in the fund unless preceded or accompanied by an effective prospectus.
A fund files its complete schedule of portfolio holdings with the SEC for the first and third quarters of each fiscal year on Form N-Q. Forms N-Q are available on the SEC's web site at http://www.sec.gov. A fund's Forms N-Q may be reviewed and copied at the SEC's Public Reference Room in Washington, DC. Information regarding the operation of the SEC's Public Reference Room may be obtained by calling 1-800-SEC-0330. For a complete list of a fund's portfolio holdings, view the most recent quarterly holdings report, semiannual report, or annual report on Fidelity's web site at http://www.fidelity.com/holdings.
NOT FDIC INSURED · MAY LOSE VALUE · NO BANK GUARANTEE
Neither the fund nor Fidelity Distributors Corporation is a bank.
Annual Report
Chairman's Message
(photo_of_Edward_C_Johnson_3d)
Dear Shareholder:
Although many securities markets made gains in early 2006, inflation concerns led to mixed results through the year's mid-point. Financial markets are always unpredictable. There are, however, a number of time-tested principles that can put the historical odds in your favor.
One of the basic tenets is to invest for the long term. Over time, riding out the markets' inevitable ups and downs has proven much more effective than selling into panic or chasing the hottest trend. Even missing only a few of the markets' best days can significantly diminish investor returns. Patience also affords the benefits of compounding - of earning interest on additional income or reinvested dividends and capital gains. There are tax advantages and cost benefits to consider as well. The more you sell, the more taxes you pay, and the more you trade, the higher the costs. While staying the course doesn't eliminate risk, it can considerably lessen the effect of short-term declines.
You can further manage your investing risk through diversification. And today, more than ever, geographic diversification should be taken into account. Studies indicate that asset allocation is the single most important determinant of a portfolio's long-term success. The right mix of stocks, bonds and cash - aligned to your particular risk tolerance and investment objective - is very important. Age-appropriate rebalancing is also an essential aspect of asset allocation. For younger investors, an emphasis on equities - which historically have been the best performing asset class over time - is encouraged. As investors near their specific goal, such as retirement or sending a child to college, consideration may be given to replacing volatile assets (e.g. common stocks) with more-stable fixed investments (bonds or savings plans).
A third investment principle - investing regularly - can help lower the average cost of your purchases. Investing a certain amount of money each month or quarter helps ensure you won't pay for all your shares at market highs. This strategy - known as dollar cost averaging - also reduces unconstructive "emotion" from investing, helping shareholders avoid selling weak performers just prior to an upswing, or chasing a hot performer just before a correction.
We invite you to contact us via the Internet, through our Investor Centers or over the phone. It is our privilege to provide you the information you need to make the investments that are right for you.
Sincerely,
/s/Edward C. Johnson 3d
Edward C. Johnson 3d
Annual Report
Performance: The Bottom Line
Average annual total return reflects the change in the value of an investment, assuming reinvestment of the fund's dividend income and capital gains (the profits earned upon the sale of securities that have grown in value) and assuming a constant rate of performance each year. The $10,000 table and the fund's returns do not reflect the deduction of taxes that a shareholder would pay on fund distributions or the redemption of fund shares. During periods of reimbursement by Fidelity, a fund's total return will be greater than it would be had the reimbursement not occurred. How a fund did yesterday is no guarantee of how it will do tomorrow.
Average Annual Total Returns
Periods ended July 31, 2006 | Past 1
year | Past 5
years | Life of
fundA |
Fidelity® Leveraged Company Stock Fund | 12.80% | 24.29% | 22.75% |
A From December 19, 2000
$10,000 Over Life of Fund
Let's say hypothetically that $10,000 was invested in Fidelity ® Leveraged Company Stock Fund on December 19, 2000, when the fund started. The chart shows how the value of your investment would have changed, and also shows how the Standard & Poor'sSM 500 Index performed over the same period.
Annual Report
Management's Discussion of Fund Performance
Comments from Thomas Soviero, Portfolio Manager of Fidelity® Leveraged Company Stock Fund
As measured by the Dow Jones Wilshire 5000 Composite IndexSM - the broadest measure of U.S. equity market performance - stocks did well for most of the 12-month period ending July 31, 2006, before faltering. For the one-year time frame as a whole, the Dow Jones Wilshire benchmark rose 5.43%. That was nearly identical to the 5.38% gain of the Standard & Poor's 500SM Index, a broad market proxy that's a reflection of larger-cap stocks. Stocks were resilient early on, bouncing back quickly after Hurricanes Katrina and Rita caused energy prices to spike to record-high levels. Buoyed by strong corporate earnings and solid economic growth, the S&P 500® ran off six consecutive months of positive returns from November through April. However, stocks pulled back for most of the remainder of the period. A slowdown in economic expansion and consumer spending, reaccelerating energy prices and continued interest rate hikes by the Federal Reserve Board cooled equity performance. Among other widely quoted market yardsticks, the Dow Jones Industrial AverageSM returned 7.59%, while the NASDAQ Composite® Index dropped 3.47%.
For the 12 months ending July 31, 2006, Fidelity Leveraged Company Stock Fund returned 12.80%, outperforming the S&P 500 and the 3.11% return of the Credit Suisse First Boston Leveraged Equity Index. A sizable overweighting of the strong performing energy sector was the main contributor to the fund's outperformance of the S&P 500, along with positive stock selection in telecommunication services and technology - particularly within semiconductors and semiconductor equipment. A significant underweighting of diversified financials and unfruitful security selection in materials held back performance. Stocks that helped relative returns included telecom firm Qwest Communications; oil and gas refining firm Valero Energy; out-of-benchmark holdings in semiconductor manufacturer Atmel; oil and gas refiner and marketer Frontier Oil; Norway-based oil and gas equipment and services firm Petroleum Geo-Services; independent oil and gas producer Range Resources; and envelope manufacturer and printer Cenveo. Detractors included chemical company Chemtura, funeral home operator Service Corporation International and Teekay Shipping, none of which were part of the S&P 500.
The views expressed above reflect those of the portfolio manager(s) only through the end of the period as stated on the cover of this report and do not necessarily represent the views of Fidelity or any other person in the Fidelity organization. Any such views are subject to change at any time based upon market or other conditions and Fidelity disclaims any responsibility to update such views. These views may not be relied on as investment advice and, because investment decisions for a Fidelity fund are based on numerous factors, may not be relied on as an indication of trading intent on behalf of any Fidelity fund.
Annual Report
Shareholder Expense Example
As a shareholder of the Fund, you incur two types of costs: (1) transaction costs, including redemption fees, and (2) ongoing costs, including management fees and other Fund expenses. This Example is intended to help you understand your ongoing costs (in dollars) of investing in the Fund and to compare these costs with the ongoing costs of investing in other mutual funds.
The Example is based on an investment of $1,000 invested at the beginning of the period and held for the entire period (February 1, 2006 to July 31, 2006).
Actual Expenses
The first line of the accompanying table provides information about actual account values and actual expenses. You may use the information in this line, together with the amount you invested, to estimate the expenses that you paid over the period. Simply divide your account value by $1,000.00 (for example, an $8,600 account value divided by $1,000.00 = 8.6), then multiply the result by the number in the first line under the heading entitled "Expenses Paid During Period" to estimate the expenses you paid on your account during this period. A small balance maintenance fee of $12.00 that is charged once a year may apply for certain accounts with a value of less than $2,000. This fee is not included in the table below. If it was, the estimate of expenses you paid during the period would be higher, and your ending account value lower, by this amount.
Hypothetical Example for Comparison Purposes
The second line of the accompanying table provides information about hypothetical account values and hypothetical expenses based on the Fund's actual expense ratio and an assumed rate of return of 5% per year before expenses, which is not the Fund's actual return. The hypothetical account values and expenses may not be used to estimate the actual ending account balance or expenses you paid for the period. You may use this information to compare the ongoing costs of investing in the Fund and other funds. To do so, compare this 5% hypothetical example with the 5% hypothetical examples that appear in the shareholder reports of the other funds. A small balance maintenance fee of $12.00 that is charged once a year may apply for certain accounts with a value of less than $2,000. This fee is not included in the table below. If it was, the estimate of expenses you paid during the period would be higher, and your ending account value lower, by this amount.
Please note that the expenses shown in the table are meant to highlight your ongoing costs only and do not reflect any transaction costs. Therefore, the second line of the table is useful in comparing ongoing costs only, and will not help you determine the relative total costs of owning different funds. In addition, if these transactional costs were included, your costs would have been higher.
| Beginning
Account Value
February 1, 2006 | Ending
Account Value
July 31, 2006 | Expenses Paid
During Period*
February 1, 2006
to July 31, 2006 |
Actual | $ 1,000.00 | $ 1,009.30 | $ 4.28 |
Hypothetical (5% return per year before expenses) | $ 1,000.00 | $ 1,020.53 | $ 4.31 |
* Expenses are equal to the Fund's annualized expense ratio of .86%; multiplied by the average account value over the period, multiplied by 181/365 (to reflect the one-half year period).
Annual Report
Investment Changes
Top Ten Stocks as of July 31, 2006 |
| % of fund's
net assets | % of fund's net assets
6 months ago |
Teekay Shipping Corp. | 3.4 | 3.3 |
AES Corp. | 3.2 | 4.0 |
Forest Oil Corp. | 2.9 | 4.9 |
General Maritime Corp. | 2.8 | 3.2 |
Service Corp. International (SCI) | 2.8 | 3.4 |
OMI Corp. | 2.7 | 2.3 |
ON Semiconductor Corp. | 2.7 | 3.1 |
Range Resources Corp. | 2.3 | 2.7 |
Qwest Communications International, Inc. | 2.1 | 2.1 |
Atmel Corp. | 2.1 | 1.6 |
| 27.0 | |
Top Five Market Sectors as of July 31, 2006 |
| % of fund's
net assets | % of fund's net assets
6 months ago |
Energy | 37.6 | 34.4 |
Information Technology | 17.7 | 14.0 |
Materials | 10.2 | 12.9 |
Industrials | 8.8 | 8.2 |
Consumer Discretionary | 7.8 | 9.1 |
Asset Allocation (% of fund's net assets) |
As of July 31, 2006 * | As of January 31, 2006 ** |
 | Stocks 97.9% | | | Stocks 98.0% | |
 | Bonds 0.7% | | | Bonds 0.7% | |
 | Convertible
Securities 0.3% | | | Convertible
Securities 0.4% | |
 | Short-Term
Investments and
Net Other Assets 1.1% | | | Short-Term
Investments and
Net Other Assets 0.9% | |
* Foreign investments | 18.9% | | ** Foreign investments | 17.1% | |

Annual Report
Investments July 31, 2006
Showing Percentage of Net Assets
Common Stocks - 97.8% |
| Shares | | Value (Note 1) (000s) |
CONSUMER DISCRETIONARY - 7.3% |
Auto Components - 0.4% |
TRW Automotive Holdings Corp. (a) | 618,100 | | $ 16,009 |
Diversified Consumer Services - 2.9% |
Carriage Services, Inc. Class A | 266,200 | | 1,118 |
Service Corp. International (SCI) (g) | 15,698,600 | | 117,896 |
| | 119,014 |
Hotels, Restaurants & Leisure - 1.8% |
Bally Technologies, Inc. (a)(f) | 1,152,360 | | 18,968 |
Centerplate, Inc. unit | 363,005 | | 5,162 |
Friendly Ice Cream Corp. (a)(g) | 423,400 | | 3,260 |
Pinnacle Entertainment, Inc. (a) | 493,200 | | 13,528 |
Six Flags, Inc. (f) | 3,295,400 | | 17,400 |
Station Casinos, Inc. | 332,100 | | 18,219 |
| | 76,537 |
Media - 1.9% |
Cablevision Systems Corp. - NY Group Class A | 242,900 | | 5,405 |
Charter Communications, Inc. Class A (a) | 13,115,971 | | 17,313 |
Gray Television, Inc. | 622,300 | | 4,182 |
Liberty Global, Inc.: | | | |
Class A | 33,815 | | 739 |
Class C | 33,815 | | 716 |
Nexstar Broadcasting Group, Inc. Class A (a) | 510,500 | | 2,093 |
NTL, Inc. | 781,380 | | 17,855 |
The DIRECTV Group, Inc. (a) | 619,645 | | 10,565 |
The Reader's Digest Association, Inc. (non-vtg.) | 752,900 | | 10,285 |
Triple Crown Media, Inc. (a) | 62,230 | | 480 |
Valassis Communications, Inc. (a) | 394,400 | | 8,097 |
| | 77,730 |
Specialty Retail - 0.3% |
Gamestop Corp. Class A (a)(f) | 326,000 | | 13,565 |
TOTAL CONSUMER DISCRETIONARY | | 302,855 |
CONSUMER STAPLES - 2.5% |
Food & Staples Retailing - 1.3% |
Koninklijke Ahold NV sponsored ADR (a) | 2,756,800 | | 24,618 |
Kroger Co. | 339,300 | | 7,780 |
Pathmark Stores, Inc. (a) | 1,297,047 | | 11,116 |
Safeway, Inc. | 296,800 | | 8,334 |
| | 51,848 |
Common Stocks - continued |
| Shares | | Value (Note 1) (000s) |
CONSUMER STAPLES - continued |
Food Products - 1.2% |
Corn Products International, Inc. | 744,019 | | $ 24,746 |
Kellogg Co. | 84,900 | | 4,090 |
Smithfield Foods, Inc. (a) | 711,700 | | 20,248 |
| | 49,084 |
Personal Products - 0.0% |
Revlon, Inc. Class A (sub. vtg.) (a) | 1,853,658 | | 1,742 |
TOTAL CONSUMER STAPLES | | 102,674 |
ENERGY - 37.6% |
Energy Equipment & Services - 7.2% |
Basic Energy Services, Inc. | 249,300 | | 6,731 |
Grant Prideco, Inc. (a) | 506,300 | | 23,042 |
Grey Wolf, Inc. (a) | 8,326,600 | | 63,782 |
Hanover Compressor Co. (a)(f) | 451,500 | | 8,579 |
Hercules Offshore, Inc. | 33,400 | | 1,194 |
Nabors Industries Ltd. (a) | 808,800 | | 28,567 |
Noble Corp. | 137,000 | | 9,830 |
Petrojarl ASA sponsored ADR | 748,259 | | 4,639 |
Petroleum Geo-Services ASA sponsored ADR (a)(f) | 748,259 | | 41,207 |
Pride International, Inc. (a) | 646,100 | | 19,299 |
Rowan Companies, Inc. | 321,100 | | 10,876 |
Universal Compression Holdings, Inc. (a) | 1,295,500 | | 82,523 |
| | 300,269 |
Oil, Gas & Consumable Fuels - 30.4% |
Alpha Natural Resources, Inc. (a) | 3,149,140 | | 50,922 |
Chesapeake Energy Corp. | 2,434,100 | | 80,082 |
Comstock Resources, Inc. (a) | 311,800 | | 9,173 |
ConocoPhillips | 201,631 | | 13,840 |
El Paso Corp. | 4,557,712 | | 72,923 |
Forest Oil Corp. (a)(g) | 3,610,100 | | 120,974 |
Frontier Oil Corp. | 1,583,600 | | 55,822 |
Frontline Ltd. (f) | 185,300 | | 7,256 |
Frontline Ltd. (NY Shares) (f) | 1,136,800 | | 44,278 |
General Maritime Corp. (g) | 3,249,200 | | 117,946 |
Houston Exploration Co. (a) | 89,200 | | 5,696 |
Mariner Energy, Inc. (a) | 2,921,653 | | 52,619 |
Massey Energy Co. | 586,700 | | 15,677 |
Nexen, Inc. | 831,600 | | 48,650 |
Common Stocks - continued |
| Shares | | Value (Note 1) (000s) |
ENERGY - continued |
Oil, Gas & Consumable Fuels - continued |
OMI Corp. (g) | 5,100,900 | | $ 112,526 |
Overseas Shipholding Group, Inc. | 975,400 | | 62,806 |
Petrohawk Energy Corp. (a)(f) | 2,719,148 | | 31,868 |
Plains Exploration & Production Co. (a) | 299,100 | | 13,148 |
Pogo Producing Co. | 404,600 | | 17,912 |
Range Resources Corp. | 3,489,300 | | 98,084 |
Ship Finance International Ltd.: | | | |
(Norway) | 33,245 | | 627 |
(NY Shares) | 496,052 | | 9,643 |
Teekay Shipping Corp. | 3,258,300 | | 139,973 |
Valero Energy Corp. | 964,600 | | 65,043 |
Williams Companies, Inc. | 953,000 | | 23,110 |
| | 1,270,598 |
TOTAL ENERGY | | 1,570,867 |
FINANCIALS - 0.7% |
Capital Markets - 0.2% |
Merrill Lynch & Co., Inc. | 126,000 | | 9,175 |
Insurance - 0.3% |
American Financial Group, Inc., Ohio | 333,700 | | 14,052 |
Thrifts & Mortgage Finance - 0.2% |
Capital Crossing Bank (a)(g) | 258,800 | | 6,897 |
TOTAL FINANCIALS | | 30,124 |
HEALTH CARE - 2.9% |
Biotechnology - 0.0% |
Lexicon Genetics, Inc. (a) | 392,187 | | 1,730 |
Health Care Equipment & Supplies - 0.7% |
Baxter International, Inc. | 430,100 | | 18,064 |
Beckman Coulter, Inc. | 159,200 | | 9,114 |
| | 27,178 |
Health Care Providers & Services - 2.2% |
DaVita, Inc. (a) | 1,439,200 | | 71,989 |
Emergency Medical Services Corp. Class A | 258,600 | | 3,083 |
Common Stocks - continued |
| Shares | | Value (Note 1) (000s) |
HEALTH CARE - continued |
Health Care Providers & Services - continued |
Rural/Metro Corp. (a) | 834,200 | | $ 5,814 |
Tenet Healthcare Corp. (a)(f) | 2,043,452 | | 12,097 |
| | 92,983 |
TOTAL HEALTH CARE | | 121,891 |
INDUSTRIALS - 8.6% |
Air Freight & Logistics - 0.1% |
Park-Ohio Holdings Corp. (a) | 179,465 | | 3,004 |
Airlines - 1.1% |
AirTran Holdings, Inc. (a) | 861,500 | | 10,803 |
AMR Corp. (a)(f) | 1,016,730 | | 22,368 |
US Airways Group, Inc. (a) | 230,246 | | 10,520 |
| | 43,691 |
Building Products - 1.3% |
American Standard Companies, Inc. | 834,600 | | 32,241 |
Goodman Global, Inc. | 406,800 | | 5,004 |
Lennox International, Inc. | 230,700 | | 5,262 |
Masco Corp. | 366,400 | | 9,794 |
| | 52,301 |
Commercial Services & Supplies - 3.9% |
Allied Waste Industries, Inc. | 2,403,900 | | 24,424 |
Cenveo, Inc. (a)(f)(g) | 2,934,600 | | 56,139 |
Deluxe Corp. | 227,100 | | 3,861 |
Global Cash Access Holdings, Inc. | 1,835,000 | | 27,488 |
Republic Services, Inc. | 496,500 | | 19,939 |
Waste Management, Inc. | 904,900 | | 31,110 |
| | 162,961 |
Electrical Equipment - 0.1% |
GrafTech International Ltd. (a) | 837,325 | | 4,496 |
Industrial Conglomerates - 0.4% |
Tyco International Ltd. | 679,200 | | 17,720 |
Machinery - 0.3% |
FreightCar America, Inc. (f) | 151,247 | | 8,116 |
Thermadyne Holdings Corp. (a) | 64,900 | | 761 |
Timken Co. | 92,800 | | 2,988 |
| | 11,865 |
Common Stocks - continued |
| Shares | | Value (Note 1) (000s) |
INDUSTRIALS - continued |
Marine - 0.0% |
American Commercial Lines, Inc. | 8,000 | | $ 440 |
Golden Ocean Group Ltd. (a)(f) | 2,067,600 | | 1,361 |
| | 1,801 |
Road & Rail - 0.6% |
Burlington Northern Santa Fe Corp. | 246,400 | | 16,979 |
Kansas City Southern | 326,700 | | 8,043 |
| | 25,022 |
Trading Companies & Distributors - 0.8% |
H&E Equipment Services, Inc. | 12,900 | | 342 |
UAP Holding Corp. | 846,600 | | 16,678 |
United Rentals, Inc. (a) | 655,600 | | 18,304 |
| | 35,324 |
TOTAL INDUSTRIALS | | 358,185 |
INFORMATION TECHNOLOGY - 17.7% |
Communications Equipment - 1.3% |
CIENA Corp. (a) | 631,400 | | 2,292 |
Lucent Technologies, Inc. (a) | 3,259,600 | | 6,943 |
Motorola, Inc. | 1,997,200 | | 45,456 |
| | 54,691 |
Computers & Peripherals - 1.4% |
EMC Corp. (a) | 1,573,500 | | 15,971 |
Seagate Technology | 1,653,300 | | 38,357 |
Sun Microsystems, Inc. (a) | 1,260,600 | | 5,484 |
| | 59,812 |
Electronic Equipment & Instruments - 4.1% |
Celestica, Inc. (sub. vtg.) (a) | 3,779,400 | | 35,503 |
DDi Corp. (a) | 295,900 | | 2,412 |
Flextronics International Ltd. (a) | 6,454,400 | | 73,193 |
Merix Corp. (a)(f)(g) | 1,545,123 | | 16,239 |
Sanmina-SCI Corp. (a) | 1,619,100 | | 5,602 |
Solectron Corp. (a) | 3,673,600 | | 11,094 |
Viasystems Group, Inc. (a) | 775,300 | | 6,590 |
Viasystems Group, Inc. (a)(i) | 625,780 | | 5,319 |
Vishay Intertechnology, Inc. (a) | 1,248,400 | | 17,515 |
| | 173,467 |
Common Stocks - continued |
| Shares | | Value (Note 1) (000s) |
INFORMATION TECHNOLOGY - continued |
IT Services - 0.1% |
Affiliated Computer Services, Inc. Class A (a) | 65,100 | | $ 3,316 |
Semiconductors & Semiconductor Equipment - 9.5% |
AMIS Holdings, Inc. (a) | 1,877,824 | | 17,614 |
Amkor Technology, Inc. (a)(f)(g) | 12,599,836 | | 77,867 |
Atmel Corp. (a) | 18,002,000 | | 86,230 |
Cypress Semiconductor Corp. (a) | 1,151,200 | | 17,487 |
Fairchild Semiconductor International, Inc. (a) | 200,000 | | 3,272 |
Freescale Semiconductor, Inc.: | | | |
Class A (a) | 1,273,500 | | 36,460 |
Class B (a) | 27,040 | | 771 |
ON Semiconductor Corp. (a)(g) | 17,876,600 | | 112,444 |
Skyworks Solutions, Inc. (a) | 1,112,647 | | 4,885 |
STATS ChipPAC Ltd. sponsored ADR (a)(f) | 5,467,282 | | 30,890 |
Texas Instruments, Inc. | 262,700 | | 7,823 |
| | 395,743 |
Software - 1.3% |
Sybase, Inc. (a) | 396,100 | | 8,338 |
Symantec Corp. (a) | 2,549,400 | | 44,283 |
| | 52,621 |
TOTAL INFORMATION TECHNOLOGY | | 739,650 |
MATERIALS - 10.1% |
Chemicals - 4.7% |
Albemarle Corp. | 400,000 | | 20,168 |
Arch Chemicals, Inc. | 648,542 | | 22,984 |
Celanese Corp. Class A | 4,143,100 | | 79,589 |
Chemtura Corp. | 2,502,961 | | 21,550 |
Methanex Corp. | 701,700 | | 13,425 |
Monsanto Co. | 253,800 | | 10,911 |
NOVA Chemicals Corp. (f) | 537,000 | | 15,840 |
Pliant Corp. | 566 | | 0 |
Rhodia SA sponsored ADR | 7,102,200 | | 13,565 |
Texas Petrochemicals, Inc. (a) | 11,700 | | 287 |
| | 198,319 |
Construction Materials - 0.1% |
Texas Industries, Inc. | 53,800 | | 2,657 |
Containers & Packaging - 2.5% |
Owens-Illinois, Inc. | 617,490 | | 9,343 |
Common Stocks - continued |
| Shares | | Value (Note 1) (000s) |
MATERIALS - continued |
Containers & Packaging - continued |
Packaging Corp. of America | 179,700 | | $ 4,121 |
Pactiv Corp. (a) | 1,806,300 | | 44,272 |
Sealed Air Corp. | 156,900 | | 7,412 |
Smurfit-Stone Container Corp. | 3,726,482 | | 37,712 |
| | 102,860 |
Metals & Mining - 0.6% |
Allegheny Technologies, Inc. | 123,874 | | 7,914 |
Chaparral Steel Co. (a) | 53,800 | | 3,776 |
Freeport-McMoRan Copper & Gold, Inc. Class B | 282,500 | | 15,413 |
| | 27,103 |
Paper & Forest Products - 2.2% |
Aracruz Celulose SA (PN-B) sponsored ADR (non-vtg.) | 184,500 | | 9,221 |
International Paper Co. | 1,209,800 | | 41,532 |
Weyerhaeuser Co. | 691,100 | | 40,540 |
| | 91,293 |
TOTAL MATERIALS | | 422,232 |
TELECOMMUNICATION SERVICES - 4.6% |
Diversified Telecommunication Services - 2.7% |
General Communications, Inc. Class A (a) | 907,800 | | 10,830 |
McLeodUSA, Inc. (a) | 1,701,867 | | 11,913 |
Qwest Communications International, Inc. (a) | 11,009,200 | | 87,964 |
XO Holdings, Inc. (a) | 926,500 | | 3,660 |
| | 114,367 |
Wireless Telecommunication Services - 1.9% |
Sprint Nextel Corp. | 3,905,697 | | 77,333 |
TOTAL TELECOMMUNICATION SERVICES | | 191,700 |
UTILITIES - 5.8% |
Electric Utilities - 0.3% |
Allegheny Energy, Inc. (a) | 269,300 | | 11,055 |
Gas Utilities - 0.3% |
ONEOK, Inc. | 317,600 | | 11,818 |
Independent Power Producers & Energy Traders - 3.6% |
AES Corp. (a) | 6,685,440 | | 132,773 |
Common Stocks - continued |
| Shares | | Value (Note 1) (000s) |
UTILITIES - continued |
Independent Power Producers & Energy Traders - continued |
Dynegy, Inc. Class A (a) | 1,987,000 | | $ 11,187 |
Mirant Corp. (a) | 335,400 | | 8,912 |
| | 152,872 |
Multi-Utilities - 1.6% |
Aquila, Inc. | 911,800 | | 4,048 |
CMS Energy Corp. (a) | 4,552,600 | | 63,782 |
| | 67,830 |
TOTAL UTILITIES | | 243,575 |
TOTAL COMMON STOCKS (Cost $3,107,480) | 4,083,753 |
Nonconvertible Preferred Stocks - 0.1% |
| | | |
MATERIALS - 0.1% |
Chemicals - 0.1% |
Pliant Corp. Redeemable Preferred Series AA, 13.00% | 5,008 | | 1,816 |
TELECOMMUNICATION SERVICES - 0.0% |
Diversified Telecommunication Services - 0.0% |
PTV, Inc. Series A, 10.00% | 84 | | 0 |
TOTAL NONCONVERTIBLE PREFERRED STOCKS (Cost $2,411) | 1,816 |
Corporate Bonds - 1.0% |
| Principal Amount (000s) | | |
Convertible Bonds - 0.3% |
TELECOMMUNICATION SERVICES - 0.3% |
Wireless Telecommunication Services - 0.3% |
ICO North America, Inc. 7.5% 8/15/09 (i) | | $ 11,095 | | 13,314 |
Nonconvertible Bonds - 0.7% |
CONSUMER DISCRETIONARY - 0.5% |
Auto Components - 0.5% |
IdleAire Technologies Corp. 0% 12/15/12 unit (e)(h) | | 24,470 | | 18,353 |
Corporate Bonds - continued |
| Principal Amount (000s) | | Value (Note 1) (000s) |
Nonconvertible Bonds - continued |
INDUSTRIALS - 0.2% |
Airlines - 0.2% |
Delta Air Lines, Inc. 8% 12/15/07 (d)(h) | | $ 11,835 | | $ 3,077 |
Northwest Airlines, Inc.: | | | | |
8.7% 3/15/07 (d) | | 1,750 | | 897 |
9.875% 3/15/07 (d) | | 7,000 | | 3,570 |
| | 7,544 |
MATERIALS - 0.0% |
Chemicals - 0.0% |
Pliant Corp. 13% 7/15/10 | | 661 | | 661 |
TOTAL NONCONVERTIBLE BONDS | | 26,558 |
TOTAL CORPORATE BONDS (Cost $39,541) | 39,872 |
Money Market Funds - 4.2% |
| Shares | | |
Fidelity Cash Central Fund, 5.3% (b) | 55,374,876 | | 55,375 |
Fidelity Securities Lending Cash Central Fund, 5.32% (b)(c) | 120,665,267 | | 120,665 |
TOTAL MONEY MARKET FUNDS (Cost $176,040) | 176,040 |
TOTAL INVESTMENT PORTFOLIO - 103.1% (Cost $3,325,472) | | 4,301,481 |
NET OTHER ASSETS - (3.1)% | | (127,596) |
NET ASSETS - 100% | $ 4,173,885 |
Legend |
(a) Non-income producing |
(b) Affiliated fund that is available only to investment companies and other accounts managed by Fidelity Investments. The rate quoted is the annualized seven-day yield of the fund at period end. A complete unaudited listing of the fund's holdings as of its most recent quarter end is available upon request. |
(c) Investment made with cash collateral received from securities on loan. |
(d) Non-income producing - Issuer is in default. |
(e) Security initially issued in zero coupon form which converts to coupon form at a specified rate and date. The rate shown is the rate at period end. |
(f) Security or a portion of the security is on loan at period end. |
(g) Affiliated company |
(h) Security exempt from registration under Rule 144A of the Securities Act of 1933. These securities may be resold in transactions exempt from registration, normally to qualified institutional buyers. At the period end, the value of these securities amounted to $21,430,000 or 0.5% of net assets. |
(i) Restricted securities - Investment in securities not registered under the Securities Act of 1933 (excluding 144A issues). At the end of the period, the value of restricted securities (excluding 144A issues) amounted to $18,633,000 or 0.4% of net assets. |
Additional information on each holding is as follows: |
Security | Acquisition Date | Acquisition Cost (000s) |
ICO North America, Inc. 7.5% 8/15/09 | 8/12/05 | $ 11,095 |
Viasystems Group, Inc. | 2/13/04 | $ 12,594 |
Affiliated Central Funds |
Information regarding fiscal year to date income earned by the fund from the affiliated Central funds is as follows: |
Fund | Income earned
(Amounts in thousands) |
Fidelity Cash Central Fund | $ 2,165 |
Fidelity Securities Lending Cash Central Fund | 2,078 |
Total | $ 4,243 |
Other Affiliated Issuers |
An affiliated company is a company in which the fund has ownership of at least 5% of the voting securities. Fiscal year to date transactions with companies which are or were affiliates are as follows: |
Affiliates
(Amounts in thousands) | Value,
beginning of
period | Purchases | Sales
Proceeds | Dividend
Income | Value,
end of
period |
Amkor Technology, Inc. | $ 43,989 | $ 19,625 | $ - | $ - | $ 77,867 |
Capital Crossing Bank | 9,475 | - | - | - | 6,897 |
Cenveo, Inc. | 14,879 | 13,581 | - | - | 56,139 |
Forest Oil Corp. | 161,587 | - | - | - | 120,974 |
Friendly Ice Cream Corp. | 5,102 | - | - | - | 3,260 |
General Maritime Corp. | 114,085 | 11,764 | 1,086 | 14,421 | 117,946 |
Integrated Electrical Services, Inc. | 7,223 | - | - | - | - |
Merix Corp. | 2,422 | 10,887 | - | - | 16,239 |
OMI Corp. | 91,969 | - | - | 1,836 | 112,526 |
ON Semiconductor Corp. | 74,157 | 26,224 | - | - | 112,444 |
Service Corp. International (SCI) | 126,376 | 9,631 | - | 1,568 | 117,896 |
Total | $ 651,264 | $ 91,712 | $ 1,086 | $ 17,825 | $ 742,188 |
Other Information |
Distribution of investments by country of issue, as a percentage of total net assets, is as follows: |
United States of America | 81.1% |
Marshall Islands | 8.9% |
Canada | 2.7% |
Singapore | 2.5% |
Bermuda | 1.5% |
Cayman Islands | 1.1% |
Norway | 1.1% |
Others (individually less than 1%) | 1.1% |
| 100.0% |
See accompanying notes which are an integral part of the financial statements.
Annual Report
Financial Statements
Statement of Assets and Liabilities
Amounts in thousands (except per-share amount) | July 31, 2006 |
Assets | | |
Investment in securities, at value (including securities loaned of $115,659) - See accompanying schedule: Unaffiliated issuers (cost $2,603,855) | $ 3,383,253 | |
Affiliated Central Funds (cost $176,040) | 176,040 | |
Other affiliated issuers (cost $545,577) | 742,188 | |
Total Investments (cost $3,325,472) | | $ 4,301,481 |
Receivable for investments sold | | 13,000 |
Receivable for fund shares sold | | 12,361 |
Dividends receivable | | 678 |
Interest receivable | | 734 |
Prepaid expenses | | 5 |
Other receivables | | 211 |
Total assets | | 4,328,470 |
| | |
Liabilities | | |
Payable for investments purchased | $ 27,181 | |
Payable for fund shares redeemed | 3,651 | |
Accrued management fee | 2,102 | |
Other affiliated payables | 781 | |
Other payables and accrued expenses | 205 | |
Collateral on securities loaned, at value | 120,665 | |
Total liabilities | | 154,585 |
| | |
Net Assets | | $ 4,173,885 |
Net Assets consist of: | | |
Paid in capital | | $ 2,997,349 |
Undistributed net investment income | | 13,934 |
Accumulated undistributed net realized gain (loss) on investments and foreign currency transactions | | 186,593 |
Net unrealized appreciation (depreciation) on investments and assets and liabilities in foreign currencies | | 976,009 |
Net Assets, for 148,675 shares outstanding | | $ 4,173,885 |
Net Asset Value, offering price and redemption price per share ($4,173,885 ÷ 148,675 shares) | | $ 28.07 |
See accompanying notes which are an integral part of the financial statements.
Annual Report
Statement of Operations
Amounts in thousands | Year ended July 31, 2006 |
Investment Income | | |
Dividends (including $17,825 received from other affiliated issuers) | | $ 48,185 |
Interest | | 2,063 |
Income from affiliated Central Funds | | 4,243 |
Total income | | 54,491 |
| | |
Expenses | | |
Management fee | $ 23,197 | |
Transfer agent fees | 7,551 | |
Accounting and security lending fees | 1,005 | |
Independent trustees' compensation | 15 | |
Custodian fees and expenses | 60 | |
Registration fees | 157 | |
Audit | 67 | |
Legal | 37 | |
Interest | 11 | |
Miscellaneous | 183 | |
Total expenses before reductions | 32,283 | |
Expense reductions | (217) | 32,066 |
Net investment income (loss) | | 22,425 |
Realized and Unrealized Gain (Loss) Net realized gain (loss) on: | | |
Investment securities: | | |
Unaffiliated issuers | 201,436 | |
Other affiliated issuers | (192) | |
Foreign currency transactions | (62) | |
Total net realized gain (loss) | | 201,182 |
Change in net unrealized appreciation (depreciation) on: Investment securities | | 191,436 |
Net gain (loss) | | 392,618 |
Net increase (decrease) in net assets resulting from operations | | $ 415,043 |
See accompanying notes which are an integral part of the financial statements.
Annual Report
Financial Statements - continued
Statement of Changes in Net Assets
Amounts in thousands | Year ended
July 31,
2006 | Year ended
July 31,
2005 |
Increase (Decrease) in Net Assets | | |
Operations | | |
Net investment income (loss) | $ 22,425 | $ 23,691 |
Net realized gain (loss) | 201,182 | 54,521 |
Change in net unrealized appreciation (depreciation) | 191,436 | 531,827 |
Net increase (decrease) in net assets resulting
from operations | 415,043 | 610,039 |
Distributions to shareholders from net investment income | (28,125) | (3,319) |
Distributions to shareholders from net realized gain | (54,860) | (83,082) |
Total distributions | (82,985) | (86,401) |
Share transactions
Proceeds from sales of shares | 1,839,637 | 1,965,483 |
Reinvestment of distributions | 79,716 | 82,683 |
Cost of shares redeemed | (1,406,453) | (749,454) |
Net increase (decrease) in net assets resulting from share transactions | 512,900 | 1,298,712 |
Redemption fees | 1,158 | 1,224 |
Total increase (decrease) in net assets | 846,116 | 1,823,574 |
| | |
Net Assets | | |
Beginning of period | 3,327,769 | 1,504,195 |
End of period (including undistributed net investment income of $13,934 and undistributed net investment income of $23,521, respectively) | $ 4,173,885 | $ 3,327,769 |
Other Information Shares | | |
Sold | 68,132 | 85,928 |
Issued in reinvestment of distributions | 3,063 | 4,283 |
Redeemed | (53,133) | (34,148) |
Net increase (decrease) | 18,062 | 56,063 |
See accompanying notes which are an integral part of the financial statements.
Annual Report
Financial Highlights
Years ended July 31, | 2006 | 2005 | 2004 | 2003 | 2002 |
Selected Per-Share Data | | | | | |
Net asset value, beginning of period | $ 25.48 | $ 20.18 | $ 14.93 | $ 7.37 | $ 10.66 |
Income from Investment Operations | | | | | |
Net investment income (loss) B | .16 | .24 C | .04 | .01 | .11 |
Net realized and unrealized gain (loss) | 3.04 | 6.21 | 5.45 | 7.49 | (3.22) |
Total from investment operations | 3.20 | 6.45 | 5.49 | 7.50 | (3.11) |
Distributions from net investment income | (.21) | (.04) | - | - | (.20) |
Distributions from net realized gain | (.41) | (1.12) | (.27) | - | - |
Total distributions | (.62) | (1.16) | (.27) | - | (.20) |
Redemption fees added to paid in capital B | .01 | .01 | .03 | .06 | .02 |
Net asset value, end of period | $ 28.07 | $ 25.48 | $ 20.18 | $ 14.93 | $ 7.37 |
Total Return A | 12.80% | 33.93% | 37.27% | 102.58% | (29.40)% |
Ratios to Average Net Assets D | | | | | |
Expenses before reductions | .86% | .87% | .88% | .93% | 1.14% |
Expenses net of fee waivers, if any | .86% | .87% | .88% | .93% | 1.14% |
Expenses net of all reductions | .85% | .84% | .85% | .83% | .93% |
Net investment income (loss) | .60% | 1.04% C | .23% | .07% | 1.16% |
Supplemental Data | | | | | |
Net assets, end of period (in millions) | $ 4,174 | $ 3,328 | $ 1,504 | $ 718 | $ 36 |
Portfolio turnover rate | 23% | 16% | 35% | 79% | 203% |
A Total returns would have been lower had certain expenses not been reduced during the periods shown.
B Calculated based on average shares outstanding during the period.
C Investment Income per share reflects an in-kind dividend received in a corporate reorganization which amounted to $0.10 per share. Excluding this dividend, the ratio of net investment income to average net assets would have been .61%.
D Expense ratios reflect operating expenses of the Fund. Expenses before reductions do not reflect amounts reimbursed by the investment adviser or reductions from brokerage service arrangements or other expense offset arrangements and do not represent the amount paid by the Fund during periods when reimbursements or reductions occur. Expenses net of fee waivers reflect expenses after reimbursement by the investment adviser but prior to reductions from brokerage service arrangements or other expense offset arrangements. Expenses net of all reductions represent the net expenses paid by the Fund.
See accompanying notes which are an integral part of the financial statements.
Annual Report
Notes to Financial Statements
For the period ended July 31, 2006
(Amounts in thousands except ratios)
1. Significant Accounting Policies.
Fidelity Leveraged Company Stock Fund (the Fund) is a fund of Fidelity Securities Fund (the trust) and is authorized to issue an unlimited number of shares. The trust is registered under the Investment Company Act of 1940, as amended (the 1940 Act), as an open-end management investment company organized as a Massachusetts business trust. The Fund may invest in affiliated money market central funds (Money Market Central Funds), which are open-end investment companies available to investment companies and other accounts managed by Fidelity Management & Research Company (FMR) and its affiliates. The financial statements have been prepared in conformity with accounting principles generally accepted in the United States of America, which require management to make certain estimates and assumptions at the date of the financial statements. The following summarizes the significant accounting policies of the Fund:
Security Valuation. Investments are valued and net asset value (NAV) per share is calculated (NAV calculation) as of the close of business of the New York Stock Exchange (NYSE), normally 4:00 p.m. Eastern time. Wherever possible, the Fund uses independent pricing services approved by the Board of Trustees to value its investments.
Equity securities, including restricted securities, for which market quotations are readily available, are valued at the last reported sale price or official closing price as reported by an independent pricing service on the primary market or exchange on which they are traded. In the event there were no sales during the day or closing prices are not available, securities are valued at the last quoted bid price. Debt securities, including restricted securities, for which quotations are readily available, are valued by independent pricing services or by dealers who make markets in such securities. Pricing services consider yield or price of bonds of comparable quality, coupon, maturity and type as well as dealer supplied prices. Investments in open-end mutual funds are valued at their closing net asset value each business day. Short-term securities with remaining maturities of sixty days or less for which quotations are not readily available are valued at amortized cost, which approximates value.
When current market prices or quotations are not readily available or do not accurately reflect fair value, valuations may be determined in accordance with procedures adopted by the Board of Trustees. For example, when developments occur between the close of a market and the close of the NYSE that may materially affect the value of some or all of the securities, or when trading in a security is halted, those securities may be fair valued. Factors used in the determination of fair value may include monitoring news to identify significant market or security specific events such as changes in the value of U.S. securities markets, reviewing developments in foreign markets and evaluating the performance of ADRs, futures contracts and exchange-traded funds. Because the Fund's utilization of fair value pricing depends on market activity, the frequency with which fair
Annual Report
1. Significant Accounting Policies - continued
Security Valuation - continued
value pricing is used can not be predicted and may be utilized to a significant extent. The value of securities used for NAV calculation under fair value pricing may differ from published prices for the same securities.
Foreign Currency. The Fund uses foreign currency contracts to facilitate transactions in foreign-denominated securities. Losses from these transactions may arise from changes in the value of the foreign currency or if the counterparties do not perform under the contracts' terms.
Foreign-denominated assets, including investment securities, and liabilities are translated into U.S. dollars at the exchange rate at period end. Purchases and sales of investment securities, income and dividends received and expenses denominated in foreign currencies are translated into U.S. dollars at the exchange rate in effect on the transaction date.
The effects of exchange rate fluctuations on investments are included with the net realized and unrealized gain (loss) on investment securities. Other foreign currency transactions resulting in realized and unrealized gain (loss) are disclosed separately.
Investment Transactions and Income. Security transactions are accounted for as of trade date. Gains and losses on securities sold are determined on the basis of identified cost and may include proceeds received from litigation. Dividend income is recorded on the ex-dividend date, except for certain dividends from foreign securities where the ex-dividend date may have passed, which are recorded as soon as the Fund is informed of the ex-dividend date. Non-cash dividends included in dividend income, if any, are recorded at the fair market value of the securities received. Distributions received on securities that represent a return of capital or capital gain are recorded as a reduction of cost of investments and/or as a realized gain. The Fund estimates the components of distributions received that may be considered return of capital distributions or capital gain distributions. Interest income is accrued as earned. Interest income includes coupon interest and amortization of premium and accretion of discount on debt securities. Investment income is recorded net of foreign taxes withheld where recovery of such taxes is uncertain. Debt obligations may be placed on non-accrual status and related interest income may be reduced by ceasing current accruals and writing off interest receivables when the collection of all or a portion of interest has become doubtful based on consistently applied procedures. A debt obligation is removed from non-accrual status when the issuer resumes interest payments or when collectibility of interest is reasonably assured.
Expenses. Most expenses of the trust can be directly attributed to a fund. Expenses which cannot be directly attributed are apportioned among each Fund in the trust.
Annual Report
Notes to Financial Statements - continued
(Amounts in thousands except ratios)
1. Significant Accounting Policies - continued
Expenses - continued
Expense estimates are accrued in the period to which they relate and adjustments are made when actual amounts are known.
Income Tax Information and Distributions to Shareholders. Each year, the Fund intends to qualify as a regulated investment company by distributing all of its taxable income and realized gains under Subchapter M of the Internal Revenue Code. As a result, no provision for income taxes is required in the accompanying financial statements. Foreign taxes are provided for based on the Fund's understanding of the tax rules and rates that exist in the foreign markets in which it invests.
Distributions are recorded on the ex-dividend date. Income and capital gain distributions are determined in accordance with income tax regulations, which may differ from generally accepted accounting principles. In addition, the Fund will claim a portion of the payment made to redeeming shareholders as a distribution for income tax purposes.
Capital accounts within the financial statements are adjusted for permanent book-tax differences. These adjustments have no impact on net assets or the results of operations. Temporary book-tax differences will reverse in a subsequent period.
Book-tax differences are primarily due to foreign currency transactions, defaulted bonds, market discount and losses deferred due to wash sales.
The tax-basis components of distributable earnings and the federal tax cost as of period end were as follows:
Unrealized appreciation | $ 1,189,224 |
Unrealized depreciation | (212,130) |
Net unrealized appreciation (depreciation) | 977,094 |
Undistributed ordinary income | 22,391 |
Undistributed long-term capital gain | 152,985 |
Cost for federal income tax purposes | $ 3,324,387 |
The tax character of distributions paid was as follows:
| July 31,2006 | July 31, 2005 |
Ordinary Income | $ 28,125 | $ 43,399 |
Long-term Capital Gains | 54,860 | 43,002 |
Total | $ 82,985 | $ 86,401 |
Annual Report
1. Significant Accounting Policies - continued
New Accounting Pronouncement. In July 2006, Financial Accounting Standards Board Interpretation No. 48, Accounting for Uncertainty in Income Taxes - an interpretation of FASB Statement 109 (FIN 48) was issued and is effective for fiscal years beginning after December 15, 2006. FIN 48 sets forth a threshold for financial statement recognition, measurement and disclosure of a tax position taken or expected to be taken on a tax return. Management is currently evaluating the impact, if any, the adoption of FIN 48 will have on the Fund's net assets and results of operations.
Short-Term Trading (Redemption) Fees. Shares held in the Fund less than 90 days are subject to a redemption fee equal to 1.50% of the proceeds of the redeemed shares. All redemption fees, including any estimated redemption fees paid by FMR, are retained by the Fund and accounted for as an addition to paid in capital.
2. Operating Policies.
Repurchase Agreements. FMR has received an Exemptive Order from the Securities and Exchange Commission (the SEC) which permits the Fund and other affiliated entities of FMR to transfer uninvested cash balances into joint trading accounts which are then invested in repurchase agreements. The Fund may also invest directly with institutions in repurchase agreements. Repurchase agreements are collateralized by government or non-government securities. Upon settlement date, collateral is held in segregated accounts with custodian banks and may be obtained in the event of a default of the counterparty. The Fund monitors, on a daily basis, the value of the collateral to ensure it is at least equal to the principal amount of the repurchase agreement (including accrued interest). In the event of a default by the counterparty, realization of the collateral proceeds could be delayed, during which time the value of the collateral may decline.
Restricted Securities. The Fund may invest in securities that are subject to legal or contractual restrictions on resale. These securities generally may be resold in transactions exempt from registration or to the public if the securities are registered. Disposal of these securities may involve time-consuming negotiations and expense, and prompt sale at an acceptable price may be difficult. Information regarding restricted securities is included at the end of the fund's Schedule of Investments.
3. Purchases and Sales of Investments.
Purchases and sales of securities, other than short-term securities, aggregated $1,261,271 and $844,981, respectively.
Annual Report
Notes to Financial Statements - continued
(Amounts in thousands except ratios)
4. Fees and Other Transactions with Affiliates.
Management Fee. FMR and its affiliates provide the Fund with investment management related services for which the Fund pays a monthly management fee. The management fee is the sum of an individual fund fee rate that is based on an annual rate of .35% of the Fund's average net assets and a group fee rate that averaged ..27% during the period. The group fee rate is based upon the average net assets of all the mutual funds advised by FMR. The group fee rate decreases as assets under management increase and increases as assets under management decrease. For the period, the total annual management fee rate was .62% of the Fund's average net assets.
Transfer Agent Fees. Fidelity Service Company, Inc. (FSC), an affiliate of FMR, is the Fund's transfer, dividend disbursing and shareholder servicing agent. FSC receives account fees and asset-based fees that vary according to account size and type of account. FSC pays for typesetting, printing and mailing of shareholder reports, except proxy statements. For the period, the transfer agent fees were equivalent to an annual rate of .20% of average net assets.
Accounting and Security Lending Fees. FSC maintains the Fund's accounting records. The accounting fee is based on the level of average net assets for the month. Under a separate contract, FSC administers the security lending program. The security lending fee is based on the number and duration of lending transactions.
Affiliated Central Funds. The Fund may invest in Money Market Central Funds which seek preservation of capital and current income and are managed by Fidelity Investments Money Management, Inc. (FIMM), an affiliate of FMR.
The Money Market Central Funds do not pay a management fee.
Brokerage Commissions. The Fund placed a portion of its portfolio transactions with brokerage firms which are affiliates of the investment adviser. The commissions paid to these affiliated firms were $36 for the period.
Interfund Lending Program. Pursuant to an Exemptive Order issued by the SEC, the Fund, along with other registered investment companies having management contracts with FMR, may participate in an interfund lending program. This program provides an alternative credit facility allowing the Funds to borrow from, or lend money to, other participating affiliated funds. At period end, there were no interfund loans outstanding. The Fund's activity in this program during the period for which loans were outstanding was as follows:
Borrower or Lender | Average Daily
Loan Balance | Weighted Average Interest Rate | Interest
Expense |
Borrower | $ 11,496 | 4.95% | $ 11 |
Annual Report
5. Committed Line of Credit.
The Fund participates with other funds managed by FMR in a $4.2 billion credit facility (the "line of credit") to be utilized for temporary or emergency purposes to fund shareholder redemptions or for other short-term liquidity purposes. The Fund has agreed to pay commitment fees on its pro rata portion of the line of credit, which amounts to $8 and is reflected in Miscellaneous Expense on the Statement of Operations. During the period, there were no borrowings on this line of credit.
6. Security Lending.
The Fund lends portfolio securities from time to time in order to earn additional income. On the settlement date of the loan, the Fund receives collateral (in the form of U.S. Treasury obligations, letters of credit and/or cash) against the loaned securities and maintains collateral in an amount not less than 100% of the market value of the loaned securities during the period of the loan. The market value of the loaned securities is determined at the close of business of the Fund and any additional required collateral is delivered to the Fund on the next business day. If the borrower defaults on its obligation to return the securities loaned because of insolvency or other reasons, a fund could experience delays and costs in recovering the securities loaned or in gaining access to the collateral. Any cash collateral received is invested in the Fidelity Securities Lending Cash Central Fund. The value of loaned securities and cash collateral at period end are disclosed on the Fund's Statement of Assets and Liabilities. Security lending income represents the income earned on investing cash collateral, less fees and expenses associated with the loan, plus any premium payments that may be received on the loan of certain types of securities. Security lending income is presented in the Statement of Operations as a component of income from affiliated central funds. Net income from lending portfolio securities during the period amounted to $2,078.
7. Expense Reductions.
Many of the brokers with whom FMR places trades on behalf of the Fund provided services to the Fund in addition to trade execution. These services included payments of certain expenses on behalf of the Fund totaling $170 for the period. In addition, through arrangements with the Fund's custodian and transfer agent, credits realized as a result of uninvested cash balances were used to reduce the Fund's expenses. During the period, these credits reduced the Fund's custody and transfer agent expenses by $10 and $37, respectively.
8. Other.
The Fund's organizational documents provide former and current trustees and officers with a limited indemnification against liabilities arising in connection with the
Annual Report
Notes to Financial Statements - continued
(Amounts in thousands except ratios)
8. Other - continued
perfomance of their duties to the Fund. In the normal course of business, the Fund may also enter into contracts that provide general indemnifications. The Fund's maximum exposure under these arrangements is unknown as this would be dependent on future claims that may be made against the Fund. The risk of material loss from such claims is considered remote.
Annual Report
Report of Independent Registered Public Accounting Firm
To the Trustees of Fidelity Securities Fund and the Shareholders of Fidelity Leveraged Company Stock Fund:
In our opinion, the accompanying statement of assets and liabilities, including the schedule of investments, and the related statements of operations and of changes in net assets and the financial highlights present fairly, in all material respects, the financial position of Fidelity Leveraged Company Stock Fund (a fund of Fidelity Securities Fund) at July 31, 2006, and the results of its operations for the year then ended, the changes in its net assets for each of the two years in the period then ended and the financial highlights for each of the five years in the period then ended, in conformity with accounting principles generally accepted in the United States of America. These financial statements and financial highlights (hereafter referred to as "financial statements") are the responsibility of the Fidelity Leveraged Company Stock Fund's management; our responsibility is to express an opinion on these financial statements based on our audits. We conducted our audits of these financial statements in accordance with the standards of the Public Company Accounting Oversight Board (United States). Those standards require that we plan and perform the audit to obtain reasonable assurance about whether the financial statements are free of material misstatement. An audit includes examining, on a test basis, evidence supporting the amounts and disclosures in the financial statements, assessing the accounting principles used and significant estimates made by management, and evaluating the overall financial statement presentation. We believe that our audits, which included confirmation of securities at July 31, 2006 by correspondence with the custodian and brokers, provide a reasonable basis for our opinion.
/s/ PricewaterhouseCoopers LLP
PricewaterhouseCoopers LLP
Boston, Massachusetts
September 13, 2006
Annual Report
Trustees and Officers
The Trustees, Members of the Advisory Board, and executive officers of the trust and fund, as applicable, are listed below. The Board of Trustees governs the fund and is responsible for protecting the interests of shareholders. The Trustees are experienced executives who meet periodically throughout the year to oversee the fund's activities, review contractual arrangements with companies that provide services to the fund, and review the fund's performance. Except for William O. McCoy and Albert R. Gamper, Jr., each of the Trustees oversees 345 funds advised by FMR or an affiliate. Mr. McCoy oversees 347 funds advised by FMR or an affiliate. Mr. Gamper oversees 292 funds advised by FMR or an affiliate.
The Trustees hold office without limit in time except that (a) any Trustee may resign; (b) any Trustee may be removed by written instrument, signed by at least two-thirds of the number of Trustees prior to such removal; (c) any Trustee who requests to be retired or who has become incapacitated by illness or injury may be retired by written instrument signed by a majority of the other Trustees; and (d) any Trustee may be removed at any special meeting of shareholders by a two-thirds vote of the outstanding voting securities of the trust. Each Trustee who is not an interested person (as defined in the 1940 Act) (Independent Trustee), shall retire not later than the last day of the calendar year in which his or her 72nd birthday occurs. The Independent Trustees may waive this mandatory retirement age policy with respect to individual Trustees. The executive officers and Advisory Board Members hold office without limit in time, except that any officer and Advisory Board Member may resign or may be removed by a vote of a majority of the Trustees at any regular meeting or any special meeting of the Trustees. Except as indicated, each individual has held the office shown or other offices in the same company for the past five years.
The fund's Statement of Additonal Information (SAI) includes more information about the Trustees. To request a free copy, call Fidelity at 1-800-544-8544.
Interested Trustees*:
Correspondence intended for each Trustee who is an interested person may be sent to Fidelity Investments, 82 Devonshire Street, Boston, Massachusetts 02109.
Name, Age; Principal Occupation |
Edward C. Johnson 3d (76) |
| Year of Election or Appointment: 1984 Mr. Johnson is Chairman of the Board of Trustees. Mr. Johnson serves as President (2006-present), Chief Executive Officer, Chairman, and a Director of FMR Corp.; Chairman and a Director of FMR; Chairman and a Director of Fidelity Research & Analysis Company (FRAC); Chairman and a Director of Fidelity Investments Money Management, Inc.; and Chairman (2001-present) and a Director (1999-present) of FMR Co., Inc. In addition, Mr. Johnson serves as Chairman and Director of Fidelity International Limited (FIL). |
Stephen P. Jonas (53) |
| Year of Election or Appointment: 2005 Mr. Jonas is Senior Vice President of Leveraged Company Stock (2005-present). He also serves as Senior Vice President of other Fidelity funds (2005-present). Mr. Jonas is Executive Director of FMR (2005-present) and FMR Co., Inc. (2005-present). He also serves as a Director of Fidelity Investments Money Management, Inc. (2005-present) and FMR Corp. (2003-present). Previously, Mr. Jonas served as President of Fidelity Enterprise Operations and Risk Services (2004-2005), Chief Administrative Officer (2002-2004), and Chief Financial Officer of FMR Corp. (1998-2002). In addition, he serves on the Boards of Boston Ballet (2003-present) and Simmons College (2003-present). |
Robert L. Reynolds (54) |
| Year of Election or Appointment: 2003 Mr. Reynolds is President and a Director of FMR (2005-present), Fidelity Investments Money Management, Inc. (2005-present), and FMR Co., Inc. (2005-present). Mr. Reynolds also serves as a Director (2003-present) and Chief Operating Officer (2000-present) of FMR Corp. and a Director of Strategic Advisers, Inc. (2005-present). He also serves on the Board at Fidelity Investments Canada, Ltd. (2000-present). Previously, Mr. Reynolds served as President of Fidelity Investments Institutional Retirement Group (1996-2000). |
* Trustees have been determined to be "Interested Trustees" by virtue of, among other things, their affiliation with the trusts or various entities under common control with FMR.
Annual Report
Independent Trustees:
Correspondence intended for each Independent Trustee (that is, the Trustees other than the Interested Trustees) may be sent to Fidelity Investments, P.O. Box 55235, Boston, Massachusetts 02205-5235.
Name, Age; Principal Occupation |
Dennis J. Dirks (58) |
| Year of Election or Appointment: 2005 Prior to his retirement in May 2003, Mr. Dirks was Chief Operating Officer and a member of the Board of The Depository Trust & Clearing Corporation (DTCC) (1999-2003). He also served as President, Chief Operating Officer, and Board member of The Depository Trust Company (DTC) (1999-2003) and President and Board member of the National Securities Clearing Corporation (NSCC) (1999-2003). In addition, Mr. Dirks served as Chief Executive Officer and Board member of the Government Securities Clearing Corporation (2001-2003) and Chief Executive Officer and Board member of the Mortgage-Backed Securities Clearing Corporation (2001-2003). Mr. Dirks also serves as a Trustee and a member of the Finance Committee of Manhattan College (2005-present) and a Trustee and a member of the Finance Committee of AHRC of Nassau County (2006-present). |
Albert R. Gamper, Jr. (64) |
| Year of Election or Appointment: 2006 Trustee of Fidelity Securities Fund. Mr. Gamper also serves as a Trustee (2006-present) or Member of the Advisory Board (2005-present) of other investment companies advised by FMR. Prior to his retirement in December 2004, Mr. Gamper served as Chairman of the Board of CIT Group Inc. (commercial finance). During his tenure with CIT Group Inc. Mr. Gamper served in numerous senior management positions, including Chairman (1987-1989; 1999-2001; 2002-2004), Chief Executive Officer (1987-2004), and President (1989-2002). He currently serves as a member of the Board of Directors of Public Service Enterprise Group (utilities, 2001-present), Chairman of the Board of Governors, Rutgers University (2004-present), and Chairman of the Board of Saint Barnabas Health Care System. |
Robert M. Gates (62) |
| Year of Election or Appointment: 1997 Dr. Gates is Chairman of the Independent Trustees (2006-present). Dr. Gates is President of Texas A&M University (2002-present). He was Director of the Central Intelligence Agency (CIA) from 1991 to 1993. From 1989 to 1991, Dr. Gates served as Assistant to the President of the United States and Deputy National Security Advisor. Dr. Gates is a Director of NACCO Industries, Inc. (mining and manufacturing), Parker Drilling Co., Inc. (drilling and rental tools for the energy industry, 2001-present), and Brinker International (restaurant management, 2003-present). Previously, Dr. Gates served as a Director of LucasVarity PLC (automotive components and diesel engines), a Director of TRW Inc. (automotive, space, defense, and information technology), and Dean of the George Bush School of Government and Public Service at Texas A&M University (1999-2001). |
George H. Heilmeier (70) |
| Year of Election or Appointment: 2004 Dr. Heilmeier is Chairman Emeritus of Telcordia Technologies (communication software and systems), where prior to his retirement, he served as company Chairman and Chief Executive Officer. He currently serves on the Boards of Directors of The Mitre Corporation (systems engineering and information technology support for the government), and HRL Laboratories (private research and development, 2004-present). He is Chairman of the General Motors Science & Technology Advisory Board and a Life Fellow of the Institute of Electrical and Electronics Engineers (IEEE). Dr. Heilmeier is a member of the Defense Science Board and the National Security Agency Advisory Board. He is also a member of the National Academy of Engineering, the American Academy of Arts and Sciences, and the Board of Overseers of the School of Engineering and Applied Science of the University of Pennsylvania. Previously, Dr. Heilmeier served as a Director of TRW Inc. (automotive, space, defense, and information technology, 1992-2002), Compaq (1994-2002), Automatic Data Processing, Inc. (ADP) (technology-based business outsourcing, 1995-2002), INET Technologies Inc. (telecommunications network surveillance, 2001-2004), and Teletech Holdings (customer management services). He is the recipient of the 2005 Kyoto Prize in Advanced Technology for his invention of the liquid crystal display. |
Marie L. Knowles (59) |
| Year of Election or Appointment: 2001 Prior to Ms. Knowles' retirement in June 2000, she served as Executive Vice President and Chief Financial Officer of Atlantic Richfield Company (ARCO) (diversified energy, 1996-2000). From 1993 to 1996, she was a Senior Vice President of ARCO and President of ARCO Transportation Company. She served as a Director of ARCO from 1996 to 1998. She currently serves as a Director of Phelps Dodge Corporation (copper mining and manufacturing) and McKesson Corporation (healthcare service, 2002-present). Ms. Knowles is a Trustee of the Brookings Institution and the Catalina Island Conservancy and also serves as a member of the Advisory Board for the School of Engineering of the University of Southern California. |
Ned C. Lautenbach (62) |
| Year of Election or Appointment: 2000 Mr. Lautenbach has been a partner of Clayton, Dubilier & Rice, Inc. (private equity investment firm) since September 1998. Previously, Mr. Lautenbach was with the International Business Machines Corporation (IBM) from 1968 until his retirement in 1998. Mr. Lautenbach serves as a Director of Italtel Holding S.p.A. (telecommunications (Milan, Italy), 2004-present) and Eaton Corporation (diversified industrial) as well as the Philharmonic Center for the Arts in Naples, Florida. He also is a member of the Board of Trustees of Fairfield University (2005-present), as well as a member of the Council on Foreign Relations. |
William O. McCoy (72) |
| Year of Election or Appointment: 1997 Prior to his retirement in December 1994, Mr. McCoy was Vice Chairman of the Board of BellSouth Corporation (telecommunications) and President of BellSouth Enterprises. He is currently a Director of Duke Realty Corporation (real estate). He is also a partner of Franklin Street Partners (private investment management firm). In addition, Mr. McCoy served as the Interim Chancellor (1999-2000) and a member of the Board of Visitors for the University of North Carolina at Chapel Hill and currently serves as Chairman of the Board of Directors of the University of North Carolina Health Care System. He also served as Vice President of Finance for the University of North Carolina (16-school system). |
Cornelia M. Small (62) |
| Year of Election or Appointment: 2005 Ms. Small is a member (2000-present) and Chairperson (2002-present) of the Investment Committee, and a member (2002-present) of the Board of Trustees of Smith College. Previously, she served as Chief Investment Officer (1999-2000), Director of Global Equity Investments (1996-1999), and a member of the Board of Directors of Scudder, Stevens & Clark (1990-1997) and Scudder Kemper Investments (1997-1999). In addition, Ms. Small served as Co-Chair (2000-2003) of the Annual Fund for the Fletcher School of Law and Diplomacy. |
William S. Stavropoulos (67) |
| Year of Election or Appointment: 2002 Mr. Stavropoulos is Chairman Emeritus of the Board of Directors of The Dow Chemical Company. Since joining The Dow Chemical Company in 1967, Mr. Stavropoulos served in numerous senior management positions, including President (1993-2000; 2002-2003), CEO (1995-2000; 2002-2004), and Chairman of the Executive Committee (2000-2004). Currently, he is a Director of NCR Corporation (data warehousing and technology solutions), BellSouth Corporation (telecommunications), Chemical Financial Corporation, Maersk Inc. (industrial conglomerate, 2002-present), and Metalmark Capital (private equity investment firm, 2005-present). He also serves as a member of the Board of Trustees of the American Enterprise Institute for Public Policy Research. In addition, Mr. Stavropoulos is a member of The Business Council, J.P. Morgan International Council and the University of Notre Dame Advisory Council for the College of Science. |
Kenneth L. Wolfe (67) |
| Year of Election or Appointment: 2005 Prior to his retirement in 2001, Mr. Wolfe was Chairman and Chief Executive Officer of Hershey Foods Corporation (1993-2001). He currently serves as a member of the boards of Adelphia Communications Corporation (2003-present), Bausch & Lomb, Inc., and Revlon Inc. (2004-present). |
Annual Report
Advisory Board Members and Executive Officers:
Correspondence intended for Mr. Keyes may be sent to Fidelity Investments, P.O. Box 55235, Boston, Massachusetts 02205-5235. Correspondence intended for each executive officer and Mr. Lynch may be sent to Fidelity Investments, 82 Devonshire Street, Boston, Massachusetts 02109.
Name, Age; Principal Occupation |
James H. Keyes (65) |
| Year of Election or Appointment: 2006 Member of the Advisory Board of Fidelity Securities Fund. Prior to his retirement in 2003, Mr. Keyes was Chairman, President, and Chief Executive Officer of Johnson Controls, Inc. (automotive supplier, 1993-2003). He currently serves as a member of the boards of LSI Logic Corporation (semiconductor technologies, 1984-present), Navistar International Corporation (manufacture and sale of trucks, buses, and diesel engines, 2002-present), and Pitney Bowes, Inc. (integrated mail, messaging, and document management solutions, 1998-present). |
Peter S. Lynch (62) |
| Year of Election or Appointment: 2003 Member of the Advisory Board of Fidelity Securities Fund. Mr. Lynch is Vice Chairman and a Director of FMR, and Vice Chairman (2001-present) and a Director (1999-present) of FMR Co., Inc. Previously, Mr. Lynch served as a Trustee of the Fidelity funds (1990-2003). In addition, he serves as the Chairman of the Inner-City Scholarship Fund. |
Walter C. Donovan (44) |
| Year of Election or Appointment: 2005 Vice President of Leveraged Company Stock. Mr. Donovan also serves as Vice President of Fidelity's High Income Funds (2005-present). Mr. Donovan also serves as Executive Vice President of FMR (2005-present) and FMR Co., Inc. (2005-present). Previously, Mr. Donovan served as Vice President of Fidelity's Fixed-Income Funds (2005-2006), certain Asset Allocation Funds (2005-2006), certain Balanced Funds (2005-2006), and as Vice President and Director of Fidelity's International Equity Trading group (1998-2005). |
Robert A. Lawrence (53) |
| Year of Election or Appointment: 2006 Vice President of Leveraged Company Stock. Mr. Lawrence also serves as Vice President of the High Income Funds. Mr. Lawrence is Senior Vice President of FMR (2006-present) and FMR Co., Inc. (2006-present). Previously, Mr. Lawrence served as President of Fidelity Strategic Investments (2002-2005). |
Thomas Soviero (42) |
| Year of Election or Appointment: 2003 Vice President of Leveraged Company Stock. Mr. Soviero also serves as Vice President of other funds advised by FMR. Prior to assuming his current responsibilities, Mr. Soviero has worked as a research analyst, manager and director of high-yield research. Mr. Soviero also serves as Senior Vice President of FMR (2005) and FMR Co., Inc. (2005). |
Eric D. Roiter (57) |
| Year of Election or Appointment: 2000 Secretary of Leveraged Company Stock. He also serves as Secretary of other Fidelity funds; Vice President, General Counsel, and Secretary of FMR Co., Inc. (2001-present) and FMR; Assistant Secretary of Fidelity Management & Research (U.K.) Inc. (2001-present), Fidelity Research & Analysis Company (2001-present), and Fidelity Investments Money Management, Inc. (2001-present). Mr. Roiter is an Adjunct Member, Faculty of Law, at Boston College Law School (2003-present). Previously, Mr. Roiter served as Vice President and Secretary of Fidelity Distributors Corporation (FDC) (1998-2005). |
Stuart Fross (46) |
| Year of Election or Appointment: 2003 Assistant Secretary of Leveraged Company Stock. Mr. Fross also serves as Assistant Secretary of other Fidelity funds (2003-present), Vice President and Secretary of FDC (2005-present), and is an employee of FMR. |
Christine Reynolds (47) |
| Year of Election or Appointment: 2004 President and Treasurer of Leveraged Company Stock. Ms. Reynolds also serves as President and Treasurer of other Fidelity funds (2004-present) and is a Vice President (2003-present) and an employee (2002-present) of FMR. Before joining Fidelity Investments, Ms. Reynolds worked at PricewaterhouseCoopers LLP (PwC) (1980-2002), where she was most recently an audit partner with PwC's investment management practice. |
R. Stephen Ganis (40) |
| Year of Election or Appointment: 2006 Anti-Money Laundering (AML) officer of Leveraged Company Stock. Mr. Ganis also serves as AML officer of other Fidelity funds (2006-present) and FMR Corp. (2003-present). Before joining Fidelity Investments, Mr. Ganis practiced law at Goodwin Procter, LLP (2000-2002). |
Joseph B. Hollis (58) |
| Year of Election or Appointment: 2006 Chief Financial Officer of Leveraged Company Stock. Mr. Hollis also serves as Chief Financial Officer of other Fidelity funds. Mr. Hollis is President of Fidelity Pricing and Cash Management Services (FPCMS) (2005-present). Mr. Hollis also serves as President and Director of Fidelity Service Company, Inc. (2006-present). Previously, Mr. Hollis served as Senior Vice President of Cash Management Services (1999-2002) and Investment Management Operations (2002-2005). |
Kenneth A. Rathgeber (59) |
| Year of Election or Appointment: 2004 Chief Compliance Officer of Leveraged Company Stock. Mr. Rathgeber also serves as Chief Compliance Officer of other Fidelity funds (2004-present) and Executive Vice President of Risk Oversight for Fidelity Investments (2002-present). He is Chief Compliance Officer of FMR (2005-present), FMR Co., Inc. (2005-present), Fidelity Management & Research (U.K.) Inc. (2005-present), Fidelity Research & Analysis Company (2005-present), Fidelity Investments Money Management, Inc. (2005-present), and Strategic Advisers, Inc. (2005-present). Previously, Mr. Rathgeber served as Executive Vice President and Chief Operating Officer for Fidelity Investments Institutional Services Company, Inc. (1998-2002). |
Bryan A. Mehrmann (45) |
| Year of Election or Appointment: 2005 Deputy Treasurer of Leveraged Company Stock. Mr. Mehrmann also serves as Deputy Treasurer of other Fidelity funds (2005-present) and is an employee of FMR. Previously, Mr. Mehrmann served as Vice President of Fidelity Investments Institutional Services Group (FIIS)/Fidelity Investments Institutional Operations Corporation, Inc. (FIIOC) Client Services (1998-2004). |
Kimberley H. Monasterio (42) |
| Year of Election or Appointment: 2004 Deputy Treasurer of Leveraged Company Stock. Ms. Monasterio also serves as Deputy Treasurer of other Fidelity funds (2004) and is an employee of FMR (2004). Before joining Fidelity Investments, Ms. Monasterio served as Treasurer (2000-2004) and Chief Financial Officer (2002-2004) of the Franklin Templeton Funds and Senior Vice President of Franklin Templeton Services, LLC (2000-2004). |
Kenneth B. Robins (36) |
| Year of Election or Appointment: 2005 Deputy Treasurer of Leveraged Company Stock. Mr. Robins also serves as Deputy Treasurer of other Fidelity funds (2005-present) and is an employee of FMR (2004-present). Before joining Fidelity Investments, Mr. Robins worked at KPMG LLP, where he was a partner in KPMG's department of professional practice (2002-2004) and a Senior Manager (1999-2000). In addition, Mr. Robins served as Assistant Chief Accountant, United States Securities and Exchange Commission (2000-2002). |
Robert G. Byrnes (39) |
| Year of Election or Appointment: 2005 Assistant Treasurer ofLeveraged Company Stock.. Mr. Byrnes also serves as Assistant Treasurer of other Fidelity funds (2005-present) and is an employee of FMR (2005-present). Previously, Mr. Byrnes served as Vice President of FPCMS (2003-2005). Before joining Fidelity Investments, Mr. Byrnes worked at Deutsche Asset Management where he served as Vice President of the Investment Operations Group (2000-2003). |
John H. Costello (59) |
| Year of Election or Appointment: 2000 Assistant Treasurer of Leveraged Company Stock. Mr. Costello also serves as Assistant Treasurer of other Fidelity funds and is an employee of FMR. |
Peter L. Lydecker (52) |
| Year of Election or Appointment: 2004 Assistant Treasurer of Leveraged Company Stock. Mr. Lydecker also serves as Assistant Treasurer of other Fidelity funds (2004) and is an employee of FMR. |
Mark Osterheld (51) |
| Year of Election or Appointment: 2002 Assistant Treasurer of Leveraged Company Stock. Mr. Osterheld also serves as Assistant Treasurer of other Fidelity funds (2002) and is an employee of FMR. |
Gary W. Ryan (47) |
| Year of Election or Appointment: 2005 Assistant Treasurer of Leveraged Company Stock. Mr. Ryan also serves as Assistant Treasurer of other Fidelity funds (2005-present) and is an employee of FMR (2005-present). Previously, Mr. Ryan served as Vice President of Fund Reporting in FPCMS (1999-2005). |
Salvatore Schiavone (40) |
| Year of Election or Appointment: 2005 Assistant Treasurer of Leveraged Company Stock. Mr. Schiavone also serves as Assistant Treasurer of other Fidelity funds (2005-present) and is an employee of FMR (2005-present). Before joining Fidelity Investments, Mr. Schiavone worked at Deutsche Asset Management, where he most recently served as Assistant Treasurer (2003-2005) of the Scudder Funds and Vice President and Head of Fund Reporting (1996-2003). |
Annual Report
Distributions
The Board of Trustees of Fidelity Leveraged Company Stock Fund voted to pay on September 11, 2006, to shareholders of record at the opening of business on September 8, 2006, a distribution of $1.07 per share derived from capital gains realized from sales of portfolio securities and a dividend of $.07 per share from net investment income.
The fund hereby designates as a capital gain dividend with respect to the taxable year ended July 31, 2006 $169,235,491, or, if subsequently determined to be different, the net capital gain of such year.
The fund designates 33% and 85% of the dividends distributed in months of September 05 and December 05, respectively during the fiscal year as qualifying for the dividends-received deduction for corporate shareholders.
The fund designates 100% distributed during the fiscal year as amounts which may be taken into account as a dividend for the purposes of the maximum rate under section 1(h)(11) of the Internal Revenue Code.
The fund will notify shareholders in January 2007 of amounts for use in preparing 2006 income tax returns.
Annual Report
Proxy Voting Results
A special meeting of the fund's shareholders was held on May 17, 2006. The results of votes taken among shareholders on the proposals before them are reported below. Each vote reported represents one dollar of net asset value held on the record date for the meeting.
PROPOSAL 1 |
To elect a Board of Trustees. A |
| # of
Votes | % of
Votes |
Dennis J. Dirks |
Affirmative | 43,119,905,166.54 | 95.455 |
Withheld | 2,053,001,967.67 | 4.545 |
TOTAL | 45,172,907,134.21 | 100.000 |
Albert R. Gamper, Jr. |
Affirmative | 43,068,780,128.62 | 95.342 |
Withheld | 2,104,127,005.59 | 4.658 |
TOTAL | 45,172,907,134.21 | 100.000 |
Robert M. Gates |
Affirmative | 43,032,117,662.60 | 95.261 |
Withheld | 2,140,789,471.61 | 4.739 |
TOTAL | 45,172,907,134.21 | 100.000 |
George H. Heilmeier |
Affirmative | 43,023,368,882.30 | 95.242 |
Withheld | 2,149,538,251.91 | 4.758 |
TOTAL | 45,172,907,134.21 | 100.000 |
Edward C. Johnson 3d |
Affirmative | 42,881,915,819.70 | 94.928 |
Withheld | 2,290,991,314.51 | 5.072 |
TOTAL | 45,172,907,134.21 | 100.000 |
Stephen P. Jonas |
Affirmative | 43,081,912,066.37 | 95.371 |
Withheld | 2,090,995,067.84 | 4.629 |
TOTAL | 45,172,907,134.21 | 100.000 |
James H. KeyesB |
Affirmative | 43,049,050,093.79 | 95.298 |
Withheld | 2,123,857,040.42 | 4.702 |
TOTAL | 45,172,907,134.21 | 100.000 |
Marie L. Knowles |
Affirmative | 43,090,434,696.02 | 95.390 |
Withheld | 2,082,472,438.19 | 4.610 |
TOTAL | 45,172,907,134.21 | 100.000 |
| # of
Votes | % of
Votes |
Ned C. Lautenbach |
Affirmative | 43,082,185,255.05 | 95.372 |
Withheld | 2,090,721,879.16 | 4.628 |
TOTAL | 45,172,907,134.21 | 100.000 |
William O. McCoy |
Affirmative | 42,960,162,066.32 | 95.102 |
Withheld | 2,212,745,067.89 | 4.898 |
TOTAL | 45,172,907,134.21 | 100.000 |
Robert L. Reynolds |
Affirmative | 43,087,560,419.66 | 95.384 |
Withheld | 2,085,346,714.55 | 4.616 |
TOTAL | 45,172,907,134.21 | 100.000 |
Cornelia M. Small |
Affirmative | 43,092,070,014.53 | 95.394 |
Withheld | 2,080,837,119.68 | 4.606 |
TOTAL | 45,172,907,134.21 | 100.000 |
William S. Stavropoulos |
Affirmative | 43,002,032,676.43 | 95.194 |
Withheld | 2,170,874,457.78 | 4.806 |
TOTAL | 45,172,907,134.21 | 100.000 |
Kenneth L. Wolfe |
Affirmative | 43,047,241,852.81 | 95.294 |
Withheld | 2,125,665,281.40 | 4.706 |
TOTAL | 45,172,907,134.21 | 100.000 |
A Denotes trust-wide proposal and voting results. B Effective on or about January 1, 2007. |
Annual Report
Board Approval of Investment Advisory Contracts and Management Fees
Fidelity Leveraged Company Stock Fund
Each year, typically in July, the Board of Trustees, including the Independent Trustees (together, the Board), votes on the renewal of the management contract and sub-advisory agreements (together, the Advisory Contracts) for the fund. The Board, assisted by the advice of fund counsel and Independent Trustees' counsel, requests and considers a broad range of information throughout the year.
The Board meets regularly each month except August and takes into account throughout the year matters bearing on Advisory Contracts. The Board, acting directly and through its separate committees, considers at each of its meetings factors that are relevant to the annual renewal of the fund's Advisory Contracts, including the services and support provided to the fund and its shareholders. At the time of the renewal, the Board had 12 standing committees, each composed of Independent Trustees with varying backgrounds, to which the Board has assigned specific subject matter responsibilities in order to enhance effective decision-making by the Board. Each committee has adopted a written charter outlining the structure and purposes of the committee. One such committee, the Equity Contract Committee, meets periodically as needed throughout the year to consider matters specifically related to the annual renewal of Advisory Contracts. The committee requests and receives information on, and makes recommendations to the Independent Trustees concerning, the approval and annual review of the Advisory Contracts.
At its July 2006 meeting, the Board of Trustees, including the Independent Trustees, unanimously determined to renew the Advisory Contracts for the fund. In reaching its determination, the Board considered all factors it believed relevant, including (i) the nature, extent, and quality of the services to be provided to the fund and its shareholders (including the investment performance of the fund); (ii) the competitiveness of the management fee and total expenses of the fund; (iii) the total costs of the services to be provided by and the profits to be realized by the investment adviser and its affiliates from the relationship with the fund; (iv) the extent to which economies of scale would be realized as the fund grows; and (v) whether fee levels reflect these economies of scale, if any, for the benefit of fund shareholders.
In determining whether to renew the Advisory Contracts for the fund, the Board ultimately reached a determination, with the assistance of fund counsel and Independent Trustees' counsel, that the renewal of the Advisory Contracts and the compensation to be received by Fidelity under the management contract is consistent with Fidelity's fiduciary duty under applicable law. In addition to evaluating the specific factors noted above, the Board, in reaching its determination, is aware that shareholders in the fund have a broad range of investment choices available to them, including a wide choice among mutual funds offered by competitors to Fidelity, and that the fund's shareholders, with the opportunity to review and weigh the disclosure provided by the fund in its prospectus and other public disclosures, have chosen to invest in this fund, managed by Fidelity.
Annual Report
Board Approval of Investment Advisory Contracts and
Management Fees - continued
Nature, Extent, and Quality of Services Provided. The Board considered staffing within the investment adviser, FMR, and the sub-advisers (together, the Investment Advisers), including the background of the fund's portfolio manager and the fund's investment objective and discipline. The Independent Trustees also had discussions with senior management of Fidelity's investment operations and investment groups. The Board considered the structure of the portfolio manager compensation program and whether this structure provides appropriate incentives.
Resources Dedicated to Investment Management and Support Services. The Board reviewed the size, education, and experience of the Investment Advisers' investment staff, their use of technology, and the Investment Advisers' approach to recruiting, training, and retaining portfolio managers and other research, advisory, and management personnel. The Board considered Fidelity's extensive global research capabilities that enable the Investment Advisers to aggregate data from various sources in an effort to produce positive investment results. The Board noted that Fidelity's analysts have access to a variety of technological tools that enable them to perform both fundamental and quantitative analysis and to specialize in various disciplines. The Board also considered that Fidelity's portfolio managers and analysts have access to daily portfolio attribution that allows for monitoring of a fund's portfolio, as well as an electronic communication system that provides immediate real-time access to research concerning issuers and credit enhancers.
Shareholder and Administrative Services. The Board considered (i) the nature, extent, quality, and cost of administrative, distribution, and shareholder services performed by the Investment Advisers and their affiliates under the Advisory Contracts and under separate agreements covering transfer agency, pricing and bookkeeping, and securities lending services for the fund; (ii) the nature and extent of the Investment Advisers' supervision of third party service providers, principally custodians and subcustodians; and (iii) the resources devoted to, and the record of compliance with, the fund's compliance policies and procedures. The Board reviewed the allocation of fund brokerage, including allocations to brokers affiliated with the Investment Advisers, the use of brokerage commissions to pay fund expenses, and the use of "soft" commission dollars to pay for research services. The Board also considered that Fidelity voluntarily pays for market data out of its own resources.
The Board noted that the growth of fund assets across the complex allows Fidelity to reinvest in the development of services designed to enhance the value or convenience of the Fidelity funds as investment vehicles. These services include 24-hour access to account information and market information through phone representatives and over the Internet, and investor education materials and asset allocation tools.
Annual Report
Investment in a Large Fund Family. The Board considered the benefits to shareholders of investing in a Fidelity fund, including the benefits of investing in a fund that is part of a large family of funds offering a variety of investment disciplines and providing for a large variety of mutual fund investor services. For example, fund shareholders are offered the privilege of exchanging shares of the fund for shares of other Fidelity funds, as set forth in the fund's prospectus, without paying a sales charge. The Board noted that, since the last Advisory Contract renewals in July 2005, Fidelity has taken a number of actions that benefited particular funds, including (i) dedicating additional resources to investment research and to restructure the investment research teams; (ii) voluntarily entering into contractual arrangements with certain brokers pursuant to which Fidelity pays for research products and services separately out of its own resources, rather than bundling with fund commissions; (iii) launching the Fidelity Advantage Class of its five Spartan stock index funds and three Spartan bond index funds, which is a lower-fee class available to shareholders with higher account balances; (iv) contractually agreeing to impose expense limitations on Fidelity U.S. Bond Index Fund and reducing the fund's initial investment minimum; and (v) offering shareholders of each of the Fidelity Institutional Money Market Funds the privilege of exchanging shares of the fund for shares of other Fidelity funds.
Investment Performance and Compliance. The Board considered whether the fund has operated within its investment objective, as well as its record of compliance with its investment restrictions. It also reviewed the fund's absolute investment performance, as well as the fund's relative investment performance measured against (i) a broad-based securities market index, and (ii) a peer group of mutual funds deemed appropriate by the Board over multiple periods. The following charts considered by the Board show, over the one-, three-, and five-year periods ended December 31, 2005, the fund's cumulative total returns, the cumulative total returns of a broad-based securities market index ("benchmark"), and a range of cumulative total returns of a peer group of mutual funds identified by Lipper Inc. as having an investment objective similar to that of the fund. The box within each chart shows the 25th percentile return (bottom of box) and the 75th percentile return (top of box) of the Lipper peer group. Returns shown above the box are in the first quartile and returns shown below the box are in the fourth quartile. The percentage beaten number noted below each chart corresponds to the percentile box and represents the percentage of funds in the Lipper peer group whose performance was equal to or lower than that of the fund.
Annual Report
Board Approval of Investment Advisory Contracts and
Management Fees - continued
Fidelity Leveraged Company Stock Fund
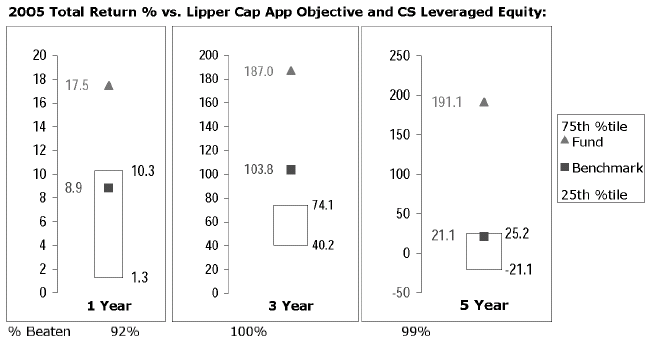
The Board reviewed the fund's relative investment performance against its Lipper peer group and stated that the performance of the fund was in the first quartile for all the periods shown. The Board also stated that the relative investment performance of the fund compared favorably to its benchmark for all the periods shown. The Board also reviewed the fund's relative investment performance against a customized peer group based on a combination of categories defined by Morningstar.
The Board considered that FMR has taken steps to refocus and strengthen equity research, equity portfolio management, and compliance. The Board noted with favor FMR's reorganization of its senior management team in 2005 and FMR's dedication of additional resources to investment research, and participated in the process that led to those changes.
Based on its review, and giving particular weight to the nature and quality of the resources dedicated by the Investment Advisers to maintain and improve relative performance, the Board concluded that the nature, extent, and quality of the services provided to the fund will benefit the fund's shareholders, particularly in light of the Board's view that the fund's shareholders benefit from investing in a fund that is part of a large family of funds offering a variety of investment disciplines and services.
Competitiveness of Management Fee and Total Fund Expenses. The Board considered the fund's management fee and total expenses compared to "mapped groups" of competitive funds and classes. Fidelity creates "mapped groups" by combining similar Lipper investment objective categories that have comparable management fee characteristics. Combining Lipper investment objective categories aids the Board's management fee and total expense comparisons by broadening the competitive group used for comparison and by reducing the number of universes to which various Fidelity funds are compared.
Annual Report
The Board considered two proprietary management fee comparisons for the 12-month periods shown in the chart below. The group of Lipper funds used by the Board for management fee comparisons is referred to below as the "Total Mapped Group" and, for the reasons explained above, is broader than the Lipper peer group used by the Board for performance comparisons. The Total Mapped Group comparison focuses on a fund's standing relative to the total universe of comparable funds available to investors, in terms of gross management fees before expense reimbursements or caps. "TMG %" represents the percentage of funds in the Total Mapped Group that had management fees that were lower than the fund's. For example, a TMG % of 15% means that 85% of the funds in the Total Mapped Group had higher management fees than the fund. The "Asset-Size Peer Group" (ASPG) comparison focuses on a fund's standing relative to non-Fidelity funds similar in size to the fund within the Total Mapped Group. The ASPG represents at least 15% of the funds in the Total Mapped Group with comparable asset size and management fee characteristics, subject to a minimum of 50 funds (or all funds in the Total Mapped Group if fewer than 50). Additional information, such as the ASPG quartile in which the fund's management fee ranked, is also included in the chart and considered by the Board.
Fidelity Leveraged Company Stock Fund
The Board noted that the fund's management fee ranked below the median of its Total Mapped Group and below the median of its ASPG for 2005.
Annual Report
Board Approval of Investment Advisory Contracts and
Management Fees - continued
Based on its review, the Board concluded that the fund's management fee was fair and reasonable in light of the services that the fund receives and the other factors considered.
In its review of the fund's total expenses, the Board considered the fund's management fee as well as other fund expenses, such as transfer agent fees, pricing and bookkeeping fees, and custodial, legal, and audit fees. The Board also noted the effects of any waivers and reimbursements on fees and expenses. As part of its review, the Board also considered current and historical total expenses of the fund compared to competitive fund median expenses. The fund is compared to those funds and classes in the Total Mapped Group (used by the Board for management fee comparisons) that have a similar sales load structure.
The Board noted that the fund's total expenses ranked below its competitive median for 2005.
In its review of total expenses, the Board also considered Fidelity fee structures and other information on clients that FMR and its affiliates service in other competitive markets, such as other mutual funds advised or subadvised by FMR or its affiliates, pension plan clients, and other institutional clients.
Based on its review, the Board concluded that the fund's total expenses were reasonable in light of the services that the fund and its shareholders receive and the other factors considered.
Costs of the Services and Profitability. The Board considered the revenues earned and the expenses incurred by Fidelity in conducting the business of developing, marketing, distributing, managing, administering and servicing the fund and its shareholders. The Board also considered the level of Fidelity's profits in respect of all the Fidelity funds.
On an annual basis, FMR presents to the Board Fidelity's profitability for the fund. Fidelity calculates the profitability for each fund, as well as aggregate profitability for groups of Fidelity funds and all Fidelity funds, using a series of detailed revenue and cost allocation methodologies which originate with the audited books and records of Fidelity. The Audit Committee of the Board reviews any significant changes from the prior year's methodologies.
PricewaterhouseCoopers LLP (PwC), independent registered accounting firm and auditor to Fidelity and certain Fidelity funds, has been engaged annually by the Board as part of the Board's assessment of the results of Fidelity's profitability analysis. PwC's engagement includes the review and assessment of Fidelity's methodologies used in determining the revenues and expenses attributable to Fidelity's mutual fund business, and completion of agreed-upon procedures surrounding the mathematical accuracy of fund profitability and its conformity to allocation methodologies. After considering PwC's reports issued under the engagement and information provided by Fidelity, the Board believes that while other allocation methods may also be reasonable, Fidelity's profitability methodologies are reasonable in all material respects.
Annual Report
The Board has also reviewed Fidelity's non-fund businesses and any fall-out benefits related to the mutual fund business as well as cases where Fidelity's affiliates may benefit from or be related to the fund's business.
The Board considered the costs of the services provided by and the profits realized by Fidelity in connection with the operation of the fund and determined that the amount of profit is a fair entrepreneurial profit for the management of the fund.
Economies of Scale. The Board considered whether there have been economies of scale in respect of the management of the Fidelity funds, whether the Fidelity funds (including the fund) have appropriately benefited from any such economies of scale, and whether there is potential for realization of any further economies of scale. The Board considered the extent to which the fund will benefit from economies of scale through increased services to the fund, through waivers or reimbursements, or through fee or expense reductions, including reductions that occur through operation of the transfer agent agreement. The transfer agent fee varies in part based on the number of accounts in the fund. If the number of accounts decreases or the average account size increases, the overall transfer agent fee rate decreases.
The Board recognized that the fund's management contract incorporates a "group fee" structure, which provides for lower fee rates as total fund assets under FMR's management increase, and for higher fee rates as total fund assets under FMR's management decrease. The Board considered that the group fee is designed to deliver the benefits of economies of scale to fund shareholders when total fund assets increase, even if assets of any particular fund are unchanged or have declined, because some portion of Fidelity's costs are attributable to services provided to all Fidelity funds, and all funds benefit if those costs can be allocated among more assets. The Board concluded that, given the group fee structure, fund shareholders will achieve a certain level of economies of scale as assets under FMR's management increase at the fund complex level, regardless of whether Fidelity achieves any such economies of scale.
The Board further concluded that any potential economies of scale are being shared between fund shareholders and Fidelity in an appropriate manner.
Additional Information Requested by the Board. In order to develop fully the factual basis for consideration of the Advisory Contracts, the Board requested additional information on several topics, including (i) Fidelity's fund profitability methodology and profitability trends within certain funds; (ii) portfolio manager compensation; (iii) the extent to which any economies of scale exist and are shared between the funds and Fidelity; (iv) the total expenses of certain funds and classes relative to competitors, including the extent to which the expenses of certain funds have been or could be capped; (v) fund performance trends; and (vi) Fidelity's fee structures, including use of performance fees.
Annual Report
Board Approval of Investment Advisory Contracts and
Management Fees - continued
Based on its evaluation of all of the conclusions noted above, and after considering all material factors, the Board ultimately concluded that the advisory fee structures are fair and reasonable, and that the fund's Advisory Contracts should be renewed.
Annual Report
Managing Your Investments
Fidelity offers several ways to conveniently manage your personal investments via your telephone or PC. You can access your account information, conduct trades and research your investments 24 hours a day.
By Phone
Fidelity Automated Service Telephone provides a single toll-free number to access account balances, positions, quotes and trading. It's easy to navigate the service, and on your first call, the system will help you create a personal identification number (PIN) for security.
(phone_graphic)
Fidelity Automated
Service Telephone (FAST®)
1-800-544-5555
Press
1 For mutual fund and brokerage trading.
2 For quotes.*
3 For account balances and holdings.
4 To review orders and mutual
fund activity.
5 To change your PIN.
*0 To speak to a Fidelity representative.
By PC
Fidelity's web site on the Internet provides a wide range of information, including daily financial news, fund performance, interactive planning tools and news about Fidelity products and services.
(computer_graphic)
Fidelity's Web Site
www.fidelity.com
* When you call the quotes line, please remember that a fund's yield and return will vary and, except for money market funds, share price will also vary. This means that you may have a gain or loss when you sell your shares. There is no assurance that money market funds will be able to maintain a stable $1 share price; an investment in a money market fund is not insured or guaranteed by the U.S. government. Total returns are historical and include changes in share price, reinvestment of dividends and capital gains, and the effects of any sales charges.
Annual Report
To Visit Fidelity
For directions and hours,
please call 1-800-544-9797.
Arizona
7001 West Ray Road
Chandler, AZ
15445 N. Scottsdale Road
Scottsdale, AZ
California
815 East Birch Street
Brea, CA
1411 Chapin Avenue
Burlingame, CA
851 East Hamilton Avenue
Campbell, CA
19200 Von Karman Avenue
Irvine, CA
601 Larkspur Landing Circle
Larkspur, CA
10100 Santa Monica Blvd.
Los Angeles, CA
27101 Puerta Real
Mission Viejo, CA
73-575 El Paseo
Palm Desert, CA
251 University Avenue
Palo Alto, CA
123 South Lake Avenue
Pasadena, CA
16995 Bernardo Ctr. Drive
Rancho Bernardo, CA
1220 Roseville Parkway
Roseville, CA
1740 Arden Way
Sacramento, CA
7676 Hazard Center Drive
San Diego, CA
11943 El Camino Real
San Diego, CA
8 Montgomery Street
San Francisco, CA
3793 State Street
Santa Barbara, CA
1200 Wilshire Boulevard
Santa Monica, CA
21701 Hawthorne Boulevard
Torrance, CA
2001 North Main Street
Walnut Creek, CA
6300 Canoga Avenue
Woodland Hills, CA
Colorado
1625 Broadway
Denver, CO
9185 Westview Road
Lone Tree, CO
Connecticut
48 West Putnam Avenue
Greenwich, CT
265 Church Street
New Haven, CT
300 Atlantic Street
Stamford, CT
29 South Main Street
West Hartford, CT
Delaware
400 Delaware Avenue
Wilmington, DE
Florida
4400 N. Federal Highway
Boca Raton, FL
121 Alhambra Plaza
Coral Gables, FL
2948 N. Federal Highway
Ft. Lauderdale, FL
4671 Town Center Parkway
Jacksonville, FL
1907 West State Road 434
Longwood, FL
8880 Tamiami Trail, North
Naples, FL
3501 PGA Boulevard
Palm Beach Gardens, FL
3550 Tamiami Trail, South
Sarasota, FL
1502 N. Westshore Blvd.
Tampa, FL
2465 State Road 7
Wellington, FL
Georgia
3445 Peachtree Road, N.E.
Atlanta, GA
1000 Abernathy Road
Atlanta, GA
Illinois
One North LaSalle Street
Chicago, IL
875 North Michigan Ave.
Chicago, IL
1415 West 22nd Street
Oak Brook, IL
1572 East Golf Road
Schaumburg, IL
3232 Lake Avenue
Wilmette, IL
Indiana
4729 East 82nd Street
Indianapolis, IN
Kansas
5400 College Boulevard
Overland Park, KS
Maine
Three Canal Plaza
Portland, ME
Maryland
7315 Wisconsin Avenue
Bethesda, MD
One W. Pennsylvania Ave.
Towson, MD
Massachusetts
801 Boylston Street
Boston, MA
155 Congress Street
Boston, MA
300 Granite Street
Braintree, MA
44 Mall Road
Burlington, MA
238 Main Street
Cambridge, MA
405 Cochituate Road
Framingham, MA
416 Belmont Street
Worcester, MA
Annual Report
Michigan
500 E. Eisenhower Pkwy.
Ann Arbor, MI
280 Old N. Woodward Ave.
Birmingham, MI
43420 Grand River Avenue
Novi, MI
29155 Northwestern Hwy.
Southfield, MI
Minnesota
7600 France Avenue South
Edina, MN
Missouri
1524 South Lindbergh Blvd.
St. Louis, MO
Nevada
2225 Village Walk Drive
Henderson, NV
New Jersey
150 Essex Street
Millburn, NJ
56 South Street
Morristown, NJ
396 Route 17, North
Paramus, NJ
3518 Route 1 North
Princeton, NJ
530 Broad Street
Shrewsbury, NJ
New York
1055 Franklin Avenue
Garden City, NY
37 West Jericho Turnpike
Huntington Station, NY
1271 Avenue of the Americas
New York, NY
980 Madison Avenue
New York, NY
61 Broadway
New York, NY
350 Park Avenue
New York, NY
200 Fifth Avenue
New York, NY
733 Third Avenue
New York, NY
11 Penn Plaza
New York, NY
2070 Broadway
New York, NY
1075 Northern Blvd.
Roslyn, NY
799 Central Park Avenue
Scarsdale, NY
North Carolina
4611 Sharon Road
Charlotte, NC
7011 Fayetteville Road
Durham, NC
Ohio
3805 Edwards Road
Cincinnati, OH
1324 Polaris Parkway
Columbus, OH
28699 Chagrin Boulevard
Woodmere Village, OH
Oregon
7493 SW Bridgeport Road
Tigard, OR
Pennsylvania
600 West DeKalb Pike
King of Prussia, PA
1735 Market Street
Philadelphia, PA
12001 Perry Highway
Wexford, PA
Rhode Island
47 Providence Place
Providence, RI
Tennessee
6150 Poplar Avenue
Memphis, TN
Texas
10000 Research Boulevard
Austin, TX
4001 Northwest Parkway
Dallas, TX
12532 Memorial Drive
Houston, TX
2701 Drexel Drive
Houston, TX
6560 Fannin Street
Houston, TX
6500 N. MacArthur Blvd.
Irving, TX
6005 West Park Boulevard
Plano, TX
14100 San Pedro
San Antonio, TX
1576 East Southlake Blvd.
Southlake, TX
19740 IH 45 North
Spring, TX
Utah
279 West South Temple
Salt Lake City, UT
Virginia
1861 International Drive
McLean, VA
Washington
411 108th Avenue, N.E.
Bellevue, WA
1518 6th Avenue
Seattle, WA
Washington, DC
1900 K Street, N.W.
Washington, DC
Wisconsin
595 North Barker Road
Brookfield, WI
Fidelity Brokerage Services, Inc., 100 Summer St., Boston, MA 02110 Member NYSE/SIPC
Annual Report
Investment Adviser
Fidelity Management & Research Company
Boston, MA
Investment Sub-Adviser
FMR Co., Inc.
Fidelity Research & Analysis Company (formerly Fidelity Management &
Research (Far East) Inc.)
Fidelity Management & Research
(U.K.) Inc.
Fidelity Investments Japan Limited
Fidelity International Investment
Advisors
Fidelity International Investment
Advisors (U.K.) Limited
General Distributor
Fidelity Distributors Corporation
Boston, MA
Transfer and Service Agent
Fidelity Service Company, Inc.
Boston, MA
Custodian
JPMorgan Chase Bank
New York, NY
The Fidelity Telephone Connection
Mutual Fund 24-Hour Service
Exchanges/Redemptions
and Account Assistance 1-800-544-6666
Product Information 1-800-544-6666
Retirement Accounts 1-800-544-4774
(8 a.m. - 9 p.m.)
TDD Service 1-800-544-0118
for the deaf and hearing impaired
(9 a.m. - 9 p.m. Eastern time)
Fidelity Automated Service
Telephone (FAST ®) (automated graphic) 1-800-544-5555
(automated graphic) Automated line for quickest service
LSF-UANN-0906
1.789248.103
(Fidelity Investment logo)(registered trademark)
Corporate Headquarters
82 Devonshire St., Boston, MA 02109
www.fidelity.com
Fidelity®
OTC
Portfolio
Annual Report
July 31, 2006
(2_fidelity_logos) (Registered_Trademark)
Contents
Chairman's Message | <Click Here> | Ned Johnson's message to shareholders. |
Performance | <Click Here> | How the fund has done over time. |
Management's Discussion | <Click Here> | The manager's review of fund performance, strategy and outlook |
Shareholder Expense Example | <Click Here> | An example of shareholder expenses. |
Investment Changes | <Click Here> | A summary of major shifts in the fund's investments over the past six months. |
Investments | <Click Here> | A complete list of the fund's investments with their market values. |
Financial Statements | <Click Here> | Statements of assets and liabilities, operations, and changes in net assets, as well as financial highlights. |
Notes | <Click Here> | Notes to the financial statements. |
Report of Independent Registered Public Accounting Firm | <Click Here> | |
Trustees and Officers | <Click Here> | |
Proxy Voting Results | <Click Here> | |
Board Approval of Investment Advisory Contracts and Management Fees | <Click Here> | |
To view a fund's proxy voting guidelines and proxy voting record for the 12-month period ended June 30, visit www.fidelity.com/proxyvotingresults or visit the Securities and Exchange Commission's (SEC) web site at www.sec.gov. You may also call 1-800-544-8544 to request a free copy of the proxy voting guidelines.
Standard & Poor's, S&P and S&P 500 are registered service marks of The McGraw-Hill Companies, Inc. and have been licensed for use by Fidelity Distributors Corporation.
Other third party marks appearing herein are the property of their respective owners.
All other marks appearing herein are registered or unregistered trademarks or service marks of FMR Corp. or an affiliated company.
Annual Report
This report and the financial statements contained herein are submitted for the general information of the shareholders of the fund. This report is not authorized for distribution to prospective investors in the fund unless preceded or accompanied by an effective prospectus.
A fund files its complete schedule of portfolio holdings with the SEC for the first and third quarters of each fiscal year on Form N-Q. Forms N-Q are available on the SEC's web site at http://www.sec.gov. A fund's Forms N-Q may be reviewed and copied at the SEC's Public Reference Room in Washington, DC. Information regarding the operation of the SEC's Public Reference Room may be obtained by calling 1-800-SEC-0330. For a complete list of a fund's portfolio holdings, view the most recent quarterly holdings report, semiannual report, or annual report on Fidelity's web site at http://www.fidelity.com/holdings.
NOT FDIC INSURED · MAY LOSE VALUE · NO BANK GUARANTEE
Neither the fund nor Fidelity Distributors Corporation is a bank.
Annual Report
Chairman's Message
(photo_of_Edward_C_Johnson_3d)
Dear Shareholder:
Although many securities markets made gains in early 2006, inflation concerns led to mixed results through the year's mid-point. Financial markets are always unpredictable. There are, however, a number of time-tested principles that can put the historical odds in your favor.
One of the basic tenets is to invest for the long term. Over time, riding out the markets' inevitable ups and downs has proven much more effective than selling into panic or chasing the hottest trend. Even missing only a few of the markets' best days can significantly diminish investor returns. Patience also affords the benefits of compounding - of earning interest on additional income or reinvested dividends and capital gains. There are tax advantages and cost benefits to consider as well. The more you sell, the more taxes you pay, and the more you trade, the higher the costs. While staying the course doesn't eliminate risk, it can considerably lessen the effect of short-term declines.
You can further manage your investing risk through diversification. And today, more than ever, geographic diversification should be taken into account. Studies indicate that asset allocation is the single most important determinant of a portfolio's long-term success. The right mix of stocks, bonds and cash - aligned to your particular risk tolerance and investment objective - is very important. Age-appropriate rebalancing is also an essential aspect of asset allocation. For younger investors, an emphasis on equities - which historically have been the best performing asset class over time - is encouraged. As investors near their specific goal, such as retirement or sending a child to college, consideration may be given to replacing volatile assets (e.g. common stocks) with more-stable fixed investments (bonds or savings plans).
A third investment principle - investing regularly - can help lower the average cost of your purchases. Investing a certain amount of money each month or quarter helps ensure you won't pay for all your shares at market highs. This strategy - known as dollar cost averaging - also reduces unconstructive "emotion" from investing, helping shareholders avoid selling weak performers just prior to an upswing, or chasing a hot performer just before a correction.
We invite you to contact us via the Internet, through our Investor Centers or over the phone. It is our privilege to provide you the information you need to make the investments that are right for you.
Sincerely,
/s/Edward C. Johnson 3d
Edward C. Johnson 3d
Annual Report
Performance: The Bottom Line
Average annual total return reflects the change in the value of an investment, assuming reinvestment of the fund's dividend income and capital gains (the profits earned upon the sale of securities that have grown in value) and assuming a constant rate of performance each year. The $10,000 table and the fund's returns do not reflect the deduction of taxes that a shareholder would pay on fund distributions or the redemption of fund shares. During periods of reimbursement by Fidelity, a fund's total return will be greater than it would be had the reimbursement not occurred. How a fund did yesterday is no guarantee of how it will do tomorrow.
Average Annual Total Returns
Periods ended July 31, 2006 | Past 1
year | Past 5
years | Past 10
years |
Fidelity® OTC Portfolio | -3.58% | 1.28% | 7.20% |
$10,000 Over 10 Years
Let's say hypothetically that $10,000 was invested in Fidelity ® OTC Portfolio on July 31, 1996. The chart shows how the value of your investment would have changed, and also shows how the NASDAQ Composite® Index performed over the same period.
Annual Report
Management's Discussion of Fund Performance
Comments from Sonu Kalra, Portfolio Manager of Fidelity® OTC Portfolio
As measured by the Dow Jones Wilshire 5000 Composite IndexSM - the broadest measure of U.S. equity market performance - stocks did well for most of the 12-month period ending July 31, 2006, before faltering. For the one-year time frame as a whole, the Dow Jones Wilshire benchmark rose 5.43%. That was nearly identical to the 5.38% gain of the Standard & Poor's 500SM Index, a broad market proxy that's a reflection of larger-cap stocks. Stocks were resilient early on, bouncing back quickly after Hurricanes Katrina and Rita caused energy prices to spike to record-high levels. Buoyed by strong corporate earnings and solid economic growth, the S&P 500® ran off six consecutive months of positive returns from November through April. However, stocks pulled back for most of the remainder of the period. A slowdown in economic expansion and consumer spending, reaccelerating energy prices and continued interest rate hikes by the Federal Reserve Board cooled equity performance. Among other widely quoted market yardsticks, the Dow Jones Industrial AverageSM returned 7.59%, while the NASDAQ Composite® Index dropped 3.47%.
During the past year, the fund returned -3.58%, roughly even with the NASDAQ Composite Index. A substantial underweighting and weak security selection in banks hurt performance versus the index, along with unfavorable picks in consumer services, transportation, and semiconductors and semiconductor equipment. Personal computer maker Dell was the biggest detractor. Customer service issues, along with growing competition, sidetracked the stock. Two semiconductor holdings - Broadcom and Marvell Technology Group - struggled amid the flight from stocks more sensitive to broader economic conditions. The stock price of online auctioneer eBay also fell sharply, as did the shares of server and storage systems vendor Rackable Systems. Conversely, stock selection aided performance in several groups, including technology hardware and equipment, software and services, and pharmaceuticals/biotechnology/life science. The top contributor was Apple Computer, driven by robust sales of the iPod digital music player and growing market share for the company's line of Macintosh personal computers. Internet search engine Google also aided our results, while network management software vendor Mercury Interactive received a lucrative buyout offer from Hewlett-Packard. Biotechnology holding Celgene and enterprise storage and data management stock Network Appliance benefited performance as well.
The views expressed above reflect those of the portfolio manager(s) only through the end of the period as stated on the cover of this report and do not necessarily represent the views of Fidelity or any other person in the Fidelity organization. Any such views are subject to change at any time based upon market or other conditions and Fidelity disclaims any responsibility to update such views. These views may not be relied on as investment advice and, because investment decisions for a Fidelity fund are based on numerous factors, may not be relied on as an indication of trading intent on behalf of any Fidelity fund.
Annual Report
Shareholder Expense Example
As a shareholder of the Fund, you incur two types of costs: (1) transaction costs, and (2) ongoing costs, including management fees and other Fund expenses. This Example is intended to help you understand your ongoing costs (in dollars) of investing in the Fund and to compare these costs with the ongoing costs of investing in other mutual funds.
The Example is based on an investment of $1,000 invested at the beginning of the period and held for the entire period (February 1, 2006 to July 31, 2006).
Actual Expenses
The first line of the accompanying table provides information about actual account values and actual expenses. You may use the information in this line, together with the amount you invested, to estimate the expenses that you paid over the period. Simply divide your account value by $1,000.00 (for example, an $8,600 account value divided by $1,000.00 = 8.6), then multiply the result by the number in the first line under the heading entitled "Expenses Paid During Period" to estimate the expenses you paid on your account during this period. A small balance maintenance fee of $12.00 that is charged once a year may apply for certain accounts with a value of less than $2,000. This fee is not included in the table below. If it was, the estimate of expenses you paid during the period would be higher, and your ending account value lower, by this amount.
Hypothetical Example for Comparison Purposes
The second line of the accompanying table provides information about hypothetical account values and hypothetical expenses based on the Fund's actual expense ratio and an assumed rate of return of 5% per year before expenses, which is not the Fund's actual return. The hypothetical account values and expenses may not be used to estimate the actual ending account balance or expenses you paid for the period. You may use this information to compare the ongoing costs of investing in the Fund and other funds. To do so, compare this 5% hypothetical example with the 5% hypothetical examples that appear in the shareholder reports of the other funds. A small balance maintenance fee of $12.00 that is charged once a year may apply for certain accounts with a value of less than $2,000. This fee is not included in the table below. If it was, the estimate of expenses you paid during the period would be higher, and your ending account value lower, by this amount.
Please note that the expenses shown in the table are meant to highlight your ongoing costs only and do not reflect any transaction costs. Therefore, the second line of the table is useful in comparing ongoing costs only, and will not help you determine the relative total costs of owning different funds.
| Beginning
Account Value
February 1, 2006 | Ending
Account Value
July 31, 2006 | Expenses Paid
During Period*
February 1, 2006
to July 31, 2006 |
Actual | $ 1,000.00 | $ 877.60 | $ 4.10 |
Hypothetical (5% return per year before expenses) | $ 1,000.00 | $ 1,020.43 | $ 4.41 |
* Expenses are equal to the Fund's annualized expense ratio of .88%; multiplied by the average account value over the period, multiplied by 181/365 (to reflect the one-half year period).
Annual Report
Investment Changes
Top Ten Stocks as of July 31, 2006 |
| % of fund's
net assets | % of fund's net assets
6 months ago |
Google, Inc. Class A (sub. vtg.) | 6.7 | 4.9 |
Apple Computer, Inc. | 4.7 | 2.8 |
Yahoo!, Inc. | 3.2 | 1.9 |
Amgen, Inc. | 3.1 | 3.2 |
Microsoft Corp. | 2.8 | 5.8 |
eBay, Inc. | 2.8 | 2.1 |
Intel Corp. | 2.7 | 2.0 |
Research In Motion Ltd. | 2.5 | 1.8 |
QUALCOMM, Inc. | 2.4 | 2.5 |
Network Appliance, Inc. | 2.0 | 1.0 |
| 32.9 | |
Top Five Market Sectors as of July 31, 2006 |
| % of fund's
net assets | % of fund's net assets
6 months ago |
Information Technology | 62.8 | 53.0 |
Health Care | 16.0 | 18.8 |
Consumer Discretionary | 7.9 | 12.6 |
Financials | 3.9 | 5.4 |
Industrials | 2.9 | 4.2 |
Asset Allocation (% of fund's net assets) |
As of July 31, 2006 * | As of January 31, 2006 ** |
| Stocks 98.5% | | | Stocks 99.4% | |
| Short-Term
Investments and
Net Other Assets 1.5% | | | Short-Term
Investments and
Net Other Assets 0.6% | |
* Foreign investments | 11.3% | | ** Foreign investments | 11.8% | |

Annual Report
Investments July 31, 2006
Showing Percentage of Net Assets
Common Stocks - 98.5% |
| Shares | | Value (Note 1) (000s) |
CONSUMER DISCRETIONARY - 7.9% |
Diversified Consumer Services - 0.2% |
DeVry, Inc. (a) | 821,361 | | $ 17,331 |
Hotels, Restaurants & Leisure - 2.8% |
BJ's Restaurants, Inc. (a) | 525,300 | | 10,049 |
International Game Technology | 91,000 | | 3,518 |
Morgans Hotel Group Co. | 1,203,100 | | 16,194 |
Penn National Gaming, Inc. (a) | 1,130,333 | | 37,380 |
Red Robin Gourmet Burgers, Inc. (a)(e) | 1,379,450 | | 53,592 |
Starbucks Corp. (a) | 1,279,400 | | 43,832 |
Texas Roadhouse, Inc. Class A (a) | 1,020,310 | | 11,040 |
The Cheesecake Factory, Inc. (a) | 1,236,400 | | 28,252 |
| | 203,857 |
Household Durables - 0.0% |
Comstock Homebuilding Companies, Inc. Class A (a)(d) | 255,000 | | 1,446 |
Internet & Catalog Retail - 0.3% |
Coldwater Creek, Inc. (a) | 1,021,650 | | 20,361 |
Media - 0.5% |
Comcast Corp. Class A (a) | 251,600 | | 8,650 |
RCN Corp. (a) | 200,000 | | 4,800 |
TiVo, Inc. (a)(d) | 3,354,075 | | 22,573 |
| | 36,023 |
Multiline Retail - 0.3% |
Sears Holdings Corp. (a) | 146,500 | | 20,107 |
Specialty Retail - 3.4% |
Bed Bath & Beyond, Inc. (a) | 307,400 | | 10,292 |
Best Buy Co., Inc. | 1,527,450 | | 69,255 |
Circuit City Stores, Inc. | 1,375,500 | | 33,700 |
Gamestop Corp.: | | | |
Class A (a) | 189,900 | | 7,902 |
Class B (a) | 1,004,200 | | 37,758 |
OfficeMax, Inc. | 644,800 | | 26,508 |
Provogue (India) Ltd. | 400,000 | | 1,627 |
Staples, Inc. | 1,219,400 | | 26,363 |
The Children's Place Retail Stores, Inc. (a) | 300,000 | | 16,746 |
Urban Outfitters, Inc. (a) | 1,395,500 | | 20,360 |
| | 250,511 |
Common Stocks - continued |
| Shares | | Value (Note 1) (000s) |
CONSUMER DISCRETIONARY - continued |
Textiles, Apparel & Luxury Goods - 0.4% |
Deckers Outdoor Corp. (a)(e) | 675,500 | | $ 28,803 |
Volcom, Inc. (a) | 258,100 | | 5,196 |
| | 33,999 |
TOTAL CONSUMER DISCRETIONARY | | 583,635 |
CONSUMER STAPLES - 0.7% |
Food & Staples Retailing - 0.5% |
Costco Wholesale Corp. | 755,800 | | 39,876 |
Food Products - 0.2% |
Gold Kist, Inc. Delaware (a) | 344,700 | | 4,822 |
Sanderson Farms, Inc. | 254,000 | | 6,581 |
| | 11,403 |
TOTAL CONSUMER STAPLES | | 51,279 |
ENERGY - 1.8% |
Energy Equipment & Services - 0.7% |
Halliburton Co. | 303,000 | | 10,108 |
Hydril Co. (a) | 115,700 | | 8,015 |
Noble Corp. | 304,200 | | 21,826 |
Schlumberger Ltd. (NY Shares) | 196,200 | | 13,116 |
| | 53,065 |
Oil, Gas & Consumable Fuels - 1.1% |
Valero Energy Corp. | 1,162,600 | | 78,394 |
TOTAL ENERGY | | 131,459 |
FINANCIALS - 3.9% |
Capital Markets - 2.1% |
Calamos Asset Management, Inc. Class A | 651,600 | | 17,600 |
Charles Schwab Corp. | 3,421,500 | | 54,333 |
E*TRADE Financial Corp. (a) | 960,800 | | 22,396 |
KKR Private Equity Investors, L.P. Restricted Depositary Units (g) | 792,900 | | 18,633 |
T. Rowe Price Group, Inc. | 340,000 | | 14,045 |
TD Ameritrade Holding Corp. | 1,670,010 | | 27,355 |
| | 154,362 |
Commercial Banks - 0.6% |
East West Bancorp, Inc. | 212,350 | | 8,568 |
Common Stocks - continued |
| Shares | | Value (Note 1) (000s) |
FINANCIALS - continued |
Commercial Banks - continued |
Fifth Third Bancorp | 180,200 | | $ 6,873 |
SVB Financial Group (a) | 446,800 | | 20,026 |
UCBH Holdings, Inc. | 706,800 | | 11,789 |
| | 47,256 |
Diversified Financial Services - 0.7% |
IntercontinentalExchange, Inc. | 61,300 | | 3,653 |
The NASDAQ Stock Market, Inc. (a) | 1,604,600 | | 44,175 |
| | 47,828 |
Insurance - 0.1% |
Navigators Group, Inc. (a) | 200,000 | | 8,502 |
Thrifts & Mortgage Finance - 0.4% |
Hudson City Bancorp, Inc. | 2,147,200 | | 27,849 |
TOTAL FINANCIALS | | 285,797 |
HEALTH CARE - 16.0% |
Biotechnology - 11.0% |
Alkermes, Inc. (a) | 1,204,300 | | 20,666 |
Amgen, Inc. (a) | 3,228,900 | | 225,183 |
Amylin Pharmaceuticals, Inc. (a) | 661,300 | | 32,271 |
Biogen Idec, Inc. (a) | 2,543,300 | | 107,124 |
BioMarin Pharmaceutical, Inc. (a) | 1,377,600 | | 20,127 |
Celgene Corp. (a) | 2,647,692 | | 126,798 |
Cephalon, Inc. (a) | 1,196,200 | | 78,638 |
Gilead Sciences, Inc. (a) | 1,557,500 | | 95,755 |
Myogen, Inc. (a) | 130,300 | | 4,021 |
Myriad Genetics, Inc. (a) | 478,000 | | 11,768 |
PDL BioPharma, Inc. (a) | 1,454,700 | | 26,199 |
Regeneron Pharmaceuticals, Inc. (a) | 1,152,900 | | 15,749 |
Solexa, Inc. (a) | 2,458,520 | | 21,782 |
Solexa, Inc.: | | | |
warrants 11/22/10 (a)(g) | 354,776 | | 1,393 |
warrants 1/19/11 (a)(g) | 452,917 | | 1,805 |
Vertex Pharmaceuticals, Inc. (a) | 588,200 | | 19,716 |
| | 808,995 |
Health Care Equipment & Supplies - 1.5% |
Aspect Medical Systems, Inc. (a) | 93,000 | | 1,362 |
BioLase Technology, Inc. (d) | 849,976 | | 6,978 |
Common Stocks - continued |
| Shares | | Value (Note 1) (000s) |
HEALTH CARE - continued |
Health Care Equipment & Supplies - continued |
Cooper Companies, Inc. | 645,200 | | $ 28,518 |
Gen-Probe, Inc. (a) | 285,800 | | 14,847 |
NUCRYST Pharmaceuticals Corp. | 648,200 | | 9,681 |
Respironics, Inc. (a) | 1,290,200 | | 45,905 |
SonoSite, Inc. (a) | 160,966 | | 5,196 |
| | 112,487 |
Health Care Providers & Services - 1.6% |
Bumrungrad Hospital PCL (For. Reg.) | 3,597,300 | | 3,373 |
Express Scripts, Inc. (a) | 240,700 | | 18,541 |
Humana, Inc. (a) | 645,200 | | 36,086 |
UnitedHealth Group, Inc. | 1,105,137 | | 52,859 |
Visicu, Inc. | 500,000 | | 6,510 |
| | 117,369 |
Health Care Technology - 0.7% |
Cerner Corp. (a) | 520,400 | | 21,066 |
Emdeon Corp. (a) | 2,659,750 | | 31,997 |
| | 53,063 |
Life Sciences Tools & Services - 0.2% |
Dionex Corp. (a) | 254,275 | | 14,074 |
Pharmaceuticals - 1.0% |
AVANIR Pharmaceuticals Class A (a)(d) | 650,500 | | 4,365 |
Elan Corp. PLC sponsored ADR (a) | 502,400 | | 7,707 |
Sepracor, Inc. (a) | 666,900 | | 32,945 |
Teva Pharmaceutical Industries Ltd. sponsored ADR | 778,300 | | 25,746 |
| | 70,763 |
TOTAL HEALTH CARE | | 1,176,751 |
INDUSTRIALS - 2.9% |
Air Freight & Logistics - 0.1% |
Forward Air Corp. | 304,200 | | 9,762 |
Airlines - 1.0% |
JetBlue Airways Corp. (a) | 4,137,375 | | 44,229 |
UAL Corp. (a) | 1,111,100 | | 29,044 |
| | 73,273 |
Common Stocks - continued |
| Shares | | Value (Note 1) (000s) |
INDUSTRIALS - continued |
Commercial Services & Supplies - 0.4% |
Monster Worldwide, Inc. (a) | 511,955 | | $ 20,478 |
Services Acquisition Corp. International (a)(d) | 643,400 | | 6,177 |
| | 26,655 |
Construction & Engineering - 0.0% |
Jaiprakash Associates Ltd. | 250,000 | | 1,980 |
Electrical Equipment - 0.4% |
Evergreen Solar, Inc. (a) | 823,600 | | 7,767 |
Q-Cells AG | 5,500 | | 394 |
Suzlon Energy Ltd. | 1,000,000 | | 23,302 |
| | 31,463 |
Machinery - 0.3% |
Joy Global, Inc. | 550,600 | | 20,659 |
Road & Rail - 0.5% |
Landstar System, Inc. | 776,722 | | 33,158 |
Trading Companies & Distributors - 0.2% |
UAP Holding Corp. | 700,000 | | 13,790 |
TOTAL INDUSTRIALS | | 210,740 |
INFORMATION TECHNOLOGY - 62.8% |
Communications Equipment - 8.4% |
Cisco Systems, Inc. (a) | 6,765,300 | | 120,761 |
Comverse Technology, Inc. (a) | 1,469,000 | | 28,469 |
Corning, Inc. | 982,060 | | 18,728 |
Harris Corp. | 200,000 | | 9,110 |
Juniper Networks, Inc. (a) | 4,133,700 | | 55,598 |
Motorola, Inc. | 342,900 | | 7,804 |
Nortel Networks Corp. | 9,226,400 | | 18,084 |
QUALCOMM, Inc. | 5,018,800 | | 176,963 |
Research In Motion Ltd. (a) | 2,807,045 | | 184,226 |
Sandvine Corp. (f) | 1,259,700 | | 2,953 |
| | 622,696 |
Computers & Peripherals - 10.0% |
Apple Computer, Inc. (a) | 5,064,500 | | 344,183 |
Dell, Inc. (a) | 380,800 | | 8,256 |
EMC Corp. (a) | 6,158,800 | | 62,512 |
Emulex Corp. (a) | 675,700 | | 10,061 |
Hewlett-Packard Co. | 2,092,000 | | 66,756 |
Network Appliance, Inc. (a) | 5,057,871 | | 150,168 |
Common Stocks - continued |
| Shares | | Value (Note 1) (000s) |
INFORMATION TECHNOLOGY - continued |
Computers & Peripherals - continued |
Rackable Systems, Inc. (a) | 1,187,500 | | $ 25,318 |
SanDisk Corp. (a) | 200,000 | | 9,332 |
Seagate Technology | 332,600 | | 7,716 |
Sun Microsystems, Inc. (a) | 9,071,600 | | 39,461 |
Synaptics, Inc. (a) | 823,002 | | 17,300 |
| | 741,063 |
Electronic Equipment & Instruments - 1.2% |
Hon Hai Precision Industry Co. Ltd. (Foxconn) | 5,517,042 | | 32,685 |
Jabil Circuit, Inc. | 625,000 | | 14,438 |
LG.Philips LCD Co. Ltd. sponsored ADR (a)(d) | 688,900 | | 12,256 |
M-Flex Electronix, Inc. (a)(d) | 466,154 | | 11,589 |
Solectron Corp. (a) | 2,441,100 | | 7,372 |
Sunpower Corp. Class A | 207,200 | | 6,616 |
Wolfson Microelectronics PLC (a) | 858,200 | | 7,246 |
| | 92,202 |
Internet Software & Services - 15.4% |
Akamai Technologies, Inc. (a) | 1,007,075 | | 39,910 |
CyberSource Corp. (a) | 1,448,088 | | 14,539 |
eBay, Inc. (a) | 8,692,100 | | 209,219 |
Equinix, Inc. (a) | 606,500 | | 31,768 |
Google, Inc. Class A (sub. vtg.) (a) | 1,275,100 | | 492,957 |
LivePerson, Inc. (a) | 1,185,538 | | 4,861 |
Spark Networks PLC unit (a) | 400,000 | | 2,274 |
Supportsoft, Inc. (a) | 1,645,119 | | 5,709 |
VeriSign, Inc. (a) | 5,135,220 | | 92,074 |
Yahoo!, Inc. (a) | 8,788,516 | | 238,520 |
| | 1,131,831 |
IT Services - 2.4% |
Cognizant Technology Solutions Corp. Class A (a) | 965,875 | | 63,255 |
Infosys Technologies Ltd. sponsored ADR (d) | 1,312,200 | | 53,918 |
NCI, Inc. Class A | 330,556 | | 4,482 |
Paychex, Inc. | 544,200 | | 18,601 |
Sapient Corp. (a) | 2,982,000 | | 14,314 |
Satyam Computer Services Ltd. sponsored ADR | 544,400 | | 19,190 |
| | 173,760 |
Semiconductors & Semiconductor Equipment - 13.0% |
Advanced Analogic Technologies, Inc. (d) | 1,950,124 | | 18,351 |
Applied Materials, Inc. | 2,268,100 | | 35,700 |
Broadcom Corp. Class A (a) | 6,067,609 | | 145,562 |
Common Stocks - continued |
| Shares | | Value (Note 1) (000s) |
INFORMATION TECHNOLOGY - continued |
Semiconductors & Semiconductor Equipment - continued |
Brooks Automation, Inc. (a) | 70,000 | | $ 790 |
Cree, Inc. (a) | 394,900 | | 7,791 |
Himax Technologies, Inc. sponsored ADR | 1,433,700 | | 9,276 |
Infineon Technologies AG sponsored ADR (a) | 2,380,700 | | 25,616 |
Intel Corp. | 11,213,800 | | 201,848 |
Intersil Corp. Class A | 2,231,533 | | 52,463 |
KLA-Tencor Corp. | 481,600 | | 20,319 |
Linear Technology Corp. | 569,400 | | 18,420 |
LSI Logic Corp. (a) | 1,332,600 | | 10,927 |
Marvell Technology Group Ltd. (a) | 6,711,900 | | 124,506 |
Maxim Integrated Products, Inc. | 3,982,300 | | 117,000 |
MEMC Electronic Materials, Inc. (a) | 1,014,300 | | 30,855 |
O2Micro International Ltd. sponsored ADR (a) | 407,400 | | 2,440 |
Omnivision Technologies, Inc. (a)(d) | 737,000 | | 14,003 |
Powerchip Semiconductor Corp. | 11,878,000 | | 7,799 |
ProMOS Technologies, Inc. | 22,781,000 | | 8,661 |
Rambus, Inc. (a) | 744,400 | | 13,124 |
Samsung Electronics Co. Ltd. | 74,550 | | 47,455 |
Trident Microsystems, Inc. (a) | 1,677,000 | | 28,878 |
Vimicro International Corp. sponsored ADR | 1,011,300 | | 10,871 |
Virage Logic Corp. (a) | 400,000 | | 3,408 |
| | 956,063 |
Software - 12.4% |
Activision, Inc. (a) | 2,860,281 | | 34,180 |
Adobe Systems, Inc. (a) | 1,314,356 | | 37,472 |
Autodesk, Inc. (a) | 773,700 | | 26,391 |
Electronic Arts, Inc. (a) | 2,766,600 | | 130,335 |
Mercury Interactive Corp. (a) | 2,373,500 | | 119,150 |
Microsoft Corp. | 8,730,100 | | 209,784 |
Nintendo Co. Ltd. | 658,000 | | 122,876 |
Oracle Corp. (a) | 3,871,800 | | 57,961 |
Quality Systems, Inc. | 428,600 | | 14,195 |
Quest Software, Inc. (a) | 3,177,621 | | 43,438 |
Red Hat, Inc. (a) | 3,478,300 | | 82,366 |
Salesforce.com, Inc. (a) | 298,200 | | 7,664 |
Square Enix Co. Ltd. (d) | 169,500 | | 3,511 |
Common Stocks - continued |
| Shares | | Value (Note 1) (000s) |
INFORMATION TECHNOLOGY - continued |
Software - continued |
Take-Two Interactive Software, Inc. (a)(d) | 1,343,800 | | $ 14,392 |
Ubisoft Entertainment SA (a)(d) | 200,000 | | 9,708 |
| | 913,423 |
TOTAL INFORMATION TECHNOLOGY | | 4,631,038 |
MATERIALS - 1.5% |
Chemicals - 0.7% |
Ashland, Inc. | 465,800 | | 30,980 |
Monsanto Co. | 472,000 | | 20,291 |
| | 51,271 |
Metals & Mining - 0.8% |
Aleris International, Inc. (a) | 385,300 | | 15,774 |
Century Aluminum Co. (a) | 315,300 | | 9,733 |
Steel Dynamics, Inc. (d) | 352,300 | | 20,440 |
Titanium Metals Corp. | 483,000 | | 13,930 |
| | 59,877 |
TOTAL MATERIALS | | 111,148 |
TELECOMMUNICATION SERVICES - 1.0% |
Diversified Telecommunication Services - 0.1% |
Telenor ASA sponsored ADR | 304,900 | | 11,708 |
Wireless Telecommunication Services - 0.9% |
Bharti Airtel Ltd. (a) | 961,400 | | 8,791 |
NII Holdings, Inc. (a) | 1,044,800 | | 55,145 |
| | 63,936 |
TOTAL TELECOMMUNICATION SERVICES | | 75,644 |
TOTAL COMMON STOCKS (Cost $7,362,224) | 7,257,491 |
Money Market Funds - 2.7% |
| Shares | | Value (Note 1)
(000s) |
Fidelity Cash Central Fund, 5.3% (b) | 147,910,943 | | $ 147,911 |
Fidelity Securities Lending Cash Central Fund, 5.32% (b)(c) | 49,094,448 | | 49,094 |
TOTAL MONEY MARKET FUNDS (Cost $197,005) | 197,005 |
TOTAL INVESTMENT PORTFOLIO - 101.2% (Cost $7,559,229) | | 7,454,496 |
NET OTHER ASSETS - (1.2)% | | (84,986) |
NET ASSETS - 100% | $ 7,369,510 |
Legend |
(a) Non-income producing |
(b) Affiliated fund that is available only to investment companies and other accounts managed by Fidelity Investments. The rate quoted is the annualized seven-day yield of the fund at period end. A complete unaudited listing of the fund's holdings as of its most recent quarter end is available upon request. |
(c) Investment made with cash collateral received from securities on loan. |
(d) Security or a portion of the security is on loan at period end. |
(e) Affiliated company |
(f) Security exempt from registration under Rule 144A of the Securities Act of 1933. These securities may be resold in transactions exempt from registration, normally to qualified institutional buyers. At the period end, the value of these securities amounted to $2,953,000 or 0.0% of net assets. |
(g) Restricted securities - Investment in securities not registered under the Securities Act of 1933 (excluding 144A issues). At the end of the period, the value of restricted securities (excluding 144A issues) amounted to $21,831,000 or 0.3% of net assets. |
Additional information on each holding is as follows: |
Security | Acquisition Date | Acquisition Cost (000s) |
KKR Private Equity Investors, L.P. Restricted Depositary Units | 5/3/06 | $ 19,823 |
Solexa, Inc. warrants 11/22/10 | 11/21/05 | $ 0 |
Solexa, Inc. warrants 1/19/11 | 1/18/06 | $ 0 |
Affiliated Central Funds |
Information regarding fiscal year to date income earned by the fund from the affiliated Central funds is as follows: |
Fund | Income earned
(Amounts in thousands) |
Fidelity Cash Central Fund | $ 2,468 |
Fidelity Securities Lending Cash Central Fund | 1,881 |
Total | $ 4,349 |
Other Affiliated Issuers |
An affiliated company is a company in which the fund has ownership of at least 5% of the voting securities. Fiscal year to date transactions with companies which are or were affiliates are as follows: |
Affiliates
(Amounts in thousands) | Value,
beginning of
period | Purchases | Sales
Proceeds | Dividend
Income | Value,
end of
period |
Aladdin Knowledge Systems Ltd. | $ - | $ 14,832 | $ 13,841 | $ - | $ - |
Deckers Outdoor Corp. | - | 18,768 | - | - | 28,803 |
M-Systems Flash Disk Pioneers Ltd. | 45,837 | 20,567 | 67,444 | - | - |
PeopleSupport, Inc. | 13,740 | - | 13,217 | - | - |
PortalPlayer, Inc. | 33,019 | 6,498 | 46,059 | - | - |
Red Robin Gourmet Burgers, Inc. | 21,930 | 44,945 | 1,302 | - | 53,592 |
Total | $ 114,526 | $ 105,610 | $ 141,863 | $ - | $ 82,395 |
Other Information |
Distribution of investments by country of issue, as a percentage of total net assets, is as follows: |
United States of America | 88.7% |
Canada | 2.8% |
Japan | 1.7% |
Bermuda | 1.7% |
India | 1.4% |
Others (individually less than 1%) | 3.7% |
| 100.0% |
Income Tax Information |
At July 31, 2006, the fund had a capital loss carryforward of approximately $3,832,690,000 of which $2,582,795,000 and $1,249,895,000 will expire on July 31, 2010 and 2011, respectively. |
See accompanying notes which are an integral part of the financial statements.
Annual Report
Financial Statements
Statement of Assets and Liabilities
Amounts in thousands (except per-share amount) | July 31, 2006 |
| | |
Assets | | |
Investment in securities, at value (including securities loaned of $47,563) - See accompanying schedule: Unaffiliated issuers (cost $7,282,911) | $ 7,175,096 | |
Affiliated Central Funds (cost $197,005) | 197,005 | |
Other affiliated issuers (cost $79,313) | 82,395 | |
Total Investments (cost $7,559,229) | | $ 7,454,496 |
Receivable for investments sold | | 115,329 |
Receivable for fund shares sold | | 10,633 |
Dividends receivable | | 391 |
Interest receivable | | 389 |
Prepaid expenses | | 12 |
Other receivables | | 443 |
Total assets | | 7,581,693 |
| | |
Liabilities | | |
Payable for investments purchased | $ 150,132 | |
Payable for fund shares redeemed | 6,884 | |
Accrued management fee | 3,878 | |
Other affiliated payables | 1,737 | |
Other payables and accrued expenses | 458 | |
Collateral on securities loaned, at value | 49,094 | |
Total liabilities | | 212,183 |
| | |
Net Assets | | $ 7,369,510 |
Net Assets consist of: | | |
Paid in capital | | $ 11,343,824 |
Accumulated net investment loss | | (165) |
Accumulated undistributed net realized gain (loss) on investments and foreign currency transactions | | (3,869,415) |
Net unrealized appreciation (depreciation) on investments and assets and liabilities in foreign currencies | | (104,734) |
Net Assets, for 212,376 shares outstanding | | $ 7,369,510 |
Net Asset Value, offering price and redemption price per share ($7,369,510 ÷ 212,376 shares) | | $ 34.70 |
See accompanying notes which are an integral part of the financial statements.
Annual Report
Financial Statements - continued
Statement of Operations
Amounts in thousands | Year ended July 31, 2006 |
| | |
Investment Income | | |
Dividends | | $ 28,006 |
Special dividends | | 6,954 |
Interest | | 93 |
Income from affiliated Central Funds | | 4,349 |
Total income | | 39,402 |
| | |
Expenses | | |
Management fee
Basic fee | $ 49,707 | |
Performance adjustment | (5,702) | |
Transfer agent fees | 18,388 | |
Accounting and security lending fees | 1,185 | |
Independent trustees' compensation | 32 | |
Appreciation in deferred trustee compensation account | 9 | |
Custodian fees and expenses | 413 | |
Registration fees | 40 | |
Audit | 89 | |
Legal | 107 | |
Interest | 2 | |
Miscellaneous | 377 | |
Total expenses before reductions | 64,647 | |
Expense reductions | (4,464) | 60,183 |
Net investment income (loss) | | (20,781) |
Realized and Unrealized Gain (Loss) Net realized gain (loss) on: | | |
Investment securities: | | |
Unaffiliated issuers (net of foreign taxes of $5) | 591,110 | |
Other affiliated issuers | 12,147 | |
Foreign currency transactions | (205) | |
Total net realized gain (loss) | | 603,052 |
Change in net unrealized appreciation (depreciation) on: Investment securities (net of increase in deferred foreign taxes of $2) | (840,834) | |
Assets and liabilities in foreign currencies | (17) | |
Total change in net unrealized appreciation (depreciation) | | (840,851) |
Net gain (loss) | | (237,799) |
Net increase (decrease) in net assets resulting from operations | | $ (258,580) |
See accompanying notes which are an integral part of the financial statements.
Annual Report
Statement of Changes in Net Assets
Amounts in thousands | Year ended
July 31,
2006 | Year ended
July 31,
2005 |
Increase (Decrease) in Net Assets | | |
Operations | | |
Net investment income (loss) | $ (20,781) | $ 85,537 |
Net realized gain (loss) | 603,052 | 965,937 |
Change in net unrealized appreciation (depreciation) | (840,851) | 323,774 |
Net increase (decrease) in net assets resulting
from operations | (258,580) | 1,375,248 |
Distributions to shareholders from net investment income | - | (95,497) |
Share transactions
Proceeds from sales of shares | 1,366,517 | 1,495,132 |
Reinvestment of distributions | - | 94,058 |
Cost of shares redeemed | (1,801,274) | (2,128,096) |
Net increase (decrease) in net assets resulting from share transactions | (434,757) | (538,906) |
Total increase (decrease) in net assets | (693,337) | 740,845 |
| | |
Net Assets | | |
Beginning of period | 8,062,847 | 7,322,002 |
End of period (including accumulated net investment loss of $165 and accumulated net investment loss of $209, respectively) | $ 7,369,510 | $ 8,062,847 |
Other Information Shares | | |
Sold | 36,636 | 45,709 |
Issued in reinvestment of distributions | - | 2,762 |
Redeemed | (48,306) | (65,059) |
Net increase (decrease) | (11,670) | (16,588) |
See accompanying notes which are an integral part of the financial statements.
Annual Report
Financial Highlights
Years ended July 31, | 2006 | 2005 | 2004 | 2003 | 2002 |
Selected Per-Share Data | | | | | |
Net asset value, beginning of period | $ 35.99 | $ 30.43 | $ 28.33 | $ 23.46 | $ 32.96 |
Income from Investment Operations | | | | | |
Net investment income (loss) B | (.10) C | .37 D | (.17) | (.17) | (.24) |
Net realized and unrealized gain (loss) | (1.19) | 5.60 | 2.27 | 5.04 | (9.26) |
Total from investment operations | (1.29) | 5.97 | 2.10 | 4.87 | (9.50) |
Distributions from net investment income | - | (.41) | - | - | - |
Net asset value, end of period | $ 34.70 | $ 35.99 | $ 30.43 | $ 28.33 | $ 23.46 |
Total Return A | (3.58)% | 19.70% | 7.41% | 20.76% | (28.82)% |
Ratios to Average Net Assets E | | | | | |
Expenses before reductions | .80% | .81% | .91% | 1.18% | 1.14% |
Expenses net of fee waivers, if any | .80% | .81% | .91% | 1.18% | 1.14% |
Expenses net of all reductions | .75% | .75% | .89% | 1.12% | 1.09% |
Net investment income (loss) | (.26)% C | 1.13% D | (.53)% | (.71)% | (.81)% |
Supplemental Data | | | | | |
Net assets, end of period (in millions) | $ 7,370 | $ 8,063 | $ 7,322 | $ 7,041 | $ 5,911 |
Portfolio turnover rate | 149% | 117% | 61% | 116% | 120% |
A Total returns would have been lower had certain expenses not been reduced during the periods shown.
B Calculated based on average shares outstanding during the period.
C Investment income per share reflects a special dividend which amounted to $.03 per share. Excluding the special dividend, the ratio of net investment income (loss) to average net assets would have been (.34)%.
D Investment income per share reflects a special dividend which amounted to $.46 per share. Excluding the special dividend, the ratio of net investment income (loss) to average net assets would have been (.27)%.
E Expense ratios reflect operating expenses of the Fund. Expenses before reductions do not reflect amounts reimbursed by the investment adviser or reductions from brokerage service arrangements or other expense offset arrangements and do not represent the amount paid by the Fund during periods when reimbursements or reductions occur. Expenses net of fee waivers reflect expenses after reimbursement by the investment adviser but prior to reductions from brokerage service arrangements or other expense offset arrangements. Expenses net of all reductions represent the net expenses paid by the Fund.
See accompanying notes which are an integral part of the financial statements.
Annual Report
Notes to Financial Statements
For the period ended July 31, 2006
(Amounts in thousands except ratios)
1. Significant Accounting Policies.
Fidelity OTC Portfolio (the Fund) is a non-diversified fund of Fidelity Securities Fund (the trust) and is authorized to issue an unlimited number of shares. The trust is registered under the Investment Company Act of 1940, as amended (the 1940 Act), as an open-end management investment company organized as a Massachusetts business trust. The Fund may invest in affiliated money market central funds (Money Market Central Funds), which are open-end investment companies available to investment companies and other accounts managed by Fidelity Management & Research Company (FMR) and its affiliates. The financial statements have been prepared in conformity with accounting principles generally accepted in the United States of America, which require management to make certain estimates and assumptions at the date of the financial statements. The following summarizes the significant accounting policies of the Fund:
Security Valuation. Investments are valued and net asset value (NAV) per share is calculated (NAV calculation) as of the close of business of the New York Stock Exchange (NYSE), normally 4:00 p.m. Eastern time. Wherever possible, the Fund uses independent pricing services approved by the Board of Trustees to value its investments.
Equity securities, including restricted securities, for which market quotations are readily available, are valued at the last reported sale price or official closing price as reported by an independent pricing service on the primary market or exchange on which they are traded. In the event there were no sales during the day or closing prices are not available, securities are valued at the last quoted bid price. Investments in open-end mutual funds are valued at their closing net asset value each business day. Short-term securities with remaining maturities of sixty days or less for which quotations are not readily available are valued at amortized cost, which approximates value.
When current market prices or quotations are not readily available or do not accurately reflect fair value, valuations may be determined in accordance with procedures adopted by the Board of Trustees. For example, when developments occur between the close of a market and the close of the NYSE that may materially affect the value of some or all of the securities, or when trading in a security is halted, those securities may be fair valued. Factors used in the determination of fair value may include monitoring news to identify significant market or security specific events such as changes in the value of U.S. securities markets, reviewing developments in foreign markets and evaluating the performance of ADRs, futures contracts and exchange-traded funds. Because the Fund's utilization of fair value pricing depends on market activity, the frequency with which fair value pricing is used can not be predicted and may be utilized to a significant extent. The value of securities used for NAV calculation under fair value pricing may differ from published prices for the same securities.
Annual Report
Notes to Financial Statements - continued
(Amounts in thousands except ratios)
1. Significant Accounting Policies - continued
Foreign Currency. The Fund uses foreign currency contracts to facilitate transactions in foreign-denominated securities. Losses from these transactions may arise from changes in the value of the foreign currency or if the counterparties do not perform under the contracts' terms.
Foreign-denominated assets, including investment securities, and liabilities are translated into U.S. dollars at the exchange rate at period end. Purchases and sales of investment securities, income and dividends received and expenses denominated in foreign currencies are translated into U.S. dollars at the exchange rate in effect on the transaction date.
The effects of exchange rate fluctuations on investments are included with the net realized and unrealized gain (loss) on investment securities. Other foreign currency transactions resulting in realized and unrealized gain (loss) are disclosed separately.
Investment Transactions and Income. Security transactions are accounted for as of trade date. Gains and losses on securities sold are determined on the basis of identified cost and may include proceeds received from litigation. Dividend income is recorded on the ex-dividend date, except for certain dividends from foreign securities where the ex-dividend date may have passed, which are recorded as soon as the Fund is informed of the ex-dividend date. Non-cash dividends included in dividend income, if any, are recorded at the fair market value of the securities received. Distributions received on securities that represent a return of capital or capital gain are recorded as a reduction of cost of investments and/or as a realized gain. The Fund estimates the components of distributions received that may be considered return of capital distributions or capital gain distributions. Large, non-recurring dividends recognized by the Fund are presented separately on the Statement of Operations as "Special Dividends" and the impact of these dividends is presented in the Financial Highlights. Interest income is accrued as earned. Interest income includes coupon interest and amortization of premium and accretion of discount on debt securities. Investment income is recorded net of foreign taxes withheld where recovery of such taxes is uncertain.
Expenses. Most expenses of the trust can be directly attributed to a fund. Expenses which cannot be directly attributed are apportioned among each Fund in the trust. Expense estimates are accrued in the period to which they relate and adjustments are made when actual amounts are known.
Deferred Trustee Compensation. Under a Deferred Compensation Plan (the Plan), Independent Trustees must defer receipt of a portion of, and may elect to defer receipt of an additional portion of, their annual compensation. Deferred amounts are invested in a cross- section of Fidelity funds, are marked-to-market and remain in the Fund until distributed in accordance with the Plan. The investment of deferred amounts and the offsetting payable to the Trustees are included in the accompanying Statement of Assets and Liabilities.
Annual Report
1. Significant Accounting Policies - continued
Income Tax Information and Distributions to Shareholders. Each year, the Fund intends to qualify as a regulated investment company by distributing all of its taxable income and realized gains under Subchapter M of the Internal Revenue Code. As a result, no provision for income taxes is required in the accompanying financial statements. Foreign taxes are provided for based on the Fund's understanding of the tax rules and rates that exist in the foreign markets in which it invests.
Distributions are recorded on the ex-dividend date. Income and capital gain distributions are determined in accordance with income tax regulations, which may differ from generally accepted accounting principles.
Capital accounts within the financial statements are adjusted for permanent book-tax differences. These adjustments have no impact on net assets or the results of operations. Temporary book-tax differences will reverse in a subsequent period.
Book-tax differences are primarily due to foreign currency transactions, deferred trustees compensation, net operating losses, capital loss carryforwards and losses deferred due to wash sales.
The tax-basis components of distributable earnings and the federal tax cost as of period end were as follows:
Unrealized appreciation | $ 816,625 | |
Unrealized depreciation | (958,085) | |
Net unrealized appreciation (depreciation) | (141,460) | |
Capital loss carryforward | (3,832,690) | |
| | |
Cost for federal income tax purposes | $ 7,595,956 | |
The tax character of distributions paid was as follows:
| July 31, 2006 | July 31, 2005 |
Ordinary Income | $ - | $ 95,497 |
New Accounting Pronouncement. In July 2006, Financial Accounting Standards Board Interpretation No. 48, Accounting for Uncertainty in Income Taxes - an interpretation of FASB Statement 109 (FIN 48) was issued and is effective for fiscal years beginning after December 15, 2006. FIN 48 sets forth a threshold for financial statement recognition, measurement and disclosure of a tax position taken or expected to be taken on a tax return. Management is currently evaluating the impact, if any, the adoption of FIN 48 will have on the Fund's net assets and results of operations.
Annual Report
Notes to Financial Statements - continued
(Amounts in thousands except ratios)
2. Operating Policies.
Repurchase Agreements. FMR has received an Exemptive Order from the Securities and Exchange Commission (the SEC) which permits the Fund and other affiliated entities of FMR to transfer uninvested cash balances into joint trading accounts which are then invested in repurchase agreements. The Fund may also invest directly with institutions in repurchase agreements. Repurchase agreements are collateralized by government or non-government securities. Upon settlement date, collateral is held in segregated accounts with custodian banks and may be obtained in the event of a default of the counterparty. The Fund monitors, on a daily basis, the value of the collateral to ensure it is at least equal to the principal amount of the repurchase agreement (including accrued interest). In the event of a default by the counterparty, realization of the collateral proceeds could be delayed, during which time the value of the collateral may decline.
Restricted Securities. The Fund may invest in securities that are subject to legal or contractual restrictions on resale. These securities generally may be resold in transactions exempt from registration or to the public if the securities are registered. Disposal of these securities may involve time-consuming negotiations and expense, and prompt sale at an acceptable price may be difficult. Information regarding restricted securities is included at the end of the Fund's Schedule of Investments.
3. Purchases and Sales of Investments.
Purchases and sales of securities, other than short-term securities, aggregated $11,924,269 and $12,371,872, respectively.
4. Fees and Other Transactions with Affiliates.
Management Fee. FMR and its affiliates provide the Fund with investment management related services for which the Fund pays a monthly management fee. The management fee is the sum of an individual fund fee rate that is based on an annual rate of .35% of the Fund's average net assets and a group fee rate that averaged ..27% during the period. The group fee rate is based upon the average net assets of all the mutual funds advised by FMR. The group fee rate decreases as assets under management increase and increases as assets under management decrease. In addition, the management fee is subject to a performance adjustment (up to a maximum of ± .20% of the Fund's average net assets over a 36 month performance period). The upward or downward adjustment to the management fee is based on the Fund's relative investment performance as compared to an appropriate benchmark index. For the period, the total annual management fee rate, including the performance adjustment, was .55% of the Fund's average net assets.
Annual Report
4. Fees and Other Transactions with Affiliates - continued
Transfer Agent Fees. Fidelity Service Company, Inc. (FSC), an affiliate of FMR, is the Fund's transfer, dividend disbursing and shareholder servicing agent. FSC receives account fees and asset-based fees that vary according to account size and type of account. FSC pays for typesetting, printing and mailing of shareholder reports, except proxy statements. For the period, the transfer agent fees were equivalent to an annual rate of .23% of average net assets.
Accounting and Security Lending Fees. FSC maintains the Fund's accounting records. The accounting fee is based on the level of average net assets for the month. Under a separate contract, FSC administers the security lending program. The security lending fee is based on the number and duration of lending transactions.
Affiliated Central Funds. The Fund may invest in Money Market Central Funds which seek preservation of capital and current income and are managed by Fidelity Investments Money Management, Inc. (FIMM), an affiliate of FMR.
The Money Market Central Funds do not pay a management fee.
Brokerage Commissions. The Fund placed a portion of its portfolio transactions with brokerage firms which are affiliates of the investment adviser. The commissions paid to these affiliated firms were $495 for the period.
Interfund Lending Program. Pursuant to an Exemptive Order issued by the SEC, the Fund, along with other registered investment companies having management contracts with FMR, may participate in an interfund lending program. This program provides an alternative credit facility allowing the Funds to borrow from, or lend money to, other participating affiliated funds. At period end, there were no interfund loans outstanding. The Fund's activity in this program during the period for which loans were outstanding was as follows:
Borrower or Lender | Average Daily Loan Balance | Weighted Average Interest Rate | Interest Expense |
Borrower | $ 8,278 | 4.61% | $ 2 |
5. Committed Line of Credit.
The Fund participates with other funds managed by FMR in a $4.2 billion credit facility (the "line of credit") to be utilized for temporary or emergency purposes to fund shareholder redemptions or for other short-term liquidity purposes. The Fund has agreed to pay commitment fees on its pro rata portion of the line of credit, which amounts to $23 and is reflected in Miscellaneous Expense on the Statement of Operations. During the period, there were no borrowings on this line of credit.
Annual Report
Notes to Financial Statements - continued
(Amounts in thousands except ratios)
6. Security Lending.
The Fund lends portfolio securities from time to time in order to earn additional income. On the settlement date of the loan, the Fund receives collateral (in the form of U.S. Treasury obligations, letters of credit and/or cash) against the loaned securities and maintains collateral in an amount not less than 100% of the market value of the loaned securities during the period of the loan. The market value of the loaned securities is determined at the close of business of the Fund and any additional required collateral is delivered to the Fund on the next business day. If the borrower defaults on its obligation to return the securities loaned because of insolvency or other reasons, a fund could experience delays and costs in recovering the securities loaned or in gaining access to the collateral. Any cash collateral received is invested in the Fidelity Securities Lending Cash Central Fund. The value of loaned securities and cash collateral at period end are disclosed on the Fund's Statement of Assets and Liabilities. Security lending income represents the income earned on investing cash collateral, less fees and expenses associated with the loan, plus any premium payments that may be received on the loan of certain types of securities. Security lending income is presented in the Statement of Operations as a component of income from affiliated central funds. Net income from lending portfolio securities during the period amounted to $1,881.
7. Expense Reductions.
Many of the brokers with whom FMR places trades on behalf of the Fund provided services to the Fund in addition to trade execution. These services included payments of certain expenses on behalf of the Fund totaling $4,030 for the period.In addition, through arrangements with the Fund's custodian and transfer agent, credits realized as a result of uninvested cash balances were used to reduce the Fund's expenses. During the period, these credits reduced the Fund's custody and transfer agent expenses by $5 and $429, respectively.
8. Other.
The Fund's organizational documents provide former and current trustees and officers with a limited indemnification against liabilities arising in connection with the performance of their duties to the Fund. In the normal course of business, the Fund may also enter into contracts that provide general indemnifications. The Fund's maximum exposure under these arrangements is unknown as this would be dependent on future claims that may be made against the Fund. The risk of material loss from such claims is considered remote.
Annual Report
Report of Independent Registered Public Accounting Firm
To the Trustees of Fidelity Securities Fund and Shareholders of Fidelity OTC Portfolio:
We have audited the accompanying statement of assets and liabilities of Fidelity OTC Portfolio (the Fund), a fund of Fidelity Securities Fund, including the schedule of investments as of July 31, 2006, and the related statement of operations for the year then ended, the statement of changes in net assets for each of the two years in the period then ended, and the financial highlights for each of the five years in the period then ended. These financial statements and financial highlights are the responsibility of the Fund's management. Our responsibility is to express an opinion on these financial statements and financial highlights based on our audits.
We conducted our audits in accordance with standards of the Public Company Accounting Oversight Board (United States). Those standards require that we plan and perform the audit to obtain reasonable assurance about whether the financial statements and financial highlights are free of material misstatement. The Fund is not required to have, nor were we engaged to perform, an audit of its internal control over financial reporting. Our audits included consideration of internal control over financial reporting as a basis for designing audit procedures that are appropriate in the circumstances, but not for the purpose of expressing an opinion on the effectiveness of the Fund's internal control over financial reporting. Accordingly, we express no such opinion. An audit also includes examining, on a test basis, evidence supporting the amounts and disclosures in the financial statements, assessing the accounting principles used and significant estimates made by management, as well as evaluating the overall financial statement presentation. Our procedures included confirmation of securities owned as of July 31, 2006, by correspondence with the custodians and brokers; where replies were not received from brokers, we performed other auditing procedures. We believe that our audits provide a reasonable basis for our opinion.
In our opinion, the financial statements and financial highlights referred to above present fairly, in all material respects, the financial position of Fidelity OTC Portfolio as of July 31, 2006, the results of its operations for the year then ended, the changes in its net assets for each of the two years in the period then ended, and its financial highlights for each of the five years in the period then ended, in conformity with accounting principles generally accepted in the United States of America.
/s/ Delolitte & Touche LLP
DELOITTE & TOUCHE LLP
Boston, Massachusetts
September 8, 2006
Annual Report
Trustees and Officers
The Trustees, Members of the Advisory Board, and executive officers of the trust, as applicable, are listed below. The Board of Trustees governs the fund and is responsible for protecting the interests of shareholders. The Trustees are experienced executives who meet periodically throughout the year to oversee the fund's activities, review contractual arrangements with companies that provide services to the fund, and review the fund's performance. Except for William O. McCoy and Albert R. Gamper, Jr., each of the Trustees oversees 345 funds advised by FMR or an affiliate. Mr. McCoy oversees 347 funds advised by FMR or an affiliate. Mr. Gamper oversees 292 funds advised by FMR or an affiliate.
The Trustees hold office without limit in time except that (a) any Trustee may resign; (b) any Trustee may be removed by written instrument, signed by at least two-thirds of the number of Trustees prior to such removal; (c) any Trustee who requests to be retired or who has become incapacitated by illness or injury may be retired by written instrument signed by a majority of the other Trustees; and (d) any Trustee may be removed at any special meeting of shareholders by a two-thirds vote of the outstanding voting securities of the trust. Each Trustee who is not an interested person (as defined in the 1940 Act) (Independent Trustee), shall retire not later than the last day of the calendar year in which his or her 72nd birthday occurs. The Independent Trustees may waive this mandatory retirement age policy with respect to individual Trustees. The executive officers and Advisory Board Members hold office without limit in time, except that any officer and Advisory Board Member may resign or may be removed by a vote of a majority of the Trustees at any regular meeting or any special meeting of the Trustees. Except as indicated, each individual has held the office shown or other offices in the same company for the past five years.
The fund's Statement of Additional Information (SAI) includes more information about the Trustees. To request a free copy, call Fidelity at 1-800-544-8544.
Interested Trustees*:
Correspondence intended for each Trustee who is an interested person may be sent to Fidelity Investments, 82 Devonshire Street, Boston, Massachusetts 02109.
Name, Age; Principal Occupation |
Edward C. Johnson 3d (76) |
| Year of Election or Appointment: 1984 Mr. Johnson is Chairman of the Board of Trustees. Mr. Johnson serves as President (2006-present), Chief Executive Officer, Chairman, and a Director of FMR Corp.; Chairman and a Director of FMR; Chairman and a Director of Fidelity Research & Analysis Company (FRAC); Chairman and a Director of Fidelity Investments Money Management, Inc.; and Chairman (2001-present) and a Director (1999-present) of FMR Co., Inc. In addition, Mr. Johnson serves as Chairman and Director of Fidelity International Limited (FIL). |
Stephen P. Jonas (53) |
| Year of Election or Appointment: 2005 Mr. Jonas is Senior Vice President of OTC (2005-present). He also serves as Senior Vice President of other Fidelity funds (2005-present). Mr. Jonas is Executive Director of FMR (2005-present) and FMR Co., Inc. (2005-present). He also serves as a Director of Fidelity Investments Money Management, Inc. (2005-present) and FMR Corp. (2003-present). Previously, Mr. Jonas served as President of Fidelity Enterprise Operations and Risk Services (2004-2005), Chief Administrative Officer (2002-2004), and Chief Financial Officer of FMR Corp. (1998-2002). In addition, he serves on the Boards of Boston Ballet (2003-present) and Simmons College (2003-present). |
Robert L. Reynolds (54) |
| Year of Election or Appointment: 2003 Mr. Reynolds is President and a Director of FMR (2005-present), Fidelity Investments Money Management, Inc. (2005-present), and FMR Co., Inc. (2005-present). Mr. Reynolds also serves as a Director (2003-present) and Chief Operating Officer (2000-present) of FMR Corp. and a Director of Strategic Advisers, Inc. (2005-present). He also serves on the Board at Fidelity Investments Canada, Ltd. (2000-present). Previously, Mr. Reynolds served as President of Fidelity Investments Institutional Retirement Group (1996-2000). |
* Trustees have been determined to be "Interested Trustees" by virtue of, among other things, their affiliation with the trust or various entities under common control with FMR.
Annual Report
Independent Trustees:
Correspondence intended for each Independent Trustee (that is, the Trustees other than the Interested Trustees) may be sent to Fidelity Investments, P.O. Box 55235, Boston, Massachusetts 02205-5235.
Name, Age; Principal Occupation |
Dennis J. Dirks (58) |
| Year of Election or Appointment: 2005 Prior to his retirement in May 2003, Mr. Dirks was Chief Operating Officer and a member of the Board of The Depository Trust & Clearing Corporation (DTCC) (1999-2003). He also served as President, Chief Operating Officer, and Board member of The Depository Trust Company (DTC) (1999-2003) and President and Board member of the National Securities Clearing Corporation (NSCC) (1999-2003). In addition, Mr. Dirks served as Chief Executive Officer and Board member of the Government Securities Clearing Corporation (2001-2003) and Chief Executive Officer and Board member of the Mortgage-Backed Securities Clearing Corporation (2001-2003). Mr. Dirks also serves as a Trustee and a member of the Finance Committee of Manhattan College (2005-present) and a Trustee and a member of the Finance Committee of AHRC of Nassau County (2006-present). |
Albert R. Gamper, Jr. (64) |
| Year of Election or Appointment: 2006 Mr. Gamper also serves as a Trustee (2006-present) or Member of the Advisory Board (2005-present) of other investment companies advised by FMR. Prior to his retirement in December 2004, Mr. Gamper served as Chairman of the Board of CIT Group Inc. (commercial finance). During his tenure with CIT Group Inc. Mr. Gamper served in numerous senior management positions, including Chairman (1987-1989; 1999-2001; 2002-2004), Chief Executive Officer (1987-2004), and President (1989-2002). He currently serves as a member of the Board of Directors of Public Service Enterprise Group (utilities, 2001-present), Chairman of the Board of Governors, Rutgers University (2004-present), and Chairman of the Board of Saint Barnabas Health Care System. |
Robert M. Gates (62) |
| Year of Election or Appointment: 1997 Dr. Gates is Chairman of the Independent Trustees (2006-present). Dr. Gates is President of Texas A&M University (2002-present). He was Director of the Central Intelligence Agency (CIA) from 1991 to 1993. From 1989 to 1991, Dr. Gates served as Assistant to the President of the United States and Deputy National Security Advisor. Dr. Gates is a Director of NACCO Industries, Inc. (mining and manufacturing), Parker Drilling Co., Inc. (drilling and rental tools for the energy industry, 2001-present), and Brinker International (restaurant management, 2003-present). Previously, Dr. Gates served as a Director of LucasVarity PLC (automotive components and diesel engines), a Director of TRW Inc. (automotive, space, defense, and information technology), and Dean of the George Bush School of Government and Public Service at Texas A&M University (1999-2001). |
George H. Heilmeier (70) |
| Year of Election or Appointment: 2004 Dr. Heilmeier is Chairman Emeritus of Telcordia Technologies (communication software and systems), where prior to his retirement, he served as company Chairman and Chief Executive Officer. He currently serves on the Boards of Directors of The Mitre Corporation (systems engineering and information technology support for the government), and HRL Laboratories (private research and development, 2004-present). He is Chairman of the General Motors Science & Technology Advisory Board and a Life Fellow of the Institute of Electrical and Electronics Engineers (IEEE). Dr. Heilmeier is a member of the Defense Science Board and the National Security Agency Advisory Board. He is also a member of the National Academy of Engineering, the American Academy of Arts and Sciences, and the Board of Overseers of the School of Engineering and Applied Science of the University of Pennsylvania. Previously, Dr. Heilmeier served as a Director of TRW Inc. (automotive, space, defense, and information technology, 1992-2002), Compaq (1994-2002), Automatic Data Processing, Inc. (ADP) (technology-based business outsourcing, 1995-2002), INET Technologies Inc. (telecommunications network surveillance, 2001-2004), and Teletech Holdings (customer management services). He is the recipient of the 2005 Kyoto Prize in Advanced Technology for his invention of the liquid crystal display. |
Marie L. Knowles (59) |
| Year of Election or Appointment: 2001 Prior to Ms. Knowles' retirement in June 2000, she served as Executive Vice President and Chief Financial Officer of Atlantic Richfield Company (ARCO) (diversified energy, 1996-2000). From 1993 to 1996, she was a Senior Vice President of ARCO and President of ARCO Transportation Company. She served as a Director of ARCO from 1996 to 1998. She currently serves as a Director of Phelps Dodge Corporation (copper mining and manufacturing) and McKesson Corporation (healthcare service, 2002-present). Ms. Knowles is a Trustee of the Brookings Institution and the Catalina Island Conservancy and also serves as a member of the Advisory Board for the School of Engineering of the University of Southern California. |
Ned C. Lautenbach (62) |
| Year of Election or Appointment: 2000 Mr. Lautenbach has been a partner of Clayton, Dubilier & Rice, Inc. (private equity investment firm) since September 1998. Previously, Mr. Lautenbach was with the International Business Machines Corporation (IBM) from 1968 until his retirement in 1998. Mr. Lautenbach serves as a Director of Italtel Holding S.p.A. (telecommunications (Milan, Italy), 2004-present) and Eaton Corporation (diversified industrial) as well as the Philharmonic Center for the Arts in Naples, Florida. He also is a member of the Board of Trustees of Fairfield University (2005-present), as well as a member of the Council on Foreign Relations. |
William O. McCoy (72) |
| Year of Election or Appointment: 1997 Prior to his retirement in December 1994, Mr. McCoy was Vice Chairman of the Board of BellSouth Corporation (telecommunications) and President of BellSouth Enterprises. He is currently a Director of Duke Realty Corporation (real estate). He is also a partner of Franklin Street Partners (private investment management firm). In addition, Mr. McCoy served as the Interim Chancellor (1999-2000) and a member of the Board of Visitors for the University of North Carolina at Chapel Hill and currently serves as Chairman of the Board of Directors of the University of North Carolina Health Care System. He also served as Vice President of Finance for the University of North Carolina (16-school system). |
Cornelia M. Small (62) |
| Year of Election or Appointment: 2005 Ms. Small is a member (2000-present) and Chairperson (2002-present) of the Investment Committee, and a member (2002-present) of the Board of Trustees of Smith College. Previously, she served as Chief Investment Officer (1999-2000), Director of Global Equity Investments (1996-1999), and a member of the Board of Directors of Scudder, Stevens & Clark (1990-1997) and Scudder Kemper Investments (1997-1999). In addition, Ms. Small served as Co-Chair (2000-2003) of the Annual Fund for the Fletcher School of Law and Diplomacy. |
William S. Stavropoulos (67) |
| Year of Election or Appointment: 2002 Mr. Stavropoulos is Chairman Emeritus of the Board of Directors of The Dow Chemical Company. Since joining The Dow Chemical Company in 1967, Mr. Stavropoulos served in numerous senior management positions, including President (1993-2000; 2002-2003), CEO (1995-2000; 2002-2004), and Chairman of the Executive Committee (2000-2004). Currently, he is a Director of NCR Corporation (data warehousing and technology solutions), BellSouth Corporation (telecommunications), Chemical Financial Corporation, Maersk Inc. (industrial conglomerate, 2002-present), and Metalmark Capital (private equity investment firm, 2005-present). He also serves as a member of the Board of Trustees of the American Enterprise Institute for Public Policy Research. In addition, Mr. Stavropoulos is a member of The Business Council, J.P. Morgan International Council and the University of Notre Dame Advisory Council for the College of Science. |
Kenneth L. Wolfe (67) |
| Year of Election or Appointment: 2005 Prior to his retirement in 2001, Mr. Wolfe was Chairman and Chief Executive Officer of Hershey Foods Corporation (1993-2001). He currently serves as a member of the boards of Adelphia Communications Corporation (2003-present), Bausch & Lomb, Inc., and Revlon Inc. (2004-present). |
Annual Report
Advisory Board Members and Executive Officers:
Correspondence intended for Mr. Keyes may be sent to Fidelity Investments, P.O. Box 55235, Boston, Massachusetts 02205-5235. Correspondence intended for each executive officer and Mr. Lynch may be sent to Fidelity Investments, 82 Devonshire Street, Boston, Massachusetts 02109.
Name, Age; Principal Occupation |
James H. Keyes (65) |
| Year of Election or Appointment: 2006 Member of the Advisory Board of Fidelity Securities Fund. Prior to his retirement in 2003, Mr. Keyes was Chairman, President, and Chief Executive Officer of Johnson Controls, Inc. (automotive supplier, 1993-2003). He currently serves as a member of the boards of LSI Logic Corporation (semiconductor technologies, 1984-present), Navistar International Corporation (manufacture and sale of trucks, buses, and diesel engines, 2002-present), and Pitney Bowes, Inc. (integrated mail, messaging, and document management solutions, 1998-present). |
Peter S. Lynch (62) |
| Year of Election or Appointment: 2003 Member of the Advisory Board of Fidelity Securities Fund. Mr. Lynch is Vice Chairman and a Director of FMR, and Vice Chairman (2001-present) and a Director (1999-present) of FMR Co., Inc. Previously, Mr. Lynch served as a Trustee of the Fidelity funds (1990-2003). In addition, he serves as the Chairman of the Inner-City Scholarship Fund. |
Dwight D. Churchill (52) |
| Year of Election or Appointment: 2005 Vice President of OTC. Mr. Churchill also serves as Vice President of certain Equity Funds (2005-present). Mr. Churchill is Executive Vice President of FMR (2005-present) and FMR Co., Inc. (2005-present). Previously, Mr. Churchill served as Senior Vice President of Fidelity Investments Money Management, Inc. (2005-2006), Head of Fidelity's Fixed-Income Division (2000-2005), Vice President of Fidelity's Money Market Funds (2000-2005), Vice President of Fidelity's Bond Funds, and Senior Vice President of FMR. |
Bruce T. Herring (40) |
| Year of Election or Appointment: 2006 Vice President of OTC. Mr. Herring also serves as Vice President of certain Equity Funds (2006-present). Mr. Herring is Senior Vice President of FMR (2006-present) and Vice President of FMR Co., Inc. (2001-present). Previously, Mr. Herring served as a portfolio manager for Fidelity U.S. Equity Funds (2001-2005). |
Sonu Kalra (35) |
| Year of Election or Appointment: 2006 Vice President of OTC. Prior to assuming his current responsibilities, Mr. Kalra worked as a research analyst. |
Eric D. Roiter (57) |
| Year of Election or Appointment: 1998 Secretary of OTC. He also serves as Secretary of other Fidelity funds; Vice President, General Counsel, and Secretary of FMR Co., Inc. (2001-present) and FMR; Assistant Secretary of Fidelity Management & Research (U.K.) Inc. (2001-present), Fidelity Research & Analysis Company (2001-present), and Fidelity Investments Money Management, Inc. (2001-present). Mr. Roiter is an Adjunct Member, Faculty of Law, at Boston College Law School (2003-present). Previously, Mr. Roiter served as Vice President and Secretary of Fidelity Distributors Corporation (FDC) (1998-2005). |
Stuart Fross (46) |
| Year of Election or Appointment: 2003 Assistant Secretary of OTC. Mr. Fross also serves as Assistant Secretary of other Fidelity funds (2003-present), Vice President and Secretary of FDC (2005-present), and is an employee of FMR. |
Christine Reynolds (47) |
| Year of Election or Appointment: 2004 President and Treasurer of OTC. Ms. Reynolds also serves as President and Treasurer of other Fidelity funds (2004-present) and is a Vice President (2003-present) and an employee (2002-present) of FMR. Before joining Fidelity Investments, Ms. Reynolds worked at PricewaterhouseCoopers LLP (PwC) (1980-2002), where she was most recently an audit partner with PwC's investment management practice. |
R. Stephen Ganis (40) |
| Year of Election or Appointment: 2006 Anti-Money Laundering (AML) office of OTC. Mr. Ganis also serves as AML officer of other Fidelity funds (2006-present) and FMR Corp. (2003-present). Before joining Fidelity Investments, Mr. Ganis practiced law at Goodwin Procter, LLP (2000-2002). |
Joseph B. Hollis (58) |
| Year of Election or Appointment: 2006 Chief Financial Officer of OTC. Mr. Hollis also serves as Chief Financial Officer of other Fidelity funds. Mr. Hollis is President of Fidelity Pricing and Cash Management Services (FPCMS) (2005-present). Mr. Hollis also serves as President and Director of Fidelity Service Company, Inc. (2006-present). Previously, Mr. Hollis served as Senior Vice President of Cash Management Services (1999-2002) and Investment Management Operations (2002-2005). |
Kenneth A. Rathgeber (59) |
| Year of Election or Appointment: 2004 Chief Compliance Officer of OTC. Mr. Rathgeber also serves as Chief Compliance Officer of other Fidelity funds (2004-present) and Executive Vice President of Risk Oversight for Fidelity Investments (2002-present). He is Chief Compliance Officer of FMR (2005-present), FMR Co., Inc. (2005-present), Fidelity Management & Research (U.K.) Inc. (2005-present), Fidelity Research & Analysis Company (2005-present), Fidelity Investments Money Management, Inc. (2005-present), and Strategic Advisers, Inc. (2005-present). Previously, Mr. Rathgeber served as Executive Vice President and Chief Operating Officer for Fidelity Investments Institutional Services Company, Inc. (1998-2002). |
Bryan A. Mehrmann (45) |
| Year of Election or Appointment: 2005 Deputy Treasurer of OTC. Mr. Mehrmann also serves as Deputy Treasurer of other Fidelity funds (2005-present) and is an employee of FMR. Previously, Mr. Mehrmann served as Vice President of Fidelity Investments Institutional Services Group (FIIS)/Fidelity Investments Institutional Operations Corporation, Inc. (FIIOC) Client Services (1998-2004). |
Kimberley H. Monasterio (42) |
| Year of Election or Appointment: 2004 Deputy Treasurer of OTC. Ms. Monasterio also serves as Deputy Treasurer of other Fidelity funds (2004) and is an employee of FMR (2004). Before joining Fidelity Investments, Ms. Monasterio served as Treasurer (2000-2004) and Chief Financial Officer (2002-2004) of the Franklin Templeton Funds and Senior Vice President of Franklin Templeton Services, LLC (2000-2004). |
Kenneth B. Robins (36) |
| Year of Election or Appointment: 2005 Deputy Treasurer of OTC. Mr. Robins also serves as Deputy Treasurer of other Fidelity funds (2005-present) and is an employee of FMR (2004-present). Before joining Fidelity Investments, Mr. Robins worked at KPMG LLP, where he was a partner in KPMG's department of professional practice (2002-2004) and a Senior Manager (1999-2000). In addition, Mr. Robins served as Assistant Chief Accountant, United States Securities and Exchange Commission (2000-2002). |
Robert G. Byrnes (39) |
| Year of Election or Appointment: 2005 Assistant Treasurer of OTC. Mr. Byrnes also serves as Assistant Treasurer of other Fidelity funds (2005-present) and is an employee of FMR (2005-present). Previously, Mr. Byrnes served as Vice President of FPCMS (2003-2005). Before joining Fidelity Investments, Mr. Byrnes worked at Deutsche Asset Management where he served as Vice President of the Investment Operations Group (2000-2003). |
John H. Costello (59) |
| Year of Election or Appointment: 1986 Assistant Treasurer of OTC. Mr. Costello also serves as Assistant Treasurer of other Fidelity funds and is an employee of FMR. |
Peter L. Lydecker (52) |
| Year of Election or Appointment: 2004 Assistant Treasurer of OTC. Mr. Lydecker also serves as Assistant Treasurer of other Fidelity funds (2004) and is an employee of FMR. |
Mark Osterheld (51) |
| Year of Election or Appointment: 2002 Assistant Treasurer of OTC. Mr. Osterheld also serves as Assistant Treasurer of other Fidelity funds (2002) and is an employee of FMR. |
Gary W. Ryan (47) |
| Year of Election or Appointment: 2005 Assistant Treasurer of OTC. Mr. Ryan also serves as Assistant Treasurer of other Fidelity funds (2005-present) and is an employee of FMR (2005-present). Previously, Mr. Ryan served as Vice President of Fund Reporting in FPCMS (1999-2005). |
Salvatore Schiavone (40) |
| Year of Election or Appointment: 2005 Assistant Treasurer of OTC. Mr. Schiavone also serves as Assistant Treasurer of other Fidelity funds (2005-present) and is an employee of FMR (2005-present). Before joining Fidelity Investments, Mr. Schiavone worked at Deutsche Asset Management, where he most recently served as Assistant Treasurer (2003-2005) of the Scudder Funds and Vice President and Head of Fund Reporting (1996-2003). |
Annual Report
Proxy Voting Results
A special meeting of the fund's shareholders was held on May 17, 2006. The results of votes taken among shareholders on the proposal before them are reported below. Each vote reported represents one dollar of net asset value held on the record date for the meeting.
PROPOSAL 1 |
To elect a Board of Trustees. A |
| # of
Votes | % of
Votes |
Dennis J. Dirks |
Affirmative | 43,119,905,166.54 | 95.455 |
Withheld | 2,053,001,967.67 | 4.545 |
TOTAL | 45,172,907,134.21 | 100.000 |
Albert R. Gamper, Jr. |
Affirmative | 43,068,780,128.62 | 95.342 |
Withheld | 2,104,127,005.59 | 4.658 |
TOTAL | 45,172,907,134.21 | 100.000 |
Robert M. Gates |
Affirmative | 43,032,117,662.60 | 95.261 |
Withheld | 2,140,789,471.61 | 4.739 |
TOTAL | 45,172,907,134.21 | 100.000 |
George H. Heilmeier |
Affirmative | 43,023,368,882.30 | 95.242 |
Withheld | 2,149,538,251.91 | 4.758 |
TOTAL | 45,172,907,134.21 | 100.000 |
Edward C. Johnson 3d |
Affirmative | 42,881,915,819.70 | 94.928 |
Withheld | 2,290,991,314.51 | 5.072 |
TOTAL | 45,172,907,134.21 | 100.000 |
Stephen P. Jonas |
Affirmative | 43,081,912,066.37 | 95.371 |
Withheld | 2,090,995,067.84 | 4.629 |
TOTAL | 45,172,907,134.21 | 100.000 |
James H. KeyesB |
Affirmative | 43,049,050,093.79 | 95.298 |
Withheld | 2,123,857,040.42 | 4.702 |
TOTAL | 45,172,907,134.21 | 100.000 |
Marie L. Knowles |
Affirmative | 43,090,434,696.02 | 95.390 |
Withheld | 2,082,472,438.19 | 4.610 |
TOTAL | 45,172,907,134.21 | 100.000 |
| # of
Votes | % of
Votes |
Ned C. Lautenbach |
Affirmative | 43,082,185,255.05 | 95.372 |
Withheld | 2,090,721,879.16 | 4.628 |
TOTAL | 45,172,907,134.21 | 100.000 |
William O. McCoy |
Affirmative | 42,960,162,066.32 | 95.102 |
Withheld | 2,212,745,067.89 | 4.898 |
TOTAL | 45,172,907,134.21 | 100.000 |
Robert L. Reynolds |
Affirmative | 43,087,560,419.66 | 95.384 |
Withheld | 2,085,346,714.55 | 4.616 |
TOTAL | 45,172,907,134.21 | 100.000 |
Cornelia M. Small |
Affirmative | 43,092,070,014.53 | 95.394 |
Withheld | 2,080,837,119.68 | 4.606 |
TOTAL | 45,172,907,134.21 | 100.000 |
William S. Stavropoulos |
Affirmative | 43,002,032,676.43 | 95.194 |
Withheld | 2,170,874,457.78 | 4.806 |
TOTAL | 45,172,907,134.21 | 100.000 |
Kenneth L. Wolfe |
Affirmative | 43,047,241,852.81 | 95.294 |
Withheld | 2,125,665,281.40 | 4.706 |
TOTAL | 45,172,907,134.21 | 100.000 |
A Denotes trust-wide proposal and voting results. B Effective on or about January 1, 2007. |
Annual Report
Board Approval of Investment Advisory Contracts and Management Fees
Fidelity OTC Portfolio
Each year, typically in July, the Board of Trustees, including the Independent Trustees (together, the Board), votes on the renewal of the management contract and sub-advisory agreements (together, the Advisory Contracts) for the fund. The Board, assisted by the advice of fund counsel and Independent Trustees' counsel, requests and considers a broad range of information throughout the year.
The Board meets regularly each month except August and takes into account throughout the year matters bearing on Advisory Contracts. The Board, acting directly and through its separate committees, considers at each of its meetings factors that are relevant to the annual renewal of the fund's Advisory Contracts, including the services and support provided to the fund and its shareholders. At the time of the renewal, the Board had 12 standing committees, each composed of Independent Trustees with varying backgrounds, to which the Board has assigned specific subject matter responsibilities in order to enhance effective decision-making by the Board. Each committee has adopted a written charter outlining the structure and purposes of the committee. One such committee, the Equity Contract Committee, meets periodically as needed throughout the year to consider matters specifically related to the annual renewal of Advisory Contracts. The committee requests and receives information on, and makes recommendations to the Independent Trustees concerning, the approval and annual review of the Advisory Contracts.
At its July 2006 meeting, the Board of Trustees, including the Independent Trustees, unanimously determined to renew the Advisory Contracts for the fund. In reaching its determination, the Board considered all factors it believed relevant, including (i) the nature, extent, and quality of the services to be provided to the fund and its shareholders (including the investment performance of the fund); (ii) the competitiveness of the management fee and total expenses of the fund; (iii) the total costs of the services to be provided by and the profits to be realized by the investment adviser and its affiliates from the relationship with the fund; (iv) the extent to which economies of scale would be realized as the fund grows; and (v) whether fee levels reflect these economies of scale, if any, for the benefit of fund shareholders.
In determining whether to renew the Advisory Contracts for the fund, the Board ultimately reached a determination, with the assistance of fund counsel and Independent Trustees' counsel, that the renewal of the Advisory Contracts and the compensation to be received by Fidelity under the management contract is consistent with Fidelity's fiduciary duty under applicable law. In addition to evaluating the specific factors noted above, the Board, in reaching its determination, is aware that shareholders in the fund have a broad range of investment choices available to them, including a wide choice among mutual funds offered by competitors to Fidelity, and that the fund's shareholders, with the opportunity to review and weigh the disclosure provided by the fund in its prospectus and other public disclosures, have chosen to invest in this fund, managed by Fidelity.
Annual Report
Nature, Extent, and Quality of Services Provided. The Board considered staffing within the investment adviser, FMR, and the sub-advisers (together, the Investment Advisers), including the background of the fund's portfolio manager and the fund's investment objective and discipline. The Independent Trustees also had discussions with senior management of Fidelity's investment operations and investment groups. The Board considered the structure of the portfolio manager compensation program and whether this structure provides appropriate incentives.
Resources Dedicated to Investment Management and Support Services. The Board reviewed the size, education, and experience of the Investment Advisers' investment staff, their use of technology, and the Investment Advisers' approach to recruiting, training, and retaining portfolio managers and other research, advisory, and management personnel. The Board considered Fidelity's extensive global research capabilities that enable the Investment Advisers to aggregate data from various sources in an effort to produce positive investment results. The Board noted that Fidelity's analysts have access to a variety of technological tools that enable them to perform both fundamental and quantitative analysis and to specialize in various disciplines. The Board also considered that Fidelity's portfolio managers and analysts have access to daily portfolio attribution that allows for monitoring of a fund's portfolio, as well as an electronic communication system that provides immediate real-time access to research concerning issuers and credit enhancers.
Shareholder and Administrative Services. The Board considered (i) the nature, extent, quality, and cost of administrative, distribution, and shareholder services performed by the Investment Advisers and their affiliates under the Advisory Contracts and under separate agreements covering transfer agency, pricing and bookkeeping, and securities lending services for the fund; (ii) the nature and extent of the Investment Advisers' supervision of third party service providers, principally custodians and subcustodians; and (iii) the resources devoted to, and the record of compliance with, the fund's compliance policies and procedures. The Board reviewed the allocation of fund brokerage, including allocations to brokers affiliated with the Investment Advisers, the use of brokerage commissions to pay fund expenses, and the use of "soft" commission dollars to pay for research services. The Board also considered that Fidelity voluntarily pays for market data out of its own resources.
The Board noted that the growth of fund assets across the complex allows Fidelity to reinvest in the development of services designed to enhance the value or convenience of the Fidelity funds as investment vehicles. These services include 24-hour access to account information and market information through phone representatives and over the Internet, and investor education materials and asset allocation tools.
Annual Report
Board Approval of Investment Advisory Contracts and
Management Fees - continued
Investment in a Large Fund Family. The Board considered the benefits to shareholders of investing in a Fidelity fund, including the benefits of investing in a fund that is part of a large family of funds offering a variety of investment disciplines and providing for a large variety of mutual fund investor services. For example, fund shareholders are offered the privilege of exchanging shares of the fund for shares of other Fidelity funds, as set forth in the fund's prospectus, without paying a sales charge. The Board noted that, since the last Advisory Contract renewals in July 2005, Fidelity has taken a number of actions that benefited particular funds, including (i) dedicating additional resources to investment research and to restructure the investment research teams; (ii) voluntarily entering into contractual arrangements with certain brokers pursuant to which Fidelity pays for research products and services separately out of its own resources, rather than bundling with fund commissions; (iii) launching the Fidelity Advantage Class of its five Spartan stock index funds and three Spartan bond index funds, which is a lower-fee class available to shareholders with higher account balances; (iv) contractually agreeing to impose expense limitations on Fidelity U.S. Bond Index Fund and reducing the fund's initial investment minimum; and (v) offering shareholders of each of the Fidelity Institutional Money Market Funds the privilege of exchanging shares of the fund for shares of other Fidelity funds.
Investment Performance and Compliance. The Board considered whether the fund has operated within its investment objective, as well as its record of compliance with its investment restrictions. It also reviewed the fund's absolute investment performance, as well as the fund's relative investment performance measured against (i) a broad-based securities market index, and (ii) a peer group of mutual funds deemed appropriate by the Board over multiple periods. The following charts considered by the Board show, over the one-, three-, and five-year periods ended December 31, 2005, the fund's cumulative total returns, the cumulative total returns of a broad-based securities market index ("benchmark"), and a range of cumulative total returns of a peer group of mutual funds identified by Lipper Inc. as having an investment objective similar to that of the fund. The box within each chart shows the 25th percentile return (bottom of box) and the 75th percentile return (top of box) of the Lipper peer group. Returns shown above the box are in the first quartile and returns shown below the box are in the fourth quartile. The percentage beaten number noted below each chart corresponds to the percentile box and represents the percentage of funds in the Lipper peer group whose performance was equal to or lower than that of the fund.
Annual Report
Fidelity OTC Portfolio
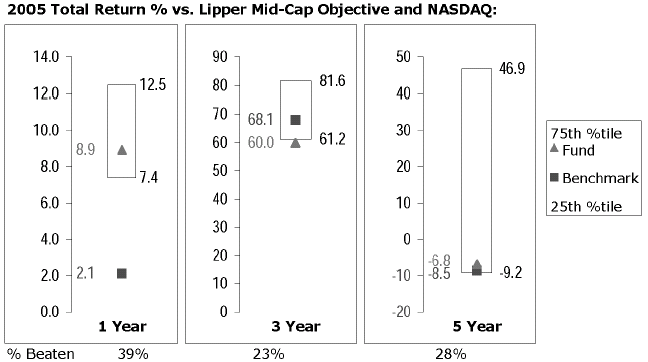
The Board reviewed the fund's relative investment performance against its Lipper peer group and stated that the performance of the fund was in the third quartile for the one- and five-year periods and the fourth quartile for the three-year period. The Board also stated that the relative investment performance of the fund was higher than its benchmark for the one- and five-year periods, although the fund's three-year cumulative total return was lower than its benchmark. The Board discussed with FMR actions to be taken by FMR to improve the fund's disappointing performance. The Board will continue to closely monitor the performance of the fund in the coming year.
The Board also considered that the fund's management fee is subject to upward or downward adjustment depending upon whether, and to what extent, the fund's investment performance for the performance period exceeds, or is exceeded by, the record (over the same period) of a Board-approved performance adjustment index. The Board realizes that the performance adjustment provides FMR with a strong economic incentive to seek to achieve superior performance for the fund's shareholders and helps to more closely align the interests of FMR and the fund's shareholders.
The Board considered that FMR has taken steps to refocus and strengthen equity research, equity portfolio management, and compliance. The Board noted with favor FMR's reorganization of its senior management team in 2005 and FMR's dedication of additional resources to investment research, and participated in the process that led to those changes.
Based on its review, and giving particular weight to the nature and quality of the resources dedicated by the Investment Advisers to maintain and improve relative performance, the Board concluded that the nature, extent, and quality of the services provided to the fund will benefit the fund's shareholders, particularly in light of the Board's view that the fund's shareholders benefit from investing in a fund that is part of a large family of funds offering a variety of investment disciplines and services.
Annual Report
Board Approval of Investment Advisory Contracts and
Management Fees - continued
Competitiveness of Management Fee and Total Fund Expenses. The Board considered the fund's management fee and total expenses compared to "mapped groups" of competitive funds and classes. Fidelity creates "mapped groups" by combining similar Lipper investment objective categories that have comparable management fee characteristics. Combining Lipper investment objective categories aids the Board's management fee and total expense comparisons by broadening the competitive group used for comparison and by reducing the number of universes to which various Fidelity funds are compared.
The Board considered two proprietary management fee comparisons for the 12-month periods shown in the chart below. The group of Lipper funds used by the Board for management fee comparisons is referred to below as the "Total Mapped Group" and, for the reasons explained above, is broader than the Lipper peer group used by the Board for performance comparisons. The Total Mapped Group comparison focuses on a fund's standing relative to the total universe of comparable funds available to investors, in terms of gross management fees before expense reimbursements or caps, and without giving effect to the fund's performance adjustment. "TMG %" represents the percentage of funds in the Total Mapped Group that had management fees that were lower than the fund's. For example, a TMG % of 15% means that 85% of the funds in the Total Mapped Group had higher management fees than the fund. The "Asset-Size Peer Group" (ASPG) comparison focuses on a fund's standing relative to non-Fidelity funds similar in size to the fund within the Total Mapped Group. The ASPG represents at least 15% of the funds in the Total Mapped Group with comparable asset size and management fee characteristics, subject to a minimum of 50 funds (or all funds in the Total Mapped Group if fewer than 50). Additional information, such as the ASPG quartile in which the fund's management fee ranked and the impact of the fund's performance adjustment, is also included in the chart and considered by the Board.
Annual Report
Fidelity OTC Portfolio
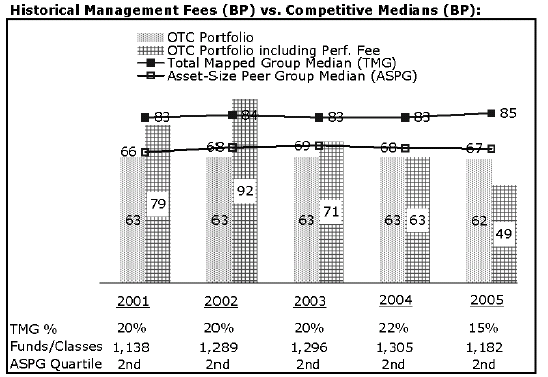
The Board noted that the fund's management fee ranked below the median of its Total Mapped Group and below the median of its ASPG for 2005. The Board also noted the effect of the fund's negative performance adjustment on the fund's management fee ranking. The Board noted that the performance adjustment for each year represents calculations for rolling 36-month periods that differ from the periods shown in the performance charts above.
Based on its review, the Board concluded that the fund's management fee was fair and reasonable in light of the services that the fund receives and the other factors considered.
In its review of the fund's total expenses, the Board considered the fund's management fee as well as other fund expenses, such as transfer agent fees, pricing and bookkeeping fees, and custodial, legal, and audit fees. The Board also noted the effects of any waivers and reimbursements on fees and expenses, as well as the fund's negative performance adjustment. As part of its review, the Board also considered current and historical total expenses of the fund compared to competitive fund median expenses. The fund is compared to those funds and classes in the Total Mapped Group (used by the Board for management fee comparisons) that have a similar sales load structure.
The Board noted that the fund's total expenses ranked below its competitive median for 2005.
In its review of total expenses, the Board also considered Fidelity fee structures and other information on clients that FMR and its affiliates service in other competitive markets, such as other mutual funds advised or subadvised by FMR or its affiliates, pension plan clients, and other institutional clients.
Annual Report
Board Approval of Investment Advisory Contracts and
Management Fees - continued
Based on its review, the Board concluded that the fund's total expenses were reasonable in light of the services that the fund and its shareholders receive and the other factors considered.
Costs of the Services and Profitability. The Board considered the revenues earned and the expenses incurred by Fidelity in conducting the business of developing, marketing, distributing, managing, administering and servicing the fund and its shareholders. The Board also considered the level of Fidelity's profits in respect of all the Fidelity funds.
On an annual basis, FMR presents to the Board Fidelity's profitability for the fund. Fidelity calculates the profitability for each fund, as well as aggregate profitability for groups of Fidelity funds and all Fidelity funds, using a series of detailed revenue and cost allocation methodologies which originate with the audited books and records of Fidelity. The Audit Committee of the Board reviews any significant changes from the prior year's methodologies.
PricewaterhouseCoopers LLP (PwC), independent registered accounting firm and auditor to Fidelity and certain Fidelity funds, has been engaged annually by the Board as part of the Board's assessment of the results of Fidelity's profitability analysis. PwC's engagement includes the review and assessment of Fidelity's methodologies used in determining the revenues and expenses attributable to Fidelity's mutual fund business, and completion of agreed-upon procedures surrounding the mathematical accuracy of fund profitability and its conformity to allocation methodologies. After considering PwC's reports issued under the engagement and information provided by Fidelity, the Board believes that while other allocation methods may also be reasonable, Fidelity's profitability methodologies are reasonable in all material respects.
The Board has also reviewed Fidelity's non-fund businesses and any fall-out benefits related to the mutual fund business as well as cases where Fidelity's affiliates may benefit from or be related to the fund's business.
The Board considered the costs of the services provided by and the profits realized by Fidelity in connection with the operation of the fund and determined that the amount of profit is a fair entrepreneurial profit for the management of the fund.
Economies of Scale. The Board considered whether there have been economies of scale in respect of the management of the Fidelity funds, whether the Fidelity funds (including the fund) have appropriately benefited from any such economies of scale, and whether there is potential for realization of any further economies of scale. The Board considered the extent to which the fund will benefit from economies of scale through increased services to the fund, through waivers or reimbursements, or through fee or expense reductions, including reductions that occur through operation of the transfer agent agreement. The transfer agent fee varies in part based on the number of accounts in the fund. If the number of accounts decreases or the average account size increases, the overall transfer agent fee rate decreases.
Annual Report
The Board recognized that the fund's management contract incorporates a "group fee" structure, which provides for lower fee rates as total fund assets under FMR's management increase, and for higher fee rates as total fund assets under FMR's management decrease. The Board considered that the group fee is designed to deliver the benefits of economies of scale to fund shareholders when total fund assets increase, even if assets of any particular fund are unchanged or have declined, because some portion of Fidelity's costs are attributable to services provided to all Fidelity funds, and all funds benefit if those costs can be allocated among more assets. The Board concluded that, given the group fee structure, fund shareholders will achieve a certain level of economies of scale as assets under FMR's management increase at the fund complex level, regardless of whether Fidelity achieves any such economies of scale.
The Board further concluded that any potential economies of scale are being shared between fund shareholders and Fidelity in an appropriate manner.
Additional Information Requested by the Board. In order to develop fully the factual basis for consideration of the Advisory Contracts, the Board requested additional information on several topics, including (i) Fidelity's fund profitability methodology and profitability trends within certain funds; (ii) portfolio manager compensation; (iii) the extent to which any economies of scale exist and are shared between the funds and Fidelity; (iv) the total expenses of certain funds and classes relative to competitors, including the extent to which the expenses of certain funds have been or could be capped; (v) fund performance trends; and (vi) Fidelity's fee structures, including use of performance fees.
Based on its evaluation of all of the conclusions noted above, and after considering all material factors, the Board ultimately concluded that the advisory fee structures are fair and reasonable, and that the fund's Advisory Contracts should be renewed.
Annual Report
Managing Your Investments
Fidelity offers several ways to conveniently manage your personal investments via your telephone or PC. You can access your account information, conduct trades and research your investments 24 hours a day.
By Phone
Fidelity Automated Service Telephone provides a single toll-free number to access account balances, positions, quotes and trading. It's easy to navigate the service, and on your first call, the system will help you create a personal identification number (PIN) for security.
(phone_graphic)
Fidelity Automated
Service Telephone (FAST®)
1-800-544-5555
Press
1 For mutual fund and brokerage trading.
2 For quotes.*
3 For account balances and holdings.
4 To review orders and mutual
fund activity.
5 To change your PIN.
*0 To speak to a Fidelity representative.
By PC
Fidelity's web site on the Internet provides a wide range of information, including daily financial news, fund performance, interactive planning tools and news about Fidelity products and services.
(computer_graphic)
Fidelity's Web Site
www.fidelity.com
* When you call the quotes line, please remember that a fund's yield and return will vary and, except for money market funds, share price will also vary. This means that you may have a gain or loss when you sell your shares. There is no assurance that money market funds will be able to maintain a stable $1 share price; an investment in a money market fund is not insured or guaranteed by the U.S. government. Total returns are historical and include changes in share price, reinvestment of dividends and capital gains, and the effects of any sales charges.
Annual Report
To Write Fidelity
We'll give your correspondence immediate attention and send you written confirmation upon completion of your request.
(letter_graphic)
Making Changes
To Your Account
(such as changing name, address, bank, etc.)
Fidelity Investments
P.O. Box 770001
Cincinnati, OH 45277-0002
(letter_graphic)
For Non-Retirement
Accounts
Buying shares
Fidelity Investments
P.O. Box 770001
Cincinnati, OH 45277-0003
Overnight Express
Fidelity Investments
Attn: Distribution Services
100 Crosby Parkway - KC1H
Covington, KY 41015
Selling shares
Fidelity Investments
P.O. Box 770001
Cincinnati, OH 45277-0035
Overnight Express
Fidelity Investments
Attn: Distribution Services
100 Crosby Parkway - KC1H
Covington, KY 41015
General Correspondence
Fidelity Investments
P.O. Box 500
Merrimack, NH 03054-0500
(letter_graphic)
For Retirement
Accounts
Buying shares
Fidelity Investments
P.O. Box 770001
Cincinnati, OH 45277-0003
Selling shares
Fidelity Investments
P.O. Box 770001
Cincinnati, OH 45277-0035
Overnight Express
Fidelity Investments
Attn: Distribution Services
100 Crosby Parkway - KC1H
Covington, KY 41015
General Correspondence
Fidelity Investments
P.O. Box 500
Merrimack, NH 03054-0500
Annual Report
To Visit Fidelity
For directions and hours,
please call 1-800-544-9797.
Arizona
7001 West Ray Road
Chandler, AZ
15445 N. Scottsdale Road
Scottsdale, AZ
California
815 East Birch Street
Brea, CA
1411 Chapin Avenue
Burlingame, CA
851 East Hamilton Avenue
Campbell, CA
19200 Von Karman Avenue
Irvine, CA
601 Larkspur Landing Circle
Larkspur, CA
10100 Santa Monica Blvd.
Los Angeles, CA
27101 Puerta Real
Mission Viejo, CA
73-575 El Paseo
Palm Desert, CA
251 University Avenue
Palo Alto, CA
123 South Lake Avenue
Pasadena, CA
16995 Bernardo Ctr. Drive
Rancho Bernardo, CA
1220 Roseville Parkway
Roseville, CA
1740 Arden Way
Sacramento, CA
7676 Hazard Center Drive
San Diego, CA
11943 El Camino Real
San Diego, CA
8 Montgomery Street
San Francisco, CA
3793 State Street
Santa Barbara, CA
1200 Wilshire Boulevard
Santa Monica, CA
21701 Hawthorne Boulevard
Torrance, CA
2001 North Main Street
Walnut Creek, CA
6300 Canoga Avenue
Woodland Hills, CA
Colorado
1625 Broadway
Denver, CO
9185 Westview Road
Lone Tree, CO
Connecticut
48 West Putnam Avenue
Greenwich, CT
265 Church Street
New Haven, CT
300 Atlantic Street
Stamford, CT
29 South Main Street
West Hartford, CT
Delaware
400 Delaware Avenue
Wilmington, DE
Florida
4400 N. Federal Highway
Boca Raton, FL
121 Alhambra Plaza
Coral Gables, FL
2948 N. Federal Highway
Ft. Lauderdale, FL
4671 Town Center Parkway
Jacksonville, FL
1907 West State Road 434
Longwood, FL
8880 Tamiami Trail, North
Naples, FL
3501 PGA Boulevard
Palm Beach Gardens, FL
3550 Tamiami Trail, South
Sarasota, FL
1502 N. Westshore Blvd.
Tampa, FL
2465 State Road 7
Wellington, FL
Georgia
3445 Peachtree Road, N.E.
Atlanta, GA
1000 Abernathy Road
Atlanta, GA
Illinois
One North LaSalle Street
Chicago, IL
875 North Michigan Ave.
Chicago, IL
1415 West 22nd Street
Oak Brook, IL
1572 East Golf Road
Schaumburg, IL
3232 Lake Avenue
Wilmette, IL
Indiana
4729 East 82nd Street
Indianapolis, IN
Kansas
5400 College Boulevard
Overland Park, KS
Maine
Three Canal Plaza
Portland, ME
Maryland
7315 Wisconsin Avenue
Bethesda, MD
One W. Pennsylvania Ave.
Towson, MD
Massachusetts
801 Boylston Street
Boston, MA
155 Congress Street
Boston, MA
300 Granite Street
Braintree, MA
44 Mall Road
Burlington, MA
238 Main Street
Cambridge, MA
405 Cochituate Road
Framingham, MA
416 Belmont Street
Worcester, MA
Annual Report
Michigan
500 E. Eisenhower Pkwy.
Ann Arbor, MI
280 Old N. Woodward Ave.
Birmingham, MI
43420 Grand River Avenue
Novi, MI
29155 Northwestern Hwy.
Southfield, MI
Minnesota
7600 France Avenue South
Edina, MN
Missouri
1524 South Lindbergh Blvd.
St. Louis, MO
Nevada
2225 Village Walk Drive
Henderson, NV
New Jersey
150 Essex Street
Millburn, NJ
56 South Street
Morristown, NJ
396 Route 17, North
Paramus, NJ
3518 Route 1 North
Princeton, NJ
530 Broad Street
Shrewsbury, NJ
New York
1055 Franklin Avenue
Garden City, NY
37 West Jericho Turnpike
Huntington Station, NY
1271 Avenue of the Americas
New York, NY
980 Madison Avenue
New York, NY
61 Broadway
New York, NY
350 Park Avenue
New York, NY
200 Fifth Avenue
New York, NY
733 Third Avenue
New York, NY
11 Penn Plaza
New York, NY
2070 Broadway
New York, NY
1075 Northern Blvd.
Roslyn, NY
799 Central Park Avenue
Scarsdale, NY
North Carolina
4611 Sharon Road
Charlotte, NC
7011 Fayetteville Road
Durham, NC
Ohio
3805 Edwards Road
Cincinnati, OH
1324 Polaris Parkway
Columbus, OH
28699 Chagrin Boulevard
Woodmere Village, OH
Oregon
7493 SW Bridgeport Road
Tigard, OR
Pennsylvania
600 West DeKalb Pike
King of Prussia, PA
1735 Market Street
Philadelphia, PA
12001 Perry Highway
Wexford, PA
Rhode Island
47 Providence Place
Providence, RI
Tennessee
6150 Poplar Avenue
Memphis, TN
Texas
10000 Research Boulevard
Austin, TX
4001 Northwest Parkway
Dallas, TX
12532 Memorial Drive
Houston, TX
2701 Drexel Drive
Houston, TX
6560 Fannin Street
Houston, TX
6500 N. MacArthur Blvd.
Irving, TX
6005 West Park Boulevard
Plano, TX
14100 San Pedro
San Antonio, TX
1576 East Southlake Blvd.
Southlake, TX
19740 IH 45 North
Spring, TX
Utah
279 West South Temple
Salt Lake City, UT
Virginia
1861 International Drive
McLean, VA
Washington
411 108th Avenue, N.E.
Bellevue, WA
1518 6th Avenue
Seattle, WA
Washington, DC
1900 K Street, N.W.
Washington, DC
Wisconsin
595 North Barker Road
Brookfield, WI
Fidelity Brokerage Services, Inc., 100 Summer St., Boston, MA 02110 Member NYSE/SIPC
Annual Report
Annual Report
Annual Report
Investment Adviser
Fidelity Management & Research Company
Boston, MA
Investment Sub-Advisers
FMR Co., Inc.
Fidelity Research & Analysis Company
(formerly Fidelity Management &
Research (Far East) Inc.)
Fidelity Management & Research
(U.K.) Inc.
Fidelity Investments Japan Limited
Fidelity International Investments
Advisors
Fidelity International Investments
Advisors (U.K.) Limited
General Distributor
Fidelity Distributors Corporation
Boston, MA
Transfer and Service Agent
Fidelity Service Company, Inc.
Boston, MA
Custodian
Brown Brothers Harriman & Co.
Boston, MA
The Fidelity Telephone Connection
Mutual Fund 24-Hour Service
Exchanges/Redemptions
and Account Assistance 1-800-544-6666
Product Information 1-800-544-6666
Retirement Accounts 1-800-544-4774
(8 a.m. - 9 p.m.)
TDD Service 1-800-544-0118
for the deaf and hearing impaired
(9 a.m. - 9 p.m. Eastern time)
Fidelity Automated Service
Telephone (FAST®) (automated graphic) 1-800-544-5555
(automated graphic) Automated line for quickest service
OTC-UANN-0906
1.789250.103
Fidelity®
Real Estate Income
Fund
Annual Report
July 31, 2006
(2_fidelity_logos) (Registered_Trademark)
Contents
Chairman's Message | <Click Here> | Ned Johnson's message to shareholders. |
Performance | <Click Here> | How the fund has done over time. |
Management's Discussion | <Click Here> | The manager's review of fund performance, strategy and outlook. |
Shareholder Expense Example | <Click Here> | An example of shareholder expenses. |
Investment Changes | <Click Here> | A summary of major shifts in the fund's investments over the past six months. |
Investments | <Click Here> | A complete list of the fund's investments with their market values. |
Financial Statements | <Click Here> | Statements of assets and liabilities, operations, and changes in net assets,
as well as financial highlights. |
Notes | <Click Here> | Notes to the financial statements. |
Report of Independent Registered Public Accounting Firm | <Click Here> | |
Trustees and Officers | <Click Here> | |
Distributions | <Click Here> | |
Proxy Voting Results | <Click Here> | |
Board Approval of Investment Advisory Contracts and Management Fees | <Click Here> | |
| | |
To view a fund's proxy voting guidelines and proxy voting record for the 12-month period ended June 30, visit www.fidelity.com/proxyvotingresults or visit the Securities and Exchange Commission's (SEC) web site at www.sec.gov. You may also call 1-800-544-8544 to request a free copy of the proxy voting guidelines.
Standard & Poor's, S&P and S&P 500 are registered service marks of The McGraw-Hill Companies, Inc. and have been licensed for use by Fidelity Distributors Corporation.
Other third party marks appearing herein are the property of their respective owners.
All other marks appearing herein are registered or unregistered trademarks or service marks of FMR Corp. or an affiliated company.
This report and the financial statements contained herein are submitted for the general information of the shareholders of the fund. This report is not authorized for distribution to prospective investors in the fund unless preceded or accompanied by an effective prospectus.
A fund files its complete schedule of portfolio holdings with the SEC for the first and third quarters of each fiscal year on Form N-Q. Forms N-Q are available on the SEC's web site at http://www.sec.gov. A fund's Forms N-Q may be reviewed and copied at the SEC's Public Reference Room in Washington, DC. Information regarding the operation of the SEC's Public Reference Room may be obtained by calling 1-800-SEC-0330. For a complete list of a fund's portfolio holdings, view the most recent quarterly holdings report, semiannual report, or annual report on Fidelity's web site at http://www.fidelity.com/holdings.
NOT FDIC INSURED · MAY LOSE VALUE · NO BANK GUARANTEE
Neither the fund nor Fidelity Distributors Corporation is a bank.
Annual Report
Chairman's Message
(photo_of_Edward_C_Johnson_3d)
Dear Shareholder:
Although many securities markets made gains in early 2006, inflation concerns led to mixed results through the year's mid-point. Financial markets are always unpredictable. There are, however, a number of time-tested principles that can put the historical odds in your favor.
One of the basic tenets is to invest for the long term. Over time, riding out the markets' inevitable ups and downs has proven much more effective than selling into panic or chasing the hottest trend. Even missing only a few of the markets' best days can significantly diminish investor returns. Patience also affords the benefits of compounding - of earning interest on additional income or reinvested dividends and capital gains. There are tax advantages and cost benefits to consider as well. The more you sell, the more taxes you pay, and the more you trade, the higher the costs. While staying the course doesn't eliminate risk, it can considerably lessen the effect of short-term declines.
You can further manage your investing risk through diversification. And today, more than ever, geographic diversification should be taken into account. Studies indicate that asset allocation is the single most important determinant of a portfolio's long-term success. The right mix of stocks, bonds and cash - aligned to your particular risk tolerance and investment objective - is very important. Age-appropriate rebalancing is also an essential aspect of asset allocation. For younger investors, an emphasis on equities - which historically have been the best performing asset class over time - is encouraged. As investors near their specific goal, such as retirement or sending a child to college, consideration may be given to replacing volatile assets (e.g. common stocks) with more-stable fixed investments (bonds or savings plans).
A third investment principle - investing regularly - can help lower the average cost of your purchases. Investing a certain amount of money each month or quarter helps ensure you won't pay for all your shares at market highs. This strategy - known as dollar cost averaging - also reduces unconstructive "emotion" from investing, helping shareholders avoid selling weak performers just prior to an upswing, or chasing a hot performer just before a correction.
We invite you to contact us via the Internet, through our Investor Centers or over the phone. It is our privilege to provide you the information you need to make the investments that are right for you.
Sincerely,
/s/Edward C. Johnson 3d
Edward C. Johnson 3d
Annual Report
Performance: The Bottom Line
Average annual total return reflects the change in the value of an investment, assuming reinvestment of the fund's dividend income and capital gains (the profits earned upon the sale of securities that have grown in value) and assuming a constant rate of performance each year. The $10,000 table and the fund's returns do not reflect the deduction of taxes that a shareholder would pay on fund distributions or the redemption of fund shares. During periods of reimbursement by Fidelity, a fund's total return will be greater than it would be had the reimbursement not occurred. How a fund did yesterday is no guarantee of how it will do tomorrow.
Average Annual Total Returns
Periods ended July 31, 2006 | Past 1
year | Life of
Fund A |
Fidelity Real Estate Income Fund | 4.82% | 11.17% |
A From February 4, 2003.
$10,000 Over Life of Fund
Let's say hypothetically that $10,000 was invested in Fidelity® Real Estate Income Fund on February 4, 2003, when the fund started. The chart shows how the value of your investment would have changed, and also shows how the Standard and Poor's 500SM Index performed over the same period.
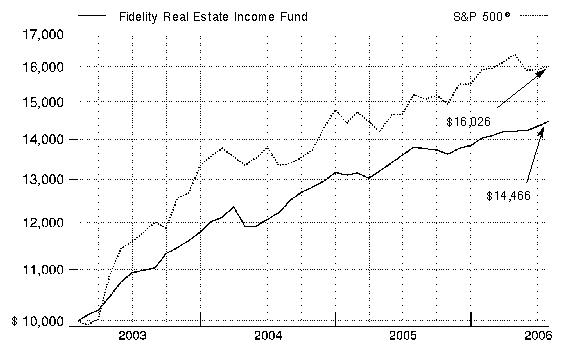
Annual Report
Management's Discussion of Fund Performance
Comments from Mark Snyderman, Portfolio Manager of Fidelity® Real Estate Income Fund
The fundamentals of the commercial property markets continued to be positive during the 12 months ending July 31, 2006. Growth in demand for new office, apartment and retail properties grew gently while very limited new supply was created - providing a favorable real estate market backdrop. During the period, the U.S. real estate investment trust (REIT) market, as measured by the FTSE NAREIT All REIT index (NAREIT index), returned 12.48%. The broad stock market, as measured by the Standard & Poor's 500SM Index, gained 5.38%, while the Merrill Lynch® Real Estate Corporate Bond Index - a market-capitalization-weighted index that measures the performance of investment-grade public debt of real estate sector corporate issuers in the domestic bond market - gained 2.14%.
The fund returned 4.82% during the past year, while the Fidelity Real Estate Income Composite Index - a 40/40/20 blend of the Morgan Stanley® REIT Preferred Index, the Merrill Lynch Real Estate Corporate Bond Index and the NAREIT index, respectively - returned 5.01%. The fund benefited from its high-yield and investment-grade commercial mortgage-backed securities (CMBS), while preferred stocks and high-yield corporate bonds were modest positives. My real estate common stock holdings also performed well, although in hindsight I should have owned more than my 14% average weighting for the year. Two solid performers were CMBS: CS First Boston (CSFB) Mortgage Securities Corp. Series 1998-C1 Class F and J.P. Morgan Commercial Mortgage Finance Corp. Series 1997-C5 Class F. Both benefited from improving credit quality. We sold the CSFB holding after it reached what we considered its fair value. The fund's preferred stock holdings in LBA Realty and CenterPoint Properties Trust detracted. Both companies went private during the period, retiring their common shares and paying off their bonds, but leaving the fate of their preferred shares uncertain.
Note to shareholders: Effective June 1, 2006, the fund changed its supplemental Composite benchmark to include a 20% allocation to the FTSE NAREIT All REIT index, in addition to 40% in the Morgan Stanley REIT Preferred Index and 40% in the Merrill Lynch Real Estate Corporate Bond Index. The Composite benchmark previously comprised a 50/50 blend of the Morgan Stanley and Merrill Lynch indexes. Fidelity believes that, with the addition of the NAREIT index, the Composite benchmark better represents the diversified real estate market and more accurately reflects the fund's real estate holdings and investment strategy.
The views expressed above reflect those of the portfolio manager(s) only through the end of the period as stated on the cover of this report and do not necessarily represent the views of Fidelity or any other person in the Fidelity organization. Any such views are subject to change at any time based upon market or other conditions and Fidelity disclaims any responsibility to update such views. These views may not be relied on as investment advice and, because investment decisions for a Fidelity fund are based on numerous factors, may not be relied on as an indication of trading intent on behalf of any Fidelity fund.
Annual Report
Shareholder Expense Example
As a shareholder of the Fund, you incur two types of costs: (1) transaction costs, including redemption fees, and (2) ongoing costs, including management fees and other Fund expenses. This Example is intended to help you understand your ongoing costs (in dollars) of investing in the Fund and to compare these costs with the ongoing costs of investing in other mutual funds.
The Example is based on an investment of $1,000 invested at the beginning of the period and held for the entire period (February 1, 2006 to July 31, 2006).
Actual Expenses
The first line of the accompanying table provides information about actual account values and actual expenses. You may use the information in this line, together with the amount you invested, to estimate the expenses that you paid over the period. Simply divide your account value by $1,000.00 (for example, an $8,600 account value divided by $1,000.00 = 8.6), then multiply the result by the number in the first line under the heading entitled "Expenses Paid During Period" to estimate the expenses you paid on your account during this period. A small balance maintenance fee of $12.00 that is charged once a year may apply for certain accounts with a value of less than $2,000. This fee is not included in the table below. If it was, the estimate of expenses you paid during the period would be higher, and your ending account value lower, by this amount. In addition, the fund, as a shareholder in the underlying affiliated central funds, will indirectly bear its pro rata share of the fees and expenses incurred by the underlying affiliated central funds. These fees and expenses are not included in the fund's annualized expense ratio used to calculate the expense estimate in the table below.
Hypothetical Example for Comparison Purposes
The second line of the accompanying table provides information about hypothetical account values and hypothetical expenses based on the Fund's actual expense ratio and an assumed rate of return of 5% per year before expenses, which is not the Fund's actual return. The hypothetical account values and expenses may not be used to estimate the actual ending account balance or expenses you paid for the period. You may use this information to compare the ongoing costs of investing in the Fund and other funds. To do so, compare this 5% hypothetical example with the 5% hypothetical examples that appear in the shareholder reports of the other funds. A small balance maintenance fee of $12.00 that is charged once a year may apply for certain accounts with a value of less than $2,000. This fee is not included in the table below. If it was, the estimate of expenses you paid during the period would be higher, and your ending account value lower, by this amount. In addition, the fund, as a shareholder in the underlying affiliated central funds, will indirectly bear its pro rata share of the fees and expenses incurred by the underlying affiliated central funds. These fees and expenses are not included in the fund's annualized expense ratio used to calculate the expense estimate in the table below.
Please note that the expenses shown in the table are meant to highlight your ongoing costs only and do not reflect any transaction costs. Therefore, the second line of the table is useful in comparing ongoing costs only, and will not help you determine the relative total costs of owning different funds. In addition, if these transactional costs were included, your costs would have been higher.
Annual Report
| Beginning
Account Value
February 1, 2006 | Ending
Account Value
July 31, 2006 | Expenses Paid
During Period*
February 1, 2006
to July 31, 2006 |
Actual | $ 1,000.00 | $ 1,031.20 | $ 4.28 |
Hypothetical (5% return per year before expenses) | $ 1,000.00 | $ 1,020.58 | $ 4.26 |
* Expenses are equal to the Fund's annualized expense ratio of .85%; multiplied by the average account value over the period, multiplied by 181/365 (to reflect the one-half year period). The fees and expenses of the underlying affiliated central funds in which the fund invests are not included in the fund's annualized expense ratio.
Annual Report
Investment Changes
Top Five Stocks as of July 31, 2006 |
| % of fund's
net assets | % of fund's net assets
6 months ago |
MFA Mortgage Investments, Inc. Series A, 8.50% | 1.1 | 1.0 |
LaSalle Hotel Properties Series A, 10.25% | 1.0 | 0.9 |
Anworth Mortgage Asset Corp. Series A, 8.625% | 1.0 | 0.9 |
General Growth Properties, Inc. | 1.0 | 0.6 |
Newcastle Investment Corp. Series B, 9.75% | 1.0 | 0.9 |
| 5.1 | |
Top 5 Bonds as of July 31, 2006 |
| % of fund's
net assets | % of fund's net assets
6 months ago |
Thornburg Mortgage, Inc. 8% 5/15/13 | 1.1 | 1.0 |
American Financial Realty Trust 4.375% 7/15/24 | 0.9 | 0.0 |
Wrightwood Capital LLC 9% 6/1/14 | 0.7 | 0.7 |
Ventas Realty LP/Ventas Capital Corp. 9% 5/1/12 | 0.7 | 0.6 |
First Chicago/Lennar Trust I Series 1997-CHL1 Class E, 7.6364% 4/29/39 | 0.7 | 0.6 |
| 4.1 | |
Asset Allocation (% of fund's net assets) |
As of July 31, 2006* | As of January 31, 2006** |
 | Common Stocks 18.4% | |  | Common Stocks 13.8% | |
 | Preferred Stocks 25.0% | |  | Preferred Stocks 29.6% | |
 | Bonds 44.2% | |  | Bonds 46.7% | |
 | Convertible
Securities 3.4% | |  | Convertible
Securities 2.2% | |
 | Other Investments 2.9% | |  | Other Investments 2.8% | |
 | Short-Term
Investments and
Net Other Assets 6.1% | |  | Short-Term
Investments and
Net Other Assets 4.9% | |
* Foreign investments | 0.4% | | ** Foreign investments | 0.3% | |

The information in the above tables is based on the combined investments of the fund and its pro-rata share of the investments of Fidelity's fixed-income central fund. |
Percentages are adjusted for the effect of futures and swap contacts, if applicable. |
For an unaudited list of holdings for each fixed-income central fund, visit fidelity.com. |
Annual Report
Investments July 31, 2006
Showing Percentage of Net Assets
Common Stocks - 18.4% |
| Shares | | Value
(Note 1) |
CONSUMER DISCRETIONARY - 1.2% |
Hotels, Restaurants & Leisure - 0.5% |
Red Lion Hotels Corp. (a) | 68,300 | | $ 663,193 |
Starwood Hotels & Resorts Worldwide, Inc. | 40,200 | | 2,113,716 |
| | 2,776,909 |
Household Durables - 0.7% |
KB Home | 26,200 | | 1,114,024 |
Lennar Corp. Class A | 26,500 | | 1,185,345 |
Ryland Group, Inc. | 28,300 | | 1,156,055 |
| | 3,455,424 |
TOTAL CONSUMER DISCRETIONARY | | 6,232,333 |
FINANCIALS - 17.1% |
Real Estate Investment Trusts - 17.0% |
Acadia Realty Trust (SBI) | 46,600 | | 1,110,944 |
Alexandria Real Estate Equities, Inc. | 17,500 | | 1,652,350 |
American Financial Realty Trust (SBI) | 113,000 | | 1,308,540 |
Annaly Mortgage Management, Inc. | 244,200 | | 3,128,202 |
Anworth Mortgage Asset Corp. | 291,300 | | 2,298,357 |
Apartment Investment & Management Co. Class A | 8,700 | | 418,383 |
AvalonBay Communities, Inc. | 18,400 | | 2,151,328 |
Boston Properties, Inc. | 10,900 | | 1,070,380 |
Capital Lease Funding, Inc. | 94,000 | | 1,033,060 |
Capital Trust, Inc. Class A | 23,800 | | 818,244 |
Cousins Properties, Inc. | 15,100 | | 479,727 |
Developers Diversified Realty Corp. | 29,900 | | 1,578,122 |
DiamondRock Hospitality Co. | 55,500 | | 891,885 |
Eagle Hospitality Properties Trust, Inc. | 19,300 | | 178,139 |
Education Realty Trust, Inc. | 41,100 | | 642,393 |
Equity Lifestyle Properties, Inc. | 89,130 | | 3,829,916 |
Equity Office Properties Trust | 38,500 | | 1,459,535 |
Equity Residential (SBI) | 64,100 | | 2,981,291 |
Federal Realty Investment Trust (SBI) | 24,300 | | 1,762,965 |
Fieldstone Investment Corp. | 138,217 | | 1,250,864 |
General Growth Properties, Inc. | 115,640 | | 5,277,810 |
Glenborough Realty Trust, Inc. | 41,700 | | 925,740 |
GMH Communities Trust | 55,900 | | 700,986 |
Healthcare Realty Trust, Inc. | 7,000 | | 231,630 |
HomeBanc Mortgage Corp., Georgia | 274,200 | | 2,248,440 |
Host Hotels & Resorts, Inc. | 190,349 | | 4,039,206 |
Inland Real Estate Corp. | 296,100 | | 4,799,781 |
Common Stocks - continued |
| Shares | | Value
(Note 1) |
FINANCIALS - continued |
Real Estate Investment Trusts - continued |
Innkeepers USA Trust (SBI) | 26,500 | | $ 447,055 |
Kimco Realty Corp. | 71,800 | | 2,817,432 |
KKR Financial Corp. | 31,400 | | 727,224 |
Lexington Corporate Properties Trust | 36,800 | | 733,056 |
MFA Mortgage Investments, Inc. | 198,400 | | 1,361,024 |
MortgageIT Holdings, Inc. | 169,100 | | 2,470,551 |
Nationwide Health Properties, Inc. | 83,100 | | 1,971,132 |
New York Mortgage Trust, Inc. | 138,800 | | 631,540 |
Newcastle Investment Corp. | 137,000 | | 3,519,530 |
Opteum, Inc. Class A | 114,400 | | 995,280 |
Origen Financial, Inc. (c) | 75,000 | | 450,000 |
ProLogis Trust | 45,266 | | 2,505,473 |
Redwood Trust, Inc. | 13,200 | | 628,056 |
Regency Centers Corp. | 5,800 | | 371,896 |
Resource Capital Corp. | 17,400 | | 224,112 |
Saxon Capital, Inc. | 289,000 | | 3,268,590 |
Simon Property Group, Inc. | 28,804 | | 2,463,606 |
Spirit Finance Corp. | 425,300 | | 4,720,830 |
Strategic Hotel & Resorts, Inc. | 19,000 | | 379,050 |
Trizec Properties, Inc. | 41,200 | | 1,184,912 |
Trustreet Properties, Inc. | 54,800 | | 729,388 |
U-Store-It Trust | 11,700 | | 223,002 |
United Dominion Realty Trust, Inc. (SBI) | 65,100 | | 1,813,035 |
Ventas, Inc. | 121,500 | | 4,341,195 |
Vornado Realty Trust | 12,900 | | 1,348,695 |
| | 88,593,882 |
Real Estate Management & Development - 0.1% |
The St. Joe Co. | 11,000 | | 493,900 |
TOTAL FINANCIALS | | 89,087,782 |
MATERIALS - 0.1% |
Paper & Forest Products - 0.1% |
Weyerhaeuser Co. | 12,100 | | 709,786 |
TOTAL COMMON STOCKS (Cost $81,134,763) | 96,029,901 |
Preferred Stocks - 27.2% |
| Shares | | Value
(Note 1) |
Convertible Preferred Stocks - 2.2% |
FINANCIALS - 2.2% |
Real Estate Investment Trusts - 2.2% |
Annaly Mortgage Management, Inc. Series B, 6.00% | 20,000 | | $ 533,020 |
Crescent Real Estate Equities Co. Series A, 6.75% | 17,700 | | 371,700 |
Equity Office Properties Trust Series B, 5.25% | 74,000 | | 4,014,500 |
Glenborough Realty Trust, Inc. Series A, 7.75% | 2,030 | | 50,446 |
The Mills Corp. 6.75% (c) | 3,158 | | 2,518,505 |
Trustreet Properties, Inc. Series C, 7.50% | 27,300 | | 569,751 |
Windrose Medical Properties Trust 7.50% | 138,500 | | 3,505,435 |
| | 11,563,357 |
Nonconvertible Preferred Stocks - 25.0% |
CONSUMER DISCRETIONARY - 0.0% |
Hotels, Restaurants & Leisure - 0.0% |
Hilton Hotels Corp. 8.00% | 4,800 | | 121,680 |
FINANCIALS - 25.0% |
Diversified Financial Services - 0.6% |
DRA CRT Acquisition Corp. Series A, 8.50% | 25,000 | | 575,000 |
Red Lion Hotels Capital Trust 9.50% | 87,750 | | 2,325,375 |
| | 2,900,375 |
Real Estate Investment Trusts - 23.3% |
Accredited Mortgage Loan Trust Series A, 9.75% | 172,595 | | 4,416,706 |
Alexandria Real Estate Equities, Inc.: | | | |
Series B, 9.10% | 101,200 | | 2,572,504 |
Series C, 8.375% | 65,000 | | 1,691,950 |
American Home Mortgage Investment Corp.: | | | |
Series A, 9.375% | 120,000 | | 3,141,600 |
Series B, 9.25% | 87,000 | | 2,241,990 |
Annaly Mortgage Management, Inc. Series A, 7.875% | 157,000 | | 3,738,170 |
Anthracite Capital, Inc. Series C, 9.375% | 46,000 | | 1,185,420 |
Anworth Mortgage Asset Corp. Series A, 8.625% | 217,827 | | 5,288,840 |
Apartment Investment & Management Co.: | | | |
Series G, 9.375% | 66,600 | | 1,762,236 |
Series T, 8.00% | 57,500 | | 1,457,050 |
Ashford Hospitality Trust, Inc. Series A, 8.55% | 100,000 | | 2,562,000 |
Capital Lease Funding, Inc. Series A, 8.125% | 2,000 | | 50,400 |
CBL & Associates Properties, Inc. Series B, 8.75% | 60,000 | | 3,051,000 |
Cedar Shopping Centers, Inc. 8.875% | 90,000 | | 2,353,500 |
CenterPoint Properties Trust Series D, 5.377% | 3,575 | | 2,681,250 |
Colonial Properties Trust (depositary shares) Series D, 8.125% | 3,500 | | 89,845 |
Preferred Stocks - continued |
| Shares | | Value
(Note 1) |
Nonconvertible Preferred Stocks - continued |
FINANCIALS - continued |
Real Estate Investment Trusts - continued |
Cousins Properties, Inc. Series A, 7.75% | 81,700 | | $ 2,100,507 |
Crescent Real Estate Equities Co. Series B, 9.50% | 33,900 | | 882,417 |
Developers Diversified Realty Corp. (depositary shares)
Series F, 8.60% | 7,200 | | 184,392 |
Digital Realty Trust, Inc. Series A, 8.50% | 120,000 | | 3,052,800 |
Duke Realty Corp. (depositary shares) Series B, 7.99% | 74,700 | | 3,735,000 |
Eagle Hospitality Properties Trust, Inc. Series A, 8.25% | 24,000 | | 600,000 |
Eastgroup Properties, Inc. Series D, 7.95% | 103,900 | | 2,633,865 |
Entertainment Properties Trust Series A 9.50% | 20,000 | | 517,000 |
Equity Inns, Inc. Series B, 8.75% | 55,000 | | 1,457,500 |
Federal Realty Investment Trust Series B, 8.50% | 11,600 | | 291,740 |
Glimcher Realty Trust Series F, 8.75% | 32,000 | | 819,200 |
Hersha Hospitality Trust Series A, 8.00% | 40,000 | | 1,004,000 |
Highwoods Properties, Inc.: | | | |
Series A, 8.625% | 214 | | 217,210 |
Series B, 8.00% | 8,266 | | 208,221 |
Home Properties of New York, Inc. Series F, 9.00% | 5,000 | | 128,400 |
HomeBanc Mortgage Corp., Georgia Series A, 10.00% | 107,485 | | 2,751,616 |
Host Hotels & Resorts, Inc. Series E, 8.875% | 50,000 | | 1,350,000 |
HRPT Properties Trust Series B, 8.75% | 41,200 | | 1,064,196 |
Impac Mortgage Holdings, Inc. Series C, 9.125% | 97,500 | | 2,369,250 |
Innkeepers USA Trust Series C, 8.00% | 42,400 | | 1,066,360 |
LaSalle Hotel Properties: | | | |
Series A, 10.25% | 208,200 | | 5,454,840 |
Series B, 8.375% | 19,400 | | 510,220 |
LBA Realty Fund II: | | | |
Series A, 8.75% (a)(c) | 69,000 | | 2,794,500 |
Series B, 7.625% (a) | 24,800 | | 483,600 |
Lexington Corporate Properties Trust Series B, 8.05% | 74,500 | | 1,873,675 |
MFA Mortgage Investments, Inc. Series A, 8.50% | 229,400 | | 5,560,656 |
Mid-America Apartment Communities, Inc. Series H, 8.30% | 27,800 | | 720,020 |
Nationwide Health Properties, Inc. 7.677% | 36,939 | | 3,730,839 |
New Plan Excel Realty Trust (depositary shares) Series D, 7.80% | 42,106 | | 2,136,880 |
Newcastle Investment Corp. Series B, 9.75% | 199,700 | | 5,212,170 |
Omega Healthcare Investors, Inc. Series D, 8.375% | 79,800 | | 2,054,052 |
Parkway Properties, Inc. Series D, 8.00% | 40,000 | | 1,042,000 |
Prime Group Realty Trust Series B, 9.00% | 60,000 | | 990,600 |
ProLogis Trust Series C, 8.54% | 6,478 | | 361,553 |
PS Business Parks, Inc. (depositary shares) Series F, 8.75% | 21,500 | | 545,670 |
Preferred Stocks - continued |
| Shares | | Value
(Note 1) |
Nonconvertible Preferred Stocks - continued |
FINANCIALS - continued |
Real Estate Investment Trusts - continued |
RAIT Investment Trust: | | | |
Series A, 7.75% | 44,200 | | $ 1,078,480 |
Series B, 8.375% | 81,300 | | 2,060,955 |
Realty Income Corp. 8.25% | 76,800 | | 2,021,376 |
Saul Centers, Inc. 8.00% | 119,500 | | 3,089,075 |
Simon Property Group, Inc.: | | | |
Series G, 7.89% | 29,600 | | 1,503,680 |
Series J, 8.375% | 16,100 | | 945,875 |
Strategic Hotel & Resorts, Inc. 8.50% (c) | 119,500 | | 3,047,250 |
The Mills Corp.: | | | |
Series B, 9.00% | 46,400 | | 1,055,600 |
Series C, 9.00% | 157,300 | | 3,616,327 |
Series E, 8.75% | 151,020 | | 3,449,297 |
Series G, 7.875% | 20,767 | | 454,797 |
United Dominion Realty Trust, Inc. Series B, 8.60% | 12,500 | | 321,875 |
Winston Hotels, Inc. Series B, 8.00% | 35,600 | | 888,220 |
| | 121,722,217 |
Real Estate Management & Development - 0.4% |
Affordable Residential Communties, Inc. Series A, 8.25% | 83,000 | | 1,979,550 |
Thrifts & Mortgage Finance - 0.7% |
Fannie Mae 7.00% | 20,000 | | 1,079,000 |
MFH Financial Trust I 9.50% (a)(c) | 22,660 | | 2,316,985 |
| | 3,395,985 |
TOTAL FINANCIALS | | 129,998,127 |
TOTAL NONCONVERTIBLE PREFERRED STOCKS | | 130,119,807 |
TOTAL PREFERRED STOCKS (Cost $143,635,475) | 141,683,164 |
Corporate Bonds - 26.0% |
| Principal Amount | | Value
(Note 1) |
Convertible Bonds - 1.2% |
FINANCIALS - 1.2% |
Real Estate Investment Trusts - 1.0% |
American Financial Realty Trust 4.375% 7/15/24 | | $ 4,750,000 | | $ 4,417,025 |
Essex Portfolio LP 3.625% 11/1/25 (c) | | 400,000 | | 477,080 |
| | 4,894,105 |
Real Estate Management & Development - 0.2% |
Affordable Resources Communities LP 7.5% 8/15/25 (c) | | 1,000,000 | | 1,040,060 |
TOTAL FINANCIALS | | 5,934,165 |
Nonconvertible Bonds - 24.8% |
CONSUMER DISCRETIONARY - 3.4% |
Hotels, Restaurants & Leisure - 0.7% |
Felcor Lodging LP 9% 6/1/11 (e) | | 1,500,000 | | 1,575,000 |
Host Marriott LP 7% 8/15/12 | | 1,000,000 | | 1,000,000 |
Landry's Seafood Restaurants, Inc. 7.5% 12/15/14 | | 1,000,000 | | 925,000 |
| | 3,500,000 |
Household Durables - 2.7% |
Beazer Homes USA, Inc. 8.375% 4/15/12 | | 1,000,000 | | 980,000 |
D.R. Horton, Inc. 4.875% 1/15/10 | | 1,000,000 | | 957,500 |
K. Hovnanian Enterprises, Inc.: | | | | |
6% 1/15/10 | | 420,000 | | 387,450 |
6.25% 1/15/16 | | 1,000,000 | | 865,000 |
7.75% 5/15/13 | | 2,500,000 | | 2,262,500 |
KB Home: | | | | |
5.875% 1/15/15 | | 1,000,000 | | 862,200 |
6.25% 6/15/15 | | 100,000 | | 87,932 |
7.75% 2/1/10 | | 1,500,000 | | 1,488,750 |
Kimball Hill, Inc. 10.5% 12/15/12 | | 600,000 | | 543,000 |
Standard Pacific Corp.: | | | | |
6.5% 8/15/10 | | 500,000 | | 462,500 |
9.25% 4/15/12 | | 1,500,000 | | 1,425,000 |
Stanley-Martin Communities LLC 9.75% 8/15/15 | | 2,020,000 | | 1,585,700 |
Technical Olympic USA, Inc. 7.5% 3/15/11 | | 200,000 | | 165,000 |
WCI Communities, Inc. 9.125% 5/1/12 | | 2,250,000 | | 2,019,375 |
| | 14,091,907 |
TOTAL CONSUMER DISCRETIONARY | | 17,591,907 |
Corporate Bonds - continued |
| Principal Amount | | Value
(Note 1) |
Nonconvertible Bonds - continued |
CONSUMER STAPLES - 0.3% |
Food & Staples Retailing - 0.3% |
Ahold Lease Series 2001 A1 pass thru trust certificates 7.82% 1/2/20 | | $ 1,433,258 | | $ 1,461,923 |
FINANCIALS - 20.6% |
Real Estate Investment Trusts - 16.6% |
American Health Properties, Inc. 7.5% 1/15/07 | | 1,000,000 | | 1,008,578 |
Archstone-Smith Trust 5% 8/15/07 | | 300,000 | | 297,900 |
Arden Realty LP: | | | | |
5.2% 9/1/11 | | 740,000 | | 730,036 |
5.25% 3/1/15 | | 400,000 | | 386,871 |
7% 11/15/07 | | 1,000,000 | | 1,018,523 |
8.5% 11/15/10 | | 1,000,000 | | 1,111,390 |
Bay Apartment Communities, Inc. 6.625% 1/15/08 | | 840,000 | | 849,681 |
Brandywine Operating Partnership LP 4.5% 11/1/09 | | 1,000,000 | | 960,381 |
Camden Property Trust: | | | | |
4.375% 1/15/10 | | 2,370,000 | | 2,281,049 |
7% 11/15/06 | | 943,000 | | 946,699 |
Colonial Properties Trust 7% 7/14/07 | | 3,450,000 | | 3,485,514 |
Commercial Net Lease Realty, Inc.: | | | | |
6.15% 12/15/15 | | 100,000 | | 97,726 |
6.25% 6/15/14 | | 500,000 | | 496,251 |
Crescent Real Estate Equities LP 7.5% 9/15/07 (e) | | 1,500,000 | | 1,513,125 |
Crescent Real Estate Equities LP/Crescent Finance Co. 9.25% 4/15/09 | | 2,500,000 | | 2,562,500 |
Developers Diversified Realty Corp.: | | | | |
5% 5/3/10 | | 1,000,000 | | 975,622 |
6.625% 1/15/08 | | 550,000 | | 556,754 |
7.5% 7/15/18 | | 200,000 | | 216,841 |
Duke Realty LP: | | | | |
5.25% 1/15/10 | | 200,000 | | 196,425 |
6.8% 2/12/09 | | 1,500,000 | | 1,538,403 |
Evans Withycombe Residential LP 7.625% 4/15/07 | | 1,675,000 | | 1,690,361 |
Federal Realty Investment Trust 6.125% 11/15/07 | | 1,200,000 | | 1,204,018 |
Health Care REIT, Inc.: | | | | |
6% 11/15/13 | | 1,000,000 | | 977,421 |
7.5% 8/15/07 | | 450,000 | | 453,307 |
8% 9/12/12 | | 2,450,000 | | 2,662,912 |
Healthcare Realty Trust, Inc. 8.125% 5/1/11 | | 1,790,000 | | 1,933,123 |
Heritage Property Investment Trust, Inc. 4.5% 10/15/09 | | 1,500,000 | | 1,449,180 |
Corporate Bonds - continued |
| Principal Amount | | Value
(Note 1) |
Nonconvertible Bonds - continued |
FINANCIALS - continued |
Real Estate Investment Trusts - continued |
Highwoods/Forsyth LP: | | | | |
7% 12/1/06 | | $ 500,000 | | $ 501,277 |
7.125% 2/1/08 | | 950,000 | | 966,534 |
Hospitality Properties Trust 6.75% 2/15/13 | | 610,000 | | 630,963 |
HRPT Properties Trust: | | | | |
5.9406% 3/16/11 (e) | | 1,500,000 | | 1,501,521 |
6.5% 1/15/13 | | 200,000 | | 204,353 |
iStar Financial, Inc.: | | | | |
5.125% 4/1/11 | | 1,000,000 | | 966,760 |
5.9638% 3/16/09 (e) | | 500,000 | | 503,252 |
6.5% 12/15/13 | | 1,000,000 | | 996,250 |
7% 3/15/08 | | 1,800,000 | | 1,788,750 |
Liberty Property LP 7.25% 8/15/07 | | 1,500,000 | | 1,509,990 |
Mack-Cali Realty LP 7.25% 3/15/09 | | 100,000 | | 103,159 |
Nationwide Health Properties, Inc.: | | | | |
6% 5/20/15 | | 1,000,000 | | 966,781 |
7.23% 11/8/06 | | 300,000 | | 301,024 |
8.25% 7/1/12 | | 1,300,000 | | 1,398,870 |
Omega Healthcare Investors, Inc. 7% 4/1/14 | | 2,970,000 | | 2,858,625 |
Price Development Co. LP 7.29% 3/11/08 | | 1,100,000 | | 1,112,375 |
ProLogis Trust 7.1% 4/15/08 | | 775,000 | | 793,334 |
Reckson Operating Partnership LP 7.75% 3/15/09 | | 2,600,000 | | 2,724,036 |
Security Capital Industrial Trust 7.95% 5/15/08 | | 64,000 | | 65,035 |
Senior Housing Properties Trust: | | | | |
7.875% 4/15/15 | | 355,000 | | 358,550 |
8.625% 1/15/12 | | 2,500,000 | | 2,625,000 |
Shurgard Storage Centers, Inc.: | | | | |
5.875% 3/15/13 | | 1,000,000 | | 1,005,249 |
7.75% 2/22/11 | | 500,000 | | 535,795 |
Simon Property Group LP 5.375% 8/28/08 | | 550,000 | | 547,316 |
Tanger Properties LP 9.125% 2/15/08 | | 300,000 | | 312,750 |
The Rouse Co.: | | | | |
5.375% 11/26/13 | | 2,000,000 | | 1,828,078 |
7.2% 9/15/12 | | 3,220,000 | | 3,237,130 |
Thornburg Mortgage, Inc. 8% 5/15/13 | | 5,995,000 | | 5,860,108 |
Trustreet Properties, Inc. 7.5% 4/1/15 | | 3,500,000 | | 3,451,875 |
United Dominion Realty Trust 5% 1/15/12 | | 1,000,000 | | 956,044 |
United Dominion Realty Trust, Inc. 6.5% 6/15/09 | | 325,000 | | 335,633 |
Corporate Bonds - continued |
| Principal Amount | | Value
(Note 1) |
Nonconvertible Bonds - continued |
FINANCIALS - continued |
Real Estate Investment Trusts - continued |
Ventas Realty LP/Ventas Capital Corp.: | | | | |
6.5% 6/1/16 | | $ 1,730,000 | | $ 1,656,475 |
6.625% 10/15/14 | | 2,170,000 | | 2,115,750 |
6.75% 6/1/10 | | 2,100,000 | | 2,079,000 |
8.75% 5/1/09 | | 800,000 | | 840,000 |
9% 5/1/12 | | 3,261,000 | | 3,562,643 |
Vornado Realty LP 4.5% 8/15/09 | | 1,000,000 | | 966,982 |
Vornado Realty Trust 5.625% 6/15/07 | | 2,700,000 | | 2,692,594 |
| | 86,460,452 |
Real Estate Management & Development - 3.0% |
American Real Estate Partners/American Real Estate Finance Corp.: | | | | |
7.125% 2/15/13 | | 1,000,000 | | 977,500 |
8.125% 6/1/12 | | 3,190,000 | | 3,237,850 |
EOP Operating LP 6.1081% 10/1/10 (e) | | 3,000,000 | | 3,027,582 |
First Industrial LP: | | | | |
5.25% 6/15/09 | | 1,000,000 | | 983,721 |
7.375% 3/15/11 | | 2,100,000 | | 2,219,534 |
7.6% 5/15/07 | | 1,000,000 | | 1,013,241 |
Post Apartment Homes LP: | | | | |
5.125% 10/12/11 | | 1,500,000 | | 1,438,577 |
7.7% 12/20/10 | | 2,500,000 | | 2,666,405 |
| | 15,564,410 |
Thrifts & Mortgage Finance - 1.0% |
Saxon Capital, Inc. 12% 5/1/14 (c) | | 1,750,000 | | 1,758,750 |
Wrightwood Capital LLC 9% 6/1/14 (h) | | 4,000,000 | | 3,880,000 |
| | 5,638,750 |
TOTAL FINANCIALS | | 107,663,612 |
HEALTH CARE - 0.3% |
Health Care Providers & Services - 0.3% |
Extendicare Health Services, Inc. 6.875% 5/1/14 | | 1,500,000 | | 1,560,000 |
Corporate Bonds - continued |
| Principal Amount | | Value
(Note 1) |
Nonconvertible Bonds - continued |
TELECOMMUNICATION SERVICES - 0.2% |
Wireless Telecommunication Services - 0.2% |
American Tower Corp. 7.125% 10/15/12 | | $ 1,000,000 | | $ 1,007,500 |
TOTAL NONCONVERTIBLE BONDS | | 129,284,942 |
TOTAL CORPORATE BONDS (Cost $138,211,755) | 135,219,107 |
Asset-Backed Securities - 4.3% |
|
Ameriquest Mortgage Securities, Inc. Series 2004-R9 Class M9, 7.885% 10/25/34 (c)(e) | | 2,000,000 | | 1,899,999 |
Conseco Finance Securitizations Corp.: | | | | |
Series 2000-4 Class A4, 7.73% 4/1/31 | | 317,614 | | 281,427 |
Series 2002-2 Class M2, 9.163% 3/1/33 | | 500,000 | | 366,856 |
Crest Clarendon Street Ltd./Crest Clarendon Corp. Series 2002-1A Class D, 9% 12/28/35 (c) | | 500,000 | | 534,175 |
Crest Dartmouth Street Ltd./Crest Dartmouth Street Corp. Series 2003-1A Class D, 9% 6/28/38 (c) | | 850,000 | | 917,813 |
Crown Castle Towers LLC/Crown Atlantic Holdings Sub LLC/Crown Communication, Inc. Series 2005-1
Class D, 5.612% 6/15/35 (c) | | 2,000,000 | | 1,959,106 |
Diversified REIT Trust: | | | | |
Series 1999-1A Class H, 6.78% 3/18/11 (c)(e) | | 1,785,000 | | 1,696,494 |
Series 2000-1A Class G, 6.971% 3/8/10 (c) | | 1,720,000 | | 1,683,914 |
Fairfield Street Solar Corp. Series 2004-1A Class E1, 8.585% 11/28/39 (c)(e) | | 550,000 | | 555,896 |
Gramercy Real Estate CDO Ltd. Series 2005-1A Class H, 7.485% 7/25/35 (c)(e) | | 2,000,000 | | 2,010,580 |
Green Tree Financial Corp. Series 1996-4 Class M1, 7.75% 6/15/27 | | 1,788,179 | | 1,484,188 |
GSAMP Trust Series 2005-HE3 Class B3, 7.885% 6/25/35 (e) | | 1,259,000 | | 1,115,493 |
Guggenheim Structured Real Estate Funding Ltd./Guggenheim Structured Real Estate Funding LLC Series 2005-2A: | | | | |
Class D, 6.935% 8/26/30 (c)(e) | | 735,000 | | 737,058 |
Class E, 7.385% 8/26/30 (c)(e) | | 1,420,000 | | 1,429,514 |
Merit Securities Corp. Series 13 Class M1, 8.63% 12/28/33 | | 500,000 | | 440,000 |
Asset-Backed Securities - continued |
| Principal Amount | | Value
(Note 1) |
Park Place Securities NIMS Trust Series 2004-WCW1 Class NOTE, 5.65% 9/25/34 (c) | | $ 87,063 | | $ 86,628 |
Park Place Securities, Inc. Series 2004-WHQ2
Class M10, 7.885% 2/25/35 (c)(e) | | 1,500,000 | | 1,393,080 |
Resi Finance LP Series 2006-B Class B6, 7.0688% 6/15/38 (e) | | 999,342 | | 999,322 |
Taberna Preferred Funding III Ltd. Series 2005-3A
Class D, 7.8% 2/5/36 (c)(e) | | 3,000,000 | | 2,992,500 |
TOTAL ASSET-BACKED SECURITIES (Cost $22,793,543) | 22,584,043 |
Collateralized Mortgage Obligations - 3.2% |
|
Private Sponsor - 3.1% |
Countrywide Home Loans, Inc.: | | | | |
Series 2002-38 Class B3, 5% 2/25/18 (c) | | 203,955 | | 184,809 |
Series 2002-R2 Class 2B3, 5.5081% 7/25/33 (c)(e) | | 268,754 | | 175,546 |
Series 2003-40 Class B3, 4.5% 10/25/18 (c) | | 257,668 | | 222,500 |
Series 2003-R2 Class B3, 5.5% 5/25/43 (c) | | 582,062 | | 457,373 |
Series 2003-R3: | | | | |
Class B2, 5.5% 11/25/33 | | 1,840,246 | | 1,661,569 |
Class B3, 5.5% 11/25/33 (c) | | 551,029 | | 438,733 |
Series 2004-R1 Class 1B3, 5.5% 11/25/34 (c)(e) | | 620,805 | | 481,827 |
Diversified REIT Trust Series 2000-1A Class F, 6.971% 3/8/10 (c) | | 1,512,000 | | 1,515,417 |
Residential Finance LP/Residential Finance Development Corp. floater: | | | | |
Series 2002-A Class B10, 21.545% 10/10/34 (e) | | 540,484 | | 558,333 |
Series 2003-B Class B9, 17.295% 7/10/35 (c)(e) | | 945,916 | | 982,346 |
Series 2004-C Class B5, 6.695% 9/10/36 (e) | | 389,708 | | 392,814 |
Series 2005-A Class B6, 7.345% 3/10/37 (c)(e) | | 1,961,724 | | 1,971,173 |
Series 2005-B Class B6, 6.945% 6/10/37 (c)(e) | | 978,623 | | 978,742 |
Series 2005-D Class B6, 7.6188% 12/15/37 (c)(e) | | 494,417 | | 497,800 |
Residential Funding Mortgage Securities I, Inc. Series 2002-S20 Class M3, 5.25% 12/25/17 | | 83,039 | | 76,213 |
Residential Funding Securities Corp. Series 2002-RM1 Class BI1, 5.5% 12/25/17 (c) | | 172,701 | | 160,286 |
Resix Finance Ltd. floater: | | | | |
Series 2003-D Class B8, 11.845% 12/10/35 (c)(e) | | 714,231 | | 729,426 |
Series 2004-A Class B7, 9.595% 2/10/36 (c)(e) | | 675,839 | | 682,551 |
Series 2004-B Class B7, 9.345% 2/10/36 (c)(e) | | 812,239 | | 817,135 |
Collateralized Mortgage Obligations - continued |
| Principal Amount | | Value
(Note 1) |
Private Sponsor - continued |
Resix Finance Ltd. floater: - continued | | | | |
Series 2005-C Class B7, 8.445% 9/10/37 (c)(e) | | $ 1,977,212 | | $ 1,969,997 |
Series 2006-B Class B7, 9.2188% 7/15/38 (c)(e) | | 999,342 | | 999,322 |
TOTAL PRIVATE SPONSOR | | 15,953,912 |
U.S. Government Agency - 0.1% |
Fannie Mae REMIC Trust: | | | | |
Series 2003-W1 Subordinate REMIC Pass-Through Certificate, Class B3, 5.75% 12/25/42 | | 329,893 | | 271,084 |
Series 2003-W4 Subordinate REMIC Pass-Through Certificate, Class 2B3, 5.5246% 10/25/42 (c)(d) | | 82,667 | | 54,476 |
Series 2003-W10 Subordinate REMIC Pass-Through Certificate, Class 2B3, 5.3238% 6/25/43 (d) | | 192,377 | | 122,635 |
Series 2001-W3 Subordinate REMIC Pass-Through Certificate, Class B3, 7% 9/25/41 | | 286,795 | | 252,483 |
Series 2002-W1 Subordinate REMIC Pass-Through Certificate, Class 3B3, 5.2957% 2/25/42 (c)(d) | | 167,247 | | 111,774 |
TOTAL U.S. GOVERNMENT AGENCY | | 812,452 |
TOTAL COLLATERALIZED MORTGAGE OBLIGATIONS (Cost $16,818,118) | 16,766,364 |
Commercial Mortgage Securities - 8.9% |
|
Asset Securitization Corp. Series 1997-D4 Class B2, 7.525% 4/14/29 | | 515,000 | | 557,968 |
Banc of America Commercial Mortgage, Inc. Series 2003-2: | | | | |
Class BWD, 6.947% 10/11/37 (c) | | 425,409 | | 416,271 |
Class BWE, 7.226% 10/11/37 (c) | | 576,361 | | 563,810 |
Class BWF, 7.55% 10/11/37 (c) | | 508,726 | | 498,714 |
Class BWG, 8.155% 10/11/37 (c) | | 493,043 | | 479,490 |
Class BWH, 9.073% 10/11/37 (c) | | 258,774 | | 255,663 |
Class BWJ, 9.99% 10/11/37 (c) | | 425,409 | | 419,703 |
Class BWK, 10.676% 10/11/37 (c) | | 334,250 | | 331,703 |
Class BWL, 10.1596% 10/11/37 (c) | | 563,618 | | 521,046 |
Banc of America Large Loan, Inc. floater: | | | | |
Series 2005-BOCA Class M, 7.4688% 12/15/16 (c)(e) | | 1,790,000 | | 1,783,956 |
Series 2005-ESHA Class K, 7.1588% 7/14/08 (c)(e) | | 3,000,000 | | 3,011,009 |
Series 2005-MIB1 Class K, 7.3688% 3/15/22 (c)(e) | | 700,000 | | 689,280 |
Commercial Mortgage Securities - continued |
| Principal Amount | | Value
(Note 1) |
Capital Trust RE CDO Ltd. floater Series 2005-1A
Class D, 6.8781% 3/20/50 (c)(e) | | $ 2,250,000 | | $ 2,251,575 |
CS First Boston Mortgage Securities Corp.: | | | | |
Series 2004-FL1A Class G, 7.947% 5/15/14 (c)(e) | | 1,739,397 | | 1,743,187 |
Series 2004-TF2A Class AX, 1.3983% 11/15/19 (c)(e)(g) | | 21,744,220 | | 95,675 |
Series 2004-TFLA Class AX, 0.9157% 2/15/14 (c)(e)(g) | | 13,543,865 | | 10,835 |
EQI Financing Partnership I LP Series 1997-1 Class C, 7.58% 2/20/17 (c) | | 2,500,000 | | 2,498,842 |
First Chicago/Lennar Trust I: | | | | |
Series 1997-CHL1 Class E, 7.6364% 4/29/39 (c)(e) | | 3,500,000 | | 3,550,313 |
weighted average coupon Series 1997-CHL1 Class D, 7.6364% 4/29/39 (c)(e) | | 371,623 | | 371,506 |
Global Signal Trust III Series 2006-1 Class F, 7.036% 2/15/36 (c) | | 1,015,000 | | 1,023,089 |
GMAC Commercial Mortgage Securities, Inc.
Series 1997-C2 Class F, 6.75% 4/15/29 (e) | | 2,767,000 | | 2,362,326 |
J.P. Morgan Commercial Mortgage Finance Corp.: | | | | |
Series 1997-C5 Class F, 7.5605% 9/15/29 | | 2,000,000 | | 2,169,007 |
Series 1999-C7 Class F, 6% 10/15/35 (c) | | 350,000 | | 346,691 |
Series 1999-C8: | | | | |
Class G, 6% 7/15/31 (c) | | 1,385,000 | | 1,367,688 |
Class H, 6% 7/15/31 (c) | | 2,638,000 | | 2,380,795 |
Series 2000-C9 Class G, 6.25% 10/15/32 (c) | | 2,425,000 | | 2,395,900 |
JPMorgan Chase Commercial Mortgage Securities Corp. Series 2001-A: | | | | |
Class G, 6% 10/15/32 (c)(e) | | 2,895,000 | | 2,265,338 |
Class X, 1.8844% 10/15/32 (c)(e)(g) | | 19,903,244 | | 556,296 |
Merrill Lynch Financial Asset, Inc. Series 2005-CA16: | | | | |
Class F, 4.384% 7/12/15 | CAD | 710,000 | | 535,901 |
Class G, 4.384% 7/12/15 | CAD | 355,000 | | 258,724 |
Class H, 4.384% 7/12/15 | CAD | 236,000 | | 150,395 |
Class J, 4.384% 7/12/15 | CAD | 355,000 | | 208,043 |
Class K, 4.384% 7/12/15 | CAD | 355,000 | | 194,782 |
Class L, 4.384% 7/12/15 | CAD | 236,000 | | 121,363 |
Class M, 4.384% 7/12/15 | CAD | 995,000 | | 341,507 |
Merrill Lynch Mortgage Investors, Inc.: | | | | |
Series 1999-C1 Class G, 6.71% 11/15/31 (c) | | 3,359,000 | | 2,748,703 |
Series 2001-HRPA Class G, 6.778% 2/3/16 (c) | | 820,000 | | 831,123 |
Mezz Capital Commercial Mortgage Trust Series 2004-C1: | | | | |
Class D, 6.988% 9/15/13 | | 750,000 | | 744,371 |
Class E, 7.983% 10/15/13 | | 1,453,000 | | 1,478,143 |
Commercial Mortgage Securities - continued |
| Principal Amount | | Value
(Note 1) |
Mezz Capital Commercial Mortgage Trust Series 2004-C1: - continued | | | | |
Class X, 8.0502% 1/15/18 (e)(g) | | $ 7,161,989 | | $ 2,588,108 |
Morgan Stanley Capital I, Inc.: | | | | |
Series 1997-C1 Class F, 6.85% 2/15/20 (c) | | 500,000 | | 499,913 |
Series 1997-HF1 Class G, 6.86% 7/15/29 (c) | | 555,000 | | 557,103 |
Wrightwood Capital Real Estate CDO Ltd. floater Series 2005-1A Class F, 7.1394% 11/21/40 (c)(e) | | 250,000 | | 251,893 |
TOTAL COMMERCIAL MORTGAGE SECURITIES (Cost $46,540,913) | 46,427,748 |
Floating Rate Loans - 1.9% |
|
CONSUMER DISCRETIONARY - 0.5% |
Specialty Retail - 0.5% |
Toys 'R' US, Inc. term loan 8.3463% 12/9/08 (d)(e) | | 2,600,000 | | 2,583,750 |
FINANCIALS - 1.3% |
Diversified Financial Services - 0.4% |
Landsource Communication Development LLC Tranche B, term loan 7.875% 3/31/10 (e) | | 2,200,000 | | 2,200,000 |
Real Estate Investment Trusts - 0.7% |
Apartment Investment & Management Co. term loan 7.0106% 3/22/11 (e) | | 2,200,000 | | 2,205,500 |
Capital Automotive (REIT) Tranche B, term loan 7.1% 12/16/10 (e) | | 97,679 | | 97,801 |
General Growth Properties, Inc. Tranche A1, term loan 6.65% 2/24/10 (e) | | 1,000,000 | | 986,250 |
Lion Gables Realty LP term loan 7.1% 9/30/06 (e) | | 264,376 | | 264,046 |
Newkirk Master LP Tranche B, term loan 7.0963% 8/11/08 (e) | | 84,560 | | 84,454 |
| | 3,638,051 |
Real Estate Management & Development - 0.2% |
MDS Realty Holdings LLC Tranche M3, term loan 8.8344% 1/8/08 (e) | | 459,884 | | 459,884 |
Shea Mountain House LLC Tranche B, term loan 7.09% 5/11/11 (e) | | 349,125 | | 346,507 |
| | 806,391 |
TOTAL FINANCIALS | | 6,644,442 |
Floating Rate Loans - continued |
| Principal Amount | | Value
(Note 1) |
TELECOMMUNICATION SERVICES - 0.1% |
Wireless Telecommunication Services - 0.1% |
Crown Castle Operating Co. Tranche B, term loan 7.65% 6/1/14 (e) | | $ 840,000 | | $ 844,200 |
TOTAL FLOATING RATE LOANS (Cost $10,099,528) | 10,072,392 |
Preferred Securities - 1.0% |
| | | |
FINANCIALS - 1.0% |
Diversified Financial Services - 1.0% |
Crest Clarendon Street 2002-1 Ltd. Series 2002-1A Class PS, 11.6458% 12/28/35 (c)(e) | 500,000 | | 548,485 |
Crest Dartmouth Street 2003 1 Ltd. Series 2003-1A Class PS, 25.5535% 6/28/38 (c)(e) | 590,000 | | 701,971 |
Harp High Grade CDO I Ltd. Series 2006-1, 15.49% 7/8/46 (c)(e) | 810,000 | | 785,700 |
Ipswich Street CDO Series 2006-1, 15.15% 6/27/46 (c)(e) | 1,350,000 | | 1,304,775 |
Wachovia Ltd./Wachovia Llc Series 2006-1 Class 1Ml, 7.5081% 9/25/26 (c)(e) | 2,000,000 | | 2,000,000 |
| | 5,340,931 |
TOTAL PREFERRED SECURITIES (Cost $5,271,702) | 5,340,931 |
Fixed-Income Funds - 3.9% |
| Shares | | |
Fidelity Ultra-Short Central Fund (f)
(Cost $19,995,490) | 200,884 | | 19,983,940 |
Money Market Funds - 4.4% |
| Shares | | Value
(Note 1) |
Fidelity Cash Central Fund, 5.3% (b)
(Cost $23,016,748) | 23,016,748 | | $ 23,016,748 |
TOTAL INVESTMENT PORTFOLIO - 99.2% (Cost $507,518,035) | | 517,124,338 |
NET OTHER ASSETS - 0.8% | | 4,140,351 |
NET ASSETS - 100% | $ 521,264,689 |
Currency Abbreviations |
CAD | - | Canadian dollar |
Legend |
(a) Non-income producing |
(b) Affiliated fund that is available only to investment companies and other accounts managed by Fidelity Investments. The rate quoted is the annualized seven-day yield of the fund at period end. A complete unaudited listing of the fund's holdings as of its most recent quarter end is available upon request. |
(c) Security exempt from registration under Rule 144A of the Securities Act of 1933. These securities may be resold in transactions exempt from registration, normally to qualified institutional buyers. At the period end, the value of these securities amounted to $85,789,161 or 16.5% of net assets. |
(d) Security or a portion of the security purchased on a delayed delivery or when-issued basis. |
(e) The coupon rate shown on floating or adjustable rate securities represents the rate at period end. |
(f) Affiliated fund that is available only to investment companies and other accounts managed by Fidelity Investments. A complete unaudited list of holdings for each fixed-income central fund, as of the investing fund's report date, is available upon request or at fidelity.com. The reports are located just after the fund's financial statements and quarterly reports but are not part of the financial statements or quarterly reports. In addition, the fixed-income central fund's financial statements, which are not covered by the investing fund's Report of Independent Registered Public Accounting Firm, are available on the EDGAR Database on the SEC's web site, www.sec.gov, or upon request. |
(g) Security represents right to receive monthly interest payments on an underlying pool of mortgages. Principal shown is the par amount of the mortgage pool. |
(h) Restricted securities - Investment in securities not registered under the Securities Act of 1933 (excluding 144A issues). At the end of the period, the value of restricted securities (excluding 144A issues) amounted to $3,880,000 or 0.7% of net assets. |
Additional information on each holding is as follows: |
Security | Acquisition Date | Acquisition Cost |
Wrightwood Capital LLC 9% 6/1/14 | 1/1/05 | $ 4,000,000 |
Affiliated Central Funds |
Information regarding fiscal year to date income earned by the fund from the affiliated Central funds is as follows: |
Fund | Income earned |
Fidelity Cash Central Fund | $ 935,227 |
Fidelity Ultra-Short Central Fund | 1,108,067 |
Total | $ 2,043,294 |
|
Additional information regarding the fund's fiscal year to date purchases and sales, including the ownership percentage, of the following fixed income Central Funds is as follows: |
Fund | Value, beginning of period | Purchases | Sales Proceeds | Value, end of period | % ownership, end of period |
Fidelity Ultra-Short Central Fund | $ 24,983,905 | $ - | $ 4,999,462 | $ 19,983,940 | 0.3% |
Other Information |
The composition of credit quality ratings as a percentage of net assets is as follows (ratings are unaudited): |
U.S.Government and U.S.Government Agency Obligations | 0.4% |
AAA,AA,A | 3.0% |
BBB | 16.5% |
BB | 15.9% |
B | 6.4% |
CCC,CC,C | 0.1% |
Not Rated | 5.7% |
Equities | 45.6% |
Short-Term Investments and Net Other Assets | 6.4% |
| 100.0% |
We have used ratings from Moody's® Investors Services, Inc. Where Moody's ratings are not available, we have used S&P® ratings. |
The information in the above tables is based on the combined investments of the fund and its pro-rata share of the investments of Fidelity's fixed-income central fund. |
See accompanying notes which are an integral part of the financial statements.
Annual Report
Financial Statements
Statement of Assets and Liabilities
| July 31, 2006 |
| | |
Assets | | |
Investment in securities, at value -
See accompanying schedule: Unaffiliated issuers (cost $464,505,797) | $ 474,123,650 | |
Affiliated Central Funds (cost $43,012,238) | 43,000,688 | |
Total Investments (cost $507,518,035) | | $ 517,124,338 |
Cash | | 1,016,487 |
Receivable for investments sold | | 478,632 |
Receivable for fund shares sold | | 1,338,448 |
Dividends receivable | | 705,123 |
Interest receivable | | 3,233,958 |
Prepaid expenses | | 999 |
Other receivables | | 3,889 |
Total assets | | 523,901,874 |
| | |
Liabilities | | |
Payable for investments purchased
Regular delivery | $ 1,011,130 | |
Delayed delivery | 99,750 | |
Payable for fund shares redeemed | 1,101,036 | |
Accrued management fee | 244,254 | |
Other affiliated payables | 113,885 | |
Other payables and accrued expenses | 67,130 | |
Total liabilities | | 2,637,185 |
| | |
Net Assets | | $ 521,264,689 |
Net Assets consist of: | | |
Paid in capital | | $ 491,225,096 |
Undistributed net investment income | | 6,570,783 |
Accumulated undistributed net realized gain (loss) on investments and foreign currency transactions | | 13,862,544 |
Net unrealized appreciation (depreciation) on investments and assets and liabilities in foreign currencies | | 9,606,266 |
Net Assets, for 44,233,090 shares outstanding | | $ 521,264,689 |
Net Asset Value, offering price and redemption price per share ($521,264,689 ÷ 44,233,090 shares) | | $ 11.78 |
See accompanying notes which are an integral part of the financial statements.
Annual Report
Financial Statements - continued
Statement of Operations
| Year ended July 31, 2006 |
| | |
Investment Income | | |
Dividends | | $ 16,132,776 |
Interest | | 19,817,867 |
Income from affiliated Central Funds | | 2,043,294 |
Total income | | 37,993,937 |
| | |
Expenses | | |
Management fee | $ 3,336,430 | |
Transfer agent fees | 1,237,165 | |
Accounting fees and expenses | 267,348 | |
Independent trustees' compensation | 2,445 | |
Custodian fees and expenses | 18,402 | |
Registration fees | 40,003 | |
Audit | 75,834 | |
Legal | 9,965 | |
Miscellaneous | 33,743 | |
Total expenses before reductions | 5,021,335 | |
Expense reductions | (28,822) | 4,992,513 |
Net investment income (loss) | | 33,001,424 |
Realized and Unrealized Gain (Loss) Net realized gain (loss) on: | | |
Investment securities: | | |
Unaffiliated issuers | 19,669,643 | |
Affiliated Central Funds | (5,025) | |
Foreign currency transactions | 4,736 | |
Total net realized gain (loss) | | 19,669,354 |
Change in net unrealized appreciation (depreciation) on: Investment securities | (26,604,553) | |
Assets and liabilities in foreign currencies | (20) | |
Total change in net unrealized appreciation (depreciation) | | (26,604,573) |
Net gain (loss) | | (6,935,219) |
Net increase (decrease) in net assets resulting from operations | | $ 26,066,205 |
See accompanying notes which are an integral part of the financial statements.
Annual Report
Statement of Changes in Net Assets
| Year ended
July 31,
2006 | Year ended
July 31,
2005 |
Increase (Decrease) in Net Assets | | |
Operations | | |
Net investment income (loss) | $ 33,001,424 | $ 29,546,754 |
Net realized gain (loss) | 19,669,354 | 10,712,768 |
Change in net unrealized appreciation (depreciation) | (26,604,573) | 27,324,066 |
Net increase (decrease) in net assets resulting
from operations | 26,066,205 | 67,583,588 |
Distributions to shareholders from net investment income | (33,588,262) | (26,821,897) |
Distributions to shareholders from net realized gain | (14,457,481) | (7,090,927) |
Total distributions | (48,045,743) | (33,912,824) |
Share transactions
Proceeds from sales of shares | 146,568,380 | 342,677,417 |
Reinvestment of distributions | 41,687,679 | 29,547,608 |
Cost of shares redeemed | (312,491,302) | (161,193,200) |
Net increase (decrease) in net assets resulting from share transactions | (124,235,243) | 211,031,825 |
Redemption fees | 76,862 | 148,704 |
Total increase (decrease) in net assets | (146,137,919) | 244,851,293 |
| | |
Net Assets | | |
Beginning of period | 667,402,608 | 422,551,315 |
End of period (including undistributed net investment income of $6,570,783 and undistributed net investment income of $6,241,480, respectively) | $ 521,264,689 | $ 667,402,608 |
Other Information Shares | | |
Sold | 12,465,060 | 29,225,235 |
Issued in reinvestment of distributions | 3,575,296 | 2,535,568 |
Redeemed | (26,652,681) | (13,702,129) |
Net increase (decrease) | (10,612,325) | 18,058,674 |
See accompanying notes which are an integral part of the financial statements.
Annual Report
Financial Highlights
Years ended July 31, | 2006 | 2005 | 2004 | 2003 G |
Selected Per-Share Data | | | | |
Net asset value, beginning of period | $ 12.17 | $ 11.49 | $ 10.91 | $ 10.00 |
Income from Investment Operations | | | | |
Net investment income (loss) D | .66 | .60 | .59 | .27 |
Net realized and unrealized gain (loss) | (.11) | .83 | .60 | .71 |
Total from investment operations | .55 | 1.43 | 1.19 | .98 |
Distributions from net investment income | (.67) | (.57) | (.55) | (.07) |
Distributions from net realized gain | (.27) | (.18) | (.07) | - |
Total distributions | (.94) | (.75) | (.62) | (.07) |
Redemption fees added to paid in capital D | - I | - I | .01 | - I |
Net asset value, end of period | $ 11.78 | $ 12.17 | $ 11.49 | $ 10.91 |
Total Return B, C | 4.82% | 12.90% | 11.31% | 9.83% |
Ratios to Average Net Assets E, H | | | | |
Expenses before reductions | .85% | .85% | .85% | .97% A |
Expenses net of fee waivers, if any | .85% | .85% | .85% | .97% A |
Expenses net of all reductions | .85% | .85% | .85% | .94% A |
Net investment income (loss) | 5.61% | 5.13% | 5.25% | 5.10% A |
Supplemental Data | | | | |
Net assets, end of period (000 omitted) | $ 521,265 | $ 667,403 | $ 422,551 | $ 228,545 |
Portfolio turnover rate F | 27% | 30% | 61% | 41% A |
A Annualized
B Total returns for periods of less than one year are not annualized.
C Total returns would have been lower had certain expenses not been reduced during the periods shown.
D Calculated based on average shares outstanding during the period.
E Amounts do not include the activity of the affiliated central funds.
F Amounts do not include the portfolio activity of the affiliated central funds.
G For the period February 4, 2003 (commencement of operations) to July 31, 2003.
H Expense ratios reflect operating expenses of the Fund. Expenses before reductions do not reflect amounts reimbursed by the investment adviser or reductions from brokerage service arrangements or other expense offset arrangements and do not represent the amount paid by the Fund during periods when reimbursements or reductions occur. Expense ratios before reductions for start-up periods may not be representative of longer term operating periods. Expenses net of fee waivers reflect expenses after reimbursement by the investment adviser but prior to reductions from brokerage service arrangements or other expense offset arrangements. Expenses net of all reductions represent the net expenses paid by the Fund.
I Amount represents less than $.01 per share.
See accompanying notes which are an integral part of the financial statements.
Annual Report
Notes to Financial Statements
For the period ended July 31, 2006
1. Significant Accounting Policies.
Fidelity Real Estate Income Fund (the Fund) is a non-diversified fund of Fidelity Securities Fund (the trust) and is authorized to issue an unlimited number of shares. The trust is registered under the Investment Company Act of 1940, as amended (the 1940 Act), as an open-end management investment company organized as a Massachusetts business trust. The Fund may invest in Fidelity Central Funds, which are open end investment companies available to investment companies and other accounts managed by Fidelity Management & Research Company (FMR) and its affiliates. The financial statements have been prepared in conformity with accounting principles generally accepted in the United States of America, which require management to make certain estimates and assumptions at the date of the financial statements. The following summarizes the significant accounting policies of the Fund, which are also consistently followed by the Central Funds:
Security Valuation. Investments are valued and net asset value (NAV) per share is calculated (NAV calculation) as of the close of business of the New York Stock Exchange (NYSE), normally 4:00 p.m. Eastern time. Wherever possible, the Fund uses independent pricing services approved by the Board of Trustees to value its investments.
Equity securities, including restricted securities, for which market quotations are readily available, are valued at the last reported sale price or official closing price as reported by an independent pricing service on the primary market or exchange on which they are traded. In the event there were no sales during the day or closing prices are not available, securities are valued at the last quoted bid price. Debt securities, including restricted securities, for which quotations are readily available, are valued by independent pricing services or by dealers who make markets in such securities. Pricing services consider yield or price of bonds of comparable quality, coupon, maturity and type as well as dealer supplied prices. Investments in open-end mutual funds, including the Central Funds, are valued at their closing net asset value each business day. Short-term securities with remaining maturities of sixty days or less for which quotations are not readily available are valued at amortized cost, which approximates value.
When current market prices or quotations are not readily available or do not accurately reflect fair value, valuations may be determined in accordance with procedures adopted by the Board of Trustees. For example, when developments occur between the close of a market and the close of the NYSE that may materially affect the value of some or all of the securities, or when trading in a security is halted, those securities may be fair valued. Factors used in the determination of fair value may include monitoring news to identify significant market or security specific events such as changes in the value of U.S.
Annual Report
Notes to Financial Statements - continued
1. Significant Accounting Policies - continued
Security Valuation - continued
securities markets, reviewing developments in foreign markets and evaluating the performance of ADRs, futures contracts and exchange-traded funds. Because the Fund's utilization of fair value pricing depends on market activity, the frequency with which fair value pricing is used can not be predicted and may be utilized to a significant extent. The value of securities used for NAV calculation under fair value pricing may differ from published prices for the same securities.
Foreign Currency. The Fund uses foreign currency contracts to facilitate transactions in foreign-denominated securities. Losses from these transactions may arise from changes in the value of the foreign currency or if the counterparties do not perform under the contracts' terms.
Foreign-denominated assets, including investment securities, and liabilities are translated into U.S. dollars at the exchange rate at period end. Purchases and sales of investment securities, income and dividends received and expenses denominated in foreign currencies are translated into U.S. dollars at the exchange rate in effect on the transaction date.
The effects of exchange rate fluctuations on investments are included with the net realized and unrealized gain (loss) on investment securities. Other foreign currency transactions resulting in realized and unrealized gain (loss) are disclosed separately.
Investment Transactions and Income. Security transactions, including the Fund's investment activity in the Central Funds, are accounted for as of trade date. Gains and losses on securities sold are determined on the basis of identified cost. Dividend income is recorded on the ex-dividend date, except for certain dividends from foreign securities where the ex-dividend date may have passed, which are recorded as soon as the Fund is informed of the ex-dividend date. Non-cash dividends included in dividend income, if any, are recorded at the fair market value of the securities received. Distributions received on securities that represent a return of capital or capital gain are recorded as a reduction of cost of investments and/or as a realized gain. The Fund estimates the components of distributions received that may be considered return of capital distributions or capital gain distributions. Interest income and distributions from the Central Funds are accrued as earned. Interest income includes coupon interest and amortization of premium and accretion of discount on debt securities. The Fund follows the provisions of Emerging Issues Task Force Issue No. 99-20 (EITF 99-20), "Recognition of Interest Income and Impairment on Purchased and Retained Beneficial Interests in Securitized Financial Assets" for certain lower credit quality securitized assets that have contractual cash flows (for example, asset backed securities, collateralized mortgage obligations and commercial mortgage-backed securities). Under EITF 99-20, if there is a change in the
Annual Report
1. Significant Accounting Policies - continued
Investment Transactions and Income - continued
estimated cash flows for any of these securities, based on an evaluation of current information, then the estimated yield is adjusted on a prospective basis over the remaining life of the security. Investment income is recorded net of foreign taxes withheld where recovery of such taxes is uncertain.
Expenses. Most expenses of the trust can be directly attributed to a fund. Expenses which cannot be directly attributed are apportioned among each fund in the trust. Expense estimates are accrued in the period to which they relate and adjustments are made when actual amounts are known.
Income Tax Information and Distributions to Shareholders. Each year, the Fund intends to qualify as a regulated investment company by distributing all of its taxable income and realized gains under Subchapter M of the Internal Revenue Code. As a result, no provision for income taxes is required in the accompanying financial statements. Foreign taxes are provided for based on the Fund's understanding of the tax rules and rates that exist in the foreign markets in which it invests.
Distributions are recorded on the ex-dividend date. Income and capital gain distributions are determined in accordance with income tax regulations, which may differ from generally accepted accounting principles. In addition, the Fund will claim a portion of the payment made to redeeming shareholders as a distribution for income tax purposes.
Capital accounts within the financial statements are adjusted for permanent book-tax differences. These adjustments have no impact on net assets or the results of operations. Temporary book-tax differences will reverse in a subsequent period.
Book-tax differences are primarily due to foreign currency transactions, passive foreign investment companies (PFIC), market discount and losses deferred due to wash sales.
The tax-basis components of distributable earnings and the federal tax cost as of period end were as follows:
Unrealized appreciation | $ 22,582,414 | |
Unrealized depreciation | (12,766,519) | |
Net unrealized appreciation (depreciation) | 9,815,895 | |
Undistributed ordinary income | 6,099,013 | |
Undistributed long-term capital gain | 9,971,264 | |
| | |
Cost for federal income tax purposes | $ 507,308,443 | |
Annual Report
Notes to Financial Statements - continued
1. Significant Accounting Policies - continued
Income Tax Information and Distributions to Shareholders - continued
The tax character of distributions paid was as follows:
| July 31, 2006 | July 31, 2005 |
Ordinary Income | $ 35,223,101 | $ 28,735,912 |
Long-term Capital Gains | 12,822,642 | 5,176,912 |
Total | $ 48,045,743 | $ 33,912,824 |
New Accounting Pronouncement. In July 2006, Financial Accounting Standards Board Interpretation No. 48, Accounting for Uncertainty in Income Taxes - an interpretation of FASB Statement 109 (FIN 48) was issued and is effective for fiscal years beginning after December 15, 2006. FIN 48 sets forth a threshold for financial statement recognition, measurement and disclosure of a tax position taken or expected to be taken on a tax return. Management is currently evaluating the impact, if any, the adoption of FIN 48 will have on the Fund's net assets and results of operations.
Short-Term Trading (Redemption) Fees. Shares held in the Fund less than 90 days are subject to a redemption fee equal to .75% of the proceeds of the redeemed shares. All redemption fees, including any estimated redemption fees paid by FMR, are retained by the Fund and accounted for as an addition to paid in capital.
2. Operating Policies.
Repurchase Agreements. FMR has received an Exemptive Order from the Securities and Exchange Commission (the SEC) which permits the Fund and other affiliated entities of FMR to transfer uninvested cash balances into joint trading accounts which are then invested in repurchase agreements. The Fund may also invest directly with institutions in repurchase agreements. Repurchase agreements are collateralized by government or non-government securities. Upon settlement date, collateral is held in segregated accounts with custodian banks and may be obtained in the event of a default of the counterparty. The Fund monitors, on a daily basis, the value of the collateral to ensure it is at least equal to the principal amount of the repurchase agreement (including accrued interest). In the event of a default by the counterparty, realization of the collateral proceeds could be delayed, during which time the value of the collateral may decline.
Delayed Delivery Transactions and When-Issued Securities. The Fund may purchase or sell securities on a delayed delivery or when-issued basis. Payment and delivery may take place after the customary settlement period for that security. The price of the underlying securities and the date when the securities will be delivered and paid for are fixed at the time the transaction is negotiated. During the time a delayed delivery
Annual Report
2. Operating Policies - continued
Delayed Delivery Transactions and When-Issued Securities - continued
sell is outstanding, the contract is marked-to-market daily and equivalent deliverable securities are held for the transaction. The value of the securities purchased on a delayed delivery or when-issued basis are identified as such in the Fund's Schedule of Investments. The Fund may receive compensation for interest forgone in the purchase of a delayed delivery or when-issued security. With respect to purchase commitments, the Fund identifies securities as segregated in its records with a value at least equal to the amount of the commitment. Losses may arise due to changes in the value of the underlying securities or if the counterparty does not perform under the contract's terms, or if the issuer does not issue the securities due to political, economic, or other factors.
Restricted Securities. The Fund may invest in securities that are subject to legal or contractual restrictions on resale. These securities generally may be resold in transactions exempt from registration or to the public if the securities are registered. Disposal of these securities may involve time-consuming negotiations and expense, and prompt sale at an acceptable price may be difficult. Information regarding restricted securities is included at the end of the fund's Schedule of Investments.
Loans and Other Direct Debt Instruments. The Fund may invest in loans and loan participations, trade claims or other receivables. These investments may include standby financing commitments, including revolving credit facilities, that obligate the Fund to supply additional cash to the borrower on demand. Loan participations involve a risk of insolvency of the lending bank or other financial intermediary. The Fund may be contractually obligated to receive approval from the agent bank and/or borrower prior to the sale of these investments.
3. Purchases and Sales of Investments.
Purchases and sales of securities, other than short-term securities and U.S. government securities, aggregated $152,567,473 and $281,683,393, respectively.
4. Fees and Other Transactions with Affiliates.
Management Fee. FMR and its affiliates provide the Fund with investment management related services for which the Fund pays a monthly management fee. The management fee is the sum of an individual fund fee rate that is based on an annual rate of .30% of the Fund's average net assets and a group fee rate that averaged ..27% during the period. The group fee rate is based upon the average net assets of all the mutual funds advised by FMR. The group fee rate decreases as assets under management increase and increases as assets under management decrease. For the period, the total annual management fee rate was .57% of the Fund's average net assets.
Annual Report
Notes to Financial Statements - continued
4. Fees and Other Transactions with Affiliates - continued
Transfer Agent Fees. Fidelity Service Company, Inc. (FSC), an affiliate of FMR, is the Fund's transfer, dividend disbursing and shareholder servicing agent. FSC receives account fees and asset-based fees that vary according to account size and type of account. FSC pays for typesetting, printing and mailing of shareholder reports, except proxy statements. For the period, the transfer agent fees were equivalent to an annual rate of .21% of average net assets.
Accounting Fees. FSC maintains the Fund's accounting records. The fee is based on the level of average net assets for the month.
Affiliated Central Funds. The Fund may invest in Money Market Central Funds which seek preservation of capital and current income and are managed by Fidelity Investments Money Management, Inc. (FIMM), an affiliate of FMR.
The Fund may also invest in Fidelity Ultra-Short Central Fund (Ultra-Short Central Fund), managed by FIMM, which seeks to obtain a high level of current income consistent with preservation of capital by investing in U.S. dollar denominated money market and investment-grade debt securities.
The Fund's Schedule of Investments lists the Central Funds as an investment of the Fund but does not include the underlying holdings of the Central Funds. Based on its investment objectives, the Central Funds may invest or participate in various investment vehicles or strategies that are similar to those of the investing fund. In addition, the Ultra-Short Central Fund may also participate in derivatives. These strategies are consistent with the investment objectives of the Fund and may involve certain economic risks, including the risk that a counterparty to one or more of these transactions may be unable or unwilling to comply with the terms of the governing agreement. This may result in a decline in value of the Ultra-Short Central Fund and the Fund.
A complete unaudited list of holdings for the Ultra-Short Central Fund, as of the Fund's report date, is available upon request or at fidelity.com. The reports are located just after the Fund's financial statements and quarterly reports but are not part of the financial statements or quarterly reports. In addition, the Ultra-Short Central Fund financial statements, which are not covered by this Fund's Report of Independent Registered Public Accounting Firm, are available on the EDGAR Database on the SEC's web site, www.sec.gov, or upon request.
The Central Funds do not pay a management fee.
Brokerage Commissions. The Fund placed a portion of its portfolio transactions with brokerage firms which are affiliates of the investment adviser. The commissions paid to these affiliated firms were $9,584 for the period.
Annual Report
5. Committed Line of Credit.
The Fund participates with other funds managed by FMR in a $4.2 billion credit facility (the "line of credit") to be utilized for temporary or emergency purposes to fund shareholder redemptions or for other short-term liquidity purposes. The Fund has agreed to pay commitment fees on its pro rata portion of the line of credit, which amounts to $1,221 and is reflected in Miscellaneous Expense on the Statement of Operations. During the period, there were no borrowings on this line of credit.
6. Expense Reductions.
Many of the brokers with whom FMR places trades on behalf of the Fund provided services to the Fund in addition to trade execution. These services included payments of certain expenses on behalf of the Fund totaling $11,520 for the period. In addition, through arrangements with the Fund's custodian and transfer agent, credits realized as a result of uninvested cash balances were used to reduce the Fund's expenses. During the period, these credits reduced the Fund's custody and transfer agent expenses by $14,728 and $2,574, respectively.
7. Other.
The Fund's organizational documents provide former and current trustees and officers with a limited indemnification against liabilities arising in connection with the performance of their duties to the Fund. In the normal course of business, the Fund may also enter into contracts that provide general indemnifications. The Fund's maximum exposure under these arrangements is unknown as this would be dependent on future claims that may be made against the Fund. The risk of material loss from such claims is considered remote.
Annual Report
Report of Independent Registered Public Accounting Firm
To the Trustees of Fidelity Securities Fund and Shareholders of Fidelity Real Estate Income Fund:
We have audited the accompanying statement of assets and liabilities of Fidelity Real Estate Income Fund (the Fund), a fund of Fidelity Securities Fund, including the schedule of investments as of July 31, 2006, and the related statement of operations for the year then ended, the statement of changes in net assets for each of the two years in the period then ended, and the financial highlights for each of the three years in the period then ended and for the period February 4, 2003 (commencement of operations) to July 31, 2003. These financial statements and financial highlights are the responsibility of the Fund's management. Our responsibility is to express an opinion on these financial statements and financial highlights based on our audits.
We conducted our audits in accordance with standards of the Public Company Accounting Oversight Board (United States). Those standards require that we plan and perform the audit to obtain reasonable assurance about whether the financial statements and financial highlights are free of material misstatement. The Fund is not required to have, nor were we engaged to perform, an audit of its internal control over financial reporting. Our audits included consideration of internal control over financial reporting as a basis for designing audit procedures that are appropriate in the circumstances, but not for the purpose of expressing an opinion on the effectiveness of the Fund's internal control over financial reporting. Accordingly, we express no such opinion. An audit also includes examining, on a test basis, evidence supporting the amounts and disclosures in the financial statements, assessing the accounting principles used and significant estimates made by management, as well as evaluating the overall financial statement presentation. Our procedures included confirmation of securities owned as of July 31, 2006, by correspondence with the custodians and brokers; where replies were not received from brokers, we performed other auditing procedures. We believe that our audits provide a reasonable basis for our opinion.
In our opinion, the financial statements and financial highlights referred to above present fairly, in all material respects, the financial position of Fidelity Real Estate Income Fund as of July 31, 2006, the results of its operations for the year then ended, the changes in its net assets for each of the two years in the period then ended, and its financial highlights for each of the three years in the period then ended and for the period February 4, 2003 (commencement of operations) to July 31, 2003, in conformity with accounting principles generally accepted in the United States of America.
/s/ Deloitte & Touche LLP
DELOITTE & TOUCHE LLP
Boston, Massachusetts
September 22, 2006
Annual Report
Trustees and Officers
The Trustees, Members of the Advisory Board, and executive officers of the trust and fund, as applicable, are listed below. The Board of Trustees governs the fund and is responsible for protecting the interests of shareholders. The Trustees are experienced executives who meet periodically throughout the year to oversee the fund's activities, review contractual arrangements with companies that provide services to the fund, and review the fund's performance. Except for William O. McCoy and Albert R. Gamper, Jr., each of the Trustees oversees 345 funds advised by FMR or an affiliate. Mr. McCoy oversees 347 funds advised by FMR or an affiliate. Mr. Gamper oversees 292 funds advised by FMR or an affiliate.
The Trustees hold office without limit in time except that (a) any Trustee may resign; (b) any Trustee may be removed by written instrument, signed by at least two-thirds of the number of Trustees prior to such removal; (c) any Trustee who requests to be retired or who has become incapacitated by illness or injury may be retired by written instrument signed by a majority of the other Trustees; and (d) any Trustee may be removed at any special meeting of shareholders by a two-thirds vote of the outstanding voting securities of the trust. Each Trustee who is not an interested person (as defined in the 1940 Act) (Independent Trustee), shall retire not later than the last day of the calendar year in which his or her 72nd birthday occurs. The Independent Trustees may waive this mandatory retirement age policy with respect to individual Trustees. The executive officers and Advisory Board Members hold office without limit in time, except that any officer and Advisory Board Member may resign or may be removed by a vote of a majority of the Trustees at any regular meeting or any special meeting of the Trustees. Except as indicated, each individual has held the office shown or other offices in the same company for the past five years.
The fund's Statement of Additional Information (SAI) includes more information about the Trustees. To request a free copy, call Fidelity at 1-800-544-8544.
Annual Report
Trustees and Officers - continued
Interested Trustees*:
Correspondence intended for each Trustee who is an interested person may be sent to Fidelity Investments, 82 Devonshire Street, Boston, Massachusetts 02109.
Name, Age; Principal Occupation |
Edward C. Johnson 3d (76) |
| Year of Election or Appointment: 1984 Mr. Johnson is Chairman of the Board of Trustees. Mr. Johnson serves as President (2006-present), Chief Executive Officer, Chairman, and a Director of FMR Corp.; Chairman and a Director of FMR; Chairman and a Director of Fidelity Research & Analysis Company (FRAC); Chairman and a Director of Fidelity Investments Money Management, Inc.; and Chairman (2001-present) and a Director (1999-present) of FMR Co., Inc. In addition, Mr. Johnson serves as Chairman and Director of Fidelity International Limited (FIL). |
Stephen P. Jonas (53) |
| Year of Election or Appointment: 2005 Mr. Jonas is Senior Vice President of Real Estate Income (2005-present). He also serves as Senior Vice President of other Fidelity funds (2005-present). Mr. Jonas is Executive Director of FMR (2005-present) and FMR Co., Inc. (2005-present). He also serves as a Director of Fidelity Investments Money Management, Inc. (2005-present) and FMR Corp. (2003-present). Previously, Mr. Jonas served as President of Fidelity Enterprise Operations and Risk Services (2004-2005), Chief Administrative Officer (2002-2004), and Chief Financial Officer of FMR Corp. (1998-2002). In addition, he serves on the Boards of Boston Ballet (2003-present) and Simmons College (2003-present). |
Robert L. Reynolds (54) |
| Year of Election or Appointment: 2003 Mr. Reynolds is President and a Director of FMR (2005-present), Fidelity Investments Money Management, Inc. (2005-present), and FMR Co., Inc. (2005-present). Mr. Reynolds also serves as a Director (2003-present) and Chief Operating Officer (2000-present) of FMR Corp. and a Director of Strategic Advisers, Inc. (2005-present). He also serves on the Board at Fidelity Investments Canada, Ltd. (2000-present). Previously, Mr. Reynolds served as President of Fidelity Investments Institutional Retirement Group (1996-2000). |
* Trustees have been determined to be "Interested Trustees" by virtue of, among other things, their affiliation with the trust or various entities under common control with FMR.
Annual Report
Independent Trustees:
Correspondence intended for each Independent Trustee (that is, the Trustees other than the Interested Trustees) may be sent to Fidelity Investments, P.O. Box 55235, Boston, Massachusetts 02205-5235.
Name, Age; Principal Occupation |
Dennis J. Dirks (58) |
| Year of Election or Appointment: 2005 Prior to his retirement in May 2003, Mr. Dirks was Chief Operating Officer and a member of the Board of The Depository Trust & Clearing Corporation (DTCC) (1999-2003). He also served as President, Chief Operating Officer, and Board member of The Depository Trust Company (DTC) (1999-2003) and President and Board member of the National Securities Clearing Corporation (NSCC) (1999-2003). In addition, Mr. Dirks served as Chief Executive Officer and Board member of the Government Securities Clearing Corporation (2001-2003) and Chief Executive Officer and Board member of the Mortgage-Backed Securities Clearing Corporation (2001-2003). Mr. Dirks also serves as a Trustee and a member of the Finance Committee of Manhattan College (2005-present) and a Trustee and a member of the Finance Committee of AHRC of Nassau County (2006-present). |
Albert R. Gamper, Jr. (64) |
| Year of Election or Appointment: 2006 Mr. Gamper also serves as a Trustee (2006-present) or Member of the Advisory Board (2005-present) of other investment companies advised by FMR. Prior to his retirement in December 2004, Mr. Gamper served as Chairman of the Board of CIT Group Inc. (commercial finance). During his tenure with CIT Group Inc. Mr. Gamper served in numerous senior management positions, including Chairman (1987-1989; 1999-2001; 2002-2004), Chief Executive Officer (1987-2004), and President (1989-2002). He currently serves as a member of the Board of Directors of Public Service Enterprise Group (utilities, 2001-present), Chairman of the Board of Governors, Rutgers University (2004-present), and Chairman of the Board of Saint Barnabas Health Care System. |
Robert M. Gates (62) |
| Year of Election or Appointment: 1997 Dr. Gates is Chairman of the Independent Trustees (2006-present). Dr. Gates is President of Texas A&M University (2002-present). He was Director of the Central Intelligence Agency (CIA) from 1991 to 1993. From 1989 to 1991, Dr. Gates served as Assistant to the President of the United States and Deputy National Security Advisor. Dr. Gates is a Director of NACCO Industries, Inc. (mining and manufacturing), Parker Drilling Co., Inc. (drilling and rental tools for the energy industry, 2001-present), and Brinker International (restaurant management, 2003-present). Previously, Dr. Gates served as a Director of LucasVarity PLC (automotive components and diesel engines), a Director of TRW Inc. (automotive, space, defense, and information technology), and Dean of the George Bush School of Government and Public Service at Texas A&M University (1999-2001). |
George H. Heilmeier (70) |
| Year of Election or Appointment: 2004 Dr. Heilmeier is Chairman Emeritus of Telcordia Technologies (communication software and systems), where prior to his retirement, he served as company Chairman and Chief Executive Officer. He currently serves on the Boards of Directors of The Mitre Corporation (systems engineering and information technology support for the government), and HRL Laboratories (private research and development, 2004-present). He is Chairman of the General Motors Science & Technology Advisory Board and a Life Fellow of the Institute of Electrical and Electronics Engineers (IEEE). Dr. Heilmeier is a member of the Defense Science Board and the National Security Agency Advisory Board. He is also a member of the National Academy of Engineering, the American Academy of Arts and Sciences, and the Board of Overseers of the School of Engineering and Applied Science of the University of Pennsylvania. Previously, Dr. Heilmeier served as a Director of TRW Inc. (automotive, space, defense, and information technology, 1992-2002), Compaq (1994-2002), Automatic Data Processing, Inc. (ADP) (technology-based business outsourcing, 1995-2002), INET Technologies Inc. (telecommunications network surveillance, 2001-2004), and Teletech Holdings (customer management services). He is the recipient of the 2005 Kyoto Prize in Advanced Technology for his invention of the liquid crystal display. |
Marie L. Knowles (59) |
| Year of Election or Appointment: 2001 Prior to Ms. Knowles' retirement in June 2000, she served as Executive Vice President and Chief Financial Officer of Atlantic Richfield Company (ARCO) (diversified energy, 1996-2000). From 1993 to 1996, she was a Senior Vice President of ARCO and President of ARCO Transportation Company. She served as a Director of ARCO from 1996 to 1998. She currently serves as a Director of Phelps Dodge Corporation (copper mining and manufacturing) and McKesson Corporation (healthcare service, 2002-present). Ms. Knowles is a Trustee of the Brookings Institution and the Catalina Island Conservancy and also serves as a member of the Advisory Board for the School of Engineering of the University of Southern California. |
Ned C. Lautenbach (62) |
| Year of Election or Appointment: 2000 Mr. Lautenbach has been a partner of Clayton, Dubilier & Rice, Inc. (private equity investment firm) since September 1998. Previously, Mr. Lautenbach was with the International Business Machines Corporation (IBM) from 1968 until his retirement in 1998. Mr. Lautenbach serves as a Director of Italtel Holding S.p.A. (telecommunications (Milan, Italy), 2004-present) and Eaton Corporation (diversified industrial) as well as the Philharmonic Center for the Arts in Naples, Florida. He also is a member of the Board of Trustees of Fairfield University (2005-present), as well as a member of the Council on Foreign Relations. |
William O. McCoy (72) |
| Year of Election or Appointment: 1997 Prior to his retirement in December 1994, Mr. McCoy was Vice Chairman of the Board of BellSouth Corporation (telecommunications) and President of BellSouth Enterprises. He is currently a Director of Duke Realty Corporation (real estate). He is also a partner of Franklin Street Partners (private investment management firm). In addition, Mr. McCoy served as the Interim Chancellor (1999-2000) and a member of the Board of Visitors for the University of North Carolina at Chapel Hill and currently serves as Chairman of the Board of Directors of the University of North Carolina Health Care System. He also served as Vice President of Finance for the University of North Carolina (16-school system). |
Cornelia M. Small (62) |
| Year of Election or Appointment: 2005 Ms. Small is a member (2000-present) and Chairperson (2002-present) of the Investment Committee, and a member (2002-present) of the Board of Trustees of Smith College. Previously, she served as Chief Investment Officer (1999-2000), Director of Global Equity Investments (1996-1999), and a member of the Board of Directors of Scudder, Stevens & Clark (1990-1997) and Scudder Kemper Investments (1997-1999). In addition, Ms. Small served as Co-Chair (2000-2003) of the Annual Fund for the Fletcher School of Law and Diplomacy. |
William S. Stavropoulos (67) |
| Year of Election or Appointment: 2002 Mr. Stavropoulos is Chairman Emeritus of the Board of Directors of The Dow Chemical Company. Since joining The Dow Chemical Company in 1967, Mr. Stavropoulos served in numerous senior management positions, including President (1993-2000; 2002-2003), CEO (1995-2000; 2002-2004), and Chairman of the Executive Committee (2000-2004). Currently, he is a Director of NCR Corporation (data warehousing and technology solutions), BellSouth Corporation (telecommunications), Chemical Financial Corporation, Maersk Inc. (industrial conglomerate, 2002-present), and Metalmark Capital (private equity investment firm, 2005-present). He also serves as a member of the Board of Trustees of the American Enterprise Institute for Public Policy Research. In addition, Mr. Stavropoulos is a member of The Business Council, J.P. Morgan International Council and the University of Notre Dame Advisory Council for the College of Science. |
Kenneth L. Wolfe (67) |
| Year of Election or Appointment: 2005 Prior to his retirement in 2001, Mr. Wolfe was Chairman and Chief Executive Officer of Hershey Foods Corporation (1993-2001). He currently serves as a member of the boards of Adelphia Communications Corporation (2003-present), Bausch & Lomb, Inc., and Revlon Inc. (2004-present). |
Annual Report
Advisory Board Members and Executive Officers:
Correspondence intended for Mr. Keyes may be sent to Fidelity Investments, P.O. Box 55235, Boston, Massachusetts 02205-5235. Correspondence intended for each executive officer and Mr. Lynch may be sent to Fidelity Investments, 82 Devonshire Street, Boston, Massachusetts 02109.
Name, Age; Principal Occupation |
James H. Keyes (65) |
| Year of Election or Appointment: 2006 Member of the Advisory Board of Fidelity Securities Fund. Prior to his retirement in 2003, Mr. Keyes was Chairman, President, and Chief Executive Officer of Johnson Controls, Inc. (automotive supplier, 1993-2003). He currently serves as a member of the boards of LSI Logic Corporation (semiconductor technologies, 1984-present), Navistar International Corporation (manufacture and sale of trucks, buses, and diesel engines, 2002-present), and Pitney Bowes, Inc. (integrated mail, messaging, and document management solutions, 1998-present). |
Peter S. Lynch (62) |
| Year of Election or Appointment: 2003 Member of the Advisory Board of Fidelity Securities Fund. Mr. Lynch is Vice Chairman and a Director of FMR, and Vice Chairman (2001-present) and a Director (1999-present) of FMR Co., Inc. Previously, Mr. Lynch served as a Trustee of the Fidelity funds (1990-2003). In addition, he serves as the Chairman of the Inner-City Scholarship Fund. |
Dwight D. Churchill (52) |
| Year of Election or Appointment: 2005 Vice President of Real Estate Income. Mr. Churchill also serves as Vice President of certain Equity Funds (2005-present). Mr. Churchill is Executive Vice President of FMR (2005-present) and FMR Co., Inc. (2005-present). Previously, Mr. Churchill served as Senior Vice President of Fidelity Investments Money Management, Inc. (2005-2006), Head of Fidelity's Fixed-Income Division (2000-2005), Vice President of Fidelity's Money Market Funds (2000-2005), Vice President of Fidelity's Bond Funds, and Senior Vice President of FMR. |
Mark P. Snyderman (49) |
| Year of Election or Appointment: 2003 Vice President of Real Estate Income. Mr. Snyderman also serves as Vice President of other funds advised by FMR. Prior to assuming his current responsibilities, Mr. Snyderman worked as an investment officer and portfolio manager. |
Eric D. Roiter (57) |
| Year of Election or Appointment: 2003 Secretary of Real Estate Income. He also serves as Secretary of other Fidelity funds; Vice President, General Counsel, and Secretary of FMR Co., Inc. (2001-present) and FMR; Assistant Secretary of Fidelity Management & Research (U.K.) Inc. (2001-present), Fidelity Research & Analysis Company (2001-present), and Fidelity Investments Money Management, Inc. (2001-present). Mr. Roiter is an Adjunct Member, Faculty of Law, at Boston College Law School (2003-present). Previously, Mr. Roiter served as Vice President and Secretary of Fidelity Distributors Corporation (FDC) (1998-2005). |
Stuart Fross (46) |
| Year of Election or Appointment: 2003 Assistant Secretary of Real Estate Income. Mr. Fross also serves as Assistant Secretary of other Fidelity funds (2003-present), Vice President and Secretary of FDC (2005-present), and is an employee of FMR. |
Christine Reynolds (47) |
| Year of Election or Appointment: 2004 President and Treasurer of Real Estate Income. Ms. Reynolds also serves as President and Treasurer of other Fidelity funds (2004-present) and is a Vice President (2003-present) and an employee (2002-present) of FMR. Before joining Fidelity Investments, Ms. Reynolds worked at PricewaterhouseCoopers LLP (PwC) (1980-2002), where she was most recently an audit partner with PwC's investment management practice. |
R. Stephen Ganis (40) |
| Year of Election or Appointment: 2006 Anti-Money Laundering (AML) officer of Real Estate Income. Mr. Ganis also serves as AML officer of other Fidelity funds (2006-present) and FMR Corp. (2003-present). Before joining Fidelity Investments, Mr. Ganis practiced law at Goodwin Procter, LLP (2000-2002). |
Joseph B. Hollis (58) |
| Year of Election or Appointment: 2006 Chief Financial Officer of Real Estate Income. Mr. Hollis also serves as Chief Financial Officer of other Fidelity funds. Mr. Hollis is President of Fidelity Pricing and Cash Management Services (FPCMS) (2005-present). Mr. Hollis also serves as President and Director of Fidelity Service Company, Inc. (2006-present). Previously, Mr. Hollis served as Senior Vice President of Cash Management Services (1999-2002) and Investment Management Operations (2002-2005). |
Kenneth A. Rathgeber (59) |
| Year of Election or Appointment: 2004 Chief Compliance Officer of Real Estate Income. Mr. Rathgeber also serves as Chief Compliance Officer of other Fidelity funds (2004-present) and Executive Vice President of Risk Oversight for Fidelity Investments (2002-present). He is Chief Compliance Officer of FMR (2005-present), FMR Co., Inc. (2005-present), Fidelity Management & Research (U.K.) Inc. (2005-present), Fidelity Research & Analysis Company (2005-present), Fidelity Investments Money Management, Inc. (2005-present), and Strategic Advisers, Inc. (2005-present). Previously, Mr. Rathgeber served as Executive Vice President and Chief Operating Officer for Fidelity Investments Institutional Services Company, Inc. (1998-2002). |
Bryan A. Mehrmann (45) |
| Year of Election or Appointment: 2005 Deputy Treasurer of Real Estate Income. Mr. Mehrmann also serves as Deputy Treasurer of other Fidelity funds (2005-present) and is an employee of FMR. Previously, Mr. Mehrmann served as Vice President of Fidelity Investments Institutional Services Group (FIIS)/Fidelity Investments Institutional Operations Corporation, Inc. (FIIOC) Client Services (1998-2004). |
Kimberley H. Monasterio (42) |
| Year of Election or Appointment: 2004 Deputy Treasurer of Real Estate Income. Ms. Monasterio also serves as Deputy Treasurer of other Fidelity funds (2004) and is an employee of FMR (2004). Before joining Fidelity Investments, Ms. Monasterio served as Treasurer (2000-2004) and Chief Financial Officer (2002-2004) of the Franklin Templeton Funds and Senior Vice President of Franklin Templeton Services, LLC (2000-2004). |
Kenneth B. Robins (36) |
| Year of Election or Appointment: 2005 Deputy Treasurer of Real Estate Income. Mr. Robins also serves as Deputy Treasurer of other Fidelity funds (2005-present) and is an employee of FMR (2004-present). Before joining Fidelity Investments, Mr. Robins worked at KPMG LLP, where he was a partner in KPMG's department of professional practice (2002-2004) and a Senior Manager (1999-2000). In addition, Mr. Robins served as Assistant Chief Accountant, United States Securities and Exchange Commission (2000-2002). |
Robert G. Byrnes (39) |
| Year of Election or Appointment: 2005 Assistant Treasurer of Real Estate Income. Mr. Byrnes also serves as Assistant Treasurer of other Fidelity funds (2005-present) and is an employee of FMR (2005-present). Previously, Mr. Byrnes served as Vice President of FPCMS (2003-2005). Before joining Fidelity Investments, Mr. Byrnes worked at Deutsche Asset Management where he served as Vice President of the Investment Operations Group (2000-2003). |
John H. Costello (59) |
| Year of Election or Appointment: 2003 Assistant Treasurer of Real Estate Income. Mr. Costello also serves as Assistant Treasurer of other Fidelity funds and is an employee of FMR. |
Peter L. Lydecker (52) |
| Year of Election or Appointment: 2004 Assistant Treasurer of Real Estate Income. Mr. Lydecker also serves as Assistant Treasurer of other Fidelity funds (2004) and is an employee of FMR. |
Mark Osterheld (51) |
| Year of Election or Appointment: 2003 Assistant Treasurer of Real Estate Income. Mr. Osterheld also serves as Assistant Treasurer of other Fidelity funds (2002) and is an employee of FMR. |
Gary W. Ryan (47) |
| Year of Election or Appointment: 2005 Assistant Treasurer of Real Estate Income. Mr. Ryan also serves as Assistant Treasurer of other Fidelity funds (2005-present) and is an employee of FMR (2005-present). Previously, Mr. Ryan served as Vice President of Fund Reporting in FPCMS (1999-2005). |
Salvatore Schiavone (40) |
| Year of Election or Appointment: 2005 Assistant Treasurer of Real Estate Income. Mr. Schiavone also serves as Assistant Treasurer of other Fidelity funds (2005-present) and is an employee of FMR (2005-present). Before joining Fidelity Investments, Mr. Schiavone worked at Deutsche Asset Management, where he most recently served as Assistant Treasurer (2003-2005) of the Scudder Funds and Vice President and Head of Fund Reporting (1996-2003). |
Annual Report
Distributions
The Board of Trustees of Fidelity Real Estate Income voted to pay on September 11, 2006, to shareholders of record at the opening of business on September 8, 2006, a distribution of $0.21 per share derived from capital gains realized from sales of portfolio securities and a dividend of $0.15 per share from net investment income.
The fund hereby designates as a capital gain dividend with respect to the taxable year ended July 31, 2006, $16,721,334, or, if subsequently determined to be different, the net capital gain of such year.
A total of 0.05% of the dividends distributed during the fiscal year was derived from interest on U.S. Government securities which is generally exempt from state income tax.
The fund will notify shareholders in January 2007 of amounts for use in preparing 2006 income tax returns.
Annual Report
Proxy Voting Results
A special meeting of the fund's shareholders was held on May 17, 2006. The results of votes taken among shareholders on the proposal before them are reported below. Each vote reported represents one dollar of net asset value held on the record date for the meeting.
PROPOSAL 1 |
To elect a Board of Trustees. A |
| # of
Votes | % of
Votes |
Dennis J. Dirks |
Affirmative | 43,119,905,166.54 | 95.455 |
Withheld | 2,053,001,967.67 | 4.545 |
TOTAL | 45,172,907,134.21 | 100.000 |
Albert R. Gamper, Jr. |
Affirmative | 43,068,780,128.62 | 95.342 |
Withheld | 2,104,127,005.59 | 4.658 |
TOTAL | 45,172,907,134.21 | 100.000 |
Robert M. Gates |
Affirmative | 43,032,117,662.60 | 95.261 |
Withheld | 2,140,789,471.61 | 4.739 |
TOTAL | 45,172,907,134.21 | 100.000 |
George H. Heilmeier |
Affirmative | 43,023,368,882.30 | 95.242 |
Withheld | 2,149,538,251.91 | 4.758 |
TOTAL | 45,172,907,134.21 | 100.000 |
Edward C. Johnson 3d |
Affirmative | 42,881,915,819.70 | 94.928 |
Withheld | 2,290,991,314.51 | 5.072 |
TOTAL | 45,172,907,134.21 | 100.000 |
Stephen P. Jonas |
Affirmative | 43,081,912,066.37 | 95.371 |
Withheld | 2,090,995,067.84 | 4.629 |
TOTAL | 45,172,907,134.21 | 100.000 |
James H. KeyesB |
Affirmative | 43,049,050,093.79 | 95.298 |
Withheld | 2,123,857,040.42 | 4.702 |
TOTAL | 45,172,907,134.21 | 100.000 |
Marie L. Knowles |
Affirmative | 43,090,434,696.02 | 95.390 |
Withheld | 2,082,472,438.19 | 4.610 |
TOTAL | 45,172,907,134.21 | 100.000 |
| # of
Votes | % of
Votes |
Ned C. Lautenbach |
Affirmative | 43,082,185,255.05 | 95.372 |
Withheld | 2,090,721,879.16 | 4.628 |
TOTAL | 45,172,907,134.21 | 100.000 |
William O. McCoy |
Affirmative | 42,960,162,066.32 | 95.102 |
Withheld | 2,212,745,067.89 | 4.898 |
TOTAL | 45,172,907,134.21 | 100.000 |
Robert L. Reynolds |
Affirmative | 43,087,560,419.66 | 95.384 |
Withheld | 2,085,346,714.55 | 4.616 |
TOTAL | 45,172,907,134.21 | 100.000 |
Cornelia M. Small |
Affirmative | 43,092,070,014.53 | 95.394 |
Withheld | 2,080,837,119.68 | 4.606 |
TOTAL | 45,172,907,134.21 | 100.000 |
William S. Stavropoulos |
Affirmative | 43,002,032,676.43 | 95.194 |
Withheld | 2,170,874,457.78 | 4.806 |
TOTAL | 45,172,907,134.21 | 100.000 |
Kenneth L. Wolfe |
Affirmative | 43,047,241,852.81 | 95.294 |
Withheld | 2,125,665,281.40 | 4.706 |
TOTAL | 45,172,907,134.21 | 100.000 |
A Denotes trust-wide proposal and voting results. B Effective on or about January 1, 2007. |
Annual Report
Board Approval of Investment Advisory Contracts and Management Fees
Fidelity Real Estate Income Fund
Each year, typically in July, the Board of Trustees, including the Independent Trustees (together, the Board), votes on the renewal of the management contract and sub-advisory agreements (together, the Advisory Contracts) for the fund. The Board, assisted by the advice of fund counsel and Independent Trustees' counsel, requests and considers a broad range of information throughout the year.
The Board meets regularly each month except August and takes into account throughout the year matters bearing on Advisory Contracts. The Board, acting directly and through its separate committees, considers at each of its meetings factors that are relevant to the annual renewal of the fund's Advisory Contracts, including the services and support provided to the fund and its shareholders. At the time of the renewal, the Board had 12 standing committees, each composed of Independent Trustees with varying backgrounds, to which the Board has assigned specific subject matter responsibilities in order to enhance effective decision-making by the Board. Each committee has adopted a written charter outlining the structure and purposes of the committee. One such committee, the Equity Contract Committee, meets periodically as needed throughout the year to consider matters specifically related to the annual renewal of Advisory Contracts. The committee requests and receives information on, and makes recommendations to the Independent Trustees concerning, the approval and annual review of the Advisory Contracts.
At its July 2006 meeting, the Board of Trustees, including the Independent Trustees, unanimously determined to renew the Advisory Contracts for the fund. In reaching its determination, the Board considered all factors it believed relevant, including (i) the nature, extent, and quality of the services to be provided to the fund and its shareholders (including the investment performance of the fund); (ii) the competitiveness of the management fee and total expenses of the fund; (iii) the total costs of the services to be provided by and the profits to be realized by the investment adviser and its affiliates from the relationship with the fund; (iv) the extent to which economies of scale would be realized as the fund grows; and (v) whether fee levels reflect these economies of scale, if any, for the benefit of fund shareholders.
In determining whether to renew the Advisory Contracts for the fund, the Board ultimately reached a determination, with the assistance of fund counsel and Independent Trustees' counsel, that the renewal of the Advisory Contracts and the compensation to be received by Fidelity under the management contract is consistent with Fidelity's fiduciary duty under applicable law. In addition to evaluating the specific factors noted above, the Board, in reaching its determination, is aware that shareholders in the fund have a broad range of investment choices available to them, including a wide choice among mutual funds offered by competitors to Fidelity, and that the fund's shareholders, with the opportunity to review and weigh the disclosure provided by the fund in its prospectus and other public disclosures, have chosen to invest in this fund, managed by Fidelity.
Annual Report
Board Approval of Investment Advisory Contracts and
Management Fees - continued
Nature, Extent, and Quality of Services Provided. The Board considered staffing within the investment adviser, FMR, and the sub-advisers (together, the Investment Advisers), including the background of the fund's portfolio manager and the fund's investment objective and discipline. The Independent Trustees also had discussions with senior management of Fidelity's investment operations and investment groups. The Board considered the structure of the portfolio manager compensation program and whether this structure provides appropriate incentives.
Resources Dedicated to Investment Management and Support Services. The Board reviewed the size, education, and experience of the Investment Advisers' investment staff, their use of technology, and the Investment Advisers' approach to recruiting, training, and retaining portfolio managers and other research, advisory, and management personnel. The Board considered Fidelity's extensive global research capabilities that enable the Investment Advisers to aggregate data from various sources in an effort to produce positive investment results. The Board noted that Fidelity's analysts have access to a variety of technological tools that enable them to perform both fundamental and quantitative analysis and to specialize in various disciplines. The Board also considered that Fidelity's portfolio managers and analysts have access to daily portfolio attribution that allows for monitoring of a fund's portfolio, as well as an electronic communication system that provides immediate real-time access to research concerning issuers and credit enhancers.
Shareholder and Administrative Services. The Board considered (i) the nature, extent, quality, and cost of administrative, distribution, and shareholder services performed by the Investment Advisers and their affiliates under the Advisory Contracts and under separate agreements covering transfer agency, pricing and bookkeeping, and securities lending services for the fund; (ii) the nature and extent of the Investment Advisers' supervision of third party service providers, principally custodians and subcustodians; and (iii) the resources devoted to, and the record of compliance with, the fund's compliance policies and procedures. The Board reviewed the allocation of fund brokerage, including allocations to brokers affiliated with the Investment Advisers, the use of brokerage commissions to pay fund expenses, and the use of "soft" commission dollars to pay for research services. The Board also considered that Fidelity voluntarily pays for market data out of its own resources.
The Board noted that the growth of fund assets across the complex allows Fidelity to reinvest in the development of services designed to enhance the value or convenience of the Fidelity funds as investment vehicles. These services include 24-hour access to account information and market information through phone representatives and over the Internet, and investor education materials and asset allocation tools.
Annual Report
Investment in a Large Fund Family. The Board considered the benefits to shareholders of investing in a Fidelity fund, including the benefits of investing in a fund that is part of a large family of funds offering a variety of investment disciplines and providing for a large variety of mutual fund investor services. For example, fund shareholders are offered the privilege of exchanging shares of the fund for shares of other Fidelity funds, as set forth in the fund's prospectus, without paying a sales charge. The Board noted that, since the last Advisory Contract renewals in July 2005, Fidelity has taken a number of actions that benefited particular funds, including (i) dedicating additional resources to investment research and to restructure the investment research teams; (ii) voluntarily entering into contractual arrangements with certain brokers pursuant to which Fidelity pays for research products and services separately out of its own resources, rather than bundling with fund commissions; (iii) launching the Fidelity Advantage Class of its five Spartan stock index funds and three Spartan bond index funds, which is a lower-fee class available to shareholders with higher account balances; (iv) contractually agreeing to impose expense limitations on Fidelity U.S. Bond Index Fund and reducing the fund's initial investment minimum; and (v) offering shareholders of each of the Fidelity Institutional Money Market Funds the privilege of exchanging shares of the fund for shares of other Fidelity funds.
Investment Performance and Compliance. The Board considered whether the fund has operated within its investment objective, as well as its record of compliance with its investment restrictions. It also reviewed the fund's absolute investment performance, as well as the fund's relative investment performance measured against (i) a proprietary custom index, and (ii) a peer group of mutual funds. Because the fund had been in existence less than three calendar years, the following chart considered by the Board shows, for the one-year period ended December 31, 2005, the fund's total return, the total return of a proprietary custom index ("benchmark"), and a range of total returns of a peer group of mutual funds identified by Lipper Inc. as having an investment objective similar to that of the fund. The box within the chart shows the 25th percentile return (bottom of box) and the 75th percentile return (top of box) of the Lipper peer group. Returns shown above the box are in the first quartile and returns shown below the box are in the fourth quartile. The percentage beaten number noted below the chart corresponds to the percentile box and represents the percentage of funds in the Lipper peer group whose performance was equal to or lower than that of the fund. The fund's proprietary custom index is an index developed by FMR that represents the performance of the fund's unmanaged indexes.
Annual Report
Board Approval of Investment Advisory Contracts and
Management Fees - continued
Fidelity Real Estate Income Fund
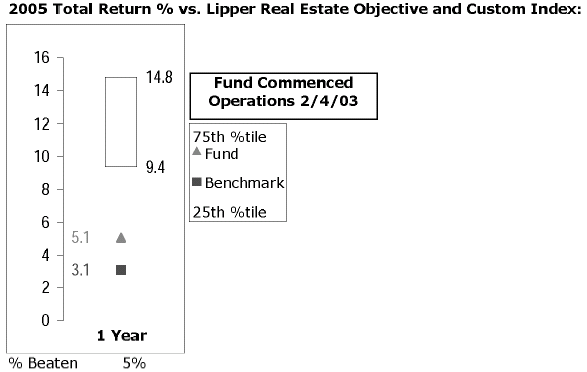
The Board reviewed the fund's relative investment performance against its Lipper peer group and stated that the performance of the fund was in the fourth quartile for the period shown. The Board noted that FMR does not consider that Lipper peer group to be a meaningful comparison for the fund, however, because unlike many of its peers, which invest primarily in common stocks of real estate companies, the fund invests in a mix of common, preferred and debt securities of real estate entities. The Board also stated that the relative investment performance of the fund compared favorably to its benchmark for the period shown. The Board stated that it is difficult to evaluate in any comprehensive fashion the performance of the fund, in light of its relatively recent launch.
The Board considered that FMR has taken steps to refocus and strengthen equity research, equity portfolio management, and compliance. The Board noted with favor FMR's reorganization of its senior management team in 2005 and FMR's dedication of additional resources to investment research, and participated in the process that led to those changes.
Based on its review, and giving particular weight to the nature and quality of the resources dedicated by the Investment Advisers to maintain and improve relative performance, the Board concluded that the nature, extent, and quality of the services provided to the fund will benefit the fund's shareholders, particularly in light of the Board's view that the fund's shareholders benefit from investing in a fund that is part of a large family of funds offering a variety of investment disciplines and services.
Competitiveness of Management Fee and Total Fund Expenses. The Board considered the fund's management fee and total expenses compared to "mapped groups" of competitive funds and classes. Fidelity creates "mapped groups" by combining similar Lipper investment objective categories that have comparable management fee characteristics. Combining Lipper investment objective categories aids the Board's management fee and total expense comparisons by broadening the competitive group used for comparison and by reducing the number of universes to which various Fidelity funds are compared.
Annual Report
The Board considered two proprietary management fee comparisons for the 12-month (or shorter) periods shown in the chart below. The group of Lipper funds used by the Board for management fee comparisons is referred to below as the "Total Mapped Group" and, for the reasons explained above, is broader than the Lipper peer group used by the Board for performance comparisons. The Total Mapped Group comparison focuses on a fund's standing relative to the total universe of comparable funds available to investors, in terms of gross management fees before expense reimbursements or caps. "TMG %" represents the percentage of funds in the Total Mapped Group that had management fees that were lower than the fund's. For example, a TMG % of 21% means that 79% of the funds in the Total Mapped Group had higher management fees than the fund. The "Asset-Size Peer Group" (ASPG) comparison focuses on a fund's standing relative to non-Fidelity funds similar in size to the fund within the Total Mapped Group. The ASPG represents at least 15% of the funds in the Total Mapped Group with comparable asset size and management fee characteristics, subject to a minimum of 50 funds (or all funds in the Total Mapped Group if fewer than 50). Additional information, such as the ASPG quartile in which the fund's management fee ranked, is also included in the chart and considered by the Board.
Fidelity Real Estate Income Fund
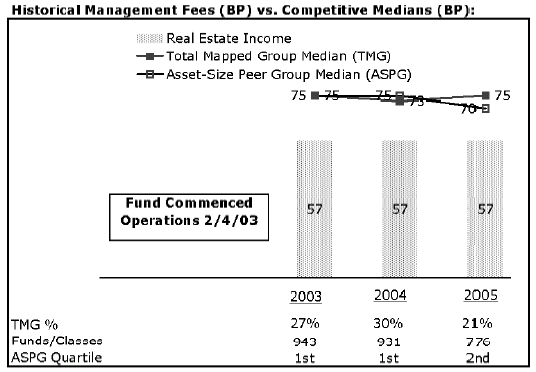
Annual Report
Board Approval of Investment Advisory Contracts and
Management Fees - continued
The Board noted that the fund's management fee ranked below the median of its Total Mapped Group and below the median of its ASPG for 2005.
Based on its review, the Board concluded that the fund's management fee was fair and reasonable in light of the services that the fund receives and the other factors considered.
In its review of the fund's total expenses, the Board considered the fund's management fee as well as other fund expenses, such as transfer agent fees, pricing and bookkeeping fees, and custodial, legal, and audit fees. The Board also noted the effects of any waivers and reimbursements on fees and expenses. As part of its review, the Board also considered current and historical total expenses of the fund compared to competitive fund median expenses. The fund is compared to those funds and classes in the Total Mapped Group (used by the Board for management fee comparisons) that have a similar sales load structure.
The Board noted that the fund's total expenses ranked below its competitive median for 2005.
In its review of total expenses, the Board also considered Fidelity fee structures and other information on clients that FMR and its affiliates service in other competitive markets, such as other mutual funds advised or subadvised by FMR or its affiliates, pension plan clients, and other institutional clients.
Based on its review, the Board concluded that the fund's total expenses were reasonable in light of the services that the fund and its shareholders receive and the other factors considered.
Costs of the Services and Profitability. The Board considered the revenues earned and the expenses incurred by Fidelity in conducting the business of developing, marketing, distributing, managing, administering and servicing the fund and its shareholders. The Board also considered the level of Fidelity's profits in respect of all the Fidelity funds.
On an annual basis, FMR presents to the Board Fidelity's profitability for the fund. Fidelity calculates the profitability for each fund, as well as aggregate profitability for groups of Fidelity funds and all Fidelity funds, using a series of detailed revenue and cost allocation methodologies which originate with the audited books and records of Fidelity. The Audit Committee of the Board reviews any significant changes from the prior year's methodologies.
PricewaterhouseCoopers LLP (PwC), independent registered accounting firm and auditor to Fidelity and certain Fidelity funds, has been engaged annually by the Board as part of the Board's assessment of the results of Fidelity's profitability analysis. PwC's engagement includes the review and assessment of Fidelity's methodologies used in determining the revenues and expenses attributable to Fidelity's mutual fund business, and completion of agreed-upon procedures surrounding the mathematical accuracy of fund profitability and its conformity to allocation methodologies. After considering PwC's reports issued under the engagement and information provided by Fidelity, the Board believes that while other allocation methods may also be reasonable, Fidelity's profitability methodologies are reasonable in all material respects.
Annual Report
The Board has also reviewed Fidelity's non-fund businesses and any fall-out benefits related to the mutual fund business as well as cases where Fidelity's affiliates may benefit from or be related to the fund's business.
The Board considered the costs of the services provided by and the profits realized by Fidelity in connection with the operation of the fund and determined that the amount of profit is a fair entrepreneurial profit for the management of the fund.
Economies of Scale. The Board considered whether there have been economies of scale in respect of the management of the Fidelity funds, whether the Fidelity funds (including the fund) have appropriately benefited from any such economies of scale, and whether there is potential for realization of any further economies of scale. The Board considered the extent to which the fund will benefit from economies of scale through increased services to the fund, through waivers or reimbursements, or through fee or expense reductions, including reductions that occur through operation of the transfer agent agreement. The transfer agent fee varies in part based on the number of accounts in the fund. If the number of accounts decreases or the average account size increases, the overall transfer agent fee rate decreases.
The Board recognized that the fund's management contract incorporates a "group fee" structure, which provides for lower fee rates as total fund assets under FMR's management increase, and for higher fee rates as total fund assets under FMR's management decrease. The Board considered that the group fee is designed to deliver the benefits of economies of scale to fund shareholders when total fund assets increase, even if assets of any particular fund are unchanged or have declined, because some portion of Fidelity's costs are attributable to services provided to all Fidelity funds, and all funds benefit if those costs can be allocated among more assets. The Board concluded that, given the group fee structure, fund shareholders will achieve a certain level of economies of scale as assets under FMR's management increase at the fund complex level, regardless of whether Fidelity achieves any such economies of scale.
The Board further concluded that any potential economies of scale are being shared between fund shareholders and Fidelity in an appropriate manner.
Additional Information Requested by the Board. In order to develop fully the factual basis for consideration of the Advisory Contracts, the Board requested additional information on several topics, including (i) Fidelity's fund profitability methodology and profitability trends within certain funds; (ii) portfolio manager compensation; (iii) the extent to which any economies of scale exist and are shared between the funds and Fidelity; (iv) the total expenses of certain funds and classes relative to competitors, including the extent to which the expenses of certain funds have been or could be capped; (v) fund performance trends; and (vi) Fidelity's fee structures, including use of performance fees.
Annual Report
Board Approval of Investment Advisory Contracts and
Management Fees - continued
Based on its evaluation of all of the conclusions noted above, and after considering all material factors, the Board ultimately concluded that the advisory fee structures are fair and reasonable, and that the fund's Advisory Contracts should be renewed.
Annual Report
Managing Your Investments
Fidelity offers several ways to conveniently manage your personal investments via your telephone or PC. You can access your account information, conduct trades and research your investments 24 hours a day.
By Phone
Fidelity Automated Service Telephone provides a single toll-free number to access account balances, positions, quotes and trading. It's easy to navigate the service, and on your first call, the system will help you create a personal identification number (PIN) for security.
(phone_graphic)
Fidelity Automated
Service Telephone (FAST®)
1-800-544-5555
Press
1 For mutual fund and brokerage trading.
2 For quotes.*
3 For account balances and holdings.
4 To review orders and mutual
fund activity.
5 To change your PIN.
*0 To speak to a Fidelity representative.
By PC
Fidelity's web site on the Internet provides a wide range of information, including daily financial news, fund performance, interactive planning tools and news about Fidelity products and services.
(computer_graphic)
Fidelity's Web Site
www.fidelity.com
* When you call the quotes line, please remember that a fund's yield and return will vary and, except for money market funds, share price will also vary. This means that you may have a gain or loss when you sell your shares. There is no assurance that money market funds will be able to maintain a stable $1 share price; an investment in a money market fund is not insured or guaranteed by the U.S. government. Total returns are historical and include changes in share price, reinvestment of dividends and capital gains, and the effects of any sales charges.
Annual Report
To Visit Fidelity
For directions and hours,
please call 1-800-544-9797.
Arizona
7001 West Ray Road
Chandler, AZ
15445 N. Scottsdale Road
Scottsdale, AZ
California
815 East Birch Street
Brea, CA
1411 Chapin Avenue
Burlingame, CA
851 East Hamilton Avenue
Campbell, CA
19200 Von Karman Avenue
Irvine, CA
601 Larkspur Landing Circle
Larkspur, CA
10100 Santa Monica Blvd.
Los Angeles, CA
27101 Puerta Real
Mission Viejo, CA
73-575 El Paseo
Palm Desert, CA
251 University Avenue
Palo Alto, CA
123 South Lake Avenue
Pasadena, CA
16995 Bernardo Ctr. Drive
Rancho Bernardo, CA
1220 Roseville Parkway
Roseville, CA
1740 Arden Way
Sacramento, CA
7676 Hazard Center Drive
San Diego, CA
11943 El Camino Real
San Diego, CA
8 Montgomery Street
San Francisco, CA
3793 State Street
Santa Barbara, CA
1200 Wilshire Boulevard
Santa Monica, CA
21701 Hawthorne Boulevard
Torrance, CA
2001 North Main Street
Walnut Creek, CA
6300 Canoga Avenue
Woodland Hills, CA
Colorado
1625 Broadway
Denver, CO
9185 Westview Road
Lone Tree, CO
Connecticut
48 West Putnam Avenue
Greenwich, CT
265 Church Street
New Haven, CT
300 Atlantic Street
Stamford, CT
29 South Main Street
West Hartford, CT
Delaware
400 Delaware Avenue
Wilmington, DE
Florida
4400 N. Federal Highway
Boca Raton, FL
121 Alhambra Plaza
Coral Gables, FL
2948 N. Federal Highway
Ft. Lauderdale, FL
4671 Town Center Parkway
Jacksonville, FL
1907 West State Road 434
Longwood, FL
8880 Tamiami Trail, North
Naples, FL
3501 PGA Boulevard
Palm Beach Gardens, FL
3550 Tamiami Trail, South
Sarasota, FL
1502 N. Westshore Blvd.
Tampa, FL
2465 State Road 7
Wellington, FL
Georgia
3445 Peachtree Road, N.E.
Atlanta, GA
1000 Abernathy Road
Atlanta, GA
Illinois
One North LaSalle Street
Chicago, IL
875 North Michigan Ave.
Chicago, IL
1415 West 22nd Street
Oak Brook, IL
1572 East Golf Road
Schaumburg, IL
3232 Lake Avenue
Wilmette, IL
Indiana
4729 East 82nd Street
Indianapolis, IN
Kansas
5400 College Boulevard
Overland Park, KS
Maine
Three Canal Plaza
Portland, ME
Maryland
7315 Wisconsin Avenue
Bethesda, MD
One W. Pennsylvania Ave.
Towson, MD
Massachusetts
801 Boylston Street
Boston, MA
155 Congress Street
Boston, MA
300 Granite Street
Braintree, MA
44 Mall Road
Burlington, MA
238 Main Street
Cambridge, MA
405 Cochituate Road
Framingham, MA
416 Belmont Street
Worcester, MA
Annual Report
Michigan
500 E. Eisenhower Pkwy.
Ann Arbor, MI
280 Old N. Woodward Ave.
Birmingham, MI
43420 Grand River Avenue
Novi, MI
29155 Northwestern Hwy.
Southfield, MI
Minnesota
7600 France Avenue South
Edina, MN
Missouri
1524 South Lindbergh Blvd.
St. Louis, MO
Nevada
2225 Village Walk Drive
Henderson, NV
New Jersey
150 Essex Street
Millburn, NJ
56 South Street
Morristown, NJ
396 Route 17, North
Paramus, NJ
3518 Route 1 North
Princeton, NJ
530 Broad Street
Shrewsbury, NJ
New York
1055 Franklin Avenue
Garden City, NY
37 West Jericho Turnpike
Huntington Station, NY
1271 Avenue of the Americas
New York, NY
980 Madison Avenue
New York, NY
61 Broadway
New York, NY
350 Park Avenue
New York, NY
200 Fifth Avenue
New York, NY
733 Third Avenue
New York, NY
11 Penn Plaza
New York, NY
2070 Broadway
New York, NY
1075 Northern Blvd.
Roslyn, NY
799 Central Park Avenue
Scarsdale, NY
North Carolina
4611 Sharon Road
Charlotte, NC
7011 Fayetteville Road
Durham, NC
Ohio
3805 Edwards Road
Cincinnati, OH
1324 Polaris Parkway
Columbus, OH
28699 Chagrin Boulevard
Woodmere Village, OH
Oregon
7493 SW Bridgeport Road
Tigard, OR
Pennsylvania
600 West DeKalb Pike
King of Prussia, PA
1735 Market Street
Philadelphia, PA
12001 Perry Highway
Wexford, PA
Rhode Island
47 Providence Place
Providence, RI
Tennessee
6150 Poplar Avenue
Memphis, TN
Texas
10000 Research Boulevard
Austin, TX
4001 Northwest Parkway
Dallas, TX
12532 Memorial Drive
Houston, TX
2701 Drexel Drive
Houston, TX
6560 Fannin Street
Houston, TX
6500 N. MacArthur Blvd.
Irving, TX
6005 West Park Boulevard
Plano, TX
14100 San Pedro
San Antonio, TX
1576 East Southlake Blvd.
Southlake, TX
19740 IH 45 North
Spring, TX
Utah
279 West South Temple
Salt Lake City, UT
Virginia
1861 International Drive
McLean, VA
Washington
411 108th Avenue, N.E.
Bellevue, WA
1518 6th Avenue
Seattle, WA
Washington, DC
1900 K Street, N.W.
Washington, DC
Wisconsin
595 North Barker Road
Brookfield, WI
Fidelity Brokerage Services, Inc., 100 Summer St., Boston, MA 02110 Member NYSE/SIPC
Annual Report
To Write Fidelity
We'll give your correspondence immediate attention and send you written confirmation upon completion of your request.
(letter_graphic)
Making Changes
To Your Account
(such as changing name, address, bank, etc.)
Fidelity Investments
P.O. Box 770001
Cincinnati, OH 45277-0002
(letter_graphic)
For Non-Retirement
Accounts
Buying shares
Fidelity Investments
P.O. Box 770001
Cincinnati, OH 45277-0003
Overnight Express
Fidelity Investments
Attn: Distribution Services
100 Crosby Parkway - KC1H
Covington, KY 41015
Selling shares
Fidelity Investments
P.O. Box 770001
Cincinnati, OH 45277-0035
Overnight Express
Fidelity Investments
Attn: Distribution Services
100 Crosby Parkway - KC1H
Covington, KY 41015
General Correspondence
Fidelity Investments
P.O. Box 500
Merrimack, NH 03054-0500
(letter_graphic)
For Retirement
Accounts
Buying shares
Fidelity Investments
P.O. Box 770001
Cincinnati, OH 45277-0003
Selling shares
Fidelity Investments
P.O. Box 770001
Cincinnati, OH 45277-0035
Overnight Express
Fidelity Investments
Attn: Distribution Services
100 Crosby Parkway - KC1H
Covington, KY 41015
General Correspondence
Fidelity Investments
P.O. Box 500
Merrimack, NH 03054-0500
Annual Report
Annual Report
Investment Adviser
Fidelity Management & Research Company
Boston, MA
Investment Sub-Advisers
FMR Co., Inc.
Fidelity Research & Analysis Company
(formerly Fidelity Management &
Research (Far East) Inc.)
Fidelity Management & Research
(U.K.) Inc.
Fidelity Investments Japan Limited
Fidelity International Investment
Advisers
Fidelity International Investment
Advisers (U.K.) Limited
General Distributor
Fidelity Distributors Corporation
Boston, MA
Transfer and Service Agent
Fidelity Service Company, Inc.
Boston, MA
Custodian
Citibank, N.A.
New York, NY
The Fidelity Telephone Connection
Mutual Fund 24-Hour Service
Exchanges/Redemptions
and Account Assistance 1-800-544-6666
Product Information 1-800-544-6666
Retirement Accounts 1-800-544-4774
(8 a.m. - 9 p.m.)
TDD Service 1-800-544-0118
for the deaf and hearing impaired
(9 a.m. - 9 p.m. Eastern time)
Fidelity Automated Service
Telephone (FAST®) (automated graphic) 1-800-544-5555
(automated graphic) Automated line for quickest service
REI-UANN-0906
1.789710.103
(Fidelity Investment logo)(registered trademark)
Corporate Headquarters
82 Devonshire St., Boston, MA 02109
www.fidelity.com
Item 2. Code of Ethics
As of the end of the period, July 31, 2006, Fidelity Securities Fund (the trust) has adopted a code of ethics, as defined in Item 2 of Form N-CSR, that applies to its President and Treasurer and its Chief Financial Officer. A copy of the code of ethics is filed as an exhibit to this Form N-CSR.
Item 3. Audit Committee Financial Expert
The Board of Trustees of the trust has determined that Marie L. Knowles is an audit committee financial expert, as defined in Item 3 of Form N-CSR. Ms. Knowles is independent for purposes of Item 3 of Form N-CSR.
Item 4. Principal Accountant Fees and Services
(a) Audit Fees.
For the fiscal years ended July 31, 2006 and July 31, 2005, the aggregate Audit Fees billed by PricewaterhouseCoopers LLP (PwC) for professional services rendered for the audits of the financial statements, or services that are normally provided in connection with statutory and regulatory filings or engagements for those fiscal years, for Fidelity Blue Chip Value Fund, Fidelity Dividend Growth Fund, Fidelity Growth & Income Portfolio, Fidelity International Real Estate Fund, and Fidelity Leveraged Company Stock Fund (the Funds) and for all funds in the Fidelity Group of Funds are shown in the table below.
Fund | 2006A | 2005A,B |
Fidelity Blue Chip Value Fund | $38,000 | $28,000 |
Fidelity Dividend Growth Fund | $102,000 | $102,000 |
Fidelity Growth & Income Portfolio | $168,000 | $162,000 |
Fidelity International Real Estate Fund | $51,000 | $35,000 |
Fidelity Leveraged Company Stock Fund | $54,000 | $45,000 |
All funds in the Fidelity Group of Funds audited by PwC | $12,800,000 | $11,600,000 |
A | Aggregate amounts may reflect rounding. |
B | Fidelity International Real Estate Fund commenced operations on September 8, 2004. |
For the fiscal years ended July 31, 2006 and July 31, 2005, the aggregate Audit Fees billed by Deloitte & Touche LLP, the member firms of Deloitte Touche Tohmatsu, and their respective affiliates (collectively, "Deloitte Entities") for professional services rendered for the audits of the financial statements, or services that are normally provided in connection with statutory and regulatory filings or engagements for those fiscal years, for Fidelity Blue Chip Growth Fund, Fidelity OTC Portfolio and Fidelity Real Estate Income Fund (the Funds) and for all funds in the Fidelity Group of Funds are shown in the table below.
Fund | 2006A | 2005A |
Fidelity Blue Chip Growth Fund | $69,000 | $69,000 |
Fidelity OTC Portfolio | $48,000 | $52,000 |
Fidelity Real Estate Income Fund | $69,000 | $70,000 |
All funds in the Fidelity Group of Funds audited by Deloitte Entities | $5,900,000 | $4,800,000 |
A | Aggregate amounts may reflect rounding. |
(b) Audit-Related Fees.
In each of the fiscal years ended July 31, 2006 and July 31, 2005, the aggregate Audit-Related Fees billed by PwC for services rendered for assurance and related services to each Fund that are reasonably related to the performance of the audit or review of the Fund's financial statements, but not reported as Audit Fees, are shown in the table below.
Fund | 2006A | 2005 A,B |
Fidelity Blue Chip Value Fund | $0 | $0 |
Fidelity Dividend Growth Fund | $0 | $0 |
Fidelity Growth & Income Portfolio | $0 | $0 |
Fidelity International Real Estate Fund | $0 | $0 |
Fidelity Leveraged Company Stock Fund | $0 | $0 |
A | Aggregate amounts may reflect rounding. |
B | Fidelity International Real Estate Fund commenced operations on September 8, 2004. |
In each of the fiscal years ended July 31, 2006 and July 31, 2005, the aggregate Audit-Related Fees billed by Deloitte Entities for services rendered for assurance and related services to each Fund that are reasonably related to the performance of the audit or review of the Fund's financial statements, but not reported as Audit Fees, are shown in the table below.
Fund | 2006A | 2005 A |
Fidelity Blue Chip Growth Fund | $0 | $0 |
Fidelity OTC Portfolio | $0 | $0 |
Fidelity Real Estate Income Fund | $0 | $0 |
A | Aggregate amounts may reflect rounding. |
In each of the fiscal years ended July 31, 2006 and July 31, 2005, the aggregate Audit-Related Fees that were billed by PwC and Deloitte Entities that were required to be approved by the Audit Committee for services rendered on behalf of Fidelity Management & Research Company (FMR) and entities controlling, controlled by, or under common control with FMR (not including any sub-adviser whose role is primarily portfolio management and is subcontracted with or overseen by another investment adviser) that provide ongoing services to the Funds ("Fund Service Providers") for assurance and related services that relate directly to the operations and financial reporting of each Fund that are reasonably related to the performance of the audit or review of the Fund's financial statements, but not reported as Audit Fees, are shown in the table below.
Billed By | 2006 A | 2005A |
PwC | $0 | $0 |
Deloitte Entities | $0 | $0 |
A | Aggregate amounts may reflect rounding. |
Fees included in the audit-related category comprise assurance and related services (e.g., due diligence services) that are traditionally performed by the independent registered public accounting firm. These audit-related services include due diligence related to mergers and acquisitions, accounting consultations and audits in connection with acquisitions, internal control reviews, attest services that are not required by statute or regulation and consultation concerning financial accounting and reporting standards.
(c) Tax Fees.
In each of the fiscal years ended July 31, 2006 and July 31, 2005, the aggregate Tax Fees billed by PwC for professional services rendered for tax compliance, tax advice, and tax planning for each Fund is shown in the table below.
Fund | 2006A | 2005A,B |
Fidelity Blue Chip Value Fund | $2,700 | $2,500 |
Fidelity Dividend Growth Fund | $2,700 | $2,500 |
Fidelity Growth & Income Portfolio | $4,600 | $4,200 |
Fidelity International Real Estate Fund | $2,700 | $2,400 |
Fidelity Leveraged Company Stock Fund | $2,700 | $2,500 |
A | Aggregate amounts may reflect rounding. |
B | Fidelity International Real Estate Fund commenced operations on September 8, 2004. |
In each of the fiscal years ended July 31, 2006 and July 31, 2005, the aggregate Tax Fees billed by Deloitte Entities for professional services rendered for tax compliance, tax advice, and tax planning for each Fund is shown in the table below.
Fund | 2006A | 2005A |
Fidelity Blue Chip Growth Fund | $4,500 | $4,500 |
Fidelity OTC Portfolio | $4,500 | $4,500 |
Fidelity Real Estate Income Fund | $4,000 | $3,200 |
A | Aggregate amounts may reflect rounding. |
In each of the fiscal years ended July 31, 2006 and July 31, 2005, the aggregate Tax Fees billed by PwC and Deloitte Entities that were required to be approved by the Audit Committee for professional services rendered on behalf of the Fund Service Providers for tax compliance, tax advice, and tax planning that relate directly to the operations and financial reporting of each Fund is shown in the table below.
Billed By | 2006A | 2005A |
PwC | $0 | $0 |
Deloitte Entities | $0 | $0 |
A | Aggregate amounts may reflect rounding. |
Fees included in the Tax Fees category comprise all services performed by professional staff in the independent registered public accounting firm's tax division except those services related to the audit. Typically, this category would include fees for tax compliance, tax planning, and tax advice. Tax compliance, tax advice, and tax planning services include preparation of original and amended tax returns, claims for refund and tax payment-planning services, assistance with tax audits and appeals, tax advice related to mergers and acquisitions and requests for rulings or technical advice from taxing authorities.
(d) All Other Fees.
In each of the fiscal years ended July 31, 2006 and July 31, 2005, the aggregate Other Fees billed by PwC for all other non-audit services rendered to the Funds is shown in the table below.
Fund | 2006 | 2005A,B |
Fidelity Blue Chip Value Fund | $1,500 | $1,400 |
Fidelity Dividend Growth Fund | $15,600 | $17,700 |
Fidelity Growth & Income Portfolio | $27,900 | $28,800 |
Fidelity International Real Estate Fund | $1,600 | $1,100 |
Fidelity Leveraged Company Stock Fund | $4,500 | $3,200 |
A | Aggregate amounts may reflect rounding. |
B | Fidelity International Real Estate Fund commenced operations on September 8, 2004. |
In each of the fiscal years ended July 31, 2006 and July 31, 2005, the aggregate Other Fees billed by Deloitte Entities for all other non-audit services rendered to the Funds is shown in the table below.
Fund | 2006A | 2005A |
Fidelity Blue Chip Growth Fund | $0 | $0 |
Fidelity OTC Portfolio | $0 | $0 |
Fidelity Real Estate Income Fund | $0 | $0 |
A | Aggregate amounts may reflect rounding. |
In each of the fiscal years ended July 31, 2006 and July 31, 2005, the aggregate Other Fees billed by PwC and Deloitte Entities that were required to be approved by the Audit Committee for all other non-audit services rendered on behalf of the Fund Service Providers that relate directly to the operations and financial reporting of each Fund is shown in the table below.
Billed By | 2006A | 2005A |
PwC | $155,000 | $280,000 |
Deloitte Entities | $255,000 | $210,000 |
A | Aggregate amounts may reflect rounding. |
Fees included in the All Other Fees category include services related to internal control reviews, strategy and other consulting, financial information systems design and implementation, consulting on other information systems, and other tax services unrelated to the Fund.
(e) (1) | Audit Committee Pre-Approval Policies and Procedures: |
The trust's Audit Committee must pre-approve all audit and non-audit services provided by the independent registered public accounting firm relating to the operations or financial reporting of the funds. Prior to the commencement of any audit or non-audit services to a fund, the Audit Committee reviews the services to determine whether they are appropriate and permissible under applicable law.
The trust's Audit Committee has adopted policies and procedures to, among other purposes, provide a framework for the Committee's consideration of non-audit services by the audit firms that audit the Fidelity funds. The policies and procedures require that any non-audit service provided by a fund audit firm to a Fidelity Fund and any non-audit service provided by a fund auditor to a Fund Service Provider that relates directly to the operations and financial reporting of a Fidelity fund (Covered Service) are subject to approval by the Audit Committee before such service is provided. Non-audit services provided by a fund audit firm for a Fund Service Provider that do not relate directly to the operations and financial reporting of a Fidelity fund (Non-Covered Service) but that are expected to exceed $50,000 are also subject to pre-approval by the Audit Committee.
All Covered Services, as well as Non-Covered Services that are expected to exceed $50,000, must be approved in advance of provision of the service either: (i) by formal resolution of the Audit Committee, or (ii) by oral or written approval of the service by the Chair of the Audit Committee (or if the Chair is unavailable, such other member of the Audit Committee as may be designated by the Chair to act in the Chair's absence). The approval contemplated by (ii) above is permitted where the Treasurer determines that action on such an engagement is necessary before the next meeting of the Audit Committee. Neither pre-approval nor advance notice of Non-Covered Service engagements for which fees are not expected to exceed $50,000 is required; such engagements are to be reported to the Audit Committee monthly.
(e) (2) | Services approved pursuant to paragraph (c)(7)(i)(C) of Rule 2-01 of Regulation S-X: |
Audit-Related Fees:
There were no amounts that were approved by the Audit Committee pursuant to the de minimis exception for the fiscal years ended July 31, 2006 and July 31, 2005 on behalf of each fund.
There were no amounts that were required to be approved by the Audit Committee pursuant to the de minimis exception for the fiscal years ended July 31, 2006 and July 31, 2005 on behalf of the Fund Service Providers that relate directly to the operations and financial reporting of each Fund.
Tax Fees:
There were no amounts that were approved by the Audit Committee pursuant to the de minimis exception for the fiscal years ended July 31, 2006 and July 31, 2005 on behalf of each Fund.
There were no amounts that were required to be approved by the Audit Committee pursuant to the de minimis exception for the fiscal years ended July 31, 2006 and July 31, 2005 on behalf of the Fund Service Providers that relate directly to the operations and financial reporting of each Fund.
All Other Fees:
There were no amounts that were approved by the Audit Committee pursuant to the de minimis exception for the fiscal years ended July 31, 2006 and July 31, 2005 on behalf of each Fund.
There were no amounts that were required to be approved by the Audit Committee pursuant to the de minimis exception for the fiscal years ended July 31, 2006 and July 31, 2005 on behalf of the Fund Service Providers that relate directly to the operations and financial reporting of each Fund.
(f) Not applicable.
(g) For the fiscal years ended July 31, 2006 and July 31, 2005, the aggregate fees billed by PwC of $1,220,000A and $1,450,000A,B for non-audit services rendered on behalf of the Funds, FMR (not including any sub-adviser whose role is primarily portfolio management and is subcontracted with or overseen by another investment adviser) and Fund Service Providers relating to Covered Services and Non-Covered Services are shown in the table below.
| 2006A | 2005A |
Covered Services | $220,000 | $350,000 |
Non-Covered Services | $1,000,000 | $1,100,000 B |
A | Aggregate amounts may reflect rounding. |
B | Reflects current period presentation. |
For the fiscal years ended July 31, 2006 and July 31, 2005, the aggregate fees billed by Deloitte Entities of $640,000A and $575,000A,B for non-audit services rendered on behalf of the Funds, FMR (not including any sub-adviser whose role is primarily portfolio management and is subcontracted with or overseen by another investment adviser) and Fund Service Providers relating to Covered Services and Non-Covered Services are shown in the table below.
| 2006A | 2005A |
Covered Services | $270,000 | $250,000 |
Non-Covered Services | $370,000 | $325,000 B |
A | Aggregate amounts may reflect rounding. |
B | Reflects current period presentation. |
(h) The trust's Audit Committee has considered Non-Covered Services that were not pre-approved that were provided by PwC and Deloitte Entities to Fund Service Providers to be compatible with maintaining the independence of PwC and Deloitte Entities in their audit of the Funds, taking into account representations from PwC and Deloitte Entities, in accordance with Independence Standards Board Standard No.1, regarding their independence from the Funds and their related entities.
Item 5. Audit Committee of Listed Registrants
Not applicable.
Item 6. Schedule of Investments
Not applicable.
Item 7. Disclosure of Proxy Voting Policies and Procedures for Closed-End Management Investment Companies
Not applicable.
Item 8. Portfolio Managers of Closed-End Management Investment Companies
Not applicable.
Item 9. Purchase of Equity Securities by Closed-End Management Investment Company and Affiliated Purchasers
Not applicable.
Item 10. Submission of Matters to a Vote of Security Holders
There were no material changes to the procedures by which shareholders may recommend nominees to the Board of Trustees.
Item 11. Controls and Procedures
(a)(i) The President and Treasurer and the Chief Financial Officer have concluded that the disclosure controls and procedures (as defined in Rule 30a-3(c) under the Investment Company Act) for each Fund provide reasonable assurances that material information relating to such Fund is made known to them by the appropriate persons, based on their evaluation of these controls and procedures as of a date within 90 days of the filing date of this report.
(a)(ii) There was no change in a Fund's internal control over financial reporting (as defined in Rule 30a-3(d) under the Investment Company Act) that occurred during the second fiscal quarter of the period covered by this report that has materially affected, or is reasonably likely to materially affect, a Fund's internal control over financial reporting.
Item 12. Exhibits
(a) | (1) | Code of Ethics pursuant to Item 2 of Form N-CSR is filed and attached hereto as EX-99.CODE ETH. |
(a) | (2) | Certification pursuant to Rule 30a-2(a) under the Investment Company Act of 1940 (17 CFR 270.30a-2(a)) is filed and attached hereto as Exhibit 99.CERT. |
(a) | (3) | Not applicable. |
(b) | | Certification pursuant to Rule 30a-2(b) under the Investment Company Act of 1940 (17 CFR 270.30a-2(b)) is furnished and attached hereto as Exhibit 99.906CERT. |
SIGNATURES
Pursuant to the requirements of the Securities Exchange Act of 1934 and the Investment Company Act of 1940, the registrant has duly caused this report to be signed on its behalf by the undersigned, thereunto duly authorized.
Fidelity Securities Fund
By: | /s/Christine Reynolds |
| Christine Reynolds |
| President and Treasurer |
| |
Date: | September 26, 2006 |
Pursuant to the requirements of the Securities Exchange Act of 1934 and the Investment Company Act of 1940, this report has been signed below by the following persons on behalf of the registrant and in the capacities and on the dates indicated.
By: | /s/Christine Reynolds |
| Christine Reynolds |
| President and Treasurer |
| |
Date: | September 26, 2006 |
By: | /s/Joseph B. Hollis |
| Joseph B. Hollis |
| Chief Financial Officer |
| |
Date: | September 26, 2006 |