0000754510fmr:C000098199_2_AdditionalIndexMember_AsOf_2020Member2020-07-310000754510fmr:C000182861_1_BBIndexMember_1YRMember2023-07-312024-07-31
UNITED STATES
SECURITIES AND EXCHANGE COMMISSION
Washington, D.C. 20549
FORM N-CSR
CERTIFIED SHAREHOLDER REPORT OF REGISTERED
MANAGEMENT INVESTMENT COMPANIES
Investment Company Act file number 811-04118
Fidelity Securities Fund
(Exact name of registrant as specified in charter)
245 Summer St., Boston, Massachusetts 02210
(Address of principal executive offices) (Zip code)
Margaret Carey, Secretary
245 Summer St.
Boston, Massachusetts 02210
(Name and address of agent for service)
Registrant's telephone number, including area code:
617-563-7000
| |
Date of fiscal year end: | July 31 |
|
|
Date of reporting period: | July 31, 2024 |
Item 1.
Reports to Stockholders
| |
| | ANNUAL SHAREHOLDER REPORT | AS OF JULY 31, 2024 | This report describes changes to the Fund that occurred during the reporting period. |
| | Fidelity® Blue Chip Growth Fund Fidelity® Blue Chip Growth Fund Class K : FBGKX |
| | | |
This annual shareholder report contains information about Fidelity® Blue Chip Growth Fund for the period August 1, 2023 to July 31, 2024. You can find additional information about the Fund at fundresearch.fidelity.com/prospectus/sec. You can also request this information by contacting us at 1-800-835-5092 or by sending an e-mail to fidfunddocuments@fidelity.com.
What were your Fund costs for the last year?(based on hypothetical $10,000 investment)
FUND COST (PREVIOUS YEAR)
| | Costs of a $10,000 investment | Costs paid as a percentage of a $10,000 investment | |
| Class K | $ 47 | 0.41% | |
What affected the Fund's performance this period?
•U.S. equities gained for the 12 months ending July 31, 2024, driven by resilient corporate profits, a frenzy over generative artificial intelligence and the Federal Reserve's likely pivot to cutting interest rates later this year.
•Against this backdrop, security selection was the primary contributor to the fund's performance versus the benchmark for the fiscal year, especially within information technology. Picks in industrials also boosted the fund's relative performance. Also helping our relative result was an overweight in communication services, primarily within the media & entertainment industry.
•The top individual relative contributor by far was an overweight in Nvidia (+150%). The stock was the fund's biggest holding. A second notable relative contributor was an underweight in Apple (+14%). The company was among the fund's biggest holdings. Another notable relative contributor was a non-benchmark stake in Abercrombie & Fitch (+273%).
•In contrast, the biggest detractor from performance versus the benchmark was an overweight in consumer discretionary, especially within the consumer durables & apparel industry. Stock picks in consumer staples, primarily within the consumer staples distribution & retail industry, also hampered the fund's result, as did an underweight in information technology.
•The biggest individual relative detractor was an underweight in Broadcom (+82%). This was a position we established this period. The second-largest relative detractor was an overweight in Marvell Technology (+3%). The stock was one of our largest holdings. An overweight in Lululemon Athletica (-31%) also hurt.
•Notable changes in positioning include lower allocation to industrials.
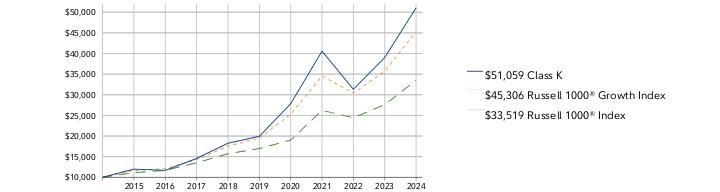
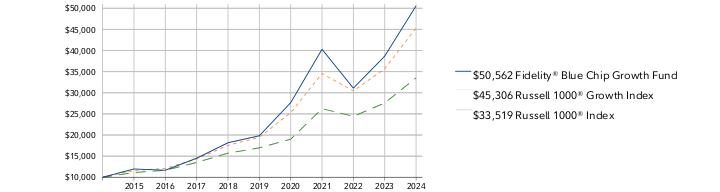
How did the Fund perform over the past 10 years?
CUMULATIVE PERFORMANCE
July 31, 2014 through July 31, 2024.
Initial investment of $10,000.
Class K | $10,000 | $11,984 | $11,688 | $14,566 | $18,256 | $19,935 | $27,822 | $40,573 | $31,330 | $39,021 | $51,059 |
Russell 1000® Growth Index | $10,000 | $11,608 | $12,113 | $14,299 | $17,566 | $19,467 | $25,275 | $34,546 | $30,426 | $35,692 | $45,306 |
Russell 1000® Index | $10,000 | $11,124 | $11,661 | $13,521 | $15,710 | $16,967 | $19,009 | $26,226 | $24,424 | $27,587 | $33,519 |
| | 2014 | 2015 | 2016 | 2017 | 2018 | 2019 | 2020 | 2021 | 2022 | 2023 | 2024 |
AVERAGE ANNUAL TOTAL RETURNS: | | 1 Year | 5 Year | 10 Year |
| Class K | 30.85% | 20.70% | 17.71% |
| Russell 1000® Growth Index | 26.94% | 18.41% | 16.31% |
| Russell 1000® Index | 21.50% | 14.59% | 12.86% |
Visit www.401k.com for more recent performance information. |
The Fund's past performance is not a good predictor of the Fund's future performance. The graph and table do not reflect the deduction of taxes that a shareholder would pay on fund distributions or redemption of fund shares. |
Key Fund Statistics (as of July 31, 2024)
KEY FACTS | | |
| Fund Size | $65,240,592,776 | |
| Number of Holdings | 397 | |
| Total Advisory Fee | $229,406,657 | |
| Portfolio Turnover | 22% | |
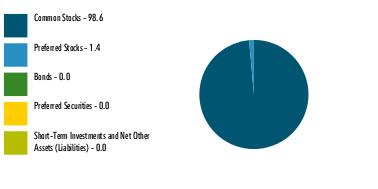
What did the Fund invest in?
(as of July 31, 2024)
MARKET SECTORS (% of Fund's net assets) | | |
| Information Technology | 45.3 | |
| Consumer Discretionary | 19.5 | |
| Communication Services | 15.6 | |
| Health Care | 7.7 | |
| Industrials | 4.6 | |
| Financials | 3.6 | |
| Energy | 1.5 | |
| Consumer Staples | 1.1 | |
| Materials | 0.8 | |
| Real Estate | 0.3 | |
| Utilities | 0.0 | |
| |
| Common Stocks | 98.6 |
| Preferred Stocks | 1.4 |
| Bonds | 0.0 |
| Preferred Securities | 0.0 |
| Short-Term Investments and Net Other Assets (Liabilities) | 0.0 |
ASSET ALLOCATION (% of Fund's net assets) |
|
|
| United States | 93.9 |
| China | 2.0 |
| India | 1.1 |
| Taiwan | 0.7 |
| Denmark | 0.6 |
| Canada | 0.4 |
| France | 0.2 |
| Netherlands | 0.2 |
| Switzerland | 0.2 |
| Others | 0.7 |
GEOGRAPHIC DIVERSIFICATION (% of Fund's net assets) |
|
| |
|
TOP HOLDINGS (% of Fund's net assets) | | |
| NVIDIA Corp | 13.5 | |
| Apple Inc | 11.2 | |
| Amazon.com Inc | 8.5 | |
| Microsoft Corp | 8.4 | |
| Alphabet Inc Class A | 6.5 | |
| Meta Platforms Inc Class A | 4.7 | |
| Marvell Technology Inc | 2.8 | |
| Eli Lilly & Co | 2.5 | |
| Netflix Inc | 2.1 | |
| Snap Inc Class A | 1.6 | |
| | 61.8 | |
| |
How has the Fund changed?
This is a summary of certain changes to the Fund since August 1, 2023. For more complete information, you may review the Fund's next prospectus, which we expect to be available by September 28, 2024 at fundresearch.fidelity.com/prospectus/sec or upon request at 1-800-835-5092 or by sending an e-mail to fidfunddocuments@fidelity.com.
The fees associated with this class changed during the reporting year. The variations in class fees are primarily the result of the following changes: - •Management fee
- •Performance adjustment fee
The fund's transfer agent and pricing & bookkeeping fees were changed to a fixed rate effective December 1, 2023, through February 29, 2024, in anticipation of the transition to a new management fee structure. Effective March 1, 2024, the fund's management contract was amended to incorporate administrative services previously covered under separate services agreements (transfer agent and pricing & bookkeeping). The amended contract incorporates a basic fee rate that may vary by class (subject to a performance adjustment). The Adviser or an affiliate pays certain expenses of managing and operating the fund out of each class's management fee. |
| Fidelity, the Fidelity Investments Logo and all other Fidelity trademarks or service marks used herein are trademarks or service marks of FMR LLC. Any third-party marks that are used herein are trademarks or service marks of their respective owners. © 2024 FMR LLC. All rights reserved. |
| | For additional information about the Fund; including its prospectus, financial information, holdings and proxy information, scan the QR code or visit fundresearch.fidelity.com/prospectus/sec 1.9913432.100 2078-TSRA-0924 |
| |
| | ANNUAL SHAREHOLDER REPORT | AS OF JULY 31, 2024 | This report describes changes to the Fund that occurred during the reporting period. |
| | Fidelity® Small Cap Growth Fund Fidelity Advisor® Small Cap Growth Fund Class I : FCIGX |
| | | |
This annual shareholder report contains information about Fidelity® Small Cap Growth Fund for the period August 1, 2023 to July 31, 2024. You can find additional information about the Fund at fundresearch.fidelity.com/prospectus/sec. You can also request this information by contacting us at 1-877-208-0098 or by sending an e-mail to fidfunddocuments@fidelity.com.
What were your Fund costs for the last year?(based on hypothetical $10,000 investment)
FUND COST (PREVIOUS YEAR)
| | Costs of a $10,000 investment | Costs paid as a percentage of a $10,000 investment | |
| Class I | $ 112 | 1.01% | |
What affected the Fund's performance this period?
•U.S. equities gained for the 12 months ending July 31, 2024, driven by resilient corporate profits, a frenzy over generative artificial intelligence and the Federal Reserve's likely pivot to cutting interest rates later this year.
•Against this backdrop, security selection was the primary contributor to the fund's performance versus the benchmark for the fiscal year, especially within industrials, where our stock picks in capital goods helped most. Stock choices in health care, primarily within the pharmaceuticals, biotechnology & life sciences industry, and consumer discretionary also boosted the fund's relative performance.
•The fund's non-benchmark stake in Vertiv Holdings (+227%) was the top individual relative contributor. The stock was not held at period end. The second-largest relative contributor was an overweight in FTAI Aviation (+253%). This period we increased our stake, and FTAI Aviation finished the fiscal year as one of our biggest holdings. Another notable relative contributor was our stake in Rover (+99%), a stock that was not held at period end.
•In contrast, the biggest detractors from performance versus the benchmark were overweight holdings in health care and energy. Picks in communication services also detracted from our relative result.
•The largest individual relative detractors were an overweight in agilon health (-64%) and a non-benchmark stake in Allegro MicroSystems (-51%). This period we increased our position in Allegro MicroSystems. Our stake in Abercrombie & Fitch (-20%) also detracted. This was an investment we established this period.
•Notable changes in positioning include increased exposure to the financials sector and a lower allocation to consumer staples.
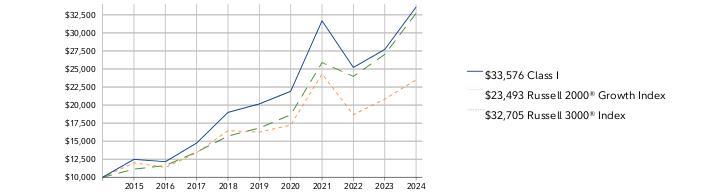
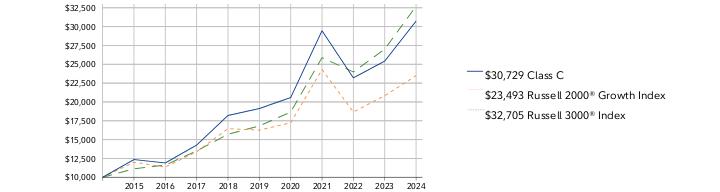
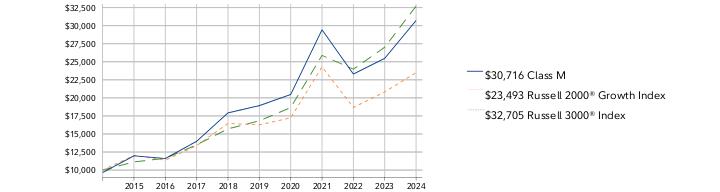
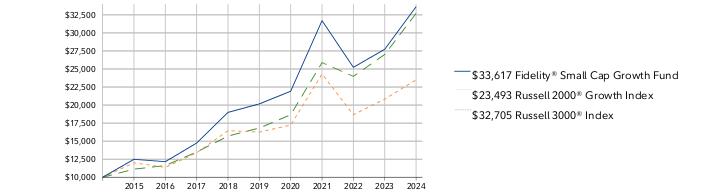
How did the Fund perform over the past 10 years?
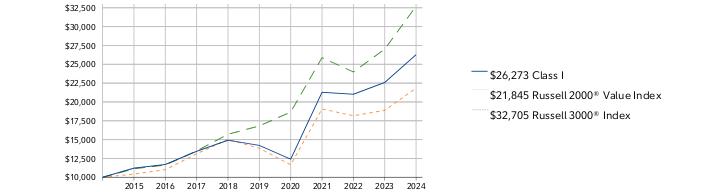
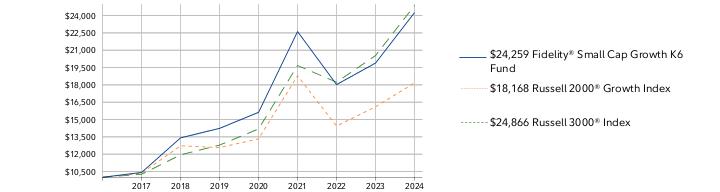
CUMULATIVE PERFORMANCE
July 31, 2014 through July 31, 2024.
Initial investment of $10,000.
Class I | $10,000 | $12,485 | $12,158 | $14,746 | $18,989 | $20,162 | $21,915 | $31,682 | $25,212 | $27,703 | $33,576 |
Russell 2000® Growth Index | $10,000 | $12,007 | $11,371 | $13,390 | $16,458 | $16,258 | $17,233 | $24,299 | $18,666 | $20,828 | $23,493 |
Russell 3000® Index | $10,000 | $11,128 | $11,623 | $13,498 | $15,711 | $16,819 | $18,657 | $25,882 | $23,979 | $27,013 | $32,705 |
| | 2014 | 2015 | 2016 | 2017 | 2018 | 2019 | 2020 | 2021 | 2022 | 2023 | 2024 |
AVERAGE ANNUAL TOTAL RETURNS: | | 1 Year | 5 Year | 10 Year |
| Class I | 21.20% | 10.74% | 12.88% |
| Russell 2000® Growth Index | 12.80% | 7.64% | 8.92% |
| Russell 3000® Index | 21.07% | 14.23% | 12.58% |
Visit institutional.fidelity.com for more recent performance information. |
The Fund's past performance is not a good predictor of the Fund's future performance. The graph and table do not reflect the deduction of taxes that a shareholder would pay on fund distributions or redemption of fund shares. |
Key Fund Statistics (as of July 31, 2024)
KEY FACTS | | |
| Fund Size | $7,489,579,269 | |
| Number of Holdings | 290 | |
| Total Advisory Fee | $51,167,416 | |
| Portfolio Turnover | 84% | |
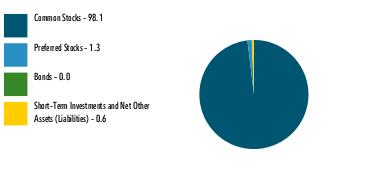
What did the Fund invest in?
(as of July 31, 2024)
MARKET SECTORS (% of Fund's net assets) | | |
| Health Care | 23.3 | |
| Industrials | 21.9 | |
| Information Technology | 19.6 | |
| Consumer Discretionary | 12.9 | |
| Financials | 6.6 | |
| Materials | 5.2 | |
| Energy | 4.7 | |
| Consumer Staples | 2.6 | |
| Real Estate | 1.4 | |
| Communication Services | 1.1 | |
| Utilities | 0.1 | |
| |
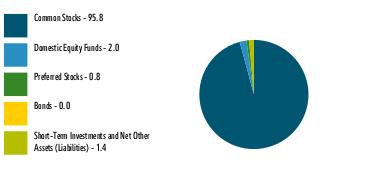
| Common Stocks | 98.1 |
| Preferred Stocks | 1.3 |
| Bonds | 0.0 |
| Short-Term Investments and Net Other Assets (Liabilities) | 0.6 |
ASSET ALLOCATION (% of Fund's net assets) |
|
|
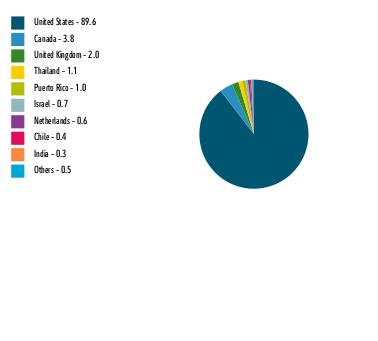
| United States | 91.6 |
| Israel | 2.8 |
| Canada | 1.0 |
| United Kingdom | 1.0 |
| Thailand | 0.8 |
| Netherlands | 0.5 |
| Japan | 0.5 |
| Sweden | 0.4 |
| Italy | 0.4 |
| Others | 1.0 |
GEOGRAPHIC DIVERSIFICATION (% of Fund's net assets) |
|
| |
|
TOP HOLDINGS (% of Fund's net assets) | | |
| Insight Enterprises Inc | 1.6 | |
| FTAI Aviation Ltd | 1.5 | |
| Wix.com Ltd | 1.3 | |
| TransMedics Group Inc | 1.3 | |
| Applied Industrial Technologies Inc | 1.2 | |
| Fluor Corp | 1.1 | |
| Carpenter Technology Corp | 1.0 | |
| Installed Building Products Inc | 1.0 | |
| TD SYNNEX Corp | 0.9 | |
| Brinker International Inc | 0.9 | |
| | 11.8 | |
| |
How has the Fund changed?
This is a summary of certain changes to the Fund since August 1, 2023. For more complete information, you may review the Fund's next prospectus, which we expect to be available by September 28, 2024 at fundresearch.fidelity.com/prospectus/sec or upon request at 1-877-208-0098 or by sending an e-mail to fidfunddocuments@fidelity.com.
The fees associated with this class changed during the reporting year. The variations in class fees are primarily the result of the following changes: - •Management fee
- •Performance adjustment fee
The fund's transfer agent and pricing & bookkeeping fees were changed to a fixed rate effective December 1, 2023, through February 29, 2024, in anticipation of the transition to a new management fee structure. Effective March 1, 2024, the fund's management contract was amended to incorporate administrative services previously covered under separate services agreements (transfer agent and pricing & bookkeeping). The amended contract incorporates a basic fee rate that may vary by class (subject to a performance adjustment). The Adviser or an affiliate pays certain expenses of managing and operating the fund out of each class's management fee. |
| Fidelity, the Fidelity Investments Logo and all other Fidelity trademarks or service marks used herein are trademarks or service marks of FMR LLC. Any third-party marks that are used herein are trademarks or service marks of their respective owners. © 2024 FMR LLC. All rights reserved. |
| | For additional information about the Fund; including its prospectus, financial information, holdings and proxy information, scan the QR code or visit fundresearch.fidelity.com/prospectus/sec 1.9913463.100 1382-TSRA-0924 |
| |
| | ANNUAL SHAREHOLDER REPORT | AS OF JULY 31, 2024 | This report describes changes to the Fund that occurred during the reporting period. |
| | Fidelity® Growth & Income Portfolio Fidelity® Growth & Income Portfolio : FGRIX |
| | | |
This annual shareholder report contains information about Fidelity® Growth & Income Portfolio for the period August 1, 2023 to July 31, 2024. You can find additional information about the Fund at fundresearch.fidelity.com/prospectus/sec. You can also request this information by contacting us at 1-800-544-8544 or by sending an e-mail to fidfunddocuments@fidelity.com.
What were your Fund costs for the last year?(based on hypothetical $10,000 investment)
FUND COST (PREVIOUS YEAR)
| | Costs of a $10,000 investment | Costs paid as a percentage of a $10,000 investment | |
| Fidelity® Growth & Income Portfolio | $ 61 | 0.56% | |
What affected the Fund's performance this period?
•U.S. equities gained for the 12 months ending July 31, 2024, driven by resilient corporate profits, a frenzy over generative artificial intelligence and the Federal Reserve's likely pivot to cutting interest rates later this year.
•Against this backdrop, market selection was the primary detractor from the fund's performance versus the S&P 500® index for the fiscal year, especially an underweight in information technology, where an underweight in semiconductors & semiconductor equipment hurt most. Stock picking and an underweight in communication services, primarily within the media & entertainment industry, also hampered the fund's result, as did security selection in materials. Lastly, the fund's position in cash detracted.
•The largest individual relative detractor was an underweight in Nvidia (+150%). This period we increased our position in Nvidia. The stock was one of our biggest holdings. The second-largest relative detractor was an overweight in Boeing (-22%). The company was among the fund's biggest holdings. Another notable relative detractor was our non-benchmark stake in First Quantum Minerals (-58%).
•In contrast, the biggest contributor to performance versus the benchmark was stock picking in industrials, primarily within the capital goods industry. Picks in health care, especially within the health care equipment & services industry, also boosted relative performance. Also contributing to our result was an underweight in consumer discretionary, primarily within the automobiles & components industry.
•The top individual relative contributor was an overweight in General Electric (+88%). The company was among the fund's biggest holdings. The second-largest relative contributor this period was avoiding Tesla, a benchmark component that returned -13%. An overweight in Wells Fargo (+30%) also contributed. The company was one of our biggest holdings.
•Notable changes in positioning include increased exposure to information technology.
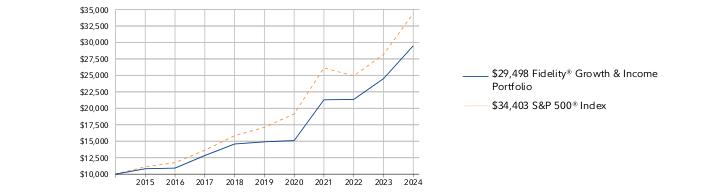
How did the Fund perform over the past 10 years?
CUMULATIVE PERFORMANCE
July 31, 2014 through July 31, 2024.
Initial investment of $10,000.
Fidelity® Growth & Income Portfolio | $10,000 | $10,823 | $10,918 | $12,826 | $14,578 | $14,908 | $15,097 | $21,289 | $21,345 | $24,497 | $29,498 |
S&P 500® Index | $10,000 | $11,121 | $11,745 | $13,629 | $15,843 | $17,108 | $19,153 | $26,134 | $24,921 | $28,165 | $34,403 |
| | 2014 | 2015 | 2016 | 2017 | 2018 | 2019 | 2020 | 2021 | 2022 | 2023 | 2024 |
AVERAGE ANNUAL TOTAL RETURNS: | | 1 Year | 5 Year | 10 Year |
| Fidelity® Growth & Income Portfolio | 20.41% | 14.62% | 11.42% |
| S&P 500® Index | 22.15% | 15.00% | 13.15% |
Visit www.fidelity.com for more recent performance information. |
The Fund's past performance is not a good predictor of the Fund's future performance. The graph and table do not reflect the deduction of taxes that a shareholder would pay on fund distributions or redemption of fund shares. |
Key Fund Statistics (as of July 31, 2024)
KEY FACTS | | |
| Fund Size | $10,757,029,257 | |
| Number of Holdings | 185 | |
| Total Advisory Fee | $44,965,159 | |
| Portfolio Turnover | 19% | |
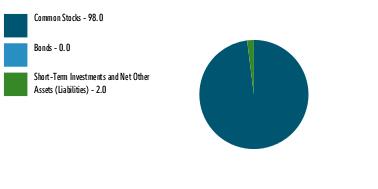
What did the Fund invest in?
(as of July 31, 2024)
MARKET SECTORS (% of Fund's net assets) | | |
| Information Technology | 24.3 | |
| Financials | 18.5 | |
| Industrials | 16.3 | |
| Health Care | 12.1 | |
| Energy | 9.9 | |
| Consumer Staples | 5.9 | |
| Communication Services | 4.0 | |
| Utilities | 2.4 | |
| Consumer Discretionary | 2.0 | |
| Real Estate | 1.4 | |
| Materials | 1.2 | |
| |
| Common Stocks | 98.0 |
| Bonds | 0.0 |
| Short-Term Investments and Net Other Assets (Liabilities) | 2.0 |
ASSET ALLOCATION (% of Fund's net assets) |
|
|
| United States | 90.9 |
| Canada | 1.6 |
| Germany | 1.3 |
| United Kingdom | 1.2 |
| Netherlands | 0.9 |
| Belgium | 0.8 |
| France | 0.6 |
| Zambia | 0.6 |
| China | 0.5 |
| Others | 1.6 |
GEOGRAPHIC DIVERSIFICATION (% of Fund's net assets) |
|
| |
|
TOP HOLDINGS (% of Fund's net assets) | | |
| Microsoft Corp | 8.2 | |
| Exxon Mobil Corp | 7.1 | |
| Wells Fargo & Co | 5.6 | |
| General Electric Co | 5.1 | |
| NVIDIA Corp | 4.2 | |
| Apple Inc | 3.0 | |
| Bank of America Corp | 2.8 | |
| UnitedHealth Group Inc | 2.1 | |
| Boeing Co | 1.9 | |
| Visa Inc Class A | 1.8 | |
| | 41.8 | |
| |
How has the Fund changed?
This is a summary of certain changes to the Fund since August 1, 2023. For more complete information, you may review the Fund's next prospectus, which we expect to be available by September 28, 2024 at fundresearch.fidelity.com/prospectus/sec or upon request at 1-800-544-8544 or by sending an e-mail to fidfunddocuments@fidelity.com.
The fund's transfer agent and pricing & bookkeeping fees were changed to a fixed rate effective December 1, 2023, through February 29, 2024, in anticipation of the transition to a new management fee structure. Effective March 1, 2024, the fund's management contract was amended to incorporate administrative services previously covered under separate services agreements (transfer agent and pricing & bookkeeping). The amended contract incorporates a management fee rate that may vary by class. The Adviser or an affiliate pays certain expenses of managing and operating the fund out of each class's management fee. | |
| Fidelity, the Fidelity Investments Logo and all other Fidelity trademarks or service marks used herein are trademarks or service marks of FMR LLC. Any third-party marks that are used herein are trademarks or service marks of their respective owners. © 2024 FMR LLC. All rights reserved. |
| | For additional information about the Fund; including its prospectus, financial information, holdings and proxy information, scan the QR code or visit fundresearch.fidelity.com/prospectus/sec 1.9913386.100 27-TSRA-0924 |
| |
| | ANNUAL SHAREHOLDER REPORT | AS OF JULY 31, 2024 | |
| | Fidelity® Blue Chip Growth K6 Fund Fidelity® Blue Chip Growth K6 Fund : FBCGX |
| | | |
This annual shareholder report contains information about Fidelity® Blue Chip Growth K6 Fund for the period August 1, 2023 to July 31, 2024. You can find additional information about the Fund at fundresearch.fidelity.com/prospectus/sec. You can also request this information by contacting us at 1-800-835-5092 or by sending an e-mail to fidfunddocuments@fidelity.com.
What were your Fund costs for the last year?(based on hypothetical $10,000 investment)
FUND COST (PREVIOUS YEAR)
| | Costs of a $10,000 investment | Costs paid as a percentage of a $10,000 investment | |
| Fidelity® Blue Chip Growth K6 Fund | $ 52 | 0.45% | |
What affected the Fund's performance this period?
•U.S. equities gained for the 12 months ending July 31, 2024, driven by resilient corporate profits, a frenzy over generative artificial intelligence and the Federal Reserve's likely pivot to cutting interest rates later this year.
•Against this backdrop, security selection was the primary contributor to the fund's performance versus the benchmark for the fiscal year, especially within information technology. Stock picks in industrials and health care, primarily within the pharmaceuticals, biotechnology & life sciences industry, also boosted the fund's relative performance.
•The top individual relative contributor by far was an overweight in Nvidia (+150%), the fund's biggest holding. An overweight in Meta Platforms (+49%) and an underweight in Apple (+14%), two of the fund's biggest holdings, also helped.
•In contrast, the biggest detractor from performance versus the benchmark was an underweight in information technology. Picks and an overweight in consumer discretionary, primarily within the consumer durables & apparel industry, also hampered the fund's result, as did picks in consumer staples, especially within the consumer staples distribution & retail industry.
•The largest individual relative detractor was an overweight in Marvell Technology (+3%), one of the fund's biggest holdings. It also hurt to underweight in Broadcom (+82%), an investment we established this period, and to hold a non-benchmark stake in ON Semiconductor (-28%).
•Notable changes in positioning include increased exposure to the financials sector and a lower allocation to consumer discretionary.
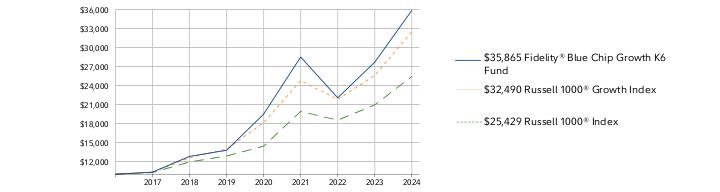
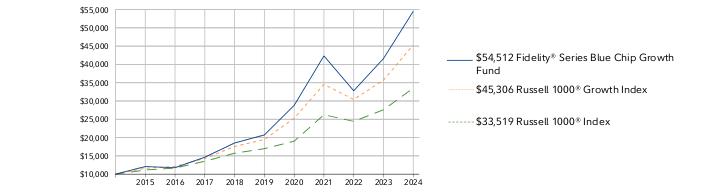
How did the Fund perform over the life of Fund?
CUMULATIVE PERFORMANCE
May 25, 2017 through July 31, 2024.
Initial investment of $10,000.
Fidelity® Blue Chip Growth K6 Fund | $10,000 | $10,320 | $12,807 | $13,764 | $19,483 | $28,499 | $22,052 | $27,686 |
Russell 1000® Growth Index | $10,000 | $10,255 | $12,597 | $13,961 | $18,126 | $24,774 | $21,819 | $25,596 |
Russell 1000® Index | $10,000 | $10,258 | $11,918 | $12,872 | $14,421 | $19,896 | $18,529 | $20,928 |
| | 2017 | 2018 | 2019 | 2020 | 2021 | 2022 | 2023 | 2024 |
AVERAGE ANNUAL TOTAL RETURNS: | | 1 Year | 5 Year | Life of Fund A |
| Fidelity® Blue Chip Growth K6 Fund | 29.54% | 21.11% | 19.44% |
| Russell 1000® Growth Index | 26.94% | 18.41% | 17.81% |
| Russell 1000® Index | 21.50% | 14.59% | 13.86% |
A From May 25, 2017
Visit www.401k.com for more recent performance information. |
The Fund's past performance is not a good predictor of the Fund's future performance. The graph and table do not reflect the deduction of taxes that a shareholder would pay on fund distributions or redemption of fund shares. |
Key Fund Statistics (as of July 31, 2024)
KEY FACTS | | |
| Fund Size | $15,453,476,056 | |
| Number of Holdings | 385 | |
| Total Advisory Fee | $56,871,896 | |
| Portfolio Turnover | 17% | |
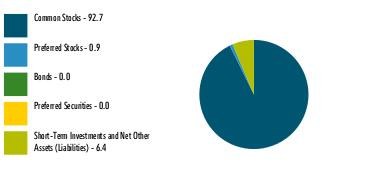
What did the Fund invest in?
(as of July 31, 2024)
MARKET SECTORS (% of Fund's net assets) | | |
| Information Technology | 39.4 | |
| Consumer Discretionary | 17.0 | |
| Communication Services | 15.2 | |
| Health Care | 8.4 | |
| Industrials | 5.1 | |
| Financials | 3.9 | |
| Consumer Staples | 2.3 | |
| Energy | 1.3 | |
| Materials | 0.7 | |
| Real Estate | 0.3 | |
| Utilities | 0.0 | |
| |
| Common Stocks | 92.7 |
| Preferred Stocks | 0.9 |
| Bonds | 0.0 |
| Preferred Securities | 0.0 |
| Short-Term Investments and Net Other Assets (Liabilities) | 6.4 |
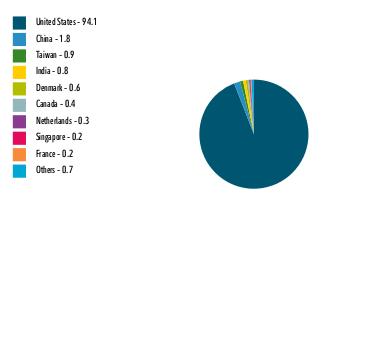
ASSET ALLOCATION (% of Fund's net assets) |
|
|
| United States | 94.1 |
| China | 1.8 |
| Taiwan | 0.9 |
| India | 0.8 |
| Denmark | 0.6 |
| Canada | 0.4 |
| Netherlands | 0.3 |
| Singapore | 0.2 |
| France | 0.2 |
| Others | 0.7 |
GEOGRAPHIC DIVERSIFICATION (% of Fund's net assets) |
|
| |
|
TOP HOLDINGS (% of Fund's net assets) | | |
| NVIDIA Corp | 13.7 | |
| Apple Inc | 5.9 | |
| Alphabet Inc Class A | 5.6 | |
| Amazon.com Inc | 5.2 | |
| Meta Platforms Inc Class A | 5.0 | |
| Microsoft Corp | 5.0 | |
| Eli Lilly & Co | 2.8 | |
| Marvell Technology Inc | 2.4 | |
| Netflix Inc | 2.2 | |
| Snap Inc Class A | 1.7 | |
| | 49.5 | |
| |
| Fidelity, the Fidelity Investments Logo and all other Fidelity trademarks or service marks used herein are trademarks or service marks of FMR LLC. Any third-party marks that are used herein are trademarks or service marks of their respective owners. © 2024 FMR LLC. All rights reserved. |
| | For additional information about the Fund; including its prospectus, financial information, holdings and proxy information, scan the QR code or visit fundresearch.fidelity.com/prospectus/sec 1.9913548.100 2945-TSRA-0924 |
| |
| | ANNUAL SHAREHOLDER REPORT | AS OF JULY 31, 2024 | This report describes changes to the Fund that occurred during the reporting period. |
| | Fidelity® Leveraged Company Stock Fund Fidelity® Leveraged Company Stock Fund Class K : FLCKX |
| | | |
This annual shareholder report contains information about Fidelity® Leveraged Company Stock Fund for the period August 1, 2023 to July 31, 2024. You can find additional information about the Fund at fundresearch.fidelity.com/prospectus/sec. You can also request this information by contacting us at 1-800-835-5092 or by sending an e-mail to fidfunddocuments@fidelity.com.
What were your Fund costs for the last year?(based on hypothetical $10,000 investment)
FUND COST (PREVIOUS YEAR)
| | Costs of a $10,000 investment | Costs paid as a percentage of a $10,000 investment | |
| Class K | $ 69 | 0.62% | |
What affected the Fund's performance this period?
•U.S. equities gained for the 12 months ending July 31, 2024, driven by resilient corporate profits, a frenzy over generative artificial intelligence and the Federal Reserve's likely pivot to cutting interest rates later this year.
•Against this backdrop, security selection was the primary contributor to the fund's performance versus the benchmark, the Russell Midcap Index, for the fiscal year, led by information technology, where our picks in semiconductors & semiconductor equipment helped most. Picks in utilities and communication services, primarily within the media & entertainment industry, also boosted the fund's relative performance.
•The fund's non-benchmark stake in Nvidia gained about 151% and was the top individual relative contributor. The company was the fund's biggest holding at period end. The second-largest relative contributor was an overweight in Vistra (+187%). The company was among our biggest holdings. Another notable relative contributor was a non-benchmark stake in Meta Platforms (+49%), the fund's top holding this period.
•In contrast, the biggest detractor from performance versus the benchmark was stock selection in materials. Also hurting our result were an overweight in communication services, primarily within the media & entertainment industry, and an underweight in industrials.
•The largest individual relative detractor was an overweight in ON Semiconductor (-27%). The company was among the biggest holdings. A non-benchmark stake in Tesla returned about -31% and was a second notable relative detractor. The stock was not held at period end. Another notable relative detractor was an overweight in Boyd Gaming (-10%), which was among the fund's biggest holdings this period.
•Notable changes in positioning include decreased exposure to the health care sector and a higher allocation to utilities.
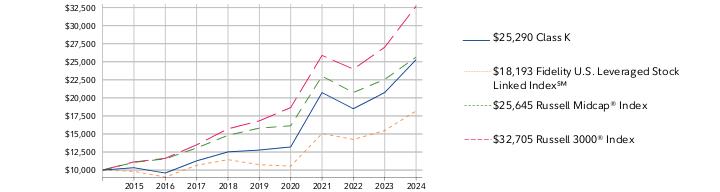
How did the Fund perform over the past 10 years?
CUMULATIVE PERFORMANCE
July 31, 2014 through July 31, 2024.
Initial investment of $10,000.
Class K | $10,000 | $10,326 | $9,589 | $11,276 | $12,518 | $12,773 | $13,204 | $20,731 | $18,498 | $20,739 | $25,290 |
Fidelity U.S. Leveraged Stock Linked Index℠ | $10,000 | $9,817 | $9,034 | $10,656 | $11,441 | $10,745 | $10,547 | $15,059 | $14,240 | $15,468 | $18,193 |
Russell Midcap® Index | $10,000 | $11,069 | $11,554 | $13,060 | $14,817 | $15,811 | $16,134 | $23,004 | $20,743 | $22,558 | $25,645 |
Russell 3000® Index | $10,000 | $11,128 | $11,623 | $13,498 | $15,711 | $16,819 | $18,657 | $25,882 | $23,979 | $27,013 | $32,705 |
| | 2014 | 2015 | 2016 | 2017 | 2018 | 2019 | 2020 | 2021 | 2022 | 2023 | 2024 |
AVERAGE ANNUAL TOTAL RETURNS: | | 1 Year | 5 Year | 10 Year |
| Class K | 21.95% | 14.64% | 9.72% |
| Fidelity U.S. Leveraged Stock Linked Index℠ | 17.62% | 11.11% | 6.17% |
| Russell Midcap® Index | 13.69% | 10.16% | 9.88% |
| Russell 3000® Index | 21.07% | 14.23% | 12.58% |
Visit www.401k.com for more recent performance information. |
The Fund's past performance is not a good predictor of the Fund's future performance. The graph and table do not reflect the deduction of taxes that a shareholder would pay on fund distributions or redemption of fund shares. |
Key Fund Statistics (as of July 31, 2024)
KEY FACTS | | |
| Fund Size | $2,667,917,613 | |
| Number of Holdings | 102 | |
| Total Advisory Fee | $13,687,002 | |
| Portfolio Turnover | 50% | |
What did the Fund invest in?
(as of July 31, 2024)
MARKET SECTORS (% of Fund's net assets) | | |
| Information Technology | 25.4 | |
| Industrials | 16.9 | |
| Consumer Discretionary | 15.5 | |
| Financials | 15.4 | |
| Utilities | 6.8 | |
| Communication Services | 6.7 | |
| Materials | 4.7 | |
| Energy | 4.2 | |
| Consumer Staples | 2.3 | |
| Health Care | 1.6 | |
| |
| Common Stocks | 99.5 |
| Short-Term Investments and Net Other Assets (Liabilities) | 0.5 |
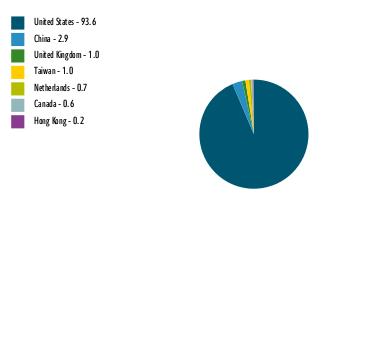
ASSET ALLOCATION (% of Fund's net assets) |
|
|
| United States | 93.6 |
| China | 2.9 |
| United Kingdom | 1.0 |
| Taiwan | 1.0 |
| Netherlands | 0.7 |
| Canada | 0.6 |
| Hong Kong | 0.2 |
GEOGRAPHIC DIVERSIFICATION (% of Fund's net assets) |
|
| |
|
TOP HOLDINGS (% of Fund's net assets) | | |
| NVIDIA Corp | 4.8 | |
| Arthur J Gallagher & Co | 4.0 | |
| Meta Platforms Inc Class A | 3.8 | |
| Microsoft Corp | 3.0 | |
| Apollo Global Management Inc | 3.0 | |
| Vistra Corp | 2.8 | |
| Constellation Energy Corp | 2.4 | |
| Parker-Hannifin Corp | 2.1 | |
| Cheniere Energy Inc | 2.1 | |
| ON Semiconductor Corp | 1.9 | |
| | 29.9 | |
| |
How has the Fund changed?
This is a summary of certain changes to the Fund since August 1, 2023. For more complete information, you may review the Fund's next prospectus, which we expect to be available by September 28, 2024 at fundresearch.fidelity.com/prospectus/sec or upon request at 1-800-835-5092 or by sending an e-mail to fidfunddocuments@fidelity.com.
Effective July 26, 2024, the fund's investment objective became a fundamental policy. | The fund's transfer agent and pricing & bookkeeping fees were changed to a fixed rate effective December 1, 2023, through February 29, 2024, in anticipation of the transition to a new management fee structure. Effective March 1, 2024, the fund's management contract was amended to incorporate administrative services previously covered under separate services agreements (transfer agent and pricing & bookkeeping). The amended contract incorporates a management fee rate that may vary by class. The Adviser or an affiliate pays certain expenses of managing and operating the fund out of each class's management fee. |
| Fidelity, the Fidelity Investments Logo and all other Fidelity trademarks or service marks used herein are trademarks or service marks of FMR LLC. Any third-party marks that are used herein are trademarks or service marks of their respective owners. © 2024 FMR LLC. All rights reserved. |
| | For additional information about the Fund; including its prospectus, financial information, holdings and proxy information, scan the QR code or visit fundresearch.fidelity.com/prospectus/sec 1.9913430.100 2094-TSRA-0924 |
| |
| | ANNUAL SHAREHOLDER REPORT | AS OF JULY 31, 2024 | This report describes changes to the Fund that occurred during the reporting period. |
| | Fidelity® OTC Portfolio Fidelity® OTC Portfolio : FOCPX |
| | | |
This annual shareholder report contains information about Fidelity® OTC Portfolio for the period August 1, 2023 to July 31, 2024. You can find additional information about the Fund at fundresearch.fidelity.com/prospectus/sec. You can also request this information by contacting us at 1-800-544-8544 or by sending an e-mail to fidfunddocuments@fidelity.com.
What were your Fund costs for the last year?(based on hypothetical $10,000 investment)
FUND COST (PREVIOUS YEAR)
| | Costs of a $10,000 investment | Costs paid as a percentage of a $10,000 investment | |
| Fidelity® OTC Portfolio | $ 85 | 0.75% | |
What affected the Fund's performance this period?
•U.S. equities gained for the 12 months ending July 31, 2024, driven by resilient corporate profits, a frenzy over generative artificial intelligence and the Federal Reserve's likely pivot to cutting interest rates later this year.
•Against this backdrop, security selection was the primary contributor to the fund's performance versus the NASDAQ Composite Index for the fiscal year, led by industrials, where our picks among capital goods stocks helped the most. Security selection in consumer discretionary and information technology also boosted the fund's relative performance.
•The top individual relative contributor was an underweight in Tesla (-13%), followed by a non-benchmark stake in Taiwan Semiconductor Manufacturing (+69%). The latter was among the fund's largest holdings. Out-of-benchmark exposure to Vertiv Holdings (+210%) was another plus.
•In contrast, the biggest detractor from performance versus the benchmark was stock picking in consumer staples. An overweight in energy and comparatively light exposure to the market-leading information technology sector hurt as well.
•The biggest individual relative detractor was an underweight in Broadcom (+82%). This was a stake we established this period. A larger-than-benchmark holding in Lululemon Athletica (-32%) further pressured relative performance, as did an outsized position in Marvell Technology (+3%), one of the fund's largest holdings.
•Notable changes in positioning include decreased exposure to the energy sector and a higher allocation to health care stocks.
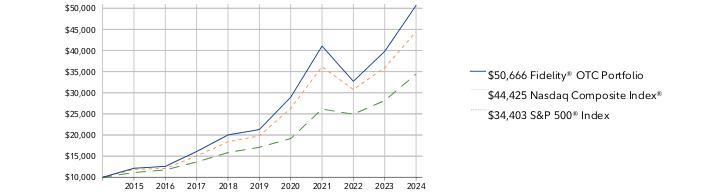
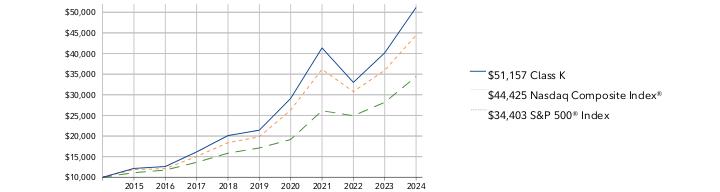
How did the Fund perform over the past 10 years?
CUMULATIVE PERFORMANCE
July 31, 2014 through July 31, 2024.
Initial investment of $10,000.
Fidelity® OTC Portfolio | $10,000 | $12,134 | $12,581 | $16,100 | $20,018 | $21,304 | $28,930 | $41,050 | $32,719 | $39,796 | $50,666 |
Nasdaq Composite Index® | $10,000 | $11,871 | $12,099 | $15,053 | $18,384 | $19,807 | $26,301 | $36,171 | $30,762 | $35,935 | $44,425 |
S&P 500® Index | $10,000 | $11,121 | $11,745 | $13,629 | $15,843 | $17,108 | $19,153 | $26,134 | $24,921 | $28,165 | $34,403 |
| | 2014 | 2015 | 2016 | 2017 | 2018 | 2019 | 2020 | 2021 | 2022 | 2023 | 2024 |
AVERAGE ANNUAL TOTAL RETURNS: | | 1 Year | 5 Year | 10 Year |
| Fidelity® OTC Portfolio | 27.31% | 18.92% | 17.62% |
| Nasdaq Composite Index® | 23.62% | 17.53% | 16.08% |
| S&P 500® Index | 22.15% | 15.00% | 13.15% |
Visit www.fidelity.com for more recent performance information. |
The Fund's past performance is not a good predictor of the Fund's future performance. The graph and table do not reflect the deduction of taxes that a shareholder would pay on fund distributions or redemption of fund shares. |
Key Fund Statistics (as of July 31, 2024)
KEY FACTS | | |
| Fund Size | $30,575,892,319 | |
| Number of Holdings | 160 | |
| Total Advisory Fee | $180,091,338 | |
| Portfolio Turnover | 37% | |
What did the Fund invest in?
(as of July 31, 2024)
MARKET SECTORS (% of Fund's net assets) | | |
| Information Technology | 45.0 | |
| Communication Services | 19.2 | |
| Consumer Discretionary | 12.3 | |
| Health Care | 7.4 | |
| Consumer Staples | 3.1 | |
| Financials | 2.4 | |
| Industrials | 2.2 | |
| Energy | 1.6 | |
| Utilities | 0.7 | |
| Real Estate | 0.2 | |
| Materials | 0.1 | |
| |
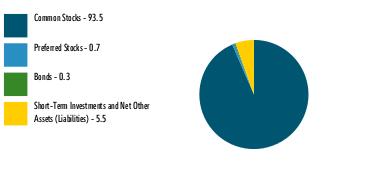
| Common Stocks | 93.5 |
| Preferred Stocks | 0.7 |
| Bonds | 0.3 |
| Short-Term Investments and Net Other Assets (Liabilities) | 5.5 |
ASSET ALLOCATION (% of Fund's net assets) |
|
|
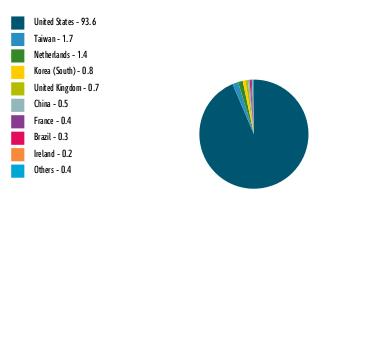
| United States | 93.9 |
| Taiwan | 1.5 |
| Netherlands | 1.3 |
| Korea (South) | 0.8 |
| China | 0.7 |
| United Kingdom | 0.6 |
| France | 0.4 |
| Brazil | 0.3 |
| Ireland | 0.2 |
| Others | 0.3 |
GEOGRAPHIC DIVERSIFICATION (% of Fund's net assets) |
|
| |
|
TOP HOLDINGS (% of Fund's net assets) | | |
| Apple Inc | 13.4 | |
| Microsoft Corp | 10.1 | |
| Amazon.com Inc | 8.4 | |
| NVIDIA Corp | 8.1 | |
| Alphabet Inc Class A | 6.6 | |
| Meta Platforms Inc Class A | 4.7 | |
| Alphabet Inc Class C | 2.9 | |
| Marvell Technology Inc | 2.3 | |
| Netflix Inc | 2.1 | |
| Regeneron Pharmaceuticals Inc | 1.7 | |
| | 60.3 | |
| |
How has the Fund changed?
This is a summary of certain changes to the Fund since August 1, 2023. For more complete information, you may review the Fund's next prospectus, which we expect to be available by September 28, 2024 at fundresearch.fidelity.com/prospectus/sec or upon request at 1-800-544-8544 or by sending an e-mail to fidfunddocuments@fidelity.com.
The fund's transfer agent and pricing and bookkeeping fees were changed to a fixed rate effective December 1, 2023, through February 29, 2024, in anticipation of the transition to a new management fee structure. Effective March 1, 2024, the fund's management contract was amended to incorporate administrative services previously covered under separate services agreements (transfer agent and pricing and bookkeeping).The amended contract incorporates a management fee rate that may vary by class (subject to a performance adjustment). The Adviser or an affiliate pays certain expenses of managing and operating the fund out of each class's management fee. | |
| Fidelity, the Fidelity Investments Logo and all other Fidelity trademarks or service marks used herein are trademarks or service marks of FMR LLC. Any third-party marks that are used herein are trademarks or service marks of their respective owners. © 2024 FMR LLC. All rights reserved. |
| | For additional information about the Fund; including its prospectus, financial information, holdings and proxy information, scan the QR code or visit fundresearch.fidelity.com/prospectus/sec 1.9913384.100 93-TSRA-0924 |
| |
| | ANNUAL SHAREHOLDER REPORT | AS OF JULY 31, 2024 | This report describes changes to the Fund that occurred during the reporting period. |
| | Fidelity® Dividend Growth Fund Fidelity® Dividend Growth Fund : FDGFX |
| | | |
This annual shareholder report contains information about Fidelity® Dividend Growth Fund for the period August 1, 2023 to July 31, 2024. You can find additional information about the Fund at fundresearch.fidelity.com/prospectus/sec. You can also request this information by contacting us at 1-800-544-8544 or by sending an e-mail to fidfunddocuments@fidelity.com.
What were your Fund costs for the last year?(based on hypothetical $10,000 investment)
FUND COST (PREVIOUS YEAR)
| | Costs of a $10,000 investment | Costs paid as a percentage of a $10,000 investment | |
| Fidelity® Dividend Growth Fund | $ 80 | 0.70% | |
What affected the Fund's performance this period?
•U.S. equities gained for the 12 months ending July 31, 2024, driven by resilient corporate profits, a frenzy over generative artificial intelligence and the Federal Reserve's likely pivot to cutting interest rates later this year.
•Against this backdrop, security selection was the primary contributor to the fund's performance versus the S&P 500® index for the fiscal year, especially within information technology. Stock picks in industrials and utilities also boosted the fund's relative performance, as did positioning in consumer discretionary.
•The fund's non-benchmark stake in Vertiv Holdings (201%) was the top individual relative contributor. We reduced our holding in the stock by period end. Other notable relative contributors included overweight positions in Vistra (+186%) and Nvidia (+150%). We trimmed our stake in Vistra but increased it in Nvidia, and the latter was the fund's largest holding at the end of the fiscal year.
•In contrast, the biggest detractors from performance versus the benchmark were: positioning in communication services, particularly within the media & entertainment industry; an underweight in information technology; and overweights in energy and utilities.
•The largest individual relative detractor was our overweight stake in Boeing (-20%), which was among the fund's largest holdings this period. Untimely positioning in Meta Platforms (+50%) and avoiding Amazon.com (+40%) also hurt. We increased our stakes in Boeing and Meta Platforms during the period.
•Notable changes in positioning include increased exposure to the communication services sector and a lower allocation to materials.
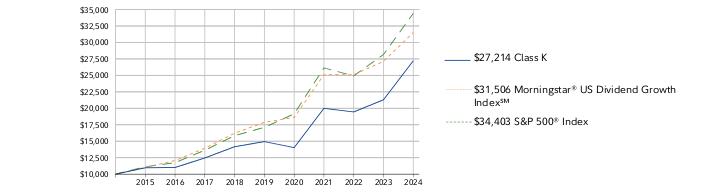
How did the Fund perform over the past 10 years?
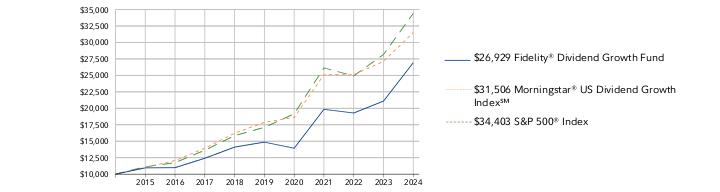
CUMULATIVE PERFORMANCE
July 31, 2014 through July 31, 2024.
Initial investment of $10,000.
Fidelity® Dividend Growth Fund | $10,000 | $10,954 | $10,982 | $12,416 | $14,104 | $14,863 | $13,935 | $19,846 | $19,284 | $21,094 | $26,929 |
Morningstar® US Dividend Growth Index℠ | $10,000 | $11,027 | $12,066 | $13,943 | $16,218 | $17,883 | $18,603 | $25,107 | $25,107 | $27,124 | $31,506 |
S&P 500® Index | $10,000 | $11,121 | $11,745 | $13,629 | $15,843 | $17,108 | $19,153 | $26,134 | $24,921 | $28,165 | $34,403 |
| | 2014 | 2015 | 2016 | 2017 | 2018 | 2019 | 2020 | 2021 | 2022 | 2023 | 2024 |
AVERAGE ANNUAL TOTAL RETURNS: | | 1 Year | 5 Year | 10 Year |
| Fidelity® Dividend Growth Fund | 27.66% | 12.62% | 10.41% |
| Morningstar® US Dividend Growth Index℠ | 16.15% | 11.99% | 12.16% |
| S&P 500® Index | 22.15% | 15.00% | 13.15% |
Visit www.fidelity.com for more recent performance information. |
The Fund's past performance is not a good predictor of the Fund's future performance. The graph and table do not reflect the deduction of taxes that a shareholder would pay on fund distributions or redemption of fund shares. |
Key Fund Statistics (as of July 31, 2024)
KEY FACTS | | |
| Fund Size | $7,979,890,820 | |
| Number of Holdings | 131 | |
| Total Advisory Fee | $40,966,988 | |
| Portfolio Turnover | 70% | |
What did the Fund invest in?
(as of July 31, 2024)
MARKET SECTORS (% of Fund's net assets) | | |
| Information Technology | 26.9 | |
| Industrials | 16.4 | |
| Financials | 13.1 | |
| Energy | 11.1 | |
| Communication Services | 8.5 | |
| Health Care | 8.0 | |
| Utilities | 6.3 | |
| Consumer Staples | 3.4 | |
| Materials | 2.5 | |
| Consumer Discretionary | 1.7 | |
| Real Estate | 1.2 | |
| |
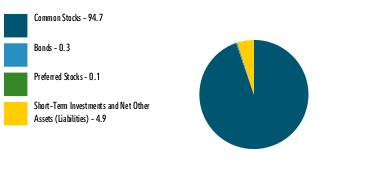
| Common Stocks | 99.1 |
| Short-Term Investments and Net Other Assets (Liabilities) | 0.9 |
ASSET ALLOCATION (% of Fund's net assets) |
|
|
| United States | 86.1 |
| Canada | 4.0 |
| United Kingdom | 2.1 |
| Korea (South) | 1.3 |
| India | 1.0 |
| Taiwan | 1.0 |
| Norway | 0.8 |
| Netherlands | 0.7 |
| Mexico | 0.5 |
| Others | 2.5 |
GEOGRAPHIC DIVERSIFICATION (% of Fund's net assets) |
|
| |
|
TOP HOLDINGS (% of Fund's net assets) | | |
| NVIDIA Corp | 6.4 | |
| Microsoft Corp | 5.9 | |
| Meta Platforms Inc Class A | 3.5 | |
| Exxon Mobil Corp | 3.1 | |
| Broadcom Inc | 2.9 | |
| Allison Transmission Holdings Inc | 2.4 | |
| QUALCOMM Inc | 2.2 | |
| Alphabet Inc Class A | 2.0 | |
| Apollo Global Management Inc | 2.0 | |
| Comcast Corp Class A | 1.9 | |
| | 32.3 | |
| |
How has the Fund changed?
This is a summary of certain changes to the Fund since August 1, 2023. For more complete information, you may review the Fund's next prospectus, which we expect to be available by September 28, 2024 at fundresearch.fidelity.com/prospectus/sec or upon request at 1-800-544-8544 or by sending an e-mail to fidfunddocuments@fidelity.com.
The fees associated with this class changed during the reporting year. The variations in class fees are primarily the result of the following changes: - •Management fee
- •Performance adjustment fee
The fund's transfer agent and pricing & bookkeeping fees were changed to a fixed rate effective December 1, 2023, through February 29, 2024, in anticipation of the transition to a new management fee structure. Effective March 1, 2024, the fund's management contract was amended to incorporate administrative services previously covered under separate services agreements (transfer agent and pricing & bookkeeping). The amended contract incorporates a management fee rate that may vary by class (subject to a performance adjustment). The Adviser or an affiliate pays certain expenses of managing and operating the fund out of each class's management fee. |
| Fidelity, the Fidelity Investments Logo and all other Fidelity trademarks or service marks used herein are trademarks or service marks of FMR LLC. Any third-party marks that are used herein are trademarks or service marks of their respective owners. © 2024 FMR LLC. All rights reserved. |
| | For additional information about the Fund; including its prospectus, financial information, holdings and proxy information, scan the QR code or visit fundresearch.fidelity.com/prospectus/sec 1.9913440.100 330-TSRA-0924 |
| |
| | ANNUAL SHAREHOLDER REPORT | AS OF JULY 31, 2024 | This report describes changes to the Fund that occurred during the reporting period. |
| | Fidelity® Growth & Income Portfolio Fidelity® Growth & Income Portfolio Class K : FGIKX |
| | | |
This annual shareholder report contains information about Fidelity® Growth & Income Portfolio for the period August 1, 2023 to July 31, 2024. You can find additional information about the Fund at fundresearch.fidelity.com/prospectus/sec. You can also request this information by contacting us at 1-800-835-5092 or by sending an e-mail to fidfunddocuments@fidelity.com.
What were your Fund costs for the last year?(based on hypothetical $10,000 investment)
FUND COST (PREVIOUS YEAR)
| | Costs of a $10,000 investment | Costs paid as a percentage of a $10,000 investment | |
| Class K | $ 51 | 0.47% | |
What affected the Fund's performance this period?
•U.S. equities gained for the 12 months ending July 31, 2024, driven by resilient corporate profits, a frenzy over generative artificial intelligence and the Federal Reserve's likely pivot to cutting interest rates later this year.
•Against this backdrop, market selection was the primary detractor from the fund's performance versus the S&P 500® index for the fiscal year, especially an underweight in information technology, where an underweight in semiconductors & semiconductor equipment hurt most. Stock picking and an underweight in communication services, primarily within the media & entertainment industry, also hampered the fund's result, as did security selection in materials. Lastly, the fund's position in cash detracted.
•The largest individual relative detractor was an underweight in Nvidia (+150%). This period we increased our position in Nvidia. The stock was one of our biggest holdings. The second-largest relative detractor was an overweight in Boeing (-22%). The company was among the fund's biggest holdings. Another notable relative detractor was our non-benchmark stake in First Quantum Minerals (-58%).
•In contrast, the biggest contributor to performance versus the benchmark was stock picking in industrials, primarily within the capital goods industry. Picks in health care, especially within the health care equipment & services industry, also boosted relative performance. Also contributing to our result was an underweight in consumer discretionary, primarily within the automobiles & components industry.
•The top individual relative contributor was an overweight in General Electric (+88%). The company was among the fund's biggest holdings. The second-largest relative contributor this period was avoiding Tesla, a benchmark component that returned -13%. An overweight in Wells Fargo (+30%) also contributed. The company was one of our biggest holdings.
•Notable changes in positioning include increased exposure to information technology.
How did the Fund perform over the past 10 years?
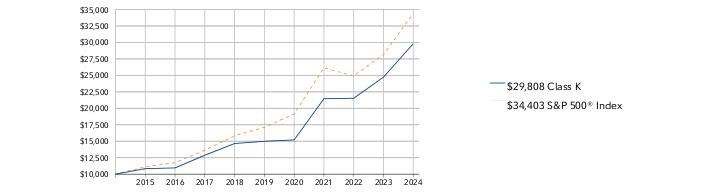
CUMULATIVE PERFORMANCE
July 31, 2014 through July 31, 2024.
Initial investment of $10,000.
Class K | $10,000 | $10,834 | $10,947 | $12,874 | $14,648 | $14,992 | $15,200 | $21,455 | $21,526 | $24,733 | $29,808 |
S&P 500® Index | $10,000 | $11,121 | $11,745 | $13,629 | $15,843 | $17,108 | $19,153 | $26,134 | $24,921 | $28,165 | $34,403 |
| | 2014 | 2015 | 2016 | 2017 | 2018 | 2019 | 2020 | 2021 | 2022 | 2023 | 2024 |
AVERAGE ANNUAL TOTAL RETURNS: | | 1 Year | 5 Year | 10 Year |
| Class K | 20.52% | 14.73% | 11.54% |
| S&P 500® Index | 22.15% | 15.00% | 13.15% |
Visit www.401k.com for more recent performance information. |
The Fund's past performance is not a good predictor of the Fund's future performance. The graph and table do not reflect the deduction of taxes that a shareholder would pay on fund distributions or redemption of fund shares. |
Key Fund Statistics (as of July 31, 2024)
KEY FACTS | | |
| Fund Size | $10,757,029,257 | |
| Number of Holdings | 185 | |
| Total Advisory Fee | $44,965,159 | |
| Portfolio Turnover | 19% | |
What did the Fund invest in?
(as of July 31, 2024)
MARKET SECTORS (% of Fund's net assets) | | |
| Information Technology | 24.3 | |
| Financials | 18.5 | |
| Industrials | 16.3 | |
| Health Care | 12.1 | |
| Energy | 9.9 | |
| Consumer Staples | 5.9 | |
| Communication Services | 4.0 | |
| Utilities | 2.4 | |
| Consumer Discretionary | 2.0 | |
| Real Estate | 1.4 | |
| Materials | 1.2 | |
| |
| Common Stocks | 98.0 |
| Bonds | 0.0 |
| Short-Term Investments and Net Other Assets (Liabilities) | 2.0 |
ASSET ALLOCATION (% of Fund's net assets) |
|
|
| United States | 90.9 |
| Canada | 1.6 |
| Germany | 1.3 |
| United Kingdom | 1.2 |
| Netherlands | 0.9 |
| Belgium | 0.8 |
| France | 0.6 |
| Zambia | 0.6 |
| China | 0.5 |
| Others | 1.6 |
GEOGRAPHIC DIVERSIFICATION (% of Fund's net assets) |
|
| |
|
TOP HOLDINGS (% of Fund's net assets) | | |
| Microsoft Corp | 8.2 | |
| Exxon Mobil Corp | 7.1 | |
| Wells Fargo & Co | 5.6 | |
| General Electric Co | 5.1 | |
| NVIDIA Corp | 4.2 | |
| Apple Inc | 3.0 | |
| Bank of America Corp | 2.8 | |
| UnitedHealth Group Inc | 2.1 | |
| Boeing Co | 1.9 | |
| Visa Inc Class A | 1.8 | |
| | 41.8 | |
| |
How has the Fund changed?
This is a summary of certain changes to the Fund since August 1, 2023. For more complete information, you may review the Fund's next prospectus, which we expect to be available by September 28, 2024 at fundresearch.fidelity.com/prospectus/sec or upon request at 1-800-835-5092 or by sending an e-mail to fidfunddocuments@fidelity.com.
The fund's transfer agent and pricing & bookkeeping fees were changed to a fixed rate effective December 1, 2023, through February 29, 2024, in anticipation of the transition to a new management fee structure. Effective March 1, 2024, the fund's management contract was amended to incorporate administrative services previously covered under separate services agreements (transfer agent and pricing & bookkeeping). The amended contract incorporates a management fee rate that may vary by class. The Adviser or an affiliate pays certain expenses of managing and operating the fund out of each class's management fee. | |
| Fidelity, the Fidelity Investments Logo and all other Fidelity trademarks or service marks used herein are trademarks or service marks of FMR LLC. Any third-party marks that are used herein are trademarks or service marks of their respective owners. © 2024 FMR LLC. All rights reserved. |
| | For additional information about the Fund; including its prospectus, financial information, holdings and proxy information, scan the QR code or visit fundresearch.fidelity.com/prospectus/sec 1.9913385.100 2089-TSRA-0924 |
| |
| | ANNUAL SHAREHOLDER REPORT | AS OF JULY 31, 2024 | This report describes changes to the Fund that occurred during the reporting period. |
| | Fidelity® Leveraged Company Stock Fund Fidelity® Leveraged Company Stock Fund : FLVCX |
| | | |
This annual shareholder report contains information about Fidelity® Leveraged Company Stock Fund for the period August 1, 2023 to July 31, 2024. You can find additional information about the Fund at fundresearch.fidelity.com/prospectus/sec. You can also request this information by contacting us at 1-800-544-8544 or by sending an e-mail to fidfunddocuments@fidelity.com.
What were your Fund costs for the last year?(based on hypothetical $10,000 investment)
FUND COST (PREVIOUS YEAR)
| | Costs of a $10,000 investment | Costs paid as a percentage of a $10,000 investment | |
| Fidelity® Leveraged Company Stock Fund | $ 80 | 0.72% | |
What affected the Fund's performance this period?
•U.S. equities gained for the 12 months ending July 31, 2024, driven by resilient corporate profits, a frenzy over generative artificial intelligence and the Federal Reserve's likely pivot to cutting interest rates later this year.
•Against this backdrop, security selection was the primary contributor to the fund's performance versus the benchmark, the Russell Midcap Index, for the fiscal year, led by information technology, where our picks in semiconductors & semiconductor equipment helped most. Picks in utilities and communication services, primarily within the media & entertainment industry, also boosted the fund's relative performance.
•The fund's non-benchmark stake in Nvidia gained about 151% and was the top individual relative contributor. The company was the fund's biggest holding at period end. The second-largest relative contributor was an overweight in Vistra (+187%). The company was among our biggest holdings. Another notable relative contributor was a non-benchmark stake in Meta Platforms (+49%), the fund's top holding this period.
•In contrast, the biggest detractor from performance versus the benchmark was stock selection in materials. Also hurting our result were an overweight in communication services, primarily within the media & entertainment industry, and an underweight in industrials.
•The largest individual relative detractor was an overweight in ON Semiconductor (-27%). The company was among the biggest holdings. A non-benchmark stake in Tesla returned about -31% and was a second notable relative detractor. The stock was not held at period end. Another notable relative detractor was an overweight in Boyd Gaming (-10%), which was among the fund's biggest holdings this period.
•Notable changes in positioning include decreased exposure to the health care sector and a higher allocation to utilities.
How did the Fund perform over the past 10 years?
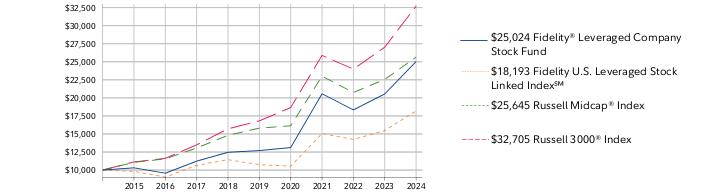
CUMULATIVE PERFORMANCE
July 31, 2014 through July 31, 2024.
Initial investment of $10,000.
Fidelity® Leveraged Company Stock Fund | $10,000 | $10,312 | $9,566 | $11,236 | $12,461 | $12,702 | $13,114 | $20,568 | $18,336 | $20,538 | $25,024 |
Fidelity U.S. Leveraged Stock Linked Index℠ | $10,000 | $9,817 | $9,034 | $10,656 | $11,441 | $10,745 | $10,547 | $15,059 | $14,240 | $15,468 | $18,193 |
Russell Midcap® Index | $10,000 | $11,069 | $11,554 | $13,060 | $14,817 | $15,811 | $16,134 | $23,004 | $20,743 | $22,558 | $25,645 |
Russell 3000® Index | $10,000 | $11,128 | $11,623 | $13,498 | $15,711 | $16,819 | $18,657 | $25,882 | $23,979 | $27,013 | $32,705 |
| | 2014 | 2015 | 2016 | 2017 | 2018 | 2019 | 2020 | 2021 | 2022 | 2023 | 2024 |
AVERAGE ANNUAL TOTAL RETURNS: | | 1 Year | 5 Year | 10 Year |
| Fidelity® Leveraged Company Stock Fund | 21.84% | 14.52% | 9.61% |
| Fidelity U.S. Leveraged Stock Linked Index℠ | 17.62% | 11.11% | 6.17% |
| Russell Midcap® Index | 13.69% | 10.16% | 9.88% |
| Russell 3000® Index | 21.07% | 14.23% | 12.58% |
Visit www.fidelity.com for more recent performance information. |
The Fund's past performance is not a good predictor of the Fund's future performance. The graph and table do not reflect the deduction of taxes that a shareholder would pay on fund distributions or redemption of fund shares. |
Key Fund Statistics (as of July 31, 2024)
KEY FACTS | | |
| Fund Size | $2,667,917,613 | |
| Number of Holdings | 102 | |
| Total Advisory Fee | $13,687,002 | |
| Portfolio Turnover | 50% | |
What did the Fund invest in?
(as of July 31, 2024)
MARKET SECTORS (% of Fund's net assets) | | |
| Information Technology | 25.4 | |
| Industrials | 16.9 | |
| Consumer Discretionary | 15.5 | |
| Financials | 15.4 | |
| Utilities | 6.8 | |
| Communication Services | 6.7 | |
| Materials | 4.7 | |
| Energy | 4.2 | |
| Consumer Staples | 2.3 | |
| Health Care | 1.6 | |
| |
| Common Stocks | 99.5 |
| Short-Term Investments and Net Other Assets (Liabilities) | 0.5 |
ASSET ALLOCATION (% of Fund's net assets) |
|
|
| United States | 93.6 |
| China | 2.9 |
| United Kingdom | 1.0 |
| Taiwan | 1.0 |
| Netherlands | 0.7 |
| Canada | 0.6 |
| Hong Kong | 0.2 |
GEOGRAPHIC DIVERSIFICATION (% of Fund's net assets) |
|
| |
|
TOP HOLDINGS (% of Fund's net assets) | | |
| NVIDIA Corp | 4.8 | |
| Arthur J Gallagher & Co | 4.0 | |
| Meta Platforms Inc Class A | 3.8 | |
| Microsoft Corp | 3.0 | |
| Apollo Global Management Inc | 3.0 | |
| Vistra Corp | 2.8 | |
| Constellation Energy Corp | 2.4 | |
| Parker-Hannifin Corp | 2.1 | |
| Cheniere Energy Inc | 2.1 | |
| ON Semiconductor Corp | 1.9 | |
| | 29.9 | |
| |
How has the Fund changed?
This is a summary of certain changes to the Fund since August 1, 2023. For more complete information, you may review the Fund's next prospectus, which we expect to be available by September 28, 2024 at fundresearch.fidelity.com/prospectus/sec or upon request at 1-800-544-8544 or by sending an e-mail to fidfunddocuments@fidelity.com.
Effective July 26, 2024, the fund's investment objective became a fundamental policy. | The fund's transfer agent and pricing & bookkeeping fees were changed to a fixed rate effective December 1, 2023, through February 29, 2024, in anticipation of the transition to a new management fee structure. Effective March 1, 2024, the fund's management contract was amended to incorporate administrative services previously covered under separate services agreements (transfer agent and pricing & bookkeeping). The amended contract incorporates a management fee rate that may vary by class. The Adviser or an affiliate pays certain expenses of managing and operating the fund out of each class's management fee. |
| Fidelity, the Fidelity Investments Logo and all other Fidelity trademarks or service marks used herein are trademarks or service marks of FMR LLC. Any third-party marks that are used herein are trademarks or service marks of their respective owners. © 2024 FMR LLC. All rights reserved. |
| | For additional information about the Fund; including its prospectus, financial information, holdings and proxy information, scan the QR code or visit fundresearch.fidelity.com/prospectus/sec 1.9913429.100 122-TSRA-0924 |
| |
| | ANNUAL SHAREHOLDER REPORT | AS OF JULY 31, 2024 | This report describes changes to the Fund that occurred during the reporting period. |
| | Fidelity® Real Estate Income Fund Fidelity® Real Estate Income Fund : FRIFX |
| | | |
This annual shareholder report contains information about Fidelity® Real Estate Income Fund for the period August 1, 2023 to July 31, 2024. You can find additional information about the Fund at fundresearch.fidelity.com/prospectus/sec. You can also request this information by contacting us at 1-800-544-8544 or by sending an e-mail to fidfunddocuments@fidelity.com.
What were your Fund costs for the last year?(based on hypothetical $10,000 investment)
FUND COST (PREVIOUS YEAR)
| | Costs of a $10,000 investment | Costs paid as a percentage of a $10,000 investment | |
| Fidelity® Real Estate Income Fund | $ 71 | 0.68% | |
What affected the Fund's performance this period?
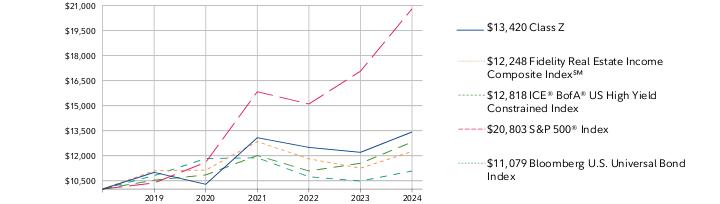
•Investors in real estate securities experienced often-fluctuating market conditions throughout the 12 months ending July 31, 2024, initially declining due to concerns about rate hikes but later rallying as hopes for rate cuts in 2024 grew.
•Against this backdrop, security selection was the primary contributor to the fund's performance versus the Fidelity Real Estate Income Composite IndexSM, a 40/25/20/15 blend of the ICE BofA® US Real Estate Index, the MSCI REIT Preferred Index, the FTSE® NAREIT® All REITs Index and the Bloomberg U.S. CMBS ex-AAA Index. Selection among preferred stocks and collateralized mortgage obligations stood out as helping relative performance. Asset allocation modestly contributed this period, especially among preferred stocks, while a stake in cash of roughly 7%, on average, also helped.
•The largest individual relative contributor was a common stock position in Welltower (+39%), an owner of senior-housing properties.
•In contrast, detractors included the fund's underweight in real estate bonds and security selection among real estate common stocks.
•The largest individual relative detractor was a real estate bond investment of Veritas related to a defaulted loan on apartment buildings in San Francisco. The holding lost all its value and was not held in the portfolio on July 31.
•Notable changes in positioning include increased exposure to investment-grade real estate bonds and reductions in high-yield real estate bonds, cash and preferred stocks.
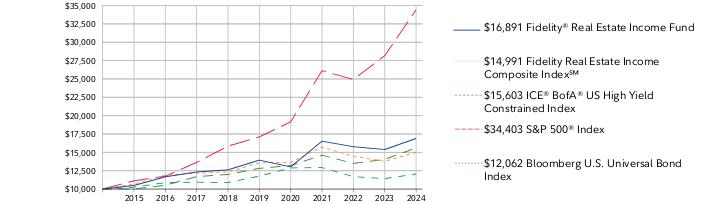
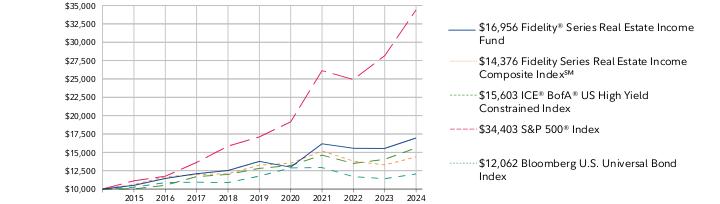
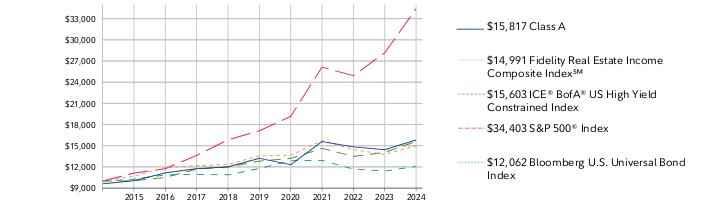
How did the Fund perform over the past 10 years?
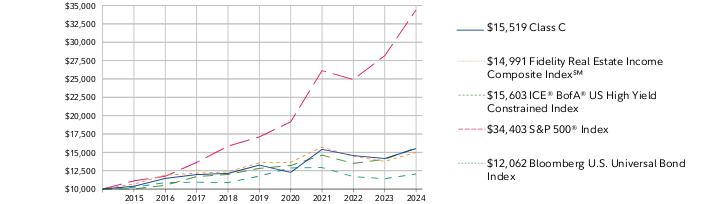
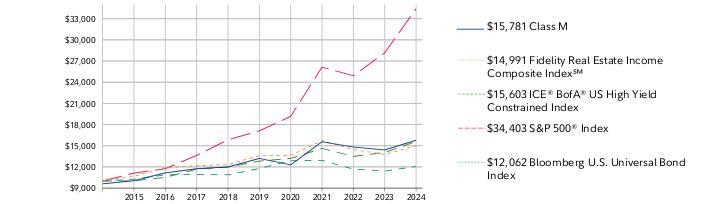
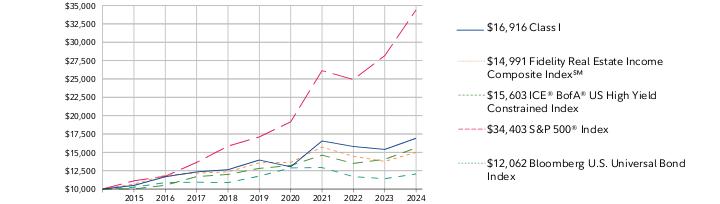
CUMULATIVE PERFORMANCE
July 31, 2014 through July 31, 2024.
Initial investment of $10,000.
Fidelity® Real Estate Income Fund | $10,000 | $10,484 | $11,668 | $12,321 | $12,617 | $13,938 | $13,020 | $16,519 | $15,766 | $15,384 | $16,891 |
Fidelity Real Estate Income Composite Index℠ | $10,000 | $10,669 | $11,896 | $12,161 | $12,343 | $13,577 | $13,629 | $15,721 | $14,457 | $13,774 | $14,991 |
ICE® BofA® US High Yield Constrained Index | $10,000 | $10,017 | $10,513 | $11,695 | $11,987 | $12,818 | $13,202 | $14,621 | $13,490 | $14,051 | $15,603 |
S&P 500® Index | $10,000 | $11,121 | $11,745 | $13,629 | $15,843 | $17,108 | $19,153 | $26,134 | $24,921 | $28,165 | $34,403 |
Bloomberg U.S. Universal Bond Index | $10,000 | $10,253 | $10,875 | $10,939 | $10,877 | $11,766 | $12,878 | $12,926 | $11,690 | $11,410 | $12,062 |
| | 2014 | 2015 | 2016 | 2017 | 2018 | 2019 | 2020 | 2021 | 2022 | 2023 | 2024 |
Effective June 1, 2024, the fund began comparing its performance to ICE® BofA® US High Yield Constrained Index rather than S&P 500® Index because the ICE® BofA® US High Yield Constrained Index conforms more closely to the fund's investment policies.
AVERAGE ANNUAL TOTAL RETURNS: | | 1 Year | 5 Year | 10 Year |
| Fidelity® Real Estate Income Fund | 9.79% | 3.92% | 5.38% |
| Fidelity Real Estate Income Composite Index℠ | 8.84% | 2.00% | 4.13% |
| ICE® BofA® US High Yield Constrained Index | 11.04% | 4.01% | 4.55% |
| S&P 500® Index | 22.15% | 15.00% | 13.15% |
| Bloomberg U.S. Universal Bond Index | 5.72% | 0.50% | 1.89% |
Effective June 1, 2024, the fund began comparing its performance to ICE® BofA® US High Yield Constrained Index rather than S&P 500® Index because the ICE® BofA® US High Yield Constrained Index conforms more closely to the fund's investment policies.
Visit www.fidelity.com for more recent performance information. |
The Fund's past performance is not a good predictor of the Fund's future performance. The graph and table do not reflect the deduction of taxes that a shareholder would pay on fund distributions or redemption of fund shares. |
Key Fund Statistics (as of July 31, 2024)
KEY FACTS | | |
| Fund Size | $4,786,766,888 | |
| Number of Holdings | 519 | |
| Total Advisory Fee | $25,368,688 | |
| Portfolio Turnover | 24% | |
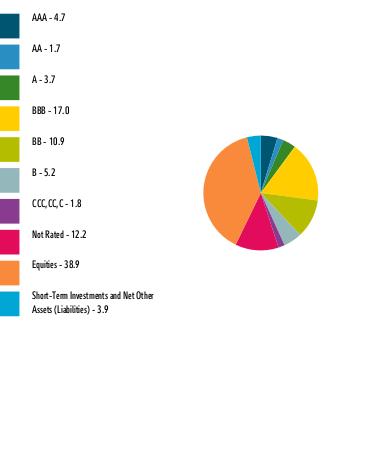
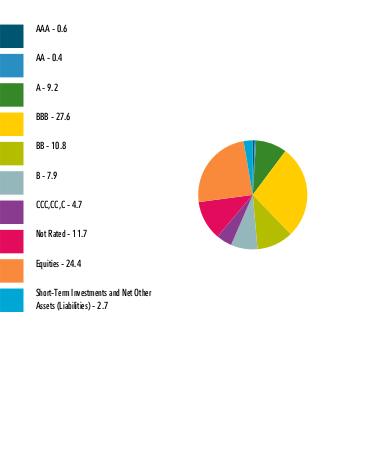
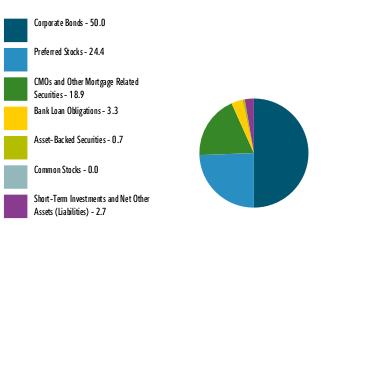
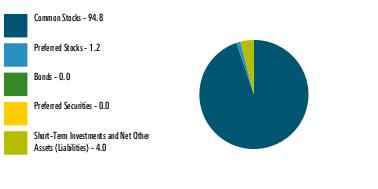
What did the Fund invest in?
(as of July 31, 2024)
| AAA | 4.7 |
| AA | 1.7 |
| A | 3.7 |
| BBB | 17.0 |
| BB | 10.9 |
| B | 5.2 |
| CCC,CC,C | 1.8 |
| Not Rated | 12.2 |
| Equities | 38.9 |
| Short-Term Investments and Net Other Assets (Liabilities) | 3.9 |
QUALITY DIVERSIFICATION (% of Fund's net assets) |
|
| |
| We have used ratings from Moody's Investors Service, Inc. Where Moody's® ratings are not available, we have used S&P® ratings. All ratings are as of the date indicated and do not reflect subsequent changes. |
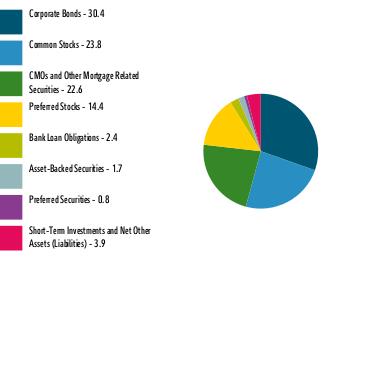
| Corporate Bonds | 30.4 |
| Common Stocks | 23.8 |
| CMOs and Other Mortgage Related Securities | 22.6 |
| Preferred Stocks | 14.4 |
| Bank Loan Obligations | 2.4 |
| Asset-Backed Securities | 1.7 |
| Preferred Securities | 0.8 |
| Short-Term Investments and Net Other Assets (Liabilities) | 3.9 |
ASSET ALLOCATION (% of Fund's net assets) |
|
|
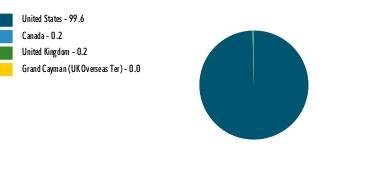
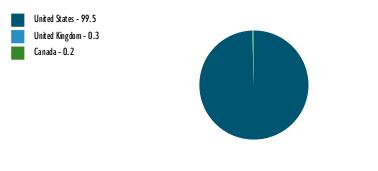
| United States | 99.6 |
| Canada | 0.2 |
| United Kingdom | 0.2 |
| Grand Cayman (UK Overseas Ter) | 0.0 |
GEOGRAPHIC DIVERSIFICATION (% of Fund's net assets) |
|
| |
|
TOP HOLDINGS (% of Fund's net assets) | | |
| American Tower Corp | 2.7 | |
| American Tower Corp | 2.5 | |
| Crown Castle Inc | 2.0 | |
| Equity LifeStyle Properties Inc | 1.9 | |
| Prologis Inc | 1.6 | |
| Welltower Inc | 1.5 | |
| Equinix Inc | 1.4 | |
| American Homes 4 Rent LP | 1.4 | |
| Crown Castle Inc | 1.3 | |
| Sun Communities Operating LP | 1.3 | |
| | 17.6 | |
| |
How has the Fund changed?
This is a summary of certain changes to the Fund since August 1, 2023. For more complete information, you may review the Fund's next prospectus, which we expect to be available by September 28, 2024 at fundresearch.fidelity.com/prospectus/sec or upon request at 1-800-544-8544 or by sending an e-mail to fidfunddocuments@fidelity.com.
The fees associated with this class changed during the reporting year. The variations in class fees are primarily the result of the following changes: - •Management fee
- •Operating expenses
The fund's transfer agent and pricing & bookkeeping fees were changed to a fixed rate effective December 1, 2023, through February 29, 2024, in anticipation of the transition to a new management fee structure. Effective March 1, 2024, the fund's management contract was amended to incorporate administrative services previously covered under separate services agreements (transfer agent and pricing & bookkeeping). The amended contract incorporates a basic fee rate that may vary by class (subject to a performance adjustment). The Adviser or an affiliate pays certain expenses of managing and operating the fund out of each class's management fee. |
| Fidelity, the Fidelity Investments Logo and all other Fidelity trademarks or service marks used herein are trademarks or service marks of FMR LLC. Any third-party marks that are used herein are trademarks or service marks of their respective owners. © 2024 FMR LLC. All rights reserved. |
| | For additional information about the Fund; including its prospectus, financial information, holdings and proxy information, scan the QR code or visit fundresearch.fidelity.com/prospectus/sec 1.9913478.100 833-TSRA-0924 |
| |
| | ANNUAL SHAREHOLDER REPORT | AS OF JULY 31, 2024 | This report describes changes to the Fund that occurred during the reporting period. |
| | Fidelity® Small Cap Value Fund Fidelity Advisor® Small Cap Value Fund Class I : FCVIX |
| | | |
This annual shareholder report contains information about Fidelity® Small Cap Value Fund for the period August 1, 2023 to July 31, 2024. You can find additional information about the Fund at fundresearch.fidelity.com/prospectus/sec. You can also request this information by contacting us at 1-877-208-0098 or by sending an e-mail to fidfunddocuments@fidelity.com.
What were your Fund costs for the last year?(based on hypothetical $10,000 investment)
FUND COST (PREVIOUS YEAR)
| | Costs of a $10,000 investment | Costs paid as a percentage of a $10,000 investment | |
| Class I | $ 111 | 1.03% | |
What affected the Fund's performance this period?
•U.S. equities gained for the 12 months ending July 31, 2024, driven by resilient corporate profits, a frenzy over generative artificial intelligence and the Federal Reserve's likely pivot to cutting interest rates later this year.
•Against this backdrop, security selection was the primary contributor to the fund's performance versus the Russell 2000 Value Index for the fiscal year, led by the information technology sector, especially technology hardware & equipment firms. Solid picks and an underweight in real estate also boosted relative performance. Investment choices in energy helped as well.
•A stake in XPO gained about 82% and was the top individual relative contributor, though the company was not held at period end. Our position in TechnipFMC gained approximately 61% and was another plus. This period we decreased our exposure to the stock. Another notable relative contributor was Insight Enterprises (+54%), one of our largest holdings. All of these contributors were non-benchmark positions.
•In contrast, the biggest detractor from performance versus the benchmark was stock selection in materials. Subpar picks in health care and utilities also hurt.
•The largest individual relative detractor was an outsized stake in O-I Glass (-52%), a stock that was not held at period end. An overweight in Brookfield Infrastructure (-13%), one of the fund's largest holdings this period, proved detrimental as well. Larger-than-benchmark exposure to Owens & Minor (-15%) also hurt.
•Notable changes in positioning include decreased exposure to the consumer discretionary sector and a higher allocation to real estate stocks.
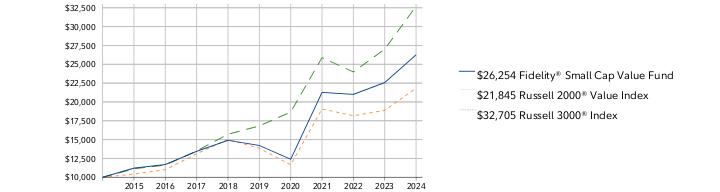
How did the Fund perform over the past 10 years?
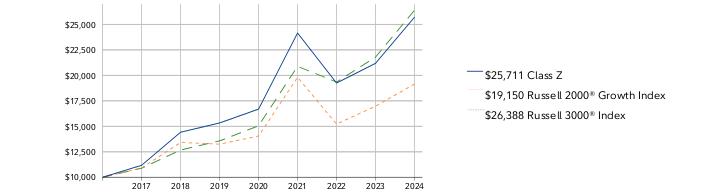
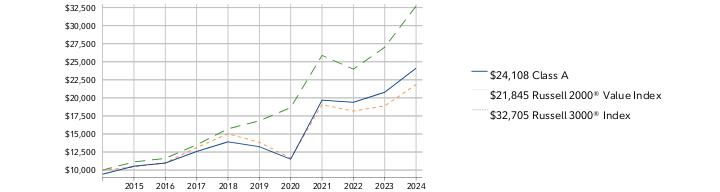
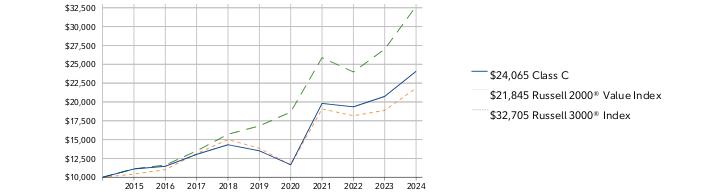
CUMULATIVE PERFORMANCE
July 31, 2014 through July 31, 2024.
Initial investment of $10,000.
Class I | $10,000 | $11,217 | $11,700 | $13,450 | $14,921 | $14,230 | $12,405 | $21,282 | $21,022 | $22,586 | $26,273 |
Russell 2000® Value Index | $10,000 | $10,430 | $11,013 | $13,129 | $15,016 | $13,858 | $11,653 | $19,076 | $18,167 | $18,883 | $21,845 |
Russell 3000® Index | $10,000 | $11,128 | $11,623 | $13,498 | $15,711 | $16,819 | $18,657 | $25,882 | $23,979 | $27,013 | $32,705 |
| | 2014 | 2015 | 2016 | 2017 | 2018 | 2019 | 2020 | 2021 | 2022 | 2023 | 2024 |
AVERAGE ANNUAL TOTAL RETURNS: | | 1 Year | 5 Year | 10 Year |
| Class I | 16.32% | 13.05% | 10.14% |
| Russell 2000® Value Index | 15.68% | 9.53% | 8.13% |
| Russell 3000® Index | 21.07% | 14.23% | 12.58% |
Visit institutional.fidelity.com for more recent performance information. |
The Fund's past performance is not a good predictor of the Fund's future performance. The graph and table do not reflect the deduction of taxes that a shareholder would pay on fund distributions or redemption of fund shares. |
Key Fund Statistics (as of July 31, 2024)
KEY FACTS | | |
| Fund Size | $5,128,532,088 | |
| Number of Holdings | 105 | |
| Total Advisory Fee | $41,899,156 | |
| Portfolio Turnover | 63% | |
What did the Fund invest in?
(as of July 31, 2024)
MARKET SECTORS (% of Fund's net assets) | | |
| Financials | 25.7 | |
| Industrials | 16.2 | |
| Information Technology | 9.5 | |
| Energy | 9.3 | |
| Real Estate | 8.9 | |
| Health Care | 7.9 | |
| Consumer Discretionary | 7.7 | |
| Materials | 4.6 | |
| Consumer Staples | 3.8 | |
| Utilities | 2.3 | |
| Communication Services | 1.4 | |
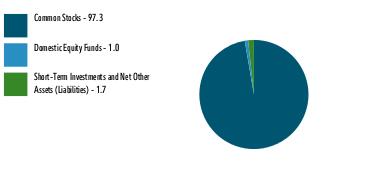
| |
| Common Stocks | 97.3 |
| Domestic Equity Funds | 1.0 |
| Short-Term Investments and Net Other Assets (Liabilities) | 1.7 |
ASSET ALLOCATION (% of Fund's net assets) |
|
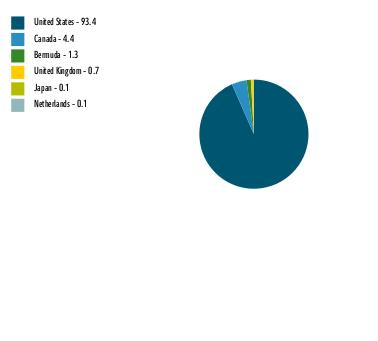
|
| United States | 93.4 |
| Canada | 4.4 |
| Bermuda | 1.3 |
| United Kingdom | 0.7 |
| Japan | 0.1 |
| Netherlands | 0.1 |
GEOGRAPHIC DIVERSIFICATION (% of Fund's net assets) |
|
| |
|
TOP HOLDINGS (% of Fund's net assets) | | |
| Eastern Bankshares Inc | 2.6 | |
| Graphic Packaging Holding CO | 2.5 | |
| Insight Enterprises Inc | 2.5 | |
| Brookfield Infrastructure Corp Class A (United States) | 2.3 | |
| Beacon Roofing Supply Inc | 2.2 | |
| Old Republic International Corp | 2.0 | |
| Primerica Inc | 2.0 | |
| AMN Healthcare Services Inc | 1.9 | |
| US Foods Holding Corp | 1.9 | |
| Lumentum Holdings Inc | 1.9 | |
| | 21.8 | |
| |
How has the Fund changed?
This is a summary of certain changes to the Fund since August 1, 2023. For more complete information, you may review the Fund's next prospectus, which we expect to be available by September 28, 2024 at fundresearch.fidelity.com/prospectus/sec or upon request at 1-877-208-0098 or by sending an e-mail to fidfunddocuments@fidelity.com.
The fund's transfer agent and pricing & bookkeeping fees were changed to a fixed rate effective December 1, 2023, through February 29, 2024, in anticipation of the transition to a new management fee structure. Effective March 1, 2024, the fund's management contract was amended to incorporate administrative services previously covered under separate services agreements (transfer agent and pricing & bookkeeping). The amended contract incorporates a basic fee rate that may vary by class (subject to a performance adjustment). The Adviser or an affiliate pays certain expenses of managing and operating the fund out of each class's management fee. | |
| Fidelity, the Fidelity Investments Logo and all other Fidelity trademarks or service marks used herein are trademarks or service marks of FMR LLC. Any third-party marks that are used herein are trademarks or service marks of their respective owners. © 2024 FMR LLC. All rights reserved. |
| | For additional information about the Fund; including its prospectus, financial information, holdings and proxy information, scan the QR code or visit fundresearch.fidelity.com/prospectus/sec 1.9913469.100 1387-TSRA-0924 |
| |
| | ANNUAL SHAREHOLDER REPORT | AS OF JULY 31, 2024 | This report describes changes to the Fund that occurred during the reporting period. |
| | Fidelity® Small Cap Growth Fund Fidelity Advisor® Small Cap Growth Fund Class Z : FIDGX |
| | | |
This annual shareholder report contains information about Fidelity® Small Cap Growth Fund for the period August 1, 2023 to July 31, 2024. You can find additional information about the Fund at fundresearch.fidelity.com/prospectus/sec. You can also request this information by contacting us at 1-877-208-0098 or by sending an e-mail to fidfunddocuments@fidelity.com.
What were your Fund costs for the last year?(based on hypothetical $10,000 investment)
FUND COST (PREVIOUS YEAR)
| | Costs of a $10,000 investment | Costs paid as a percentage of a $10,000 investment | |
| Class Z | $ 97 | 0.88% | |
What affected the Fund's performance this period?
•U.S. equities gained for the 12 months ending July 31, 2024, driven by resilient corporate profits, a frenzy over generative artificial intelligence and the Federal Reserve's likely pivot to cutting interest rates later this year.
•Against this backdrop, security selection was the primary contributor to the fund's performance versus the benchmark for the fiscal year, especially within industrials, where our stock picks in capital goods helped most. Stock choices in health care, primarily within the pharmaceuticals, biotechnology & life sciences industry, and consumer discretionary also boosted the fund's relative performance.
•The fund's non-benchmark stake in Vertiv Holdings (+227%) was the top individual relative contributor. The stock was not held at period end. The second-largest relative contributor was an overweight in FTAI Aviation (+253%). This period we increased our stake, and FTAI Aviation finished the fiscal year as one of our biggest holdings. Another notable relative contributor was our stake in Rover (+99%), a stock that was not held at period end.
•In contrast, the biggest detractors from performance versus the benchmark were overweight holdings in health care and energy. Picks in communication services also detracted from our relative result.
•The largest individual relative detractors were an overweight in agilon health (-64%) and a non-benchmark stake in Allegro MicroSystems (-51%). This period we increased our position in Allegro MicroSystems. Our stake in Abercrombie & Fitch (-20%) also detracted. This was an investment we established this period.
•Notable changes in positioning include increased exposure to the financials sector and a lower allocation to consumer staples.
How did the Fund perform over the life of Fund?
CUMULATIVE PERFORMANCE
February 1, 2017 through July 31, 2024.
Initial investment of $10,000.
Class Z | $10,000 | $11,178 | $14,422 | $15,329 | $16,688 | $24,156 | $19,246 | $21,183 |
Russell 2000® Growth Index | $10,000 | $10,915 | $13,415 | $13,252 | $14,047 | $19,807 | $15,216 | $16,978 |
Russell 3000® Index | $10,000 | $10,891 | $12,676 | $13,570 | $15,053 | $20,883 | $19,347 | $21,795 |
| | 2017 | 2018 | 2019 | 2020 | 2021 | 2022 | 2023 | 2024 |
AVERAGE ANNUAL TOTAL RETURNS: | | 1 Year | 5 Year | Life of Fund A |
| Class Z | 21.37% | 10.90% | 13.42% |
| Russell 2000® Growth Index | 12.80% | 7.64% | 9.05% |
| Russell 3000® Index | 21.07% | 14.23% | 13.81% |
A From February 1, 2017
Visit institutional.fidelity.com for more recent performance information. |
The Fund's past performance is not a good predictor of the Fund's future performance. The graph and table do not reflect the deduction of taxes that a shareholder would pay on fund distributions or redemption of fund shares. |
Key Fund Statistics (as of July 31, 2024)
KEY FACTS | | |
| Fund Size | $7,489,579,269 | |
| Number of Holdings | 290 | |
| Total Advisory Fee | $51,167,416 | |
| Portfolio Turnover | 84% | |
What did the Fund invest in?
(as of July 31, 2024)
MARKET SECTORS (% of Fund's net assets) | | |
| Health Care | 23.3 | |
| Industrials | 21.9 | |
| Information Technology | 19.6 | |
| Consumer Discretionary | 12.9 | |
| Financials | 6.6 | |
| Materials | 5.2 | |
| Energy | 4.7 | |
| Consumer Staples | 2.6 | |
| Real Estate | 1.4 | |
| Communication Services | 1.1 | |
| Utilities | 0.1 | |
| |
| Common Stocks | 98.1 |
| Preferred Stocks | 1.3 |
| Bonds | 0.0 |
| Short-Term Investments and Net Other Assets (Liabilities) | 0.6 |
ASSET ALLOCATION (% of Fund's net assets) |
|
|
| United States | 91.6 |
| Israel | 2.8 |
| Canada | 1.0 |
| United Kingdom | 1.0 |
| Thailand | 0.8 |
| Netherlands | 0.5 |
| Japan | 0.5 |
| Sweden | 0.4 |
| Italy | 0.4 |
| Others | 1.0 |
GEOGRAPHIC DIVERSIFICATION (% of Fund's net assets) |
|
| |
|
TOP HOLDINGS (% of Fund's net assets) | | |
| Insight Enterprises Inc | 1.6 | |
| FTAI Aviation Ltd | 1.5 | |
| Wix.com Ltd | 1.3 | |
| TransMedics Group Inc | 1.3 | |
| Applied Industrial Technologies Inc | 1.2 | |
| Fluor Corp | 1.1 | |
| Carpenter Technology Corp | 1.0 | |
| Installed Building Products Inc | 1.0 | |
| TD SYNNEX Corp | 0.9 | |
| Brinker International Inc | 0.9 | |
| | 11.8 | |
| |
How has the Fund changed?
This is a summary of certain changes to the Fund since August 1, 2023. For more complete information, you may review the Fund's next prospectus, which we expect to be available by September 28, 2024 at fundresearch.fidelity.com/prospectus/sec or upon request at 1-877-208-0098 or by sending an e-mail to fidfunddocuments@fidelity.com.
The fund's transfer agent and pricing & bookkeeping fees were changed to a fixed rate effective December 1, 2023, through February 29, 2024, in anticipation of the transition to a new management fee structure. Effective March 1, 2024, the fund's management contract was amended to incorporate administrative services previously covered under separate services agreements (transfer agent and pricing & bookkeeping). The amended contract incorporates a basic fee rate that may vary by class (subject to a performance adjustment). The Adviser or an affiliate pays certain expenses of managing and operating the fund out of each class's management fee. | |
| Fidelity, the Fidelity Investments Logo and all other Fidelity trademarks or service marks used herein are trademarks or service marks of FMR LLC. Any third-party marks that are used herein are trademarks or service marks of their respective owners. © 2024 FMR LLC. All rights reserved. |
| | For additional information about the Fund; including its prospectus, financial information, holdings and proxy information, scan the QR code or visit fundresearch.fidelity.com/prospectus/sec 1.9913465.100 2891-TSRA-0924 |
| |
| | ANNUAL SHAREHOLDER REPORT | AS OF JULY 31, 2024 | This report describes changes to the Fund that occurred during the reporting period. |
| | Fidelity® Real Estate Income Fund Fidelity Advisor® Real Estate Income Fund Class Z : FIKMX |
| | | |
This annual shareholder report contains information about Fidelity® Real Estate Income Fund for the period August 1, 2023 to July 31, 2024. You can find additional information about the Fund at fundresearch.fidelity.com/prospectus/sec. You can also request this information by contacting us at 1-877-208-0098 or by sending an e-mail to fidfunddocuments@fidelity.com.
What were your Fund costs for the last year?(based on hypothetical $10,000 investment)
FUND COST (PREVIOUS YEAR)
| | Costs of a $10,000 investment | Costs paid as a percentage of a $10,000 investment | |
| Class Z | $ 62 | 0.59% | |
What affected the Fund's performance this period?
•Investors in real estate securities experienced often-fluctuating market conditions throughout the 12 months ending July 31, 2024, initially declining due to concerns about rate hikes but later rallying as hopes for rate cuts in 2024 grew.
•Against this backdrop, security selection was the primary contributor to the fund's performance versus the Fidelity Real Estate Income Composite IndexSM, a 40/25/20/15 blend of the ICE BofA® US Real Estate Index, the MSCI REIT Preferred Index, the FTSE® NAREIT® All REITs Index and the Bloomberg U.S. CMBS ex-AAA Index. Selection among preferred stocks and collateralized mortgage obligations stood out as helping relative performance. Asset allocation modestly contributed this period, especially among preferred stocks, while a stake in cash of roughly 7%, on average, also helped.
•The largest individual relative contributor was a common stock position in Welltower (+39%), an owner of senior-housing properties.
•In contrast, detractors included the fund's underweight in real estate bonds and security selection among real estate common stocks.
•The largest individual relative detractor was a real estate bond investment of Veritas related to a defaulted loan on apartment buildings in San Francisco. The holding lost all its value and was not held in the portfolio on July 31.
•Notable changes in positioning include increased exposure to investment-grade real estate bonds and reductions in high-yield real estate bonds, cash and preferred stocks.
How did the Fund perform over the life of Fund?
CUMULATIVE PERFORMANCE
October 2, 2018 through July 31, 2024.
Initial investment of $10,000.
Class Z | $10,000 | $11,000 | $10,285 | $13,077 | $12,496 | $12,201 | $13,420 |
Fidelity Real Estate Income Composite Index℠ | $10,000 | $11,092 | $11,135 | $12,844 | $11,811 | $11,253 | $12,248 |
ICE® BofA® US High Yield Constrained Index | $10,000 | $10,531 | $10,846 | $12,012 | $11,083 | $11,544 | $12,818 |
S&P 500® Index | $10,000 | $10,365 | $11,604 | $15,833 | $15,098 | $17,064 | $20,803 |
Bloomberg U.S. Universal Bond Index | $10,000 | $10,807 | $11,829 | $11,872 | $10,737 | $10,480 | $11,079 |
| | 2018 | 2019 | 2020 | 2021 | 2022 | 2023 | 2024 |
Effective June 1, 2024, the fund began comparing its performance to ICE® BofA® US High Yield Constrained Index rather than S&P 500® Index because the ICE® BofA® US High Yield Constrained Index conforms more closely to the fund's investment policies.
AVERAGE ANNUAL TOTAL RETURNS: | | 1 Year | 5 Year | Life of Fund A |
| Class Z | 9.99% | 4.06% | 5.17% |
| Fidelity Real Estate Income Composite Index℠ | 8.84% | 2.00% | 3.54% |
| ICE® BofA® US High Yield Constrained Index | 11.04% | 4.01% | 4.35% |
| S&P 500® Index | 22.15% | 15.00% | 13.42% |
| Bloomberg U.S. Universal Bond Index | 5.72% | 0.50% | 1.77% |
A From October 2, 2018
Effective June 1, 2024, the fund began comparing its performance to ICE® BofA® US High Yield Constrained Index rather than S&P 500® Index because the ICE® BofA® US High Yield Constrained Index conforms more closely to the fund's investment policies.
Visit institutional.fidelity.com for more recent performance information. |
The Fund's past performance is not a good predictor of the Fund's future performance. The graph and table do not reflect the deduction of taxes that a shareholder would pay on fund distributions or redemption of fund shares. |
Key Fund Statistics (as of July 31, 2024)
KEY FACTS | | |
| Fund Size | $4,786,766,888 | |
| Number of Holdings | 519 | |
| Total Advisory Fee | $25,368,688 | |
| Portfolio Turnover | 24% | |
What did the Fund invest in?
(as of July 31, 2024)
| AAA | 4.7 |
| AA | 1.7 |
| A | 3.7 |
| BBB | 17.0 |
| BB | 10.9 |
| B | 5.2 |
| CCC,CC,C | 1.8 |
| Not Rated | 12.2 |
| Equities | 38.9 |
| Short-Term Investments and Net Other Assets (Liabilities) | 3.9 |
QUALITY DIVERSIFICATION (% of Fund's net assets) |
|
| |
| We have used ratings from Moody's Investors Service, Inc. Where Moody's® ratings are not available, we have used S&P® ratings. All ratings are as of the date indicated and do not reflect subsequent changes. |
| Corporate Bonds | 30.4 |
| Common Stocks | 23.8 |
| CMOs and Other Mortgage Related Securities | 22.6 |
| Preferred Stocks | 14.4 |
| Bank Loan Obligations | 2.4 |
| Asset-Backed Securities | 1.7 |
| Preferred Securities | 0.8 |
| Short-Term Investments and Net Other Assets (Liabilities) | 3.9 |
ASSET ALLOCATION (% of Fund's net assets) |
|
|
| United States | 99.6 |
| Canada | 0.2 |
| United Kingdom | 0.2 |
| Grand Cayman (UK Overseas Ter) | 0.0 |
GEOGRAPHIC DIVERSIFICATION (% of Fund's net assets) |
|
| |
|
TOP HOLDINGS (% of Fund's net assets) | | |
| American Tower Corp | 2.7 | |
| American Tower Corp | 2.5 | |
| Crown Castle Inc | 2.0 | |
| Equity LifeStyle Properties Inc | 1.9 | |
| Prologis Inc | 1.6 | |
| Welltower Inc | 1.5 | |
| Equinix Inc | 1.4 | |
| American Homes 4 Rent LP | 1.4 | |
| Crown Castle Inc | 1.3 | |
| Sun Communities Operating LP | 1.3 | |
| | 17.6 | |
| |
How has the Fund changed?
This is a summary of certain changes to the Fund since August 1, 2023. For more complete information, you may review the Fund's next prospectus, which we expect to be available by September 28, 2024 at fundresearch.fidelity.com/prospectus/sec or upon request at 1-877-208-0098 or by sending an e-mail to fidfunddocuments@fidelity.com.
The fund's transfer agent and pricing & bookkeeping fees were changed to a fixed rate effective December 1, 2023, through February 29, 2024, in anticipation of the transition to a new management fee structure. Effective March 1, 2024, the fund's management contract was amended to incorporate administrative services previously covered under separate services agreements (transfer agent and pricing & bookkeeping). The amended contract incorporates a basic fee rate that may vary by class (subject to a performance adjustment). The Adviser or an affiliate pays certain expenses of managing and operating the fund out of each class's management fee. | |
| Fidelity, the Fidelity Investments Logo and all other Fidelity trademarks or service marks used herein are trademarks or service marks of FMR LLC. Any third-party marks that are used herein are trademarks or service marks of their respective owners. © 2024 FMR LLC. All rights reserved. |
| | For additional information about the Fund; including its prospectus, financial information, holdings and proxy information, scan the QR code or visit fundresearch.fidelity.com/prospectus/sec 1.9913477.100 3302-TSRA-0924 |
| |
| | ANNUAL SHAREHOLDER REPORT | AS OF JULY 31, 2024 | This report describes changes to the Fund that occurred during the reporting period. |
| | Fidelity® Dividend Growth Fund Fidelity® Dividend Growth Fund Class K : FDGKX |
| | | |
This annual shareholder report contains information about Fidelity® Dividend Growth Fund for the period August 1, 2023 to July 31, 2024. You can find additional information about the Fund at fundresearch.fidelity.com/prospectus/sec. You can also request this information by contacting us at 1-800-835-5092 or by sending an e-mail to fidfunddocuments@fidelity.com.
What were your Fund costs for the last year?(based on hypothetical $10,000 investment)
FUND COST (PREVIOUS YEAR)
| | Costs of a $10,000 investment | Costs paid as a percentage of a $10,000 investment | |
| Class K | $ 70 | 0.61% | |
What affected the Fund's performance this period?
•U.S. equities gained for the 12 months ending July 31, 2024, driven by resilient corporate profits, a frenzy over generative artificial intelligence and the Federal Reserve's likely pivot to cutting interest rates later this year.
•Against this backdrop, security selection was the primary contributor to the fund's performance versus the S&P 500® index for the fiscal year, especially within information technology. Stock picks in industrials and utilities also boosted the fund's relative performance, as did positioning in consumer discretionary.
•The fund's non-benchmark stake in Vertiv Holdings (201%) was the top individual relative contributor. We reduced our holding in the stock by period end. Other notable relative contributors included overweight positions in Vistra (+186%) and Nvidia (+150%). We trimmed our stake in Vistra but increased it in Nvidia, and the latter was the fund's largest holding at the end of the fiscal year.
•In contrast, the biggest detractors from performance versus the benchmark were: positioning in communication services, particularly within the media & entertainment industry; an underweight in information technology; and overweights in energy and utilities.
•The largest individual relative detractor was our overweight stake in Boeing (-20%), which was among the fund's largest holdings this period. Untimely positioning in Meta Platforms (+50%) and avoiding Amazon.com (+40%) also hurt. We increased our stakes in Boeing and Meta Platforms during the period.
•Notable changes in positioning include increased exposure to the communication services sector and a lower allocation to materials.
How did the Fund perform over the past 10 years?
CUMULATIVE PERFORMANCE
July 31, 2014 through July 31, 2024.
Initial investment of $10,000.
Class K | $10,000 | $10,965 | $11,008 | $12,457 | $14,164 | $14,942 | $14,029 | $19,995 | $19,445 | $21,295 | $27,214 |
Morningstar® US Dividend Growth Index℠ | $10,000 | $11,027 | $12,066 | $13,943 | $16,218 | $17,883 | $18,603 | $25,107 | $25,107 | $27,124 | $31,506 |
S&P 500® Index | $10,000 | $11,121 | $11,745 | $13,629 | $15,843 | $17,108 | $19,153 | $26,134 | $24,921 | $28,165 | $34,403 |
| | 2014 | 2015 | 2016 | 2017 | 2018 | 2019 | 2020 | 2021 | 2022 | 2023 | 2024 |
AVERAGE ANNUAL TOTAL RETURNS: | | 1 Year | 5 Year | 10 Year |
| Class K | 27.79% | 12.74% | 10.53% |
| Morningstar® US Dividend Growth Index℠ | 16.15% | 11.99% | 12.16% |
| S&P 500® Index | 22.15% | 15.00% | 13.15% |
Visit www.401k.com for more recent performance information. |
The Fund's past performance is not a good predictor of the Fund's future performance. The graph and table do not reflect the deduction of taxes that a shareholder would pay on fund distributions or redemption of fund shares. |
Key Fund Statistics (as of July 31, 2024)
KEY FACTS | | |
| Fund Size | $7,979,890,820 | |
| Number of Holdings | 131 | |
| Total Advisory Fee | $40,966,988 | |
| Portfolio Turnover | 70% | |
What did the Fund invest in?
(as of July 31, 2024)
MARKET SECTORS (% of Fund's net assets) | | |
| Information Technology | 26.9 | |
| Industrials | 16.4 | |
| Financials | 13.1 | |
| Energy | 11.1 | |
| Communication Services | 8.5 | |
| Health Care | 8.0 | |
| Utilities | 6.3 | |
| Consumer Staples | 3.4 | |
| Materials | 2.5 | |
| Consumer Discretionary | 1.7 | |
| Real Estate | 1.2 | |
| |
| Common Stocks | 99.1 |
| Short-Term Investments and Net Other Assets (Liabilities) | 0.9 |
ASSET ALLOCATION (% of Fund's net assets) |
|
|
| United States | 86.1 |
| Canada | 4.0 |
| United Kingdom | 2.1 |
| Korea (South) | 1.3 |
| India | 1.0 |
| Taiwan | 1.0 |
| Norway | 0.8 |
| Netherlands | 0.7 |
| Mexico | 0.5 |
| Others | 2.5 |
GEOGRAPHIC DIVERSIFICATION (% of Fund's net assets) |
|
| |
|
TOP HOLDINGS (% of Fund's net assets) | | |
| NVIDIA Corp | 6.4 | |
| Microsoft Corp | 5.9 | |
| Meta Platforms Inc Class A | 3.5 | |
| Exxon Mobil Corp | 3.1 | |
| Broadcom Inc | 2.9 | |
| Allison Transmission Holdings Inc | 2.4 | |
| QUALCOMM Inc | 2.2 | |
| Alphabet Inc Class A | 2.0 | |
| Apollo Global Management Inc | 2.0 | |
| Comcast Corp Class A | 1.9 | |
| | 32.3 | |
| |
How has the Fund changed?
This is a summary of certain changes to the Fund since August 1, 2023. For more complete information, you may review the Fund's next prospectus, which we expect to be available by September 28, 2024 at fundresearch.fidelity.com/prospectus/sec or upon request at 1-800-835-5092 or by sending an e-mail to fidfunddocuments@fidelity.com.
The fees associated with this class changed during the reporting year. The variations in class fees are primarily the result of the following changes: - •Management fee
- •Performance adjustment fee
The fund's transfer agent and pricing & bookkeeping fees were changed to a fixed rate effective December 1, 2023, through February 29, 2024, in anticipation of the transition to a new management fee structure. Effective March 1, 2024, the fund's management contract was amended to incorporate administrative services previously covered under separate services agreements (transfer agent and pricing & bookkeeping). The amended contract incorporates a management fee rate that may vary by class (subject to a performance adjustment). The Adviser or an affiliate pays certain expenses of managing and operating the fund out of each class's management fee. |
| Fidelity, the Fidelity Investments Logo and all other Fidelity trademarks or service marks used herein are trademarks or service marks of FMR LLC. Any third-party marks that are used herein are trademarks or service marks of their respective owners. © 2024 FMR LLC. All rights reserved. |
| | For additional information about the Fund; including its prospectus, financial information, holdings and proxy information, scan the QR code or visit fundresearch.fidelity.com/prospectus/sec 1.9913439.100 2083-TSRA-0924 |
| |
| | ANNUAL SHAREHOLDER REPORT | AS OF JULY 31, 2024 | |
| | Fidelity® Series Real Estate Income Fund Fidelity® Series Real Estate Income Fund : FSREX |
| | | |
This annual shareholder report contains information about Fidelity® Series Real Estate Income Fund for the period August 1, 2023 to July 31, 2024. You can find additional information about the Fund at fundresearch.fidelity.com/prospectus/sec. You can also request this information by contacting us at 1-800-544-8544.
What were your Fund costs for the last year?(based on hypothetical $10,000 investment)
FUND COST (PREVIOUS YEAR)
| | Costs of a $10,000 investment | Costs paid as a percentage of a $10,000 investment | |
| Fidelity® Series Real Estate Income Fund | $ 0 A | 0.00%B | |
A Amount represents less than $.50
B Amount represents less than 0.005%
What affected the Fund's performance this period?
•Investors in real estate securities experienced often-fluctuating market conditions throughout the 12 months ending July 31, 2024, initially declining due to concerns about rate hikes but later rallying as hopes for rate cuts in 2024 grew.
•Against this backdrop, security selection modestly contributed to the fund's performance versus the Fidelity Real Estate Income Composite IndexSM, a 60/25/15 blend of the ICE BofA® US Real Estate Index, the MSCI REIT Preferred Index and the Bloomberg U.S. CMBS ex-AAA Index.
•Selection among preferred stocks and an overweight in commercial mortgage-backed securities also helped relative performance.
•The largest individual relative contributor was a CMBS position referred to as COMM 2012-CR1 C CSTR 5/45.
•In contrast, security selection in commercial mortgage-backed securities detracted, as did picks among real estate bonds and an overweight in preferreds.
•The largest individual relative detractor was a real estate bond investment of Veritas related to a defaulted loan on apartment buildings in San Francisco. The holding lost all its value and was not held in the portfolio on July 31.
•On June 1, 2024, the commercial mortgage-backed securities (CMBS) component of the fund's supplemental benchmark was updated from the Bloomberg U.S. CMBS ex-AAA Index to the Bloomberg U.S. CMBS ex-AAA ex-Agency Guaranteed Index, which better reflects the strategy's focus within the CMBS universe.
How did the Fund perform over the past 10 years?
CUMULATIVE PERFORMANCE
July 31, 2014 through July 31, 2024.
Initial investment of $10,000.
Fidelity® Series Real Estate Income Fund | $10,000 | $10,505 | $11,443 | $12,090 | $12,526 | $13,767 | $12,985 | $16,165 | $15,554 | $15,535 | $16,956 |
Fidelity Series Real Estate Income Composite Index℠ | $10,000 | $10,603 | $11,676 | $11,968 | $12,087 | $13,256 | $13,508 | $15,181 | $13,811 | $13,282 | $14,376 |
ICE® BofA® US High Yield Constrained Index | $10,000 | $10,017 | $10,513 | $11,695 | $11,987 | $12,818 | $13,202 | $14,621 | $13,490 | $14,051 | $15,603 |
S&P 500® Index | $10,000 | $11,121 | $11,745 | $13,629 | $15,843 | $17,108 | $19,153 | $26,134 | $24,921 | $28,165 | $34,403 |
Bloomberg U.S. Universal Bond Index | $10,000 | $10,253 | $10,875 | $10,939 | $10,877 | $11,766 | $12,878 | $12,926 | $11,690 | $11,410 | $12,062 |
| | 2014 | 2015 | 2016 | 2017 | 2018 | 2019 | 2020 | 2021 | 2022 | 2023 | 2024 |
Effective August 1, 2023, the fund began comparing its performance to ICE® BofA® US High Yield Constrained Index rather than S&P 500® Index because the ICE® BofA® US High Yield Constrained Index conforms more closely to the fund's investment policies.
AVERAGE ANNUAL TOTAL RETURNS: | | 1 Year | 5 Year | 10 Year |
| Fidelity® Series Real Estate Income Fund | 9.15% | 4.26% | 5.42% |
| Fidelity Series Real Estate Income Composite Index℠ | 8.24% | 1.64% | 3.70% |
| ICE® BofA® US High Yield Constrained Index | 11.04% | 4.01% | 4.55% |
| S&P 500® Index | 22.15% | 15.00% | 13.15% |
| Bloomberg U.S. Universal Bond Index | 5.72% | 0.50% | 1.89% |
Effective August 1, 2023, the fund began comparing its performance to ICE® BofA® US High Yield Constrained Index rather than S&P 500® Index because the ICE® BofA® US High Yield Constrained Index conforms more closely to the fund's investment policies.
Visit www.fidelity.com for more recent performance information. |
The Fund's past performance is not a good predictor of the Fund's future performance. The graph and table do not reflect the deduction of taxes that a shareholder would pay on fund distributions or redemption of fund shares. |
Key Fund Statistics (as of July 31, 2024)
KEY FACTS | | |
| Fund Size | $264,416,974 | |
| Number of Holdings | 289 | |
| Total Advisory Fee | $0 | |
| Portfolio Turnover | 37% | |
What did the Fund invest in?
(as of July 31, 2024)
| AAA | 0.6 |
| AA | 0.4 |
| A | 9.2 |
| BBB | 27.6 |
| BB | 10.8 |
| B | 7.9 |
| CCC,CC,C | 4.7 |
| Not Rated | 11.7 |
| Equities | 24.4 |
| Short-Term Investments and Net Other Assets (Liabilities) | 2.7 |
QUALITY DIVERSIFICATION (% of Fund's net assets) |
|
| |
| We have used ratings from Moody's Investors Service, Inc. Where Moody's® ratings are not available, we have used S&P® ratings. All ratings are as of the date indicated and do not reflect subsequent changes. |
| Corporate Bonds | 50.0 |
| Preferred Stocks | 24.4 |
| CMOs and Other Mortgage Related Securities | 18.9 |
| Bank Loan Obligations | 3.3 |
| Asset-Backed Securities | 0.7 |
| Common Stocks | 0.0 |
| Short-Term Investments and Net Other Assets (Liabilities) | 2.7 |
ASSET ALLOCATION (% of Fund's net assets) |
|
|
| United States | 99.5 |
| United Kingdom | 0.3 |
| Canada | 0.2 |
GEOGRAPHIC DIVERSIFICATION (% of Fund's net assets) |
|
| |
|
TOP HOLDINGS (% of Fund's net assets) | | |
| American Tower Corp | 4.3 | |
| Crown Castle Inc | 3.4 | |
| MHP Commercial Mortgage Trust | 2.6 | |
| Prologis LP | 2.4 | |
| Equinix Inc | 2.4 | |
| Simon Property Group LP | 2.4 | |
| American Homes 4 Rent LP | 2.3 | |
| Extra Space Storage LP | 2.2 | |
| Invitation Homes Operating Partnership LP | 1.8 | |
| Sun Communities Operating LP | 1.6 | |
| | 25.4 | |
| |
| Fidelity, the Fidelity Investments Logo and all other Fidelity trademarks or service marks used herein are trademarks or service marks of FMR LLC. Any third-party marks that are used herein are trademarks or service marks of their respective owners. © 2024 FMR LLC. All rights reserved. |
| | For additional information about the Fund; including its prospectus, financial information, holdings and proxy information, scan the QR code or visit fundresearch.fidelity.com/prospectus/sec 1.9913514.100 2277-TSRA-0924 |
| |
| | ANNUAL SHAREHOLDER REPORT | AS OF JULY 31, 2024 | This report describes changes to the Fund that occurred during the reporting period. |
| | Fidelity® Small Cap Value Fund Fidelity® Small Cap Value Fund : FCPVX |
| | | |
This annual shareholder report contains information about Fidelity® Small Cap Value Fund for the period August 1, 2023 to July 31, 2024. You can find additional information about the Fund at fundresearch.fidelity.com/prospectus/sec. You can also request this information by contacting us at 1-800-544-8544 or by sending an e-mail to fidfunddocuments@fidelity.com.
What were your Fund costs for the last year?(based on hypothetical $10,000 investment)
FUND COST (PREVIOUS YEAR)
| | Costs of a $10,000 investment | Costs paid as a percentage of a $10,000 investment | |
| Fidelity® Small Cap Value Fund | $ 111 | 1.02% | |
What affected the Fund's performance this period?
•U.S. equities gained for the 12 months ending July 31, 2024, driven by resilient corporate profits, a frenzy over generative artificial intelligence and the Federal Reserve's likely pivot to cutting interest rates later this year.
•Against this backdrop, security selection was the primary contributor to the fund's performance versus the Russell 2000 Value Index for the fiscal year, led by the information technology sector, especially technology hardware & equipment firms. Solid picks and an underweight in real estate also boosted relative performance. Investment choices in energy helped as well.
•A stake in XPO gained about 82% and was the top individual relative contributor, though the company was not held at period end. Our position in TechnipFMC gained approximately 61% and was another plus. This period we decreased our exposure to the stock. Another notable relative contributor was Insight Enterprises (+54%), one of our largest holdings. All of these contributors were non-benchmark positions.
•In contrast, the biggest detractor from performance versus the benchmark was stock selection in materials. Subpar picks in health care and utilities also hurt.
•The largest individual relative detractor was an outsized stake in O-I Glass (-52%), a stock that was not held at period end. An overweight in Brookfield Infrastructure (-13%), one of the fund's largest holdings this period, proved detrimental as well. Larger-than-benchmark exposure to Owens & Minor (-15%) also hurt.
•Notable changes in positioning include decreased exposure to the consumer discretionary sector and a higher allocation to real estate stocks.
How did the Fund perform over the past 10 years?
CUMULATIVE PERFORMANCE
July 31, 2014 through July 31, 2024.
Initial investment of $10,000.
Fidelity® Small Cap Value Fund | $10,000 | $11,218 | $11,693 | $13,445 | $14,907 | $14,224 | $12,391 | $21,268 | $21,006 | $22,569 | $26,254 |
Russell 2000® Value Index | $10,000 | $10,430 | $11,013 | $13,129 | $15,016 | $13,858 | $11,653 | $19,076 | $18,167 | $18,883 | $21,845 |
Russell 3000® Index | $10,000 | $11,128 | $11,623 | $13,498 | $15,711 | $16,819 | $18,657 | $25,882 | $23,979 | $27,013 | $32,705 |
| | 2014 | 2015 | 2016 | 2017 | 2018 | 2019 | 2020 | 2021 | 2022 | 2023 | 2024 |
AVERAGE ANNUAL TOTAL RETURNS: | | 1 Year | 5 Year | 10 Year |
| Fidelity® Small Cap Value Fund | 16.33% | 13.04% | 10.13% |
| Russell 2000® Value Index | 15.68% | 9.53% | 8.13% |
| Russell 3000® Index | 21.07% | 14.23% | 12.58% |
Visit www.fidelity.com for more recent performance information. |
The Fund's past performance is not a good predictor of the Fund's future performance. The graph and table do not reflect the deduction of taxes that a shareholder would pay on fund distributions or redemption of fund shares. |
Key Fund Statistics (as of July 31, 2024)
KEY FACTS | | |
| Fund Size | $5,128,532,088 | |
| Number of Holdings | 105 | |
| Total Advisory Fee | $41,899,156 | |
| Portfolio Turnover | 63% | |
What did the Fund invest in?
(as of July 31, 2024)
MARKET SECTORS (% of Fund's net assets) | | |
| Financials | 25.7 | |
| Industrials | 16.2 | |
| Information Technology | 9.5 | |
| Energy | 9.3 | |
| Real Estate | 8.9 | |
| Health Care | 7.9 | |
| Consumer Discretionary | 7.7 | |
| Materials | 4.6 | |
| Consumer Staples | 3.8 | |
| Utilities | 2.3 | |
| Communication Services | 1.4 | |
| |
| Common Stocks | 97.3 |
| Domestic Equity Funds | 1.0 |
| Short-Term Investments and Net Other Assets (Liabilities) | 1.7 |
ASSET ALLOCATION (% of Fund's net assets) |
|
|
| United States | 93.4 |
| Canada | 4.4 |
| Bermuda | 1.3 |
| United Kingdom | 0.7 |
| Japan | 0.1 |
| Netherlands | 0.1 |
GEOGRAPHIC DIVERSIFICATION (% of Fund's net assets) |
|
| |
|
TOP HOLDINGS (% of Fund's net assets) | | |
| Eastern Bankshares Inc | 2.6 | |
| Graphic Packaging Holding CO | 2.5 | |
| Insight Enterprises Inc | 2.5 | |
| Brookfield Infrastructure Corp Class A (United States) | 2.3 | |
| Beacon Roofing Supply Inc | 2.2 | |
| Old Republic International Corp | 2.0 | |
| Primerica Inc | 2.0 | |
| AMN Healthcare Services Inc | 1.9 | |
| US Foods Holding Corp | 1.9 | |
| Lumentum Holdings Inc | 1.9 | |
| | 21.8 | |
| |
How has the Fund changed?
This is a summary of certain changes to the Fund since August 1, 2023. For more complete information, you may review the Fund's next prospectus, which we expect to be available by September 28, 2024 at fundresearch.fidelity.com/prospectus/sec or upon request at 1-800-544-8544 or by sending an e-mail to fidfunddocuments@fidelity.com.
The fund's transfer agent and pricing & bookkeeping fees were changed to a fixed rate effective December 1, 2023, through February 29, 2024, in anticipation of the transition to a new management fee structure. Effective March 1, 2024, the fund's management contract was amended to incorporate administrative services previously covered under separate services agreements (transfer agent and pricing & bookkeeping). The amended contract incorporates a basic fee rate that may vary by class (subject to a performance adjustment). The Adviser or an affiliate pays certain expenses of managing and operating the fund out of each class's management fee. | |
| Fidelity, the Fidelity Investments Logo and all other Fidelity trademarks or service marks used herein are trademarks or service marks of FMR LLC. Any third-party marks that are used herein are trademarks or service marks of their respective owners. © 2024 FMR LLC. All rights reserved. |
| | For additional information about the Fund; including its prospectus, financial information, holdings and proxy information, scan the QR code or visit fundresearch.fidelity.com/prospectus/sec 1.9913470.100 1389-TSRA-0924 |
| |
| | ANNUAL SHAREHOLDER REPORT | AS OF JULY 31, 2024 | This report describes changes to the Fund that occurred during the reporting period. |
| | Fidelity® Small Cap Value Fund Fidelity Advisor® Small Cap Value Fund Class Z : FIKNX |
| | | |
This annual shareholder report contains information about Fidelity® Small Cap Value Fund for the period August 1, 2023 to July 31, 2024. You can find additional information about the Fund at fundresearch.fidelity.com/prospectus/sec. You can also request this information by contacting us at 1-877-208-0098 or by sending an e-mail to fidfunddocuments@fidelity.com.
What were your Fund costs for the last year?(based on hypothetical $10,000 investment)
FUND COST (PREVIOUS YEAR)
| | Costs of a $10,000 investment | Costs paid as a percentage of a $10,000 investment | |
| Class Z | $ 100 | 0.93% | |
What affected the Fund's performance this period?
•U.S. equities gained for the 12 months ending July 31, 2024, driven by resilient corporate profits, a frenzy over generative artificial intelligence and the Federal Reserve's likely pivot to cutting interest rates later this year.
•Against this backdrop, security selection was the primary contributor to the fund's performance versus the Russell 2000 Value Index for the fiscal year, led by the information technology sector, especially technology hardware & equipment firms. Solid picks and an underweight in real estate also boosted relative performance. Investment choices in energy helped as well.
•A stake in XPO gained about 82% and was the top individual relative contributor, though the company was not held at period end. Our position in TechnipFMC gained approximately 61% and was another plus. This period we decreased our exposure to the stock. Another notable relative contributor was Insight Enterprises (+54%), one of our largest holdings. All of these contributors were non-benchmark positions.
•In contrast, the biggest detractor from performance versus the benchmark was stock selection in materials. Subpar picks in health care and utilities also hurt.
•The largest individual relative detractor was an outsized stake in O-I Glass (-52%), a stock that was not held at period end. An overweight in Brookfield Infrastructure (-13%), one of the fund's largest holdings this period, proved detrimental as well. Larger-than-benchmark exposure to Owens & Minor (-15%) also hurt.
•Notable changes in positioning include decreased exposure to the consumer discretionary sector and a higher allocation to real estate stocks.
How did the Fund perform over the life of Fund?
CUMULATIVE PERFORMANCE
October 2, 2018 through July 31, 2024.
Initial investment of $10,000.
Class Z | $10,000 | $9,625 | $8,399 | $14,426 | $14,266 | $15,351 | $17,878 |
Russell 2000® Value Index | $10,000 | $9,404 | $7,908 | $12,946 | $12,329 | $12,815 | $14,824 |
Russell 3000® Index | $10,000 | $10,325 | $11,453 | $15,888 | $14,720 | $16,582 | $20,077 |
| | 2018 | 2019 | 2020 | 2021 | 2022 | 2023 | 2024 |
AVERAGE ANNUAL TOTAL RETURNS: | | 1 Year | 5 Year | Life of Fund A |
| Class Z | 16.46% | 13.18% | 10.47% |
| Russell 2000® Value Index | 15.68% | 9.53% | 6.98% |
| Russell 3000® Index | 21.07% | 14.23% | 12.69% |
A From October 2, 2018
Visit institutional.fidelity.com for more recent performance information. |
The Fund's past performance is not a good predictor of the Fund's future performance. The graph and table do not reflect the deduction of taxes that a shareholder would pay on fund distributions or redemption of fund shares. |
Key Fund Statistics (as of July 31, 2024)
KEY FACTS | | |
| Fund Size | $5,128,532,088 | |
| Number of Holdings | 105 | |
| Total Advisory Fee | $41,899,156 | |
| Portfolio Turnover | 63% | |
What did the Fund invest in?
(as of July 31, 2024)
MARKET SECTORS (% of Fund's net assets) | | |
| Financials | 25.7 | |
| Industrials | 16.2 | |
| Information Technology | 9.5 | |
| Energy | 9.3 | |
| Real Estate | 8.9 | |
| Health Care | 7.9 | |
| Consumer Discretionary | 7.7 | |
| Materials | 4.6 | |
| Consumer Staples | 3.8 | |
| Utilities | 2.3 | |
| Communication Services | 1.4 | |
| |
| Common Stocks | 97.3 |
| Domestic Equity Funds | 1.0 |
| Short-Term Investments and Net Other Assets (Liabilities) | 1.7 |
ASSET ALLOCATION (% of Fund's net assets) |
|
|
| United States | 93.4 |
| Canada | 4.4 |
| Bermuda | 1.3 |
| United Kingdom | 0.7 |
| Japan | 0.1 |
| Netherlands | 0.1 |
GEOGRAPHIC DIVERSIFICATION (% of Fund's net assets) |
|
| |
|
TOP HOLDINGS (% of Fund's net assets) | | |
| Eastern Bankshares Inc | 2.6 | |
| Graphic Packaging Holding CO | 2.5 | |
| Insight Enterprises Inc | 2.5 | |
| Brookfield Infrastructure Corp Class A (United States) | 2.3 | |
| Beacon Roofing Supply Inc | 2.2 | |
| Old Republic International Corp | 2.0 | |
| Primerica Inc | 2.0 | |
| AMN Healthcare Services Inc | 1.9 | |
| US Foods Holding Corp | 1.9 | |
| Lumentum Holdings Inc | 1.9 | |
| | 21.8 | |
| |
How has the Fund changed?
This is a summary of certain changes to the Fund since August 1, 2023. For more complete information, you may review the Fund's next prospectus, which we expect to be available by September 28, 2024 at fundresearch.fidelity.com/prospectus/sec or upon request at 1-877-208-0098 or by sending an e-mail to fidfunddocuments@fidelity.com.
The fund's transfer agent and pricing & bookkeeping fees were changed to a fixed rate effective December 1, 2023, through February 29, 2024, in anticipation of the transition to a new management fee structure. Effective March 1, 2024, the fund's management contract was amended to incorporate administrative services previously covered under separate services agreements (transfer agent and pricing & bookkeeping). The amended contract incorporates a basic fee rate that may vary by class (subject to a performance adjustment). The Adviser or an affiliate pays certain expenses of managing and operating the fund out of each class's management fee. | |
| Fidelity, the Fidelity Investments Logo and all other Fidelity trademarks or service marks used herein are trademarks or service marks of FMR LLC. Any third-party marks that are used herein are trademarks or service marks of their respective owners. © 2024 FMR LLC. All rights reserved. |
| | For additional information about the Fund; including its prospectus, financial information, holdings and proxy information, scan the QR code or visit fundresearch.fidelity.com/prospectus/sec 1.9913471.100 3303-TSRA-0924 |
| |
| | ANNUAL SHAREHOLDER REPORT | AS OF JULY 31, 2024 | This report describes changes to the Fund that occurred during the reporting period. |
| | Fidelity® Real Estate Income Fund Fidelity Advisor® Real Estate Income Fund Class C : FRIOX |
| | | |
This annual shareholder report contains information about Fidelity® Real Estate Income Fund for the period August 1, 2023 to July 31, 2024. You can find additional information about the Fund at fundresearch.fidelity.com/prospectus/sec. You can also request this information by contacting us at 1-877-208-0098 or by sending an e-mail to fidfunddocuments@fidelity.com.
What were your Fund costs for the last year?(based on hypothetical $10,000 investment)
FUND COST (PREVIOUS YEAR)
| | Costs of a $10,000 investment | Costs paid as a percentage of a $10,000 investment | |
| Class C | $ 177 | 1.70% | |
What affected the Fund's performance this period?
•Investors in real estate securities experienced often-fluctuating market conditions throughout the 12 months ending July 31, 2024, initially declining due to concerns about rate hikes but later rallying as hopes for rate cuts in 2024 grew.
•Against this backdrop, security selection was the primary contributor to the fund's performance versus the Fidelity Real Estate Income Composite IndexSM, a 40/25/20/15 blend of the ICE BofA® US Real Estate Index, the MSCI REIT Preferred Index, the FTSE® NAREIT® All REITs Index and the Bloomberg U.S. CMBS ex-AAA Index. Selection among preferred stocks and collateralized mortgage obligations stood out as helping relative performance. Asset allocation modestly contributed this period, especially among preferred stocks, while a stake in cash of roughly 7%, on average, also helped.
•The largest individual relative contributor was a common stock position in Welltower (+39%), an owner of senior-housing properties.
•In contrast, detractors included the fund's underweight in real estate bonds and security selection among real estate common stocks.
•The largest individual relative detractor was a real estate bond investment of Veritas related to a defaulted loan on apartment buildings in San Francisco. The holding lost all its value and was not held in the portfolio on July 31.
•Notable changes in positioning include increased exposure to investment-grade real estate bonds and reductions in high-yield real estate bonds, cash and preferred stocks.
How did the Fund perform over the past 10 years?
CUMULATIVE PERFORMANCE
July 31, 2014 through July 31, 2024.
Initial investment of $10,000.
Class C | $10,000 | $10,382 | $11,450 | $11,971 | $12,128 | $13,261 | $12,267 | $15,412 | $14,558 | $14,162 | $15,519 |
Fidelity Real Estate Income Composite Index℠ | $10,000 | $10,669 | $11,896 | $12,161 | $12,343 | $13,577 | $13,629 | $15,721 | $14,457 | $13,774 | $14,991 |
ICE® BofA® US High Yield Constrained Index | $10,000 | $10,017 | $10,513 | $11,695 | $11,987 | $12,818 | $13,202 | $14,621 | $13,490 | $14,051 | $15,603 |
S&P 500® Index | $10,000 | $11,121 | $11,745 | $13,629 | $15,843 | $17,108 | $19,153 | $26,134 | $24,921 | $28,165 | $34,403 |
Bloomberg U.S. Universal Bond Index | $10,000 | $10,253 | $10,875 | $10,939 | $10,877 | $11,766 | $12,878 | $12,926 | $11,690 | $11,410 | $12,062 |
| | 2014 | 2015 | 2016 | 2017 | 2018 | 2019 | 2020 | 2021 | 2022 | 2023 | 2024 |
Effective June 1, 2024, the fund began comparing its performance to ICE® BofA® US High Yield Constrained Index rather than S&P 500® Index because the ICE® BofA® US High Yield Constrained Index conforms more closely to the fund's investment policies.
AVERAGE ANNUAL TOTAL RETURNS: | | 1 Year | 5 Year | 10 Year |
| Class C (incl. contingent deferred sales charge) | 7.72% | 2.88% | 4.49% |
| Class C | 8.72% | 2.88% | 4.49% |
| Fidelity Real Estate Income Composite Index℠ | 8.84% | 2.00% | 4.13% |
| ICE® BofA® US High Yield Constrained Index | 11.04% | 4.01% | 4.55% |
| S&P 500® Index | 22.15% | 15.00% | 13.15% |
| Bloomberg U.S. Universal Bond Index | 5.72% | 0.50% | 1.89% |
Effective June 1, 2024, the fund began comparing its performance to ICE® BofA® US High Yield Constrained Index rather than S&P 500® Index because the ICE® BofA® US High Yield Constrained Index conforms more closely to the fund's investment policies.
Visit institutional.fidelity.com for more recent performance information. |
The Fund's past performance is not a good predictor of the Fund's future performance. The graph and table do not reflect the deduction of taxes that a shareholder would pay on fund distributions or redemption of fund shares. |
Key Fund Statistics (as of July 31, 2024)
KEY FACTS | | |
| Fund Size | $4,786,766,888 | |
| Number of Holdings | 519 | |
| Total Advisory Fee | $25,368,688 | |
| Portfolio Turnover | 24% | |
What did the Fund invest in?
(as of July 31, 2024)
| AAA | 4.7 |
| AA | 1.7 |
| A | 3.7 |
| BBB | 17.0 |
| BB | 10.9 |
| B | 5.2 |
| CCC,CC,C | 1.8 |
| Not Rated | 12.2 |
| Equities | 38.9 |
| Short-Term Investments and Net Other Assets (Liabilities) | 3.9 |
QUALITY DIVERSIFICATION (% of Fund's net assets) |
|
| |
| We have used ratings from Moody's Investors Service, Inc. Where Moody's® ratings are not available, we have used S&P® ratings. All ratings are as of the date indicated and do not reflect subsequent changes. |
| Corporate Bonds | 30.4 |
| Common Stocks | 23.8 |
| CMOs and Other Mortgage Related Securities | 22.6 |
| Preferred Stocks | 14.4 |
| Bank Loan Obligations | 2.4 |
| Asset-Backed Securities | 1.7 |
| Preferred Securities | 0.8 |
| Short-Term Investments and Net Other Assets (Liabilities) | 3.9 |
ASSET ALLOCATION (% of Fund's net assets) |
|
|
| United States | 99.6 |
| Canada | 0.2 |
| United Kingdom | 0.2 |
| Grand Cayman (UK Overseas Ter) | 0.0 |
GEOGRAPHIC DIVERSIFICATION (% of Fund's net assets) |
|
| |
|
TOP HOLDINGS (% of Fund's net assets) | | |
| American Tower Corp | 2.7 | |
| American Tower Corp | 2.5 | |
| Crown Castle Inc | 2.0 | |
| Equity LifeStyle Properties Inc | 1.9 | |
| Prologis Inc | 1.6 | |
| Welltower Inc | 1.5 | |
| Equinix Inc | 1.4 | |
| American Homes 4 Rent LP | 1.4 | |
| Crown Castle Inc | 1.3 | |
| Sun Communities Operating LP | 1.3 | |
| | 17.6 | |
| |
How has the Fund changed?
This is a summary of certain changes to the Fund since August 1, 2023. For more complete information, you may review the Fund's next prospectus, which we expect to be available by September 28, 2024 at fundresearch.fidelity.com/prospectus/sec or upon request at 1-877-208-0098 or by sending an e-mail to fidfunddocuments@fidelity.com.
The fund's transfer agent and pricing & bookkeeping fees were changed to a fixed rate effective December 1, 2023, through February 29, 2024, in anticipation of the transition to a new management fee structure. Effective March 1, 2024, the fund's management contract was amended to incorporate administrative services previously covered under separate services agreements (transfer agent and pricing & bookkeeping). The amended contract incorporates a basic fee rate that may vary by class (subject to a performance adjustment). The Adviser or an affiliate pays certain expenses of managing and operating the fund out of each class's management fee. | |
| Fidelity, the Fidelity Investments Logo and all other Fidelity trademarks or service marks used herein are trademarks or service marks of FMR LLC. Any third-party marks that are used herein are trademarks or service marks of their respective owners. © 2024 FMR LLC. All rights reserved. |
| | For additional information about the Fund; including its prospectus, financial information, holdings and proxy information, scan the QR code or visit fundresearch.fidelity.com/prospectus/sec 1.9913474.100 2224-TSRA-0924 |
| |
| | ANNUAL SHAREHOLDER REPORT | AS OF JULY 31, 2024 | This report describes changes to the Fund that occurred during the reporting period. |
| | Fidelity® Small Cap Value Fund Fidelity Advisor® Small Cap Value Fund Class A : FCVAX |
| | | |
This annual shareholder report contains information about Fidelity® Small Cap Value Fund for the period August 1, 2023 to July 31, 2024. You can find additional information about the Fund at fundresearch.fidelity.com/prospectus/sec. You can also request this information by contacting us at 1-877-208-0098 or by sending an e-mail to fidfunddocuments@fidelity.com.
What were your Fund costs for the last year?(based on hypothetical $10,000 investment)
FUND COST (PREVIOUS YEAR)
| | Costs of a $10,000 investment | Costs paid as a percentage of a $10,000 investment | |
| Class A | $ 139 | 1.29% | |
What affected the Fund's performance this period?
•U.S. equities gained for the 12 months ending July 31, 2024, driven by resilient corporate profits, a frenzy over generative artificial intelligence and the Federal Reserve's likely pivot to cutting interest rates later this year.
•Against this backdrop, security selection was the primary contributor to the fund's performance versus the Russell 2000 Value Index for the fiscal year, led by the information technology sector, especially technology hardware & equipment firms. Solid picks and an underweight in real estate also boosted relative performance. Investment choices in energy helped as well.
•A stake in XPO gained about 82% and was the top individual relative contributor, though the company was not held at period end. Our position in TechnipFMC gained approximately 61% and was another plus. This period we decreased our exposure to the stock. Another notable relative contributor was Insight Enterprises (+54%), one of our largest holdings. All of these contributors were non-benchmark positions.
•In contrast, the biggest detractor from performance versus the benchmark was stock selection in materials. Subpar picks in health care and utilities also hurt.
•The largest individual relative detractor was an outsized stake in O-I Glass (-52%), a stock that was not held at period end. An overweight in Brookfield Infrastructure (-13%), one of the fund's largest holdings this period, proved detrimental as well. Larger-than-benchmark exposure to Owens & Minor (-15%) also hurt.
•Notable changes in positioning include decreased exposure to the consumer discretionary sector and a higher allocation to real estate stocks.
How did the Fund perform over the past 10 years?
CUMULATIVE PERFORMANCE
July 31, 2014 through July 31, 2024.
Initial investment of $10,000 and the current sales charge was paid.
Class A | $9,425 | $10,542 | $10,971 | $12,573 | $13,913 | $13,238 | $11,505 | $19,682 | $19,387 | $20,778 | $24,108 |
Russell 2000® Value Index | $10,000 | $10,430 | $11,013 | $13,129 | $15,016 | $13,858 | $11,653 | $19,076 | $18,167 | $18,883 | $21,845 |
Russell 3000® Index | $10,000 | $11,128 | $11,623 | $13,498 | $15,711 | $16,819 | $18,657 | $25,882 | $23,979 | $27,013 | $32,705 |
| | 2014 | 2015 | 2016 | 2017 | 2018 | 2019 | 2020 | 2021 | 2022 | 2023 | 2024 |
AVERAGE ANNUAL TOTAL RETURNS: | | 1 Year | 5 Year | 10 Year |
| Class A (incl. 5.75% sales charge) | 9.35% | 11.41% | 9.20% |
| Class A (without 5.75% sales charge) | 16.03% | 12.74% | 9.85% |
| Russell 2000® Value Index | 15.68% | 9.53% | 8.13% |
| Russell 3000® Index | 21.07% | 14.23% | 12.58% |
Visit institutional.fidelity.com for more recent performance information. |
The Fund's past performance is not a good predictor of the Fund's future performance. The graph and table do not reflect the deduction of taxes that a shareholder would pay on fund distributions or redemption of fund shares. |
Key Fund Statistics (as of July 31, 2024)
KEY FACTS | | |
| Fund Size | $5,128,532,088 | |
| Number of Holdings | 105 | |
| Total Advisory Fee | $41,899,156 | |
| Portfolio Turnover | 63% | |
What did the Fund invest in?
(as of July 31, 2024)
MARKET SECTORS (% of Fund's net assets) | | |
| Financials | 25.7 | |
| Industrials | 16.2 | |
| Information Technology | 9.5 | |
| Energy | 9.3 | |
| Real Estate | 8.9 | |
| Health Care | 7.9 | |
| Consumer Discretionary | 7.7 | |
| Materials | 4.6 | |
| Consumer Staples | 3.8 | |
| Utilities | 2.3 | |
| Communication Services | 1.4 | |
| |
| Common Stocks | 97.3 |
| Domestic Equity Funds | 1.0 |
| Short-Term Investments and Net Other Assets (Liabilities) | 1.7 |
ASSET ALLOCATION (% of Fund's net assets) |
|
|
| United States | 93.4 |
| Canada | 4.4 |
| Bermuda | 1.3 |
| United Kingdom | 0.7 |
| Japan | 0.1 |
| Netherlands | 0.1 |
GEOGRAPHIC DIVERSIFICATION (% of Fund's net assets) |
|
| |
|
TOP HOLDINGS (% of Fund's net assets) | | |
| Eastern Bankshares Inc | 2.6 | |
| Graphic Packaging Holding CO | 2.5 | |
| Insight Enterprises Inc | 2.5 | |
| Brookfield Infrastructure Corp Class A (United States) | 2.3 | |
| Beacon Roofing Supply Inc | 2.2 | |
| Old Republic International Corp | 2.0 | |
| Primerica Inc | 2.0 | |
| AMN Healthcare Services Inc | 1.9 | |
| US Foods Holding Corp | 1.9 | |
| Lumentum Holdings Inc | 1.9 | |
| | 21.8 | |
| |
How has the Fund changed?
This is a summary of certain changes to the Fund since August 1, 2023. For more complete information, you may review the Fund's next prospectus, which we expect to be available by September 28, 2024 at fundresearch.fidelity.com/prospectus/sec or upon request at 1-877-208-0098 or by sending an e-mail to fidfunddocuments@fidelity.com.
The fund's transfer agent and pricing & bookkeeping fees were changed to a fixed rate effective December 1, 2023, through February 29, 2024, in anticipation of the transition to a new management fee structure. Effective March 1, 2024, the fund's management contract was amended to incorporate administrative services previously covered under separate services agreements (transfer agent and pricing & bookkeeping). The amended contract incorporates a basic fee rate that may vary by class (subject to a performance adjustment). The Adviser or an affiliate pays certain expenses of managing and operating the fund out of each class's management fee. | |
| Fidelity, the Fidelity Investments Logo and all other Fidelity trademarks or service marks used herein are trademarks or service marks of FMR LLC. Any third-party marks that are used herein are trademarks or service marks of their respective owners. © 2024 FMR LLC. All rights reserved. |
| | For additional information about the Fund; including its prospectus, financial information, holdings and proxy information, scan the QR code or visit fundresearch.fidelity.com/prospectus/sec 1.9913466.100 1383-TSRA-0924 |
| |
| | ANNUAL SHAREHOLDER REPORT | AS OF JULY 31, 2024 | This report describes changes to the Fund that occurred during the reporting period. |
| | Fidelity® Small Cap Growth Fund Fidelity Advisor® Small Cap Growth Fund Class C : FCCGX |
| | | |
This annual shareholder report contains information about Fidelity® Small Cap Growth Fund for the period August 1, 2023 to July 31, 2024. You can find additional information about the Fund at fundresearch.fidelity.com/prospectus/sec. You can also request this information by contacting us at 1-877-208-0098 or by sending an e-mail to fidfunddocuments@fidelity.com.
What were your Fund costs for the last year?(based on hypothetical $10,000 investment)
FUND COST (PREVIOUS YEAR)
| | Costs of a $10,000 investment | Costs paid as a percentage of a $10,000 investment | |
| Class C | $ 222 | 2.02% | |
What affected the Fund's performance this period?
•U.S. equities gained for the 12 months ending July 31, 2024, driven by resilient corporate profits, a frenzy over generative artificial intelligence and the Federal Reserve's likely pivot to cutting interest rates later this year.
•Against this backdrop, security selection was the primary contributor to the fund's performance versus the benchmark for the fiscal year, especially within industrials, where our stock picks in capital goods helped most. Stock choices in health care, primarily within the pharmaceuticals, biotechnology & life sciences industry, and consumer discretionary also boosted the fund's relative performance.
•The fund's non-benchmark stake in Vertiv Holdings (+227%) was the top individual relative contributor. The stock was not held at period end. The second-largest relative contributor was an overweight in FTAI Aviation (+253%). This period we increased our stake, and FTAI Aviation finished the fiscal year as one of our biggest holdings. Another notable relative contributor was our stake in Rover (+99%), a stock that was not held at period end.
•In contrast, the biggest detractors from performance versus the benchmark were overweight holdings in health care and energy. Picks in communication services also detracted from our relative result.
•The largest individual relative detractors were an overweight in agilon health (-64%) and a non-benchmark stake in Allegro MicroSystems (-51%). This period we increased our position in Allegro MicroSystems. Our stake in Abercrombie & Fitch (-20%) also detracted. This was an investment we established this period.
•Notable changes in positioning include increased exposure to the financials sector and a lower allocation to consumer staples.
How did the Fund perform over the past 10 years?
CUMULATIVE PERFORMANCE
July 31, 2014 through July 31, 2024.
Initial investment of $10,000.
Class C | $10,000 | $12,353 | $11,903 | $14,277 | $18,205 | $19,127 | $20,585 | $29,450 | $23,195 | $25,422 | $30,729 |
Russell 2000® Growth Index | $10,000 | $12,007 | $11,371 | $13,390 | $16,458 | $16,258 | $17,233 | $24,299 | $18,666 | $20,828 | $23,493 |
Russell 3000® Index | $10,000 | $11,128 | $11,623 | $13,498 | $15,711 | $16,819 | $18,657 | $25,882 | $23,979 | $27,013 | $32,705 |
| | 2014 | 2015 | 2016 | 2017 | 2018 | 2019 | 2020 | 2021 | 2022 | 2023 | 2024 |
AVERAGE ANNUAL TOTAL RETURNS: | | 1 Year | 5 Year | 10 Year |
| Class C (incl. contingent deferred sales charge) | 18.99% | 9.62% | 11.88% |
| Class C | 19.99% | 9.62% | 11.88% |
| Russell 2000® Growth Index | 12.80% | 7.64% | 8.92% |
| Russell 3000® Index | 21.07% | 14.23% | 12.58% |
Visit institutional.fidelity.com for more recent performance information. |
The Fund's past performance is not a good predictor of the Fund's future performance. The graph and table do not reflect the deduction of taxes that a shareholder would pay on fund distributions or redemption of fund shares. |
Key Fund Statistics (as of July 31, 2024)
KEY FACTS | | |
| Fund Size | $7,489,579,269 | |
| Number of Holdings | 290 | |
| Total Advisory Fee | $51,167,416 | |
| Portfolio Turnover | 84% | |
What did the Fund invest in?
(as of July 31, 2024)
MARKET SECTORS (% of Fund's net assets) | | |
| Health Care | 23.3 | |
| Industrials | 21.9 | |
| Information Technology | 19.6 | |
| Consumer Discretionary | 12.9 | |
| Financials | 6.6 | |
| Materials | 5.2 | |
| Energy | 4.7 | |
| Consumer Staples | 2.6 | |
| Real Estate | 1.4 | |
| Communication Services | 1.1 | |
| Utilities | 0.1 | |
| |
| Common Stocks | 98.1 |
| Preferred Stocks | 1.3 |
| Bonds | 0.0 |
| Short-Term Investments and Net Other Assets (Liabilities) | 0.6 |
ASSET ALLOCATION (% of Fund's net assets) |
|
|
| United States | 91.6 |
| Israel | 2.8 |
| Canada | 1.0 |
| United Kingdom | 1.0 |
| Thailand | 0.8 |
| Netherlands | 0.5 |
| Japan | 0.5 |
| Sweden | 0.4 |
| Italy | 0.4 |
| Others | 1.0 |
GEOGRAPHIC DIVERSIFICATION (% of Fund's net assets) |
|
| |
|
TOP HOLDINGS (% of Fund's net assets) | | |
| Insight Enterprises Inc | 1.6 | |
| FTAI Aviation Ltd | 1.5 | |
| Wix.com Ltd | 1.3 | |
| TransMedics Group Inc | 1.3 | |
| Applied Industrial Technologies Inc | 1.2 | |
| Fluor Corp | 1.1 | |
| Carpenter Technology Corp | 1.0 | |
| Installed Building Products Inc | 1.0 | |
| TD SYNNEX Corp | 0.9 | |
| Brinker International Inc | 0.9 | |
| | 11.8 | |
| |
How has the Fund changed?
This is a summary of certain changes to the Fund since August 1, 2023. For more complete information, you may review the Fund's next prospectus, which we expect to be available by September 28, 2024 at fundresearch.fidelity.com/prospectus/sec or upon request at 1-877-208-0098 or by sending an e-mail to fidfunddocuments@fidelity.com.
The fees associated with this class changed during the reporting year. The variations in class fees are primarily the result of the following changes: - •Management fee
- •Performance adjustment fee
The fund's transfer agent and pricing & bookkeeping fees were changed to a fixed rate effective December 1, 2023, through February 29, 2024, in anticipation of the transition to a new management fee structure. Effective March 1, 2024, the fund's management contract was amended to incorporate administrative services previously covered under separate services agreements (transfer agent and pricing & bookkeeping). The amended contract incorporates a basic fee rate that may vary by class (subject to a performance adjustment). The Adviser or an affiliate pays certain expenses of managing and operating the fund out of each class's management fee. |
| Fidelity, the Fidelity Investments Logo and all other Fidelity trademarks or service marks used herein are trademarks or service marks of FMR LLC. Any third-party marks that are used herein are trademarks or service marks of their respective owners. © 2024 FMR LLC. All rights reserved. |
| | For additional information about the Fund; including its prospectus, financial information, holdings and proxy information, scan the QR code or visit fundresearch.fidelity.com/prospectus/sec 1.9913461.100 1379-TSRA-0924 |
| |
| | ANNUAL SHAREHOLDER REPORT | AS OF JULY 31, 2024 | This report describes changes to the Fund that occurred during the reporting period. |
| | Fidelity® OTC Portfolio Fidelity® OTC Portfolio Class K : FOCKX |
| | | |
This annual shareholder report contains information about Fidelity® OTC Portfolio for the period August 1, 2023 to July 31, 2024. You can find additional information about the Fund at fundresearch.fidelity.com/prospectus/sec. You can also request this information by contacting us at 1-800-835-5092 or by sending an e-mail to fidfunddocuments@fidelity.com.
What were your Fund costs for the last year?(based on hypothetical $10,000 investment)
FUND COST (PREVIOUS YEAR)
| | Costs of a $10,000 investment | Costs paid as a percentage of a $10,000 investment | |
| Class K | $ 76 | 0.67% | |
What affected the Fund's performance this period?
•U.S. equities gained for the 12 months ending July 31, 2024, driven by resilient corporate profits, a frenzy over generative artificial intelligence and the Federal Reserve's likely pivot to cutting interest rates later this year.
•Against this backdrop, security selection was the primary contributor to the fund's performance versus the NASDAQ Composite Index for the fiscal year, led by industrials, where our picks among capital goods stocks helped the most. Security selection in consumer discretionary and information technology also boosted the fund's relative performance.
•The top individual relative contributor was an underweight in Tesla (-13%), followed by a non-benchmark stake in Taiwan Semiconductor Manufacturing (+69%). The latter was among the fund's largest holdings. Out-of-benchmark exposure to Vertiv Holdings (+210%) was another plus.
•In contrast, the biggest detractor from performance versus the benchmark was stock picking in consumer staples. An overweight in energy and comparatively light exposure to the market-leading information technology sector hurt as well.
•The biggest individual relative detractor was an underweight in Broadcom (+82%). This was a stake we established this period. A larger-than-benchmark holding in Lululemon Athletica (-32%) further pressured relative performance, as did an outsized position in Marvell Technology (+3%), one of the fund's largest holdings.
•Notable changes in positioning include decreased exposure to the energy sector and a higher allocation to health care stocks.
How did the Fund perform over the past 10 years?
CUMULATIVE PERFORMANCE
July 31, 2014 through July 31, 2024.
Initial investment of $10,000.
Class K | $10,000 | $12,149 | $12,611 | $16,156 | $20,112 | $21,420 | $29,118 | $41,362 | $33,003 | $40,167 | $51,157 |
Nasdaq Composite Index® | $10,000 | $11,871 | $12,099 | $15,053 | $18,384 | $19,807 | $26,301 | $36,171 | $30,762 | $35,935 | $44,425 |
S&P 500® Index | $10,000 | $11,121 | $11,745 | $13,629 | $15,843 | $17,108 | $19,153 | $26,134 | $24,921 | $28,165 | $34,403 |
| | 2014 | 2015 | 2016 | 2017 | 2018 | 2019 | 2020 | 2021 | 2022 | 2023 | 2024 |
AVERAGE ANNUAL TOTAL RETURNS: | | 1 Year | 5 Year | 10 Year |
| Class K | 27.36% | 19.02% | 17.73% |
| Nasdaq Composite Index® | 23.62% | 17.53% | 16.08% |
| S&P 500® Index | 22.15% | 15.00% | 13.15% |
Visit www.401k.com for more recent performance information. |
The Fund's past performance is not a good predictor of the Fund's future performance. The graph and table do not reflect the deduction of taxes that a shareholder would pay on fund distributions or redemption of fund shares. |
Key Fund Statistics (as of July 31, 2024)
KEY FACTS | | |
| Fund Size | $30,575,892,319 | |
| Number of Holdings | 160 | |
| Total Advisory Fee | $180,091,338 | |
| Portfolio Turnover | 37% | |
What did the Fund invest in?
(as of July 31, 2024)
MARKET SECTORS (% of Fund's net assets) | | |
| Information Technology | 45.0 | |
| Communication Services | 19.2 | |
| Consumer Discretionary | 12.3 | |
| Health Care | 7.4 | |
| Consumer Staples | 3.1 | |
| Financials | 2.4 | |
| Industrials | 2.2 | |
| Energy | 1.6 | |
| Utilities | 0.7 | |
| Real Estate | 0.2 | |
| Materials | 0.1 | |
| |
| Common Stocks | 93.5 |
| Preferred Stocks | 0.7 |
| Bonds | 0.3 |
| Short-Term Investments and Net Other Assets (Liabilities) | 5.5 |
ASSET ALLOCATION (% of Fund's net assets) |
|
|
| United States | 93.9 |
| Taiwan | 1.5 |
| Netherlands | 1.3 |
| Korea (South) | 0.8 |
| China | 0.7 |
| United Kingdom | 0.6 |
| France | 0.4 |
| Brazil | 0.3 |
| Ireland | 0.2 |
| Others | 0.3 |
GEOGRAPHIC DIVERSIFICATION (% of Fund's net assets) |
|
| |
|
TOP HOLDINGS (% of Fund's net assets) | | |
| Apple Inc | 13.4 | |
| Microsoft Corp | 10.1 | |
| Amazon.com Inc | 8.4 | |
| NVIDIA Corp | 8.1 | |
| Alphabet Inc Class A | 6.6 | |
| Meta Platforms Inc Class A | 4.7 | |
| Alphabet Inc Class C | 2.9 | |
| Marvell Technology Inc | 2.3 | |
| Netflix Inc | 2.1 | |
| Regeneron Pharmaceuticals Inc | 1.7 | |
| | 60.3 | |
| |
How has the Fund changed?
This is a summary of certain changes to the Fund since August 1, 2023. For more complete information, you may review the Fund's next prospectus, which we expect to be available by September 28, 2024 at fundresearch.fidelity.com/prospectus/sec or upon request at 1-800-835-5092 or by sending an e-mail to fidfunddocuments@fidelity.com.
The fund's transfer agent and pricing and bookkeeping fees were changed to a fixed rate effective December 1, 2023, through February 29, 2024, in anticipation of the transition to a new management fee structure. Effective March 1, 2024, the fund's management contract was amended to incorporate administrative services previously covered under separate services agreements (transfer agent and pricing and bookkeeping).The amended contract incorporates a management fee rate that may vary by class (subject to a performance adjustment). The Adviser or an affiliate pays certain expenses of managing and operating the fund out of each class's management fee. | |
| Fidelity, the Fidelity Investments Logo and all other Fidelity trademarks or service marks used herein are trademarks or service marks of FMR LLC. Any third-party marks that are used herein are trademarks or service marks of their respective owners. © 2024 FMR LLC. All rights reserved. |
| | For additional information about the Fund; including its prospectus, financial information, holdings and proxy information, scan the QR code or visit fundresearch.fidelity.com/prospectus/sec 1.9913383.100 2098-TSRA-0924 |
| |
| | ANNUAL SHAREHOLDER REPORT | AS OF JULY 31, 2024 | This report describes changes to the Fund that occurred during the reporting period. |
| | Fidelity® Small Cap Growth Fund Fidelity Advisor® Small Cap Growth Fund Class A : FCAGX |
| | | |
This annual shareholder report contains information about Fidelity® Small Cap Growth Fund for the period August 1, 2023 to July 31, 2024. You can find additional information about the Fund at fundresearch.fidelity.com/prospectus/sec. You can also request this information by contacting us at 1-877-208-0098 or by sending an e-mail to fidfunddocuments@fidelity.com.
What were your Fund costs for the last year?(based on hypothetical $10,000 investment)
FUND COST (PREVIOUS YEAR)
| | Costs of a $10,000 investment | Costs paid as a percentage of a $10,000 investment | |
| Class A | $ 140 | 1.26% | |
What affected the Fund's performance this period?
•U.S. equities gained for the 12 months ending July 31, 2024, driven by resilient corporate profits, a frenzy over generative artificial intelligence and the Federal Reserve's likely pivot to cutting interest rates later this year.
•Against this backdrop, security selection was the primary contributor to the fund's performance versus the benchmark for the fiscal year, especially within industrials, where our stock picks in capital goods helped most. Stock choices in health care, primarily within the pharmaceuticals, biotechnology & life sciences industry, and consumer discretionary also boosted the fund's relative performance.
•The fund's non-benchmark stake in Vertiv Holdings (+227%) was the top individual relative contributor. The stock was not held at period end. The second-largest relative contributor was an overweight in FTAI Aviation (+253%). This period we increased our stake, and FTAI Aviation finished the fiscal year as one of our biggest holdings. Another notable relative contributor was our stake in Rover (+99%), a stock that was not held at period end.
•In contrast, the biggest detractors from performance versus the benchmark were overweight holdings in health care and energy. Picks in communication services also detracted from our relative result.
•The largest individual relative detractors were an overweight in agilon health (-64%) and a non-benchmark stake in Allegro MicroSystems (-51%). This period we increased our position in Allegro MicroSystems. Our stake in Abercrombie & Fitch (-20%) also detracted. This was an investment we established this period.
•Notable changes in positioning include increased exposure to the financials sector and a lower allocation to consumer staples.
How did the Fund perform over the past 10 years?
CUMULATIVE PERFORMANCE
July 31, 2014 through July 31, 2024.
Initial investment of $10,000 and the current sales charge was paid.
Class A | $9,425 | $11,730 | $11,396 | $13,777 | $17,699 | $18,740 | $20,313 | $29,294 | $23,253 | $25,486 | $30,806 |
Russell 2000® Growth Index | $10,000 | $12,007 | $11,371 | $13,390 | $16,458 | $16,258 | $17,233 | $24,299 | $18,666 | $20,828 | $23,493 |
Russell 3000® Index | $10,000 | $11,128 | $11,623 | $13,498 | $15,711 | $16,819 | $18,657 | $25,882 | $23,979 | $27,013 | $32,705 |
| | 2014 | 2015 | 2016 | 2017 | 2018 | 2019 | 2020 | 2021 | 2022 | 2023 | 2024 |
AVERAGE ANNUAL TOTAL RETURNS: | | 1 Year | 5 Year | 10 Year |
| Class A (incl. 5.75% sales charge) | 13.93% | 9.15% | 11.91% |
| Class A (without 5.75% sales charge) | 20.88% | 10.45% | 12.57% |
| Russell 2000® Growth Index | 12.80% | 7.64% | 8.92% |
| Russell 3000® Index | 21.07% | 14.23% | 12.58% |
Visit institutional.fidelity.com for more recent performance information. |
The Fund's past performance is not a good predictor of the Fund's future performance. The graph and table do not reflect the deduction of taxes that a shareholder would pay on fund distributions or redemption of fund shares. |
Key Fund Statistics (as of July 31, 2024)
KEY FACTS | | |
| Fund Size | $7,489,579,269 | |
| Number of Holdings | 290 | |
| Total Advisory Fee | $51,167,416 | |
| Portfolio Turnover | 84% | |
What did the Fund invest in?
(as of July 31, 2024)
MARKET SECTORS (% of Fund's net assets) | | |
| Health Care | 23.3 | |
| Industrials | 21.9 | |
| Information Technology | 19.6 | |
| Consumer Discretionary | 12.9 | |
| Financials | 6.6 | |
| Materials | 5.2 | |
| Energy | 4.7 | |
| Consumer Staples | 2.6 | |
| Real Estate | 1.4 | |
| Communication Services | 1.1 | |
| Utilities | 0.1 | |
| |
| Common Stocks | 98.1 |
| Preferred Stocks | 1.3 |
| Bonds | 0.0 |
| Short-Term Investments and Net Other Assets (Liabilities) | 0.6 |
ASSET ALLOCATION (% of Fund's net assets) |
|
|
| United States | 91.6 |
| Israel | 2.8 |
| Canada | 1.0 |
| United Kingdom | 1.0 |
| Thailand | 0.8 |
| Netherlands | 0.5 |
| Japan | 0.5 |
| Sweden | 0.4 |
| Italy | 0.4 |
| Others | 1.0 |
GEOGRAPHIC DIVERSIFICATION (% of Fund's net assets) |
|
| |
|
TOP HOLDINGS (% of Fund's net assets) | | |
| Insight Enterprises Inc | 1.6 | |
| FTAI Aviation Ltd | 1.5 | |
| Wix.com Ltd | 1.3 | |
| TransMedics Group Inc | 1.3 | |
| Applied Industrial Technologies Inc | 1.2 | |
| Fluor Corp | 1.1 | |
| Carpenter Technology Corp | 1.0 | |
| Installed Building Products Inc | 1.0 | |
| TD SYNNEX Corp | 0.9 | |
| Brinker International Inc | 0.9 | |
| | 11.8 | |
| |
How has the Fund changed?
This is a summary of certain changes to the Fund since August 1, 2023. For more complete information, you may review the Fund's next prospectus, which we expect to be available by September 28, 2024 at fundresearch.fidelity.com/prospectus/sec or upon request at 1-877-208-0098 or by sending an e-mail to fidfunddocuments@fidelity.com.
The fees associated with this class changed during the reporting year. The variations in class fees are primarily the result of the following changes: - •Management fee
- •Performance adjustment fee
The fund's transfer agent and pricing & bookkeeping fees were changed to a fixed rate effective December 1, 2023, through February 29, 2024, in anticipation of the transition to a new management fee structure. Effective March 1, 2024, the fund's management contract was amended to incorporate administrative services previously covered under separate services agreements (transfer agent and pricing & bookkeeping). The amended contract incorporates a basic fee rate that may vary by class (subject to a performance adjustment). The Adviser or an affiliate pays certain expenses of managing and operating the fund out of each class's management fee. |
| Fidelity, the Fidelity Investments Logo and all other Fidelity trademarks or service marks used herein are trademarks or service marks of FMR LLC. Any third-party marks that are used herein are trademarks or service marks of their respective owners. © 2024 FMR LLC. All rights reserved. |
| | For additional information about the Fund; including its prospectus, financial information, holdings and proxy information, scan the QR code or visit fundresearch.fidelity.com/prospectus/sec 1.9913460.100 1377-TSRA-0924 |
| |
| | ANNUAL SHAREHOLDER REPORT | AS OF JULY 31, 2024 | This report describes changes to the Fund that occurred during the reporting period. |
| | Fidelity® Blue Chip Growth Fund Fidelity® Blue Chip Growth Fund : FBGRX |
| | | |
This annual shareholder report contains information about Fidelity® Blue Chip Growth Fund for the period August 1, 2023 to July 31, 2024. You can find additional information about the Fund at fundresearch.fidelity.com/prospectus/sec. You can also request this information by contacting us at 1-800-544-8544 or by sending an e-mail to fidfunddocuments@fidelity.com.
What were your Fund costs for the last year?(based on hypothetical $10,000 investment)
FUND COST (PREVIOUS YEAR)
| | Costs of a $10,000 investment | Costs paid as a percentage of a $10,000 investment | |
| Fidelity® Blue Chip Growth Fund | $ 57 | 0.49% | |
What affected the Fund's performance this period?
•U.S. equities gained for the 12 months ending July 31, 2024, driven by resilient corporate profits, a frenzy over generative artificial intelligence and the Federal Reserve's likely pivot to cutting interest rates later this year.
•Against this backdrop, security selection was the primary contributor to the fund's performance versus the benchmark for the fiscal year, especially within information technology. Picks in industrials also boosted the fund's relative performance. Also helping our relative result was an overweight in communication services, primarily within the media & entertainment industry.
•The top individual relative contributor by far was an overweight in Nvidia (+150%). The stock was the fund's biggest holding. A second notable relative contributor was an underweight in Apple (+14%). The company was among the fund's biggest holdings. Another notable relative contributor was a non-benchmark stake in Abercrombie & Fitch (+273%).
•In contrast, the biggest detractor from performance versus the benchmark was an overweight in consumer discretionary, especially within the consumer durables & apparel industry. Stock picks in consumer staples, primarily within the consumer staples distribution & retail industry, also hampered the fund's result, as did an underweight in information technology.
•The biggest individual relative detractor was an underweight in Broadcom (+82%). This was a position we established this period. The second-largest relative detractor was an overweight in Marvell Technology (+3%). The stock was one of our largest holdings. An overweight in Lululemon Athletica (-31%) also hurt.
•Notable changes in positioning include lower allocation to industrials.
How did the Fund perform over the past 10 years?
CUMULATIVE PERFORMANCE
July 31, 2014 through July 31, 2024.
Initial investment of $10,000.
Fidelity® Blue Chip Growth Fund | $10,000 | $11,972 | $11,661 | $14,516 | $18,175 | $19,828 | $27,650 | $40,287 | $31,082 | $38,675 | $50,562 |
Russell 1000® Growth Index | $10,000 | $11,608 | $12,113 | $14,299 | $17,566 | $19,467 | $25,275 | $34,546 | $30,426 | $35,692 | $45,306 |
Russell 1000® Index | $10,000 | $11,124 | $11,661 | $13,521 | $15,710 | $16,967 | $19,009 | $26,226 | $24,424 | $27,587 | $33,519 |
| | 2014 | 2015 | 2016 | 2017 | 2018 | 2019 | 2020 | 2021 | 2022 | 2023 | 2024 |
AVERAGE ANNUAL TOTAL RETURNS: | | 1 Year | 5 Year | 10 Year |
| Fidelity® Blue Chip Growth Fund | 30.74% | 20.59% | 17.59% |
| Russell 1000® Growth Index | 26.94% | 18.41% | 16.31% |
| Russell 1000® Index | 21.50% | 14.59% | 12.86% |
Visit www.fidelity.com for more recent performance information. |
The Fund's past performance is not a good predictor of the Fund's future performance. The graph and table do not reflect the deduction of taxes that a shareholder would pay on fund distributions or redemption of fund shares. |
Key Fund Statistics (as of July 31, 2024)
KEY FACTS | | |
| Fund Size | $65,240,592,776 | |
| Number of Holdings | 397 | |
| Total Advisory Fee | $229,406,657 | |
| Portfolio Turnover | 22% | |
What did the Fund invest in?
(as of July 31, 2024)
MARKET SECTORS (% of Fund's net assets) | | |
| Information Technology | 45.3 | |
| Consumer Discretionary | 19.5 | |
| Communication Services | 15.6 | |
| Health Care | 7.7 | |
| Industrials | 4.6 | |
| Financials | 3.6 | |
| Energy | 1.5 | |
| Consumer Staples | 1.1 | |
| Materials | 0.8 | |
| Real Estate | 0.3 | |
| Utilities | 0.0 | |
| |
| Common Stocks | 98.6 |
| Preferred Stocks | 1.4 |
| Bonds | 0.0 |
| Preferred Securities | 0.0 |
| Short-Term Investments and Net Other Assets (Liabilities) | 0.0 |
ASSET ALLOCATION (% of Fund's net assets) |
|
|
| United States | 93.9 |
| China | 2.0 |
| India | 1.1 |
| Taiwan | 0.7 |
| Denmark | 0.6 |
| Canada | 0.4 |
| France | 0.2 |
| Netherlands | 0.2 |
| Switzerland | 0.2 |
| Others | 0.7 |
GEOGRAPHIC DIVERSIFICATION (% of Fund's net assets) |
|
| |
|
TOP HOLDINGS (% of Fund's net assets) | | |
| NVIDIA Corp | 13.5 | |
| Apple Inc | 11.2 | |
| Amazon.com Inc | 8.5 | |
| Microsoft Corp | 8.4 | |
| Alphabet Inc Class A | 6.5 | |
| Meta Platforms Inc Class A | 4.7 | |
| Marvell Technology Inc | 2.8 | |
| Eli Lilly & Co | 2.5 | |
| Netflix Inc | 2.1 | |
| Snap Inc Class A | 1.6 | |
| | 61.8 | |
| |
How has the Fund changed?
This is a summary of certain changes to the Fund since August 1, 2023. For more complete information, you may review the Fund's next prospectus, which we expect to be available by September 28, 2024 at fundresearch.fidelity.com/prospectus/sec or upon request at 1-800-544-8544 or by sending an e-mail to fidfunddocuments@fidelity.com.
The fees associated with this class changed during the reporting year. The variations in class fees are primarily the result of the following changes: - •Management fee
- •Performance adjustment fee
- •Operating expenses
The fund's transfer agent and pricing & bookkeeping fees were changed to a fixed rate effective December 1, 2023, through February 29, 2024, in anticipation of the transition to a new management fee structure. Effective March 1, 2024, the fund's management contract was amended to incorporate administrative services previously covered under separate services agreements (transfer agent and pricing & bookkeeping). The amended contract incorporates a basic fee rate that may vary by class (subject to a performance adjustment). The Adviser or an affiliate pays certain expenses of managing and operating the fund out of each class's management fee. |
| Fidelity, the Fidelity Investments Logo and all other Fidelity trademarks or service marks used herein are trademarks or service marks of FMR LLC. Any third-party marks that are used herein are trademarks or service marks of their respective owners. © 2024 FMR LLC. All rights reserved. |
| | For additional information about the Fund; including its prospectus, financial information, holdings and proxy information, scan the QR code or visit fundresearch.fidelity.com/prospectus/sec 1.9913433.100 312-TSRA-0924 |
| |
| | ANNUAL SHAREHOLDER REPORT | AS OF JULY 31, 2024 | This report describes changes to the Fund that occurred during the reporting period. |
| | Fidelity® Blue Chip Value Fund Fidelity® Blue Chip Value Fund : FBCVX |
| | | |
This annual shareholder report contains information about Fidelity® Blue Chip Value Fund for the period August 1, 2023 to July 31, 2024. You can find additional information about the Fund at fundresearch.fidelity.com/prospectus/sec. You can also request this information by contacting us at 1-800-544-8544 or by sending an e-mail to fidfunddocuments@fidelity.com.
What were your Fund costs for the last year?(based on hypothetical $10,000 investment)
FUND COST (PREVIOUS YEAR)
| | Costs of a $10,000 investment | Costs paid as a percentage of a $10,000 investment | |
| Fidelity® Blue Chip Value Fund | $ 89 | 0.85% | |
What affected the Fund's performance this period?
•U.S. equities gained for the 12 months ending July 31, 2024, driven by resilient corporate profits, a frenzy over generative artificial intelligence and the Federal Reserve's likely pivot to cutting interest rates later this year.
•Against this backdrop, security selection was the primary detractor from the fund's performance versus the Russell 1000 Value Index for the fiscal year, especially among consumer staples companies. Stock picks and an underweight in industrials, primarily within the capital goods industry, also hampered the fund's result. Subpar investment choices in communication services hurt as well.
•The biggest individual relative detractor was a non-benchmark stake in Parex Resources (-28%). Outsized exposure to Kenvue (-19%) and Comcast (-6%) also proved detrimental to performance. The latter was among the fund's largest holdings.
•In contrast, the biggest contributor to performance versus the benchmark was security selection in consumer discretionary, primarily within the consumer services industry. Favorable picks in health care - health care equipment & services firms in particular - and financials boosted the fund's relative performance as well.
•The top individual relative contributor was an overweight in H&R Block (+77%), one of the fund's largest holdings. A stake in Constellation Energy (+93%) was another plus, though the stock was not held at period end. A larger-than-benchmark position in JPMorgan Chase (+38%) also helped. The stock was one of the fund's largest holdings.
•Notable changes in positioning include higher allocations to the consumer discretionary and information technology sectors.
How did the Fund perform over the past 10 years?
CUMULATIVE PERFORMANCE
July 31, 2014 through July 31, 2024.
Initial investment of $10,000.
Fidelity® Blue Chip Value Fund | $10,000 | $11,252 | $10,992 | $12,936 | $13,815 | $13,952 | $12,273 | $16,858 | $17,580 | $19,094 | $21,255 |
Russell 1000® Value Index | $10,000 | $10,640 | $11,213 | $12,757 | $13,974 | $14,700 | $13,816 | $19,249 | $18,974 | $20,546 | $23,586 |
Russell 1000® Index | $10,000 | $11,124 | $11,661 | $13,521 | $15,710 | $16,967 | $19,009 | $26,226 | $24,424 | $27,587 | $33,519 |
| | 2014 | 2015 | 2016 | 2017 | 2018 | 2019 | 2020 | 2021 | 2022 | 2023 | 2024 |
AVERAGE ANNUAL TOTAL RETURNS: | | 1 Year | 5 Year | 10 Year |
| Fidelity® Blue Chip Value Fund | 11.31% | 8.78% | 7.83% |
| Russell 1000® Value Index | 14.80% | 9.92% | 8.96% |
| Russell 1000® Index | 21.50% | 14.59% | 12.86% |
Visit www.fidelity.com for more recent performance information. |
The Fund's past performance is not a good predictor of the Fund's future performance. The graph and table do not reflect the deduction of taxes that a shareholder would pay on fund distributions or redemption of fund shares. |
Key Fund Statistics (as of July 31, 2024)
KEY FACTS | | |
| Fund Size | $743,829,952 | |
| Number of Holdings | 37 | |
| Total Advisory Fee | $5,130,994 | |
| Portfolio Turnover | 39% | |
What did the Fund invest in?
(as of July 31, 2024)
MARKET SECTORS (% of Fund's net assets) | | |
| Financials | 22.5 | |
| Health Care | 18.4 | |
| Energy | 10.4 | |
| Information Technology | 10.0 | |
| Communication Services | 8.1 | |
| Consumer Staples | 7.8 | |
| Industrials | 7.7 | |
| Utilities | 7.1 | |
| Consumer Discretionary | 4.8 | |
| Materials | 1.7 | |
| |
| Common Stocks | 95.1 |
| Preferred Stocks | 3.4 |
| Short-Term Investments and Net Other Assets (Liabilities) | 1.5 |
ASSET ALLOCATION (% of Fund's net assets) |
|
|
| United States | 89.8 |
| Korea (South) | 3.4 |
| Canada | 3.0 |
| Germany | 1.9 |
| United Kingdom | 1.9 |
GEOGRAPHIC DIVERSIFICATION (% of Fund's net assets) |
|
| |
|
TOP HOLDINGS (% of Fund's net assets) | | |
| UnitedHealth Group Inc | 5.7 | |
| JPMorgan Chase & Co | 5.6 | |
| Cigna Group/The | 5.1 | |
| H&R Block Inc | 4.8 | |
| Comcast Corp Class A | 4.8 | |
| Centene Corp | 4.3 | |
| Bank of America Corp | 4.2 | |
| Exxon Mobil Corp | 4.2 | |
| Shell PLC ADR | 4.1 | |
| Gen Digital Inc | 3.5 | |
| | 46.3 | |
| |
How has the Fund changed?
This is a summary of certain changes to the Fund since August 1, 2023. For more complete information, you may review the Fund's next prospectus, which we expect to be available by September 28, 2024 at fundresearch.fidelity.com/prospectus/sec or upon request at 1-800-544-8544 or by sending an e-mail to fidfunddocuments@fidelity.com.
The fees associated with this class changed during the reporting year. The variations in class fees are primarily the result of the following changes: - •Management fee
- •Performance adjustment fee
The fund's transfer agent and pricing & bookkeeping fees were changed to a fixed rate effective December 1, 2023, through February 29, 2024, in anticipation of the transition to a new management fee structure. Effective March 1, 2024, the fund's management contract was amended to incorporate administrative services previously covered under separate services agreements (transfer agent and pricing & bookkeeping). The amended contract incorporates a basic fee rate that may vary by class (subject to a performance adjustment). The Adviser or an affiliate pays certain expenses of managing and operating the fund out of each class's management fee. |
| Fidelity, the Fidelity Investments Logo and all other Fidelity trademarks or service marks used herein are trademarks or service marks of FMR LLC. Any third-party marks that are used herein are trademarks or service marks of their respective owners. © 2024 FMR LLC. All rights reserved. |
| | For additional information about the Fund; including its prospectus, financial information, holdings and proxy information, scan the QR code or visit fundresearch.fidelity.com/prospectus/sec 1.9913453.100 1271-TSRA-0924 |
| |
| | ANNUAL SHAREHOLDER REPORT | AS OF JULY 31, 2024 | This report describes changes to the Fund that occurred during the reporting period. |
| | Fidelity® Small Cap Growth Fund Fidelity Advisor® Small Cap Growth Fund Class M : FCTGX |
| | | |
This annual shareholder report contains information about Fidelity® Small Cap Growth Fund for the period August 1, 2023 to July 31, 2024. You can find additional information about the Fund at fundresearch.fidelity.com/prospectus/sec. You can also request this information by contacting us at 1-877-208-0098 or by sending an e-mail to fidfunddocuments@fidelity.com.
What were your Fund costs for the last year?(based on hypothetical $10,000 investment)
FUND COST (PREVIOUS YEAR)
| | Costs of a $10,000 investment | Costs paid as a percentage of a $10,000 investment | |
| Class M | $ 167 | 1.51% | |
What affected the Fund's performance this period?
•U.S. equities gained for the 12 months ending July 31, 2024, driven by resilient corporate profits, a frenzy over generative artificial intelligence and the Federal Reserve's likely pivot to cutting interest rates later this year.
•Against this backdrop, security selection was the primary contributor to the fund's performance versus the benchmark for the fiscal year, especially within industrials, where our stock picks in capital goods helped most. Stock choices in health care, primarily within the pharmaceuticals, biotechnology & life sciences industry, and consumer discretionary also boosted the fund's relative performance.
•The fund's non-benchmark stake in Vertiv Holdings (+227%) was the top individual relative contributor. The stock was not held at period end. The second-largest relative contributor was an overweight in FTAI Aviation (+253%). This period we increased our stake, and FTAI Aviation finished the fiscal year as one of our biggest holdings. Another notable relative contributor was our stake in Rover (+99%), a stock that was not held at period end.
•In contrast, the biggest detractors from performance versus the benchmark were overweight holdings in health care and energy. Picks in communication services also detracted from our relative result.
•The largest individual relative detractors were an overweight in agilon health (-64%) and a non-benchmark stake in Allegro MicroSystems (-51%). This period we increased our position in Allegro MicroSystems. Our stake in Abercrombie & Fitch (-20%) also detracted. This was an investment we established this period.
•Notable changes in positioning include increased exposure to the financials sector and a lower allocation to consumer staples.
How did the Fund perform over the past 10 years?
CUMULATIVE PERFORMANCE
July 31, 2014 through July 31, 2024.
Initial investment of $10,000 and the current sales charge was paid.
Class M | $9,650 | $11,976 | $11,599 | $13,986 | $17,923 | $18,926 | $20,466 | $29,435 | $23,299 | $25,476 | $30,716 |
Russell 2000® Growth Index | $10,000 | $12,007 | $11,371 | $13,390 | $16,458 | $16,258 | $17,233 | $24,299 | $18,666 | $20,828 | $23,493 |
Russell 3000® Index | $10,000 | $11,128 | $11,623 | $13,498 | $15,711 | $16,819 | $18,657 | $25,882 | $23,979 | $27,013 | $32,705 |
| | 2014 | 2015 | 2016 | 2017 | 2018 | 2019 | 2020 | 2021 | 2022 | 2023 | 2024 |
AVERAGE ANNUAL TOTAL RETURNS: | | 1 Year | 5 Year | 10 Year |
| Class M (incl. 3.50% sales charge) | 16.35% | 9.39% | 11.88% |
| Class M (without 3.50% sales charge) | 20.57% | 10.17% | 12.28% |
| Russell 2000® Growth Index | 12.80% | 7.64% | 8.92% |
| Russell 3000® Index | 21.07% | 14.23% | 12.58% |
Visit institutional.fidelity.com for more recent performance information. |
The Fund's past performance is not a good predictor of the Fund's future performance. The graph and table do not reflect the deduction of taxes that a shareholder would pay on fund distributions or redemption of fund shares. |
Key Fund Statistics (as of July 31, 2024)
KEY FACTS | | |
| Fund Size | $7,489,579,269 | |
| Number of Holdings | 290 | |
| Total Advisory Fee | $51,167,416 | |
| Portfolio Turnover | 84% | |
What did the Fund invest in?
(as of July 31, 2024)
MARKET SECTORS (% of Fund's net assets) | | |
| Health Care | 23.3 | |
| Industrials | 21.9 | |
| Information Technology | 19.6 | |
| Consumer Discretionary | 12.9 | |
| Financials | 6.6 | |
| Materials | 5.2 | |
| Energy | 4.7 | |
| Consumer Staples | 2.6 | |
| Real Estate | 1.4 | |
| Communication Services | 1.1 | |
| Utilities | 0.1 | |
| |
| Common Stocks | 98.1 |
| Preferred Stocks | 1.3 |
| Bonds | 0.0 |
| Short-Term Investments and Net Other Assets (Liabilities) | 0.6 |
ASSET ALLOCATION (% of Fund's net assets) |
|
|
| United States | 91.6 |
| Israel | 2.8 |
| Canada | 1.0 |
| United Kingdom | 1.0 |
| Thailand | 0.8 |
| Netherlands | 0.5 |
| Japan | 0.5 |
| Sweden | 0.4 |
| Italy | 0.4 |
| Others | 1.0 |
GEOGRAPHIC DIVERSIFICATION (% of Fund's net assets) |
|
| |
|
TOP HOLDINGS (% of Fund's net assets) | | |
| Insight Enterprises Inc | 1.6 | |
| FTAI Aviation Ltd | 1.5 | |
| Wix.com Ltd | 1.3 | |
| TransMedics Group Inc | 1.3 | |
| Applied Industrial Technologies Inc | 1.2 | |
| Fluor Corp | 1.1 | |
| Carpenter Technology Corp | 1.0 | |
| Installed Building Products Inc | 1.0 | |
| TD SYNNEX Corp | 0.9 | |
| Brinker International Inc | 0.9 | |
| | 11.8 | |
| |
How has the Fund changed?
This is a summary of certain changes to the Fund since August 1, 2023. For more complete information, you may review the Fund's next prospectus, which we expect to be available by September 28, 2024 at fundresearch.fidelity.com/prospectus/sec or upon request at 1-877-208-0098 or by sending an e-mail to fidfunddocuments@fidelity.com.
The fees associated with this class changed during the reporting year. The variations in class fees are primarily the result of the following changes: - •Management fee
- •Performance adjustment fee
The fund's transfer agent and pricing & bookkeeping fees were changed to a fixed rate effective December 1, 2023, through February 29, 2024, in anticipation of the transition to a new management fee structure. Effective March 1, 2024, the fund's management contract was amended to incorporate administrative services previously covered under separate services agreements (transfer agent and pricing & bookkeeping). The amended contract incorporates a basic fee rate that may vary by class (subject to a performance adjustment). The Adviser or an affiliate pays certain expenses of managing and operating the fund out of each class's management fee. |
| Fidelity, the Fidelity Investments Logo and all other Fidelity trademarks or service marks used herein are trademarks or service marks of FMR LLC. Any third-party marks that are used herein are trademarks or service marks of their respective owners. © 2024 FMR LLC. All rights reserved. |
| | For additional information about the Fund; including its prospectus, financial information, holdings and proxy information, scan the QR code or visit fundresearch.fidelity.com/prospectus/sec 1.9913462.100 1381-TSRA-0924 |
| |
| | ANNUAL SHAREHOLDER REPORT | AS OF JULY 31, 2024 | This report describes changes to the Fund that occurred during the reporting period. |
| | Fidelity® Small Cap Value Fund Fidelity Advisor® Small Cap Value Fund Class M : FCVTX |
| | | |
This annual shareholder report contains information about Fidelity® Small Cap Value Fund for the period August 1, 2023 to July 31, 2024. You can find additional information about the Fund at fundresearch.fidelity.com/prospectus/sec. You can also request this information by contacting us at 1-877-208-0098 or by sending an e-mail to fidfunddocuments@fidelity.com.
What were your Fund costs for the last year?(based on hypothetical $10,000 investment)
FUND COST (PREVIOUS YEAR)
| | Costs of a $10,000 investment | Costs paid as a percentage of a $10,000 investment | |
| Class M | $ 167 | 1.55% | |
What affected the Fund's performance this period?
•U.S. equities gained for the 12 months ending July 31, 2024, driven by resilient corporate profits, a frenzy over generative artificial intelligence and the Federal Reserve's likely pivot to cutting interest rates later this year.
•Against this backdrop, security selection was the primary contributor to the fund's performance versus the Russell 2000 Value Index for the fiscal year, led by the information technology sector, especially technology hardware & equipment firms. Solid picks and an underweight in real estate also boosted relative performance. Investment choices in energy helped as well.
•A stake in XPO gained about 82% and was the top individual relative contributor, though the company was not held at period end. Our position in TechnipFMC gained approximately 61% and was another plus. This period we decreased our exposure to the stock. Another notable relative contributor was Insight Enterprises (+54%), one of our largest holdings. All of these contributors were non-benchmark positions.
•In contrast, the biggest detractor from performance versus the benchmark was stock selection in materials. Subpar picks in health care and utilities also hurt.
•The largest individual relative detractor was an outsized stake in O-I Glass (-52%), a stock that was not held at period end. An overweight in Brookfield Infrastructure (-13%), one of the fund's largest holdings this period, proved detrimental as well. Larger-than-benchmark exposure to Owens & Minor (-15%) also hurt.
•Notable changes in positioning include decreased exposure to the consumer discretionary sector and a higher allocation to real estate stocks.
How did the Fund perform over the past 10 years?
CUMULATIVE PERFORMANCE
July 31, 2014 through July 31, 2024.
Initial investment of $10,000 and the current sales charge was paid.
Class M | $9,650 | $10,768 | $11,173 | $12,776 | $14,103 | $13,387 | $11,607 | $19,805 | $19,461 | $20,813 | $24,092 |
Russell 2000® Value Index | $10,000 | $10,430 | $11,013 | $13,129 | $15,016 | $13,858 | $11,653 | $19,076 | $18,167 | $18,883 | $21,845 |
Russell 3000® Index | $10,000 | $11,128 | $11,623 | $13,498 | $15,711 | $16,819 | $18,657 | $25,882 | $23,979 | $27,013 | $32,705 |
| | 2014 | 2015 | 2016 | 2017 | 2018 | 2019 | 2020 | 2021 | 2022 | 2023 | 2024 |
AVERAGE ANNUAL TOTAL RETURNS: | | 1 Year | 5 Year | 10 Year |
| Class M (incl. 3.50% sales charge) | 11.70% | 11.67% | 9.19% |
| Class M (without 3.50% sales charge) | 15.75% | 12.47% | 9.58% |
| Russell 2000® Value Index | 15.68% | 9.53% | 8.13% |
| Russell 3000® Index | 21.07% | 14.23% | 12.58% |
Visit institutional.fidelity.com for more recent performance information. |
The Fund's past performance is not a good predictor of the Fund's future performance. The graph and table do not reflect the deduction of taxes that a shareholder would pay on fund distributions or redemption of fund shares. |
Key Fund Statistics (as of July 31, 2024)
KEY FACTS | | |
| Fund Size | $5,128,532,088 | |
| Number of Holdings | 105 | |
| Total Advisory Fee | $41,899,156 | |
| Portfolio Turnover | 63% | |
What did the Fund invest in?
(as of July 31, 2024)
MARKET SECTORS (% of Fund's net assets) | | |
| Financials | 25.7 | |
| Industrials | 16.2 | |
| Information Technology | 9.5 | |
| Energy | 9.3 | |
| Real Estate | 8.9 | |
| Health Care | 7.9 | |
| Consumer Discretionary | 7.7 | |
| Materials | 4.6 | |
| Consumer Staples | 3.8 | |
| Utilities | 2.3 | |
| Communication Services | 1.4 | |
| |
| Common Stocks | 97.3 |
| Domestic Equity Funds | 1.0 |
| Short-Term Investments and Net Other Assets (Liabilities) | 1.7 |
ASSET ALLOCATION (% of Fund's net assets) |
|
|
| United States | 93.4 |
| Canada | 4.4 |
| Bermuda | 1.3 |
| United Kingdom | 0.7 |
| Japan | 0.1 |
| Netherlands | 0.1 |
GEOGRAPHIC DIVERSIFICATION (% of Fund's net assets) |
|
| |
|
TOP HOLDINGS (% of Fund's net assets) | | |
| Eastern Bankshares Inc | 2.6 | |
| Graphic Packaging Holding CO | 2.5 | |
| Insight Enterprises Inc | 2.5 | |
| Brookfield Infrastructure Corp Class A (United States) | 2.3 | |
| Beacon Roofing Supply Inc | 2.2 | |
| Old Republic International Corp | 2.0 | |
| Primerica Inc | 2.0 | |
| AMN Healthcare Services Inc | 1.9 | |
| US Foods Holding Corp | 1.9 | |
| Lumentum Holdings Inc | 1.9 | |
| | 21.8 | |
| |
How has the Fund changed?
This is a summary of certain changes to the Fund since August 1, 2023. For more complete information, you may review the Fund's next prospectus, which we expect to be available by September 28, 2024 at fundresearch.fidelity.com/prospectus/sec or upon request at 1-877-208-0098 or by sending an e-mail to fidfunddocuments@fidelity.com.
The fund's transfer agent and pricing & bookkeeping fees were changed to a fixed rate effective December 1, 2023, through February 29, 2024, in anticipation of the transition to a new management fee structure. Effective March 1, 2024, the fund's management contract was amended to incorporate administrative services previously covered under separate services agreements (transfer agent and pricing & bookkeeping). The amended contract incorporates a basic fee rate that may vary by class (subject to a performance adjustment). The Adviser or an affiliate pays certain expenses of managing and operating the fund out of each class's management fee. | |
| Fidelity, the Fidelity Investments Logo and all other Fidelity trademarks or service marks used herein are trademarks or service marks of FMR LLC. Any third-party marks that are used herein are trademarks or service marks of their respective owners. © 2024 FMR LLC. All rights reserved. |
| | For additional information about the Fund; including its prospectus, financial information, holdings and proxy information, scan the QR code or visit fundresearch.fidelity.com/prospectus/sec 1.9913468.100 1386-TSRA-0924 |
| |
| | ANNUAL SHAREHOLDER REPORT | AS OF JULY 31, 2024 | This report describes changes to the Fund that occurred during the reporting period. |
| | Fidelity® Small Cap Growth Fund Fidelity® Small Cap Growth Fund : FCPGX |
| | | |
This annual shareholder report contains information about Fidelity® Small Cap Growth Fund for the period August 1, 2023 to July 31, 2024. You can find additional information about the Fund at fundresearch.fidelity.com/prospectus/sec. You can also request this information by contacting us at 1-800-544-8544 or by sending an e-mail to fidfunddocuments@fidelity.com.
What were your Fund costs for the last year?(based on hypothetical $10,000 investment)
FUND COST (PREVIOUS YEAR)
| | Costs of a $10,000 investment | Costs paid as a percentage of a $10,000 investment | |
| Fidelity® Small Cap Growth Fund | $ 109 | 0.98% | |
What affected the Fund's performance this period?
•U.S. equities gained for the 12 months ending July 31, 2024, driven by resilient corporate profits, a frenzy over generative artificial intelligence and the Federal Reserve's likely pivot to cutting interest rates later this year.
•Against this backdrop, security selection was the primary contributor to the fund's performance versus the benchmark for the fiscal year, especially within industrials, where our stock picks in capital goods helped most. Stock choices in health care, primarily within the pharmaceuticals, biotechnology & life sciences industry, and consumer discretionary also boosted the fund's relative performance.
•The fund's non-benchmark stake in Vertiv Holdings (+227%) was the top individual relative contributor. The stock was not held at period end. The second-largest relative contributor was an overweight in FTAI Aviation (+253%). This period we increased our stake, and FTAI Aviation finished the fiscal year as one of our biggest holdings. Another notable relative contributor was our stake in Rover (+99%), a stock that was not held at period end.
•In contrast, the biggest detractors from performance versus the benchmark were overweight holdings in health care and energy. Picks in communication services also detracted from our relative result.
•The largest individual relative detractors were an overweight in agilon health (-64%) and a non-benchmark stake in Allegro MicroSystems (-51%). This period we increased our position in Allegro MicroSystems. Our stake in Abercrombie & Fitch (-20%) also detracted. This was an investment we established this period.
•Notable changes in positioning include increased exposure to the financials sector and a lower allocation to consumer staples.
How did the Fund perform over the past 10 years?
CUMULATIVE PERFORMANCE
July 31, 2014 through July 31, 2024.
Initial investment of $10,000.
Fidelity® Small Cap Growth Fund | $10,000 | $12,491 | $12,163 | $14,744 | $18,991 | $20,163 | $21,922 | $31,700 | $25,228 | $27,730 | $33,617 |
Russell 2000® Growth Index | $10,000 | $12,007 | $11,371 | $13,390 | $16,458 | $16,258 | $17,233 | $24,299 | $18,666 | $20,828 | $23,493 |
Russell 3000® Index | $10,000 | $11,128 | $11,623 | $13,498 | $15,711 | $16,819 | $18,657 | $25,882 | $23,979 | $27,013 | $32,705 |
| | 2014 | 2015 | 2016 | 2017 | 2018 | 2019 | 2020 | 2021 | 2022 | 2023 | 2024 |
AVERAGE ANNUAL TOTAL RETURNS: | | 1 Year | 5 Year | 10 Year |
| Fidelity® Small Cap Growth Fund | 21.23% | 10.76% | 12.89% |
| Russell 2000® Growth Index | 12.80% | 7.64% | 8.92% |
| Russell 3000® Index | 21.07% | 14.23% | 12.58% |
Visit www.fidelity.com for more recent performance information. |
The Fund's past performance is not a good predictor of the Fund's future performance. The graph and table do not reflect the deduction of taxes that a shareholder would pay on fund distributions or redemption of fund shares. |
Key Fund Statistics (as of July 31, 2024)
KEY FACTS | | |
| Fund Size | $7,489,579,269 | |
| Number of Holdings | 290 | |
| Total Advisory Fee | $51,167,416 | |
| Portfolio Turnover | 84% | |
What did the Fund invest in?
(as of July 31, 2024)
MARKET SECTORS (% of Fund's net assets) | | |
| Health Care | 23.3 | |
| Industrials | 21.9 | |
| Information Technology | 19.6 | |
| Consumer Discretionary | 12.9 | |
| Financials | 6.6 | |
| Materials | 5.2 | |
| Energy | 4.7 | |
| Consumer Staples | 2.6 | |
| Real Estate | 1.4 | |
| Communication Services | 1.1 | |
| Utilities | 0.1 | |
| |
| Common Stocks | 98.1 |
| Preferred Stocks | 1.3 |
| Bonds | 0.0 |
| Short-Term Investments and Net Other Assets (Liabilities) | 0.6 |
ASSET ALLOCATION (% of Fund's net assets) |
|
|
| United States | 91.6 |
| Israel | 2.8 |
| Canada | 1.0 |
| United Kingdom | 1.0 |
| Thailand | 0.8 |
| Netherlands | 0.5 |
| Japan | 0.5 |
| Sweden | 0.4 |
| Italy | 0.4 |
| Others | 1.0 |
GEOGRAPHIC DIVERSIFICATION (% of Fund's net assets) |
|
| |
|
TOP HOLDINGS (% of Fund's net assets) | | |
| Insight Enterprises Inc | 1.6 | |
| FTAI Aviation Ltd | 1.5 | |
| Wix.com Ltd | 1.3 | |
| TransMedics Group Inc | 1.3 | |
| Applied Industrial Technologies Inc | 1.2 | |
| Fluor Corp | 1.1 | |
| Carpenter Technology Corp | 1.0 | |
| Installed Building Products Inc | 1.0 | |
| TD SYNNEX Corp | 0.9 | |
| Brinker International Inc | 0.9 | |
| | 11.8 | |
| |
How has the Fund changed?
This is a summary of certain changes to the Fund since August 1, 2023. For more complete information, you may review the Fund's next prospectus, which we expect to be available by September 28, 2024 at fundresearch.fidelity.com/prospectus/sec or upon request at 1-800-544-8544 or by sending an e-mail to fidfunddocuments@fidelity.com.
The fees associated with this class changed during the reporting year. The variations in class fees are primarily the result of the following changes: - •Management fee
- •Performance adjustment fee
The fund's transfer agent and pricing & bookkeeping fees were changed to a fixed rate effective December 1, 2023, through February 29, 2024, in anticipation of the transition to a new management fee structure. Effective March 1, 2024, the fund's management contract was amended to incorporate administrative services previously covered under separate services agreements (transfer agent and pricing & bookkeeping). The amended contract incorporates a basic fee rate that may vary by class (subject to a performance adjustment). The Adviser or an affiliate pays certain expenses of managing and operating the fund out of each class's management fee. |
| Fidelity, the Fidelity Investments Logo and all other Fidelity trademarks or service marks used herein are trademarks or service marks of FMR LLC. Any third-party marks that are used herein are trademarks or service marks of their respective owners. © 2024 FMR LLC. All rights reserved. |
| | For additional information about the Fund; including its prospectus, financial information, holdings and proxy information, scan the QR code or visit fundresearch.fidelity.com/prospectus/sec 1.9913464.100 1388-TSRA-0924 |
| |
| | ANNUAL SHAREHOLDER REPORT | AS OF JULY 31, 2024 | |
| | Fidelity® Series Small Cap Opportunities Fund Fidelity® Series Small Cap Opportunities Fund : FSOPX |
| | | |
This annual shareholder report contains information about Fidelity® Series Small Cap Opportunities Fund for the period August 1, 2023 to July 31, 2024. You can find additional information about the Fund at fundresearch.fidelity.com/prospectus/sec. You can also request this information by contacting us at 1-800-544-8544.
What were your Fund costs for the last year?(based on hypothetical $10,000 investment)
FUND COST (PREVIOUS YEAR)
| | Costs of a $10,000 investment | Costs paid as a percentage of a $10,000 investment | |
| Fidelity® Series Small Cap Opportunities Fund | $ 0 A | 0.00%B | |
A Amount represents less than $.50
B Amount represents less than 0.005%
What affected the Fund's performance this period?
•U.S. equities gained for the 12 months ending July 31, 2024, driven by resilient corporate profits, a frenzy over generative artificial intelligence and the Federal Reserve's likely pivot to cutting interest rates later this year.
•Against this backdrop, security selection was the primary contributor to the fund's performance versus the Russell 2000® Index for the fiscal year, especially within industrials, where our picks in capital goods helped most. Stock picking in health care, primarily within the pharmaceuticals, biotechnology & life sciences industry, also boosted the fund's relative performance.
•The fund's top individual relative contributor was an overweight in IES Holdings (+169%), from the capital goods industry. The stock was one of the fund's biggest holdings at period end, even though we reduced our stake the past 12 months. A non-benchmark stake in Emcor Group gained 75% and was a second notable relative contributor. This period we decreased our investment in Emcor. An overweight in Fabrinet (+79%) also contributed. The company was among our biggest holdings.
•In contrast, the biggest detractor from the fund's performance versus the benchmark was security selection in communication services. Also hurting our result were picks in information technology, primarily within the software & services industry, and utilities
•Not owning Super Micro Computer, a benchmark component that gained 148%, was the fund's biggest individual relative detractor. Not owning MicroStrategy, a benchmark component that gained roughly 215%, was the second-largest relative detractor. Not owning Carvana, a benchmark component that gained 180%, was another notable relative detractor.
How did the Fund perform over the past 10 years?
CUMULATIVE PERFORMANCE
July 31, 2014 through July 31, 2024.
Initial investment of $10,000.
Fidelity® Series Small Cap Opportunities Fund | $10,000 | $11,266 | $11,159 | $12,523 | $15,007 | $15,305 | $14,778 | $21,572 | $19,928 | $22,421 | $27,319 |
Russell 2000® Index | $10,000 | $11,203 | $11,203 | $13,270 | $15,756 | $15,060 | $14,369 | $21,836 | $18,715 | $20,195 | $23,073 |
Russell 3000® Index | $10,000 | $11,128 | $11,623 | $13,498 | $15,711 | $16,819 | $18,657 | $25,882 | $23,979 | $27,013 | $32,705 |
| | 2014 | 2015 | 2016 | 2017 | 2018 | 2019 | 2020 | 2021 | 2022 | 2023 | 2024 |
AVERAGE ANNUAL TOTAL RETURNS: | | 1 Year | 5 Year | 10 Year |
| Fidelity® Series Small Cap Opportunities Fund | 21.85% | 12.29% | 10.57% |
| Russell 2000® Index | 14.25% | 8.91% | 8.72% |
| Russell 3000® Index | 21.07% | 14.23% | 12.58% |
Visit www.fidelity.com for more recent performance information. |
The Fund's past performance is not a good predictor of the Fund's future performance. The graph and table do not reflect the deduction of taxes that a shareholder would pay on fund distributions or redemption of fund shares. |
Key Fund Statistics (as of July 31, 2024)
KEY FACTS | | |
| Fund Size | $5,735,378,046 | |
| Number of Holdings | 220 | |
| Total Advisory Fee | $0 | |
| Portfolio Turnover | 47% | |
What did the Fund invest in?
(as of July 31, 2024)
MARKET SECTORS (% of Fund's net assets) | | |
| Industrials | 18.5 | |
| Health Care | 16.9 | |
| Financials | 16.9 | |
| Information Technology | 12.9 | |
| Consumer Discretionary | 11.5 | |
| Energy | 6.4 | |
| Materials | 6.0 | |
| Real Estate | 4.4 | |
| Consumer Staples | 2.8 | |
| Utilities | 2.0 | |
| Communication Services | 0.9 | |
| |
| Common Stocks | 99.2 |
| Short-Term Investments and Net Other Assets (Liabilities) | 0.8 |
ASSET ALLOCATION (% of Fund's net assets) |
|
|
| United States | 89.6 |
| Canada | 3.8 |
| United Kingdom | 2.0 |
| Thailand | 1.1 |
| Puerto Rico | 1.0 |
| Israel | 0.7 |
| Netherlands | 0.6 |
| Chile | 0.4 |
| India | 0.3 |
| Others | 0.5 |
GEOGRAPHIC DIVERSIFICATION (% of Fund's net assets) |
|
| |
|
TOP HOLDINGS (% of Fund's net assets) | | |
| Liberty Energy Inc Class A | 1.5 | |
| Synovus Financial Corp | 1.5 | |
| Insight Enterprises Inc | 1.4 | |
| Commercial Metals Co | 1.4 | |
| Academy Sports & Outdoors Inc | 1.3 | |
| Cactus Inc Class A | 1.2 | |
| IES Holdings Inc | 1.2 | |
| Green Brick Partners Inc | 1.2 | |
| Essent Group Ltd | 1.1 | |
| Fabrinet | 1.1 | |
| | 12.9 | |
| |
| Fidelity, the Fidelity Investments Logo and all other Fidelity trademarks or service marks used herein are trademarks or service marks of FMR LLC. Any third-party marks that are used herein are trademarks or service marks of their respective owners. © 2024 FMR LLC. All rights reserved. |
| | For additional information about the Fund; including its prospectus, financial information, holdings and proxy information, scan the QR code or visit fundresearch.fidelity.com/prospectus/sec 1.9913472.100 1799-TSRA-0924 |
| |
| | ANNUAL SHAREHOLDER REPORT | AS OF JULY 31, 2024 | |
| | Fidelity® Small Cap Growth K6 Fund Fidelity® Small Cap Growth K6 Fund : FOCSX |
| | | |
This annual shareholder report contains information about Fidelity® Small Cap Growth K6 Fund for the period August 1, 2023 to July 31, 2024. You can find additional information about the Fund at fundresearch.fidelity.com/prospectus/sec. You can also request this information by contacting us at 1-800-835-5092 or by sending an e-mail to fidfunddocuments@fidelity.com.
What were your Fund costs for the last year?(based on hypothetical $10,000 investment)
FUND COST (PREVIOUS YEAR)
| | Costs of a $10,000 investment | Costs paid as a percentage of a $10,000 investment | |
| Fidelity® Small Cap Growth K6 Fund | $ 67 | 0.60% | |
What affected the Fund's performance this period?
•U.S. equities gained for the 12 months ending July 31, 2024, driven by resilient corporate profits, a frenzy over generative artificial intelligence and the Federal Reserve's likely pivot to cutting interest rates later this year.
•Against this backdrop, security selection was the primary contributor to the fund's performance versus the benchmark for the fiscal year, especially within industrials, where our stock picks in capital goods helped most. Stock choices in health care, primarily within the pharmaceuticals, biotechnology & life sciences industry, and consumer discretionary also boosted the fund's relative performance.
•The fund's non-benchmark stake in Vertiv Holdings (+228%) was the top individual relative contributor. The stock was not held at period end. It also helped to overweight FTAI Aviation (+253%). This period we increased our stake, and FTAI Aviation finished the fiscal year as one of our biggest holdings. Another notable relative contributor was our stake in Rover (+99%), a stock that was not held at period end.
•In contrast, the biggest detractors from relative performance were picks in communication services and an overweight in health care. It also hurt to overweight energy.
•The biggest individual relative detractors were an overweight in agilon health (-64%) and a non-benchmark stake in Allegro MicroSystems (-51%). This period we increased our position in Allegro MicroSystems. Our stake in Abercrombie & Fitch (-20%) also detracted. This was an investment we established this period.
•Notable changes in positioning include increased exposure to the financials sector and a lower allocation to consumer staples.
How did the Fund perform over the life of Fund?
CUMULATIVE PERFORMANCE
May 25, 2017 through July 31, 2024.
Initial investment of $10,000.
Fidelity® Small Cap Growth K6 Fund | $10,000 | $10,420 | $13,413 | $14,237 | $15,624 | $22,617 | $18,024 | $19,887 |
Russell 2000® Growth Index | $10,000 | $10,355 | $12,727 | $12,572 | $13,326 | $18,790 | $14,435 | $16,106 |
Russell 3000® Index | $10,000 | $10,263 | $11,945 | $12,787 | $14,185 | $19,678 | $18,231 | $20,538 |
| | 2017 | 2018 | 2019 | 2020 | 2021 | 2022 | 2023 | 2024 |
AVERAGE ANNUAL TOTAL RETURNS: | | 1 Year | 5 Year | Life of Fund A |
| Fidelity® Small Cap Growth K6 Fund | 21.98% | 11.25% | 13.12% |
| Russell 2000® Growth Index | 12.80% | 7.64% | 8.66% |
| Russell 3000® Index | 21.07% | 14.23% | 13.51% |
A From May 25, 2017
Visit www.401k.com for more recent performance information. |
The Fund's past performance is not a good predictor of the Fund's future performance. The graph and table do not reflect the deduction of taxes that a shareholder would pay on fund distributions or redemption of fund shares. |
Key Fund Statistics (as of July 31, 2024)
KEY FACTS | | |
| Fund Size | $2,905,358,007 | |
| Number of Holdings | 292 | |
| Total Advisory Fee | $13,079,066 | |
| Portfolio Turnover | 85% | |
What did the Fund invest in?
(as of July 31, 2024)
MARKET SECTORS (% of Fund's net assets) | | |
| Health Care | 22.7 | |
| Industrials | 21.3 | |
| Information Technology | 19.0 | |
| Consumer Discretionary | 12.3 | |
| Financials | 6.7 | |
| Materials | 5.1 | |
| Energy | 4.5 | |
| Consumer Staples | 2.6 | |
| Real Estate | 1.3 | |
| Communication Services | 0.9 | |
| Utilities | 0.2 | |
| |
| Common Stocks | 95.8 |
| Domestic Equity Funds | 2.0 |
| Preferred Stocks | 0.8 |
| Bonds | 0.0 |
| Short-Term Investments and Net Other Assets (Liabilities) | 1.4 |
ASSET ALLOCATION (% of Fund's net assets) |
|
|
| United States | 91.9 |
| Israel | 2.7 |
| Canada | 1.0 |
| United Kingdom | 0.9 |
| Thailand | 0.8 |
| Netherlands | 0.5 |
| Japan | 0.5 |
| Sweden | 0.4 |
| Italy | 0.4 |
| Others | 0.9 |
GEOGRAPHIC DIVERSIFICATION (% of Fund's net assets) |
|
| |
|
TOP HOLDINGS (% of Fund's net assets) | | |
| iShares Russell 2000 Growth ETF | 2.0 | |
| Insight Enterprises Inc | 1.6 | |
| FTAI Aviation Ltd | 1.5 | |
| Wix.com Ltd | 1.3 | |
| TransMedics Group Inc | 1.3 | |
| Applied Industrial Technologies Inc | 1.2 | |
| Fluor Corp | 1.1 | |
| Installed Building Products Inc | 1.0 | |
| Carpenter Technology Corp | 0.9 | |
| TD SYNNEX Corp | 0.9 | |
| | 12.8 | |
| |
| Fidelity, the Fidelity Investments Logo and all other Fidelity trademarks or service marks used herein are trademarks or service marks of FMR LLC. Any third-party marks that are used herein are trademarks or service marks of their respective owners. © 2024 FMR LLC. All rights reserved. |
| | For additional information about the Fund; including its prospectus, financial information, holdings and proxy information, scan the QR code or visit fundresearch.fidelity.com/prospectus/sec 1.9913550.100 2957-TSRA-0924 |
| |
| | ANNUAL SHAREHOLDER REPORT | AS OF JULY 31, 2024 | |
| | Fidelity® OTC K6 Portfolio Fidelity® OTC K6 Portfolio : FOKFX |
| | | |
This annual shareholder report contains information about Fidelity® OTC K6 Portfolio for the period August 1, 2023 to July 31, 2024. You can find additional information about the Fund at fundresearch.fidelity.com/prospectus/sec. You can also request this information by contacting us at 1-800-835-5092 or by sending an e-mail to fidfunddocuments@fidelity.com.
What were your Fund costs for the last year?(based on hypothetical $10,000 investment)
FUND COST (PREVIOUS YEAR)
| | Costs of a $10,000 investment | Costs paid as a percentage of a $10,000 investment | |
| Fidelity® OTC K6 Portfolio | $ 57 | 0.50% | |
What affected the Fund's performance this period?
•U.S. equities gained for the 12 months ending July 31, 2024, driven by resilient corporate profits, a frenzy over generative artificial intelligence and the Federal Reserve's likely pivot to cutting interest rates later this year.
•Against this backdrop, security selection was the primary contributor to the fund's performance versus the NASDAQ Composite Index for the fiscal year, especially within the industrials sector, where our picks among capital goods stocks helped the most by far. Investment choices in consumer discretionary and information technology also boosted the fund's relative performance.
•The top individual relative contributor was an underweight in Tesla (-13%). A non-benchmark stake in Taiwan Semiconductor Manufacturing (+69%), one of the fund's largest holdings, was another plus. An out-of-benchmark position in Vertiv Holdings (+209%) also helped.
•In contrast, the biggest detractor from performance versus the benchmark was stock selection among consumer staples firms. Outsized exposure to energy stocks and an underweight in information technology hurt as well.
•The biggest individual relative detractor was an underweight in Broadcom (+82%). This was a position we established this period. Outsized exposure to Lululemon Athletica (-32%) also proved detrimental to performance, as did an overweight in Marvell Technology (+3%). The latter was among our largest holdings.
•Notable changes in positioning include decreased exposure to the energy sector and a higher allocation to health care companies.
How did the Fund perform over the life of Fund?
CUMULATIVE PERFORMANCE
June 13, 2019 through July 31, 2024.
Initial investment of $10,000.
Fidelity® OTC K6 Portfolio | $10,000 | $10,500 | $14,337 | $20,517 | $16,358 | $19,962 |
Nasdaq Composite Index® | $10,000 | $10,439 | $13,861 | $19,063 | $16,213 | $18,939 |
S&P 500® Index | $10,000 | $10,325 | $11,560 | $15,773 | $15,041 | $16,998 |
| | 2019 | 2020 | 2021 | 2022 | 2023 | 2024 |
AVERAGE ANNUAL TOTAL RETURNS: | | 1 Year | 5 Year | Life of Fund A |
| Fidelity® OTC K6 Portfolio | 27.14% | 19.31% | 19.88% |
| Nasdaq Composite Index® | 23.62% | 17.53% | 18.01% |
| S&P 500® Index | 22.15% | 15.00% | 15.28% |
A From June 13, 2019
Visit www.401k.com for more recent performance information. |
The Fund's past performance is not a good predictor of the Fund's future performance. The graph and table do not reflect the deduction of taxes that a shareholder would pay on fund distributions or redemption of fund shares. |
Key Fund Statistics (as of July 31, 2024)
KEY FACTS | | |
| Fund Size | $2,528,400,628 | |
| Number of Holdings | 154 | |
| Total Advisory Fee | $11,306,227 | |
| Portfolio Turnover | 41% | |
What did the Fund invest in?
(as of July 31, 2024)
MARKET SECTORS (% of Fund's net assets) | | |
| Information Technology | 45.2 | |
| Communication Services | 19.0 | |
| Consumer Discretionary | 12.5 | |
| Health Care | 8.1 | |
| Consumer Staples | 3.3 | |
| Financials | 2.5 | |
| Energy | 1.9 | |
| Industrials | 1.0 | |
| Utilities | 0.8 | |
| Real Estate | 0.3 | |
| Materials | 0.2 | |
| |
| Common Stocks | 94.7 |
| Bonds | 0.3 |
| Preferred Stocks | 0.1 |
| Short-Term Investments and Net Other Assets (Liabilities) | 4.9 |
ASSET ALLOCATION (% of Fund's net assets) |
|
|
| United States | 93.6 |
| Taiwan | 1.7 |
| Netherlands | 1.4 |
| Korea (South) | 0.8 |
| United Kingdom | 0.7 |
| China | 0.5 |
| France | 0.4 |
| Brazil | 0.3 |
| Ireland | 0.2 |
| Others | 0.4 |
GEOGRAPHIC DIVERSIFICATION (% of Fund's net assets) |
|
| |
|
TOP HOLDINGS (% of Fund's net assets) | | |
| Apple Inc | 13.3 | |
| Microsoft Corp | 10.3 | |
| Amazon.com Inc | 8.6 | |
| NVIDIA Corp | 8.0 | |
| Alphabet Inc Class A | 6.6 | |
| Meta Platforms Inc Class A | 4.8 | |
| Alphabet Inc Class C | 3.0 | |
| Netflix Inc | 2.4 | |
| Marvell Technology Inc | 2.3 | |
| Regeneron Pharmaceuticals Inc | 1.8 | |
| | 61.1 | |
| |
| Fidelity, the Fidelity Investments Logo and all other Fidelity trademarks or service marks used herein are trademarks or service marks of FMR LLC. Any third-party marks that are used herein are trademarks or service marks of their respective owners. © 2024 FMR LLC. All rights reserved. |
| | For additional information about the Fund; including its prospectus, financial information, holdings and proxy information, scan the QR code or visit fundresearch.fidelity.com/prospectus/sec 1.9913554.100 3407-TSRA-0924 |
| |
| | ANNUAL SHAREHOLDER REPORT | AS OF JULY 31, 2024 | This report describes changes to the Fund that occurred during the reporting period. |
| | Fidelity® Real Estate Income Fund Fidelity Advisor® Real Estate Income Fund Class M : FRIQX |
| | | |
This annual shareholder report contains information about Fidelity® Real Estate Income Fund for the period August 1, 2023 to July 31, 2024. You can find additional information about the Fund at fundresearch.fidelity.com/prospectus/sec. You can also request this information by contacting us at 1-877-208-0098 or by sending an e-mail to fidfunddocuments@fidelity.com.
What were your Fund costs for the last year?(based on hypothetical $10,000 investment)
FUND COST (PREVIOUS YEAR)
| | Costs of a $10,000 investment | Costs paid as a percentage of a $10,000 investment | |
| Class M | $ 102 | 0.97% | |
What affected the Fund's performance this period?
•Investors in real estate securities experienced often-fluctuating market conditions throughout the 12 months ending July 31, 2024, initially declining due to concerns about rate hikes but later rallying as hopes for rate cuts in 2024 grew.
•Against this backdrop, security selection was the primary contributor to the fund's performance versus the Fidelity Real Estate Income Composite IndexSM, a 40/25/20/15 blend of the ICE BofA® US Real Estate Index, the MSCI REIT Preferred Index, the FTSE® NAREIT® All REITs Index and the Bloomberg U.S. CMBS ex-AAA Index. Selection among preferred stocks and collateralized mortgage obligations stood out as helping relative performance. Asset allocation modestly contributed this period, especially among preferred stocks, while a stake in cash of roughly 7%, on average, also helped.
•The largest individual relative contributor was a common stock position in Welltower (+39%), an owner of senior-housing properties.
•In contrast, detractors included the fund's underweight in real estate bonds and security selection among real estate common stocks.
•The largest individual relative detractor was a real estate bond investment of Veritas related to a defaulted loan on apartment buildings in San Francisco. The holding lost all its value and was not held in the portfolio on July 31.
•Notable changes in positioning include increased exposure to investment-grade real estate bonds and reductions in high-yield real estate bonds, cash and preferred stocks.
How did the Fund perform over the past 10 years?
CUMULATIVE PERFORMANCE
July 31, 2014 through July 31, 2024.
Initial investment of $10,000 and the current sales charge was paid.
Class M | $9,600 | $10,044 | $11,155 | $11,742 | $11,988 | $13,202 | $12,293 | $15,565 | $14,810 | $14,403 | $15,781 |
Fidelity Real Estate Income Composite Index℠ | $10,000 | $10,669 | $11,896 | $12,161 | $12,343 | $13,577 | $13,629 | $15,721 | $14,457 | $13,774 | $14,991 |
ICE® BofA® US High Yield Constrained Index | $10,000 | $10,017 | $10,513 | $11,695 | $11,987 | $12,818 | $13,202 | $14,621 | $13,490 | $14,051 | $15,603 |
S&P 500® Index | $10,000 | $11,121 | $11,745 | $13,629 | $15,843 | $17,108 | $19,153 | $26,134 | $24,921 | $28,165 | $34,403 |
Bloomberg U.S. Universal Bond Index | $10,000 | $10,253 | $10,875 | $10,939 | $10,877 | $11,766 | $12,878 | $12,926 | $11,690 | $11,410 | $12,062 |
| | 2014 | 2015 | 2016 | 2017 | 2018 | 2019 | 2020 | 2021 | 2022 | 2023 | 2024 |
Effective June 1, 2024, the fund began comparing its performance to ICE® BofA® US High Yield Constrained Index rather than S&P 500® Index because the ICE® BofA® US High Yield Constrained Index conforms more closely to the fund's investment policies.
AVERAGE ANNUAL TOTAL RETURNS: | | 1 Year | 5 Year | 10 Year |
| Class M (incl. 4.00% sales charge) | 5.18% | 2.79% | 4.67% |
| Class M (without 4.00% sales charge) | 9.56% | 3.63% | 5.10% |
| Fidelity Real Estate Income Composite Index℠ | 8.84% | 2.00% | 4.13% |
| ICE® BofA® US High Yield Constrained Index | 11.04% | 4.01% | 4.55% |
| S&P 500® Index | 22.15% | 15.00% | 13.15% |
| Bloomberg U.S. Universal Bond Index | 5.72% | 0.50% | 1.89% |
Effective June 1, 2024, the fund began comparing its performance to ICE® BofA® US High Yield Constrained Index rather than S&P 500® Index because the ICE® BofA® US High Yield Constrained Index conforms more closely to the fund's investment policies.
Visit institutional.fidelity.com for more recent performance information. |
The Fund's past performance is not a good predictor of the Fund's future performance. The graph and table do not reflect the deduction of taxes that a shareholder would pay on fund distributions or redemption of fund shares. |
Key Fund Statistics (as of July 31, 2024)
KEY FACTS | | |
| Fund Size | $4,786,766,888 | |
| Number of Holdings | 519 | |
| Total Advisory Fee | $25,368,688 | |
| Portfolio Turnover | 24% | |
What did the Fund invest in?
(as of July 31, 2024)
| AAA | 4.7 |
| AA | 1.7 |
| A | 3.7 |
| BBB | 17.0 |
| BB | 10.9 |
| B | 5.2 |
| CCC,CC,C | 1.8 |
| Not Rated | 12.2 |
| Equities | 38.9 |
| Short-Term Investments and Net Other Assets (Liabilities) | 3.9 |
QUALITY DIVERSIFICATION (% of Fund's net assets) |
|
| |
| We have used ratings from Moody's Investors Service, Inc. Where Moody's® ratings are not available, we have used S&P® ratings. All ratings are as of the date indicated and do not reflect subsequent changes. |
| Corporate Bonds | 30.4 |
| Common Stocks | 23.8 |
| CMOs and Other Mortgage Related Securities | 22.6 |
| Preferred Stocks | 14.4 |
| Bank Loan Obligations | 2.4 |
| Asset-Backed Securities | 1.7 |
| Preferred Securities | 0.8 |
| Short-Term Investments and Net Other Assets (Liabilities) | 3.9 |
ASSET ALLOCATION (% of Fund's net assets) |
|
|
| United States | 99.6 |
| Canada | 0.2 |
| United Kingdom | 0.2 |
| Grand Cayman (UK Overseas Ter) | 0.0 |
GEOGRAPHIC DIVERSIFICATION (% of Fund's net assets) |
|
| |
|
TOP HOLDINGS (% of Fund's net assets) | | |
| American Tower Corp | 2.7 | |
| American Tower Corp | 2.5 | |
| Crown Castle Inc | 2.0 | |
| Equity LifeStyle Properties Inc | 1.9 | |
| Prologis Inc | 1.6 | |
| Welltower Inc | 1.5 | |
| Equinix Inc | 1.4 | |
| American Homes 4 Rent LP | 1.4 | |
| Crown Castle Inc | 1.3 | |
| Sun Communities Operating LP | 1.3 | |
| | 17.6 | |
| |
How has the Fund changed?
This is a summary of certain changes to the Fund since August 1, 2023. For more complete information, you may review the Fund's next prospectus, which we expect to be available by September 28, 2024 at fundresearch.fidelity.com/prospectus/sec or upon request at 1-877-208-0098 or by sending an e-mail to fidfunddocuments@fidelity.com.
The fund's transfer agent and pricing & bookkeeping fees were changed to a fixed rate effective December 1, 2023, through February 29, 2024, in anticipation of the transition to a new management fee structure. Effective March 1, 2024, the fund's management contract was amended to incorporate administrative services previously covered under separate services agreements (transfer agent and pricing & bookkeeping). The amended contract incorporates a basic fee rate that may vary by class (subject to a performance adjustment). The Adviser or an affiliate pays certain expenses of managing and operating the fund out of each class's management fee. | |
| Fidelity, the Fidelity Investments Logo and all other Fidelity trademarks or service marks used herein are trademarks or service marks of FMR LLC. Any third-party marks that are used herein are trademarks or service marks of their respective owners. © 2024 FMR LLC. All rights reserved. |
| | For additional information about the Fund; including its prospectus, financial information, holdings and proxy information, scan the QR code or visit fundresearch.fidelity.com/prospectus/sec 1.9913475.100 2225-TSRA-0924 |
| |
| | ANNUAL SHAREHOLDER REPORT | AS OF JULY 31, 2024 | This report describes changes to the Fund that occurred during the reporting period. |
| | Fidelity® Small Cap Value Fund Fidelity Advisor® Small Cap Value Fund Class C : FCVCX |
| | | |
This annual shareholder report contains information about Fidelity® Small Cap Value Fund for the period August 1, 2023 to July 31, 2024. You can find additional information about the Fund at fundresearch.fidelity.com/prospectus/sec. You can also request this information by contacting us at 1-877-208-0098 or by sending an e-mail to fidfunddocuments@fidelity.com.
What were your Fund costs for the last year?(based on hypothetical $10,000 investment)
FUND COST (PREVIOUS YEAR)
| | Costs of a $10,000 investment | Costs paid as a percentage of a $10,000 investment | |
| Class C | $ 221 | 2.05% | |
What affected the Fund's performance this period?
•U.S. equities gained for the 12 months ending July 31, 2024, driven by resilient corporate profits, a frenzy over generative artificial intelligence and the Federal Reserve's likely pivot to cutting interest rates later this year.
•Against this backdrop, security selection was the primary contributor to the fund's performance versus the Russell 2000 Value Index for the fiscal year, led by the information technology sector, especially technology hardware & equipment firms. Solid picks and an underweight in real estate also boosted relative performance. Investment choices in energy helped as well.
•A stake in XPO gained about 82% and was the top individual relative contributor, though the company was not held at period end. Our position in TechnipFMC gained approximately 61% and was another plus. This period we decreased our exposure to the stock. Another notable relative contributor was Insight Enterprises (+54%), one of our largest holdings. All of these contributors were non-benchmark positions.
•In contrast, the biggest detractor from performance versus the benchmark was stock selection in materials. Subpar picks in health care and utilities also hurt.
•The largest individual relative detractor was an outsized stake in O-I Glass (-52%), a stock that was not held at period end. An overweight in Brookfield Infrastructure (-13%), one of the fund's largest holdings this period, proved detrimental as well. Larger-than-benchmark exposure to Owens & Minor (-15%) also hurt.
•Notable changes in positioning include decreased exposure to the consumer discretionary sector and a higher allocation to real estate stocks.
How did the Fund perform over the past 10 years?
CUMULATIVE PERFORMANCE
July 31, 2014 through July 31, 2024.
Initial investment of $10,000.
Class C | $10,000 | $11,105 | $11,460 | $13,040 | $14,323 | $13,516 | $11,659 | $19,802 | $19,353 | $20,741 | $24,065 |
Russell 2000® Value Index | $10,000 | $10,430 | $11,013 | $13,129 | $15,016 | $13,858 | $11,653 | $19,076 | $18,167 | $18,883 | $21,845 |
Russell 3000® Index | $10,000 | $11,128 | $11,623 | $13,498 | $15,711 | $16,819 | $18,657 | $25,882 | $23,979 | $27,013 | $32,705 |
| | 2014 | 2015 | 2016 | 2017 | 2018 | 2019 | 2020 | 2021 | 2022 | 2023 | 2024 |
AVERAGE ANNUAL TOTAL RETURNS: | | 1 Year | 5 Year | 10 Year |
| Class C (incl. contingent deferred sales charge) | 14.15% | 11.89% | 9.18% |
| Class C | 15.15% | 11.89% | 9.18% |
| Russell 2000® Value Index | 15.68% | 9.53% | 8.13% |
| Russell 3000® Index | 21.07% | 14.23% | 12.58% |
Visit institutional.fidelity.com for more recent performance information. |
The Fund's past performance is not a good predictor of the Fund's future performance. The graph and table do not reflect the deduction of taxes that a shareholder would pay on fund distributions or redemption of fund shares. |
Key Fund Statistics (as of July 31, 2024)
KEY FACTS | | |
| Fund Size | $5,128,532,088 | |
| Number of Holdings | 105 | |
| Total Advisory Fee | $41,899,156 | |
| Portfolio Turnover | 63% | |
What did the Fund invest in?
(as of July 31, 2024)
MARKET SECTORS (% of Fund's net assets) | | |
| Financials | 25.7 | |
| Industrials | 16.2 | |
| Information Technology | 9.5 | |
| Energy | 9.3 | |
| Real Estate | 8.9 | |
| Health Care | 7.9 | |
| Consumer Discretionary | 7.7 | |
| Materials | 4.6 | |
| Consumer Staples | 3.8 | |
| Utilities | 2.3 | |
| Communication Services | 1.4 | |
| |
| Common Stocks | 97.3 |
| Domestic Equity Funds | 1.0 |
| Short-Term Investments and Net Other Assets (Liabilities) | 1.7 |
ASSET ALLOCATION (% of Fund's net assets) |
|
|
| United States | 93.4 |
| Canada | 4.4 |
| Bermuda | 1.3 |
| United Kingdom | 0.7 |
| Japan | 0.1 |
| Netherlands | 0.1 |
GEOGRAPHIC DIVERSIFICATION (% of Fund's net assets) |
|
| |
|
TOP HOLDINGS (% of Fund's net assets) | | |
| Eastern Bankshares Inc | 2.6 | |
| Graphic Packaging Holding CO | 2.5 | |
| Insight Enterprises Inc | 2.5 | |
| Brookfield Infrastructure Corp Class A (United States) | 2.3 | |
| Beacon Roofing Supply Inc | 2.2 | |
| Old Republic International Corp | 2.0 | |
| Primerica Inc | 2.0 | |
| AMN Healthcare Services Inc | 1.9 | |
| US Foods Holding Corp | 1.9 | |
| Lumentum Holdings Inc | 1.9 | |
| | 21.8 | |
| |
How has the Fund changed?
This is a summary of certain changes to the Fund since August 1, 2023. For more complete information, you may review the Fund's next prospectus, which we expect to be available by September 28, 2024 at fundresearch.fidelity.com/prospectus/sec or upon request at 1-877-208-0098 or by sending an e-mail to fidfunddocuments@fidelity.com.
The fund's transfer agent and pricing & bookkeeping fees were changed to a fixed rate effective December 1, 2023, through February 29, 2024, in anticipation of the transition to a new management fee structure. Effective March 1, 2024, the fund's management contract was amended to incorporate administrative services previously covered under separate services agreements (transfer agent and pricing & bookkeeping). The amended contract incorporates a basic fee rate that may vary by class (subject to a performance adjustment). The Adviser or an affiliate pays certain expenses of managing and operating the fund out of each class's management fee. | |
| Fidelity, the Fidelity Investments Logo and all other Fidelity trademarks or service marks used herein are trademarks or service marks of FMR LLC. Any third-party marks that are used herein are trademarks or service marks of their respective owners. © 2024 FMR LLC. All rights reserved. |
| | For additional information about the Fund; including its prospectus, financial information, holdings and proxy information, scan the QR code or visit fundresearch.fidelity.com/prospectus/sec 1.9913467.100 1385-TSRA-0924 |
| |
| | ANNUAL SHAREHOLDER REPORT | AS OF JULY 31, 2024 | This report describes changes to the Fund that occurred during the reporting period. |
| | Fidelity® Real Estate Income Fund Fidelity Advisor® Real Estate Income Fund Class I : FRIRX |
| | | |
This annual shareholder report contains information about Fidelity® Real Estate Income Fund for the period August 1, 2023 to July 31, 2024. You can find additional information about the Fund at fundresearch.fidelity.com/prospectus/sec. You can also request this information by contacting us at 1-877-208-0098 or by sending an e-mail to fidfunddocuments@fidelity.com.
What were your Fund costs for the last year?(based on hypothetical $10,000 investment)
FUND COST (PREVIOUS YEAR)
| | Costs of a $10,000 investment | Costs paid as a percentage of a $10,000 investment | |
| Class I | $ 75 | 0.71% | |
What affected the Fund's performance this period?
•Investors in real estate securities experienced often-fluctuating market conditions throughout the 12 months ending July 31, 2024, initially declining due to concerns about rate hikes but later rallying as hopes for rate cuts in 2024 grew.
•Against this backdrop, security selection was the primary contributor to the fund's performance versus the Fidelity Real Estate Income Composite IndexSM, a 40/25/20/15 blend of the ICE BofA® US Real Estate Index, the MSCI REIT Preferred Index, the FTSE® NAREIT® All REITs Index and the Bloomberg U.S. CMBS ex-AAA Index. Selection among preferred stocks and collateralized mortgage obligations stood out as helping relative performance. Asset allocation modestly contributed this period, especially among preferred stocks, while a stake in cash of roughly 7%, on average, also helped.
•The largest individual relative contributor was a common stock position in Welltower (+39%), an owner of senior-housing properties.
•In contrast, detractors included the fund's underweight in real estate bonds and security selection among real estate common stocks.
•The largest individual relative detractor was a real estate bond investment of Veritas related to a defaulted loan on apartment buildings in San Francisco. The holding lost all its value and was not held in the portfolio on July 31.
•Notable changes in positioning include increased exposure to investment-grade real estate bonds and reductions in high-yield real estate bonds, cash and preferred stocks.
How did the Fund perform over the past 10 years?
CUMULATIVE PERFORMANCE
July 31, 2014 through July 31, 2024.
Initial investment of $10,000.
Class I | $10,000 | $10,492 | $11,678 | $12,338 | $12,636 | $13,954 | $13,030 | $16,552 | $15,795 | $15,398 | $16,916 |
Fidelity Real Estate Income Composite Index℠ | $10,000 | $10,669 | $11,896 | $12,161 | $12,343 | $13,577 | $13,629 | $15,721 | $14,457 | $13,774 | $14,991 |
ICE® BofA® US High Yield Constrained Index | $10,000 | $10,017 | $10,513 | $11,695 | $11,987 | $12,818 | $13,202 | $14,621 | $13,490 | $14,051 | $15,603 |
S&P 500® Index | $10,000 | $11,121 | $11,745 | $13,629 | $15,843 | $17,108 | $19,153 | $26,134 | $24,921 | $28,165 | $34,403 |
Bloomberg U.S. Universal Bond Index | $10,000 | $10,253 | $10,875 | $10,939 | $10,877 | $11,766 | $12,878 | $12,926 | $11,690 | $11,410 | $12,062 |
| | 2014 | 2015 | 2016 | 2017 | 2018 | 2019 | 2020 | 2021 | 2022 | 2023 | 2024 |
Effective June 1, 2024, the fund began comparing its performance to ICE® BofA® US High Yield Constrained Index rather than S&P 500® Index because the ICE® BofA® US High Yield Constrained Index conforms more closely to the fund's investment policies.
AVERAGE ANNUAL TOTAL RETURNS: | | 1 Year | 5 Year | 10 Year |
| Class I | 9.86% | 3.93% | 5.40% |
| Fidelity Real Estate Income Composite Index℠ | 8.84% | 2.00% | 4.13% |
| ICE® BofA® US High Yield Constrained Index | 11.04% | 4.01% | 4.55% |
| S&P 500® Index | 22.15% | 15.00% | 13.15% |
| Bloomberg U.S. Universal Bond Index | 5.72% | 0.50% | 1.89% |
Effective June 1, 2024, the fund began comparing its performance to ICE® BofA® US High Yield Constrained Index rather than S&P 500® Index because the ICE® BofA® US High Yield Constrained Index conforms more closely to the fund's investment policies.
Visit institutional.fidelity.com for more recent performance information. |
The Fund's past performance is not a good predictor of the Fund's future performance. The graph and table do not reflect the deduction of taxes that a shareholder would pay on fund distributions or redemption of fund shares. |
Key Fund Statistics (as of July 31, 2024)
KEY FACTS | | |
| Fund Size | $4,786,766,888 | |
| Number of Holdings | 519 | |
| Total Advisory Fee | $25,368,688 | |
| Portfolio Turnover | 24% | |
What did the Fund invest in?
(as of July 31, 2024)
| AAA | 4.7 |
| AA | 1.7 |
| A | 3.7 |
| BBB | 17.0 |
| BB | 10.9 |
| B | 5.2 |
| CCC,CC,C | 1.8 |
| Not Rated | 12.2 |
| Equities | 38.9 |
| Short-Term Investments and Net Other Assets (Liabilities) | 3.9 |
QUALITY DIVERSIFICATION (% of Fund's net assets) |
|
| |
| We have used ratings from Moody's Investors Service, Inc. Where Moody's® ratings are not available, we have used S&P® ratings. All ratings are as of the date indicated and do not reflect subsequent changes. |
| Corporate Bonds | 30.4 |
| Common Stocks | 23.8 |
| CMOs and Other Mortgage Related Securities | 22.6 |
| Preferred Stocks | 14.4 |
| Bank Loan Obligations | 2.4 |
| Asset-Backed Securities | 1.7 |
| Preferred Securities | 0.8 |
| Short-Term Investments and Net Other Assets (Liabilities) | 3.9 |
ASSET ALLOCATION (% of Fund's net assets) |
|
|
| United States | 99.6 |
| Canada | 0.2 |
| United Kingdom | 0.2 |
| Grand Cayman (UK Overseas Ter) | 0.0 |
GEOGRAPHIC DIVERSIFICATION (% of Fund's net assets) |
|
| |
|
TOP HOLDINGS (% of Fund's net assets) | | |
| American Tower Corp | 2.7 | |
| American Tower Corp | 2.5 | |
| Crown Castle Inc | 2.0 | |
| Equity LifeStyle Properties Inc | 1.9 | |
| Prologis Inc | 1.6 | |
| Welltower Inc | 1.5 | |
| Equinix Inc | 1.4 | |
| American Homes 4 Rent LP | 1.4 | |
| Crown Castle Inc | 1.3 | |
| Sun Communities Operating LP | 1.3 | |
| | 17.6 | |
| |
How has the Fund changed?
This is a summary of certain changes to the Fund since August 1, 2023. For more complete information, you may review the Fund's next prospectus, which we expect to be available by September 28, 2024 at fundresearch.fidelity.com/prospectus/sec or upon request at 1-877-208-0098 or by sending an e-mail to fidfunddocuments@fidelity.com.
The fund's transfer agent and pricing & bookkeeping fees were changed to a fixed rate effective December 1, 2023, through February 29, 2024, in anticipation of the transition to a new management fee structure. Effective March 1, 2024, the fund's management contract was amended to incorporate administrative services previously covered under separate services agreements (transfer agent and pricing & bookkeeping). The amended contract incorporates a basic fee rate that may vary by class (subject to a performance adjustment). The Adviser or an affiliate pays certain expenses of managing and operating the fund out of each class's management fee. | |
| Fidelity, the Fidelity Investments Logo and all other Fidelity trademarks or service marks used herein are trademarks or service marks of FMR LLC. Any third-party marks that are used herein are trademarks or service marks of their respective owners. © 2024 FMR LLC. All rights reserved. |
| | For additional information about the Fund; including its prospectus, financial information, holdings and proxy information, scan the QR code or visit fundresearch.fidelity.com/prospectus/sec 1.9913476.100 2227-TSRA-0924 |
| |
| | ANNUAL SHAREHOLDER REPORT | AS OF JULY 31, 2024 | This report describes changes to the Fund that occurred during the reporting period. |
| | Fidelity® Real Estate Income Fund Fidelity Advisor® Real Estate Income Fund Class A : FRINX |
| | | |
This annual shareholder report contains information about Fidelity® Real Estate Income Fund for the period August 1, 2023 to July 31, 2024. You can find additional information about the Fund at fundresearch.fidelity.com/prospectus/sec. You can also request this information by contacting us at 1-877-208-0098 or by sending an e-mail to fidfunddocuments@fidelity.com.
What were your Fund costs for the last year?(based on hypothetical $10,000 investment)
FUND COST (PREVIOUS YEAR)
| | Costs of a $10,000 investment | Costs paid as a percentage of a $10,000 investment | |
| Class A | $ 101 | 0.96% | |
What affected the Fund's performance this period?
•Investors in real estate securities experienced often-fluctuating market conditions throughout the 12 months ending July 31, 2024, initially declining due to concerns about rate hikes but later rallying as hopes for rate cuts in 2024 grew.
•Against this backdrop, security selection was the primary contributor to the fund's performance versus the Fidelity Real Estate Income Composite IndexSM, a 40/25/20/15 blend of the ICE BofA® US Real Estate Index, the MSCI REIT Preferred Index, the FTSE® NAREIT® All REITs Index and the Bloomberg U.S. CMBS ex-AAA Index. Selection among preferred stocks and collateralized mortgage obligations stood out as helping relative performance. Asset allocation modestly contributed this period, especially among preferred stocks, while a stake in cash of roughly 7%, on average, also helped.
•The largest individual relative contributor was a common stock position in Welltower (+39%), an owner of senior-housing properties.
•In contrast, detractors included the fund's underweight in real estate bonds and security selection among real estate common stocks.
•The largest individual relative detractor was a real estate bond investment of Veritas related to a defaulted loan on apartment buildings in San Francisco. The holding lost all its value and was not held in the portfolio on July 31.
•Notable changes in positioning include increased exposure to investment-grade real estate bonds and reductions in high-yield real estate bonds, cash and preferred stocks.
How did the Fund perform over the past 10 years?
CUMULATIVE PERFORMANCE
July 31, 2014 through July 31, 2024.
Initial investment of $10,000 and the current sales charge was paid.
Class A | $9,600 | $10,046 | $11,153 | $11,751 | $12,002 | $13,220 | $12,311 | $15,591 | $14,837 | $14,433 | $15,817 |
Fidelity Real Estate Income Composite Index℠ | $10,000 | $10,669 | $11,896 | $12,161 | $12,343 | $13,577 | $13,629 | $15,721 | $14,457 | $13,774 | $14,991 |
ICE® BofA® US High Yield Constrained Index | $10,000 | $10,017 | $10,513 | $11,695 | $11,987 | $12,818 | $13,202 | $14,621 | $13,490 | $14,051 | $15,603 |
S&P 500® Index | $10,000 | $11,121 | $11,745 | $13,629 | $15,843 | $17,108 | $19,153 | $26,134 | $24,921 | $28,165 | $34,403 |
Bloomberg U.S. Universal Bond Index | $10,000 | $10,253 | $10,875 | $10,939 | $10,877 | $11,766 | $12,878 | $12,926 | $11,690 | $11,410 | $12,062 |
| | 2014 | 2015 | 2016 | 2017 | 2018 | 2019 | 2020 | 2021 | 2022 | 2023 | 2024 |
Effective June 1, 2024, the fund began comparing its performance to ICE® BofA® US High Yield Constrained Index rather than S&P 500® Index because the ICE® BofA® US High Yield Constrained Index conforms more closely to the fund's investment policies.
AVERAGE ANNUAL TOTAL RETURNS: | | 1 Year | 5 Year | 10 Year |
| Class A (incl. 4.00% sales charge) | 5.20% | 2.81% | 4.69% |
| Class A (without 4.00% sales charge) | 9.58% | 3.65% | 5.12% |
| Fidelity Real Estate Income Composite Index℠ | 8.84% | 2.00% | 4.13% |
| ICE® BofA® US High Yield Constrained Index | 11.04% | 4.01% | 4.55% |
| S&P 500® Index | 22.15% | 15.00% | 13.15% |
| Bloomberg U.S. Universal Bond Index | 5.72% | 0.50% | 1.89% |
Effective June 1, 2024, the fund began comparing its performance to ICE® BofA® US High Yield Constrained Index rather than S&P 500® Index because the ICE® BofA® US High Yield Constrained Index conforms more closely to the fund's investment policies.
Visit institutional.fidelity.com for more recent performance information. |
The Fund's past performance is not a good predictor of the Fund's future performance. The graph and table do not reflect the deduction of taxes that a shareholder would pay on fund distributions or redemption of fund shares. |
Key Fund Statistics (as of July 31, 2024)
KEY FACTS | | |
| Fund Size | $4,786,766,888 | |
| Number of Holdings | 519 | |
| Total Advisory Fee | $25,368,688 | |
| Portfolio Turnover | 24% | |
What did the Fund invest in?
(as of July 31, 2024)
| AAA | 4.7 |
| AA | 1.7 |
| A | 3.7 |
| BBB | 17.0 |
| BB | 10.9 |
| B | 5.2 |
| CCC,CC,C | 1.8 |
| Not Rated | 12.2 |
| Equities | 38.9 |
| Short-Term Investments and Net Other Assets (Liabilities) | 3.9 |
QUALITY DIVERSIFICATION (% of Fund's net assets) |
|
| |
| We have used ratings from Moody's Investors Service, Inc. Where Moody's® ratings are not available, we have used S&P® ratings. All ratings are as of the date indicated and do not reflect subsequent changes. |
| Corporate Bonds | 30.4 |
| Common Stocks | 23.8 |
| CMOs and Other Mortgage Related Securities | 22.6 |
| Preferred Stocks | 14.4 |
| Bank Loan Obligations | 2.4 |
| Asset-Backed Securities | 1.7 |
| Preferred Securities | 0.8 |
| Short-Term Investments and Net Other Assets (Liabilities) | 3.9 |
ASSET ALLOCATION (% of Fund's net assets) |
|
|
| United States | 99.6 |
| Canada | 0.2 |
| United Kingdom | 0.2 |
| Grand Cayman (UK Overseas Ter) | 0.0 |
GEOGRAPHIC DIVERSIFICATION (% of Fund's net assets) |
|
| |
|
TOP HOLDINGS (% of Fund's net assets) | | |
| American Tower Corp | 2.7 | |
| American Tower Corp | 2.5 | |
| Crown Castle Inc | 2.0 | |
| Equity LifeStyle Properties Inc | 1.9 | |
| Prologis Inc | 1.6 | |
| Welltower Inc | 1.5 | |
| Equinix Inc | 1.4 | |
| American Homes 4 Rent LP | 1.4 | |
| Crown Castle Inc | 1.3 | |
| Sun Communities Operating LP | 1.3 | |
| | 17.6 | |
| |
How has the Fund changed?
This is a summary of certain changes to the Fund since August 1, 2023. For more complete information, you may review the Fund's next prospectus, which we expect to be available by September 28, 2024 at fundresearch.fidelity.com/prospectus/sec or upon request at 1-877-208-0098 or by sending an e-mail to fidfunddocuments@fidelity.com.
The fund's transfer agent and pricing & bookkeeping fees were changed to a fixed rate effective December 1, 2023, through February 29, 2024, in anticipation of the transition to a new management fee structure. Effective March 1, 2024, the fund's management contract was amended to incorporate administrative services previously covered under separate services agreements (transfer agent and pricing & bookkeeping). The amended contract incorporates a basic fee rate that may vary by class (subject to a performance adjustment). The Adviser or an affiliate pays certain expenses of managing and operating the fund out of each class's management fee. | |
| Fidelity, the Fidelity Investments Logo and all other Fidelity trademarks or service marks used herein are trademarks or service marks of FMR LLC. Any third-party marks that are used herein are trademarks or service marks of their respective owners. © 2024 FMR LLC. All rights reserved. |
| | For additional information about the Fund; including its prospectus, financial information, holdings and proxy information, scan the QR code or visit fundresearch.fidelity.com/prospectus/sec 1.9913473.100 2221-TSRA-0924 |
| |
| | ANNUAL SHAREHOLDER REPORT | AS OF JULY 31, 2024 | |
| | Fidelity® Series Blue Chip Growth Fund Fidelity® Series Blue Chip Growth Fund : FSBDX |
| | | |
This annual shareholder report contains information about Fidelity® Series Blue Chip Growth Fund for the period August 1, 2023 to July 31, 2024. You can find additional information about the Fund at fundresearch.fidelity.com/prospectus/sec. You can also request this information by contacting us at 1-800-544-8544.
What were your Fund costs for the last year?(based on hypothetical $10,000 investment)
FUND COST (PREVIOUS YEAR)
| | Costs of a $10,000 investment | Costs paid as a percentage of a $10,000 investment | |
| Fidelity® Series Blue Chip Growth Fund | $ 1 | 0.01% | |
What affected the Fund's performance this period?
•U.S. equities gained for the 12 months ending July 31, 2024, driven by resilient corporate profits, a frenzy over generative artificial intelligence and the Federal Reserve's likely pivot to cutting interest rates later this year.
•Against this backdrop, security selection was the primary contributor to the fund's performance versus the benchmark for the fiscal year, led by information technology. Security selection in industrials and health care, primarily within the pharmaceuticals, biotechnology & life sciences industry, also boosted the fund's relative performance.
•The top individual relative contributor by far was an overweight in Nvidia (+149%), the fund's biggest holding. It also helped to underweight Apple (+14%), one of the fund's largest holdings, and to hold a non-benchmark stake in Abercrombie & Fitch (+273%).
•In contrast, the biggest detractors from performance versus the benchmark were picks and an overweight in consumer discretionary, primarily within the consumer durables & apparel industry. Security selection in consumer staples, especially within the consumer staples distribution & retail industry, also hampered the fund's result, as did an underweight in information technology.
•The largest individual relative detractor was an overweight in Lululemon Athletica (-32%). We decreased our investment in Lululemon Athletica but the company was among our largest holdings this period. It also hurt to overweight Marvell Technology (+3%), one of our biggest holdings, and to underweight Broadcom (+82%), a position we established this period.
How did the Fund perform over the past 10 years?
CUMULATIVE PERFORMANCE
July 31, 2014 through July 31, 2024.
Initial investment of $10,000.
Fidelity® Series Blue Chip Growth Fund | $10,000 | $12,074 | $11,756 | $14,637 | $18,521 | $20,715 | $28,795 | $42,322 | $32,795 | $41,597 | $54,512 |
Russell 1000® Growth Index | $10,000 | $11,608 | $12,113 | $14,299 | $17,566 | $19,467 | $25,275 | $34,546 | $30,426 | $35,692 | $45,306 |
Russell 1000® Index | $10,000 | $11,124 | $11,661 | $13,521 | $15,710 | $16,967 | $19,009 | $26,226 | $24,424 | $27,587 | $33,519 |
| | 2014 | 2015 | 2016 | 2017 | 2018 | 2019 | 2020 | 2021 | 2022 | 2023 | 2024 |
AVERAGE ANNUAL TOTAL RETURNS: | | 1 Year | 5 Year | 10 Year |
| Fidelity® Series Blue Chip Growth Fund | 31.05% | 21.35% | 18.48% |
| Russell 1000® Growth Index | 26.94% | 18.41% | 16.31% |
| Russell 1000® Index | 21.50% | 14.59% | 12.86% |
Visit www.fidelity.com for more recent performance information. |
The Fund's past performance is not a good predictor of the Fund's future performance. The graph and table do not reflect the deduction of taxes that a shareholder would pay on fund distributions or redemption of fund shares. |
Key Fund Statistics (as of July 31, 2024)
KEY FACTS | | |
| Fund Size | $11,061,225,318 | |
| Number of Holdings | 340 | |
| Total Advisory Fee | $0 | |
| Portfolio Turnover | 29% | |
What did the Fund invest in?
(as of July 31, 2024)
MARKET SECTORS (% of Fund's net assets) | | |
| Information Technology | 43.9 | |
| Consumer Discretionary | 18.5 | |
| Communication Services | 15.2 | |
| Health Care | 7.6 | |
| Industrials | 4.4 | |
| Financials | 3.2 | |
| Energy | 1.2 | |
| Consumer Staples | 1.0 | |
| Materials | 0.7 | |
| Real Estate | 0.3 | |
| |
| Common Stocks | 94.8 |
| Preferred Stocks | 1.2 |
| Bonds | 0.0 |
| Preferred Securities | 0.0 |
| Short-Term Investments and Net Other Assets (Liabilities) | 4.0 |
ASSET ALLOCATION (% of Fund's net assets) |
|
|
| United States | 94.3 |
| China | 2.1 |
| India | 0.7 |
| Taiwan | 0.7 |
| Denmark | 0.6 |
| Canada | 0.4 |
| Netherlands | 0.2 |
| France | 0.2 |
| Switzerland | 0.2 |
| Others | 0.6 |
GEOGRAPHIC DIVERSIFICATION (% of Fund's net assets) |
|
| |
|
TOP HOLDINGS (% of Fund's net assets) | | |
| NVIDIA Corp | 12.7 | |
| Apple Inc | 11.0 | |
| Microsoft Corp | 8.1 | |
| Amazon.com Inc | 8.0 | |
| Alphabet Inc Class A | 6.2 | |
| Meta Platforms Inc Class A | 4.4 | |
| Marvell Technology Inc | 3.2 | |
| Eli Lilly & Co | 2.5 | |
| Netflix Inc | 2.0 | |
| Snap Inc Class A | 1.8 | |
| | 59.9 | |
| |
| Fidelity, the Fidelity Investments Logo and all other Fidelity trademarks or service marks used herein are trademarks or service marks of FMR LLC. Any third-party marks that are used herein are trademarks or service marks of their respective owners. © 2024 FMR LLC. All rights reserved. |
| | For additional information about the Fund; including its prospectus, financial information, holdings and proxy information, scan the QR code or visit fundresearch.fidelity.com/prospectus/sec 1.9913528.100 2611-TSRA-0924 |
Item 2.
Code of Ethics
As of the end of the period, July 31, 2024, Fidelity Securities Fund (the trust) has adopted a code of ethics, as defined in Item 2 of Form N-CSR, that applies to its President and Treasurer and its Chief Financial Officer. A copy of the code of ethics is filed as an exhibit to this Form N-CSR.
Item 3.
Audit Committee Financial Expert
The Board of Trustees of the trust has determined that Donald F. Donahue is an audit committee financial expert, as defined in Item 3 of Form N-CSR. Mr. Donahue is independent for purposes of Item 3 of Form N-CSR.
Item 4.
Principal Accountant Fees and Services
Fees and Services
The following table presents fees billed by Deloitte & Touche LLP, the member firms of Deloitte Touche Tohmatsu, and their respective affiliates (collectively, “Deloitte Entities”) in each of the last two fiscal years for services rendered to Fidelity Blue Chip Growth Fund, Fidelity Blue Chip Growth K6 Fund, Fidelity OTC K6 Portfolio, Fidelity OTC Portfolio, Fidelity Real Estate Income Fund, Fidelity Series Blue Chip Growth Fund, Fidelity Series Real Estate Income Fund and Fidelity Series Small Cap Opportunities Fund (the “Funds”):
Services Billed by Deloitte Entities
July 31, 2024 FeesA
| | | | |
| Audit Fees | Audit-Related Fees | Tax Fees | All Other Fees |
Fidelity Blue Chip Growth Fund | $83,300 | $- | $10,400 | $1,600 |
Fidelity Blue Chip Growth K6 Fund | $55,200 | $- | $6,900 | $1,100 |
Fidelity OTC K6 Portfolio | $68,900 | $- | $9,900 | $1,500 |
Fidelity OTC Portfolio | $70,000 | $- | $9,900 | $1,600 |
Fidelity Real Estate Income Fund | $81,900 | $- | $13,100 | $1,900 |
Fidelity Series Blue Chip Growth Fund | $65,400 | $- | $8,400 | $1,600 |
Fidelity Series Real Estate Income Fund | $71,900 | $- | $9,700 | $1,700 |
Fidelity Series Small Cap Opportunities Fund | $39,500 | $- | $8,400 | $1,000 |
| | | | |
| Audit Fees | Audit-Related Fees | Tax Fees | All Other Fees |
Fidelity Blue Chip Growth Fund | $92,900 | $- | $9,200 | $1,600 |
Fidelity Blue Chip Growth K6 Fund | $67,000 | $- | $5,700 | $1,100 |
Fidelity OTC K6 Portfolio | $76,900 | $- | $8,900 | $1,500 |
Fidelity OTC Portfolio | $78,600 | $- | $10,700 | $1,600 |
Fidelity Real Estate Income Fund | $82,200 | $- | $8,700 | $1,900 |
Fidelity Series Blue Chip Growth Fund | $65,500 | $- | $7,400 | $1,500 |
Fidelity Series Real Estate Income Fund | $72,200 | $- | $8,700 | $1,700 |
Fidelity Series Small Cap Opportunities Fund | $39,500 | $- | $7,200 | $1,000 |
A Amounts may reflect rounding.
The following table presents fees billed by PricewaterhouseCoopers LLP (“PwC”) in each of the last two fiscal years for services rendered to Fidelity Blue Chip Value Fund, Fidelity Dividend Growth Fund, Fidelity Growth & Income Portfolio, Fidelity Leveraged Company Stock Fund, Fidelity Small Cap Growth Fund, Fidelity Small Cap Growth K6 Fund and Fidelity Small Cap Value Fund (the “Funds”):
Services Billed by PwC
July 31, 2024 FeesA
| | | | |
| Audit Fees | Audit-Related Fees | Tax Fees | All Other Fees |
Fidelity Blue Chip Value Fund | $44,200 | $4,100 | $8,800 | $1,400 |
Fidelity Dividend Growth Fund | $53,200 | $4,800 | $11,400 | $1,600 |
Fidelity Growth & Income Portfolio | $60,400 | $5,500 | $11,000 | $1,900 |
Fidelity Leveraged Company Stock Fund | $44,200 | $4,300 | $11,100 | $1,500 |
Fidelity Small Cap Growth Fund | $42,400 | $4,000 | $16,600 | $1,400 |
Fidelity Small Cap Growth K6 Fund | $39,500 | $3,700 | $10,600 | $1,200 |
Fidelity Small Cap Value Fund | $45,900 | $4,200 | $8,800 | $1,400 |
| | | | |
| Audit Fees | Audit-Related Fees | Tax Fees | All Other Fees |
Fidelity Blue Chip Value Fund | $44,400 | $3,900 | $9,700 | $1,300 |
Fidelity Dividend Growth Fund | $53,400 | $4,600 | $8,800 | $1,600 |
Fidelity Growth & Income Portfolio | $60,600 | $5,300 | $28,200 | $1,800 |
Fidelity Leveraged Company Stock Fund | $44,400 | $4,100 | $11,100 | $1,400 |
Fidelity Small Cap Growth Fund | $50,700 | $3,900 | $21,300 | $1,300 |
Fidelity Small Cap Growth K6 Fund | $47,900 | $3,600 | $8,500 | $1,200 |
Fidelity Small Cap Value Fund | $46,000 | $4,000 | $8,800 | $1,400 |
A Amounts may reflect rounding.
The following table(s) present(s) fees billed by Deloitte Entities and PwC that were required to be approved by the Audit Committee for services that relate directly to the operations and financial reporting of the Fund(s) and that are rendered on behalf of Fidelity Management & Research Company LLC ("FMR") and entities controlling, controlled by, or under common control with FMR (not including any sub-adviser whose role is primarily portfolio management and is subcontracted with or overseen by another investment adviser) that provide ongoing services to the Fund(s) (“Fund Service Providers”):
Services Billed by Deloitte Entities
| | |
| July 31, 2024A | July 31, 2023A |
Audit-Related Fees | $200,000 | $80,000 |
Tax Fees | $- | $- |
All Other Fees | $1,929,500 | $- |
A Amounts may reflect rounding.
Services Billed by PwC
| | |
| July 31, 2024A | July 31, 2023A |
Audit-Related Fees | $9,437,800 | $8,699,200 |
Tax Fees | $61,000 | $1,000 |
All Other Fees | $35,000 | $- |
A Amounts may reflect rounding.
“Audit-Related Fees” represent fees billed for assurance and related services that are reasonably related to the performance of the fund audit or the review of the fund's financial statements and that are not reported under Audit Fees.
“Tax Fees” represent fees billed for tax compliance, tax advice or tax planning that relate directly to the operations and financial reporting of the fund.
“All Other Fees” represent fees billed for services provided to the fund or Fund Service Provider, a significant portion of which are assurance related, that relate directly to the operations and financial reporting of the fund, excluding those services that are reported under Audit Fees, Audit-Related Fees or Tax Fees.
Assurance services must be performed by an independent public accountant.
* * *
The aggregate non-audit fees billed by Deloitte Entities and PwC for services rendered to the Fund(s), FMR (not including any sub-adviser whose role is primarily portfolio management and is subcontracted with or overseen by another investment adviser), and any Fund Service Provider for each of the last two fiscal years of the Fund(s) are as follows:
| | |
Billed By | July 31, 2024A | July 31, 2023A |
Deloitte Entities | $5,037,200 | $3,376,400 |
PwC | $15,127,700 | $14,288,800 |
A Amounts may reflect rounding.
The trust's Audit Committee has considered non-audit services that were not pre-approved that were provided by Deloitte Entities and PwC to Fund Service Providers to be compatible with maintaining the independence of Deloitte Entities and PwC in its(their) audit of the Fund(s), taking into account representations from Deloitte Entities and PwC, in accordance with Public Company Accounting Oversight Board rules,
regarding its independence from the Fund(s) and its(their) related entities and FMR’s review of the appropriateness and permissibility under applicable law of such non-audit services prior to their provision to the Fund(s) Service Providers.
Audit Committee Pre-Approval Policies and Procedures
The trust’s Audit Committee must pre-approve all audit and non-audit services provided by a fund’s independent registered public accounting firm relating to the operations or financial reporting of the fund. Prior to the commencement of any audit or non-audit services to a fund, the Audit Committee reviews the services to determine whether they are appropriate and permissible under applicable law.
The Audit Committee has adopted policies and procedures to, among other purposes, provide a framework for the Committee’s consideration of non-audit services by the audit firms that audit the Fidelity funds. The policies and procedures require that any non-audit service provided by a fund audit firm to a Fidelity fund and any non-audit service provided by a fund auditor to a Fund Service Provider that relates directly to the operations and financial reporting of a Fidelity fund (“Covered Service”) are subject to approval by the Audit Committee before such service is provided.
All Covered Services must be approved in advance of provision of the service either: (i) by formal resolution of the Audit Committee, or (ii) by oral or written approval of the service by the Chair of the Audit Committee (or if the Chair is unavailable, such other member of the Audit Committee as may be designated by the Chair to act in the Chair’s absence). The approval contemplated by (ii) above is permitted where the Treasurer determines that action on such an engagement is necessary before the next meeting of the Audit Committee.
Non-audit services provided by a fund audit firm to a Fund Service Provider that do not relate directly to the operations and financial reporting of a Fidelity fund are reported to the Audit Committee periodically.
Non-Audit Services Approved Pursuant to Rule 2-01(c)(7)(i)(C) and (ii) of Regulation S-X (“De Minimis Exception”)
There were no non-audit services approved or required to be approved by the Audit Committee pursuant to the De Minimis Exception during the Fund’s(s’) last two fiscal years relating to services provided to (i) the Fund(s) or (ii) any Fund Service Provider that relate directly to the operations and financial reporting of the Fund(s).
The Registrant has not retained, for the preparation of the audit report on the financial statements included in the Form N-CSR, a registered public accounting firm that has a branch or office that is located in a foreign jurisdiction and that the Public Company Accounting Oversight Board (the “PCAOB”) has determined that the PCAOB is unable to inspect or investigate completely because of a position taken by an authority in the foreign jurisdiction.
The Registrant is not a “foreign issuer,” as defined in 17 CFR 240.3b-4.
Item 5.
Audit Committee of Listed Registrants
Not applicable.
Item 6.
Investments
(a)
Not applicable.
(b)
Not applicable.
Item 7.
Financial Statements and Financial Highlights for Open-End Management Investment Companies
Fidelity® Small Cap Value Fund
Annual Report
July 31, 2024
Includes Fidelity and Fidelity Advisor share classes
Contents
To view a fund's proxy voting guidelines and proxy voting record for the 12-month period ended June 30, visit http://www.fidelity.com/proxyvotingresults or visit the Securities and Exchange Commission's (SEC) web site at http://www.sec.gov.
You may also call 1-800-544-8544 if you're an individual investing directly with Fidelity, call 1-800-835-5092 if you're a plan sponsor or participant with Fidelity as your recordkeeper or call 1-877-208-0098 on institutional accounts or if you're an advisor or invest through one to request a free copy of the proxy voting guidelines.
Standard & Poor's, S&P and S&P 500 are registered service marks of The McGraw-Hill Companies, Inc. and have been licensed for use by Fidelity Distributors Corporation.
Other third-party marks appearing herein are the property of their respective owners.
All other marks appearing herein are registered or unregistered trademarks or service marks of FMR LLC or an affiliated company. © 2024 FMR LLC. All rights reserved.
This report and the financial statements contained herein are submitted for the general information of the shareholders of the Fund. This report is not authorized for distribution to prospective investors in the Fund unless preceded or accompanied by an effective prospectus.
A fund files its complete schedule of portfolio holdings with the SEC for the first and third quarters of each fiscal year on Form N-PORT. Forms N-PORT are available on the SEC's web site at http://www.sec.gov. A fund's Forms N-PORT may be reviewed and copied at the SEC's Public Reference Room in Washington, DC. Information regarding the operation of the SEC's Public Reference Room may be obtained by calling 1-800-SEC-0330.
For a complete list of a fund's portfolio holdings, view the most recent holdings listing, semiannual report, or annual report on Fidelity's web site at http://www.fidelity.com, http://www.institutional.fidelity.com, or http://www.401k.com, as applicable.
NOT FDIC INSURED •MAY LOSE VALUE •NO BANK GUARANTEE
Neither the Fund nor Fidelity Distributors Corporation is a bank.
Item 7: Financial Statements and Financial Highlights for Open-End Management Investment Companies (Annual Report)
Fidelity® Small Cap Value Fund
Schedule of Investments July 31, 2024
Showing Percentage of Net Assets
| Common Stocks - 97.3% |
| | | Shares | Value ($) |
| COMMUNICATION SERVICES - 1.4% | | | |
| Media - 1.4% | | | |
| Nexstar Media Group, Inc. | | 396,800 | 73,324,672 |
| CONSUMER DISCRETIONARY - 7.7% | | | |
| Leisure Products - 2.6% | | | |
| BRP, Inc. (a) | | 1,065,200 | 77,175,212 |
| Brunswick Corp. (a) | | 666,153 | 54,258,162 |
| | | | 131,433,374 |
| Specialty Retail - 5.1% | | | |
| Academy Sports & Outdoors, Inc. | | 1,065,000 | 57,584,550 |
| Advance Auto Parts, Inc. (a) | | 1,154,172 | 73,093,713 |
| Lithia Motors, Inc. Class A (sub. vtg.) | | 104,326 | 28,828,404 |
| Murphy U.S.A., Inc. | | 121,906 | 61,552,778 |
| Upbound Group, Inc. (a) | | 1,072,453 | 40,463,652 |
| | | | 261,523,097 |
TOTAL CONSUMER DISCRETIONARY | | | 392,956,471 |
| CONSUMER STAPLES - 3.8% | | | |
| Beverages - 1.1% | | | |
| MGP Ingredients, Inc. (a) | | 695,000 | 56,677,250 |
| Consumer Staples Distribution & Retail - 1.9% | | | |
| U.S. Foods Holding Corp. (b) | | 1,786,000 | 97,140,540 |
| Food Products - 0.8% | | | |
| TreeHouse Foods, Inc. (b) | | 1,001,400 | 40,336,392 |
TOTAL CONSUMER STAPLES | | | 194,154,182 |
| ENERGY - 9.2% | | | |
| Energy Equipment & Services - 5.4% | | | |
| Cactus, Inc. (a) | | 1,227,955 | 77,508,520 |
| Kodiak Gas Services, Inc. | | 60,000 | 1,731,000 |
| Liberty Energy, Inc. Class A | | 1,700,000 | 41,055,000 |
| Noble Corp. PLC (a) | | 750,000 | 35,415,000 |
| NOV, Inc. | | 1,289,200 | 26,841,144 |
| Select Water Solutions, Inc. Class A (a) | | 3,518,038 | 41,583,209 |
| TechnipFMC PLC | | 1,153,500 | 34,028,250 |
| Tidewater, Inc. (b) | | 199,069 | 19,699,868 |
| | | | 277,861,991 |
| Oil, Gas & Consumable Fuels - 3.8% | | | |
| Antero Resources Corp. (b) | | 1,129,799 | 32,786,767 |
| Parkland Corp. (a) | | 3,025,000 | 84,857,314 |
| Sitio Royalties Corp. | | 3,076,805 | 74,920,202 |
| | | | 192,564,283 |
TOTAL ENERGY | | | 470,426,274 |
| FINANCIALS - 25.7% | | | |
| Banks - 13.5% | | | |
| BOK Financial Corp. | | 519,524 | 53,427,848 |
| Cadence Bank | | 2,570,000 | 84,475,900 |
| Cullen/Frost Bankers, Inc. | | 335,000 | 39,215,100 |
| Eastern Bankshares, Inc. | | 7,830,100 | 130,292,863 |
| First Foundation, Inc. (a) | | 2,419,850 | 16,938,950 |
| Independent Bank Group, Inc. | | 1,229,769 | 72,630,157 |
| Pinnacle Financial Partners, Inc. | | 804,000 | 77,441,280 |
| Synovus Financial Corp. | | 1,482,341 | 69,299,442 |
| The Bank of NT Butterfield & Son Ltd. | | 1,760,000 | 67,478,400 |
| Trico Bancshares | | 340,314 | 15,834,810 |
| Webster Financial Corp. | | 650,000 | 32,253,000 |
| Wintrust Financial Corp. | | 308,803 | 33,412,485 |
| | | | 692,700,235 |
| Capital Markets - 2.0% | | | |
| AllianceBernstein Holding LP | | 1,328,200 | 46,872,178 |
| Lazard, Inc. Class A (a) | | 1,194,300 | 58,723,731 |
| | | | 105,595,909 |
| Consumer Finance - 2.4% | | | |
| Encore Capital Group, Inc. (a)(b) | | 840,200 | 42,472,110 |
| FirstCash Holdings, Inc. | | 717,300 | 80,050,680 |
| | | | 122,522,790 |
| Financial Services - 0.8% | | | |
| ECN Capital Corp. (a) | | 10,243,751 | 15,729,368 |
| Federal Agricultural Mortgage Corp. Class C (non-vtg.) (a) | | 120,000 | 24,746,400 |
| | | | 40,475,768 |
| Insurance - 7.0% | | | |
| Enstar Group Ltd. (b) | | 196,049 | 63,598,296 |
| First American Financial Corp. | | 1,506,600 | 91,269,828 |
| Old Republic International Corp. | | 2,975,100 | 102,997,962 |
| Primerica, Inc. | | 397,224 | 100,009,086 |
| | | | 357,875,172 |
TOTAL FINANCIALS | | | 1,319,169,874 |
| HEALTH CARE - 8.0% | | | |
| Biotechnology - 2.3% | | | |
| ALX Oncology Holdings, Inc. (b) | | 678,400 | 3,256,320 |
| Arcellx, Inc. (b) | | 130,000 | 8,035,300 |
| Celldex Therapeutics, Inc. (b) | | 244,800 | 9,329,328 |
| Crinetics Pharmaceuticals, Inc. (b) | | 205,000 | 10,889,600 |
| Cytokinetics, Inc. (b) | | 550,853 | 32,505,836 |
| Keros Therapeutics, Inc. (b) | | 130,000 | 6,520,800 |
| Madrigal Pharmaceuticals, Inc. (a)(b) | | 25,300 | 7,201,898 |
| Merus BV (b) | | 118,301 | 6,274,685 |
| Spyre Therapeutics, Inc. (a)(b) | | 314,164 | 8,639,510 |
| Vaxcyte, Inc. (b) | | 162,096 | 12,787,753 |
| Viridian Therapeutics, Inc. (b) | | 355,889 | 5,996,730 |
| Xenon Pharmaceuticals, Inc. (b) | | 155,000 | 6,685,150 |
| | | | 118,122,910 |
| Health Care Providers & Services - 4.3% | | | |
| AMN Healthcare Services, Inc. (a)(b) | | 1,436,671 | 97,147,693 |
| BrightSpring Health Services, Inc. (a) | | 2,652,727 | 32,867,288 |
| Owens & Minor, Inc. (a)(b)(c) | | 4,953,981 | 81,344,368 |
| Pennant Group, Inc. (b) | | 340,212 | 10,141,720 |
| | | | 221,501,069 |
| Health Care Technology - 0.7% | | | |
| Evolent Health, Inc. Class A (a)(b) | | 1,379,766 | 32,176,143 |
| Life Sciences Tools & Services - 0.2% | | | |
| Maravai LifeSciences Holdings, Inc. Class A (b) | | 1,175,000 | 11,432,750 |
| Pharmaceuticals - 0.5% | | | |
| Enliven Therapeutics, Inc. (a)(b) | | 240,540 | 6,345,445 |
| Prestige Consumer Healthcare, Inc. (b) | | 272,635 | 19,305,284 |
| | | | 25,650,729 |
TOTAL HEALTH CARE | | | 408,883,601 |
| INDUSTRIALS - 16.2% | | | |
| Building Products - 1.4% | | | |
| Hayward Holdings, Inc. (a)(b) | | 3,133,319 | 46,341,788 |
| Tecnoglass, Inc. (a) | | 445,077 | 23,949,593 |
| | | | 70,291,381 |
| Construction & Engineering - 0.2% | | | |
| Sterling Construction Co., Inc. (b) | | 100,859 | 11,735,953 |
| Ground Transportation - 2.2% | | | |
| ArcBest Corp. | | 566,002 | 71,344,552 |
| Knight-Swift Transportation Holdings, Inc. | | 710,000 | 38,645,300 |
| | | | 109,989,852 |
| Machinery - 5.6% | | | |
| Atmus Filtration Technologies, Inc. | | 1,185,000 | 36,545,400 |
| Blue Bird Corp. (b) | | 627,500 | 32,705,300 |
| EnPro Industries, Inc. (a) | | 379,972 | 64,952,414 |
| Gates Industrial Corp. PLC (b) | | 1,429,400 | 26,572,546 |
| REV Group, Inc. (c) | | 2,925,502 | 85,366,148 |
| Terex Corp. | | 669,951 | 42,381,100 |
| | | | 288,522,908 |
| Professional Services - 4.1% | | | |
| Concentrix Corp. (a) | | 52,280 | 3,685,740 |
| Genpact Ltd. | | 1,967,957 | 68,229,069 |
| KBR, Inc. | | 1,319,038 | 87,834,740 |
| Science Applications International Corp. (a) | | 400,000 | 49,760,000 |
| | | | 209,509,549 |
| Trading Companies & Distributors - 2.7% | | | |
| Beacon Roofing Supply, Inc. (b) | | 1,116,000 | 114,724,800 |
| DXP Enterprises, Inc. (a)(b) | | 458,872 | 25,127,831 |
| | | | 139,852,631 |
TOTAL INDUSTRIALS | | | 829,902,274 |
| INFORMATION TECHNOLOGY - 9.5% | | | |
| Communications Equipment - 3.6% | | | |
| Ciena Corp. (b) | | 1,706,400 | 89,995,536 |
| Lumentum Holdings, Inc. (a)(b) | | 1,865,698 | 96,605,842 |
| | | | 186,601,378 |
| Electronic Equipment, Instruments & Components - 4.5% | | | |
| Insight Enterprises, Inc. (b) | | 561,873 | 126,140,489 |
| TD SYNNEX Corp. | | 301,100 | 35,882,087 |
| Vontier Corp. | | 1,770,000 | 69,437,100 |
| | | | 231,459,676 |
| IT Services - 0.7% | | | |
| ASGN, Inc. (b) | | 352,900 | 33,409,043 |
| Semiconductors & Semiconductor Equipment - 0.7% | | | |
| Allegro MicroSystems LLC (b) | | 285,031 | 6,852,145 |
| Diodes, Inc. (b) | | 390,400 | 30,529,280 |
| | | | 37,381,425 |
TOTAL INFORMATION TECHNOLOGY | | | 488,851,522 |
| MATERIALS - 4.6% | | | |
| Chemicals - 0.9% | | | |
| Ecovyst, Inc. (a)(b) | | 4,900,000 | 46,746,000 |
| Construction Materials - 1.2% | | | |
| Eagle Materials, Inc. | | 225,000 | 61,267,500 |
| Containers & Packaging - 2.5% | | | |
| Graphic Packaging Holding Co. (a) | | 4,275,000 | 128,677,500 |
TOTAL MATERIALS | | | 236,691,000 |
| REAL ESTATE - 8.9% | | | |
| Equity Real Estate Investment Trusts (REITs) - 5.2% | | | |
| Acadia Realty Trust (SBI) | | 2,149,300 | 46,510,852 |
| Americold Realty Trust | | 1,270,000 | 37,960,300 |
| LXP Industrial Trust (REIT) | | 4,815,000 | 49,594,500 |
| National Storage Affiliates Trust | | 1,410,000 | 60,023,700 |
| SITE Centers Corp. | | 4,725,000 | 73,001,250 |
| | | | 267,090,602 |
| Real Estate Management & Development - 3.7% | | | |
| Compass, Inc. (b) | | 9,121,296 | 40,042,489 |
| Cushman & Wakefield PLC (a)(b) | | 3,816,679 | 50,036,662 |
| Jones Lang LaSalle, Inc. (b) | | 320,000 | 80,288,000 |
| LandBridge Co. LLC (a) | | 554,683 | 18,287,899 |
| | | | 188,655,050 |
TOTAL REAL ESTATE | | | 455,745,652 |
| UTILITIES - 2.3% | | | |
| Gas Utilities - 2.3% | | | |
| Brookfield Infrastructure Corp. A Shares (a) | | 3,095,750 | 120,424,675 |
| TOTAL COMMON STOCKS (Cost $4,128,807,875) | | | 4,990,530,197 |
| | | | |
| Money Market Funds - 7.7% |
| | | Shares | Value ($) |
| Fidelity Cash Central Fund 5.39% (d) | | 74,476,406 | 74,491,302 |
| Fidelity Securities Lending Cash Central Fund 5.39% (d)(e) | | 321,909,838 | 321,942,029 |
| TOTAL MONEY MARKET FUNDS (Cost $396,433,331) | | | 396,433,331 |
| | | | |
| Equity Funds - 1.0% |
| | | Shares | Value ($) |
| Domestic Equity Funds - 1.0% | | | |
iShares Russell 2000 Value ETF (Cost $50,243,561) | | 295,800 | 50,643,918 |
| | | | |
| TOTAL INVESTMENT IN SECURITIES - 106.0% (Cost $4,575,484,767) | 5,437,607,446 |
NET OTHER ASSETS (LIABILITIES) - (6.0)% | (309,075,358) |
| NET ASSETS - 100.0% | 5,128,532,088 |
| | |
Security Type Abbreviations
Legend
| (a) | Security or a portion of the security is on loan at period end. |
| (d) | Affiliated fund that is generally available only to investment companies and other accounts managed by Fidelity Investments. The rate quoted is the annualized seven-day yield of the fund at period end. A complete unaudited listing of the fund's holdings as of its most recent quarter end is available upon request. In addition, each Fidelity Central Fund's financial statements, which are not covered by the Fund's Report of Independent Registered Public Accounting Firm, are available on the SEC's website or upon request. |
| (e) | Investment made with cash collateral received from securities on loan. |
Affiliated Central Funds
Fiscal year to date information regarding the Fund's investments in Fidelity Central Funds, including the ownership percentage, is presented below.
| Affiliate | Value, beginning of period ($) | Purchases ($) | Sales Proceeds ($) | Dividend Income ($) | Realized Gain (loss) ($) | Change in Unrealized appreciation (depreciation) ($) | Value, end of period ($) | % ownership, end of period |
| Fidelity Cash Central Fund 5.39% | 120,807,535 | 1,727,904,706 | 1,774,218,754 | 2,388,114 | (2,185) | - | 74,491,302 | 0.1% |
| Fidelity Securities Lending Cash Central Fund 5.39% | 323,721,292 | 1,881,129,466 | 1,882,908,729 | 755,261 | - | - | 321,942,029 | 1.5% |
| Total | 444,528,827 | 3,609,034,172 | 3,657,127,483 | 3,143,375 | (2,185) | - | 396,433,331 | |
| | | | | | | | | |
Amounts in the dividend income column in the above table include any capital gain distributions from underlying funds, which are presented in the corresponding line item in the Statement of Operations, if applicable.
Amounts in the dividend income column for Fidelity Securities Lending Cash Central Fund represents the income earned on investing cash collateral, less rebates paid to borrowers and any lending agent fees associated with the loan, plus any premium payments received for lending certain types of securities.
Amounts included in the purchases and sales proceeds columns may include in-kind transactions, if applicable.
Other Affiliated Issuers
An affiliated company is a company in which the Fund has ownership of at least 5% of the voting securities. Fiscal year to date transactions with companies which are or were affiliates are presented in the table below. Certain corporate actions, such as mergers, are excluded from the amounts in this table if applicable. A dash in the Value end of period ($) column means either the issuer is no longer held at period end, or the issuer is held at period end but is no longer an affiliate.
| Affiliate | Value, beginning of period ($) | Purchases ($) | Sales Proceeds ($) | Dividend Income ($) | Realized Gain (loss) ($) | Change in Unrealized appreciation (depreciation) ($) | Value, end of period ($) |
| Encore Capital Group, Inc. | 66,885,700 | - | 17,823,474 | - | 2,782,282 | (9,372,398) | - |
| Owens & Minor, Inc. | 59,604,481 | 38,107,310 | 67,845 | - | (116,000) | (16,183,578) | 81,344,368 |
| REV Group, Inc. | - | 71,128,505 | - | 137,250 | - | 14,237,643 | 85,366,148 |
| Traeger, Inc. | 29,458,300 | - | 27,355,136 | - | (13,754,774) | 11,651,610 | - |
| Total | 155,948,481 | 109,235,815 | 45,246,455 | 137,250 | (11,088,492) | 333,277 | 166,710,516 |
Amounts included in the purchases and sales proceeds columns may include in-kind transactions, if applicable.
Investment Valuation
The following is a summary of the inputs used, as of July 31, 2024, involving the Fund's assets and liabilities carried at fair value. The inputs or methodology used for valuing securities may not be an indication of the risk associated with investing in those securities. For more information on valuation inputs, and their aggregation into the levels used below, please refer to the Investment Valuation section in the accompanying Notes to Financial Statements.
| Valuation Inputs at Reporting Date: |
| Description | Total ($) | Level 1 ($) | Level 2 ($) | Level 3 ($) |
Investments in Securities: | | | | |
|
| Equities: | | | | |
Communication Services | 73,324,672 | 73,324,672 | - | - |
Consumer Discretionary | 392,956,471 | 392,956,471 | - | - |
Consumer Staples | 194,154,182 | 194,154,182 | - | - |
Energy | 470,426,274 | 470,426,274 | - | - |
Financials | 1,319,169,874 | 1,319,169,874 | - | - |
Health Care | 408,883,601 | 408,883,601 | - | - |
Industrials | 829,902,274 | 829,902,274 | - | - |
Information Technology | 488,851,522 | 488,851,522 | - | - |
Materials | 236,691,000 | 236,691,000 | - | - |
Real Estate | 455,745,652 | 455,745,652 | - | - |
Utilities | 120,424,675 | 120,424,675 | - | - |
|
| Money Market Funds | 396,433,331 | 396,433,331 | - | - |
|
| Equity Funds | 50,643,918 | 50,643,918 | - | - |
| Total Investments in Securities: | 5,437,607,446 | 5,437,607,446 | - | - |
Financial Statements
| Statement of Assets and Liabilities |
As of July 31, 2024 |
| Assets | | | | |
| Investment in securities, at value (including securities loaned of $315,183,900) - See accompanying schedule: | | | | |
Unaffiliated issuers (cost $3,956,596,331) | $ | 4,874,463,599 | | |
Fidelity Central Funds (cost $396,433,331) | | 396,433,331 | | |
Other affiliated issuers (cost $222,455,105) | | 166,710,516 | | |
| | | | | |
| | | | | |
| Total Investment in Securities (cost $4,575,484,767) | | | $ | 5,437,607,446 |
| Foreign currency held at value (cost $382,123) | | | | 382,090 |
| Receivable for investments sold | | | | 40,561,108 |
| Receivable for fund shares sold | | | | 6,646,728 |
| Dividends receivable | | | | 1,168,972 |
| Distributions receivable from Fidelity Central Funds | | | | 320,493 |
| Prepaid expenses | | | | 785 |
Total assets | | | | 5,486,687,622 |
| Liabilities | | | | |
| Payable for investments purchased | $ | 28,636,442 | | |
| Payable for fund shares redeemed | | 3,558,565 | | |
| Accrued management fee | | 3,770,062 | | |
| Distribution and service plan fees payable | | 126,203 | | |
| Other payables and accrued expenses | | 127,814 | | |
| Collateral on securities loaned | | 321,936,448 | | |
| Total liabilities | | | | 358,155,534 |
| Net Assets | | | $ | 5,128,532,088 |
| Net Assets consist of: | | | | |
| Paid in capital | | | $ | 4,064,637,912 |
| Total accumulated earnings (loss) | | | | 1,063,894,176 |
| Net Assets | | | $ | 5,128,532,088 |
| | | | | |
| Net Asset Value and Maximum Offering Price | | | | |
| Class A : | | | | |
Net Asset Value and redemption price per share ($275,799,793 ÷ 12,976,878 shares)(a) | | | $ | 21.25 |
| Maximum offering price per share (100/94.25 of $21.25) | | | $ | 22.55 |
| Class M : | | | | |
Net Asset Value and redemption price per share ($106,502,131 ÷ 5,249,641 shares)(a) | | | $ | 20.29 |
| Maximum offering price per share (100/96.50 of $20.29) | | | $ | 21.03 |
| Class C : | | | | |
Net Asset Value and offering price per share ($39,362,726 ÷ 2,236,307 shares)(a) | | | $ | 17.60 |
| Small Cap Value : | | | | |
Net Asset Value, offering price and redemption price per share ($2,806,716,900 ÷ 127,433,822 shares) | | | $ | 22.02 |
| Class I : | | | | |
Net Asset Value, offering price and redemption price per share ($1,085,760,913 ÷ 49,302,347 shares) | | | $ | 22.02 |
| Class Z : | | | | |
Net Asset Value, offering price and redemption price per share ($814,389,625 ÷ 36,925,533 shares) | | | $ | 22.05 |
(a)Redemption price per share is equal to net asset value less any applicable contingent deferred sales charge. |
| Statement of Operations |
| Year ended July 31, 2024 |
| Investment Income | | | | |
| Dividends (including $137,250 earned from affiliated issuers) | | | $ | 80,045,858 |
| Income from Fidelity Central Funds (including $755,261 from security lending) | | | | 3,143,375 |
| Total income | | | | 83,189,233 |
| Expenses | | | | |
| Management fee | | | | |
| Basic fee | $ | 33,322,065 | | |
| Performance adjustment | | 8,872,268 | | |
| Transfer agent fees | | 4,259,907 | | |
| Distribution and service plan fees | | 1,467,927 | | |
| Accounting fees | | 546,143 | | |
| Custodian fees and expenses | | 73,231 | | |
| Independent trustees' fees and expenses | | 22,751 | | |
| Registration fees | | 163,351 | | |
| Audit fees | | 64,649 | | |
| Legal | | 7,200 | | |
| Interest | | 18,052 | | |
| Miscellaneous | | 83,087 | | |
| Total expenses before reductions | | 48,900,631 | | |
| Expense reductions | | (295,177) | | |
| Total expenses after reductions | | | | 48,605,454 |
| Net Investment income (loss) | | | | 34,583,779 |
| Realized and Unrealized Gain (Loss) | | | | |
| Net realized gain (loss) on: | | | | |
| Investment Securities: | | | | |
| Unaffiliated issuers | | 261,916,511 | | |
| Fidelity Central Funds | | (2,185) | | |
| Other affiliated issuers | | (11,088,492) | | |
| Foreign currency transactions | | (68,497) | | |
| Total net realized gain (loss) | | | | 250,757,337 |
| Change in net unrealized appreciation (depreciation) on: | | | | |
| Investment Securities: | | | | |
| Unaffiliated issuers | | 425,185,623 | | |
| Affiliated issuers | | 333,277 | | |
| Assets and liabilities in foreign currencies | | 16,171 | | |
| Total change in net unrealized appreciation (depreciation) | | | | 425,535,071 |
| Net gain (loss) | | | | 676,292,408 |
| Net increase (decrease) in net assets resulting from operations | | | $ | 710,876,187 |
| Statement of Changes in Net Assets |
| |
| | Year ended July 31, 2024 | | Year ended July 31, 2023 |
| Increase (Decrease) in Net Assets | | | | |
| Operations | | | | |
| Net investment income (loss) | $ | 34,583,779 | $ | 35,640,987 |
| Net realized gain (loss) | | 250,757,337 | | 210,566,714 |
| Change in net unrealized appreciation (depreciation) | | 425,535,071 | | 72,534,354 |
| Net increase (decrease) in net assets resulting from operations | | 710,876,187 | | 318,742,055 |
| Distributions to shareholders | | (251,816,868) | | (265,224,207) |
| | | | | |
| Share transactions - net increase (decrease) | | (238,811,656) | | (84,780,976) |
| Total increase (decrease) in net assets | | 220,247,663 | | (31,263,128) |
| | | | | |
| Net Assets | | | | |
| Beginning of period | | 4,908,284,425 | | 4,939,547,553 |
| End of period | $ | 5,128,532,088 | $ | 4,908,284,425 |
| | | | | |
| | | | | |
Financial Highlights
Fidelity Advisor® Small Cap Value Fund Class A |
| |
| Years ended July 31, | | 2024 | | 2023 | | 2022 | | 2021 | | 2020 |
Selected Per-Share Data | | | | | | | | | | |
| Net asset value, beginning of period | $ | 19.35 | $ | 19.13 | $ | 21.03 | $ | 12.33 | $ | 14.68 |
| Income from Investment Operations | | | | | | | | | | |
Net investment income (loss) A,B | | .09 | | .09 | | .18 C | | .09 D | | .11 |
| Net realized and unrealized gain (loss) | | 2.80 | | 1.18 | | (.41) | | 8.66 | | (1.96) |
| Total from investment operations | | 2.89 | | 1.27 | | (.23) | | 8.75 | | (1.85) |
| Distributions from net investment income | | (.09) | | - | | (.39) | | (.05) | | (.09) |
| Distributions from net realized gain | | (.90) | | (1.05) | | (1.28) | | - | | (.41) |
| Total distributions | | (.99) | | (1.05) | | (1.67) | | (.05) | | (.50) |
| Net asset value, end of period | $ | 21.25 | $ | 19.35 | $ | 19.13 | $ | 21.03 | $ | 12.33 |
Total Return E,F | | | | 7.17% | | (1.50)% | | 71.07% | | (13.09)% |
Ratios to Average Net Assets B,G,H | | | | | | | | | | |
| Expenses before reductions | | 1.30% | | 1.30% | | 1.26% | | 1.24% | | 1.22% |
| Expenses net of fee waivers, if any | | | | 1.29% | | 1.25% | | 1.24% | | 1.22% |
| Expenses net of all reductions | | 1.29% | | 1.29% | | 1.25% | | 1.23% | | 1.20% |
| Net investment income (loss) | | .50% | | .51% | | .90% C | | .50% D | | .84% |
| Supplemental Data | | | | | | | | | | |
| Net assets, end of period (000 omitted) | $ | 275,800 | $ | 270,455 | $ | 267,854 | $ | 232,920 | $ | 101,675 |
Portfolio turnover rate I | | | | 29% | | 40% | | 54% | | 109% |
ACalculated based on average shares outstanding during the period.
BNet investment income (loss) is affected by the timing of the declaration of dividends by any underlying mutual funds or exchange-traded funds (ETFs). Net investment income (loss) of any mutual funds or ETFs is not included in the Fund's net investment income (loss) ratio.
CNet investment income per share reflects one or more large, non-recurring dividend(s) which amounted to $.16 per share. Excluding such non-recurring dividend(s), the ratio of net investment income (loss) to average net assets would have been .14%.
DNet investment income per share reflects one or more large, non-recurring dividend(s) which amounted to $.07 per share. Excluding such non-recurring dividend(s), the ratio of net investment income (loss) to average net assets would have been .13%.
ETotal returns would have been lower if certain expenses had not been reduced during the applicable periods shown.
FTotal returns do not include the effect of the sales charges.
GFees and expenses of any underlying mutual funds or exchange-traded funds (ETFs) are not included in the Fund's expense ratio. The Fund indirectly bears its proportionate share of these expenses. For additional expense information related to investments in Fidelity Central Funds, please refer to the "Investments in Fidelity Central Funds" note found in the Notes to Financial Statements section of the most recent Annual or Semi-Annual report.
HExpense ratios reflect operating expenses of the class. Expenses before reductions do not reflect amounts reimbursed, waived, or reduced through arrangements with the investment adviser, brokerage services, or other offset arrangements, if applicable, and do not represent the amount paid by the class during periods when reimbursements, waivers or reductions occur.
IAmount does not include the portfolio activity of any underlying mutual funds or exchange-traded funds (ETFs).
Fidelity Advisor® Small Cap Value Fund Class M |
| |
| Years ended July 31, | | 2024 | | 2023 | | 2022 | | 2021 | | 2020 |
Selected Per-Share Data | | | | | | | | | | |
| Net asset value, beginning of period | $ | 18.55 | $ | 18.42 | $ | 20.31 | $ | 11.93 | $ | 14.22 |
| Income from Investment Operations | | | | | | | | | | |
Net investment income (loss) A,B | | .04 | | .04 | | .13 C | | .05 D | | .08 |
| Net realized and unrealized gain (loss) | | 2.68 | | 1.14 | | (.40) | | 8.37 | | (1.91) |
| Total from investment operations | | 2.72 | | 1.18 | | (.27) | | 8.42 | | (1.83) |
| Distributions from net investment income | | (.08) | | - | | (.35) | | (.04) | | (.05) |
| Distributions from net realized gain | | (.90) | | (1.05) | | (1.28) | | - | | (.41) |
| Total distributions | | (.98) | | (1.05) | | (1.62) E | | (.04) | | (.46) |
| Net asset value, end of period | $ | 20.29 | $ | 18.55 | $ | 18.42 | $ | 20.31 | $ | 11.93 |
Total Return F,G | | | | 6.95% | | (1.74)% | | 70.63% | | (13.29)% |
Ratios to Average Net Assets B,H,I | | | | | | | | | | |
| Expenses before reductions | | 1.55% | | 1.54% | | 1.50% | | 1.48% | | 1.46% |
| Expenses net of fee waivers, if any | | | | 1.54% | | 1.49% | | 1.48% | | 1.46% |
| Expenses net of all reductions | | 1.55% | | 1.54% | | 1.49% | | 1.47% | | 1.44% |
| Net investment income (loss) | | .24% | | .26% | | .66% C | | .26% D | | .59% |
| Supplemental Data | | | | | | | | | | |
| Net assets, end of period (000 omitted) | $ | 106,502 | $ | 94,205 | $ | 81,790 | $ | 80,182 | $ | 38,049 |
Portfolio turnover rate J | | | | 29% | | 40% | | 54% | | 109% |
ACalculated based on average shares outstanding during the period.
BNet investment income (loss) is affected by the timing of the declaration of dividends by any underlying mutual funds or exchange-traded funds (ETFs). Net investment income (loss) of any mutual funds or ETFs is not included in the Fund's net investment income (loss) ratio.
CNet investment income per share reflects one or more large, non-recurring dividend(s) which amounted to $.15 per share. Excluding such non-recurring dividend(s), the ratio of net investment income (loss) to average net assets would have been (.10)%.
DNet investment income per share reflects one or more large, non-recurring dividend(s) which amounted to $.06 per share. Excluding such non-recurring dividend(s), the ratio of net investment income (loss) to average net assets would have been (.11)%.
ETotal distributions per share do not sum due to rounding.
FTotal returns would have been lower if certain expenses had not been reduced during the applicable periods shown.
GTotal returns do not include the effect of the sales charges.
HFees and expenses of any underlying mutual funds or exchange-traded funds (ETFs) are not included in the Fund's expense ratio. The Fund indirectly bears its proportionate share of these expenses. For additional expense information related to investments in Fidelity Central Funds, please refer to the "Investments in Fidelity Central Funds" note found in the Notes to Financial Statements section of the most recent Annual or Semi-Annual report.
IExpense ratios reflect operating expenses of the class. Expenses before reductions do not reflect amounts reimbursed, waived, or reduced through arrangements with the investment adviser, brokerage services, or other offset arrangements, if applicable, and do not represent the amount paid by the class during periods when reimbursements, waivers or reductions occur.
JAmount does not include the portfolio activity of any underlying mutual funds or exchange-traded funds (ETFs).
Fidelity Advisor® Small Cap Value Fund Class C |
| |
| Years ended July 31, | | 2024 | | 2023 | | 2022 | | 2021 | | 2020 |
Selected Per-Share Data | | | | | | | | | | |
| Net asset value, beginning of period | $ | 16.28 | $ | 16.38 | $ | 18.25 | $ | 10.76 | $ | 12.91 |
| Income from Investment Operations | | | | | | | | | | |
Net investment income (loss) A,B | | (.04) | | (.04) | | .03 C | | (.04) D | | .01 |
| Net realized and unrealized gain (loss) | | 2.31 | | .99 | | (.36) | | 7.55 | | (1.72) |
| Total from investment operations | | 2.27 | | .95 | | (.33) | | 7.51 | | (1.71) |
| Distributions from net investment income | | (.05) | | - | | (.31) | | (.02) | | (.03) |
| Distributions from net realized gain | | (.90) | | (1.05) | | (1.24) | | - | | (.41) |
| Total distributions | | (.95) | | (1.05) | | (1.54) E | | (.02) | | (.44) |
| Net asset value, end of period | $ | 17.60 | $ | 16.28 | $ | 16.38 | $ | 18.25 | $ | 10.76 |
Total Return F,G | | | | 6.38% | | (2.27)% | | 69.84% | | (13.74)% |
Ratios to Average Net Assets B,H,I | | | | | | | | | | |
| Expenses before reductions | | 2.06% | | 2.06% | | 2.02% | | 2.01% | | 2.00% |
| Expenses net of fee waivers, if any | | | | 2.05% | | 2.01% | | 2.01% | | 1.99% |
| Expenses net of all reductions | | 2.05% | | 2.05% | | 2.01% | | 2.00% | | 1.97% |
| Net investment income (loss) | | (.27)% | | (.26)% | | .14% C | | (.26)% D | | .06% |
| Supplemental Data | | | | | | | | | | |
| Net assets, end of period (000 omitted) | $ | 39,363 | $ | 38,077 | $ | 38,832 | $ | 32,469 | $ | 13,748 |
Portfolio turnover rate J | | | | 29% | | 40% | | 54% | | 109% |
ACalculated based on average shares outstanding during the period.
BNet investment income (loss) is affected by the timing of the declaration of dividends by any underlying mutual funds or exchange-traded funds (ETFs). Net investment income (loss) of any mutual funds or ETFs is not included in the Fund's net investment income (loss) ratio.
CNet investment income per share reflects one or more large, non-recurring dividend(s) which amounted to $.13 per share. Excluding such non-recurring dividend(s), the ratio of net investment income (loss) to average net assets would have been (.62)%.
DNet investment income per share reflects one or more large, non-recurring dividend(s) which amounted to $.06 per share. Excluding such non-recurring dividend(s), the ratio of net investment income (loss) to average net assets would have been (.64)%.
ETotal distributions per share do not sum due to rounding.
FTotal returns would have been lower if certain expenses had not been reduced during the applicable periods shown.
GTotal returns do not include the effect of the contingent deferred sales charge.
HFees and expenses of any underlying mutual funds or exchange-traded funds (ETFs) are not included in the Fund's expense ratio. The Fund indirectly bears its proportionate share of these expenses. For additional expense information related to investments in Fidelity Central Funds, please refer to the "Investments in Fidelity Central Funds" note found in the Notes to Financial Statements section of the most recent Annual or Semi-Annual report.
IExpense ratios reflect operating expenses of the class. Expenses before reductions do not reflect amounts reimbursed, waived, or reduced through arrangements with the investment adviser, brokerage services, or other offset arrangements, if applicable, and do not represent the amount paid by the class during periods when reimbursements, waivers or reductions occur.
JAmount does not include the portfolio activity of any underlying mutual funds or exchange-traded funds (ETFs).
Fidelity® Small Cap Value Fund |
| |
| Years ended July 31, | | 2024 | | 2023 | | 2022 | | 2021 | | 2020 |
Selected Per-Share Data | | | | | | | | | | |
| Net asset value, beginning of period | $ | 20.00 | $ | 19.69 | $ | 21.59 | $ | 12.64 | $ | 15.04 |
| Income from Investment Operations | | | | | | | | | | |
Net investment income (loss) A,B | | .15 | | .14 | | .24 C | | .14 D | | .15 |
| Net realized and unrealized gain (loss) | | 2.90 | | 1.22 | | (.42) | | 8.89 | | (2.01) |
| Total from investment operations | | 3.05 | | 1.36 | | (.18) | | 9.03 | | (1.86) |
| Distributions from net investment income | | (.13) | | - | | (.44) | | (.08) | | (.12) |
| Distributions from net realized gain | | (.90) | | (1.05) | | (1.28) | | - | | (.41) |
| Total distributions | | (1.03) | | (1.05) | | (1.72) | | (.08) | | (.54) E |
| Net asset value, end of period | $ | 22.02 | $ | 20.00 | $ | 19.69 | $ | 21.59 | $ | 12.64 |
Total Return F | | | | 7.44% | | (1.23)% | | 71.64% | | (12.88)% |
Ratios to Average Net Assets B,G,H | | | | | | | | | | |
| Expenses before reductions | | 1.03% | | 1.04% | | .99% | | .97% | | .96% |
| Expenses net of fee waivers, if any | | | | 1.03% | | .98% | | .97% | | .96% |
| Expenses net of all reductions | | 1.02% | | 1.03% | | .98% | | .96% | | .94% |
| Net investment income (loss) | | .76% | | .77% | | 1.17% C | | .77% D | | 1.10% |
| Supplemental Data | | | | | | | | | | |
| Net assets, end of period (000 omitted) | $ | 2,806,717 | $ | 2,696,316 | $ | 2,691,063 | $ | 2,715,703 | $ | 1,231,427 |
Portfolio turnover rate I | | | | 29% | | 40% | | 54% | | 109% |
ACalculated based on average shares outstanding during the period.
BNet investment income (loss) is affected by the timing of the declaration of dividends by any underlying mutual funds or exchange-traded funds (ETFs). Net investment income (loss) of any mutual funds or ETFs is not included in the Fund's net investment income (loss) ratio.
CNet investment income per share reflects one or more large, non-recurring dividend(s) which amounted to $.16 per share. Excluding such non-recurring dividend(s), the ratio of net investment income (loss) to average net assets would have been .41%.
DNet investment income per share reflects one or more large, non-recurring dividend(s) which amounted to $.07 per share. Excluding such non-recurring dividend(s), the ratio of net investment income (loss) to average net assets would have been .40%.
ETotal distributions per share do not sum due to rounding.
FTotal returns would have been lower if certain expenses had not been reduced during the applicable periods shown.
GFees and expenses of any underlying mutual funds or exchange-traded funds (ETFs) are not included in the Fund's expense ratio. The Fund indirectly bears its proportionate share of these expenses. For additional expense information related to investments in Fidelity Central Funds, please refer to the "Investments in Fidelity Central Funds" note found in the Notes to Financial Statements section of the most recent Annual or Semi-Annual report.
HExpense ratios reflect operating expenses of the class. Expenses before reductions do not reflect amounts reimbursed, waived, or reduced through arrangements with the investment adviser, brokerage services, or other offset arrangements, if applicable, and do not represent the amount paid by the class during periods when reimbursements, waivers or reductions occur.
IAmount does not include the portfolio activity of any underlying mutual funds or exchange-traded funds (ETFs).
Fidelity Advisor® Small Cap Value Fund Class I |
| |
| Years ended July 31, | | 2024 | | 2023 | | 2022 | | 2021 | | 2020 |
Selected Per-Share Data | | | | | | | | | | |
| Net asset value, beginning of period | $ | 20.00 | $ | 19.69 | $ | 21.59 | $ | 12.65 | $ | 15.04 |
| Income from Investment Operations | | | | | | | | | | |
Net investment income (loss) A,B | | .15 | | .14 | | .24 C | | .15 D | | .15 |
| Net realized and unrealized gain (loss) | | 2.90 | | 1.22 | | (.42) | | 8.87 | | (2.01) |
| Total from investment operations | | 3.05 | | 1.36 | | (.18) | | 9.02 | | (1.86) |
| Distributions from net investment income | | (.13) | | - | | (.44) | | (.08) | | (.12) |
| Distributions from net realized gain | | (.90) | | (1.05) | | (1.28) | | - | | (.41) |
| Total distributions | | (1.03) | | (1.05) | | (1.72) | | (.08) | | (.53) |
| Net asset value, end of period | $ | 22.02 | $ | 20.00 | $ | 19.69 | $ | 21.59 | $ | 12.65 |
Total Return E | | | | 7.44% | | (1.22)% | | 71.55% | | (12.82)% |
Ratios to Average Net Assets B,F,G | | | | | | | | | | |
| Expenses before reductions | | 1.03% | | 1.03% | | .99% | | .97% | | .95% |
| Expenses net of fee waivers, if any | | | | 1.03% | | .99% | | .97% | | .95% |
| Expenses net of all reductions | | 1.03% | | 1.03% | | .99% | | .96% | | .93% |
| Net investment income (loss) | | .76% | | .77% | | 1.17% C | | .77% D | | 1.10% |
| Supplemental Data | | | | | | | | | | |
| Net assets, end of period (000 omitted) | $ | 1,085,761 | $ | 1,169,580 | $ | 1,319,154 | $ | 845,012 | $ | 214,538 |
Portfolio turnover rate H | | | | 29% | | 40% | | 54% | | 109% |
ACalculated based on average shares outstanding during the period.
BNet investment income (loss) is affected by the timing of the declaration of dividends by any underlying mutual funds or exchange-traded funds (ETFs). Net investment income (loss) of any mutual funds or ETFs is not included in the Fund's net investment income (loss) ratio.
CNet investment income per share reflects one or more large, non-recurring dividend(s) which amounted to $.16 per share. Excluding such non-recurring dividend(s), the ratio of net investment income (loss) to average net assets would have been .40%.
DNet investment income per share reflects one or more large, non-recurring dividend(s) which amounted to $.07 per share. Excluding such non-recurring dividend(s), the ratio of net investment income (loss) to average net assets would have been .40%.
ETotal returns would have been lower if certain expenses had not been reduced during the applicable periods shown.
FFees and expenses of any underlying mutual funds or exchange-traded funds (ETFs) are not included in the Fund's expense ratio. The Fund indirectly bears its proportionate share of these expenses. For additional expense information related to investments in Fidelity Central Funds, please refer to the "Investments in Fidelity Central Funds" note found in the Notes to Financial Statements section of the most recent Annual or Semi-Annual report.
GExpense ratios reflect operating expenses of the class. Expenses before reductions do not reflect amounts reimbursed, waived, or reduced through arrangements with the investment adviser, brokerage services, or other offset arrangements, if applicable, and do not represent the amount paid by the class during periods when reimbursements, waivers or reductions occur.
HAmount does not include the portfolio activity of any underlying mutual funds or exchange-traded funds (ETFs).
Fidelity Advisor® Small Cap Value Fund Class Z |
| |
| Years ended July 31, | | 2024 | | 2023 | | 2022 | | 2021 | | 2020 |
Selected Per-Share Data | | | | | | | | | | |
| Net asset value, beginning of period | $ | 20.03 | $ | 19.69 | $ | 21.59 | $ | 12.65 | $ | 15.05 |
| Income from Investment Operations | | | | | | | | | | |
Net investment income (loss) A,B | | .17 | | .16 | | .27 C | | .17 D | | .17 |
| Net realized and unrealized gain (loss) | | 2.90 | | 1.23 | | (.43) | | 8.87 | | (2.01) |
| Total from investment operations | | 3.07 | | 1.39 | | (.16) | | 9.04 | | (1.84) |
| Distributions from net investment income | | (.15) | | - | | (.47) | | (.10) | | (.15) |
| Distributions from net realized gain | | (.90) | | (1.05) | | (1.28) | | - | | (.41) |
| Total distributions | | (1.05) | | (1.05) | | (1.74) E | | (.10) | | (.56) |
| Net asset value, end of period | $ | 22.05 | $ | 20.03 | $ | 19.69 | $ | 21.59 | $ | 12.65 |
Total Return F | | | | 7.60% | | (1.11)% | | 71.75% | | (12.73)% |
Ratios to Average Net Assets B,G,H | | | | | | | | | | |
| Expenses before reductions | | .93% | | .90% | | .86% | | .84% | | .81% |
| Expenses net of fee waivers, if any | | | | .90% | | .86% | | .84% | | .81% |
| Expenses net of all reductions | | .93% | | .90% | | .86% | | .83% | | .79% |
| Net investment income (loss) | | .86% | | .90% | | 1.30% C | | .90% D | | 1.25% |
| Supplemental Data | | | | | | | | | | |
| Net assets, end of period (000 omitted) | $ | 814,390 | $ | 639,652 | $ | 540,854 | $ | 364,564 | $ | 93,849 |
Portfolio turnover rate I | | | | 29% | | 40% | | 54% | | 109% |
ACalculated based on average shares outstanding during the period.
BNet investment income (loss) is affected by the timing of the declaration of dividends by any underlying mutual funds or exchange-traded funds (ETFs). Net investment income (loss) of any mutual funds or ETFs is not included in the Fund's net investment income (loss) ratio.
CNet investment income per share reflects one or more large, non-recurring dividend(s) which amounted to $.16 per share. Excluding such non-recurring dividend(s), the ratio of net investment income (loss) to average net assets would have been .53%.
DNet investment income per share reflects one or more large, non-recurring dividend(s) which amounted to $.07 per share. Excluding such non-recurring dividend(s), the ratio of net investment income (loss) to average net assets would have been .53%.
ETotal distributions per share do not sum due to rounding.
FTotal returns would have been lower if certain expenses had not been reduced during the applicable periods shown.
GFees and expenses of any underlying mutual funds or exchange-traded funds (ETFs) are not included in the Fund's expense ratio. The Fund indirectly bears its proportionate share of these expenses. For additional expense information related to investments in Fidelity Central Funds, please refer to the "Investments in Fidelity Central Funds" note found in the Notes to Financial Statements section of the most recent Annual or Semi-Annual report.
HExpense ratios reflect operating expenses of the class. Expenses before reductions do not reflect amounts reimbursed, waived, or reduced through arrangements with the investment adviser, brokerage services, or other offset arrangements, if applicable, and do not represent the amount paid by the class during periods when reimbursements, waivers or reductions occur.
IAmount does not include the portfolio activity of any underlying mutual funds or exchange-traded funds (ETFs).
Notes to Financial Statements
For the period ended July 31, 2024
1. Organization.
Fidelity Small Cap Value Fund (the Fund) is a fund of Fidelity Securities Fund (the Trust) and is authorized to issue an unlimited number of shares. The Trust is registered under the Investment Company Act of 1940, as amended (the 1940 Act), as an open-end management investment company organized as a Massachusetts business trust. The Fund offers Class A, Class M, Class C, Small Cap Value, Class I and Class Z shares, each of which has equal rights as to assets and voting privileges. Class A, Class M, Class C, Class I and Class Z are Fidelity Advisor classes. Each class has exclusive voting rights with respect to matters that affect that class. Class C shares will automatically convert to Class A shares after a holding period of eight years from the initial date of purchase, with certain exceptions.
2. Investments in Fidelity Central Funds.
Funds may invest in Fidelity Central Funds, which are open-end investment companies generally available only to other investment companies and accounts managed by the investment adviser and its affiliates. The Schedule of Investments lists any Fidelity Central Funds held as an investment as of period end, but does not include the underlying holdings of each Fidelity Central Fund. An investing fund indirectly bears its proportionate share of the expenses of the underlying Fidelity Central Funds.
Based on its investment objective, each Fidelity Central Fund may invest or participate in various investment vehicles or strategies that are similar to those of the investing fund. These strategies are consistent with the investment objectives of the investing fund and may involve certain economic risks which may cause a decline in value of each of the Fidelity Central Funds and thus a decline in the value of the investing fund.
| Fidelity Central Fund | Investment Manager | Investment Objective | Investment Practices | Expense RatioA |
| Fidelity Money Market Central Funds | Fidelity Management & Research Company LLC (FMR) | Each fund seeks to obtain a high level of current income consistent with the preservation of capital and liquidity. | Short-term Investments | Less than .005% |
A Expenses expressed as a percentage of average net assets and are as of each underlying Central Fund's most recent annual or semi-annual shareholder report.
A complete unaudited list of holdings for each Fidelity Central Fund is available upon request or at the Securities and Exchange Commission website at www.sec.gov. In addition, the financial statements of the Fidelity Central Funds which contain the significant accounting policies (including investment valuation policies) of those funds, and are not covered by the Report of Independent Registered Public Accounting Firm, are available on the Securities and Exchange Commission website or upon request.
3. Significant Accounting Policies.
The Fund is an investment company and applies the accounting and reporting guidance of the Financial Accounting Standards Board (FASB) Accounting Standards Codification Topic 946 Financial Services - Investment Companies. The financial statements have been prepared in conformity with accounting principles generally accepted in the United States of America (GAAP), which require management to make certain estimates and assumptions at the date of the financial statements. Actual results could differ from those estimates. Subsequent events, if any, through the date that the financial statements were issued have been evaluated in the preparation of the financial statements. The Fund's Schedule of Investments lists any underlying mutual funds or exchange-traded funds (ETFs) but does not include the underlying holdings of these funds. The following summarizes the significant accounting policies of the Fund:
Investment Valuation. Investments are valued as of 4:00 p.m. Eastern time on the last calendar day of the period. The Board of Trustees (the Board) has designated the Fund's investment adviser as the valuation designee responsible for the fair valuation function and performing fair value determinations as needed. The investment adviser has established a Fair Value Committee (the Committee) to carry out the day-to-day fair valuation responsibilities and has adopted policies and procedures to govern the fair valuation process and the activities of the Committee. In accordance with these fair valuation policies and procedures, which have been approved by the Board, the Fund attempts to obtain prices from one or more third party pricing services or brokers to value its investments. When current market prices, quotations or currency exchange rates are not readily available or reliable, investments will be fair valued in good faith by the Committee, in accordance with the policies and procedures. Factors used in determining fair value vary by investment type and may include market or investment specific events, transaction data, estimated cash flows, and market observations of comparable investments. The frequency that the fair valuation procedures are used cannot be predicted and they may be utilized to a significant extent. The Committee manages the Fund's fair valuation practices and maintains the fair valuation policies and procedures. The Fund's investment adviser reports to the Board information regarding the fair valuation process and related material matters.
The Fund categorizes the inputs to valuation techniques used to value its investments into a disclosure hierarchy consisting of three levels as shown below:
Level 1 - unadjusted quoted prices in active markets for identical investments
Level 2 - other significant observable inputs (including quoted prices for similar investments, interest rates, prepayment speeds, etc.)
Level 3 - unobservable inputs (including the Fund's own assumptions based on the best information available)
Valuation techniques used to value the Fund's investments by major category are as follows:
Equity securities, including restricted securities, for which market quotations are readily available, are valued at the last reported sale price or official closing price as reported by a third party pricing service on the primary market or exchange on which they are traded and are categorized as Level 1 in the hierarchy. In the event there were no sales during the day or closing prices are not available, securities are valued at the last quoted bid price or may be valued using the last available price and are generally categorized as Level 2 in the hierarchy. For foreign equity securities, when market or security specific events arise, comparisons to the valuation of American Depositary Receipts (ADRs), futures contracts, Exchange-Traded Funds (ETFs) and certain indexes as well as quoted prices for similar securities may be used and would be categorized as Level 2 in the hierarchy. For equity securities, including restricted securities, where observable inputs are limited, assumptions about market activity and risk are used and these securities may be categorized as Level 3 in the hierarchy.
Investments in open-end mutual funds, including the Fidelity Central Funds, are valued at their closing net asset value (NAV) each business day and are categorized as Level 1 in the hierarchy.
Changes in valuation techniques may result in transfers in or out of an assigned level within the disclosure hierarchy. The aggregate value of investments by input level as of July 31, 2024 is included at the end of the Fund's Schedule of Investments.
Foreign Currency. Certain Funds may use foreign currency contracts to facilitate transactions in foreign-denominated securities. Gains and losses from these transactions may arise from changes in the value of the foreign currency or if the counterparties do not perform under the contracts' terms.
Foreign-denominated assets, including investment securities, and liabilities are translated into U.S. dollars at the exchange rates at period end. Purchases and sales of investment securities, income and dividends received, and expenses denominated in foreign currencies are translated into U.S. dollars at the exchange rate in effect on the transaction date.
The effects of exchange rate fluctuations on investments are included with the net realized and unrealized gain (loss) on investment securities. Other foreign currency transactions resulting in realized and unrealized gain (loss) are disclosed separately.
Investment Transactions and Income. For financial reporting purposes, the Fund's investment holdings and NAV include trades executed through the end of the last business day of the period. The NAV per share for processing shareholder transactions is calculated as of the close of business of the New York Stock Exchange (NYSE), normally 4:00 p.m. Eastern time and includes trades executed through the end of the prior business day. Gains and losses on securities sold are determined on the basis of identified cost and include proceeds received from litigation. Commissions paid to certain brokers with whom the investment adviser, or its affiliates, places trades on behalf of a fund include an amount in addition to trade execution, which may be rebated back to a fund. Any such rebates are included in net realized gain (loss) on investments in the Statement of Operations. Dividend income is recorded on the ex-dividend date, except for certain dividends from foreign securities where the ex-dividend date may have passed, which are recorded as soon as the Fund is informed of the ex-dividend date. Non-cash dividends included in dividend income, if any, are recorded at the fair market value of the securities received. Income and capital gain distributions from Fidelity Central Funds, if any, are recorded on the ex-dividend date. Certain distributions received by the Fund represent a return of capital or capital gain. The Fund determines the components of these distributions subsequent to the ex-dividend date, based upon receipt of tax filings or other correspondence relating to the underlying investment. These distributions are recorded as a reduction of cost of investments and/or as a realized gain. Investment income is recorded net of foreign taxes withheld where recovery of such taxes is uncertain. Funds may file withholding tax reclaims in certain jurisdictions to recover a portion of amounts previously withheld. Any withholding tax reclaims income is included in the Statement of Operations in dividends. Any receivables for withholding tax reclaims are included in the Statement of Assets and Liabilities in dividends receivable.
Class Allocations and Expenses. Investment income, realized and unrealized capital gains and losses, common expenses of a fund, and certain fund-level expense reductions, if any, are allocated daily on a pro-rata basis to each class based on the relative net assets of each class to the total net assets of a fund. Each class differs with respect to transfer agent and distribution and service plan fees incurred, as applicable. Certain expense reductions may also differ by class, if applicable. For the reporting period, the allocated portion of income and expenses to each class as a percent of its average net assets may vary due to the timing of recording these transactions in relation to fluctuating net assets of the classes. Expenses directly attributable to a fund are charged to that fund. Expenses attributable to more than one fund are allocated among the respective funds on the basis of relative net assets or other appropriate methods. Expenses included in the accompanying financial statements reflect the expenses of that fund and do not include any expenses associated with any underlying mutual funds or exchange-traded funds (ETFs). Although not included in a fund's expenses, a fund indirectly bears its proportionate share of these expenses through the net asset value of each underlying mutual fund or exchange-traded fund (ETF). Expense estimates are accrued in the period to which they relate and adjustments are made when actual amounts are known.
Income Tax Information and Distributions to Shareholders. Each year, the Fund intends to qualify as a regulated investment company under Subchapter M of the Internal Revenue Code, including distributing substantially all of its taxable income and realized gains. As a result, no provision for U.S. Federal income taxes is required. As of July 31, 2024, the Fund did not have any unrecognized tax benefits in the financial statements; nor is the Fund aware of any tax positions for which it is reasonably possible that the total amounts of unrecognized tax benefits will significantly change in the next twelve months. The Fund files a U.S. federal tax return, in addition to state and local tax returns as required. The Fund's federal income tax returns are subject to examination by the Internal Revenue Service (IRS) for a period of three fiscal years after they are filed. State and local tax returns may be subject to examination for an additional fiscal year depending on the jurisdiction. Foreign taxes are provided for based on the Fund's understanding of the tax rules and rates that exist in the foreign markets in which it invests.
Distributions are declared and recorded on the ex-dividend date. Income and capital gain distributions are declared separately for each class. Income and capital gain distributions are determined in accordance with income tax regulations, which may differ from GAAP. In addition, the Fund claimed a portion of the payment made to redeeming shareholders as a distribution for income tax purposes.
Capital accounts within the financial statements are adjusted for permanent book-tax differences. These adjustments have no impact on net assets or the results of operations. Capital accounts are not adjusted for temporary book-tax differences which will reverse in a subsequent period.
Book-tax differences are primarily due to due to foreign currency transactions, passive foreign investment companies (PFIC), partnerships and losses deferred due to wash sales.
As of period end, the cost and unrealized appreciation (depreciation) in securities, and derivatives if applicable, for federal income tax purposes were as follows:
| Gross unrealized appreciation | $1,072,522,467 |
| Gross unrealized depreciation | (232,107,370) |
| Net unrealized appreciation (depreciation) | $840,415,097 |
| Tax Cost | $4,597,192,349 |
The tax-based components of distributable earnings as of period end were as follows:
| Undistributed ordinary income | $87,958,804 |
| Undistributed long-term capital gain | $135,546,330 |
| Net unrealized appreciation (depreciation) on securities and other investments | $840,389,041 |
The tax character of distributions paid was as follows:
| | July 31, 2024 | July 31, 2023 |
| Ordinary Income | $30,670,625 | $- |
| Long-term Capital Gains | 221,146,243 | 265,224,207 |
| Total | $251,816,868 | $265,224,207 |
4. Purchases and Sales of Investments.
Purchases and sales of securities, other than short-term securities and in-kind transactions, as applicable, are noted in the table below.
| | Purchases ($) | Sales ($) |
| Fidelity Small Cap Value Fund | 2,928,447,713 | 3,353,084,146 |
5. Fees and Other Transactions with Affiliates.
Management Fee. Fidelity Management & Research Company LLC (the investment adviser) and its affiliates provide the Fund with investment management related services for which the Fund pays a monthly management fee.
Effective March 1, 2024, the Fund's management contract was amended to incorporate administrative services previously covered under separate services agreements (Transfer Agent and Accounting agreements). The amended contract incorporates a basic fee rate that may vary by class (subject to a performance adjustment). The investment adviser or an affiliate pays certain expenses of managing and operating the Fund out of each class's management fee. Each class of the Fund pays a management fee to the investment adviser. The management fee is calculated and paid to the investment adviser every month. The management fee is determined by calculating a basic fee and then applying a performance adjustment. When determining a class's basic fee, a mandate rate is calculated based on the monthly average net assets of a group of funds advised by FMR within a designated asset class. A discount rate is subtracted from the mandate rate once the Fund's monthly average net assets reach a certain level. The mandate rate and discount rate may vary by class. The annual basic fee rate for a class of shares of the Fund is the lesser of (1) the class's mandate rate reduced by the class's discount rate (if applicable) or (2) the amount set forth in the following table.
| | Maximum Management Fee Rate % |
| Class A | .85 |
| Class M | .84 |
| Class C | .86 |
| Small Cap Value | .84 |
| Class I | .84 |
| Class Z | .70 |
One-twelfth of the basic fee rate for a class is applied to the average net assets of the class for the month, giving a dollar amount which is the basic fee for the class for that month. A different management fee rate may be applicable to each class of the Fund. The difference between classes is the result of separate arrangements for class-level services and/or waivers of certain expenses. It is not the result of any difference in advisory or custodial fees or other expenses related to the management of the Fund's assets, which do not vary by class. For the portion of the reporting period on or after March 1, 2024, the total annualized management fee rates were as follows:
| | Total Management Fee Rate % |
| Class A | .81 |
| Class M | .81 |
| Class C | .81 |
| Small Cap Value | .77 |
| Class I | .81 |
| Class Z | .69 |
Prior to March 1, 2024, the management fee was the sum of an individual fund fee rate that was based on an annual rate of .45% of the Fund's average net assets and an annualized group fee rate that averaged .22% during the period. The group fee rate was based upon the monthly average net assets of a group of registered investment companies with which the investment adviser has management contracts. The group fee rate decreased as assets under management increased and increased as assets under management decreased. For the portion of the reporting period prior to March 1, 2024, the total annualized management fee rate was .67%.
The performance adjustment rate is calculated monthly by comparing over the performance period the Fund's performance to that of the performance adjustment index listed below.
| | Performance Adjustment Index |
| Fidelity Small Cap Value Fund | Russell 2000 Value Index |
For the purposes of calculating the performance adjustment for the Fund, the Fund's investment performance is based on the performance of Small Cap Value. To the extent that other classes of the Fund have higher expenses, this could result in those classes bearing a larger positive performance adjustment and smaller negative performance adjustment than would be the case if each class's own performance were considered. The performance period is the most recent 36 month period. The maximum annualized performance adjustment rate is ±.20% of the Fund's average net assets over the performance period. The performance adjustment rate is divided by twelve and multiplied by the Fund's average net assets over the performance period, and the resulting dollar amount is proportionately added to or subtracted from a class's basic fee. For the entire reporting period, the total annual performance adjustment was .19%.
Effective March 1, 2024, the Fund's sub-advisory agreements with FMR Investment Management (UK) Limited, Fidelity Management & Research (Hong Kong) Limited, and Fidelity Management & Research (Japan) Limited were amended to provide that the investment adviser pays each sub-adviser monthly fees equal to 110% of the sub-adviser's costs for providing sub-advisory services.
Distribution and Service Plan Fees. In accordance with Rule 12b-1 of the 1940 Act, the Fund has adopted separate Distribution and Service Plans for each class of shares. Certain classes pay Fidelity Distributors Company LLC (FDC), an affiliate of the investment adviser, separate Distribution and Service Fees, each of which is based on an annual percentage of each class' average net assets. In addition, FDC may pay financial intermediaries for selling shares of the Fund and providing shareholder support services. For the period, the Distribution and Service Fee rates, total fees and amounts retained by FDC were as follows:
| | Distribution Fee | Service Fee | Total Fees ($) | Retained by FDC ($) |
| Class A | -% | .25% | 638,792 | 408,514 |
| Class M | .25% | .25% | 463,930 | 56,744 |
| Class C | .75% | .25% | 365,205 | 310,804 |
| | | | 1,467,927 | 776,062 |
Sales Load. FDC may receive a front-end sales charge of up to 5.75% for selling Class A shares and 3.50% for selling Class M shares, some of which is paid to financial intermediaries for selling shares of the Fund. Depending on the holding period, FDC may receive contingent deferred sales charges levied on Class A, Class M and Class C redemptions. The deferred sales charges are 1.00% for Class C shares, 1.00% for certain purchases of Class A shares and .25% for certain purchases of Class M shares.
For the period, sales charge amounts retained by FDC were as follows:
| | Retained by FDC ($) |
| Class A | 46,978 |
| Class M | 3,121 |
Class CA | 559 |
| | 50,658 |
A When Class C shares are initially sold, FDC pays commissions from its own resources to financial intermediaries through which the sales are made.
Transfer Agent Fees. Fidelity Investments Institutional Operations Company LLC (FIIOC), an affiliate of the investment adviser, is the transfer, dividend disbursing and shareholder servicing agent for each class of the Fund. Effective March 1, 2024, the Fund's management contract was amended to incorporate transfer agent services and associated fees previously covered under a separate services agreement. FIIOC pays for typesetting, printing and mailing of shareholder reports, except proxy statements.
During the period December 1, 2023 through February 29, 2024, the transfer agent fees for each class were a fixed annual rate of class-level average net assets as follows:
| | | % of Class-Level Average Net Assets | |
| Class A | | .1833 | |
| Class M | | .1774 | |
| Class C | | .1964 | |
| Small Cap Value | | .1738 | |
| Class I | | .1726 | |
| Class Z | | .0420 | |
| | | |
| | | | |
Prior to December 1, 2023, FIIOC received account fees and asset-based fees that varied according to the account size and type of account of the shareholders of the respective classes of the Fund, except for Class Z. FIIOC received an asset-based fee of Class Z's average net assets. For the portion of the reporting period prior to March 1, 2024, the fees were equivalent to the following annualized rates:
| | Amount ($) | % of Class-Level Average Net Assets |
| Class A | 274,162 | .19 |
| Class M | 95,059 | .18 |
| Class C | 41,484 | .20 |
| Small Cap Value | 2,632,026 | .18 |
| Class I | 1,065,619 | .17 |
| Class Z | 151,557 | .04 |
| 4,259,907 | |
Accounting Fees. Fidelity Service Company, Inc. (FSC), an affiliate of the investment adviser, maintains the Fund's accounting records. Effective March 1, 2024, the Fund's management contract was amended to incorporate accounting services and associated fees previously covered under a separate services agreement.
During the period December 1, 2023 through February 29, 2024, the accounting fees were a fixed annual rate of average net assets as follows:
| | % of Average Net Assets |
| Fidelity Small Cap Value Fund | .0198 |
Prior to December 1, 2023, the accounting fee was based on the level of average net assets for each month. For the portion of the reporting period prior to March 1, 2024, the fees were equivalent to the following annualized rates:
| | % of Average Net Assets |
| Fidelity Small Cap Value Fund | .02 |
Brokerage Commissions. A portion of portfolio transactions were placed with brokerage firms which are affiliates of the investment adviser. Brokerage commissions are included in net realized gain (loss) and change in net unrealized appreciation (depreciation) in the Statement of Operations. The commissions paid to these affiliated firms were as follows:
| | Amount ($) |
| Fidelity Small Cap Value Fund | 80,827 |
Interfund Lending Program. Pursuant to an Exemptive Order issued by the Securities and Exchange Commission (the SEC), the Fund, along with other registered investment companies having management contracts with Fidelity Management & Research Company LLC (FMR), or other affiliated entities of FMR, may participate in an interfund lending program. This program provides an alternative credit facility allowing the Fund to borrow from, or lend money to, other participating affiliated funds. At period end, there were no interfund loans outstanding. Activity in this program during the period for which loans were outstanding was as follows:
| | Borrower or Lender | Average Loan Balance ($) | Weighted Average Interest Rate | Interest Expense ($) |
| Fidelity Small Cap Value Fund | Borrower | 14,591,000 | 5.57% | 18,052 |
Interfund Trades. Funds may purchase from or sell securities to other Fidelity Funds under procedures adopted by the Board. The procedures have been designed to ensure these interfund trades are executed in accordance with Rule 17a-7 of the 1940 Act. Any interfund trades are included within the respective purchases and sales amounts shown in the Purchases and Sales of Investments note. Interfund trades during the period are noted in the table below.
| | Purchases ($) | Sales ($) | Realized Gain (Loss)($) |
| Fidelity Small Cap Value Fund | 148,649,084 | 343,731,743 | (12,882,525) |
6. Committed Line of Credit.
Certain Funds participate with other funds managed by the investment adviser or an affiliate in a $4.25 billion credit facility (the "line of credit") to be utilized for temporary or emergency purposes to fund shareholder redemptions or for other short-term liquidity purposes. The participating funds have agreed to pay commitment fees on their pro-rata portion of the line of credit, which are reflected in Miscellaneous expenses on the Statement of Operations, and are listed below. During the period, there were no borrowings on this line of credit.
| | Amount ($) |
| Fidelity Small Cap Value Fund | 7,813 |
7. Security Lending.
Funds lend portfolio securities from time to time in order to earn additional income. Lending agents are used, including National Financial Services (NFS), an affiliate of the investment adviser. Pursuant to a securities lending agreement, NFS will receive a fee, which is capped at 9.9% of a fund's daily lending revenue, for its services as lending agent. A fund may lend securities to certain qualified borrowers, including NFS. On the settlement date of the loan, a fund receives collateral (in the form of U.S. Treasury obligations, letters of credit and/or cash) against the loaned securities and maintains collateral in an amount not less than 100% of the market value of the loaned securities during the period of the loan. The market value of the loaned securities is determined at the close of business of a fund and any additional required collateral is delivered to a fund on the next business day. A fund or borrower may terminate the loan at any time, and if the borrower defaults on its obligation to return the securities loaned because of insolvency or other reasons, a fund may apply collateral received from the borrower against the obligation. A fund may experience delays and costs in recovering the securities loaned. Any cash collateral received is invested in the Fidelity Securities Lending Cash Central Fund. Any loaned securities are identified as such in the Schedule of Investments, and the value of loaned securities and cash collateral at period end, as applicable, are presented in the Statement of Assets and Liabilities. Security lending income represents the income earned on investing cash collateral, less rebates paid to borrowers and any lending agent fees associated with the loan, plus any premium payments received for lending certain types of securities. Security lending income is presented in the Statement of Operations as a component of income from Fidelity Central Funds. Affiliated security lending activity, if any, was as follows:
| | Total Security Lending Fees Paid to NFS ($) | Security Lending Income From Securities Loaned to NFS ($) | Value of Securities Loaned to NFS at Period End ($) |
| Fidelity Small Cap Value Fund | 81,111 | 918 | - |
8. Expense Reductions.
During the period the investment adviser or an affiliate reimbursed and/or waived a portion of fund-level operating expenses in the amount of $295,177.
9. Distributions to Shareholders.
Distributions to shareholders of each class were as follows:
| | Year ended July 31, 2024 | Year ended July 31, 2023 |
| Fidelity Small Cap Value Fund | | |
| Distributions to shareholders | | |
| Class A | $13,808,522 | $14,784,350 |
| Class M | 4,979,529 | 4,753,937 |
| Class C | 2,221,061 | 2,573,021 |
| Small Cap Value | 137,976,781 | 143,553,970 |
| Class I | 58,310,982 | 70,449,681 |
| Class Z | 34,519,993 | 29,109,248 |
Total | $251,816,868 | $265,224,207 |
10. Share Transactions.
Share transactions for each class were as follows and may contain in-kind transactions, automatic conversions between classes or exchanges between affiliated funds:
| | Shares | Shares | Dollars | Dollars |
| | Year ended July 31, 2024 | Year ended July 31, 2023 | Year ended July 31, 2024 | Year ended July 31, 2023 |
| Fidelity Small Cap Value Fund | | | | |
| Class A | | | | |
| Shares sold | 1,839,641 | 2,796,646 | $34,270,736 | $49,740,328 |
| Reinvestment of distributions | 757,603 | 821,348 | 13,430,863 | 14,511,162 |
| Shares redeemed | (3,595,356) | (3,644,484) | (66,634,723) | (64,094,019) |
| Net increase (decrease) | (998,112) | (26,490) | $(18,933,124) | $157,471 |
| Class M | | | | |
| Shares sold | 1,020,584 | 1,323,567 | $18,462,632 | $22,813,537 |
| Reinvestment of distributions | 291,157 | 277,763 | 4,934,489 | 4,713,039 |
| Shares redeemed | (1,140,591) | (962,174) | (20,371,563) | (16,264,726) |
| Net increase (decrease) | 171,150 | 639,156 | $3,025,558 | $11,261,850 |
| Class C | | | | |
| Shares sold | 483,222 | 610,972 | $7,604,784 | $9,222,163 |
| Reinvestment of distributions | 142,897 | 162,722 | 2,106,132 | 2,435,733 |
| Shares redeemed | (728,461) | (805,375) | (11,288,315) | (11,893,135) |
| Net increase (decrease) | (102,342) | (31,681) | $(1,577,399) | $(235,239) |
| Small Cap Value | | | | |
| Shares sold | 24,020,538 | 30,005,506 | $465,397,362 | $553,458,025 |
| Reinvestment of distributions | 7,107,269 | 7,490,939 | 130,465,039 | 136,467,165 |
| Shares redeemed | (38,489,919) | (39,383,960) | (737,973,559) | (716,479,073) |
| Net increase (decrease) | (7,362,112) | (1,887,515) | $(142,111,158) | $(26,553,883) |
| Class I | | | | |
| Shares sold | 14,976,802 | 29,686,434 | $288,232,544 | $543,972,298 |
| Reinvestment of distributions | 2,998,337 | 3,613,120 | 55,002,406 | 65,821,608 |
| Shares redeemed | (27,145,630) | (41,832,427) | (522,188,250) | (756,480,294) |
| Net increase (decrease) | (9,170,491) | (8,532,873) | $(178,953,300) | $(146,686,388) |
| Class Z | | | | |
| Shares sold | 15,740,824 | 16,185,746 | $308,536,262 | $291,398,386 |
| Reinvestment of distributions | 1,701,801 | 1,366,081 | 31,276,569 | 24,883,951 |
| Shares redeemed | (12,447,667) | (13,088,293) | (240,075,064) | (239,007,124) |
| Net increase (decrease) | 4,994,958 | 4,463,534 | $99,737,767 | $77,275,213 |
11. Other.
A fund's organizational documents provide former and current trustees and officers with a limited indemnification against liabilities arising in connection with the performance of their duties to the fund. In the normal course of business, a fund may also enter into contracts that provide general indemnifications. A fund's maximum exposure under these arrangements is unknown as this would be dependent on future claims that may be made against a fund. The risk of material loss from such claims is considered remote.
12. Risk and Uncertainties.
Many factors affect a fund's performance. Developments that disrupt global economies and financial markets, such as pandemics, epidemics, outbreaks of infectious diseases, war, terrorism, and environmental disasters, may significantly affect a fund's investment performance. The effects of these developments to a fund will be impacted by the types of securities in which a fund invests, the financial condition, industry, economic sector, and geographic location of an issuer, and a fund's level of investment in the securities of that issuer. Significant concentrations in security types, issuers, industries, sectors, and geographic locations may magnify the factors that affect a fund's performance.
Report of Independent Registered Public Accounting Firm
To the Board of Trustees of Fidelity Securities Fund and Shareholders of Fidelity Small Cap Value Fund
Opinion on the Financial Statements
We have audited the accompanying statement of assets and liabilities, including the schedule of investments, of Fidelity Small Cap Value Fund (one of the funds constituting Fidelity Securities Fund, referred to hereafter as the "Fund") as of July 31, 2024, the related statement of operations for the year ended July 31, 2024, the statement of changes in net assets for each of the two years in the period ended July 31, 2024, including the related notes, and the financial highlights for each of the five years in the period ended July 31, 2024 (collectively referred to as the "financial statements"). In our opinion, the financial statements present fairly, in all material respects, the financial position of the Fund as of July 31, 2024, the results of its operations for the year then ended, the changes in its net assets for each of the two years in the period ended July 31, 2024 and the financial highlights for each of the five years in the period ended July 31, 2024 in conformity with accounting principles generally accepted in the United States of America.
Basis for Opinion
These financial statements are the responsibility of the Fund's management. Our responsibility is to express an opinion on the Fund's financial statements based on our audits. We are a public accounting firm registered with the Public Company Accounting Oversight Board (United States) (PCAOB) and are required to be independent with respect to the Fund in accordance with the U.S. federal securities laws and the applicable rules and regulations of the Securities and Exchange Commission and the PCAOB.
We conducted our audits of these financial statements in accordance with the standards of the PCAOB. Those standards require that we plan and perform the audit to obtain reasonable assurance about whether the financial statements are free of material misstatement, whether due to error or fraud.
Our audits included performing procedures to assess the risks of material misstatement of the financial statements, whether due to error or fraud, and performing procedures that respond to those risks. Such procedures included examining, on a test basis, evidence regarding the amounts and disclosures in the financial statements. Our audits also included evaluating the accounting principles used and significant estimates made by management, as well as evaluating the overall presentation of the financial statements. Our procedures included confirmation of securities owned as of July 31, 2024 by correspondence with the custodian and brokers; when replies were not received from brokers, we performed other auditing procedures. We believe that our audits provide a reasonable basis for our opinion.
/s/ PricewaterhouseCoopers LLP
Boston, Massachusetts
September 16, 2024
We have served as the auditor of one or more investment companies in the Fidelity group of funds since 1932.
Distributions
(Unaudited)The dividend and capital gains distributions for the fund(s) are available on Fidelity.com or Institutional.Fidelity.com.
The fund hereby designates as a capital gain dividend with respect to the taxable year ended July 31, 2024, $173,586,264 or, if subsequently determined to be different, the net capital gain of such year.
Class A designates 0% and 100%; Class M designates 0% and 100%; Class C designates 0% and 100%; Small Cap Value designates 100% and 100%; Class I designates 100% and 100%; and Class Z designates 100% and 98% of the dividends distributed in September and December, respectively during the fiscal year as qualifying for the dividends-received deduction for corporate shareholders.
Class A designates 0% and 100%; Class M designates 0% and 100%; Class C designates 0% and 100%; Small Cap Value designates 100% and 100%; Class I designates 100% and 100%; and Class Z designates 100% and 100% of the dividends distributed in September and December, respectively during the fiscal year as amounts which may be taken into account as a dividend for purposes of the maximum rate under section 1(h)(11) of the Internal Revenue Code.
The fund will notify shareholders in January 2025 of amounts for use in preparing 2024 income tax returns.
Item 8: Changes in and Disagreements with Accountants for Open-End Management Investment Companies
Note: This is not applicable for any fund included in this document.
Item 9: Proxy Disclosures for Open-End Management Investment Companies
| A special meeting of shareholders was held on July 16, 2024. The results of votes taken among shareholders on the proposal before them are reported below. Each vote reported represents one dollar of net asset value held on the record date for the meeting. |
| Proposal 1 |
| To elect a Board of Trustees. |
| | # of Votes | % of Votes |
| Bettina Doulton |
| Affirmative | 88,756,759,992.17 | 95.11 |
| Withheld | 4,564,750,651.52 | 4.89 |
| TOTAL | 93,321,510,643.68 | 100.00 |
| Robert A. Lawrence |
| Affirmative | 88,523,438,331.98 | 94.86 |
| Withheld | 4,798,072,311.70 | 5.14 |
| TOTAL | 93,321,510,643.68 | 100.00 |
| Vijay C. Advani |
| Affirmative | 88,484,371,668.51 | 94.82 |
| Withheld | 4,837,138,975.17 | 5.18 |
| TOTAL | 93,321,510,643.68 | 100.00 |
| Thomas P. Bostick |
| Affirmative | 88,618,596,648.21 | 94.96 |
| Withheld | 4,702,913,995.47 | 5.04 |
| TOTAL | 93,321,510,643.68 | 100.00 |
| Donald F. Donahue |
| Affirmative | 88,542,403,002.79 | 94.88 |
| Withheld | 4,779,107,640.89 | 5.12 |
| TOTAL | 93,321,510,643.68 | 100.00 |
| Vicki L. Fuller |
| Affirmative | 88,788,711,037.44 | 95.14 |
| Withheld | 4,532,799,606.24 | 4.86 |
| TOTAL | 93,321,510,643.68 | 100.00 |
| Patricia L. Kampling |
| Affirmative | 88,819,315,996.59 | 95.18 |
| Withheld | 4,502,194,647.10 | 4.82 |
| TOTAL | 93,321,510,643.68 | 100.00 |
| Thomas A. Kennedy |
| Affirmative | 88,667,457,817.34 | 95.01 |
| Withheld | 4,654,052,826.34 | 4.99 |
| TOTAL | 93,321,510,643.68 | 100.00 |
| Oscar Munoz |
| Affirmative | 88,183,976,568.30 | 94.49 |
| Withheld | 5,137,534,075.39 | 5.51 |
| TOTAL | 93,321,510,643.68 | 100.00 |
| Karen B. Peetz |
| Affirmative | 88,720,160,318.58 | 95.07 |
| Withheld | 4,601,350,325.11 | 4.93 |
| TOTAL | 93,321,510,643.68 | 100.00 |
| David M. Thomas |
| Affirmative | 88,471,490,747.86 | 94.80 |
| Withheld | 4,850,019,895.82 | 5.20 |
| TOTAL | 93,321,510,643.68 | 100.00 |
| Susan Tomasky |
| Affirmative | 88,536,869,646.78 | 94.87 |
| Withheld | 4,784,640,996.90 | 5.13 |
| TOTAL | 93,321,510,643.68 | 100.00 |
| Michael E. Wiley |
| Affirmative | 88,526,906,267.86 | 94.86 |
| Withheld | 4,794,604,375.83 | 5.14 |
| TOTAL | 93,321,510,643.68 | 100.00 |
| | | |
| Proposal 1 reflects trust-wide proposal and voting results. |
Item 10: Remuneration Paid to Directors, Officers, and others of Open-End Management Investment Companies
Note: This information is disclosed as part of the financial statements for each Fund as part of Item 7: Financial Statements and Financial Highlights for Open-End Management Investment companies.
Item 11: Statement Regarding Basis for Approval of Investment Advisory Contract
Board Approval of Investment Advisory Contracts and Management Fees
Fidelity Small Cap Value Fund
Each year, the Board of Trustees, including the Independent Trustees (together, the Board), considers the renewal of the fund's management contract with Fidelity Management & Research Company LLC (FMR) and the sub-advisory agreements (together, the Advisory Contracts) for the fund. FMR and the sub-advisers are referred to herein as the Investment Advisers. The Board, assisted by the advice of fund counsel and Independent Trustees' counsel, requests and considers a broad range of information relevant to the renewal of the Advisory Contracts throughout the year.
The Board meets regularly and, at each of its meetings, covers an extensive agenda of topics and materials and considers factors that are relevant to its annual consideration of the renewal of the fund's Advisory Contracts, including the services and support provided to the fund and its shareholders. The Board, acting directly and through its Committees (each of which is composed of and chaired by Independent Trustees), requests and receives information concerning the annual consideration of the renewal of the fund's Advisory Contracts. The Board also meets as needed to review matters specifically related to the Board's annual consideration of the renewal of the Advisory Contracts. Members of the Board may also meet with trustees of other Fidelity funds through joint ad hoc committees to discuss certain matters relevant to all of the Fidelity funds.
At its May 2024 meeting, the Board unanimously determined to renew the fund's Advisory Contracts. In reaching its determination, the Board considered all factors it believed relevant, including (i) the nature, extent, and quality of the services provided to the fund and its shareholders (including the investment performance of the fund); (ii) the competitiveness relative to peer funds of the fund's management fee and the total expense ratio of a representative class (the retail class, which was selected because it was the largest class without 12b-1 fees); (iii) the total costs of the services provided by and the profits realized by FMR and its affiliates (Fidelity) from its relationships with the fund; and (iv) the extent to which, if any, economies of scale exist and are realized as the fund grows, and whether any economies of scale are appropriately shared with fund shareholders. The Board also considered the broad range of investment choices available to shareholders from FMR's competitors and that the fund's shareholders have chosen to invest in the fund, which is part of the Fidelity family of funds. The Board's decision to renew the Advisory Contracts was not based on any single factor.
The Board reached a determination, with the assistance of fund counsel and Independent Trustees' counsel and through the exercise of its business judgment, that the renewal of the Advisory Contracts was in the best interests of the fund and its shareholders and that the compensation payable under the Advisory Contracts was fair and reasonable in light of all of the surrounding circumstances.
Nature, Extent, and Quality of Services Provided. The Board considered staffing as it relates to the fund, including the backgrounds and experience of investment personnel of the Investment Advisers, and also considered the Investment Advisers' implementation of the fund's investment program. The Independent Trustees also had discussions with senior management of Fidelity's investment operations and investment groups. The Board considered the structure of the investment personnel compensation program and whether this structure provides appropriate incentives to act in the best interests of the fund. Additionally, the Board considered the portfolio managers' investments, if any, in the funds that they manage.
Resources Dedicated to Investment Management and Support Services. The Board and the Fund Oversight and Research Committees reviewed the general qualifications and capabilities of Fidelity's investment staff, including its size, education, experience, and resources, as well as Fidelity's approach to recruiting, training, managing, and compensating investment personnel. The Board noted the resources devoted to expansion of Fidelity's global investment organization, and that Fidelity's analysts have extensive resources, tools, and capabilities that allow them to conduct sophisticated quantitative and fundamental analysis, as well as credit analysis of issuers, counterparties, and guarantors. Further, the Board considered that Fidelity's investment professionals have sufficient access to global information and data so as to provide competitive investment results over time, and that those professionals also have access to sophisticated tools that permit them to assess portfolio construction and risk and performance attribution characteristics continuously, as well as to transmit new information and research conclusions rapidly around the world. Additionally, in its deliberations, the Board considered Fidelity's trading, risk management, compliance, and technology and operations capabilities and resources, which are integral parts of the investment management process.
Shareholder and Administrative Services. The Board considered (i) the nature, extent, quality, and cost of advisory, administrative, shareholder, transfer agency, and pricing and bookkeeping services performed by the Investment Advisers and their affiliates under the Advisory Contracts; (ii) the nature and extent of Fidelity's supervision of third party service providers, principally custodians, subcustodians, and pricing vendors; and (iii) the resources devoted by Fidelity to, and the record of compliance with, the fund's compliance policies and procedures. The Board also reviewed the allocation of fund brokerage, including allocations to brokers affiliated with the Investment Advisers, the use of brokerage commissions to pay fund expenses, and the use of "soft" commission dollars to pay for research services. The Board also considered the fund's securities lending activities and any payments made to Fidelity relating to securities lending under a separate agreement.
The Board noted that the growth of fund assets over time across the complex allows Fidelity to reinvest in the development of services designed to enhance the value and convenience of the Fidelity funds as investment vehicles. These services include 24-hour access to account information and market information over the Internet and through telephone representatives, investor education materials, and asset allocation tools. The Board also considered that it reviews customer service metrics such as telephone response times, continuity of services on the website and metrics addressing services at Fidelity Investor Centers.
Investment in a Large Fund Family. The Board considered the benefits to shareholders of investing in a fund that is part of a large family of funds offering a variety of investment disciplines and providing a large variety of fund investor services. The Board noted that Fidelity had taken, or had made recommendations that resulted in the Fidelity funds taking, a number of actions over the previous year that benefited particular funds and/or the Fidelity funds in general.
Investment Performance. The Board took into account discussions that occur with representatives of the Investment Advisers, and reports that it receives, at Board meetings throughout the year, relating to fund investment performance. In this regard the Board noted that as part of regularly scheduled fund reviews and other reports to the Board on fund performance, the Board considered annualized return information for the fund for different time periods, measured against an appropriate securities market index (benchmark index) and an appropriate peer group of funds with similar objectives (peer group). The Board also considered information about performance attribution. In its ongoing evaluation of fund investment performance, the Board gives particular attention to information indicating changes in performance of the funds over different time periods and discussed with the Investment Advisers the reasons for any overperformance or underperformance.
In addition to reviewing absolute and relative fund performance, the Independent Trustees periodically consider the appropriateness of fund performance metrics in evaluating the results achieved. The Independent Trustees generally give greater weight to fund performance over longer time periods than over shorter time periods. Depending on the circumstances, the Independent Trustees may be satisfied with a fund's performance notwithstanding that it lags its benchmark index or peer group for certain periods.
Based on its review, the Board concluded that the nature, extent, and quality of services provided to the fund under the Advisory Contracts should continue to benefit the shareholders of the fund.
Competitiveness of Management Fee and Total Expense Ratio. The Board was provided with information regarding industry trends in management fees and expenses. The Board considered that, effective March 1, 2024, an amended Advisory Contract with FMR went into effect with class-level management fees based on tiered schedules and subject to a maximum class-level rate (the management fee). The Board also considered that in exchange for the variable management fee, each class of the fund receives investment advisory, management, administrative, transfer agent, and pricing and bookkeeping services. In its review of the management fee and total expense ratio of the retail class, the Board considered a pro forma management fee rate the retail class as if it had been in effect for the 12-month period ended September 30, 2023, as well as other third-party fund expenses, as applicable, such as custodial, legal, and audit fees and any fund-paid 12b-1 fees. The Board noted that Fidelity may agree to waive fees or reimburse expenses from time to time, and the extent to which, if any, it has done so for the fund. The Board also considered information about the impact of the fund's performance adjustment.
Comparisons of Management Fees and Total Expense Ratios. Among other things, the Board reviewed data for selected groups of competitive funds and classes (referred to as "mapped groups") that were compiled by Fidelity based on combining similar investment objective categories (as classified by Morningstar) that have comparable investment mandates. The data reviewed by the Board included (i) gross management fee comparisons (before taking into account expense reimbursements or caps and without taking into account the fund's performance adjustment) relative to the total universe of funds within the mapped group; (ii) gross management fee comparisons relative to a subset of non-Fidelity funds in the mapped group that are similar in size and management fee structure to the fund (referred to as the "asset size peer group"); (iii) total expense comparisons of the retail class of the fund relative to funds and classes in the mapped group that have a similar sales load structure to the retail class of the fund (referred to as the "similar sales load structure group"); and (iv) total expense comparisons of the retail class of the fund relative to funds and classes in the similar sales load structure group that are similar in size and management fee structure to the fund (referred to as the "total expense asset size peer group"). The total expense asset size peer group comparison excludes performance adjustments and fund-paid 12b-1 fees to eliminate variability in fee structures.
The information provided to the Board indicated that the fund's management fee rate ranked below the competitive median of the mapped group for the 12-month period ended September 30, 2023 and above the competitive median of the asset size peer group for the 12-month period ended September 30, 2023. Further, the information provided to the Board indicated that the total expense ratio of the retail class of the fund ranked below the competitive median of the similar sales load structure group for the 12-month period ended September 30, 2023 and below the competitive median of the total expense asset size peer group for the 12-month period ended September 30, 2023. The Board noted that the fund has a management fee structure that covers expenses for services beyond portfolio management and further noted that Fidelity believes that total expense ratio comparisons are more useful in this context.
The Board noted that a different variable management fee rate is applicable to each class of the fund. The Board considered that the difference in management fee rates between classes is the result of separate arrangements for class-level services and/or waivers of certain expenses and not the result of any difference in advisory or custodial fees or other expenses related to the management of the fund's assets, which do not vary by class.
The Board also considered that the fund's management fee is subject to upward or downward adjustment depending upon whether, and to what extent, the fund's investment performance for the performance period (a rolling 36-month period) exceeds, or is exceeded by, a securities index, thus leading to a performance adjustment for the same period. The Board noted that the performance adjustment provides FMR with a strong economic incentive to seek to achieve superior long-term performance for the fund's shareholders and helps to more closely align the interests of FMR and the shareholders of the fund.
In connection its consideration of the fund's performance adjustment, the Board noted that the performance of the retail class is used for purposes of determining the performance adjustment. The Board noted that to the extent the performance adjustment was based on the performance of a share class with higher total annual operating expenses, the fund would be subject to a smaller positive and larger negative performance adjustment. The Board considered the appropriateness of the use of the retail class as the basis for the performance adjustment. The Board noted that the retail class is typically the largest class (reflecting the actual investment experience for the plurality of shareholders), employs a standard expense structure, and does not include fund-paid 12b-1 fees, which Fidelity believes makes it a more appropriate measurement of Fidelity's investment skill.
Fees Charged to Other Fidelity Clients. The Board also considered Fidelity fee structures and other information with respect to clients of Fidelity, such as other funds advised or subadvised by Fidelity, pension plan clients, and other institutional clients with similar mandates. The Board noted that a joint ad hoc committee created by it and the boards of other Fidelity funds periodically reviews and compares Fidelity's institutional investment advisory business with its business of providing services to the Fidelity funds and also noted the most recent findings of the committee. The Board noted that the committee's review included a consideration of the differences in services provided, fees charged, and costs incurred, as well as competition in the markets serving the different categories of clients.
Based on its review, the Board concluded that the fund's management fee, including the use of the retail class as the basis for the performance adjustment, is fair and reasonable in light of the services that the fund receives and the other factors considered. Further, based on its review of total expense ratios and fees charged to other Fidelity clients, the Board concluded that the total expense ratio of each class of the fund was reasonable in light of the services that the fund and its shareholders receive and the other factors considered.
Costs of the Services and Profitability. The Board considered the revenues earned and the expenses incurred by Fidelity in conducting the business of developing, marketing, distributing, managing, administering and servicing the fund and servicing the fund's shareholders. The Board also considered the level of Fidelity's profits in respect of all the Fidelity funds.
On an annual basis, Fidelity presents to the Board information about the profitability of its relationships with the fund. Fidelity calculates profitability information for each fund, as well as aggregate profitability information for groups of Fidelity funds and all Fidelity funds, using a series of detailed revenue and cost allocation methodologies which originate with the books and records of Fidelity on which Fidelity's audited financial statements are based. The Audit Committee of the Board reviews any significant changes from the prior year's methodologies and the full Board approves such changes.
A public accounting firm has been engaged annually by the Board as part of the Board's assessment of Fidelity's profitability analysis. The engagement includes the review and assessment of the methodologies used by Fidelity in determining the revenues and expenses attributable to Fidelity's fund business, and completion of agreed-upon procedures in respect of the mathematical accuracy of certain fund profitability information and its conformity to established allocation methodologies. After considering the reports issued under the engagement and information provided by Fidelity, the Board concluded that while other allocation methods may also be reasonable, Fidelity's profitability methodologies are reasonable in all material respects.
The Board also reviewed Fidelity's non-fund businesses and potential indirect benefits such businesses may have received as a result of their association with Fidelity's fund business (i.e., fall-out benefits) as well as cases where Fidelity's affiliates may benefit from the funds' business. The Board considered areas where potential indirect benefits to the Fidelity funds from their relationships with Fidelity may exist. The Board's consideration of these matters was informed by the findings of a joint ad hoc committee created by it and the boards of other Fidelity funds to evaluate potential fall-out benefits.
The Board considered the costs of the services provided by and the profits realized by Fidelity in connection with the operation of the fund and was satisfied that the profitability was not excessive.
Economies of Scale. The Board considered whether there have been economies of scale in respect of the management of the Fidelity funds, whether the Fidelity funds (including the fund) have appropriately benefited from any such economies of scale, and whether there is potential for realization of any further economies of scale. The Board considered the extent to which the fund will benefit from economies of scale as assets grow through increased services to the fund, through waivers or reimbursements, or through fee or expense ratio reductions. The Board also noted that a committee created by it and the boards of other Fidelity funds periodically analyzes whether Fidelity attains economies of scale in respect of the management and servicing of the Fidelity funds, whether the Fidelity funds have appropriately benefited from such economies of scale, and whether there is potential for realization of any further economies of scale.
The Board recognized that the fund's management contract incorporates a variable management fee structure, which provides breakpoints as a way to share, in part, any potential economies of scale that may exist at the asset class level and through a discount that considers both fund size and total assets of the four applicable asset classes. The Board considered that the variable management fee is designed to deliver the benefits of economies of scale to fund shareholders even if assets of any particular fund are unchanged or have declined, because some portion of Fidelity's costs are attributable to services provided to all funds subject to the variable management fee, and all such funds benefit if those costs can be allocated among more assets. The Board concluded that, given the variable management fee structure, fund shareholders will benefit from lower management fees due to the application of the breakpoints and discount factor, regardless of whether Fidelity achieves any such economies of scale.
The Board concluded, taking into account the analysis of the committee, that economies of scale, if any, are being appropriately shared between fund shareholders and Fidelity.
Additional Information Requested by the Board. In order to develop fully the factual basis for consideration of the Fidelity funds' advisory contracts, the Board requested and received additional information on certain topics, including but not limited to: (i) fund flow and performance trends, in particular the underperformance of certain funds and strategies, and Fidelity's long-term strategies for certain funds; (ii) the operation of performance fees and the rationale for implementing performance fees on certain categories of funds but not others; (iii) Fidelity's pricing philosophy compared to competitors; (iv) fund profitability methodology and data; (v) evaluation of competitive fund data and peer group classifications and fee and expense comparisons; (vi) the management fee and expense structures for different funds and classes and information about the differences between various fee and expense structures; (vii) the variable management fee implemented for certain funds effective March 1, 2024; and (viii) information regarding other accounts managed by Fidelity and the funds' sub-advisory arrangements.
Conclusion. Based on its evaluation of all of the conclusions noted above, and after considering all factors it believed relevant, the Board, including the Independent Trustees, concluded that the advisory and sub-advisory fee arrangements are fair and reasonable in light of all of the surrounding circumstances and that the fund's Advisory Contracts should be renewed through May 31, 2025.
1.803706.119
SCV-ANN-0924
Fidelity® Real Estate Income Fund
Annual Report
July 31, 2024
Includes Fidelity and Fidelity Advisor share classes
Contents
To view a fund's proxy voting guidelines and proxy voting record for the 12-month period ended June 30, visit http://www.fidelity.com/proxyvotingresults or visit the Securities and Exchange Commission's (SEC) web site at http://www.sec.gov.
You may also call 1-800-544-8544 if you're an individual investing directly with Fidelity, call 1-800-835-5092 if you're a plan sponsor or participant with Fidelity as your recordkeeper or call 1-877-208-0098 on institutional accounts or if you're an advisor or invest through one to request a free copy of the proxy voting guidelines.
Standard & Poor's, S&P and S&P 500 are registered service marks of The McGraw-Hill Companies, Inc. and have been licensed for use by Fidelity Distributors Corporation.
Other third-party marks appearing herein are the property of their respective owners.
All other marks appearing herein are registered or unregistered trademarks or service marks of FMR LLC or an affiliated company. © 2024 FMR LLC. All rights reserved.
This report and the financial statements contained herein are submitted for the general information of the shareholders of the Fund. This report is not authorized for distribution to prospective investors in the Fund unless preceded or accompanied by an effective prospectus.
A fund files its complete schedule of portfolio holdings with the SEC for the first and third quarters of each fiscal year on Form N-PORT. Forms N-PORT are available on the SEC's web site at http://www.sec.gov. A fund's Forms N-PORT may be reviewed and copied at the SEC's Public Reference Room in Washington, DC. Information regarding the operation of the SEC's Public Reference Room may be obtained by calling 1-800-SEC-0330.
For a complete list of a fund's portfolio holdings, view the most recent holdings listing, semiannual report, or annual report on Fidelity's web site at http://www.fidelity.com, http://www.institutional.fidelity.com, or http://www.401k.com, as applicable.
NOT FDIC INSURED •MAY LOSE VALUE •NO BANK GUARANTEE
Neither the Fund nor Fidelity Distributors Corporation is a bank.
Item 7: Financial Statements and Financial Highlights for Open-End Management Investment Companies (Annual Report)
Fidelity® Real Estate Income Fund
Schedule of Investments July 31, 2024
Showing Percentage of Net Assets
| Common Stocks - 23.8% |
| | | Shares | Value ($) |
| FINANCIALS - 0.8% | | | |
| Mortgage Real Estate Investment Trusts - 0.8% | | | |
| Dynex Capital, Inc. | | 1,260,300 | 15,337,851 |
| Great Ajax Corp. | | 1,275,264 | 4,476,177 |
| MFA Financial, Inc. | | 1,231,885 | 13,784,793 |
| Rithm Capital Corp. | | 385,699 | 4,477,965 |
| | | | 38,076,786 |
| INDUSTRIALS - 0.0% | | | |
| Construction & Engineering - 0.0% | | | |
| Willscot Holdings Corp. (a) | | 58,900 | 2,414,900 |
| REAL ESTATE - 23.0% | | | |
| Equity Real Estate Investment Trusts (REITs) - 22.9% | | | |
| Acadia Realty Trust (SBI) | | 646,626 | 13,992,987 |
| American Homes 4 Rent Class A | | 519,600 | 18,752,364 |
| American Tower Corp. | | 532,300 | 117,318,911 |
| AvalonBay Communities, Inc. | | 94,500 | 19,364,940 |
| Brixmor Property Group, Inc. | | 373,400 | 9,510,498 |
| Crown Castle, Inc. | | 573,510 | 63,131,981 |
| CubeSmart | | 335,600 | 15,967,848 |
| Digital Realty Trust, Inc. | | 51,700 | 7,728,633 |
| Easterly Government Properties, Inc. | | 998,900 | 13,914,677 |
| EastGroup Properties, Inc. | | 55,600 | 10,396,644 |
| Elme Communities (SBI) | | 755,647 | 12,437,950 |
| Equinix, Inc. | | 85,000 | 67,170,400 |
| Equity Lifestyle Properties, Inc. | | 1,311,596 | 90,080,413 |
| Equity Residential (SBI) | | 96,200 | 6,698,406 |
| Essex Property Trust, Inc. | | 138,800 | 38,636,368 |
| Extra Space Storage, Inc. | | 198,049 | 31,612,581 |
| First Industrial Realty Trust, Inc. | | 115,000 | 6,292,800 |
| Gaming & Leisure Properties | | 354,946 | 17,818,289 |
| Healthcare Realty Trust, Inc. | | 186,360 | 3,296,708 |
| Invitation Homes, Inc. | | 917,500 | 32,360,225 |
| Kimco Realty Corp. | | 1,198,600 | 26,045,578 |
| Lamar Advertising Co. Class A | | 150,700 | 18,062,902 |
| LXP Industrial Trust (REIT) | | 3,254,074 | 33,516,962 |
| Mid-America Apartment Communities, Inc. | | 100,106 | 13,991,816 |
| NNN (REIT), Inc. | | 63,000 | 2,828,070 |
| Postal Realty Trust, Inc. Class A | | 878,500 | 13,142,360 |
| Prologis, Inc. | | 588,830 | 74,222,022 |
| Public Storage Operating Co. | | 174,300 | 51,578,856 |
| Realty Income Corp. | | 389,382 | 22,362,208 |
| Retail Opportunity Investments Corp. | | 74,700 | 1,116,765 |
| Retail Value, Inc. (a)(b) | | 274,131 | 3 |
| Rexford Industrial Realty, Inc. (c) | | 67,700 | 3,392,447 |
| RLJ Lodging Trust | | 272,400 | 2,571,456 |
| Sabra Health Care REIT, Inc. | | 604,175 | 9,805,760 |
| SITE Centers Corp. | | 1,379,438 | 21,312,317 |
| Sun Communities, Inc. | | 62,900 | 7,971,317 |
| Terreno Realty Corp. | | 263,828 | 18,048,473 |
| UDR, Inc. | | 250,900 | 10,053,563 |
| UMH Properties, Inc. | | 335,723 | 5,962,440 |
| Ventas, Inc. | | 934,186 | 50,857,086 |
| VICI Properties, Inc. | | 1,197,700 | 37,440,102 |
| Welltower, Inc. | | 627,800 | 69,842,750 |
| Weyerhaeuser Co. | | 147,500 | 4,684,600 |
| | | | 1,095,293,476 |
| Real Estate Management & Development - 0.1% | | | |
| Cushman & Wakefield PLC (a) | | 201,400 | 2,640,354 |
| Digitalbridge Group, Inc. | | 76,688 | 1,083,601 |
| | | | 3,723,955 |
TOTAL REAL ESTATE | | | 1,099,017,431 |
| TOTAL COMMON STOCKS (Cost $815,182,645) | | | 1,139,509,117 |
| | | | |
| Preferred Stocks - 14.5% |
| | | Shares | Value ($) |
| Convertible Preferred Stocks - 0.5% | | | |
| REAL ESTATE - 0.5% | | | |
| Equity Real Estate Investment Trusts (REITs) - 0.5% | | | |
| LXP Industrial Trust (REIT) Series C, 6.50% | | 440,102 | 20,024,641 |
| RLJ Lodging Trust Series A, 1.95% | | 31,585 | 789,625 |
| | | | 20,814,266 |
| Nonconvertible Preferred Stocks - 14.0% | | | |
| ENERGY - 0.3% | | | |
| Oil, Gas & Consumable Fuels - 0.3% | | | |
| Enbridge, Inc.: | | | |
| Series 1, U.S. TREASURY 5 YEAR INDEX + 3.140% 5.949%(d)(e) | | 498,275 | 11,006,895 |
| Series L, U.S. TREASURY 5 YEAR INDEX + 3.150% 4.959%(d)(e) | | 111,400 | 2,378,390 |
| Global Partners LP Series B, 9.50% | | 67,800 | 1,784,503 |
| | | | 15,169,788 |
| FINANCIALS - 6.8% | | | |
| Mortgage Real Estate Investment Trusts - 6.8% | | | |
| AGNC Investment Corp.: | | | |
| 6.125% | | 930,100 | 22,387,507 |
| Series C, CME Term SOFR 3 Month Index + 5.110% 7.00%(d)(e) | | 653,202 | 16,754,631 |
| Series E, 6.50% | | 1,202,034 | 29,828,474 |
| Series G, 7.75% | | 320,000 | 7,795,200 |
| Annaly Capital Management, Inc.: | | | |
| 6.75%(d) | | 192,992 | 4,963,754 |
| Series F, CME Term SOFR 3 Month Index + 4.990% 6.95%(d)(e) | | 1,452,443 | 37,211,590 |
| Series G, CME Term SOFR 3 Month Index + 4.430% 6.50%(d)(e) | | 1,069,599 | 27,157,119 |
| Arbor Realty Trust, Inc.: | | | |
| Series D, 6.375% | | 126,100 | 2,247,102 |
| Series F, 6.25%(d) | | 447,536 | 8,543,462 |
| Chimera Investment Corp. Series C, 7.75% (d) | | 958,562 | 21,347,176 |
| Dynex Capital, Inc. Series C 6.90% | | 298,683 | 7,416,299 |
| Ellington Financial LLC 6.75% (d) | | 212,370 | 5,245,539 |
| MFA Financial, Inc.: | | | |
| 6.50%(d) | | 838,551 | 19,370,528 |
| Series B, 7.50% | | 211,532 | 4,569,091 |
| PennyMac Mortgage Investment Trust: | | | |
| 6.75% | | 217,700 | 4,208,141 |
| 8.125%(d) | | 195,481 | 4,697,408 |
| Series B, U.S. TREASURY 3 MO INDEX + 5.990% 8.00%(d)(e) | | 380,732 | 9,082,362 |
| Rithm Capital Corp.: | | | |
| 7.125%(d) | | 1,023,942 | 25,578,071 |
| Series A, 7.50%(d) | | 505,904 | 12,796,639 |
| Series C, 6.375%(d) | | 1,074,554 | 25,563,640 |
| Series D, 7.00%(d) | | 151,200 | 3,501,792 |
| Two Harbors Investment Corp.: | | | |
| Series A, 8.125%(d) | | 363,526 | 8,706,448 |
| Series B, 7.625%(d) | | 776,859 | 17,595,856 |
| | | | 326,567,829 |
| REAL ESTATE - 6.9% | | | |
| Equity Real Estate Investment Trusts (REITs) - 5.2% | | | |
| Agree Realty Corp. 4.25% | | 259,800 | 4,756,938 |
| American Homes 4 Rent: | | | |
| 6.25% | | 98,905 | 2,346,027 |
| Series G, 5.875% | | 249,550 | 5,682,254 |
| Armada Hoffler Properties, Inc. 6.75% | | 255,050 | 5,529,484 |
| Ashford Hospitality Trust, Inc.: | | | |
| Series F, 7.375% | | 34,000 | 547,400 |
| Series H, 7.50% | | 38,365 | 617,677 |
| Series I, 7.50% | | 71,209 | 1,159,995 |
| Braemar Hotels & Resorts, Inc. Series D, 8.25% | | 173,050 | 3,261,993 |
| Cedar Realty Trust, Inc.: | | | |
| 7.25% | | 126,972 | 1,758,562 |
| Series C, 6.50% | | 291,600 | 3,726,648 |
| Centerspace Series C, 6.625% | | 317,300 | 7,745,293 |
| CTO Realty Growth, Inc. 6.375% | | 120,000 | 2,623,800 |
| DiamondRock Hospitality Co. 8.25% | | 448,231 | 11,219,222 |
| Digital Realty Trust, Inc.: | | | |
| 5.25% | | 32,900 | 714,259 |
| Series L, 5.20% | | 33,700 | 726,909 |
| Gladstone Commercial Corp.: | | | |
| 6.625% | | 157,675 | 3,461,755 |
| Series G, 6.00% | | 391,000 | 7,894,290 |
| Gladstone Land Corp. Series D, 5.00% | | 30,000 | 730,500 |
| Global Medical REIT, Inc. Series A, 7.50% | | 150,848 | 3,713,878 |
| Global Net Lease, Inc.: | | | |
| 7.50% | | 721,484 | 15,872,648 |
| Series A, 7.25% | | 509,695 | 10,948,249 |
| Series B 6.875% | | 294,000 | 5,982,900 |
| Series E, 7.375% | | 379,839 | 8,489,402 |
| Healthcare Trust, Inc.: | | | |
| 7.125% | | 190,000 | 2,789,200 |
| Series A 7.375% | | 364,800 | 5,399,040 |
| Hudson Pacific Properties, Inc. Series C, 4.75% | | 686,200 | 8,996,082 |
| Kimco Realty Corp.: | | | |
| 5.125% | | 49,000 | 1,052,030 |
| Series M, 5.25% | | 58,100 | 1,270,647 |
| National Storage Affiliates Trust Series A, 6.00% | | 101,375 | 2,269,786 |
| Pebblebrook Hotel Trust: | | | |
| 6.30% | | 281,697 | 5,864,932 |
| 6.375% | | 372,994 | 7,877,633 |
| 6.375% | | 666,800 | 13,422,684 |
| Series H, 5.70% | | 717,200 | 12,909,600 |
| Prologis, Inc. Series Q, 8.54% | | 93,396 | 5,281,544 |
| Public Storage Operating Co.: | | | |
| 4.00% | | 47,800 | 836,022 |
| 4.00% | | 45,700 | 796,094 |
| Series F, 5.15% | | 25,800 | 596,496 |
| Series G, 5.05% | | 43,800 | 987,690 |
| Series L, 4.625% | | 35,900 | 729,890 |
| Series M, 4.125% | | 28,000 | 511,840 |
| Series S, 4.10% | | 100,000 | 1,806,340 |
| Realty Income Corp. 6.00% | | 121,125 | 2,951,816 |
| Regency Centers Corp.: | | | |
| 5.875% | | 69,225 | 1,522,258 |
| Series A, 6.25% | | 281,325 | 6,498,608 |
| Rexford Industrial Realty, Inc.: | | | |
| Series B, 5.875% | | 98,400 | 2,170,704 |
| Series C, 5.625% | | 78,225 | 1,674,015 |
| Saul Centers, Inc.: | | | |
| Series D, 6.125% | | 57,775 | 1,201,720 |
| Series E, 6.00% | | 76,841 | 1,570,630 |
| SITE Centers Corp. 6.375% | | 124,200 | 2,872,746 |
| Sotherly Hotels, Inc.: | | | |
| Series B, 8.00% | | 67,250 | 1,242,780 |
| Series C, 7.875% | | 107,000 | 2,006,250 |
| Summit Hotel Properties, Inc.: | | | |
| Series E, 6.25% | | 457,602 | 9,426,601 |
| Series F, 5.875% | | 377,000 | 7,660,640 |
| Sunstone Hotel Investors, Inc.: | | | |
| Series H, 6.125% | | 180,000 | 3,879,000 |
| Series I, 5.70% | | 240,000 | 4,773,600 |
| UMH Properties, Inc. Series D, 6.375% | | 694,525 | 16,564,421 |
| Vornado Realty Trust: | | | |
| Series L, 5.40% | | 30,100 | 469,560 |
| Series M, 5.25% | | 2,000 | 30,440 |
| | | | 249,423,422 |
| Real Estate Management & Development - 1.7% | | | |
| Brookfield Property Partners LP: | | | |
| 5.75% | | 43,000 | 543,090 |
| 6.50% | | 34,125 | 509,486 |
| Digitalbridge Group, Inc.: | | | |
| Series H, 7.125% | | 942,305 | 21,503,400 |
| Series I, 7.15% | | 1,074,492 | 24,219,050 |
| Series J, 7.15% | | 1,362,346 | 30,611,915 |
| Seritage Growth Properties Series A, 7.00% | | 91,986 | 1,849,838 |
| | | | 79,236,779 |
TOTAL REAL ESTATE | | | 328,660,201 |
| | | | |
| TOTAL NONCONVERTIBLE PREFERRED STOCKS | | | 670,397,818 |
| TOTAL PREFERRED STOCKS (Cost $742,311,702) | | | 691,212,084 |
| | | | |
| Corporate Bonds - 30.3% |
| | | Principal Amount (f) | Value ($) |
| Convertible Bonds - 0.4% | | | |
| FINANCIALS - 0.4% | | | |
| Mortgage Real Estate Investment Trusts - 0.4% | | | |
| PennyMac Corp. 5.5% 11/1/24 | | 13,601,000 | 13,424,187 |
| Two Harbors Investment Corp. 6.25% 1/15/26 | | 4,896,000 | 4,749,120 |
| | | | 18,173,307 |
| Nonconvertible Bonds - 29.9% | | | |
| COMMUNICATION SERVICES - 0.1% | | | |
| Media - 0.1% | | | |
| Lamar Media Corp. 4% 2/15/30 | | 5,875,000 | 5,418,803 |
| | | | |
| CONSUMER DISCRETIONARY - 3.3% | | | |
| Hotels, Restaurants & Leisure - 2.0% | | | |
| Caesars Entertainment, Inc. 8.125% 7/1/27 (g) | | 17,465,000 | 17,839,785 |
| Choice Hotels International, Inc. 5.85% 8/1/34 | | 7,000,000 | 7,034,108 |
| Hilton Domestic Operating Co., Inc.: | | | |
| 3.625% 2/15/32(g) | | 13,965,000 | 12,231,163 |
| 4% 5/1/31(g) | | 12,000,000 | 10,869,192 |
| Hilton Grand Vacations Borrower Escrow LLC 4.875% 7/1/31 (g) | | 18,265,000 | 16,445,464 |
| Hyatt Hotels Corp. 5.5% 6/30/34 | | 5,000,000 | 5,009,548 |
| Marriott Ownership Resorts, Inc. 4.5% 6/15/29 (g) | | 15,960,000 | 14,842,660 |
| Sugarhouse HSP Gaming Prop Mezz LP/Sugarhouse HSP Gaming Finance Corp. 5.875% 5/15/25 (g) | | 8,000,000 | 7,952,730 |
| Times Square Hotel Trust 8.528% 8/1/26 (g) | | 2,093,931 | 2,089,689 |
| | | | 94,314,339 |
| Household Durables - 1.3% | | | |
| Ashton Woods U.S.A. LLC/Ashton Woods Finance Co. 6.625% 1/15/28 (g) | | 7,925,000 | 7,965,061 |
| Century Communities, Inc.: | | | |
| 3.875% 8/15/29(g) | | 13,005,000 | 11,857,288 |
| 6.75% 6/1/27 | | 4,670,000 | 4,696,698 |
| LGI Homes, Inc. 4% 7/15/29 (g) | | 13,310,000 | 11,916,045 |
| M/I Homes, Inc. 3.95% 2/15/30 | | 17,070,000 | 15,522,106 |
| TRI Pointe Homes, Inc. 5.25% 6/1/27 | | 11,458,000 | 11,367,964 |
| | | | 63,325,162 |
TOTAL CONSUMER DISCRETIONARY | | | 157,639,501 |
| | | | |
| ENERGY - 0.2% | | | |
| Oil, Gas & Consumable Fuels - 0.2% | | | |
| EG Global Finance PLC 12% 11/30/28 (g) | | 10,000,000 | 10,707,630 |
| | | | |
| FINANCIALS - 0.1% | | | |
| Financial Services - 0.1% | | | |
| Rexford Industrial Realty LP 2.15% 9/1/31 | | 6,188,000 | 5,051,661 |
| | | | |
| HEALTH CARE - 0.4% | | | |
| Health Care Providers & Services - 0.4% | | | |
| Sabra Health Care LP: | | | |
| 3.9% 10/15/29 | | 989,000 | 914,915 |
| 5.125% 8/15/26 | | 17,264,000 | 17,178,062 |
| | | | 18,092,977 |
| INDUSTRIALS - 0.2% | | | |
| Commercial Services & Supplies - 0.2% | | | |
| Williams Scotsman, Inc.: | | | |
| 6.125% 6/15/25(g) | | 3,240,000 | 3,241,685 |
| 6.625% 6/15/29(g) | | 5,000,000 | 5,091,447 |
| | | | 8,333,132 |
| REAL ESTATE - 25.6% | | | |
| Equity Real Estate Investment Trusts (REITs) - 22.7% | | | |
| Agree LP: | | | |
| 2.6% 6/15/33 | | 6,100,000 | 4,914,611 |
| 2.9% 10/1/30 | | 1,500,000 | 1,323,883 |
| 4.8% 10/1/32 | | 1,288,000 | 1,239,943 |
| 5.625% 6/15/34 | | 372,000 | 377,698 |
| American Homes 4 Rent LP: | | | |
| 2.375% 7/15/31 | | 9,000,000 | 7,490,360 |
| 3.625% 4/15/32 | | 27,000,000 | 24,211,972 |
| 4.9% 2/15/29 | | 13,000,000 | 12,936,966 |
| 5.5% 2/1/34 | | 20,000,000 | 20,130,805 |
| 5.5% 7/15/34 | | 47,000 | 47,313 |
| American Tower Corp.: | | | |
| 2.7% 4/15/31 | | 2,000,000 | 1,736,105 |
| 3.8% 8/15/29 | | 23,000,000 | 21,906,313 |
| 4.05% 3/15/32 | | 27,000,000 | 25,366,314 |
| 5.45% 2/15/34 | | 29,000,000 | 29,569,102 |
| 5.55% 7/15/33 | | 23,000,000 | 23,575,005 |
| 5.65% 3/15/33 | | 20,000,000 | 20,624,886 |
| 5.9% 11/15/33 | | 5,000,000 | 5,254,074 |
| Boston Properties, Inc.: | | | |
| 3.25% 1/30/31 | | 8,000,000 | 6,939,530 |
| 6.75% 12/1/27 | | 37,000 | 38,496 |
| Brixmor Operating Partnership LP: | | | |
| 2.5% 8/16/31 | | 9,000,000 | 7,577,248 |
| 4.05% 7/1/30 | | 4,000,000 | 3,801,353 |
| 4.125% 5/15/29 | | 1,872,000 | 1,801,067 |
| 5.5% 2/15/34 | | 10,000,000 | 10,042,991 |
| CBL & Associates LP: | | | |
| 4.6%(b)(h) | | 18,229,000 | 2 |
| 5.25%(b)(h) | | 11,371,000 | 1 |
| 5.95%(b)(h) | | 10,317,000 | 1 |
| Crown Castle, Inc.: | | | |
| 2.1% 4/1/31 | | 4,000,000 | 3,322,501 |
| 2.25% 1/15/31 | | 14,000,000 | 11,825,466 |
| 2.5% 7/15/31 | | 10,000,000 | 8,471,130 |
| 3.8% 2/15/28 | | 2,000,000 | 1,926,430 |
| 5% 1/11/28 | | 3,000,000 | 3,009,661 |
| 5.1% 5/1/33 | | 35,000,000 | 34,822,314 |
| 5.8% 3/1/34 | | 30,000,000 | 31,175,874 |
| CTR Partnership LP/CareTrust Capital Corp. 3.875% 6/30/28 (g) | | 21,865,000 | 20,429,209 |
| CubeSmart LP: | | | |
| 2.5% 2/15/32 | | 10,000,000 | 8,443,284 |
| 4.375% 2/15/29 | | 12,000,000 | 11,734,131 |
| EPR Properties: | | | |
| 3.6% 11/15/31 | | 2,000,000 | 1,732,343 |
| 4.95% 4/15/28 | | 8,000,000 | 7,830,668 |
| Equinix Europe 2 Financing Corp. LLC 5.5% 6/15/34 | | 5,000,000 | 5,103,292 |
| Equinix, Inc.: | | | |
| 3.2% 11/18/29 | | 10,000,000 | 9,240,379 |
| 3.9% 4/15/32 | | 28,000,000 | 26,103,382 |
| Global Net Lease, Inc. / Global Net Lease Operating Partnership LP 3.75% 12/15/27 (g) | | 5,075,000 | 4,593,071 |
| GLP Capital LP/GLP Financing II, Inc.: | | | |
| 4% 1/15/30 | | 3,000,000 | 2,799,114 |
| 4% 1/15/31 | | 2,000,000 | 1,829,869 |
| 5.3% 1/15/29 | | 19,193,000 | 19,155,846 |
| 5.625% 9/15/34 | | 5,000,000 | 4,978,260 |
| 6.25% 9/15/54 | | 7,000,000 | 7,022,547 |
| 6.75% 12/1/33 | | 4,500,000 | 4,826,808 |
| Hudson Pacific Properties LP 4.65% 4/1/29 | | 6,000,000 | 5,060,598 |
| Invitation Homes Operating Partnership LP: | | | |
| 4.15% 4/15/32 | | 35,000,000 | 32,653,003 |
| 5.5% 8/15/33 | | 23,000,000 | 23,223,980 |
| Kimco Realty OP, LLC: | | | |
| 4.6% 2/1/33 | | 9,000,000 | 8,697,644 |
| 6.4% 3/1/34 | | 13,424,000 | 14,587,942 |
| Kite Realty Group LP 5.5% 3/1/34 | | 9,007,000 | 9,042,637 |
| LXP Industrial Trust (REIT): | | | |
| 2.375% 10/1/31 | | 7,500,000 | 6,113,609 |
| 2.7% 9/15/30 | | 1,422,000 | 1,230,869 |
| 6.75% 11/15/28 | | 1,000,000 | 1,051,406 |
| MPT Operating Partnership LP/MPT Finance Corp.: | | | |
| 3.5% 3/15/31 | | 6,000,000 | 3,942,208 |
| 4.625% 8/1/29 | | 19,835,000 | 14,394,941 |
| 5% 10/15/27 | | 5,000,000 | 4,099,497 |
| Necessity Retail REIT, Inc./American Finance Operating Partnership LP 4.5% 9/30/28 (g) | | 13,405,000 | 12,204,661 |
| NNN (REIT), Inc. 5.6% 10/15/33 | | 9,575,000 | 9,775,122 |
| Omega Healthcare Investors, Inc.: | | | |
| 3.25% 4/15/33 | | 18,000,000 | 14,986,460 |
| 3.375% 2/1/31 | | 5,000,000 | 4,408,022 |
| Park Intermediate Holdings LLC / PK Domestic Property LLC / PK Finance Co.-Issuer: | | | |
| 4.875% 5/15/29(g) | | 7,000,000 | 6,614,341 |
| 7% 2/1/30(g) | | 3,115,000 | 3,170,966 |
| Phillips Edison Grocery Center Operating Partnership I LP: | | | |
| 2.625% 11/15/31 | | 16,500,000 | 13,756,489 |
| 5.75% 7/15/34 | | 7,000 | 7,103 |
| Prologis LP: | | | |
| 5% 3/15/34 | | 10,000,000 | 10,021,490 |
| 5.125% 1/15/34 | | 5,000,000 | 5,062,307 |
| 5.25% 6/15/53 | | 10,000,000 | 9,709,951 |
| 5.25% 3/15/54 | | 3,000,000 | 2,900,648 |
| Public Storage Operating Co.: | | | |
| 5.1% 8/1/33 | | 10,000,000 | 10,136,938 |
| 5.35% 8/1/53 | | 9,000,000 | 8,942,939 |
| Realty Income Corp.: | | | |
| 3.4% 1/15/30 | | 12,000,000 | 11,196,610 |
| 4% 7/15/29 | | 3,000,000 | 2,900,753 |
| 5.625% 10/13/32 | | 5,000,000 | 5,191,713 |
| Regency Centers LP 5.25% 1/15/34 | | 5,000,000 | 5,012,650 |
| RHP Hotel Properties LP/RHP Finance Corp. 6.5% 4/1/32 (g) | | 8,000,000 | 8,090,368 |
| RLJ Lodging Trust LP: | | | |
| 3.75% 7/1/26(g) | | 4,000,000 | 3,818,471 |
| 4% 9/15/29(g) | | 4,835,000 | 4,314,506 |
| Safehold Operating Partnership LP: | | | |
| 2.8% 6/15/31 | | 7,000,000 | 5,988,308 |
| 2.85% 1/15/32 | | 18,250,000 | 15,377,607 |
| 6.1% 4/1/34 | | 22,410,000 | 23,033,061 |
| SBA Communications Corp.: | | | |
| 3.125% 2/1/29 | | 25,000,000 | 22,633,945 |
| 3.875% 2/15/27 | | 5,000,000 | 4,813,992 |
| Simon Property Group LP: | | | |
| 5.85% 3/8/53 | | 9,000,000 | 9,199,324 |
| 6.25% 1/15/34 | | 15,000,000 | 16,193,844 |
| 6.65% 1/15/54 | | 5,000,000 | 5,677,478 |
| Sun Communities Operating LP: | | | |
| 2.7% 7/15/31 | | 9,000,000 | 7,611,073 |
| 4.2% 4/15/32 | | 18,439,000 | 16,933,190 |
| 5.5% 1/15/29 | | 9,000,000 | 9,135,535 |
| 5.7% 1/15/33 | | 28,750,000 | 28,946,375 |
| UDR, Inc. 3% 8/15/31 | | 1,500,000 | 1,329,633 |
| Uniti Group LP/Uniti Fiber Holdings, Inc./CSL Capital LLC 6% 1/15/30 (g) | | 18,035,000 | 12,921,105 |
| Uniti Group LP/Uniti Group Finance, Inc./CSL Capital LLC: | | | |
| 6.5% 2/15/29(g) | | 27,505,000 | 20,789,137 |
| 10.5% 2/15/28(g) | | 7,000,000 | 7,080,139 |
| Ventas Realty LP: | | | |
| 2.5% 9/1/31 | | 1,500,000 | 1,263,704 |
| 4.4% 1/15/29 | | 17,000,000 | 16,686,649 |
| 4.75% 11/15/30 | | 4,000,000 | 3,938,624 |
| 5.625% 7/1/34 | | 5,000,000 | 5,118,287 |
| 5.7% 9/30/43 | | 3,000,000 | 2,948,655 |
| VICI Properties LP: | | | |
| 4.75% 2/15/28 | | 5,000,000 | 4,942,134 |
| 5.125% 5/15/32 | | 38,000,000 | 37,051,699 |
| 5.625% 5/15/52 | | 11,000,000 | 10,114,998 |
| 5.75% 4/1/34 | | 575,000 | 583,615 |
| 6.125% 4/1/54 | | 8,532,000 | 8,429,794 |
| VICI Properties LP / VICI Note Co. 4.625% 12/1/29 (g) | | 26,000,000 | 25,033,115 |
| Welltower OP LLC 4.125% 3/15/29 | | 3,000,000 | 2,918,923 |
| WP Carey, Inc.: | | | |
| 2.25% 4/1/33 | | 5,000,000 | 4,001,896 |
| 2.45% 2/1/32 | | 2,000,000 | 1,657,091 |
| 3.85% 7/15/29 | | 3,000,000 | 2,856,496 |
| 5.375% 6/30/34 | | 7,000,000 | 6,986,245 |
| XHR LP 4.875% 6/1/29 (g) | | 10,000,000 | 9,436,197 |
| | | | 1,089,234,328 |
| Real Estate Management & Development - 2.9% | | | |
| CBRE Group, Inc. 5.95% 8/15/34 | | 27,250,000 | 28,592,102 |
| CoStar Group, Inc. 2.8% 7/15/30 (g) | | 2,000,000 | 1,741,475 |
| Cushman & Wakefield U.S. Borrower LLC 6.75% 5/15/28 (g) | | 11,165,000 | 11,187,208 |
| Digital Realty Trust LP: | | | |
| 3.6% 7/1/29 | | 5,000,000 | 4,721,160 |
| 3.7% 8/15/27 | | 5,000,000 | 4,837,473 |
| Essex Portfolio LP: | | | |
| 2.55% 6/15/31 | | 2,000,000 | 1,711,890 |
| 2.65% 3/15/32 | | 3,000,000 | 2,543,885 |
| 5.5% 4/1/34 | | 12,077,000 | 12,282,340 |
| Extra Space Storage LP: | | | |
| 2.35% 3/15/32 | | 12,000,000 | 9,811,051 |
| 2.55% 6/1/31 | | 2,000,000 | 1,700,819 |
| 5.4% 2/1/34 | | 12,000,000 | 12,099,886 |
| 5.5% 7/1/30 | | 5,000,000 | 5,144,584 |
| 5.9% 1/15/31 | | 9,000,000 | 9,372,380 |
| Forestar Group, Inc. 5% 3/1/28 (g) | | 5,000,000 | 4,813,317 |
| Howard Hughes Corp. 5.375% 8/1/28 (g) | | 2,515,000 | 2,438,904 |
| Kennedy-Wilson, Inc.: | | | |
| 4.75% 3/1/29 | | 12,075,000 | 10,627,065 |
| 4.75% 2/1/30 | | 8,130,000 | 6,948,475 |
| 5% 3/1/31 | | 6,960,000 | 5,873,837 |
| Taylor Morrison Communities, Inc./Monarch Communities, Inc. 5.875% 6/15/27 (g) | | 1,798,000 | 1,805,332 |
| | | | 138,253,183 |
TOTAL REAL ESTATE | | | 1,227,487,511 |
| | | | |
| TOTAL NONCONVERTIBLE BONDS | | | 1,432,731,215 |
| TOTAL CORPORATE BONDS (Cost $1,448,704,328) | | | 1,450,904,522 |
| | | | |
| Asset-Backed Securities - 1.7% |
| | | Principal Amount (f) | Value ($) |
| American Homes 4 Rent Series 2015-SFR2: | | | |
| Class E, 6.07% 10/17/52 (g) | | 8,259,000 | 8,249,292 |
| Class XS, 0% 10/17/52 (b)(d)(g)(i) | | 4,433,536 | 44 |
| Capital Trust RE CDO Ltd. Series 2005-1A Class D, CME Term SOFR 1 Month Index + 1.610% 3.3464% 3/20/50 (b)(d)(e)(g) | | 2,250,000 | 0 |
| Crest Clarendon Street 2002-1 Ltd. Series 2002-1A Class PS, 12/28/35 (b)(g) | | 500,000 | 0 |
| Home Partners of America Trust: | | | |
| Series 2019-2 Class F, 3.866% 10/19/39 (g) | | 2,751,934 | 2,509,925 |
| Series 2021-1 Class F, 3.325% 9/17/41 (g) | | 6,562,219 | 5,333,605 |
| Series 2021-2 Class G, 4.505% 12/17/26 (g) | | 27,687,707 | 25,119,093 |
| Series 2021-3 Class F, 4.242% 1/17/41 (g) | | 9,871,099 | 8,632,181 |
| New Residential Mortgage Loan Trust Series 2022-SFR2 Class E1, 4% 9/4/39 (g) | | 2,900,000 | 2,633,157 |
| Retained Vantage Data Ctrs Iss Series 2023-2A Class A2, 5.05% 9/15/48 (g) | | 4,000,000 | 3,810,229 |
| Switch Abs Issuer LLC Series 2024-2A Class C, 10.033% 6/25/54 (g) | | 8,000,000 | 8,100,193 |
| Tricon American Homes Series 2018-SFR1 Class F, 4.96% 5/17/37 (g) | | 8,282,000 | 8,188,232 |
| Tricon Residential 2023-Sfr1 T Series 2023-SFR1: | | | |
| Class D, 5.1% 7/17/40 (g) | | 5,000,000 | 4,829,799 |
| Class E, 7.977% 7/17/40 (g) | | 2,000,000 | 2,038,123 |
| Tricon Residential Trust Series 2021-SFR1 Class G, 4.133% 7/17/38 (g) | | 3,000,000 | 2,760,725 |
| TOTAL ASSET-BACKED SECURITIES (Cost $89,314,659) | | | 82,204,598 |
| | | | |
| Collateralized Mortgage Obligations - 0.0% |
| | | Principal Amount (f) | Value ($) |
| U.S. Government Agency - 0.0% | | | |
| Fannie Mae REMIC Trust: | | | |
| Series 2002-W1 subordinate REMIC pass thru certificates, Class 3B3, 3.676% 2/25/42 (d)(g) | | 20,184 | 8,598 |
| Series 2003-W10 subordinate REMIC pass thru certificates, Class 2B3, 3.8566% 6/25/43 (b)(d)(g) | | 34,368 | 25,037 |
| TOTAL COLLATERALIZED MORTGAGE OBLIGATIONS (Cost $33,185) | | | 33,635 |
| | | | |
| Commercial Mortgage Securities - 22.6% |
| | | Principal Amount (f) | Value ($) |
| BANK sequential payer: | | | |
| Series 2022-BNK42 Class D, 2.5% 6/15/55 (g) | | 2,000,000 | 1,388,045 |
| Series 2022-BNK42, Class A5, 4.493% 6/15/55 (d) | | 15,000,000 | 14,461,448 |
| Series 2022-BNK43 Class A5, 4.399% 8/15/55 | | 10,485,000 | 9,984,095 |
| Series 2022-BNK44, Class A5, 5.7446% 11/15/55 (d) | | 15,900,000 | 16,664,351 |
| Bank sequential payer Series 2023-BNK46 Class A4, 5.745% 8/15/56 | | 1,409,000 | 1,471,014 |
| BANK: | | | |
| Series 2017-BNK8 Class E, 2.8% 11/15/50 (g) | | 11,374,393 | 4,563,525 |
| Series 2020-BN30 Class MCDG, 2.9182% 12/15/53 (d) | | 2,000,000 | 945,546 |
| Series 2021-BN38 Class C, 3.2176% 12/15/64 (d) | | 3,505,000 | 2,752,849 |
| Series 2022-BNK41, Class C, 3.7902% 4/15/65 (d) | | 4,433,000 | 3,613,609 |
| Series 2022-BNK42 Class C, 4.88% 6/15/55 (d) | | 6,500,000 | 5,765,131 |
| Series 2022-BNK44 Class A/S, 5.9362% 11/15/55 (d) | | 5,000,000 | 5,119,040 |
| Bank Series 2023-BNK46 Class A/S, 6.385% 8/15/56 | | 5,000,000 | 5,293,847 |
| Bank of America Commercial Mortgage Trust Series 2016-UB10 Class C, 4.8241% 7/15/49 (d) | | 3,030,000 | 2,879,200 |
| Bank5 2023-5Yr3 Series 2023-5YR3: | | | |
| Class A/S, 7.3153% 9/15/56 (d) | | 1,500,000 | 1,599,701 |
| Class B, 7.3153% 9/15/56 (d) | | 2,000,000 | 2,117,320 |
| Bank5 2023-5Yr4 Series 2023-5YR4 Class A/S, 7.274% 12/15/56 (d) | | 5,000,000 | 5,302,678 |
| BBCMS Mortgage Trust: | | | |
| sequential payer: | | | |
Series 2022-C17: | | | |
| Class C, 5.45% 9/15/55 | | 2,000,000 | 1,854,212 |
| Class D, 2.5% 9/15/55 (g) | | 2,000,000 | 1,293,526 |
Series 2023-C19 Class A5, 5.451% 4/15/56 | | 22,500,000 | 23,099,432 |
Series 2023-C20 Class A5, 5.576% 7/15/56 | | 24,250,000 | 25,204,417 |
Series 2023-C21 Class A/S, 6.2965% 9/15/56 (d) | | 7,000,000 | 7,463,880 |
Series 2023-C22: | | | |
| Class A/S, 7.1258% 11/15/56 (d) | | 10,000,000 | 11,348,608 |
| Class B, 7.1258% 11/15/56 (d) | | 10,000,000 | 11,097,376 |
| Series 2020-C6 Class C, 3.045% 2/15/53 | | 1,129,000 | 930,925 |
| Series 2020-C7 Class C, 3.6014% 4/15/53 (d) | | 2,067,000 | 1,468,292 |
| Series 2022-C16 Class C, 4.6% 6/15/55 (b)(d) | | 5,250,000 | 4,440,931 |
| Series 2023-5C23 Class A/S, 7.4547% 12/15/56 (d) | | 2,500,000 | 2,690,935 |
| Series 2023-C21 Class B, 6.2965% 9/15/56 (d) | | 7,000,000 | 7,317,190 |
| Benchmark 2023-V3 Mtg Trust Series 2023-V3 Class A/S, 7.0967% 7/15/56 | | 10,000,000 | 10,497,584 |
| Benchmark Mortgage Trust: | | | |
| sequential payer: | | | |
Series 2019-B14: | | | |
| Class 225D, 3.2943% 12/15/62 (d)(g) | | 3,427,000 | 70,705 |
| Class 225E, 3.2943% 12/15/62 (d)(g) | | 5,141,000 | 50,774 |
Series 2021-B28 Class A5, 2.2237% 8/15/54 | | 500,000 | 416,704 |
Series 2022-B34 Class A5, 3.786% 4/15/55 | | 10,168,402 | 9,070,729 |
Series 2022-B35 Class A5, 4.4439% 5/15/55 (d) | | 12,302,000 | 11,585,251 |
Series 2022-B36 Class A5, 4.4699% 7/15/55 | | 4,900,000 | 4,709,065 |
Series 2023-B38 Class A4, 5.5246% 4/15/56 | | 21,000,000 | 21,705,806 |
Series 2023-B39 Class A5, 5.7536% 7/15/56 | | 5,000,000 | 5,248,843 |
Series 2023-C5 Class A5, 5.7653% 6/15/56 | | 22,850,000 | 23,966,373 |
| Series 2020-B18 Class AGNG, 4.3885% 7/15/53 (d)(g) | | 11,379,000 | 10,342,800 |
| Series 2022-B35 Class C, 4.5921% 5/15/55 (d) | | 7,000,000 | 5,591,041 |
| Series 2022-B36: | | | |
Class C, 5.2896% 7/15/55 (b)(d) | | 2,000,000 | 1,680,863 |
Class D, 2.5% 7/15/55 (g) | | 3,828,000 | 2,341,345 |
| Series 2023-B39 Class B, 6.192% 7/15/56 (g) | | 5,000,000 | 5,155,940 |
| Series 2023-C5 Class B, 6.4756% 6/15/56 (d) | | 4,750,000 | 5,018,083 |
| BMO Mortgage Trust: | | | |
| sequential payer Series 2023-C6 Class A5, 5.9562% 9/15/56 | | 14,000,000 | 14,883,985 |
| Series 2023-5C1 Class A/S, 7.3549% 8/15/56 (d) | | 3,500,000 | 3,687,078 |
| Series 2023-5C2 Class A5, 7.244% 11/15/56 (d) | | 10,000,000 | 10,658,221 |
| Series 2023-C6 Class A/S, 6.5504% 9/15/56 (d) | | 5,000,000 | 5,373,171 |
| Series 2023-C7 Class A/S, 6.6738% 12/15/56 (d) | | 5,000,000 | 5,416,736 |
| Bx 2024 Vlt4 floater Series 2024-VLT4: | | | |
| Class E, CME Term SOFR 1 Month Index + 2.880% 8.2182% 7/15/29 (d)(e)(g) | | 14,200,000 | 14,175,690 |
| Class F, CME Term SOFR 1 Month Index + 3.930% 9.2667% 7/15/29 (d)(e)(g) | | 8,250,000 | 8,126,250 |
| BX Commercial Mortgage Trust: | | | |
| floater: | | | |
Series 2019-IMC Class G, CME Term SOFR 1 Month Index + 3.640% 8.9753% 4/15/34 (d)(e)(g) | | 5,181,000 | 4,958,481 |
Series 2021-CIP Class F, CME Term SOFR 1 Month Index + 3.330% 8.6625% 12/15/38 (d)(e)(g) | | 7,730,434 | 7,518,194 |
Series 2021-PAC Class G, CME Term SOFR 1 Month Index + 3.060% 8.3896% 10/15/36 (d)(e)(g) | | 17,232,000 | 16,620,536 |
Series 2021-SOAR Class J, CME Term SOFR 1 Month Index + 3.860% 9.1935% 6/15/38 (d)(e)(g) | | 16,662,402 | 16,419,927 |
Series 2021-VINO Class G, CME Term SOFR 1 Month Index + 4.060% 9.3958% 5/15/38 (d)(e)(g) | | 11,520,072 | 11,306,491 |
Series 2021-VOLT: | | | |
| Class F, CME Term SOFR 1 Month Index + 2.510% 7.8433% 9/15/36 (d)(e)(g) | | 10,000,000 | 9,831,250 |
| Class G, CME Term SOFR 1 Month Index + 2.960% 8.2933% 9/15/36 (d)(e)(g) | | 5,000,000 | 4,902,994 |
Series 2022-LBA6: | | | |
| Class F, CME Term SOFR 1 Month Index + 3.350% 8.6788% 1/15/39 (d)(e)(g) | | 6,200,000 | 6,080,067 |
| Class G, CME Term SOFR 1 Month Index + 4.200% 9.5288% 1/15/39 (d)(e)(g) | | 11,340,000 | 11,121,595 |
Series 2024-XL5 Class E, CME Term SOFR 1 Month Index + 3.680% 9.0172% 3/15/41 (d)(e)(g) | | 4,890,811 | 4,867,471 |
| Series 2019-OC11 Class E, 3.944% 12/9/41 (d)(g) | | 22,521,000 | 19,488,072 |
| Series 2020-VIVA Class E, 3.5488% 3/11/44 (d)(g) | | 20,898,990 | 17,375,544 |
| BX Commercial Mortgage Trust 2024-Xl4 floater Series 2024-XL4: | | | |
| Class D, CME Term SOFR 1 Month Index + 3.130% 8.4684% 2/15/39 (d)(e)(g) | | 9,849,570 | 9,828,024 |
| Class E, CME Term SOFR 1 Month Index + 4.180% 9.5169% 2/15/39 (d)(e)(g) | | 4,924,785 | 4,902,388 |
| Bx Commercial Mtg Trust 2024-King floater Series 2024-KING Class E, CME Term SOFR 1 Month Index + 3.680% 9.0168% 5/15/34 (d)(e)(g) | | 2,000,000 | 1,990,112 |
| BX Trust floater: | | | |
| Series 2021-ACNT Class G, CME Term SOFR 1 Month Index + 3.400% 8.7385% 11/15/38 (d)(e)(g) | | 14,626,376 | 14,367,826 |
| Series 2022-VAMF Class F, CME Term SOFR 1 Month Index + 3.290% 8.6278% 1/15/39 (d)(e)(g) | | 4,367,000 | 4,215,701 |
| Series 2024-CNYN Class E, CME Term SOFR 1 Month Index + 3.680% 9.0174% 4/15/41 (d)(e)(g) | | 17,884,390 | 17,804,781 |
| BXP Trust Series 2021-601L Class E, 2.7755% 1/15/44 (d)(g) | | 5,754,000 | 3,744,654 |
| CD Mortgage Trust: | | | |
| Series 2017-CD3 Class D, 3.25% 2/10/50 (b)(g) | | 3,353,000 | 1,089,726 |
| Series 2017-CD4 Class D, 3.3% 5/10/50 (g) | | 2,769,000 | 2,243,928 |
| Series 2019-CD4 Class C, 4.3497% 5/10/50 (d) | | 3,000,000 | 2,690,797 |
| Citigroup Commercial Mortgage Trust: | | | |
| sequential payer Series 2023-V2 Class A3, 5.8524% 10/12/40 (d)(g) | | 5,000,000 | 4,954,828 |
| Series 2022-GC48 Class E, 2.5% 6/15/55 (g) | | 2,000,000 | 1,175,907 |
| Series 2023-PRM3: | | | |
Class B, 6.3597% 7/10/28 (d)(g) | | 5,000,000 | 5,069,848 |
Class C, 6.3597% 7/10/28 (d)(g) | | 5,500,000 | 5,501,600 |
| Series 2023-SMRT Class C, 5.8524% 10/12/40 (d)(g) | | 9,750,000 | 9,533,134 |
| COMM Mortgage Trust: | | | |
| floater Series 2018-HCLV: | | | |
Class F, CME Term SOFR 1 Month Index + 3.340% 8.675% 9/15/33 (d)(e)(g) | | 4,265,000 | 2,073,277 |
Class G, CME Term SOFR 1 Month Index + 5.350% 10.6813% 9/15/33 (d)(e)(g) | | 4,265,000 | 1,582,802 |
| sequential payer Series 2013-LC6 Class E, 3.5% 1/10/46 (g) | | 4,741,000 | 4,276,306 |
| Series 2012-CR1: | | | |
Class D, 5.1372% 5/15/45 (d)(g) | | 1,416,611 | 1,121,248 |
Class G, 2.462% 5/15/45 (g) | | 2,169,265 | 29,087 |
| Series 2014-UBS2 Class D, 4.826% 3/10/47 (d)(g) | | 3,713,000 | 2,949,712 |
| COMM Trust Series 2017-COR2 Class D, 3% 9/10/50 (g) | | 2,769,000 | 2,209,410 |
| Cone Trust 2024-Dfw1 floater Series 2024-DFW1 Class E, CME Term SOFR 1 Month Index + 3.880% 9.1885% 8/15/26 (d)(e)(g) | | 10,200,000 | 10,180,822 |
| Credit Suisse Commercial Mortgage Trust floater Series 2021-SOP2 Class F, CME Term SOFR 1 Month Index + 4.330% 9.7602% 6/15/34 (b)(e)(g) | | 7,120,000 | 2,346,538 |
| Credit Suisse Mortgage Trust: | | | |
| floater Series 2021-BPNY Class A, CME Term SOFR 1 Month Index + 3.820% 9.1579% 8/15/26 (d)(e)(g) | | 18,000,000 | 16,242,246 |
| Series 2021-BRIT Class A, CME Term SOFR 1 Month Index + 3.570% 8.9027% 5/9/25 (d)(e)(g) | | 7,813,560 | 7,502,397 |
| DTP Commercial Mortgage Trust 2023-Ste2 sequential payer Series 2023-STE2 Class C, 6.4734% 1/15/41 (d)(g) | | 8,800,000 | 8,816,649 |
| ELP Commercial Mortgage Trust floater Series 2021-ELP Class J, CME Term SOFR 1 Month Index + 3.720% 9.0584% 11/15/38 (d)(e)(g) | | 15,430,040 | 14,927,274 |
| Eqt Trust 2024-Extr Series 2024-EXTR Class B, 1 month U.S. LIBOR + 0.000% 5.6546% 7/5/41 (d)(e)(g) | | 5,000,000 | 5,028,797 |
| GS Mortgage Securities Trust: | | | |
| floater Series 2018-RIVR Class G, CME Term SOFR 1 Month Index + 2.640% 8.226% 7/15/35 (d)(e)(g) | | 3,808,000 | 41,850 |
| sequential payer Series 2023-SHIP: | | | |
Class D, 6.0706% 9/10/38 (d)(g) | | 9,000,000 | 8,859,972 |
Class E, 7.4336% 9/10/38 (d)(g) | | 18,500,000 | 18,477,580 |
| Series 2011-GC5: | | | |
Class C, 5.15% 8/10/44 (d)(g) | | 8,899,000 | 6,850,695 |
Class D, 5.15% 8/10/44 (d)(g) | | 2,733,635 | 1,298,208 |
Class E, 5.15% 8/10/44 (d)(g) | | 8,138,000 | 916,678 |
Class F, 4.5% 8/10/44 (b)(g) | | 7,897,000 | 23,691 |
| Series 2012-GCJ9: | | | |
Class D, 4.6009% 11/10/45 (d)(g) | | 4,531,578 | 4,125,991 |
Class E, 4.6009% 11/10/45 (d)(g) | | 1,908,000 | 1,591,157 |
| Hilton U.S.A. Trust Series 2016-HHV Class F, 4.1935% 11/5/38 (d)(g) | | 20,270,000 | 18,985,741 |
| Independence Plaza Trust Series 2018-INDP Class E, 4.996% 7/10/35 (g) | | 2,896,000 | 2,635,302 |
| JPMBB Commercial Mortgage Securities Trust: | | | |
| Series 2014-C23 Class UH5, 4.7094% 9/15/47 (g) | | 8,640,000 | 8,143,606 |
| Series 2014-C26 Class D, 3.851% 1/15/48 (d)(g) | | 2,398,000 | 1,870,466 |
| JPMDB Commercial Mortgage Securities Trust: | | | |
| sequential payer Series 2019-COR6 Class A4, 3.0565% 11/13/52 | | 8,000,000 | 6,852,030 |
| Series 2018-C8 Class D, 3.2573% 6/15/51 (d)(g) | | 1,698,000 | 1,215,942 |
| JPMorgan Chase Commercial Mortgage Securities Trust: | | | |
| sequential payer Series 2021-1MEM Class E, 2.6535% 10/9/42 (d)(g) | | 9,552,000 | 5,706,464 |
| Series 2011-C3: | | | |
Class E, 5.5252% 2/15/46 (d)(g) | | 13,774,000 | 5,372,817 |
Class G, 4.409% 2/15/46 (d)(g) | | 4,671,000 | 443,743 |
Class H, 4.409% 2/15/46 (b)(d)(g) | | 7,077,000 | 489,268 |
| Series 2012-CBX: | | | |
Class E, 4.6896% 6/15/45 (d)(g) | | 4,108,129 | 3,768,399 |
Class F, 4% 6/15/45 (b)(g) | | 8,192,000 | 6,799,360 |
Class G 4% 6/15/45 (b)(g) | | 4,044,000 | 2,300,421 |
| Series 2013-LC11: | | | |
Class D, 4.1582% 4/15/46 (d) | | 7,722,000 | 3,430,885 |
Class E, 3.25% 4/15/46 (b)(d)(g) | | 472,000 | 91,946 |
Class F, 3.25% 4/15/46 (b)(d)(g) | | 2,518,000 | 102,231 |
| Series 2014-DSTY Class E, 3.8046% 6/10/27 (b)(d)(g) | | 8,161,000 | 19,905 |
| Series 2018-AON Class F, 4.6132% 7/5/31 (d)(g) | | 5,039,000 | 1,093,816 |
| Series 2020-NNN Class FFX, 4.6254% 1/16/37 (g) | | 2,000,000 | 620,180 |
| KNDR Trust floater Series 2021-KIND Class F, CME Term SOFR 1 Month Index + 4.060% 9.3945% 8/15/38 (d)(e)(g) | | 7,096,721 | 6,777,634 |
| Mcr 2024-Twa Mtg Trust sequential payer Series 2024-TWA Class F, 10.382% 6/12/39 (g) | | 5,500,000 | 5,538,458 |
| Merit floater Series 2021-STOR Class J, CME Term SOFR 1 Month Index + 4.060% 9.3935% 7/15/38 (d)(e)(g) | | 3,476,000 | 3,416,143 |
| MHC Commercial Mortgage Trust floater Series 2021-MHC Class G, CME Term SOFR 1 Month Index + 3.310% 8.6444% 4/15/38 (d)(e)(g) | | 13,087,315 | 12,923,908 |
| MHP Commercial Mortgage Trust floater Series 2022-MHIL: | | | |
| Class F, CME Term SOFR 1 Month Index + 3.250% 8.588% 1/15/27 (d)(e)(g) | | 3,924,498 | 3,870,536 |
| Class G, CME Term SOFR 1 Month Index + 3.950% 9.2863% 1/15/27 (d)(e)(g) | | 13,149,119 | 13,048,088 |
| Mira Trust 2023-Mile sequential payer Series 2023-MILE Class B, 7.2026% 6/10/38 (g) | | 4,200,000 | 4,276,219 |
| Morgan Stanley BAML Trust: | | | |
| Series 2012-C6 Class D, 4.3596% 11/15/45 (b)(d)(g) | | 2,000,000 | 1,610,000 |
| Series 2012-C6, Class F, 4.3596% 11/15/45 (d)(g) | | 2,500,000 | 375,000 |
| Series 2013-C12 Class D, 4.8042% 10/15/46 (d)(g) | | 5,670,988 | 4,922,952 |
| Series 2013-C9: | | | |
Class C, 3.7233% 5/15/46 (d) | | 3,302,000 | 2,873,035 |
Class D, 3.8113% 5/15/46 (d)(g) | | 5,137,000 | 4,263,710 |
| Morgan Stanley Capital I Trust: | | | |
| sequential payer Series 2024-BPR2 Class A, 7.291% 5/5/29 (g) | | 8,985,862 | 9,275,288 |
| Series 2011-C2: | | | |
Class D, 5.2113% 6/15/44 (d)(g) | | 2,492,000 | 2,391,323 |
Class F, 5.2113% 6/15/44 (d)(g) | | 4,440,000 | 2,574,159 |
Class XB, 0.4665% 6/15/44 (d)(g)(i) | | 27,511,935 | 94,418 |
| Series 2011-C3: | | | |
Class E, 4.943% 7/15/49 (d)(g) | | 1,093,909 | 1,070,849 |
Class F, 4.943% 7/15/49 (d)(g) | | 5,624,050 | 5,145,807 |
Class G, 4.943% 7/15/49 (d)(g) | | 5,049,500 | 4,325,627 |
| Series 2015-MS1 Class D, 4.023% 5/15/48 (d)(g) | | 10,833,000 | 7,597,203 |
| Series 2016-BNK2 Class C, 3% 11/15/49 (g) | | 2,966,000 | 1,472,636 |
| Series 2017-H1 Class C, 4.281% 6/15/50 | | 2,470,594 | 2,232,474 |
| Series 2020-L4, Class C, 3.536% 2/15/53 | | 2,765,000 | 2,220,376 |
| MSJP Commercial Securities Mortgage Trust Series 2015-HAUL Class E, 4.851% 9/5/47 (d)(g) | | 1,500,000 | 1,246,238 |
| MSWF Commercial Mortgage Trust sequential payer: | | | |
| Series 2023-1: | | | |
Class A5, 5.752% 5/15/56 | | 16,000,000 | 16,720,685 |
Class B, 6.6828% 5/15/56 (d) | | 3,750,000 | 4,065,596 |
| Series 2023-2: | | | |
Class AS, 6.491% 12/15/56 | | 10,000,000 | 10,713,814 |
Class B, 6.8762% 12/15/56 (d) | | 10,000,000 | 10,811,877 |
| Natixis Commercial Mortgage Securities Trust Series 2020-2PAC Class AMZ3, 3.5% 1/15/37 (b)(d)(g) | | 2,502,675 | 1,265,595 |
| Open Trust 2023-Air sequential payer Series 2023-AIR Class D, CME Term SOFR 1 Month Index + 6.680% 12.0125% 10/15/28 (d)(e)(g) | | 8,761,269 | 8,783,172 |
| OPG Trust floater Series 2021-PORT: | | | |
| Class G, CME Term SOFR 1 Month Index + 2.510% 7.8415% 10/15/36 (d)(e)(g) | | 4,529,850 | 4,459,071 |
| Class J, CME Term SOFR 1 Month Index + 3.460% 8.7895% 10/15/36 (d)(e)(g) | | 8,113,300 | 7,890,184 |
| PKHL Commercial Mortgage Trust floater Series 2021-MF: | | | |
| Class E, CME Term SOFR 1 Month Index + 2.710% 8.0435% 7/15/38 (d)(e)(g) | | 500,000 | 384,029 |
| Class G, CME Term SOFR 1 Month Index + 4.460% 9.7935% 7/15/38 (b)(d)(e)(g) | | 5,944,000 | 3,677,021 |
| Prima Capital CRE Securitization Ltd. Series 2020-8A Class C, 3% 12/26/70 (g) | | 9,277,000 | 7,355,733 |
| Prima Capital Ltd. floater Series 2021-9A Class C, CME Term SOFR 1 Month Index + 2.460% 7.8057% 12/15/37 (d)(e)(g) | | 2,861,848 | 2,867,974 |
| Providence Place Group Ltd. Partnership Series 2000-C1 Class A2, 7.75% 7/20/28 (g) | | 2,319,489 | 2,364,145 |
| SG Commercial Mortgage Securities Trust Series 2020-COVE Class F, 3.7276% 3/15/37 (d)(g) | | 5,000,000 | 4,442,178 |
| SMRT Commercial Mortgage Trust floater Series 2022-MINI Class F, CME Term SOFR 1 Month Index + 3.350% 8.679% 1/15/39 (d)(e)(g) | | 14,615,000 | 13,750,254 |
| SREIT Trust floater: | | | |
| Series 2021-IND Class G, CME Term SOFR 1 Month Index + 3.380% 8.7093% 10/15/38 (d)(e)(g) | | 12,754,000 | 12,228,489 |
| Series 2021-MFP Class G, CME Term SOFR 1 Month Index + 3.080% 8.4171% 11/15/38 (d)(e)(g) | | 3,706,887 | 3,668,189 |
| Series 2021-MFP2 Class J, CME Term SOFR 1 Month Index + 4.020% 9.359% 11/15/36 (d)(e)(g) | | 10,872,000 | 10,629,751 |
| STWD Trust floater sequential payer Series 2021-LIH: | | | |
| Class E, CME Term SOFR 1 Month Index + 3.010% 8.346% 11/15/36 (d)(e)(g) | | 4,985,000 | 4,886,908 |
| Class F, CME Term SOFR 1 Month Index + 3.660% 8.994% 11/15/36 (d)(e)(g) | | 15,282,000 | 15,014,548 |
| Class G, CME Term SOFR 1 Month Index + 4.310% 9.643% 11/15/36 (d)(e)(g) | | 9,177,000 | 8,932,769 |
| SUMIT Mortgage Trust Series 2022-BVUE: | | | |
| Class D, 2.8925% 2/12/41 (d)(g) | | 6,000,000 | 4,223,122 |
| Class F, 2.8925% 2/12/41 (d)(g) | | 3,211,000 | 2,019,028 |
| TPGI Trust floater Series 2021-DGWD Class G, CME Term SOFR 1 Month Index + 3.960% 9.2945% 6/15/26 (d)(e)(g) | | 5,846,400 | 5,811,951 |
| UBS Commercial Mortgage Trust Series 2012-C1: | | | |
| Class E, 5% 5/10/45 (d)(g) | | 4,699,074 | 4,356,211 |
| Class F, 5% 5/10/45 (b)(d)(g) | | 2,221,350 | 535,237 |
| UBS-BAMLL Trust Series 12-WRM Class D, 4.238% 6/10/30 (d)(g) | | 2,143,000 | 1,746,329 |
| VASA Trust: | | | |
| floater Series 2021-VASA Class G, CME Term SOFR 1 Month Index + 5.110% 10.4435% 7/15/39 (d)(e)(g) | | 800,000 | 364,932 |
| floater sequential payer Series 2021-VASA Class F, CME Term SOFR 1 Month Index + 4.010% 9.3435% 7/15/39 (d)(e)(g) | | 6,685,000 | 3,450,566 |
| Wells Fargo Commercial Mortgag Series 2024-1CHI Class D, 6.7085% 7/15/35 (d)(g) | | 5,250,000 | 5,220,539 |
| Wells Fargo Commercial Mortgage Trust: | | | |
| Series 2016-BNK1 Class D, 3% 8/15/49 (g) | | 6,979,000 | 2,994,093 |
| Series 2016-NXS6 Class D, 3.059% 11/15/49 (g) | | 5,037,000 | 4,298,902 |
| Series 2019-C52 Class C, 3.561% 8/15/52 | | 883,000 | 718,423 |
| WF-RBS Commercial Mortgage Trust: | | | |
| sequential payer Series 2011-C4I Class G, 5% 6/15/44 (b)(d) | | 3,955,000 | 312,750 |
| Series 2011-C3 Class D, 5.8545% 3/15/44 (d)(g) | | 503,530 | 181,271 |
| Series 2013-C11 Class E, 4.0617% 3/15/45 (d)(g) | | 4,727,000 | 3,000,801 |
| Series 2013-C13 Class D, 4.0084% 5/15/45 (d)(g) | | 3,648,049 | 3,243,115 |
| WP Glimcher Mall Trust Series 2015-WPG: | | | |
| Class PR1, 3.516% 6/5/35 (d)(g) | | 6,725,000 | 5,550,471 |
| Class PR2, 3.516% 6/5/35 (d)(g) | | 2,541,000 | 2,040,856 |
| TOTAL COMMERCIAL MORTGAGE SECURITIES (Cost $1,188,950,421) | | | 1,081,445,605 |
| | | | |
| Bank Loan Obligations - 2.4% |
| | | Principal Amount (f) | Value ($) |
| COMMUNICATION SERVICES - 0.6% | | | |
| Diversified Telecommunication Services - 0.0% | | | |
| Frontier Communications Holdings LLC Tranche B 1LN, term loan CME Term SOFR 1 Month Index + 3.500% 8.763% 7/1/31 (d)(e)(j) | | 1,435,000 | 1,443,079 |
| Wireless Telecommunication Services - 0.6% | | | |
| SBA Senior Finance II, LLC Tranche B 1LN, term loan CME Term SOFR 1 Month Index + 2.000% 7.35% 1/27/31 (d)(e)(j) | | 25,869,271 | 25,901,608 |
TOTAL COMMUNICATION SERVICES | | | 27,344,687 |
| CONSUMER DISCRETIONARY - 0.6% | | | |
| Hotels, Restaurants & Leisure - 0.6% | | | |
| BRE/Everbright M6 Borrower LLC Tranche B 1LN, term loan CME Term SOFR 1 Month Index + 5.000% 10.4496% 9/9/26 (d)(e)(j) | | 7,785,120 | 7,785,120 |
| Caesars Entertainment, Inc. Tranche B1 1LN, term loan CME Term SOFR 1 Month Index + 2.750% 8.0973% 2/6/31 (d)(e)(j) | | 4,423,913 | 4,427,850 |
| Hilton Grand Vacations Borrower LLC Tranche B 1LN, term loan: | | | |
| CME Term SOFR 1 Month Index + 2.750% 7.5937% 1/17/31 (d)(e)(j) | | 3,990,000 | 3,992,155 |
| CME Term SOFR 1 Month Index + 3.000% 7.8439% 8/2/28 (d)(e)(j) | | 994,885 | 995,353 |
| Hilton Worldwide Finance LLC Tranche B 1LN, term loan CME Term SOFR 1 Month Index + 1.750% 7.0996% 11/8/30 (d)(e)(j) | | 13,500,000 | 13,525,380 |
| | | | 30,725,858 |
| ENERGY - 0.2% | | | |
| Oil, Gas & Consumable Fuels - 0.2% | | | |
| New Fortress Energy, Inc. Tranche B 1LN, term loan CME Term SOFR 1 Month Index + 5.000% 10.2521% 10/30/28 (d)(e)(j) | | 9,950,000 | 9,794,581 |
| FINANCIALS - 0.9% | | | |
| Capital Markets - 0.2% | | | |
| CQP Holdco LP Tranche B 1LN, term loan CME Term SOFR 1 Month Index + 2.250% 7.5846% 12/31/30 (d)(e)(j) | | 9,975,000 | 9,990,860 |
| Financial Services - 0.7% | | | |
| Agellan Portfolio 9% 8/7/25 (b)(j) | | 6,611,000 | 6,611,000 |
| MHP Commercial Mortgage Trust U.S. Secured Overnight Fin. Rate (SOFR) Index + 5.000% 10.3288% 1/9/25 (b)(d)(e)(j) | | 23,154,831 | 22,344,411 |
| Sunbelt Mezz U.S. Secured Overnight Fin. Rate (SOFR) Index + 4.450% 9.9075% 1/21/27 (b)(d)(e)(j) | | 2,310,520 | 2,310,520 |
| | | | 31,265,931 |
TOTAL FINANCIALS | | | 41,256,791 |
| REAL ESTATE - 0.1% | | | |
| Real Estate Management & Development - 0.1% | | | |
| Cushman & Wakefield U.S. Borrower LLC Tranche B 1LN, term loan: | | | |
| CME Term SOFR 1 Month Index + 2.750% 8.2082% 8/21/25 (d)(e)(j) | | 130,922 | 130,881 |
| CME Term SOFR 1 Month Index + 3.000% 8.3437% 1/31/30 (d)(e)(j) | | 2,618,005 | 2,618,005 |
| CME Term SOFR 1 Month Index + 3.750% 9.0937% 1/31/30 (d)(e)(j) | | 2,284,275 | 2,289,986 |
| | | | 5,038,872 |
| TOTAL BANK LOAN OBLIGATIONS (Cost $114,239,051) | | | 114,160,789 |
| | | | |
| Preferred Securities - 0.8% |
| | | Principal Amount (f) | Value ($) |
| ENERGY - 0.1% | | | |
| Oil, Gas & Consumable Fuels - 0.1% | | | |
| Energy Transfer LP 7.125% (d)(k) | | 6,000,000 | 6,071,487 |
| FINANCIALS - 0.7% | | | |
| Financial Services - 0.0% | | | |
| Crest Dartmouth Street 2003-1 Ltd. Series 2003-1A Class PS, 6/28/38 (b)(g) | | 1,220,000 | 12 |
| Mortgage Real Estate Investment Trusts - 0.7% | | | |
| AGNC Investment Corp. CME Term SOFR 3 Month Index + 4.330% 0% 12/31/99 (d)(e) | | 673,972 | 16,930,177 |
| Chimera Investment Corp. Series B, CME Term SOFR 3 Month Index + 6.050% 11.3508% 12/31/99 (d)(e) | | 673,204 | 16,661,799 |
| | | | 33,591,976 |
TOTAL FINANCIALS | | | 33,591,988 |
| TOTAL PREFERRED SECURITIES (Cost $38,624,335) | | | 39,663,475 |
| | | | |
| Money Market Funds - 3.6% |
| | | Shares | Value ($) |
| Fidelity Cash Central Fund 5.39% (l) | | 170,533,679 | 170,567,786 |
| Fidelity Securities Lending Cash Central Fund 5.39% (l)(m) | | 3,110,664 | 3,110,975 |
| TOTAL MONEY MARKET FUNDS (Cost $173,646,229) | | | 173,678,761 |
| | | | |
| TOTAL INVESTMENT IN SECURITIES - 99.7% (Cost $4,611,006,555) | 4,772,812,586 |
NET OTHER ASSETS (LIABILITIES) - 0.3% | 13,954,302 |
| NET ASSETS - 100.0% | 4,786,766,888 |
| | |
Legend
| (c) | Security or a portion of the security is on loan at period end. |
| (d) | Coupon rates for floating and adjustable rate securities reflect the rates in effect at period end. |
| (e) | Coupon is indexed to a floating interest rate which may be multiplied by a specified factor and/or subject to caps or floors. |
| (f) | Amount is stated in United States dollars unless otherwise noted. |
| (g) | Security exempt from registration under Rule 144A of the Securities Act of 1933. These securities may be resold in transactions exempt from registration, normally to qualified institutional buyers. At the end of the period, the value of these securities amounted to $1,079,176,909 or 22.5% of net assets. |
| (h) | Non-income producing - Security is in default. |
| (i) | Interest Only (IO) security represents the right to receive only monthly interest payments on an underlying pool of mortgages or assets. Principal shown is the outstanding par amount of the pool as of the end of the period. |
| (j) | Remaining maturities of bank loan obligations may be less than the stated maturities shown as a result of contractual or optional prepayments by the borrower. Such prepayments cannot be predicted with certainty. |
| (k) | Security is perpetual in nature with no stated maturity date. |
| (l) | Affiliated fund that is generally available only to investment companies and other accounts managed by Fidelity Investments. The rate quoted is the annualized seven-day yield of the fund at period end. A complete unaudited listing of the fund's holdings as of its most recent quarter end is available upon request. In addition, each Fidelity Central Fund's financial statements, which are not covered by the Fund's Report of Independent Registered Public Accounting Firm, are available on the SEC's website or upon request. |
| (m) | Investment made with cash collateral received from securities on loan. |
Affiliated Central Funds
Fiscal year to date information regarding the Fund's investments in Fidelity Central Funds, including the ownership percentage, is presented below.
| Affiliate | Value, beginning of period ($) | Purchases ($) | Sales Proceeds ($) | Dividend Income ($) | Realized Gain (loss) ($) | Change in Unrealized appreciation (depreciation) ($) | Value, end of period ($) | % ownership, end of period |
| Fidelity Cash Central Fund 5.39% | 506,279,498 | 901,544,413 | 1,237,257,625 | 14,792,917 | 15,987 | (14,487) | 170,567,786 | 0.3% |
| Fidelity Securities Lending Cash Central Fund 5.39% | 573,400 | 57,139,111 | 54,601,536 | 31,631 | - | - | 3,110,975 | 0.0% |
| Total | 506,852,898 | 958,683,524 | 1,291,859,161 | 14,824,548 | 15,987 | (14,487) | 173,678,761 | |
| | | | | | | | | |
Amounts in the dividend income column in the above table include any capital gain distributions from underlying funds, which are presented in the corresponding line item in the Statement of Operations, if applicable.
Amounts in the dividend income column for Fidelity Securities Lending Cash Central Fund represents the income earned on investing cash collateral, less rebates paid to borrowers and any lending agent fees associated with the loan, plus any premium payments received for lending certain types of securities.
Amounts included in the purchases and sales proceeds columns may include in-kind transactions, if applicable.
Other Affiliated Issuers
An affiliated company is a company in which the Fund has ownership of at least 5% of the voting securities. Fiscal year to date transactions with companies which are or were affiliates are presented in the table below. Certain corporate actions, such as mergers, are excluded from the amounts in this table if applicable. A dash in the Value end of period ($) column means either the issuer is no longer held at period end, or the issuer is held at period end but is no longer an affiliate.
| Affiliate | Value, beginning of period ($) | Purchases ($) | Sales Proceeds ($) | Dividend Income ($) | Realized Gain (loss) ($) | Change in Unrealized appreciation (depreciation) ($) | Value, end of period ($) |
| Great Ajax Corp. | 11,477,212 | - | 1,304,236 | 54,949 | (3,573,801) | (1,403,558) | - |
| Great Ajax Corp. 7.25% | 14,943,642 | - | 15,286,049 | 877,355 | 412,170 | (69,763) | - |
| Total | 26,420,854 | - | 16,590,285 | 932,304 | (3,161,631) | (1,473,321) | - |
Amounts included in the purchases and sales proceeds columns may include in-kind transactions, if applicable.
Investment Valuation
The following is a summary of the inputs used, as of July 31, 2024, involving the Fund's assets and liabilities carried at fair value. The inputs or methodology used for valuing securities may not be an indication of the risk associated with investing in those securities. For more information on valuation inputs, and their aggregation into the levels used below, please refer to the Investment Valuation section in the accompanying Notes to Financial Statements.
| Valuation Inputs at Reporting Date: |
| Description | Total ($) | Level 1 ($) | Level 2 ($) | Level 3 ($) |
Investments in Securities: | | | | |
|
| Equities: | | | | |
Energy | 15,169,788 | 15,169,788 | - | - |
Financials | 364,644,615 | 364,644,615 | - | - |
Industrials | 2,414,900 | 2,414,900 | - | - |
Real Estate | 1,448,491,898 | 1,427,677,629 | 20,814,266 | 3 |
|
| Corporate Bonds | 1,450,904,522 | - | 1,450,904,518 | 4 |
|
| Asset-Backed Securities | 82,204,598 | - | 82,204,554 | 44 |
|
| Collateralized Mortgage Obligations | 33,635 | - | 8,598 | 25,037 |
|
| Commercial Mortgage Securities | 1,081,445,605 | - | 1,054,660,122 | 26,785,483 |
|
| Bank Loan Obligations | 114,160,789 | - | 82,894,858 | 31,265,931 |
|
| Preferred Securities | 39,663,475 | 33,591,976 | 6,071,487 | 12 |
|
| Money Market Funds | 173,678,761 | 173,678,761 | - | - |
| Total Investments in Securities: | 4,772,812,586 | 2,017,177,669 | 2,697,558,403 | 58,076,514 |
The following is a reconciliation of Investments in Securities for which Level 3 inputs were used in determining value:
| |
| Investments in Securities: | |
| Commercial Mortgage Securities | | | |
| Beginning Balance | $ | 50,262,279 | |
| Net Realized Gain (Loss) on Investment Securities | | (6,938,114) | |
| Net Unrealized Gain (Loss) on Investment Securities | | 4,178,817 | |
| Cost of Purchases | | - | |
| Proceeds of Sales | | - | |
| Amortization/Accretion | | (731,452) | |
| Transfers into Level 3 | | 12,196,963 | |
| Transfers out of Level 3 | | (32,183,010) | |
| Ending Balance | $ | 26,785,483 | |
| The change in unrealized gain (loss) for the period attributable to Level 3 securities held at July 31, 2024 | $ | 2,444,746 | |
| Bank Loan Obligations | | | |
| Beginning Balance | $ | 64,799,225 | |
| Net Realized Gain (Loss) on Investment Securities | | (29,319,092) | |
| Net Unrealized Gain (Loss) on Investment Securities | | 13,835,662 | |
| Cost of Purchases | | - | |
| Proceeds of Sales | | (18,051,897) | |
| Amortization/Accretion | | 2,033 | |
| Transfers into Level 3 | | - | |
| Transfers out of Level 3 | | - | |
| Ending Balance | $ | 31,265,931 | |
| The change in unrealized gain (loss) for the period attributable to Level 3 securities held at July 31, 2024 | $ | 927,800 | |
| Other Investments in Securities | | | |
| Beginning Balance | $ | 4,527,633 | |
| Net Realized Gain (Loss) on Investment Securities | | 383,723 | |
| Net Unrealized Gain (Loss) on Investment Securities | | (123,691) | |
| Cost of Purchases | | 7,986,333 | |
| Proceeds of Sales | | (12,786,499) | |
| Amortization/Accretion | | 46,342 | |
| Transfers into Level 3 | | - | |
| Transfers out of Level 3 | | (8,741) | |
| Ending Balance | $ | 25,100 | |
| The change in unrealized gain (loss) for the period attributable to Level 3 securities held at July 31, 2024 | $ | 6,015 | |
| The information used in the above reconciliation represents fiscal year to date activity for any Investments in Securities identified as using Level 3 inputs at either the beginning or the end of the current fiscal period. Cost of purchases and proceeds of sales may include securities received and/or delivered through in-kind transactions, corporate actions or exchanges. Transfers into Level 3 were attributable to a lack of observable market data resulting from decreases in market activity, decreases in liquidity, security restructurings or corporate actions. Transfers out of Level 3 were attributable to observable market data becoming available for those securities. Transfers in or out of Level 3 represent the beginning value of any Security or Instrument where a change in the pricing level occurred from the beginning to the end of the period. Realized and unrealized gains (losses) disclosed in the reconciliation are included in Net Gain (Loss) on the Fund's Statement of Operations. | |
Financial Statements
| Statement of Assets and Liabilities |
As of July 31, 2024 |
| Assets | | | | |
| Investment in securities, at value (including securities loaned of $3,071,743) - See accompanying schedule: | | | | |
Unaffiliated issuers (cost $4,437,360,326) | $ | 4,599,133,825 | | |
Fidelity Central Funds (cost $173,646,229) | | 173,678,761 | | |
| | | | | |
| | | | | |
| Total Investment in Securities (cost $4,611,006,555) | | | $ | 4,772,812,586 |
| Cash | | | | 448,300 |
| Receivable for investments sold | | | | 15,987 |
| Receivable for fund shares sold | | | | 4,309,163 |
| Dividends receivable | | | | 1,790,355 |
| Interest receivable | | | | 26,446,666 |
| Distributions receivable from Fidelity Central Funds | | | | 809,313 |
| Prepaid expenses | | | | 814 |
Total assets | | | | 4,806,633,184 |
| Liabilities | | | | |
| Payable for investments purchased | $ | 11,897,510 | | |
| Payable for fund shares redeemed | | 2,140,861 | | |
| Accrued management fee | | 2,483,698 | | |
| Distribution and service plan fees payable | | 101,879 | | |
| Other payables and accrued expenses | | 131,373 | | |
| Collateral on securities loaned | | 3,110,975 | | |
| Total liabilities | | | | 19,866,296 |
| Net Assets | | | $ | 4,786,766,888 |
| Net Assets consist of: | | | | |
| Paid in capital | | | $ | 4,813,039,454 |
| Total accumulated earnings (loss) | | | | (26,272,566) |
| Net Assets | | | $ | 4,786,766,888 |
| | | | | |
| Net Asset Value and Maximum Offering Price | | | | |
| Class A : | | | | |
Net Asset Value and redemption price per share ($291,736,803 ÷ 24,542,964 shares)(a) | | | $ | 11.89 |
| Maximum offering price per share (100/96.00 of $11.89) | | | $ | 12.39 |
| Class M : | | | | |
Net Asset Value and redemption price per share ($38,026,401 ÷ 3,197,592 shares)(a) | | | $ | 11.89 |
| Maximum offering price per share (100/96.00 of $11.89) | | | $ | 12.39 |
| Class C : | | | | |
Net Asset Value and offering price per share ($40,266,766 ÷ 3,449,487 shares)(a) | | | $ | 11.67 |
| Real Estate Income : | | | | |
Net Asset Value, offering price and redemption price per share ($1,101,736,610 ÷ 91,929,272 shares) | | | $ | 11.98 |
| Class I : | | | | |
Net Asset Value, offering price and redemption price per share ($1,396,172,933 ÷ 117,098,939 shares) | | | $ | 11.92 |
| Class Z : | | | | |
Net Asset Value, offering price and redemption price per share ($1,918,827,375 ÷ 160,992,832 shares) | | | $ | 11.92 |
(a)Redemption price per share is equal to net asset value less any applicable contingent deferred sales charge. |
| Statement of Operations |
| Year ended July 31, 2024 |
| Investment Income | | | | |
| Dividends (including $932,304 earned from affiliated issuers) | | | $ | 89,376,387 |
| Interest | | | | 146,991,372 |
| Income from Fidelity Central Funds (including $31,631 from security lending) | | | | 14,824,548 |
| Total income | | | | 251,192,307 |
| Expenses | | | | |
| Management fee | $ | 25,651,806 | | |
| Transfer agent fees | | 3,211,410 | | |
| Distribution and service plan fees | | 1,294,126 | | |
| Accounting fees | | 737,110 | | |
| Custodian fees and expenses | | 26,966 | | |
| Independent trustees' fees and expenses | | 22,033 | | |
| Registration fees | | 167,494 | | |
| Audit fees | | 107,520 | | |
| Legal | | 46,668 | | |
| Miscellaneous | | 56,214 | | |
| Total expenses before reductions | | 31,321,347 | | |
| Expense reductions | | (293,058) | | |
| Total expenses after reductions | | | | 31,028,289 |
| Net Investment income (loss) | | | | 220,164,018 |
| Realized and Unrealized Gain (Loss) | | | | |
| Net realized gain (loss) on: | | | | |
| Investment Securities: | | | | |
| Unaffiliated issuers | | (112,507,625) | | |
| Fidelity Central Funds | | 15,987 | | |
| Other affiliated issuers | | (3,161,631) | | |
| Foreign currency transactions | | (190) | | |
| Total net realized gain (loss) | | | | (115,653,459) |
| Change in net unrealized appreciation (depreciation) on: | | | | |
| Investment Securities: | | | | |
| Unaffiliated issuers | | 317,814,476 | | |
| Fidelity Central Funds | | (14,487) | | |
| Other affiliated issuers | | (1,473,321) | | |
| Assets and liabilities in foreign currencies | | 85 | | |
| Total change in net unrealized appreciation (depreciation) | | | | 316,326,753 |
| Net gain (loss) | | | | 200,673,294 |
| Net increase (decrease) in net assets resulting from operations | | | $ | 420,837,312 |
| Statement of Changes in Net Assets |
| |
| | Year ended July 31, 2024 | | Year ended July 31, 2023 |
| Increase (Decrease) in Net Assets | | | | |
| Operations | | | | |
| Net investment income (loss) | $ | 220,164,018 | $ | 238,244,025 |
| Net realized gain (loss) | | (115,653,459) | | (93,379,075) |
| Change in net unrealized appreciation (depreciation) | | 316,326,753 | | (324,762,669) |
| Net increase (decrease) in net assets resulting from operations | | 420,837,312 | | (179,897,719) |
| Distributions to shareholders | | (217,452,716) | | (351,750,740) |
| | | | | |
| Share transactions - net increase (decrease) | | (5,343,665) | | (838,782,559) |
| Total increase (decrease) in net assets | | 198,040,931 | | (1,370,431,018) |
| | | | | |
| Net Assets | | | | |
| Beginning of period | | 4,588,725,957 | | 5,959,156,975 |
| End of period | $ | 4,786,766,888 | $ | 4,588,725,957 |
| | | | | |
| | | | | |
Financial Highlights
Fidelity Advisor® Real Estate Income Fund Class A |
| |
| Years ended July 31, | | 2024 | | 2023 | | 2022 | | 2021 | | 2020 |
Selected Per-Share Data | | | | | | | | | | |
| Net asset value, beginning of period | $ | 11.36 | $ | 12.49 | $ | 13.43 | $ | 11.02 | $ | 12.43 |
| Income from Investment Operations | | | | | | | | | | |
Net investment income (loss) A,B | | .52 | | .53 | | .39 | | .33 | | .45 |
| Net realized and unrealized gain (loss) | | .53 | | (.88) | | (1.03) | | 2.53 | | (1.25) |
| Total from investment operations | | 1.05 | | (.35) | | (.64) | | 2.86 | | (.80) |
| Distributions from net investment income | | (.52) | | (.56) | | (.28) | | (.42) C | | (.44) |
| Distributions from net realized gain | | - | | (.22) | | (.02) | | (.03) C | | (.16) |
| Total distributions | | (.52) | | (.78) | | (.30) | | (.45) | | (.61) D |
| Net asset value, end of period | $ | 11.89 | $ | 11.36 | $ | 12.49 | $ | 13.43 | $ | 11.02 |
Total Return E,F | | | | (2.72)% | | (4.83)% | | 26.64% | | (6.88)% |
Ratios to Average Net Assets B,G,H | | | | | | | | | | |
| Expenses before reductions | | .97% | | .99% | | .98% | | .99% | | 1.01% |
| Expenses net of fee waivers, if any | | | | .98% | | .98% | | .99% | | 1.01% |
| Expenses net of all reductions | | .96% | | .98% | | .98% | | .99% | | 1.00% |
| Net investment income (loss) | | 4.61% | | 4.61% | | 2.97% | | 2.75% | | 3.85% |
| Supplemental Data | | | | | | | | | | |
| Net assets, end of period (000 omitted) | $ | 291,737 | $ | 304,754 | $ | 364,443 | $ | 384,382 | $ | 324,031 |
Portfolio turnover rate I | | | | 17% | | 42% | | 26% | | 32% J |
ACalculated based on average shares outstanding during the period.
BNet investment income (loss) is affected by the timing of the declaration of dividends by any underlying mutual funds or exchange-traded funds (ETFs). Net investment income (loss) of any mutual funds or ETFs is not included in the Fund's net investment income (loss) ratio.
CThe amount shown reflects reclassifications related to book to tax differences that were made in the year shown.
DTotal distributions per share do not sum due to rounding.
ETotal returns would have been lower if certain expenses had not been reduced during the applicable periods shown.
FTotal returns do not include the effect of the sales charges.
GFees and expenses of any underlying mutual funds or exchange-traded funds (ETFs) are not included in the Fund's expense ratio. The Fund indirectly bears its proportionate share of these expenses. For additional expense information related to investments in Fidelity Central Funds, please refer to the "Investments in Fidelity Central Funds" note found in the Notes to Financial Statements section of the most recent Annual or Semi-Annual report.
HExpense ratios reflect operating expenses of the class. Expenses before reductions do not reflect amounts reimbursed, waived, or reduced through arrangements with the investment adviser, brokerage services, or other offset arrangements, if applicable, and do not represent the amount paid by the class during periods when reimbursements, waivers or reductions occur.
IAmount does not include the portfolio activity of any underlying mutual funds or exchange-traded funds (ETFs).
JPortfolio turnover rate excludes securities received or delivered in-kind.
Fidelity Advisor® Real Estate Income Fund Class M |
| |
| Years ended July 31, | | 2024 | | 2023 | | 2022 | | 2021 | | 2020 |
Selected Per-Share Data | | | | | | | | | | |
| Net asset value, beginning of period | $ | 11.36 | $ | 12.49 | $ | 13.43 | $ | 11.02 | $ | 12.43 |
| Income from Investment Operations | | | | | | | | | | |
Net investment income (loss) A,B | | .52 | | .52 | | .39 | | .33 | | .45 |
| Net realized and unrealized gain (loss) | | .53 | | (.87) | | (1.03) | | 2.53 | | (1.26) |
| Total from investment operations | | 1.05 | | (.35) | | (.64) | | 2.86 | | (.81) |
| Distributions from net investment income | | (.52) | | (.56) | | (.28) | | (.42) C | | (.44) |
| Distributions from net realized gain | | - | | (.22) | | (.02) | | (.03) C | | (.16) |
| Total distributions | | (.52) | | (.78) | | (.30) | | (.45) | | (.60) |
| Net asset value, end of period | $ | 11.89 | $ | 11.36 | $ | 12.49 | $ | 13.43 | $ | 11.02 |
Total Return D,E | | | | (2.75)% | | (4.85)% | | 26.62% | | (6.89)% |
Ratios to Average Net Assets B,F,G | | | | | | | | | | |
| Expenses before reductions | | .98% | | 1.01% | | .99% | | 1.01% | | 1.03% |
| Expenses net of fee waivers, if any | | | | 1.00% | | .99% | | 1.01% | | 1.03% |
| Expenses net of all reductions | | .97% | | 1.00% | | .99% | | 1.01% | | 1.03% |
| Net investment income (loss) | | 4.61% | | 4.59% | | 2.97% | | 2.73% | | 3.82% |
| Supplemental Data | | | | | | | | | | |
| Net assets, end of period (000 omitted) | $ | 38,026 | $ | 42,829 | $ | 52,919 | $ | 57,338 | $ | 49,387 |
Portfolio turnover rate H | | | | 17% | | 42% | | 26% | | 32% I |
ACalculated based on average shares outstanding during the period.
BNet investment income (loss) is affected by the timing of the declaration of dividends by any underlying mutual funds or exchange-traded funds (ETFs). Net investment income (loss) of any mutual funds or ETFs is not included in the Fund's net investment income (loss) ratio.
CThe amount shown reflects reclassifications related to book to tax differences that were made in the year shown.
DTotal returns would have been lower if certain expenses had not been reduced during the applicable periods shown.
ETotal returns do not include the effect of the sales charges.
FFees and expenses of any underlying mutual funds or exchange-traded funds (ETFs) are not included in the Fund's expense ratio. The Fund indirectly bears its proportionate share of these expenses. For additional expense information related to investments in Fidelity Central Funds, please refer to the "Investments in Fidelity Central Funds" note found in the Notes to Financial Statements section of the most recent Annual or Semi-Annual report.
GExpense ratios reflect operating expenses of the class. Expenses before reductions do not reflect amounts reimbursed, waived, or reduced through arrangements with the investment adviser, brokerage services, or other offset arrangements, if applicable, and do not represent the amount paid by the class during periods when reimbursements, waivers or reductions occur.
HAmount does not include the portfolio activity of any underlying mutual funds or exchange-traded funds (ETFs).
IPortfolio turnover rate excludes securities received or delivered in-kind.
Fidelity Advisor® Real Estate Income Fund Class C |
| |
| Years ended July 31, | | 2024 | | 2023 | | 2022 | | 2021 | | 2020 |
Selected Per-Share Data | | | | | | | | | | |
| Net asset value, beginning of period | $ | 11.16 | $ | 12.27 | $ | 13.21 | $ | 10.88 | $ | 12.28 |
| Income from Investment Operations | | | | | | | | | | |
Net investment income (loss) A,B | | .43 | | .43 | | .29 | | .24 | | .36 |
| Net realized and unrealized gain (loss) | | .51 | | (.86) | | (1.01) | | 2.48 | | (1.23) |
| Total from investment operations | | .94 | | (.43) | | (.72) | | 2.72 | | (.87) |
| Distributions from net investment income | | (.43) | | (.46) | | (.20) | | (.36) C | | (.36) |
| Distributions from net realized gain | | - | | (.22) | | (.02) | | (.03) C | | (.16) |
| Total distributions | | (.43) | | (.68) | | (.22) | | (.39) | | (.53) D |
| Net asset value, end of period | $ | 11.67 | $ | 11.16 | $ | 12.27 | $ | 13.21 | $ | 10.88 |
Total Return E,F | | | | (3.46)% | | (5.54)% | | 25.64% | | (7.50)% |
Ratios to Average Net Assets B,G,H | | | | | | | | | | |
| Expenses before reductions | | 1.70% | | 1.74% | | 1.72% | | 1.74% | | 1.76% |
| Expenses net of fee waivers, if any | | | | 1.73% | | 1.72% | | 1.74% | | 1.76% |
| Expenses net of all reductions | | 1.70% | | 1.73% | | 1.72% | | 1.74% | | 1.76% |
| Net investment income (loss) | | 3.88% | | 3.86% | | 2.23% | | 2.00% | | 3.09% |
| Supplemental Data | | | | | | | | | | |
| Net assets, end of period (000 omitted) | $ | 40,267 | $ | 56,795 | $ | 89,135 | $ | 120,072 | $ | 150,653 |
Portfolio turnover rate I | | | | 17% | | 42% | | 26% | | 32% J |
ACalculated based on average shares outstanding during the period.
BNet investment income (loss) is affected by the timing of the declaration of dividends by any underlying mutual funds or exchange-traded funds (ETFs). Net investment income (loss) of any mutual funds or ETFs is not included in the Fund's net investment income (loss) ratio.
CThe amount shown reflects reclassifications related to book to tax differences that were made in the year shown.
DTotal distributions per share do not sum due to rounding.
ETotal returns would have been lower if certain expenses had not been reduced during the applicable periods shown.
FTotal returns do not include the effect of the contingent deferred sales charge.
GFees and expenses of any underlying mutual funds or exchange-traded funds (ETFs) are not included in the Fund's expense ratio. The Fund indirectly bears its proportionate share of these expenses. For additional expense information related to investments in Fidelity Central Funds, please refer to the "Investments in Fidelity Central Funds" note found in the Notes to Financial Statements section of the most recent Annual or Semi-Annual report.
HExpense ratios reflect operating expenses of the class. Expenses before reductions do not reflect amounts reimbursed, waived, or reduced through arrangements with the investment adviser, brokerage services, or other offset arrangements, if applicable, and do not represent the amount paid by the class during periods when reimbursements, waivers or reductions occur.
IAmount does not include the portfolio activity of any underlying mutual funds or exchange-traded funds (ETFs).
JPortfolio turnover rate excludes securities received or delivered in-kind.
Fidelity® Real Estate Income Fund |
| |
| Years ended July 31, | | 2024 | | 2023 | | 2022 | | 2021 | | 2020 |
Selected Per-Share Data | | | | | | | | | | |
| Net asset value, beginning of period | $ | 11.45 | $ | 12.58 | $ | 13.52 | $ | 11.09 | $ | 12.50 |
| Income from Investment Operations | | | | | | | | | | |
Net investment income (loss) A,B | | .56 | | .56 | | .43 | | .37 | | .48 |
| Net realized and unrealized gain (loss) | | .52 | | (.88) | | (1.03) | | 2.53 | | (1.25) |
| Total from investment operations | | 1.08 | | (.32) | | (.60) | | 2.90 | | (.77) |
| Distributions from net investment income | | (.55) | | (.60) | | (.32) | | (.44) C | | (.48) |
| Distributions from net realized gain | | - | | (.22) | | (.02) | | (.03) C | | (.16) |
| Total distributions | | (.55) | | (.81) D | | (.34) | | (.47) | | (.64) |
| Net asset value, end of period | $ | 11.98 | $ | 11.45 | $ | 12.58 | $ | 13.52 | $ | 11.09 |
Total Return E | | | | (2.42)% | | (4.56)% | | 26.88% | | (6.58)% |
Ratios to Average Net Assets B,F,G | | | | | | | | | | |
| Expenses before reductions | | .69% | | .73% | | .71% | | .72% | | .73% |
| Expenses net of fee waivers, if any | | | | .72% | | .71% | | .72% | | .73% |
| Expenses net of all reductions | | .68% | | .72% | | .71% | | .72% | | .73% |
| Net investment income (loss) | | 4.90% | | 4.87% | | 3.24% | | 3.02% | | 4.12% |
| Supplemental Data | | | | | | | | | | |
| Net assets, end of period (000 omitted) | $ | 1,101,737 | $ | 1,288,147 | $ | 1,898,345 | $ | 2,777,243 | $ | 2,205,319 |
Portfolio turnover rate H | | | | 17% | | 42% | | 26% | | 32% I |
ACalculated based on average shares outstanding during the period.
BNet investment income (loss) is affected by the timing of the declaration of dividends by any underlying mutual funds or exchange-traded funds (ETFs). Net investment income (loss) of any mutual funds or ETFs is not included in the Fund's net investment income (loss) ratio.
CThe amount shown reflects reclassifications related to book to tax differences that were made in the year shown.
DTotal distributions per share do not sum due to rounding.
ETotal returns would have been lower if certain expenses had not been reduced during the applicable periods shown.
FFees and expenses of any underlying mutual funds or exchange-traded funds (ETFs) are not included in the Fund's expense ratio. The Fund indirectly bears its proportionate share of these expenses. For additional expense information related to investments in Fidelity Central Funds, please refer to the "Investments in Fidelity Central Funds" note found in the Notes to Financial Statements section of the most recent Annual or Semi-Annual report.
GExpense ratios reflect operating expenses of the class. Expenses before reductions do not reflect amounts reimbursed, waived, or reduced through arrangements with the investment adviser, brokerage services, or other offset arrangements, if applicable, and do not represent the amount paid by the class during periods when reimbursements, waivers or reductions occur.
HAmount does not include the portfolio activity of any underlying mutual funds or exchange-traded funds (ETFs).
IPortfolio turnover rate excludes securities received or delivered in-kind.
Fidelity Advisor® Real Estate Income Fund Class I |
| |
| Years ended July 31, | | 2024 | | 2023 | | 2022 | | 2021 | | 2020 |
Selected Per-Share Data | | | | | | | | | | |
| Net asset value, beginning of period | $ | 11.39 | $ | 12.53 | $ | 13.47 | $ | 11.04 | $ | 12.45 |
| Income from Investment Operations | | | | | | | | | | |
Net investment income (loss) A,B | | .55 | | .56 | | .43 | | .37 | | .48 |
| Net realized and unrealized gain (loss) | | .53 | | (.89) | | (1.03) | | 2.53 | | (1.25) |
| Total from investment operations | | 1.08 | | (.33) | | (.60) | | 2.90 | | (.77) |
| Distributions from net investment income | | (.55) | | (.60) | | (.32) | | (.44) C | | (.47) |
| Distributions from net realized gain | | - | | (.22) | | (.02) | | (.03) C | | (.16) |
| Total distributions | | (.55) | | (.81) D | | (.34) | | (.47) | | (.64) D |
| Net asset value, end of period | $ | 11.92 | $ | 11.39 | $ | 12.53 | $ | 13.47 | $ | 11.04 |
Total Return E | | | | (2.52)% | | (4.57)% | | 27.03% | | (6.62)% |
Ratios to Average Net Assets B,F,G | | | | | | | | | | |
| Expenses before reductions | | .72% | | .73% | | .71% | | .71% | | .74% |
| Expenses net of fee waivers, if any | | | | .72% | | .71% | | .71% | | .74% |
| Expenses net of all reductions | | .71% | | .72% | | .71% | | .71% | | .74% |
| Net investment income (loss) | | 4.87% | | 4.87% | | 3.24% | | 3.03% | | 4.11% |
| Supplemental Data | | | | | | | | | | |
| Net assets, end of period (000 omitted) | $ | 1,396,173 | $ | 1,379,614 | $ | 1,946,852 | $ | 2,810,475 | $ | 1,782,594 |
Portfolio turnover rate H | | | | 17% | | 42% | | 26% | | 32% I |
ACalculated based on average shares outstanding during the period.
BNet investment income (loss) is affected by the timing of the declaration of dividends by any underlying mutual funds or exchange-traded funds (ETFs). Net investment income (loss) of any mutual funds or ETFs is not included in the Fund's net investment income (loss) ratio.
CThe amount shown reflects reclassifications related to book to tax differences that were made in the year shown.
DTotal distributions per share do not sum due to rounding.
ETotal returns would have been lower if certain expenses had not been reduced during the applicable periods shown.
FFees and expenses of any underlying mutual funds or exchange-traded funds (ETFs) are not included in the Fund's expense ratio. The Fund indirectly bears its proportionate share of these expenses. For additional expense information related to investments in Fidelity Central Funds, please refer to the "Investments in Fidelity Central Funds" note found in the Notes to Financial Statements section of the most recent Annual or Semi-Annual report.
GExpense ratios reflect operating expenses of the class. Expenses before reductions do not reflect amounts reimbursed, waived, or reduced through arrangements with the investment adviser, brokerage services, or other offset arrangements, if applicable, and do not represent the amount paid by the class during periods when reimbursements, waivers or reductions occur.
HAmount does not include the portfolio activity of any underlying mutual funds or exchange-traded funds (ETFs).
IPortfolio turnover rate excludes securities received or delivered in-kind.
Fidelity Advisor® Real Estate Income Fund Class Z |
| |
| Years ended July 31, | | 2024 | | 2023 | | 2022 | | 2021 | | 2020 |
Selected Per-Share Data | | | | | | | | | | |
| Net asset value, beginning of period | $ | 11.39 | $ | 12.53 | $ | 13.47 | $ | 11.04 | $ | 12.45 |
| Income from Investment Operations | | | | | | | | | | |
Net investment income (loss) A,B | | .57 | | .57 | | .44 | | .38 | | .49 |
| Net realized and unrealized gain (loss) | | .53 | | (.88) | | (1.02) | | 2.53 | | (1.25) |
| Total from investment operations | | 1.10 | | (.31) | | (.58) | | 2.91 | | (.76) |
| Distributions from net investment income | | (.57) | | (.61) | | (.34) | | (.45) C | | (.49) |
| Distributions from net realized gain | | - | | (.22) | | (.02) | | (.03) C | | (.16) |
| Total distributions | | (.57) | | (.83) | | (.36) | | (.48) | | (.65) |
| Net asset value, end of period | $ | 11.92 | $ | 11.39 | $ | 12.53 | $ | 13.47 | $ | 11.04 |
Total Return D | | | | (2.36)% | | (4.44)% | | 27.15% | | (6.50)% |
Ratios to Average Net Assets B,E,F | | | | | | | | | | |
| Expenses before reductions | | .60% | | .60% | | .59% | | .60% | | .62% |
| Expenses net of fee waivers, if any | | | | .60% | | .59% | | .60% | | .62% |
| Expenses net of all reductions | | .59% | | .60% | | .59% | | .60% | | .61% |
| Net investment income (loss) | | 4.98% | | 4.99% | | 3.36% | | 3.14% | | 4.24% |
| Supplemental Data | | | | | | | | | | |
| Net assets, end of period (000 omitted) | $ | 1,918,827 | $ | 1,516,585 | $ | 1,607,463 | $ | 919,766 | $ | 793,220 |
Portfolio turnover rate G | | | | 17% | | 42% | | 26% | | 32% H |
ACalculated based on average shares outstanding during the period.
BNet investment income (loss) is affected by the timing of the declaration of dividends by any underlying mutual funds or exchange-traded funds (ETFs). Net investment income (loss) of any mutual funds or ETFs is not included in the Fund's net investment income (loss) ratio.
CThe amount shown reflects reclassifications related to book to tax differences that were made in the year shown.
DTotal returns would have been lower if certain expenses had not been reduced during the applicable periods shown.
EFees and expenses of any underlying mutual funds or exchange-traded funds (ETFs) are not included in the Fund's expense ratio. The Fund indirectly bears its proportionate share of these expenses. For additional expense information related to investments in Fidelity Central Funds, please refer to the "Investments in Fidelity Central Funds" note found in the Notes to Financial Statements section of the most recent Annual or Semi-Annual report.
FExpense ratios reflect operating expenses of the class. Expenses before reductions do not reflect amounts reimbursed, waived, or reduced through arrangements with the investment adviser, brokerage services, or other offset arrangements, if applicable, and do not represent the amount paid by the class during periods when reimbursements, waivers or reductions occur.
GAmount does not include the portfolio activity of any underlying mutual funds or exchange-traded funds (ETFs).
HPortfolio turnover rate excludes securities received or delivered in-kind.
Notes to Financial Statements
For the period ended July 31, 2024
1. Organization.
Fidelity Real Estate Income Fund (the Fund) is a fund of Fidelity Securities Fund (the Trust) and is authorized to issue an unlimited number of shares. The Trust is registered under the Investment Company Act of 1940, as amended (the 1940 Act), as an open-end management investment company organized as a Massachusetts business trust. The Fund offers Class A, Class M, Class C, Real Estate Income, Class I and Class Z shares, each of which has equal rights as to assets and voting privileges. Class A, Class M, Class C, Class I and Class Z are Fidelity Advisor classes. Each class has exclusive voting rights with respect to matters that affect that class. Class C shares will automatically convert to Class A shares after a holding period of eight years from the initial date of purchase, with certain exceptions.
2. Investments in Fidelity Central Funds.
Funds may invest in Fidelity Central Funds, which are open-end investment companies generally available only to other investment companies and accounts managed by the investment adviser and its affiliates. The Schedule of Investments lists any Fidelity Central Funds held as an investment as of period end, but does not include the underlying holdings of each Fidelity Central Fund. An investing fund indirectly bears its proportionate share of the expenses of the underlying Fidelity Central Funds.
Based on its investment objective, each Fidelity Central Fund may invest or participate in various investment vehicles or strategies that are similar to those of the investing fund. These strategies are consistent with the investment objectives of the investing fund and may involve certain economic risks which may cause a decline in value of each of the Fidelity Central Funds and thus a decline in the value of the investing fund.
| Fidelity Central Fund | Investment Manager | Investment Objective | Investment Practices | Expense RatioA |
| Fidelity Money Market Central Funds | Fidelity Management & Research Company LLC (FMR) | Each fund seeks to obtain a high level of current income consistent with the preservation of capital and liquidity. | Short-term Investments | Less than .005% |
A Expenses expressed as a percentage of average net assets and are as of each underlying Central Fund's most recent annual or semi-annual shareholder report.
A complete unaudited list of holdings for each Fidelity Central Fund is available upon request or at the Securities and Exchange Commission website at www.sec.gov. In addition, the financial statements of the Fidelity Central Funds which contain the significant accounting policies (including investment valuation policies) of those funds, and are not covered by the Report of Independent Registered Public Accounting Firm, are available on the Securities and Exchange Commission website or upon request.
3. Significant Accounting Policies.
The Fund is an investment company and applies the accounting and reporting guidance of the Financial Accounting Standards Board (FASB) Accounting Standards Codification Topic 946 Financial Services - Investment Companies. The financial statements have been prepared in conformity with accounting principles generally accepted in the United States of America (GAAP), which require management to make certain estimates and assumptions at the date of the financial statements. Actual results could differ from those estimates. Subsequent events, if any, through the date that the financial statements were issued have been evaluated in the preparation of the financial statements. The Fund's Schedule of Investments lists any underlying mutual funds or exchange-traded funds (ETFs) but does not include the underlying holdings of these funds. The following summarizes the significant accounting policies of the Fund:
Investment Valuation. Investments are valued as of 4:00 p.m. Eastern time on the last calendar day of the period. The Board of Trustees (the Board) has designated the Fund's investment adviser as the valuation designee responsible for the fair valuation function and performing fair value determinations as needed. The investment adviser has established a Fair Value Committee (the Committee) to carry out the day-to-day fair valuation responsibilities and has adopted policies and procedures to govern the fair valuation process and the activities of the Committee. In accordance with these fair valuation policies and procedures, which have been approved by the Board, the Fund attempts to obtain prices from one or more third party pricing services or brokers to value its investments. When current market prices, quotations or currency exchange rates are not readily available or reliable, investments will be fair valued in good faith by the Committee, in accordance with the policies and procedures. Factors used in determining fair value vary by investment type and may include market or investment specific events, transaction data, estimated cash flows, and market observations of comparable investments. The frequency that the fair valuation procedures are used cannot be predicted and they may be utilized to a significant extent. The Committee manages the Fund's fair valuation practices and maintains the fair valuation policies and procedures. The Fund's investment adviser reports to the Board information regarding the fair valuation process and related material matters.
The Fund categorizes the inputs to valuation techniques used to value its investments into a disclosure hierarchy consisting of three levels as shown below:
Level 1 - unadjusted quoted prices in active markets for identical investments
Level 2 - other significant observable inputs (including quoted prices for similar investments, interest rates, prepayment speeds, etc.)
Level 3 - unobservable inputs (including the Fund's own assumptions based on the best information available)
Valuation techniques used to value the Fund's investments by major category are as follows:
Equity securities, including restricted securities, for which market quotations are readily available, are valued at the last reported sale price or official closing price as reported by a third party pricing service on the primary market or exchange on which they are traded and are categorized as Level 1 in the hierarchy. In the event there were no sales during the day or closing prices are not available, securities are valued at the last quoted bid price or may be valued using the last available price and are generally categorized as Level 2 in the hierarchy. For foreign equity securities, when market or security specific events arise, comparisons to the valuation of American Depositary Receipts (ADRs), futures contracts, Exchange-Traded Funds (ETFs) and certain indexes as well as quoted prices for similar securities may be used and would be categorized as Level 2 in the hierarchy. For equity securities, including restricted securities, where observable inputs are limited, assumptions about market activity and risk are used and these securities may be categorized as Level 3 in the hierarchy.
Debt securities, including restricted securities, are valued based on evaluated prices received from third party pricing services or from brokers who make markets in such securities. Corporate bonds, bank loan obligations and preferred securities are valued by pricing services who utilize matrix pricing which considers yield or price of bonds of comparable quality, coupon, maturity and type or by broker-supplied prices. Asset backed securities, collateralized mortgage obligations and commercial mortgage securities are valued by pricing services who utilize matrix pricing which considers prepayment speed assumptions, attributes of the collateral, yield or price of bonds of comparable quality, coupon, maturity and type or by broker-supplied prices. When independent prices are unavailable or unreliable, debt securities may be valued utilizing pricing methodologies which consider similar factors that would be used by third party pricing services. Debt securities are generally categorized as Level 2 in the hierarchy but may be Level 3 depending on the circumstances. The Fund invests a significant portion of its assets in below investment grade securities. The value of these securities can be more volatile due to changes in the credit quality of the issuer and is sensitive to changes in economic, market and regulatory conditions.
Investments in open-end mutual funds, including the Fidelity Central Funds, are valued at their closing net asset value (NAV) each business day and are categorized as Level 1 in the hierarchy.
The following provides information on Level 3 securities held by the Fund that were valued at period end based on unobservable inputs. These amounts exclude valuations provided by a broker.
| Asset Type | Fair Value | Valuation Technique(s) | Unobservable Input | Amount or Range/Weighted Average | Impact to Valuation from an Increase in InputA |
| Equities | $3 | Recovery value | Recovery value | $0.00 | Increase |
| Corporate Bonds | $4 | Recovery value | Recovery value | $0.00 | Increase |
| Bank Loan Obligations | $31,265,931 | Discounted cash flow | Yield | 9.1% - 11.4% / 10.8% | Decrease |
| Commercial Mortgage Securities | $26,785,483 | Indicative market price | Evaluated bid | $0.24 - $84.59 / $65.97 | Increase |
| Asset-Backed Securities | $44 | Recovery value | Recovery value | $0.00 | Increase |
| | | Indicative market price | Evaluated bid | $0.00 | Increase |
| Preferred Securities | $12 | Recovery value | Recovery value | $0.00 | Increase |
| Collateralized Mortgage Obligations | $25,037 | Indicative market price | Evaluated bid | $72.85 | Increase |
A Represents the directional change in the fair value of the Level 3 investments that could have resulted from an increase in the corresponding input as of period end. A decrease to the unobservable input would have had the opposite effect. Significant changes in these inputs may have resulted in a significantly higher or lower fair value measurement at period end.
Changes in valuation techniques may result in transfers in or out of an assigned level within the disclosure hierarchy. The aggregate value of investments by input level as of July 31, 2024, as well as a roll forward of Level 3 investments, is included at the end of the Fund's Schedule of Investments.
Foreign Currency. Certain Funds may use foreign currency contracts to facilitate transactions in foreign-denominated securities. Gains and losses from these transactions may arise from changes in the value of the foreign currency or if the counterparties do not perform under the contracts' terms.
Foreign-denominated assets, including investment securities, and liabilities are translated into U.S. dollars at the exchange rates at period end. Purchases and sales of investment securities, income and dividends received, and expenses denominated in foreign currencies are translated into U.S. dollars at the exchange rate in effect on the transaction date.
The effects of exchange rate fluctuations on investments are included with the net realized and unrealized gain (loss) on investment securities. Other foreign currency transactions resulting in realized and unrealized gain (loss) are disclosed separately.
Investment Transactions and Income. For financial reporting purposes, the Fund's investment holdings and NAV include trades executed through the end of the last business day of the period. The NAV per share for processing shareholder transactions is calculated as of the close of business of the New York Stock Exchange (NYSE), normally 4:00 p.m. Eastern time and includes trades executed through the end of the prior business day. Gains and losses on securities sold are determined on the basis of identified cost and include proceeds received from litigation. Commissions paid to certain brokers with whom the investment adviser, or its affiliates, places trades on behalf of a fund include an amount in addition to trade execution, which may be rebated back to a fund. Any such rebates are included in net realized gain (loss) on investments in the Statement of Operations. Dividend income is recorded on the ex-dividend date, except for certain dividends from foreign securities where the ex-dividend date may have passed, which are recorded as soon as the Fund is informed of the ex-dividend date. Non-cash dividends included in dividend income, if any, are recorded at the fair market value of the securities received. Income and capital gain distributions from Fidelity Central Funds, if any, are recorded on the ex-dividend date. Certain distributions received by the Fund represent a return of capital or capital gain. The Fund determines the components of these distributions subsequent to the ex-dividend date, based upon receipt of tax filings or other correspondence relating to the underlying investment. These distributions are recorded as a reduction of cost of investments and/or as a realized gain. Interest income is accrued as earned and includes coupon interest and amortization of premium and accretion of discount on debt securities as applicable. For certain lower credit quality securitized assets that have contractual cash flows (for example, asset backed securities, collateralized mortgage obligations and commercial mortgage-backed securities), changes in estimated cash flows are periodically evaluated and the estimated yield is adjusted on a prospective basis, resulting in increases or decreases to Interest Income in the accompanying Statement of Operations. Investment income is recorded net of foreign taxes withheld where recovery of such taxes is uncertain. Debt obligations may be placed on non-accrual status and related interest income may be reduced by ceasing current accruals and writing off interest receivables when the collection of all or a portion of interest has become doubtful based on consistently applied procedures. A debt obligation is removed from non-accrual status when the issuer resumes interest payments or when collectability of interest is reasonably assured. Funds may file withholding tax reclaims in certain jurisdictions to recover a portion of amounts previously withheld. Any withholding tax reclaims income is included in the Statement of Operations in dividends. Any receivables for withholding tax reclaims are included in the Statement of Assets and Liabilities in dividends receivable.
Class Allocations and Expenses. Investment income, realized and unrealized capital gains and losses, common expenses of a fund, and certain fund-level expense reductions, if any, are allocated daily on a pro-rata basis to each class based on the relative net assets of each class to the total net assets of a fund. Each class differs with respect to transfer agent and distribution and service plan fees incurred, as applicable. Certain expense reductions may also differ by class, if applicable. For the reporting period, the allocated portion of income and expenses to each class as a percent of its average net assets may vary due to the timing of recording these transactions in relation to fluctuating net assets of the classes. Expenses directly attributable to a fund are charged to that fund. Expenses attributable to more than one fund are allocated among the respective funds on the basis of relative net assets or other appropriate methods. Expenses included in the accompanying financial statements reflect the expenses of that fund and do not include any expenses associated with any underlying mutual funds or exchange-traded funds (ETFs). Although not included in a fund's expenses, a fund indirectly bears its proportionate share of these expenses through the net asset value of each underlying mutual fund or exchange-traded fund (ETF). Expense estimates are accrued in the period to which they relate and adjustments are made when actual amounts are known.
Income Tax Information and Distributions to Shareholders. Each year, the Fund intends to qualify as a regulated investment company under Subchapter M of the Internal Revenue Code, including distributing substantially all of its taxable income and realized gains. As a result, no provision for U.S. Federal income taxes is required. As of July 31, 2024, the Fund did not have any unrecognized tax benefits in the financial statements; nor is the Fund aware of any tax positions for which it is reasonably possible that the total amounts of unrecognized tax benefits will significantly change in the next twelve months. The Fund files a U.S. federal tax return, in addition to state and local tax returns as required. The Fund's federal income tax returns are subject to examination by the Internal Revenue Service (IRS) for a period of three fiscal years after they are filed. State and local tax returns may be subject to examination for an additional fiscal year depending on the jurisdiction. Foreign taxes are provided for based on the Fund's understanding of the tax rules and rates that exist in the foreign markets in which it invests.
Distributions are declared and recorded on the ex-dividend date. Income and capital gain distributions are declared separately for each class. Income and capital gain distributions are determined in accordance with income tax regulations, which may differ from GAAP.
Capital accounts within the financial statements are adjusted for permanent book-tax differences. These adjustments have no impact on net assets or the results of operations. Capital accounts are not adjusted for temporary book-tax differences which will reverse in a subsequent period.
Book-tax differences are primarily due to foreign currency transactions, passive foreign investment companies (PFIC), certain conversion ratio adjustments, equity-debt classifications, partnerships, capital loss carryforwards and losses deferred due to wash sales.
As of period end, the cost and unrealized appreciation (depreciation) in securities, and derivatives if applicable, for federal income tax purposes were as follows:
| Gross unrealized appreciation | $423,980,646 |
| Gross unrealized depreciation | (265,906,995) |
| Net unrealized appreciation (depreciation) | $158,073,651 |
| Tax Cost | $4,614,738,935 |
The tax-based components of distributable earnings as of period end were as follows:
| Undistributed ordinary income | $21,014,222 |
| Capital loss carryforward | $(205,360,438) |
| Net unrealized appreciation (depreciation) on securities and other investments | $158,073,651 |
Capital loss carryforwards are only available to offset future capital gains of the Fund to the extent provided by regulations and may be limited. The capital loss carryforward information presented below, including any applicable limitation, is estimated as of fiscal period end and is subject to adjustment.
Short-term | $(33,506,903) |
Long-term | (171,853,535) |
| Total capital loss carryforward | $(205,360,438) |
The tax character of distributions paid was as follows:
| | July 31, 2024 | July 31, 2023 |
| Ordinary Income | $217,452,716 | $ 252,925,681 |
| Long-term Capital Gains | - | 98,825,059 |
| Total | $217,452,716 | $ 351,750,740 |
Restricted Securities (including Private Placements). Funds may invest in securities that are subject to legal or contractual restrictions on resale. These securities generally may be resold in transactions exempt from registration or to the public if the securities are registered. Disposal of these securities may involve time-consuming negotiations and expense, and prompt sale at an acceptable price may be difficult. Information regarding restricted securities held at period end is included at the end of the Schedule of Investments, if applicable.
Loans and Other Direct Debt Instruments. Direct debt instruments are interests in amounts owed to lenders by corporate or other borrowers. These instruments may be in the form of loans, trade claims or other receivables and may include standby financing commitments such as revolving credit facilities that obligate a fund to supply additional cash to the borrower on demand. Loans may be acquired through assignment, participation, or may be made directly to a borrower. Such instruments are presented in the Bank Loan Obligations section in the Schedule of Investments. Certain funds may also invest in unfunded loan commitments, which are contractual obligations for future funding. Information regarding unfunded commitments is included at the end of the Schedule of Investments, if applicable.
4. Purchases and Sales of Investments.
Purchases and sales of securities, other than short-term securities, U.S. government securities and in-kind transactions, as applicable, are noted in the table below.
| | Purchases ($) | Sales ($) |
| Fidelity Real Estate Income Fund | 1,330,250,457 | 1,019,760,098 |
5. Fees and Other Transactions with Affiliates.
Management Fee. Fidelity Management & Research Company LLC (the investment adviser) and its affiliates provide the Fund with investment management related services for which the Fund pays a monthly management fee.
Effective March 1, 2024, the Fund's management contract was amended to incorporate administrative services previously covered under separate services agreements (Transfer Agent and Accounting agreements). The amended contract incorporates a management fee rate that may vary by class. The investment adviser or an affiliate pays certain expenses of managing and operating the Fund out of each class's management fee. Each class of the Fund pays a management fee to the investment adviser. The management fee is calculated and paid to the investment adviser every month. When determining a class's management fee, a mandate rate is calculated based on the monthly average net assets of a group of funds advised by FMR within a designated asset class. A discount rate is subtracted from the mandate rate once the Fund's monthly average net assets reach a certain level. The mandate rate and discount rate may vary by class. The annual management fee rate for a class of shares of the Fund is the lesser of (1) the class's mandate rate reduced by the class's discount rate (if applicable) or (2) the amount set forth in the following table.
| | Maximum Management Fee Rate % |
| Class A | .70 |
| Class M | .72 |
| Class C | .70 |
| Real Estate Income | .69 |
| Class I | .69 |
| Class Z | .56 |
One-twelfth of the management fee rate for a class is applied to the average net assets of the class for the month, giving a dollar amount which is the management fee for the class for that month. A different management fee rate may be applicable to each class of the Fund. The difference between classes is the result of separate arrangements for class-level services and/or waivers of certain expenses. It is not the result of any difference in advisory or custodial fees or other expenses related to the management of the Fund's assets, which do not vary by class. For the portion of the reporting period on or after March 1, 2024, the total annualized management fee rates were as follows:
| | Total Management Fee Rate % |
| Class A | .70 |
| Class M | .70 |
| Class C | .70 |
| Real Estate Income | .66 |
| Class I | .69 |
| Class Z | .56 |
Prior to March 1, 2024, the management fee was the sum of an individual fund fee rate that was based on an annual rate of .30% of the Fund's average net assets and an annualized group fee rate that averaged .22% during the period. The group fee rate was based upon the monthly average net assets of a group of registered investment companies with which the investment adviser has management contracts. The group fee rate decreased as assets under management increased and increased as assets under management decreased. For the portion of the reporting period prior to March 1, 2024, the total annualized management fee rate was .52%.
Effective March 1, 2024, the Fund's sub-advisory agreements with FMR Investment Management (UK) Limited, Fidelity Management & Research (Hong Kong) Limited, and Fidelity Management & Research (Japan) Limited were amended to provide that the investment adviser pays each sub-adviser monthly fees equal to 110% of the sub-adviser's costs for providing sub-advisory services.
Distribution and Service Plan Fees. In accordance with Rule 12b-1 of the 1940 Act, the Fund has adopted separate Distribution and Service Plans for each class of shares. Certain classes pay Fidelity Distributors Company LLC (FDC), an affiliate of the investment adviser, separate Distribution and Service Fees, each of which is based on an annual percentage of each class' average net assets. In addition, FDC may pay financial intermediaries for selling shares of the Fund and providing shareholder support services. For the period, the Distribution and Service Fee rates, total fees and amounts retained by FDC were as follows:
| | Distribution Fee | Service Fee | Total Fees ($) | Retained by FDC ($) |
| Class A | - % | .25% | 722,636 | 626,257 |
| Class M | - % | .25% | 100,381 | 44,293 |
| Class C | .75% | .25% | 471,109 | 416,594 |
| | | | 1,294,126 | 1,087,144 |
Sales Load. FDC may receive a front-end sales charge of up to 4.00% for selling Class A shares and Class M shares, some of which is paid to financial intermediaries for selling shares of the Fund. Depending on the holding period, FDC may receive contingent deferred sales charges levied on Class A, Class M and Class C redemptions. The deferred sales charges are 1.00% for Class C shares, 1.00% for certain purchases of Class A shares and .25% for certain purchases of Class M shares.
For the period, sales charge amounts retained by FDC were as follows:
| | Retained by FDC ($) |
| Class A | 8,274 |
| Class M | 1,333 |
Class C A | 743 |
| | 10,350 |
A When Class C shares are initially sold, FDC pays commissions from its own resources to financial intermediaries through which the sales are made.
Transfer Agent Fees. Fidelity Investments Institutional Operations Company LLC (FIIOC), an affiliate of the investment adviser, is the transfer, dividend disbursing and shareholder servicing agent for each class of the Fund. Effective March 1, 2024, the Fund's management contract was amended to incorporate transfer agent services and associated fees previously covered under a separate services agreement. FIIOC pays for typesetting, printing and mailing of shareholder reports, except proxy statements.
During the period December 1, 2023 through February 29, 2024, the transfer agent fees for each class were a fixed annual rate of class-level average net assets as follows:
| | | % of Class-Level Average Net Assets |
| Class A | | .1777 |
| Class M | | .1975 |
| Class C | | .1799 |
| Real Estate Income | | .1674 |
| Class I | | .1660 |
| Class Z | | .0420 |
Prior to December 1, 2023, FIIOC received account fees and asset-based fees that varied according to the account size and type of account of the shareholders of the respective classes of the Fund, except for Class Z. FIIOC received an asset-based fee of Class Z's average net assets. For the portion of the reporting period prior to March 1, 2024, the fees were equivalent to the following annualized rates:
| | Amount ($) | % of Class-Level Average Net Assets |
| Class A | 301,240 | .18 |
| Class M | 47,672 | .20 |
| Class C | 52,538 | .18 |
| Real Estate Income | 1,205,681 | .17 |
| Class I | 1,222,125 | .17 |
| Class Z | 382,154 | .04 |
| 3,211,410 | |
Accounting Fees. Fidelity Service Company, Inc. (FSC), an affiliate of the investment adviser, maintains the Fund's accounting records. Effective March 1, 2024, the Fund's management contract was amended to incorporate accounting services and associated fees previously covered under a separate services agreement.
During the period December 1, 2023 through February 29, 2024, the accounting fees were a fixed annual rate of average net assets as follows:
| | % of Average Net Assets |
| Fidelity Real Estate Income Fund | .0278 |
Prior to December 1, 2023, the accounting fee was based on the level of average net assets for each month. For the portion of the reporting period prior to March 1, 2024, the fees were equivalent to the following annualized rates:
| | % of Average Net Assets |
| Fidelity Real Estate Income Fund | .03 |
| | |
Brokerage Commissions. A portion of portfolio transactions were placed with brokerage firms which are affiliates of the investment adviser. Brokerage commissions are included in net realized gain (loss) and change in net unrealized appreciation (depreciation) in the Statement of Operations. The commissions paid to these affiliated firms were as follows:
| | Amount ($) |
| Fidelity Real Estate Income Fund | 11,012 |
Interfund Trades. Funds may purchase from or sell securities to other Fidelity Funds under procedures adopted by the Board. The procedures have been designed to ensure these interfund trades are executed in accordance with Rule 17a-7 of the 1940 Act. Any interfund trades are included within the respective purchases and sales amounts shown in the Purchases and Sales of Investments note. Interfund trades during the period are noted in the table below.
| | Purchases ($) | Sales ($) | Realized Gain (Loss)($) |
| Fidelity Real Estate Income Fund | 6,753,642 | 8,279,400 | (163,022) |
Other. During the period, the investment adviser reimbursed the Fund for certain losses as follows:
| | Amount ($) |
| Fidelity Real Estate Income Fund | 44,700 |
6. Committed Line of Credit.
Certain Funds participate with other funds managed by the investment adviser or an affiliate in a $4.25 billion credit facility (the "line of credit") to be utilized for temporary or emergency purposes to fund shareholder redemptions or for other short-term liquidity purposes. The participating funds have agreed to pay commitment fees on their pro-rata portion of the line of credit, which are reflected in Miscellaneous expenses on the Statement of Operations, and are listed below. During the period, there were no borrowings on this line of credit.
| | Amount ($) |
| Fidelity Real Estate Income Fund | 7,546 |
7. Security Lending.
Funds lend portfolio securities from time to time in order to earn additional income. Lending agents are used, including National Financial Services (NFS), an affiliate of the investment adviser. Pursuant to a securities lending agreement, NFS will receive a fee, which is capped at 9.9% of a fund's daily lending revenue, for its services as lending agent. A fund may lend securities to certain qualified borrowers, including NFS. On the settlement date of the loan, a fund receives collateral (in the form of U.S. Treasury obligations, letters of credit and/or cash) against the loaned securities and maintains collateral in an amount not less than 100% of the market value of the loaned securities during the period of the loan. The market value of the loaned securities is determined at the close of business of a fund and any additional required collateral is delivered to a fund on the next business day. A fund or borrower may terminate the loan at any time, and if the borrower defaults on its obligation to return the securities loaned because of insolvency or other reasons, a fund may apply collateral received from the borrower against the obligation. A fund may experience delays and costs in recovering the securities loaned. Any cash collateral received is invested in the Fidelity Securities Lending Cash Central Fund. Any loaned securities are identified as such in the Schedule of Investments, and the value of loaned securities and cash collateral at period end, as applicable, are presented in the Statement of Assets and Liabilities. Security lending income represents the income earned on investing cash collateral, less rebates paid to borrowers and any lending agent fees associated with the loan, plus any premium payments received for lending certain types of securities. Security lending income is presented in the Statement of Operations as a component of income from Fidelity Central Funds. Affiliated security lending activity, if any, was as follows:
| | Total Security Lending Fees Paid to NFS ($) | Security Lending Income From Securities Loaned to NFS ($) | Value of Securities Loaned to NFS at Period End ($) |
| Fidelity Real Estate Income Fund | 3,246 | 68 | - |
8. Expense Reductions.
Through arrangements with the Fund's custodian, credits realized as a result of certain uninvested cash balances were used to reduce the Fund's expenses. During the period, custodian credits reduced the Fund's expenses by $9,940.
In addition, during the period the investment adviser or an affiliate reimbursed and/or waived a portion of fund-level operating expenses in the amount of $283,118.
9. Distributions to Shareholders.
Distributions to shareholders of each class were as follows:
| | Year ended July 31, 2024 | Year ended July 31, 2023 |
| Fidelity Real Estate Income Fund | | |
| Distributions to shareholders | | |
| Class A | $13,177,295 | $21,930,158 |
| Class M | 1,823,834 | 3,110,455 |
| Class C | 1,813,536 | 4,348,277 |
| Real Estate Income | 55,987,373 | 103,579,841 |
| Class I | 62,875,218 | 115,278,699 |
| Class Z | 81,775,460 | 103,503,310 |
Total | $217,452,716 | $351,750,740 |
10. Share Transactions.
Share transactions for each class were as follows and may contain in-kind transactions, automatic conversions between classes or exchanges between affiliated funds:
| | Shares | Shares | Dollars | Dollars |
| | Year ended July 31, 2024 | Year ended July 31, 2023 | Year ended July 31, 2024 | Year ended July 31, 2023 |
| Fidelity Real Estate Income Fund | | | | |
| Class A | | | | |
| Shares sold | 3,700,074 | 4,529,438 | $41,875,300 | $51,823,043 |
| Reinvestment of distributions | 838,801 | 1,431,595 | 9,434,884 | 16,449,419 |
| Shares redeemed | (6,823,815) | (8,310,972) | (77,005,379) | (94,422,132) |
| Net increase (decrease) | (2,284,940) | (2,349,939) | $(25,695,195) | $(26,149,670) |
| Class M | | | | |
| Shares sold | 144,804 | 182,092 | $1,640,819 | $2,081,875 |
| Reinvestment of distributions | 154,071 | 262,127 | 1,731,872 | 3,012,477 |
| Shares redeemed | (870,172) | (910,889) | (9,878,223) | (10,351,315) |
| Net increase (decrease) | (571,297) | (466,670) | $(6,505,532) | $(5,256,963) |
| Class C | | | | |
| Shares sold | 266,039 | 229,563 | $2,985,822 | $2,595,406 |
| Reinvestment of distributions | 159,687 | 375,961 | 1,761,565 | 4,260,263 |
| Shares redeemed | (2,064,875) | (2,780,448) | (22,904,785) | (31,102,886) |
| Net increase (decrease) | (1,639,149) | (2,174,924) | $(18,157,398) | $(24,247,217) |
| Real Estate Income | | | | |
| Shares sold | 11,593,441 | 14,381,485 | $132,809,316 | $165,460,169 |
| Reinvestment of distributions | 4,248,694 | 7,887,949 | 48,106,620 | 91,324,900 |
| Shares redeemed | (36,436,540) | (60,597,988) | (401,261,808) | (708,964,361) |
| Net increase (decrease) | (20,594,405) | (38,328,554) | $(220,345,872) | $(452,179,292) |
| Class I | | | | |
| Shares sold | 38,177,142 | 30,191,122 | $435,724,422 | $345,734,833 |
| Reinvestment of distributions | 5,121,376 | 9,257,182 | 57,787,894 | 106,675,182 |
| Shares redeemed | (47,272,737) | (73,751,513) | (531,909,551) | (837,783,994) |
| Net increase (decrease) | (3,974,219) | (34,303,209) | $(38,397,235) | $(385,373,979) |
| Class Z | | | | |
| Shares sold | 43,967,800 | 30,444,095 | $485,551,322 | $349,094,163 |
| Reinvestment of distributions | 6,349,429 | 8,001,421 | 71,705,582 | 91,968,427 |
| Shares redeemed | (22,476,549) | (33,595,613) | (253,499,337) | (386,638,028) |
| Net increase (decrease) | 27,840,680 | 4,849,903 | $303,757,567 | $54,424,562 |
11. Other.
A fund's organizational documents provide former and current trustees and officers with a limited indemnification against liabilities arising in connection with the performance of their duties to the fund. In the normal course of business, a fund may also enter into contracts that provide general indemnifications. A fund's maximum exposure under these arrangements is unknown as this would be dependent on future claims that may be made against a fund. The risk of material loss from such claims is considered remote.
In addition, at the end of the period, the following mutual funds managed by the investment adviser or its affiliates were the owners of record of 10% or more of the total outstanding shares.
| | Strategic Advisers Fidelity Core Income Fund |
| Fidelity Real Estate Income Fund | 25% |
12. Risk and Uncertainties.
Many factors affect a fund's performance. Developments that disrupt global economies and financial markets, such as pandemics, epidemics, outbreaks of infectious diseases, war, terrorism, and environmental disasters, may significantly affect a fund's investment performance. The effects of these developments to a fund will be impacted by the types of securities in which a fund invests, the financial condition, industry, economic sector, and geographic location of an issuer, and a fund's level of investment in the securities of that issuer. Significant concentrations in security types, issuers, industries, sectors, and geographic locations may magnify the factors that affect a fund's performance.
Report of Independent Registered Public Accounting Firm
To the Board of Trustees of Fidelity Securities Fund and the Shareholders of Fidelity Real Estate Income Fund:
Opinion on the Financial Statements and Financial Highlights
We have audited the accompanying statement of assets and liabilities of Fidelity Real Estate Income Fund (the "Fund"), a fund of Fidelity Securities Fund, including the schedule of investments, as of July 31, 2024, the related statement of operations for the year then ended, the statement of changes in net assets for each of the two years in the period then ended, the financial highlights for each of the five years in the period then ended, and the related notes. In our opinion, the financial statements and financial highlights present fairly, in all material respects, the financial position of the Fund as of July 31, 2024, and the results of its operations for the year then ended, the changes in its net assets for each of the two years in the period then ended, and the financial highlights for each of the five years in the period then ended in conformity with accounting principles generally accepted in the United States of America.
Basis for Opinion
These financial statements and financial highlights are the responsibility of the Fund's management. Our responsibility is to express an opinion on the Fund's financial statements and financial highlights based on our audits. We are a public accounting firm registered with the Public Company Accounting Oversight Board (United States) (PCAOB) and are required to be independent with respect to the Fund in accordance with the U.S. federal securities laws and the applicable rules and regulations of the Securities and Exchange Commission and the PCAOB.
We conducted our audits in accordance with the standards of the PCAOB. Those standards require that we plan and perform the audit to obtain reasonable assurance about whether the financial statements and financial highlights are free of material misstatement, whether due to error or fraud. The Fund is not required to have, nor were we engaged to perform, an audit of its internal control over financial reporting. As part of our audits, we are required to obtain an understanding of internal control over financial reporting but not for the purpose of expressing an opinion on the effectiveness of the Fund's internal control over financial reporting. Accordingly, we express no such opinion.
Our audits included performing procedures to assess the risks of material misstatement of the financial statements and financial highlights, whether due to error or fraud, and performing procedures that respond to those risks. Such procedures included examining, on a test basis, evidence regarding the amounts and disclosures in the financial statements and financial highlights. Our audits also included evaluating the accounting principles used and significant estimates made by management, as well as evaluating the overall presentation of the financial statements and financial highlights. Our procedures included confirmation of securities owned as of July 31, 2024, by correspondence with the custodian, brokers, and agent banks; when replies were not received from brokers and agent banks, we performed other auditing procedures. We believe that our audits provide a reasonable basis for our opinion.
/s/ Deloitte & Touche LLP
Boston, Massachusetts
September 16, 2024
We have served as the auditor of one or more of the Fidelity investment companies since 1999.
Distributions
(Unaudited)The dividend and capital gains distributions for the fund(s) are available on Fidelity.com or Institutional.Fidelity.com.
A total of 0.94% of the dividends distributed during the fiscal year was derived from interest on U.S. Government securities which is generally exempt from state income tax.
The fund designates $141,124,258 of distributions paid in the calendar year 2023 as qualifying to be taxed as interest-related dividends for nonresident alien shareholders.
The fund designates $141,799,708 of distributions paid during the fiscal year ended 2024 as qualifying to be taxed as section 163(j) interest dividends.
Class A, Class M, Class C, Real Estate Income, Class I and Class Z designate 1% of the dividends distributed in October and December, respectively during the fiscal year as qualifying for the dividends-received deduction for corporate shareholders.
Class A designates 1.14% and 1.83%; Class M designates 1.15% and 1.83%; Class C designates 1.39% and 2.11%; Real Estate Income designates 1.08% and 1.75%; Class I designates 1.08% and 1.75%; and Class Z designates 1.05% and 1.72%; of the dividends distributed in October and December, respectively during the fiscal year as amounts which may be taken into account as a dividend for purposes of the maximum rate under section 1(h)(11) of the Internal Revenue Code.
Class A designates 23.45%, 37.66%, 32.42%, and 32.08%; Class M designates 23.65%, 37.66%, 32.42%, and 32.34%; Class C designates 28.56%, 43.42%, 40.62%, and 38.80%; Real Estate Income designates 22.19%, 35.93%, 30.37%, and 30.18%; Class I designates 22.19%, 35.93%, 29.84%, and 30.18%; and Class Z designates 21.53%, 35.32%, 29.32%, and 29.31%; of the dividends distributed in October, December, April and July, respectively during the fiscal year as a section 199A dividend.
The fund will notify shareholders in January 2025 of amounts for use in preparing 2024 income tax returns.
Item 8: Changes in and Disagreements with Accountants for Open-End Management Investment Companies
Note: This is not applicable for any fund included in this document.
Item 9: Proxy Disclosures for Open-End Management Investment Companies
| A special meeting of shareholders was held on July 16, 2024. The results of votes taken among shareholders on the proposal before them are reported below. Each vote reported represents one dollar of net asset value held on the record date for the meeting. |
| Proposal 1 |
| To elect a Board of Trustees. |
| | # of Votes | % of Votes |
| Bettina Doulton |
| Affirmative | 88,756,759,992.17 | 95.11 |
| Withheld | 4,564,750,651.52 | 4.89 |
| TOTAL | 93,321,510,643.68 | 100.00 |
| Robert A. Lawrence |
| Affirmative | 88,523,438,331.98 | 94.86 |
| Withheld | 4,798,072,311.70 | 5.14 |
| TOTAL | 93,321,510,643.68 | 100.00 |
| Vijay C. Advani |
| Affirmative | 88,484,371,668.51 | 94.82 |
| Withheld | 4,837,138,975.17 | 5.18 |
| TOTAL | 93,321,510,643.68 | 100.00 |
| Thomas P. Bostick |
| Affirmative | 88,618,596,648.21 | 94.96 |
| Withheld | 4,702,913,995.47 | 5.04 |
| TOTAL | 93,321,510,643.68 | 100.00 |
| Donald F. Donahue |
| Affirmative | 88,542,403,002.79 | 94.88 |
| Withheld | 4,779,107,640.89 | 5.12 |
| TOTAL | 93,321,510,643.68 | 100.00 |
| Vicki L. Fuller |
| Affirmative | 88,788,711,037.44 | 95.14 |
| Withheld | 4,532,799,606.24 | 4.86 |
| TOTAL | 93,321,510,643.68 | 100.00 |
| Patricia L. Kampling |
| Affirmative | 88,819,315,996.59 | 95.18 |
| Withheld | 4,502,194,647.10 | 4.82 |
| TOTAL | 93,321,510,643.68 | 100.00 |
| Thomas A. Kennedy |
| Affirmative | 88,667,457,817.34 | 95.01 |
| Withheld | 4,654,052,826.34 | 4.99 |
| TOTAL | 93,321,510,643.68 | 100.00 |
| Oscar Munoz |
| Affirmative | 88,183,976,568.30 | 94.49 |
| Withheld | 5,137,534,075.39 | 5.51 |
| TOTAL | 93,321,510,643.68 | 100.00 |
| Karen B. Peetz |
| Affirmative | 88,720,160,318.58 | 95.07 |
| Withheld | 4,601,350,325.11 | 4.93 |
| TOTAL | 93,321,510,643.68 | 100.00 |
| David M. Thomas |
| Affirmative | 88,471,490,747.86 | 94.80 |
| Withheld | 4,850,019,895.82 | 5.20 |
| TOTAL | 93,321,510,643.68 | 100.00 |
| Susan Tomasky |
| Affirmative | 88,536,869,646.78 | 94.87 |
| Withheld | 4,784,640,996.90 | 5.13 |
| TOTAL | 93,321,510,643.68 | 100.00 |
| Michael E. Wiley |
| Affirmative | 88,526,906,267.86 | 94.86 |
| Withheld | 4,794,604,375.83 | 5.14 |
| TOTAL | 93,321,510,643.68 | 100.00 |
| | | |
| Proposal 1 reflects trust-wide proposal and voting results. |
Item 10: Remuneration Paid to Directors, Officers, and others of Open-End Management Investment Companies
Note: This information is disclosed as part of the financial statements for each Fund as part of Item 7: Financial Statements and Financial Highlights for Open-End Management Investment companies.
Item 11: Statement Regarding Basis for Approval of Investment Advisory Contract
Board Approval of Investment Advisory Contracts and Management Fees
Fidelity Real Estate Income Fund
Each year, the Board of Trustees, including the Independent Trustees (together, the Board), considers the renewal of the fund's management contract with Fidelity Management & Research Company LLC (FMR) and the sub-advisory agreements (together, the Advisory Contracts) for the fund. FMR and the sub-advisers are referred to herein as the Investment Advisers. The Board, assisted by the advice of fund counsel and Independent Trustees' counsel, requests and considers a broad range of information relevant to the renewal of the Advisory Contracts throughout the year.
The Board meets regularly and, at each of its meetings, covers an extensive agenda of topics and materials and considers factors that are relevant to its annual consideration of the renewal of the fund's Advisory Contracts, including the services and support provided to the fund and its shareholders. The Board, acting directly and through its Committees (each of which is composed of and chaired by Independent Trustees), requests and receives information concerning the annual consideration of the renewal of the fund's Advisory Contracts. The Board also meets as needed to review matters specifically related to the Board's annual consideration of the renewal of the Advisory Contracts. Members of the Board may also meet with trustees of other Fidelity funds through joint ad hoc committees to discuss certain matters relevant to all of the Fidelity funds.
At its May 2024 meeting, the Board unanimously determined to renew the fund's Advisory Contracts. In reaching its determination, the Board considered all factors it believed relevant, including (i) the nature, extent, and quality of the services provided to the fund and its shareholders (including the investment performance of the fund); (ii) the competitiveness relative to peer funds of the fund's management fee and the total expense ratio of a representative class (the retail class, which was selected because it was the largest class without 12b-1 fees); (iii) the total costs of the services provided by and the profits realized by FMR and its affiliates (Fidelity) from its relationships with the fund; and (iv) the extent to which, if any, economies of scale exist and are realized as the fund grows, and whether any economies of scale are appropriately shared with fund shareholders. The Board also considered the broad range of investment choices available to shareholders from FMR's competitors and that the fund's shareholders have chosen to invest in the fund, which is part of the Fidelity family of funds. The Board's decision to renew the Advisory Contracts was not based on any single factor.
The Board reached a determination, with the assistance of fund counsel and Independent Trustees' counsel and through the exercise of its business judgment, that the renewal of the Advisory Contracts was in the best interests of the fund and its shareholders and that the compensation payable under the Advisory Contracts was fair and reasonable in light of all of the surrounding circumstances.
Nature, Extent, and Quality of Services Provided. The Board considered staffing as it relates to the fund, including the backgrounds and experience of investment personnel of the Investment Advisers, and also considered the Investment Advisers' implementation of the fund's investment program. The Independent Trustees also had discussions with senior management of Fidelity's investment operations and investment groups. The Board considered the structure of the investment personnel compensation program and whether this structure provides appropriate incentives to act in the best interests of the fund. Additionally, the Board considered the portfolio managers' investments, if any, in the funds that they manage.
Resources Dedicated to Investment Management and Support Services. The Board and the Fund Oversight and Research Committees reviewed the general qualifications and capabilities of Fidelity's investment staff, including its size, education, experience, and resources, as well as Fidelity's approach to recruiting, training, managing, and compensating investment personnel. The Board noted the resources devoted to expansion of Fidelity's global investment organization, and that Fidelity's analysts have extensive resources, tools, and capabilities that allow them to conduct sophisticated quantitative and fundamental analysis, as well as credit analysis of issuers, counterparties, and guarantors. Further, the Board considered that Fidelity's investment professionals have sufficient access to global information and data so as to provide competitive investment results over time, and that those professionals also have access to sophisticated tools that permit them to assess portfolio construction and risk and performance attribution characteristics continuously, as well as to transmit new information and research conclusions rapidly around the world. Additionally, in its deliberations, the Board considered Fidelity's trading, risk management, compliance, and technology and operations capabilities and resources, which are integral parts of the investment management process.
Shareholder and Administrative Services. The Board considered (i) the nature, extent, quality, and cost of advisory, administrative, shareholder, transfer agency, and pricing and bookkeeping services performed by the Investment Advisers and their affiliates under the Advisory Contracts; (ii) the nature and extent of Fidelity's supervision of third party service providers, principally custodians, subcustodians, and pricing vendors; and (iii) the resources devoted by Fidelity to, and the record of compliance with, the fund's compliance policies and procedures. The Board also reviewed the allocation of fund brokerage, including allocations to brokers affiliated with the Investment Advisers, the use of brokerage commissions to pay fund expenses, and the use of "soft" commission dollars to pay for research services. The Board also considered the fund's securities lending activities and any payments made to Fidelity relating to securities lending under a separate agreement.
The Board noted that the growth of fund assets over time across the complex allows Fidelity to reinvest in the development of services designed to enhance the value and convenience of the Fidelity funds as investment vehicles. These services include 24-hour access to account information and market information over the Internet and through telephone representatives, investor education materials, and asset allocation tools. The Board also considered that it reviews customer service metrics such as telephone response times, continuity of services on the website and metrics addressing services at Fidelity Investor Centers.
Investment in a Large Fund Family. The Board considered the benefits to shareholders of investing in a fund that is part of a large family of funds offering a variety of investment disciplines and providing a large variety of fund investor services. The Board noted that Fidelity had taken, or had made recommendations that resulted in the Fidelity funds taking, a number of actions over the previous year that benefited particular funds and/or the Fidelity funds in general.
Investment Performance. The Board took into account discussions that occur with representatives of the Investment Advisers, and reports that it receives, at Board meetings throughout the year, relating to fund investment performance. In this regard the Board noted that as part of regularly scheduled fund reviews and other reports to the Board on fund performance, the Board considered annualized return information for the fund for different time periods, measured against an appropriate securities market index (benchmark index) and an appropriate peer group of funds with similar objectives (peer group). The Board also considered information about performance attribution. In its ongoing evaluation of fund investment performance, the Board gives particular attention to information indicating changes in performance of the funds over different time periods and discussed with the Investment Advisers the reasons for any overperformance or underperformance.
In addition to reviewing absolute and relative fund performance, the Independent Trustees periodically consider the appropriateness of fund performance metrics in evaluating the results achieved. The Independent Trustees generally give greater weight to fund performance over longer time periods than over shorter time periods. Depending on the circumstances, the Independent Trustees may be satisfied with a fund's performance notwithstanding that it lags its benchmark index or peer group for certain periods.
Based on its review, the Board concluded that the nature, extent, and quality of services provided to the fund under the Advisory Contracts should continue to benefit the shareholders of the fund.
Competitiveness of Management Fee and Total Expense Ratio. The Board was provided with information regarding industry trends in management fees and expenses. The Board considered that, effective March 1, 2024, an amended Advisory Contract with FMR went into effect with class-level management fees based on tiered schedules and subject to a maximum class-level rate (the management fee). The Board also considered that in exchange for the variable management fee, each class of the fund receives investment advisory, management, administrative, transfer agent, and pricing and bookkeeping services. In its review of the management fee and total expense ratio of the retail class, the Board considered a pro forma management fee rate the retail class as if it had been in effect for the 12-month period ended September 30, 2023, as well as other third-party fund expenses, as applicable, such as custodial, legal, and audit fees and any fund-paid 12b-1 fees. The Board noted that Fidelity may agree to waive fees or reimburse expenses from time to time, and the extent to which, if any, it has done so for the fund.
Comparisons of Management Fees and Total Expense Ratios. Among other things, the Board reviewed data for selected groups of competitive funds and classes (referred to as "mapped groups") that were compiled by Fidelity based on combining similar investment objective categories (as classified by Morningstar) that have comparable investment mandates. The data reviewed by the Board included (i) gross management fee comparisons (before taking into account expense reimbursements or caps) relative to the total universe of funds within the mapped group; (ii) gross management fee comparisons relative to a subset of non-Fidelity funds in the mapped group that are similar in size and management fee structure to the fund (referred to as the "asset size peer group"); (iii) total expense comparisons of the retail class of the fund relative to funds and classes in the mapped group that have a similar sales load structure to the retail class of the fund (referred to as the "similar sales load structure group"); and (iv) total expense comparisons of the retail class of the fund relative to funds and classes in the similar sales load structure group that are similar in size and management fee structure to the fund (referred to as the "total expense asset size peer group"). The total expense asset size peer group comparison excludes performance adjustments and fund-paid 12b-1 fees to eliminate variability in fee structures.
The information provided to the Board indicated that the fund's management fee rate ranked below the competitive median of the mapped group for the 12-month period ended September 30, 2023 and below the competitive median of the asset size peer group for the 12-month period ended September 30, 2023. Further, the information provided to the Board indicated that the total expense ratio of the retail class of the fund ranked below the competitive median of the similar sales load structure group for the 12-month period ended September 30, 2023 and below the competitive median of the total expense asset size peer group for the 12-month period ended September 30, 2023.
The Board noted that a different variable management fee rate is applicable to each class of the fund. The Board considered that the difference in management fee rates between classes is the result of separate arrangements for class-level services and/or waivers of certain expenses and not the result of any difference in advisory or custodial fees or other expenses related to the management of the fund's assets, which do not vary by class.
Fees Charged to Other Fidelity Clients. The Board also considered Fidelity fee structures and other information with respect to clients of Fidelity, such as other funds advised or subadvised by Fidelity, pension plan clients, and other institutional clients with similar mandates. The Board noted that a joint ad hoc committee created by it and the boards of other Fidelity funds periodically reviews and compares Fidelity's institutional investment advisory business with its business of providing services to the Fidelity funds and also noted the most recent findings of the committee. The Board noted that the committee's review included a consideration of the differences in services provided, fees charged, and costs incurred, as well as competition in the markets serving the different categories of clients.
Based on its review, the Board concluded that the fund's management fee is fair and reasonable in light of the services that the fund receives and the other factors considered. Further, based on its review of total expense ratios and fees charged to other Fidelity clients, the Board concluded that the total expense ratio of each class of the fund was reasonable in light of the services that the fund and its shareholders receive and the other factors considered.
Costs of the Services and Profitability. The Board considered the revenues earned and the expenses incurred by Fidelity in conducting the business of developing, marketing, distributing, managing, administering and servicing the fund and servicing the fund's shareholders. The Board also considered the level of Fidelity's profits in respect of all the Fidelity funds.
On an annual basis, Fidelity presents to the Board information about the profitability of its relationships with the fund. Fidelity calculates profitability information for each fund, as well as aggregate profitability information for groups of Fidelity funds and all Fidelity funds, using a series of detailed revenue and cost allocation methodologies which originate with the books and records of Fidelity on which Fidelity's audited financial statements are based. The Audit Committee of the Board reviews any significant changes from the prior year's methodologies and the full Board approves such changes.
A public accounting firm has been engaged annually by the Board as part of the Board's assessment of Fidelity's profitability analysis. The engagement includes the review and assessment of the methodologies used by Fidelity in determining the revenues and expenses attributable to Fidelity's fund business, and completion of agreed-upon procedures in respect of the mathematical accuracy of certain fund profitability information and its conformity to established allocation methodologies. After considering the reports issued under the engagement and information provided by Fidelity, the Board concluded that while other allocation methods may also be reasonable, Fidelity's profitability methodologies are reasonable in all material respects.
The Board also reviewed Fidelity's non-fund businesses and potential indirect benefits such businesses may have received as a result of their association with Fidelity's fund business (i.e., fall-out benefits) as well as cases where Fidelity's affiliates may benefit from the funds' business. The Board considered areas where potential indirect benefits to the Fidelity funds from their relationships with Fidelity may exist. The Board's consideration of these matters was informed by the findings of a joint ad hoc committee created by it and the boards of other Fidelity funds to evaluate potential fall-out benefits.
The Board considered the costs of the services provided by and the profits realized by Fidelity in connection with the operation of the fund and was satisfied that the profitability was not excessive.
Economies of Scale. The Board considered whether there have been economies of scale in respect of the management of the Fidelity funds, whether the Fidelity funds (including the fund) have appropriately benefited from any such economies of scale, and whether there is potential for realization of any further economies of scale. The Board considered the extent to which the fund will benefit from economies of scale as assets grow through increased services to the fund, through waivers or reimbursements, or through fee or expense ratio reductions. The Board also noted that a committee created by it and the boards of other Fidelity funds periodically analyzes whether Fidelity attains economies of scale in respect of the management and servicing of the Fidelity funds, whether the Fidelity funds have appropriately benefited from such economies of scale, and whether there is potential for realization of any further economies of scale.
The Board recognized that the fund's management contract incorporates a variable management fee structure, which provides breakpoints as a way to share, in part, any potential economies of scale that may exist at the asset class level and through a discount that considers both fund size and total assets of the four applicable asset classes. The Board considered that the variable management fee is designed to deliver the benefits of economies of scale to fund shareholders even if assets of any particular fund are unchanged or have declined, because some portion of Fidelity's costs are attributable to services provided to all funds subject to the variable management fee, and all such funds benefit if those costs can be allocated among more assets. The Board concluded that, given the variable management fee structure, fund shareholders will benefit from lower management fees due to the application of the breakpoints and discount factor, regardless of whether Fidelity achieves any such economies of scale.
The Board concluded, taking into account the analysis of the committee, that economies of scale, if any, are being appropriately shared between fund shareholders and Fidelity.
Additional Information Requested by the Board. In order to develop fully the factual basis for consideration of the Fidelity funds' advisory contracts, the Board requested and received additional information on certain topics, including but not limited to: (i) fund flow and performance trends, in particular the underperformance of certain funds and strategies, and Fidelity's long-term strategies for certain funds; (ii) the operation of performance fees and the rationale for implementing performance fees on certain categories of funds but not others; (iii) Fidelity's pricing philosophy compared to competitors; (iv) fund profitability methodology and data; (v) evaluation of competitive fund data and peer group classifications and fee and expense comparisons; (vi) the management fee and expense structures for different funds and classes and information about the differences between various fee and expense structures; (vii) the variable management fee implemented for certain funds effective March 1, 2024; and (viii) information regarding other accounts managed by Fidelity and the funds' sub-advisory arrangements.
Conclusion. Based on its evaluation of all of the conclusions noted above, and after considering all factors it believed relevant, the Board, including the Independent Trustees, concluded that the advisory and sub-advisory fee arrangements are fair and reasonable in light of all of the surrounding circumstances and that the fund's Advisory Contracts should be renewed through May 31, 2025.
1.788862.121
REI-ANN-0924
Fidelity® Leveraged Company Stock Fund
Annual Report
July 31, 2024
Contents
To view a fund's proxy voting guidelines and proxy voting record for the 12-month period ended June 30, visit http://www.fidelity.com/proxyvotingresults or visit the Securities and Exchange Commission's (SEC) web site at http://www.sec.gov.
You may also call 1-800-544-8544 if you're an individual investing directly with Fidelity, call 1-800-835-5092 if you're a plan sponsor or participant with Fidelity as your recordkeeper or call 1-877-208-0098 on institutional accounts or if you're an advisor or invest through one to request a free copy of the proxy voting guidelines.
Standard & Poor's, S&P and S&P 500 are registered service marks of The McGraw-Hill Companies, Inc. and have been licensed for use by Fidelity Distributors Corporation.
Other third-party marks appearing herein are the property of their respective owners.
All other marks appearing herein are registered or unregistered trademarks or service marks of FMR LLC or an affiliated company. © 2024 FMR LLC. All rights reserved.
This report and the financial statements contained herein are submitted for the general information of the shareholders of the Fund. This report is not authorized for distribution to prospective investors in the Fund unless preceded or accompanied by an effective prospectus.
A fund files its complete schedule of portfolio holdings with the SEC for the first and third quarters of each fiscal year on Form N-PORT. Forms N-PORT are available on the SEC's web site at http://www.sec.gov. A fund's Forms N-PORT may be reviewed and copied at the SEC's Public Reference Room in Washington, DC. Information regarding the operation of the SEC's Public Reference Room may be obtained by calling 1-800-SEC-0330.
For a complete list of a fund's portfolio holdings, view the most recent holdings listing, semiannual report, or annual report on Fidelity's web site at http://www.fidelity.com, http://www.institutional.fidelity.com, or http://www.401k.com, as applicable.
NOT FDIC INSURED •MAY LOSE VALUE •NO BANK GUARANTEE
Neither the Fund nor Fidelity Distributors Corporation is a bank.
Item 7: Financial Statements and Financial Highlights for Open-End Management Investment Companies (Annual Report)
Fidelity® Leveraged Company Stock Fund
Schedule of Investments July 31, 2024
Showing Percentage of Net Assets
| Common Stocks - 99.5% |
| | | Shares | Value ($) (000s) |
| COMMUNICATION SERVICES - 6.6% | | | |
| Entertainment - 1.3% | | | |
| Netflix, Inc. (a) | | 50,600 | 31,795 |
| Warner Bros Discovery, Inc. (a) | | 423,900 | 3,667 |
| | | | 35,462 |
| Interactive Media & Services - 5.3% | | | |
| Alphabet, Inc. Class A | | 83,100 | 14,255 |
| Cars.com, Inc. (a) | | 475,000 | 9,795 |
| Meta Platforms, Inc. Class A | | 209,700 | 99,572 |
| Pinterest, Inc. Class A (a) | | 584,100 | 18,662 |
| | | | 142,284 |
TOTAL COMMUNICATION SERVICES | | | 177,746 |
| CONSUMER DISCRETIONARY - 15.6% | | | |
| Automobiles - 1.9% | | | |
| BYD Co. Ltd. (H Shares) | | 1,715,500 | 50,787 |
| Broadline Retail - 1.9% | | | |
| Amazon.com, Inc. (a) | | 267,800 | 50,073 |
| Hotels, Restaurants & Leisure - 4.3% | | | |
| Airbnb, Inc. Class A (a) | | 118,100 | 16,482 |
| Booking Holdings, Inc. | | 3,200 | 11,888 |
| Boyd Gaming Corp. | | 495,522 | 30,162 |
| Flutter Entertainment PLC (a) | | 61,200 | 12,096 |
| Red Rock Resorts, Inc. | | 598,700 | 34,126 |
| Studio City International Holdings Ltd.: | | | |
| ADR (a)(b) | | 631,958 | 4,258 |
| (NYSE) ADR (a) | | 692,929 | 4,668 |
| Viking Holdings Ltd. | | 25,300 | 903 |
| | | | 114,583 |
| Household Durables - 2.5% | | | |
| D.R. Horton, Inc. | | 42,600 | 7,665 |
| PulteGroup, Inc. | | 70,300 | 9,280 |
| TopBuild Corp. (a) | | 105,800 | 50,630 |
| | | | 67,575 |
| Specialty Retail - 3.3% | | | |
| Dick's Sporting Goods, Inc. | | 166,200 | 35,957 |
| Lowe's Companies, Inc. | | 73,700 | 18,094 |
| Valvoline, Inc. (a) | | 301,800 | 14,034 |
| Williams-Sonoma, Inc. | | 134,400 | 20,789 |
| | | | 88,874 |
| Textiles, Apparel & Luxury Goods - 1.7% | | | |
| Crocs, Inc. (a) | | 314,900 | 42,313 |
| Tapestry, Inc. | | 38,616 | 1,548 |
| | | | 43,861 |
TOTAL CONSUMER DISCRETIONARY | | | 415,753 |
| CONSUMER STAPLES - 2.4% | | | |
| Beverages - 0.3% | | | |
| Celsius Holdings, Inc. (a) | | 190,200 | 8,907 |
| Consumer Staples Distribution & Retail - 1.4% | | | |
| Performance Food Group Co. (a) | | 77,000 | 5,313 |
| U.S. Foods Holding Corp. (a) | | 562,200 | 30,578 |
| | | | 35,891 |
| Personal Care Products - 0.7% | | | |
| elf Beauty, Inc. (a) | | 106,700 | 18,414 |
TOTAL CONSUMER STAPLES | | | 63,212 |
| ENERGY - 4.1% | | | |
| Oil, Gas & Consumable Fuels - 4.1% | | | |
| Antero Resources Corp. (a) | | 582,800 | 16,913 |
| Canadian Natural Resources Ltd. | | 305,400 | 10,843 |
| Cheniere Energy, Inc. | | 312,522 | 57,079 |
| Diamondback Energy, Inc. | | 76,500 | 15,477 |
| Permian Resource Corp. Class A | | 618,800 | 9,492 |
| | | | 109,804 |
| FINANCIALS - 15.4% | | | |
| Capital Markets - 3.1% | | | |
| Ares Management Corp. Class A, | | 146,600 | 22,459 |
| Blue Owl Capital, Inc. Class A | | 1,159,200 | 22,106 |
| Coinbase Global, Inc. (a) | | 65,500 | 14,696 |
| Moody's Corp. | | 52,300 | 23,874 |
| | | | 83,135 |
| Consumer Finance - 1.4% | | | |
| OneMain Holdings, Inc. | | 729,900 | 38,145 |
| Financial Services - 6.8% | | | |
| Apollo Global Management, Inc. | | 620,800 | 77,792 |
| Block, Inc. Class A (a) | | 331,900 | 20,538 |
| Fiserv, Inc. (a) | | 175,400 | 28,690 |
| MasterCard, Inc. Class A | | 43,000 | 19,940 |
| Visa, Inc. Class A | | 131,000 | 34,803 |
| | | | 181,763 |
| Insurance - 4.1% | | | |
| Arthur J. Gallagher & Co. | | 381,000 | 108,010 |
TOTAL FINANCIALS | | | 411,053 |
| HEALTH CARE - 1.7% | | | |
| Health Care Equipment & Supplies - 1.1% | | | |
| Boston Scientific Corp. (a) | | 394,900 | 29,175 |
| Health Care Providers & Services - 0.6% | | | |
| Tenet Healthcare Corp. (a) | | 102,109 | 15,286 |
TOTAL HEALTH CARE | | | 44,461 |
| INDUSTRIALS - 17.0% | | | |
| Aerospace & Defense - 0.8% | | | |
| TransDigm Group, Inc. | | 16,100 | 20,837 |
| Building Products - 3.9% | | | |
| Builders FirstSource, Inc. (a) | | 117,900 | 19,733 |
| Carlisle Companies, Inc. | | 74,700 | 31,268 |
| Fortune Brands Innovations, Inc. | | 348,000 | 28,122 |
| Trane Technologies PLC | | 75,000 | 25,071 |
| | | | 104,194 |
| Construction & Engineering - 3.2% | | | |
| Comfort Systems U.S.A., Inc. | | 101,700 | 33,807 |
| EMCOR Group, Inc. | | 58,700 | 22,038 |
| Willscot Holdings Corp. (a) | | 695,800 | 28,528 |
| | | | 84,373 |
| Electrical Equipment - 3.7% | | | |
| Eaton Corp. PLC | | 105,700 | 32,216 |
| Nextracker, Inc. Class A (a) | | 100,800 | 4,953 |
| nVent Electric PLC | | 375,300 | 27,258 |
| Vertiv Holdings Co. | | 443,100 | 34,872 |
| | | | 99,299 |
| Ground Transportation - 0.6% | | | |
| Uber Technologies, Inc. (a) | | 262,800 | 16,943 |
| Machinery - 2.1% | | | |
| Parker Hannifin Corp. | | 102,100 | 57,294 |
| Marine Transportation - 0.0% | | | |
| Genco Shipping & Trading Ltd. | | 831 | 16 |
| Passenger Airlines - 0.3% | | | |
| Air Canada (a) | | 342,300 | 3,945 |
| Delta Air Lines, Inc. | | 103,500 | 4,453 |
| | | | 8,398 |
| Trading Companies & Distributors - 2.4% | | | |
| Ashtead Group PLC | | 197,100 | 14,194 |
| Core & Main, Inc. (a) | | 216,200 | 11,560 |
| FTAI Aviation Ltd. | | 210,100 | 23,416 |
| United Rentals, Inc. | | 18,100 | 13,704 |
| | | | 62,874 |
TOTAL INDUSTRIALS | | | 454,228 |
| INFORMATION TECHNOLOGY - 25.3% | | | |
| Communications Equipment - 1.0% | | | |
| Arista Networks, Inc. (a) | | 78,100 | 27,066 |
| Semiconductors & Semiconductor Equipment - 15.2% | | | |
| ASML Holding NV (depository receipt) | | 19,600 | 18,359 |
| Broadcom, Inc. | | 210,000 | 33,743 |
| KLA Corp. | | 14,100 | 11,605 |
| Lam Research Corp. | | 32,200 | 29,664 |
| Marvell Technology, Inc. | | 286,800 | 19,210 |
| Microchip Technology, Inc. | | 123,800 | 10,991 |
| Micron Technology, Inc. | | 236,700 | 25,994 |
| MKS Instruments, Inc. | | 215,000 | 27,069 |
| NVIDIA Corp. | | 1,080,000 | 126,379 |
| NXP Semiconductors NV | | 97,700 | 25,711 |
| ON Semiconductor Corp. (a) | | 662,759 | 51,861 |
| Taiwan Semiconductor Manufacturing Co. Ltd. sponsored ADR | | 156,400 | 25,931 |
| | | | 406,517 |
| Software - 8.3% | | | |
| Adobe, Inc. (a) | | 48,600 | 26,810 |
| DoubleVerify Holdings, Inc. (a) | | 438,100 | 9,253 |
| Gen Digital, Inc. | | 265,700 | 6,906 |
| Microsoft Corp. | | 192,600 | 80,574 |
| Monday.com Ltd. (a) | | 63,600 | 14,616 |
| Oracle Corp. | | 192,800 | 26,886 |
| Palo Alto Networks, Inc. (a) | | 79,200 | 25,719 |
| Salesforce, Inc. | | 68,100 | 17,624 |
| UiPath, Inc. Class A (a) | | 1,011,800 | 12,314 |
| | | | 220,702 |
| Technology Hardware, Storage & Peripherals - 0.8% | | | |
| Dell Technologies, Inc. | | 180,900 | 20,565 |
TOTAL INFORMATION TECHNOLOGY | | | 674,850 |
| MATERIALS - 4.7% | | | |
| Chemicals - 0.8% | | | |
| The Chemours Co. LLC | | 542,928 | 13,123 |
| Westlake Corp. | | 46,200 | 6,831 |
| | | | 19,954 |
| Construction Materials - 2.2% | | | |
| Eagle Materials, Inc. | | 140,000 | 38,122 |
| Martin Marietta Materials, Inc. | | 35,800 | 21,242 |
| | | | 59,364 |
| Containers & Packaging - 0.8% | | | |
| Graphic Packaging Holding Co. | | 668,800 | 20,131 |
| Metals & Mining - 0.9% | | | |
| ATI, Inc. (a) | | 370,200 | 25,066 |
TOTAL MATERIALS | | | 124,515 |
| UTILITIES - 6.7% | | | |
| Electric Utilities - 3.9% | | | |
| Constellation Energy Corp. | | 329,000 | 62,444 |
| PG&E Corp. | | 2,317,002 | 42,285 |
| | | | 104,729 |
| Independent Power and Renewable Electricity Producers - 2.8% | | | |
| Vistra Corp. | | 953,400 | 75,528 |
TOTAL UTILITIES | | | 180,257 |
| TOTAL COMMON STOCKS (Cost $1,827,037) | | | 2,655,879 |
| | | | |
| Money Market Funds - 0.7% |
| | | Shares | Value ($) (000s) |
Fidelity Cash Central Fund 5.39% (c) (Cost $17,797) | | 17,793,917 | 17,797 |
| | | | |
| TOTAL INVESTMENT IN SECURITIES - 100.2% (Cost $1,844,834) | 2,673,676 |
NET OTHER ASSETS (LIABILITIES) - (0.2)% | (5,758) |
| NET ASSETS - 100.0% | 2,667,918 |
| | |
Any values shown as $0 in the Schedule of Investments may reflect amounts less than $500.
Legend
| (b) | Security exempt from registration under Rule 144A of the Securities Act of 1933. These securities may be resold in transactions exempt from registration, normally to qualified institutional buyers. At the end of the period, the value of these securities amounted to $4,258,000 or 0.2% of net assets. |
| (c) | Affiliated fund that is generally available only to investment companies and other accounts managed by Fidelity Investments. The rate quoted is the annualized seven-day yield of the fund at period end. A complete unaudited listing of the fund's holdings as of its most recent quarter end is available upon request. In addition, each Fidelity Central Fund's financial statements, which are not covered by the Fund's Report of Independent Registered Public Accounting Firm, are available on the SEC's website or upon request. |
Affiliated Central Funds
Fiscal year to date information regarding the Fund's investments in Fidelity Central Funds, including the ownership percentage, is presented below.
| Affiliate (Amounts in thousands) | Value, beginning of period ($) | Purchases ($) | Sales Proceeds ($) | Dividend Income ($) | Realized Gain (loss) ($) | Change in Unrealized appreciation (depreciation) ($) | Value, end of period ($) | % ownership, end of period |
| Fidelity Cash Central Fund 5.39% | 29,145 | 692,383 | 703,730 | 2,140 | 2 | (3) | 17,797 | 0.0% |
| Fidelity Securities Lending Cash Central Fund 5.39% | 5,568 | 485,530 | 491,098 | 17 | - | - | - | 0.0% |
| Total | 34,713 | 1,177,913 | 1,194,828 | 2,157 | 2 | (3) | 17,797 | |
| | | | | | | | | |
Amounts in the dividend income column in the above table include any capital gain distributions from underlying funds, which are presented in the corresponding line item in the Statement of Operations, if applicable.
Amounts in the dividend income column for Fidelity Securities Lending Cash Central Fund represents the income earned on investing cash collateral, less rebates paid to borrowers and any lending agent fees associated with the loan, plus any premium payments received for lending certain types of securities.
Amounts included in the purchases and sales proceeds columns may include in-kind transactions, if applicable.
Investment Valuation
The following is a summary of the inputs used, as of July 31, 2024, involving the Fund's assets and liabilities carried at fair value. The inputs or methodology used for valuing securities may not be an indication of the risk associated with investing in those securities. For more information on valuation inputs, and their aggregation into the levels used below, please refer to the Investment Valuation section in the accompanying Notes to Financial Statements.
| Valuation Inputs at Reporting Date: |
Description (Amounts in thousands) | Total ($) | Level 1 ($) | Level 2 ($) | Level 3 ($) |
Investments in Securities: | | | | |
|
| Equities: | | | | |
Communication Services | 177,746 | 177,746 | - | - |
Consumer Discretionary | 415,753 | 364,966 | 50,787 | - |
Consumer Staples | 63,212 | 63,212 | - | - |
Energy | 109,804 | 109,804 | - | - |
Financials | 411,053 | 411,053 | - | - |
Health Care | 44,461 | 44,461 | - | - |
Industrials | 454,228 | 454,228 | - | - |
Information Technology | 674,850 | 674,850 | - | - |
Materials | 124,515 | 124,515 | - | - |
Utilities | 180,257 | 180,257 | - | - |
|
| Money Market Funds | 17,797 | 17,797 | - | - |
| Total Investments in Securities: | 2,673,676 | 2,622,889 | 50,787 | - |
Financial Statements
| Statement of Assets and Liabilities |
As of July 31, 2024 Amounts in thousands (except per-share amounts) |
| Assets | | | | |
| Investment in securities, at value - See accompanying schedule: | | | | |
Unaffiliated issuers (cost $1,827,037) | $ | 2,655,879 | | |
Fidelity Central Funds (cost $17,797) | | 17,797 | | |
| | | | | |
| | | | | |
| Total Investment in Securities (cost $1,844,834) | | | $ | 2,673,676 |
| Receivable for investments sold | | | | 2,061 |
| Receivable for fund shares sold | | | | 233 |
| Dividends receivable | | | | 404 |
| Distributions receivable from Fidelity Central Funds | | | | 158 |
| Prepaid expenses | | | | 1 |
Total assets | | | | 2,676,533 |
| Liabilities | | | | |
| Payable for fund shares redeemed | $ | 6,997 | | |
| Accrued management fee | | 1,529 | | |
| Other payables and accrued expenses | | 89 | | |
| Total liabilities | | | | 8,615 |
| Net Assets | | | $ | 2,667,918 |
| Net Assets consist of: | | | | |
| Paid in capital | | | $ | 1,594,799 |
| Total accumulated earnings (loss) | | | | 1,073,119 |
| Net Assets | | | $ | 2,667,918 |
| | | | | |
| Net Asset Value and Maximum Offering Price | | | | |
| Leveraged Company Stock : | | | | |
Net Asset Value, offering price and redemption price per share ($2,512,446 ÷ 61,461 shares) | | | $ | 40.88 |
| Class K : | | | | |
Net Asset Value, offering price and redemption price per share ($155,472 ÷ 3,780 shares) | | | $ | 41.13 |
| Statement of Operations |
| Year ended July 31, 2024 Amounts in thousands |
| Investment Income | | | | |
| Dividends | | | $ | 21,437 |
| Income from Fidelity Central Funds (including $17 from security lending) | | | | 2,157 |
| Total income | | | | 23,594 |
| Expenses | | | | |
| Management fee | $ | 13,817 | | |
| Transfer agent fees | | 1,517 | | |
| Accounting fees | | 314 | | |
| Custodian fees and expenses | | 45 | | |
| Independent trustees' fees and expenses | | 10 | | |
| Registration fees | | 90 | | |
| Audit fees | | 65 | | |
| Legal | | 3 | | |
| Interest | | 1 | | |
| Miscellaneous | | 34 | | |
| Total expenses before reductions | | 15,896 | | |
| Expense reductions | | (130) | | |
| Total expenses after reductions | | | | 15,766 |
| Net Investment income (loss) | | | | 7,828 |
| Realized and Unrealized Gain (Loss) | | | | |
| Net realized gain (loss) on: | | | | |
| Investment Securities: | | | | |
| Unaffiliated issuers | | 329,060 | | |
| Fidelity Central Funds | | 2 | | |
| Foreign currency transactions | | (40) | | |
| Total net realized gain (loss) | | | | 329,022 |
| Change in net unrealized appreciation (depreciation) on: | | | | |
| Investment Securities: | | | | |
| Unaffiliated issuers | | 97,256 | | |
| Fidelity Central Funds | | (3) | | |
| Assets and liabilities in foreign currencies | | 2 | | |
| Total change in net unrealized appreciation (depreciation) | | | | 97,255 |
| Net gain (loss) | | | | 426,277 |
| Net increase (decrease) in net assets resulting from operations | | | $ | 434,105 |
| Statement of Changes in Net Assets |
| |
| Amount in thousands | | Year ended July 31, 2024 | | Year ended July 31, 2023 |
| Increase (Decrease) in Net Assets | | | | |
| Operations | | | | |
| Net investment income (loss) | $ | 7,828 | $ | 17,110 |
| Net realized gain (loss) | | 329,022 | | 264,921 |
| Change in net unrealized appreciation (depreciation) | | 97,255 | | (80,146) |
| Net increase (decrease) in net assets resulting from operations | | 434,105 | | 201,885 |
| Distributions to shareholders | | (234,459) | | (321,039) |
| | | | | |
| Share transactions - net increase (decrease) | | 396,301 | | (19,247) |
| Total increase (decrease) in net assets | | 595,947 | | (138,401) |
| | | | | |
| Net Assets | | | | |
| Beginning of period | | 2,071,971 | | 2,210,372 |
| End of period | $ | 2,667,918 | $ | 2,071,971 |
| | | | | |
| | | | | |
Financial Highlights
Fidelity® Leveraged Company Stock Fund |
| |
| Years ended July 31, | | 2024 | | 2023 | | 2022 | | 2021 | | 2020 |
Selected Per-Share Data | | | | | | | | | | |
| Net asset value, beginning of period | $ | 37.87 | $ | 39.65 | $ | 48.37 | $ | 30.88 | $ | 29.94 |
| Income from Investment Operations | | | | | | | | | | |
Net investment income (loss) A,B | | .13 | | .30 | | .17 | | .03 C | | .08 D |
| Net realized and unrealized gain (loss) | | 7.13 | | 3.69 E | | (4.89) | | 17.50 | | .89 |
| Total from investment operations | | 7.26 | | 3.99 | | (4.72) | | 17.53 | | .97 |
| Distributions from net investment income | | (.22) | | (.25) | | (.12) | | (.04) | | (.03) |
| Distributions from net realized gain | | (4.04) | | (5.52) | | (3.89) | | - | | - |
| Total distributions | | (4.25) F | | (5.77) | | (4.00) F | | (.04) | | (.03) |
| Net asset value, end of period | $ | 40.88 | $ | 37.87 | $ | 39.65 | $ | 48.37 | $ | 30.88 |
Total Return G | | | | 12.01% E | | (10.85)% | | 56.84% | | 3.24% |
Ratios to Average Net Assets B,H,I | | | | | | | | | | |
| Expenses before reductions | | .73% | | .75% | | .74% | | .75% | | .78% |
| Expenses net of fee waivers, if any | | | | .74% | | .74% | | .75% | | .78% |
| Expenses net of all reductions | | .72% | | .74% | | .74% | | .75% | | .77% |
| Net investment income (loss) | | .35% | | .87% | | .38% | | .06% C | | .27% D |
| Supplemental Data | | | | | | | | | | |
| Net assets, end of period (in millions) | $ | 2,512 | $ | 1,934 | $ | 1,937 | $ | 2,534 | $ | 1,631 |
Portfolio turnover rate J | | | | 58% | | 26% | | 15% | | 31% |
ACalculated based on average shares outstanding during the period.
BNet investment income (loss) is affected by the timing of the declaration of dividends by any underlying mutual funds or exchange-traded funds (ETFs). Net investment income (loss) of any mutual funds or ETFs is not included in the Fund's net investment income (loss) ratio.
CNet investment income per share reflects one or more large, non-recurring dividend(s) which amounted to $.05 per share. Excluding such non-recurring dividend(s), the ratio of net investment income (loss) to average net assets would have been (.05)%.
DNet investment income per share reflects one or more large, non-recurring dividend(s) which amounted to $.03 per share. Excluding such non-recurring dividend(s), the ratio of net investment income (loss) to average net assets would have been .16%.
ENet realized and unrealized gain (loss) per share reflects proceeds received from litigation which amounted to $.02 per share. Excluding these litigation proceeds, the total return would have been 11.96%.
FTotal distributions per share do not sum due to rounding.
GTotal returns would have been lower if certain expenses had not been reduced during the applicable periods shown.
HFees and expenses of any underlying mutual funds or exchange-traded funds (ETFs) are not included in the Fund's expense ratio. The Fund indirectly bears its proportionate share of these expenses. For additional expense information related to investments in Fidelity Central Funds, please refer to the "Investments in Fidelity Central Funds" note found in the Notes to Financial Statements section of the most recent Annual or Semi-Annual report.
IExpense ratios reflect operating expenses of the class. Expenses before reductions do not reflect amounts reimbursed, waived, or reduced through arrangements with the investment adviser, brokerage services, or other offset arrangements, if applicable, and do not represent the amount paid by the class during periods when reimbursements, waivers or reductions occur.
JAmount does not include the portfolio activity of any underlying mutual funds or exchange-traded funds (ETFs).
Fidelity® Leveraged Company Stock Fund Class K |
| |
| Years ended July 31, | | 2024 | | 2023 | | 2022 | | 2021 | | 2020 |
Selected Per-Share Data | | | | | | | | | | |
| Net asset value, beginning of period | $ | 38.08 | $ | 39.84 | $ | 48.58 | $ | 31.01 | $ | 30.04 |
| Income from Investment Operations | | | | | | | | | | |
Net investment income (loss) A,B | | .17 | | .33 | | .21 | | .06 C | | .11 D |
| Net realized and unrealized gain (loss) | | 7.16 | | 3.72 E | | (4.91) | | 17.59 | | .91 |
| Total from investment operations | | 7.33 | | 4.05 | | (4.70) | | 17.65 | | 1.02 |
| Distributions from net investment income | | (.25) | | (.28) | | (.16) | | (.08) | | (.05) |
| Distributions from net realized gain | | (4.04) | | (5.52) | | (3.89) | | - | | - |
| Total distributions | | (4.28) F | | (5.81) F | | (4.04) F | | (.08) | | (.05) |
| Net asset value, end of period | $ | 41.13 | $ | 38.08 | $ | 39.84 | $ | 48.58 | $ | 31.01 |
Total Return G | | | | 12.11% E | | (10.77)% | | 57.00% | | 3.38% |
Ratios to Average Net Assets B,H,I | | | | | | | | | | |
| Expenses before reductions | | .63% | | .65% | | .65% | | .66% | | .67% |
| Expenses net of fee waivers, if any | | | | .65% | | .65% | | .66% | | .67% |
| Expenses net of all reductions | | .62% | | .65% | | .65% | | .66% | | .66% |
| Net investment income (loss) | | .45% | | .96% | | .47% | | .15% C | | .38% D |
| Supplemental Data | | | | | | | | | | |
| Net assets, end of period (in millions) | $ | 155 | $ | 138 | $ | 274 | $ | 362 | $ | 285 |
Portfolio turnover rate J | | | | 58% | | 26% | | 15% | | 31% |
ACalculated based on average shares outstanding during the period.
BNet investment income (loss) is affected by the timing of the declaration of dividends by any underlying mutual funds or exchange-traded funds (ETFs). Net investment income (loss) of any mutual funds or ETFs is not included in the Fund's net investment income (loss) ratio.
CNet investment income per share reflects one or more large, non-recurring dividend(s) which amounted to $.05 per share. Excluding such non-recurring dividend(s), the ratio of net investment income (loss) to average net assets would have been .05%.
DNet investment income per share reflects one or more large, non-recurring dividend(s) which amounted to $.03 per share. Excluding such non-recurring dividend(s), the ratio of net investment income (loss) to average net assets would have been .27%.
ENet realized and unrealized gain (loss) per share reflects proceeds received from litigation which amounted to $.02 per share. Excluding these litigation proceeds, the total return would have been 12.06%.
FTotal distributions per share do not sum due to rounding.
GTotal returns would have been lower if certain expenses had not been reduced during the applicable periods shown.
HFees and expenses of any underlying mutual funds or exchange-traded funds (ETFs) are not included in the Fund's expense ratio. The Fund indirectly bears its proportionate share of these expenses. For additional expense information related to investments in Fidelity Central Funds, please refer to the "Investments in Fidelity Central Funds" note found in the Notes to Financial Statements section of the most recent Annual or Semi-Annual report.
IExpense ratios reflect operating expenses of the class. Expenses before reductions do not reflect amounts reimbursed, waived, or reduced through arrangements with the investment adviser, brokerage services, or other offset arrangements, if applicable, and do not represent the amount paid by the class during periods when reimbursements, waivers or reductions occur.
JAmount does not include the portfolio activity of any underlying mutual funds or exchange-traded funds (ETFs).
Notes to Financial Statements
For the period ended July 31, 2024
(Amounts in thousands except percentages)
1. Organization.
Fidelity Leveraged Company Stock Fund (the Fund) is a fund of Fidelity Securities Fund (the Trust) and is authorized to issue an unlimited number of shares. The Trust is registered under the Investment Company Act of 1940, as amended (the 1940 Act), as an open-end management investment company organized as a Massachusetts business trust. The Fund offers Leveraged Company Stock and Class K shares, each of which has equal rights as to assets and voting privileges. Each class has exclusive voting rights with respect to matters that affect that class.
2. Investments in Fidelity Central Funds.
Funds may invest in Fidelity Central Funds, which are open-end investment companies generally available only to other investment companies and accounts managed by the investment adviser and its affiliates. The Schedule of Investments lists any Fidelity Central Funds held as an investment as of period end, but does not include the underlying holdings of each Fidelity Central Fund. An investing fund indirectly bears its proportionate share of the expenses of the underlying Fidelity Central Funds.
Based on its investment objective, each Fidelity Central Fund may invest or participate in various investment vehicles or strategies that are similar to those of the investing fund. These strategies are consistent with the investment objectives of the investing fund and may involve certain economic risks which may cause a decline in value of each of the Fidelity Central Funds and thus a decline in the value of the investing fund.
| Fidelity Central Fund | Investment Manager | Investment Objective | Investment Practices | Expense RatioA |
| Fidelity Money Market Central Funds | Fidelity Management & Research Company LLC (FMR) | Each fund seeks to obtain a high level of current income consistent with the preservation of capital and liquidity. | Short-term Investments | Less than .005% |
A Expenses expressed as a percentage of average net assets and are as of each underlying Central Fund's most recent annual or semi-annual shareholder report.
A complete unaudited list of holdings for each Fidelity Central Fund is available upon request or at the Securities and Exchange Commission website at www.sec.gov. In addition, the financial statements of the Fidelity Central Funds which contain the significant accounting policies (including investment valuation policies) of those funds, and are not covered by the Report of Independent Registered Public Accounting Firm, are available on the Securities and Exchange Commission website or upon request.
3. Significant Accounting Policies.
The Fund is an investment company and applies the accounting and reporting guidance of the Financial Accounting Standards Board (FASB) Accounting Standards Codification Topic 946 Financial Services - Investment Companies. The financial statements have been prepared in conformity with accounting principles generally accepted in the United States of America (GAAP), which require management to make certain estimates and assumptions at the date of the financial statements. Actual results could differ from those estimates. Subsequent events, if any, through the date that the financial statements were issued have been evaluated in the preparation of the financial statements. The Fund's Schedule of Investments lists any underlying mutual funds or exchange-traded funds (ETFs) but does not include the underlying holdings of these funds. The following summarizes the significant accounting policies of the Fund:
Investment Valuation. Investments are valued as of 4:00 p.m. Eastern time on the last calendar day of the period. The Board of Trustees (the Board) has designated the Fund's investment adviser as the valuation designee responsible for the fair valuation function and performing fair value determinations as needed. The investment adviser has established a Fair Value Committee (the Committee) to carry out the day-to-day fair valuation responsibilities and has adopted policies and procedures to govern the fair valuation process and the activities of the Committee. In accordance with these fair valuation policies and procedures, which have been approved by the Board, the Fund attempts to obtain prices from one or more third party pricing services or brokers to value its investments. When current market prices, quotations or currency exchange rates are not readily available or reliable, investments will be fair valued in good faith by the Committee, in accordance with the policies and procedures. Factors used in determining fair value vary by investment type and may include market or investment specific events, transaction data, estimated cash flows, and market observations of comparable investments. The frequency that the fair valuation procedures are used cannot be predicted and they may be utilized to a significant extent. The Committee manages the Fund's fair valuation practices and maintains the fair valuation policies and procedures. The Fund's investment adviser reports to the Board information regarding the fair valuation process and related material matters.
The Fund categorizes the inputs to valuation techniques used to value its investments into a disclosure hierarchy consisting of three levels as shown below:
Level 1 - unadjusted quoted prices in active markets for identical investments
Level 2 - other significant observable inputs (including quoted prices for similar investments, interest rates, prepayment speeds, etc.)
Level 3 - unobservable inputs (including the Fund's own assumptions based on the best information available)
Valuation techniques used to value the Fund's investments by major category are as follows:
Equity securities, including restricted securities, for which market quotations are readily available, are valued at the last reported sale price or official closing price as reported by a third party pricing service on the primary market or exchange on which they are traded and are categorized as Level 1 in the hierarchy. In the event there were no sales during the day or closing prices are not available, securities are valued at the last quoted bid price or may be valued using the last available price and are generally categorized as Level 2 in the hierarchy. For foreign equity securities, when market or security specific events arise, comparisons to the valuation of American Depositary Receipts (ADRs), futures contracts, Exchange-Traded Funds (ETFs) and certain indexes as well as quoted prices for similar securities may be used and would be categorized as Level 2 in the hierarchy. For equity securities, including restricted securities, where observable inputs are limited, assumptions about market activity and risk are used and these securities may be categorized as Level 3 in the hierarchy.
Investments in open-end mutual funds, including the Fidelity Central Funds, are valued at their closing net asset value (NAV) each business day and are categorized as Level 1 in the hierarchy.
Changes in valuation techniques may result in transfers in or out of an assigned level within the disclosure hierarchy. The aggregate value of investments by input level as of July 31, 2024 is included at the end of the Fund's Schedule of Investments.
Foreign Currency. Certain Funds may use foreign currency contracts to facilitate transactions in foreign-denominated securities. Gains and losses from these transactions may arise from changes in the value of the foreign currency or if the counterparties do not perform under the contracts' terms.
Foreign-denominated assets, including investment securities, and liabilities are translated into U.S. dollars at the exchange rates at period end. Purchases and sales of investment securities, income and dividends received, and expenses denominated in foreign currencies are translated into U.S. dollars at the exchange rate in effect on the transaction date.
The effects of exchange rate fluctuations on investments are included with the net realized and unrealized gain (loss) on investment securities. Other foreign currency transactions resulting in realized and unrealized gain (loss) are disclosed separately.
Investment Transactions and Income. For financial reporting purposes, the Fund's investment holdings and NAV include trades executed through the end of the last business day of the period. The NAV per share for processing shareholder transactions is calculated as of the close of business of the New York Stock Exchange (NYSE), normally 4:00 p.m. Eastern time and includes trades executed through the end of the prior business day. Gains and losses on securities sold are determined on the basis of identified cost and include proceeds received from litigation. Commissions paid to certain brokers with whom the investment adviser, or its affiliates, places trades on behalf of a fund include an amount in addition to trade execution, which may be rebated back to a fund. Any such rebates are included in net realized gain (loss) on investments in the Statement of Operations. Dividend income is recorded on the ex-dividend date, except for certain dividends from foreign securities where the ex-dividend date may have passed, which are recorded as soon as the Fund is informed of the ex-dividend date. Non-cash dividends included in dividend income, if any, are recorded at the fair market value of the securities received. Income and capital gain distributions from Fidelity Central Funds, if any, are recorded on the ex-dividend date. Certain distributions received by the Fund represent a return of capital or capital gain. The Fund determines the components of these distributions subsequent to the ex-dividend date, based upon receipt of tax filings or other correspondence relating to the underlying investment. These distributions are recorded as a reduction of cost of investments and/or as a realized gain. Investment income is recorded net of foreign taxes withheld where recovery of such taxes is uncertain. Funds may file withholding tax reclaims in certain jurisdictions to recover a portion of amounts previously withheld. Any withholding tax reclaims income is included in the Statement of Operations in dividends. Any receivables for withholding tax reclaims are included in the Statement of Assets and Liabilities in dividends receivable.
Class Allocations and Expenses. Investment income, realized and unrealized capital gains and losses, common expenses of a fund, and certain fund-level expense reductions, if any, are allocated daily on a pro-rata basis to each class based on the relative net assets of each class to the total net assets of a fund. Each class differs with respect to transfer agent and distribution and service plan fees incurred, as applicable. Certain expense reductions may also differ by class, if applicable. For the reporting period, the allocated portion of income and expenses to each class as a percent of its average net assets may vary due to the timing of recording these transactions in relation to fluctuating net assets of the classes. Expenses directly attributable to a fund are charged to that fund. Expenses attributable to more than one fund are allocated among the respective funds on the basis of relative net assets or other appropriate methods. Expenses included in the accompanying financial statements reflect the expenses of that fund and do not include any expenses associated with any underlying mutual funds or exchange-traded funds (ETFs). Although not included in a fund's expenses, a fund indirectly bears its proportionate share of these expenses through the net asset value of each underlying mutual fund or exchange-traded fund (ETF). Expense estimates are accrued in the period to which they relate and adjustments are made when actual amounts are known.
Income Tax Information and Distributions to Shareholders. Each year, the Fund intends to qualify as a regulated investment company under Subchapter M of the Internal Revenue Code, including distributing substantially all of its taxable income and realized gains. As a result, no provision for U.S. Federal income taxes is required. As of July 31, 2024, the Fund did not have any unrecognized tax benefits in the financial statements; nor is the Fund aware of any tax positions for which it is reasonably possible that the total amounts of unrecognized tax benefits will significantly change in the next twelve months. The Fund files a U.S. federal tax return, in addition to state and local tax returns as required. The Fund's federal income tax returns are subject to examination by the Internal Revenue Service (IRS) for a period of three fiscal years after they are filed. State and local tax returns may be subject to examination for an additional fiscal year depending on the jurisdiction. Foreign taxes are provided for based on the Fund's understanding of the tax rules and rates that exist in the foreign markets in which it invests.
Distributions are declared and recorded on the ex-dividend date. Income and capital gain distributions are declared separately for each class. Income and capital gain distributions are determined in accordance with income tax regulations, which may differ from GAAP. In addition, the Fund claimed a portion of the payment made to redeeming shareholders as a distribution for income tax purposes.
Capital accounts within the financial statements are adjusted for permanent book-tax differences. These adjustments have no impact on net assets or the results of operations. Capital accounts are not adjusted for temporary book-tax differences which will reverse in a subsequent period.
Book-tax differences are primarily due to foreign currency transactions, passive foreign investment companies (PFIC) and losses deferred due to wash sales.
As of period end, the cost and unrealized appreciation (depreciation) in securities, and derivatives if applicable, for federal income tax purposes were as follows:
| Gross unrealized appreciation | $871,671 |
| Gross unrealized depreciation | (56,996) |
| Net unrealized appreciation (depreciation) | $814,675 |
| Tax Cost | $1,859,001 |
The tax-based components of distributable earnings as of period end were as follows:
| Undistributed ordinary income | $14,711 |
| Undistributed long-term capital gain | $243,733 |
| Net unrealized appreciation (depreciation) on securities and other investments | $814,676 |
The tax character of distributions paid was as follows:
| | July 31, 2024 | July 31, 2023 |
| Ordinary Income | $12,060 | $14,220 |
| Long-term Capital Gains | 222,399 | 306,819 |
| Total | $234,459 | $321,039 |
Restricted Securities (including Private Placements). Funds may invest in securities that are subject to legal or contractual restrictions on resale. These securities generally may be resold in transactions exempt from registration or to the public if the securities are registered. Disposal of these securities may involve time-consuming negotiations and expense, and prompt sale at an acceptable price may be difficult. Information regarding restricted securities held at period end is included at the end of the Schedule of Investments, if applicable.
4. Purchases and Sales of Investments.
Purchases and sales of securities, other than short-term securities and in-kind transactions, as applicable, are noted in the table below.
| | Purchases ($) | Sales ($) |
| Fidelity Leveraged Company Stock Fund | 1,274,984 | 1,082,537 |
5. Fees and Other Transactions with Affiliates.
Management Fee. Fidelity Management & Research Company LLC (the investment adviser) and its affiliates provide the Fund with investment management related services for which the Fund pays a monthly management fee.
Effective March 1, 2024, the Fund's management contract was amended to incorporate administrative services previously covered under separate services agreements (Transfer Agent and Accounting agreements). The amended contract incorporates a management fee rate that may vary by class. The investment adviser or an affiliate pays certain expenses of managing and operating the Fund out of each class's management fee. Each class of the Fund pays a management fee to the investment adviser. The management fee is calculated and paid to the investment adviser every month. When determining a class's management fee, a mandate rate is calculated based on the monthly average net assets of a group of funds advised by FMR within a designated asset class. A discount rate is subtracted from the mandate rate once the Fund's monthly average net assets reach a certain level. The mandate rate and discount rate may vary by class. The annual management fee rate for a class of shares of the Fund is the lesser of (1) the class's mandate rate reduced by the class's discount rate (if applicable) or (2) the amount set forth in the following table.
| | Maximum Management Fee Rate % |
| Leveraged Company Stock | .70 |
| Class K | .61 |
One-twelfth of the management fee rate for a class is applied to the average net assets of the class for the month, giving a dollar amount which is the management fee for the class for that month. A different management fee rate may be applicable to each class of the Fund. The difference between classes is the result of separate arrangements for class-level services and/or waivers of certain expenses. It is not the result of any difference in advisory or custodial fees or other expenses related to the management of the Fund's assets, which do not vary by class. For the portion of the reporting period on or after March 1, 2024, the total annualized management fee rates were as follows:
| | Total Management Fee Rate % |
| Leveraged Company Stock | .69 |
| Class K | .61 |
Prior to March 1, 2024, the management fee was the sum of an individual fund fee rate that was based on an annual rate of .35% of the Fund's average net assets and an annualized group fee rate that averaged .22% during the period. The group fee rate was based upon the monthly average net assets of a group of registered investment companies with which the investment adviser has management contracts. The group fee rate decreased as assets under management increased and increased as assets under management decreased. For the portion of the reporting period prior to March 1, 2024, the total annualized management fee rate was .57%.
Effective March 1, 2024, the Fund's sub-advisory agreements with FMR Investment Management (UK) Limited, Fidelity Management & Research (Hong Kong) Limited, and Fidelity Management & Research (Japan) Limited were amended to provide that the investment adviser pays each sub-adviser monthly fees equal to 110% of the sub-adviser's costs for providing sub-advisory services.
Transfer Agent Fees. Fidelity Investments Institutional Operations Company LLC (FIIOC), an affiliate of the investment adviser, is the transfer, dividend disbursing and shareholder servicing agent for each class of the Fund. Effective March 1, 2024, the Fund's management contract was amended to incorporate transfer agent services and associated fees previously covered under a separate services agreement. FIIOC pays for typesetting, printing and mailing of shareholder reports, except proxy statements.
During the period December 1, 2023 through February 29, 2024, the transfer agent fees for each class were a fixed annual rate of class-level average net assets as follows:
| | | % of Class-Level Average Net Assets |
| Leveraged Company Stock | | .1341 |
| Class K | | .0420 |
Prior to December 1, 2023, FIIOC received account fees and asset-based fees that varied according to the account size and type of account of the shareholders of the respective classes of the Fund, except for Class K. FIIOC received an asset-based fee of Class K's average net assets. For the portion of the reporting period prior to March 1, 2024, the fees were equivalent to the following annualized rates:
| | Amount ($) | % of Class-Level Average Net Assets |
| Leveraged Company Stock | 1,485 | .14 |
| Class K | 32 | .04 |
| 1,517 | |
Accounting Fees. Fidelity Service Company, Inc. (FSC), an affiliate of the investment adviser, maintains the Fund's accounting records. Effective March 1, 2024, the Fund's management contract was amended to incorporate accounting services and associated fees previously covered under a separate services agreement.
During the period December 1, 2023 through February 29, 2024, the accounting fees were a fixed annual rate of average net assets as follows:
| | % of Average Net Assets |
| Fidelity Leveraged Company Stock Fund | .0267 |
Prior to December 1, 2023, the accounting fee was based on the level of average net assets for each month. For the portion of the reporting period prior to March 1, 2024, the fees were equivalent to the following annualized rates:
| | % of Average Net Assets |
| Fidelity Leveraged Company Stock Fund | .03 |
Brokerage Commissions. A portion of portfolio transactions were placed with brokerage firms which are affiliates of the investment adviser. Brokerage commissions are included in net realized gain (loss) and change in net unrealized appreciation (depreciation) in the Statement of Operations. The commissions paid to these affiliated firms were as follows:
| | Amount ($) |
| Fidelity Leveraged Company Stock Fund | 12 |
Interfund Lending Program. Pursuant to an Exemptive Order issued by the Securities and Exchange Commission (the SEC), the Fund, along with other registered investment companies having management contracts with Fidelity Management & Research Company LLC (FMR), or other affiliated entities of FMR, may participate in an interfund lending program. This program provides an alternative credit facility allowing the Fund to borrow from, or lend money to, other participating affiliated funds. At period end, there were no interfund loans outstanding. Activity in this program during the period for which loans were outstanding was as follows:
| | Borrower or Lender | Average Loan Balance ($) | Weighted Average Interest Rate | Interest Expense ($) |
Fidelity Leveraged Company Stock Fund. | Borrower | 5,863 | 5.57% | 1 |
Interfund Trades. Funds may purchase from or sell securities to other Fidelity Funds under procedures adopted by the Board. The procedures have been designed to ensure these interfund trades are executed in accordance with Rule 17a-7 of the 1940 Act. Any interfund trades are included within the respective purchases and sales amounts shown in the Purchases and Sales of Investments note. Interfund trades during the period are noted in the table below.
| | Purchases ($) | Sales ($) | Realized Gain (Loss)($) |
| Fidelity Leveraged Company Stock Fund | 62,306 | 80,818 | 15,286 |
6. Committed Line of Credit.
Certain Funds participate with other funds managed by the investment adviser or an affiliate in a $4.25 billion credit facility (the "line of credit") to be utilized for temporary or emergency purposes to fund shareholder redemptions or for other short-term liquidity purposes. The participating funds have agreed to pay commitment fees on their pro-rata portion of the line of credit, which are reflected in Miscellaneous expenses on the Statement of Operations, and are listed below. During the period, there were no borrowings on this line of credit.
| | Amount ($) |
| Fidelity Leveraged Company Stock Fund | 4 |
7. Security Lending.
Funds lend portfolio securities from time to time in order to earn additional income. Lending agents are used, including National Financial Services (NFS), an affiliate of the investment adviser. Pursuant to a securities lending agreement, NFS will receive a fee, which is capped at 9.9% of a fund's daily lending revenue, for its services as lending agent. A fund may lend securities to certain qualified borrowers, including NFS. On the settlement date of the loan, a fund receives collateral (in the form of U.S. Treasury obligations, letters of credit and/or cash) against the loaned securities and maintains collateral in an amount not less than 100% of the market value of the loaned securities during the period of the loan. The market value of the loaned securities is determined at the close of business of a fund and any additional required collateral is delivered to a fund on the next business day. A fund or borrower may terminate the loan at any time, and if the borrower defaults on its obligation to return the securities loaned because of insolvency or other reasons, a fund may apply collateral received from the borrower against the obligation. A fund may experience delays and costs in recovering the securities loaned. Any cash collateral received is invested in the Fidelity Securities Lending Cash Central Fund. Any loaned securities are identified as such in the Schedule of Investments, and the value of loaned securities and cash collateral at period end, as applicable, are presented in the Statement of Assets and Liabilities. Security lending income represents the income earned on investing cash collateral, less rebates paid to borrowers and any lending agent fees associated with the loan, plus any premium payments received for lending certain types of securities. Security lending income is presented in the Statement of Operations as a component of income from Fidelity Central Funds. Affiliated security lending activity, if any, was as follows:
| | Total Security Lending Fees Paid to NFS ($) | Security Lending Income From Securities Loaned to NFS ($) | Value of Securities Loaned to NFS at Period End ($) |
| Fidelity Leveraged Company Stock Fund | 2 | - | - |
8. Expense Reductions.
During the period the investment adviser or an affiliate reimbursed and/or waived a portion of fund-level operating expenses in the amount of $130.
9. Distributions to Shareholders.
Distributions to shareholders of each class were as follows:
| | Year ended July 31, 2024 | Year ended July 31, 2023 |
| Fidelity Leveraged Company Stock Fund | | |
| Distributions to shareholders | | |
| Leveraged Company Stock | $218,850 | $284,888 |
| Class K | 15,609 | 36,151 |
Total | $234,459 | $321,039 |
10. Share Transactions.
Share transactions for each class were as follows and may contain in-kind transactions, automatic conversions between classes or exchanges between affiliated funds:
| | Shares | Shares | Dollars | Dollars |
| | Year ended July 31, 2024 | Year ended July 31, 2023 | Year ended July 31, 2024 | Year ended July 31, 2023 |
| Fidelity Leveraged Company Stock Fund | | | | |
| Leveraged Company Stock | | | | |
| Shares sold | 11,676 | 1,200 | $458,186 | $42,108 |
| Reinvestment of distributions | 6,074 | 7,834 | 205,661 | 268,740 |
| Shares redeemed | (7,348) | (6,815) | (272,158) | (231,649) |
| Net increase (decrease) | 10,402 | 2,219 | $391,689 | $79,199 |
| Class K | | | | |
| Shares sold | 758 | 273 | $29,117 | $9,384 |
| Reinvestment of distributions | 459 | 1,038 | 15,609 | 36,151 |
| Shares redeemed | (1,073) | (4,546) | (40,114) | (143,981) |
| Net increase (decrease) | 144 | (3,235) | $4,612 | $(98,446) |
11. Other.
A fund's organizational documents provide former and current trustees and officers with a limited indemnification against liabilities arising in connection with the performance of their duties to the fund. In the normal course of business, a fund may also enter into contracts that provide general indemnifications. A fund's maximum exposure under these arrangements is unknown as this would be dependent on future claims that may be made against a fund. The risk of material loss from such claims is considered remote.
12. Risk and Uncertainties.
Many factors affect a fund's performance. Developments that disrupt global economies and financial markets, such as pandemics, epidemics, outbreaks of infectious diseases, war, terrorism, and environmental disasters, may significantly affect a fund's investment performance. The effects of these developments to a fund will be impacted by the types of securities in which a fund invests, the financial condition, industry, economic sector, and geographic location of an issuer, and a fund's level of investment in the securities of that issuer. Significant concentrations in security types, issuers, industries, sectors, and geographic locations may magnify the factors that affect a fund's performance.
13. Proposed Reorganization.
The Board of Trustees of the Fund approved an Agreement and Plan of Reorganization (the Agreement) between the Fund and Fidelity Advisor Leveraged Company Stock Fund. In addition, the Board approved the creation of additional classes of shares that will commence operations on October 18, 2024. The Agreement provides for the transfer of all the assets and the assumption of all the liabilities of Fidelity Advisor Leveraged Company Stock Fund in exchange for corresponding shares of the Fund equal in value to the net assets of Fidelity Advisor Leveraged Company Stock Fund on the day the reorganization is effective. The reorganization provides shareholders of Fidelity Advisor Leveraged Company Stock Fund access to a larger portfolio with a similar investment objective.
The reorganization does not require Fidelity Advisor Leveraged Company Stock Fund shareholder approval and is expected to become effective in October 2024. The reorganization is expected to qualify as a tax-free transaction for federal income tax purposes with no gain or loss recognized by the funds or their shareholders.
Report of Independent Registered Public Accounting Firm
To the Board of Trustees of Fidelity Securities Fund and Shareholders of Fidelity Leveraged Company Stock Fund
Opinion on the Financial Statements
We have audited the accompanying statement of assets and liabilities, including the schedule of investments, of Fidelity Leveraged Company Stock Fund (one of the funds constituting Fidelity Securities Fund, referred to hereafter as the "Fund") as of July 31, 2024, the related statement of operations for the year ended July 31, 2024, the statement of changes in net assets for each of the two years in the period ended July 31, 2024, including the related notes, and the financial highlights for each of the five years in the period ended July 31, 2024 (collectively referred to as the "financial statements"). In our opinion, the financial statements present fairly, in all material respects, the financial position of the Fund as of July 31, 2024, the results of its operations for the year then ended, the changes in its net assets for each of the two years in the period ended July 31, 2024 and the financial highlights for each of the five years in the period ended July 31, 2024 in conformity with accounting principles generally accepted in the United States of America.
Basis for Opinion
These financial statements are the responsibility of the Fund's management. Our responsibility is to express an opinion on the Fund's financial statements based on our audits. We are a public accounting firm registered with the Public Company Accounting Oversight Board (United States) (PCAOB) and are required to be independent with respect to the Fund in accordance with the U.S. federal securities laws and the applicable rules and regulations of the Securities and Exchange Commission and the PCAOB.
We conducted our audits of these financial statements in accordance with the standards of the PCAOB. Those standards require that we plan and perform the audit to obtain reasonable assurance about whether the financial statements are free of material misstatement, whether due to error or fraud.
Our audits included performing procedures to assess the risks of material misstatement of the financial statements, whether due to error or fraud, and performing procedures that respond to those risks. Such procedures included examining, on a test basis, evidence regarding the amounts and disclosures in the financial statements. Our audits also included evaluating the accounting principles used and significant estimates made by management, as well as evaluating the overall presentation of the financial statements. Our procedures included confirmation of securities owned as of July 31, 2024 by correspondence with the custodian. We believe that our audits provide a reasonable basis for our opinion.
/s/ PricewaterhouseCoopers LLP
Boston, Massachusetts
September 13, 2024
We have served as the auditor of one or more investment companies in the Fidelity group of funds since 1932.
Distributions
(Unaudited)The dividend and capital gains distributions for the fund(s) are available on Fidelity.com or Institutional.Fidelity.com.
The fund hereby designates as a capital gain dividend with respect to the taxable year ended July 31, 2024, $311,516,937, or, if subsequently determined to be different, the net capital gain of such year.
Fidelity® Leveraged Company Stock Fund and Class K designates 100% of each dividend distributed during the fiscal year as qualifying for the dividends-received deduction for corporate shareholders.
Fidelity® Leveraged Company Stock Fund and Class K designates 100% of each dividend distributed during the fiscal year as amounts which may be taken into account as a dividend for purposes of the maximum rate under section 1(h)(11) of the Internal Revenue Code.
The fund will notify shareholders in January 2025 of amounts for use in preparing 2024 income tax returns.
Item 8: Changes in and Disagreements with Accountants for Open-End Management Investment Companies
Note: This is not applicable for any fund included in this document.
Item 9: Proxy Disclosures for Open-End Management Investment Companies
| A special meeting of shareholders was held on July 16, 2024. The results of votes taken among shareholders on the proposal before them are reported below. Each vote reported represents one dollar of net asset value held on the record date for the meeting. |
| Proposal 1 |
| To elect a Board of Trustees. |
| | # of Votes | % of Votes |
| Bettina Doulton |
| Affirmative | 88,756,759,992.17 | 95.11 |
| Withheld | 4,564,750,651.52 | 4.89 |
| TOTAL | 93,321,510,643.68 | 100.00 |
| Robert A. Lawrence |
| Affirmative | 88,523,438,331.98 | 94.86 |
| Withheld | 4,798,072,311.70 | 5.14 |
| TOTAL | 93,321,510,643.68 | 100.00 |
| Vijay C. Advani |
| Affirmative | 88,484,371,668.51 | 94.82 |
| Withheld | 4,837,138,975.17 | 5.18 |
| TOTAL | 93,321,510,643.68 | 100.00 |
| Thomas P. Bostick |
| Affirmative | 88,618,596,648.21 | 94.96 |
| Withheld | 4,702,913,995.47 | 5.04 |
| TOTAL | 93,321,510,643.68 | 100.00 |
| Donald F. Donahue |
| Affirmative | 88,542,403,002.79 | 94.88 |
| Withheld | 4,779,107,640.89 | 5.12 |
| TOTAL | 93,321,510,643.68 | 100.00 |
| Vicki L. Fuller |
| Affirmative | 88,788,711,037.44 | 95.14 |
| Withheld | 4,532,799,606.24 | 4.86 |
| TOTAL | 93,321,510,643.68 | 100.00 |
| Patricia L. Kampling |
| Affirmative | 88,819,315,996.59 | 95.18 |
| Withheld | 4,502,194,647.10 | 4.82 |
| TOTAL | 93,321,510,643.68 | 100.00 |
| Thomas A. Kennedy |
| Affirmative | 88,667,457,817.34 | 95.01 |
| Withheld | 4,654,052,826.34 | 4.99 |
| TOTAL | 93,321,510,643.68 | 100.00 |
| Oscar Munoz |
| Affirmative | 88,183,976,568.30 | 94.49 |
| Withheld | 5,137,534,075.39 | 5.51 |
| TOTAL | 93,321,510,643.68 | 100.00 |
| Karen B. Peetz |
| Affirmative | 88,720,160,318.58 | 95.07 |
| Withheld | 4,601,350,325.11 | 4.93 |
| TOTAL | 93,321,510,643.68 | 100.00 |
| David M. Thomas |
| Affirmative | 88,471,490,747.86 | 94.80 |
| Withheld | 4,850,019,895.82 | 5.20 |
| TOTAL | 93,321,510,643.68 | 100.00 |
| Susan Tomasky |
| Affirmative | 88,536,869,646.78 | 94.87 |
| Withheld | 4,784,640,996.90 | 5.13 |
| TOTAL | 93,321,510,643.68 | 100.00 |
| Michael E. Wiley |
| Affirmative | 88,526,906,267.86 | 94.86 |
| Withheld | 4,794,604,375.83 | 5.14 |
| TOTAL | 93,321,510,643.68 | 100.00 |
| | | |
| Proposal 1 reflects trust-wide proposal and voting results. |
Item 10: Remuneration Paid to Directors, Officers, and others of Open-End Management Investment Companies
Note: This information is disclosed as part of the financial statements for each Fund as part of Item 7: Financial Statements and Financial Highlights for Open-End Management Investment companies.
Item 11: Statement Regarding Basis for Approval of Investment Advisory Contract
Board Approval of Investment Advisory Contracts and Management Fees
Fidelity Leveraged Company Stock Fund
Each year, the Board of Trustees, including the Independent Trustees (together, the Board), considers the renewal of the fund's management contract with Fidelity Management & Research Company LLC (FMR) and the sub-advisory agreements (together, the Advisory Contracts) for the fund. FMR and the sub-advisers are referred to herein as the Investment Advisers. The Board, assisted by the advice of fund counsel and Independent Trustees' counsel, requests and considers a broad range of information relevant to the renewal of the Advisory Contracts throughout the year.
The Board meets regularly and, at each of its meetings, covers an extensive agenda of topics and materials and considers factors that are relevant to its annual consideration of the renewal of the fund's Advisory Contracts, including the services and support provided to the fund and its shareholders. The Board, acting directly and through its Committees (each of which is composed of and chaired by Independent Trustees), requests and receives information concerning the annual consideration of the renewal of the fund's Advisory Contracts. The Board also meets as needed to review matters specifically related to the Board's annual consideration of the renewal of the Advisory Contracts. Members of the Board may also meet with trustees of other Fidelity funds through joint ad hoc committees to discuss certain matters relevant to all of the Fidelity funds.
At its May 2024 meeting, the Board unanimously determined to renew the fund's Advisory Contracts. In reaching its determination, the Board considered all factors it believed relevant, including (i) the nature, extent, and quality of the services provided to the fund and its shareholders (including the investment performance of the fund); (ii) the competitiveness relative to peer funds of the fund's management fee and the total expense ratio of a representative class (the retail class, which was selected because it is the largest share class); (iii) the total costs of the services provided by and the profits realized by FMR and its affiliates (Fidelity) from its relationships with the fund; and (iv) the extent to which, if any, economies of scale exist and are realized as the fund grows, and whether any economies of scale are appropriately shared with fund shareholders. The Board also considered the broad range of investment choices available to shareholders from FMR's competitors and that the fund's shareholders have chosen to invest in the fund, which is part of the Fidelity family of funds. The Board's decision to renew the Advisory Contracts was not based on any single factor.
The Board reached a determination, with the assistance of fund counsel and Independent Trustees' counsel and through the exercise of its business judgment, that the renewal of the Advisory Contracts was in the best interests of the fund and its shareholders and that the compensation payable under the Advisory Contracts was fair and reasonable in light of all of the surrounding circumstances.
Nature, Extent, and Quality of Services Provided. The Board considered staffing as it relates to the fund, including the backgrounds and experience of investment personnel of the Investment Advisers, and also considered the Investment Advisers' implementation of the fund's investment program. The Independent Trustees also had discussions with senior management of Fidelity's investment operations and investment groups. The Board considered the structure of the investment personnel compensation program and whether this structure provides appropriate incentives to act in the best interests of the fund. Additionally, the Board considered the portfolio managers' investments, if any, in the funds that they manage.
Resources Dedicated to Investment Management and Support Services. The Board and the Fund Oversight and Research Committees reviewed the general qualifications and capabilities of Fidelity's investment staff, including its size, education, experience, and resources, as well as Fidelity's approach to recruiting, training, managing, and compensating investment personnel. The Board noted the resources devoted to expansion of Fidelity's global investment organization, and that Fidelity's analysts have extensive resources, tools, and capabilities that allow them to conduct sophisticated quantitative and fundamental analysis, as well as credit analysis of issuers, counterparties, and guarantors. Further, the Board considered that Fidelity's investment professionals have sufficient access to global information and data so as to provide competitive investment results over time, and that those professionals also have access to sophisticated tools that permit them to assess portfolio construction and risk and performance attribution characteristics continuously, as well as to transmit new information and research conclusions rapidly around the world. Additionally, in its deliberations, the Board considered Fidelity's trading, risk management, compliance, and technology and operations capabilities and resources, which are integral parts of the investment management process.
Shareholder and Administrative Services. The Board considered (i) the nature, extent, quality, and cost of advisory, administrative, shareholder, transfer agency, and pricing and bookkeeping services performed by the Investment Advisers and their affiliates under the Advisory Contracts; (ii) the nature and extent of Fidelity's supervision of third party service providers, principally custodians, subcustodians, and pricing vendors; and (iii) the resources devoted by Fidelity to, and the record of compliance with, the fund's compliance policies and procedures. The Board also reviewed the allocation of fund brokerage, including allocations to brokers affiliated with the Investment Advisers, the use of brokerage commissions to pay fund expenses, and the use of "soft" commission dollars to pay for research services. The Board also considered the fund's securities lending activities and any payments made to Fidelity relating to securities lending under a separate agreement.
The Board noted that the growth of fund assets over time across the complex allows Fidelity to reinvest in the development of services designed to enhance the value and convenience of the Fidelity funds as investment vehicles. These services include 24-hour access to account information and market information over the Internet and through telephone representatives, investor education materials, and asset allocation tools. The Board also considered that it reviews customer service metrics such as telephone response times, continuity of services on the website and metrics addressing services at Fidelity Investor Centers.
Investment in a Large Fund Family. The Board considered the benefits to shareholders of investing in a fund that is part of a large family of funds offering a variety of investment disciplines and providing a large variety of fund investor services. The Board noted that Fidelity had taken, or had made recommendations that resulted in the Fidelity funds taking, a number of actions over the previous year that benefited particular funds and/or the Fidelity funds in general.
Investment Performance. The Board took into account discussions that occur with representatives of the Investment Advisers, and reports that it receives, at Board meetings throughout the year, relating to fund investment performance. In this regard the Board noted that as part of regularly scheduled fund reviews and other reports to the Board on fund performance, the Board considered annualized return information for the fund for different time periods, measured against an appropriate securities market index (benchmark index) and an appropriate peer group of funds with similar objectives (peer group). The Board also considered information about performance attribution. In its ongoing evaluation of fund investment performance, the Board gives particular attention to information indicating changes in performance of the funds over different time periods and discussed with the Investment Advisers the reasons for any overperformance or underperformance.
In addition to reviewing absolute and relative fund performance, the Independent Trustees periodically consider the appropriateness of fund performance metrics in evaluating the results achieved. The Independent Trustees generally give greater weight to fund performance over longer time periods than over shorter time periods. Depending on the circumstances, the Independent Trustees may be satisfied with a fund's performance notwithstanding that it lags its benchmark index or peer group for certain periods.
Based on its review, the Board concluded that the nature, extent, and quality of services provided to the fund under the Advisory Contracts should continue to benefit the shareholders of the fund.
Competitiveness of Management Fee and Total Expense Ratio. The Board was provided with information regarding industry trends in management fees and expenses. The Board considered that, effective March 1, 2024, an amended Advisory Contract with FMR went into effect with class-level management fees based on tiered schedules and subject to a maximum class-level rate (the management fee). The Board also considered that in exchange for the variable management fee, each class of the fund receives investment advisory, management, administrative, transfer agent, and pricing and bookkeeping services. In its review of the management fee and total expense ratio of the retail class, the Board considered a pro forma management fee rate for the retail class as if it had been in effect for the 12-month period ended September 30, 2023, as well as other third-party fund expenses, as applicable, such as custodial, legal, and audit fees. The Board noted that Fidelity may agree to waive fees or reimburse expenses from time to time, and the extent to which, if any, it has done so for the fund.
Comparisons of Management Fees and Total Expense Ratios. Among other things, the Board reviewed data for selected groups of competitive funds and classes (referred to as "mapped groups") that were compiled by Fidelity based on combining similar investment objective categories (as classified by Morningstar) that have comparable investment mandates. The data reviewed by the Board included (i) gross management fee comparisons (before taking into account expense reimbursements or caps) relative to the total universe of funds within the mapped group; (ii) gross management fee comparisons relative to a subset of non-Fidelity funds in the mapped group that are similar in size and management fee structure to the fund (referred to as the "asset size peer group"); (iii) total expense comparisons of the retail class of the fund relative to funds and classes in the mapped group that have a similar sales load structure to the retail class of the fund (referred to as the "similar sales load structure group"); and (iv) total expense comparisons of the retail class of the fund relative to funds and classes in the similar sales load structure group that are similar in size and management fee structure to the fund (referred to as the "total expense asset size peer group"). The total expense asset size peer group comparison excludes performance adjustments and fund-paid 12b-1 fees to eliminate variability in fee structures.
The information provided to the Board indicated that the fund's management fee rate ranked above the competitive median of the mapped group for the 12-month period ended September 30, 2023 and above the competitive median of the asset size peer group for the 12-month period ended September 30, 2023. Further, the information provided to the Board indicated that the total expense ratio of the retail class of the fund ranked below the competitive median of the similar sales load structure group for the 12-month period ended September 30, 2023 and below the competitive median of the total expense asset size peer group for the 12-month period ended September 30, 2023. The Board considered that Fidelity believes that management fee comparisons are particularly unhelpful in the context of this fund and that total expense comparisons are more useful. The Board noted that the total expense ratio of the representative class ranked below the competitive median.
The Board noted that a different variable management fee rate is applicable to each class of the fund. The Board considered that the difference in management fee rates between classes is the result of separate arrangements for class-level services and/or waivers of certain expenses and not the result of any difference in advisory or custodial fees or other expenses related to the management of the fund's assets, which do not vary by class.
Fees Charged to Other Fidelity Clients. The Board also considered Fidelity fee structures and other information with respect to clients of Fidelity, such as other funds advised or subadvised by Fidelity, pension plan clients, and other institutional clients with similar mandates. The Board noted that a joint ad hoc committee created by it and the boards of other Fidelity funds periodically reviews and compares Fidelity's institutional investment advisory business with its business of providing services to the Fidelity funds and also noted the most recent findings of the committee. The Board noted that the committee's review included a consideration of the differences in services provided, fees charged, and costs incurred, as well as competition in the markets serving the different categories of clients.
Based on its review, the Board concluded that the fund's management fee is fair and reasonable in light of the services that the fund receives and the other factors considered. Further, based on its review of total expense ratios and fees charged to other Fidelity clients, the Board concluded that the total expense ratio of each class of the fund was reasonable in light of the services that the fund and its shareholders receive and the other factors considered.
Costs of the Services and Profitability. The Board considered the revenues earned and the expenses incurred by Fidelity in conducting the business of developing, marketing, distributing, managing, administering and servicing the fund and servicing the fund's shareholders. The Board also considered the level of Fidelity's profits in respect of all the Fidelity funds.
On an annual basis, Fidelity presents to the Board information about the profitability of its relationships with the fund. Fidelity calculates profitability information for each fund, as well as aggregate profitability information for groups of Fidelity funds and all Fidelity funds, using a series of detailed revenue and cost allocation methodologies which originate with the books and records of Fidelity on which Fidelity's audited financial statements are based. The Audit Committee of the Board reviews any significant changes from the prior year's methodologies and the full Board approves such changes.
A public accounting firm has been engaged annually by the Board as part of the Board's assessment of Fidelity's profitability analysis. The engagement includes the review and assessment of the methodologies used by Fidelity in determining the revenues and expenses attributable to Fidelity's fund business, and completion of agreed-upon procedures in respect of the mathematical accuracy of certain fund profitability information and its conformity to established allocation methodologies. After considering the reports issued under the engagement and information provided by Fidelity, the Board concluded that while other allocation methods may also be reasonable, Fidelity's profitability methodologies are reasonable in all material respects.
The Board also reviewed Fidelity's non-fund businesses and potential indirect benefits such businesses may have received as a result of their association with Fidelity's fund business (i.e., fall-out benefits) as well as cases where Fidelity's affiliates may benefit from the funds' business. The Board considered areas where potential indirect benefits to the Fidelity funds from their relationships with Fidelity may exist. The Board's consideration of these matters was informed by the findings of a joint ad hoc committee created by it and the boards of other Fidelity funds to evaluate potential fall-out benefits.
The Board considered the costs of the services provided by and the profits realized by Fidelity in connection with the operation of the fund and was satisfied that the profitability was not excessive.
Economies of Scale. The Board considered whether there have been economies of scale in respect of the management of the Fidelity funds, whether the Fidelity funds (including the fund) have appropriately benefited from any such economies of scale, and whether there is potential for realization of any further economies of scale. The Board considered the extent to which the fund will benefit from economies of scale as assets grow through increased services to the fund, through waivers or reimbursements, or through fee or expense ratio reductions. The Board also noted that a committee created by it and the boards of other Fidelity funds periodically analyzes whether Fidelity attains economies of scale in respect of the management and servicing of the Fidelity funds, whether the Fidelity funds have appropriately benefited from such economies of scale, and whether there is potential for realization of any further economies of scale.
The Board recognized that the fund's management contract incorporates a variable management fee structure, which provides breakpoints as a way to share, in part, any potential economies of scale that may exist at the asset class level and through a discount that considers both fund size and total assets of the four applicable asset classes. The Board considered that the variable management fee is designed to deliver the benefits of economies of scale to fund shareholders even if assets of any particular fund are unchanged or have declined, because some portion of Fidelity's costs are attributable to services provided to all funds subject to the variable management fee, and all such funds benefit if those costs can be allocated among more assets. The Board concluded that, given the variable management fee structure, fund shareholders will benefit from lower management fees due to the application of the breakpoints and discount factor, regardless of whether Fidelity achieves any such economies of scale.
The Board concluded, taking into account the analysis of the committee, that economies of scale, if any, are being appropriately shared between fund shareholders and Fidelity.
Additional Information Requested by the Board. In order to develop fully the factual basis for consideration of the Fidelity funds' advisory contracts, the Board requested and received additional information on certain topics, including but not limited to: (i) fund flow and performance trends, in particular the underperformance of certain funds and strategies, and Fidelity's long-term strategies for certain funds; (ii) the operation of performance fees and the rationale for implementing performance fees on certain categories of funds but not others; (iii) Fidelity's pricing philosophy compared to competitors; (iv) fund profitability methodology and data; (v) evaluation of competitive fund data and peer group classifications and fee and expense comparisons; (vi) the management fee and expense structures for different funds and classes and information about the differences between various fee and expense structures; (vii) the variable management fee implemented for certain funds effective March 1, 2024; and (viii) information regarding other accounts managed by Fidelity and the funds' sub-advisory arrangements.
Conclusion. Based on its evaluation of all of the conclusions noted above, and after considering all factors it believed relevant, the Board, including the Independent Trustees, concluded that the advisory and sub-advisory fee arrangements are fair and reasonable in light of all of the surrounding circumstances and that the fund's Advisory Contracts should be renewed through May 31, 2025.
1.762413.123
LSF-ANN-0924
Fidelity® Blue Chip Growth Fund
Annual Report
July 31, 2024
Contents
To view a fund's proxy voting guidelines and proxy voting record for the 12-month period ended June 30, visit http://www.fidelity.com/proxyvotingresults or visit the Securities and Exchange Commission's (SEC) web site at http://www.sec.gov.
You may also call 1-800-544-8544 if you're an individual investing directly with Fidelity, call 1-800-835-5092 if you're a plan sponsor or participant with Fidelity as your recordkeeper or call 1-877-208-0098 on institutional accounts or if you're an advisor or invest through one to request a free copy of the proxy voting guidelines.
Standard & Poor's, S&P and S&P 500 are registered service marks of The McGraw-Hill Companies, Inc. and have been licensed for use by Fidelity Distributors Corporation.
Other third-party marks appearing herein are the property of their respective owners.
All other marks appearing herein are registered or unregistered trademarks or service marks of FMR LLC or an affiliated company. © 2024 FMR LLC. All rights reserved.
This report and the financial statements contained herein are submitted for the general information of the shareholders of the Fund. This report is not authorized for distribution to prospective investors in the Fund unless preceded or accompanied by an effective prospectus.
A fund files its complete schedule of portfolio holdings with the SEC for the first and third quarters of each fiscal year on Form N-PORT. Forms N-PORT are available on the SEC's web site at http://www.sec.gov. A fund's Forms N-PORT may be reviewed and copied at the SEC's Public Reference Room in Washington, DC. Information regarding the operation of the SEC's Public Reference Room may be obtained by calling 1-800-SEC-0330.
For a complete list of a fund's portfolio holdings, view the most recent holdings listing, semiannual report, or annual report on Fidelity's web site at http://www.fidelity.com, http://www.institutional.fidelity.com, or http://www.401k.com, as applicable.
NOT FDIC INSURED •MAY LOSE VALUE •NO BANK GUARANTEE
Neither the Fund nor Fidelity Distributors Corporation is a bank.
Item 7: Consolidated Financial Statements and Consolidated Financial Highlights for Open-End Management Investment Companies (Annual Report)
Fidelity® Blue Chip Growth Fund
Consolidated Schedule of Investments July 31, 2024
Showing Percentage of Net Assets
| Common Stocks - 98.6% |
| | | Shares | Value ($) (000s) |
| COMMUNICATION SERVICES - 15.5% | | | |
| Diversified Telecommunication Services - 0.1% | | | |
| Indus Towers Ltd. (a) | | 8,191,300 | 42,376 |
| Entertainment - 2.3% | | | |
| Netflix, Inc. (a) | | 2,095,524 | 1,316,723 |
| Sea Ltd. ADR Class A (a) | | 1,116,968 | 73,385 |
| Sphere Entertainment Co. (a)(b) | | 58,329 | 2,594 |
| Spotify Technology SA (a) | | 131,450 | 45,211 |
| Take-Two Interactive Software, Inc. (a) | | 107,585 | 16,195 |
| TKO Group Holdings, Inc. | | 269,188 | 29,436 |
| | | | 1,483,544 |
| Interactive Media & Services - 12.9% | | | |
| Alphabet, Inc. Class A | | 24,582,121 | 4,216,817 |
| Epic Games, Inc. (a)(c)(d) | | 6,131 | 3,679 |
| Meta Platforms, Inc. Class A | | 6,434,428 | 3,055,259 |
| Pinterest, Inc. Class A (a) | | 1,136,669 | 36,317 |
| Reddit, Inc. Class B | | 1,025,187 | 62,383 |
| Snap, Inc. Class A (a) | | 80,007,015 | 1,065,693 |
| Webtoon Entertainment, Inc. | | 319,100 | 6,813 |
| | | | 8,446,961 |
| Media - 0.0% | | | |
| The Trade Desk, Inc. Class A (a)(b) | | 237,088 | 21,309 |
| Wireless Telecommunication Services - 0.2% | | | |
| T-Mobile U.S., Inc. | | 231,096 | 42,124 |
| Vodafone Idea Ltd. (a) | | 469,252,105 | 91,185 |
| | | | 133,309 |
TOTAL COMMUNICATION SERVICES | | | 10,127,499 |
| CONSUMER DISCRETIONARY - 19.4% | | | |
| Automobiles - 1.2% | | | |
| General Motors Co. | | 653,381 | 28,958 |
| Mahindra & Mahindra Ltd. | | 416,700 | 14,472 |
| Neutron Holdings, Inc. (a)(c)(d) | | 7,152,433 | 220 |
| Rad Power Bikes, Inc. (a)(c)(d) | | 928,091 | 232 |
| Rad Power Bikes, Inc. warrants 10/6/33 (a)(c)(d) | | 980,651 | 1,520 |
| Rivian Automotive, Inc. (a)(b) | | 9,210,153 | 151,139 |
| Tesla, Inc. (a) | | 2,392,157 | 555,148 |
| | | | 751,689 |
| Broadline Retail - 8.9% | | | |
| Amazon.com, Inc. (a) | | 29,613,616 | 5,537,154 |
| Dollarama, Inc. | | 181,591 | 17,023 |
| JD.com, Inc. sponsored ADR | | 406,835 | 10,736 |
| Lenskart Solutions Pvt Ltd. (a)(c)(d) | | 10,719,190 | 29,446 |
| Ollie's Bargain Outlet Holdings, Inc. (a) | | 648,864 | 63,355 |
| PDD Holdings, Inc. ADR (a) | | 1,398,793 | 180,290 |
| | | | 5,838,004 |
| Diversified Consumer Services - 0.0% | | | |
| Duolingo, Inc. (a) | | 121,962 | 20,970 |
| New Oriental Education & Technology Group, Inc. sponsored ADR (a) | | 56,398 | 3,543 |
| | | | 24,513 |
| Hotels, Restaurants & Leisure - 2.3% | | | |
| Airbnb, Inc. Class A (a) | | 2,218,221 | 309,575 |
| Caesars Entertainment, Inc. (a) | | 1,595,440 | 63,738 |
| Carnival Corp. (a) | | 1,101,322 | 18,348 |
| Cava Group, Inc. (a) | | 178,389 | 15,024 |
| Chipotle Mexican Grill, Inc. (a) | | 4,904,043 | 266,388 |
| Draftkings Holdings, Inc. (a) | | 2,893,968 | 106,932 |
| Flutter Entertainment PLC (a) | | 216,381 | 42,768 |
| Flutter Entertainment PLC (a) | | 87,186 | 17,211 |
| Hilton Worldwide Holdings, Inc. | | 30,320 | 6,509 |
| MakeMyTrip Ltd. (a) | | 143,700 | 13,449 |
| Marriott International, Inc. Class A | | 278,852 | 63,383 |
| McDonald's Corp. | | 289,301 | 76,780 |
| Penn Entertainment, Inc. (a)(b) | | 3,467,344 | 69,243 |
| Restaurant Brands International, Inc. | | 435,332 | 30,481 |
| Royal Caribbean Cruises Ltd. | | 116,810 | 18,306 |
| Sonder Holdings, Inc.: | | | |
| Stage 1 rights (a)(d) | | 16,222 | 0 |
| Stage 2 rights (a)(d) | | 16,221 | 0 |
| Stage 3 rights (a)(d) | | 16,222 | 0 |
| Stage 4 rights (a)(d) | | 16,221 | 0 |
| Stage 5: | | | |
| rights (a)(d) | | 16,221 | 0 |
| rights (a)(d) | | 16,221 | 0 |
| Starbucks Corp. | | 2,606,235 | 203,156 |
| Sweetgreen, Inc. Class A (a)(b) | | 4,387,631 | 120,572 |
| Viking Holdings Ltd. (b) | | 641,811 | 22,913 |
| Wingstop, Inc. | | 34,788 | 13,007 |
| Zomato Ltd. (a) | | 9,763,200 | 26,755 |
| | | | 1,504,538 |
| Household Durables - 0.3% | | | |
| D.R. Horton, Inc. | | 279,887 | 50,360 |
| Garmin Ltd. | | 143,362 | 24,551 |
| PulteGroup, Inc. | | 271,709 | 35,866 |
| SharkNinja, Inc. | | 873,225 | 67,107 |
| TopBuild Corp. (a) | | 88,893 | 42,539 |
| | | | 220,423 |
| Specialty Retail - 4.1% | | | |
| Abercrombie & Fitch Co. Class A (a) | | 1,832,671 | 270,282 |
| American Eagle Outfitters, Inc. (b) | | 8,915,866 | 196,595 |
| Aritzia, Inc. (a) | | 1,947,238 | 63,918 |
| Carvana Co. Class A (a) | | 2,094,628 | 279,067 |
| Dick's Sporting Goods, Inc. | | 770,043 | 166,599 |
| Fanatics, Inc. Class A (a)(c)(d) | | 1,938,909 | 127,503 |
| Five Below, Inc. (a) | | 619,556 | 45,067 |
| Floor & Decor Holdings, Inc. Class A (a) | | 99,628 | 9,764 |
| Foot Locker, Inc. | | 613,870 | 17,839 |
| Gap, Inc. | | 1,530,164 | 35,928 |
| Lowe's Companies, Inc. | | 2,380,675 | 584,480 |
| RH (a)(b)(e) | | 1,021,575 | 296,338 |
| The Home Depot, Inc. | | 89,168 | 32,828 |
| TJX Companies, Inc. | | 2,898,030 | 327,535 |
| Warby Parker, Inc. (a)(b)(e) | | 5,390,035 | 88,774 |
| Wayfair LLC Class A (a) | | 1,344,154 | 73,162 |
| Williams-Sonoma, Inc. | | 201,520 | 31,171 |
| | | | 2,646,850 |
| Textiles, Apparel & Luxury Goods - 2.6% | | | |
| adidas AG | | 217,100 | 54,345 |
| Amer Sports, Inc. (b) | | 2,833,824 | 32,901 |
| Birkenstock Holding PLC | | 122,100 | 7,217 |
| Compagnie Financiere Richemont SA Series A | | 209,596 | 31,970 |
| Crocs, Inc. (a) | | 1,247,067 | 167,568 |
| Deckers Outdoor Corp. (a) | | 531,601 | 490,471 |
| Hermes International SCA | | 21,285 | 46,601 |
| lululemon athletica, Inc. (a) | | 1,074,557 | 277,945 |
| LVMH Moet Hennessy Louis Vuitton SE | | 146,440 | 103,293 |
| NIKE, Inc. Class B | | 2,872,236 | 215,016 |
| On Holding AG (a) | | 2,259,183 | 93,575 |
| Prada SpA | | 2,200,200 | 15,883 |
| PVH Corp. | | 833,646 | 85,024 |
| Ralph Lauren Corp. Class A | | 88,500 | 15,540 |
| Tapestry, Inc. | | 474,869 | 19,037 |
| Tory Burch LLC (a)(c)(d)(f) | | 293,611 | 10,312 |
| | | | 1,666,698 |
TOTAL CONSUMER DISCRETIONARY | | | 12,652,715 |
| CONSUMER STAPLES - 1.2% | | | |
| Beverages - 0.1% | | | |
| Celsius Holdings, Inc. (a)(b) | | 973,223 | 45,576 |
| Consumer Staples Distribution & Retail - 0.5% | | | |
| Costco Wholesale Corp. | | 33,088 | 27,198 |
| Maplebear, Inc. (NASDAQ) (b) | | 286,232 | 9,872 |
| Target Corp. | | 431,714 | 64,934 |
| Walmart, Inc. | | 3,088,085 | 211,966 |
| | | | 313,970 |
| Food Products - 0.1% | | | |
| Bowery Farming, Inc. (a)(d) | | 306,790 | 6 |
| Bowery Farming, Inc. warrants (a)(c)(d) | | 145,528 | 3 |
| Patanjali Foods Ltd. | | 1,495,812 | 30,730 |
| The Hershey Co. (b) | | 108,686 | 21,463 |
| The Real Good Food Co. LLC: | | | |
| Class B (a)(d)(e) | | 1,262,073 | 0 |
| Class B unit (a)(e)(g) | | 1,262,073 | 644 |
| The Real Good Food Co., Inc. Class A (a) | | 195,444 | 100 |
| | | | 52,946 |
| Household Products - 0.2% | | | |
| Procter & Gamble Co. | | 1,057,300 | 169,972 |
| Personal Care Products - 0.2% | | | |
| elf Beauty, Inc. (a) | | 131,283 | 22,657 |
| Estee Lauder Companies, Inc. Class A | | 408,218 | 40,663 |
| Kenvue, Inc. | | 1,573,059 | 29,086 |
| Oddity Tech Ltd. | | 335,280 | 13,560 |
| Oddity Tech Ltd. (g) | | 360,543 | 14,582 |
| | | | 120,548 |
| Tobacco - 0.1% | | | |
| JUUL Labs, Inc.: | | | |
| Class A (a)(c)(d) | | 21,148 | 23 |
| Class B (a)(c)(d) | | 6,625 | 7 |
| Philip Morris International, Inc. | | 541,003 | 62,302 |
| | | | 62,332 |
TOTAL CONSUMER STAPLES | | | 765,344 |
| ENERGY - 1.4% | | | |
| Energy Equipment & Services - 0.0% | | | |
| Secure Energy Services, Inc. | | 1,767,155 | 15,603 |
| Oil, Gas & Consumable Fuels - 1.4% | | | |
| Cameco Corp. | | 1,354,560 | 61,653 |
| Cheniere Energy, Inc. | | 87,595 | 15,998 |
| Diamondback Energy, Inc. | | 939,247 | 190,019 |
| EOG Resources, Inc. | | 1,131,444 | 143,467 |
| Exxon Mobil Corp. | | 975,891 | 115,731 |
| Occidental Petroleum Corp. | | 1,730,224 | 105,232 |
| Reliance Industries Ltd. | | 6,517,493 | 234,369 |
| Reliance Industries Ltd. GDR (g) | | 218,103 | 15,725 |
| Shell PLC ADR | | 295,200 | 21,615 |
| | | | 903,809 |
TOTAL ENERGY | | | 919,412 |
| FINANCIALS - 3.6% | | | |
| Banks - 0.3% | | | |
| Citigroup, Inc. | | 1,645,848 | 106,783 |
| HDFC Bank Ltd. | | 1,172,172 | 22,652 |
| KeyCorp | | 1,278,100 | 20,616 |
| U.S. Bancorp | | 388,900 | 17,454 |
| | | | 167,505 |
| Capital Markets - 1.1% | | | |
| 3i Group PLC | | 856,503 | 34,458 |
| Blue Owl Capital, Inc. Class A | | 3,411,564 | 65,059 |
| Coinbase Global, Inc. (a) | | 1,049,564 | 235,480 |
| CVC Capital Partners PLC (g) | | 919,222 | 17,265 |
| Goldman Sachs Group, Inc. | | 273,192 | 139,063 |
| Interactive Brokers Group, Inc. | | 56,800 | 6,775 |
| Jefferies Financial Group, Inc. (b) | | 462,754 | 27,057 |
| KKR & Co., Inc. (b) | | 478,336 | 59,051 |
| Moody's Corp. | | 116,584 | 53,218 |
| Morgan Stanley | | 717,904 | 74,095 |
| Northern Trust Corp. | | 103,969 | 9,217 |
| Robinhood Markets, Inc. (a) | | 366,357 | 7,536 |
| | | | 728,274 |
| Consumer Finance - 0.3% | | | |
| American Express Co. | | 884,456 | 223,803 |
| Kaspi.KZ JSC ADR | | 55,878 | 7,271 |
| | | | 231,074 |
| Financial Services - 1.7% | | | |
| Ant International Co. Ltd. Class C (a)(c)(d) | | 3,214,400 | 5,464 |
| Apollo Global Management, Inc. | | 426,718 | 53,472 |
| Berkshire Hathaway, Inc. Class B (a) | | 52,063 | 22,830 |
| Block, Inc. Class A (a) | | 2,492,746 | 154,251 |
| Circle Internet Financial Ltd. Class E (d) | | 1,244,183 | 36,106 |
| Jio Financial Services Ltd. | | 6,689,593 | 26,246 |
| MasterCard, Inc. Class A | | 1,357,004 | 629,256 |
| Rapyd Financial Network 2016 Ltd. (a)(c)(d) | | 204,327 | 9,268 |
| Rocket Companies, Inc. (a)(b) | | 155,895 | 2,524 |
| Toast, Inc. (a) | | 1,352,692 | 35,386 |
| Visa, Inc. Class A | | 510,087 | 135,515 |
| | | | 1,110,318 |
| Insurance - 0.2% | | | |
| Progressive Corp. | | 558,885 | 119,668 |
TOTAL FINANCIALS | | | 2,356,839 |
| HEALTH CARE - 7.7% | | | |
| Biotechnology - 1.2% | | | |
| Alnylam Pharmaceuticals, Inc. (a) | | 224,952 | 53,417 |
| Apogee Therapeutics, Inc. (b) | | 275,454 | 13,415 |
| Arcellx, Inc. (a) | | 87,186 | 5,389 |
| Ascendis Pharma A/S sponsored ADR (a) | | 416,108 | 55,550 |
| Avidity Biosciences, Inc. (a) | | 218,066 | 9,939 |
| Cibus, Inc. (a) | | 153,600 | 1,519 |
| Janux Therapeutics, Inc. (a) | | 124,142 | 5,040 |
| Legend Biotech Corp. ADR (a) | | 463,276 | 26,124 |
| Moderna, Inc. (a) | | 359,691 | 42,882 |
| Moonlake Immunotherapeutics Class A (a)(b) | | 392,858 | 16,363 |
| Natera, Inc. (a) | | 149,900 | 15,348 |
| Regeneron Pharmaceuticals, Inc. (a) | | 448,193 | 483,685 |
| Viking Therapeutics, Inc. (a) | | 601,437 | 34,282 |
| | | | 762,953 |
| Health Care Equipment & Supplies - 1.1% | | | |
| Blink Health LLC Series A1 (a)(c)(d) | | 63,681 | 2,675 |
| Boston Scientific Corp. (a) | | 5,800,060 | 428,508 |
| Glaukos Corp. (a) | | 187,252 | 21,940 |
| Intuitive Surgical, Inc. (a) | | 355,391 | 158,010 |
| Masimo Corp. (a) | | 125,925 | 13,471 |
| Stryker Corp. | | 317,705 | 104,033 |
| TransMedics Group, Inc. (a) | | 104,589 | 14,879 |
| | | | 743,516 |
| Health Care Providers & Services - 1.3% | | | |
| Hims & Hers Health, Inc. (a) | | 561,365 | 11,923 |
| McKesson Corp. | | 20,707 | 12,777 |
| Tenet Healthcare Corp. (a) | | 491,558 | 73,586 |
| UnitedHealth Group, Inc. | | 1,257,492 | 724,517 |
| | | | 822,803 |
| Health Care Technology - 0.0% | | | |
| MultiPlan Corp. warrants (a)(c) | | 138,859 | 0 |
| Life Sciences Tools & Services - 0.4% | | | |
| Danaher Corp. | | 658,213 | 182,378 |
| Revvity, Inc. | | 25,800 | 3,241 |
| Thermo Fisher Scientific, Inc. | | 72,768 | 44,632 |
| Veterinary Emergency Group LLC Class A (a)(c)(d)(f) | | 524,494 | 29,933 |
| | | | 260,184 |
| Pharmaceuticals - 3.7% | | | |
| Eli Lilly & Co. | | 2,045,450 | 1,645,094 |
| Galderma Group AG | | 194,862 | 15,338 |
| Merck & Co., Inc. | | 1,053,014 | 119,127 |
| Novo Nordisk A/S: | | | |
| Series B | | 271,017 | 35,908 |
| Series B sponsored ADR | | 2,057,804 | 272,927 |
| Structure Therapeutics, Inc. ADR (a) | | 112,649 | 4,212 |
| Teva Pharmaceutical Industries Ltd. sponsored ADR (a) | | 3,194,580 | 55,682 |
| UCB SA | | 187,600 | 31,399 |
| Zoetis, Inc. Class A | | 1,485,712 | 267,488 |
| | | | 2,447,175 |
TOTAL HEALTH CARE | | | 5,036,631 |
| INDUSTRIALS - 4.0% | | | |
| Aerospace & Defense - 1.5% | | | |
| ABL Space Systems warrants 12/14/30 (a)(c)(d) | | 30,937 | 339 |
| General Electric Co. | | 807,926 | 137,509 |
| Howmet Aerospace, Inc. | | 1,115,615 | 106,764 |
| Loar Holdings, Inc. (b) | | 57,860 | 3,616 |
| Space Exploration Technologies Corp. (a)(c)(d) | | 2,961,836 | 331,726 |
| Space Exploration Technologies Corp. Class C (a)(c)(d) | | 27,830 | 3,117 |
| Spirit AeroSystems Holdings, Inc. Class A (a) | | 835,503 | 30,287 |
| The Boeing Co. (a) | | 1,650,685 | 314,621 |
| TransDigm Group, Inc. | | 26,031 | 33,690 |
| | | | 961,669 |
| Air Freight & Logistics - 0.1% | | | |
| C.H. Robinson Worldwide, Inc. | | 345,400 | 30,758 |
| FedEx Corp. | | 204,274 | 61,742 |
| | | | 92,500 |
| Building Products - 0.1% | | | |
| Builders FirstSource, Inc. (a) | | 176,420 | 29,527 |
| Fortune Brands Innovations, Inc. | | 42,964 | 3,472 |
| Lennox International, Inc. (b) | | 16,000 | 9,336 |
| The AZEK Co., Inc. Class A, (a) | | 398,942 | 17,909 |
| Trane Technologies PLC | | 53,699 | 17,951 |
| | | | 78,195 |
| Commercial Services & Supplies - 0.1% | | | |
| ACV Auctions, Inc. Class A (a) | | 1,808,319 | 30,886 |
| Construction & Engineering - 0.1% | | | |
| EMCOR Group, Inc. | | 62,575 | 23,493 |
| Fluor Corp. (a) | | 389,471 | 18,734 |
| Larsen & Toubro Ltd. | | 479,700 | 21,857 |
| | | | 64,084 |
| Electrical Equipment - 0.2% | | | |
| Acuity Brands, Inc. | | 98,877 | 24,853 |
| Eaton Corp. PLC | | 217,657 | 66,340 |
| GE Vernova LLC | | 295,468 | 52,664 |
| | | | 143,857 |
| Ground Transportation - 1.5% | | | |
| Bird Global, Inc. (a)(c) | | 72,846 | 0 |
| Bird Global, Inc.: | | | |
| Stage 1 rights (a)(d) | | 10,516 | 0 |
| Stage 2 rights (a)(d) | | 10,516 | 0 |
| Stage 3 rights (a)(d) | | 10,516 | 0 |
| Lyft, Inc. (a) | | 21,533,863 | 259,483 |
| Uber Technologies, Inc. (a) | | 10,742,571 | 692,574 |
| | | | 952,057 |
| Machinery - 0.0% | | | |
| Mitsubishi Heavy Industries Ltd. | | 676,983 | 8,114 |
| Professional Services - 0.0% | | | |
| Timee, Inc. | | 777,600 | 7,527 |
| Trading Companies & Distributors - 0.4% | | | |
| Ferguson PLC | | 200,518 | 44,645 |
| FTAI Aviation Ltd. | | 1,886,830 | 210,287 |
| United Rentals, Inc. | | 9,000 | 6,814 |
| Watsco, Inc. | | 35,370 | 17,313 |
| ZKH Group Ltd. (A Shares) (a) | | 15 | 0 |
| | | | 279,059 |
| Transportation Infrastructure - 0.0% | | | |
| JSW Infrastructure Ltd. | | 1,932,200 | 7,822 |
TOTAL INDUSTRIALS | | | 2,625,770 |
| INFORMATION TECHNOLOGY - 44.8% | | | |
| Communications Equipment - 0.1% | | | |
| Arista Networks, Inc. (a) | | 162,078 | 56,168 |
| Ciena Corp. (a) | | 735,239 | 38,777 |
| | | | 94,945 |
| Electronic Equipment, Instruments & Components - 0.1% | | | |
| Celestica, Inc. (a) | | 241,400 | 12,659 |
| Coherent Corp. (a) | | 167,473 | 11,670 |
| Corning, Inc. | | 1,740,909 | 69,654 |
| | | | 93,983 |
| IT Services - 0.7% | | | |
| MongoDB, Inc. Class A (a) | | 242,327 | 61,154 |
| Okta, Inc. (a) | | 2,347,362 | 220,511 |
| Shopify, Inc. Class A (a) | | 1,113,747 | 68,213 |
| Snowflake, Inc. (a) | | 584,930 | 76,263 |
| X Holdings Corp. Class A (a)(c)(d) | | 196,600 | 5,493 |
| | | | 431,634 |
| Semiconductors & Semiconductor Equipment - 22.2% | | | |
| Advanced Micro Devices, Inc. (a) | | 1,442,784 | 208,453 |
| Allegro MicroSystems LLC (a) | | 979,760 | 23,553 |
| Applied Materials, Inc. | | 155,635 | 33,026 |
| ASML Holding NV (depository receipt) | | 154,631 | 144,843 |
| Astera Labs, Inc. | | 436,823 | 19,150 |
| Astera Labs, Inc. | | 2,491,651 | 109,234 |
| Broadcom, Inc. | | 1,995,360 | 320,614 |
| Enphase Energy, Inc. (a) | | 241,960 | 27,852 |
| First Solar, Inc. (a) | | 131,077 | 28,311 |
| GlobalFoundries, Inc. (a) | | 5,731,047 | 292,341 |
| Impinj, Inc. (a) | | 281,621 | 44,859 |
| Lam Research Corp. | | 72,986 | 67,238 |
| Marvell Technology, Inc. | | 27,367,010 | 1,833,042 |
| Micron Technology, Inc. | | 1,566,802 | 172,066 |
| Monolithic Power Systems, Inc. | | 310,968 | 268,393 |
| NVIDIA Corp. (h) | | 75,043,545 | 8,781,595 |
| NXP Semiconductors NV | | 3,686,855 | 970,233 |
| ON Semiconductor Corp. (a) | | 4,462,356 | 349,179 |
| Qorvo, Inc. (a) | | 277,612 | 33,258 |
| Qualcomm, Inc. | | 655,740 | 118,656 |
| Synaptics, Inc. (a) | | 75,239 | 6,570 |
| Taiwan Semiconductor Manufacturing Co. Ltd. sponsored ADR | | 2,787,932 | 462,239 |
| Teradyne, Inc. | | 1,309,146 | 171,708 |
| Xsight Labs Ltd. warrants 1/11/34 (a)(c)(d) | | 130,829 | 276 |
| | | | 14,486,689 |
| Software - 10.1% | | | |
| Adobe, Inc. (a) | | 132,781 | 73,249 |
| Applied Intuition, Inc. Class A (c)(d) | | 33,762 | 2,015 |
| AppLovin Corp. Class A, (a) | | 409,380 | 31,563 |
| Atom Tickets LLC (a)(c)(d)(f) | | 1,204,239 | 0 |
| CoreWeave, Inc. Class A (d) | | 148,061 | 115,194 |
| Datadog, Inc. Class A (a) | | 640,386 | 74,567 |
| Figma, Inc. (c)(d) | | 253,830 | 5,886 |
| HubSpot, Inc. (a) | | 305,629 | 151,907 |
| Intuit, Inc. | | 257,423 | 166,643 |
| Life360, Inc. | | 422,656 | 14,180 |
| Microsoft Corp. | | 13,056,976 | 5,462,386 |
| Onestream, Inc. (b) | | 85,500 | 2,381 |
| Oracle Corp. | | 708,043 | 98,737 |
| Palantir Technologies, Inc. Class A (a) | | 782,894 | 21,052 |
| Pine Labs Private Ltd. (a)(c)(d) | | 9,912 | 3,197 |
| SAP SE sponsored ADR | | 154,200 | 32,629 |
| ServiceNow, Inc. (a) | | 229,777 | 187,128 |
| Stripe, Inc. Class B (a)(c)(d) | | 173,600 | 4,776 |
| Synopsys, Inc. (a) | | 80,450 | 44,917 |
| Tanium, Inc. Class B (a)(c)(d) | | 554,900 | 4,822 |
| Zoom Video Communications, Inc. Class A (a) | | 1,009,998 | 61,004 |
| | | | 6,558,233 |
| Technology Hardware, Storage & Peripherals - 11.6% | | | |
| Apple, Inc. | | 32,887,845 | 7,303,733 |
| Dell Technologies, Inc. | | 1,066,657 | 121,258 |
| Western Digital Corp. (a) | | 1,707,167 | 114,466 |
| | | | 7,539,457 |
TOTAL INFORMATION TECHNOLOGY | | | 29,204,941 |
| MATERIALS - 0.7% | | | |
| Chemicals - 0.1% | | | |
| Linde PLC | | 65,261 | 29,596 |
| Sherwin-Williams Co. | | 81,286 | 28,515 |
| Westlake Corp. | | 70,400 | 10,409 |
| | | | 68,520 |
| Construction Materials - 0.2% | | | |
| CRH PLC | | 254,966 | 21,851 |
| Eagle Materials, Inc. | | 121,774 | 33,159 |
| Grasim Industries Ltd. | | 575,900 | 19,099 |
| Martin Marietta Materials, Inc. | | 51,090 | 30,314 |
| Vulcan Materials Co. | | 114,177 | 31,343 |
| | | | 135,766 |
| Containers & Packaging - 0.1% | | | |
| Aptargroup, Inc. | | 55,500 | 8,157 |
| Crown Holdings, Inc. | | 98,000 | 8,693 |
| International Paper Co. | | 284,900 | 13,242 |
| Smurfit Westrock PLC | | 141,200 | 6,331 |
| | | | 36,423 |
| Metals & Mining - 0.3% | | | |
| ATI, Inc. (a) | | 730,955 | 49,493 |
| Carpenter Technology Corp. | | 628,919 | 91,740 |
| Freeport-McMoRan, Inc. | | 582,860 | 26,468 |
| Hindalco Industries Ltd. | | 824,500 | 6,594 |
| Welspun Gujarat Stahl Rohren Ltd. | | 2,887,200 | 22,093 |
| | | | 196,388 |
TOTAL MATERIALS | | | 437,097 |
| REAL ESTATE - 0.3% | | | |
| Equity Real Estate Investment Trusts (REITs) - 0.2% | | | |
| Welltower, Inc. | | 1,176,847 | 130,924 |
| Real Estate Management & Development - 0.1% | | | |
| Zillow Group, Inc. Class C (a)(b) | | 925,355 | 45,065 |
TOTAL REAL ESTATE | | | 175,989 |
| TOTAL COMMON STOCKS (Cost $27,281,745) | | | 64,302,237 |
| | | | |
| Preferred Stocks - 1.4% |
| | | Shares | Value ($) (000s) |
| Convertible Preferred Stocks - 1.4% | | | |
| COMMUNICATION SERVICES - 0.1% | | | |
| Interactive Media & Services - 0.1% | | | |
| ByteDance Ltd. Series E1 (a)(c)(d) | | 293,038 | 67,346 |
| | | | |
| CONSUMER DISCRETIONARY - 0.1% | | | |
| Automobiles - 0.0% | | | |
| Neutron Holdings, Inc.: | | | |
| Series 1C(a)(c)(d) | | 50,654,200 | 1,560 |
| Series 1D(a)(c)(d) | | 85,315,542 | 2,628 |
| Rad Power Bikes, Inc.: | | | |
| Series A(a)(c)(d) | | 120,997 | 30 |
| Series C(a)(c)(d) | | 476,111 | 229 |
| Series D(a)(c)(d) | | 867,000 | 624 |
| Waymo LLC Series A2 (a)(c)(d) | | 81,316 | 5,041 |
| | | | 10,112 |
| Broadline Retail - 0.1% | | | |
| Meesho: | | | |
| Series D2(c)(d) | | 199,367 | 11,119 |
| Series E(c)(d) | | 33,209 | 1,852 |
| Series E1(c)(d) | | 39,951 | 2,228 |
| Series F(a)(c)(d) | | 577,413 | 32,762 |
| | | | 47,961 |
| Hotels, Restaurants & Leisure - 0.0% | | | |
| Discord, Inc. Series I (a)(c)(d) | | 6,100 | 1,619 |
| MOD Super Fast Pizza Holdings LLC: | | | |
| Series 3(a)(c)(d)(f) | | 68,723 | 0 |
| Series 4(a)(c)(d)(f) | | 6,272 | 0 |
| Series 5(a)(c)(d)(f) | | 25,187 | 0 |
| | | | 1,619 |
TOTAL CONSUMER DISCRETIONARY | | | 59,692 |
| | | | |
| CONSUMER STAPLES - 0.0% | | | |
| Consumer Staples Distribution & Retail - 0.0% | | | |
| GoBrands, Inc.: | | | |
| Series G(a)(c)(d) | | 166,200 | 4,115 |
| Series H(a)(c)(d) | | 104,029 | 3,313 |
| | | | 7,428 |
| Food Products - 0.0% | | | |
| AgBiome LLC Series C (a)(c)(d) | | 1,091,300 | 0 |
| | | | |
| Tobacco - 0.0% | | | |
| JUUL Labs, Inc.: | | | |
| Series C(a)(c)(d) | | 2,570,575 | 2,751 |
| Series D(a)(c)(d) | | 13,822 | 15 |
| Series E(a)(c)(d) | | 14,959 | 16 |
| | | | 2,782 |
TOTAL CONSUMER STAPLES | | | 10,210 |
| | | | |
| FINANCIALS - 0.1% | | | |
| Financial Services - 0.1% | | | |
| Akeana Series C (c)(d) | | 363,100 | 4,782 |
| Tenstorrent Holdings, Inc.: | | | |
| Series C1(c)(d) | | 150,460 | 11,175 |
| Series D1(c)(d) | | 102,500 | 8,080 |
| Series D2(c)(d) | | 47,443 | 3,605 |
| | | | 27,642 |
| HEALTH CARE - 0.0% | | | |
| Biotechnology - 0.0% | | | |
| Castle Creek Biosciences, Inc.: | | | |
| Series B(a)(c)(d) | | 3,301 | 715 |
| Series D2(a)(c)(d) | | 5,347 | 1,089 |
| | | | 1,804 |
| Health Care Equipment & Supplies - 0.0% | | | |
| Blink Health LLC: | | | |
| Series C(a)(c)(d) | | 170,685 | 7,169 |
| Series D(c)(d) | | 38,410 | 1,613 |
| | | | 8,782 |
TOTAL HEALTH CARE | | | 10,586 |
| | | | |
| INDUSTRIALS - 0.5% | | | |
| Aerospace & Defense - 0.5% | | | |
| ABL Space Systems: | | | |
| Series B(a)(c)(d) | | 270,130 | 6,480 |
| Series B2(a)(c)(d) | | 141,569 | 3,749 |
| Series C1(c)(d) | | 41,250 | 821 |
| Relativity Space, Inc. Series E (a)(c)(d) | | 2,480,614 | 53,432 |
| Space Exploration Technologies Corp.: | | | |
| Series G(a)(c)(d) | | 98,074 | 109,843 |
| Series H(a)(c)(d) | | 25,767 | 28,859 |
| Series J(c)(d) | | 5,376 | 6,021 |
| Series N(a)(c)(d) | | 79,406 | 88,935 |
| | | | 298,140 |
| Air Freight & Logistics - 0.0% | | | |
| Zipline International, Inc. Series G (c)(d) | | 281,500 | 11,809 |
| | | | |
| Construction & Engineering - 0.0% | | | |
| Beta Technologies, Inc. Series A (a)(c)(d) | | 101,010 | 11,132 |
| | | | |
TOTAL INDUSTRIALS | | | 321,081 |
| | | | |
| INFORMATION TECHNOLOGY - 0.5% | | | |
| Electronic Equipment, Instruments & Components - 0.0% | | | |
| CelLink Corp. Series D (a)(c)(d) | | 771,513 | 5,763 |
| Enevate Corp. Series E (a)(c)(d) | | 12,084,432 | 8,459 |
| Frore Systems, Inc. Series C (c)(d) | | 366,694 | 5,918 |
| Menlo Micro, Inc. Series C (a)(c)(d) | | 4,680,700 | 3,276 |
| | | | 23,416 |
| IT Services - 0.0% | | | |
| Gupshup, Inc. (a)(c)(d) | | 709,497 | 6,265 |
| Yanka Industries, Inc. Series F (a)(c)(d) | | 508,854 | 3,160 |
| | | | 9,425 |
| Semiconductors & Semiconductor Equipment - 0.1% | | | |
| Alif Semiconductor Series C (a)(c)(d) | | 391,847 | 7,265 |
| Retym, Inc. Series C (a)(c)(d) | | 810,037 | 6,983 |
| Sima Technologies, Inc.: | | | |
| Series B(a)(c)(d) | | 2,821,200 | 18,422 |
| Series B1(a)(c)(d) | | 188,978 | 1,427 |
| Xsight Labs Ltd.: | | | |
| Series D(a)(c)(d) | | 1,192,000 | 6,628 |
| Series D1(c)(d) | | 436,098 | 3,454 |
| | | | 44,179 |
| Software - 0.4% | | | |
| Algolia, Inc. Series D (a)(c)(d) | | 276,495 | 4,612 |
| Anthropic PBC Series D (c)(d) | | 393,051 | 11,792 |
| Applied Intuition, Inc.: | | | |
| Series A2(c)(d) | | 43,948 | 2,623 |
| Series B2(c)(d) | | 21,192 | 1,265 |
| Bolt Technology OU Series E (a)(c)(d) | | 170,267 | 22,940 |
| CoreWeave, Inc. Series C (c)(d) | | 9,498 | 7,634 |
| Databricks, Inc.: | | | |
| Series G(a)(c)(d) | | 437,958 | 33,872 |
| Series H(a)(c)(d) | | 273,924 | 21,185 |
| Series I(c)(d) | | 6,675 | 516 |
| Dataminr, Inc. Series D (a)(c)(d) | | 277,250 | 3,521 |
| Moloco, Inc. Series A (a)(c)(d) | | 103,822 | 5,661 |
| Mountain Digital, Inc. Series D (a)(c)(d) | | 524,265 | 7,025 |
| Pine Labs Private Ltd.: | | | |
| Series 1(a)(c)(d) | | 23,689 | 7,641 |
| Series A(a)(c)(d) | | 5,920 | 1,910 |
| Series B(a)(c)(d) | | 6,440 | 2,077 |
| Series B2(a)(c)(d) | | 5,209 | 1,680 |
| Series C(a)(c)(d) | | 9,690 | 3,126 |
| Series C1(a)(c)(d) | | 2,041 | 658 |
| Series D(a)(c)(d) | | 2,183 | 704 |
| Skyryse, Inc. Series B (a)(c)(d) | | 560,000 | 11,872 |
| Stripe, Inc.: | | | |
| Series H(a)(c)(d) | | 73,100 | 2,011 |
| Series I(a)(c)(d) | | 1,129,819 | 31,081 |
| xAI Corp. Series B (c)(d) | | 3,688,585 | 44,152 |
| | | | 229,558 |
| Technology Hardware, Storage & Peripherals - 0.0% | | | |
| Lightmatter, Inc.: | | | |
| Series C(a)(c)(d) | | 372,617 | 8,149 |
| Series C2(c)(d) | | 58,528 | 1,528 |
| | | | 9,677 |
TOTAL INFORMATION TECHNOLOGY | | | 316,255 |
| | | | |
| MATERIALS - 0.1% | | | |
| Metals & Mining - 0.1% | | | |
| Diamond Foundry, Inc. Series C (a)(c)(d) | | 2,271,329 | 62,552 |
| | | | |
| UTILITIES - 0.0% | | | |
| Independent Power and Renewable Electricity Producers - 0.0% | | | |
| Redwood Materials: | | | |
| Series C(a)(c)(d) | | 341,408 | 12,181 |
| Series D(a)(c)(d) | | 97,832 | 3,491 |
| | | | 15,672 |
| TOTAL CONVERTIBLE PREFERRED STOCKS | | | 891,036 |
| Nonconvertible Preferred Stocks - 0.0% | | | |
| HEALTH CARE - 0.0% | | | |
| Biotechnology - 0.0% | | | |
| Castle Creek Biosciences, Inc. Series A4 (a)(c)(d) | | 29,758 | 6,710 |
| | | | |
| TOTAL PREFERRED STOCKS (Cost $875,752) | | | 897,746 |
| | | | |
| Convertible Bonds - 0.0% |
| | | Principal Amount (i) (000s) | Value ($) (000s) |
| CONSUMER DISCRETIONARY - 0.0% | | | |
| Automobiles - 0.0% | | | |
| Neutron Holdings, Inc.: | | | |
| 4% 5/22/27 (c)(d) | | 2,433 | 3,101 |
| 4% 6/12/27 (c)(d) | | 647 | 825 |
| 6.5% 10/29/26 (c)(d)(j) | | 22,340 | 22,404 |
| (Cost $25,420) | | | 26,330 |
| | | | |
| Preferred Securities - 0.0% |
| | | Principal Amount (i) (000s) | Value ($) (000s) |
| CONSUMER DISCRETIONARY - 0.0% | | | |
| Automobiles - 0.0% | | | |
| Rad Power Bikes, Inc. 8% 12/31/25 (c)(d) | | 981 | 1,428 |
| INFORMATION TECHNOLOGY - 0.0% | | | |
| Electronic Equipment, Instruments & Components - 0.0% | | | |
| Enevate Corp. 6% (c)(d)(k) | | 628 | 713 |
| Semiconductors & Semiconductor Equipment - 0.0% | | | |
| Sima Technologies, Inc. 10% 12/31/27 (c)(d) | | 2,800 | 2,829 |
TOTAL INFORMATION TECHNOLOGY | | | 3,542 |
| TOTAL PREFERRED SECURITIES (Cost $4,409) | | | 4,970 |
| | | | |
| Money Market Funds - 0.3% |
| | | Shares | Value ($) (000s) |
| Fidelity Cash Central Fund 5.39% (l) | | 34,912,555 | 34,920 |
| Fidelity Securities Lending Cash Central Fund 5.39% (l)(m) | | 200,800,764 | 200,821 |
| TOTAL MONEY MARKET FUNDS (Cost $235,741) | | | 235,741 |
| | | | |
| Purchased Options - 0.0% |
| | Counterparty | Number of Contracts | Notional Amount ($) (000s) | Exercise Price ($) | Expiration Date | Value ($) (000s) |
| Put Options | | | | | | |
| NVIDIA Corp. | Chicago Board Options Exchange | 6,000 | 70,212 | 80 | 09/20/24 | 504 |
| | | | | | | |
| | | | | | | 504 |
TOTAL PURCHASED OPTIONS (Cost $3,764) | | | | | | 504 |
| TOTAL INVESTMENT IN SECURITIES - 100.3% (Cost $28,426,831) | 65,467,528 |
NET OTHER ASSETS (LIABILITIES) - (0.3)% | (226,935) |
| NET ASSETS - 100.0% | 65,240,593 |
| | |
| Written Options |
| | Counterparty | Number of Contracts | Notional Amount ($) (000s) | Exercise Price ($) | Expiration Date | Value ($) (000s) |
| Call Options | | | | | | |
| NVIDIA Corp. | Chicago Board Options Exchange | 6,000 | 70,212 | 114.00 | 09/20/24 | (7,605) |
| | | | | | | |
Any values shown as $0 in the Consolidated Schedule of Investments may reflect amounts less than $500.
Legend
| (b) | Security or a portion of the security is on loan at period end. |
| (c) | Restricted securities (including private placements) - Investment in securities not registered under the Securities Act of 1933 (excluding 144A issues). At the end of the period, the value of restricted securities (excluding 144A issues) amounted to $1,510,978,000 or 2.3% of net assets. |
| (f) | Investment is owned by a wholly-owned subsidiary (Subsidiary) that is treated as a corporation for U.S. tax purposes. |
| (g) | Security exempt from registration under Rule 144A of the Securities Act of 1933. These securities may be resold in transactions exempt from registration, normally to qualified institutional buyers. At the end of the period, the value of these securities amounted to $48,216,000 or 0.1% of net assets. |
| (h) | Security or a portion of the security is pledged as collateral for options written. At period end, the value of securities pledged amounted to $70,212,000. |
| (i) | Amount is stated in United States dollars unless otherwise noted. |
| (j) | Security initially issued at one coupon which converts to a higher coupon at a specified date. The rate shown is the rate at period end. |
| (k) | Security is perpetual in nature with no stated maturity date. |
| (l) | Affiliated fund that is generally available only to investment companies and other accounts managed by Fidelity Investments. The rate quoted is the annualized seven-day yield of the fund at period end. A complete unaudited listing of the fund's holdings as of its most recent quarter end is available upon request. In addition, each Fidelity Central Fund's financial statements, which are not covered by the Fund's Report of Independent Registered Public Accounting Firm, are available on the SEC's website or upon request. |
| (m) | Investment made with cash collateral received from securities on loan. |
| Additional information on each restricted holding is as follows: |
| Security | Acquisition Date | Acquisition Cost ($) (000s) |
| ABL Space Systems warrants 12/14/30 | 12/14/23 | 0 |
| | | |
| ABL Space Systems Series B | 3/24/21 | 12,165 |
| | | |
| ABL Space Systems Series B2 | 10/22/21 | 9,626 |
| | | |
| ABL Space Systems Series C1 | 12/14/23 | 1,349 |
| | | |
| AgBiome LLC Series C | 6/29/18 | 6,912 |
| | | |
| Akeana Series C | 1/23/24 | 4,633 |
| | | |
| Algolia, Inc. Series D | 7/23/21 | 8,086 |
| | | |
| Alif Semiconductor Series C | 3/08/22 | 7,954 |
| | | |
| Ant International Co. Ltd. Class C | 5/16/18 | 12,251 |
| | | |
| Anthropic PBC Series D | 5/31/24 | 11,793 |
| | | |
| Applied Intuition, Inc. Class A | 7/02/24 | 2,016 |
| | | |
| Applied Intuition, Inc. Series A2 | 7/02/24 | 2,623 |
| | | |
| Applied Intuition, Inc. Series B2 | 7/02/24 | 1,265 |
| | | |
| Atom Tickets LLC | 8/15/17 | 7,000 |
| | | |
| Beta Technologies, Inc. Series A | 4/09/21 | 7,401 |
| | | |
| Bird Global, Inc. | 5/11/21 | 18,211 |
| | | |
| Blink Health LLC Series A1 | 12/30/20 - 6/17/24 | 1,807 |
| | | |
| Blink Health LLC Series C | 11/07/19 - 7/14/21 | 6,515 |
| | | |
| Blink Health LLC Series D | 6/17/24 - 6/25/24 | 1,613 |
| | | |
| Bolt Technology OU Series E | 1/03/22 | 44,235 |
| | | |
| Bowery Farming, Inc. warrants | 10/25/23 | 0 |
| | | |
| ByteDance Ltd. Series E1 | 11/18/20 | 32,109 |
| | | |
| Castle Creek Biosciences, Inc. Series A4 | 9/29/16 | 9,831 |
| | | |
| Castle Creek Biosciences, Inc. Series B | 10/09/18 | 1,360 |
| | | |
| Castle Creek Biosciences, Inc. Series D2 | 6/28/21 | 917 |
| | | |
| CelLink Corp. Series D | 1/20/22 | 16,066 |
| | | |
| CoreWeave, Inc. Series C | 5/17/24 | 7,399 |
| | | |
| Databricks, Inc. Series G | 2/01/21 | 25,893 |
| | | |
| Databricks, Inc. Series H | 8/31/21 | 20,129 |
| | | |
| Databricks, Inc. Series I | 9/14/23 | 491 |
| | | |
| Dataminr, Inc. Series D | 3/06/15 | 3,535 |
| | | |
| Diamond Foundry, Inc. Series C | 3/15/21 | 54,512 |
| | | |
| Discord, Inc. Series I | 9/15/21 | 3,359 |
| | | |
| Enevate Corp. Series E | 1/29/21 | 13,398 |
| | | |
| Enevate Corp. 6% | 11/02/23 | 628 |
| | | |
| Epic Games, Inc. | 7/30/20 | 3,525 |
| | | |
| Fanatics, Inc. Class A | 8/13/20 - 10/24/22 | 78,990 |
| | | |
| Figma, Inc. | 5/15/24 | 5,887 |
| | | |
| Frore Systems, Inc. Series C | 5/10/24 | 5,893 |
| | | |
| GoBrands, Inc. Series G | 3/02/21 | 41,503 |
| | | |
| GoBrands, Inc. Series H | 7/22/21 | 40,414 |
| | | |
| Gupshup, Inc. | 6/08/21 | 16,223 |
| | | |
| JUUL Labs, Inc. Class A | 12/20/17 | 453 |
| | | |
| JUUL Labs, Inc. Class B | 11/21/17 | 0 |
| | | |
| JUUL Labs, Inc. Series C | 5/22/15 - 7/06/18 | 0 |
| | | |
| JUUL Labs, Inc. Series D | 6/25/18 - 7/06/18 | 0 |
| | | |
| JUUL Labs, Inc. Series E | 12/20/17 | 321 |
| | | |
| Lenskart Solutions Pvt Ltd. | 4/30/24 | 29,540 |
| | | |
| Lightmatter, Inc. Series C | 5/19/23 | 6,132 |
| | | |
| Lightmatter, Inc. Series C2 | 12/18/23 | 1,522 |
| | | |
| Meesho Series D2 | 7/15/24 | 11,165 |
| | | |
| Meesho Series E | 7/15/24 | 1,860 |
| | | |
| Meesho Series E1 | 4/18/24 | 2,237 |
| | | |
| Meesho Series F | 9/21/21 - 7/15/24 | 43,634 |
| | | |
| Menlo Micro, Inc. Series C | 2/09/22 | 6,204 |
| | | |
| MOD Super Fast Pizza Holdings LLC Series 3 | 11/03/16 | 9,415 |
| | | |
| MOD Super Fast Pizza Holdings LLC Series 4 | 12/14/17 | 878 |
| | | |
| MOD Super Fast Pizza Holdings LLC Series 5 | 5/15/19 | 3,590 |
| | | |
| Moloco, Inc. Series A | 6/26/23 | 6,229 |
| | | |
| Mountain Digital, Inc. Series D | 11/05/21 | 12,040 |
| | | |
| MultiPlan Corp. warrants | 10/08/20 | 0 |
| | | |
| Neutron Holdings, Inc. | 2/04/21 | 72 |
| | | |
| Neutron Holdings, Inc. Series 1C | 7/03/18 | 9,262 |
| | | |
| Neutron Holdings, Inc. Series 1D | 1/25/19 | 20,689 |
| | | |
| Neutron Holdings, Inc. 4% 5/22/27 | 6/04/20 | 2,433 |
| | | |
| Neutron Holdings, Inc. 4% 6/12/27 | 6/12/20 | 647 |
| | | |
| Neutron Holdings, Inc. 6.5% 10/29/26 | 10/29/21 - 4/29/24 | 22,340 |
| | | |
| Pine Labs Private Ltd. | 6/30/21 | 3,696 |
| | | |
| Pine Labs Private Ltd. Series 1 | 6/30/21 | 8,833 |
| | | |
| Pine Labs Private Ltd. Series A | 6/30/21 | 2,207 |
| | | |
| Pine Labs Private Ltd. Series B | 6/30/21 | 2,401 |
| | | |
| Pine Labs Private Ltd. Series B2 | 6/30/21 | 1,942 |
| | | |
| Pine Labs Private Ltd. Series C | 6/30/21 | 3,613 |
| | | |
| Pine Labs Private Ltd. Series C1 | 6/30/21 | 761 |
| | | |
| Pine Labs Private Ltd. Series D | 6/30/21 | 814 |
| | | |
| Rad Power Bikes, Inc. | 1/21/21 | 4,477 |
| | | |
| Rad Power Bikes, Inc. warrants 10/6/33 | 10/06/23 | 0 |
| | | |
| Rad Power Bikes, Inc. Series A | 1/21/21 | 584 |
| | | |
| Rad Power Bikes, Inc. Series C | 1/21/21 | 2,297 |
| | | |
| Rad Power Bikes, Inc. Series D | 9/17/21 | 8,309 |
| | | |
| Rad Power Bikes, Inc. 8% 12/31/25 | 10/06/23 | 981 |
| | | |
| Rapyd Financial Network 2016 Ltd. | 3/30/21 | 15,000 |
| | | |
| Redwood Materials Series C | 5/28/21 | 16,184 |
| | | |
| Redwood Materials Series D | 6/02/23 | 4,670 |
| | | |
| Relativity Space, Inc. Series E | 5/27/21 | 56,645 |
| | | |
| Retym, Inc. Series C | 5/17/23 - 6/20/23 | 6,303 |
| | | |
| Sima Technologies, Inc. Series B | 5/10/21 | 14,465 |
| | | |
| Sima Technologies, Inc. Series B1 | 4/25/22 | 1,340 |
| | | |
| Sima Technologies, Inc. 10% 12/31/27 | 4/08/24 - 7/05/24 | 2,800 |
| | | |
| Skyryse, Inc. Series B | 10/21/21 | 13,821 |
| | | |
| Space Exploration Technologies Corp. | 10/16/15 - 5/24/22 | 55,406 |
| | | |
| Space Exploration Technologies Corp. Class C | 9/11/17 | 376 |
| | | |
| Space Exploration Technologies Corp. Series G | 1/20/15 - 9/07/23 | 8,181 |
| | | |
| Space Exploration Technologies Corp. Series H | 8/04/17 | 3,479 |
| | | |
| Space Exploration Technologies Corp. Series J | 9/07/23 | 4,355 |
| | | |
| Space Exploration Technologies Corp. Series N | 8/04/20 | 21,440 |
| | | |
| Stripe, Inc. Class B | 5/18/21 | 6,966 |
| | | |
| Stripe, Inc. Series H | 3/15/21 | 2,933 |
| | | |
| Stripe, Inc. Series I | 3/20/23 - 5/12/23 | 22,748 |
| | | |
| Tanium, Inc. Class B | 4/21/17 | 2,755 |
| | | |
| Tenstorrent Holdings, Inc. Series C1 | 4/23/21 | 8,946 |
| | | |
| Tenstorrent Holdings, Inc. Series D1 | 7/16/24 | 8,080 |
| | | |
| Tenstorrent Holdings, Inc. Series D2 | 7/17/24 | 3,605 |
| | | |
| Tory Burch LLC | 5/14/15 | 20,890 |
| | | |
| Veterinary Emergency Group LLC Class A | 9/16/21 - 3/17/22 | 21,636 |
| | | |
| Waymo LLC Series A2 | 5/08/20 | 6,982 |
| | | |
| X Holdings Corp. Class A | 10/25/22 | 19,660 |
| | | |
| xAI Corp. Series B | 5/13/24 | 44,152 |
| | | |
| Xsight Labs Ltd. warrants 1/11/34 | 1/11/24 | 0 |
| | | |
| Xsight Labs Ltd. Series D | 2/16/21 | 9,531 |
| | | |
| Xsight Labs Ltd. Series D1 | 1/11/24 | 3,487 |
| | | |
| Yanka Industries, Inc. Series F | 4/08/21 | 16,221 |
| | | |
| Zipline International, Inc. Series G | 6/07/24 | 11,808 |
| | | |
Affiliated Central Funds
Fiscal year to date information regarding the Fund's investments in Fidelity Central Funds, including the ownership percentage, is presented below.
| Affiliate (Amounts in thousands) | Value, beginning of period ($) | Purchases ($) | Sales Proceeds ($) | Dividend Income ($) | Realized Gain (loss) ($) | Change in Unrealized appreciation (depreciation) ($) | Value, end of period ($) | % ownership, end of period |
| Fidelity Cash Central Fund 5.39% | 35,306 | 3,456,844 | 3,457,227 | 3,656 | (3) | - | 34,920 | 0.1% |
| Fidelity Securities Lending Cash Central Fund 5.39% | 735,437 | 2,506,793 | 3,041,409 | 981 | - | - | 200,821 | 0.9% |
| Total | 770,743 | 5,963,637 | 6,498,636 | 4,637 | (3) | - | 235,741 | |
| | | | | | | | | |
Amounts in the dividend income column in the above table include any capital gain distributions from underlying funds, which are presented in the corresponding line item in the Consolidated Statement of Operations, if applicable.
Amounts in the dividend income column for Fidelity Securities Lending Cash Central Fund represents the income earned on investing cash collateral, less rebates paid to borrowers and any lending agent fees associated with the loan, plus any premium payments received for lending certain types of securities.
Amounts included in the purchases and sales proceeds columns may include in-kind transactions, if applicable.
Other Affiliated Issuers
An affiliated company is a company in which the Fund has ownership of at least 5% of the voting securities. Fiscal year to date transactions with companies which are or were affiliates are presented in the table below. Certain corporate actions, such as mergers, are excluded from the amounts in this table if applicable. A dash in the Value end of period ($) column means either the issuer is no longer held at period end, or the issuer is held at period end but is no longer an affiliate.
| Affiliate (Amounts in thousands) | Value, beginning of period ($) | Purchases ($) | Sales Proceeds ($) | Dividend Income ($) | Realized Gain (loss) ($) | Change in Unrealized appreciation (depreciation) ($) | Value, end of period ($) |
| Abercrombie & Fitch Co. Class A | 45,361 | 69,020 | 101,463 | - | 59,468 | 197,896 | - |
| American Eagle Outfitters, Inc. | 166,179 | 2,398 | 63,995 | 4,872 | (8,783) | 100,796 | - |
| RH | 296,343 | 82,753 | 13,386 | - | (1,491) | (67,881) | 296,338 |
| The Real Good Food Co. LLC Class B | - | - | - | - | - | - | - |
| The Real Good Food Co. LLC Class B unit | 5,301 | - | - | - | - | (4,657) | 644 |
| Warby Parker, Inc. | 83,231 | 2,394 | 6,137 | - | (12,365) | 21,651 | 88,774 |
| Total | 596,415 | 156,565 | 184,981 | 4,872 | 36,829 | 247,805 | 385,756 |
Amounts included in the purchases and sales proceeds columns may include in-kind transactions, if applicable.
Investment Valuation
The following is a summary of the inputs used, as of July 31, 2024, involving the Fund's assets and liabilities carried at fair value. The inputs or methodology used for valuing securities may not be an indication of the risk associated with investing in those securities. For more information on valuation inputs, and their aggregation into the levels used below, please refer to the Investment Valuation section in the accompanying Notes to Consolidated Financial Statements.
| Valuation Inputs at Reporting Date: |
Description (Amounts in thousands) | Total ($) | Level 1 ($) | Level 2 ($) | Level 3 ($) |
Investments in Securities: | | | | |
|
| Equities: | | | | |
Communication Services | 10,194,845 | 10,123,820 | - | 71,025 |
Consumer Discretionary | 12,712,407 | 12,348,219 | 135,263 | 228,925 |
Consumer Staples | 775,554 | 765,305 | - | 10,249 |
Energy | 919,412 | 919,412 | - | - |
Financials | 2,384,481 | 2,248,891 | 57,110 | 78,480 |
Health Care | 5,053,927 | 4,968,115 | 35,908 | 49,904 |
Industrials | 2,946,851 | 2,282,474 | 8,114 | 656,263 |
Information Technology | 29,521,196 | 29,063,282 | - | 457,914 |
Materials | 499,649 | 437,097 | - | 62,552 |
Real Estate | 175,989 | 175,989 | - | - |
Utilities | 15,672 | - | - | 15,672 |
|
| Corporate Bonds | 26,330 | - | - | 26,330 |
|
| Preferred Securities | 4,970 | - | - | 4,970 |
|
| Money Market Funds | 235,741 | 235,741 | - | - |
|
| Purchased Options | 504 | 504 | - | - |
| Total Investments in Securities: | 65,467,528 | 63,568,849 | 236,395 | 1,662,284 |
| | | | | |
|
| Net Unrealized Appreciation on Unfunded Commitments | 72 | - | - | 72 |
| Total | 72 | - | - | 72 |
Derivative Instruments: Liabilities | | | | |
Written Options | (7,605) | (7,605) | - | - |
| Total Liabilities | (7,605) | (7,605) | - | - |
| Total Derivative Instruments: | (7,605) | (7,605) | - | - |
The following is a reconciliation of consolidated Investments in Securities for which Level 3 inputs were used in determining value:
| (Amounts in thousands) | |
| Investments in Securities: | |
| Industrials | | | |
| Beginning Balance | $ | 477,140 | |
| Net Realized Gain (Loss) on Investment Securities | | - | |
| Net Unrealized Gain (Loss) on Investment Securities | | 160,966 | |
| Cost of Purchases | | 18,157 | |
| Proceeds of Sales | | - | |
| Amortization/Accretion | | - | |
| Transfers into Level 3 | | - | |
| Transfers out of Level 3 | | - | |
| Ending Balance | $ | 656,263 | |
| The change in unrealized gain (loss) for the period attributable to Level 3 securities held at July 31, 2024 | $ | 160,966 | |
| Other Investments in Securities | | | |
| Beginning Balance | $ | 1,022,619 | |
| Net Realized Gain (Loss) on Investment Securities | | 1,851 | |
| Net Unrealized Gain (Loss) on Investment Securities | | (29,012) | |
| Cost of Purchases | | 206,109 | |
| Proceeds of Sales | | (87,652) | |
| Amortization/Accretion | | - | |
| Transfers into Level 3 | | - | |
| Transfers out of Level 3 | | (107,894) | |
| Ending Balance | $ | 1,006,021 | |
| The change in unrealized gain (loss) for the period attributable to Level 3 securities held at July 31, 2024 | $ | (42,410) | |
| The information used in the above reconciliation represents fiscal year to date activity for any Investments in Securities identified as using Level 3 inputs at either the beginning or the end of the current fiscal period. Cost of purchases and proceeds of sales may include securities received and/or delivered through in-kind transactions, corporate actions or exchanges. Transfers into Level 3 were attributable to a lack of observable market data resulting from decreases in market activity, decreases in liquidity, security restructurings or corporate actions. Transfers out of Level 3 were attributable to observable market data becoming available for those securities. Transfers in or out of Level 3 represent the beginning value of any Security or Instrument where a change in the pricing level occurred from the beginning to the end of the period. Realized and unrealized gains (losses) disclosed in the reconciliation are included in Net Gain (Loss) on the Fund's consolidated Statement of Operations. | |
Value of Derivative Instruments
The following table is a summary of the Fund's value of derivative instruments by primary risk exposure as of July 31, 2024. For additional information on derivative instruments, please refer to the Derivative Instruments section in the accompanying Notes to Consolidated Financial Statements.
Primary Risk Exposure / Derivative Type | Value |
| (Amounts in thousands) | Asset ($) | Liability ($) |
| Equity Risk | | |
Purchased Options (a) | 504 | 0 |
Written Options (b) | 0 | (7,605) |
| Total Equity Risk | 504 | (7,605) |
| Total Value of Derivatives | 504 | (7,605) |
(a)Gross value is presented in the Consolidated Statement of Assets and Liabilities in the Investments in Securities at value line-item.
(b)Gross value is presented in the Consolidated Statement of Assets and Liabilities in the written options, at value line-item.
Consolidated Financial Statements
| Consolidated Statement of Assets and Liabilities |
As of July 31, 2024 Amounts in thousands (except per-share amounts) |
| Assets | | | | |
| Investment in securities, at value (including securities loaned of $197,694) - See accompanying schedule: | | | | |
Unaffiliated issuers (cost $27,861,895) | $ | 64,846,031 | | |
Fidelity Central Funds (cost $235,741) | | 235,741 | | |
Other affiliated issuers (cost $329,195) | | 385,756 | | |
| | | | | |
| | | | | |
| Total Investment in Securities (cost $28,426,831) | | | $ | 65,467,528 |
| Restricted cash | | | | 1,527 |
| Foreign currency held at value (cost $40) | | | | 40 |
| Receivable for investments sold | | | | 78,977 |
| Unrealized appreciation on unfunded commitments | | | | 72 |
| Receivable for fund shares sold | | | | 69,442 |
| Dividends receivable | | | | 10,392 |
| Interest receivable | | | | 885 |
| Distributions receivable from Fidelity Central Funds | | | | 161 |
| Prepaid expenses | | | | 15 |
| Other receivables | | | | 1,032 |
Total assets | | | | 65,630,071 |
| Liabilities | | | | |
| Payable for investments purchased | $ | 86,702 | | |
| Payable for fund shares redeemed | | 32,016 | | |
| Accrued management fee | | 28,592 | | |
| Written options, at value (premium received $4,976) | | 7,605 | | |
| Deferred taxes | | 31,913 | | |
| Other payables and accrued expenses | | 1,867 | | |
| Collateral on securities loaned | | 200,783 | | |
| Total liabilities | | | | 389,478 |
| Commitments and contingent liabilities (see Commitments note) | | | | |
| Net Assets | | | $ | 65,240,593 |
| Net Assets consist of: | | | | |
| Paid in capital | | | $ | 24,987,255 |
| Total accumulated earnings (loss) | | | | 40,253,338 |
| Net Assets | | | $ | 65,240,593 |
| | | | | |
| Net Asset Value and Maximum Offering Price | | | | |
| Blue Chip Growth : | | | | |
Net Asset Value, offering price and redemption price per share ($59,681,817 ÷ 280,062 shares) | | | $ | 213.10 |
| Class K : | | | | |
Net Asset Value, offering price and redemption price per share ($5,558,776 ÷ 25,931 shares) | | | $ | 214.37 |
| Consolidated Statement of Operations |
| Year ended July 31, 2024 Amounts in thousands |
| Investment Income | | | | |
| Dividends (including $4,872 earned from affiliated issuers) | | | $ | 250,423 |
| Interest | | | | 1,294 |
| Income from Fidelity Central Funds (including $981 from security lending) | | | | 4,637 |
| Total income | | | | 256,354 |
| Expenses | | | | |
| Management fee | | | | |
| Basic fee | $ | 309,879 | | |
| Performance adjustment | | (77,204) | | |
| Transfer agent fees | | 36,151 | | |
| Accounting fees | | 1,337 | | |
| Custodian fees and expenses | | 568 | | |
| Independent trustees' fees and expenses | | 255 | | |
| Registration fees | | 548 | | |
| Audit fees | | 185 | | |
| Legal | | 94 | | |
| Interest | | 226 | | |
| Miscellaneous | | 549 | | |
| Total expenses before reductions | | 272,588 | | |
| Expense reductions | | (3,274) | | |
| Total expenses after reductions | | | | 269,314 |
| Net Investment income (loss) | | | | (12,960) |
| Realized and Unrealized Gain (Loss) | | | | |
| Net realized gain (loss) on: | | | | |
| Investment Securities: | | | | |
| Unaffiliated issuers (net of foreign taxes of $5,255) | | 3,724,333 | | |
| Redemptions in-kind | | 939,644 | | |
| Fidelity Central Funds | | (3) | | |
| Other affiliated issuers | | 36,829 | | |
| Foreign currency transactions | | 1,370 | | |
| Written options | | 2,306 | | |
| Total net realized gain (loss) | | | | 4,704,479 |
| Change in net unrealized appreciation (depreciation) on: | | | | |
| Investment Securities: | | | | |
| Unaffiliated issuers (net of increase in deferred foreign taxes of $12,676) | | 10,159,229 | | |
| Affiliated issuers | | 247,805 | | |
| Unfunded commitments | | 72 | | |
| Assets and liabilities in foreign currencies | | (4) | | |
| Written options | | (2,629) | | |
| Total change in net unrealized appreciation (depreciation) | | | | 10,404,473 |
| Net gain (loss) | | | | 15,108,952 |
| Net increase (decrease) in net assets resulting from operations | | | $ | 15,095,992 |
| Consolidated Statement of Changes in Net Assets |
| |
| Amount in thousands | | Year ended July 31, 2024 | | Year ended July 31, 2023 |
| Increase (Decrease) in Net Assets | | | | |
| Operations | | | | |
| Net investment income (loss) | $ | (12,960) | $ | (37,165) |
| Net realized gain (loss) | | 4,704,479 | | 817,436 |
| Change in net unrealized appreciation (depreciation) | | 10,404,473 | | 8,879,299 |
| Net increase (decrease) in net assets resulting from operations | | 15,095,992 | | 9,659,570 |
| Distributions to shareholders | | (486,357) | | (195,822) |
| | | | | |
| Share transactions - net increase (decrease) | | 886,066 | | (825,802) |
| Total increase (decrease) in net assets | | 15,495,701 | | 8,637,946 |
| | | | | |
| Net Assets | | | | |
| Beginning of period | | 49,744,892 | | 41,106,946 |
| End of period | $ | 65,240,593 | $ | 49,744,892 |
| | | | | |
| | | | | |
Consolidated Financial Highlights
Fidelity® Blue Chip Growth Fund |
| |
| Years ended July 31, | | 2024 | | 2023 | | 2022 | | 2021 | | 2020 |
Selected Per-Share Data | | | | | | | | | | |
| Net asset value, beginning of period | $ | 164.62 | $ | 132.94 | $ | 187.79 | $ | 138.12 | $ | 103.05 |
| Income from Investment Operations | | | | | | | | | | |
Net investment income (loss) A,B | | (.06) | | (.13) | | (.50) | | (.73) | | (.17) |
| Net realized and unrealized gain (loss) | | 50.16 | | 32.45 | | (38.32) | | 60.84 | | 39.23 |
| Total from investment operations | | 50.10 | | 32.32 | | (38.82) | | 60.11 | | 39.06 |
| Distributions from net realized gain | | (1.62) | | (.64) | | (16.03) | | (10.44) | | (3.99) |
| Total distributions | | (1.62) | | (.64) | | (16.03) | | (10.44) | | (3.99) |
| Net asset value, end of period | $ | 213.10 | $ | 164.62 | $ | 132.94 | $ | 187.79 | $ | 138.12 |
Total Return C | | | | 24.43% | | (22.85)% | | 45.70% | | 39.45% |
Ratios to Average Net Assets B,D,E | | | | | | | | | | |
| Expenses before reductions | | .50% | | .69% | | .76% | | .79% | | .79% |
| Expenses net of fee waivers, if any | | | | .68% | | .76% | | .79% | | .79% |
| Expenses net of all reductions | | .49% | | .68% | | .76% | | .78% | | .78% |
| Net investment income (loss) | | (.03)% | | (.10)% | | (.31)% | | (.44)% | | (.16)% |
| Supplemental Data | | | | | | | | | | |
| Net assets, end of period (in millions) | $ | 59,682 | $ | 45,272 | $ | 36,726 | $ | 48,318 | $ | 31,023 |
Portfolio turnover rate F,G | | | | 19% | | 34% | | 41% | | 49% |
ACalculated based on average shares outstanding during the period.
BNet investment income (loss) is affected by the timing of the declaration of dividends by any underlying mutual funds or exchange-traded funds (ETFs). Net investment income (loss) of any mutual funds or ETFs is not included in the Fund's net investment income (loss) ratio.
CTotal returns would have been lower if certain expenses had not been reduced during the applicable periods shown.
DFees and expenses of any underlying mutual funds or exchange-traded funds (ETFs) are not included in the Fund's expense ratio. The Fund indirectly bears its proportionate share of these expenses. For additional expense information related to investments in Fidelity Central Funds, please refer to the "Investments in Fidelity Central Funds" note found in the Notes to Consolidated Financial Statements section of the most recent Annual or Semi-Annual report.
EExpense ratios reflect operating expenses of the class. Expenses before reductions do not reflect amounts reimbursed, waived, or reduced through arrangements with the investment adviser, brokerage services, or other offset arrangements, if applicable, and do not represent the amount paid by the class during periods when reimbursements, waivers or reductions occur.
FAmount does not include the portfolio activity of any underlying mutual funds or exchange-traded funds (ETFs).
GPortfolio turnover rate excludes securities received or delivered in-kind.
Fidelity® Blue Chip Growth Fund Class K |
| |
| Years ended July 31, | | 2024 | | 2023 | | 2022 | | 2021 | | 2020 |
Selected Per-Share Data | | | | | | | | | | |
| Net asset value, beginning of period | $ | 165.45 | $ | 133.48 | $ | 188.45 | $ | 138.50 | $ | 103.24 |
| Income from Investment Operations | | | | | | | | | | |
Net investment income (loss) A,B | | .10 | | (.01) | | (.37) | | (.60) | | (.08) |
| Net realized and unrealized gain (loss) | | 50.44 | | 32.62 | | (38.45) | | 61.04 | | 39.33 |
| Total from investment operations | | 50.54 | | 32.61 | | (38.82) | | 60.44 | | 39.25 |
| Distributions from net realized gain | | (1.62) | | (.64) | | (16.15) | | (10.49) | | (3.99) |
| Total distributions | | (1.62) | | (.64) | | (16.15) | | (10.49) | | (3.99) |
| Net asset value, end of period | $ | 214.37 | $ | 165.45 | $ | 133.48 | $ | 188.45 | $ | 138.50 |
Total Return C | | | | 24.55% | | (22.78)% | | 45.83% | | 39.57% |
Ratios to Average Net Assets B,D,E | | | | | | | | | | |
| Expenses before reductions | | .42% | | .59% | | .68% | | .71% | | .70% |
| Expenses net of fee waivers, if any | | | | .59% | | .68% | | .71% | | .69% |
| Expenses net of all reductions | | .41% | | .59% | | .68% | | .70% | | .69% |
| Net investment income (loss) | | .05% | | (.01)% | | (.23)% | | (.36)% | | (.07)% |
| Supplemental Data | | | | | | | | | | |
| Net assets, end of period (in millions) | $ | 5,559 | $ | 4,473 | $ | 4,380 | $ | 8,635 | $ | 6,625 |
Portfolio turnover rate F,G | | | | 19% | | 34% | | 41% | | 49% |
ACalculated based on average shares outstanding during the period.
BNet investment income (loss) is affected by the timing of the declaration of dividends by any underlying mutual funds or exchange-traded funds (ETFs). Net investment income (loss) of any mutual funds or ETFs is not included in the Fund's net investment income (loss) ratio.
CTotal returns would have been lower if certain expenses had not been reduced during the applicable periods shown.
DFees and expenses of any underlying mutual funds or exchange-traded funds (ETFs) are not included in the Fund's expense ratio. The Fund indirectly bears its proportionate share of these expenses. For additional expense information related to investments in Fidelity Central Funds, please refer to the "Investments in Fidelity Central Funds" note found in the Notes to Consolidated Financial Statements section of the most recent Annual or Semi-Annual report.
EExpense ratios reflect operating expenses of the class. Expenses before reductions do not reflect amounts reimbursed, waived, or reduced through arrangements with the investment adviser, brokerage services, or other offset arrangements, if applicable, and do not represent the amount paid by the class during periods when reimbursements, waivers or reductions occur.
FAmount does not include the portfolio activity of any underlying mutual funds or exchange-traded funds (ETFs).
GPortfolio turnover rate excludes securities received or delivered in-kind.
Notes to Consolidated Financial Statements
For the period ended July 31, 2024
(Amounts in thousands except percentages)
1. Organization.
Fidelity Blue Chip Growth Fund (the Fund) is a non-diversified fund of Fidelity Securities Fund (the Trust) and is authorized to issue an unlimited number of shares. The Trust is registered under the Investment Company Act of 1940, as amended (the 1940 Act), as an open-end management investment company organized as a Massachusetts business trust. The Fund offers Blue Chip Growth and Class K shares, each of which has equal rights as to assets and voting privileges. Each class has exclusive voting rights with respect to matters that affect that class.
2. Investments in Fidelity Central Funds.
Funds may invest in Fidelity Central Funds, which are open-end investment companies generally available only to other investment companies and accounts managed by the investment adviser and its affiliates. The Consolidated Schedule of Investments lists any Fidelity Central Funds held as an investment as of period end, but does not include the underlying holdings of each Fidelity Central Fund. An investing fund indirectly bears its proportionate share of the expenses of the underlying Fidelity Central Funds.
Based on its investment objective, each Fidelity Central Fund may invest or participate in various investment vehicles or strategies that are similar to those of the investing fund. These strategies are consistent with the investment objectives of the investing fund and may involve certain economic risks which may cause a decline in value of each of the Fidelity Central Funds and thus a decline in the value of the investing fund.
| Fidelity Central Fund | Investment Manager | Investment Objective | Investment Practices | Expense RatioA |
| Fidelity Money Market Central Funds | Fidelity Management & Research Company LLC (FMR) | Each fund seeks to obtain a high level of current income consistent with the preservation of capital and liquidity. | Short-term Investments | Less than .005% |
A Expenses expressed as a percentage of average net assets and are as of each underlying Central Fund's most recent annual or semi-annual shareholder report.
A complete unaudited list of holdings for each Fidelity Central Fund is available upon request or at the Securities and Exchange Commission website at www.sec.gov. In addition, the financial statements of the Fidelity Central Funds which contain the significant accounting policies (including investment valuation policies) of those funds, and are not covered by the Report of Independent Registered Public Accounting Firm, are available on the Securities and Exchange Commission website or upon request.
3. Significant Accounting Policies.
The Fund is an investment company and applies the accounting and reporting guidance of the Financial Accounting Standards Board (FASB) Accounting Standards Codification Topic 946 Financial Services - Investment Companies. The consolidated financial statements have been prepared in conformity with accounting principles generally accepted in the United States of America (GAAP), which require management to make certain estimates and assumptions at the date of the consolidated financial statements. Actual results could differ from those estimates. Subsequent events, if any, through the date that the consolidated financial statements were issued have been evaluated in the preparation of the consolidated financial statements. The Fund's Consolidated Schedule of Investments lists any underlying mutual funds or exchange-traded funds (ETFs) but does not include the underlying holdings of these funds. The following summarizes the significant accounting policies of the Fund:
Investment Valuation. Investments are valued as of 4:00 p.m. Eastern time on the last calendar day of the period. The Board of Trustees (the Board) has designated the Fund's investment adviser as the valuation designee responsible for the fair valuation function and performing fair value determinations as needed. The investment adviser has established a Fair Value Committee (the Committee) to carry out the day-to-day fair valuation responsibilities and has adopted policies and procedures to govern the fair valuation process and the activities of the Committee. In accordance with these fair valuation policies and procedures, which have been approved by the Board, the Fund attempts to obtain prices from one or more third party pricing services or brokers to value its investments. When current market prices, quotations or currency exchange rates are not readily available or reliable, investments will be fair valued in good faith by the Committee, in accordance with the policies and procedures. Factors used in determining fair value vary by investment type and may include market or investment specific events, transaction data, estimated cash flows, and market observations of comparable investments. The frequency that the fair valuation procedures are used cannot be predicted and they may be utilized to a significant extent. The Committee manages the Fund's fair valuation practices and maintains the fair valuation policies and procedures. The Fund's investment adviser reports to the Board information regarding the fair valuation process and related material matters.
The Fund categorizes the inputs to valuation techniques used to value its investments into a disclosure hierarchy consisting of three levels as shown below:
Level 1 - unadjusted quoted prices in active markets for identical investments
Level 2 - other significant observable inputs (including quoted prices for similar investments, interest rates, prepayment speeds, etc.)
Level 3 - unobservable inputs (including the Fund's own assumptions based on the best information available)
Valuation techniques used to value the Fund's investments by major category are as follows:
Equity securities, including restricted securities, for which market quotations are readily available, are valued at the last reported sale price or official closing price as reported by a third party pricing service on the primary market or exchange on which they are traded and are categorized as Level 1 in the hierarchy. In the event there were no sales during the day or closing prices are not available, securities are valued at the last quoted bid price or may be valued using the last available price and are generally categorized as Level 2 in the hierarchy. For foreign equity securities, when market or security specific events arise, comparisons to the valuation of American Depositary Receipts (ADRs), futures contracts, Exchange-Traded Funds (ETFs) and certain indexes as well as quoted prices for similar securities may be used and would be categorized as Level 2 in the hierarchy. For equity securities, including restricted securities, where observable inputs are limited, assumptions about market activity and risk are used and these securities may be categorized as Level 3 in the hierarchy. Securities, including private placements or other restricted securities, for which observable inputs are not available are valued using alternate valuation approaches, including the market approach, the income approach and cost approach, and are categorized as Level 3 in the hierarchy. The market approach considers factors including the price of recent investments in the same or a similar security or financial metrics of comparable securities. The income approach considers factors including expected future cash flows, security specific risks and corresponding discount rates. The cost approach considers factors including the value of the security's underlying assets and liabilities.
Debt securities, including restricted securities, are valued based on evaluated prices received from third party pricing services or from brokers who make markets in such securities. Corporate bonds and preferred securities are valued by pricing services who utilize matrix pricing which considers yield or price of bonds of comparable quality, coupon, maturity and type or by broker-supplied prices. When independent prices are unavailable or unreliable, debt securities may be valued utilizing pricing methodologies which consider similar factors that would be used by third party pricing services. Debt securities are generally categorized as Level 2 in the hierarchy but may be Level 3 depending on the circumstances.
Exchange-traded options are valued using the last sale price or, in the absence of a sale, the last offering price and are categorized as Level 1 in the hierarchy. Investments in open-end mutual funds, including the Fidelity Central Funds, are valued at their closing net asset value (NAV) each business day and are categorized as Level 1 in the hierarchy.
The following provides information on Level 3 securities held by the Fund that were valued at period end based on unobservable inputs. These amounts exclude valuations provided by a broker.
| Asset Type | Fair Value | Valuation Technique(s) | Unobservable Input | Amount or Range/Weighted Average | Impact to Valuation from an Increase in InputA |
| | | | | | |
| Equities | $1,630,984 | Recovery value | Recovery value | $0.00 | Increase |
| | | Market approach | Transaction price | $1.10 - $215.03 / $41.58 | Increase |
| | | | Discount rate | 10.0% - 55.0% / 24.0% | Decrease |
| | | | Premium rate | 10.0% - 30.0% / 20.3% | Increase |
| | | Market comparable | Enterprise value/Revenue multiple (EV/R) | 0.8 - 61.0 / 9.4 | Increase |
| | | | Enterprise value/EBITDA multiple (EV/EBITDA) | 6.5 - 21.3 / 21.0 | Increase |
| | | Discounted cash flow | Weighted average cost of capital (WACC) | 30.6% | Decrease |
| | | | Yield | 33.0% | Decrease |
| | | | Exit multiple | 1.5 | Increase |
| | | Book value | Book value multiple | 1.6 | Increase |
| | | Black scholes | Discount rate | 4.1% - 5.0% / 4.2% | Increase |
| | | | Volatility | 40.0% - 100.0% / 70.2% | Increase |
| | | | Term | 0.7 - 5.0 / 3.4 | Increase |
| Corporate Bonds | $26,330 | Market comparable | Enterprise value/Revenue multiple (EV/R) | 2.0 | Increase |
| | | | Discount rate | 29.2% | Decrease |
| | | | Probability rate | 10.0% - 75.0% / 33.3% | Increase |
| | | Black scholes | Discount rate | 4.6% | Increase |
| | | | Volatility | 75.0% | Increase |
| | | | Term | 1.4 | Increase |
| | | Recovery value | Recovery value | $0.00 | Increase |
| Preferred Securities | $4,970 | Market approach | Transaction price | $100.00 | Increase |
| | | | Discount rate | 35.4% - 37.9% / 37.4% | Decrease |
| | | | Probability rate | 0.0% - 60.0% / 36.4% | Increase |
| | | Market comparable | Enterprise value/Revenue multiple (EV/R) | 1.6 | Increase |
| | | Black scholes | Discount rate | 4.4% - 5.4% / 4.8% | Increase |
| | | | Volatility | 50.0% - 100.0% / 60.1% | Increase |
| | | | Term | 0.3 - 2.1 / 1.2 | Increase |
| | | | | | |
| | | | | | |
A Represents the directional change in the fair value of the Level 3 investments that could have resulted from an increase in the corresponding input as of period end. A decrease to the unobservable input would have had the opposite effect. Significant changes in these inputs may have resulted in a significantly higher or lower fair value measurement at period end.
Changes in valuation techniques may result in transfers in or out of an assigned level within the disclosure hierarchy. The aggregate value of investments by input level as of July 31, 2024, as well as a roll forward of Level 3 investments, is included at the end of the Fund's Consolidated Schedule of Investments.
Foreign Currency. Certain Funds may use foreign currency contracts to facilitate transactions in foreign-denominated securities. Gains and losses from these transactions may arise from changes in the value of the foreign currency or if the counterparties do not perform under the contracts' terms.
Foreign-denominated assets, including investment securities, and liabilities are translated into U.S. dollars at the exchange rates at period end. Purchases and sales of investment securities, income and dividends received, and expenses denominated in foreign currencies are translated into U.S. dollars at the exchange rate in effect on the transaction date.
The effects of exchange rate fluctuations on investments are included with the net realized and unrealized gain (loss) on investment securities. Other foreign currency transactions resulting in realized and unrealized gain (loss) are disclosed separately.
Investment Transactions and Income. For financial reporting purposes, the Fund's investment holdings and NAV include trades executed through the end of the last business day of the period. The NAV per share for processing shareholder transactions is calculated as of the close of business of the New York Stock Exchange (NYSE), normally 4:00 p.m. Eastern time and includes trades executed through the end of the prior business day. Gains and losses on securities sold are determined on the basis of identified cost and include proceeds received from litigation. Commissions paid to certain brokers with whom the investment adviser, or its affiliates, places trades on behalf of a fund include an amount in addition to trade execution, which may be rebated back to a fund. Any such rebates are included in net realized gain (loss) on investments in the Consolidated Statement of Operations. Dividend income is recorded on the ex-dividend date, except for certain dividends from foreign securities where the ex-dividend date may have passed, which are recorded as soon as the Fund is informed of the ex-dividend date. Non-cash dividends included in dividend income, if any, are recorded at the fair market value of the securities received. Income and capital gain distributions from Fidelity Central Funds, if any, are recorded on the ex-dividend date. Certain distributions received by the Fund represent a return of capital or capital gain. The Fund determines the components of these distributions subsequent to the ex-dividend date, based upon receipt of tax filings or other correspondence relating to the underlying investment. These distributions are recorded as a reduction of cost of investments and/or as a realized gain. Interest income is accrued as earned and includes coupon interest and amortization of premium and accretion of discount on debt securities as applicable. Investment income is recorded net of foreign taxes withheld where recovery of such taxes is uncertain. Funds may file withholding tax reclaims in certain jurisdictions to recover a portion of amounts previously withheld. Any withholding tax reclaims income is included in the Consolidated Statement of Operations in dividends. Any receivables for withholding tax reclaims are included in the Consolidated Statement of Assets and Liabilities in dividends receivable. The Fund has filed tax reclaims for previously withheld taxes on dividends earned in certain European Union (EU) countries. These additional filings are subject to various administrative proceedings by the local jurisdictions' tax authorities within the EU, as well as a number of related judicial proceedings. Income recognized for EU reclaims is included with other reclaims in the Consolidated Statement of Operations in dividends. These reclaims are recorded when the amount is known and there are no significant uncertainties on collectability.
Class Allocations and Expenses. Investment income, realized and unrealized capital gains and losses, common expenses of a fund, and certain fund-level expense reductions, if any, are allocated daily on a pro-rata basis to each class based on the relative net assets of each class to the total net assets of a fund. Each class differs with respect to transfer agent and distribution and service plan fees incurred, as applicable. Certain expense reductions may also differ by class, if applicable. For the reporting period, the allocated portion of income and expenses to each class as a percent of its average net assets may vary due to the timing of recording these transactions in relation to fluctuating net assets of the classes. Expenses directly attributable to a fund are charged to that fund. Expenses attributable to more than one fund are allocated among the respective funds on the basis of relative net assets or other appropriate methods. Expenses included in the accompanying consolidated financial statements reflect the expenses of that fund and do not include any expenses associated with any underlying mutual funds or exchange-traded funds (ETFs). Although not included in a fund's expenses, a fund indirectly bears its proportionate share of these expenses through the net asset value of each underlying mutual fund or exchange-traded fund (ETF). Expense estimates are accrued in the period to which they relate and adjustments are made when actual amounts are known.
Deferred Trustee Compensation. Under a Deferred Compensation Plan (the Plan) for certain Funds, certain independent Trustees have elected to defer receipt of a portion of their annual compensation. Deferred amounts are invested in affiliated mutual funds, are marked-to-market and remain in a fund until distributed in accordance with the Plan. The investment of deferred amounts and the offsetting payable to the Trustees presented below are included in the accompanying Consolidated Statement of Assets and Liabilities in other receivables and other payables and accrued expenses, as applicable.
| Fidelity Blue Chip Growth Fund | $1,002 |
Income Tax Information and Distributions to Shareholders. Each year, the Fund intends to qualify as a regulated investment company under Subchapter M of the Internal Revenue Code, including distributing substantially all of its taxable income and realized gains. As a result, no provision for U.S. Federal income taxes is required. As of July 31, 2024, the Fund did not have any unrecognized tax benefits in the consolidated financial statements; nor is the Fund aware of any tax positions for which it is reasonably possible that the total amounts of unrecognized tax benefits will significantly change in the next twelve months. The Fund files a U.S. federal tax return, in addition to state and local tax returns as required. The Fund's federal income tax returns are subject to examination by the Internal Revenue Service (IRS) for a period of three fiscal years after they are filed. State and local tax returns may be subject to examination for an additional fiscal year depending on the jurisdiction. Foreign taxes are provided for based on the Fund's understanding of the tax rules and rates that exist in the foreign markets in which it invests. The Fund is subject to a tax imposed on capital gains by certain countries in which it invests. An estimated deferred tax liability for net unrealized appreciation on the applicable securities is included in Deferred taxes on the Consolidated Statement of Assets & Liabilities.
Distributions are declared and recorded on the ex-dividend date. Income and capital gain distributions are declared separately for each class. Income and capital gain distributions are determined in accordance with income tax regulations, which may differ from GAAP. In addition, the Fund claimed a portion of the payment made to redeeming shareholders as a distribution for income tax purposes.
Capital accounts within the consolidated financial statements are adjusted for permanent book-tax differences. These adjustments have no impact on net assets or the results of operations. Capital accounts are not adjusted for temporary book-tax differences which will reverse in a subsequent period.
Book-tax differences are primarily due to foreign currency transactions, certain foreign taxes, passive foreign investment companies (PFIC), redemptions in-kind, partnerships, deferred Trustee compensation, losses deferred due to wash sales, options and excise tax regulations.
As of period end, the cost and unrealized appreciation (depreciation) in securities, and derivatives if applicable, for federal income tax purposes were as follows:
| Gross unrealized appreciation | $38,770,421 |
| Gross unrealized depreciation | (2,013,352) |
| Net unrealized appreciation (depreciation) | $36,757,069 |
| Tax Cost | $28,702,927 |
The tax-based components of distributable earnings as of period end were as follows:
| Undistributed ordinary income | $137,063 |
| Undistributed long-term capital gain | $3,393,929 |
| Net unrealized appreciation (depreciation) on securities and other investments | $36,754,732 |
The tax character of distributions paid was as follows:
| | July 31, 2024 | July 31, 2023 |
| Long-term Capital Gains | 486,357 | 195,822 |
Restricted Securities (including Private Placements). Funds may invest in securities that are subject to legal or contractual restrictions on resale. These securities generally may be resold in transactions exempt from registration or to the public if the securities are registered. Disposal of these securities may involve time-consuming negotiations and expense, and prompt sale at an acceptable price may be difficult. Information regarding restricted securities held at period end is included at the end of the Consolidated Schedule of Investments, if applicable.
Commitments. A commitment is an agreement to acquire an investment at a future date (subject to conditions) in connection with a potential public or non-public offering. Commitments outstanding at period end are presented in the table below. Unrealized appreciation (depreciation) on any commitments outstanding at period end is separately presented in the Consolidated Statement of Assets and Liabilities as Unrealized appreciation (depreciation) on unfunded commitments, and any change in unrealized appreciation (depreciation) on unfunded commitments during the period is separately presented in the Consolidated Statement of Operations, as applicable based on contractual conditions of each commitment.
| | Investment to be Acquired | Commitment Amount ($) | Unrealized Appreciation (Depreciation)($) |
| Fidelity Blue Chip Growth Fund | Space Exploration Technologies Corp. Class A | 636 | - |
| Fidelity Blue Chip Growth Fund | Space Exploration Technologies Corp. Class C | 5,143 | - |
| Fidelity Blue Chip Growth Fund | JUUL Labs, Inc. Class A | 29,626 | 72 |
Consolidated Subsidiary. The Funds included in the table below hold certain investments through a wholly-owned subsidiary ("Subsidiary"), which may be subject to federal and state taxes upon disposition.
As of period end, investments in Subsidiaries were as follows:
| | Amount ($) | % of Net Assets |
| Fidelity Blue Chip Growth Fund | 41,772 | .06 |
The financial statements have been consolidated to include the Subsidiary accounts where applicable. Accordingly, all inter-company transactions and balances have been eliminated.
At period end, any estimated tax liability for these investments is presented as "Deferred taxes" in the Consolidated Statement of Assets and Liabilities and included in "Change in net unrealized appreciation (depreciation) on investment securities" in the Consolidated Statement of Operations. The tax liability incurred may differ materially depending on conditions when these investments are disposed. Any cash held by a Subsidiary is restricted as to its use and is presented as "Restricted cash" in the Consolidated Statement of Assets and Liabilities, if applicable.
4. Derivative Instruments.
Risk Exposures and the Use of Derivative Instruments. The Fund's investment objectives allow for various types of derivative instruments, including options. Derivatives are investments whose value is primarily derived from underlying assets, indices or reference rates and may be transacted on an exchange or over-the-counter (OTC). Derivatives may involve a future commitment to buy or sell a specified asset based on specified terms, to exchange future cash flows at periodic intervals based on a notional principal amount, or for one party to make one or more payments upon the occurrence of specified events in exchange for periodic payments from the other party.
Derivatives were used to increase returns and to manage exposure to certain risks as defined below. The success of any strategy involving derivatives depends on analysis of numerous economic factors, and if the strategies for investment do not work as intended, the objectives may not be achieved.
Derivatives were used to increase or decrease exposure to the following risk(s):
| Equity Risk | Equity risk relates to the fluctuations in the value of financial instruments as a result of changes in market prices (other than those arising from interest rate risk or foreign exchange risk), whether caused by factors specific to an individual investment, its issuer, or all factors affecting all instruments traded in a market or market segment. |
Funds are also exposed to additional risks from investing in derivatives, such as liquidity risk and counterparty credit risk. Liquidity risk is the risk that a fund will be unable to close out the derivative in the open market in a timely manner. Counterparty credit risk is the risk that the counterparty will not be able to fulfill its obligation to a fund. Counterparty credit risk related to exchange-traded contracts may be mitigated by the protection provided by the exchange on which they trade.
Investing in derivatives may involve greater risks than investing in the underlying assets directly and, to varying degrees, may involve risk of loss in excess of any initial investment and collateral received and amounts recognized in the Consolidated Statement of Assets and Liabilities. In addition, there may be the risk that the change in value of the derivative contract does not correspond to the change in value of the underlying instrument.
Net Realized Gain (Loss) and Change in Net Unrealized Appreciation (Depreciation) on Derivatives. The table below, which reflects the impacts of derivatives on the financial performance, summarizes the net realized gain (loss) and change in net unrealized appreciation (depreciation) for derivatives during the period as presented in the Consolidated Statement of Operations.
| Primary Risk Exposure / Derivative Type | Net Realized Gain (Loss)($) | Change in Net Unrealized Appreciation (Depreciation)($) |
| Fidelity Blue Chip Growth Fund | | |
| Equity Risk | | |
| Purchased Options | (2,283) | (3,260) |
| Written Options | 2,306 | (2,629) |
| Total Equity Risk | 23 | (5,889) |
| Totals | 23 | (5,889) |
If there are any open positions at period end, a summary of the value of derivatives by primary risk exposure is included at the end of the Consolidated Schedule of Investments.
Options. Options give the purchaser the right, but not the obligation, to buy (call) or sell (put) an underlying security or financial instrument at an agreed exercise or strike price between or on certain dates. Options obligate the seller (writer) to buy (put) or sell (call) an underlying instrument at the exercise or strike price or cash settle an underlying derivative instrument if the holder exercises the option on or before the expiration date. Exchange-traded and/or OTC options were used to manage exposure to the market.
Upon entering into an options contract, a fund will pay or receive a premium. Premiums paid on purchased options are reflected as cost of investments and premiums received on written options are reflected as a liability on the Consolidated Statement of Assets and Liabilities. Certain options may be purchased or written with premiums to be paid or received on a future date. Options are valued daily and any unrealized appreciation (depreciation) is reflected in total accumulated earnings (loss) in the Consolidated Statement of Assets and Liabilities. When an option is exercised, the cost or proceeds of the underlying instrument purchased or sold is adjusted by the amount of the premium. When an option is closed, a gain or loss is realized depending on whether the proceeds or amount paid for the closing sale transaction is greater or less than the premium received or paid. When an option expires, gains and losses are realized to the extent of premiums received and paid, respectively. The net realized and unrealized gains (losses) on purchased options are included in the Consolidated Statement of Operations in net realized gain (loss) and change in net unrealized appreciation (depreciation) on investment securities. The net realized gain (loss) and change in net unrealized appreciation (depreciation) on written options are presented in the Consolidated Statement of Operations.
Any open options at period end are presented in the Consolidated Schedule of Investments under the captions "Purchased Options," "Purchased Swaptions," "Written Options" and "Written Swaptions," as applicable, and are representative of volume of activity during the period unless an average notional amount is presented.
Writing puts and buying calls tend to increase exposure to the underlying instrument while buying puts and writing calls tend to decrease exposure to the underlying instrument. For purchased options, risk of loss is limited to the premium paid, and for written options, risk of loss is the change in value in excess of the premium received.
5. Purchases and Sales of Investments.
Purchases and sales of securities, other than short-term securities and in-kind transactions, as applicable, are noted in the table below.
| | Purchases ($) | Sales ($) |
| Fidelity Blue Chip Growth Fund | 13,703,989 | 12,173,776 |
Unaffiliated Redemptions In-Kind. Shares that were redeemed in-kind for investments, including accrued interest and cash, if any, are shown in the table below. The net realized gain or loss on investments delivered through in-kind redemptions is included in the "Net realized gain (loss) on: Redemptions in-kind" line in the accompanying Consolidated Statement of Operations. The amount of the in-kind redemptions is included in share transactions in the accompanying Consolidated Statement of Changes in Net Assets. There was no gain or loss for federal income tax purposes.
| | Shares | Total net realized gain or loss ($) | Total Proceeds ($) |
| Fidelity Blue Chip Growth Fund | 5,684 | 939,644 | 1,176,166 |
Prior Fiscal Year Unaffiliated Redemptions In-Kind. Shares that were redeemed in-kind for investments, including accrued interest and cash, if any, are shown in the table below; along with realized gain or loss on investments delivered through in-kind redemptions. The amount of the in-kind redemptions is included in share transactions in the accompanying Consolidated Statement of Changes in Net Assets. There was no gain or loss for federal income tax purposes.
| | Shares | Total net realized gain or loss ($) | Total Proceeds ($) |
| Fidelity Blue Chip Growth Fund | 4,731 | 290,079 | 606,525 |
6. Fees and Other Transactions with Affiliates.
Management Fee. Fidelity Management & Research Company LLC (the investment adviser) and its affiliates provide the Fund with investment management related services for which the Fund pays a monthly management fee.
Effective March 1, 2024, the Fund's management contract was amended to incorporate administrative services previously covered under separate services agreements (Transfer Agent and Accounting agreements). The amended contract incorporates a basic fee rate that may vary by class (subject to a performance adjustment). The investment adviser or an affiliate pays certain expenses of managing and operating the Fund out of each class's management fee. Each class of the Fund pays a management fee to the investment adviser. The management fee is calculated and paid to the investment adviser every month. The management fee is determined by calculating a basic fee and then applying a performance adjustment. When determining a class's basic fee, a mandate rate is calculated based on the monthly average net assets of a group of funds advised by FMR within a designated asset class. A discount rate is subtracted from the mandate rate once the Fund's monthly average net assets reach a certain level. The mandate rate and discount rate may vary by class. The annual basic fee rate for a class of shares of the Fund is the lesser of (1) the class's mandate rate reduced by the class's discount rate (if applicable) or (2) the amount set forth in the following table.
| | Maximum Management Fee Rate % |
| Blue Chip Growth | .63 |
| Class K | .54 |
One-twelfth of the basic fee rate for a class is applied to the average net assets of the class for the month, giving a dollar amount which is the basic fee for the class for that month. A different management fee rate may be applicable to each class of the Fund. The difference between classes is the result of separate arrangements for class-level services and/or waivers of certain expenses. It is not the result of any difference in advisory or custodial fees or other expenses related to the management of the Fund's assets, which do not vary by class. For the portion of the reporting period on or after March 1, 2024, the total annualized management fee rates were as follows:
| | Total Management Fee Rate % |
| Blue Chip Growth | .61 |
| Class K | .53 |
Prior to March 1, 2024, the management fee was the sum of an individual fund fee rate that was based on an annual rate of .30% of the Fund's average net assets and an annualized group fee rate that averaged .22% during the period. The group fee rate was based upon the monthly average net assets of a group of registered investment companies with which the investment adviser has management contracts. The group fee rate decreased as assets under management increased and increased as assets under management decreased. For the portion of the reporting period prior to March 1, 2024, the total annualized management fee rate was .52%.
The performance adjustment rate is calculated monthly by comparing over the performance period the Fund's performance to that of the performance adjustment index listed below.
| | Performance Adjustment Index |
| Fidelity Blue Chip Growth Fund | Russell 1000 Growth Index |
For the purposes of calculating the performance adjustment for the Fund, the Fund's investment performance is based on the performance of Blue Chip Growth. To the extent that other classes of the Fund have higher expenses, this could result in those classes bearing a larger positive performance adjustment and smaller negative performance adjustment than would be the case if each class's own performance were considered. The performance period is the most recent 36 month period. The maximum annualized performance adjustment rate is ± .20% of the Fund's average net assets over the performance period. The performance adjustment rate is divided by twelve and multiplied by the Fund's average net assets over the performance period, and the resulting dollar amount is proportionately added to or subtracted from a class's basic fee. For the entire reporting period, the total annual performance adjustment was (.14)%.
Effective March 1, 2024, the Fund's sub-advisory agreements with FMR Investment Management (UK) Limited, Fidelity Management & Research (Hong Kong) Limited, and Fidelity Management & Research (Japan) Limited were amended to provide that the investment adviser pays each sub-adviser monthly fees equal to 110% of the sub-adviser's costs for providing sub-advisory services.
Transfer Agent Fees. Fidelity Investments Institutional Operations Company LLC (FIIOC), an affiliate of the investment adviser, is the transfer, dividend disbursing and shareholder servicing agent for each class of the Fund. Effective March 1, 2024, the Fund's management contract was amended to incorporate transfer agent services and associated fees previously covered under a separate services agreement. FIIOC pays for typesetting, printing and mailing of shareholder reports, except proxy statements.
During the period December 1, 2023 through February 29, 2024, the transfer agent fees for each class were a fixed annual rate of class-level average net assets as follows:
| | | % of Class-Level Average Net Assets | |
| Blue Chip Growth | | .1305 | |
| Class K | | .0420 | |
| | | |
| | | | |
Prior to December 1, 2023, FIIOC received account fees and asset-based fees that varied according to the account size and type of account of the shareholders of the respective classes of the Fund, except for Class K. FIIOC received an asset-based fee of Class K's average net assets. For the portion of the reporting period prior to March 1, 2024, the fees were equivalent to the following annualized rates:
| | Amount ($) | % of Class-Level Average Net Assets |
| Blue Chip Growth | 35,085 | .13 |
| Class K | 1,066 | .04 |
| 36,151 | |
Accounting Fees. Fidelity Service Company, Inc. (FSC), an affiliate of the investment adviser, maintains the Fund's accounting records. Effective March 1, 2024, the Fund's management contract was amended to incorporate accounting services and associated fees previously covered under a separate services agreement.
During the period December 1, 2023 through February 29, 2024, the accounting fees were a fixed annual rate of average net assets as follows:
| | % of Average Net Assets |
| Fidelity Blue Chip Growth Fund | .0045 |
Prior to December 1, 2023, the accounting fee was based on the level of average net assets for each month. For the portion of the reporting period prior to March 1, 2024, the fees were equivalent to the following annualized rates:
| | % of Average Net Assets |
| Fidelity Blue Chip Growth Fund | - A |
A Amount represents less than .005%
Brokerage Commissions. A portion of portfolio transactions were placed with brokerage firms which are affiliates of the investment adviser. Brokerage commissions are included in net realized gain (loss) and change in net unrealized appreciation (depreciation) in the Consolidated Statement of Operations. The commissions paid to these affiliated firms were as follows:
| | Amount ($) |
| Fidelity Blue Chip Growth Fund | 217 |
Interfund Lending Program. Pursuant to an Exemptive Order issued by the Securities and Exchange Commission (the SEC), the Fund, along with other registered investment companies having management contracts with Fidelity Management & Research Company LLC (FMR), or other affiliated entities of FMR, may participate in an interfund lending program. This program provides an alternative credit facility allowing the Fund to borrow from, or lend money to, other participating affiliated funds. At period end, there were no interfund loans outstanding. Activity in this program during the period for which loans were outstanding was as follows:
| | Borrower or Lender | Average Loan Balance ($) | Weighted Average Interest Rate | Interest Expense ($) |
| Fidelity Blue Chip Growth Fund | Borrower | 18,710 | 5.57% | 226 |
Interfund Trades. Funds may purchase from or sell securities to other Fidelity Funds under procedures adopted by the Board. The procedures have been designed to ensure these interfund trades are executed in accordance with Rule 17a-7 of the 1940 Act. Any interfund trades are included within the respective purchases and sales amounts shown in the Purchases and Sales of Investments note. Interfund trades during the period are noted in the table below.
| | Purchases ($) | Sales ($) | Realized Gain (Loss)($) |
| Fidelity Blue Chip Growth Fund | 620,513 | 524,038 | 56,245 |
7. Committed Line of Credit.
Certain Funds participate with other funds managed by the investment adviser or an affiliate in a $4.25 billion credit facility (the "line of credit") to be utilized for temporary or emergency purposes to fund shareholder redemptions or for other short-term liquidity purposes. The participating funds have agreed to pay commitment fees on their pro-rata portion of the line of credit, which are reflected in Miscellaneous expenses on the Consolidated Statement of Operations, and are listed below. During the period, there were no borrowings on this line of credit.
| | Amount ($) |
| Fidelity Blue Chip Growth Fund | 90 |
8. Security Lending.
Funds lend portfolio securities from time to time in order to earn additional income. Lending agents are used, including National Financial Services (NFS), an affiliate of the investment adviser. Pursuant to a securities lending agreement, NFS will receive a fee, which is capped at 9.9% of a fund's daily lending revenue, for its services as lending agent. A fund may lend securities to certain qualified borrowers, including NFS. On the settlement date of the loan, a fund receives collateral (in the form of U.S. Treasury obligations, letters of credit and/or cash) against the loaned securities and maintains collateral in an amount not less than 100% of the market value of the loaned securities during the period of the loan. The market value of the loaned securities is determined at the close of business of a fund and any additional required collateral is delivered to a fund on the next business day. A fund or borrower may terminate the loan at any time, and if the borrower defaults on its obligation to return the securities loaned because of insolvency or other reasons, a fund may apply collateral received from the borrower against the obligation. A fund may experience delays and costs in recovering the securities loaned. Any cash collateral received is invested in the Fidelity Securities Lending Cash Central Fund. Any loaned securities are identified as such in the Consolidated Schedule of Investments, and the value of loaned securities and cash collateral at period end, as applicable, are presented in the Consolidated Statement of Assets and Liabilities. Security lending income represents the income earned on investing cash collateral, less rebates paid to borrowers and any lending agent fees associated with the loan, plus any premium payments received for lending certain types of securities. Security lending income is presented in the Consolidated Statement of Operations as a component of income from Fidelity Central Funds. Affiliated security lending activity, if any, was as follows:
| | Total Security Lending Fees Paid to NFS ($) | Security Lending Income From Securities Loaned to NFS ($) | Value of Securities Loaned to NFS at Period End ($) |
| Fidelity Blue Chip Growth Fund | 101 | 171 | - |
9. Expense Reductions.
Through arrangements with the Fund's custodian, credits realized as a result of certain uninvested cash balances were used to reduce the Fund's expenses. During the period, custodian credits reduced the Fund's expenses by $5.
In addition, during the period the investment adviser or an affiliate reimbursed and/or waived a portion of fund-level operating expenses in the amount of $3,269.
10. Distributions to Shareholders.
Distributions to shareholders of each class were as follows:
| | Year ended July 31, 2024 | Year ended July 31, 2023 |
| Fidelity Blue Chip Growth Fund | | |
| Distributions to shareholders | | |
| Blue Chip Growth | $443,550 | $175,348 |
| Class K | 42,807 | 20,474 |
| Total | $486,357 | $195,822 |
11. Share Transactions.
Share transactions for each class were as follows and may contain in-kind transactions, automatic conversions between classes or exchanges between affiliated funds:
| | Shares | Shares | Dollars | Dollars |
| | Year ended July 31, 2024 | Year ended July 31, 2023 | Year ended July 31, 2024 | Year ended July 31, 2023 |
| Fidelity Blue Chip Growth Fund | | | | |
| Blue Chip Growth | | | | |
| Shares sold | 48,330 | 43,972 | $9,118,148 | $5,714,869 |
| Reinvestment of distributions | 2,484 | 1,237 | 405,114 | 162,230 |
| Shares redeemed | (45,754) | (46,469) | (8,460,461) | (5,985,882) |
| Net increase (decrease) | 5,060 | (1,260) | $1,062,801 | $(108,783) |
| Class K | | | | |
| Shares sold | 7,166 | 5,674 | $1,367,778 | $755,595 |
| Reinvestment of distributions | 261 | 155 | 42,795 | 20,474 |
| Shares redeemed | (8,529) | (11,614) | (1,587,308) | (1,493,088) |
| Net increase (decrease) | (1,102) | (5,785) | $(176,735) | $(717,019) |
12. Other.
A fund's organizational documents provide former and current trustees and officers with a limited indemnification against liabilities arising in connection with the performance of their duties to the fund. In the normal course of business, a fund may also enter into contracts that provide general indemnifications. A fund's maximum exposure under these arrangements is unknown as this would be dependent on future claims that may be made against a fund. The risk of material loss from such claims is considered remote.
13. Risk and Uncertainties.
Many factors affect a fund's performance. Developments that disrupt global economies and financial markets, such as pandemics, epidemics, outbreaks of infectious diseases, war, terrorism, and environmental disasters, may significantly affect a fund's investment performance. The effects of these developments to a fund will be impacted by the types of securities in which a fund invests, the financial condition, industry, economic sector, and geographic location of an issuer, and a fund's level of investment in the securities of that issuer. Significant concentrations in security types, issuers, industries, sectors, and geographic locations may magnify the factors that affect a fund's performance.
Report of Independent Registered Public Accounting Firm
To the Board of Trustees of Fidelity Securities Fund and the Shareholders of Fidelity Blue Chip Growth Fund:
Opinion on the Financial Statements and Financial Highlights
We have audited the accompanying consolidated statement of assets and liabilities of Fidelity Blue Chip Growth Fund (the "Fund"), a fund of Fidelity Securities Fund, including the consolidated schedule of investments, as of July 31, 2024, the related consolidated statement of operations for the year then ended, the consolidated statement of changes in net assets for each of the two years in the period then ended, the consolidated financial highlights for each of the five years in the period then ended, and the related notes. In our opinion, the consolidated financial statements and consolidated financial highlights present fairly, in all material respects, the financial position of the Fund as of July 31, 2024, and the results of its operations for the year then ended, the changes in its net assets for each of the two years in the period then ended, and the financial highlights for each of the five years in the period then ended in conformity with accounting principles generally accepted in the United States of America.
Basis for Opinion
These financial statements and financial highlights are the responsibility of the Fund's management. Our responsibility is to express an opinion on the Fund's financial statements and financial highlights based on our audits. We are a public accounting firm registered with the Public Company Accounting Oversight Board (United States) (PCAOB) and are required to be independent with respect to the Fund in accordance with the U.S. federal securities laws and the applicable rules and regulations of the Securities and Exchange Commission and the PCAOB.
We conducted our audits in accordance with the standards of the PCAOB. Those standards require that we plan and perform the audit to obtain reasonable assurance about whether the financial statements and financial highlights are free of material misstatement, whether due to error or fraud. The Fund is not required to have, nor were we engaged to perform, an audit of its internal control over financial reporting. As part of our audits, we are required to obtain an understanding of internal control over financial reporting but not for the purpose of expressing an opinion on the effectiveness of the Fund's internal control over financial reporting. Accordingly, we express no such opinion.
Our audits included performing procedures to assess the risks of material misstatement of the financial statements and financial highlights, whether due to error or fraud, and performing procedures that respond to those risks. Such procedures included examining, on a test basis, evidence regarding the amounts and disclosures in the financial statements and financial highlights. Our audits also included evaluating the accounting principles used and significant estimates made by management, as well as evaluating the overall presentation of the financial statements and financial highlights. Our procedures included confirmation of securities owned as of July 31, 2024, by correspondence with the custodian and brokers; when replies were not received from brokers, we performed other auditing procedures. We believe that our audits provide a reasonable basis for our opinion.
/s/ Deloitte & Touche LLP
Boston, Massachusetts
September 16, 2024
We have served as the auditor of one or more of the Fidelity investment companies since 1999.
Distributions
(Unaudited)The dividend and capital gains distributions for the fund(s) are available on Fidelity.com or Institutional.Fidelity.com.
The fund hereby designates as a capital gain dividend with respect to the taxable year ended July 31, 2024, $3,773,622,946, or, if subsequently determined to be different, the net capital gain of such year.
The fund will notify shareholders in January 2025 of amounts for use in preparing 2024 income tax returns.
Item 8: Changes in and Disagreements with Accountants for Open-End Management Investment Companies
Note: This is not applicable for any fund included in this document.
Item 9: Proxy Disclosures for Open-End Management Investment Companies
| A special meeting of shareholders was held on July 16, 2024. The results of votes taken among shareholders on the proposal before them are reported below. Each vote reported represents one dollar of net asset value held on the record date for the meeting. |
| Proposal 1 |
| To elect a Board of Trustees. |
| | # of Votes | % of Votes |
| Bettina Doulton |
| Affirmative | 88,756,759,992.17 | 95.11 |
| Withheld | 4,564,750,651.52 | 4.89 |
| TOTAL | 93,321,510,643.68 | 100.00 |
| Robert A. Lawrence |
| Affirmative | 88,523,438,331.98 | 94.86 |
| Withheld | 4,798,072,311.70 | 5.14 |
| TOTAL | 93,321,510,643.68 | 100.00 |
| Vijay C. Advani |
| Affirmative | 88,484,371,668.51 | 94.82 |
| Withheld | 4,837,138,975.17 | 5.18 |
| TOTAL | 93,321,510,643.68 | 100.00 |
| Thomas P. Bostick |
| Affirmative | 88,618,596,648.21 | 94.96 |
| Withheld | 4,702,913,995.47 | 5.04 |
| TOTAL | 93,321,510,643.68 | 100.00 |
| Donald F. Donahue |
| Affirmative | 88,542,403,002.79 | 94.88 |
| Withheld | 4,779,107,640.89 | 5.12 |
| TOTAL | 93,321,510,643.68 | 100.00 |
| Vicki L. Fuller |
| Affirmative | 88,788,711,037.44 | 95.14 |
| Withheld | 4,532,799,606.24 | 4.86 |
| TOTAL | 93,321,510,643.68 | 100.00 |
| Patricia L. Kampling |
| Affirmative | 88,819,315,996.59 | 95.18 |
| Withheld | 4,502,194,647.10 | 4.82 |
| TOTAL | 93,321,510,643.68 | 100.00 |
| Thomas A. Kennedy |
| Affirmative | 88,667,457,817.34 | 95.01 |
| Withheld | 4,654,052,826.34 | 4.99 |
| TOTAL | 93,321,510,643.68 | 100.00 |
| Oscar Munoz |
| Affirmative | 88,183,976,568.30 | 94.49 |
| Withheld | 5,137,534,075.39 | 5.51 |
| TOTAL | 93,321,510,643.68 | 100.00 |
| Karen B. Peetz |
| Affirmative | 88,720,160,318.58 | 95.07 |
| Withheld | 4,601,350,325.11 | 4.93 |
| TOTAL | 93,321,510,643.68 | 100.00 |
| David M. Thomas |
| Affirmative | 88,471,490,747.86 | 94.80 |
| Withheld | 4,850,019,895.82 | 5.20 |
| TOTAL | 93,321,510,643.68 | 100.00 |
| Susan Tomasky |
| Affirmative | 88,536,869,646.78 | 94.87 |
| Withheld | 4,784,640,996.90 | 5.13 |
| TOTAL | 93,321,510,643.68 | 100.00 |
| Michael E. Wiley |
| Affirmative | 88,526,906,267.86 | 94.86 |
| Withheld | 4,794,604,375.83 | 5.14 |
| TOTAL | 93,321,510,643.68 | 100.00 |
| | | |
| Proposal 1 reflects trust-wide proposal and voting results. |
Item 10: Remuneration Paid to Directors, Officers, and others of Open-End Management Investment Companies
Note: This information is disclosed as part of the consolidated financial statements for each Fund as part of Item 7: Consolidated Financial Statements and Consolidated Financial Highlights for Open-End Management Investment companies.
Item 11: Statement Regarding Basis for Approval of Investment Advisory Contract
Board Approval of Investment Advisory Contracts and Management Fees
Fidelity Blue Chip Growth Fund
Each year, the Board of Trustees, including the Independent Trustees (together, the Board), considers the renewal of the fund's management contract with Fidelity Management & Research Company LLC (FMR) and the sub-advisory agreements (together, the Advisory Contracts) for the fund. FMR and the sub-advisers are referred to herein as the Investment Advisers. The Board, assisted by the advice of fund counsel and Independent Trustees' counsel, requests and considers a broad range of information relevant to the renewal of the Advisory Contracts throughout the year.
The Board meets regularly and, at each of its meetings, covers an extensive agenda of topics and materials and considers factors that are relevant to its annual consideration of the renewal of the fund's Advisory Contracts, including the services and support provided to the fund and its shareholders. The Board, acting directly and through its Committees (each of which is composed of and chaired by Independent Trustees), requests and receives information concerning the annual consideration of the renewal of the fund's Advisory Contracts. The Board also meets as needed to review matters specifically related to the Board's annual consideration of the renewal of the Advisory Contracts. Members of the Board may also meet with trustees of other Fidelity funds through joint ad hoc committees to discuss certain matters relevant to all of the Fidelity funds.
At its May 2024 meeting, the Board unanimously determined to renew the fund's Advisory Contracts. In reaching its determination, the Board considered all factors it believed relevant, including (i) the nature, extent, and quality of the services provided to the fund and its shareholders (including the investment performance of the fund); (ii) the competitiveness relative to peer funds of the fund's management fee and the total expense ratio of a representative class (the retail class, which was selected because it was the largest class); (iii) the total costs of the services provided by and the profits realized by FMR and its affiliates (Fidelity) from its relationships with the fund; and (iv) the extent to which, if any, economies of scale exist and are realized as the fund grows, and whether any economies of scale are appropriately shared with fund shareholders. The Board also considered the broad range of investment choices available to shareholders from FMR's competitors and that the fund's shareholders have chosen to invest in the fund, which is part of the Fidelity family of funds. The Board's decision to renew the Advisory Contracts was not based on any single factor.
The Board reached a determination, with the assistance of fund counsel and Independent Trustees' counsel and through the exercise of its business judgment, that the renewal of the Advisory Contracts was in the best interests of the fund and its shareholders and that the compensation payable under the Advisory Contracts was fair and reasonable in light of all of the surrounding circumstances.
Nature, Extent, and Quality of Services Provided. The Board considered staffing as it relates to the fund, including the backgrounds and experience of investment personnel of the Investment Advisers, and also considered the Investment Advisers' implementation of the fund's investment program. The Independent Trustees also had discussions with senior management of Fidelity's investment operations and investment groups. The Board considered the structure of the investment personnel compensation program and whether this structure provides appropriate incentives to act in the best interests of the fund. Additionally, the Board considered the portfolio managers' investments, if any, in the funds that they manage.
Resources Dedicated to Investment Management and Support Services. The Board and the Fund Oversight and Research Committees reviewed the general qualifications and capabilities of Fidelity's investment staff, including its size, education, experience, and resources, as well as Fidelity's approach to recruiting, training, managing, and compensating investment personnel. The Board noted the resources devoted to expansion of Fidelity's global investment organization, and that Fidelity's analysts have extensive resources, tools and capabilities that allow them to conduct sophisticated quantitative and fundamental analysis, as well as credit analysis of issuers, counterparties and guarantors. Further, the Board considered that Fidelity's investment professionals have sufficient access to global information and data so as to provide competitive investment results over time, and that those professionals also have access to sophisticated tools that permit them to assess portfolio construction and risk and performance attribution characteristics continuously, as well as to transmit new information and research conclusions rapidly around the world. Additionally, in its deliberations, the Board considered Fidelity's trading, risk management, compliance, and technology and operations capabilities and resources, which are integral parts of the investment management process.
Shareholder and Administrative Services. The Board considered (i) the nature, extent, quality, and cost of advisory, administrative, shareholder, transfer agency, and pricing and bookkeeping services performed by the Investment Advisers and their affiliates under the Advisory Contracts; (ii) the nature and extent of Fidelity's supervision of third party service providers, principally custodians, subcustodians, and pricing vendors; and (iii) the resources devoted by Fidelity to, and the record of compliance with, the fund's compliance policies and procedures. The Board also reviewed the allocation of fund brokerage, including allocations to brokers affiliated with the Investment Advisers, the use of brokerage commissions to pay fund expenses, and the use of "soft" commission dollars to pay for research services. The Board also considered the fund's securities lending activities and any payments made to Fidelity relating to securities lending under a separate agreement.
The Board noted that the growth of fund assets over time across the complex allows Fidelity to reinvest in the development of services designed to enhance the value and convenience of the Fidelity funds as investment vehicles. These services include 24-hour access to account information and market information over the Internet and through telephone representatives, investor education materials and asset allocation tools. The Board also considered that it reviews customer service metrics such as telephone response times, continuity of services on the website and metrics addressing services at Fidelity Investor Centers.
Investment in a Large Fund Family. The Board considered the benefits to shareholders of investing in a fund that is part of a large family of funds offering a variety of investment disciplines and providing a large variety of fund investor services. The Board noted that Fidelity had taken, or had made recommendations that resulted in the Fidelity funds taking, a number of actions over the previous year that benefited particular funds and/or the Fidelity funds in general.
Investment Performance. The Board took into account discussions that occur with representatives of the Investment Advisers, and reports that it receives, at Board meetings throughout the year, relating to fund investment performance. In this regard the Board noted that as part of regularly scheduled fund reviews and other reports to the Board on fund performance, the Board considered annualized return information for the fund for different time periods, measured against an appropriate securities market index (benchmark index) and an appropriate peer group of funds with similar objectives (peer group). The Board also considered information about performance attribution. In its ongoing evaluation of fund investment performance, the Board gives particular attention to information indicating changes in performance of the funds over different time periods and discussed with the Investment Advisers the reasons for any overperformance or underperformance.
In addition to reviewing absolute and relative fund performance, the Independent Trustees periodically consider the appropriateness of fund performance metrics in evaluating the results achieved. The Independent Trustees generally give greater weight to fund performance over longer time periods than over shorter time periods. Depending on the circumstances, the Independent Trustees may be satisfied with a fund's performance notwithstanding that it lags its benchmark index or peer group for certain periods.
Based on its review, the Board concluded that the nature, extent, and quality of services provided to the fund under the Advisory Contracts should continue to benefit the shareholders of the fund.
Competitiveness of Management Fee and Total Expense Ratio. The Board was provided with information regarding industry trends in management fees and expenses. The Board considered that, effective March 1, 2024, an amended Advisory Contract with FMR went into effect with class-level management fees based on tiered schedules and subject to a maximum class-level rate (the management fee). The Board also considered that in exchange for the variable management fee, each class of the fund receives investment advisory, management, administrative, transfer agent, and pricing and bookkeeping services. In its review of the management fee and total expense ratio of the retail class, the Board considered a pro forma management fee rate for the retail class as if it had been in effect for the 12-month period ended September 30, 2023, as well as other third-party fund expenses, as applicable, such as custodial, legal, and audit fees. The Board noted that Fidelity may agree to waive fees or reimburse expenses from time to time, and the extent to which, if any, it has done so for the fund. The Board also considered information about the impact of the fund's performance adjustment.
Comparisons of Management Fees and Total Expense Ratios. Among other things, the Board reviewed data for selected groups of competitive funds and classes (referred to as "mapped groups") that were compiled by Fidelity based on combining similar investment objective categories (as classified by Morningstar) that have comparable investment mandates. The data reviewed by the Board included (i) gross management fee comparisons (before taking into account expense reimbursements or caps and without taking into account the fund's performance adjustment) relative to the total universe of funds within the mapped group; (ii) gross management fee comparisons relative to a subset of non-Fidelity funds in the mapped group that are similar in size and management fee structure to the fund (referred to as the "asset size peer group"); (iii) total expense comparisons of the retail class of the fund relative to funds and classes in the mapped group that have a similar sales load structure to the retail class of the fund (referred to as the "similar sales load structure group"); and (iv) total expense comparisons of the retail class of the fund relative to funds and classes in the similar sales load structure group that are similar in size and management fee structure to the fund (referred to as the "total expense asset size peer group"). The total expense asset size peer group comparison excludes performance adjustments and fund-paid 12b-1 fees to eliminate variability in fee structures.
The information provided to the Board indicated that the fund's management fee rate ranked below the competitive median of the mapped group for the 12-month period ended September 30, 2023 and above the competitive median of the asset size peer group for the 12-month period ended September 30, 2023. Further, the information provided to the Board indicated that the total expense ratio of the retail class of the fund ranked below the competitive median of the similar sales load structure group for the 12-month period ended September 30, 2023 and below the competitive median of the total expense asset size peer group for the 12-month period ended September 30, 2023. The Board considered that Fidelity believes that management fee comparisons are particularly unhelpful in the context of this fund and that total expense comparisons are more useful. The Board noted that the total expense ratio of the representative class ranked below the competitive median.
The Board noted that a different variable management fee rate is applicable to each class of the fund. The Board considered that the difference in management fee rates between classes is the result of separate arrangements for class-level services and/or waivers of certain expenses and not the result of any difference in advisory or custodial fees or other expenses related to the management of the fund's assets, which do not vary by class.
The Board also considered that the fund's management fee is subject to upward or downward adjustment depending upon whether, and to what extent, the fund's investment performance for the performance period (a rolling 36-month period) exceeds, or is exceeded by, a securities index, thus leading to a performance adjustment for the same period. The Board noted that the performance adjustment provides FMR with a strong economic incentive to seek to achieve superior long-term performance for the fund's shareholders and helps to more closely align the interests of FMR and the shareholders of the fund.
In connection with its consideration of the fund's performance adjustment, the Board noted that the performance of the retail class is used for purposes of determining the performance adjustment. The Board noted that to the extent the performance adjustment was based on the performance of a share class with higher total annual operating expenses, the fund would be subject to a smaller positive and larger negative performance adjustment. The Board considered the appropriateness of the use of the retail class as the basis for the performance adjustment. The Board noted that the retail class is typically the largest class (reflecting the actual investment experience for the plurality of shareholders), employs a standard expense structure, and does not include fund-paid 12b-1 fees, which Fidelity believes makes it a more appropriate measurement of Fidelity's investment skill.
Fees Charged to Other Fidelity Clients. The Board also considered Fidelity fee structures and other information with respect to clients of Fidelity, such as other funds advised or subadvised by Fidelity, pension plan clients, and other institutional clients with similar mandates. The Board noted that a joint ad hoc committee created by it and the boards of other Fidelity funds periodically reviews and compares Fidelity's institutional investment advisory business with its business of providing services to the Fidelity funds and also noted the most recent findings of the committee. The Board noted that the committee's review included a consideration of the differences in services provided, fees charged, and costs incurred, as well as competition in the markets serving the different categories of clients.
Based on its review, the Board concluded that the fund's management fee, including the use of the retail class as the basis for the performance adjustment, is fair and reasonable in light of the services that the fund receives and the other factors considered. Further, based on its review of total expense ratios and fees charged to other Fidelity clients, the Board concluded that the total expense ratio of each class of the fund was reasonable in light of the services that the fund and its shareholders receive and the other factors considered.
Costs of the Services and Profitability. The Board considered the revenues earned and the expenses incurred by Fidelity in conducting the business of developing, marketing, distributing, managing, administering and servicing the fund and servicing the fund's shareholders. The Board also considered the level of Fidelity's profits in respect of all the Fidelity funds.
On an annual basis, Fidelity presents to the Board information about the profitability of its relationships with the fund. Fidelity calculates profitability information for each fund, as well as aggregate profitability information for groups of Fidelity funds and all Fidelity funds, using a series of detailed revenue and cost allocation methodologies which originate with the books and records of Fidelity on which Fidelity's audited financial statements are based. The Audit Committee of the Board reviews any significant changes from the prior year's methodologies and the full Board approves such changes.
A public accounting firm has been engaged annually by the Board as part of the Board's assessment of Fidelity's profitability analysis. The engagement includes the review and assessment of the methodologies used by Fidelity in determining the revenues and expenses attributable to Fidelity's fund business, and completion of agreed-upon procedures in respect of the mathematical accuracy of certain fund profitability information and its conformity to established allocation methodologies. After considering the reports issued under the engagement and information provided by Fidelity, the Board concluded that while other allocation methods may also be reasonable, Fidelity's profitability methodologies are reasonable in all material respects.
The Board also reviewed Fidelity's non-fund businesses and potential indirect benefits such businesses may have received as a result of their association with Fidelity's fund business (i.e., fall-out benefits) as well as cases where Fidelity's affiliates may benefit from the funds' business. The Board considered areas where potential indirect benefits to the Fidelity funds from their relationships with Fidelity may exist. The Board's consideration of these matters was informed by the findings of a joint ad hoc committee created by it and the boards of other Fidelity funds to evaluate potential fall-out benefits.
The Board considered the costs of the services provided by and the profits realized by Fidelity in connection with the operation of the fund and was satisfied that the profitability was not excessive.
Economies of Scale. The Board considered whether there have been economies of scale in respect of the management of the Fidelity funds, whether the Fidelity funds (including the fund) have appropriately benefited from any such economies of scale, and whether there is potential for realization of any further economies of scale. The Board considered the extent to which the fund will benefit from economies of scale as assets grow through increased services to the fund, through waivers or reimbursements, or through fee or expense ratio reductions. The Board also noted that a committee created by it and the boards of other Fidelity funds periodically analyzes whether Fidelity attains economies of scale in respect of the management and servicing of the Fidelity funds, whether the Fidelity funds have appropriately benefited from such economies of scale, and whether there is potential for realization of any further economies of scale.
The Board recognized that the fund's management contract incorporates a variable management fee structure, which provides breakpoints as a way to share, in part, any potential economies of scale that may exist at the asset class level and through a discount that considers both fund size and total assets of the four applicable asset classes. The Board considered that the variable management fee is designed to deliver the benefits of economies of scale to fund shareholders even if assets of any particular fund are unchanged or have declined, because some portion of Fidelity's costs are attributable to services provided to all funds subject to the variable management fee, and all such funds benefit if those costs can be allocated among more assets. The Board concluded that, given the variable management fee structure, fund shareholders will benefit from lower management fees due to the application of the breakpoints and discount factor, regardless of whether Fidelity achieves any such economies of scale.
The Board concluded, taking into account the analysis of the committee, that economies of scale, if any, are being appropriately shared between fund shareholders and Fidelity.
Additional Information Requested by the Board. In order to develop fully the factual basis for consideration of the Fidelity funds' advisory contracts, the Board requested and received additional information on certain topics, including but not limited to: (i) fund flow and performance trends, in particular the underperformance of certain funds and strategies, and Fidelity's long-term strategies for certain funds; (ii) the operation of performance fees and the rationale for implementing performance fees on certain categories of funds but not others; (iii) Fidelity's pricing philosophy compared to competitors; (iv) fund profitability methodology and data; (v) evaluation of competitive fund data and peer group classifications and fee and expense comparisons; (vi) the management fee and expense structures for different funds and classes and information about the differences between various fee and expense structures; (vii) the variable management fee implemented for certain funds effective March 1, 2024; and (viii) information regarding other accounts managed by Fidelity and the funds' sub-advisory arrangements.
Conclusion. Based on its evaluation of all of the conclusions noted above, and after considering all factors it believed relevant, the Board, including the Independent Trustees, concluded that the advisory and sub-advisory fee arrangements are fair and reasonable in light of all of the surrounding circumstances and that the fund's Advisory Contracts should be renewed through May 31, 2025.
1.536058.127
BCF-ANN-0924
Fidelity® Series Real Estate Income Fund
Annual Report
July 31, 2024
Contents
To view a fund's proxy voting guidelines and proxy voting record for the 12-month period ended June 30, visit http://www.fidelity.com/proxyvotingresults or visit the Securities and Exchange Commission's (SEC) web site at http://www.sec.gov.
You may also call 1-800-544-8544 to request a free copy of the proxy voting guidelines.
Standard & Poor's, S&P and S&P 500 are registered service marks of The McGraw-Hill Companies, Inc. and have been licensed for use by Fidelity Distributors Corporation.
Other third-party marks appearing herein are the property of their respective owners.
All other marks appearing herein are registered or unregistered trademarks or service marks of FMR LLC or an affiliated company. © 2024 FMR LLC. All rights reserved.
This report and the financial statements contained herein are submitted for the general information of the shareholders of the Fund. This report is not authorized for distribution to prospective investors in the Fund unless preceded or accompanied by an effective prospectus.
A fund files its complete schedule of portfolio holdings with the SEC for the first and third quarters of each fiscal year on Form N-PORT. Forms N-PORT are available on the SEC's web site at http://www.sec.gov. A fund's Forms N-PORT may be reviewed and copied at the SEC's Public Reference Room in Washington, DC. Information regarding the operation of the SEC's Public Reference Room may be obtained by calling 1-800-SEC-0330.
For a complete list of a fund's portfolio holdings, view the most recent holdings listing, semiannual report, or annual report on Fidelity's web site at http://www.fidelity.com, http://www.institutional.fidelity.com, or http://www.401k.com, as applicable.
NOT FDIC INSURED •MAY LOSE VALUE •NO BANK GUARANTEE
Neither the Fund nor Fidelity Distributors Corporation is a bank.
Item 7: Financial Statements and Financial Highlights for Open-End Management Investment Companies (Annual Report)
Fidelity® Series Real Estate Income Fund
Schedule of Investments July 31, 2024
Showing Percentage of Net Assets
| Common Stocks - 0.0% |
| | | Shares | Value ($) |
| REAL ESTATE - 0.0% | | | |
| Equity Real Estate Investment Trusts (REITs) - 0.0% | | | |
Retail Value, Inc. (a)(b) (Cost $709,415) | | 24,066 | 0 |
| | | | |
| Preferred Stocks - 23.2% |
| | | Shares | Value ($) |
| Convertible Preferred Stocks - 1.2% | | | |
| REAL ESTATE - 1.2% | | | |
| Equity Real Estate Investment Trusts (REITs) - 1.2% | | | |
| LXP Industrial Trust (REIT) Series C, 6.50% | | 68,019 | 3,094,865 |
| | | | |
| Nonconvertible Preferred Stocks - 22.0% | | | |
| ENERGY - 0.3% | | | |
| Oil, Gas & Consumable Fuels - 0.3% | | | |
| Enbridge, Inc. Series 1, U.S. TREASURY 5 YEAR INDEX + 3.140% 5.949% (c)(d) | | 20,325 | 448,979 |
| Global Partners LP Series B, 9.50% | | 12,200 | 321,105 |
| | | | 770,084 |
| FINANCIALS - 8.5% | | | |
| Mortgage Real Estate Investment Trusts - 8.5% | | | |
| AGNC Investment Corp.: | | | |
| 6.125% | | 61,500 | 1,480,305 |
| Series C, CME Term SOFR 3 Month Index + 5.110% 7.00%(c)(d) | | 41,899 | 1,074,709 |
| Series E, 6.50% | | 46,750 | 1,160,101 |
| Annaly Capital Management, Inc.: | | | |
| 6.75%(c) | | 27,900 | 717,588 |
| Series F, CME Term SOFR 3 Month Index + 4.990% 6.95%(c)(d) | | 73,400 | 1,880,508 |
| Series G, CME Term SOFR 3 Month Index + 4.430% 6.50%(c)(d) | | 70,990 | 1,802,436 |
| Arbor Realty Trust, Inc.: | | | |
| Series D, 6.375% | | 12,400 | 220,968 |
| Series F, 6.25%(c) | | 14,100 | 269,169 |
| Chimera Investment Corp. Series C, 7.75% (c) | | 55,437 | 1,234,582 |
| Dynex Capital, Inc. Series C 6.90% | | 89,500 | 2,222,285 |
| Ellington Financial LLC 6.75% (c) | | 58,522 | 1,445,493 |
| MFA Financial, Inc.: | | | |
| 6.50%(c) | | 26,100 | 602,910 |
| Series B, 7.50% | | 16,249 | 350,978 |
| PennyMac Mortgage Investment Trust: | | | |
| 8.125%(c) | | 14,975 | 359,849 |
| Series B, U.S. TREASURY 3 MO INDEX + 5.990% 8.00%(c)(d) | | 24,205 | 577,410 |
| Rithm Capital Corp.: | | | |
| 7.125%(c) | | 60,467 | 1,510,466 |
| Series A, 7.50%(c) | | 64,459 | 1,630,465 |
| Series C, 6.375%(c) | | 20,446 | 486,410 |
| Series D, 7.00%(c) | | 17,100 | 396,036 |
| Two Harbors Investment Corp.: | | | |
| Series A, 8.125%(c) | | 41,635 | 997,158 |
| Series B, 7.625%(c) | | 89,612 | 2,029,712 |
| | | | 22,449,538 |
| REAL ESTATE - 13.2% | | | |
| Equity Real Estate Investment Trusts (REITs) - 11.5% | | | |
| Agree Realty Corp. 4.25% | | 38,700 | 708,597 |
| American Homes 4 Rent: | | | |
| 6.25% | | 18,925 | 448,901 |
| Series G, 5.875% | | 37,050 | 843,629 |
| Armada Hoffler Properties, Inc. 6.75% | | 33,250 | 720,860 |
| Ashford Hospitality Trust, Inc.: | | | |
| Series F, 7.375% | | 10,135 | 163,174 |
| Series H, 7.50% | | 5,875 | 94,588 |
| Series I, 7.50% | | 12,911 | 210,320 |
| Braemar Hotels & Resorts, Inc. Series D, 8.25% | | 5,450 | 102,733 |
| Cedar Realty Trust, Inc.: | | | |
| 7.25% | | 28,556 | 395,501 |
| Series C, 6.50% | | 43,500 | 555,930 |
| Centerspace Series C, 6.625% | | 57,700 | 1,408,457 |
| CTO Realty Growth, Inc. 6.375% | | 20,000 | 437,300 |
| DiamondRock Hospitality Co. 8.25% | | 34,900 | 873,547 |
| Gladstone Commercial Corp.: | | | |
| 6.625% | | 41,125 | 902,899 |
| Series G, 6.00% | | 64,500 | 1,302,255 |
| Gladstone Land Corp. Series D, 5.00% | | 60,000 | 1,461,000 |
| Global Medical REIT, Inc. Series A, 7.50% | | 27,461 | 676,090 |
| Global Net Lease, Inc.: | | | |
| 7.50% | | 34,998 | 769,956 |
| Series A, 7.25% | | 45,925 | 986,469 |
| Series B 6.875% | | 47,200 | 960,520 |
| Series E, 7.375% | | 19,100 | 426,885 |
| Healthcare Trust, Inc.: | | | |
| 7.125% | | 40,300 | 591,604 |
| Series A 7.375% | | 33,000 | 488,400 |
| Hudson Pacific Properties, Inc. Series C, 4.75% | | 22,900 | 300,219 |
| National Storage Affiliates Trust Series A, 6.00% | | 12,325 | 275,957 |
| Pebblebrook Hotel Trust: | | | |
| 6.30% | | 37,902 | 789,120 |
| 6.375% | | 45,192 | 954,455 |
| 6.375% | | 20,200 | 406,626 |
| Series H, 5.70% | | 50,200 | 903,600 |
| Prologis, Inc. Series Q, 8.54% | | 16,850 | 952,868 |
| Realty Income Corp. 6.00% | | 16,575 | 403,933 |
| Regency Centers Corp.: | | | |
| 5.875% | | 28,775 | 632,762 |
| Series A, 6.25% | | 51,175 | 1,182,143 |
| Rexford Industrial Realty, Inc.: | | | |
| Series B, 5.875% | | 50,000 | 1,103,000 |
| Series C, 5.625% | | 11,775 | 251,985 |
| Saul Centers, Inc.: | | | |
| Series D, 6.125% | | 15,958 | 331,926 |
| Series E, 6.00% | | 13,475 | 275,429 |
| SITE Centers Corp. 6.375% | | 15,100 | 349,263 |
| Sotherly Hotels, Inc.: | | | |
| Series B, 8.00% | | 12,750 | 235,620 |
| Series C, 7.875% | | 19,300 | 361,875 |
| Summit Hotel Properties, Inc.: | | | |
| Series E, 6.25% | | 60,784 | 1,252,150 |
| Series F, 5.875% | | 61,000 | 1,239,520 |
| Sunstone Hotel Investors, Inc.: | | | |
| Series H, 6.125% | | 20,000 | 431,000 |
| Series I, 5.70% | | 38,700 | 769,743 |
| UMH Properties, Inc. Series D, 6.375% | | 63,875 | 1,523,419 |
| | | | 30,456,228 |
| Real Estate Management & Development - 1.7% | | | |
| Brookfield Property Partners LP: | | | |
| 5.75% | | 7,000 | 88,410 |
| 6.50% | | 5,875 | 87,714 |
| Digitalbridge Group, Inc.: | | | |
| Series H, 7.125% | | 64,710 | 1,476,682 |
| Series I, 7.15% | | 75,785 | 1,708,194 |
| Series J, 7.15% | | 52,749 | 1,185,270 |
| Seritage Growth Properties Series A, 7.00% | | 1,050 | 21,116 |
| | | | 4,567,386 |
TOTAL REAL ESTATE | | | 35,023,614 |
| | | | |
| TOTAL NONCONVERTIBLE PREFERRED STOCKS | | | 58,243,236 |
| TOTAL PREFERRED STOCKS (Cost $57,609,898) | | | 61,338,101 |
| | | | |
| Corporate Bonds - 50.0% |
| | | Principal Amount (e) | Value ($) |
| Convertible Bonds - 0.8% | | | |
| FINANCIALS - 0.8% | | | |
| Mortgage Real Estate Investment Trusts - 0.8% | | | |
| PennyMac Corp. 5.5% 11/1/24 | | 1,294,000 | 1,277,178 |
| Two Harbors Investment Corp. 6.25% 1/15/26 | | 904,000 | 876,880 |
| | | | 2,154,058 |
| Nonconvertible Bonds - 49.2% | | | |
| COMMUNICATION SERVICES - 0.3% | | | |
| Media - 0.3% | | | |
| Lamar Media Corp. 4% 2/15/30 | | 875,000 | 807,056 |
| | | | |
| CONSUMER DISCRETIONARY - 2.3% | | | |
| Hotels, Restaurants & Leisure - 1.8% | | | |
| Choice Hotels International, Inc. 5.85% 8/1/34 | | 250,000 | 251,218 |
| Hilton Domestic Operating Co., Inc.: | | | |
| 3.625% 2/15/32(f) | | 1,500,000 | 1,313,766 |
| 4% 5/1/31(f) | | 500,000 | 452,883 |
| Hilton Grand Vacations Borrower Escrow LLC 4.875% 7/1/31 (f) | | 740,000 | 666,282 |
| Marriott Ownership Resorts, Inc. 4.5% 6/15/29 (f) | | 1,570,000 | 1,460,086 |
| Times Square Hotel Trust 8.528% 8/1/26 (f) | | 682,080 | 680,698 |
| | | | 4,824,933 |
| Household Durables - 0.5% | | | |
| M/I Homes, Inc. 3.95% 2/15/30 | | 1,430,000 | 1,300,329 |
| | | | |
TOTAL CONSUMER DISCRETIONARY | | | 6,125,262 |
| | | | |
| ENERGY - 0.3% | | | |
| Oil, Gas & Consumable Fuels - 0.3% | | | |
| EG Global Finance PLC 12% 11/30/28 (f) | | 750,000 | 803,072 |
| | | | |
| FINANCIALS - 0.5% | | | |
| Financial Services - 0.5% | | | |
| Rexford Industrial Realty LP: | | | |
| 2.125% 12/1/30 | | 1,000,000 | 839,104 |
| 2.15% 9/1/31 | | 500,000 | 408,182 |
| | | | 1,247,286 |
| HEALTH CARE - 0.6% | | | |
| Health Care Providers & Services - 0.6% | | | |
| Sabra Health Care LP 5.125% 8/15/26 | | 1,615,000 | 1,606,961 |
| | | | |
| INDUSTRIALS - 0.5% | | | |
| Commercial Services & Supplies - 0.5% | | | |
| Williams Scotsman, Inc.: | | | |
| 4.625% 8/15/28(f) | | 750,000 | 713,698 |
| 6.125% 6/15/25(f) | | 648,000 | 648,337 |
| | | | 1,362,035 |
| REAL ESTATE - 44.7% | | | |
| Equity Real Estate Investment Trusts (REITs) - 40.2% | | | |
| Agree LP: | | | |
| 2.6% 6/15/33 | | 1,000,000 | 805,674 |
| 2.9% 10/1/30 | | 500,000 | 441,294 |
| 4.8% 10/1/32 | | 77,000 | 74,127 |
| 5.625% 6/15/34 | | 25,000 | 25,383 |
| American Homes 4 Rent LP: | | | |
| 2.375% 7/15/31 | | 2,000,000 | 1,664,525 |
| 3.625% 4/15/32 | | 1,000,000 | 896,740 |
| 4.25% 2/15/28 | | 2,000,000 | 1,945,986 |
| 5.5% 2/1/34 | | 1,500,000 | 1,509,810 |
| 5.5% 7/15/34 | | 3,000 | 3,020 |
| American Tower Corp.: | | | |
| 3.1% 6/15/50 | | 1,500,000 | 1,000,394 |
| 3.8% 8/15/29 | | 1,000,000 | 952,448 |
| 4.05% 3/15/32 | | 2,500,000 | 2,348,733 |
| 5.45% 2/15/34 | | 2,000,000 | 2,039,248 |
| 5.55% 7/15/33 | | 1,000,000 | 1,025,000 |
| 5.65% 3/15/33 | | 2,000,000 | 2,062,489 |
| 5.9% 11/15/33 | | 1,500,000 | 1,576,222 |
| Brixmor Operating Partnership LP: | | | |
| 4.125% 5/15/29 | | 138,000 | 132,771 |
| 5.5% 2/15/34 | | 500,000 | 502,150 |
| CBL & Associates LP: | | | |
| 4.6%(b)(g) | | 3,930,000 | 0 |
| 5.25%(b)(g) | | 3,629,000 | 0 |
| 5.95%(b)(g) | | 2,551,000 | 0 |
| Crown Castle, Inc.: | | | |
| 2.1% 4/1/31 | | 2,000,000 | 1,661,250 |
| 2.25% 1/15/31 | | 1,500,000 | 1,267,014 |
| 2.5% 7/15/31 | | 2,500,000 | 2,117,782 |
| 5.1% 5/1/33 | | 2,500,000 | 2,487,308 |
| 5.8% 3/1/34 | | 1,500,000 | 1,558,794 |
| CTR Partnership LP/CareTrust Capital Corp. 3.875% 6/30/28 (f) | | 1,760,000 | 1,644,427 |
| CubeSmart LP: | | | |
| 2.5% 2/15/32 | | 1,500,000 | 1,266,493 |
| 4.375% 2/15/29 | | 1,000,000 | 977,844 |
| Equinix Europe 2 Financing Corp. LLC 5.5% 6/15/34 | | 1,000,000 | 1,020,658 |
| Equinix, Inc.: | | | |
| 2.5% 5/15/31 | | 2,000,000 | 1,717,471 |
| 2.95% 9/15/51 | | 2,000,000 | 1,275,030 |
| 3% 7/15/50 | | 2,500,000 | 1,628,227 |
| 3.4% 2/15/52 | | 2,316,000 | 1,621,469 |
| Global Net Lease, Inc. / Global Net Lease Operating Partnership LP 3.75% 12/15/27 (f) | | 925,000 | 837,161 |
| GLP Capital LP/GLP Financing II, Inc.: | | | |
| 4% 1/15/31 | | 1,000,000 | 914,935 |
| 5.3% 1/15/29 | | 1,000,000 | 998,064 |
| 5.625% 9/15/34 | | 500,000 | 497,826 |
| 6.25% 9/15/54 | | 500,000 | 501,610 |
| 6.75% 12/1/33 | | 500,000 | 536,312 |
| Invitation Homes Operating Partnership LP: | | | |
| 2% 8/15/31 | | 1,000,000 | 812,262 |
| 4.15% 4/15/32 | | 1,000,000 | 932,943 |
| 5.5% 8/15/33 | | 3,000,000 | 3,029,215 |
| Kimco Realty OP, LLC: | | | |
| 4.6% 2/1/33 | | 1,000,000 | 966,405 |
| 6.4% 3/1/34 | | 1,576,000 | 1,712,649 |
| Kite Realty Group LP 5.5% 3/1/34 | | 1,000,000 | 1,003,957 |
| LXP Industrial Trust (REIT): | | | |
| 2.375% 10/1/31 | | 500,000 | 407,574 |
| 2.7% 9/15/30 | | 78,000 | 67,516 |
| 6.75% 11/15/28 | | 250,000 | 262,852 |
| MPT Operating Partnership LP/MPT Finance Corp.: | | | |
| 4.625% 8/1/29 | | 1,506,000 | 1,092,956 |
| 5% 10/15/27 | | 3,237,000 | 2,654,014 |
| NNN (REIT), Inc. 5.6% 10/15/33 | | 634,000 | 647,251 |
| Omega Healthcare Investors, Inc.: | | | |
| 4.5% 4/1/27 | | 483,000 | 473,271 |
| 4.75% 1/15/28 | | 1,616,000 | 1,589,000 |
| 5.25% 1/15/26 | | 22,000 | 21,941 |
| Phillips Edison Grocery Center Operating Partnership I LP 2.625% 11/15/31 | | 3,000,000 | 2,501,180 |
| Prologis LP: | | | |
| 4.875% 6/15/28 | | 1,000,000 | 1,009,877 |
| 5% 3/15/34 | | 1,000,000 | 1,002,149 |
| 5.125% 1/15/34 | | 1,000,000 | 1,012,461 |
| 5.25% 6/15/53 | | 2,000,000 | 1,941,990 |
| 5.25% 3/15/54 | | 1,500,000 | 1,450,324 |
| Public Storage Operating Co.: | | | |
| 5.1% 8/1/33 | | 1,000,000 | 1,013,694 |
| 5.35% 8/1/53 | | 2,000,000 | 1,987,320 |
| Realty Income Corp.: | | | |
| 3.1% 12/15/29 | | 1,000,000 | 920,815 |
| 3.4% 1/15/30 | | 500,000 | 466,525 |
| 4% 7/15/29 | | 1,000,000 | 966,918 |
| 5.625% 10/13/32 | | 1,000,000 | 1,038,343 |
| RLJ Lodging Trust LP 4% 9/15/29 (f) | | 715,000 | 638,029 |
| Safehold Operating Partnership LP: | | | |
| 2.8% 6/15/31 | | 500,000 | 427,736 |
| 2.85% 1/15/32 | | 1,250,000 | 1,053,261 |
| 6.1% 4/1/34 | | 1,400,000 | 1,438,924 |
| SBA Communications Corp. 3.125% 2/1/29 | | 2,500,000 | 2,263,395 |
| Simon Property Group LP: | | | |
| 3.25% 9/13/49 | | 2,500,000 | 1,728,301 |
| 5.85% 3/8/53 | | 1,000,000 | 1,022,147 |
| 6.25% 1/15/34 | | 2,000,000 | 2,159,179 |
| 6.65% 1/15/54 | | 1,000,000 | 1,135,496 |
| Sun Communities Operating LP: | | | |
| 2.7% 7/15/31 | | 2,500,000 | 2,114,187 |
| 5.5% 1/15/29 | | 1,000,000 | 1,015,059 |
| 5.7% 1/15/33 | | 1,000,000 | 1,006,830 |
| UDR, Inc. 3% 8/15/31 | | 500,000 | 443,211 |
| Uniti Group LP/Uniti Fiber Holdings, Inc./CSL Capital LLC 6% 1/15/30 (f) | | 1,040,000 | 745,104 |
| Uniti Group LP/Uniti Group Finance, Inc./CSL Capital LLC: | | | |
| 6.5% 2/15/29(f) | | 1,960,000 | 1,481,429 |
| 10.5% 2/15/28(f) | | 1,000,000 | 1,011,448 |
| Ventas Realty LP: | | | |
| 2.5% 9/1/31 | | 500,000 | 421,235 |
| 4.4% 1/15/29 | | 2,000,000 | 1,963,135 |
| 4.75% 11/15/30 | | 1,000,000 | 984,656 |
| VICI Properties LP: | | | |
| 5.125% 5/15/32 | | 1,000,000 | 975,045 |
| 5.625% 5/15/52 | | 1,000,000 | 919,545 |
| 5.75% 4/1/34 | | 32,000 | 32,479 |
| 6.125% 4/1/54 | | 1,254,000 | 1,238,978 |
| VICI Properties LP / VICI Note Co. 4.625% 12/1/29 (f) | | 3,095,000 | 2,979,903 |
| WP Carey, Inc.: | | | |
| 2.25% 4/1/33 | | 1,000,000 | 800,379 |
| 2.45% 2/1/32 | | 1,000,000 | 828,546 |
| 4% 2/1/25 | | 422,000 | 418,439 |
| 4.25% 10/1/26 | | 459,000 | 451,203 |
| | | | 106,218,370 |
| Real Estate Management & Development - 4.5% | | | |
| CBRE Group, Inc. 5.95% 8/15/34 | | 2,250,000 | 2,360,816 |
| Essex Portfolio LP 5.5% 4/1/34 | | 1,006,000 | 1,023,105 |
| Extra Space Storage LP: | | | |
| 2.35% 3/15/32 | | 2,000,000 | 1,635,175 |
| 5.4% 2/1/34 | | 2,000,000 | 2,016,648 |
| 5.5% 7/1/30 | | 1,000,000 | 1,028,917 |
| 5.9% 1/15/31 | | 1,000,000 | 1,041,376 |
| Howard Hughes Corp.: | | | |
| 4.125% 2/1/29(f) | | 665,000 | 610,174 |
| 5.375% 8/1/28(f) | | 355,000 | 344,259 |
| Kennedy-Wilson, Inc. 4.75% 2/1/30 | | 1,755,000 | 1,499,948 |
| Taylor Morrison Communities, Inc./Monarch Communities, Inc. 5.875% 6/15/27 (f) | | 202,000 | 202,824 |
| | | | 11,763,242 |
TOTAL REAL ESTATE | | | 117,981,612 |
| | | | |
| TOTAL NONCONVERTIBLE BONDS | | | 129,933,284 |
| TOTAL CORPORATE BONDS (Cost $130,998,989) | | | 132,087,342 |
| | | | |
| Asset-Backed Securities - 0.7% |
| | | Principal Amount (e) | Value ($) |
| American Homes 4 Rent Series 2015-SFR2 Class XS, 0% 10/17/52 (b)(c)(f)(h) | | 876,365 | 9 |
| Home Partners of America Trust: | | | |
| Series 2021-1 Class F, 3.325% 9/17/41 (f) | | 422,932 | 343,749 |
| Series 2021-2 Class G, 4.505% 12/17/26 (f) | | 961,012 | 871,858 |
| Switch Abs Issuer LLC Series 2024-2A Class C, 10.033% 6/25/54 (f) | | 750,000 | 759,393 |
| TOTAL ASSET-BACKED SECURITIES (Cost $2,133,912) | | | 1,975,009 |
| | | | |
| Commercial Mortgage Securities - 18.9% |
| | | Principal Amount (e) | Value ($) |
| BANK: | | | |
| Series 2017-BNK4 Class D, 3.357% 5/15/50 (f) | | 625,000 | 412,442 |
| Series 2017-BNK8 Class E, 2.8% 11/15/50 (f) | | 1,848,000 | 741,437 |
| Benchmark Mortgage Trust sequential payer Series 2019-B14: | | | |
| Class 225D, 3.2943% 12/15/62 (c)(f) | | 573,000 | 11,822 |
| Class 225E, 3.2943% 12/15/62 (c)(f) | | 859,000 | 8,484 |
| BSREP Commercial Mortgage Trust floater Series 2021-DC: | | | |
| Class F, CME Term SOFR 1 Month Index + 2.960% 8.2935% 8/15/38 (c)(d)(f) | | 101,405 | 67,300 |
| Class G, CME Term SOFR 1 Month Index + 3.960% 9.2935% 8/15/38 (c)(d)(f) | | 236,927 | 141,844 |
| Bx 2024 Vlt4 floater Series 2024-VLT4 Class F, CME Term SOFR 1 Month Index + 3.930% 9.2667% 7/15/29 (c)(d)(f) | | 750,000 | 738,750 |
| BX Commercial Mortgage Trust: | | | |
| floater: | | | |
Series 2019-IMC Class G, CME Term SOFR 1 Month Index + 3.640% 8.9753% 4/15/34 (c)(d)(f) | | 819,000 | 783,825 |
Series 2021-SOAR Class G, CME Term SOFR 1 Month Index + 2.910% 8.2435% 6/15/38 (c)(d)(f) | | 876,738 | 859,647 |
Series 2021-VINO Class G, CME Term SOFR 1 Month Index + 4.060% 9.3958% 5/15/38 (c)(d)(f) | | 1,080,705 | 1,060,669 |
Series 2022-LBA6 Class F, CME Term SOFR 1 Month Index + 3.350% 8.6788% 1/15/39 (c)(d)(f) | | 700,000 | 686,459 |
| Series 2019-OC11 Class E, 3.944% 12/9/41 (c)(f) | | 3,666,000 | 3,172,296 |
| Series 2020-VIVA Class E, 3.5488% 3/11/44 (c)(f) | | 2,018,000 | 1,677,777 |
| CD Mortgage Trust Series 2017-CD4 Class D, 3.3% 5/10/50 (f) | | 213,000 | 172,610 |
| COMM Mortgage Trust: | | | |
| floater Series 2018-HCLV: | | | |
Class F, CME Term SOFR 1 Month Index + 3.340% 8.675% 9/15/33 (c)(d)(f) | | 735,000 | 357,294 |
Class G, CME Term SOFR 1 Month Index + 5.350% 10.6813% 9/15/33 (c)(d)(f) | | 735,000 | 272,769 |
| sequential payer Series 2013-LC6 Class E, 3.5% 1/10/46 (f) | | 1,299,000 | 1,171,677 |
| Series 2012-CR1 Class G, 2.462% 5/15/45 (f) | | 387,296 | 5,193 |
| COMM Trust Series 2017-COR2 Class D, 3% 9/10/50 (f) | | 31,000 | 24,735 |
| Cone Trust 2024-Dfw1 floater Series 2024-DFW1 Class E, CME Term SOFR 1 Month Index + 3.880% 9.1885% 8/15/26 (c)(d)(f) | | 500,000 | 499,060 |
| Credit Suisse Commercial Mortgage Trust floater Series 2021-SOP2 Class F, CME Term SOFR 1 Month Index + 4.330% 9.7602% 6/15/34 (b)(d)(f) | | 800,000 | 263,656 |
| DBGS Mortgage Trust Series 2018-C1 Class C, 4.647% 10/15/51 (c) | | 1,000,000 | 864,666 |
| Eqt Trust 2024-Extr Series 2024-EXTR Class B, 1 month U.S. LIBOR + 0.000% 5.6546% 7/5/41 (c)(d)(f) | | 1,000,000 | 1,005,759 |
| GS Mortgage Securities Trust: | | | |
| floater Series 2018-RIVR Class G, CME Term SOFR 1 Month Index + 2.640% 8.226% 7/15/35 (c)(d)(f) | | 669,000 | 7,352 |
| sequential payer Series 2023-SHIP Class E, 7.4336% 9/10/38 (c)(f) | | 1,000,000 | 998,788 |
| Series 2011-GC5: | | | |
Class C, 5.15% 8/10/44 (c)(f) | | 101,000 | 77,753 |
Class D, 5.15% 8/10/44 (c)(f) | | 759,236 | 360,562 |
Class E, 5.15% 8/10/44 (c)(f) | | 848,000 | 95,520 |
Class F, 4.5% 8/10/44 (b)(f) | | 677,000 | 2,031 |
| Series 2012-GCJ9 Class E, 4.6009% 11/10/45 (c)(f) | | 355,000 | 296,049 |
| Hilton U.S.A. Trust Series 2016-HHV Class F, 4.1935% 11/5/38 (c)(f) | | 2,515,000 | 2,355,656 |
| Independence Plaza Trust Series 2018-INDP Class E, 4.996% 7/10/35 (f) | | 504,000 | 458,630 |
| JPMBB Commercial Mortgage Securities Trust Series 2014-C23 Class UH5, 4.7094% 9/15/47 (f) | | 1,624,000 | 1,530,696 |
| JPMDB Commercial Mortgage Securities Trust Series 2018-C8 Class D, 3.2573% 6/15/51 (c)(f) | | 302,000 | 216,263 |
| JPMorgan Chase Commercial Mortgage Securities Trust: | | | |
| sequential payer Series 2021-1MEM Class E, 2.6535% 10/9/42 (c)(f) | | 500,000 | 298,705 |
| Series 2011-C3: | | | |
Class E, 5.5252% 2/15/46 (c)(f) | | 3,467,000 | 1,352,371 |
Class G, 4.409% 2/15/46 (c)(f) | | 1,680,000 | 159,599 |
Class H, 4.409% 2/15/46 (b)(c)(f) | | 1,320,000 | 91,258 |
| Series 2012-CBX: | | | |
Class E, 4.6896% 6/15/45 (c)(f) | | 751,623 | 689,466 |
Class G 4% 6/15/45 (b)(f) | | 805,000 | 457,923 |
| Series 2013-LC11: | | | |
Class D, 4.1582% 4/15/46 (c) | | 1,316,000 | 584,699 |
Class F, 3.25% 4/15/46 (b)(c)(f) | | 482,000 | 19,569 |
| Series 2014-DSTY Class E, 3.8046% 6/10/27 (b)(c)(f) | | 924,000 | 2,254 |
| Series 2018-AON Class F, 4.6132% 7/5/31 (c)(f) | | 961,000 | 208,604 |
| Series 2020-NNN Class FFX, 4.6254% 1/16/37 (f) | | 1,406,000 | 435,987 |
| Merit floater Series 2021-STOR Class G, CME Term SOFR 1 Month Index + 2.860% 8.1935% 7/15/38 (c)(d)(f) | | 250,000 | 246,563 |
| MHC Commercial Mortgage Trust floater Series 2021-MHC: | | | |
| Class F, CME Term SOFR 1 Month Index + 2.710% 8.0444% 4/15/38 (c)(d)(f) | | 582,180 | 573,812 |
| Class G, CME Term SOFR 1 Month Index + 3.310% 8.6444% 4/15/38 (c)(d)(f) | | 709,690 | 700,829 |
| Morgan Stanley BAML Trust: | | | |
| Series 2012-C6 Class D, 4.3596% 11/15/45 (b)(c)(f) | | 2,000,000 | 1,610,000 |
| Series 2012-C6, Class F, 4.3596% 11/15/45 (c)(f) | | 1,000,000 | 150,000 |
| Series 2013-C9 Class C, 3.7233% 5/15/46 (c) | | 625,000 | 543,806 |
| Morgan Stanley Capital I Trust: | | | |
| sequential payer Series 2024-BPR2 Class A, 7.291% 5/5/29 (f) | | 998,429 | 1,030,588 |
| Series 2011-C2: | | | |
Class D, 5.2113% 6/15/44 (c)(f) | | 1,101,902 | 1,057,385 |
Class F, 5.2113% 6/15/44 (c)(f) | | 1,467,000 | 850,516 |
Class XB, 0.4665% 6/15/44 (c)(f)(h) | | 22,300,792 | 76,534 |
| Series 2011-C3: | | | |
Class E, 4.943% 7/15/49 (c)(f) | | 206,374 | 202,024 |
Class F, 4.943% 7/15/49 (c)(f) | | 636,000 | 581,918 |
Class G, 4.943% 7/15/49 (c)(f) | | 979,600 | 839,169 |
| Series 2015-MS1 Class D, 4.023% 5/15/48 (c)(f) | | 2,045,000 | 1,434,162 |
| Series 2016-BNK2 Class C, 3% 11/15/49 (f) | | 2,346,000 | 1,164,802 |
| MSJP Commercial Securities Mortgage Trust Series 2015-HAUL Class E, 4.851% 9/5/47 (c)(f) | | 1,000,000 | 830,825 |
| OPG Trust floater Series 2021-PORT Class J, CME Term SOFR 1 Month Index + 3.460% 8.7895% 10/15/36 (c)(d)(f) | | 325,000 | 316,063 |
| PKHL Commercial Mortgage Trust floater Series 2021-MF Class G, CME Term SOFR 1 Month Index + 4.460% 9.7935% 7/15/38 (b)(c)(d)(f) | | 500,000 | 309,305 |
| Prima Capital CRE Securitization Ltd. Series 2020-8A Class C, 3% 12/26/70 (f) | | 250,000 | 198,225 |
| Providence Place Group Ltd. Partnership Series 2000-C1 Class A2, 7.75% 7/20/28 (f) | | 637,086 | 649,352 |
| SG Commercial Mortgage Securities Trust Series 2019-PREZ Class F, 3.4771% 9/15/39 (c)(f) | | 2,000,000 | 1,597,254 |
| SREIT Trust floater: | | | |
| Series 2021-IND Class G, CME Term SOFR 1 Month Index + 3.380% 8.7093% 10/15/38 (c)(d)(f) | | 1,573,000 | 1,508,187 |
| Series 2021-MFP2 Class J, CME Term SOFR 1 Month Index + 4.020% 9.359% 11/15/36 (c)(d)(f) | | 1,000,000 | 977,718 |
| STWD Trust floater sequential payer Series 2021-LIH Class G, CME Term SOFR 1 Month Index + 4.310% 9.643% 11/15/36 (c)(d)(f) | | 1,280,000 | 1,245,935 |
| TPGI Trust floater Series 2021-DGWD Class G, CME Term SOFR 1 Month Index + 3.960% 9.2945% 6/15/26 (c)(d)(f) | | 940,800 | 935,257 |
| UBS Commercial Mortgage Trust Series 2012-C1: | | | |
| Class E, 5% 5/10/45 (c)(f) | | 926,620 | 859,010 |
| Class F, 5% 5/10/45 (b)(c)(f) | | 399,000 | 96,139 |
| UBS-BAMLL Trust Series 12-WRM Class D, 4.238% 6/10/30 (c)(f) | | 1,817,000 | 1,480,672 |
| Wells Fargo Commercial Mortgage Trust Series 2016-BNK1 Class D, 3% 8/15/49 (f) | | 1,260,000 | 540,558 |
| WF-RBS Commercial Mortgage Trust: | | | |
| sequential payer Series 2011-C4I Class G, 5% 6/15/44 (b)(c) | | 45,000 | 3,558 |
| Series 2011-C3 Class D, 5.8545% 3/15/44 (c)(f) | | 843,916 | 303,810 |
| Series 2013-C11 Class E, 4.0617% 3/15/45 (c)(f) | | 53,000 | 33,646 |
| Series 2013-C13 Class D, 4.0084% 5/15/45 (c)(f) | | 41,508 | 36,900 |
| WP Glimcher Mall Trust Series 2015-WPG: | | | |
| Class PR1, 3.516% 6/5/35 (c)(f) | | 1,168,000 | 964,007 |
| Class PR2, 3.516% 6/5/35 (c)(f) | | 459,000 | 368,655 |
| TOTAL COMMERCIAL MORTGAGE SECURITIES (Cost $67,304,456) | | | 50,017,090 |
| | | | |
| Bank Loan Obligations - 3.3% |
| | | Principal Amount (e) | Value ($) |
| FINANCIALS - 3.3% | | | |
| Financial Services - 3.3% | | | |
| Agellan Portfolio 9% 8/7/25 (b)(i) | | 1,217,000 | 1,217,000 |
| MHP Commercial Mortgage Trust U.S. Secured Overnight Fin. Rate (SOFR) Index + 5.000% 10.3288% 1/9/25 (b)(c)(d)(i) | | 7,110,539 | 6,861,664 |
| Sunbelt Mezz U.S. Secured Overnight Fin. Rate (SOFR) Index + 4.450% 9.9075% 1/21/27 (b)(c)(d)(i) | | 561,230 | 561,230 |
| | | | 8,639,894 |
| REAL ESTATE - 0.0% | | | |
| Real Estate Management & Development - 0.0% | | | |
| Cushman & Wakefield U.S. Borrower LLC Tranche B 1LN, term loan CME Term SOFR 1 Month Index + 3.750% 9.0937% 1/31/30 (c)(d)(i) | | 19,950 | 20,000 |
| TOTAL BANK LOAN OBLIGATIONS (Cost $8,907,815) | | | 8,659,894 |
| | | | |
| Preferred Securities - 1.2% |
| | | Principal Amount (e) | Value ($) |
| FINANCIALS - 1.2% | | | |
| Mortgage Real Estate Investment Trusts - 1.2% | | | |
| AGNC Investment Corp. CME Term SOFR 3 Month Index + 4.330% 0% 12/31/99 (c)(d) | | 65,750 | 1,651,640 |
| Chimera Investment Corp. Series B, CME Term SOFR 3 Month Index + 6.050% 11.3508% 12/31/99 (c)(d) | | 62,658 | 1,550,786 |
| TOTAL PREFERRED SECURITIES (Cost $2,733,468) | | | 3,202,426 |
| | | | |
| Money Market Funds - 2.2% |
| | | Shares | Value ($) |
Fidelity Cash Central Fund 5.39% (j) (Cost $5,849,693) | | 5,848,523 | 5,849,693 |
| | | | |
| TOTAL INVESTMENT IN SECURITIES - 99.5% (Cost $276,247,646) | 263,129,555 |
NET OTHER ASSETS (LIABILITIES) - 0.5% | 1,287,419 |
| NET ASSETS - 100.0% | 264,416,974 |
| | |
Legend
| (c) | Coupon rates for floating and adjustable rate securities reflect the rates in effect at period end. |
| (d) | Coupon is indexed to a floating interest rate which may be multiplied by a specified factor and/or subject to caps or floors. |
| (e) | Amount is stated in United States dollars unless otherwise noted. |
| (f) | Security exempt from registration under Rule 144A of the Securities Act of 1933. These securities may be resold in transactions exempt from registration, normally to qualified institutional buyers. At the end of the period, the value of these securities amounted to $67,228,950 or 25.4% of net assets. |
| (g) | Non-income producing - Security is in default. |
| (h) | Interest Only (IO) security represents the right to receive only monthly interest payments on an underlying pool of mortgages or assets. Principal shown is the outstanding par amount of the pool as of the end of the period. |
| (i) | Remaining maturities of bank loan obligations may be less than the stated maturities shown as a result of contractual or optional prepayments by the borrower. Such prepayments cannot be predicted with certainty. |
| (j) | Affiliated fund that is generally available only to investment companies and other accounts managed by Fidelity Investments. The rate quoted is the annualized seven-day yield of the fund at period end. A complete unaudited listing of the fund's holdings as of its most recent quarter end is available upon request. In addition, each Fidelity Central Fund's financial statements, which are not covered by the Fund's Report of Independent Registered Public Accounting Firm, are available on the SEC's website or upon request. |
Affiliated Central Funds
Fiscal year to date information regarding the Fund's investments in Fidelity Central Funds, including the ownership percentage, is presented below.
| Affiliate | Value, beginning of period ($) | Purchases ($) | Sales Proceeds ($) | Dividend Income ($) | Realized Gain (loss) ($) | Change in Unrealized appreciation (depreciation) ($) | Value, end of period ($) | % ownership, end of period |
| Fidelity Cash Central Fund 5.39% | 42,034,884 | 103,738,284 | 139,923,242 | 722,129 | (233) | - | 5,849,693 | 0.0% |
| Fidelity Securities Lending Cash Central Fund 5.39% | 37,700 | 2,904 | 40,604 | 2,654 | - | - | - | 0.0% |
| Total | 42,072,584 | 103,741,188 | 139,963,846 | 724,783 | (233) | - | 5,849,693 | |
| | | | | | | | | |
Amounts in the dividend income column in the above table include any capital gain distributions from underlying funds, which are presented in the corresponding line item in the Statement of Operations, if applicable.
Amounts in the dividend income column for Fidelity Securities Lending Cash Central Fund represents the income earned on investing cash collateral, less rebates paid to borrowers and any lending agent fees associated with the loan, plus any premium payments received for lending certain types of securities.
Amounts included in the purchases and sales proceeds columns may include in-kind transactions, if applicable.
Investment Valuation
The following is a summary of the inputs used, as of July 31, 2024, involving the Fund's assets and liabilities carried at fair value. The inputs or methodology used for valuing securities may not be an indication of the risk associated with investing in those securities. For more information on valuation inputs, and their aggregation into the levels used below, please refer to the Investment Valuation section in the accompanying Notes to Financial Statements.
| Valuation Inputs at Reporting Date: |
| Description | Total ($) | Level 1 ($) | Level 2 ($) | Level 3 ($) |
Investments in Securities: | | | | |
|
| Equities: | | | | |
Energy | 770,084 | 770,084 | - | - |
Financials | 22,449,538 | 22,449,538 | - | - |
Real Estate | 38,118,479 | 35,023,614 | 3,094,865 | - |
|
| Corporate Bonds | 132,087,342 | - | 132,087,342 | - |
|
| Asset-Backed Securities | 1,975,009 | - | 1,975,000 | 9 |
|
| Commercial Mortgage Securities | 50,017,090 | - | 47,161,397 | 2,855,693 |
|
| Bank Loan Obligations | 8,659,894 | - | 20,000 | 8,639,894 |
|
| Preferred Securities | 3,202,426 | 3,202,426 | - | - |
|
| Money Market Funds | 5,849,693 | 5,849,693 | - | - |
| Total Investments in Securities: | 263,129,555 | 67,295,355 | 184,338,604 | 11,495,596 |
The following is a reconciliation of Investments in Securities for which Level 3 inputs were used in determining value:
| |
| Investments in Securities: | |
| Bank Loan Obligations | | | |
| Beginning Balance | $ | 15,802,706 | |
| Net Realized Gain (Loss) on Investment Securities | | (5,300,916) | |
| Net Unrealized Gain (Loss) on Investment Securities | | 2,620,342 | |
| Cost of Purchases | | - | |
| Proceeds of Sales | | (4,482,732) | |
| Amortization/Accretion | | 494 | |
| Transfers into Level 3 | | - | |
| Transfers out of Level 3 | | - | |
| Ending Balance | $ | 8,639,894 | |
| The change in unrealized gain (loss) for the period attributable to Level 3 securities held at July 31, 2024 | $ | 286,134 | |
| Commercial Mortgage Securities | | | |
| Beginning Balance | $ | 5,638,573 | |
| Net Realized Gain (Loss) on Investment Securities | | - | |
| Net Unrealized Gain (Loss) on Investment Securities | | (10,729) | |
| Cost of Purchases | | - | |
| Proceeds of Sales | | - | |
| Amortization/Accretion | | (145,059) | |
| Transfers into Level 3 | | 2,232,772 | |
| Transfers out of Level 3 | | (4,859,864) | |
| Ending Balance | $ | 2,855,693 | |
| The change in unrealized gain (loss) for the period attributable to Level 3 securities held at July 31, 2024 | $ | (10,729) | |
| Other Investments in Securities | | | |
| Beginning Balance | $ | 2,440 | |
| Net Realized Gain (Loss) on Investment Securities | | - | |
| Net Unrealized Gain (Loss) on Investment Securities | | 216 | |
| Cost of Purchases | | - | |
| Proceeds of Sales | | (2,647) | |
| Amortization/Accretion | | - | |
| Transfers into Level 3 | | - | |
| Transfers out of Level 3 | | - | |
| Ending Balance | $ | 9 | |
| The change in unrealized gain (loss) for the period attributable to Level 3 securities held at July 31, 2024 | $ | 216 | |
| The information used in the above reconciliation represents fiscal year to date activity for any Investments in Securities identified as using Level 3 inputs at either the beginning or the end of the current fiscal period. Cost of purchases and proceeds of sales may include securities received and/or delivered through in-kind transactions, corporate actions or exchanges. Transfers into Level 3 were attributable to a lack of observable market data resulting from decreases in market activity, decreases in liquidity, security restructurings or corporate actions. Transfers out of Level 3 were attributable to observable market data becoming available for those securities. Transfers in or out of Level 3 represent the beginning value of any Security or Instrument where a change in the pricing level occurred from the beginning to the end of the period. Realized and unrealized gains (losses) disclosed in the reconciliation are included in Net Gain (Loss) on the Fund's Statement of Operations. | |
Financial Statements
| Statement of Assets and Liabilities |
As of July 31, 2024 |
| Assets | | | | |
| Investment in securities, at value - See accompanying schedule: | | | | |
Unaffiliated issuers (cost $270,397,953) | $ | 257,279,862 | | |
Fidelity Central Funds (cost $5,849,693) | | 5,849,693 | | |
| | | | | |
| | | | | |
| Total Investment in Securities (cost $276,247,646) | | | $ | 263,129,555 |
| Receivable for investments sold | | | | 6,174 |
| Receivable for fund shares sold | | | | 35,607 |
| Dividends receivable | | | | 135,159 |
| Interest receivable | | | | 2,173,631 |
| Distributions receivable from Fidelity Central Funds | | | | 29,716 |
Total assets | | | | 265,509,842 |
| Liabilities | | | | |
| Payable for investments purchased | $ | 991,385 | | |
| Payable for fund shares redeemed | | 99,172 | | |
| Other payables and accrued expenses | | 2,311 | | |
| Total liabilities | | | | 1,092,868 |
| Net Assets | | | $ | 264,416,974 |
| Net Assets consist of: | | | | |
| Paid in capital | | | $ | 298,105,543 |
| Total accumulated earnings (loss) | | | | (33,688,569) |
| Net Assets | | | $ | 264,416,974 |
Net Asset Value, offering price and redemption price per share ($264,416,974 ÷ 26,780,098 shares) | | | $ | 9.87 |
| Statement of Operations |
| Year ended July 31, 2024 |
| Investment Income | | | | |
| Dividends | | | $ | 4,582,207 |
| Interest | | | | 10,981,429 |
| Income from Fidelity Central Funds (including $2,654 from security lending) | | | | 724,783 |
| Total income | | | | 16,288,419 |
| Expenses | | | | |
| Custodian fees and expenses | $ | 6,823 | | |
| Independent trustees' fees and expenses | | 1,346 | | |
| Legal | | 2,970 | | |
| Miscellaneous | | 79 | | |
| Total expenses before reductions | | 11,218 | | |
| Expense reductions | | (6,006) | | |
| Total expenses after reductions | | | | 5,212 |
| Net Investment income (loss) | | | | 16,283,207 |
| Realized and Unrealized Gain (Loss) | | | | |
| Net realized gain (loss) on: | | | | |
| Investment Securities: | | | | |
| Unaffiliated issuers | | (12,739,704) | | |
| Fidelity Central Funds | | (233) | | |
| Foreign currency transactions | | 7 | | |
| Total net realized gain (loss) | | | | (12,739,930) |
| Change in net unrealized appreciation (depreciation) on investment securities | | | | 18,082,600 |
| Net gain (loss) | | | | 5,342,670 |
| Net increase (decrease) in net assets resulting from operations | | | $ | 21,625,877 |
| Statement of Changes in Net Assets |
| |
| | Year ended July 31, 2024 | | Year ended July 31, 2023 |
| Increase (Decrease) in Net Assets | | | | |
| Operations | | | | |
| Net investment income (loss) | $ | 16,283,207 | $ | 28,327,877 |
| Net realized gain (loss) | | (12,739,930) | | (8,060,362) |
| Change in net unrealized appreciation (depreciation) | | 18,082,600 | | (34,702,246) |
| Net increase (decrease) in net assets resulting from operations | | 21,625,877 | | (14,434,731) |
| Distributions to shareholders | | (17,807,958) | | (51,835,383) |
| | | | | |
| Share transactions | | | | |
| Proceeds from sales of shares | | 31,935,725 | | 74,079,738 |
| Reinvestment of distributions | | 17,807,958 | | 51,835,383 |
| Cost of shares redeemed | | (127,111,138) | | (403,320,263) |
| | | | | |
Net increase (decrease) in net assets resulting from share transactions | | (77,367,455) | | (277,405,142) |
| Total increase (decrease) in net assets | | (73,549,536) | | (343,675,256) |
| | | | | |
| Net Assets | | | | |
| Beginning of period | | 337,966,510 | | 681,641,766 |
| End of period | $ | 264,416,974 | $ | 337,966,510 |
| | | | | |
| Other Information | | | | |
| Shares | | | | |
| Sold | | 3,337,469 | | 7,587,930 |
| Issued in reinvestment of distributions | | 1,889,282 | | 5,277,000 |
| Redeemed | | (13,304,256) | | (41,469,063) |
| Net increase (decrease) | | (8,077,505) | | (28,604,133) |
| | | | | |
Financial Highlights
Fidelity® Series Real Estate Income Fund |
| |
| Years ended July 31, | | 2024 | | 2023 | | 2022 | | 2021 | | 2020 |
Selected Per-Share Data | | | | | | | | | | |
| Net asset value, beginning of period | $ | 9.70 | $ | 10.74 | $ | 11.77 | $ | 9.94 | $ | 11.21 |
| Income from Investment Operations | | | | | | | | | | |
Net investment income (loss) A,B | | .60 | | .60 | | .55 | | .45 | | .56 |
| Net realized and unrealized gain (loss) | | .24 | | (.64) | | (.97) | | 1.90 | | (1.16) |
| Total from investment operations | | .84 | | (.04) | | (.42) | | 2.35 | | (.60) |
| Distributions from net investment income | | (.67) | | (.68) | | (.52) | | (.45) | | (.55) |
| Distributions from net realized gain | | - | | (.32) | | (.09) | | (.07) | | (.12) |
| Total distributions | | (.67) | | (1.00) | | (.61) | | (.52) | | (.67) |
| Net asset value, end of period | $ | 9.87 | $ | 9.70 | $ | 10.74 | $ | 11.77 | $ | 9.94 |
Total Return C | | | | (.13)% | | (3.78)% | | 24.48% | | (5.68)% |
Ratios to Average Net Assets B,D,E | | | | | | | | | | |
Expenses before reductions F | | -% | | -% | | -% | | -% | | -% |
Expenses net of fee waivers, if any F | | | | -% | | -% | | -% | | -% |
Expenses net of all reductions F | | -% | | -% | | -% | | -% | | -% |
| Net investment income (loss) | | 6.27% | | 6.13% | | 4.83% | | 4.21% | | 5.36% |
| Supplemental Data | | | | | | | | | | |
| Net assets, end of period (000 omitted) | $ | 264,417 | $ | 337,967 | $ | 681,642 | $ | 1,047,202 | $ | 935,054 |
Portfolio turnover rate G | | | | 5% | | 19% | | 23% | | 25% H |
ACalculated based on average shares outstanding during the period.
BNet investment income (loss) is affected by the timing of the declaration of dividends by any underlying mutual funds or exchange-traded funds (ETFs). Net investment income (loss) of any mutual funds or ETFs is not included in the Fund's net investment income (loss) ratio.
CTotal returns would have been lower if certain expenses had not been reduced during the applicable periods shown.
DFees and expenses of any underlying mutual funds or exchange-traded funds (ETFs) are not included in the Fund's expense ratio. The Fund indirectly bears its proportionate share of these expenses. For additional expense information related to investments in Fidelity Central Funds, please refer to the "Investments in Fidelity Central Funds" note found in the Notes to Financial Statements section of the most recent Annual or Semi-Annual report.
EExpense ratios reflect operating expenses of the class. Expenses before reductions do not reflect amounts reimbursed, waived, or reduced through arrangements with the investment adviser, brokerage services, or other offset arrangements, if applicable, and do not represent the amount paid by the class during periods when reimbursements, waivers or reductions occur.
FAmount represents less than .005%.
GAmount does not include the portfolio activity of any underlying mutual funds or exchange-traded funds (ETFs).
HPortfolio turnover rate excludes securities received or delivered in-kind.
Notes to Financial Statements
For the period ended July 31, 2024
1. Organization.
Fidelity Series Real Estate Income Fund (the Fund) is a fund of Fidelity Securities Fund (the Trust) and is authorized to issue an unlimited number of shares. Shares are offered only to certain other Fidelity funds, Fidelity managed 529 plans, and Fidelity managed collective investment trusts. The Trust is registered under the Investment Company Act of 1940, as amended (the 1940 Act), as an open-end management investment company organized as a Massachusetts business trust.
2. Investments in Fidelity Central Funds.
Funds may invest in Fidelity Central Funds, which are open-end investment companies generally available only to other investment companies and accounts managed by the investment adviser and its affiliates. The Schedule of Investments lists any Fidelity Central Funds held as an investment as of period end, but does not include the underlying holdings of each Fidelity Central Fund. An investing fund indirectly bears its proportionate share of the expenses of the underlying Fidelity Central Funds.
Based on its investment objective, each Fidelity Central Fund may invest or participate in various investment vehicles or strategies that are similar to those of the investing fund. These strategies are consistent with the investment objectives of the investing fund and may involve certain economic risks which may cause a decline in value of each of the Fidelity Central Funds and thus a decline in the value of the investing fund.
| Fidelity Central Fund | Investment Manager | Investment Objective | Investment Practices | Expense RatioA |
| Fidelity Money Market Central Funds | Fidelity Management & Research Company LLC (FMR) | Each fund seeks to obtain a high level of current income consistent with the preservation of capital and liquidity. | Short-term Investments | Less than .005% |
A Expenses expressed as a percentage of average net assets and are as of each underlying Central Fund's most recent annual or semi-annual shareholder report.
A complete unaudited list of holdings for each Fidelity Central Fund is available upon request or at the Securities and Exchange Commission website at www.sec.gov. In addition, the financial statements of the Fidelity Central Funds which contain the significant accounting policies (including investment valuation policies) of those funds, and are not covered by the Report of Independent Registered Public Accounting Firm, are available on the Securities and Exchange Commission website or upon request.
3. Significant Accounting Policies.
The Fund is an investment company and applies the accounting and reporting guidance of the Financial Accounting Standards Board (FASB) Accounting Standards Codification Topic 946 Financial Services - Investment Companies. The financial statements have been prepared in conformity with accounting principles generally accepted in the United States of America (GAAP), which require management to make certain estimates and assumptions at the date of the financial statements. Actual results could differ from those estimates. Subsequent events, if any, through the date that the financial statements were issued have been evaluated in the preparation of the financial statements. The Fund's Schedule of Investments lists any underlying mutual funds or exchange-traded funds (ETFs) but does not include the underlying holdings of these funds. The following summarizes the significant accounting policies of the Fund:
Investment Valuation. Investments are valued as of 4:00 p.m. Eastern time on the last calendar day of the period. The Board of Trustees (the Board) has designated the Fund's investment adviser as the valuation designee responsible for the fair valuation function and performing fair value determinations as needed. The investment adviser has established a Fair Value Committee (the Committee) to carry out the day-to-day fair valuation responsibilities and has adopted policies and procedures to govern the fair valuation process and the activities of the Committee. In accordance with these fair valuation policies and procedures, which have been approved by the Board, the Fund attempts to obtain prices from one or more third party pricing services or brokers to value its investments. When current market prices, quotations or currency exchange rates are not readily available or reliable, investments will be fair valued in good faith by the Committee, in accordance with the policies and procedures. Factors used in determining fair value vary by investment type and may include market or investment specific events, transaction data, estimated cash flows, and market observations of comparable investments. The frequency that the fair valuation procedures are used cannot be predicted and they may be utilized to a significant extent. The Committee manages the Fund's fair valuation practices and maintains the fair valuation policies and procedures. The Fund's investment adviser reports to the Board information regarding the fair valuation process and related material matters.
The Fund categorizes the inputs to valuation techniques used to value its investments into a disclosure hierarchy consisting of three levels as shown below:
Level 1 - unadjusted quoted prices in active markets for identical investments
Level 2 - other significant observable inputs (including quoted prices for similar investments, interest rates, prepayment speeds, etc.)
Level 3 - unobservable inputs (including the Fund's own assumptions based on the best information available)
Valuation techniques used to value the Fund's investments by major category are as follows:
Equity securities, including restricted securities, for which market quotations are readily available, are valued at the last reported sale price or official closing price as reported by a third party pricing service on the primary market or exchange on which they are traded and are categorized as Level 1 in the hierarchy. In the event there were no sales during the day or closing prices are not available, securities are valued at the last quoted bid price or may be valued using the last available price and are generally categorized as Level 2 in the hierarchy. For foreign equity securities, when market or security specific events arise, comparisons to the valuation of American Depositary Receipts (ADRs), futures contracts, Exchange-Traded Funds (ETFs) and certain indexes as well as quoted prices for similar securities may be used and would be categorized as Level 2 in the hierarchy. For equity securities, including restricted securities, where observable inputs are limited, assumptions about market activity and risk are used and these securities may be categorized as Level 3 in the hierarchy. Securities, including private placements or other restricted securities, for which observable inputs are not available are valued using alternate valuation approaches, including the market approach, the income approach and cost approach, and are categorized as Level 3 in the hierarchy. The market approach considers factors including the price of recent investments in the same or a similar security or financial metrics of comparable securities. The income approach considers factors including expected future cash flows, security specific risks and corresponding discount rates. The cost approach considers factors including the value of the security's underlying assets and liabilities.
Debt securities, including restricted securities, are valued based on evaluated prices received from third party pricing services or from brokers who make markets in such securities. Corporate bonds, preferred securities and bank loan obligations are valued by pricing services who utilize matrix pricing which considers yield or price of bonds of comparable quality, coupon, maturity and type or by broker-supplied prices. Asset backed securities and commercial mortgage securities are valued by pricing services who utilize matrix pricing which considers prepayment speed assumptions, attributes of the collateral, yield or price of bonds of comparable quality, coupon, maturity and type or by broker-supplied prices. When independent prices are unavailable or unreliable, debt securities may be valued utilizing pricing methodologies which consider similar factors that would be used by third party pricing services. Debt securities are generally categorized as Level 2 in the hierarchy but may be Level 3 depending on the circumstances. The Fund invests a significant portion of its assets in below investment grade securities. The value of these securities can be more volatile due to changes in the credit quality of the issuer and is sensitive to changes in economic, market and regulatory conditions.
Investments in open-end mutual funds, including the Fidelity Central Funds, are valued at their closing net asset value (NAV) each business day and are categorized as Level 1 in the hierarchy.
The following provides information on Level 3 securities held by the Fund that were valued at period end based on unobservable inputs. These amounts exclude valuations provided by a broker.
| Asset Type | Fair Value | Valuation Technique(s) | Unobservable Input | Amount or Range/Weighted Average | Impact to Valuation from an Increase in InputA |
| Equities | $- | Recovery value | Recovery value | $0.00 | Increase |
| Corporate Bonds | $- | Recovery value | Recovery value | $0.00 | Increase |
| Bank Loan Obligations | $8,639,894 | Discounted cash flow | Yield | 9.1% - 11.4% / 11.0% | Decrease |
| Commercial Mortgage Securities | $2,855,693 | Indicative market price | Evaluated bid | $0.24 - $80.50 / $65.32 | Increase |
| Asset-Backed Securities | $9 | Indicative market price | Evaluated bid | $0.00 | Increase |
A Represents the directional change in the fair value of the Level 3 investments that could have resulted from an increase in the corresponding input as of period end. A decrease to the unobservable input would have had the opposite effect. Significant changes in these inputs may have resulted in a significantly higher or lower fair value measurement at period end.
Changes in valuation techniques may result in transfers in or out of an assigned level within the disclosure hierarchy. The aggregate value of investments by input level as of July 31, 2024, as well as a roll forward of Level 3 investments, is included at the end of the Fund's Schedule of Investments.
Foreign Currency. Certain Funds may use foreign currency contracts to facilitate transactions in foreign-denominated securities. Gains and losses from these transactions may arise from changes in the value of the foreign currency or if the counterparties do not perform under the contracts' terms.
Foreign-denominated assets, including investment securities, and liabilities are translated into U.S. dollars at the exchange rates at period end. Purchases and sales of investment securities, income and dividends received, and expenses denominated in foreign currencies are translated into U.S. dollars at the exchange rate in effect on the transaction date.
The effects of exchange rate fluctuations on investments are included with the net realized and unrealized gain (loss) on investment securities. Other foreign currency transactions resulting in realized and unrealized gain (loss) are disclosed separately.
Investment Transactions and Income. For financial reporting purposes, the Fund's investment holdings and NAV include trades executed through the end of the last business day of the period. The NAV per share for processing shareholder transactions is calculated as of the close of business of the New York Stock Exchange (NYSE), normally 4:00 p.m. Eastern time and includes trades executed through the end of the prior business day. Gains and losses on securities sold are determined on the basis of identified cost and include proceeds received from litigation. Commissions paid to certain brokers with whom the investment adviser, or its affiliates, places trades on behalf of a fund include an amount in addition to trade execution, which may be rebated back to a fund. Any such rebates are included in net realized gain (loss) on investments in the Statement of Operations. Dividend income is recorded on the ex-dividend date, except for certain dividends from foreign securities where the ex-dividend date may have passed, which are recorded as soon as the Fund is informed of the ex-dividend date. Non-cash dividends included in dividend income, if any, are recorded at the fair market value of the securities received. Income and capital gain distributions from Fidelity Central Funds, if any, are recorded on the ex-dividend date. Certain distributions received by the Fund represent a return of capital or capital gain. The Fund determines the components of these distributions subsequent to the ex-dividend date, based upon receipt of tax filings or other correspondence relating to the underlying investment. These distributions are recorded as a reduction of cost of investments and/or as a realized gain. Interest income is accrued as earned and includes coupon interest and amortization of premium and accretion of discount on debt securities as applicable. Investment income is recorded net of foreign taxes withheld where recovery of such taxes is uncertain. Debt obligations may be placed on non-accrual status and related interest income may be reduced by ceasing current accruals and writing off interest receivables when the collection of all or a portion of interest has become doubtful based on consistently applied procedures. A debt obligation is removed from non-accrual status when the issuer resumes interest payments or when collectability of interest is reasonably assured. Funds may file withholding tax reclaims in certain jurisdictions to recover a portion of amounts previously withheld. Any withholding tax reclaims income is included in the Statement of Operations in dividends. Any receivables for withholding tax reclaims are included in the Statement of Assets and Liabilities in dividends receivable.
Expenses. Expenses directly attributable to a fund are charged to that fund. Expenses attributable to more than one fund are allocated among the respective funds on the basis of relative net assets or other appropriate methods. Expenses included in the accompanying financial statements reflect the expenses of that fund and do not include any expenses associated with any underlying mutual funds or exchange-traded funds. Although not included in a fund's expenses, a fund indirectly bears its proportionate share of these expenses through the net asset value of each underlying mutual fund or exchange-traded fund. Expense estimates are accrued in the period to which they relate and adjustments are made when actual amounts are known.
Income Tax Information and Distributions to Shareholders. Each year, the Fund intends to qualify as a regulated investment company under Subchapter M of the Internal Revenue Code, including distributing substantially all of its taxable income and realized gains. As a result, no provision for U.S. Federal income taxes is required. As of July 31, 2024, the Fund did not have any unrecognized tax benefits in the financial statements; nor is the Fund aware of any tax positions for which it is reasonably possible that the total amounts of unrecognized tax benefits will significantly change in the next twelve months. The Fund files a U.S. federal tax return, in addition to state and local tax returns as required. The Fund's federal income tax returns are subject to examination by the Internal Revenue Service (IRS) for a period of three fiscal years after they are filed. State and local tax returns may be subject to examination for an additional fiscal year depending on the jurisdiction. Foreign taxes are provided for based on the Fund's understanding of the tax rules and rates that exist in the foreign markets in which it invests.
Distributions are declared and recorded on the ex-dividend date. Income and capital gain distributions are determined in accordance with income tax regulations, which may differ from GAAP.
Capital accounts within the financial statements are adjusted for permanent book-tax differences. These adjustments have no impact on net assets or the results of operations. Capital accounts are not adjusted for temporary book-tax differences which will reverse in a subsequent period.
Book-tax differences are primarily due to foreign currency transactions, certain conversion ratio adjustments, equity-debt classifications, partnerships, capital loss carryforwards, and losses deferred due to wash sales.
As of period end, the cost and unrealized appreciation (depreciation) in securities, and derivatives if applicable, for federal income tax purposes were as follows:
| Gross unrealized appreciation | $11,440,644 |
| Gross unrealized depreciation | (25,996,283) |
| Net unrealized appreciation (depreciation) | $(14,555,639) |
| Tax Cost | $277,685,194 |
The tax-based components of distributable earnings as of period end were as follows:
| Undistributed ordinary income | $2,896,409 |
| Capital loss carryforward | $(22,029,339) |
| Net unrealized appreciation (depreciation) on securities and other investments | $(14,555,639) |
Capital loss carryforwards are only available to offset future capital gains of the Fund to the extent provided by regulations and may be limited. The capital loss carryforward
information presented below, including any applicable limitation, is estimated as of fiscal period end and is subject to adjustment.
Short-term | $(2,109,914) |
Long-term | (19,919,425) |
| Total capital loss carryforward | $(22,029,339) |
The tax character of distributions paid was as follows:
| | July 31, 2024 | July 31, 2023 |
| Ordinary Income | $17,807,958 | $ 33,013,495 |
| Long-term Capital Gains | - | 18,821,888 |
| Total | $17,807,958 | $ 51,835,383 |
Restricted Securities (including Private Placements). Funds may invest in securities that are subject to legal or contractual restrictions on resale. These securities generally may be resold in transactions exempt from registration or to the public if the securities are registered. Disposal of these securities may involve time-consuming negotiations and expense, and prompt sale at an acceptable price may be difficult. Information regarding restricted securities held at period end is included at the end of the Schedule of Investments, if applicable.
Loans and Other Direct Debt Instruments. Direct debt instruments are interests in amounts owed to lenders by corporate or other borrowers. These instruments may be in the form of loans, trade claims or other receivables and may include standby financing commitments such as revolving credit facilities that obligate a fund to supply additional cash to the borrower on demand. Loans may be acquired through assignment, participation, or may be made directly to a borrower. Such instruments are presented in the Bank Loan Obligations section in the Schedule of Investments. Certain funds may also invest in unfunded loan commitments, which are contractual obligations for future funding. Information regarding unfunded commitments is included at the end of the Schedule of Investments, if applicable.
4. Purchases and Sales of Investments.
Purchases and sales of securities, other than short-term securities and in-kind transactions, as applicable, are noted in the table below.
| | Purchases ($) | Sales ($) |
| Fidelity Series Real Estate Income Fund | 90,001,475 | 115,964,438 |
5. Fees and Other Transactions with Affiliates.
Management Fee. Fidelity Management & Research Company LLC (the investment adviser) and its affiliates provide the Fund with investment management related services for which the Fund does not pay a management fee. Under the management contract, the investment adviser or an affiliate pays all ordinary operating expenses of the Fund, except custody fees, fees and expenses of the independent Trustees, and certain miscellaneous expenses such as proxy and shareholder meeting expenses.
Brokerage Commissions. A portion of portfolio transactions were placed with brokerage firms which are affiliates of the investment adviser. Brokerage commissions are included in net realized gain (loss) and change in net unrealized appreciation (depreciation) in the Statement of Operations. The commissions paid to these affiliated firms were as follows:
| | Amount ($) |
| Fidelity Series Real Estate Income Fund | 2,076 |
Interfund Trades. Funds may purchase from or sell securities to other Fidelity Funds under procedures adopted by the Board. The procedures have been designed to ensure these interfund trades are executed in accordance with Rule 17a-7 of the 1940 Act. Any interfund trades are included within the respective purchases and sales amounts shown in the Purchases and Sales of Investments note. During the period, there were no interfund trades.
Other. During the period, the investment adviser reimbursed the Fund for certain losses as follows:
| | Amount ($) |
| Fidelity Series Real Estate Income Fund | 2,900 |
Sub-Advisory Arrangements. Effective March 1, 2024, the Fund's sub-advisory agreements with FMR Investment Management (UK) Limited, Fidelity Management & Research (Hong Kong) Limited, and Fidelity Management & Research (Japan) Limited were amended to provide that the investment adviser pays each sub-adviser monthly fees equal to 110% of the sub-adviser's costs for providing sub-advisory services.
6. Committed Line of Credit.
Certain Funds participate with other funds managed by the investment adviser or an affiliate in a $4.25 billion credit facility (the "line of credit") to be utilized for temporary or emergency purposes to fund shareholder redemptions or for other short-term liquidity purposes. The commitment fees on the pro-rata portion of the line of credit are borne by the investment adviser. During the period, there were no borrowings on this line of credit.
7. Security Lending.
Funds lend portfolio securities from time to time in order to earn additional income. Lending agents are used, including National Financial Services (NFS), an affiliate of the investment adviser. Pursuant to a securities lending agreement, NFS will receive a fee, which is capped at 9.9% of a fund's daily lending revenue, for its services as lending agent. A fund may lend securities to certain qualified borrowers, including NFS. On the settlement date of the loan, a fund receives collateral (in the form of U.S. Treasury obligations, letters of credit and/or cash) against the loaned securities and maintains collateral in an amount not less than 100% of the market value of the loaned securities during the period of the loan. The market value of the loaned securities is determined at the close of business of a fund and any additional required collateral is delivered to a fund on the next business day. A fund or borrower may terminate the loan at any time, and if the borrower defaults on its obligation to return the securities loaned because of insolvency or other reasons, a fund may apply collateral received from the borrower against the obligation. A fund may experience delays and costs in recovering the securities loaned. Any cash collateral received is invested in the Fidelity Securities Lending Cash Central Fund. Any loaned securities are identified as such in the Schedule of Investments, and the value of loaned securities and cash collateral at period end, as applicable, are presented in the Statement of Assets and Liabilities. Security lending income represents the income earned on investing cash collateral, less rebates paid to borrowers and any lending agent fees associated with the loan, plus any premium payments received for lending certain types of securities. Security lending income is presented in the Statement of Operations as a component of income from Fidelity Central Funds. Affiliated security lending activity, if any, was as follows:
| | Total Security Lending Fees Paid to NFS ($) | Security Lending Income From Securities Loaned to NFS ($) | Value of Securities Loaned to NFS at Period End ($) |
| Fidelity Series Real Estate Income Fund | 272 | - | - |
8. Expense Reductions.
The investment adviser contractually agreed to reimburse the Fund to the extent annual operating expenses exceeded .003% of average net assets. This reimbursement will remain in place through November 30, 2027. Some expenses, for example the compensation of the independent Trustees, and certain other expenses such as interest expense, are excluded from this reimbursement. During the period this reimbursement reduced the Fund's expenses by $2,078.
Through arrangements with the Fund's custodian, credits realized as a result of certain uninvested cash balances were used to reduce the Fund's expenses by $3,928.
9. Other.
A fund's organizational documents provide former and current trustees and officers with a limited indemnification against liabilities arising in connection with the performance of their duties to the fund. In the normal course of business, a fund may also enter into contracts that provide general indemnifications. A fund's maximum exposure under these arrangements is unknown as this would be dependent on future claims that may be made against a fund. The risk of material loss from such claims is considered remote.
At the end of the period, mutual funds and accounts managed by the investment adviser or its affiliates were the owners of record of all of the outstanding shares of the Fund.
10. Risk and Uncertainties.
Many factors affect a fund's performance. Developments that disrupt global economies and financial markets, such as pandemics, epidemics, outbreaks of infectious diseases, war, terrorism, and environmental disasters, may significantly affect a fund's investment performance. The effects of these developments to a fund will be impacted by the types of securities in which a fund invests, the financial condition, industry, economic sector, and geographic location of an issuer, and a fund's level of investment in the securities of that issuer. Significant concentrations in security types, issuers, industries, sectors, and geographic locations may magnify the factors that affect a fund's performance.
Report of Independent Registered Public Accounting Firm
To the Board of Trustees of Fidelity Securities Fund and the Shareholders of Fidelity Series Real Estate Income Fund:
Opinion on the Financial Statements and Financial Highlights
We have audited the accompanying statement of assets and liabilities of Fidelity Series Real Estate Income Fund (the "Fund"), a fund of Fidelity Securities Fund, including the schedule of investments, as of July 31, 2024, the related statement of operations for the year then ended, the statement of changes in net assets for each of the two years in the period then ended, the financial highlights for each of the five years in the period then ended, and the related notes. In our opinion, the financial statements and financial highlights present fairly, in all material respects, the financial position of the Fund as of July 31, 2024, and the results of its operations for the year then ended, the changes in its net assets for each of the two years in the period then ended, and the financial highlights for each of the five years in the period then ended in conformity with accounting principles generally accepted in the United States of America.
Basis for Opinion
These financial statements and financial highlights are the responsibility of the Fund's management. Our responsibility is to express an opinion on the Fund's financial statements and financial highlights based on our audits. We are a public accounting firm registered with the Public Company Accounting Oversight Board (United States) (PCAOB) and are required to be independent with respect to the Fund in accordance with the U.S. federal securities laws and the applicable rules and regulations of the Securities and Exchange Commission and the PCAOB.
We conducted our audits in accordance with the standards of the PCAOB. Those standards require that we plan and perform the audit to obtain reasonable assurance about whether the financial statements and financial highlights are free of material misstatement, whether due to error or fraud. The Fund is not required to have, nor were we engaged to perform, an audit of its internal control over financial reporting. As part of our audits, we are required to obtain an understanding of internal control over financial reporting but not for the purpose of expressing an opinion on the effectiveness of the Fund's internal control over financial reporting. Accordingly, we express no such opinion.
Our audits included performing procedures to assess the risks of material misstatement of the financial statements and financial highlights, whether due to error or fraud, and performing procedures that respond to those risks. Such procedures included examining, on a test basis, evidence regarding the amounts and disclosures in the financial statements and financial highlights. Our audits also included evaluating the accounting principles used and significant estimates made by management, as well as evaluating the overall presentation of the financial statements and financial highlights. Our procedures included confirmation of securities owned as of July 31, 2024, by correspondence with the custodian, brokers, and agent banks; when replies were not received from brokers or agent banks, we performed other auditing procedures. We believe that our audits provide a reasonable basis for our opinion.
/s/ Deloitte & Touche LLP
Boston, Massachusetts
September 16, 2024
We have served as the auditor of one or more of the Fidelity investment companies since 1999.
Distributions
(Unaudited)
The dividend and capital gains distributions for the fund(s) are available on Fidelity.com or Institutional.Fidelity.com.
A total of 0.62% of the dividends distributed during the fiscal year was derived from interest on U.S. Government securities which is generally exempt from state income tax.
The fund designates $10,917,544 of distributions paid during the fiscal year ended 2024 as qualifying to be taxed as section 163(j) interest dividends.
The fund designates 2% of the dividend distributed during the fiscal year as qualifying for the dividends-received deduction for corporate shareholders.
The fund designates 0.39% and 2.41% of the dividends distributed in September and December, respectively during the fiscal year as amounts which may be taken into account as a dividend for the purposes of the maximum rate under section 1(h)(11) of the Internal Revenue Code.
The fund designates 60.51%, 60.51%, 3.71%, and 23.35% of the dividends distributed in March, June, September, and December, respectively during the fiscal year as a section 199A dividend.
The fund will notify shareholders in January 2025 of amounts for use in preparing 2024 income tax returns.
Item 8: Changes in and Disagreements with Accountants for Open-End Management Investment Companies
Note: This is not applicable for any fund included in this document.
Item 9: Proxy Disclosures for Open-End Management Investment Companies
| A special meeting of shareholders was held on July 16, 2024. The results of votes taken among shareholders on the proposal before them are reported below. Each vote reported represents one dollar of net asset value held on the record date for the meeting. |
| Proposal 1 |
| To elect a Board of Trustees. |
| | # of Votes | % of Votes |
| Bettina Doulton |
| Affirmative | 88,756,759,992.17 | 95.11 |
| Withheld | 4,564,750,651.52 | 4.89 |
| TOTAL | 93,321,510,643.68 | 100.00 |
| Robert A. Lawrence |
| Affirmative | 88,523,438,331.98 | 94.86 |
| Withheld | 4,798,072,311.70 | 5.14 |
| TOTAL | 93,321,510,643.68 | 100.00 |
| Vijay C. Advani |
| Affirmative | 88,484,371,668.51 | 94.82 |
| Withheld | 4,837,138,975.17 | 5.18 |
| TOTAL | 93,321,510,643.68 | 100.00 |
| Thomas P. Bostick |
| Affirmative | 88,618,596,648.21 | 94.96 |
| Withheld | 4,702,913,995.47 | 5.04 |
| TOTAL | 93,321,510,643.68 | 100.00 |
| Donald F. Donahue |
| Affirmative | 88,542,403,002.79 | 94.88 |
| Withheld | 4,779,107,640.89 | 5.12 |
| TOTAL | 93,321,510,643.68 | 100.00 |
| Vicki L. Fuller |
| Affirmative | 88,788,711,037.44 | 95.14 |
| Withheld | 4,532,799,606.24 | 4.86 |
| TOTAL | 93,321,510,643.68 | 100.00 |
| Patricia L. Kampling |
| Affirmative | 88,819,315,996.59 | 95.18 |
| Withheld | 4,502,194,647.10 | 4.82 |
| TOTAL | 93,321,510,643.68 | 100.00 |
| Thomas A. Kennedy |
| Affirmative | 88,667,457,817.34 | 95.01 |
| Withheld | 4,654,052,826.34 | 4.99 |
| TOTAL | 93,321,510,643.68 | 100.00 |
| Oscar Munoz |
| Affirmative | 88,183,976,568.30 | 94.49 |
| Withheld | 5,137,534,075.39 | 5.51 |
| TOTAL | 93,321,510,643.68 | 100.00 |
| Karen B. Peetz |
| Affirmative | 88,720,160,318.58 | 95.07 |
| Withheld | 4,601,350,325.11 | 4.93 |
| TOTAL | 93,321,510,643.68 | 100.00 |
| David M. Thomas |
| Affirmative | 88,471,490,747.86 | 94.80 |
| Withheld | 4,850,019,895.82 | 5.20 |
| TOTAL | 93,321,510,643.68 | 100.00 |
| Susan Tomasky |
| Affirmative | 88,536,869,646.78 | 94.87 |
| Withheld | 4,784,640,996.90 | 5.13 |
| TOTAL | 93,321,510,643.68 | 100.00 |
| Michael E. Wiley |
| Affirmative | 88,526,906,267.86 | 94.86 |
| Withheld | 4,794,604,375.83 | 5.14 |
| TOTAL | 93,321,510,643.68 | 100.00 |
| | | |
| Proposal 1 reflects trust-wide proposal and voting results. |
Item 10: Remuneration Paid to Directors, Officers, and others of Open-End Management Investment Companies
Note: This information is disclosed as part of the financial statements for each Fund as part of Item 7: Financial Statements and Financial Highlights for Open-End Management Investment companies.
Item 11: Statement Regarding Basis for Approval of Investment Advisory Contract
Board Approval of Investment Advisory Contracts and Management Fees
Fidelity Series Real Estate Income Fund
Each year, the Board of Trustees, including the Independent Trustees (together, the Board), considers the renewal of the fund's management contract with Fidelity Management & Research Company LLC (FMR) and the sub-advisory agreements (together, the Advisory Contracts) for the fund. FMR and the sub-advisers are referred to herein as the Investment Advisers. The Board, assisted by the advice of fund counsel and Independent Trustees' counsel, requests and considers a broad range of information relevant to the renewal of the Advisory Contracts throughout the year.
The Board meets regularly and, at each of its meetings, covers an extensive agenda of topics and materials and considers factors that are relevant to its annual consideration of the renewal of the fund's Advisory Contracts, including the services and support provided to the fund and its shareholders. The Board, acting directly and through its Committees (each of which is composed of and chaired by Independent Trustees), requests and receives information concerning the annual consideration of the renewal of the fund's Advisory Contracts. The Board also meets as needed to review matters specifically related to the Board's annual consideration of the renewal of the Advisory Contracts. Members of the Board may also meet with trustees of other Fidelity funds through joint ad hoc committees to discuss certain matters relevant to all of the Fidelity funds.
At its May 2024 meeting, the Board unanimously determined to renew the fund's Advisory Contracts. The Board considered all factors it believed relevant and reached a determination, with the assistance of fund counsel and Independent Trustees' counsel and through the exercise of its business judgment, that the renewal of the Advisory Contracts was in the best interests of the fund and its shareholders and the fact that no fee is payable under the management contract was fair and reasonable in light of all of the surrounding circumstances.
Nature, Extent, and Quality of Services Provided. The Board considered staffing as it relates to the fund, including the backgrounds and experience of investment personnel of the Investment Advisers, and also considered the Investment Advisers' implementation of the fund's investment program. The Independent Trustees also had discussions with senior management of Fidelity's investment operations and investment groups. The Board considered the structure of the investment personnel compensation program and whether this structure provides appropriate incentives to act in the best interests of the fund.
Resources Dedicated to Investment Management and Support Services. The Board and the Fund Oversight and Research Committees reviewed the general qualifications and capabilities of Fidelity's investment staff, including its size, education, experience, and resources, as well as Fidelity's approach to recruiting, training, managing, and compensating investment personnel. The Board noted the resources devoted to expansion of Fidelity's global investment organization, and that Fidelity's analysts have extensive resources, tools, and capabilities that allow them to conduct sophisticated quantitative and fundamental analysis, as well as credit analysis of issuers, counterparties, and guarantors. Further, the Board considered that Fidelity's investment professionals have sufficient access to global information and data so as to provide competitive investment results over time, and that those professionals also have access to sophisticated tools that permit them to assess portfolio construction and risk and performance attribution characteristics continuously, as well as to transmit new information and research conclusions rapidly around the world. Additionally, in its deliberations, the Board considered Fidelity's trading, risk management, compliance, and technology and operations capabilities and resources, which are integral parts of the investment management process.
Administrative Services. The Board considered (i) the nature, extent, quality, and cost of advisory and administrative services performed by the Investment Advisers and their affiliates under the Advisory Contracts and under separate agreements covering transfer agency and pricing and bookkeeping services for the fund; (ii) the nature and extent of Fidelity's supervision of third party service providers, principally custodians, subcustodians, and pricing vendors; and (iii) the resources devoted by Fidelity to, and the record of compliance with, the fund's compliance policies and procedures. The Board also reviewed the allocation of fund brokerage, including allocations to brokers affiliated with the Investment Advisers, the use of brokerage commissions to pay fund expenses, and the use of "soft" commission dollars to pay for research services. The Board also considered the fund's securities lending activities and any payments made to Fidelity relating to securities lending under a separate agreement.
Investment Performance. The Board reviewed the fund's absolute investment performance, as well as the fund's relative investment performance, and noted that the fund is not publicly offered as a stand-alone investment product. In this regard, the Board noted that the fund is designed to offer an investment option for other investment companies, 529 plans, and collective investment trusts managed by Fidelity and ultimately to enhance the performance of those investment companies, 529 plans, and collective investment trusts.
Based on its review, the Board concluded that the nature, extent, and quality of services provided to the fund under the Advisory Contracts should continue to benefit the shareholders of the fund.
Competitiveness of Management Fee and Total Expense Ratio. The Board considered that the fund does not pay FMR a management fee for investment advisory services, but that FMR receives fees for providing services to funds that invest in the fund. The Board noted that FMR or an affiliate undertakes to pay all operating expenses of the fund, except transfer agent fees, 12b‑1 fees, Independent Trustee fees and expenses, custodian fees and expenses, proxy and shareholder meeting expenses, interest, taxes, and extraordinary expenses (such as litigation expenses). The Board further noted that the fund pays its non-operating expenses, including brokerage commissions and fees and expenses associated with the fund's securities lending program, if applicable.
The Board further considered that FMR has contractually agreed to reimburse the fund to the extent that total operating expenses, with certain exceptions, as a percentage of its average net assets, exceed 0.003% through November 30, 2026.
Based on its review, the Board considered that the fund does not pay a management fee and concluded that the total expense ratio of the fund was reasonable in light of the services that the fund and its shareholders receive and the other factors considered.
Costs of the Services and Profitability. The Board considered the level of Fidelity's profits in respect of all the Fidelity funds.
A public accounting firm has been engaged annually by the Board as part of the Board's assessment of Fidelity's profitability analysis. The engagement includes the review and assessment of the methodologies used by Fidelity in determining the revenues and expenses attributable to Fidelity's fund business, and completion of agreed-upon procedures in respect of the mathematical accuracy of certain fund profitability information and its conformity to established allocation methodologies. After considering the reports issued under the engagement and information provided by Fidelity, the Board concluded that while other allocation methods may also be reasonable, Fidelity's profitability methodologies are reasonable in all material respects.
The Board also reviewed Fidelity's non-fund businesses and potential indirect benefits such businesses may have received as a result of their association with Fidelity's fund business (i.e., fall-out benefits) as well as cases where Fidelity's affiliates may benefit from the funds' business. The Board considered areas where potential indirect benefits to the Fidelity funds from their relationships with Fidelity may exist. The Board's consideration of these matters was informed by the findings of a joint ad hoc committee created by it and the boards of other Fidelity funds to evaluate potential fall-out benefits.
The Board concluded that the costs of the services provided by and the profits realized by Fidelity in connection with the operation of the fund were not relevant to the renewal of the Advisory Contracts because the fund pays no advisory fees and FMR bears all expenses of the fund with certain exceptions.
Economies of Scale. The Board concluded that because the fund pays no advisory fees and FMR bears all expenses of the fund with certain exceptions, the realization of economies of scale was not a material factor in the Board's decision to renew the fund's Advisory Contracts.
Additional Information Requested by the Board. In order to develop fully the factual basis for consideration of the Fidelity funds' advisory contracts, the Board requested and received additional information on certain topics, including but not limited to: (i) fund flow and performance trends, in particular the underperformance of certain funds and strategies, and Fidelity's long-term strategies for certain funds; (ii) the operation of performance fees and the rationale for implementing performance fees on certain categories of funds but not others; (iii) Fidelity's pricing philosophy compared to competitors; (iv) fund profitability methodology and data; (v) evaluation of competitive fund data and peer group classifications and fee and expense comparisons; (vi) the management fee and expense structures for different funds and classes and information about the differences between various fee and expense structures; (vii) the variable management fee implemented for certain funds effective March 1, 2024; and (viii) information regarding other accounts managed by Fidelity and the funds' sub-advisory arrangements.
Conclusion. Based on its evaluation of all of the conclusions noted above, and after considering all factors it believed relevant, the Board, including the Independent Trustees, concluded that the advisory and sub-advisory fee arrangements are fair and reasonable in light of all of the surrounding circumstances and that the fund's Advisory Contracts should be renewed through May 31, 2025.
1.924310.112
SRE-ANN-0924
Fidelity® Small Cap Growth Fund
Annual Report
July 31, 2024
Includes Fidelity and Fidelity Advisor share classes
Contents
To view a fund's proxy voting guidelines and proxy voting record for the 12-month period ended June 30, visit http://www.fidelity.com/proxyvotingresults or visit the Securities and Exchange Commission's (SEC) web site at http://www.sec.gov.
You may also call 1-800-544-8544 if you're an individual investing directly with Fidelity, call 1-800-835-5092 if you're a plan sponsor or participant with Fidelity as your recordkeeper or call 1-877-208-0098 on institutional accounts or if you're an advisor or invest through one to request a free copy of the proxy voting guidelines.
Standard & Poor's, S&P and S&P 500 are registered service marks of The McGraw-Hill Companies, Inc. and have been licensed for use by Fidelity Distributors Corporation.
Other third-party marks appearing herein are the property of their respective owners.
All other marks appearing herein are registered or unregistered trademarks or service marks of FMR LLC or an affiliated company. © 2024 FMR LLC. All rights reserved.
This report and the financial statements contained herein are submitted for the general information of the shareholders of the Fund. This report is not authorized for distribution to prospective investors in the Fund unless preceded or accompanied by an effective prospectus.
A fund files its complete schedule of portfolio holdings with the SEC for the first and third quarters of each fiscal year on Form N-PORT. Forms N-PORT are available on the SEC's web site at http://www.sec.gov. A fund's Forms N-PORT may be reviewed and copied at the SEC's Public Reference Room in Washington, DC. Information regarding the operation of the SEC's Public Reference Room may be obtained by calling 1-800-SEC-0330.
For a complete list of a fund's portfolio holdings, view the most recent holdings listing, semiannual report, or annual report on Fidelity's web site at http://www.fidelity.com, http://www.institutional.fidelity.com, or http://www.401k.com, as applicable.
NOT FDIC INSURED •MAY LOSE VALUE •NO BANK GUARANTEE
Neither the Fund nor Fidelity Distributors Corporation is a bank.
Item 7: Consolidated Financial Statements and Consolidated Financial Highlights for Open-End Management Investment Companies (Annual Report)
Fidelity® Small Cap Growth Fund
Consolidated Schedule of Investments July 31, 2024
Showing Percentage of Net Assets
| Common Stocks - 98.1% |
| | | Shares | Value ($) |
| COMMUNICATION SERVICES - 1.1% | | | |
| Entertainment - 0.1% | | | |
| IMAX Corp. (a) | | 225,609 | 4,760,350 |
| Interactive Media & Services - 0.7% | | | |
| Cars.com, Inc. (a) | | 1,474,314 | 30,400,355 |
| Reddit, Inc. Class B | | 253,500 | 15,425,475 |
| Yelp, Inc. (a) | | 286,979 | 10,454,645 |
| | | | 56,280,475 |
| Media - 0.3% | | | |
| TechTarget, Inc. (a) | | 629,687 | 20,149,984 |
TOTAL COMMUNICATION SERVICES | | | 81,190,809 |
| CONSUMER DISCRETIONARY - 12.7% | | | |
| Automobile Components - 0.3% | | | |
| Autoliv, Inc. | | 205,905 | 20,825,232 |
| Diversified Consumer Services - 2.1% | | | |
| Duolingo, Inc. (a) | | 252,249 | 43,371,693 |
| Grand Canyon Education, Inc. (a) | | 294,393 | 45,910,588 |
| H&R Block, Inc. | | 339,762 | 19,685,810 |
| OneSpaWorld Holdings Ltd. | | 837,391 | 13,473,621 |
| Stride, Inc. (a)(b) | | 213,617 | 16,230,620 |
| Udemy, Inc. (a)(b) | | 939,476 | 8,680,758 |
| Universal Technical Institute, Inc. (a) | | 620,920 | 11,760,225 |
| | | | 159,113,315 |
| Hotels, Restaurants & Leisure - 2.3% | | | |
| Brinker International, Inc. (a) | | 980,781 | 65,525,979 |
| Cava Group, Inc. (a) | | 274,284 | 23,100,198 |
| Dutch Bros, Inc. (a) | | 822,589 | 31,464,029 |
| GEN Restaurant Group, Inc. (a) | | 36,695 | 317,412 |
| Kura Sushi U.S.A., Inc. Class A (a)(b) | | 327,048 | 18,801,990 |
| Red Rock Resorts, Inc. | | 605,355 | 34,505,235 |
| | | | 173,714,843 |
| Household Durables - 2.8% | | | |
| Installed Building Products, Inc. | | 259,422 | 70,134,738 |
| KB Home | | 391,220 | 33,676,218 |
| Lovesac (a)(b)(c) | | 1,202,151 | 32,890,851 |
| SharkNinja, Inc. | | 520,477 | 39,998,657 |
| TopBuild Corp. (a) | | 67,151 | 32,134,440 |
| | | | 208,834,904 |
| Leisure Products - 0.2% | | | |
| Games Workshop Group PLC | | 142,714 | 18,896,996 |
| Specialty Retail - 4.4% | | | |
| Abercrombie & Fitch Co. Class A (a) | | 381,320 | 56,237,074 |
| Aritzia, Inc. (a) | | 826,504 | 27,130,092 |
| Boot Barn Holdings, Inc. (a) | | 381,360 | 50,903,933 |
| Chewy, Inc. (a)(b) | | 1,083,443 | 26,197,652 |
| Fanatics, Inc. Class A (a)(d)(e) | | 726,062 | 47,745,837 |
| Group 1 Automotive, Inc. (b) | | 98,220 | 35,921,018 |
| Murphy U.S.A., Inc. | | 92,889 | 46,901,514 |
| Valvoline, Inc. (a) | | 778,496 | 36,200,064 |
| | | | 327,237,184 |
| Textiles, Apparel & Luxury Goods - 0.6% | | | |
| Crocs, Inc. (a) | | 332,985 | 44,743,194 |
TOTAL CONSUMER DISCRETIONARY | | | 953,365,668 |
| CONSUMER STAPLES - 2.6% | | | |
| Beverages - 0.2% | | | |
| The Vita Coco Co., Inc. (a)(b) | | 562,823 | 14,543,346 |
| Consumer Staples Distribution & Retail - 2.0% | | | |
| Casey's General Stores, Inc. | | 62,738 | 24,332,306 |
| Sprouts Farmers Market LLC (a) | | 643,369 | 64,266,129 |
| U.S. Foods Holding Corp. (a) | | 1,088,191 | 59,186,708 |
| | | | 147,785,143 |
| Food Products - 0.2% | | | |
| Lamb Weston Holdings, Inc. | | 191,757 | 11,509,255 |
| Vital Farms, Inc. (a) | | 172,400 | 6,290,876 |
| | | | 17,800,131 |
| Personal Care Products - 0.2% | | | |
| elf Beauty, Inc. (a) | | 67,492 | 11,647,769 |
TOTAL CONSUMER STAPLES | | | 191,776,389 |
| ENERGY - 4.7% | | | |
| Energy Equipment & Services - 3.5% | | | |
| Cactus, Inc. Class A | | 784,202 | 49,498,830 |
| Championx Corp. | | 456,303 | 15,632,941 |
| Expro Group Holdings NV (a) | | 1,227,408 | 28,500,414 |
| Liberty Energy, Inc. Class A | | 2,093,933 | 50,568,482 |
| TechnipFMC PLC | | 1,142,625 | 33,707,438 |
| Tidewater, Inc. (a) | | 314,273 | 31,100,456 |
| Weatherford International PLC | | 416,527 | 49,091,872 |
| | | | 258,100,433 |
| Oil, Gas & Consumable Fuels - 1.2% | | | |
| Antero Resources Corp. (a) | | 874,414 | 25,375,494 |
| Northern Oil & Gas, Inc. (b) | | 1,084,450 | 46,837,396 |
| Range Resources Corp. | | 641,760 | 20,042,165 |
| | | | 92,255,055 |
TOTAL ENERGY | | | 350,355,488 |
| FINANCIALS - 6.7% | | | |
| Banks - 1.0% | | | |
| Eastern Bankshares, Inc. | | 1,333,870 | 22,195,597 |
| Pinnacle Financial Partners, Inc. | | 467,463 | 45,026,036 |
| Starling Bank Ltd. Series D (a)(d)(e) | | 1,942,800 | 7,917,286 |
| | | | 75,138,919 |
| Capital Markets - 2.6% | | | |
| Houlihan Lokey | | 237,178 | 35,635,995 |
| Perella Weinberg Partners (d) | | 2,039,500 | 38,546,550 |
| Perella Weinberg Partners Class A | | 427,622 | 8,082,056 |
| StepStone Group, Inc. Class A | | 1,025,653 | 51,549,320 |
| Stifel Financial Corp. | | 575,550 | 51,034,019 |
| WisdomTree Investments, Inc. (b) | | 903,907 | 10,792,650 |
| | | | 195,640,590 |
| Consumer Finance - 0.4% | | | |
| FirstCash Holdings, Inc. | | 129,140 | 14,412,024 |
| PROG Holdings, Inc. | | 321,756 | 14,498,325 |
| | | | 28,910,349 |
| Financial Services - 1.5% | | | |
| AvidXchange Holdings, Inc. (a) | | 2,151,450 | 19,233,963 |
| Flywire Corp. (a) | | 2,005,870 | 36,727,480 |
| HA Sustainable Infrastructure Capital, Inc. | | 815,670 | 26,729,506 |
| Walker & Dunlop, Inc. | | 302,547 | 32,342,274 |
| | | | 115,033,223 |
| Insurance - 1.2% | | | |
| Selective Insurance Group, Inc. | | 142,616 | 12,881,077 |
| Stewart Information Services Corp. | | 311,860 | 22,048,502 |
| The Baldwin Insurance Group, Inc. Class A, (a) | | 1,215,734 | 53,176,205 |
| TWFG, Inc. | | 43,400 | 1,096,284 |
| | | | 89,202,068 |
TOTAL FINANCIALS | | | 503,925,149 |
| HEALTH CARE - 23.0% | | | |
| Biotechnology - 11.4% | | | |
| ADMA Biologics, Inc. (a) | | 1,324,820 | 16,268,790 |
| Allogene Therapeutics, Inc. (a) | | 1,571,066 | 4,618,934 |
| ALX Oncology Holdings, Inc. (a)(b) | | 1,767,880 | 8,485,824 |
| AnaptysBio, Inc. (a) | | 626,790 | 21,837,364 |
| Annexon, Inc. (a)(b) | | 1,335,240 | 8,558,888 |
| Apogee Therapeutics, Inc. (b) | | 281,133 | 13,691,177 |
| Arcellx, Inc. (a) | | 542,381 | 33,524,570 |
| Arrowhead Pharmaceuticals, Inc. (a) | | 871,344 | 24,885,585 |
| Ascendis Pharma A/S sponsored ADR (a) | | 198,862 | 26,548,077 |
| Astria Therapeutics, Inc. (a) | | 1,358,000 | 15,861,440 |
| Autolus Therapeutics PLC ADR (a) | | 2,578,098 | 12,091,280 |
| Avidity Biosciences, Inc. (a) | | 501,050 | 22,837,859 |
| Blueprint Medicines Corp. (a) | | 440,617 | 47,718,821 |
| Boundless Bio, Inc. | | 262,971 | 1,012,438 |
| Boundless Bio, Inc. (b) | | 32,982 | 126,981 |
| Cargo Therapeutics, Inc. | | 640,202 | 10,902,640 |
| Cargo Therapeutics, Inc. (d) | | 292,094 | 4,974,361 |
| Celldex Therapeutics, Inc. (a) | | 465,719 | 17,748,551 |
| Crinetics Pharmaceuticals, Inc. (a) | | 492,790 | 26,177,005 |
| Cytokinetics, Inc. (a)(b) | | 852,733 | 50,319,774 |
| Denali Therapeutics, Inc. (a) | | 34,958 | 851,926 |
| Dyne Therapeutics, Inc. (a) | | 260,214 | 11,165,783 |
| Insmed, Inc. (a) | | 557,033 | 40,524,151 |
| Janux Therapeutics, Inc. (a)(b) | | 646,325 | 26,240,795 |
| Keros Therapeutics, Inc. (a) | | 377,821 | 18,951,501 |
| Kiniksa Pharmaceuticals Intern (a)(b) | | 375,894 | 9,998,780 |
| Legend Biotech Corp. ADR (a) | | 194,574 | 10,972,028 |
| Madrigal Pharmaceuticals, Inc. (a)(b) | | 136,522 | 38,862,353 |
| Merus BV (a)(b) | | 458,709 | 24,329,925 |
| Monte Rosa Therapeutics, Inc. (a) | | 622,600 | 2,814,152 |
| Moonlake Immunotherapeutics Class A (a) | | 144,731 | 6,028,046 |
| Neurogene, Inc. (a)(b) | | 165,683 | 6,816,199 |
| Nuvalent, Inc. Class A (a) | | 485,478 | 38,809,111 |
| ORIC Pharmaceuticals, Inc. (a)(b) | | 1,284,203 | 14,383,074 |
| Revolution Medicines, Inc. (a) | | 614,320 | 28,037,565 |
| Spyre Therapeutics, Inc. (a) | | 387,063 | 10,644,233 |
| Tango Therapeutics, Inc. (a) | | 1,257,386 | 12,385,252 |
| Tyra Biosciences, Inc. (d) | | 457,928 | 10,147,684 |
| Tyra Biosciences, Inc. (a) | | 644,281 | 14,277,267 |
| Vaxcyte, Inc. (a) | | 749,651 | 59,139,967 |
| Vericel Corp. (a)(b) | | 828,989 | 41,880,524 |
| Viking Therapeutics, Inc. (a)(b) | | 429,101 | 24,458,757 |
| Viridian Therapeutics, Inc. (a) | | 780,411 | 13,149,925 |
| Xenon Pharmaceuticals, Inc. (a) | | 351,761 | 15,171,452 |
| Zentalis Pharmaceuticals, Inc. (a) | | 736,857 | 2,866,374 |
| | | | 851,097,183 |
| Health Care Equipment & Supplies - 4.8% | | | |
| Atricure, Inc. (a) | | 526,216 | 11,350,479 |
| Glaukos Corp. (a) | | 482,854 | 56,576,003 |
| Integer Holdings Corp. (a) | | 202,679 | 24,070,158 |
| Lantheus Holdings, Inc. (a) | | 545,695 | 57,205,207 |
| Masimo Corp. (a) | | 193,901 | 20,743,529 |
| NeuroPace, Inc. (a)(b) | | 181,247 | 1,401,039 |
| Nyxoah SA (a)(b) | | 669,303 | 5,668,996 |
| Penumbra, Inc. (a) | | 93,799 | 15,672,875 |
| PROCEPT BioRobotics Corp. (a)(b) | | 629,232 | 39,842,970 |
| Pulmonx Corp. (a) | | 1,497,379 | 10,346,889 |
| RxSight, Inc. (a) | | 486,288 | 22,257,402 |
| TransMedics Group, Inc. (a)(b) | | 671,821 | 95,573,255 |
| | | | 360,708,802 |
| Health Care Providers & Services - 4.6% | | | |
| agilon health, Inc. (a) | | 2,069,390 | 14,258,097 |
| Astrana Health, Inc. (a) | | 148,200 | 7,774,572 |
| BrightSpring Health Services, Inc. | | 2,427,008 | 30,070,629 |
| Guardant Health, Inc. (a) | | 319,620 | 11,228,251 |
| HealthEquity, Inc. (a) | | 694,338 | 54,491,646 |
| Hims & Hers Health, Inc. (a) | | 1,812,999 | 38,508,099 |
| LifeStance Health Group, Inc. (a) | | 2,353,644 | 12,968,578 |
| Molina Healthcare, Inc. (a) | | 66,429 | 22,670,225 |
| Option Care Health, Inc. (a) | | 485,235 | 14,406,627 |
| Pennant Group, Inc. (a) | | 502,632 | 14,983,460 |
| Privia Health Group, Inc. (a) | | 986,764 | 20,465,485 |
| Progyny, Inc. (a)(b) | | 819,405 | 23,107,221 |
| Surgery Partners, Inc. (a) | | 961,732 | 29,198,184 |
| The Ensign Group, Inc. | | 373,139 | 52,519,314 |
| | | | 346,650,388 |
| Health Care Technology - 0.3% | | | |
| Evolent Health, Inc. Class A (a)(b) | | 565,777 | 13,193,920 |
| Schrodinger, Inc. (a)(b) | | 338,464 | 7,540,978 |
| | | | 20,734,898 |
| Life Sciences Tools & Services - 0.6% | | | |
| 10X Genomics, Inc. (a) | | 316,111 | 6,534,014 |
| Charles River Laboratories International, Inc. (a) | | 121,636 | 29,691,348 |
| Veterinary Emergency Group LLC Class A (a)(d)(e)(f) | | 190,561 | 10,875,316 |
| | | | 47,100,678 |
| Pharmaceuticals - 1.3% | | | |
| Alto Neuroscience, Inc. (b) | | 429,665 | 4,631,789 |
| Corcept Therapeutics, Inc. (a)(b) | | 552,715 | 21,373,489 |
| Edgewise Therapeutics, Inc. (a) | | 983,347 | 16,746,399 |
| Enliven Therapeutics, Inc. (d) | | 266,907 | 7,041,007 |
| Enliven Therapeutics, Inc. (a)(b) | | 708,294 | 18,684,796 |
| Pharvaris BV (a)(b) | | 729,999 | 12,512,183 |
| Rapport Therapeutics, Inc. | | 54,400 | 1,235,968 |
| Structure Therapeutics, Inc. ADR (a) | | 199,901 | 7,474,298 |
| Terns Pharmaceuticals, Inc. (a) | | 815,169 | 6,317,560 |
| | | | 96,017,489 |
TOTAL HEALTH CARE | | | 1,722,309,438 |
| INDUSTRIALS - 21.3% | | | |
| Aerospace & Defense - 0.2% | | | |
| BWX Technologies, Inc. | | 126,963 | 12,631,549 |
| Building Products - 3.4% | | | |
| AAON, Inc. | | 208,035 | 18,417,339 |
| AZZ, Inc. | | 778,798 | 62,272,688 |
| CSW Industrials, Inc. | | 95,847 | 31,094,684 |
| Fortune Brands Innovations, Inc. | | 512,392 | 41,406,398 |
| Simpson Manufacturing Co. Ltd. | | 164,969 | 31,688,895 |
| Tecnoglass, Inc. (b) | | 217,585 | 11,708,249 |
| The AZEK Co., Inc. Class A, (a) | | 712,126 | 31,967,336 |
| UFP Industries, Inc. | | 197,395 | 26,042,322 |
| | | | 254,597,911 |
| Commercial Services & Supplies - 1.2% | | | |
| ACV Auctions, Inc. Class A (a) | | 1,359,210 | 23,215,307 |
| HNI Corp. | | 118,175 | 6,493,716 |
| The Brink's Co. | | 176,077 | 19,366,709 |
| The GEO Group, Inc. (a) | | 2,871,847 | 41,641,782 |
| | | | 90,717,514 |
| Construction & Engineering - 3.5% | | | |
| Comfort Systems U.S.A., Inc. | | 94,303 | 31,348,203 |
| Dycom Industries, Inc. (a) | | 234,055 | 42,951,433 |
| Fluor Corp. (a) | | 1,713,997 | 82,443,256 |
| Sterling Construction Co., Inc. (a) | | 504,377 | 58,689,308 |
| Valmont Industries, Inc. | | 158,060 | 47,158,782 |
| | | | 262,590,982 |
| Electrical Equipment - 2.1% | | | |
| Acuity Brands, Inc. | | 122,653 | 30,828,832 |
| Nextracker, Inc. Class A (a) | | 840,916 | 41,322,612 |
| nVent Electric PLC | | 515,914 | 37,470,834 |
| Prysmian SpA | | 445,938 | 30,665,446 |
| Sunrun, Inc. (a)(b) | | 1,139,360 | 19,972,981 |
| | | | 160,260,705 |
| Machinery - 3.9% | | | |
| Crane Co. | | 238,530 | 38,264,983 |
| ESAB Corp. | | 281,942 | 28,645,307 |
| Federal Signal Corp. | | 413,854 | 41,372,984 |
| Gates Industrial Corp. PLC (a) | | 1,592,922 | 29,612,420 |
| ITT, Inc. | | 311,188 | 44,020,654 |
| Mueller Industries, Inc. | | 719,100 | 51,012,954 |
| Oshkosh Corp. | | 127,930 | 13,899,595 |
| REV Group, Inc. | | 662,660 | 19,336,419 |
| Terex Corp. | | 216,970 | 13,725,522 |
| Timken Co. | | 178,732 | 15,540,747 |
| | | | 295,431,585 |
| Marine Transportation - 0.4% | | | |
| Kirby Corp. (a) | | 223,364 | 27,446,968 |
| Professional Services - 2.8% | | | |
| CACI International, Inc. (a) | | 114,448 | 52,815,463 |
| CBIZ, Inc. (a) | | 302,666 | 21,005,020 |
| ExlService Holdings, Inc. (a) | | 1,488,676 | 52,490,716 |
| Insperity, Inc. (b) | | 261,636 | 26,875,250 |
| KBR, Inc. | | 408,199 | 27,181,971 |
| Verra Mobility Corp. (a) | | 1,111,051 | 33,475,967 |
| | | | 213,844,387 |
| Trading Companies & Distributors - 3.8% | | | |
| Alligo AB (B Shares) | | 890,141 | 11,703,195 |
| Applied Industrial Technologies, Inc. | | 422,910 | 92,274,733 |
| FTAI Aviation Ltd. | | 985,103 | 109,789,729 |
| GMS, Inc. (a) | | 416,033 | 40,034,856 |
| Herc Holdings, Inc. | | 79,069 | 12,322,113 |
| Xometry, Inc. (a)(b) | | 1,051,855 | 15,388,639 |
| | | | 281,513,265 |
TOTAL INDUSTRIALS | | | 1,599,034,866 |
| INFORMATION TECHNOLOGY - 19.2% | | | |
| Communications Equipment - 0.2% | | | |
| Lumentum Holdings, Inc. (a) | | 245,781 | 12,726,540 |
| Electronic Equipment, Instruments & Components - 7.0% | | | |
| Advanced Energy Industries, Inc. | | 447,847 | 52,115,955 |
| Belden, Inc. | | 320,710 | 29,726,610 |
| Cognex Corp. | | 288,047 | 14,292,892 |
| Coherent Corp. (a) | | 363,490 | 25,327,983 |
| Crane NXT Co. | | 509,335 | 32,026,985 |
| Fabrinet (a) | | 273,424 | 60,306,397 |
| Insight Enterprises, Inc. (a) | | 547,959 | 123,016,794 |
| Littelfuse, Inc. | | 16,254 | 4,341,606 |
| OSI Systems, Inc. (a) | | 53,590 | 7,930,248 |
| Par Technology Corp. (a)(b) | | 524,730 | 26,572,327 |
| Sanmina Corp. (a) | | 409,000 | 30,809,970 |
| TD SYNNEX Corp. | | 578,000 | 68,880,260 |
| Vontier Corp. | | 1,241,788 | 48,715,343 |
| | | | 524,063,370 |
| IT Services - 1.5% | | | |
| Kyndryl Holdings, Inc. (a) | | 643,610 | 17,293,801 |
| Wix.com Ltd. (a) | | 613,659 | 95,684,780 |
| | | | 112,978,581 |
| Semiconductors & Semiconductor Equipment - 3.7% | | | |
| AEHR Test Systems (a)(b) | | 555,820 | 10,488,323 |
| Allegro MicroSystems LLC (a) | | 1,447,072 | 34,787,611 |
| Axcelis Technologies, Inc. (a) | | 190,680 | 24,092,418 |
| Camtek Ltd. (b) | | 130,680 | 13,721,400 |
| MACOM Technology Solutions Holdings, Inc. (a) | | 365,888 | 36,925,417 |
| MKS Instruments, Inc. | | 145,520 | 18,320,968 |
| Nova Ltd. (a) | | 237,870 | 49,113,019 |
| Onto Innovation, Inc. (a) | | 149,559 | 28,610,637 |
| Ultra Clean Holdings, Inc. (a) | | 592,690 | 25,639,769 |
| Veeco Instruments, Inc. (a) | | 893,667 | 37,006,750 |
| | | | 278,706,312 |
| Software - 6.8% | | | |
| Agilysys, Inc. (a) | | 89,840 | 10,070,166 |
| Algolia, Inc. (a)(d)(e) | | 234,640 | 3,913,795 |
| Alkami Technology, Inc. (a) | | 1,004,486 | 32,876,827 |
| Altair Engineering, Inc. Class A (a)(b) | | 139,830 | 12,355,379 |
| Cellebrite DI Ltd. (a) | | 1,465,440 | 20,076,528 |
| CommVault Systems, Inc. (a) | | 279,198 | 42,675,414 |
| Convoy, Inc. warrants (a)(d)(e) | | 59,855 | 1 |
| CyberArk Software Ltd. (a) | | 86,310 | 22,128,158 |
| Intapp, Inc. (a) | | 581,714 | 20,842,813 |
| JFrog Ltd. (a)(b) | | 774,397 | 29,860,748 |
| Life360, Inc. (b) | | 204,800 | 6,871,040 |
| Lightspeed Commerce, Inc. Subordinate (vtg.) Shares (United States) (a)(b) | | 41,966 | 561,925 |
| Lumine Group, Inc. (a) | | 496,000 | 13,274,327 |
| Monday.com Ltd. (a) | | 168,160 | 38,644,850 |
| nCino, Inc. (a)(b) | | 876,897 | 28,727,146 |
| Onestream, Inc. (b) | | 9,500 | 264,575 |
| Q2 Holdings, Inc. (a)(b) | | 345,670 | 23,322,355 |
| Semrush Holdings, Inc. (a) | | 2,442,546 | 36,003,128 |
| SPS Commerce, Inc. (a) | | 145,794 | 31,406,943 |
| TECSYS, Inc. | | 705,720 | 20,456,245 |
| Tenable Holdings, Inc. (a) | | 1,236,214 | 56,766,947 |
| Varonis Systems, Inc. (a) | | 405,628 | 22,362,272 |
| Vertex, Inc. Class A (a)(b) | | 966,330 | 38,314,985 |
| | | | 511,776,567 |
TOTAL INFORMATION TECHNOLOGY | | | 1,440,251,370 |
| MATERIALS - 5.2% | | | |
| Chemicals - 2.5% | | | |
| Aspen Aerogels, Inc. (a)(b) | | 569,470 | 11,622,883 |
| Axalta Coating Systems Ltd. (a) | | 1,446,447 | 51,565,836 |
| Cabot Corp. | | 616,236 | 61,802,308 |
| Element Solutions, Inc. | | 1,139,200 | 30,701,440 |
| Orion SA | | 1,241,239 | 30,559,304 |
| | | | 186,251,771 |
| Construction Materials - 0.6% | | | |
| Eagle Materials, Inc. | | 150,911 | 41,093,065 |
| Metals & Mining - 1.8% | | | |
| ATI, Inc. (a)(b) | | 962,893 | 65,197,485 |
| Carpenter Technology Corp. | | 488,540 | 71,263,330 |
| | | | 136,460,815 |
| Paper & Forest Products - 0.3% | | | |
| Louisiana-Pacific Corp. | | 251,450 | 24,682,332 |
TOTAL MATERIALS | | | 388,487,983 |
| REAL ESTATE - 1.4% | | | |
| Equity Real Estate Investment Trusts (REITs) - 0.8% | | | |
| Ryman Hospitality Properties, Inc. | | 419,491 | 42,163,040 |
| Terreno Realty Corp. | | 267,380 | 18,291,466 |
| | | | 60,454,506 |
| Real Estate Management & Development - 0.6% | | | |
| Compass, Inc. (a) | | 7,605,479 | 33,388,053 |
| LandBridge Co. LLC | | 265,790 | 8,763,096 |
| | | | 42,151,149 |
TOTAL REAL ESTATE | | | 102,605,655 |
| UTILITIES - 0.2% | | | |
| Independent Power and Renewable Electricity Producers - 0.2% | | | |
| Sunnova Energy International, Inc. (a)(b) | | 2,072,590 | 14,653,211 |
| TOTAL COMMON STOCKS (Cost $5,716,967,512) | | | 7,347,956,026 |
| | | | |
| Convertible Preferred Stocks - 1.3% |
| | | Shares | Value ($) |
| HEALTH CARE - 0.4% | | | |
| Biotechnology - 0.4% | | | |
| Bright Peak Therapeutics, Inc.: | | | |
| Series B (a)(d)(e) | | 1,079,522 | 1,759,621 |
| Series C (d)(e) | | 2,205,558 | 2,514,336 |
| Caris Life Sciences, Inc. Series D (a)(d)(e) | | 780,603 | 2,138,852 |
| Endeavor BioMedicines, Inc. Series C (d)(e) | | 556,156 | 3,993,200 |
| LifeMine Therapeutics, Inc. Series C (a)(d)(e) | | 2,048,403 | 4,240,194 |
| Sonoma Biotherapeutics, Inc.: | | | |
| Series B (a)(d)(e) | | 2,370,360 | 6,802,933 |
| Series B1 (a)(d)(e) | | 1,264,171 | 4,095,914 |
| T-Knife Therapeutics, Inc. Series B (a)(d)(e) | | 1,097,257 | 1,832,419 |
| Treeline Biosciences Series A (a)(d)(e) | | 115,000 | 1,032,700 |
| | | | 28,410,169 |
| Health Care Technology - 0.0% | | | |
| Wugen, Inc. Series B (a)(d)(e) | | 326,496 | 1,358,223 |
TOTAL HEALTH CARE | | | 29,768,392 |
| INDUSTRIALS - 0.5% | | | |
| Construction & Engineering - 0.5% | | | |
| Beta Technologies, Inc.: | | | |
| Series A (a)(d)(e) | | 278,129 | 30,652,597 |
| Series B, 6.00% (a)(d)(e) | | 85,106 | 10,673,143 |
| | | | 41,325,740 |
| INFORMATION TECHNOLOGY - 0.4% | | | |
| Communications Equipment - 0.1% | | | |
| Astranis Space Technologies Corp.: | | | |
| Series C (a)(d)(e) | | 557,717 | 7,144,355 |
| Series C Prime (a)(d)(e) | | 87,241 | 1,117,557 |
| Series D (d)(e) | | 139,151 | 1,301,062 |
| | | | 9,562,974 |
| IT Services - 0.1% | | | |
| Yanka Industries, Inc.: | | | |
| Series E (a)(d)(e) | | 869,641 | 4,278,634 |
| Series F (a)(d)(e) | | 127,716 | 793,116 |
| | | | 5,071,750 |
| Software - 0.2% | | | |
| Algolia, Inc. Series D (a)(d)(e) | | 53,800 | 897,384 |
| Convoy, Inc. Series D (a)(d)(e) | | 913,444 | 9 |
| Mountain Digital, Inc. Series D (a)(d)(e) | | 729,676 | 9,777,658 |
| Skyryse, Inc. Series B (a)(d)(e) | | 62,100 | 1,316,520 |
| | | | 11,991,571 |
TOTAL INFORMATION TECHNOLOGY | | | 26,626,295 |
| TOTAL CONVERTIBLE PREFERRED STOCKS (Cost $130,438,085) | | | 97,720,427 |
| | | | |
| Convertible Bonds - 0.0% |
| | | Principal Amount (g) | Value ($) |
| HEALTH CARE - 0.0% | | | |
| Health Care Technology - 0.0% | | | |
| Wugen, Inc. 10% 6/14/25 (d)(e) | | 1,379,633 | 1,411,227 |
| INFORMATION TECHNOLOGY - 0.0% | | | |
| Software - 0.0% | | | |
| Convoy, Inc. 15% 9/30/26 (d)(e) | | 398,614 | 0 |
| TOTAL CONVERTIBLE BONDS (Cost $1,778,247) | | | 1,411,227 |
| | | | |
| Money Market Funds - 4.4% |
| | | Shares | Value ($) |
| Fidelity Cash Central Fund 5.39% (h) | | 52,492,787 | 52,503,286 |
| Fidelity Securities Lending Cash Central Fund 5.39% (h)(i) | | 277,033,158 | 277,060,862 |
| TOTAL MONEY MARKET FUNDS (Cost $329,564,148) | | | 329,564,148 |
| | | | |
| TOTAL INVESTMENT IN SECURITIES - 103.8% (Cost $6,178,747,992) | 7,776,651,828 |
NET OTHER ASSETS (LIABILITIES) - (3.8)% | (287,072,559) |
| NET ASSETS - 100.0% | 7,489,579,269 |
| | |
Legend
| (b) | Security or a portion of the security is on loan at period end. |
| (d) | Restricted securities (including private placements) - Investment in securities not registered under the Securities Act of 1933 (excluding 144A issues). At the end of the period, the value of restricted securities (excluding 144A issues) amounted to $230,293,491 or 3.1% of net assets. |
| (f) | Investment is owned by a wholly-owned subsidiary (Subsidiary) that is treated as a corporation for U.S. tax purposes. |
| (g) | Amount is stated in United States dollars unless otherwise noted. |
| (h) | Affiliated fund that is generally available only to investment companies and other accounts managed by Fidelity Investments. The rate quoted is the annualized seven-day yield of the fund at period end. A complete unaudited listing of the fund's holdings as of its most recent quarter end is available upon request. In addition, each Fidelity Central Fund's financial statements, which are not covered by the Fund's Report of Independent Registered Public Accounting Firm, are available on the SEC's website or upon request. |
| (i) | Investment made with cash collateral received from securities on loan. |
| Additional information on each restricted holding is as follows: |
| Security | Acquisition Date | Acquisition Cost ($) |
| Algolia, Inc. | 10/27/21 | 6,862,059 |
| | | |
| Algolia, Inc. Series D | 7/23/21 | 1,573,384 |
| | | |
| Astranis Space Technologies Corp. Series C | 3/19/21 | 12,225,675 |
| | | |
| Astranis Space Technologies Corp. Series C Prime | 4/05/23 | 1,912,404 |
| | | |
| Astranis Space Technologies Corp. Series D | 4/25/24 | 1,300,004 |
| | | |
| Beta Technologies, Inc. Series A | 4/09/21 | 20,378,512 |
| | | |
| Beta Technologies, Inc. Series B, 6.00% | 4/04/22 | 8,780,386 |
| | | |
| Bright Peak Therapeutics, Inc. Series B | 5/14/21 | 4,216,613 |
| | | |
| Bright Peak Therapeutics, Inc. Series C | 5/07/24 | 2,500,000 |
| | | |
| Cargo Therapeutics, Inc. | 5/28/24 | 4,965,598 |
| | | |
| Caris Life Sciences, Inc. Series D | 5/11/21 | 6,322,884 |
| | | |
| Convoy, Inc. Series D | 10/30/19 | 12,368,032 |
| | | |
| Convoy, Inc. warrants | 3/24/23 | 0 |
| | | |
| Convoy, Inc. 15% 9/30/26 | 3/24/23 | 398,614 |
| | | |
| Endeavor BioMedicines, Inc. Series C | 4/22/24 | 3,628,695 |
| | | |
| Enliven Therapeutics, Inc. | 3/19/24 | 3,736,698 |
| | | |
| Fanatics, Inc. Class A | 8/13/20 - 3/22/21 | 12,874,623 |
| | | |
| LifeMine Therapeutics, Inc. Series C | 2/15/22 | 4,171,757 |
| | | |
| Mountain Digital, Inc. Series D | 11/05/21 | 16,757,228 |
| | | |
| Perella Weinberg Partners | 12/29/20 | 20,395,000 |
| | | |
| Skyryse, Inc. Series B | 10/21/21 | 1,532,626 |
| | | |
| Sonoma Biotherapeutics, Inc. Series B | 7/26/21 | 4,684,542 |
| | | |
| Sonoma Biotherapeutics, Inc. Series B1 | 7/26/21 | 3,747,635 |
| | | |
| Starling Bank Ltd. Series D | 6/18/21 - 4/05/22 | 3,728,430 |
| | | |
| T-Knife Therapeutics, Inc. Series B | 6/30/21 | 6,329,856 |
| | | |
| Treeline Biosciences Series A | 7/30/21 | 900,163 |
| | | |
| Tyra Biosciences, Inc. | 2/02/24 | 5,957,644 |
| | | |
| Veterinary Emergency Group LLC Class A | 9/16/21 - 3/17/22 | 9,331,366 |
| | | |
| Wugen, Inc. Series B | 7/09/21 | 2,531,944 |
| | | |
| Wugen, Inc. 10% 6/14/25 | 6/14/24 | 1,379,633 |
| | | |
| Yanka Industries, Inc. Series E | 5/15/20 | 10,504,568 |
| | | |
| Yanka Industries, Inc. Series F | 4/08/21 | 4,071,177 |
| | | |
Affiliated Central Funds
Fiscal year to date information regarding the Fund's investments in Fidelity Central Funds, including the ownership percentage, is presented below.
| Affiliate | Value, beginning of period ($) | Purchases ($) | Sales Proceeds ($) | Dividend Income ($) | Realized Gain (loss) ($) | Change in Unrealized appreciation (depreciation) ($) | Value, end of period ($) | % ownership, end of period |
| Fidelity Cash Central Fund 5.39% | 21 | 1,803,101,696 | 1,750,594,154 | 2,515,627 | (4,277) | - | 52,503,286 | 0.1% |
| Fidelity Securities Lending Cash Central Fund 5.39% | 347,027,293 | 2,026,207,772 | 2,096,174,203 | 1,957,179 | - | - | 277,060,862 | 1.3% |
| Total | 347,027,314 | 3,829,309,468 | 3,846,768,357 | 4,472,806 | (4,277) | - | 329,564,148 | |
| | | | | | | | | |
Amounts in the dividend income column in the above table include any capital gain distributions from underlying funds, which are presented in the corresponding line item in the Consolidated Statement of Operations, if applicable.
Amounts in the dividend income column for Fidelity Securities Lending Cash Central Fund represents the income earned on investing cash collateral, less rebates paid to borrowers and any lending agent fees associated with the loan, plus any premium payments received for lending certain types of securities.
Amounts included in the purchases and sales proceeds columns may include in-kind transactions, if applicable.
Other Affiliated Issuers
An affiliated company is a company in which the Fund has ownership of at least 5% of the voting securities. Fiscal year to date transactions with companies which are or were affiliates are presented in the table below. Certain corporate actions, such as mergers, are excluded from the amounts in this table if applicable. A dash in the Value end of period ($) column means either the issuer is no longer held at period end, or the issuer is held at period end but is no longer an affiliate.
| Affiliate | Value, beginning of period ($) | Purchases ($) | Sales Proceeds ($) | Dividend Income ($) | Realized Gain (loss) ($) | Change in Unrealized appreciation (depreciation) ($) | Value, end of period ($) |
| Lovesac | 32,183,727 | 12,940,767 | 8,786,421 | - | (15,272,089) | 11,824,867 | 32,890,851 |
| Total | 32,183,727 | 12,940,767 | 8,786,421 | - | (15,272,089) | 11,824,867 | 32,890,851 |
Amounts included in the purchases and sales proceeds columns may include in-kind transactions, if applicable.
Investment Valuation
The following is a summary of the inputs used, as of July 31, 2024, involving the Fund's assets and liabilities carried at fair value. The inputs or methodology used for valuing securities may not be an indication of the risk associated with investing in those securities. For more information on valuation inputs, and their aggregation into the levels used below, please refer to the Investment Valuation section in the accompanying Notes to Consolidated Financial Statements.
| Valuation Inputs at Reporting Date: |
| Description | Total ($) | Level 1 ($) | Level 2 ($) | Level 3 ($) |
Investments in Securities: | | | | |
|
| Equities: | | | | |
Communication Services | 81,190,809 | 81,190,809 | - | - |
Consumer Discretionary | 953,365,668 | 905,619,831 | - | 47,745,837 |
Consumer Staples | 191,776,389 | 191,776,389 | - | - |
Energy | 350,355,488 | 350,355,488 | - | - |
Financials | 503,925,149 | 496,007,863 | - | 7,917,286 |
Health Care | 1,752,077,830 | 1,711,434,122 | - | 40,643,708 |
Industrials | 1,640,360,606 | 1,599,034,866 | - | 41,325,740 |
Information Technology | 1,466,877,665 | 1,436,337,574 | - | 30,540,091 |
Materials | 388,487,983 | 388,487,983 | - | - |
Real Estate | 102,605,655 | 102,605,655 | - | - |
Utilities | 14,653,211 | 14,653,211 | - | - |
|
| Corporate Bonds | 1,411,227 | - | - | 1,411,227 |
|
| Money Market Funds | 329,564,148 | 329,564,148 | - | - |
| Total Investments in Securities: | 7,776,651,828 | 7,607,067,939 | - | 169,583,889 |
| | | | | |
|
| Net Unrealized Appreciation on Unfunded Commitments | 2,547,122 | - | - | 2,547,122 |
| Total | 2,547,122 | - | - | 2,547,122 |
The following is a reconciliation of consolidated Investments in Securities for which Level 3 inputs were used in determining value:
| |
| Investments in Securities: | |
| Beginning Balance | $ | 207,367,653 | |
| Net Realized Gain (Loss) on Investment Securities | | (2) | |
| Net Unrealized Gain (Loss) on Investment Securities | | (33,552,444) | |
| Cost of Purchases | | 8,832,730 | |
| Proceeds of Sales | | - | |
| Amortization/Accretion | | - | |
| Transfers into Level 3 | | - | |
| Transfers out of Level 3 | | (13,064,048) | |
| Ending Balance | $ | 169,583,889 | |
| The change in unrealized gain (loss) for the period attributable to Level 3 securities held at July 31, 2024 | $ | (33,552,444) | |
| The information used in the above reconciliation represents fiscal year to date activity for any Investments in Securities identified as using Level 3 inputs at either the beginning or the end of the current fiscal period. Cost of purchases and proceeds of sales may include securities received and/or delivered through in-kind transactions, corporate actions or exchanges. Transfers into Level 3 were attributable to a lack of observable market data resulting from decreases in market activity, decreases in liquidity, security restructurings or corporate actions. Transfers out of Level 3 were attributable to observable market data becoming available for those securities. Transfers in or out of Level 3 represent the beginning value of any Security or Instrument where a change in the pricing level occurred from the beginning to the end of the period. Realized and unrealized gains (losses) disclosed in the reconciliation are included in Net Gain (Loss) on the Fund's consolidated Statement of Operations. | |
Consolidated Financial Statements
| Consolidated Statement of Assets and Liabilities |
As of July 31, 2024 |
| Assets | | | | |
| Investment in securities, at value (including securities loaned of $274,241,124) - See accompanying schedule: | | | | |
Unaffiliated issuers (cost $5,812,711,127) | $ | 7,414,196,829 | | |
Fidelity Central Funds (cost $329,564,148) | | 329,564,148 | | |
Other affiliated issuers (cost $36,472,717) | | 32,890,851 | | |
| | | | | |
| | | | | |
| Total Investment in Securities (cost $6,178,747,992) | | | $ | 7,776,651,828 |
| Cash | | | | 221,113 |
| Foreign currency held at value (cost $13) | | | | 13 |
| Receivable for investments sold | | | | 7,921,647 |
| Unrealized appreciation on unfunded commitments | | | | 2,547,122 |
| Receivable for fund shares sold | | | | 7,315,900 |
| Dividends receivable | | | | 313,203 |
| Interest receivable | | | | 99,192 |
| Distributions receivable from Fidelity Central Funds | | | | 482,768 |
| Prepaid expenses | | | | 1,434 |
| Other receivables | | | | 206 |
Total assets | | | | 7,795,554,426 |
| Liabilities | | | | |
| Payable for investments purchased | $ | 19,396,403 | | |
| Payable for fund shares redeemed | | 3,815,472 | | |
| Accrued management fee | | 5,351,500 | | |
| Distribution and service plan fees payable | | 159,638 | | |
| Other payables and accrued expenses | | 202,231 | | |
| Collateral on securities loaned | | 277,049,913 | | |
| Total liabilities | | | | 305,975,157 |
| Commitments and contingent liabilities (see Commitments note) | | | | |
| Net Assets | | | $ | 7,489,579,269 |
| Net Assets consist of: | | | | |
| Paid in capital | | | $ | 5,893,909,478 |
| Total accumulated earnings (loss) | | | | 1,595,669,791 |
| Net Assets | | | $ | 7,489,579,269 |
| | | | | |
| Net Asset Value and Maximum Offering Price | | | | |
| Class A : | | | | |
Net Asset Value and redemption price per share ($388,894,256 ÷ 12,694,903 shares)(a) | | | $ | 30.63 |
| Maximum offering price per share (100/94.25 of $30.63) | | | $ | 32.50 |
| Class M : | | | | |
Net Asset Value and redemption price per share ($96,687,784 ÷ 3,359,045 shares)(a) | | | $ | 28.78 |
| Maximum offering price per share (100/96.50 of $28.78) | | | $ | 29.82 |
| Class C : | | | | |
Net Asset Value and offering price per share ($52,766,714 ÷ 2,138,765 shares)(a) | | | $ | 24.67 |
| Small Cap Growth : | | | | |
Net Asset Value, offering price and redemption price per share ($3,194,599,272 ÷ 96,626,851 shares) | | | $ | 33.06 |
| Class I : | | | | |
Net Asset Value, offering price and redemption price per share ($1,228,750,765 ÷ 37,058,025 shares) | | | $ | 33.16 |
| Class Z : | | | | |
Net Asset Value, offering price and redemption price per share ($2,527,880,478 ÷ 75,580,613 shares) | | | $ | 33.45 |
(a)Redemption price per share is equal to net asset value less any applicable contingent deferred sales charge. |
| Consolidated Statement of Operations |
| Year ended July 31, 2024 |
| Investment Income | | | | |
| Dividends | | | $ | 27,861,114 |
| Interest | | | | 78,362 |
| Income from Fidelity Central Funds (including $1,957,179 from security lending) | | | | 4,472,806 |
| Total income | | | | 32,412,282 |
| Expenses | | | | |
| Management fee | | | | |
| Basic fee | $ | 42,056,375 | | |
| Performance adjustment | | 9,461,894 | | |
| Transfer agent fees | | 4,109,050 | | |
| Distribution and service plan fees | | 1,671,196 | | |
| Accounting fees | | 577,647 | | |
| Custodian fees and expenses | | 122,889 | | |
| Independent trustees' fees and expenses | | 27,461 | | |
| Registration fees | | 187,535 | | |
| Audit fees | | 88,174 | | |
| Legal | | 10,537 | | |
| Interest | | 82,734 | | |
| Miscellaneous | | 81,955 | | |
| Total expenses before reductions | | 58,477,447 | | |
| Expense reductions | | (350,870) | | |
| Total expenses after reductions | | | | 58,126,577 |
| Net Investment income (loss) | | | | (25,714,295) |
| Realized and Unrealized Gain (Loss) | | | | |
| Net realized gain (loss) on: | | | | |
| Investment Securities: | | | | |
| Unaffiliated issuers | | 439,570,451 | | |
| Redemptions in-kind | | 10,828,045 | | |
| Fidelity Central Funds | | (4,277) | | |
| Other affiliated issuers | | (15,272,089) | | |
| Foreign currency transactions | | 76,405 | | |
| Total net realized gain (loss) | | | | 435,198,535 |
| Change in net unrealized appreciation (depreciation) on: | | | | |
| Investment Securities: | | | | |
| Unaffiliated issuers | | 793,448,585 | | |
| Affiliated issuers | | 11,824,867 | | |
| Unfunded commitments | | 2,547,122 | | |
| Assets and liabilities in foreign currencies | | 3,341 | | |
| Total change in net unrealized appreciation (depreciation) | | | | 807,823,915 |
| Net gain (loss) | | | | 1,243,022,450 |
| Net increase (decrease) in net assets resulting from operations | | | $ | 1,217,308,155 |
| Consolidated Statement of Changes in Net Assets |
| |
| | Year ended July 31, 2024 | | Year ended July 31, 2023 |
| Increase (Decrease) in Net Assets | | | | |
| Operations | | | | |
| Net investment income (loss) | $ | (25,714,295) | $ | (22,495,635) |
| Net realized gain (loss) | | 435,198,535 | | (88,790,257) |
| Change in net unrealized appreciation (depreciation) | | 807,823,915 | | 601,413,550 |
| Net increase (decrease) in net assets resulting from operations | | 1,217,308,155 | | 490,127,658 |
| Share transactions - net increase (decrease) | | 784,026,430 | | (238,473,369) |
| Total increase (decrease) in net assets | | 2,001,334,585 | | 251,654,289 |
| | | | | |
| Net Assets | | | | |
| Beginning of period | | 5,488,244,684 | | 5,236,590,395 |
| End of period | $ | 7,489,579,269 | $ | 5,488,244,684 |
| | | | | |
| | | | | |
Consolidated Financial Highlights
Fidelity Advisor® Small Cap Growth Fund Class A |
| |
| Years ended July 31, | | 2024 | | 2023 | | 2022 | | 2021 | | 2020 |
Selected Per-Share Data | | | | | | | | | | |
| Net asset value, beginning of period | $ | 25.34 | $ | 23.12 | $ | 34.89 | $ | 26.64 | $ | 26.03 |
| Income from Investment Operations | | | | | | | | | | |
Net investment income (loss) A,B | | (.19) | | (.17) | | (.17) | | (.26) C | | (.20) |
| Net realized and unrealized gain (loss) | | 5.48 | | 2.39 | | (5.58) | | 11.27 | | 2.26 |
| Total from investment operations | | 5.29 | | 2.22 | | (5.75) | | 11.01 | | 2.06 |
| Distributions from net realized gain | | - | | - | | (6.02) | | (2.76) | | (1.45) |
| Total distributions | | - | | - | | (6.02) | | (2.76) | | (1.45) |
| Net asset value, end of period | $ | 30.63 | $ | 25.34 | $ | 23.12 | $ | 34.89 | $ | 26.64 |
Total Return D,E | | | | 9.60% | | (20.62)% | | 44.21% | | 8.39% |
Ratios to Average Net Assets B,F,G | | | | | | | | | | |
| Expenses before reductions | | 1.27% | | 1.32% | | 1.29% | | 1.29% | | 1.37% |
| Expenses net of fee waivers, if any | | | | 1.32% | | 1.29% | | 1.29% | | 1.37% |
| Expenses net of all reductions | | 1.26% | | 1.32% | | 1.29% | | 1.28% | | 1.36% |
| Net investment income (loss) | | (.71)% | | (.71)% | | (.61)% | | (.82)% C | | (.80)% |
| Supplemental Data | | | | | | | | | | |
| Net assets, end of period (000 omitted) | $ | 388,894 | $ | 295,801 | $ | 287,905 | $ | 387,793 | $ | 268,448 |
Portfolio turnover rate H | | | | 75% I | | 79% I | | 107% | | 126% I |
ACalculated based on average shares outstanding during the period.
BNet investment income (loss) is affected by the timing of the declaration of dividends by any underlying mutual funds or exchange-traded funds (ETFs). Net investment income (loss) of any mutual funds or ETFs is not included in the Fund's net investment income (loss) ratio.
CNet investment income per share reflects one or more large, non-recurring dividend(s) which amounted to $.03 per share. Excluding such non-recurring dividend(s), the ratio of net investment income (loss) to average net assets would have been (.91)%.
DTotal returns would have been lower if certain expenses had not been reduced during the applicable periods shown.
ETotal returns do not include the effect of the sales charges.
FFees and expenses of any underlying mutual funds or exchange-traded funds (ETFs) are not included in the Fund's expense ratio. The Fund indirectly bears its proportionate share of these expenses. For additional expense information related to investments in Fidelity Central Funds, please refer to the "Investments in Fidelity Central Funds" note found in the Notes to Consolidated Financial Statements section of the most recent Annual or Semi-Annual report.
GExpense ratios reflect operating expenses of the class. Expenses before reductions do not reflect amounts reimbursed, waived, or reduced through arrangements with the investment adviser, brokerage services, or other offset arrangements, if applicable, and do not represent the amount paid by the class during periods when reimbursements, waivers or reductions occur.
HAmount does not include the portfolio activity of any underlying mutual funds or exchange-traded funds (ETFs).
IPortfolio turnover rate excludes securities received or delivered in-kind.
Fidelity Advisor® Small Cap Growth Fund Class M |
| |
| Years ended July 31, | | 2024 | | 2023 | | 2022 | | 2021 | | 2020 |
Selected Per-Share Data | | | | | | | | | | |
| Net asset value, beginning of period | $ | 23.87 | $ | 21.83 | $ | 33.27 | $ | 25.56 | $ | 25.09 |
| Income from Investment Operations | | | | | | | | | | |
Net investment income (loss) A,B | | (.24) | | (.21) | | (.22) | | (.33) C | | (.25) |
| Net realized and unrealized gain (loss) | | 5.15 | | 2.25 | | (5.28) | | 10.77 | | 2.17 |
| Total from investment operations | | 4.91 | | 2.04 | | (5.50) | | 10.44 | | 1.92 |
| Distributions from net realized gain | | - | | - | | (5.94) | | (2.73) | | (1.45) |
| Total distributions | | - | | - | | (5.94) | | (2.73) | | (1.45) |
| Net asset value, end of period | $ | 28.78 | $ | 23.87 | $ | 21.83 | $ | 33.27 | $ | 25.56 |
Total Return D,E | | | | 9.34% | | (20.85)% | | 43.82% | | 8.14% |
Ratios to Average Net Assets B,F,G | | | | | | | | | | |
| Expenses before reductions | | 1.52% | | 1.58% | | 1.54% | | 1.55% | | 1.63% |
| Expenses net of fee waivers, if any | | | | 1.57% | | 1.54% | | 1.55% | | 1.63% |
| Expenses net of all reductions | | 1.51% | | 1.57% | | 1.54% | | 1.53% | | 1.62% |
| Net investment income (loss) | | (.97)% | | (.97)% | | (.86)% | | (1.08)% C | | (1.06)% |
| Supplemental Data | | | | | | | | | | |
| Net assets, end of period (000 omitted) | $ | 96,688 | $ | 76,283 | $ | 70,182 | $ | 98,005 | $ | 70,605 |
Portfolio turnover rate H | | | | 75% I | | 79% I | | 107% | | 126% I |
ACalculated based on average shares outstanding during the period.
BNet investment income (loss) is affected by the timing of the declaration of dividends by any underlying mutual funds or exchange-traded funds (ETFs). Net investment income (loss) of any mutual funds or ETFs is not included in the Fund's net investment income (loss) ratio.
CNet investment income per share reflects one or more large, non-recurring dividend(s) which amounted to $.03 per share. Excluding such non-recurring dividend(s), the ratio of net investment income (loss) to average net assets would have been (1.17)%.
DTotal returns would have been lower if certain expenses had not been reduced during the applicable periods shown.
ETotal returns do not include the effect of the sales charges.
FFees and expenses of any underlying mutual funds or exchange-traded funds (ETFs) are not included in the Fund's expense ratio. The Fund indirectly bears its proportionate share of these expenses. For additional expense information related to investments in Fidelity Central Funds, please refer to the "Investments in Fidelity Central Funds" note found in the Notes to Consolidated Financial Statements section of the most recent Annual or Semi-Annual report.
GExpense ratios reflect operating expenses of the class. Expenses before reductions do not reflect amounts reimbursed, waived, or reduced through arrangements with the investment adviser, brokerage services, or other offset arrangements, if applicable, and do not represent the amount paid by the class during periods when reimbursements, waivers or reductions occur.
HAmount does not include the portfolio activity of any underlying mutual funds or exchange-traded funds (ETFs).
IPortfolio turnover rate excludes securities received or delivered in-kind.
Fidelity Advisor® Small Cap Growth Fund Class C |
| |
| Years ended July 31, | | 2024 | | 2023 | | 2022 | | 2021 | | 2020 |
Selected Per-Share Data | | | | | | | | | | |
| Net asset value, beginning of period | $ | 20.56 | $ | 18.90 | $ | 29.58 | $ | 23.07 | $ | 22.89 |
| Income from Investment Operations | | | | | | | | | | |
Net investment income (loss) A,B | | (.31) | | (.28) | | (.31) | | (.43) C | | (.34) |
| Net realized and unrealized gain (loss) | | 4.42 | | 1.94 | | (4.54) | | 9.62 | | 1.97 |
| Total from investment operations | | 4.11 | | 1.66 | | (4.85) | | 9.19 | | 1.63 |
| Distributions from net realized gain | | - | | - | | (5.83) | | (2.68) | | (1.45) |
| Total distributions | | - | | - | | (5.83) | | (2.68) | | (1.45) |
| Net asset value, end of period | $ | 24.67 | $ | 20.56 | $ | 18.90 | $ | 29.58 | $ | 23.07 |
Total Return D,E | | | | 8.78% | | (21.24)% | | 43.07% | | 7.62% |
Ratios to Average Net Assets B,F,G | | | | | | | | | | |
| Expenses before reductions | | 2.03% | | 2.08% | | 2.05% | | 2.06% | | 2.13% |
| Expenses net of fee waivers, if any | | | | 2.08% | | 2.05% | | 2.06% | | 2.13% |
| Expenses net of all reductions | | 2.02% | | 2.08% | | 2.05% | | 2.05% | | 2.12% |
| Net investment income (loss) | | (1.47)% | | (1.48)% | | (1.37)% | | (1.59)% C | | (1.56)% |
| Supplemental Data | | | | | | | | | | |
| Net assets, end of period (000 omitted) | $ | 52,767 | $ | 51,891 | $ | 59,768 | $ | 88,239 | $ | 77,850 |
Portfolio turnover rate H | | | | 75% I | | 79% I | | 107% | | 126% I |
ACalculated based on average shares outstanding during the period.
BNet investment income (loss) is affected by the timing of the declaration of dividends by any underlying mutual funds or exchange-traded funds (ETFs). Net investment income (loss) of any mutual funds or ETFs is not included in the Fund's net investment income (loss) ratio.
CNet investment income per share reflects one or more large, non-recurring dividend(s) which amounted to $.02 per share. Excluding such non-recurring dividend(s), the ratio of net investment income (loss) to average net assets would have been (1.68)%.
DTotal returns would have been lower if certain expenses had not been reduced during the applicable periods shown.
ETotal returns do not include the effect of the contingent deferred sales charge.
FFees and expenses of any underlying mutual funds or exchange-traded funds (ETFs) are not included in the Fund's expense ratio. The Fund indirectly bears its proportionate share of these expenses. For additional expense information related to investments in Fidelity Central Funds, please refer to the "Investments in Fidelity Central Funds" note found in the Notes to Consolidated Financial Statements section of the most recent Annual or Semi-Annual report.
GExpense ratios reflect operating expenses of the class. Expenses before reductions do not reflect amounts reimbursed, waived, or reduced through arrangements with the investment adviser, brokerage services, or other offset arrangements, if applicable, and do not represent the amount paid by the class during periods when reimbursements, waivers or reductions occur.
HAmount does not include the portfolio activity of any underlying mutual funds or exchange-traded funds (ETFs).
IPortfolio turnover rate excludes securities received or delivered in-kind.
Fidelity® Small Cap Growth Fund |
| |
| Years ended July 31, | | 2024 | | 2023 | | 2022 | | 2021 | | 2020 |
Selected Per-Share Data | | | | | | | | | | |
| Net asset value, beginning of period | $ | 27.27 | $ | 24.81 | $ | 37.02 | $ | 28.07 | $ | 27.27 |
| Income from Investment Operations | | | | | | | | | | |
Net investment income (loss) A,B | | (.12) | | (.11) | | (.10) | | (.18) C | | (.13) |
| Net realized and unrealized gain (loss) | | 5.91 | | 2.57 | | (6.00) | | 11.92 | | 2.38 |
| Total from investment operations | | 5.79 | | 2.46 | | (6.10) | | 11.74 | | 2.25 |
| Distributions from net realized gain | | - | | - | | (6.11) | | (2.79) | | (1.45) |
| Total distributions | | - | | - | | (6.11) | | (2.79) | | (1.45) |
| Net asset value, end of period | $ | 33.06 | $ | 27.27 | $ | 24.81 | $ | 37.02 | $ | 28.07 |
Total Return D | | | | 9.92% | | (20.42)% | | 44.60% | | 8.72% |
Ratios to Average Net Assets B,E,F | | | | | | | | | | |
| Expenses before reductions | | .99% | | 1.05% | | 1.02% | | 1.00% | | 1.08% |
| Expenses net of fee waivers, if any | | | | 1.05% | | 1.01% | | 1.00% | | 1.08% |
| Expenses net of all reductions | | .98% | | 1.05% | | 1.01% | | .99% | | 1.07% |
| Net investment income (loss) | | (.43)% | | (.44)% | | (.33)% | | (.53)% C | | (.52)% |
| Supplemental Data | | | | | | | | | | |
| Net assets, end of period (000 omitted) | $ | 3,194,599 | $ | 2,766,171 | $ | 2,747,002 | $ | 4,540,695 | $ | 2,839,506 |
Portfolio turnover rate G | | | | 75% H | | 79% H | | 107% | | 126% H |
ACalculated based on average shares outstanding during the period.
BNet investment income (loss) is affected by the timing of the declaration of dividends by any underlying mutual funds or exchange-traded funds (ETFs). Net investment income (loss) of any mutual funds or ETFs is not included in the Fund's net investment income (loss) ratio.
CNet investment income per share reflects one or more large, non-recurring dividend(s) which amounted to $.03 per share. Excluding such non-recurring dividend(s), the ratio of net investment income (loss) to average net assets would have been (.62)%.
DTotal returns would have been lower if certain expenses had not been reduced during the applicable periods shown.
EFees and expenses of any underlying mutual funds or exchange-traded funds (ETFs) are not included in the Fund's expense ratio. The Fund indirectly bears its proportionate share of these expenses. For additional expense information related to investments in Fidelity Central Funds, please refer to the "Investments in Fidelity Central Funds" note found in the Notes to Consolidated Financial Statements section of the most recent Annual or Semi-Annual report.
FExpense ratios reflect operating expenses of the class. Expenses before reductions do not reflect amounts reimbursed, waived, or reduced through arrangements with the investment adviser, brokerage services, or other offset arrangements, if applicable, and do not represent the amount paid by the class during periods when reimbursements, waivers or reductions occur.
GAmount does not include the portfolio activity of any underlying mutual funds or exchange-traded funds (ETFs).
HPortfolio turnover rate excludes securities received or delivered in-kind.
Fidelity Advisor® Small Cap Growth Fund Class I |
| |
| Years ended July 31, | | 2024 | | 2023 | | 2022 | | 2021 | | 2020 |
Selected Per-Share Data | | | | | | | | | | |
| Net asset value, beginning of period | $ | 27.36 | $ | 24.90 | $ | 37.13 | $ | 28.15 | $ | 27.35 |
| Income from Investment Operations | | | | | | | | | | |
Net investment income (loss) A,B | | (.13) | | (.11) | | (.10) | | (.19) C | | (.14) |
| Net realized and unrealized gain (loss) | | 5.93 | | 2.57 | | (6.03) | | 11.96 | | 2.39 |
| Total from investment operations | | 5.80 | | 2.46 | | (6.13) | | 11.77 | | 2.25 |
| Distributions from net realized gain | | - | | - | | (6.10) | | (2.79) | | (1.45) |
| Total distributions | | - | | - | | (6.10) | | (2.79) | | (1.45) |
| Net asset value, end of period | $ | 33.16 | $ | 27.36 | $ | 24.90 | $ | 37.13 | $ | 28.15 |
Total Return D | | | | 9.88% | | (20.42)% | | 44.57% | | 8.70% |
Ratios to Average Net Assets B,E,F | | | | | | | | | | |
| Expenses before reductions | | 1.01% | | 1.07% | | 1.04% | | 1.04% | | 1.11% |
| Expenses net of fee waivers, if any | | | | 1.06% | | 1.03% | | 1.04% | | 1.11% |
| Expenses net of all reductions | | 1.01% | | 1.06% | | 1.03% | | 1.03% | | 1.10% |
| Net investment income (loss) | | (.46)% | | (.46)% | | (.35)% | | (.57)% C | | (.54)% |
| Supplemental Data | | | | | | | | | | |
| Net assets, end of period (000 omitted) | $ | 1,228,751 | $ | 660,166 | $ | 606,422 | $ | 775,746 | $ | 540,553 |
Portfolio turnover rate G | | | | 75% H | | 79% H | | 107% | | 126% H |
ACalculated based on average shares outstanding during the period.
BNet investment income (loss) is affected by the timing of the declaration of dividends by any underlying mutual funds or exchange-traded funds (ETFs). Net investment income (loss) of any mutual funds or ETFs is not included in the Fund's net investment income (loss) ratio.
CNet investment income per share reflects one or more large, non-recurring dividend(s) which amounted to $.03 per share. Excluding such non-recurring dividend(s), the ratio of net investment income (loss) to average net assets would have been (.66)%.
DTotal returns would have been lower if certain expenses had not been reduced during the applicable periods shown.
EFees and expenses of any underlying mutual funds or exchange-traded funds (ETFs) are not included in the Fund's expense ratio. The Fund indirectly bears its proportionate share of these expenses. For additional expense information related to investments in Fidelity Central Funds, please refer to the "Investments in Fidelity Central Funds" note found in the Notes to Consolidated Financial Statements section of the most recent Annual or Semi-Annual report.
FExpense ratios reflect operating expenses of the class. Expenses before reductions do not reflect amounts reimbursed, waived, or reduced through arrangements with the investment adviser, brokerage services, or other offset arrangements, if applicable, and do not represent the amount paid by the class during periods when reimbursements, waivers or reductions occur.
GAmount does not include the portfolio activity of any underlying mutual funds or exchange-traded funds (ETFs).
HPortfolio turnover rate excludes securities received or delivered in-kind.
Fidelity Advisor® Small Cap Growth Fund Class Z |
| |
| Years ended July 31, | | 2024 | | 2023 | | 2022 | | 2021 | | 2020 |
Selected Per-Share Data | | | | | | | | | | |
| Net asset value, beginning of period | $ | 27.56 | $ | 25.04 | $ | 37.32 | $ | 28.26 | $ | 27.41 |
| Income from Investment Operations | | | | | | | | | | |
Net investment income (loss) A,B | | (.09) | | (.08) | | (.06) | | (.15) C | | (.10) |
| Net realized and unrealized gain (loss) | | 5.98 | | 2.60 | | (6.06) | | 12.01 | | 2.40 |
| Total from investment operations | | 5.89 | | 2.52 | | (6.12) | | 11.86 | | 2.30 |
| Distributions from net realized gain | | - | | - | | (6.16) | | (2.80) | | (1.45) |
| Total distributions | | - | | - | | (6.16) | | (2.80) | | (1.45) |
| Net asset value, end of period | $ | 33.45 | $ | 27.56 | $ | 25.04 | $ | 37.32 | $ | 28.26 |
Total Return D | | | | 10.06% | | (20.33)% | | 44.75% | | 8.87% |
Ratios to Average Net Assets B,E,F | | | | | | | | | | |
| Expenses before reductions | | .88% | | .93% | | .90% | | .90% | | .97% |
| Expenses net of fee waivers, if any | | | | .92% | | .90% | | .90% | | .96% |
| Expenses net of all reductions | | .88% | | .92% | | .90% | | .89% | | .95% |
| Net investment income (loss) | | (.33)% | | (.32)% | | (.22)% | | (.43)% C | | (.40)% |
| Supplemental Data | | | | | | | | | | |
| Net assets, end of period (000 omitted) | $ | 2,527,880 | $ | 1,637,933 | $ | 1,465,312 | $ | 366,620 | $ | 197,764 |
Portfolio turnover rate G | | | | 75% H | | 79% H | | 107% | | 126% H |
ACalculated based on average shares outstanding during the period.
BNet investment income (loss) is affected by the timing of the declaration of dividends by any underlying mutual funds or exchange-traded funds (ETFs). Net investment income (loss) of any mutual funds or ETFs is not included in the Fund's net investment income (loss) ratio.
CNet investment income per share reflects one or more large, non-recurring dividend(s) which amounted to $.03 per share. Excluding such non-recurring dividend(s), the ratio of net investment income (loss) to average net assets would have been (.52)%.
DTotal returns would have been lower if certain expenses had not been reduced during the applicable periods shown.
EFees and expenses of any underlying mutual funds or exchange-traded funds (ETFs) are not included in the Fund's expense ratio. The Fund indirectly bears its proportionate share of these expenses. For additional expense information related to investments in Fidelity Central Funds, please refer to the "Investments in Fidelity Central Funds" note found in the Notes to Consolidated Financial Statements section of the most recent Annual or Semi-Annual report.
FExpense ratios reflect operating expenses of the class. Expenses before reductions do not reflect amounts reimbursed, waived, or reduced through arrangements with the investment adviser, brokerage services, or other offset arrangements, if applicable, and do not represent the amount paid by the class during periods when reimbursements, waivers or reductions occur.
GAmount does not include the portfolio activity of any underlying mutual funds or exchange-traded funds (ETFs).
HPortfolio turnover rate excludes securities received or delivered in-kind.
Notes to Consolidated Financial Statements
For the period ended July 31, 2024
1. Organization.
Fidelity Small Cap Growth Fund (the Fund) is a fund of Fidelity Securities Fund (the Trust) and is authorized to issue an unlimited number of shares. The Trust is registered under the Investment Company Act of 1940, as amended (the 1940 Act), as an open-end management investment company organized as a Massachusetts business trust. The Fund offers Class A, Class M, Class C, Small Cap Growth, Class I and Class Z shares, each of which has equal rights as to assets and voting privileges. Class A, Class M, Class C, Class I and Class Z are Fidelity Advisor classes. Each class has exclusive voting rights with respect to matters that affect that class. Class C shares will automatically convert to Class A shares after a holding period of eight years from the initial date of purchase, with certain exceptions.
2. Investments in Fidelity Central Funds.
Funds may invest in Fidelity Central Funds, which are open-end investment companies generally available only to other investment companies and accounts managed by the investment adviser and its affiliates. The Consolidated Schedule of Investments lists any Fidelity Central Funds held as an investment as of period end, but does not include the underlying holdings of each Fidelity Central Fund. An investing fund indirectly bears its proportionate share of the expenses of the underlying Fidelity Central Funds.
Based on its investment objective, each Fidelity Central Fund may invest or participate in various investment vehicles or strategies that are similar to those of the investing fund. These strategies are consistent with the investment objectives of the investing fund and may involve certain economic risks which may cause a decline in value of each of the Fidelity Central Funds and thus a decline in the value of the investing fund.
| Fidelity Central Fund | Investment Manager | Investment Objective | Investment Practices | Expense RatioA |
| Fidelity Money Market Central Funds | Fidelity Management & Research Company LLC (FMR) | Each fund seeks to obtain a high level of current income consistent with the preservation of capital and liquidity. | Short-term Investments | Less than .005% |
A Expenses expressed as a percentage of average net assets and are as of each underlying Central Fund's most recent annual or semi-annual shareholder report.
A complete unaudited list of holdings for each Fidelity Central Fund is available upon request or at the Securities and Exchange Commission website at www.sec.gov. In addition, the financial statements of the Fidelity Central Funds which contain the significant accounting policies (including investment valuation policies) of those funds, and are not covered by the Report of Independent Registered Public Accounting Firm, are available on the Securities and Exchange Commission website or upon request.
3. Significant Accounting Policies.
The Fund is an investment company and applies the accounting and reporting guidance of the Financial Accounting Standards Board (FASB) Accounting Standards Codification Topic 946 Financial Services - Investment Companies. The consolidated financial statements have been prepared in conformity with accounting principles generally accepted in the United States of America (GAAP), which require management to make certain estimates and assumptions at the date of the consolidated financial statements. Actual results could differ from those estimates. Subsequent events, if any, through the date that the consolidated financial statements were issued have been evaluated in the preparation of the consolidated financial statements. The Fund's Consolidated Schedule of Investments lists any underlying mutual funds or exchange-traded funds (ETFs) but does not include the underlying holdings of these funds. The following summarizes the significant accounting policies of the Fund:
Investment Valuation. Investments are valued as of 4:00 p.m. Eastern time on the last calendar day of the period. The Board of Trustees (the Board) has designated the Fund's investment adviser as the valuation designee responsible for the fair valuation function and performing fair value determinations as needed. The investment adviser has established a Fair Value Committee (the Committee) to carry out the day-to-day fair valuation responsibilities and has adopted policies and procedures to govern the fair valuation process and the activities of the Committee. In accordance with these fair valuation policies and procedures, which have been approved by the Board, the Fund attempts to obtain prices from one or more third party pricing services or brokers to value its investments. When current market prices, quotations or currency exchange rates are not readily available or reliable, investments will be fair valued in good faith by the Committee, in accordance with the policies and procedures. Factors used in determining fair value vary by investment type and may include market or investment specific events, transaction data, estimated cash flows, and market observations of comparable investments. The frequency that the fair valuation procedures are used cannot be predicted and they may be utilized to a significant extent. The Committee manages the Fund's fair valuation practices and maintains the fair valuation policies and procedures. The Fund's investment adviser reports to the Board information regarding the fair valuation process and related material matters.
The Fund categorizes the inputs to valuation techniques used to value its investments into a disclosure hierarchy consisting of three levels as shown below:
Level 1 - unadjusted quoted prices in active markets for identical investments
Level 2 - other significant observable inputs (including quoted prices for similar investments, interest rates, prepayment speeds, etc.)
Level 3 - unobservable inputs (including the Fund's own assumptions based on the best information available)
Valuation techniques used to value the Fund's investments by major category are as follows:
Equity securities, including restricted securities, for which market quotations are readily available, are valued at the last reported sale price or official closing price as reported by a third party pricing service on the primary market or exchange on which they are traded and are categorized as Level 1 in the hierarchy. In the event there were no sales during the day or closing prices are not available, securities are valued at the last quoted bid price or may be valued using the last available price and are generally categorized as Level 2 in the hierarchy. For foreign equity securities, when market or security specific events arise, comparisons to the valuation of American Depositary Receipts (ADRs), futures contracts, Exchange-Traded Funds (ETFs) and certain indexes as well as quoted prices for similar securities may be used and would be categorized as Level 2 in the hierarchy. For equity securities, including restricted securities, where observable inputs are limited, assumptions about market activity and risk are used and these securities may be categorized as Level 3 in the hierarchy. Securities, including private placements or other restricted securities, for which observable inputs are not available are valued using alternate valuation approaches, including the market approach, the income approach and cost approach, and are categorized as Level 3 in the hierarchy. The market approach considers factors including the price of recent investments in the same or a similar security or financial metrics of comparable securities. The income approach considers factors including expected future cash flows, security specific risks and corresponding discount rates. The cost approach considers factors including the value of the security's underlying assets and liabilities.
Debt securities, including restricted securities, are valued based on evaluated prices received from third party pricing services or from brokers who make markets in such securities. Corporate bonds are valued by pricing services who utilize matrix pricing which considers yield or price of bonds of comparable quality, coupon, maturity and type or by broker-supplied prices. When independent prices are unavailable or unreliable, debt securities may be valued utilizing pricing methodologies which consider similar factors that would be used by third party pricing services. Debt securities are generally categorized as Level 2 in the hierarchy but may be Level 3 depending on the circumstances.
Investments in open-end mutual funds, including the Fidelity Central Funds, are valued at their closing net asset value (NAV) each business day and are categorized as Level 1 in the hierarchy.
The following provides information on Level 3 securities held by the Fund that were valued at period end based on unobservable inputs. These amounts exclude valuations provided by a broker.
| Asset Type | Fair Value | Valuation Technique(s) | Unobservable Input | Amount or Range/Weighted Average | Impact to Valuation from an Increase in InputA |
| Equities | $168,172,662 | Recovery value | Recovery value | $0.00 | Increase |
| | | Market approach | Transaction price | $1.13 - $8.61 / $3.69 | Increase |
| | | | Discount rate | 30.0% - 75.0% / 55.8% | Decrease |
| | | | Premium rate | 10.0% - 15.0% / 13.4% | Increase |
| | | Market comparable | Enterprise value/Revenue multiple (EV/R) | 2.8 - 12.0 / 6.7 | Increase |
| | | | Enterprise value/Net income multiple (EV/NI) | 16.0 | Increase |
| | | Black scholes | Discount rate | 4.1% - 4.2% / 4.2% | Increase |
| | | | Volatility | 50.0% - 90.0% / 79.2% | Increase |
| | | | Term | 3.0 | Increase |
| Corporate Bonds | $1,411,227 | Recovery value | Recovery value | $0.00 | Increase |
| | | Market approach | Transaction price | $100.00 | Increase |
| | | | Discount rate | 23.5% | Decrease |
| | | | Probability rate | 0.0% - 33.3% / 16.7% | Increase |
A Represents the directional change in the fair value of the Level 3 investments that could have resulted from an increase in the corresponding input as of period end. A decrease to the unobservable input would have had the opposite effect. Significant changes in these inputs may have resulted in a significantly higher or lower fair value measurement at period end.
Changes in valuation techniques may result in transfers in or out of an assigned level within the disclosure hierarchy. The aggregate value of investments by input level as of July 31, 2024, as well as a roll forward of Level 3 investments, is included at the end of the Fund's Consolidated Schedule of Investments.
Foreign Currency. Certain Funds may use foreign currency contracts to facilitate transactions in foreign-denominated securities. Gains and losses from these transactions may arise from changes in the value of the foreign currency or if the counterparties do not perform under the contracts' terms.
Foreign-denominated assets, including investment securities, and liabilities are translated into U.S. dollars at the exchange rates at period end. Purchases and sales of investment securities, income and dividends received, and expenses denominated in foreign currencies are translated into U.S. dollars at the exchange rate in effect on the transaction date.
The effects of exchange rate fluctuations on investments are included with the net realized and unrealized gain (loss) on investment securities. Other foreign currency transactions resulting in realized and unrealized gain (loss) are disclosed separately.
Investment Transactions and Income. For financial reporting purposes, the Fund's investment holdings and NAV include trades executed through the end of the last business day of the period. The NAV per share for processing shareholder transactions is calculated as of the close of business of the New York Stock Exchange (NYSE), normally 4:00 p.m. Eastern time and includes trades executed through the end of the prior business day. Gains and losses on securities sold are determined on the basis of identified cost and include proceeds received from litigation. Commissions paid to certain brokers with whom the investment adviser, or its affiliates, places trades on behalf of a fund include an amount in addition to trade execution, which may be rebated back to a fund. Any such rebates are included in net realized gain (loss) on investments in the Consolidated Statement of Operations. Dividend income is recorded on the ex-dividend date, except for certain dividends from foreign securities where the ex-dividend date may have passed, which are recorded as soon as the Fund is informed of the ex-dividend date. Non-cash dividends included in dividend income, if any, are recorded at the fair market value of the securities received. Income and capital gain distributions from Fidelity Central Funds, if any, are recorded on the ex-dividend date. Certain distributions received by the Fund represent a return of capital or capital gain. The Fund determines the components of these distributions subsequent to the ex-dividend date, based upon receipt of tax filings or other correspondence relating to the underlying investment. These distributions are recorded as a reduction of cost of investments and/or as a realized gain. Interest income is accrued as earned and includes coupon interest and amortization of premium and accretion of discount on debt securities as applicable. Investment income is recorded net of foreign taxes withheld where recovery of such taxes is uncertain. Funds may file withholding tax reclaims in certain jurisdictions to recover a portion of amounts previously withheld. Any withholding tax reclaims income is included in the Consolidated Statement of Operations in dividends. Any receivables for withholding tax reclaims are included in the Consolidated Statement of Assets and Liabilities in dividends receivable.
Class Allocations and Expenses. Investment income, realized and unrealized capital gains and losses, common expenses of a fund, and certain fund-level expense reductions, if any, are allocated daily on a pro-rata basis to each class based on the relative net assets of each class to the total net assets of a fund. Each class differs with respect to transfer agent and distribution and service plan fees incurred, as applicable. Certain expense reductions may also differ by class, if applicable. For the reporting period, the allocated portion of income and expenses to each class as a percent of its average net assets may vary due to the timing of recording these transactions in relation to fluctuating net assets of the classes. Expenses directly attributable to a fund are charged to that fund. Expenses attributable to more than one fund are allocated among the respective funds on the basis of relative net assets or other appropriate methods. Expenses included in the accompanying consolidated financial statements reflect the expenses of that fund and do not include any expenses associated with any underlying mutual funds or exchange-traded funds (ETFs). Although not included in a fund's expenses, a fund indirectly bears its proportionate share of these expenses through the net asset value of each underlying mutual fund or exchange-traded fund (ETF). Expense estimates are accrued in the period to which they relate and adjustments are made when actual amounts are known.
Income Tax Information and Distributions to Shareholders. Each year, the Fund intends to qualify as a regulated investment company under Subchapter M of the Internal Revenue Code, including distributing substantially all of its taxable income and realized gains. As a result, no provision for U.S. Federal income taxes is required. As of July 31, 2024, the Fund did not have any unrecognized tax benefits in the consolidated financial statements; nor is the Fund aware of any tax positions for which it is reasonably possible that the total amounts of unrecognized tax benefits will significantly change in the next twelve months. The Fund files a U.S. federal tax return, in addition to state and local tax returns as required. The Fund's federal income tax returns are subject to examination by the Internal Revenue Service (IRS) for a period of three fiscal years after they are filed. State and local tax returns may be subject to examination for an additional fiscal year depending on the jurisdiction. Foreign taxes are provided for based on the Fund's understanding of the tax rules and rates that exist in the foreign markets in which it invests.
Distributions are declared and recorded on the ex-dividend date. Income and capital gain distributions are declared separately for each class. Income and capital gain distributions are determined in accordance with income tax regulations, which may differ from GAAP.
Capital accounts within the consolidated financial statements are adjusted for permanent book-tax differences. These adjustments have no impact on net assets or the results of operations. Capital accounts are not adjusted for temporary book-tax differences which will reverse in a subsequent period.
Book-tax differences are primarily due to foreign currency transactions, passive foreign investment companies (PFIC), partnerships, redemptions in-kind, capital loss carryforwards and losses deferred due to wash sales and excise tax regulations.
As of period end, the cost and unrealized appreciation (depreciation) in securities, and derivatives if applicable, for federal income tax purposes were as follows:
| Gross unrealized appreciation | $1,879,635,386 |
| Gross unrealized depreciation | (382,179,605) |
| Net unrealized appreciation (depreciation) | $1,497,455,781 |
| Tax Cost | $6,281,743,169 |
The tax-based components of distributable earnings as of period end were as follows:
| Undistributed ordinary income | $66,396,053 |
| Undistributed long-term capital gain | $31,820,656 |
| Net unrealized appreciation (depreciation) on securities and other investments | $1,497,450,690 |
Restricted Securities (including Private Placements). Funds may invest in securities that are subject to legal or contractual restrictions on resale. These securities generally may be resold in transactions exempt from registration or to the public if the securities are registered. Disposal of these securities may involve time-consuming negotiations and expense, and prompt sale at an acceptable price may be difficult. Information regarding restricted securities held at period end is included at the end of the Consolidated Schedule of Investments, if applicable.
Commitments. A commitment is an agreement to acquire an investment at a future date (subject to conditions) in connection with a potential public or non-public offering. Commitments outstanding at period end are presented in the table below. Unrealized appreciation (depreciation) on any commitments outstanding at period end is separately presented in the Consolidated Statement of Assets and Liabilities as Unrealized appreciation (depreciation) on unfunded commitments, and any change in unrealized appreciation (depreciation) on unfunded commitments during the period is separately presented in the Consolidated Statement of Operations, as applicable based on contractual conditions of each commitment.
| | Investment to be Acquired | Commitment Amount ($) | Unrealized Appreciation (Depreciation)($) |
| Fidelity Small Cap Growth Fund | Oruka Therapeutics, Inc. | 3,645,180 | 2,547,122 |
Consolidated Subsidiary. The Funds included in the table below hold certain investments through a wholly-owned subsidiary ("Subsidiary"), which may be subject to federal and state taxes upon disposition.
As of period end, investments in Subsidiaries were as follows:
| | Amount ($) | % of Net Assets |
| Fidelity Small Cap Growth Fund | 10,875,316 | .15 |
The financial statements have been consolidated to include the Subsidiary accounts where applicable. Accordingly, all inter-company transactions and balances have been eliminated.
At period end, any estimated tax liability for these investments is presented as "Deferred taxes" in the Consolidated Statement of Assets and Liabilities and included in "Change in net unrealized appreciation (depreciation) on investment securities" in the Consolidated Statement of Operations. The tax liability incurred may differ materially depending on conditions when these investments are disposed. Any cash held by a Subsidiary is restricted as to its use and is presented as "Restricted cash" in the Consolidated Statement of Assets and Liabilities, if applicable.
4. Purchases and Sales of Investments.
Purchases and sales of securities, other than short-term securities and in-kind transactions, as applicable, are noted in the table below.
| | Purchases ($) | Sales ($) |
| Fidelity Small Cap Growth Fund | 5,749,897,079 | 5,006,903,091 |
Unaffiliated Redemptions In-Kind. Shares that were redeemed in-kind for investments, including accrued interest and cash, if any, are shown in the table below. The net realized gain or loss on investments delivered through in-kind redemptions is included in the "Net realized gain (loss) on: Redemptions in-kind" line in the accompanying Consolidated Statement of Operations. The amount of the in-kind redemptions is included in share transactions in the accompanying Consolidated Statement of Changes in Net Assets. There was no gain or loss for federal income tax purposes.
| | Shares | Total net realized gain or loss ($) | Total Proceeds ($) |
| Fidelity Small Cap Growth Fund | 1,196,548 | 10,828,045 | 34,928,214 |
Prior Fiscal Year Unaffiliated Redemptions In-Kind. Shares that were redeemed in-kind for investments, including accrued interest and cash, if any, are shown in the table below; along with realized gain or loss on investments delivered through in-kind redemptions. The amount of the in-kind redemptions is included in share transactions in the accompanying Consolidated Statement of Changes in Net Assets. There was no gain or loss for federal income tax purposes.
| | Shares | Total net realized gain or loss ($) | Total Proceeds ($) |
| Fidelity Small Cap Growth Fund | 4,832,654 | 23,556,784 | 120,866,697 |
5. Fees and Other Transactions with Affiliates.
Management Fee. Fidelity Management & Research Company LLC (the investment adviser) and its affiliates provide the Fund with investment management related services for which the Fund pays a monthly management fee.
Effective March 1, 2024, the Fund's management contract was amended to incorporate administrative services previously covered under separate services agreements (Transfer Agent and Accounting agreements). The amended contract incorporates a basic fee rate that may vary by class (subject to a performance adjustment). The investment adviser or an affiliate pays certain expenses of managing and operating the Fund out of each class's management fee. Each class of the Fund pays a management fee to the investment adviser. The management fee is calculated and paid to the investment adviser every month. The management fee is determined by calculating a basic fee and then applying a performance adjustment. When determining a class's basic fee, a mandate rate is calculated based on the monthly average net assets of a group of funds advised by FMR within a designated asset class. A discount rate is subtracted from the mandate rate once the Fund's monthly average net assets reach a certain level. The mandate rate and discount rate may vary by class. The annual basic fee rate for a class of shares of the Fund is the lesser of (1) the class's mandate rate reduced by the class's discount rate (if applicable) or (2) the amount set forth in the following table.
| | Maximum Management Fee Rate % |
| Class A | .85 |
| Class M | .85 |
| Class C | .86 |
| Small Cap Growth | .83 |
| Class I | .84 |
| Class Z | .70 |
One-twelfth of the basic fee rate for a class is applied to the average net assets of the class for the month, giving a dollar amount which is the basic fee for the class for that month. A different management fee rate may be applicable to each class of the Fund. The difference between classes is the result of separate arrangements for class-level services and/or waivers of certain expenses. It is not the result of any difference in advisory or custodial fees or other expenses related to the management of the Fund's assets, which do not vary by class. For the portion of the reporting period on or after March 1, 2024, the total annualized management fee rates were as follows:
| | Total Management Fee Rate % |
| Class A | .81 |
| Class M | .81 |
| Class C | .81 |
| Small Cap Growth | .77 |
| Class I | .81 |
| Class Z | .69 |
Prior to March 1, 2024, the management fee was the sum of an individual fund fee rate that was based on an annual rate of .45% of the Fund's average net assets and an annualized group fee rate that averaged .22% during the period. The group fee rate was based upon the monthly average net assets of a group of registered investment companies with which the investment adviser has management contracts. The group fee rate decreased as assets under management increased and increased as assets under management decreased. For the portion of the reporting period prior to March 1, 2024, the total annualized management fee rate was .67%.
The performance adjustment rate is calculated monthly by comparing over the performance period the Fund's performance to that of the performance adjustment index listed below.
| | Performance Adjustment Index |
| Fidelity Small Cap Growth Fund | Russell 2000 Growth Index |
For the purposes of calculating the performance adjustment for the Fund, the Fund's investment performance is based on the performance of Small Cap Growth. To the extent that other classes of the Fund have higher expenses, this could result in those classes bearing a larger positive performance adjustment and smaller negative performance adjustment than would be the case if each class's own performance were considered. The performance period is the most recent 36 month period. The maximum annualized performance adjustment rate is +/-.20% of the Fund's average net assets over the performance period. The performance adjustment rate is divided by twelve and multiplied by the Fund's average net assets over the performance period, and the resulting dollar amount is proportionately added to or subtracted from a class's basic fee. For the entire reporting period, the total annual performance adjustment was .16%.
Effective March 1, 2024, the Fund's sub-advisory agreements with FMR Investment Management (UK) Limited, Fidelity Management & Research (Hong Kong) Limited, and Fidelity Management & Research (Japan) Limited were amended to provide that the investment adviser pays each sub-adviser monthly fees equal to 110% of the sub-adviser's costs for providing sub-advisory services.
Distribution and Service Plan Fees. In accordance with Rule 12b-1 of the 1940 Act, the Fund has adopted separate Distribution and Service Plans for each class of shares. Certain classes pay Fidelity Distributors Company LLC (FDC), an affiliate of the investment adviser, separate Distribution and Service Fees, each of which is based on an annual percentage of each class' average net assets. In addition, FDC may pay financial intermediaries for selling shares of the Fund and providing shareholder support services. For the period, the Distribution and Service Fee rates, total fees and amounts retained by FDC were as follows:
| | Distribution Fee | Service Fee | Total Fees ($) | Retained by FDC ($) |
| Class A | - % | .25% | 789,347 | 450,176 |
| Class M | .25% | .25% | 405,736 | 82,702 |
| Class C | .75% | .25% | 476,113 | 379,176 |
| | | | 1,671,196 | 912,054 |
Sales Load. FDC may receive a front-end sales charge of up to 5.75% for selling Class A shares and 3.50% for selling Class M shares, some of which is paid to financial intermediaries for selling shares of the Fund. Depending on the holding period, FDC may receive contingent deferred sales charges levied on Class A, Class M and Class C redemptions. The deferred sales charges are 1.00% for Class C shares, 1.00% for certain purchases of Class A shares and .25% for certain purchases of Class M shares.
For the period, sales charge amounts retained by FDC were as follows:
| | Retained by FDC ($) |
| Class A | 117,809 |
| Class M | 6,087 |
Class CA | 474 |
| | 124,370 |
A When Class C shares are initially sold, FDC pays commissions from its own resources to financial intermediaries through which the sales are made.
Transfer Agent Fees. Fidelity Investments Institutional Operations Company LLC (FIIOC), an affiliate of the investment adviser, is the transfer, dividend disbursing and shareholder servicing agent for each class of the Fund. Effective March 1, 2024, the Fund's management contract was amended to incorporate transfer agent services and associated fees previously covered under a separate services agreement. FIIOC pays for typesetting, printing and mailing of shareholder reports, except proxy statements.
During the period December 1, 2023 through February 29, 2024, the transfer agent fees for each class were a fixed annual rate of class-level average net assets as follows:
| | | % of Class-Level Average Net Assets | |
| Class A | | .1883 | |
| Class M | | .1896 | |
| Class C | | .2000 | |
| Small Cap Growth | | .1646 | |
| Class I | | .1817 | |
| Class Z | | .0420 | |
| | | |
| | | | |
Prior to December 1, 2023, FIIOC received account fees and asset-based fees that varied according to the account size and type of account of the shareholders of the respective classes of the Fund, except for Class Z. FIIOC received an asset-based fee of Class Z's average net assets. For the portion of the reporting period prior to March 1, 2024, the fees were equivalent to the following annualized rates:
| | Amount ($) | % of Class-Level Average Net Assets |
| Class A | 321,427 | .19 |
| Class M | 83,985 | .19 |
| Class C | 54,231 | .20 |
| Small Cap Growth | 2,481,942 | .17 |
| Class I | 769,182 | .19 |
| Class Z | 398,283 | .04 |
| | 4,109,050 | |
Accounting Fees. Fidelity Service Company, Inc. (FSC), an affiliate of the investment adviser, maintains the Fund's accounting records. Effective March 1, 2024, the Fund's management contract was amended to incorporate accounting services and associated fees previously covered under a separate services agreement.
During the period December 1, 2023 through February 29, 2024, the accounting fees were a fixed annual rate of average net assets as follows:
| | % of Average Net Assets |
| Fidelity Small Cap Growth Fund | .0180 |
Prior to December 1, 2023, the accounting fee was based on the level of average net assets for each month. For the portion of the reporting period prior to March 1, 2024, the fees were equivalent to the following annualized rates:
| | % of Average Net Assets |
| Fidelity Small Cap Growth Fund | .02 |
| | |
Brokerage Commissions. A portion of portfolio transactions were placed with brokerage firms which are affiliates of the investment adviser. Brokerage commissions are included in net realized gain (loss) and change in net unrealized appreciation (depreciation) in the Consolidated Statement of Operations. The commissions paid to these affiliated firms were as follows:
| | Amount ($) |
| Fidelity Small Cap Growth Fund | 122,065 |
Interfund Lending Program. Pursuant to an Exemptive Order issued by the Securities and Exchange Commission (the SEC), the Fund, along with other registered investment companies having management contracts with Fidelity Management & Research Company LLC (FMR), or other affiliated entities of FMR, may participate in an interfund lending program. This program provides an alternative credit facility allowing the Fund to borrow from, or lend money to, other participating affiliated funds. At period end, there were no interfund loans outstanding. Activity in this program during the period for which loans were outstanding was as follows:
| | Borrower or Lender | Average Loan Balance ($) | Weighted Average Interest Rate | Interest Expense ($) |
| Fidelity Small Cap Growth Fund | Borrower | 8,076,631 | 5.57% | 81,218 |
Interfund Trades. Funds may purchase from or sell securities to other Fidelity Funds under procedures adopted by the Board. The procedures have been designed to ensure these interfund trades are executed in accordance with Rule 17a-7 of the 1940 Act. Any interfund trades are included within the respective purchases and sales amounts shown in the Purchases and Sales of Investments note. Interfund trades during the period are noted in the table below.
| | Purchases ($) | Sales ($) | Realized Gain (Loss)($) |
| Fidelity Small Cap Growth Fund | 288,042,125 | 323,786,856 | 43,282,534 |
6. Committed Line of Credit.
Certain Funds participate with other funds managed by the investment adviser or an affiliate in a $4.25 billion credit facility (the "line of credit") to be utilized for temporary or emergency purposes to fund shareholder redemptions or for other short-term liquidity purposes. The participating funds have agreed to pay commitment fees on their pro-rata portion of the line of credit, which are reflected in Miscellaneous expenses on the Consolidated Statement of Operations, and are listed below. During the period, there were no borrowings on this line of credit.
| | Amount ($) |
| Fidelity Small Cap Growth Fund | 9,691 |
7. Security Lending.
Funds lend portfolio securities from time to time in order to earn additional income. Lending agents are used, including National Financial Services (NFS), an affiliate of the investment adviser. Pursuant to a securities lending agreement, NFS will receive a fee, which is capped at 9.9% of a fund's daily lending revenue, for its services as lending agent. A fund may lend securities to certain qualified borrowers, including NFS. On the settlement date of the loan, a fund receives collateral (in the form of U.S. Treasury obligations, letters of credit and/or cash) against the loaned securities and maintains collateral in an amount not less than 100% of the market value of the loaned securities during the period of the loan. The market value of the loaned securities is determined at the close of business of a fund and any additional required collateral is delivered to a fund on the next business day. A fund or borrower may terminate the loan at any time, and if the borrower defaults on its obligation to return the securities loaned because of insolvency or other reasons, a fund may apply collateral received from the borrower against the obligation. A fund may experience delays and costs in recovering the securities loaned. Any cash collateral received is invested in the Fidelity Securities Lending Cash Central Fund. Any loaned securities are identified as such in the Consolidated Schedule of Investments, and the value of loaned securities and cash collateral at period end, as applicable, are presented in the Consolidated Statement of Assets and Liabilities. Security lending income represents the income earned on investing cash collateral, less rebates paid to borrowers and any lending agent fees associated with the loan, plus any premium payments received for lending certain types of securities. Security lending income is presented in the Consolidated Statement of Operations as a component of income from Fidelity Central Funds. Affiliated security lending activity, if any, was as follows:
| | Total Security Lending Fees Paid to NFS ($) | Security Lending Income From Securities Loaned to NFS ($) | Value of Securities Loaned to NFS at Period End ($) |
| Fidelity Small Cap Growth Fund | 204,736 | 51,633 | 2,515,345 |
8. Bank Borrowings.
The Fund is permitted to have bank borrowings for temporary or emergency purposes to fund shareholder redemptions or for other short-term liquidity requirements. The Fund has established borrowing arrangements with certain banks. The interest rate on the borrowings is the bank's base rate, as revised from time to time. Any open loans, including accrued interest, at period end are presented under the caption "Notes payable" in the Consolidated Statement of Assets and Liabilities, if applicable. Activity in this program during the period for which loans were outstanding was as follows:
| | Average Loan Balance ($) | Weighted Average Interest Rate | Interest Expense ($) |
| Fidelity Small Cap Growth Fund | 2,340,000 | 5.83% | 1,516 |
9. Expense Reductions.
Through arrangements with each class' transfer agent, credits realized as a result of certain uninvested cash balances were used to reduce the Fund's expenses. During the period, transfer agent credits reduced each class' expenses as noted in the table below.
| | Expense reduction ($) |
| Class M | 17 |
In addition, during the period the investment adviser or an affiliate reimbursed and/or waived a portion of fund-level operating expenses in the amount of $350,853.
10. Share Transactions.
Share transactions for each class were as follows and may contain in-kind transactions, automatic conversions between classes or exchanges between affiliated funds:
| | Shares | Shares | Dollars | Dollars |
| | Year ended July 31, 2024 | Year ended July 31, 2023 | Year ended July 31, 2024 | Year ended July 31, 2023 |
| Fidelity Small Cap Growth Fund | | | | |
| Class A | | | | |
| Shares sold | 3,410,425 | 1,985,652 | $92,435,438 | $46,092,120 |
| Shares redeemed | (2,388,084) | (2,766,565) | (62,921,674) | (63,764,686) |
| Net increase (decrease) | 1,022,341 | (780,913) | $29,513,764 | $(17,672,566) |
| Class M | | | | |
| Shares sold | 725,789 | 434,136 | $18,290,293 | $9,560,256 |
| Shares redeemed | (562,338) | (453,165) | (14,055,708) | (9,876,371) |
| Net increase (decrease) | 163,451 | (19,029) | $4,234,585 | $(316,115) |
| Class C | | | | |
| Shares sold | 528,459 | 290,539 | $11,466,796 | $5,509,177 |
| Shares redeemed | (913,022) | (928,922) | (18,978,864) | (17,591,633) |
| Net increase (decrease) | (384,563) | (638,383) | $(7,512,068) | $(12,082,456) |
| Small Cap Growth | | | | |
| Shares sold | 19,838,628 | 14,584,621 | $590,342,520 | $365,567,725 |
| Shares redeemed | (24,637,695) | (23,866,509) | (689,666,536) | (592,542,907) |
| Net increase (decrease) | (4,799,067) | (9,281,888) | $(99,324,016) | $(226,975,182) |
| Class I | | | | |
| Shares sold | 22,048,418 | 7,314,970 | $626,318,348 | $183,764,516 |
| Shares redeemed | (9,119,606) | (7,544,771) | (261,236,897) | (187,661,628) |
| Net increase (decrease) | 12,928,812 | (229,801) | $365,081,451 | $(3,897,112) |
| Class Z | | | | |
| Shares sold | 20,985,977 | 8,164,174 | $629,325,257 | $204,704,877 |
| Shares redeemed | (4,834,752) | (7,246,491) | (137,292,543) | (182,234,815) |
| Net increase (decrease) | 16,151,225 | 917,683 | $492,032,714 | $22,470,062 |
11. Other.
A fund's organizational documents provide former and current trustees and officers with a limited indemnification against liabilities arising in connection with the performance of their duties to the fund. In the normal course of business, a fund may also enter into contracts that provide general indemnifications. A fund's maximum exposure under these arrangements is unknown as this would be dependent on future claims that may be made against a fund. The risk of material loss from such claims is considered remote.
At the end of the period, the following mutual funds managed by the investment adviser or its affiliates were the owners of record of 10% or more of the total outstanding shares.
| | Strategic Advisers Fidelity U.S. Total Stock Fund |
| Fidelity Small Cap Growth Fund | 18% |
Mutual funds managed by the investment adviser or its affiliates, in aggregate, were the owners of record of more than 20% of the total outstanding shares.
| Fund | % of shares held |
| Fidelity Small Cap Growth Fund | 26% |
12. Risk and Uncertainties.
Many factors affect a fund's performance. Developments that disrupt global economies and financial markets, such as pandemics, epidemics, outbreaks of infectious diseases, war, terrorism, and environmental disasters, may significantly affect a fund's investment performance. The effects of these developments to a fund will be impacted by the types of securities in which a fund invests, the financial condition, industry, economic sector, and geographic location of an issuer, and a fund's level of investment in the securities of that issuer. Significant concentrations in security types, issuers, industries, sectors, and geographic locations may magnify the factors that affect a fund's performance.
Report of Independent Registered Public Accounting Firm
To the Board of Trustees of Fidelity Securities Fund and Shareholders of Fidelity Small Cap Growth Fund
Opinion on the Financial Statements
We have audited the accompanying consolidated statement of assets and liabilities, including the consolidated schedule of investments, of Fidelity Small Cap Growth Fund and its subsidiary (one of the funds constituting Fidelity Securities Fund, referred to hereafter as the "Fund") as of July 31, 2024, the related consolidated statement of operations for the year ended July 31, 2024, the consolidated statement of changes in net assets for each of the two years in the period ended July 31, 2024, including the related notes, and the consolidated financial highlights for each of the five years in the period ended July 31, 2024 (collectively referred to as the "consolidated financial statements"). In our opinion, the consolidated financial statements present fairly, in all material respects, the financial position of the Fund as of July 31, 2024, the results of its operations for the year then ended, the changes in its net assets for each of the two years in the period ended July 31, 2024 and the financial highlights for each of the five years in the period ended July 31, 2024 in conformity with accounting principles generally accepted in the United States of America.
Basis for Opinion
These consolidated financial statements are the responsibility of the Fund's management. Our responsibility is to express an opinion on the Fund's consolidated financial statements based on our audits. We are a public accounting firm registered with the Public Company Accounting Oversight Board (United States) (PCAOB) and are required to be independent with respect to the Fund in accordance with the U.S. federal securities laws and the applicable rules and regulations of the Securities and Exchange Commission and the PCAOB.
We conducted our audits of these consolidated financial statements in accordance with the standards of the PCAOB. Those standards require that we plan and perform the audit to obtain reasonable assurance about whether the consolidated financial statements are free of material misstatement, whether due to error or fraud.
Our audits include performing procedures to assess the risks of material misstatement of the consolidated financial statements, whether due to error or fraud, and performing procedures that respond to those risks. Such procedures included examining, on a test basis, evidence regarding the amounts and disclosures in the consolidated financial statements. Our audits also include evaluating the accounting principles used and significant estimates made by management, as well as evaluating the overall presentation of the consolidated financial statements. Our procedures included confirmation of securities owned as of July 31, 2024 by correspondence with the custodian, issuers of privately offered securities and brokers; when replies were not received from brokers, we performed other auditing procedures. We believe that our audits provide a reasonable basis for our opinion.
/s/ PricewaterhouseCoopers LLP
Boston, Massachusetts
September 17, 2024
We have served as the auditor of one or more investment companies in the Fidelity group of funds since 1932.
Distributions
(Unaudited)The dividend and capital gains distributions for the fund(s) are available on Fidelity.com or Institutional.Fidelity.com.
The fund hereby designates as a capital gain dividend with respect to the taxable year ended July 31,2024, $31,820,656, or, if subsequently determined to be different, the net capital gain of such year.
The fund will notify shareholders in January 2025 of amounts for use in preparing 2024 income tax returns.
Item 8: Changes in and Disagreements with Accountants for Open-End Management Investment Companies
Note: This is not applicable for any fund included in this document.
Item 9: Proxy Disclosures for Open-End Management Investment Companies
| A special meeting of shareholders was held on July 16, 2024. The results of votes taken among shareholders on the proposal before them are reported below. Each vote reported represents one dollar of net asset value held on the record date for the meeting. |
| Proposal 1 |
| To elect a Board of Trustees. |
| | # of Votes | % of Votes |
| Bettina Doulton |
| Affirmative | 88,756,759,992.17 | 95.11 |
| Withheld | 4,564,750,651.52 | 4.89 |
| TOTAL | 93,321,510,643.68 | 100.00 |
| Robert A. Lawrence |
| Affirmative | 88,523,438,331.98 | 94.86 |
| Withheld | 4,798,072,311.70 | 5.14 |
| TOTAL | 93,321,510,643.68 | 100.00 |
| Vijay C. Advani |
| Affirmative | 88,484,371,668.51 | 94.82 |
| Withheld | 4,837,138,975.17 | 5.18 |
| TOTAL | 93,321,510,643.68 | 100.00 |
| Thomas P. Bostick |
| Affirmative | 88,618,596,648.21 | 94.96 |
| Withheld | 4,702,913,995.47 | 5.04 |
| TOTAL | 93,321,510,643.68 | 100.00 |
| Donald F. Donahue |
| Affirmative | 88,542,403,002.79 | 94.88 |
| Withheld | 4,779,107,640.89 | 5.12 |
| TOTAL | 93,321,510,643.68 | 100.00 |
| Vicki L. Fuller |
| Affirmative | 88,788,711,037.44 | 95.14 |
| Withheld | 4,532,799,606.24 | 4.86 |
| TOTAL | 93,321,510,643.68 | 100.00 |
| Patricia L. Kampling |
| Affirmative | 88,819,315,996.59 | 95.18 |
| Withheld | 4,502,194,647.10 | 4.82 |
| TOTAL | 93,321,510,643.68 | 100.00 |
| Thomas A. Kennedy |
| Affirmative | 88,667,457,817.34 | 95.01 |
| Withheld | 4,654,052,826.34 | 4.99 |
| TOTAL | 93,321,510,643.68 | 100.00 |
| Oscar Munoz |
| Affirmative | 88,183,976,568.30 | 94.49 |
| Withheld | 5,137,534,075.39 | 5.51 |
| TOTAL | 93,321,510,643.68 | 100.00 |
| Karen B. Peetz |
| Affirmative | 88,720,160,318.58 | 95.07 |
| Withheld | 4,601,350,325.11 | 4.93 |
| TOTAL | 93,321,510,643.68 | 100.00 |
| David M. Thomas |
| Affirmative | 88,471,490,747.86 | 94.80 |
| Withheld | 4,850,019,895.82 | 5.20 |
| TOTAL | 93,321,510,643.68 | 100.00 |
| Susan Tomasky |
| Affirmative | 88,536,869,646.78 | 94.87 |
| Withheld | 4,784,640,996.90 | 5.13 |
| TOTAL | 93,321,510,643.68 | 100.00 |
| Michael E. Wiley |
| Affirmative | 88,526,906,267.86 | 94.86 |
| Withheld | 4,794,604,375.83 | 5.14 |
| TOTAL | 93,321,510,643.68 | 100.00 |
| | | |
| Proposal 1 reflects trust-wide proposal and voting results. |
Item 10: Remuneration Paid to Directors, Officers, and others of Open-End Management Investment Companies
Note: This information is disclosed as part of the consolidated financial statements for each Fund as part of Item 7: Consolidated Financial Statements and Consolidated Financial Highlights for Open-End Management Investment companies.
Item 11: Statement Regarding Basis for Approval of Investment Advisory Contract
Board Approval of Investment Advisory Contracts and Management Fees
Fidelity Small Cap Growth Fund
Each year, the Board of Trustees, including the Independent Trustees (together, the Board), considers the renewal of the fund's management contract with Fidelity Management & Research Company LLC (FMR) and the sub-advisory agreements (together, the Advisory Contracts) for the fund. FMR and the sub-advisers are referred to herein as the Investment Advisers. The Board, assisted by the advice of fund counsel and Independent Trustees' counsel, requests and considers a broad range of information relevant to the renewal of the Advisory Contracts throughout the year.
The Board meets regularly and, at each of its meetings, covers an extensive agenda of topics and materials and considers factors that are relevant to its annual consideration of the renewal of the fund's Advisory Contracts, including the services and support provided to the fund and its shareholders. The Board, acting directly and through its Committees (each of which is composed of and chaired by Independent Trustees), requests and receives information concerning the annual consideration of the renewal of the fund's Advisory Contracts. The Board also meets as needed to review matters specifically related to the Board's annual consideration of the renewal of the Advisory Contracts. Members of the Board may also meet with trustees of other Fidelity funds through joint ad hoc committees to discuss certain matters relevant to all of the Fidelity funds.
At its May 2024 meeting, the Board unanimously determined to renew the fund's Advisory Contracts. In reaching its determination, the Board considered all factors it believed relevant, including (i) the nature, extent, and quality of the services provided to the fund and its shareholders (including the investment performance of the fund); (ii) the competitiveness relative to peer funds of the fund's management fee and the total expense ratio of a representative class (the retail class, which was selected because it was the largest class without 12b-1 fees); (iii) the total costs of the services provided by and the profits realized by FMR and its affiliates (Fidelity) from its relationships with the fund; and (iv) the extent to which, if any, economies of scale exist and are realized as the fund grows, and whether any economies of scale are appropriately shared with fund shareholders. The Board also considered the broad range of investment choices available to shareholders from FMR's competitors and that the fund's shareholders have chosen to invest in the fund, which is part of the Fidelity family of funds. The Board's decision to renew the Advisory Contracts was not based on any single factor.
The Board reached a determination, with the assistance of fund counsel and Independent Trustees' counsel and through the exercise of its business judgment, that the renewal of the Advisory Contracts was in the best interests of the fund and its shareholders and that the compensation payable under the Advisory Contracts was fair and reasonable in light of all of the surrounding circumstances.
Nature, Extent, and Quality of Services Provided. The Board considered staffing as it relates to the fund, including the backgrounds and experience of investment personnel of the Investment Advisers, and also considered the Investment Advisers' implementation of the fund's investment program. The Independent Trustees also had discussions with senior management of Fidelity's investment operations and investment groups. The Board considered the structure of the investment personnel compensation program and whether this structure provides appropriate incentives to act in the best interests of the fund. Additionally, the Board considered the portfolio managers' investments, if any, in the funds that they manage.
Resources Dedicated to Investment Management and Support Services. The Board and the Fund Oversight and Research Committees reviewed the general qualifications and capabilities of Fidelity's investment staff, including its size, education, experience, and resources, as well as Fidelity's approach to recruiting, training, managing, and compensating investment personnel. The Board noted the resources devoted to expansion of Fidelity's global investment organization, and that Fidelity's analysts have extensive resources, tools, and capabilities that allow them to conduct sophisticated quantitative and fundamental analysis, as well as credit analysis of issuers, counterparties, and guarantors. Further, the Board considered that Fidelity's investment professionals have sufficient access to global information and data so as to provide competitive investment results over time, and that those professionals also have access to sophisticated tools that permit them to assess portfolio construction and risk and performance attribution characteristics continuously, as well as to transmit new information and research conclusions rapidly around the world. Additionally, in its deliberations, the Board considered Fidelity's trading, risk management, compliance, and technology and operations capabilities and resources, which are integral parts of the investment management process.
Shareholder and Administrative Services. The Board considered (i) the nature, extent, quality, and cost of advisory, administrative, shareholder, transfer agency, and pricing and bookkeeping services performed by the Investment Advisers and their affiliates under the Advisory Contracts; (ii) the nature and extent of Fidelity's supervision of third party service providers, principally custodians, subcustodians, and pricing vendors; and (iii) the resources devoted by Fidelity to, and the record of compliance with, the fund's compliance policies and procedures. The Board also reviewed the allocation of fund brokerage, including allocations to brokers affiliated with the Investment Advisers, the use of brokerage commissions to pay fund expenses, and the use of "soft" commission dollars to pay for research services. The Board also considered the fund's securities lending activities and any payments made to Fidelity relating to securities lending under a separate agreement.
The Board noted that the growth of fund assets over time across the complex allows Fidelity to reinvest in the development of services designed to enhance the value and convenience of the Fidelity funds as investment vehicles. These services include 24-hour access to account information and market information over the Internet and through telephone representatives, investor education materials, and asset allocation tools. The Board also considered that it reviews customer service metrics such as telephone response times, continuity of services on the website and metrics addressing services at Fidelity Investor Centers.
Investment in a Large Fund Family. The Board considered the benefits to shareholders of investing in a fund that is part of a large family of funds offering a variety of investment disciplines and providing a large variety of fund investor services. The Board noted that Fidelity had taken, or had made recommendations that resulted in the Fidelity funds taking, a number of actions over the previous year that benefited particular funds and/or the Fidelity funds in general.
Investment Performance. The Board took into account discussions that occur with representatives of the Investment Advisers, and reports that it receives, at Board meetings throughout the year, relating to fund investment performance. In this regard the Board noted that as part of regularly scheduled fund reviews and other reports to the Board on fund performance, the Board considered annualized return information for the fund for different time periods, measured against an appropriate securities market index (benchmark index) and an appropriate peer group of funds with similar objectives (peer group). The Board also considered information about performance attribution. In its ongoing evaluation of fund investment performance, the Board gives particular attention to information indicating changes in performance of the funds over different time periods and discussed with the Investment Advisers the reasons for any overperformance or underperformance.
In addition to reviewing absolute and relative fund performance, the Independent Trustees periodically consider the appropriateness of fund performance metrics in evaluating the results achieved. The Independent Trustees generally give greater weight to fund performance over longer time periods than over shorter time periods. Depending on the circumstances, the Independent Trustees may be satisfied with a fund's performance notwithstanding that it lags its benchmark index or peer group for certain periods.
Based on its review, the Board concluded that the nature, extent, and quality of services provided to the fund under the Advisory Contracts should continue to benefit the shareholders of the fund.
Competitiveness of Management Fee and Total Expense Ratio. The Board was provided with information regarding industry trends in management fees and expenses. The Board considered that, effective March 1, 2024, an amended Advisory Contract with FMR went into effect with class-level management fees based on tiered schedules and subject to a maximum class-level rate (the management fee). The Board also considered that in exchange for the variable management fee, each class of the fund receives investment advisory, management, administrative, transfer agent, and pricing and bookkeeping services. In its review of the management fee and total expense ratio of the retail class, the Board considered a pro forma management fee rate the retail class as if it had been in effect for the 12-month period ended September 30, 2023, as well as other third-party fund expenses, as applicable, such as custodial, legal, and audit fees and any fund-paid 12b-1 fees. The Board noted that Fidelity may agree to waive fees or reimburse expenses from time to time, and the extent to which, if any, it has done so for the fund. The Board also considered information about the impact of the fund's performance adjustment.
Comparisons of Management Fees and Total Expense Ratios. Among other things, the Board reviewed data for selected groups of competitive funds and classes (referred to as "mapped groups") that were compiled by Fidelity based on combining similar investment objective categories (as classified by Morningstar) that have comparable investment mandates. The data reviewed by the Board included (i) gross management fee comparisons (before taking into account expense reimbursements or caps and without taking into account the fund's performance adjustment) relative to the total universe of funds within the mapped group; (ii) gross management fee comparisons relative to a subset of non-Fidelity funds in the mapped group that are similar in size and management fee structure to the fund (referred to as the "asset size peer group"); (iii) total expense comparisons of the retail class of the fund relative to funds and classes in the mapped group that have a similar sales load structure to the retail class of the fund (referred to as the "similar sales load structure group"); and (iv) total expense comparisons of the retail class of the fund relative to funds and classes in the similar sales load structure group that are similar in size and management fee structure to the fund (referred to as the "total expense asset size peer group"). The total expense asset size peer group comparison excludes performance adjustments and fund-paid 12b-1 fees to eliminate variability in fee structures.
The information provided to the Board indicated that the fund's management fee rate ranked below the competitive median of the mapped group for the 12-month period ended September 30, 2023 and above the competitive median of the asset size peer group for the 12-month period ended September 30, 2023. Further, the information provided to the Board indicated that the total expense ratio of the retail class of the fund ranked below the competitive median of the similar sales load structure group for the 12-month period ended September 30, 2023 and below the competitive median of the total expense asset size peer group for the 12-month period ended September 30, 2023. The Board noted that the fund has a management fee structure that covers expenses for services beyond portfolio management and further noted that Fidelity believes that total expense ratio comparisons are more useful in this context.
The Board noted that a different variable management fee rate is applicable to each class of the fund. The Board considered that the difference in management fee rates between classes is the result of separate arrangements for class-level services and/or waivers of certain expenses and not the result of any difference in advisory or custodial fees or other expenses related to the management of the fund's assets, which do not vary by class.
The Board also considered that the fund's management fee is subject to upward or downward adjustment depending upon whether, and to what extent, the fund's investment performance for the performance period (a rolling 36-month period) exceeds, or is exceeded by, a securities index, thus leading to a performance adjustment for the same period. The Board noted that the performance adjustment provides FMR with a strong economic incentive to seek to achieve superior long-term performance for the fund's shareholders and helps to more closely align the interests of FMR and the shareholders of the fund.
In connection with its consideration of the fund's performance adjustment, the Board noted that the performance of the retail class is used for purposes of determining the performance adjustment. The Board noted that to the extent the performance adjustment was based on the performance of a share class with higher total annual operating expenses, the fund would be subject to a smaller positive and larger negative performance adjustment. The Board considered the appropriateness of the use of the retail class as the basis for the performance adjustment. The Board noted that the retail class is typically the largest class (reflecting the actual investment experience for the plurality of shareholders), employs a standard expense structure, and does not include fund-paid 12b-1 fees, which Fidelity believes makes it a more appropriate measurement of Fidelity's investment skill.
Fees Charged to Other Fidelity Clients. The Board also considered Fidelity fee structures and other information with respect to clients of Fidelity, such as other funds advised or subadvised by Fidelity, pension plan clients, and other institutional clients with similar mandates. The Board noted that a joint ad hoc committee created by it and the boards of other Fidelity funds periodically reviews and compares Fidelity's institutional investment advisory business with its business of providing services to the Fidelity funds and also noted the most recent findings of the committee. The Board noted that the committee's review included a consideration of the differences in services provided, fees charged, and costs incurred, as well as competition in the markets serving the different categories of clients.
Based on its review, the Board concluded that the fund's management fee, including the use of the retail class as the basis for the performance adjustment, is fair and reasonable in light of the services that the fund receives and the other factors considered. Further, based on its review of total expense ratios and fees charged to other Fidelity clients, the Board concluded that the total expense ratio of each class of the fund was reasonable in light of the services that the fund and its shareholders receive and the other factors considered.
Costs of the Services and Profitability. The Board considered the revenues earned and the expenses incurred by Fidelity in conducting the business of developing, marketing, distributing, managing, administering and servicing the fund and servicing the fund's shareholders. The Board also considered the level of Fidelity's profits in respect of all the Fidelity funds.
On an annual basis, Fidelity presents to the Board information about the profitability of its relationships with the fund. Fidelity calculates profitability information for each fund, as well as aggregate profitability information for groups of Fidelity funds and all Fidelity funds, using a series of detailed revenue and cost allocation methodologies which originate with the books and records of Fidelity on which Fidelity's audited financial statements are based. The Audit Committee of the Board reviews any significant changes from the prior year's methodologies and the full Board approves such changes.
A public accounting firm has been engaged annually by the Board as part of the Board's assessment of Fidelity's profitability analysis. The engagement includes the review and assessment of the methodologies used by Fidelity in determining the revenues and expenses attributable to Fidelity's fund business, and completion of agreed-upon procedures in respect of the mathematical accuracy of certain fund profitability information and its conformity to established allocation methodologies. After considering the reports issued under the engagement and information provided by Fidelity, the Board concluded that while other allocation methods may also be reasonable, Fidelity's profitability methodologies are reasonable in all material respects.
The Board also reviewed Fidelity's non-fund businesses and potential indirect benefits such businesses may have received as a result of their association with Fidelity's fund business (i.e., fall-out benefits) as well as cases where Fidelity's affiliates may benefit from the funds' business. The Board considered areas where potential indirect benefits to the Fidelity funds from their relationships with Fidelity may exist. The Board's consideration of these matters was informed by the findings of a joint ad hoc committee created by it and the boards of other Fidelity funds to evaluate potential fall-out benefits.
The Board considered the costs of the services provided by and the profits realized by Fidelity in connection with the operation of the fund and was satisfied that the profitability was not excessive.
Economies of Scale. The Board considered whether there have been economies of scale in respect of the management of the Fidelity funds, whether the Fidelity funds (including the fund) have appropriately benefited from any such economies of scale, and whether there is potential for realization of any further economies of scale. The Board considered the extent to which the fund will benefit from economies of scale as assets grow through increased services to the fund, through waivers or reimbursements, or through fee or expense ratio reductions. The Board also noted that a committee created by it and the boards of other Fidelity funds periodically analyzes whether Fidelity attains economies of scale in respect of the management and servicing of the Fidelity funds, whether the Fidelity funds have appropriately benefited from such economies of scale, and whether there is potential for realization of any further economies of scale.
The Board recognized that the fund's management contract incorporates a variable management fee structure, which provides breakpoints as a way to share, in part, any potential economies of scale that may exist at the asset class level and through a discount that considers both fund size and total assets of the four applicable asset classes. The Board considered that the variable management fee is designed to deliver the benefits of economies of scale to fund shareholders even if assets of any particular fund are unchanged or have declined, because some portion of Fidelity's costs are attributable to services provided to all funds subject to the variable management fee, and all such funds benefit if those costs can be allocated among more assets. The Board concluded that, given the variable management fee structure, fund shareholders will benefit from lower management fees due to the application of the breakpoints and discount factor, regardless of whether Fidelity achieves any such economies of scale.
The Board concluded, taking into account the analysis of the committee, that economies of scale, if any, are being appropriately shared between fund shareholders and Fidelity.
Additional Information Requested by the Board. In order to develop fully the factual basis for consideration of the Fidelity funds' advisory contracts, the Board requested and received additional information on certain topics, including but not limited to: (i) fund flow and performance trends, in particular the underperformance of certain funds and strategies, and Fidelity's long-term strategies for certain funds; (ii) the operation of performance fees and the rationale for implementing performance fees on certain categories of funds but not others; (iii) Fidelity's pricing philosophy compared to competitors; (iv) fund profitability methodology and data; (v) evaluation of competitive fund data and peer group classifications and fee and expense comparisons; (vi) the management fee and expense structures for different funds and classes and information about the differences between various fee and expense structures; (vii) the variable management fee implemented for certain funds effective March 1, 2024; and (viii) information regarding other accounts managed by Fidelity and the funds' sub-advisory arrangements.
Conclusion. Based on its evaluation of all of the conclusions noted above, and after considering all factors it believed relevant, the Board, including the Independent Trustees, concluded that the advisory and sub-advisory fee arrangements are fair and reasonable in light of all of the surrounding circumstances and that the fund's Advisory Contracts should be renewed through May 31, 2025.
1.803695.119
SCP-ANN-0924
Fidelity® Growth & Income Portfolio
Annual Report
July 31, 2024
Contents
To view a fund's proxy voting guidelines and proxy voting record for the 12-month period ended June 30, visit http://www.fidelity.com/proxyvotingresults or visit the Securities and Exchange Commission's (SEC) web site at http://www.sec.gov.
You may also call 1-800-544-8544 if you're an individual investing directly with Fidelity, call 1-800-835-5092 if you're a plan sponsor or participant with Fidelity as your recordkeeper or call 1-877-208-0098 on institutional accounts or if you're an advisor or invest through one to request a free copy of the proxy voting guidelines.
Standard & Poor's, S&P and S&P 500 are registered service marks of The McGraw-Hill Companies, Inc. and have been licensed for use by Fidelity Distributors Corporation.
Other third-party marks appearing herein are the property of their respective owners.
All other marks appearing herein are registered or unregistered trademarks or service marks of FMR LLC or an affiliated company. © 2024 FMR LLC. All rights reserved.
This report and the financial statements contained herein are submitted for the general information of the shareholders of the Fund. This report is not authorized for distribution to prospective investors in the Fund unless preceded or accompanied by an effective prospectus.
A fund files its complete schedule of portfolio holdings with the SEC for the first and third quarters of each fiscal year on Form N-PORT. Forms N-PORT are available on the SEC's web site at http://www.sec.gov. A fund's Forms N-PORT may be reviewed and copied at the SEC's Public Reference Room in Washington, DC. Information regarding the operation of the SEC's Public Reference Room may be obtained by calling 1-800-SEC-0330.
For a complete list of a fund's portfolio holdings, view the most recent holdings listing, semiannual report, or annual report on Fidelity's web site at http://www.fidelity.com, http://www.institutional.fidelity.com, or http://www.401k.com, as applicable.
NOT FDIC INSURED •MAY LOSE VALUE •NO BANK GUARANTEE
Neither the Fund nor Fidelity Distributors Corporation is a bank.
Item 7: Financial Statements and Financial Highlights for Open-End Management Investment Companies (Annual Report)
Fidelity® Growth & Income Portfolio
Schedule of Investments July 31, 2024
Showing Percentage of Net Assets
| Common Stocks - 98.0% |
| | | Shares | Value ($) (000s) |
| COMMUNICATION SERVICES - 4.0% | | | |
| Diversified Telecommunication Services - 0.5% | | | |
| Cellnex Telecom SA (a) | | 905,000 | 31,563 |
| Verizon Communications, Inc. | | 484,274 | 19,623 |
| | | | 51,186 |
| Entertainment - 1.0% | | | |
| The Walt Disney Co. | | 452,490 | 42,394 |
| Universal Music Group NV | | 1,949,800 | 46,453 |
| Warner Music Group Corp. Class A | | 479,200 | 14,381 |
| | | | 103,228 |
| Interactive Media & Services - 0.5% | | | |
| Meta Platforms, Inc. Class A | | 111,400 | 52,896 |
| Media - 2.0% | | | |
| Comcast Corp. Class A | | 4,074,412 | 168,151 |
| Interpublic Group of Companies, Inc. | | 1,624,931 | 52,274 |
| | | | 220,425 |
TOTAL COMMUNICATION SERVICES | | | 427,735 |
| CONSUMER DISCRETIONARY - 2.0% | | | |
| Hotels, Restaurants & Leisure - 0.8% | | | |
| Booking Holdings, Inc. | | 3,900 | 14,489 |
| Churchill Downs, Inc. | | 71,800 | 10,308 |
| Domino's Pizza, Inc. | | 33,200 | 14,233 |
| Marriott International, Inc. Class A | | 113,623 | 25,827 |
| Starbucks Corp. | | 329,260 | 25,666 |
| | | | 90,523 |
| Household Durables - 0.1% | | | |
| Sony Group Corp. sponsored ADR | | 66,414 | 5,884 |
| Whirlpool Corp. | | 76,094 | 7,759 |
| | | | 13,643 |
| Specialty Retail - 0.8% | | | |
| Lowe's Companies, Inc. | | 345,914 | 84,925 |
| Textiles, Apparel & Luxury Goods - 0.3% | | | |
| NIKE, Inc. Class B | | 176,500 | 13,213 |
| Puma AG | | 285,554 | 14,185 |
| | | | 27,398 |
TOTAL CONSUMER DISCRETIONARY | | | 216,489 |
| CONSUMER STAPLES - 5.9% | | | |
| Beverages - 2.3% | | | |
| Davide Campari Milano NV | | 288,900 | 2,608 |
| Diageo PLC sponsored ADR | | 274,211 | 34,208 |
| Keurig Dr. Pepper, Inc. | | 2,422,000 | 83,026 |
| PepsiCo, Inc. | | 13,100 | 2,262 |
| Pernod Ricard SA | | 133,000 | 17,848 |
| Remy Cointreau SA | | 46,047 | 3,633 |
| Remy Cointreau SA rights (b)(c) | | 46,047 | 100 |
| The Coca-Cola Co. | | 1,528,110 | 101,986 |
| | | | 245,671 |
| Consumer Staples Distribution & Retail - 1.4% | | | |
| Sysco Corp. | | 641,736 | 49,189 |
| Target Corp. | | 250,100 | 37,618 |
| Walmart, Inc. | | 897,900 | 61,632 |
| | | | 148,439 |
| Food Products - 0.0% | | | |
| Lamb Weston Holdings, Inc. | | 68,500 | 4,111 |
| Household Products - 0.1% | | | |
| Colgate-Palmolive Co. | | 62,300 | 6,180 |
| Procter & Gamble Co. | | 68,900 | 11,076 |
| | | | 17,256 |
| Personal Care Products - 1.6% | | | |
| Estee Lauder Companies, Inc. Class A | | 216,700 | 21,585 |
| Haleon PLC ADR | | 7,861,211 | 71,930 |
| Kenvue, Inc. | | 4,178,708 | 77,264 |
| | | | 170,779 |
| Tobacco - 0.5% | | | |
| Altria Group, Inc. | | 438,667 | 21,499 |
| British American Tobacco PLC sponsored ADR | | 342,700 | 12,214 |
| Philip Morris International, Inc. | | 138,900 | 15,996 |
| | | | 49,709 |
TOTAL CONSUMER STAPLES | | | 635,965 |
| ENERGY - 10.0% | | | |
| Oil, Gas & Consumable Fuels - 10.0% | | | |
| Enterprise Products Partners LP | | 217,800 | 6,286 |
| Exxon Mobil Corp. (d) | | 6,423,577 | 761,772 |
| Galp Energia SGPS SA | | 729,500 | 15,360 |
| Imperial Oil Ltd. (e) | | 1,996,626 | 143,039 |
| Shell PLC ADR | | 1,968,300 | 144,119 |
| | | | 1,070,576 |
| FINANCIALS - 18.5% | | | |
| Banks - 12.4% | | | |
| Bank of America Corp. (d) | | 7,343,536 | 296,018 |
| HDFC Bank Ltd. sponsored ADR | | 186,700 | 11,204 |
| JPMorgan Chase & Co. (d) | | 572,175 | 121,759 |
| M&T Bank Corp. | | 363,094 | 62,514 |
| PNC Financial Services Group, Inc. (d) | | 769,201 | 139,302 |
| U.S. Bancorp | | 2,447,137 | 109,828 |
| Wells Fargo & Co. | | 10,068,870 | 597,487 |
| | | | 1,338,112 |
| Capital Markets - 2.6% | | | |
| 3i Group PLC | | 495,200 | 19,922 |
| Brookfield Corp. Class A | | 658,502 | 32,102 |
| Charles Schwab Corp. | | 59,000 | 3,846 |
| Intercontinental Exchange, Inc. | | 12,600 | 1,910 |
| KKR & Co., Inc. | | 570,552 | 70,435 |
| Moody's Corp. | | 23,900 | 10,910 |
| Morgan Stanley | | 208,951 | 21,566 |
| MSCI, Inc. | | 6,400 | 3,461 |
| Northern Trust Corp. | | 1,034,553 | 91,713 |
| Raymond James Financial, Inc. | | 213,270 | 24,739 |
| | | | 280,604 |
| Financial Services - 2.3% | | | |
| Global Payments, Inc. | | 204,500 | 20,785 |
| MasterCard, Inc. Class A | | 66,567 | 30,868 |
| Visa, Inc. Class A | | 725,675 | 192,790 |
| | | | 244,443 |
| Insurance - 1.2% | | | |
| American Financial Group, Inc. | | 40,800 | 5,343 |
| Arthur J. Gallagher & Co. | | 130,100 | 36,882 |
| Brookfield Reinsurance Ltd. (e) | | 2,086 | 102 |
| Chubb Ltd. | | 110,356 | 30,421 |
| Marsh & McLennan Companies, Inc. | | 168,770 | 37,563 |
| The Travelers Companies, Inc. | | 77,627 | 16,802 |
| | | | 127,113 |
TOTAL FINANCIALS | | | 1,990,272 |
| HEALTH CARE - 12.0% | | | |
| Health Care Equipment & Supplies - 1.9% | | | |
| Abbott Laboratories | | 179,700 | 19,037 |
| Becton, Dickinson & Co. | | 137,011 | 33,028 |
| Boston Scientific Corp. (b) | | 1,594,322 | 117,789 |
| Koninklijke Philips Electronics NV (depository receipt) (NY Reg.) (e) | | 1,009,038 | 28,435 |
| Sonova Holding AG | | 21,532 | 6,606 |
| | | | 204,895 |
| Health Care Providers & Services - 5.3% | | | |
| Cardinal Health, Inc. | | 416,611 | 42,007 |
| Cigna Group | | 433,154 | 151,028 |
| CVS Health Corp. | | 275,712 | 16,634 |
| Humana, Inc. | | 111,500 | 40,320 |
| McKesson Corp. | | 151,534 | 93,500 |
| UnitedHealth Group, Inc. | | 393,287 | 226,596 |
| | | | 570,085 |
| Life Sciences Tools & Services - 0.8% | | | |
| Danaher Corp. | | 269,803 | 74,757 |
| Thermo Fisher Scientific, Inc. | | 10,700 | 6,563 |
| | | | 81,320 |
| Pharmaceuticals - 4.0% | | | |
| Bristol-Myers Squibb Co. | | 1,691,336 | 80,440 |
| Eli Lilly & Co. (d) | | 122,648 | 98,642 |
| Galderma Group AG | | 148,300 | 11,673 |
| GSK PLC sponsored ADR | | 1,866,528 | 72,365 |
| Johnson & Johnson | | 465,366 | 73,458 |
| Royalty Pharma PLC | | 322,000 | 9,071 |
| UCB SA | | 511,900 | 85,677 |
| Zoetis, Inc. Class A | | 13,900 | 2,503 |
| | | | 433,829 |
TOTAL HEALTH CARE | | | 1,290,129 |
| INDUSTRIALS - 16.2% | | | |
| Aerospace & Defense - 8.3% | | | |
| Airbus Group NV | | 276,900 | 41,902 |
| General Dynamics Corp. | | 153,261 | 45,781 |
| General Electric Co. (d) | | 3,168,711 | 539,315 |
| Howmet Aerospace, Inc. | | 94,800 | 9,072 |
| Huntington Ingalls Industries, Inc. | | 136,484 | 38,213 |
| Loar Holdings, Inc. | | 10,200 | 638 |
| Textron, Inc. | | 173,400 | 16,109 |
| The Boeing Co. (b) | | 1,072,120 | 204,346 |
| | | | 895,376 |
| Air Freight & Logistics - 1.3% | | | |
| Expeditors International of Washington, Inc. | | 8,400 | 1,048 |
| FedEx Corp. | | 65,174 | 19,699 |
| United Parcel Service, Inc. Class B | | 934,099 | 121,778 |
| | | | 142,525 |
| Building Products - 0.0% | | | |
| A.O. Smith Corp. | | 17,000 | 1,446 |
| Commercial Services & Supplies - 0.7% | | | |
| GFL Environmental, Inc. | | 1,562,900 | 60,641 |
| Veralto Corp. | | 80,201 | 8,546 |
| | | | 69,187 |
| Electrical Equipment - 2.0% | | | |
| Acuity Brands, Inc. | | 43,915 | 11,038 |
| AMETEK, Inc. | | 36,600 | 6,349 |
| GE Vernova LLC (d) | | 927,677 | 165,349 |
| Regal Rexnord Corp. | | 153,800 | 24,713 |
| Rockwell Automation, Inc. | | 19,318 | 5,383 |
| | | | 212,832 |
| Ground Transportation - 0.3% | | | |
| Knight-Swift Transportation Holdings, Inc. | | 659,809 | 35,913 |
| Machinery - 1.9% | | | |
| Allison Transmission Holdings, Inc. | | 402,000 | 35,613 |
| Caterpillar, Inc. | | 15,323 | 5,305 |
| Cummins, Inc. | | 57,976 | 16,917 |
| Deere & Co. | | 50,400 | 18,748 |
| Donaldson Co., Inc. | | 652,212 | 48,799 |
| Fortive Corp. | | 244,588 | 17,574 |
| Nordson Corp. | | 157,527 | 39,434 |
| Otis Worldwide Corp. | | 87,573 | 8,276 |
| Stanley Black & Decker, Inc. | | 87,618 | 9,254 |
| | | | 199,920 |
| Professional Services - 0.6% | | | |
| Equifax, Inc. | | 93,923 | 26,239 |
| RELX PLC (London Stock Exchange) | | 897,501 | 42,360 |
| | | | 68,599 |
| Trading Companies & Distributors - 1.0% | | | |
| Watsco, Inc. | | 193,591 | 94,761 |
| WESCO International, Inc. | | 85,300 | 14,923 |
| | | | 109,684 |
| Transportation Infrastructure - 0.1% | | | |
| Aena SME SA (a) | | 33,500 | 6,348 |
TOTAL INDUSTRIALS | | | 1,741,830 |
| INFORMATION TECHNOLOGY - 24.3% | | | |
| Electronic Equipment, Instruments & Components - 0.1% | | | |
| CDW Corp. | | 66,164 | 14,431 |
| IT Services - 0.6% | | | |
| Amdocs Ltd. | | 302,900 | 26,495 |
| IBM Corp. | | 184,542 | 35,458 |
| | | | 61,953 |
| Semiconductors & Semiconductor Equipment - 8.9% | | | |
| Analog Devices, Inc. | | 176,208 | 40,771 |
| Applied Materials, Inc. | | 183,900 | 39,024 |
| BE Semiconductor Industries NV | | 169,000 | 21,793 |
| Broadcom, Inc. | | 523,500 | 84,116 |
| Lam Research Corp. | | 40,130 | 36,969 |
| Marvell Technology, Inc. | | 1,381,186 | 92,512 |
| Microchip Technology, Inc. | | 56,900 | 5,052 |
| NVIDIA Corp. | | 3,855,550 | 451,176 |
| NXP Semiconductors NV | | 212,726 | 55,981 |
| Qualcomm, Inc. | | 283,400 | 51,281 |
| Taiwan Semiconductor Manufacturing Co. Ltd. sponsored ADR | | 327,000 | 54,217 |
| Teradyne, Inc. | | 191,000 | 25,052 |
| | | | 957,944 |
| Software - 11.5% | | | |
| Dassault Systemes SA | | 167,900 | 6,365 |
| Intuit, Inc. | | 138,100 | 89,399 |
| Microsoft Corp. | | 2,110,682 | 882,997 |
| Oracle Corp. | | 754,400 | 105,201 |
| Sage Group PLC | | 1,616,100 | 22,562 |
| SAP SE sponsored ADR | | 598,745 | 126,694 |
| | | | 1,233,218 |
| Technology Hardware, Storage & Peripherals - 3.2% | | | |
| Apple, Inc. (d) | | 1,436,902 | 319,107 |
| Dell Technologies, Inc. | | 85,300 | 9,697 |
| Samsung Electronics Co. Ltd. | | 321,190 | 19,673 |
| | | | 348,477 |
TOTAL INFORMATION TECHNOLOGY | | | 2,616,023 |
| MATERIALS - 1.3% | | | |
| Chemicals - 0.3% | | | |
| Air Products & Chemicals, Inc. | | 79,100 | 20,871 |
| International Flavors & Fragrances, Inc. | | 35,300 | 3,512 |
| PPG Industries, Inc. | | 54,322 | 6,898 |
| Sherwin-Williams Co. | | 14,400 | 5,052 |
| | | | 36,333 |
| Metals & Mining - 1.0% | | | |
| First Quantum Minerals Ltd. | | 5,289,000 | 64,741 |
| Freeport-McMoRan, Inc. | | 837,512 | 38,031 |
| | | | 102,772 |
TOTAL MATERIALS | | | 139,105 |
| REAL ESTATE - 1.4% | | | |
| Equity Real Estate Investment Trusts (REITs) - 1.4% | | | |
| American Tower Corp. | | 302,978 | 66,776 |
| Crown Castle, Inc. | | 596,400 | 65,652 |
| Public Storage Operating Co. | | 2,400 | 710 |
| Simon Property Group, Inc. | | 85,460 | 13,113 |
| Terreno Realty Corp. | | 90,300 | 6,177 |
| | | | 152,428 |
| UTILITIES - 2.4% | | | |
| Electric Utilities - 2.3% | | | |
| Constellation Energy Corp. | | 48,213 | 9,151 |
| Duke Energy Corp. | | 201,121 | 21,976 |
| Edison International | | 217,100 | 17,370 |
| Entergy Corp. | | 142,463 | 16,521 |
| Eversource Energy | | 328,700 | 21,336 |
| Exelon Corp. | | 155,840 | 5,797 |
| FirstEnergy Corp. | | 125,300 | 5,251 |
| NextEra Energy, Inc. | | 53,800 | 4,110 |
| Southern Co. | | 1,714,166 | 143,167 |
| | | | 244,679 |
| Multi-Utilities - 0.1% | | | |
| Sempra | | 148,192 | 11,864 |
TOTAL UTILITIES | | | 256,543 |
| TOTAL COMMON STOCKS (Cost $6,073,092) | | | 10,537,095 |
| | | | |
| Convertible Bonds - 0.1% |
| | | Principal Amount (f) (000s) | Value ($) (000s) |
| COMMUNICATION SERVICES - 0.1% | | | |
| Interactive Media & Services - 0.1% | | | |
Snap, Inc. 0.125% 3/1/28 (Cost $10,091) | | 13,064 | 10,386 |
| | | | |
| U.S. Treasury Obligations - 0.5% |
| | | Principal Amount (f) (000s) | Value ($) (000s) |
U.S. Treasury Bills, yield at date of purchase 5.31% to 5.32% 8/8/24 to 9/12/24 (d) (Cost $52,914) | | 53,113 | 52,913 |
| | | | |
| Money Market Funds - 1.6% |
| | | Shares | Value ($) (000s) |
| Fidelity Cash Central Fund 5.39% (g) | | 160,701,733 | 160,734 |
| Fidelity Securities Lending Cash Central Fund 5.39% (g)(h) | | 16,821,297 | 16,823 |
| TOTAL MONEY MARKET FUNDS (Cost $177,557) | | | 177,557 |
| | | | |
| TOTAL INVESTMENT IN SECURITIES - 100.2% (Cost $6,313,654) | 10,777,951 |
NET OTHER ASSETS (LIABILITIES) - (0.2)% | (20,922) |
| NET ASSETS - 100.0% | 10,757,029 |
| | |
| Written Options |
| | Counterparty | Number of Contracts | Notional Amount ($) (000s) | Exercise Price ($) | Expiration Date | Value ($) (000s) |
| Call Options | | | | | | |
| Apple, Inc. | Chicago Board Options Exchange | 676 | 15,013 | 235.00 | 09/20/24 | (271) |
| Bank of America Corp. | Chicago Board Options Exchange | 2,250 | 9,070 | 47.00 | 10/18/24 | (36) |
| Bank of America Corp. | Chicago Board Options Exchange | 2,250 | 9,070 | 48.00 | 10/18/24 | (24) |
| Eli Lilly & Co. | Chicago Board Options Exchange | 67 | 5,389 | 850.00 | 08/16/24 | (103) |
| Exxon Mobil Corp. | Chicago Board Options Exchange | 3,225 | 38,245 | 125.00 | 09/20/24 | (474) |
| GE Vernova LLC | Chicago Board Options Exchange | 904 | 16,113 | 200.00 | 09/20/24 | (542) |
| General Electric Co. | Chicago Board Options Exchange | 1,575 | 26,807 | 190.00 | 09/20/24 | (256) |
| General Electric Co. | Chicago Board Options Exchange | 1,651 | 28,100 | 185.00 | 09/20/24 | (428) |
| JPMorgan Chase & Co. | Chicago Board Options Exchange | 226 | 4,809 | 220.00 | 09/20/24 | (82) |
| PNC Financial Services Group, Inc. | Chicago Board Options Exchange | 376 | 6,809 | 190.00 | 09/20/24 | (106) |
| | | | | | | |
| | | | | | | (2,322) |
| Put Options | | | | | | |
| The Boeing Co. | Chicago Board Options Exchange | 1,600 | 30,496 | 170.00 | 08/16/24 | (46) |
| | | | | | | |
| TOTAL WRITTEN OPTIONS | | | | | | (2,368) |
Any values shown as $0 in the Schedule of Investments may reflect amounts less than $500.
Legend
| (a) | Security exempt from registration under Rule 144A of the Securities Act of 1933. These securities may be resold in transactions exempt from registration, normally to qualified institutional buyers. At the end of the period, the value of these securities amounted to $37,911,000 or 0.4% of net assets. |
| (c) | Security or a portion of the security purchased on a delayed delivery or when-issued basis. |
| (d) | Security or a portion of the security is pledged as collateral for options written. At period end, the value of securities pledged amounted to $187,305,000. |
| (e) | Security or a portion of the security is on loan at period end. |
| (f) | Amount is stated in United States dollars unless otherwise noted. |
| (g) | Affiliated fund that is generally available only to investment companies and other accounts managed by Fidelity Investments. The rate quoted is the annualized seven-day yield of the fund at period end. A complete unaudited listing of the fund's holdings as of its most recent quarter end is available upon request. In addition, each Fidelity Central Fund's financial statements, which are not covered by the Fund's Report of Independent Registered Public Accounting Firm, are available on the SEC's website or upon request. |
| (h) | Investment made with cash collateral received from securities on loan. |
Affiliated Central Funds
Fiscal year to date information regarding the Fund's investments in Fidelity Central Funds, including the ownership percentage, is presented below.
| Affiliate (Amounts in thousands) | Value, beginning of period ($) | Purchases ($) | Sales Proceeds ($) | Dividend Income ($) | Realized Gain (loss) ($) | Change in Unrealized appreciation (depreciation) ($) | Value, end of period ($) | % ownership, end of period |
| Fidelity Cash Central Fund 5.39% | 498,389 | 934,674 | 1,272,329 | 13,219 | - | - | 160,734 | 0.3% |
| Fidelity Securities Lending Cash Central Fund 5.39% | 99,536 | 943,571 | 1,026,284 | 674 | - | - | 16,823 | 0.1% |
| Total | 597,925 | 1,878,245 | 2,298,613 | 13,893 | - | - | 177,557 | |
| | | | | | | | | |
Amounts in the dividend income column in the above table include any capital gain distributions from underlying funds, which are presented in the corresponding line item in the Statement of Operations, if applicable.
Amounts in the dividend income column for Fidelity Securities Lending Cash Central Fund represents the income earned on investing cash collateral, less rebates paid to borrowers and any lending agent fees associated with the loan, plus any premium payments received for lending certain types of securities.
Amounts included in the purchases and sales proceeds columns may include in-kind transactions, if applicable.
Investment Valuation
The following is a summary of the inputs used, as of July 31, 2024, involving the Fund's assets and liabilities carried at fair value. The inputs or methodology used for valuing securities may not be an indication of the risk associated with investing in those securities. For more information on valuation inputs, and their aggregation into the levels used below, please refer to the Investment Valuation section in the accompanying Notes to Financial Statements.
| Valuation Inputs at Reporting Date: |
Description (Amounts in thousands) | Total ($) | Level 1 ($) | Level 2 ($) | Level 3 ($) |
Investments in Securities: | | | | |
|
| Equities: | | | | |
Communication Services | 427,735 | 349,719 | 78,016 | - |
Consumer Discretionary | 216,489 | 216,489 | - | - |
Consumer Staples | 635,965 | 632,332 | 3,633 | - |
Energy | 1,070,576 | 1,070,576 | - | - |
Financials | 1,990,272 | 1,970,350 | 19,922 | - |
Health Care | 1,290,129 | 1,290,129 | - | - |
Industrials | 1,741,830 | 1,657,568 | 84,262 | - |
Information Technology | 2,616,023 | 2,609,658 | 6,365 | - |
Materials | 139,105 | 139,105 | - | - |
Real Estate | 152,428 | 152,428 | - | - |
Utilities | 256,543 | 256,543 | - | - |
|
| Corporate Bonds | 10,386 | - | 10,386 | - |
|
| U.S. Government and Government Agency Obligations | 52,913 | - | 52,913 | - |
|
| Money Market Funds | 177,557 | 177,557 | - | - |
| Total Investments in Securities: | 10,777,951 | 10,522,454 | 255,497 | - |
Derivative Instruments: Liabilities | | | | |
Written Options | (2,368) | (2,368) | - | - |
| Total Liabilities | (2,368) | (2,368) | - | - |
| Total Derivative Instruments: | (2,368) | (2,368) | - | - |
Value of Derivative Instruments
The following table is a summary of the Fund's value of derivative instruments by primary risk exposure as of July 31, 2024. For additional information on derivative instruments, please refer to the Derivative Instruments section in the accompanying Notes to Financial Statements.
Primary Risk Exposure / Derivative Type | Value |
| (Amounts in thousands) | Asset ($) | Liability ($) |
| Equity Risk | | |
Written Options (a) | 0 | (2,368) |
| Total Equity Risk | 0 | (2,368) |
| Total Value of Derivatives | 0 | (2,368) |
(a)Gross value is presented in the Statement of Assets and Liabilities in the written options, at value line-item.
Financial Statements
| Statement of Assets and Liabilities |
As of July 31, 2024 Amounts in thousands (except per-share amounts) |
| Assets | | | | |
| Investment in securities, at value (including securities loaned of $16,391) - See accompanying schedule: | | | | |
Unaffiliated issuers (cost $6,136,097) | $ | 10,600,394 | | |
Fidelity Central Funds (cost $177,557) | | 177,557 | | |
| | | | | |
| | | | | |
| Total Investment in Securities (cost $6,313,654) | | | $ | 10,777,951 |
| Cash | | | | 19 |
| Receivable for investments sold | | | | 4,601 |
| Receivable for fund shares sold | | | | 1,951 |
| Dividends receivable | | | | 6,601 |
| Interest receivable | | | | 7 |
| Distributions receivable from Fidelity Central Funds | | | | 560 |
| Prepaid expenses | | | | 2 |
| Other receivables | | | | 424 |
Total assets | | | | 10,792,116 |
| Liabilities | | | | |
| Payable for investments purchased | | | | |
Regular delivery | $ | 7,772 | | |
Delayed delivery | | 100 | | |
| Payable for fund shares redeemed | | 2,752 | | |
| Accrued management fee | | 4,663 | | |
| Written options, at value (premium received $3,520) | | 2,368 | | |
| Other payables and accrued expenses | | 609 | | |
| Collateral on securities loaned | | 16,823 | | |
| Total liabilities | | | | 35,087 |
| Net Assets | | | $ | 10,757,029 |
| Net Assets consist of: | | | | |
| Paid in capital | | | $ | 5,936,869 |
| Total accumulated earnings (loss) | | | | 4,820,160 |
| Net Assets | | | $ | 10,757,029 |
| | | | | |
| Net Asset Value and Maximum Offering Price | | | | |
| Growth and Income : | | | | |
Net Asset Value, offering price and redemption price per share ($9,390,438 ÷ 149,580 shares) | | | $ | 62.78 |
| Class K : | | | | |
Net Asset Value, offering price and redemption price per share ($1,366,591 ÷ 21,792 shares) | | | $ | 62.71 |
| Statement of Operations |
| Year ended July 31, 2024 Amounts in thousands |
| Investment Income | | | | |
| Dividends | | | $ | 186,209 |
| Interest | | | | 1,802 |
| Income from Fidelity Central Funds (including $674 from security lending) | | | | 13,893 |
| Total income | | | | 201,904 |
| Expenses | | | | |
| Management fee | $ | 45,565 | | |
| Transfer agent fees | | 6,540 | | |
| Accounting fees | | 677 | | |
| Custodian fees and expenses | | 298 | | |
| Independent trustees' fees and expenses | | 46 | | |
| Registration fees | | 88 | | |
| Audit fees | | 162 | | |
| Legal | | 13 | | |
| Miscellaneous | | 136 | | |
| Total expenses before reductions | | 53,525 | | |
| Expense reductions | | (629) | | |
| Total expenses after reductions | | | | 52,896 |
| Net Investment income (loss) | | | | 149,008 |
| Realized and Unrealized Gain (Loss) | | | | |
| Net realized gain (loss) on: | | | | |
| Investment Securities: | | | | |
| Unaffiliated issuers | | 508,685 | | |
| Foreign currency transactions | | (54) | | |
| Written options | | (9,036) | | |
| Total net realized gain (loss) | | | | 499,595 |
| Change in net unrealized appreciation (depreciation) on: | | | | |
| Investment Securities: | | | | |
| Unaffiliated issuers | | 1,232,859 | | |
| Assets and liabilities in foreign currencies | | (13) | | |
| Written options | | 1,406 | | |
| Total change in net unrealized appreciation (depreciation) | | | | 1,234,252 |
| Net gain (loss) | | | | 1,733,847 |
| Net increase (decrease) in net assets resulting from operations | | | $ | 1,882,855 |
| Statement of Changes in Net Assets |
| |
| Amount in thousands | | Year ended July 31, 2024 | | Year ended July 31, 2023 |
| Increase (Decrease) in Net Assets | | | | |
| Operations | | | | |
| Net investment income (loss) | $ | 149,008 | $ | 136,852 |
| Net realized gain (loss) | | 499,595 | | 114,801 |
| Change in net unrealized appreciation (depreciation) | | 1,234,252 | | 906,093 |
| Net increase (decrease) in net assets resulting from operations | | 1,882,855 | | 1,157,746 |
| Distributions to shareholders | | (367,130) | | (270,534) |
| | | | | |
| Share transactions - net increase (decrease) | | (115,748) | | 786,109 |
| Total increase (decrease) in net assets | | 1,399,977 | | 1,673,321 |
| | | | | |
| Net Assets | | | | |
| Beginning of period | | 9,357,052 | | 7,683,731 |
| End of period | $ | 10,757,029 | $ | 9,357,052 |
| | | | | |
| | | | | |
Financial Highlights
Fidelity® Growth & Income Portfolio |
| |
| Years ended July 31, | | 2024 | | 2023 | | 2022 | | 2021 | | 2020 |
Selected Per-Share Data | | | | | | | | | | |
| Net asset value, beginning of period | $ | 54.20 | $ | 48.92 | $ | 51.87 | $ | 38.15 | $ | 38.98 |
| Income from Investment Operations | | | | | | | | | | |
Net investment income (loss) A,B | | .85 | | .84 | | .76 | | .78 | | .83 |
| Net realized and unrealized gain (loss) | | 9.84 | | 6.13 | | (.61) | | 14.49 | | (.37) |
| Total from investment operations | | 10.69 | | 6.97 | | .15 | | 15.27 | | .46 |
| Distributions from net investment income | | (.84) | | (.86) | | (1.06) | | (.79) | | (.84) |
| Distributions from net realized gain | | (1.27) | | (.83) | | (2.05) | | (.75) | | (.46) |
| Total distributions | | (2.11) | | (1.69) | | (3.10) C | | (1.55) C | | (1.29) C |
| Net asset value, end of period | $ | 62.78 | $ | 54.20 | $ | 48.92 | $ | 51.87 | $ | 38.15 |
Total Return D | | | | 14.77% | | .26% | | 41.01% | | 1.27% |
Ratios to Average Net Assets B,E,F | | | | | | | | | | |
| Expenses before reductions | | .56% | | .58% | | .57% | | .58% | | .60% |
| Expenses net of fee waivers, if any | | | | .58% | | .57% | | .58% | | .60% |
| Expenses net of all reductions | | .56% | | .58% | | .57% | | .58% | | .60% |
| Net investment income (loss) | | 1.52% | | 1.71% | | 1.51% | | 1.71% | | 2.18% |
| Supplemental Data | | | | | | | | | | |
| Net assets, end of period (in millions) | $ | 9,390 | $ | 8,277 | $ | 7,360 | $ | 7,219 | $ | 5,451 |
Portfolio turnover rate G | | | | 13% | | 12% | | 16% | | 32% |
ACalculated based on average shares outstanding during the period.
BNet investment income (loss) is affected by the timing of the declaration of dividends by any underlying mutual funds or exchange-traded funds (ETFs). Net investment income (loss) of any mutual funds or ETFs is not included in the Fund's net investment income (loss) ratio.
CTotal distributions per share do not sum due to rounding.
DTotal returns would have been lower if certain expenses had not been reduced during the applicable periods shown.
EFees and expenses of any underlying mutual funds or exchange-traded funds (ETFs) are not included in the Fund's expense ratio. The Fund indirectly bears its proportionate share of these expenses. For additional expense information related to investments in Fidelity Central Funds, please refer to the "Investments in Fidelity Central Funds" note found in the Notes to Financial Statements section of the most recent Annual or Semi-Annual report.
FExpense ratios reflect operating expenses of the class. Expenses before reductions do not reflect amounts reimbursed, waived, or reduced through arrangements with the investment adviser, brokerage services, or other offset arrangements, if applicable, and do not represent the amount paid by the class during periods when reimbursements, waivers or reductions occur.
GAmount does not include the portfolio activity of any underlying mutual funds or exchange-traded funds (ETFs).
Fidelity® Growth & Income Portfolio Class K |
| |
| Years ended July 31, | | 2024 | | 2023 | | 2022 | | 2021 | | 2020 |
Selected Per-Share Data | | | | | | | | | | |
| Net asset value, beginning of period | $ | 54.14 | $ | 48.86 | $ | 51.82 | $ | 38.11 | $ | 38.94 |
| Income from Investment Operations | | | | | | | | | | |
Net investment income (loss) A,B | | .90 | | .89 | | .81 | | .81 | | .86 |
| Net realized and unrealized gain (loss) | | 9.83 | | 6.13 | | (.62) | | 14.48 | | (.35) |
| Total from investment operations | | 10.73 | | 7.02 | | .19 | | 15.29 | | .51 |
| Distributions from net investment income | | (.89) | | (.91) | | (1.10) | | (.83) | | (.88) |
| Distributions from net realized gain | | (1.27) | | (.83) | | (2.05) | | (.75) | | (.46) |
| Total distributions | | (2.16) | | (1.74) | | (3.15) | | (1.58) | | (1.34) |
| Net asset value, end of period | $ | 62.71 | $ | 54.14 | $ | 48.86 | $ | 51.82 | $ | 38.11 |
Total Return C | | | | 14.89% | | .33% | | 41.15% | | 1.39% |
Ratios to Average Net Assets B,D,E | | | | | | | | | | |
| Expenses before reductions | | .47% | | .49% | | .49% | | .49% | | .50% |
| Expenses net of fee waivers, if any | | | | .48% | | .48% | | .49% | | .50% |
| Expenses net of all reductions | | .47% | | .48% | | .48% | | .49% | | .50% |
| Net investment income (loss) | | 1.61% | | 1.80% | | 1.60% | | 1.80% | | 2.28% |
| Supplemental Data | | | | | | | | | | |
| Net assets, end of period (in millions) | $ | 1,367 | $ | 1,080 | $ | 323 | $ | 850 | $ | 1,020 |
Portfolio turnover rate F | | | | 13% | | 12% | | 16% | | 32% |
ACalculated based on average shares outstanding during the period.
BNet investment income (loss) is affected by the timing of the declaration of dividends by any underlying mutual funds or exchange-traded funds (ETFs). Net investment income (loss) of any mutual funds or ETFs is not included in the Fund's net investment income (loss) ratio.
CTotal returns would have been lower if certain expenses had not been reduced during the applicable periods shown.
DFees and expenses of any underlying mutual funds or exchange-traded funds (ETFs) are not included in the Fund's expense ratio. The Fund indirectly bears its proportionate share of these expenses. For additional expense information related to investments in Fidelity Central Funds, please refer to the "Investments in Fidelity Central Funds" note found in the Notes to Financial Statements section of the most recent Annual or Semi-Annual report.
EExpense ratios reflect operating expenses of the class. Expenses before reductions do not reflect amounts reimbursed, waived, or reduced through arrangements with the investment adviser, brokerage services, or other offset arrangements, if applicable, and do not represent the amount paid by the class during periods when reimbursements, waivers or reductions occur.
FAmount does not include the portfolio activity of any underlying mutual funds or exchange-traded funds (ETFs).
Notes to Financial Statements
For the period ended July 31, 2024
(Amounts in thousands except percentages)
1. Organization.
Fidelity Growth & Income Portfolio (the Fund) is a fund of Fidelity Securities Fund (the Trust) and is authorized to issue an unlimited number of shares. The Trust is registered under the Investment Company Act of 1940, as amended (the 1940 Act), as an open-end management investment company organized as a Massachusetts business trust. The Fund offers Growth & Income Portfolio and Class K shares, each of which has equal rights as to assets and voting privileges. Each class has exclusive voting rights with respect to matters that affect that class.
2. Investments in Fidelity Central Funds.
Funds may invest in Fidelity Central Funds, which are open-end investment companies generally available only to other investment companies and accounts managed by the investment adviser and its affiliates. The Schedule of Investments lists any Fidelity Central Funds held as an investment as of period end, but does not include the underlying holdings of each Fidelity Central Fund. An investing fund indirectly bears its proportionate share of the expenses of the underlying Fidelity Central Funds.
Based on its investment objective, each Fidelity Central Fund may invest or participate in various investment vehicles or strategies that are similar to those of the investing fund. These strategies are consistent with the investment objectives of the investing fund and may involve certain economic risks which may cause a decline in value of each of the Fidelity Central Funds and thus a decline in the value of the investing fund.
| Fidelity Central Fund | Investment Manager | Investment Objective | Investment Practices | Expense RatioA |
| Fidelity Money Market Central Funds | Fidelity Management & Research Company LLC (FMR) | Each fund seeks to obtain a high level of current income consistent with the preservation of capital and liquidity. | Short-term Investments | Less than .005% |
A Expenses expressed as a percentage of average net assets and are as of each underlying Central Fund's most recent annual or semi-annual shareholder report.
A complete unaudited list of holdings for each Fidelity Central Fund is available upon request or at the Securities and Exchange Commission website at www.sec.gov. In addition, the financial statements of the Fidelity Central Funds which contain the significant accounting policies (including investment valuation policies) of those funds, and are not covered by the Report of Independent Registered Public Accounting Firm, are available on the Securities and Exchange Commission website or upon request.
3. Significant Accounting Policies.
The Fund is an investment company and applies the accounting and reporting guidance of the Financial Accounting Standards Board (FASB) Accounting Standards Codification Topic 946 Financial Services - Investment Companies. The financial statements have been prepared in conformity with accounting principles generally accepted in the United States of America (GAAP), which require management to make certain estimates and assumptions at the date of the financial statements. Actual results could differ from those estimates. Subsequent events, if any, through the date that the financial statements were issued have been evaluated in the preparation of the financial statements. The Fund's Schedule of Investments lists any underlying mutual funds or exchange-traded funds (ETFs) but does not include the underlying holdings of these funds. The following summarizes the significant accounting policies of the Fund:
Investment Valuation. Investments are valued as of 4:00 p.m. Eastern time on the last calendar day of the period. The Board of Trustees (the Board) has designated the Fund's investment adviser as the valuation designee responsible for the fair valuation function and performing fair value determinations as needed. The investment adviser has established a Fair Value Committee (the Committee) to carry out the day-to-day fair valuation responsibilities and has adopted policies and procedures to govern the fair valuation process and the activities of the Committee. In accordance with these fair valuation policies and procedures, which have been approved by the Board, the Fund attempts to obtain prices from one or more third party pricing services or brokers to value its investments. When current market prices, quotations or currency exchange rates are not readily available or reliable, investments will be fair valued in good faith by the Committee, in accordance with the policies and procedures. Factors used in determining fair value vary by investment type and may include market or investment specific events, transaction data, estimated cash flows, and market observations of comparable investments. The frequency that the fair valuation procedures are used cannot be predicted and they may be utilized to a significant extent. The Committee manages the Fund's fair valuation practices and maintains the fair valuation policies and procedures. The Fund's investment adviser reports to the Board information regarding the fair valuation process and related material matters.
The Fund categorizes the inputs to valuation techniques used to value its investments into a disclosure hierarchy consisting of three levels as shown below:
Level 1 - unadjusted quoted prices in active markets for identical investments
Level 2 - other significant observable inputs (including quoted prices for similar investments, interest rates, prepayment speeds, etc.)
Level 3 - unobservable inputs (including the Fund's own assumptions based on the best information available)
Valuation techniques used to value the Fund's investments by major category are as follows:
Equity securities, including restricted securities, for which market quotations are readily available, are valued at the last reported sale price or official closing price as reported by a third party pricing service on the primary market or exchange on which they are traded and are categorized as Level 1 in the hierarchy. In the event there were no sales during the day or closing prices are not available, securities are valued at the last quoted bid price or may be valued using the last available price and are generally categorized as Level 2 in the hierarchy. For foreign equity securities, when market or security specific events arise, comparisons to the valuation of American Depositary Receipts (ADRs), futures contracts, Exchange-Traded Funds (ETFs) and certain indexes as well as quoted prices for similar securities may be used and would be categorized as Level 2 in the hierarchy. For equity securities, including restricted securities, where observable inputs are limited, assumptions about market activity and risk are used and these securities may be categorized as Level 3 in the hierarchy.
Debt securities, including restricted securities, are valued based on evaluated prices received from third party pricing services or from brokers who make markets in such securities. Corporate bonds and U.S. government and government agency obligations are valued by pricing services who utilize matrix pricing which considers yield or price of bonds of comparable quality, coupon, maturity and type or by broker-supplied prices. When independent prices are unavailable or unreliable, debt securities may be valued utilizing pricing methodologies which consider similar factors that would be used by third party pricing services. Debt securities are generally categorized as Level 2 in the hierarchy but may be Level 3 depending on the circumstances.
Exchange-traded options are valued using the last sale price or, in the absence of a sale, the last offering price and are categorized as Level 1 in the hierarchy. Investments in open-end mutual funds, including the Fidelity Central Funds, are valued at their closing net asset value (NAV) each business day and are categorized as Level 1 in the hierarchy.
Changes in valuation techniques may result in transfers in or out of an assigned level within the disclosure hierarchy. The aggregate value of investments by input level as of July 31, 2024 is included at the end of the Fund's Schedule of Investments.
Foreign Currency. Certain Funds may use foreign currency contracts to facilitate transactions in foreign-denominated securities. Gains and losses from these transactions may arise from changes in the value of the foreign currency or if the counterparties do not perform under the contracts' terms.
Foreign-denominated assets, including investment securities, and liabilities are translated into U.S. dollars at the exchange rates at period end. Purchases and sales of investment securities, income and dividends received, and expenses denominated in foreign currencies are translated into U.S. dollars at the exchange rate in effect on the transaction date.
The effects of exchange rate fluctuations on investments are included with the net realized and unrealized gain (loss) on investment securities. Other foreign currency transactions resulting in realized and unrealized gain (loss) are disclosed separately.
Investment Transactions and Income. For financial reporting purposes, the Fund's investment holdings and NAV include trades executed through the end of the last business day of the period. The NAV per share for processing shareholder transactions is calculated as of the close of business of the New York Stock Exchange (NYSE), normally 4:00 p.m. Eastern time and includes trades executed through the end of the prior business day. Gains and losses on securities sold are determined on the basis of identified cost and include proceeds received from litigation. Commissions paid to certain brokers with whom the investment adviser, or its affiliates, places trades on behalf of a fund include an amount in addition to trade execution, which may be rebated back to a fund. Any such rebates are included in net realized gain (loss) on investments in the Statement of Operations. Dividend income is recorded on the ex-dividend date, except for certain dividends from foreign securities where the ex-dividend date may have passed, which are recorded as soon as the Fund is informed of the ex-dividend date. Non-cash dividends included in dividend income, if any, are recorded at the fair market value of the securities received. Income and capital gain distributions from Fidelity Central Funds, if any, are recorded on the ex-dividend date. Certain distributions received by the Fund represent a return of capital or capital gain. The Fund determines the components of these distributions subsequent to the ex-dividend date, based upon receipt of tax filings or other correspondence relating to the underlying investment. These distributions are recorded as a reduction of cost of investments and/or as a realized gain. Interest income is accrued as earned and includes coupon interest and amortization of premium and accretion of discount on debt securities as applicable. Investment income is recorded net of foreign taxes withheld where recovery of such taxes is uncertain. Funds may file withholding tax reclaims in certain jurisdictions to recover a portion of amounts previously withheld. Any withholding tax reclaims income is included in the Statement of Operations in dividends. Any receivables for withholding tax reclaims are included in the Statement of Assets and Liabilities in dividends receivable. The Fund has filed tax reclaims for previously withheld taxes on dividends earned in certain European Union (EU) countries. These additional filings are subject to various administrative proceedings by the local jurisdictions' tax authorities within the EU, as well as a number of related judicial proceedings. Income recognized for EU reclaims is included with other reclaims in the Statement of Operations in dividends. These reclaims are recorded when the amount is known and there are no significant uncertainties on collectability.
Class Allocations and Expenses. Investment income, realized and unrealized capital gains and losses, common expenses of a fund, and certain fund-level expense reductions, if any, are allocated daily on a pro-rata basis to each class based on the relative net assets of each class to the total net assets of a fund. Each class differs with respect to transfer agent and distribution and service plan fees incurred, as applicable. Certain expense reductions may also differ by class, if applicable. For the reporting period, the allocated portion of income and expenses to each class as a percent of its average net assets may vary due to the timing of recording these transactions in relation to fluctuating net assets of the classes. Expenses directly attributable to a fund are charged to that fund. Expenses attributable to more than one fund are allocated among the respective funds on the basis of relative net assets or other appropriate methods. Expenses included in the accompanying financial statements reflect the expenses of that fund and do not include any expenses associated with any underlying mutual funds or exchange-traded funds (ETFs). Although not included in a fund's expenses, a fund indirectly bears its proportionate share of these expenses through the net asset value of each underlying mutual fund or exchange-traded fund (ETF). Expense estimates are accrued in the period to which they relate and adjustments are made when actual amounts are known.
Deferred Trustee Compensation. Under a Deferred Compensation Plan (the Plan) for certain Funds, certain independent Trustees have elected to defer receipt of a portion of their annual compensation. Deferred amounts are invested in affiliated mutual funds, are marked-to-market and remain in a fund until distributed in accordance with the Plan. The investment of deferred amounts and the offsetting payable to the Trustees presented below are included in the accompanying Statement of Assets and Liabilities in other receivables and other payables and accrued expenses, as applicable.
| Fidelity Growth & Income Portfolio | $414 |
Income Tax Information and Distributions to Shareholders. Each year, the Fund intends to qualify as a regulated investment company under Subchapter M of the Internal Revenue Code, including distributing substantially all of its taxable income and realized gains. As a result, no provision for U.S. Federal income taxes is required. As of July 31, 2024, the Fund did not have any unrecognized tax benefits in the financial statements; nor is the Fund aware of any tax positions for which it is reasonably possible that the total amounts of unrecognized tax benefits will significantly change in the next twelve months. The Fund files a U.S. federal tax return, in addition to state and local tax returns as required. The Fund's federal income tax returns are subject to examination by the Internal Revenue Service (IRS) for a period of three fiscal years after they are filed. State and local tax returns may be subject to examination for an additional fiscal year depending on the jurisdiction. Foreign taxes are provided for based on the Fund's understanding of the tax rules and rates that exist in the foreign markets in which it invests.
Distributions are declared and recorded on the ex-dividend date. Income and capital gain distributions are declared separately for each class. Income and capital gain distributions are determined in accordance with income tax regulations, which may differ from GAAP. In addition, the Fund claimed a portion of the payment made to redeeming shareholders as a distribution for income tax purposes.
Capital accounts within the financial statements are adjusted for permanent book-tax differences. These adjustments have no impact on net assets or the results of operations. Capital accounts are not adjusted for temporary book-tax differences which will reverse in a subsequent period.
Book-tax differences are primarily due to foreign currency transactions, passive foreign investment companies (PFIC), partnerships, deferred trustees compensation, and losses deferred due to wash sales.
As of period end, the cost and unrealized appreciation (depreciation) in securities, and derivatives if applicable, for federal income tax purposes were as follows:
| Gross unrealized appreciation | $4,614,412 |
| Gross unrealized depreciation | (181,015) |
| Net unrealized appreciation (depreciation) | $4,433,397 |
| Tax Cost | $6,342,186 |
The tax-based components of distributable earnings as of period end were as follows:
| Undistributed ordinary income | $14,187 |
| Undistributed long-term capital gain | $374,132 |
| Net unrealized appreciation (depreciation) on securities and other investments | $4,431,976 |
The tax character of distributions paid was as follows:
| | July 31, 2024 | July 31, 2023 |
| Ordinary Income | $161,084 | $ 140,027 |
| Long-term Capital Gains | 206,046 | 130,507 |
| Total | $367,130 | $ 270,534 |
Delayed Delivery Transactions and When-Issued Securities. During the period, certain Funds transacted in securities on a delayed delivery or when-issued basis. Payment and delivery may take place after the customary settlement period for that security. The price of the underlying securities and the date when the securities will be delivered and paid for are fixed at the time the transaction is negotiated. Securities purchased on a delayed delivery or when-issued basis are identified as such in the Schedule of Investments. Compensation for interest forgone in the purchase of a delayed delivery or when-issued debt security may be received. With respect to purchase commitments, each applicable Fund identifies securities as segregated in its records with a value at least equal to the amount of the commitment. Payables and receivables associated with the purchases and sales of delayed delivery securities having the same coupon, settlement date and broker are offset. Delayed delivery or when-issued securities that have been purchased from and sold to different brokers are reflected as both payables and receivables in the Statement of Assets and Liabilities under the caption "Delayed delivery", as applicable. Losses may arise due to changes in the value of the underlying securities or if the counterparty does not perform under the contract's terms, or if the issuer does not issue the securities due to political, economic, or other factors.
Restricted Securities (including Private Placements). Funds may invest in securities that are subject to legal or contractual restrictions on resale. These securities generally may be resold in transactions exempt from registration or to the public if the securities are registered. Disposal of these securities may involve time-consuming negotiations and expense, and prompt sale at an acceptable price may be difficult. Information regarding restricted securities held at period end is included at the end of the Schedule of Investments, if applicable.
4. Derivative Instruments.
Risk Exposures and the Use of Derivative Instruments. The Fund's investment objectives allow for various types of derivative instruments, including options. Derivatives are investments whose value is primarily derived from underlying assets, indices or reference rates and may be transacted on an exchange or over-the-counter (OTC). Derivatives may involve a future commitment to buy or sell a specified asset based on specified terms, to exchange future cash flows at periodic intervals based on a notional principal amount, or for one party to make one or more payments upon the occurrence of specified events in exchange for periodic payments from the other party.
Derivatives were used to increase returns and to manage exposure to certain risks as defined below. The success of any strategy involving derivatives depends on analysis of numerous economic factors, and if the strategies for investment do not work as intended, the objectives may not be achieved.
Derivatives were used to increase or decrease exposure to the following risk(s):
| | |
| Equity Risk | Equity risk relates to the fluctuations in the value of financial instruments as a result of changes in market prices (other than those arising from interest rate risk or foreign exchange risk), whether caused by factors specific to an individual investment, its issuer, or all factors affecting all instruments traded in a market or market segment. |
Funds are also exposed to additional risks from investing in derivatives, such as liquidity risk and counterparty credit risk. Liquidity risk is the risk that a fund will be unable to close out the derivative in the open market in a timely manner. Counterparty credit risk is the risk that the counterparty will not be able to fulfill its obligation to a fund. Counterparty credit risk related to exchange-traded contracts may be mitigated by the protection provided by the exchange on which they trade.
Investing in derivatives may involve greater risks than investing in the underlying assets directly and, to varying degrees, may involve risk of loss in excess of any initial investment and collateral received and amounts recognized in the Statement of Assets and Liabilities. In addition, there may be the risk that the change in value of the derivative contract does not correspond to the change in value of the underlying instrument.
Net Realized Gain (Loss) and Change in Net Unrealized Appreciation (Depreciation) on Derivatives. The table below, which reflects the impacts of derivatives on the financial performance, summarizes the net realized gain (loss) and change in net unrealized appreciation (depreciation) for derivatives during the period as presented in the Statement of Operations.
| Primary Risk Exposure / Derivative Type | Net Realized Gain (Loss)($) | Change in Net Unrealized Appreciation (Depreciation)($) |
| Fidelity Growth & Income Portfolio | | |
| Equity Risk | | |
| Purchased Options | (1,022) | - |
| Written Options | (9,036) | 1,406 |
| Total Equity Risk | (10,058) | 1,406 |
| Totals | (10,058) | 1,406 |
If there are any open positions at period end, a summary of the value of derivatives by primary risk exposure is included at the end of the Schedule of Investments.
Options. Options give the purchaser the right, but not the obligation, to buy (call) or sell (put) an underlying security or financial instrument at an agreed exercise or strike price between or on certain dates. Options obligate the seller (writer) to buy (put) or sell (call) an underlying instrument at the exercise or strike price or cash settle an underlying derivative instrument if the holder exercises the option on or before the expiration date. Exchange-traded and/or OTC options were used to manage exposure to the market.
Upon entering into an options contract, a fund will pay or receive a premium. Premiums paid on purchased options are reflected as cost of investments and premiums received on written options are reflected as a liability on the Statement of Assets and Liabilities. Certain options may be purchased or written with premiums to be paid or received on a future date. Options are valued daily and any unrealized appreciation (depreciation) is reflected in total accumulated earnings (loss) in the Statement of Assets and Liabilities. When an option is exercised, the cost or proceeds of the underlying instrument purchased or sold is adjusted by the amount of the premium. When an option is closed, a gain or loss is realized depending on whether the proceeds or amount paid for the closing sale transaction is greater or less than the premium received or paid. When an option expires, gains and losses are realized to the extent of premiums received and paid, respectively. The net realized and unrealized gains (losses) on purchased options are included in the Statement of Operations in net realized gain (loss) and change in net unrealized appreciation (depreciation) on investment securities. The net realized gain (loss) and change in net unrealized appreciation (depreciation) on written options are presented in the Statement of Operations.
Any open options at period end are presented in the Schedule of Investments under the captions "Purchased Options," "Purchased Swaptions," "Written Options" and "Written Swaptions," as applicable, and are representative of volume of activity during the period unless an average notional amount is presented.
Writing puts and buying calls tend to increase exposure to the underlying instrument while buying puts and writing calls tend to decrease exposure to the underlying instrument. For purchased options, risk of loss is limited to the premium paid, and for written options, risk of loss is the change in value in excess of the premium received.
5. Purchases and Sales of Investments.
Purchases and sales of securities, other than short-term securities and in-kind transactions, as applicable, are noted in the table below.
| | Purchases ($) | Sales ($) |
| Fidelity Growth & Income Portfolio | 1,770,543 | 1,814,367 |
6. Fees and Other Transactions with Affiliates.
Management Fee. Fidelity Management & Research Company LLC (the investment adviser) and its affiliates provide the Fund with investment management related services for which the Fund pays a monthly management fee.
Effective March 1, 2024, the Fund's management contract was amended to incorporate administrative services previously covered under separate services agreements (Transfer Agent and Accounting agreements). The amended contract incorporates a management fee rate that may vary by class. The investment adviser or an affiliate pays certain expenses of managing and operating the Fund out of each class's management fee. Each class of the Fund pays a management fee to the investment adviser. The management fee is calculated and paid to the investment adviser every month. When determining a class's management fee, a mandate rate is calculated based on the monthly average net assets of a group of funds advised by FMR within a designated asset class. A discount rate is subtracted from the mandate rate once the Fund's monthly average net assets reach a certain level. The mandate rate and discount rate may vary by class. The annual management fee rate for a class of shares of the Fund is the lesser of (1) the class's mandate rate reduced by the class's discount rate (if applicable) or (2) the amount set forth in the following table.
| | Maximum Management Fee Rate % |
| Growth and Income | .54 |
| Class K | .45 |
One-twelfth of the management fee rate for a class is applied to the average net assets of the class for the month, giving a dollar amount which is the management fee for the class for that month. A different management fee rate may be applicable to each class of the Fund. The difference between classes is the result of separate arrangements for class-level services and/or waivers of certain expenses. It is not the result of any difference in advisory or custodial fees or other expenses related to the management of the Fund's assets, which do not vary by class. For the portion of the reporting period on or after March 1, 2024, the total annualized management fee rates were as follows:
| | Total Management Fee Rate % |
| Growth and Income | .54 |
| Class K | .45 |
Prior to March 1, 2024, the management fee was the sum of an individual fund fee rate that was based on an annual rate of .20% of the Fund's average net assets and an annualized group fee rate that averaged .22 % during the period. The group fee rate was based upon the monthly average net assets of a group of registered investment companies with which the investment adviser has management contracts. The group fee rate decreased as assets under management increased and increased as assets under management decreased. For the portion of the reporting period prior to March 1, 2024, the total annualized management fee rate was .42%.
Effective March 1, 2024, the Fund's sub-advisory agreements with FMR Investment Management (UK) Limited, Fidelity Management & Research (Hong Kong) Limited, and Fidelity Management & Research (Japan) Limited were amended to provide that the investment adviser pays each sub-adviser monthly fees equal to 110% of the sub-adviser's costs for providing sub-advisory services.
Transfer Agent Fees. Fidelity Investments Institutional Operations Company LLC (FIIOC), an affiliate of the investment adviser, is the transfer, dividend disbursing and shareholder servicing agent for each class of the Fund. Effective March 1, 2024, the Fund's management contract was amended to incorporate transfer agent services and associated fees previously covered under a separate services agreement. FIIOC pays for typesetting, printing and mailing of shareholder reports, except proxy statements.
During the period December 1, 2023 through February 29, 2024, the transfer agent fees for each class were a fixed annual rate of class-level average net assets as follows:
| | | % of Class-Level Average Net Assets |
| Growth and Income | | .1316 |
| Class K | | .0420 |
Prior to December 1, 2023, FIIOC received account fees and asset-based fees that varied according to the account size and type of account of the shareholders of the respective classes of the Fund, except for Class K. FIIOC received an asset-based fee of Class K's average net assets. For the portion of the reporting period prior to March 1, 2024, the fees were equivalent to the following annualized rates:
| | Amount ($) | % of Class-Level Average Net Assets |
| Growth and Income | 6,244 | .13 |
| Class K | 296 | .04 |
| 6,540 | |
Accounting Fees. Fidelity Service Company, Inc. (FSC), an affiliate of the investment adviser, maintains the Fund's accounting records. Effective March 1, 2024, the Fund's management contract was amended to incorporate accounting services and associated fees previously covered under a separate services agreement.
During the period December 1, 2023 through February 29, 2024, the accounting fees were a fixed annual rate of average net assets as follows:
| | % of Average Net Assets |
| Fidelity Growth & Income Portfolio | .0125 |
| | |
Prior to December 1, 2023, the accounting fee was based on the level of average net assets for each month. For the portion of the reporting period prior to March 1, 2024, the fees were equivalent to the following annualized rates:
| | % of Average Net Assets |
| Fidelity Growth & Income Portfolio | .01 |
Brokerage Commissions. A portion of portfolio transactions were placed with brokerage firms which are affiliates of the investment adviser. Brokerage commissions are included in net realized gain (loss) and change in net unrealized appreciation (depreciation) in the Statement of Operations. The commissions paid to these affiliated firms were as follows:
| | Amount ($) |
| Fidelity Growth & Income Portfolio | 24 |
Interfund Trades. Funds may purchase from or sell securities to other Fidelity Funds under procedures adopted by the Board. The procedures have been designed to ensure these interfund trades are executed in accordance with Rule 17a-7 of the 1940 Act. Any interfund trades are included within the respective purchases and sales amounts shown in the Purchases and Sales of Investments note. Interfund trades during the period are noted in the table below.
| | Purchases ($) | Sales ($) | Realized Gain (Loss)($) |
| Fidelity Growth & Income Portfolio | 114,833 | 72,818 | 16,644 |
7. Committed Line of Credit.
Certain Funds participate with other funds managed by the investment adviser or an affiliate in a $4.25 billion credit facility (the "line of credit") to be utilized for temporary or emergency purposes to fund shareholder redemptions or for other short-term liquidity purposes. The participating funds have agreed to pay commitment fees on their pro-rata portion of the line of credit, which are reflected in Miscellaneous expenses on the Statement of Operations, and are listed below. During the period, there were no borrowings on this line of credit.
| | Amount ($) |
| Fidelity Growth & Income Portfolio | 16 |
8. Security Lending.
Funds lend portfolio securities from time to time in order to earn additional income. Lending agents are used, including National Financial Services (NFS), an affiliate of the investment adviser. Pursuant to a securities lending agreement, NFS will receive a fee, which is capped at 9.9% of a fund's daily lending revenue, for its services as lending agent. A fund may lend securities to certain qualified borrowers, including NFS. On the settlement date of the loan, a fund receives collateral (in the form of U.S. Treasury obligations, letters of credit and/or cash) against the loaned securities and maintains collateral in an amount not less than 100% of the market value of the loaned securities during the period of the loan. The market value of the loaned securities is determined at the close of business of a fund and any additional required collateral is delivered to a fund on the next business day. A fund or borrower may terminate the loan at any time, and if the borrower defaults on its obligation to return the securities loaned because of insolvency or other reasons, a fund may apply collateral received from the borrower against the obligation. A fund may experience delays and costs in recovering the securities loaned. Any cash collateral received is invested in the Fidelity Securities Lending Cash Central Fund. Any loaned securities are identified as such in the Schedule of Investments, and the value of loaned securities and cash collateral at period end, as applicable, are presented in the Statement of Assets and Liabilities. Security lending income represents the income earned on investing cash collateral, less rebates paid to borrowers and any lending agent fees associated with the loan, plus any premium payments received for lending certain types of securities. Security lending income is presented in the Statement of Operations as a component of income from Fidelity Central Funds. Affiliated security lending activity, if any, was as follows:
| | Total Security Lending Fees Paid to NFS ($) | Security Lending Income From Securities Loaned to NFS ($) | Value of Securities Loaned to NFS at Period End ($) |
| Fidelity Growth & Income Portfolio | 68 | - A | - |
A Amount represents less than five hundred dollars.
9. Expense Reductions.
Through arrangements with the Fund's custodian, credits realized as a result of certain uninvested cash balances were used to reduce the Fund's expenses. During the period, custodian credits reduced the Fund's expenses by $29.
In addition, during the period the investment adviser or an affiliate reimbursed and/or waived a portion of fund-level operating expenses in the amount of $600.
10. Distributions to Shareholders.
Distributions to shareholders of each class were as follows:
| | Year ended July 31, 2024 | Year ended July 31, 2023 |
| Fidelity Growth & Income Portfolio | | |
| Distributions to shareholders | | |
| Growth and Income | $319,194 | $256,486 |
| Class K | 47,936 | 14,048 |
Total | $367,130 | $270,534 |
11. Share Transactions.
Share transactions for each class were as follows and may contain in-kind transactions, automatic conversions between classes or exchanges between affiliated funds:
| | Shares | Shares | Dollars | Dollars |
| | Year ended July 31, 2024 | Year ended July 31, 2023 | Year ended July 31, 2024 | Year ended July 31, 2023 |
| Fidelity Growth & Income Portfolio | | | | |
| Growth and Income | | | | |
| Shares sold | 8,419 | 13,611 | $472,938 | $672,097 |
| Reinvestment of distributions | 5,440 | 4,987 | 293,667 | 238,237 |
| Shares redeemed | (17,003) | (16,347) | (945,060) | (803,035) |
| Net increase (decrease) | (3,144) | 2,251 | $(178,455) | $107,299 |
| Class K | | | | |
| Shares sold | 7,674 | 14,938 | $401,665 | $758,212 |
| Reinvestment of distributions | 886 | 291 | 47,936 | 14,048 |
| Shares redeemed | (6,715) | (1,898) | (386,894) | (93,450) |
| Net increase (decrease) | 1,845 | 13,331 | $62,707 | $678,810 |
12. Other.
A fund's organizational documents provide former and current trustees and officers with a limited indemnification against liabilities arising in connection with the performance of their duties to the fund. In the normal course of business, a fund may also enter into contracts that provide general indemnifications. A fund's maximum exposure under these arrangements is unknown as this would be dependent on future claims that may be made against a fund. The risk of material loss from such claims is considered remote.
13. Risk and Uncertainties.
Many factors affect a fund's performance. Developments that disrupt global economies and financial markets, such as pandemics, epidemics, outbreaks of infectious diseases, war, terrorism, and environmental disasters, may significantly affect a fund's investment performance. The effects of these developments to a fund will be impacted by the types of securities in which a fund invests, the financial condition, industry, economic sector, and geographic location of an issuer, and a fund's level of investment in the securities of that issuer. Significant concentrations in security types, issuers, industries, sectors, and geographic locations may magnify the factors that affect a fund's performance.
Report of Independent Registered Public Accounting Firm
To the Board of Trustees of Fidelity Securities Fund and Shareholders of Fidelity Growth & Income Portfolio
Opinion on the Financial Statements
We have audited the accompanying statement of assets and liabilities, including the schedule of investments, of Fidelity Growth & Income Portfolio (one of the funds constituting Fidelity Securities Fund, referred to hereafter as the "Fund") as of July 31, 2024, the related statement of operations for the year ended July 31, 2024, the statement of changes in net assets for each of the two years in the period ended July 31, 2024, including the related notes, and the financial highlights for each of the five years in the period ended July 31, 2024 (collectively referred to as the "financial statements"). In our opinion, the financial statements present fairly, in all material respects, the financial position of the Fund as of July 31, 2024, the results of its operations for the year then ended, the changes in its net assets for each of the two years in the period ended July 31, 2024 and the financial highlights for each of the five years in the period ended July 31, 2024 in conformity with accounting principles generally accepted in the United States of America.
Basis for Opinion
These financial statements are the responsibility of the Fund's management. Our responsibility is to express an opinion on the Fund's financial statements based on our audits. We are a public accounting firm registered with the Public Company Accounting Oversight Board (United States) (PCAOB) and are required to be independent with respect to the Fund in accordance with the U.S. federal securities laws and the applicable rules and regulations of the Securities and Exchange Commission and the PCAOB.
We conducted our audits of these financial statements in accordance with the standards of the PCAOB. Those standards require that we plan and perform the audit to obtain reasonable assurance about whether the financial statements are free of material misstatement, whether due to error or fraud.
Our audits included performing procedures to assess the risks of material misstatement of the financial statements, whether due to error or fraud, and performing procedures that respond to those risks. Such procedures included examining, on a test basis, evidence regarding the amounts and disclosures in the financial statements. Our audits also included evaluating the accounting principles used and significant estimates made by management, as well as evaluating the overall presentation of the financial statements. Our procedures included confirmation of securities owned as of July 31, 2024 by correspondence with the custodian and brokers; when replies were not received from brokers, we performed other auditing procedures. We believe that our audits provide a reasonable basis for our opinion.
/s/ PricewaterhouseCoopers LLP
Boston, Massachusetts
September 17, 2024
We have served as the auditor of one or more investment companies in the Fidelity group of funds since 1932.
Distributions
(Unaudited)The dividend and capital gains distributions for the fund(s) are available on Fidelity.com or Institutional.Fidelity.com.
The fund hereby designates as a capital gain dividend with respect to the taxable year ended July 31, 2024, $493,342,729, or, if subsequently determined to be different, the net capital gain of such year.
A total of 1.59% of the dividends distributed during the fiscal year was derived from interest on U.S. Government securities which is generally exempt from state income tax.
The fund designates 100% of the short-term capital gain dividends distributed during the fiscal year as qualifying to be taxed as short-term capital gain dividends for nonresident alien shareholders.
The fund designates $5,924,638 of distributions paid during the fiscal year ended 2024 as qualifying to be taxed as section 163(j) interest dividends.
Growth & Income Portfolio designates 22%, 87%, 100%, 100% and 100% and Class K designates 22%, 82%, 96%, 100% and 100%; distributed in September, October, December, April, and July during the fiscal year as qualifying for the dividends-received deduction for corporate shareholders.
Growth & Income Portfolio and Class K designate 100% of dividends distributed during the fiscal year as amounts which may be taken into account as a dividend for purposes of the maximum rate under section 1(h)(11) of the Internal Revenue Code.
The fund will notify shareholders in January 2025 of amounts for use in preparing 2024 income tax returns.
Item 8: Changes in and Disagreements with Accountants for Open-End Management Investment Companies
Note: This is not applicable for any fund included in this document.
Item 9: Proxy Disclosures for Open-End Management Investment Companies
| A special meeting of shareholders was held on July 16, 2024. The results of votes taken among shareholders on the proposal before them are reported below. Each vote reported represents one dollar of net asset value held on the record date for the meeting. |
| Proposal 1 |
| To elect a Board of Trustees. |
| | # of Votes | % of Votes |
| Bettina Doulton |
| Affirmative | 88,756,759,992.17 | 95.11 |
| Withheld | 4,564,750,651.52 | 4.89 |
| TOTAL | 93,321,510,643.68 | 100.00 |
| Robert A. Lawrence |
| Affirmative | 88,523,438,331.98 | 94.86 |
| Withheld | 4,798,072,311.70 | 5.14 |
| TOTAL | 93,321,510,643.68 | 100.00 |
| Vijay C. Advani |
| Affirmative | 88,484,371,668.51 | 94.82 |
| Withheld | 4,837,138,975.17 | 5.18 |
| TOTAL | 93,321,510,643.68 | 100.00 |
| Thomas P. Bostick |
| Affirmative | 88,618,596,648.21 | 94.96 |
| Withheld | 4,702,913,995.47 | 5.04 |
| TOTAL | 93,321,510,643.68 | 100.00 |
| Donald F. Donahue |
| Affirmative | 88,542,403,002.79 | 94.88 |
| Withheld | 4,779,107,640.89 | 5.12 |
| TOTAL | 93,321,510,643.68 | 100.00 |
| Vicki L. Fuller |
| Affirmative | 88,788,711,037.44 | 95.14 |
| Withheld | 4,532,799,606.24 | 4.86 |
| TOTAL | 93,321,510,643.68 | 100.00 |
| Patricia L. Kampling |
| Affirmative | 88,819,315,996.59 | 95.18 |
| Withheld | 4,502,194,647.10 | 4.82 |
| TOTAL | 93,321,510,643.68 | 100.00 |
| Thomas A. Kennedy |
| Affirmative | 88,667,457,817.34 | 95.01 |
| Withheld | 4,654,052,826.34 | 4.99 |
| TOTAL | 93,321,510,643.68 | 100.00 |
| Oscar Munoz |
| Affirmative | 88,183,976,568.30 | 94.49 |
| Withheld | 5,137,534,075.39 | 5.51 |
| TOTAL | 93,321,510,643.68 | 100.00 |
| Karen B. Peetz |
| Affirmative | 88,720,160,318.58 | 95.07 |
| Withheld | 4,601,350,325.11 | 4.93 |
| TOTAL | 93,321,510,643.68 | 100.00 |
| David M. Thomas |
| Affirmative | 88,471,490,747.86 | 94.80 |
| Withheld | 4,850,019,895.82 | 5.20 |
| TOTAL | 93,321,510,643.68 | 100.00 |
| Susan Tomasky |
| Affirmative | 88,536,869,646.78 | 94.87 |
| Withheld | 4,784,640,996.90 | 5.13 |
| TOTAL | 93,321,510,643.68 | 100.00 |
| Michael E. Wiley |
| Affirmative | 88,526,906,267.86 | 94.86 |
| Withheld | 4,794,604,375.83 | 5.14 |
| TOTAL | 93,321,510,643.68 | 100.00 |
| | | |
| Proposal 1 reflects trust-wide proposal and voting results. |
Item 10: Remuneration Paid to Directors, Officers, and others of Open-End Management Investment Companies
Note: This information is disclosed as part of the financial statements for each Fund as part of Item 7: Financial Statements and Financial Highlights for Open-End Management Investment companies.
Item 11: Statement Regarding Basis for Approval of Investment Advisory Contract
Board Approval of Investment Advisory Contracts and Management Fees
Fidelity Growth & Income Portfolio
Each year, the Board of Trustees, including the Independent Trustees (together, the Board), considers the renewal of the fund's management contract with Fidelity Management & Research Company LLC (FMR) and the sub-advisory agreements (together, the Advisory Contracts) for the fund. FMR and the sub-advisers are referred to herein as the Investment Advisers. The Board, assisted by the advice of fund counsel and Independent Trustees' counsel, requests and considers a broad range of information relevant to the renewal of the Advisory Contracts throughout the year.
The Board meets regularly and, at each of its meetings, covers an extensive agenda of topics and materials and considers factors that are relevant to its annual consideration of the renewal of the fund's Advisory Contracts, including the services and support provided to the fund and its shareholders. The Board, acting directly and through its Committees (each of which is composed of and chaired by Independent Trustees), requests and receives information concerning the annual consideration of the renewal of the fund's Advisory Contracts. The Board also meets as needed to review matters specifically related to the Board's annual consideration of the renewal of the Advisory Contracts. Members of the Board may also meet with trustees of other Fidelity funds through joint ad hoc committees to discuss certain matters relevant to all of the Fidelity funds.
At its May 2024 meeting, the Board unanimously determined to renew the fund's Advisory Contracts. In reaching its determination, the Board considered all factors it believed relevant, including (i) the nature, extent, and quality of the services provided to the fund and its shareholders (including the investment performance of the fund); (ii) the competitiveness relative to peer funds of the fund's management fee and the total expense ratio of a representative class (the retail class, which was selected because it was the largest class); (iii) the total costs of the services provided by and the profits realized by FMR and its affiliates (Fidelity) from its relationships with the fund; and (iv) the extent to which, if any, economies of scale exist and are realized as the fund grows, and whether any economies of scale are appropriately shared with fund shareholders. The Board also considered the broad range of investment choices available to shareholders from FMR's competitors and that the fund's shareholders have chosen to invest in the fund, which is part of the Fidelity family of funds. The Board's decision to renew the Advisory Contracts was not based on any single factor.
The Board reached a determination, with the assistance of fund counsel and Independent Trustees' counsel and through the exercise of its business judgment, that the renewal of the Advisory Contracts was in the best interests of the fund and its shareholders and that the compensation payable under the Advisory Contracts was fair and reasonable in light of all of the surrounding circumstances.
Nature, Extent, and Quality of Services Provided. The Board considered staffing as it relates to the fund, including the backgrounds and experience of investment personnel of the Investment Advisers, and also considered the Investment Advisers' implementation of the fund's investment program. The Independent Trustees also had discussions with senior management of Fidelity's investment operations and investment groups. The Board considered the structure of the investment personnel compensation program and whether this structure provides appropriate incentives to act in the best interests of the fund. Additionally, the Board considered the portfolio managers' investments, if any, in the funds that they manage.
Resources Dedicated to Investment Management and Support Services. The Board and the Fund Oversight and Research Committees reviewed the general qualifications and capabilities of Fidelity's investment staff, including its size, education, experience, and resources, as well as Fidelity's approach to recruiting, training, managing, and compensating investment personnel. The Board noted the resources devoted to expansion of Fidelity's global investment organization, and that Fidelity's analysts have extensive resources, tools, and capabilities that allow them to conduct sophisticated quantitative and fundamental analysis, as well as credit analysis of issuers, counterparties, and guarantors. Further, the Board considered that Fidelity's investment professionals have sufficient access to global information and data so as to provide competitive investment results over time, and that those professionals also have access to sophisticated tools that permit them to assess portfolio construction and risk and performance attribution characteristics continuously, as well as to transmit new information and research conclusions rapidly around the world. Additionally, in its deliberations, the Board considered Fidelity's trading, risk management, compliance, and technology and operations capabilities and resources, which are integral parts of the investment management process.
Shareholder and Administrative Services. The Board considered (i) the nature, extent, quality, and cost of advisory, administrative, shareholder, transfer agency, and pricing and bookkeeping services performed by the Investment Advisers and their affiliates under the Advisory Contracts; (ii) the nature and extent of Fidelity's supervision of third party service providers, principally custodians, subcustodians, and pricing vendors; and (iii) the resources devoted by Fidelity to, and the record of compliance with, the fund's compliance policies and procedures. The Board also reviewed the allocation of fund brokerage, including allocations to brokers affiliated with the Investment Advisers, the use of brokerage commissions to pay fund expenses, and the use of "soft" commission dollars to pay for research services. The Board also considered the fund's securities lending activities and any payments made to Fidelity relating to securities lending under a separate agreement.
The Board noted that the growth of fund assets over time across the complex allows Fidelity to reinvest in the development of services designed to enhance the value and convenience of the Fidelity funds as investment vehicles. These services include 24-hour access to account information and market information over the Internet and through telephone representatives, investor education materials, and asset allocation tools. The Board also considered that it reviews customer service metrics such as telephone response times, continuity of services on the website and metrics addressing services at Fidelity Investor Centers.
Investment in a Large Fund Family. The Board considered the benefits to shareholders of investing in a fund that is part of a large family of funds offering a variety of investment disciplines and providing a large variety of fund investor services. The Board noted that Fidelity had taken, or had made recommendations that resulted in the Fidelity funds taking, a number of actions over the previous year that benefited particular funds and/or the Fidelity funds in general.
Investment Performance. The Board took into account discussions that occur with representatives of the Investment Advisers, and reports that it receives, at Board meetings throughout the year, relating to fund investment performance. In this regard the Board noted that as part of regularly scheduled fund reviews and other reports to the Board on fund performance, the Board considered annualized return information for the fund for different time periods, measured against an appropriate securities market index (benchmark index) and an appropriate peer group of funds with similar objectives (peer group). The Board also considered information about performance attribution. In its ongoing evaluation of fund investment performance, the Board gives particular attention to information indicating changes in performance of the funds over different time periods and discussed with the Investment Advisers the reasons for any overperformance or underperformance.
In addition to reviewing absolute and relative fund performance, the Independent Trustees periodically consider the appropriateness of fund performance metrics in evaluating the results achieved. The Independent Trustees generally give greater weight to fund performance over longer time periods than over shorter time periods. Depending on the circumstances, the Independent Trustees may be satisfied with a fund's performance notwithstanding that it lags its benchmark index or peer group for certain periods.
Based on its review, the Board concluded that the nature, extent, and quality of services provided to the fund under the Advisory Contracts should continue to benefit the shareholders of the fund.
Competitiveness of Management Fee and Total Expense Ratio. The Board was provided with information regarding industry trends in management fees and expenses. The Board considered that, effective March 1, 2024, an amended Advisory Contract with FMR went into effect with class-level management fees based on tiered schedules and subject to a maximum class-level rate (the management fee). The Board also considered that in exchange for the variable management fee, each class of the fund receives investment advisory, management, administrative, transfer agent, and pricing and bookkeeping services. In its review of the management fee and total expense ratio of the retail class, the Board considered a pro forma management fee rate for the retail class as if it had been in effect for the 12-month period ended September 30, 2023, as well as other third-party fund expenses, as applicable, such as custodial, legal, and audit fees. The Board noted that Fidelity may agree to waive fees or reimburse expenses from time to time, and the extent to which, if any, it has done so for the fund.
Comparisons of Management Fees and Total Expense Ratios. Among other things, the Board reviewed data for selected groups of competitive funds and classes (referred to as "mapped groups") that were compiled by Fidelity based on combining similar investment objective categories (as classified by Morningstar) that have comparable investment mandates. The data reviewed by the Board included (i) gross management fee comparisons (before taking into account expense reimbursements or caps) relative to the total universe of funds within the mapped group; (ii) gross management fee comparisons relative to a subset of non-Fidelity funds in the mapped group that are similar in size and management fee structure to the fund (referred to as the "asset size peer group"); (iii) total expense comparisons of the retail class of the fund relative to funds and classes in the mapped group that have a similar sales load structure to the retail class of the fund (referred to as the "similar sales load structure group"); and (iv) total expense comparisons of the retail class of the fund relative to funds and classes in the similar sales load structure group that are similar in size and management fee structure to the fund (referred to as the "total expense asset size peer group"). The total expense asset size peer group comparison excludes performance adjustments and fund-paid 12b-1 fees to eliminate variability in fee structures.
The information provided to the Board indicated that the fund's management fee rate ranked below the competitive median of the mapped group for the 12-month period ended September 30, 2023 and below the competitive median of the asset size peer group for the 12-month period ended September 30, 2023. Further, the information provided to the Board indicated that the total expense ratio of the retail class of the fund ranked below the competitive median of the similar sales load structure group for the 12-month period ended September 30, 2023 and below the competitive median of the total expense asset size peer group for the 12-month period ended September 30, 2023.
The Board noted that a different variable management fee rate is applicable to each class of the fund. The Board considered that the difference in management fee rates between classes is the result of separate arrangements for class-level services and/or waivers of certain expenses and not the result of any difference in advisory or custodial fees or other expenses related to the management of the fund's assets, which do not vary by class.
Fees Charged to Other Fidelity Clients. The Board also considered Fidelity fee structures and other information with respect to clients of Fidelity, such as other funds advised or subadvised by Fidelity, pension plan clients, and other institutional clients with similar mandates. The Board noted that a joint ad hoc committee created by it and the boards of other Fidelity funds periodically reviews and compares Fidelity's institutional investment advisory business with its business of providing services to the Fidelity funds and also noted the most recent findings of the committee. The Board noted that the committee's review included a consideration of the differences in services provided, fees charged, and costs incurred, as well as competition in the markets serving the different categories of clients.
Based on its review, the Board concluded that the fund's management fee is fair and reasonable in light of the services that the fund receives and the other factors considered. Further, based on its review of total expense ratios and fees charged to other Fidelity clients, the Board concluded that the total expense ratio of each class of the fund was reasonable in light of the services that the fund and its shareholders receive and the other factors considered.
Costs of the Services and Profitability. The Board considered the revenues earned and the expenses incurred by Fidelity in conducting the business of developing, marketing, distributing, managing, administering and servicing the fund and servicing the fund's shareholders. The Board also considered the level of Fidelity's profits in respect of all the Fidelity funds.
On an annual basis, Fidelity presents to the Board information about the profitability of its relationships with the fund. Fidelity calculates profitability information for each fund, as well as aggregate profitability information for groups of Fidelity funds and all Fidelity funds, using a series of detailed revenue and cost allocation methodologies which originate with the books and records of Fidelity on which Fidelity's audited financial statements are based. The Audit Committee of the Board reviews any significant changes from the prior year's methodologies and the full Board approves such changes.
A public accounting firm has been engaged annually by the Board as part of the Board's assessment of Fidelity's profitability analysis. The engagement includes the review and assessment of the methodologies used by Fidelity in determining the revenues and expenses attributable to Fidelity's fund business, and completion of agreed-upon procedures in respect of the mathematical accuracy of certain fund profitability information and its conformity to established allocation methodologies. After considering the reports issued under the engagement and information provided by Fidelity, the Board concluded that while other allocation methods may also be reasonable, Fidelity's profitability methodologies are reasonable in all material respects.
The Board also reviewed Fidelity's non-fund businesses and potential indirect benefits such businesses may have received as a result of their association with Fidelity's fund business (i.e., fall-out benefits) as well as cases where Fidelity's affiliates may benefit from the funds' business. The Board considered areas where potential indirect benefits to the Fidelity funds from their relationships with Fidelity may exist. The Board's consideration of these matters was informed by the findings of a joint ad hoc committee created by it and the boards of other Fidelity funds to evaluate potential fall-out benefits.
The Board considered the costs of the services provided by and the profits realized by Fidelity in connection with the operation of the fund and was satisfied that the profitability was not excessive.
Economies of Scale. The Board considered whether there have been economies of scale in respect of the management of the Fidelity funds, whether the Fidelity funds (including the fund) have appropriately benefited from any such economies of scale, and whether there is potential for realization of any further economies of scale. The Board considered the extent to which the fund will benefit from economies of scale as assets grow through increased services to the fund, through waivers or reimbursements, or through fee or expense ratio reductions. The Board also noted that a committee created by it and the boards of other Fidelity funds periodically analyzes whether Fidelity attains economies of scale in respect of the management and servicing of the Fidelity funds, whether the Fidelity funds have appropriately benefited from such economies of scale, and whether there is potential for realization of any further economies of scale.
The Board recognized that the fund's management contract incorporates a variable management fee structure, which provides breakpoints as a way to share, in part, any potential economies of scale that may exist at the asset class level and through a discount that considers both fund size and total assets of the four applicable asset classes. The Board considered that the variable management fee is designed to deliver the benefits of economies of scale to fund shareholders even if assets of any particular fund are unchanged or have declined, because some portion of Fidelity's costs are attributable to services provided to all funds subject to the variable management fee, and all such funds benefit if those costs can be allocated among more assets. The Board concluded that, given the variable management fee structure, fund shareholders will benefit from lower management fees due to the application of the breakpoints and discount factor, regardless of whether Fidelity achieves any such economies of scale.
The Board concluded, taking into account the analysis of the committee, that economies of scale, if any, are being appropriately shared between fund shareholders and Fidelity.
Additional Information Requested by the Board. In order to develop fully the factual basis for consideration of the Fidelity funds' advisory contracts, the Board requested and received additional information on certain topics, including but not limited to: (i) fund flow and performance trends, in particular the underperformance of certain funds and strategies, and Fidelity's long-term strategies for certain funds; (ii) the operation of performance fees and the rationale for implementing performance fees on certain categories of funds but not others; (iii) Fidelity's pricing philosophy compared to competitors; (iv) fund profitability methodology and data; (v) evaluation of competitive fund data and peer group classifications and fee and expense comparisons; (vi) the management fee and expense structures for different funds and classes and information about the differences between various fee and expense structures; (vii) the variable management fee implemented for certain funds effective March 1, 2024; and (viii) information regarding other accounts managed by Fidelity and the funds' sub-advisory arrangements.
Conclusion. Based on its evaluation of all of the conclusions noted above, and after considering all factors it believed relevant, the Board, including the Independent Trustees, concluded that the advisory and sub-advisory fee arrangements are fair and reasonable in light of all of the surrounding circumstances and that the fund's Advisory Contracts should be renewed through May 31, 2025.
1.536189.127
GAI-ANN-0924
Fidelity® Dividend Growth Fund
Annual Report
July 31, 2024
Contents
To view a fund's proxy voting guidelines and proxy voting record for the 12-month period ended June 30, visit http://www.fidelity.com/proxyvotingresults or visit the Securities and Exchange Commission's (SEC) web site at http://www.sec.gov.
You may also call 1-800-544-8544 if you're an individual investing directly with Fidelity, call 1-800-835-5092 if you're a plan sponsor or participant with Fidelity as your recordkeeper or call 1-877-208-0098 on institutional accounts or if you're an advisor or invest through one to request a free copy of the proxy voting guidelines.
Standard & Poor's, S&P and S&P 500 are registered service marks of The McGraw-Hill Companies, Inc. and have been licensed for use by Fidelity Distributors Corporation.
Other third-party marks appearing herein are the property of their respective owners.
All other marks appearing herein are registered or unregistered trademarks or service marks of FMR LLC or an affiliated company. © 2024 FMR LLC. All rights reserved.
This report and the financial statements contained herein are submitted for the general information of the shareholders of the Fund. This report is not authorized for distribution to prospective investors in the Fund unless preceded or accompanied by an effective prospectus.
A fund files its complete schedule of portfolio holdings with the SEC for the first and third quarters of each fiscal year on Form N-PORT. Forms N-PORT are available on the SEC's web site at http://www.sec.gov. A fund's Forms N-PORT may be reviewed and copied at the SEC's Public Reference Room in Washington, DC. Information regarding the operation of the SEC's Public Reference Room may be obtained by calling 1-800-SEC-0330.
For a complete list of a fund's portfolio holdings, view the most recent holdings listing, semiannual report, or annual report on Fidelity's web site at http://www.fidelity.com, http://www.institutional.fidelity.com, or http://www.401k.com, as applicable.
NOT FDIC INSURED •MAY LOSE VALUE •NO BANK GUARANTEE
Neither the Fund nor Fidelity Distributors Corporation is a bank.
Item 7: Financial Statements and Financial Highlights for Open-End Management Investment Companies (Annual Report)
Fidelity® Dividend Growth Fund
Schedule of Investments July 31, 2024
Showing Percentage of Net Assets
| Common Stocks - 99.1% |
| | | Shares | Value ($) (000s) |
| COMMUNICATION SERVICES - 8.5% | | | |
| Interactive Media & Services - 5.5% | | | |
| Alphabet, Inc. Class A | | 911,500 | 156,359 |
| Meta Platforms, Inc. Class A | | 584,900 | 277,728 |
| | | | 434,087 |
| Media - 1.9% | | | |
| Comcast Corp. Class A | | 3,697,392 | 152,591 |
| Wireless Telecommunication Services - 1.1% | | | |
| T-Mobile U.S., Inc. | | 491,100 | 89,518 |
TOTAL COMMUNICATION SERVICES | | | 676,196 |
| CONSUMER DISCRETIONARY - 1.8% | | | |
| Distributors - 0.2% | | | |
| A-Mark Precious Metals, Inc. (a) | | 373,321 | 14,350 |
| Hotels, Restaurants & Leisure - 0.2% | | | |
| Hilton Worldwide Holdings, Inc. | | 77,000 | 16,530 |
| Starbucks Corp. | | 800 | 62 |
| | | | 16,592 |
| Household Durables - 1.3% | | | |
| D.R. Horton, Inc. (a) | | 61,900 | 11,138 |
| JM AB (B Shares) (a) | | 1,195,349 | 23,239 |
| Lennar Corp. Class A | | 92,300 | 16,331 |
| Vistry Group PLC (b) | | 3,190,900 | 56,773 |
| | | | 107,481 |
| Textiles, Apparel & Luxury Goods - 0.1% | | | |
| Gildan Activewear, Inc. (a) | | 219,000 | 8,907 |
TOTAL CONSUMER DISCRETIONARY | | | 147,330 |
| CONSUMER STAPLES - 3.4% | | | |
| Consumer Staples Distribution & Retail - 0.3% | | | |
| Albertsons Companies, Inc. | | 382,300 | 7,581 |
| Alimentation Couche-Tard, Inc. (multi-vtg.) | | 202,100 | 12,458 |
| | | | 20,039 |
| Personal Care Products - 0.3% | | | |
| Kenvue, Inc. | | 1,508,200 | 27,887 |
| Tobacco - 2.8% | | | |
| Altria Group, Inc. | | 459,714 | 22,531 |
| British American Tobacco PLC (United Kingdom) | | 2,146,913 | 76,175 |
| Philip Morris International, Inc. | | 1,094,700 | 126,066 |
| | | | 224,772 |
TOTAL CONSUMER STAPLES | | | 272,698 |
| ENERGY - 11.2% | | | |
| Energy Equipment & Services - 2.3% | | | |
| Borr Drilling Ltd. (a) | | 1,111,400 | 7,558 |
| Borr Drilling Ltd. (a) | | 5,297,349 | 36,287 |
| Noble Corp. PLC (a) | | 810,026 | 38,249 |
| Seadrill Ltd. (b) | | 218,900 | 12,042 |
| Subsea 7 SA sponsored ADR | | 379,700 | 7,351 |
| Tidewater, Inc. (b) | | 771,800 | 76,377 |
| | | | 177,864 |
| Oil, Gas & Consumable Fuels - 8.9% | | | |
| Cool Co. Ltd. (a) | | 1,415,939 | 17,260 |
| DHT Holdings, Inc. | | 2,381,900 | 27,987 |
| Energy Transfer LP | | 7,160,600 | 116,503 |
| Enterprise Products Partners LP | | 2,770,600 | 79,960 |
| Exxon Mobil Corp. | | 2,083,097 | 247,034 |
| Marathon Petroleum Corp. | | 129,900 | 22,995 |
| Parkland Corp. | | 1,567,277 | 43,965 |
| Reliance Industries Ltd. GDR (c) | | 527,500 | 38,033 |
| Sitio Royalties Corp. | | 1,879,400 | 45,763 |
| Teekay Tankers Ltd. | | 1,109,623 | 72,614 |
| | | | 712,114 |
TOTAL ENERGY | | | 889,978 |
| FINANCIALS - 13.1% | | | |
| Banks - 1.2% | | | |
| HDFC Bank Ltd. | | 1,153,000 | 22,281 |
| Wells Fargo & Co. | | 1,178,493 | 69,932 |
| | | | 92,213 |
| Capital Markets - 3.8% | | | |
| Ares Capital Corp. (a) | | 3,672,112 | 76,894 |
| Blue Owl Capital, Inc. Class A (a) | | 2,573,700 | 49,080 |
| Brookfield Corp. Class A (a) | | 2,546,100 | 124,122 |
| BSE Ltd. | | 651,600 | 19,895 |
| KKR & Co., Inc. | | 294,300 | 36,331 |
| | | | 306,322 |
| Financial Services - 5.7% | | | |
| Apollo Global Management, Inc. | | 1,241,800 | 155,610 |
| Fidelity National Information Services, Inc. | | 93,000 | 7,145 |
| Global Payments, Inc. | | 670,100 | 68,109 |
| MasterCard, Inc. Class A | | 189,200 | 87,734 |
| Visa, Inc. Class A | | 522,193 | 138,731 |
| | | | 457,329 |
| Insurance - 2.4% | | | |
| Arthur J. Gallagher & Co. | | 169,900 | 48,165 |
| Chubb Ltd. | | 222,400 | 61,307 |
| Fidelity National Financial, Inc. | | 313,700 | 17,382 |
| Marsh & McLennan Companies, Inc. | | 118,100 | 26,286 |
| The Travelers Companies, Inc. | | 161,600 | 34,977 |
| | | | 188,117 |
TOTAL FINANCIALS | | | 1,043,981 |
| HEALTH CARE - 8.0% | | | |
| Biotechnology - 0.4% | | | |
| Gilead Sciences, Inc. | | 466,000 | 35,444 |
| Health Care Providers & Services - 4.0% | | | |
| Cardinal Health, Inc. | | 116,400 | 11,737 |
| Cigna Group | | 360,700 | 125,765 |
| Elevance Health, Inc. | | 118,400 | 62,992 |
| UnitedHealth Group, Inc. | | 205,006 | 118,116 |
| | | | 318,610 |
| Life Sciences Tools & Services - 0.2% | | | |
| Bruker Corp. | | 190,900 | 13,079 |
| Pharmaceuticals - 3.4% | | | |
| Bristol-Myers Squibb Co. | | 341,200 | 16,227 |
| Eli Lilly & Co. | | 142,800 | 114,850 |
| Merck & Co., Inc. | | 522,900 | 59,156 |
| Royalty Pharma PLC | | 2,940,300 | 82,828 |
| | | | 273,061 |
TOTAL HEALTH CARE | | | 640,194 |
| INDUSTRIALS - 16.2% | | | |
| Aerospace & Defense - 5.4% | | | |
| BAE Systems PLC | | 1,474,600 | 24,594 |
| General Dynamics Corp. | | 177,000 | 52,872 |
| General Electric Co. | | 360,350 | 61,332 |
| Howmet Aerospace, Inc. | | 272,900 | 26,117 |
| Huntington Ingalls Industries, Inc. | | 149,300 | 41,801 |
| Spirit AeroSystems Holdings, Inc. Class A (a)(b) | | 969,000 | 35,126 |
| Textron, Inc. | | 213,100 | 19,797 |
| Thales SA | | 186,100 | 29,597 |
| The Boeing Co. (b) | | 740,700 | 141,177 |
| | | | 432,413 |
| Commercial Services & Supplies - 0.6% | | | |
| GFL Environmental, Inc. | | 174,400 | 6,767 |
| The Brink's Co. | | 349,700 | 38,464 |
| | | | 45,231 |
| Construction & Engineering - 2.3% | | | |
| Comfort Systems U.S.A., Inc. | | 85,600 | 28,455 |
| EMCOR Group, Inc. | | 333,100 | 125,059 |
| Quanta Services, Inc. | | 113,100 | 30,014 |
| | | | 183,528 |
| Electrical Equipment - 2.5% | | | |
| GE Vernova LLC | | 610,787 | 108,867 |
| nVent Electric PLC | | 146,400 | 10,633 |
| Prysmian SpA | | 209,300 | 14,393 |
| Vertiv Holdings Co. | | 874,300 | 68,807 |
| | | | 202,700 |
| Machinery - 2.4% | | | |
| Allison Transmission Holdings, Inc. | | 2,147,602 | 190,256 |
| Marine Transportation - 0.8% | | | |
| 2020 Bulkers Ltd. (d) | | 1,271,181 | 17,371 |
| Himalaya Shipping Ltd. | | 411,353 | 3,299 |
| Himalaya Shipping Ltd. (a) | | 1,333,100 | 10,825 |
| Stolt-Nielsen SA | | 881,700 | 34,587 |
| | | | 66,082 |
| Professional Services - 1.6% | | | |
| Genpact Ltd. | | 609,300 | 21,124 |
| Paycom Software, Inc. | | 280,400 | 46,768 |
| SS&C Technologies Holdings, Inc. | | 811,100 | 59,170 |
| | | | 127,062 |
| Trading Companies & Distributors - 0.6% | | | |
| Applied Industrial Technologies, Inc. | | 93,700 | 20,444 |
| Watsco, Inc. (a) | | 55,700 | 27,265 |
| | | | 47,709 |
TOTAL INDUSTRIALS | | | 1,294,981 |
| INFORMATION TECHNOLOGY - 26.9% | | | |
| Electronic Equipment, Instruments & Components - 0.0% | | | |
| Vontier Corp. | | 6,702 | 263 |
| IT Services - 0.1% | | | |
| Amdocs Ltd. | | 124,700 | 10,908 |
| Semiconductors & Semiconductor Equipment - 17.9% | | | |
| Amkor Technology, Inc. | | 1,180,000 | 38,539 |
| ASML Holding NV: | | | |
| (depository receipt) | | 8,700 | 8,149 |
| (Netherlands) | | 22,600 | 20,802 |
| BE Semiconductor Industries NV | | 232,900 | 30,032 |
| Broadcom, Inc. | | 1,398,500 | 224,711 |
| Marvell Technology, Inc. | | 1,579,105 | 105,768 |
| Micron Technology, Inc. | | 1,078,800 | 118,474 |
| NVIDIA Corp. | | 4,318,300 | 505,327 |
| NXP Semiconductors NV | | 127,800 | 33,632 |
| Qualcomm, Inc. | | 983,900 | 178,037 |
| Taiwan Semiconductor Manufacturing Co. Ltd. sponsored ADR | | 470,400 | 77,992 |
| Teradyne, Inc. | | 451,700 | 59,245 |
| Universal Display Corp. | | 109,550 | 24,388 |
| | | | 1,425,096 |
| Software - 7.0% | | | |
| Intuit, Inc. | | 65,500 | 42,401 |
| Microsoft Corp. | | 1,110,400 | 464,536 |
| Oracle Corp. | | 279,200 | 38,934 |
| Salesforce, Inc. | | 37,500 | 9,705 |
| | | | 555,576 |
| Technology Hardware, Storage & Peripherals - 1.9% | | | |
| Apple, Inc. | | 103,672 | 23,023 |
| Dell Technologies, Inc. | | 209,700 | 23,839 |
| Samsung Electronics Co. Ltd. | | 1,753,570 | 107,407 |
| | | | 154,269 |
TOTAL INFORMATION TECHNOLOGY | | | 2,146,112 |
| MATERIALS - 2.5% | | | |
| Metals & Mining - 2.5% | | | |
| Arch Resources, Inc. Class A, | | 149,409 | 21,896 |
| First Quantum Minerals Ltd. | | 2,150,300 | 26,321 |
| Franco-Nevada Corp. | | 465,500 | 60,031 |
| Freeport-McMoRan, Inc. | | 320,200 | 14,540 |
| Glencore PLC | | 718,200 | 3,985 |
| Newmont Corp. | | 447,300 | 21,949 |
| Royal Gold, Inc. | | 100,600 | 13,895 |
| Wheaton Precious Metals Corp. | | 673,200 | 40,251 |
| | | | 202,868 |
| REAL ESTATE - 1.2% | | | |
| Equity Real Estate Investment Trusts (REITs) - 0.4% | | | |
| Crown Castle, Inc. | | 295,900 | 32,573 |
| Real Estate Management & Development - 0.8% | | | |
| The St. Joe Co. (a) | | 1,000,000 | 61,680 |
TOTAL REAL ESTATE | | | 94,253 |
| UTILITIES - 6.3% | | | |
| Electric Utilities - 4.8% | | | |
| Constellation Energy Corp. | | 143,076 | 27,156 |
| Edison International | | 1,047,500 | 83,810 |
| Exelon Corp. | | 1,963,930 | 73,058 |
| FirstEnergy Corp. | | 1,580,500 | 66,239 |
| NextEra Energy, Inc. | | 1,225,200 | 93,593 |
| Southern Co. | | 430,700 | 35,972 |
| | | | 379,828 |
| Independent Power and Renewable Electricity Producers - 1.5% | | | |
| The AES Corp. | | 1,229,800 | 21,878 |
| Vistra Corp. | | 1,249,250 | 98,966 |
| | | | 120,844 |
TOTAL UTILITIES | | | 500,672 |
| TOTAL COMMON STOCKS (Cost $5,746,119) | | | 7,909,263 |
| | | | |
| Money Market Funds - 1.8% |
| | | Shares | Value ($) (000s) |
| Fidelity Cash Central Fund 5.39% (e) | | 55,866,024 | 55,877 |
| Fidelity Securities Lending Cash Central Fund 5.39% (e)(f) | | 85,651,512 | 85,660 |
| TOTAL MONEY MARKET FUNDS (Cost $141,537) | | | 141,537 |
| | | | |
| TOTAL INVESTMENT IN SECURITIES - 100.9% (Cost $5,887,656) | 8,050,800 |
NET OTHER ASSETS (LIABILITIES) - (0.9)% | (70,909) |
| NET ASSETS - 100.0% | 7,979,891 |
| | |
Any values shown as $0 in the Schedule of Investments may reflect amounts less than $500.
Legend
| (a) | Security or a portion of the security is on loan at period end. |
| (c) | Security exempt from registration under Rule 144A of the Securities Act of 1933. These securities may be resold in transactions exempt from registration, normally to qualified institutional buyers. At the end of the period, the value of these securities amounted to $38,033,000 or 0.5% of net assets. |
| (e) | Affiliated fund that is generally available only to investment companies and other accounts managed by Fidelity Investments. The rate quoted is the annualized seven-day yield of the fund at period end. A complete unaudited listing of the fund's holdings as of its most recent quarter end is available upon request. In addition, each Fidelity Central Fund's financial statements, which are not covered by the Fund's Report of Independent Registered Public Accounting Firm, are available on the SEC's website or upon request. |
| (f) | Investment made with cash collateral received from securities on loan. |
Affiliated Central Funds
Fiscal year to date information regarding the Fund's investments in Fidelity Central Funds, including the ownership percentage, is presented below.
| Affiliate (Amounts in thousands) | Value, beginning of period ($) | Purchases ($) | Sales Proceeds ($) | Dividend Income ($) | Realized Gain (loss) ($) | Change in Unrealized appreciation (depreciation) ($) | Value, end of period ($) | % ownership, end of period |
| Fidelity Cash Central Fund 5.39% | 140,298 | 1,964,202 | 2,048,625 | 4,247 | 2 | - | 55,877 | 0.1% |
| Fidelity Securities Lending Cash Central Fund 5.39% | 153,723 | 1,407,190 | 1,475,253 | 1,074 | - | - | 85,660 | 0.4% |
| Total | 294,021 | 3,371,392 | 3,523,878 | 5,321 | 2 | - | 141,537 | |
| | | | | | | | | |
Amounts in the dividend income column in the above table include any capital gain distributions from underlying funds, which are presented in the corresponding line item in the Statement of Operations, if applicable.
Amounts in the dividend income column for Fidelity Securities Lending Cash Central Fund represents the income earned on investing cash collateral, less rebates paid to borrowers and any lending agent fees associated with the loan, plus any premium payments received for lending certain types of securities.
Amounts included in the purchases and sales proceeds columns may include in-kind transactions, if applicable.
Other Affiliated Issuers
An affiliated company is a company in which the Fund has ownership of at least 5% of the voting securities. Fiscal year to date transactions with companies which are or were affiliates are presented in the table below. Certain corporate actions, such as mergers, are excluded from the amounts in this table if applicable. A dash in the Value end of period ($) column means either the issuer is no longer held at period end, or the issuer is held at period end but is no longer an affiliate.
| Affiliate (Amounts in thousands) | Value, beginning of period ($) | Purchases ($) | Sales Proceeds ($) | Dividend Income ($) | Realized Gain (loss) ($) | Change in Unrealized appreciation (depreciation) ($) | Value, end of period ($) |
| 2020 Bulkers Ltd. | 13,037 | 875 | 781 | 3,439 | (9) | 4,249 | 17,371 |
| Total | 13,037 | 875 | 781 | 3,439 | (9) | 4,249 | 17,371 |
Amounts included in the purchases and sales proceeds columns may include in-kind transactions, if applicable.
Investment Valuation
The following is a summary of the inputs used, as of July 31, 2024, involving the Fund's assets and liabilities carried at fair value. The inputs or methodology used for valuing securities may not be an indication of the risk associated with investing in those securities. For more information on valuation inputs, and their aggregation into the levels used below, please refer to the Investment Valuation section in the accompanying Notes to Financial Statements.
| Valuation Inputs at Reporting Date: |
Description (Amounts in thousands) | Total ($) | Level 1 ($) | Level 2 ($) | Level 3 ($) |
Investments in Securities: | | | | |
|
| Equities: | | | | |
Communication Services | 676,196 | 676,196 | - | - |
Consumer Discretionary | 147,330 | 147,330 | - | - |
Consumer Staples | 272,698 | 196,523 | 76,175 | - |
Energy | 889,978 | 889,978 | - | - |
Financials | 1,043,981 | 1,021,700 | 22,281 | - |
Health Care | 640,194 | 640,194 | - | - |
Industrials | 1,294,981 | 1,270,387 | 24,594 | - |
Information Technology | 2,146,112 | 2,146,112 | - | - |
Materials | 202,868 | 198,883 | 3,985 | - |
Real Estate | 94,253 | 94,253 | - | - |
Utilities | 500,672 | 500,672 | - | - |
|
| Money Market Funds | 141,537 | 141,537 | - | - |
| Total Investments in Securities: | 8,050,800 | 7,923,765 | 127,035 | - |
Financial Statements
| Statement of Assets and Liabilities |
As of July 31, 2024 Amounts in thousands (except per-share amounts) |
| Assets | | | | |
| Investment in securities, at value (including securities loaned of $83,887) - See accompanying schedule: | | | | |
Unaffiliated issuers (cost $5,731,291) | $ | 7,891,892 | | |
Fidelity Central Funds (cost $141,537) | | 141,537 | | |
Other affiliated issuers (cost $14,828) | | 17,371 | | |
| | | | | |
| | | | | |
| Total Investment in Securities (cost $5,887,656) | | | $ | 8,050,800 |
| Cash | | | | 1,020 |
| Receivable for investments sold | | | | 38,659 |
| Receivable for fund shares sold | | | | 2,962 |
| Dividends receivable | | | | 6,209 |
| Distributions receivable from Fidelity Central Funds | | | | 344 |
| Prepaid expenses | | | | 2 |
| Other receivables | | | | 420 |
Total assets | | | | 8,100,416 |
| Liabilities | | | | |
| Payable for investments purchased | $ | 25,895 | | |
| Payable for fund shares redeemed | | 3,385 | | |
| Accrued management fee | | 4,333 | | |
| Other payables and accrued expenses | | 1,257 | | |
| Collateral on securities loaned | | 85,655 | | |
| Total liabilities | | | | 120,525 |
| Net Assets | | | $ | 7,979,891 |
| Net Assets consist of: | | | | |
| Paid in capital | | | $ | 5,328,289 |
| Total accumulated earnings (loss) | | | | 2,651,602 |
| Net Assets | | | $ | 7,979,891 |
| | | | | |
| Net Asset Value and Maximum Offering Price | | | | |
| Dividend Growth : | | | | |
Net Asset Value, offering price and redemption price per share ($6,859,493 ÷ 172,725 shares) | | | $ | 39.71 |
| Class K : | | | | |
Net Asset Value, offering price and redemption price per share ($1,120,398 ÷ 28,260 shares) | | | $ | 39.65 |
| Statement of Operations |
| Year ended July 31, 2024 Amounts in thousands |
| Investment Income | | | | |
| Dividends (including $3,439 earned from affiliated issuers) | | | $ | 113,241 |
| Income from Fidelity Central Funds (including $1,074 from security lending) | | | | 5,321 |
| Total income | | | | 118,562 |
| Expenses | | | | |
| Management fee | | | | |
| Basic fee | $ | 37,982 | | |
| Performance adjustment | | 3,381 | | |
| Transfer agent fees | | 4,574 | | |
| Accounting fees | | 586 | | |
| Custodian fees and expenses | | 93 | | |
| Independent trustees' fees and expenses | | 32 | | |
| Registration fees | | 124 | | |
| Audit fees | | 78 | | |
| Legal | | 11 | | |
| Interest | | 8 | | |
| Miscellaneous | | 107 | | |
| Total expenses before reductions | | 46,976 | | |
| Expense reductions | | (402) | | |
| Total expenses after reductions | | | | 46,574 |
| Net Investment income (loss) | | | | 71,988 |
| Realized and Unrealized Gain (Loss) | | | | |
| Net realized gain (loss) on: | | | | |
| Investment Securities: | | | | |
| Unaffiliated issuers | | 560,475 | | |
| Fidelity Central Funds | | 2 | | |
| Other affiliated issuers | | (9) | | |
| Foreign currency transactions | | (44) | | |
| Total net realized gain (loss) | | | | 560,424 |
| Change in net unrealized appreciation (depreciation) on: | | | | |
| Investment Securities: | | | | |
| Unaffiliated issuers (net of increase in deferred foreign taxes of $660) | | 1,022,360 | | |
| Affiliated issuers | | 4,249 | | |
| Total change in net unrealized appreciation (depreciation) | | | | 1,026,609 |
| Net gain (loss) | | | | 1,587,033 |
| Net increase (decrease) in net assets resulting from operations | | | $ | 1,659,021 |
| Statement of Changes in Net Assets |
| |
| Amount in thousands | | Year ended July 31, 2024 | | Year ended July 31, 2023 |
| Increase (Decrease) in Net Assets | | | | |
| Operations | | | | |
| Net investment income (loss) | $ | 71,988 | $ | 98,453 |
| Net realized gain (loss) | | 560,424 | | 197,006 |
| Change in net unrealized appreciation (depreciation) | | 1,026,609 | | 259,059 |
| Net increase (decrease) in net assets resulting from operations | | 1,659,021 | | 554,518 |
| Distributions to shareholders | | (220,829) | | (658,335) |
| | | | | |
| Share transactions - net increase (decrease) | | 321,191 | | 120,909 |
| Total increase (decrease) in net assets | | 1,759,383 | | 17,092 |
| | | | | |
| Net Assets | | | | |
| Beginning of period | | 6,220,508 | | 6,203,416 |
| End of period | $ | 7,979,891 | $ | 6,220,508 |
| | | | | |
| | | | | |
Financial Highlights
Fidelity® Dividend Growth Fund |
| |
| Years ended July 31, | | 2024 | | 2023 | | 2022 | | 2021 | | 2020 |
Selected Per-Share Data | | | | | | | | | | |
| Net asset value, beginning of period | $ | 32.22 | $ | 32.82 | $ | 36.80 | $ | 26.38 | $ | 29.59 |
| Income from Investment Operations | | | | | | | | | | |
Net investment income (loss) A,B | | .37 | | .47 | | .44 | | .42 | | .58 |
| Net realized and unrealized gain (loss) | | 8.26 | | 2.26 | | (1.37) | | 10.59 | | (2.29) |
| Total from investment operations | | 8.63 | | 2.73 | | (.93) | | 11.01 | | (1.71) |
| Distributions from net investment income | | (.47) | | (.47) | | (.55) | | (.59) | | (.49) |
| Distributions from net realized gain | | (.67) | | (2.85) | | (2.50) | | - | | (1.01) |
| Total distributions | | (1.14) | | (3.33) C | | (3.05) | | (.59) | | (1.50) |
| Net asset value, end of period | $ | 39.71 | $ | 32.22 | $ | 32.82 | $ | 36.80 | $ | 26.38 |
Total Return D | | | | 9.39% | | (2.83)% | | 42.42% | | (6.24)% |
Ratios to Average Net Assets B,E,F | | | | | | | | | | |
| Expenses before reductions | | .71% | | .58% | | .48% | | .49% | | .49% |
| Expenses net of fee waivers, if any | | | | .58% | | .47% | | .49% | | .49% |
| Expenses net of all reductions | | .70% | | .58% | | .47% | | .48% | | .48% |
| Net investment income (loss) | | 1.07% | | 1.57% | | 1.27% | | 1.31% | | 2.11% |
| Supplemental Data | | | | | | | | | | |
| Net assets, end of period (in millions) | $ | 6,859 | $ | 5,711 | $ | 5,661 | $ | 6,114 | $ | 4,685 |
Portfolio turnover rate G | | | | 66% H | | 52% | | 93% | | 69% |
ACalculated based on average shares outstanding during the period.
BNet investment income (loss) is affected by the timing of the declaration of dividends by any underlying mutual funds or exchange-traded funds (ETFs). Net investment income (loss) of any mutual funds or ETFs is not included in the Fund's net investment income (loss) ratio.
CTotal distributions per share do not sum due to rounding.
DTotal returns would have been lower if certain expenses had not been reduced during the applicable periods shown.
EFees and expenses of any underlying mutual funds or exchange-traded funds (ETFs) are not included in the Fund's expense ratio. The Fund indirectly bears its proportionate share of these expenses. For additional expense information related to investments in Fidelity Central Funds, please refer to the "Investments in Fidelity Central Funds" note found in the Notes to Financial Statements section of the most recent Annual or Semi-Annual report.
FExpense ratios reflect operating expenses of the class. Expenses before reductions do not reflect amounts reimbursed, waived, or reduced through arrangements with the investment adviser, brokerage services, or other offset arrangements, if applicable, and do not represent the amount paid by the class during periods when reimbursements, waivers or reductions occur.
GAmount does not include the portfolio activity of any underlying mutual funds or exchange-traded funds (ETFs).
HPortfolio turnover rate excludes securities received or delivered in-kind.
Fidelity® Dividend Growth Fund Class K |
| |
| Years ended July 31, | | 2024 | | 2023 | | 2022 | | 2021 | | 2020 |
Selected Per-Share Data | | | | | | | | | | |
| Net asset value, beginning of period | $ | 32.17 | $ | 32.77 | $ | 36.76 | $ | 26.36 | $ | 29.56 |
| Income from Investment Operations | | | | | | | | | | |
Net investment income (loss) A,B | | .41 | | .50 | | .47 | | .44 | | .61 |
| Net realized and unrealized gain (loss) | | 8.25 | | 2.26 | | (1.37) | | 10.57 | | (2.28) |
| Total from investment operations | | 8.66 | | 2.76 | | (.90) | | 11.01 | | (1.67) |
| Distributions from net investment income | | (.50) | | (.50) | | (.59) | | (.61) | | (.52) |
| Distributions from net realized gain | | (.67) | | (2.85) | | (2.50) | | - | | (1.01) |
| Total distributions | | (1.18) C | | (3.36) C | | (3.09) | | (.61) | | (1.53) |
| Net asset value, end of period | $ | 39.65 | $ | 32.17 | $ | 32.77 | $ | 36.76 | $ | 26.36 |
Total Return D | | | | 9.51% | | (2.75)% | | 42.53% | | (6.11)% |
Ratios to Average Net Assets B,E,F | | | | | | | | | | |
| Expenses before reductions | | .62% | | .49% | | .38% | | .39% | | .39% |
| Expenses net of fee waivers, if any | | | | .48% | | .38% | | .39% | | .39% |
| Expenses net of all reductions | | .61% | | .48% | | .38% | | .38% | | .38% |
| Net investment income (loss) | | 1.16% | | 1.67% | | 1.36% | | 1.41% | | 2.22% |
| Supplemental Data | | | | | | | | | | |
| Net assets, end of period (in millions) | $ | 1,120 | $ | 509 | $ | 542 | $ | 807 | $ | 1,228 |
Portfolio turnover rate G | | | | 66% H | | 52% | | 93% | | 69% |
ACalculated based on average shares outstanding during the period.
BNet investment income (loss) is affected by the timing of the declaration of dividends by any underlying mutual funds or exchange-traded funds (ETFs). Net investment income (loss) of any mutual funds or ETFs is not included in the Fund's net investment income (loss) ratio.
CTotal distributions per share do not sum due to rounding.
DTotal returns would have been lower if certain expenses had not been reduced during the applicable periods shown.
EFees and expenses of any underlying mutual funds or exchange-traded funds (ETFs) are not included in the Fund's expense ratio. The Fund indirectly bears its proportionate share of these expenses. For additional expense information related to investments in Fidelity Central Funds, please refer to the "Investments in Fidelity Central Funds" note found in the Notes to Financial Statements section of the most recent Annual or Semi-Annual report.
FExpense ratios reflect operating expenses of the class. Expenses before reductions do not reflect amounts reimbursed, waived, or reduced through arrangements with the investment adviser, brokerage services, or other offset arrangements, if applicable, and do not represent the amount paid by the class during periods when reimbursements, waivers or reductions occur.
GAmount does not include the portfolio activity of any underlying mutual funds or exchange-traded funds (ETFs).
HPortfolio turnover rate excludes securities received or delivered in-kind.
Notes to Financial Statements
For the period ended July 31, 2024
(Amounts in thousands except percentages)
1. Organization.
Fidelity Dividend Growth Fund (the Fund) is a fund of Fidelity Securities Fund (the Trust) and is authorized to issue an unlimited number of shares. The Trust is registered under the Investment Company Act of 1940, as amended (the 1940 Act), as an open-end management investment company organized as a Massachusetts business trust. The Fund offers Dividend Growth and Class K shares, each of which has equal rights as to assets and voting privileges. Each class has exclusive voting rights with respect to matters that affect that class.
2. Investments in Fidelity Central Funds.
Funds may invest in Fidelity Central Funds, which are open-end investment companies generally available only to other investment companies and accounts managed by the investment adviser and its affiliates. The Schedule of Investments lists any Fidelity Central Funds held as an investment as of period end, but does not include the underlying holdings of each Fidelity Central Fund. An investing fund indirectly bears its proportionate share of the expenses of the underlying Fidelity Central Funds.
Based on its investment objective, each Fidelity Central Fund may invest or participate in various investment vehicles or strategies that are similar to those of the investing fund. These strategies are consistent with the investment objectives of the investing fund and may involve certain economic risks which may cause a decline in value of each of the Fidelity Central Funds and thus a decline in the value of the investing fund.
| Fidelity Central Fund | Investment Manager | Investment Objective | Investment Practices | Expense RatioA |
| Fidelity Money Market Central Funds | Fidelity Management & Research Company LLC (FMR) | Each fund seeks to obtain a high level of current income consistent with the preservation of capital and liquidity. | Short-term Investments | Less than .005% |
A Expenses expressed as a percentage of average net assets and are as of each underlying Central Fund's most recent annual or semi-annual shareholder report.
A complete unaudited list of holdings for each Fidelity Central Fund is available upon request or at the Securities and Exchange Commission website at www.sec.gov. In addition, the financial statements of the Fidelity Central Funds which contain the significant accounting policies (including investment valuation policies) of those funds, and are not covered by the Report of Independent Registered Public Accounting Firm, are available on the Securities and Exchange Commission website or upon request.
3. Significant Accounting Policies.
The Fund is an investment company and applies the accounting and reporting guidance of the Financial Accounting Standards Board (FASB) Accounting Standards Codification Topic 946 Financial Services - Investment Companies. The financial statements have been prepared in conformity with accounting principles generally accepted in the United States of America (GAAP), which require management to make certain estimates and assumptions at the date of the financial statements. Actual results could differ from those estimates. Subsequent events, if any, through the date that the financial statements were issued have been evaluated in the preparation of the financial statements. The Fund's Schedule of Investments lists any underlying mutual funds or exchange-traded funds (ETFs) but does not include the underlying holdings of these funds. The following summarizes the significant accounting policies of the Fund:
Investment Valuation. Investments are valued as of 4:00 p.m. Eastern time on the last calendar day of the period. The Board of Trustees (the Board) has designated the Fund's investment adviser as the valuation designee responsible for the fair valuation function and performing fair value determinations as needed. The investment adviser has established a Fair Value Committee (the Committee) to carry out the day-to-day fair valuation responsibilities and has adopted policies and procedures to govern the fair valuation process and the activities of the Committee. In accordance with these fair valuation policies and procedures, which have been approved by the Board, the Fund attempts to obtain prices from one or more third party pricing services or brokers to value its investments. When current market prices, quotations or currency exchange rates are not readily available or reliable, investments will be fair valued in good faith by the Committee, in accordance with the policies and procedures. Factors used in determining fair value vary by investment type and may include market or investment specific events, transaction data, estimated cash flows, and market observations of comparable investments. The frequency that the fair valuation procedures are used cannot be predicted and they may be utilized to a significant extent. The Committee manages the Fund's fair valuation practices and maintains the fair valuation policies and procedures. The Fund's investment adviser reports to the Board information regarding the fair valuation process and related material matters.
The Fund categorizes the inputs to valuation techniques used to value its investments into a disclosure hierarchy consisting of three levels as shown below:
Level 1 - unadjusted quoted prices in active markets for identical investments
Level 2 - other significant observable inputs (including quoted prices for similar investments, interest rates, prepayment speeds, etc.)
Level 3 - unobservable inputs (including the Fund's own assumptions based on the best information available)
Valuation techniques used to value the Fund's investments by major category are as follows:
Equity securities, including restricted securities, for which market quotations are readily available, are valued at the last reported sale price or official closing price as reported by a third party pricing service on the primary market or exchange on which they are traded and are categorized as Level 1 in the hierarchy. In the event there were no sales during the day or closing prices are not available, securities are valued at the last quoted bid price or may be valued using the last available price and are generally categorized as Level 2 in the hierarchy. For foreign equity securities, when market or security specific events arise, comparisons to the valuation of American Depositary Receipts (ADRs), futures contracts, Exchange-Traded Funds (ETFs) and certain indexes as well as quoted prices for similar securities may be used and would be categorized as Level 2 in the hierarchy. For equity securities, including restricted securities, where observable inputs are limited, assumptions about market activity and risk are used and these securities may be categorized as Level 3 in the hierarchy.
Investments in open-end mutual funds, including the Fidelity Central Funds, are valued at their closing net asset value (NAV) each business day and are categorized as Level 1 in the hierarchy.
Changes in valuation techniques may result in transfers in or out of an assigned level within the disclosure hierarchy. The aggregate value of investments by input level as of July 31, 2024 is included at the end of the Fund's Schedule of Investments.
Foreign Currency. Certain Funds may use foreign currency contracts to facilitate transactions in foreign-denominated securities. Gains and losses from these transactions may arise from changes in the value of the foreign currency or if the counterparties do not perform under the contracts' terms.
Foreign-denominated assets, including investment securities, and liabilities are translated into U.S. dollars at the exchange rates at period end. Purchases and sales of investment securities, income and dividends received, and expenses denominated in foreign currencies are translated into U.S. dollars at the exchange rate in effect on the transaction date.
The effects of exchange rate fluctuations on investments are included with the net realized and unrealized gain (loss) on investment securities. Other foreign currency transactions resulting in realized and unrealized gain (loss) are disclosed separately.
Investment Transactions and Income. For financial reporting purposes, the Fund's investment holdings and NAV include trades executed through the end of the last business day of the period. The NAV per share for processing shareholder transactions is calculated as of the close of business of the New York Stock Exchange (NYSE), normally 4:00 p.m. Eastern time and includes trades executed through the end of the prior business day. Gains and losses on securities sold are determined on the basis of identified cost and include proceeds received from litigation. Commissions paid to certain brokers with whom the investment adviser, or its affiliates, places trades on behalf of a fund include an amount in addition to trade execution, which may be rebated back to a fund. Any such rebates are included in net realized gain (loss) on investments in the Statement of Operations. Dividend income is recorded on the ex-dividend date, except for certain dividends from foreign securities where the ex-dividend date may have passed, which are recorded as soon as the Fund is informed of the ex-dividend date. Non-cash dividends included in dividend income, if any, are recorded at the fair market value of the securities received. Income and capital gain distributions from Fidelity Central Funds, if any, are recorded on the ex-dividend date. Certain distributions received by the Fund represent a return of capital or capital gain. The Fund determines the components of these distributions subsequent to the ex-dividend date, based upon receipt of tax filings or other correspondence relating to the underlying investment. These distributions are recorded as a reduction of cost of investments and/or as a realized gain. Investment income is recorded net of foreign taxes withheld where recovery of such taxes is uncertain. Funds may file withholding tax reclaims in certain jurisdictions to recover a portion of amounts previously withheld. Any withholding tax reclaims income is included in the Statement of Operations in dividends. Any receivables for withholding tax reclaims are included in the Statement of Assets and Liabilities in dividends receivable.
Class Allocations and Expenses. Investment income, realized and unrealized capital gains and losses, common expenses of a fund, and certain fund-level expense reductions, if any, are allocated daily on a pro-rata basis to each class based on the relative net assets of each class to the total net assets of a fund. Each class differs with respect to transfer agent and distribution and service plan fees incurred, as applicable. Certain expense reductions may also differ by class, if applicable. For the reporting period, the allocated portion of income and expenses to each class as a percent of its average net assets may vary due to the timing of recording these transactions in relation to fluctuating net assets of the classes. Expenses directly attributable to a fund are charged to that fund. Expenses attributable to more than one fund are allocated among the respective funds on the basis of relative net assets or other appropriate methods. Expenses included in the accompanying financial statements reflect the expenses of that fund and do not include any expenses associated with any underlying mutual funds or exchange-traded funds (ETFs). Although not included in a fund's expenses, a fund indirectly bears its proportionate share of these expenses through the net asset value of each underlying mutual fund or exchange-traded fund (ETF). Expense estimates are accrued in the period to which they relate and adjustments are made when actual amounts are known.
Deferred Trustee Compensation. Under a Deferred Compensation Plan (the Plan) for certain Funds, certain independent Trustees have elected to defer receipt of a portion of their annual compensation. Deferred amounts are invested in affiliated mutual funds, are marked-to-market and remain in a fund until distributed in accordance with the Plan. The investment of deferred amounts and the offsetting payable to the Trustees presented below are included in the accompanying Statement of Assets and Liabilities in other receivables and other payables and accrued expenses, as applicable.
| Fidelity Dividend Growth Fund | $402 |
Income Tax Information and Distributions to Shareholders. Each year, the Fund intends to qualify as a regulated investment company under Subchapter M of the Internal Revenue Code, including distributing substantially all of its taxable income and realized gains. As a result, no provision for U.S. Federal income taxes is required. As of July 31, 2024, the Fund did not have any unrecognized tax benefits in the financial statements; nor is the Fund aware of any tax positions for which it is reasonably possible that the total amounts of unrecognized tax benefits will significantly change in the next twelve months. The Fund files a U.S. federal tax return, in addition to state and local tax returns as required. The Fund's federal income tax returns are subject to examination by the Internal Revenue Service (IRS) for a period of three fiscal years after they are filed. State and local tax returns may be subject to examination for an additional fiscal year depending on the jurisdiction. Foreign taxes are provided for based on the Fund's understanding of the tax rules and rates that exist in the foreign markets in which it invests. The Fund is subject to a tax imposed on capital gains by certain countries in which it invests. An estimated deferred tax liability for net unrealized appreciation on the applicable securities is included in Other payables and accrued expenses on the Statement of Assets & Liabilities.
Distributions are declared and recorded on the ex-dividend date. Income and capital gain distributions are declared separately for each class. Income and capital gain distributions are determined in accordance with income tax regulations, which may differ from GAAP. In addition, the Fund claimed a portion of the payment made to redeeming shareholders as a distribution for income tax purposes.
Capital accounts within the financial statements are adjusted for permanent book-tax differences. These adjustments have no impact on net assets or the results of operations. Capital accounts are not adjusted for temporary book-tax differences which will reverse in a subsequent period.
Book-tax differences are primarily due to foreign currency transactions, passive foreign investment companies (PFIC), partnerships and losses deferred due to wash sales.
As of period end, the cost and unrealized appreciation (depreciation) in securities, and derivatives if applicable, for federal income tax purposes were as follows:
| Gross unrealized appreciation | $2,258,521 |
| Gross unrealized depreciation | (102,910) |
| Net unrealized appreciation (depreciation) | $2,155,611 |
| Tax Cost | $5,895,189 |
The tax-based components of distributable earnings as of period end were as follows:
| Undistributed ordinary income | $127,570 |
| Undistributed long-term capital gain | $387,800 |
| Net unrealized appreciation (depreciation) on securities and other investments | $2,136,892 |
The tax character of distributions paid was as follows:
| | July 31, 2024 | July 31, 2023 |
| Ordinary Income | $91,694 | $100,435 |
| Long-term Capital Gains | 129,135 | 557,900 |
| Total | $220,829 | $658,335 |
Restricted Securities (including Private Placements). Funds may invest in securities that are subject to legal or contractual restrictions on resale. These securities generally may be resold in transactions exempt from registration or to the public if the securities are registered. Disposal of these securities may involve time-consuming negotiations and expense, and prompt sale at an acceptable price may be difficult. Information regarding restricted securities held at period end is included at the end of the Schedule of Investments, if applicable.
4. Purchases and Sales of Investments.
Purchases and sales of securities, other than short-term securities and in-kind transactions, as applicable, are noted in the table below.
| | Purchases ($) | Sales ($) |
| Fidelity Dividend Growth Fund | 4,865,046 | 4,620,232 |
Prior Fiscal Year Unaffiliated Redemptions In-Kind. Shares that were redeemed in-kind for investments, including accrued interest and cash, if any, are shown in the table below; along with realized gain or loss on investments delivered through in-kind redemptions. The amount of the in-kind redemptions is included in share transactions in the accompanying Statement of Changes in Net Assets. There was no gain or loss for federal income tax purposes.
| | Shares | Total net realized gain or loss ($) | Total Proceeds ($) |
| Fidelity Dividend Growth Fund | 5,897 | 72,578 | 188,231 |
5. Fees and Other Transactions with Affiliates.
Management Fee. Fidelity Management & Research Company LLC (the investment adviser) and its affiliates provide the Fund with investment management related services for which the Fund pays a monthly management fee.
Effective March 1, 2024, the Fund's management contract was amended to incorporate administrative services previously covered under separate services agreements (Transfer Agent and Accounting agreements). The amended contract incorporates a basic fee rate that may vary by class (subject to a performance adjustment). The investment adviser or an affiliate pays certain expenses of managing and operating the Fund out of each class's management fee. Each class of the Fund pays a management fee to the investment adviser. The management fee is calculated and paid to the investment adviser every month. The management fee is determined by calculating a basic fee and then applying a performance adjustment. When determining a class's basic fee, a mandate rate is calculated based on the monthly average net assets of a group of funds advised by FMR within a designated asset class. A discount rate is subtracted from the mandate rate once the Fund's monthly average net assets reach a certain level. The mandate rate and discount rate may vary by class. The annual basic fee rate for a class of shares of the Fund is the lesser of (1) the class's mandate rate reduced by the class's discount rate (if applicable) or (2) the amount set forth in the following table.
| | Maximum Management Fee Rate % |
| Dividend Growth | .64 |
| Class K | .55 |
One-twelfth of the basic fee rate for a class is applied to the average net assets of the class for the month, giving a dollar amount which is the basic fee for the class for that month. A different management fee rate may be applicable to each class of the Fund. The difference between classes is the result of separate arrangements for class-level services and/or waivers of certain expenses. It is not the result of any difference in advisory or custodial fees or other expenses related to the management of the Fund's assets, which do not vary by class. For the portion of the reporting period on or after March 1, 2024, the total annualized management fee rates were as follows:
| | Total Management Fee Rate % |
| Dividend Growth | .63 |
| Class K | .55 |
Prior to March 1, 2024, the management fee was the sum of an individual fund fee rate that was based on an annual rate of .30% of the Fund's average net assets and an annualized group fee rate that averaged .22% during the period. The group fee rate was based upon the monthly average net assets of a group of registered investment companies with which the investment adviser has management contracts. The group fee rate decreased as assets under management increased and increased as assets under management decreased. For the portion of the reporting period prior to March 1, 2024, the total annualized management fee rate was .52%.
The performance adjustment rate is calculated monthly by comparing over the performance period the Fund's performance to that of the performance adjustment index listed below.
| | Performance Adjustment Index |
| Fidelity Dividend Growth Fund | S&P 500 Index |
For the purposes of calculating the performance adjustment for the Fund, the Fund's investment performance is based on the performance of Dividend Growth. To the extent that other classes of the Fund have higher expenses, this could result in those classes bearing a larger positive performance adjustment and smaller negative performance adjustment than would be the case if each class's own performance were considered. The performance period is the most recent 36 month period. The maximum annualized performance adjustment rate is ±.20% of the Fund's average net assets over the performance period. The performance adjustment rate is divided by twelve and multiplied by the Fund's average net assets over the performance period, and the resulting dollar amount is proportionately added to or subtracted from a class's basic fee. For the entire reporting period, the total annual performance adjustment was .05%.
Effective March 1, 2024, the Fund's sub-advisory agreements with FMR Investment Management (UK) Limited, Fidelity Management & Research (Hong Kong) Limited, and Fidelity Management & Research (Japan) Limited were amended to provide that the investment adviser pays each sub-adviser monthly fees equal to 110% of the sub-adviser's costs for providing sub-advisory services.
Transfer Agent Fees. Fidelity Investments Institutional Operations Company LLC (FIIOC), an affiliate of the investment adviser, is the transfer, dividend disbursing and shareholder servicing agent for each class of the Fund. Effective March 1, 2024, the Fund's management contract was amended to incorporate transfer agent services and associated fees previously covered under a separate services agreement. FIIOC pays for typesetting, printing and mailing of shareholder reports, except proxy statements.
During the period December 1, 2023 through February 29, 2024, the transfer agent fees for each class were a fixed annual rate of class-level average net assets as follows:
| | | % of Class-Level Average Net Assets | |
| Dividend Growth | | .1342 | |
| Class K | | .0420 | |
| | | |
| | | | |
Prior to December 1, 2023, FIIOC received account fees and asset-based fees that varied according to the account size and type of account of the shareholders of Dividend Growth. FIIOC received an asset-based fee of Class K's average net assets. For the portion of the reporting period prior to March 1, 2024, the fees were equivalent to the following annualized rates:
| | Amount ($) | % of Class-Level Average Net Assets |
| Dividend Growth | 4,455 | .14 |
| Class K | 119 | .04 |
| 4,574 | |
Accounting Fees. Fidelity Service Company, Inc. (FSC), an affiliate of the investment adviser, maintains the Fund's accounting records. Effective March 1, 2024, the Fund's management contract was amended to incorporate accounting services and associated fees previously covered under a separate services agreement.
During the period December 1, 2023 through February 29, 2024, the accounting fees were a fixed annual rate of average net assets as follows:
| | % of Average Net Assets |
| Fidelity Dividend Growth Fund | .0159 |
Prior to December 1, 2023, the accounting fee was based on the level of average net assets for each month. For the portion of the reporting period prior to March 1, 2024, the fees were equivalent to the following annualized rates:
| | % of Average Net Assets |
| Fidelity Dividend Growth Fund | .02 |
Brokerage Commissions. A portion of portfolio transactions were placed with brokerage firms which are affiliates of the investment adviser. Brokerage commissions are included in net realized gain (loss) and change in net unrealized appreciation (depreciation) in the Statement of Operations. The commissions paid to these affiliated firms were as follows:
| | Amount ($) |
| Fidelity Dividend Growth Fund | 90 |
Interfund Lending Program. Pursuant to an Exemptive Order issued by the Securities and Exchange Commission (the SEC), the Fund, along with other registered investment companies having management contracts with Fidelity Management & Research Company LLC (FMR), or other affiliated entities of FMR, may participate in an interfund lending program. This program provides an alternative credit facility allowing the Fund to borrow from, or lend money to, other participating affiliated funds. At period end, there were no interfund loans outstanding. Activity in this program during the period for which loans were outstanding was as follows:
| | Borrower or Lender | Average Loan Balance ($) | Weighted Average Interest Rate | Interest Expense ($) |
| Fidelity Dividend Growth Fund | Borrower | 8,800 | 5.57% | 8 |
Interfund Trades. Funds may purchase from or sell securities to other Fidelity Funds under procedures adopted by the Board. The procedures have been designed to ensure these interfund trades are executed in accordance with Rule 17a-7 of the 1940 Act. Any interfund trades are included within the respective purchases and sales amounts shown in the Purchases and Sales of Investments note. Interfund trades during the period are noted in the table below.
| | Purchases ($) | Sales ($) | Realized Gain (Loss) ($) |
| Fidelity Dividend Growth Fund | 240,934 | 234,709 | 30,848 |
Other. During the period, the investment adviser reimbursed the Fund for certain losses as follows:
| | Amount ($) |
| Fidelity Dividend Growth Fund | 19 |
6. Committed Line of Credit.
Certain Funds participate with other funds managed by the investment adviser or an affiliate in a $4.25 billion credit facility (the "line of credit") to be utilized for temporary or emergency purposes to fund shareholder redemptions or for other short-term liquidity purposes. The participating funds have agreed to pay commitment fees on their pro-rata portion of the line of credit, which are reflected in Miscellaneous expenses on the Statement of Operations, and are listed below. During the period, there were no borrowings on this line of credit.
| | Amount ($) |
| Fidelity Dividend Growth Fund | 11 |
7. Security Lending.
Funds lend portfolio securities from time to time in order to earn additional income. Lending agents are used, including National Financial Services (NFS), an affiliate of the investment adviser. Pursuant to a securities lending agreement, NFS will receive a fee, which is capped at 9.9% of a fund's daily lending revenue, for its services as lending agent. A fund may lend securities to certain qualified borrowers, including NFS. On the settlement date of the loan, a fund receives collateral (in the form of U.S. Treasury obligations, letters of credit and/or cash) against the loaned securities and maintains collateral in an amount not less than 100% of the market value of the loaned securities during the period of the loan. The market value of the loaned securities is determined at the close of business of a fund and any additional required collateral is delivered to a fund on the next business day. A fund or borrower may terminate the loan at any time, and if the borrower defaults on its obligation to return the securities loaned because of insolvency or other reasons, a fund may apply collateral received from the borrower against the obligation. A fund may experience delays and costs in recovering the securities loaned. Any cash collateral received is invested in the Fidelity Securities Lending Cash Central Fund. Any loaned securities are identified as such in the Schedule of Investments, and the value of loaned securities and cash collateral at period end, as applicable, are presented in the Statement of Assets and Liabilities. Security lending income represents the income earned on investing cash collateral, less rebates paid to borrowers and any lending agent fees associated with the loan, plus any premium payments received for lending certain types of securities. Security lending income is presented in the Statement of Operations as a component of income from Fidelity Central Funds. Affiliated security lending activity, if any, was as follows:
| | Total Security Lending Fees Paid to NFS ($) | Security Lending Income From Securities Loaned to NFS ($) | Value of Securities Loaned to NFS at Period End ($) |
| Fidelity Dividend Growth Fund | 112 | 48 | - |
8. Expense Reductions.
Through arrangements with the Fund's custodian, credits realized as a result of certain uninvested cash balances were used to reduce the Fund's expenses. During the period, custodian credits reduced the Fund's expenses by $7.
In addition, during the period the investment adviser or an affiliate reimbursed and/or waived a portion of fund-level operating expenses in the amount of $395.
9. Distributions to Shareholders.
Distributions to shareholders of each class were as follows:
| | Year ended July 31, 2024 | Year ended July 31, 2023 |
| Fidelity Dividend Growth Fund | | |
| Distributions to shareholders | | |
| Dividend Growth | $201,199 | $576,918 |
| Class K | 19,630 | 81,417 |
Total | $220,829 | $658,335 |
10. Share Transactions.
Share transactions for each class were as follows and may contain in-kind transactions, automatic conversions between classes or exchanges between affiliated funds:
| | Shares | Shares | Dollars | Dollars |
| | Year ended July 31, 2024 | Year ended July 31, 2023 | Year ended July 31, 2024 | Year ended July 31, 2023 |
| Fidelity Dividend Growth Fund | | | | |
| Dividend Growth | | | | |
| Shares sold | 8,681 | 11,761 | $310,821 | $365,822 |
| Reinvestment of distributions | 5,889 | 18,481 | 190,224 | 548,214 |
| Shares redeemed | (19,111) | (25,467) | (659,172) | (772,029) |
| Net increase (decrease) | (4,541) | 4,775 | $(158,127) | $142,007 |
| Class K | | | | |
| Shares sold | 15,987 | 18,841 | $599,253 | $581,956 |
| Reinvestment of distributions | 600 | 2,752 | 19,630 | 81,417 |
| Shares redeemed | (4,160) | (22,314) | (139,565) | (684,471) |
| Net increase (decrease) | 12,427 | (721) | $479,318 | $(21,098) |
11. Other.
A fund's organizational documents provide former and current trustees and officers with a limited indemnification against liabilities arising in connection with the performance of their duties to the fund. In the normal course of business, a fund may also enter into contracts that provide general indemnifications. A fund's maximum exposure under these arrangements is unknown as this would be dependent on future claims that may be made against a fund. The risk of material loss from such claims is considered remote.
12. Risk and Uncertainties.
Many factors affect a fund's performance. Developments that disrupt global economies and financial markets, such as pandemics, epidemics, outbreaks of infectious diseases, war, terrorism, and environmental disasters, may significantly affect a fund's investment performance. The effects of these developments to a fund will be impacted by the types of securities in which a fund invests, the financial condition, industry, economic sector, and geographic location of an issuer, and a fund's level of investment in the securities of that issuer. Significant concentrations in security types, issuers, industries, sectors, and geographic locations may magnify the factors that affect a fund's performance.
Report of Independent Registered Public Accounting Firm
To the Board of Trustees of Fidelity Securities Fund and Shareholders of Fidelity Dividend Growth Fund
Opinion on the Financial Statements
We have audited the accompanying statement of assets and liabilities, including the schedule of investments, of Fidelity Dividend Growth Fund (one of the funds constituting Fidelity Securities Fund, referred to hereafter as the "Fund") as of July 31, 2024, the related statement of operations for the year ended July 31, 2024, the statement of changes in net assets for each of the two years in the period ended July 31, 2024, including the related notes, and the financial highlights for each of the five years in the period ended July 31, 2024 (collectively referred to as the "financial statements"). In our opinion, the financial statements present fairly, in all material respects, the financial position of the Fund as of July 31, 2024, the results of its operations for the year then ended, the changes in its net assets for each of the two years in the period ended July 31, 2024 and the financial highlights for each of the five years in the period ended July 31, 2024 in conformity with accounting principles generally accepted in the United States of America.
Basis for Opinion
These financial statements are the responsibility of the Fund's management. Our responsibility is to express an opinion on the Fund's financial statements based on our audits. We are a public accounting firm registered with the Public Company Accounting Oversight Board (United States) (PCAOB) and are required to be independent with respect to the Fund in accordance with the U.S. federal securities laws and the applicable rules and regulations of the Securities and Exchange Commission and the PCAOB.
We conducted our audits of these financial statements in accordance with the standards of the PCAOB. Those standards require that we plan and perform the audit to obtain reasonable assurance about whether the financial statements are free of material misstatement, whether due to error or fraud.
Our audits included performing procedures to assess the risks of material misstatement of the financial statements, whether due to error or fraud, and performing procedures that respond to those risks. Such procedures included examining, on a test basis, evidence regarding the amounts and disclosures in the financial statements. Our audits also included evaluating the accounting principles used and significant estimates made by management, as well as evaluating the overall presentation of the financial statements. Our procedures included confirmation of securities owned as of July 31, 2024 by correspondence with the custodian and brokers; when replies were not received from brokers, we performed other auditing procedures. We believe that our audits provide a reasonable basis for our opinion.
/s/ PricewaterhouseCoopers LLP
Boston, Massachusetts
September 12, 2024
We have served as the auditor of one or more investment companies in the Fidelity group of funds since 1932.
Distributions
(Unaudited)The dividend and capital gains distributions for the fund(s) are available on Fidelity.com or Institutional.Fidelity.com.
The fund hereby designates as a capital gain dividend with respect to the taxable year ended July 31, 2024, $424,885,003, or, if subsequently determined to be different, the net capital gain of such year.
A total of 0.55% of the dividends distributed during the fiscal year was derived from interest on U.S. Government securities which is generally exempt from state income tax.
The fund designates $1,329,690 of distributions paid during the fiscal year ended 2024 as qualifying to be taxed as section 163(j) interest dividends.
Dividend Growth designates 80%, 88%, 100% and 100%; Class K designates 77%, 84%, 100% and 100%; of the dividends distributed in October, December, April, and July, respectively during the fiscal year as qualifying for the dividends-received deduction for corporate shareholders.
Dividend Growth designates 100%; Class K designates 100%; of the dividends distributed during the fiscal year as amounts which may be taken into account as a dividend for purposes of the maximum rate under section 1(h)(11) of the Internal Revenue Code.
The fund will notify shareholders in January 2025 of amounts for use in preparing 2024 income tax returns.
Item 8: Changes in and Disagreements with Accountants for Open-End Management Investment Companies
Note: This is not applicable for any fund included in this document.
Item 9: Proxy Disclosures for Open-End Management Investment Companies
| A special meeting of shareholders was held on July 16, 2024. The results of votes taken among shareholders on the proposal before them are reported below. Each vote reported represents one dollar of net asset value held on the record date for the meeting. |
| Proposal 1 |
| To elect a Board of Trustees. |
| | # of Votes | % of Votes |
| Bettina Doulton |
| Affirmative | 88,756,759,992.17 | 95.11 |
| Withheld | 4,564,750,651.52 | 4.89 |
| TOTAL | 93,321,510,643.68 | 100.00 |
| Robert A. Lawrence |
| Affirmative | 88,523,438,331.98 | 94.86 |
| Withheld | 4,798,072,311.70 | 5.14 |
| TOTAL | 93,321,510,643.68 | 100.00 |
| Vijay C. Advani |
| Affirmative | 88,484,371,668.51 | 94.82 |
| Withheld | 4,837,138,975.17 | 5.18 |
| TOTAL | 93,321,510,643.68 | 100.00 |
| Thomas P. Bostick |
| Affirmative | 88,618,596,648.21 | 94.96 |
| Withheld | 4,702,913,995.47 | 5.04 |
| TOTAL | 93,321,510,643.68 | 100.00 |
| Donald F. Donahue |
| Affirmative | 88,542,403,002.79 | 94.88 |
| Withheld | 4,779,107,640.89 | 5.12 |
| TOTAL | 93,321,510,643.68 | 100.00 |
| Vicki L. Fuller |
| Affirmative | 88,788,711,037.44 | 95.14 |
| Withheld | 4,532,799,606.24 | 4.86 |
| TOTAL | 93,321,510,643.68 | 100.00 |
| Patricia L. Kampling |
| Affirmative | 88,819,315,996.59 | 95.18 |
| Withheld | 4,502,194,647.10 | 4.82 |
| TOTAL | 93,321,510,643.68 | 100.00 |
| Thomas A. Kennedy |
| Affirmative | 88,667,457,817.34 | 95.01 |
| Withheld | 4,654,052,826.34 | 4.99 |
| TOTAL | 93,321,510,643.68 | 100.00 |
| Oscar Munoz |
| Affirmative | 88,183,976,568.30 | 94.49 |
| Withheld | 5,137,534,075.39 | 5.51 |
| TOTAL | 93,321,510,643.68 | 100.00 |
| Karen B. Peetz |
| Affirmative | 88,720,160,318.58 | 95.07 |
| Withheld | 4,601,350,325.11 | 4.93 |
| TOTAL | 93,321,510,643.68 | 100.00 |
| David M. Thomas |
| Affirmative | 88,471,490,747.86 | 94.80 |
| Withheld | 4,850,019,895.82 | 5.20 |
| TOTAL | 93,321,510,643.68 | 100.00 |
| Susan Tomasky |
| Affirmative | 88,536,869,646.78 | 94.87 |
| Withheld | 4,784,640,996.90 | 5.13 |
| TOTAL | 93,321,510,643.68 | 100.00 |
| Michael E. Wiley |
| Affirmative | 88,526,906,267.86 | 94.86 |
| Withheld | 4,794,604,375.83 | 5.14 |
| TOTAL | 93,321,510,643.68 | 100.00 |
| | | |
| Proposal 1 reflects trust-wide proposal and voting results. |
Item 10: Remuneration Paid to Directors, Officers, and others of Open-End Management Investment Companies
Note: This information is disclosed as part of the financial statements for each Fund as part of Item 7: Financial Statements and Financial Highlights for Open-End Management Investment companies.
Item 11: Statement Regarding Basis for Approval of Investment Advisory Contract
Board Approval of Investment Advisory Contracts and Management Fees
Fidelity Dividend Growth Fund
Each year, the Board of Trustees, including the Independent Trustees (together, the Board), considers the renewal of the fund's management contract with Fidelity Management & Research Company LLC (FMR) and the sub-advisory agreements (together, the Advisory Contracts) for the fund. FMR and the sub-advisers are referred to herein as the Investment Advisers. The Board, assisted by the advice of fund counsel and Independent Trustees' counsel, requests and considers a broad range of information relevant to the renewal of the Advisory Contracts throughout the year.
The Board meets regularly and, at each of its meetings, covers an extensive agenda of topics and materials and considers factors that are relevant to its annual consideration of the renewal of the fund's Advisory Contracts, including the services and support provided to the fund and its shareholders. The Board, acting directly and through its Committees (each of which is composed of and chaired by Independent Trustees), requests and receives information concerning the annual consideration of the renewal of the fund's Advisory Contracts. The Board also meets as needed to review matters specifically related to the Board's annual consideration of the renewal of the Advisory Contracts. Members of the Board may also meet with trustees of other Fidelity funds through joint ad hoc committees to discuss certain matters relevant to all of the Fidelity funds.
At its May 2024 meeting, the Board unanimously determined to renew the fund's Advisory Contracts. In reaching its determination, the Board considered all factors it believed relevant, including (i) the nature, extent, and quality of the services provided to the fund and its shareholders (including the investment performance of the fund); (ii) the competitiveness relative to peer funds of the fund's management fee and the total expense ratio of a representative class (the retail class, which was selected because it was the largest class); (iii) the total costs of the services provided by and the profits realized by FMR and its affiliates (Fidelity) from its relationships with the fund; and (iv) the extent to which, if any, economies of scale exist and are realized as the fund grows, and whether any economies of scale are appropriately shared with fund shareholders. The Board also considered the broad range of investment choices available to shareholders from FMR's competitors and that the fund's shareholders have chosen to invest in the fund, which is part of the Fidelity family of funds. The Board's decision to renew the Advisory Contracts was not based on any single factor.
The Board reached a determination, with the assistance of fund counsel and Independent Trustees' counsel and through the exercise of its business judgment, that the renewal of the Advisory Contracts was in the best interests of the fund and its shareholders and that the compensation payable under the Advisory Contracts was fair and reasonable in light of all of the surrounding circumstances.
Nature, Extent, and Quality of Services Provided. The Board considered staffing as it relates to the fund, including the backgrounds and experience of investment personnel of the Investment Advisers, and also considered the Investment Advisers' implementation of the fund's investment program. The Independent Trustees also had discussions with senior management of Fidelity's investment operations and investment groups. The Board considered the structure of the investment personnel compensation program and whether this structure provides appropriate incentives to act in the best interests of the fund. Additionally, the Board considered the portfolio managers' investments, if any, in the funds that they manage.
Resources Dedicated to Investment Management and Support Services. The Board and the Fund Oversight and Research Committees reviewed the general qualifications and capabilities of Fidelity's investment staff, including its size, education, experience, and resources, as well as Fidelity's approach to recruiting, training, managing, and compensating investment personnel. The Board noted the resources devoted to expansion of Fidelity's global investment organization, and that Fidelity's analysts have extensive resources, tools, and capabilities that allow them to conduct sophisticated quantitative and fundamental analysis, as well as credit analysis of issuers, counterparties, and guarantors. Further, the Board considered that Fidelity's investment professionals have sufficient access to global information and data so as to provide competitive investment results over time, and that those professionals also have access to sophisticated tools that permit them to assess portfolio construction and risk and performance attribution characteristics continuously, as well as to transmit new information and research conclusions rapidly around the world. Additionally, in its deliberations, the Board considered Fidelity's trading, risk management, compliance, and technology and operations capabilities and resources, which are integral parts of the investment management process.
Shareholder and Administrative Services. The Board considered (i) the nature, extent, quality, and cost of advisory, administrative, shareholder, transfer agency, and pricing and bookkeeping services performed by the Investment Advisers and their affiliates under the Advisory Contracts; (ii) the nature and extent of Fidelity's supervision of third party service providers, principally custodians, subcustodians, and pricing vendors; and (iii) the resources devoted by Fidelity to, and the record of compliance with, the fund's compliance policies and procedures. The Board also reviewed the allocation of fund brokerage, including allocations to brokers affiliated with the Investment Advisers, the use of brokerage commissions to pay fund expenses, and the use of "soft" commission dollars to pay for research services. The Board also considered the fund's securities lending activities and any payments made to Fidelity relating to securities lending under a separate agreement.
The Board noted that the growth of fund assets over time across the complex allows Fidelity to reinvest in the development of services designed to enhance the value and convenience of the Fidelity funds as investment vehicles. These services include 24-hour access to account information and market information over the Internet and through telephone representatives, investor education materials and asset allocation tools. The Board also considered that it reviews customer service metrics such as telephone response times, continuity of services on the website and metrics addressing services at Fidelity Investor Centers.
Investment in a Large Fund Family. The Board considered the benefits to shareholders of investing in a fund that is part of a large family of funds offering a variety of investment disciplines and providing a large variety of fund investor services. The Board noted that Fidelity had taken, or had made recommendations that resulted in the Fidelity funds taking, a number of actions over the previous year that benefited particular funds and/or the Fidelity funds in general.
Investment Performance. The Board took into account discussions that occur with representatives of the Investment Advisers, and reports that it receives, at Board meetings throughout the year, relating to fund investment performance. In this regard the Board noted that as part of regularly scheduled fund reviews and other reports to the Board on fund performance, the Board considered annualized return information for the fund for different time periods, measured against an appropriate securities market index (benchmark index) and an appropriate peer group of funds with similar objectives (peer group). The Board also considered information about performance attribution. In its ongoing evaluation of fund investment performance, the Board gives particular attention to information indicating changes in performance of the funds over different time periods and discussed with the Investment Advisers the reasons for any overperformance or underperformance.
In addition to reviewing absolute and relative fund performance, the Independent Trustees periodically consider the appropriateness of fund performance metrics in evaluating the results achieved. The Independent Trustees generally give greater weight to fund performance over longer time periods than over shorter time periods. Depending on the circumstances, the Independent Trustees may be satisfied with a fund's performance notwithstanding that it lags its benchmark index or peer group for certain periods.
Based on its review, the Board concluded that the nature, extent, and quality of services provided to the fund under the Advisory Contracts should continue to benefit the shareholders of the fund.
Competitiveness of Management Fee and Total Expense Ratio. The Board was provided with information regarding industry trends in management fees and expenses. The Board considered that, effective March 1, 2024, an amended Advisory Contract with FMR went into effect with class-level management fees based on tiered schedules and subject to a maximum class-level rate (the management fee). The Board also considered that in exchange for the variable management fee, each class of the fund receives investment advisory, management, administrative, transfer agent, and pricing and bookkeeping services. In its review of the management fee and total expense ratio of the retail class, the Board considered a pro forma management fee rate for the retail class as if it had been in effect for the 12-month period ended September 30, 2023, as well as other third-party fund expenses, as applicable, such as custodial, legal, and audit fees. The Board noted that Fidelity may agree to waive fees or reimburse expenses from time to time, and the extent to which, if any, it has done so for the fund. The Board also considered information about the impact of the fund's performance adjustment.
Comparisons of Management Fees and Total Expense Ratios. Among other things, the Board reviewed data for selected groups of competitive funds and classes (referred to as "mapped groups") that were compiled by Fidelity based on combining similar investment objective categories (as classified by Morningstar) that have comparable investment mandates. The data reviewed by the Board included (i) gross management fee comparisons (before taking into account expense reimbursements or caps and without taking into account the fund's performance adjustment) relative to the total universe of funds within the mapped group; (ii) gross management fee comparisons relative to a subset of non-Fidelity funds in the mapped group that are similar in size and management fee structure to the fund (referred to as the "asset size peer group"); (iii) total expense comparisons of the retail class of the fund relative to funds and classes in the mapped group that have a similar sales load structure to the retail class of the fund (referred to as the "similar sales load structure group"); and (iv) total expense comparisons of the retail class of the fund relative to funds and classes in the similar sales load structure group that are similar in size and management fee structure to the fund (referred to as the "total expense asset size peer group"). The total expense asset size peer group comparison excludes performance adjustments and fund-paid 12b-1 fees to eliminate variability in fee structures.
The information provided to the Board indicated that the fund's management fee rate ranked below the competitive median of the mapped group for the 12-month period ended September 30, 2023 and above the competitive median of the asset size peer group for the 12-month period ended September 30, 2023. Further, the information provided to the Board indicated that the total expense ratio of the retail class of the fund ranked below the competitive median of the similar sales load structure group for the 12-month period ended September 30, 2023 and below the competitive median of the total expense asset size peer group for the 12-month period ended September 30, 2023. The Board considered that Fidelity believes that management fee comparisons are particularly unhelpful in the context of this fund and that total expense comparisons are more useful. The Board noted that the total expense ratio of the representative class ranked below the competitive median.
The Board noted that a different variable management fee rate is applicable to each class of the fund. The Board considered that the difference in management fee rates between classes is the result of separate arrangements for class-level services and/or waivers of certain expenses and not the result of any difference in advisory or custodial fees or other expenses related to the management of the fund's assets, which do not vary by class.
The Board also considered that the fund's management fee is subject to upward or downward adjustment depending upon whether, and to what extent, the fund's investment performance for the performance period (a rolling 36-month period) exceeds, or is exceeded by, a securities index, thus leading to a performance adjustment for the same period. The Board noted that the performance adjustment provides FMR with a strong economic incentive to seek to achieve superior long-term performance for the fund's shareholders and helps to more closely align the interests of FMR and the shareholders of the fund.
In connection with its consideration of the fund's performance adjustment, the Board noted that the performance of the retail class is used for purposes of determining the performance adjustment. The Board noted that to the extent the performance adjustment was based on the performance of a share class with higher total annual operating expenses, the fund would be subject to a smaller positive and larger negative performance adjustment. The Board considered the appropriateness of the use of the retail class as the basis for the performance adjustment. The Board noted that the retail class is typically the largest class (reflecting the actual investment experience for the plurality of shareholders), employs a standard expense structure, and does not include fund-paid 12b-1 fees, which Fidelity believes makes it a more appropriate measurement of Fidelity's investment skill.
Fees Charged to Other Fidelity Clients. The Board also considered Fidelity fee structures and other information with respect to clients of Fidelity, such as other funds advised or subadvised by Fidelity, pension plan clients, and other institutional clients with similar mandates. The Board noted that a joint ad hoc committee created by it and the boards of other Fidelity funds periodically reviews and compares Fidelity's institutional investment advisory business with its business of providing services to the Fidelity funds and also noted the most recent findings of the committee. The Board noted that the committee's review included a consideration of the differences in services provided, fees charged, and costs incurred, as well as competition in the markets serving the different categories of clients.
Based on its review, the Board concluded that the fund's management fee, including the use of the retail class as the basis for the performance adjustment, is fair and reasonable in light of the services that the fund receives and the other factors considered. Further, based on its review of total expense ratios and fees charged to other Fidelity clients, the Board concluded that the total expense ratio of each class of the fund was reasonable in light of the services that the fund and its shareholders receive and the other factors considered.
Costs of the Services and Profitability. The Board considered the revenues earned and the expenses incurred by Fidelity in conducting the business of developing, marketing, distributing, managing, administering and servicing the fund and servicing the fund's shareholders. The Board also considered the level of Fidelity's profits in respect of all the Fidelity funds.
On an annual basis, Fidelity presents to the Board information about the profitability of its relationships with the fund. Fidelity calculates profitability information for each fund, as well as aggregate profitability information for groups of Fidelity funds and all Fidelity funds, using a series of detailed revenue and cost allocation methodologies which originate with the books and records of Fidelity on which Fidelity's audited financial statements are based. The Audit Committee of the Board reviews any significant changes from the prior year's methodologies and the full Board approves such changes.
A public accounting firm has been engaged annually by the Board as part of the Board's assessment of Fidelity's profitability analysis. The engagement includes the review and assessment of the methodologies used by Fidelity in determining the revenues and expenses attributable to Fidelity's fund business, and completion of agreed-upon procedures in respect of the mathematical accuracy of certain fund profitability information and its conformity to established allocation methodologies. After considering the reports issued under the engagement and information provided by Fidelity, the Board concluded that while other allocation methods may also be reasonable, Fidelity's profitability methodologies are reasonable in all material respects.
The Board also reviewed Fidelity's non-fund businesses and potential indirect benefits such businesses may have received as a result of their association with Fidelity's fund business (i.e., fall-out benefits) as well as cases where Fidelity's affiliates may benefit from the funds' business. The Board considered areas where potential indirect benefits to the Fidelity funds from their relationships with Fidelity may exist. The Board's consideration of these matters was informed by the findings of a joint ad hoc committee created by it and the boards of other Fidelity funds to evaluate potential fall-out benefits.
The Board considered the costs of the services provided by and the profits realized by Fidelity in connection with the operation of the fund and was satisfied that the profitability was not excessive.
Economies of Scale. The Board considered whether there have been economies of scale in respect of the management of the Fidelity funds, whether the Fidelity funds (including the fund) have appropriately benefited from any such economies of scale, and whether there is potential for realization of any further economies of scale. The Board considered the extent to which the fund will benefit from economies of scale as assets grow through increased services to the fund, through waivers or reimbursements, or through fee or expense ratio reductions. The Board also noted that a committee created by it and the boards of other Fidelity funds periodically analyzes whether Fidelity attains economies of scale in respect of the management and servicing of the Fidelity funds, whether the Fidelity funds have appropriately benefited from such economies of scale, and whether there is potential for realization of any further economies of scale.
The Board recognized that the fund's management contract incorporates a variable management fee structure, which provides breakpoints as a way to share, in part, any potential economies of scale that may exist at the asset class level and through a discount that considers both fund size and total assets of the four applicable asset classes. The Board considered that the variable management fee is designed to deliver the benefits of economies of scale to fund shareholders even if assets of any particular fund are unchanged or have declined, because some portion of Fidelity's costs are attributable to services provided to all funds subject to the variable management fee, and all such funds benefit if those costs can be allocated among more assets. The Board concluded that, given the variable management fee structure, fund shareholders will benefit from lower management fees due to the application of the breakpoints and discount factor, regardless of whether Fidelity achieves any such economies of scale.
The Board concluded, taking into account the analysis of the committee, that economies of scale, if any, are being appropriately shared between fund shareholders and Fidelity.
Additional Information Requested by the Board. In order to develop fully the factual basis for consideration of the Fidelity funds' advisory contracts, the Board requested and received additional information on certain topics, including but not limited to: (i) fund flow and performance trends, in particular the underperformance of certain funds and strategies, and Fidelity's long-term strategies for certain funds; (ii) the operation of performance fees and the rationale for implementing performance fees on certain categories of funds but not others; (iii) Fidelity's pricing philosophy compared to competitors; (iv) fund profitability methodology and data; (v) evaluation of competitive fund data and peer group classifications and fee and expense comparisons; (vi) the management fee and expense structures for different funds and classes and information about the differences between various fee and expense structures; (vii) the variable management fee implemented for certain funds effective March 1, 2024; and (viii) information regarding other accounts managed by Fidelity and the funds' sub-advisory arrangements.
Conclusion. Based on its evaluation of all of the conclusions noted above, and after considering all factors it believed relevant, the Board, including the Independent Trustees, concluded that the advisory and sub-advisory fee arrangements are fair and reasonable in light of all of the surrounding circumstances and that the fund's Advisory Contracts should be renewed through May 31, 2025.
1.536090.127
DGF-ANN-0924
Fidelity® OTC Portfolio
Annual Report
July 31, 2024
Contents
To view a fund's proxy voting guidelines and proxy voting record for the 12-month period ended June 30, visit http://www.fidelity.com/proxyvotingresults or visit the Securities and Exchange Commission's (SEC) web site at http://www.sec.gov.
You may also call 1-800-544-8544 if you're an individual investing directly with Fidelity, call 1-800-835-5092 if you're a plan sponsor or participant with Fidelity as your recordkeeper or call 1-877-208-0098 on institutional accounts or if you're an advisor or invest through one to request a free copy of the proxy voting guidelines.
Standard & Poor's, S&P and S&P 500 are registered service marks of The McGraw-Hill Companies, Inc. and have been licensed for use by Fidelity Distributors Corporation.
Other third-party marks appearing herein are the property of their respective owners.
All other marks appearing herein are registered or unregistered trademarks or service marks of FMR LLC or an affiliated company. © 2024 FMR LLC. All rights reserved.
This report and the financial statements contained herein are submitted for the general information of the shareholders of the Fund. This report is not authorized for distribution to prospective investors in the Fund unless preceded or accompanied by an effective prospectus.
A fund files its complete schedule of portfolio holdings with the SEC for the first and third quarters of each fiscal year on Form N-PORT. Forms N-PORT are available on the SEC's web site at http://www.sec.gov. A fund's Forms N-PORT may be reviewed and copied at the SEC's Public Reference Room in Washington, DC. Information regarding the operation of the SEC's Public Reference Room may be obtained by calling 1-800-SEC-0330.
For a complete list of a fund's portfolio holdings, view the most recent holdings listing, semiannual report, or annual report on Fidelity's web site at http://www.fidelity.com, http://www.institutional.fidelity.com, or http://www.401k.com, as applicable.
NOT FDIC INSURED •MAY LOSE VALUE •NO BANK GUARANTEE
Neither the Fund nor Fidelity Distributors Corporation is a bank.
Item 7: Consolidated Financial Statements and Consolidated Financial Highlights for Open-End Management Investment Companies (Annual Report)
Consolidated Schedule of Investments July 31, 2024
Showing Percentage of Net Assets
| Common Stocks - 93.5% |
| | | Shares | Value ($) (000s) |
| COMMUNICATION SERVICES - 19.1% | | | |
| Diversified Telecommunication Services - 0.0% | | | |
| Starry Group Holdings, Inc. Class A (a)(b) | | 331,308 | 0 |
| Entertainment - 2.2% | | | |
| Electronic Arts, Inc. | | 2,318 | 350 |
| NetEase, Inc. ADR | | 14,571 | 1,342 |
| Netflix, Inc. (a) | | 1,029,471 | 646,868 |
| Take-Two Interactive Software, Inc. (a) | | 11,474 | 1,727 |
| The Walt Disney Co. | | 376,500 | 35,274 |
| | | | 685,561 |
| Interactive Media & Services - 15.3% | | | |
| Alphabet, Inc.: | | | |
| Class A | | 11,735,114 | 2,013,041 |
| Class C | | 5,184,601 | 897,714 |
| Epic Games, Inc. (a)(b)(c) | | 77,600 | 46,560 |
| Meta Platforms, Inc. Class A | | 3,053,668 | 1,449,973 |
| Reddit, Inc.: | | | |
| Class A (d) | | 617,700 | 37,587 |
| Class B | | 3,851,357 | 234,355 |
| Vimeo, Inc. (a) | | 280,690 | 1,128 |
| | | | 4,680,358 |
| Media - 1.0% | | | |
| Charter Communications, Inc. Class A (a) | | 310,497 | 117,902 |
| Comcast Corp. Class A | | 4,347,005 | 179,401 |
| | | | 297,303 |
| Wireless Telecommunication Services - 0.6% | | | |
| T-Mobile U.S., Inc. | | 1,012,100 | 184,486 |
TOTAL COMMUNICATION SERVICES | | | 5,847,708 |
| CONSUMER DISCRETIONARY - 12.2% | | | |
| Automobiles - 0.1% | | | |
| Rivian Automotive, Inc. (a) | | 12,976 | 213 |
| Tesla, Inc. (a) | | 90,325 | 20,962 |
| | | | 21,175 |
| Broadline Retail - 8.8% | | | |
| Alibaba Group Holding Ltd. sponsored ADR | | 6,312 | 498 |
| Amazon.com, Inc. (a) | | 13,741,783 | 2,569,439 |
| ContextLogic, Inc. (a) | | 4,887 | 26 |
| Etsy, Inc. (a) | | 136,437 | 8,888 |
| Global-e Online Ltd. (a)(d) | | 248,592 | 8,532 |
| JD.com, Inc. Class A | | 8,560 | 113 |
| MercadoLibre, Inc. (a) | | 54,600 | 91,122 |
| | | | 2,678,618 |
| Hotels, Restaurants & Leisure - 1.5% | | | |
| Airbnb, Inc. Class A (a) | | 18,969 | 2,647 |
| Chipotle Mexican Grill, Inc. (a) | | 1,203,600 | 65,380 |
| Churchill Downs, Inc. | | 296,704 | 42,595 |
| Domino's Pizza, Inc. | | 463,129 | 198,543 |
| Hilton Worldwide Holdings, Inc. | | 76,465 | 16,415 |
| Marriott International, Inc. Class A | | 42,424 | 9,643 |
| Starbucks Corp. | | 1,505,777 | 117,375 |
| Wynn Resorts Ltd. | | 121,571 | 10,069 |
| | | | 462,667 |
| Specialty Retail - 0.9% | | | |
| Lowe's Companies, Inc. | | 862,817 | 211,830 |
| Ross Stores, Inc. | | 462,308 | 66,216 |
| thredUP, Inc. (a) | | 86,404 | 181 |
| | | | 278,227 |
| Textiles, Apparel & Luxury Goods - 0.9% | | | |
| Figs, Inc. Class A (a)(d) | | 44,994 | 292 |
| Kontoor Brands, Inc. | | 5,808 | 407 |
| lululemon athletica, Inc. (a) | | 667,765 | 172,724 |
| LVMH Moet Hennessy Louis Vuitton SE | | 160,490 | 113,204 |
| | | | 286,627 |
TOTAL CONSUMER DISCRETIONARY | | | 3,727,314 |
| CONSUMER STAPLES - 3.1% | | | |
| Beverages - 2.3% | | | |
| Diageo PLC | | 2,300,248 | 71,572 |
| Keurig Dr. Pepper, Inc. | | 10,814,376 | 370,717 |
| Monster Beverage Corp. (a) | | 4,887,723 | 251,473 |
| | | | 693,762 |
| Consumer Staples Distribution & Retail - 0.3% | | | |
| Costco Wholesale Corp. | | 94,545 | 77,716 |
| Dollar Tree, Inc. (a) | | 286,874 | 29,932 |
| | | | 107,648 |
| Food Products - 0.4% | | | |
| Mondelez International, Inc. | | 1,793,455 | 122,583 |
| Personal Care Products - 0.1% | | | |
| Estee Lauder Companies, Inc. Class A | | 236,100 | 23,518 |
| The Honest Co., Inc. (a) | | 157,592 | 588 |
| | | | 24,106 |
TOTAL CONSUMER STAPLES | | | 948,099 |
| ENERGY - 1.7% | | | |
| Energy Equipment & Services - 0.1% | | | |
| TGS ASA ADR | | 2,753,862 | 33,163 |
| Oil, Gas & Consumable Fuels - 1.6% | | | |
| Cenovus Energy, Inc. (Canada) | | 164,955 | 3,324 |
| Diamondback Energy, Inc. | | 51,218 | 10,362 |
| EOG Resources, Inc. | | 13,680 | 1,735 |
| Exxon Mobil Corp. | | 3,759,249 | 445,809 |
| Reliance Industries Ltd. GDR (e) | | 190,432 | 13,730 |
| | | | 474,960 |
TOTAL ENERGY | | | 508,123 |
| FINANCIALS - 2.3% | | | |
| Banks - 0.1% | | | |
| Huntington Bancshares, Inc. | | 2,197,693 | 32,856 |
| Wintrust Financial Corp. | | 43,763 | 4,735 |
| | | | 37,591 |
| Capital Markets - 0.8% | | | |
| Coinbase Global, Inc. (a) | | 980,700 | 220,030 |
| Moody's Corp. | | 15,161 | 6,921 |
| S&P Global, Inc. | | 679 | 329 |
| | | | 227,280 |
| Financial Services - 1.4% | | | |
| Ant International Co. Ltd. Class C (a)(b)(c) | | 10,036,067 | 17,061 |
| Circle Internet Financial Ltd.: | | | |
| Class E (b) | | 1,272,556 | 36,930 |
| Class F (b) | | 391,560 | 11,363 |
| MasterCard, Inc. Class A | | 775,190 | 359,463 |
| PayPal Holdings, Inc. (a) | | 170,153 | 11,193 |
| | | | 436,010 |
TOTAL FINANCIALS | | | 700,881 |
| HEALTH CARE - 7.5% | | | |
| Biotechnology - 3.6% | | | |
| Alnylam Pharmaceuticals, Inc. (a) | | 1,967,951 | 467,310 |
| Argenx SE ADR (a) | | 159,400 | 82,230 |
| Ascendis Pharma A/S sponsored ADR (a) | | 271,220 | 36,208 |
| GenSight Biologics SA (a) | | 211,791 | 77 |
| Grail, Inc. (d) | | 6,463 | 99 |
| Ionis Pharmaceuticals, Inc. (a) | | 31,614 | 1,564 |
| Legend Biotech Corp. ADR (a) | | 102,797 | 5,797 |
| Regeneron Pharmaceuticals, Inc. (a) | | 461,597 | 498,151 |
| Trevena, Inc. (a)(d) | | 17,806 | 4 |
| | | | 1,091,440 |
| Health Care Equipment & Supplies - 2.4% | | | |
| Boston Scientific Corp. (a) | | 2,531,987 | 187,063 |
| DexCom, Inc. (a) | | 576,363 | 39,089 |
| Inspire Medical Systems, Inc. (a) | | 772,182 | 108,916 |
| Insulet Corp. (a) | | 1,420,369 | 276,049 |
| Intuitive Surgical, Inc. (a) | | 168,100 | 74,739 |
| Neuronetics, Inc. (a) | | 38,510 | 72 |
| Outset Medical, Inc. (a) | | 39,921 | 142 |
| Pulmonx Corp. (a) | | 26,049 | 180 |
| TransMedics Group, Inc. (a) | | 419,700 | 59,707 |
| | | | 745,957 |
| Health Care Technology - 0.0% | | | |
| Certara, Inc. (a) | | 222,626 | 3,475 |
| Life Sciences Tools & Services - 1.1% | | | |
| 10X Genomics, Inc. (a) | | 622,621 | 12,870 |
| Bruker Corp. | | 2,256,819 | 154,615 |
| Danaher Corp. | | 482,800 | 133,774 |
| Illumina, Inc. (a) | | 38,780 | 4,754 |
| Seer, Inc. (a) | | 587,199 | 1,163 |
| Thermo Fisher Scientific, Inc. | | 21,900 | 13,432 |
| | | | 320,608 |
| Pharmaceuticals - 0.4% | | | |
| AstraZeneca PLC sponsored ADR | | 1,590,723 | 125,906 |
| Elanco Animal Health, Inc. (a) | | 88,545 | 1,155 |
| TherapeuticsMD, Inc. (a)(d) | | 6,826 | 12 |
| | | | 127,073 |
TOTAL HEALTH CARE | | | 2,288,553 |
| INDUSTRIALS - 1.7% | | | |
| Aerospace & Defense - 0.8% | | | |
| Space Exploration Technologies Corp. (a)(b)(c) | | 2,034,880 | 227,907 |
| Space Exploration Technologies Corp. Class C (a)(b)(c) | | 70,920 | 7,943 |
| | | | 235,850 |
| Commercial Services & Supplies - 0.0% | | | |
| Veralto Corp. | | 15,900 | 1,694 |
| Construction & Engineering - 0.4% | | | |
| Bowman Consulting Group Ltd. (a) | | 80,907 | 2,890 |
| Comfort Systems U.S.A., Inc. | | 95,300 | 31,680 |
| Sterling Construction Co., Inc. (a) | | 819,877 | 95,401 |
| | | | 129,971 |
| Electrical Equipment - 0.2% | | | |
| Eaton Corp. PLC | | 210,099 | 64,036 |
| Vertiv Holdings Co. | | 57,103 | 4,494 |
| | | | 68,530 |
| Ground Transportation - 0.0% | | | |
| CSX Corp. | | 285,633 | 10,026 |
| Passenger Airlines - 0.0% | | | |
| Wheels Up Experience, Inc.: | | | |
| Class A (a)(d) | | 80,274 | 211 |
| rights (a)(b) | | 11,102 | 0 |
| rights (a)(b) | | 11,102 | 0 |
| rights (a)(b) | | 11,103 | 0 |
| | | | 211 |
| Professional Services - 0.3% | | | |
| Verisk Analytics, Inc. | | 315,306 | 82,531 |
TOTAL INDUSTRIALS | | | 528,813 |
| INFORMATION TECHNOLOGY - 44.9% | | | |
| Communications Equipment - 1.0% | | | |
| Cisco Systems, Inc. | | 6,262,500 | 303,418 |
| IT Services - 1.0% | | | |
| Gartner, Inc. (a) | | 378,982 | 189,942 |
| MongoDB, Inc. Class A (a) | | 255,600 | 64,503 |
| Shopify, Inc. Class A (a) | | 471,500 | 28,856 |
| Twilio, Inc. Class A (a) | | 916 | 54 |
| X Holdings Corp. Class A (a)(b)(c) | | 709,150 | 19,814 |
| | | | 303,169 |
| Semiconductors & Semiconductor Equipment - 15.6% | | | |
| Advanced Micro Devices, Inc. (a) | | 52,489 | 7,584 |
| Analog Devices, Inc. | | 307,372 | 71,120 |
| Applied Materials, Inc. | | 479,316 | 101,711 |
| ASML Holding NV (depository receipt) | | 223,669 | 209,511 |
| Astera Labs, Inc. | | 52,600 | 2,306 |
| BE Semiconductor Industries NV | | 927,115 | 119,552 |
| Broadcom, Inc. | | 1,834,400 | 294,751 |
| Lam Research Corp. | | 185,376 | 170,776 |
| Marvell Technology, Inc. | | 10,310,719 | 690,612 |
| NVIDIA Corp. | | 20,927,750 | 2,448,965 |
| NXP Semiconductors NV | | 586,396 | 154,316 |
| Qualcomm, Inc. | | 75,100 | 13,589 |
| Skyworks Solutions, Inc. | | 93,002 | 10,567 |
| Taiwan Semiconductor Manufacturing Co. Ltd. sponsored ADR | | 2,856,054 | 473,534 |
| | | | 4,768,894 |
| Software - 13.1% | | | |
| Adobe, Inc. (a) | | 468,400 | 258,393 |
| Atom Tickets LLC (a)(b)(c)(f) | | 516,103 | 0 |
| Autodesk, Inc. (a) | | 180,048 | 44,565 |
| Cadence Design Systems, Inc. (a) | | 1,129,539 | 302,332 |
| Dropbox, Inc. Class A (a) | | 191,949 | 4,591 |
| Dynatrace, Inc. (a) | | 9,118 | 400 |
| Figma, Inc. (b)(c) | | 234,100 | 5,429 |
| Five9, Inc. (a) | | 472,000 | 21,028 |
| HubSpot, Inc. (a) | | 108,967 | 54,160 |
| Intuit, Inc. | | 282,557 | 182,913 |
| Microsoft Corp. | | 7,320,036 | 3,062,337 |
| Roper Technologies, Inc. | | 105,500 | 57,471 |
| Salesforce, Inc. | | 8,549 | 2,212 |
| Stripe, Inc. Class B (a)(b)(c) | | 91,800 | 2,525 |
| Synopsys, Inc. (a) | | 18,395 | 10,270 |
| | | | 4,008,626 |
| Technology Hardware, Storage & Peripherals - 14.2% | | | |
| Apple, Inc. | | 18,360,180 | 4,077,429 |
| Samsung Electronics Co. Ltd. | | 3,896,270 | 238,648 |
| Western Digital Corp. (a) | | 284,421 | 19,070 |
| | | | 4,335,147 |
TOTAL INFORMATION TECHNOLOGY | | | 13,719,254 |
| MATERIALS - 0.1% | | | |
| Chemicals - 0.1% | | | |
| Linde PLC | | 100,200 | 45,441 |
| REAL ESTATE - 0.2% | | | |
| Equity Real Estate Investment Trusts (REITs) - 0.2% | | | |
| Equinix, Inc. | | 94,160 | 74,409 |
| UTILITIES - 0.7% | | | |
| Electric Utilities - 0.2% | | | |
| Constellation Energy Corp. | | 278,700 | 52,897 |
| Independent Power and Renewable Electricity Producers - 0.5% | | | |
| Vistra Corp. | | 1,886,700 | 149,464 |
TOTAL UTILITIES | | | 202,361 |
| TOTAL COMMON STOCKS (Cost $11,746,489) | | | 28,590,956 |
| | | | |
| Preferred Stocks - 0.7% |
| | | Shares | Value ($) (000s) |
| Convertible Preferred Stocks - 0.7% | | | |
| COMMUNICATION SERVICES - 0.1% | | | |
| Interactive Media & Services - 0.1% | | | |
| ByteDance Ltd. Series E1 (a)(b)(c) | | 130,752 | 30,049 |
| | | | |
| CONSUMER DISCRETIONARY - 0.1% | | | |
| Automobiles - 0.1% | | | |
| Waymo LLC: | | | |
| Series A2(a)(b)(c) | | 103,940 | 6,443 |
| Series B2(a)(b)(c) | | 178,470 | 11,495 |
| | | | 17,938 |
| Hotels, Restaurants & Leisure - 0.0% | | | |
| Discord, Inc. Series I (a)(b)(c) | | 3,300 | 876 |
| | | | |
TOTAL CONSUMER DISCRETIONARY | | | 18,814 |
| | | | |
| FINANCIALS - 0.0% | | | |
| Financial Services - 0.0% | | | |
| Tenstorrent Holdings, Inc. Series C1 (b)(c) | | 79,348 | 5,893 |
| | | | |
| INDUSTRIALS - 0.5% | | | |
| Aerospace & Defense - 0.5% | | | |
| Space Exploration Technologies Corp.: | | | |
| Series G(a)(b)(c) | | 62,037 | 69,481 |
| Series H(a)(b)(c) | | 65,670 | 73,550 |
| | | | 143,031 |
| INFORMATION TECHNOLOGY - 0.0% | | | |
| Software - 0.0% | | | |
| Stripe, Inc. Series H (a)(b)(c) | | 315,830 | 8,688 |
| | | | |
| TOTAL CONVERTIBLE PREFERRED STOCKS | | | 206,475 |
| Nonconvertible Preferred Stocks - 0.0% | | | |
| HEALTH CARE - 0.0% | | | |
| Biotechnology - 0.0% | | | |
| Castle Creek Biosciences, Inc. Series A4 (a)(b)(c) | | 30,303 | 6,833 |
| | | | |
| TOTAL PREFERRED STOCKS (Cost $82,511) | | | 213,308 |
| | | | |
| Convertible Bonds - 0.3% |
| | | Principal Amount (g) (000s) | Value ($) (000s) |
| FINANCIALS - 0.3% | | | |
| Capital Markets - 0.3% | | | |
Coinbase Global, Inc. 0.5% 6/1/26 (Cost $68,477) | | 83,126 | 85,495 |
| | | | |
| Money Market Funds - 6.4% |
| | | Shares | Value ($) (000s) |
| Fidelity Cash Central Fund 5.39% (h) | | 1,911,996,704 | 1,912,379 |
| Fidelity Securities Lending Cash Central Fund 5.39% (h)(i) | | 38,183,737 | 38,188 |
| TOTAL MONEY MARKET FUNDS (Cost $1,950,567) | | | 1,950,567 |
| | | | |
| TOTAL INVESTMENT IN SECURITIES - 100.9% (Cost $13,848,044) | 30,840,326 |
NET OTHER ASSETS (LIABILITIES) - (0.9)% | (264,434) |
| NET ASSETS - 100.0% | 30,575,892 |
| | |
Any values shown as $0 in the Consolidated Schedule of Investments may reflect amounts less than $500.
Legend
| (c) | Restricted securities (including private placements) - Investment in securities not registered under the Securities Act of 1933 (excluding 144A issues). At the end of the period, the value of restricted securities (excluding 144A issues) amounted to $540,547,000 or 1.8% of net assets. |
| (d) | Security or a portion of the security is on loan at period end. |
| (e) | Security exempt from registration under Rule 144A of the Securities Act of 1933. These securities may be resold in transactions exempt from registration, normally to qualified institutional buyers. At the end of the period, the value of these securities amounted to $13,730,000 or 0.0% of net assets. |
| (f) | Investment is owned by a wholly-owned subsidiary (Subsidiary) that is treated as a corporation for U.S. tax purposes. |
| (g) | Amount is stated in United States dollars unless otherwise noted. |
| (h) | Affiliated fund that is generally available only to investment companies and other accounts managed by Fidelity Investments. The rate quoted is the annualized seven-day yield of the fund at period end. A complete unaudited listing of the fund's holdings as of its most recent quarter end is available upon request. In addition, each Fidelity Central Fund's financial statements, which are not covered by the Fund's Report of Independent Registered Public Accounting Firm, are available on the SEC's website or upon request. |
| (i) | Investment made with cash collateral received from securities on loan. |
| Additional information on each restricted holding is as follows: |
| Security | Acquisition Date | Acquisition Cost ($) (000s) |
| Ant International Co. Ltd. Class C | 5/16/18 | 38,251 |
| | | |
| Atom Tickets LLC | 8/15/17 | 3,000 |
| | | |
| ByteDance Ltd. Series E1 | 11/18/20 | 14,327 |
| | | |
| Castle Creek Biosciences, Inc. Series A4 | 9/29/16 | 10,011 |
| | | |
| Discord, Inc. Series I | 9/15/21 | 1,817 |
| | | |
| Epic Games, Inc. | 7/13/20 - 3/29/21 | 61,546 |
| | | |
| Figma, Inc. | 5/15/24 | 5,429 |
| | | |
| Space Exploration Technologies Corp. | 10/16/15 - 9/11/17 | 21,156 |
| | | |
| Space Exploration Technologies Corp. Class C | 9/11/17 | 957 |
| | | |
| Space Exploration Technologies Corp. Series G | 1/20/15 | 4,805 |
| | | |
| Space Exploration Technologies Corp. Series H | 8/04/17 | 8,865 |
| | | |
| Stripe, Inc. Class B | 5/18/21 | 3,684 |
| | | |
| Stripe, Inc. Series H | 3/15/21 - 5/25/23 | 12,673 |
| | | |
| Tenstorrent Holdings, Inc. Series C1 | 4/23/21 | 4,718 |
| | | |
| Waymo LLC Series A2 | 5/08/20 | 8,925 |
| | | |
| Waymo LLC Series B2 | 6/11/21 | 16,370 |
| | | |
| X Holdings Corp. Class A | 10/27/21 | 54,255 |
| | | |
Affiliated Central Funds
Fiscal year to date information regarding the Fund's investments in Fidelity Central Funds, including the ownership percentage, is presented below.
| Affiliate (Amounts in thousands) | Value, beginning of period ($) | Purchases ($) | Sales Proceeds ($) | Dividend Income ($) | Realized Gain (loss) ($) | Change in Unrealized appreciation (depreciation) ($) | Value, end of period ($) | % ownership, end of period |
| Fidelity Cash Central Fund 5.39% | 95,649 | 4,443,985 | 2,627,259 | 2,579 | 4 | - | 1,912,379 | 3.8% |
| Fidelity Securities Lending Cash Central Fund 5.39% | 411 | 481,673 | 443,896 | 219 | - | - | 38,188 | 0.2% |
| Total | 96,060 | 4,925,658 | 3,071,155 | 2,798 | 4 | - | 1,950,567 | |
| | | | | | | | | |
Amounts in the dividend income column in the above table include any capital gain distributions from underlying funds, which are presented in the corresponding line item in the Consolidated Statement of Operations, if applicable.
Amounts in the dividend income column for Fidelity Securities Lending Cash Central Fund represents the income earned on investing cash collateral, less rebates paid to borrowers and any lending agent fees associated with the loan, plus any premium payments received for lending certain types of securities.
Amounts included in the purchases and sales proceeds columns may include in-kind transactions, if applicable.
Investment Valuation
The following is a summary of the inputs used, as of July 31, 2024, involving the Fund's assets and liabilities carried at fair value. The inputs or methodology used for valuing securities may not be an indication of the risk associated with investing in those securities. For more information on valuation inputs, and their aggregation into the levels used below, please refer to the Investment Valuation section in the accompanying Notes to Consolidated Financial Statements.
| Valuation Inputs at Reporting Date: |
Description (Amounts in thousands) | Total ($) | Level 1 ($) | Level 2 ($) | Level 3 ($) |
Investments in Securities: | | | | |
|
| Equities: | | | | |
Communication Services | 5,877,757 | 5,801,148 | - | 76,609 |
Consumer Discretionary | 3,746,128 | 3,613,997 | 113,317 | 18,814 |
Consumer Staples | 948,099 | 876,527 | 71,572 | - |
Energy | 508,123 | 508,123 | - | - |
Financials | 706,774 | 635,527 | - | 71,247 |
Health Care | 2,295,386 | 2,288,553 | - | 6,833 |
Industrials | 671,844 | 292,963 | - | 378,881 |
Information Technology | 13,727,942 | 13,691,486 | - | 36,456 |
Materials | 45,441 | 45,441 | - | - |
Real Estate | 74,409 | 74,409 | - | - |
Utilities | 202,361 | 202,361 | - | - |
|
| Corporate Bonds | 85,495 | - | 85,495 | - |
|
| Money Market Funds | 1,950,567 | 1,950,567 | - | - |
| Total Investments in Securities: | 30,840,326 | 29,981,102 | 270,384 | 588,840 |
The following is a reconciliation of consolidated Investments in Securities for which Level 3 inputs were used in determining value:
| (Amounts in thousands) | |
| Investments in Securities: | |
| Industrials | | | |
| Beginning Balance | $ | 274,013 | |
| Net Realized Gain (Loss) on Investment Securities | | - | |
| Net Unrealized Gain (Loss) on Investment Securities | | 104,868 | |
| Cost of Purchases | | - | |
| Proceeds of Sales | | - | |
| Amortization/Accretion | | - | |
| Transfers into Level 3 | | - | |
| Transfers out of Level 3 | | - | |
| Ending Balance | $ | 378,881 | |
| The change in unrealized gain (loss) for the period attributable to Level 3 securities held at July 31, 2024 | $ | 104,868 | |
| Other Investments in Securities | | | |
| Beginning Balance | $ | 417,342 | |
| Net Realized Gain (Loss) on Investment Securities | | (72,104) | |
| Net Unrealized Gain (Loss) on Investment Securities | | 87,305 | |
| Cost of Purchases | | 5,513 | |
| Proceeds of Sales | | (91,489) | |
| Amortization/Accretion | | - | |
| Transfers into Level 3 | | - | |
| Transfers out of Level 3 | | (136,608) | |
| Ending Balance | $ | 209,959 | |
| The change in unrealized gain (loss) for the period attributable to Level 3 securities held at July 31, 2024 | $ | (3,121) | |
| The information used in the above reconciliation represents fiscal year to date activity for any Investments in Securities identified as using Level 3 inputs at either the beginning or the end of the current fiscal period. Cost of purchases and proceeds of sales may include securities received and/or delivered through in-kind transactions, corporate actions or exchanges. Transfers into Level 3 were attributable to a lack of observable market data resulting from decreases in market activity, decreases in liquidity, security restructurings or corporate actions. Transfers out of Level 3 were attributable to observable market data becoming available for those securities. Transfers in or out of Level 3 represent the beginning value of any Security or Instrument where a change in the pricing level occurred from the beginning to the end of the period. Realized and unrealized gains (losses) disclosed in the reconciliation are included in Net Gain (Loss) on the Fund's consolidated Statement of Operations. | |
Consolidated Financial Statements
| Consolidated Statement of Assets and Liabilities |
As of July 31, 2024 Amounts in thousands (except per-share amounts) |
| Assets | | | | |
| Investment in securities, at value (including securities loaned of $38,795) - See accompanying schedule: | | | | |
Unaffiliated issuers (cost $11,897,477) | $ | 28,889,759 | | |
Fidelity Central Funds (cost $1,950,567) | | 1,950,567 | | |
| | | | | |
| | | | | |
| Total Investment in Securities (cost $13,848,044) | | | $ | 30,840,326 |
| Receivable for investments sold | | | | 658,089 |
| Receivable for fund shares sold | | | | 9,124 |
| Dividends receivable | | | | 4,016 |
| Interest receivable | | | | 69 |
| Distributions receivable from Fidelity Central Funds | | | | 1,293 |
| Prepaid expenses | | | | 7 |
| Other receivables | | | | 692 |
Total assets | | | | 31,513,616 |
| Liabilities | | | | |
| Payable for investments purchased | $ | 870,401 | | |
| Payable for fund shares redeemed | | 10,954 | | |
| Accrued management fee | | 17,379 | | |
| Other payables and accrued expenses | | 826 | | |
| Collateral on securities loaned | | 38,164 | | |
| Total liabilities | | | | 937,724 |
| Commitments and contingent liabilities (see Commitments note) | | | | |
| Net Assets | | | $ | 30,575,892 |
| Net Assets consist of: | | | | |
| Paid in capital | | | $ | 10,612,599 |
| Total accumulated earnings (loss) | | | | 19,963,293 |
| Net Assets | | | $ | 30,575,892 |
| | | | | |
| Net Asset Value and Maximum Offering Price | | | | |
| OTC : | | | | |
Net Asset Value, offering price and redemption price per share ($22,787,879 ÷ 1,036,033 shares) | | | $ | 22.00 |
| Class K : | | | | |
Net Asset Value, offering price and redemption price per share ($7,788,013 ÷ 345,933 shares) | | | $ | 22.51 |
| Consolidated Statement of Operations |
| Year ended July 31, 2024 Amounts in thousands |
| Investment Income | | | | |
| Dividends | | | $ | 161,048 |
| Interest | | | | 7,503 |
| Income from Fidelity Central Funds (including $219 from security lending) | | | | 2,798 |
| Total income | | | | 171,349 |
| Expenses | | | | |
| Management fee | | | | |
| Basic fee | $ | 165,538 | | |
| Performance adjustment | | 16,194 | | |
| Transfer agent fees | | 15,934 | | |
| Accounting fees | | 1,057 | | |
| Custodian fees and expenses | | 359 | | |
| Independent trustees' fees and expenses | | 128 | | |
| Registration fees | | 129 | | |
| Audit fees | | 209 | | |
| Legal | | 32 | | |
| Interest | | 897 | | |
| Miscellaneous | | 273 | | |
| Total expenses before reductions | | 200,750 | | |
| Expense reductions | | (1,664) | | |
| Total expenses after reductions | | | | 199,086 |
| Net Investment income (loss) | | | | (27,737) |
| Realized and Unrealized Gain (Loss) | | | | |
| Net realized gain (loss) on: | | | | |
| Investment Securities: | | | | |
| Unaffiliated issuers (net of foreign taxes of $31,354) | | 3,477,535 | | |
| Fidelity Central Funds | | 4 | | |
| Foreign currency transactions | | (368) | | |
| Total net realized gain (loss) | | | | 3,477,171 |
| Change in net unrealized appreciation (depreciation) on: | | | | |
| Investment Securities: | | | | |
| Unaffiliated issuers (net of decrease in deferred foreign taxes of $22,732) | | 3,230,078 | | |
| Assets and liabilities in foreign currencies | | (12) | | |
| Total change in net unrealized appreciation (depreciation) | | | | 3,230,066 |
| Net gain (loss) | | | | 6,707,237 |
| Net increase (decrease) in net assets resulting from operations | | | $ | 6,679,500 |
| Consolidated Statement of Changes in Net Assets |
| |
| Amount in thousands | | Year ended July 31, 2024 | | Year ended July 31, 2023 |
| Increase (Decrease) in Net Assets | | | | |
| Operations | | | | |
| Net investment income (loss) | $ | (27,737) | $ | 11,206 |
| Net realized gain (loss) | | 3,477,171 | | (82,947) |
| Change in net unrealized appreciation (depreciation) | | 3,230,066 | | 4,547,283 |
| Net increase (decrease) in net assets resulting from operations | | 6,679,500 | | 4,475,542 |
| Distributions to shareholders | | (16,461) | | (782,062) |
| | | | | |
| Share transactions - net increase (decrease) | | (1,513,889) | | (600,071) |
| Total increase (decrease) in net assets | | 5,149,150 | | 3,093,409 |
| | | | | |
| Net Assets | | | | |
| Beginning of period | | 25,426,742 | | 22,333,333 |
| End of period | $ | 30,575,892 | $ | 25,426,742 |
| | | | | |
| | | | | |
Consolidated Financial Highlights
| Years ended July 31, | | 2024 | | 2023 | | 2022 | | 2021 | | 2020 |
Selected Per-Share Data | | | | | | | | | | |
| Net asset value, beginning of period | $ | 17.29 | $ | 14.74 | $ | 20.67 | $ | 15.61 | $ | 12.45 |
| Income from Investment Operations | | | | | | | | | | |
Net investment income (loss) A,B | | (.02) | | - C | | (.07) | | (.06) | | (.01) |
| Net realized and unrealized gain (loss) | | 4.74 | | 3.07 | | (3.60) | | 6.21 | | 4.14 |
| Total from investment operations | | 4.72 | | 3.07 | | (3.67) | | 6.15 | | 4.13 |
| Distributions from net investment income | | (.01) | | - | | - | | (.01) | | - |
| Distributions from net realized gain | | - | | (.52) | | (2.26) | | (1.08) | | (.97) |
| Total distributions | | (.01) | | (.52) | | (2.26) | | (1.09) | | (.97) |
| Net asset value, end of period | $ | 22.00 | $ | 17.29 | $ | 14.74 | $ | 20.67 | $ | 15.61 |
Total Return D | | | | 21.63% | | (20.30)% | | 41.90% | | 35.79% |
Ratios to Average Net Assets B,E,F | | | | | | | | | | |
| Expenses before reductions | | .76% | | .79% | | .81% | | .80% | | .87% |
| Expenses net of fee waivers, if any | | | | .79% | | .81% | | .80% | | .87% |
| Expenses net of all reductions | | .75% | | .78% | | .81% | | .80% | | .87% |
| Net investment income (loss) | | (.12)% | | .03% | | (.37)% | | (.33)% | | (.07)% |
| Supplemental Data | | | | | | | | | | |
| Net assets, end of period (in millions) | $ | 22,788 | $ | 18,890 | $ | 16,626 | $ | 22,273 | $ | 16,817 |
Portfolio turnover rate G | | | | 15% H | | 32% H | | 28% H | | 48% H |
ACalculated based on average shares outstanding during the period.
BNet investment income (loss) is affected by the timing of the declaration of dividends by any underlying mutual funds or exchange-traded funds (ETFs). Net investment income (loss) of any mutual funds or ETFs is not included in the Fund's net investment income (loss) ratio.
CAmount represents less than $.005 per share.
DTotal returns would have been lower if certain expenses had not been reduced during the applicable periods shown.
EFees and expenses of any underlying mutual funds or exchange-traded funds (ETFs) are not included in the Fund's expense ratio. The Fund indirectly bears its proportionate share of these expenses. For additional expense information related to investments in Fidelity Central Funds, please refer to the "Investments in Fidelity Central Funds" note found in the Notes to Consolidated Financial Statements section of the most recent Annual or Semi-Annual report.
FExpense ratios reflect operating expenses of the class. Expenses before reductions do not reflect amounts reimbursed, waived, or reduced through arrangements with the investment adviser, brokerage services, or other offset arrangements, if applicable, and do not represent the amount paid by the class during periods when reimbursements, waivers or reductions occur.
GAmount does not include the portfolio activity of any underlying mutual funds or exchange-traded funds (ETFs).
HPortfolio turnover rate excludes securities received or delivered in-kind.
Fidelity® OTC Portfolio Class K |
| |
| Years ended July 31, | | 2024 | | 2023 | | 2022 | | 2021 | | 2020 |
Selected Per-Share Data | | | | | | | | | | |
| Net asset value, beginning of period | $ | 17.69 | $ | 15.06 | $ | 21.06 | $ | 15.88 | $ | 12.64 |
| Income from Investment Operations | | | | | | | | | | |
Net investment income (loss) A,B | | (.01) | | .02 | | (.05) | | (.05) | | - C |
| Net realized and unrealized gain (loss) | | 4.85 | | 3.13 | | (3.68) | | 6.33 | | 4.21 |
| Total from investment operations | | 4.84 | | 3.15 | | (3.73) | | 6.28 | | 4.21 |
| Distributions from net investment income | | (.02) | | - | | - | | (.01) | | - C |
| Distributions from net realized gain | | - | | (.52) | | (2.27) | | (1.09) | | (.97) |
| Total distributions | | (.02) | | (.52) | | (2.27) | | (1.10) | | (.97) |
| Net asset value, end of period | $ | 22.51 | $ | 17.69 | $ | 15.06 | $ | 21.06 | $ | 15.88 |
Total Return D | | | | 21.71% | | (20.21)% | | 42.05% | | 35.94% |
Ratios to Average Net Assets B,E,F | | | | | | | | | | |
| Expenses before reductions | | .67% | | .70% | | .73% | | .72% | | .78% |
| Expenses net of fee waivers, if any | | | | .69% | | .73% | | .71% | | .78% |
| Expenses net of all reductions | | .67% | | .69% | | .73% | | .71% | | .78% |
| Net investment income (loss) | | (.04)% | | .12% | | (.29)% | | (.25)% | | .03% |
| Supplemental Data | | | | | | | | | | |
| Net assets, end of period (in millions) | $ | 7,788 | $ | 6,536 | $ | 5,707 | $ | 8,072 | $ | 7,074 |
Portfolio turnover rate G | | | | 15% H | | 32% H | | 28% H | | 48% H |
ACalculated based on average shares outstanding during the period.
BNet investment income (loss) is affected by the timing of the declaration of dividends by any underlying mutual funds or exchange-traded funds (ETFs). Net investment income (loss) of any mutual funds or ETFs is not included in the Fund's net investment income (loss) ratio.
CAmount represents less than $.005 per share.
DTotal returns would have been lower if certain expenses had not been reduced during the applicable periods shown.
EFees and expenses of any underlying mutual funds or exchange-traded funds (ETFs) are not included in the Fund's expense ratio. The Fund indirectly bears its proportionate share of these expenses. For additional expense information related to investments in Fidelity Central Funds, please refer to the "Investments in Fidelity Central Funds" note found in the Notes to Consolidated Financial Statements section of the most recent Annual or Semi-Annual report.
FExpense ratios reflect operating expenses of the class. Expenses before reductions do not reflect amounts reimbursed, waived, or reduced through arrangements with the investment adviser, brokerage services, or other offset arrangements, if applicable, and do not represent the amount paid by the class during periods when reimbursements, waivers or reductions occur.
GAmount does not include the portfolio activity of any underlying mutual funds or exchange-traded funds (ETFs).
HPortfolio turnover rate excludes securities received or delivered in-kind.
Notes to Consolidated Financial Statements
For the period ended July 31, 2024
(Amounts in thousands except percentages)
1. Organization.
Fidelity OTC Portfolio (the Fund) is a non-diversified fund of Fidelity Securities Fund (the Trust) and is authorized to issue an unlimited number of shares. The Trust is registered under the Investment Company Act of 1940, as amended (the 1940 Act), as an open-end management investment company organized as a Massachusetts business trust. The Fund offers OTC and Class K shares, each of which has equal rights as to assets and voting privileges. Each class has exclusive voting rights with respect to matters that affect that class.
2. Investments in Fidelity Central Funds.
Funds may invest in Fidelity Central Funds, which are open-end investment companies generally available only to other investment companies and accounts managed by the investment adviser and its affiliates. The Consolidated Schedule of Investments lists any Fidelity Central Funds held as an investment as of period end, but does not include the underlying holdings of each Fidelity Central Fund. An investing fund indirectly bears its proportionate share of the expenses of the underlying Fidelity Central Funds.
Based on its investment objective, each Fidelity Central Fund may invest or participate in various investment vehicles or strategies that are similar to those of the investing fund. These strategies are consistent with the investment objectives of the investing fund and may involve certain economic risks which may cause a decline in value of each of the Fidelity Central Funds and thus a decline in the value of the investing fund.
| Fidelity Central Fund | Investment Manager | Investment Objective | Investment Practices | Expense RatioA |
| Fidelity Money Market Central Funds | Fidelity Management & Research Company LLC (FMR) | Each fund seeks to obtain a high level of current income consistent with the preservation of capital and liquidity. | Short-term Investments | Less than .005% |
A Expenses expressed as a percentage of average net assets and are as of each underlying Central Fund's most recent annual or semi-annual shareholder report.
A complete unaudited list of holdings for each Fidelity Central Fund is available upon request or at the Securities and Exchange Commission website at www.sec.gov. In addition, the financial statements of the Fidelity Central Funds which contain the significant accounting policies (including investment valuation policies) of those funds, and are not covered by the Report of Independent Registered Public Accounting Firm, are available on the Securities and Exchange Commission website or upon request.
3. Significant Accounting Policies.
The Fund is an investment company and applies the accounting and reporting guidance of the Financial Accounting Standards Board (FASB) Accounting Standards Codification Topic 946 Financial Services - Investment Companies. The consolidated financial statements have been prepared in conformity with accounting principles generally accepted in the United States of America (GAAP), which require management to make certain estimates and assumptions at the date of the consolidated financial statements. Actual results could differ from those estimates. Subsequent events, if any, through the date that the consolidated financial statements were issued have been evaluated in the preparation of the consolidated financial statements. The Fund's Consolidated Schedule of Investments lists any underlying mutual funds or exchange-traded funds (ETFs) but does not include the underlying holdings of these funds. The following summarizes the significant accounting policies of the Fund:
Investment Valuation. Investments are valued as of 4:00 p.m. Eastern time on the last calendar day of the period. The Board of Trustees (the Board) has designated the Fund's investment adviser as the valuation designee responsible for the fair valuation function and performing fair value determinations as needed. The investment adviser has established a Fair Value Committee (the Committee) to carry out the day-to-day fair valuation responsibilities and has adopted policies and procedures to govern the fair valuation process and the activities of the Committee. In accordance with these fair valuation policies and procedures, which have been approved by the Board, the Fund attempts to obtain prices from one or more third party pricing services or brokers to value its investments. When current market prices, quotations or currency exchange rates are not readily available or reliable, investments will be fair valued in good faith by the Committee, in accordance with the policies and procedures. Factors used in determining fair value vary by investment type and may include market or investment specific events, transaction data, estimated cash flows, and market observations of comparable investments. The frequency that the fair valuation procedures are used cannot be predicted and they may be utilized to a significant extent. The Committee manages the Fund's fair valuation practices and maintains the fair valuation policies and procedures. The Fund's investment adviser reports to the Board information regarding the fair valuation process and related material matters.
The Fund categorizes the inputs to valuation techniques used to value its investments into a disclosure hierarchy consisting of three levels as shown below:
Level 1 - unadjusted quoted prices in active markets for identical investments
Level 2 - other significant observable inputs (including quoted prices for similar investments, interest rates, prepayment speeds, etc.)
Level 3 - unobservable inputs (including the Fund's own assumptions based on the best information available)
Valuation techniques used to value the Fund's investments by major category are as follows:
Equity securities, including restricted securities, for which market quotations are readily available, are valued at the last reported sale price or official closing price as reported by a third party pricing service on the primary market or exchange on which they are traded and are categorized as Level 1 in the hierarchy. In the event there were no sales during the day or closing prices are not available, securities are valued at the last quoted bid price or may be valued using the last available price and are generally categorized as Level 2 in the hierarchy. For foreign equity securities, when market or security specific events arise, comparisons to the valuation of American Depositary Receipts (ADRs), futures contracts, Exchange-Traded Funds (ETFs) and certain indexes as well as quoted prices for similar securities may be used and would be categorized as Level 2 in the hierarchy. For equity securities, including restricted securities, where observable inputs are limited, assumptions about market activity and risk are used and these securities may be categorized as Level 3 in the hierarchy. Securities, including private placements or other restricted securities, for which observable inputs are not available are valued using alternate valuation approaches, including the market approach, the income approach and cost approach, and are categorized as Level 3 in the hierarchy. The market approach considers factors including the price of recent investments in the same or a similar security or financial metrics of comparable securities. The income approach considers factors including expected future cash flows, security specific risks and corresponding discount rates. The cost approach considers factors including the value of the security's underlying assets and liabilities.
Debt securities, including restricted securities, are valued based on evaluated prices received from third party pricing services or from brokers who make markets in such securities. Corporate bonds are valued by pricing services who utilize matrix pricing which considers yield or price of bonds of comparable quality, coupon, maturity and type or by broker-supplied prices. When independent prices are unavailable or unreliable, debt securities may be valued utilizing pricing methodologies which consider similar factors that would be used by third party pricing services. Debt securities are generally categorized as Level 2 in the hierarchy but may be Level 3 depending on the circumstances.
Investments in open-end mutual funds, including the Fidelity Central Funds, are valued at their closing net asset value (NAV) each business day and are categorized as Level 1 in the hierarchy.
The following provides information on Level 3 securities held by the Fund that were valued at period end based on unobservable inputs. These amounts exclude valuations provided by a broker.
| Asset Type | Fair Value | Valuation Technique(s) | Unobservable Input | Amount or Range/Weighted Average | Impact to Valuation from an Increase in InputA |
| Equities | $588,840 | Recovery value | Recovery value | $0.00 | Increase |
| | | Market approach | Transaction price | $78.20 - $215.03 / $115.94 | Increase |
| | | | Premium rate | 10.0% | Increase |
| | | Market comparable | Enterprise value/Revenue multiple (EV/R) | 2.5 - 13.5 / 5.0 | Increase |
| | | | Enterprise value/EBITDA multiple (EV/EBITDA) | 20.6 - 21.3 / 21.2 | Increase |
| | | Book value | Book value multiple | 1.6 | Increase |
| | | Black scholes | Discount rate | 4.1% - 4.7% / 4.2% | Increase |
| | | | Volatility | 70.0% - 85.0% / 75.3% | Increase |
| | | | Term | 2.0 - 4.0 / 3.4 | Increase |
A Represents the directional change in the fair value of the Level 3 investments that could have resulted from an increase in the corresponding input as of period end. A decrease to the unobservable input would have had the opposite effect. Significant changes in these inputs may have resulted in a significantly higher or lower fair value measurement at period end.
Changes in valuation techniques may result in transfers in or out of an assigned level within the disclosure hierarchy. The aggregate value of investments by input level as of July 31, 2024, as well as a roll forward of Level 3 investments, is included at the end of the Fund's Consolidated Schedule of Investments.
Foreign Currency. Certain Funds may use foreign currency contracts to facilitate transactions in foreign-denominated securities. Gains and losses from these transactions may arise from changes in the value of the foreign currency or if the counterparties do not perform under the contracts' terms.
Foreign-denominated assets, including investment securities, and liabilities are translated into U.S. dollars at the exchange rates at period end. Purchases and sales of investment securities, income and dividends received, and expenses denominated in foreign currencies are translated into U.S. dollars at the exchange rate in effect on the transaction date.
The effects of exchange rate fluctuations on investments are included with the net realized and unrealized gain (loss) on investment securities. Other foreign currency transactions resulting in realized and unrealized gain (loss) are disclosed separately.
Investment Transactions and Income. For financial reporting purposes, the Fund's investment holdings and NAV include trades executed through the end of the last business day of the period. The NAV per share for processing shareholder transactions is calculated as of the close of business of the New York Stock Exchange (NYSE), normally 4:00 p.m. Eastern time and includes trades executed through the end of the prior business day. Gains and losses on securities sold are determined on the basis of identified cost and include proceeds received from litigation. Commissions paid to certain brokers with whom the investment adviser, or its affiliates, places trades on behalf of a fund include an amount in addition to trade execution, which may be rebated back to a fund. Any such rebates are included in net realized gain (loss) on investments in the Consolidated Statement of Operations. Dividend income is recorded on the ex-dividend date, except for certain dividends from foreign securities where the ex-dividend date may have passed, which are recorded as soon as the Fund is informed of the ex-dividend date. Non-cash dividends included in dividend income, if any, are recorded at the fair market value of the securities received. Income and capital gain distributions from Fidelity Central Funds, if any, are recorded on the ex-dividend date. Certain distributions received by the Fund represent a return of capital or capital gain. The Fund determines the components of these distributions subsequent to the ex-dividend date, based upon receipt of tax filings or other correspondence relating to the underlying investment. These distributions are recorded as a reduction of cost of investments and/or as a realized gain. Interest income is accrued as earned and includes coupon interest and amortization of premium and accretion of discount on debt securities as applicable. Investment income is recorded net of foreign taxes withheld where recovery of such taxes is uncertain. Funds may file withholding tax reclaims in certain jurisdictions to recover a portion of amounts previously withheld. Any withholding tax reclaims income is included in the Consolidated Statement of Operations in dividends. Any receivables for withholding tax reclaims are included in the Consolidated Statement of Assets and Liabilities in dividends receivable.
Class Allocations and Expenses. Investment income, realized and unrealized capital gains and losses, common expenses of a fund, and certain fund-level expense reductions, if any, are allocated daily on a pro-rata basis to each class based on the relative net assets of each class to the total net assets of a fund. Each class differs with respect to transfer agent and distribution and service plan fees incurred, as applicable. Certain expense reductions may also differ by class, if applicable. For the reporting period, the allocated portion of income and expenses to each class as a percent of its average net assets may vary due to the timing of recording these transactions in relation to fluctuating net assets of the classes. Expenses directly attributable to a fund are charged to that fund. Expenses attributable to more than one fund are allocated among the respective funds on the basis of relative net assets or other appropriate methods. Expenses included in the accompanying consolidated financial statements reflect the expenses of that fund and do not include any expenses associated with any underlying mutual funds or exchange-traded funds (ETFs). Although not included in a fund's expenses, a fund indirectly bears its proportionate share of these expenses through the net asset value of each underlying mutual fund or exchange-traded fund (ETF). Expense estimates are accrued in the period to which they relate and adjustments are made when actual amounts are known.
Deferred Trustee Compensation. Under a Deferred Compensation Plan (the Plan) for certain Funds, certain independent Trustees have elected to defer receipt of a portion of their annual compensation. Deferred amounts are invested in affiliated mutual funds, are marked-to-market and remain in a fund until distributed in accordance with the Plan. The investment of deferred amounts and the offsetting payable to the Trustees presented below are included in the accompanying Consolidated Statement of Assets and Liabilities in other receivables and other payables and accrued expenses, as applicable.
| Fidelity OTC Portfolio | $520 |
Income Tax Information and Distributions to Shareholders. Each year, the Fund intends to qualify as a regulated investment company under Subchapter M of the Internal Revenue Code, including distributing substantially all of its taxable income and realized gains. As a result, no provision for U.S. Federal income taxes is required. As of July 31, 2024, the Fund did not have any unrecognized tax benefits in the consolidated financial statements; nor is the Fund aware of any tax positions for which it is reasonably possible that the total amounts of unrecognized tax benefits will significantly change in the next twelve months. The Fund files a U.S. federal tax return, in addition to state and local tax returns as required. The Fund's federal income tax returns are subject to examination by the Internal Revenue Service (IRS) for a period of three fiscal years after they are filed. State and local tax returns may be subject to examination for an additional fiscal year depending on the jurisdiction. Foreign taxes are provided for based on the Fund's understanding of the tax rules and rates that exist in the foreign markets in which it invests. The Fund is subject to a tax imposed on capital gains by certain countries in which it invests.
Distributions are declared and recorded on the ex-dividend date. Income and capital gain distributions are declared separately for each class. Income and capital gain distributions are determined in accordance with income tax regulations, which may differ from GAAP. In addition, the Fund claimed a portion of the payment made to redeeming shareholders as a distribution for income tax purposes.
Capital accounts within the consolidated financial statements are adjusted for permanent book-tax differences. These adjustments have no impact on net assets or the results of operations. Capital accounts are not adjusted for temporary book-tax differences which will reverse in a subsequent period.
Book-tax differences are primarily due to foreign currency transactions, certain foreign taxes, passive foreign investment companies (PFIC), capital loss carryforwards and losses deferred due to wash sales and excise tax regulations.
As of period end, the cost and unrealized appreciation (depreciation) in securities, and derivatives if applicable, for federal income tax purposes were as follows:
| Gross unrealized appreciation | $17,288,520 |
| Gross unrealized depreciation | (365,039) |
| Net unrealized appreciation (depreciation) | $16,923,481 |
| Tax Cost | $13,916,845 |
The tax-based components of distributable earnings as of period end were as follows:
| Undistributed ordinary income | $249,998 |
| Undistributed long-term capital gain | $2,812,967 |
| Net unrealized appreciation (depreciation) on securities and other investments | $16,923,459 |
The Fund intends to elect to defer to its next fiscal year $23,132,021 of ordinary losses recognized during the period January 1, 2024 to July 31, 2024.
The tax character of distributions paid was as follows:
| | July 31, 2024 | July 31, 2023 |
| Ordinary Income | $16,461 | $ - |
| Long-term Capital Gains | - | 782,062 |
| Total | $16,461 | $ 782,062 |
Restricted Securities (including Private Placements). Funds may invest in securities that are subject to legal or contractual restrictions on resale. These securities generally may be resold in transactions exempt from registration or to the public if the securities are registered. Disposal of these securities may involve time-consuming negotiations and expense, and prompt sale at an acceptable price may be difficult. Information regarding restricted securities held at period end is included at the end of the Consolidated Schedule of Investments, if applicable.
Commitments. A commitment is an agreement to acquire an investment at a future date (subject to conditions) in connection with a potential public or non-public offering. Commitments outstanding at period end are presented in the table below. Unrealized appreciation (depreciation) on any commitments outstanding at period end is separately presented in the Consolidated Statement of Assets and Liabilities as Unrealized appreciation (depreciation) on unfunded commitments, and any change in unrealized appreciation (depreciation) on unfunded commitments during the period is separately presented in the Consolidated Statement of Operations, as applicable based on contractual conditions of each commitment.
| | Investment to be Acquired | Commitment Amount ($) | Unrealized Appreciation (Depreciation)($) |
| Fidelity OTC Portfolio | Space Exploration Technologies Corp. Class A | 302 | - |
| Fidelity OTC Portfolio | Space Exploration Technologies Corp. Class C | 2,442 | - |
Consolidated Subsidiary. The Funds included in the table below hold certain investments through a wholly-owned subsidiary ("Subsidiary"), which may be subject to federal and state taxes upon disposition.
As of period end, investments in Subsidiaries were as follows:
| | Amount ($) | % of Net Assets |
| Fidelity OTC Portfolio | -A | -B |
A In the amount of less than five hundred dollars.
B In the amount of less than 0.005%.
The financial statements have been consolidated to include the Subsidiary accounts where applicable. Accordingly, all inter-company transactions and balances have been eliminated.
At period end, any estimated tax liability for these investments is presented as "Deferred taxes" in the Consolidated Statement of Assets and Liabilities and included in "Change in net unrealized appreciation (depreciation) on investment securities" in the Consolidated Statement of Operations. The tax liability incurred may differ materially depending on conditions when these investments are disposed. Any cash held by a Subsidiary is restricted as to its use and is presented as "Restricted cash" in the Consolidated Statement of Assets and Liabilities, if applicable.
4. Purchases and Sales of Investments.
Purchases and sales of securities, other than short-term securities and in-kind transactions, as applicable, are noted in the table below.
| | Purchases ($) | Sales ($) |
| Fidelity OTC Portfolio | 10,060,775 | 13,187,213 |
Prior Fiscal Year Unaffiliated Redemptions In-Kind. Shares that were redeemed in-kind for investments, including accrued interest and cash, if any, are shown in the table below; along with realized gain or loss on investments delivered through in-kind redemptions. The amount of the in-kind redemptions is included in share transactions in the accompanying Consolidated Statement of Changes in Net Assets. There was no gain or loss for federal income tax purposes.
| | Shares | Total net realized gain or loss ($) | Total Proceeds ($) |
| Fidelity OTC Portfolio | 8,690 | 80,520 | 126,282 |
5. Fees and Other Transactions with Affiliates.
Management Fee. Fidelity Management & Research Company LLC (the investment adviser) and its affiliates provide the Fund with investment management related services for which the Fund pays a monthly management fee.
Effective March 1, 2024, the Fund's management contract was amended to incorporate administrative services previously covered under separate services agreements (Transfer Agent and Accounting agreements). The amended contract incorporates a basic fee rate that may vary by class (subject to a performance adjustment). The investment adviser or an affiliate pays certain expenses of managing and operating the Fund out of each class's management fee. Each class of the Fund pays a management fee to the investment adviser. The management fee is calculated and paid to the investment adviser every month. The management fee is determined by calculating a basic fee and then applying a performance adjustment. When determining a class's basic fee, a mandate rate is calculated based on the monthly average net assets of a group of funds advised by FMR within a designated asset class. A discount rate is subtracted from the mandate rate once the Fund's monthly average net assets reach a certain level. The mandate rate and discount rate may vary by class. The annual basic fee rate for a class of shares of the Fund is the lesser of (1) the class's mandate rate reduced by the class's discount rate (if applicable) or (2) the amount set forth in the following table.
| | Maximum Management Fee Rate % |
| OTC | .68 |
| Class K | .59 |
One-twelfth of the basic fee rate for a class is applied to the average net assets of the class for the month, giving a dollar amount which is the basic fee for the class for that month. A different management fee rate may be applicable to each class of the Fund. The difference between classes is the result of separate arrangements for class-level services and/or waivers of certain expenses. It is not the result of any difference in advisory or custodial fees or other expenses related to the management of the Fund's assets, which do not vary by class. For the portion of the reporting period on or after March 1, 2024, the total annualized management fee rates were as follows:
| | Total Management Fee Rate % |
| OTC | .67 |
| Class K | .59 |
Prior to March 1, 2024, the management fee was the sum of an individual fund fee rate that was based on an annual rate of .35% of the Fund's average net assets and an annualized group fee rate that averaged .22% during the period. The group fee rate was based upon the monthly average net assets of a group of registered investment companies with which the investment adviser has management contracts. The group fee rate decreased as assets under management increased and increased as assets under management decreased. For the portion of the reporting period prior to March 1, 2024, the total annualized management fee rate was .57%.
The performance adjustment rate is calculated monthly by comparing over the performance period the Fund's performance to that of the performance adjustment index listed below.
| | Performance Adjustment Index |
| Fidelity OTC Portfolio | Nasdaq Composite Index |
For the purposes of calculating the performance adjustment for the Fund, the Fund's investment performance is based on the performance of OTC. To the extent that other classes of the Fund have higher expenses, this could result in those classes bearing a larger positive performance adjustment and smaller negative performance adjustment than would be the case if each class's own performance were considered. The performance period is the most recent 36 month period. The maximum annualized performance adjustment rate is ± .20% of the Fund's average net assets over the performance period. The performance adjustment rate is divided by twelve and multiplied by the Fund's average net assets over the performance period, and the resulting dollar amount is proportionately added to or subtracted from a class's basic fee. For the entire reporting period, the total annual performance adjustment was .06%.
Effective March 1, 2024, the Fund's sub-advisory agreements with FMR Investment Management (UK) Limited, Fidelity Management & Research (Hong Kong) Limited, and Fidelity Management & Research (Japan) Limited were amended to provide that the investment adviser pays each sub-adviser monthly fees equal to 110% of the sub-adviser's costs for providing sub-advisory services.
Transfer Agent Fees. Fidelity Investments Institutional Operations Company LLC (FIIOC), an affiliate of the investment adviser, is the transfer, dividend disbursing and shareholder servicing agent for each class of the Fund. Effective March 1, 2024, the Fund's management contract was amended to incorporate transfer agent services and associated fees previously covered under a separate services agreement. FIIOC pays for typesetting, printing and mailing of shareholder reports, except proxy statements.
During the period December 1, 2023 through February 29, 2024, the transfer agent fees for each class were a fixed annual rate of class-level average net assets as follows:
| | | % of Class-Level Average Net Assets | |
| OTC | | .1300 | |
| Class K | | .0420 | |
| | | |
| | | | |
Prior to December 1, 2023, FIIOC received account fees and asset-based fees that varied according to the account size and type of account of the shareholders of the respective classes of the Fund, except for Class K. FIIOC received an asset-based fee of Class K's average net assets. For the portion of the reporting period prior to March 1, 2024, the fees were equivalent to the following annualized rates:
| | Amount ($) | % of Class-Level Average Net Assets |
| OTC | 14,346 | .13 |
| Class K | 1,588 | .04 |
| 15,934 | |
Accounting Fees. Fidelity Service Company, Inc. (FSC), an affiliate of the investment adviser, maintains the Fund's accounting records. Effective March 1, 2024, the Fund's management contract was amended to incorporate accounting services and associated fees previously covered under a separate services agreement.
During the period December 1, 2023 through February 29, 2024, the accounting fees were a fixed annual rate of average net assets as follows:
| | % of Average Net Assets |
| Fidelity OTC Portfolio | .0071 |
Prior to December 1, 2023, the accounting fee was based on the level of average net assets for each month. For the portion of the reporting period prior to March 1, 2024, the fees were equivalent to the following annualized rates:
| | % of Average Net Assets |
| Fidelity OTC Portfolio | .01 |
Brokerage Commissions. A portion of portfolio transactions were placed with brokerage firms which are affiliates of the investment adviser. Brokerage commissions are included in net realized gain (loss) and change in net unrealized appreciation (depreciation) in the Consolidated Statement of Operations. The commissions paid to these affiliated firms were as follows:
| | Amount ($) |
| Fidelity OTC Portfolio | 115 |
Interfund Lending Program. Pursuant to an Exemptive Order issued by the Securities and Exchange Commission (the SEC), the Fund, along with other registered investment companies having management contracts with Fidelity Management & Research Company LLC (FMR), or other affiliated entities of FMR, may participate in an interfund lending program. This program provides an alternative credit facility allowing the Fund to borrow from, or lend money to, other participating affiliated funds. At period end, there were no interfund loans outstanding. Activity in this program during the period for which loans were outstanding was as follows:
| | Borrower or Lender | Average Loan Balance ($) | Weighted Average Interest Rate | Interest Expense ($) |
| Fidelity OTC Portfolio | Borrower | 21,110 | 5.57% | 859 |
Interfund Trades. Funds may purchase from or sell securities to other Fidelity Funds under procedures adopted by the Board. The procedures have been designed to ensure these interfund trades are executed in accordance with Rule 17a-7 of the 1940 Act. Any interfund trades are included within the respective purchases and sales amounts shown in the Purchases and Sales of Investments note. Interfund trades during the period are noted in the table below.
| | Purchases ($) | Sales ($) | Realized Gain (Loss)($) |
| Fidelity OTC Portfolio | 624,575 | 740,057 | 338,431 |
6. Committed Line of Credit.
Certain Funds participate with other funds managed by the investment adviser or an affiliate in a $4.25 billion credit facility (the "line of credit") to be utilized for temporary or emergency purposes to fund shareholder redemptions or for other short-term liquidity purposes. The participating funds have agreed to pay commitment fees on their pro-rata portion of the line of credit, which are reflected in Miscellaneous expenses on the Consolidated Statement of Operations, and are listed below. During the period, there were no borrowings on this line of credit.
| | Amount ($) |
| Fidelity OTC Portfolio | 45 |
7. Security Lending.
Funds lend portfolio securities from time to time in order to earn additional income. Lending agents are used, including National Financial Services (NFS), an affiliate of the investment adviser. Pursuant to a securities lending agreement, NFS will receive a fee, which is capped at 9.9% of a fund's daily lending revenue, for its services as lending agent. A fund may lend securities to certain qualified borrowers, including NFS. On the settlement date of the loan, a fund receives collateral (in the form of U.S. Treasury obligations, letters of credit and/or cash) against the loaned securities and maintains collateral in an amount not less than 100% of the market value of the loaned securities during the period of the loan. The market value of the loaned securities is determined at the close of business of a fund and any additional required collateral is delivered to a fund on the next business day. A fund or borrower may terminate the loan at any time, and if the borrower defaults on its obligation to return the securities loaned because of insolvency or other reasons, a fund may apply collateral received from the borrower against the obligation. A fund may experience delays and costs in recovering the securities loaned. Any cash collateral received is invested in the Fidelity Securities Lending Cash Central Fund. Any loaned securities are identified as such in the Consolidated Schedule of Investments, and the value of loaned securities and cash collateral at period end, as applicable, are presented in the Consolidated Statement of Assets and Liabilities. Security lending income represents the income earned on investing cash collateral, less rebates paid to borrowers and any lending agent fees associated with the loan, plus any premium payments received for lending certain types of securities. Security lending income is presented in the Consolidated Statement of Operations as a component of income from Fidelity Central Funds. Affiliated security lending activity, if any, was as follows:
| | Total Security Lending Fees Paid to NFS ($) | Security Lending Income From Securities Loaned to NFS ($) | Value of Securities Loaned to NFS at Period End ($) |
| Fidelity OTC Portfolio | 24 | -A | - |
A In the amount of less than five hundred dollars.
8. Bank Borrowings.
The Fund is permitted to have bank borrowings for temporary or emergency purposes to fund shareholder redemptions or for other short-term liquidity requirements. The Fund has established borrowing arrangements with certain banks. The interest rate on the borrowings is the bank's base rate, as revised from time to time. Any open loans, including accrued interest, at period end are presented under the caption "Notes payable" in the Consolidated Statement of Assets and Liabilities, if applicable. Activity in this program during the period for which loans were outstanding was as follows:
| | Average Loan Balance ($) | Weighted Average Interest Rate | Interest Expense ($) |
| Fidelity OTC Portfolio | 11,205 | 5.83% | 38 |
9. Expense Reductions.
Through arrangements with the Fund's custodian, credits realized as a result of certain uninvested cash balances were used to reduce the Fund's expenses. During the period, custodian credits reduced the Fund's expenses by $24.
In addition, during the period the investment adviser or an affiliate reimbursed and/or waived a portion of fund-level operating expenses in the amount of $1,640.
10. Distributions to Shareholders.
Distributions to shareholders of each class were as follows:
| | Year ended July 31, 2024 | Year ended July 31, 2023 |
| Fidelity OTC Portfolio | | |
| Distributions to shareholders | | |
| OTC | $10,723 | $584,667 |
| Class K | 5,738 | 197,395 |
Total | $16,461 | $782,062 |
11. Share Transactions.
Share transactions for each class were as follows and may contain in-kind transactions, automatic conversions between classes or exchanges between affiliated funds:
| | Shares | Shares | Dollars | Dollars |
| | Year ended July 31, 2024 | Year ended July 31, 2023 | Year ended July 31, 2024 | Year ended July 31, 2023 |
| Fidelity OTC Portfolio | | | | |
| OTC | | | | |
| Shares sold | 82,312 | 80,927 | $1,602,415 | $1,192,342 |
| Reinvestment of distributions | 566 | 38,691 | 9,899 | 545,928 |
| Shares redeemed | (139,316) | (154,879) | (2,666,023) | (2,208,386) |
| Net increase (decrease) | (56,438) | (35,261) | $(1,053,709) | $(470,116) |
| Class K | | | | |
| Shares sold | 17,689 | 22,556 | $346,217 | $339,915 |
| Reinvestment of distributions | 321 | 13,689 | 5,738 | 197,395 |
| Shares redeemed | (41,594) | (45,781) | (812,135) | (667,265) |
| Net increase (decrease) | (23,584) | (9,536) | $(460,180) | $(129,955) |
12. Other.
A fund's organizational documents provide former and current trustees and officers with a limited indemnification against liabilities arising in connection with the performance of their duties to the fund. In the normal course of business, a fund may also enter into contracts that provide general indemnifications. A fund's maximum exposure under these arrangements is unknown as this would be dependent on future claims that may be made against a fund. The risk of material loss from such claims is considered remote.
13. Risk and Uncertainties.
Many factors affect a fund's performance. Developments that disrupt global economies and financial markets, such as pandemics, epidemics, outbreaks of infectious diseases, war, terrorism, and environmental disasters, may significantly affect a fund's investment performance. The effects of these developments to a fund will be impacted by the types of securities in which a fund invests, the financial condition, industry, economic sector, and geographic location of an issuer, and a fund's level of investment in the securities of that issuer. Significant concentrations in security types, issuers, industries, sectors, and geographic locations may magnify the factors that affect a fund's performance.
Report of Independent Registered Public Accounting Firm
To the Board of Trustees of Fidelity Securities Fund and the Shareholders of Fidelity OTC Portfolio:
Opinion on the Financial Statements and Financial Highlights
We have audited the accompanying consolidated statement of assets and liabilities of Fidelity OTC Portfolio (the "Fund"), a fund of Fidelity Securities Fund, including the consolidated schedule of investments, as of July 31, 2024, the related consolidated statement of operations for the year then ended, the consolidated statement of changes in net assets for each of the two years in the period then ended, the consolidated financial highlights for each of the five years in the period then ended, and the related notes. In our opinion, the consolidated financial statements and consolidated financial highlights present fairly, in all material respects, the financial position of the Fund as of July 31, 2024, and the results of its operations for the year then ended, the changes in its net assets for each of the two years in the period then ended, and the financial highlights for each of the five years in the period then ended in conformity with accounting principles generally accepted in the United States of America.
Basis for Opinion
These financial statements and financial highlights are the responsibility of the Fund's management. Our responsibility is to express an opinion on the Fund's financial statements and financial highlights based on our audits. We are a public accounting firm registered with the Public Company Accounting Oversight Board (United States) (PCAOB) and are required to be independent with respect to the Fund in accordance with the U.S. federal securities laws and the applicable rules and regulations of the Securities and Exchange Commission and the PCAOB.
We conducted our audits in accordance with the standards of the PCAOB. Those standards require that we plan and perform the audit to obtain reasonable assurance about whether the financial statements and financial highlights are free of material misstatement, whether due to error or fraud. The Fund is not required to have, nor were we engaged to perform, an audit of its internal control over financial reporting. As part of our audits, we are required to obtain an understanding of internal control over financial reporting but not for the purpose of expressing an opinion on the effectiveness of the Fund's internal control over financial reporting. Accordingly, we express no such opinion.
Our audits included performing procedures to assess the risks of material misstatement of the financial statements and financial highlights, whether due to error or fraud, and performing procedures that respond to those risks. Such procedures included examining, on a test basis, evidence regarding the amounts and disclosures in the financial statements and financial highlights. Our audits also included evaluating the accounting principles used and significant estimates made by management, as well as evaluating the overall presentation of the financial statements and financial highlights. Our procedures included confirmation of securities owned as of July 31, 2024, by correspondence with the custodian and brokers; when replies were not received from brokers, we performed other auditing procedures. We believe that our audits provide a reasonable basis for our opinion.
/s/ Deloitte & Touche LLP
Boston, Massachusetts
September 16, 2024
We have served as the auditor of one or more of the Fidelity investment companies since 1999.
Distributions
(Unaudited)The dividend and capital gains distributions for the fund(s) are available on Fidelity.com or Institutional.Fidelity.com.
The fund hereby designates as a capital gain dividend with respect to the taxable year ended July 31, 2024, $2,812,967,408, or, if subsequently determined to be different, the net capital gain of such year.
Retail Class and Class K designate 100% of the dividends distributed during the fiscal year as qualifying for the dividends-received deduction for corporate shareholders.
Retail Class and Class K designate 100% of the dividends distributed during the fiscal year as amounts which may be taken into account as a dividend for purposes of the maximum rate under section 1(h)(11) of the Internal Revenue Code.
The fund will notify shareholders in January 2025 of amounts for use in preparing 2024 income tax returns.
Item 8: Changes in and Disagreements with Accountants for Open-End Management Investment Companies
Note: This is not applicable for any fund included in this document.
Item 9: Proxy Disclosures for Open-End Management Investment Companies
| A special meeting of shareholders was held on July 16, 2024. The results of votes taken among shareholders on the proposal before them are reported below. Each vote reported represents one dollar of net asset value held on the record date for the meeting. |
| Proposal 1 |
| To elect a Board of Trustees. |
| | # of Votes | % of Votes |
| Bettina Doulton |
| Affirmative | 88,756,759,992.17 | 95.11 |
| Withheld | 4,564,750,651.52 | 4.89 |
| TOTAL | 93,321,510,643.68 | 100.00 |
| Robert A. Lawrence |
| Affirmative | 88,523,438,331.98 | 94.86 |
| Withheld | 4,798,072,311.70 | 5.14 |
| TOTAL | 93,321,510,643.68 | 100.00 |
| Vijay C. Advani |
| Affirmative | 88,484,371,668.51 | 94.82 |
| Withheld | 4,837,138,975.17 | 5.18 |
| TOTAL | 93,321,510,643.68 | 100.00 |
| Thomas P. Bostick |
| Affirmative | 88,618,596,648.21 | 94.96 |
| Withheld | 4,702,913,995.47 | 5.04 |
| TOTAL | 93,321,510,643.68 | 100.00 |
| Donald F. Donahue |
| Affirmative | 88,542,403,002.79 | 94.88 |
| Withheld | 4,779,107,640.89 | 5.12 |
| TOTAL | 93,321,510,643.68 | 100.00 |
| Vicki L. Fuller |
| Affirmative | 88,788,711,037.44 | 95.14 |
| Withheld | 4,532,799,606.24 | 4.86 |
| TOTAL | 93,321,510,643.68 | 100.00 |
| Patricia L. Kampling |
| Affirmative | 88,819,315,996.59 | 95.18 |
| Withheld | 4,502,194,647.10 | 4.82 |
| TOTAL | 93,321,510,643.68 | 100.00 |
| Thomas A. Kennedy |
| Affirmative | 88,667,457,817.34 | 95.01 |
| Withheld | 4,654,052,826.34 | 4.99 |
| TOTAL | 93,321,510,643.68 | 100.00 |
| Oscar Munoz |
| Affirmative | 88,183,976,568.30 | 94.49 |
| Withheld | 5,137,534,075.39 | 5.51 |
| TOTAL | 93,321,510,643.68 | 100.00 |
| Karen B. Peetz |
| Affirmative | 88,720,160,318.58 | 95.07 |
| Withheld | 4,601,350,325.11 | 4.93 |
| TOTAL | 93,321,510,643.68 | 100.00 |
| David M. Thomas |
| Affirmative | 88,471,490,747.86 | 94.80 |
| Withheld | 4,850,019,895.82 | 5.20 |
| TOTAL | 93,321,510,643.68 | 100.00 |
| Susan Tomasky |
| Affirmative | 88,536,869,646.78 | 94.87 |
| Withheld | 4,784,640,996.90 | 5.13 |
| TOTAL | 93,321,510,643.68 | 100.00 |
| Michael E. Wiley |
| Affirmative | 88,526,906,267.86 | 94.86 |
| Withheld | 4,794,604,375.83 | 5.14 |
| TOTAL | 93,321,510,643.68 | 100.00 |
| | | |
| Proposal 1 reflects trust-wide proposal and voting results. |
Item 10: Remuneration Paid to Directors, Officers, and others of Open-End Management Investment Companies
Note: This information is disclosed as part of the consolidated financial statements for each Fund as part of Item 7: Consolidated Financial Statements and Consolidated Financial Highlights for Open-End Management Investment companies.
Item 11: Statement Regarding Basis for Approval of Investment Advisory Contract
Board Approval of Investment Advisory Contracts and Management Fees
Fidelity OTC Portfolio
Each year, the Board of Trustees, including the Independent Trustees (together, the Board), considers the renewal of the fund's management contract with Fidelity Management & Research Company LLC (FMR) and the sub-advisory agreements (together, the Advisory Contracts) for the fund. FMR and the sub-advisers are referred to herein as the Investment Advisers. The Board, assisted by the advice of fund counsel and Independent Trustees' counsel, requests and considers a broad range of information relevant to the renewal of the Advisory Contracts throughout the year.
The Board meets regularly and, at each of its meetings, covers an extensive agenda of topics and materials and considers factors that are relevant to its annual consideration of the renewal of the fund's Advisory Contracts, including the services and support provided to the fund and its shareholders. The Board, acting directly and through its Committees (each of which is composed of and chaired by Independent Trustees), requests and receives information concerning the annual consideration of the renewal of the fund's Advisory Contracts. The Board also meets as needed to review matters specifically related to the Board's annual consideration of the renewal of the Advisory Contracts. Members of the Board may also meet with trustees of other Fidelity funds through joint ad hoc committees to discuss certain matters relevant to all of the Fidelity funds.
At its May 2024 meeting, the Board unanimously determined to renew the fund's Advisory Contracts. In reaching its determination, the Board considered all factors it believed relevant, including (i) the nature, extent, and quality of the services provided to the fund and its shareholders (including the investment performance of the fund); (ii) the competitiveness relative to peer funds of the fund's management fee and the total expense ratio of a representative class (the retail class, which was selected because it was the largest class); (iii) the total costs of the services provided by and the profits realized by FMR and its affiliates (Fidelity) from its relationships with the fund; and (iv) the extent to which, if any, economies of scale exist and are realized as the fund grows, and whether any economies of scale are appropriately shared with fund shareholders. The Board also considered the broad range of investment choices available to shareholders from FMR's competitors and that the fund's shareholders have chosen to invest in the fund, which is part of the Fidelity family of funds. The Board's decision to renew the Advisory Contracts was not based on any single factor.
The Board reached a determination, with the assistance of fund counsel and Independent Trustees' counsel and through the exercise of its business judgment, that the renewal of the Advisory Contracts was in the best interests of the fund and its shareholders and that the compensation payable under the Advisory Contracts was fair and reasonable in light of all of the surrounding circumstances.
Nature, Extent, and Quality of Services Provided. The Board considered staffing as it relates to the fund, including the backgrounds and experience of investment personnel of the Investment Advisers, and also considered the Investment Advisers' implementation of the fund's investment program. The Independent Trustees also had discussions with senior management of Fidelity's investment operations and investment groups. The Board considered the structure of the investment personnel compensation program and whether this structure provides appropriate incentives to act in the best interests of the fund. Additionally, the Board considered the portfolio managers' investments, if any, in the funds that they manage.
Resources Dedicated to Investment Management and Support Services. The Board and the Fund Oversight and Research Committees reviewed the general qualifications and capabilities of Fidelity's investment staff, including its size, education, experience, and resources, as well as Fidelity's approach to recruiting, training, managing, and compensating investment personnel. The Board noted the resources devoted to expansion of Fidelity's global investment organization, and that Fidelity's analysts have extensive resources, tools, and capabilities that allow them to conduct sophisticated quantitative and fundamental analysis, as well as credit analysis of issuers, counterparties, and guarantors. Further, the Board considered that Fidelity's investment professionals have sufficient access to global information and data so as to provide competitive investment results over time, and that those professionals also have access to sophisticated tools that permit them to assess portfolio construction and risk and performance attribution characteristics continuously, as well as to transmit new information and research conclusions rapidly around the world. Additionally, in its deliberations, the Board considered Fidelity's trading, risk management, compliance, and technology and operations capabilities and resources, which are integral parts of the investment management process.
Shareholder and Administrative Services. The Board considered (i) the nature, extent, quality, and cost of advisory, administrative, shareholder, transfer agency, and pricing and bookkeeping services performed by the Investment Advisers and their affiliates under the Advisory Contracts; (ii) the nature and extent of Fidelity's supervision of third party service providers, principally custodians, subcustodians, and pricing vendors; and (iii) the resources devoted by Fidelity to, and the record of compliance with, the fund's compliance policies and procedures. The Board also reviewed the allocation of fund brokerage, including allocations to brokers affiliated with the Investment Advisers, the use of brokerage commissions to pay fund expenses, and the use of "soft" commission dollars to pay for research services. The Board also considered the fund's securities lending activities and any payments made to Fidelity relating to securities lending under a separate agreement.
The Board noted that the growth of fund assets over time across the complex allows Fidelity to reinvest in the development of services designed to enhance the value and convenience of the Fidelity funds as investment vehicles. These services include 24-hour access to account information and market information over the Internet and through telephone representatives, investor education materials, and asset allocation tools. The Board also considered that it reviews customer service metrics such as telephone response times, continuity of services on the website and metrics addressing services at Fidelity Investor Centers.
Investment in a Large Fund Family. The Board considered the benefits to shareholders of investing in a fund that is part of a large family of funds offering a variety of investment disciplines and providing a large variety of fund investor services. The Board noted that Fidelity had taken, or had made recommendations that resulted in the Fidelity funds taking, a number of actions over the previous year that benefited particular funds and/or the Fidelity funds in general.
Investment Performance. The Board took into account discussions that occur with representatives of the Investment Advisers, and reports that it receives, at Board meetings throughout the year, relating to fund investment performance. In this regard the Board noted that as part of regularly scheduled fund reviews and other reports to the Board on fund performance, the Board considered annualized return information for the fund for different time periods, measured against an appropriate securities market index (benchmark index) and an appropriate peer group of funds with similar objectives (peer group). The Board also considered information about performance attribution. In its ongoing evaluation of fund investment performance, the Board gives particular attention to information indicating changes in performance of the funds over different time periods and discussed with the Investment Advisers the reasons for any overperformance or underperformance.
In addition to reviewing absolute and relative fund performance, the Independent Trustees periodically consider the appropriateness of fund performance metrics in evaluating the results achieved. The Independent Trustees generally give greater weight to fund performance over longer time periods than over shorter time periods. Depending on the circumstances, the Independent Trustees may be satisfied with a fund's performance notwithstanding that it lags its benchmark index or peer group for certain periods.
Based on its review, the Board concluded that the nature, extent, and quality of services provided to the fund under the Advisory Contracts should continue to benefit the shareholders of the fund.
Competitiveness of Management Fee and Total Expense Ratio. The Board was provided with information regarding industry trends in management fees and expenses. The Board considered that, effective March 1, 2024, an amended Advisory Contract with FMR went into effect with class-level management fees based on tiered schedules and subject to a maximum class-level rate (the management fee). The Board also considered that in exchange for the variable management fee, each class of the fund receives investment advisory, management, administrative, transfer agent, and pricing and bookkeeping services. In its review of the management fee and total expense ratio of the retail class, the Board considered a pro forma management fee rate for the retail class as if it had been in effect for the 12-month period ended September 30, 2023, as well as other third-party fund expenses, as applicable, such as custodial, legal, and audit fees. The Board noted that Fidelity may agree to waive fees or reimburse expenses from time to time, and the extent to which, if any, it has done so for the fund. The Board also considered information about the impact of the fund's performance adjustment.
Comparisons of Management Fees and Total Expense Ratios. Among other things, the Board reviewed data for selected groups of competitive funds and classes (referred to as "mapped groups") that were compiled by Fidelity based on combining similar investment objective categories (as classified by Morningstar) that have comparable investment mandates. The data reviewed by the Board included (i) gross management fee comparisons (before taking into account expense reimbursements or caps and without taking into account the fund's performance adjustment) relative to the total universe of funds within the mapped group; (ii) gross management fee comparisons relative to a subset of non-Fidelity funds in the mapped group that are similar in size and management fee structure to the fund (referred to as the "asset size peer group"); (iii) total expense comparisons of the retail class of the fund relative to funds and classes in the mapped group that have a similar sales load structure to the retail class of the fund (referred to as the "similar sales load structure group"); and (iv) total expense comparisons of the retail class of the fund relative to funds and classes in the similar sales load structure group that are similar in size and management fee structure to the fund (referred to as the "total expense asset size peer group"). The total expense asset size peer group comparison excludes performance adjustments and fund-paid 12b-1 fees to eliminate variability in fee structures.
The information provided to the Board indicated that the fund's management fee rate ranked above the competitive median of the mapped group for the 12-month period ended September 30, 2023 and above the competitive median of the asset size peer group for the 12-month period ended September 30, 2023. Further, the information provided to the Board indicated that the total expense ratio of the retail class of the fund ranked below the competitive median of the similar sales load structure group for the 12-month period ended September 30, 2023 and below the competitive median of the total expense asset size peer group for the 12-month period ended September 30, 2023.
The Board noted that a different variable management fee rate is applicable to each class of the fund. The Board considered that the difference in management fee rates between classes is the result of separate arrangements for class-level services and/or waivers of certain expenses and not the result of any difference in advisory or custodial fees or other expenses related to the management of the fund's assets, which do not vary by class.
The Board also considered that the fund's management fee is subject to upward or downward adjustment depending upon whether, and to what extent, the fund's investment performance for the performance period (a rolling 36-month period) exceeds, or is exceeded by, a securities index, thus leading to a performance adjustment for the same period. The Board noted that the performance adjustment provides FMR with a strong economic incentive to seek to achieve superior long-term performance for the fund's shareholders and helps to more closely align the interests of FMR and the shareholders of the fund.
In connection with its consideration of the fund's performance adjustment, the Board noted that the performance of the retail class is used for purposes of determining the performance adjustment. The Board noted that to the extent the performance adjustment was based on the performance of a share class with higher total annual operating expenses, the fund would be subject to a smaller positive and larger negative performance adjustment. The Board considered the appropriateness of the use of the retail class as the basis for the performance adjustment. The Board noted that the retail class is typically the largest class (reflecting the actual investment experience for the plurality of shareholders), employs a standard expense structure, and does not include fund-paid 12b-1 fees, which Fidelity believes makes it a more appropriate measurement of Fidelity's investment skill.
Fees Charged to Other Fidelity Clients. The Board also considered Fidelity fee structures and other information with respect to clients of Fidelity, such as other funds advised or subadvised by Fidelity, pension plan clients, and other institutional clients with similar mandates. The Board noted that a joint ad hoc committee created by it and the boards of other Fidelity funds periodically reviews and compares Fidelity's institutional investment advisory business with its business of providing services to the Fidelity funds and also noted the most recent findings of the committee. The Board noted that the committee's review included a consideration of the differences in services provided, fees charged, and costs incurred, as well as competition in the markets serving the different categories of clients.
Based on its review, the Board concluded that the fund's management fee, including the use of the retail class as the basis for the performance adjustment, is fair and reasonable in light of the services that the fund receives and the other factors considered. Further, based on its review of total expense ratios and fees charged to other Fidelity clients, the Board concluded that the total expense ratio of each class of the fund was reasonable in light of the services that the fund and its shareholders receive and the other factors considered.
Costs of the Services and Profitability. The Board considered the revenues earned and the expenses incurred by Fidelity in conducting the business of developing, marketing, distributing, managing, administering and servicing the fund and servicing the fund's shareholders. The Board also considered the level of Fidelity's profits in respect of all the Fidelity funds.
On an annual basis, Fidelity presents to the Board information about the profitability of its relationships with the fund. Fidelity calculates profitability information for each fund, as well as aggregate profitability information for groups of Fidelity funds and all Fidelity funds, using a series of detailed revenue and cost allocation methodologies which originate with the books and records of Fidelity on which Fidelity's audited financial statements are based. The Audit Committee of the Board reviews any significant changes from the prior year's methodologies and the full Board approves such changes.
A public accounting firm has been engaged annually by the Board as part of the Board's assessment of Fidelity's profitability analysis. The engagement includes the review and assessment of the methodologies used by Fidelity in determining the revenues and expenses attributable to Fidelity's fund business, and completion of agreed-upon procedures in respect of the mathematical accuracy of certain fund profitability information and its conformity to established allocation methodologies. After considering the reports issued under the engagement and information provided by Fidelity, the Board concluded that while other allocation methods may also be reasonable, Fidelity's profitability methodologies are reasonable in all material respects.
The Board also reviewed Fidelity's non-fund businesses and potential indirect benefits such businesses may have received as a result of their association with Fidelity's fund business (i.e., fall-out benefits) as well as cases where Fidelity's affiliates may benefit from the funds' business. The Board considered areas where potential indirect benefits to the Fidelity funds from their relationships with Fidelity may exist. The Board's consideration of these matters was informed by the findings of a joint ad hoc committee created by it and the boards of other Fidelity funds to evaluate potential fall-out benefits.
The Board considered the costs of the services provided by and the profits realized by Fidelity in connection with the operation of the fund and was satisfied that the profitability was not excessive.
Economies of Scale. The Board considered whether there have been economies of scale in respect of the management of the Fidelity funds, whether the Fidelity funds (including the fund) have appropriately benefited from any such economies of scale, and whether there is potential for realization of any further economies of scale. The Board considered the extent to which the fund will benefit from economies of scale as assets grow through increased services to the fund, through waivers or reimbursements, or through fee or expense ratio reductions. The Board also noted that a committee created by it and the boards of other Fidelity funds periodically analyzes whether Fidelity attains economies of scale in respect of the management and servicing of the Fidelity funds, whether the Fidelity funds have appropriately benefited from such economies of scale, and whether there is potential for realization of any further economies of scale.
The Board recognized that the fund's management contract incorporates a variable management fee structure, which provides breakpoints as a way to share, in part, any potential economies of scale that may exist at the asset class level and through a discount that considers both fund size and total assets of the four applicable asset classes. The Board considered that the variable management fee is designed to deliver the benefits of economies of scale to fund shareholders even if assets of any particular fund are unchanged or have declined, because some portion of Fidelity's costs are attributable to services provided to all funds subject to the variable management fee, and all such funds benefit if those costs can be allocated among more assets. The Board concluded that, given the variable management fee structure, fund shareholders will benefit from lower management fees due to the application of the breakpoints and discount factor, regardless of whether Fidelity achieves any such economies of scale.
The Board concluded, taking into account the analysis of the committee, that economies of scale, if any, are being appropriately shared between fund shareholders and Fidelity.
Additional Information Requested by the Board. In order to develop fully the factual basis for consideration of the Fidelity funds' advisory contracts, the Board requested and received additional information on certain topics, including but not limited to: (i) fund flow and performance trends, in particular the underperformance of certain funds and strategies, and Fidelity's long-term strategies for certain funds; (ii) the operation of performance fees and the rationale for implementing performance fees on certain categories of funds but not others; (iii) Fidelity's pricing philosophy compared to competitors; (iv) fund profitability methodology and data; (v) evaluation of competitive fund data and peer group classifications and fee and expense comparisons; (vi) the management fee and expense structures for different funds and classes and information about the differences between various fee and expense structures; (vii) the variable management fee implemented for certain funds effective March 1, 2024; and (viii) information regarding other accounts managed by Fidelity and the funds' sub-advisory arrangements.
Conclusion. Based on its evaluation of all of the conclusions noted above, and after considering all factors it believed relevant, the Board, including the Independent Trustees, concluded that the advisory and sub-advisory fee arrangements are fair and reasonable in light of all of the surrounding circumstances and that the fund's Advisory Contracts should be renewed through May 31, 2025.
1.536191.127
OTC-ANN-0924
Fidelity® Series Small Cap Opportunities Fund
Annual Report
July 31, 2024
Contents
To view a fund's proxy voting guidelines and proxy voting record for the 12-month period ended June 30, visit http://www.fidelity.com/proxyvotingresults or visit the Securities and Exchange Commission's (SEC) web site at http://www.sec.gov.
You may also call 1-800-544-8544 to request a free copy of the proxy voting guidelines.
Standard & Poor's, S&P and S&P 500 are registered service marks of The McGraw-Hill Companies, Inc. and have been licensed for use by Fidelity Distributors Corporation.
Other third-party marks appearing herein are the property of their respective owners.
All other marks appearing herein are registered or unregistered trademarks or service marks of FMR LLC or an affiliated company. © 2024 FMR LLC. All rights reserved.
This report and the financial statements contained herein are submitted for the general information of the shareholders of the Fund. This report is not authorized for distribution to prospective investors in the Fund unless preceded or accompanied by an effective prospectus.
A fund files its complete schedule of portfolio holdings with the SEC for the first and third quarters of each fiscal year on Form N-PORT. Forms N-PORT are available on the SEC's web site at http://www.sec.gov. A fund's Forms N-PORT may be reviewed and copied at the SEC's Public Reference Room in Washington, DC. Information regarding the operation of the SEC's Public Reference Room may be obtained by calling 1-800-SEC-0330.
For a complete list of a fund's portfolio holdings, view the most recent holdings listing, semiannual report, or annual report on Fidelity's web site at http://www.fidelity.com, http://www.institutional.fidelity.com, or http://www.401k.com, as applicable.
NOT FDIC INSURED •MAY LOSE VALUE •NO BANK GUARANTEE
Neither the Fund nor Fidelity Distributors Corporation is a bank.
Item 7: Financial Statements and Financial Highlights for Open-End Management Investment Companies (Annual Report)
Fidelity® Series Small Cap Opportunities Fund
Schedule of Investments July 31, 2024
Showing Percentage of Net Assets
| Common Stocks - 99.2% |
| | | Shares | Value ($) |
| COMMUNICATION SERVICES - 0.9% | | | |
| Entertainment - 0.3% | | | |
| Vivid Seats, Inc. Class A (a)(b) | | 3,223,953 | 15,732,891 |
| Interactive Media & Services - 0.1% | | | |
| Ziff Davis, Inc. (a) | | 173,000 | 8,283,240 |
| Media - 0.4% | | | |
| TechTarget, Inc. (a) | | 441,848 | 14,139,136 |
| Thryv Holdings, Inc. (a) | | 586,300 | 11,421,124 |
| | | | 25,560,260 |
| Wireless Telecommunication Services - 0.1% | | | |
| Gogo, Inc. (a)(b) | | 489,700 | 4,446,476 |
TOTAL COMMUNICATION SERVICES | | | 54,022,867 |
| CONSUMER DISCRETIONARY - 11.4% | | | |
| Automobile Components - 1.1% | | | |
| Adient PLC (a) | | 495,350 | 12,760,216 |
| LCI Industries (b) | | 112,900 | 13,174,301 |
| Patrick Industries, Inc. | | 292,500 | 37,457,550 |
| | | | 63,392,067 |
| Diversified Consumer Services - 0.5% | | | |
| Laureate Education, Inc. | | 1,946,720 | 30,174,160 |
| Hotels, Restaurants & Leisure - 0.9% | | | |
| Bloomin' Brands, Inc. | | 686,700 | 14,317,695 |
| Brinker International, Inc. (a) | | 218,750 | 14,614,688 |
| Dutch Bros, Inc. (a) | | 239,800 | 9,172,350 |
| Hilton Grand Vacations, Inc. (a) | | 314,200 | 13,576,582 |
| | | | 51,681,315 |
| Household Durables - 3.7% | | | |
| Green Brick Partners, Inc. (a) | | 891,769 | 65,232,902 |
| Installed Building Products, Inc. | | 189,100 | 51,123,185 |
| Lovesac (a) | | 274,421 | 7,508,159 |
| SharkNinja, Inc. (b) | | 588,492 | 45,225,610 |
| Skyline Champion Corp. (a) | | 518,298 | 42,246,470 |
| | | | 211,336,326 |
| Leisure Products - 1.0% | | | |
| Acushnet Holdings Corp. (b) | | 237,700 | 17,252,266 |
| BRP, Inc. | | 237,800 | 17,228,939 |
| Clarus Corp. (b) | | 1,681,784 | 10,157,975 |
| Games Workshop Group PLC | | 109,952 | 14,558,926 |
| | | | 59,198,106 |
| Specialty Retail - 3.3% | | | |
| Academy Sports & Outdoors, Inc. (b) | | 1,427,272 | 77,172,597 |
| Advance Auto Parts, Inc. | | 236,500 | 14,977,545 |
| Boot Barn Holdings, Inc. (a) | | 207,300 | 27,670,404 |
| Murphy U.S.A., Inc. | | 119,991 | 60,585,856 |
| Upbound Group, Inc. | | 237,752 | 8,970,383 |
| | | | 189,376,785 |
| Textiles, Apparel & Luxury Goods - 0.9% | | | |
| Crocs, Inc. (a) | | 203,600 | 27,357,732 |
| Deckers Outdoor Corp. (a) | | 8,000 | 7,381,040 |
| Kontoor Brands, Inc. | | 224,600 | 15,755,690 |
| | | | 50,494,462 |
TOTAL CONSUMER DISCRETIONARY | | | 655,653,221 |
| CONSUMER STAPLES - 2.8% | | | |
| Beverages - 0.6% | | | |
| Primo Water Corp. | | 735,900 | 16,138,287 |
| The Vita Coco Co., Inc. (a)(b) | | 581,700 | 15,031,128 |
| | | | 31,169,415 |
| Consumer Staples Distribution & Retail - 0.8% | | | |
| BJ's Wholesale Club Holdings, Inc. (a) | | 127,150 | 11,184,114 |
| Performance Food Group Co. (a) | | 227,800 | 15,718,200 |
| Sprouts Farmers Market LLC (a) | | 197,600 | 19,738,264 |
| | | | 46,640,578 |
| Food Products - 1.4% | | | |
| Nomad Foods Ltd. | | 2,019,901 | 38,600,308 |
| Post Holdings, Inc. (a) | | 158,100 | 17,289,816 |
| The Simply Good Foods Co. (a) | | 722,800 | 24,517,376 |
| | | | 80,407,500 |
TOTAL CONSUMER STAPLES | | | 158,217,493 |
| ENERGY - 6.5% | | | |
| Energy Equipment & Services - 4.5% | | | |
| Cactus, Inc. | | 1,060,231 | 66,921,781 |
| CES Energy Solutions Corp. | | 580,500 | 3,472,951 |
| Championx Corp. | | 1,051,200 | 36,014,112 |
| Liberty Energy, Inc. Class A (b) | | 3,533,454 | 85,332,912 |
| TechnipFMC PLC | | 1,250,600 | 36,892,700 |
| Valaris Ltd. (a) | | 379,100 | 29,793,469 |
| | | | 258,427,925 |
| Oil, Gas & Consumable Fuels - 2.0% | | | |
| Antero Resources Corp. (a) | | 1,181,958 | 34,300,421 |
| Chord Energy Corp. | | 120,100 | 20,616,366 |
| Northern Oil & Gas, Inc. (b) | | 1,326,245 | 57,280,522 |
| | | | 112,197,309 |
TOTAL ENERGY | | | 370,625,234 |
| FINANCIALS - 16.9% | | | |
| Banks - 7.8% | | | |
| ConnectOne Bancorp, Inc. | | 514,618 | 12,464,048 |
| East West Bancorp, Inc. | | 237,600 | 20,882,664 |
| First Bancorp, Puerto Rico | | 2,798,900 | 60,036,405 |
| First Interstate Bancsystem, Inc. | | 743,400 | 23,469,138 |
| Glacier Bancorp, Inc. (b) | | 435,850 | 19,486,854 |
| Independent Bank Group, Inc. | | 504,300 | 29,783,958 |
| Metropolitan Bank Holding Corp. (a) | | 270,040 | 14,239,209 |
| Pathward Financial, Inc. | | 596,402 | 40,280,991 |
| Pinnacle Financial Partners, Inc. | | 322,100 | 31,024,672 |
| Synovus Financial Corp. | | 1,667,995 | 77,978,766 |
| Trico Bancshares | | 833,080 | 38,763,212 |
| United Community Bank, Inc. | | 1,350,000 | 41,782,500 |
| Western Alliance Bancorp. | | 441,950 | 35,559,297 |
| | | | 445,751,714 |
| Capital Markets - 4.0% | | | |
| Houlihan Lokey | | 358,079 | 53,801,370 |
| Lazard, Inc. Class A | | 939,967 | 46,218,177 |
| Piper Sandler Cos. | | 105,300 | 28,776,384 |
| Stifel Financial Corp. | | 426,500 | 37,817,755 |
| TMX Group Ltd. | | 2,029,720 | 61,686,199 |
| | | | 228,299,885 |
| Consumer Finance - 1.1% | | | |
| FirstCash Holdings, Inc. | | 411,525 | 45,926,190 |
| SLM Corp. | | 920,100 | 20,877,069 |
| | | | 66,803,259 |
| Financial Services - 1.9% | | | |
| Essent Group Ltd. | | 1,023,800 | 64,335,592 |
| Mr. Cooper Group, Inc. (a) | | 246,500 | 22,155,420 |
| Walker & Dunlop, Inc. (b) | | 201,740 | 21,566,006 |
| | | | 108,057,018 |
| Insurance - 2.1% | | | |
| First American Financial Corp. | | 337,496 | 20,445,508 |
| Genworth Financial, Inc. Class A (a) | | 2,550,700 | 17,268,239 |
| Primerica, Inc. | | 221,980 | 55,887,905 |
| Selective Insurance Group, Inc. | | 286,457 | 25,872,796 |
| TWFG, Inc. (b) | | 34,700 | 876,522 |
| | | | 120,350,970 |
TOTAL FINANCIALS | | | 969,262,846 |
| HEALTH CARE - 17.0% | | | |
| Biotechnology - 9.4% | | | |
| Allogene Therapeutics, Inc. (a)(b) | | 3,680,300 | 10,820,082 |
| ALX Oncology Holdings, Inc. (a) | | 1,044,189 | 5,012,107 |
| AnaptysBio, Inc. (a) | | 386,400 | 13,462,176 |
| Arcellx, Inc. (a) | | 355,100 | 21,948,731 |
| Argenx SE ADR (a) | | 43,000 | 22,182,410 |
| Ascendis Pharma A/S sponsored ADR (a) | | 96,248 | 12,849,108 |
| Astria Therapeutics, Inc. (a) | | 824,805 | 9,633,722 |
| Astria Therapeutics, Inc. warrants (a) | | 183,003 | 1,182,524 |
| Autolus Therapeutics PLC ADR (a) | | 2,513,475 | 11,788,198 |
| Blueprint Medicines Corp. (a) | | 187,900 | 20,349,570 |
| Boundless Bio, Inc. (b) | | 26,709 | 102,830 |
| Boundless Bio, Inc. | | 251,973 | 970,096 |
| Cargo Therapeutics, Inc. | | 458,678 | 7,811,286 |
| Cargo Therapeutics, Inc. (c) | | 242,628 | 4,131,955 |
| Celldex Therapeutics, Inc. (a) | | 520,700 | 19,843,877 |
| Cogent Biosciences, Inc. (a) | | 1,389,993 | 13,107,634 |
| Crinetics Pharmaceuticals, Inc. (a) | | 481,700 | 25,587,904 |
| Cytokinetics, Inc. (a) | | 502,245 | 29,637,477 |
| Dianthus Therapeutics, Inc. (a) | | 558,654 | 16,636,716 |
| Immunovant, Inc. (a) | | 440,700 | 12,811,149 |
| Insmed, Inc. (a) | | 242,400 | 17,634,600 |
| Keros Therapeutics, Inc. (a) | | 336,000 | 16,853,760 |
| Madrigal Pharmaceuticals, Inc. (a)(b) | | 76,500 | 21,776,490 |
| Merus BV (a) | | 257,600 | 13,663,104 |
| Moonlake Immunotherapeutics Class A (a)(b) | | 290,841 | 12,113,528 |
| Nuvalent, Inc. Class A (a) | | 157,200 | 12,566,568 |
| Revolution Medicines, Inc. (a) | | 487,200 | 22,235,808 |
| Shattuck Labs, Inc. (a)(b) | | 604,679 | 2,406,622 |
| Spyre Therapeutics, Inc. (a)(b) | | 515,166 | 14,167,065 |
| Tango Therapeutics, Inc. (a) | | 111,676 | 1,100,009 |
| Tango Therapeutics, Inc. (c) | | 772,654 | 7,610,642 |
| Tyra Biosciences, Inc. (a) | | 727,917 | 16,130,641 |
| Vaxcyte, Inc. (a) | | 470,940 | 37,152,457 |
| Vericel Corp. (a) | | 515,786 | 26,057,509 |
| Viking Therapeutics, Inc. (a)(b) | | 495,600 | 28,249,200 |
| Viridian Therapeutics, Inc. (a) | | 774,652 | 13,052,886 |
| Xenon Pharmaceuticals, Inc. (a) | | 393,130 | 16,955,697 |
| | | | 539,596,138 |
| Health Care Equipment & Supplies - 3.0% | | | |
| Glaukos Corp. (a) | | 270,200 | 31,659,334 |
| Integer Holdings Corp. (a) | | 222,000 | 26,364,720 |
| Lantheus Holdings, Inc. (a) | | 196,518 | 20,600,982 |
| Masimo Corp. (a) | | 126,500 | 13,532,970 |
| Penumbra, Inc. (a) | | 127,710 | 21,339,064 |
| PROCEPT BioRobotics Corp. (a) | | 186,900 | 11,834,508 |
| TransMedics Group, Inc. (a) | | 323,147 | 45,970,892 |
| | | | 171,302,470 |
| Health Care Providers & Services - 3.1% | | | |
| agilon health, Inc. (a) | | 1,207,099 | 8,316,912 |
| Encompass Health Corp. | | 264,300 | 24,564,042 |
| HealthEquity, Inc. (a) | | 381,300 | 29,924,424 |
| Hims & Hers Health, Inc. (a) | | 605,000 | 12,850,200 |
| Privia Health Group, Inc. (a) | | 682,109 | 14,146,941 |
| Surgery Partners, Inc. (a) | | 769,492 | 23,361,777 |
| Tenet Healthcare Corp. (a) | | 201,640 | 30,185,508 |
| The Ensign Group, Inc. | | 255,600 | 35,975,700 |
| | | | 179,325,504 |
| Life Sciences Tools & Services - 0.1% | | | |
| 10X Genomics, Inc. (a) | | 255,700 | 5,285,319 |
| Pharmaceuticals - 1.4% | | | |
| Axsome Therapeutics, Inc. (a)(b) | | 141,548 | 12,358,556 |
| Enliven Therapeutics, Inc. (a)(b) | | 459,207 | 12,113,881 |
| Enliven Therapeutics, Inc. (c) | | 224,300 | 5,917,034 |
| Longboard Pharmaceuticals, Inc. (a) | | 499,800 | 16,613,352 |
| Neumora Therapeutics, Inc. (b) | | 692,200 | 8,901,692 |
| Prestige Consumer Healthcare, Inc. (a) | | 233,900 | 16,562,459 |
| Structure Therapeutics, Inc. ADR (a) | | 168,500 | 6,300,215 |
| | | | 78,767,189 |
TOTAL HEALTH CARE | | | 974,276,620 |
| INDUSTRIALS - 18.4% | | | |
| Building Products - 1.3% | | | |
| AAON, Inc. | | 267,600 | 23,690,628 |
| Simpson Manufacturing Co. Ltd. | | 266,708 | 51,231,940 |
| | | | 74,922,568 |
| Commercial Services & Supplies - 0.6% | | | |
| The Brink's Co. | | 196,932 | 21,660,551 |
| Vestis Corp. | | 1,038,400 | 13,468,048 |
| | | | 35,128,599 |
| Construction & Engineering - 4.1% | | | |
| Comfort Systems U.S.A., Inc. | | 64,722 | 21,514,887 |
| Construction Partners, Inc. Class A (a) | | 331,255 | 21,415,636 |
| Dycom Industries, Inc. (a) | | 160,910 | 29,528,594 |
| EMCOR Group, Inc. | | 69,660 | 26,153,150 |
| Granite Construction, Inc. (b) | | 440,100 | 30,129,246 |
| IES Holdings, Inc. (a) | | 433,118 | 66,687,178 |
| MDU Resources Group, Inc. | | 608,100 | 16,382,214 |
| Sterling Construction Co., Inc. (a) | | 183,387 | 21,338,911 |
| | | | 233,149,816 |
| Electrical Equipment - 1.7% | | | |
| Array Technologies, Inc. (a)(b) | | 945,000 | 9,941,400 |
| Atkore, Inc. (b) | | 262,324 | 35,413,740 |
| Nextracker, Inc. Class A (a) | | 404,200 | 19,862,388 |
| Thermon Group Holdings, Inc. (a) | | 1,042,062 | 34,190,054 |
| | | | 99,407,582 |
| Ground Transportation - 0.9% | | | |
| ArcBest Corp. | | 390,200 | 49,184,710 |
| Machinery - 4.4% | | | |
| Astec Industries, Inc. | | 737,289 | 25,871,471 |
| Atmus Filtration Technologies, Inc. | | 561,689 | 17,322,489 |
| Federal Signal Corp. | | 409,130 | 40,900,726 |
| Kadant, Inc. (b) | | 90,756 | 31,899,826 |
| REV Group, Inc. | | 118,500 | 3,457,830 |
| SPX Technologies, Inc. (a) | | 380,344 | 56,115,954 |
| Terex Corp. | | 950,400 | 60,122,304 |
| Timken Co. | | 205,600 | 17,876,920 |
| | | | 253,567,520 |
| Professional Services - 2.3% | | | |
| CACI International, Inc. (a) | | 42,700 | 19,705,196 |
| CRA International, Inc. | | 135,374 | 23,663,375 |
| ExlService Holdings, Inc. (a) | | 819,455 | 28,893,983 |
| First Advantage Corp. (b) | | 1,244,714 | 21,433,975 |
| KBR, Inc. | | 336,900 | 22,434,171 |
| WNS Holdings Ltd. | | 316,137 | 18,835,442 |
| | | | 134,966,142 |
| Trading Companies & Distributors - 3.1% | | | |
| Applied Industrial Technologies, Inc. | | 133,700 | 29,172,003 |
| Beacon Roofing Supply, Inc. (a) | | 149,057 | 15,323,060 |
| FTAI Aviation Ltd. | | 217,700 | 24,262,665 |
| GMS, Inc. (a) | | 534,000 | 51,386,820 |
| Rush Enterprises, Inc. Class A | | 1,112,851 | 56,766,530 |
| | | | 176,911,078 |
TOTAL INDUSTRIALS | | | 1,057,238,015 |
| INFORMATION TECHNOLOGY - 12.9% | | | |
| Communications Equipment - 0.4% | | | |
| Ciena Corp. (a) | | 390,300 | 20,584,422 |
| Electronic Equipment, Instruments & Components - 5.5% | | | |
| Advanced Energy Industries, Inc. | | 527,399 | 61,373,422 |
| Celestica, Inc. (a) | | 230,900 | 12,108,396 |
| ePlus, Inc. (a) | | 142,600 | 13,107,792 |
| Fabrinet (a) | | 284,556 | 62,761,671 |
| Insight Enterprises, Inc. (a) | | 369,007 | 82,842,072 |
| Napco Security Technologies, Inc. (b) | | 266,200 | 14,856,622 |
| Sanmina Corp. (a) | | 369,764 | 27,854,322 |
| TD SYNNEX Corp. | | 359,700 | 42,865,449 |
| | | | 317,769,746 |
| IT Services - 1.3% | | | |
| ASGN, Inc. (a) | | 408,650 | 38,686,896 |
| Endava PLC ADR (a) | | 339,600 | 10,819,656 |
| Wix.com Ltd. (a) | | 146,100 | 22,780,643 |
| | | | 72,287,195 |
| Semiconductors & Semiconductor Equipment - 2.2% | | | |
| Allegro MicroSystems LLC (a) | | 675,100 | 16,229,404 |
| Diodes, Inc. (a) | | 483,751 | 37,829,328 |
| MACOM Technology Solutions Holdings, Inc. (a) | | 493,300 | 49,783,836 |
| Nova Ltd. (a) | | 75,900 | 15,671,073 |
| Onto Innovation, Inc. (a) | | 46,892 | 8,970,440 |
| | | | 128,484,081 |
| Software - 3.5% | | | |
| Five9, Inc. (a) | | 160,700 | 7,159,185 |
| Intapp, Inc. (a) | | 374,318 | 13,411,814 |
| Lumine Group, Inc. (a) | | 712,100 | 19,057,759 |
| Manhattan Associates, Inc. (a) | | 39,500 | 10,087,510 |
| Progress Software Corp. | | 423,900 | 24,755,760 |
| PROS Holdings, Inc. (a) | | 159,826 | 3,851,807 |
| Rapid7, Inc. (a) | | 173,500 | 6,825,490 |
| SPS Commerce, Inc. (a) | | 259,550 | 55,912,261 |
| Tenable Holdings, Inc. (a) | | 867,700 | 39,844,784 |
| Vertex, Inc. Class A (a) | | 507,354 | 20,116,586 |
| | | | 201,022,956 |
TOTAL INFORMATION TECHNOLOGY | | | 740,148,400 |
| MATERIALS - 6.0% | | | |
| Chemicals - 1.1% | | | |
| Element Solutions, Inc. | | 1,294,717 | 34,892,623 |
| Minerals Technologies, Inc. | | 203,563 | 15,955,268 |
| Tronox Holdings PLC | | 877,247 | 14,176,312 |
| | | | 65,024,203 |
| Construction Materials - 1.1% | | | |
| Eagle Materials, Inc. | | 229,900 | 62,601,770 |
| Metals & Mining - 3.1% | | | |
| Carpenter Technology Corp. | | 172,600 | 25,177,162 |
| Commercial Metals Co. | | 1,202,684 | 72,281,308 |
| Constellium NV (a) | | 3,000,295 | 53,435,254 |
| Lundin Mining Corp. | | 2,530,200 | 25,546,654 |
| | | | 176,440,378 |
| Paper & Forest Products - 0.7% | | | |
| Louisiana-Pacific Corp. | | 203,300 | 19,955,928 |
| Sylvamo Corp. | | 283,200 | 20,874,672 |
| | | | 40,830,600 |
TOTAL MATERIALS | | | 344,896,951 |
| REAL ESTATE - 4.5% | | | |
| Equity Real Estate Investment Trusts (REITs) - 3.1% | | | |
| CareTrust (REIT), Inc. | | 1,225,200 | 33,031,392 |
| Elme Communities (SBI) | | 651,900 | 10,730,274 |
| Essential Properties Realty Trust, Inc. | | 1,919,300 | 56,792,087 |
| Lamar Advertising Co. Class A | | 246,300 | 29,521,518 |
| Terreno Realty Corp. | | 645,296 | 44,144,699 |
| | | | 174,219,970 |
| Real Estate Management & Development - 1.4% | | | |
| Colliers International Group, Inc. | | 341,100 | 45,969,997 |
| Jones Lang LaSalle, Inc. (a) | | 139,800 | 35,075,820 |
| | | | 81,045,817 |
TOTAL REAL ESTATE | | | 255,265,787 |
| UTILITIES - 1.9% | | | |
| Gas Utilities - 1.9% | | | |
| Brookfield Infrastructure Corp. A Shares | | 1,563,866 | 60,834,387 |
| Southwest Gas Holdings, Inc. | | 663,760 | 49,224,442 |
| | | | 110,058,829 |
| TOTAL COMMON STOCKS (Cost $3,919,666,303) | | | 5,689,666,263 |
| | | | |
| Money Market Funds - 6.3% |
| | | Shares | Value ($) |
| Fidelity Cash Central Fund 5.39% (d) | | 138,271,307 | 138,298,961 |
| Fidelity Securities Lending Cash Central Fund 5.39% (d)(e) | | 221,677,662 | 221,699,830 |
| TOTAL MONEY MARKET FUNDS (Cost $359,998,790) | | | 359,998,791 |
| | | | |
| TOTAL INVESTMENT IN SECURITIES - 105.5% (Cost $4,279,665,093) | 6,049,665,054 |
NET OTHER ASSETS (LIABILITIES) - (5.5)% | (314,287,008) |
| NET ASSETS - 100.0% | 5,735,378,046 |
| | |
| Futures Contracts |
| | Number of contracts | Expiration Date | Notional Amount ($) | Value ($) | Unrealized Appreciation/ (Depreciation) ($) |
| Purchased | | | | | |
| | | | | | |
| Equity Index Contracts | | | | | |
| CME E-mini Russell 2000 Index Contracts (United States) | 233 | Sep 2024 | 26,480,450 | 2,726,240 | 2,726,240 |
| | | | | | |
| The notional amount of futures purchased as a percentage of Net Assets is 0.5% |
Legend
| (b) | Security or a portion of the security is on loan at period end. |
| (c) | Restricted securities (including private placements) - Investment in securities not registered under the Securities Act of 1933 (excluding 144A issues). At the end of the period, the value of restricted securities (excluding 144A issues) amounted to $17,659,631 or 0.3% of net assets. |
| (d) | Affiliated fund that is generally available only to investment companies and other accounts managed by Fidelity Investments. The rate quoted is the annualized seven-day yield of the fund at period end. A complete unaudited listing of the fund's holdings as of its most recent quarter end is available upon request. In addition, each Fidelity Central Fund's financial statements, which are not covered by the Fund's Report of Independent Registered Public Accounting Firm, are available on the SEC's website or upon request. |
| (e) | Investment made with cash collateral received from securities on loan. |
| Additional information on each restricted holding is as follows: |
| Security | Acquisition Date | Acquisition Cost ($) |
| Cargo Therapeutics, Inc. | 5/28/24 | 4,124,676 |
| | | |
| Enliven Therapeutics, Inc. | 3/19/24 | 3,140,200 |
| | | |
| Tango Therapeutics, Inc. | 8/09/23 | 3,979,168 |
| | | |
Affiliated Central Funds
Fiscal year to date information regarding the Fund's investments in Fidelity Central Funds, including the ownership percentage, is presented below.
| Affiliate | Value, beginning of period ($) | Purchases ($) | Sales Proceeds ($) | Dividend Income ($) | Realized Gain (loss) ($) | Change in Unrealized appreciation (depreciation) ($) | Value, end of period ($) | % ownership, end of period |
| Fidelity Cash Central Fund 5.39% | 83,542,137 | 1,998,587,410 | 1,943,830,874 | 4,874,755 | 287 | 1 | 138,298,961 | 0.3% |
| Fidelity Securities Lending Cash Central Fund 5.39% | 139,488,836 | 1,772,784,700 | 1,690,573,706 | 652,514 | - | - | 221,699,830 | 1.0% |
| Total | 223,030,973 | 3,771,372,110 | 3,634,404,580 | 5,527,269 | 287 | 1 | 359,998,791 | |
| | | | | | | | | |
Amounts in the dividend income column in the above table include any capital gain distributions from underlying funds, which are presented in the corresponding line item in the Statement of Operations, if applicable.
Amounts in the dividend income column for Fidelity Securities Lending Cash Central Fund represents the income earned on investing cash collateral, less rebates paid to borrowers and any lending agent fees associated with the loan, plus any premium payments received for lending certain types of securities.
Amounts included in the purchases and sales proceeds columns may include in-kind transactions, if applicable.
Investment Valuation
The following is a summary of the inputs used, as of July 31, 2024, involving the Fund's assets and liabilities carried at fair value. The inputs or methodology used for valuing securities may not be an indication of the risk associated with investing in those securities. For more information on valuation inputs, and their aggregation into the levels used below, please refer to the Investment Valuation section in the accompanying Notes to Financial Statements.
| Valuation Inputs at Reporting Date: |
| Description | Total ($) | Level 1 ($) | Level 2 ($) | Level 3 ($) |
Investments in Securities: | | | | |
|
| Equities: | | | | |
Communication Services | 54,022,867 | 54,022,867 | - | - |
Consumer Discretionary | 655,653,221 | 655,653,221 | - | - |
Consumer Staples | 158,217,493 | 158,217,493 | - | - |
Energy | 370,625,234 | 370,625,234 | - | - |
Financials | 969,262,846 | 969,262,846 | - | - |
Health Care | 974,276,620 | 973,094,096 | 1,182,524 | - |
Industrials | 1,057,238,015 | 1,057,238,015 | - | - |
Information Technology | 740,148,400 | 740,148,400 | - | - |
Materials | 344,896,951 | 344,896,951 | - | - |
Real Estate | 255,265,787 | 255,265,787 | - | - |
Utilities | 110,058,829 | 110,058,829 | - | - |
|
| Money Market Funds | 359,998,791 | 359,998,791 | - | - |
| Total Investments in Securities: | 6,049,665,054 | 6,048,482,530 | 1,182,524 | - |
Derivative Instruments: Assets | | | | |
Futures Contracts | 2,726,240 | 2,726,240 | - | - |
| Total Assets | 2,726,240 | 2,726,240 | - | - |
| Total Derivative Instruments: | 2,726,240 | 2,726,240 | - | - |
Value of Derivative Instruments
The following table is a summary of the Fund's value of derivative instruments by primary risk exposure as of July 31, 2024. For additional information on derivative instruments, please refer to the Derivative Instruments section in the accompanying Notes to Financial Statements.
Primary Risk Exposure / Derivative Type | Value |
| Asset ($) | Liability ($) |
| Equity Risk | | |
Futures Contracts (a) | 2,726,240 | 0 |
| Total Equity Risk | 2,726,240 | 0 |
| Total Value of Derivatives | 2,726,240 | 0 |
(a)Reflects gross cumulative appreciation (depreciation) on futures contracts as presented in the Schedule of Investments. In the Statement of Assets and Liabilities, the period end daily variation margin is included in receivable or payable for daily variation margin on futures contracts, and the net cumulative appreciation (depreciation) is included in Total accumulated earnings (loss).
Financial Statements
| Statement of Assets and Liabilities |
As of July 31, 2024 |
| Assets | | | | |
| Investment in securities, at value (including securities loaned of $217,102,756) - See accompanying schedule: | | | | |
Unaffiliated issuers (cost $3,919,666,303) | $ | 5,689,666,263 | | |
Fidelity Central Funds (cost $359,998,790) | | 359,998,791 | | |
| | | | | |
| | | | | |
| Total Investment in Securities (cost $4,279,665,093) | | | $ | 6,049,665,054 |
| Segregated cash with brokers for derivative instruments | | | | 6,337,600 |
| Cash | | | | 321 |
| Foreign currency held at value (cost $181) | | | | 181 |
| Receivable for investments sold | | | | 81,261,319 |
| Receivable for fund shares sold | | | | 261,591 |
| Dividends receivable | | | | 78,917 |
| Distributions receivable from Fidelity Central Funds | | | | 374,148 |
| Receivable for daily variation margin on futures contracts | | | | 398,871 |
| Other receivables | | | | 49,665 |
Total assets | | | | 6,138,427,667 |
| Liabilities | | | | |
| Payable for investments purchased | $ | 5,304,705 | | |
| Payable for fund shares redeemed | | 175,964,552 | | |
| Other payables and accrued expenses | | 90,971 | | |
| Collateral on securities loaned | | 221,689,393 | | |
| Total liabilities | | | | 403,049,621 |
| Net Assets | | | $ | 5,735,378,046 |
| Net Assets consist of: | | | | |
| Paid in capital | | | $ | 3,595,988,387 |
| Total accumulated earnings (loss) | | | | 2,139,389,659 |
| Net Assets | | | $ | 5,735,378,046 |
Net Asset Value, offering price and redemption price per share ($5,735,378,046 ÷ 353,207,879 shares) | | | $ | 16.24 |
| Statement of Operations |
| Year ended July 31, 2024 |
| Investment Income | | | | |
| Dividends | | | $ | 53,243,256 |
| Interest | | | | 24,914 |
| Income from Fidelity Central Funds (including $652,514 from security lending) | | | | 5,527,269 |
| Total income | | | | 58,795,439 |
| Expenses | | | | |
| Custodian fees and expenses | $ | 92,893 | | |
| Independent trustees' fees and expenses | | 24,504 | | |
| Interest | | 1,887 | | |
| Miscellaneous | | 86 | | |
| Total expenses | | | | 119,370 |
| Net Investment income (loss) | | | | 58,676,069 |
| Realized and Unrealized Gain (Loss) | | | | |
| Net realized gain (loss) on: | | | | |
| Investment Securities: | | | | |
| Unaffiliated issuers | | 523,985,638 | | |
| Fidelity Central Funds | | 287 | | |
| Foreign currency transactions | | (12,789) | | |
| Futures contracts | | (1,679,584) | | |
| Total net realized gain (loss) | | | | 522,293,552 |
| Change in net unrealized appreciation (depreciation) on: | | | | |
| Investment Securities: | | | | |
| Unaffiliated issuers | | 533,996,971 | | |
| Affiliated issuers | | 1 | | |
| Unfunded commitments | | 280,277 | | |
| Assets and liabilities in foreign currencies | | (541) | | |
| Futures contracts | | 1,904,067 | | |
| Total change in net unrealized appreciation (depreciation) | | | | 536,180,775 |
| Net gain (loss) | | | | 1,058,474,327 |
| Net increase (decrease) in net assets resulting from operations | | | $ | 1,117,150,396 |
| Statement of Changes in Net Assets |
| |
| | Year ended July 31, 2024 | | Year ended July 31, 2023 |
| Increase (Decrease) in Net Assets | | | | |
| Operations | | | | |
| Net investment income (loss) | $ | 58,676,069 | $ | 52,688,477 |
| Net realized gain (loss) | | 522,293,552 | | 19,192,336 |
| Change in net unrealized appreciation (depreciation) | | 536,180,775 | | 504,653,297 |
| Net increase (decrease) in net assets resulting from operations | | 1,117,150,396 | | 576,534,110 |
| Distributions to shareholders | | (51,550,987) | | (230,929,095) |
| | | | | |
| Share transactions | | | | |
| Proceeds from sales of shares | | 1,049,687,400 | | 674,296,906 |
| Reinvestment of distributions | | 51,550,987 | | 230,929,095 |
| Cost of shares redeemed | | (1,373,931,544) | | (1,348,316,619) |
| | | | | |
Net increase (decrease) in net assets resulting from share transactions | | (272,693,157) | | (443,090,618) |
| Total increase (decrease) in net assets | | 792,906,252 | | (97,485,603) |
| | | | | |
| Net Assets | | | | |
| Beginning of period | | 4,942,471,794 | | 5,039,957,397 |
| End of period | $ | 5,735,378,046 | $ | 4,942,471,794 |
| | | | | |
| Other Information | | | | |
| Shares | | | | |
| Sold | | 77,896,664 | | 55,711,299 |
| Issued in reinvestment of distributions | | 4,018,606 | | 19,053,605 |
| Redeemed | | (95,509,377) | | (108,966,202) |
| Net increase (decrease) | | (13,594,107) | | (34,201,298) |
| | | | | |
Financial Highlights
Fidelity® Series Small Cap Opportunities Fund |
| |
| Years ended July 31, | | 2024 | | 2023 | | 2022 | | 2021 | | 2020 |
Selected Per-Share Data | | | | | | | | | | |
| Net asset value, beginning of period | $ | 13.47 | $ | 12.57 | $ | 18.08 | $ | 12.66 | $ | 14.04 |
| Income from Investment Operations | | | | | | | | | | |
Net investment income (loss) A,B | | .16 | | .14 | | .12 | | .12 | | .15 |
| Net realized and unrealized gain (loss) | | 2.75 | | 1.36 | | (1.03) | | 5.62 | | (.60) |
| Total from investment operations | | 2.91 | | 1.50 | | (.91) | | 5.74 | | (.45) |
| Distributions from net investment income | | (.14) | | (.14) | | (.12) | | (.14) | | (.16) |
| Distributions from net realized gain | | - | | (.47) | | (4.48) | | (.19) | | (.77) |
| Total distributions | | (.14) | | (.60) C | | (4.60) | | (.32) C | | (.93) |
| Net asset value, end of period | $ | 16.24 | $ | 13.47 | $ | 12.57 | $ | 18.08 | $ | 12.66 |
Total Return D | | | | 12.51% | | (7.62)% | | 45.98% | | (3.44)% |
Ratios to Average Net Assets B,E,F | | | | | | | | | | |
Expenses before reductions G | | -% | | -% | | -% | | -% | | -% |
Expenses net of fee waivers, if any G | | | | -% | | -% | | -% | | -% |
Expenses net of all reductions G | | -% | | -% | | -% | | -% | | -% |
| Net investment income (loss) | | 1.14% | | 1.11% | | .86% | | .77% | | 1.17% |
| Supplemental Data | | | | | | | | | | |
| Net assets, end of period (000 omitted) | $ | 5,735,378 | $ | 4,942,472 | $ | 5,039,957 | $ | 6,012,414 | $ | 4,931,192 |
Portfolio turnover rate H | | | | 34% | | 39% | | 96% | | 61% I |
ACalculated based on average shares outstanding during the period.
BNet investment income (loss) is affected by the timing of the declaration of dividends by any underlying mutual funds or exchange-traded funds (ETFs). Net investment income (loss) of any mutual funds or ETFs is not included in the Fund's net investment income (loss) ratio.
CTotal distributions per share do not sum due to rounding.
DTotal returns would have been lower if certain expenses had not been reduced during the applicable periods shown.
EFees and expenses of any underlying mutual funds or exchange-traded funds (ETFs) are not included in the Fund's expense ratio. The Fund indirectly bears its proportionate share of these expenses. For additional expense information related to investments in Fidelity Central Funds, please refer to the "Investments in Fidelity Central Funds" note found in the Notes to Financial Statements section of the most recent Annual or Semi-Annual report.
FExpense ratios reflect operating expenses of the class. Expenses before reductions do not reflect amounts reimbursed, waived, or reduced through arrangements with the investment adviser, brokerage services, or other offset arrangements, if applicable, and do not represent the amount paid by the class during periods when reimbursements, waivers or reductions occur.
GAmount represents less than .005%.
HAmount does not include the portfolio activity of any underlying mutual funds or exchange-traded funds (ETFs).
IPortfolio turnover rate excludes securities received or delivered in-kind.
Notes to Financial Statements
For the period ended July 31, 2024
1. Organization.
Fidelity Series Small Cap Opportunities Fund (the Fund) is a fund of Fidelity Securities Fund (the Trust) and is authorized to issue an unlimited number of shares. Shares are offered only to certain other Fidelity funds, Fidelity managed 529 plans, and Fidelity managed collective investment trusts. The Trust is registered under the Investment Company Act of 1940, as amended (the 1940 Act), as an open-end management investment company organized as a Massachusetts business trust.
2. Investments in Fidelity Central Funds.
Funds may invest in Fidelity Central Funds, which are open-end investment companies generally available only to other investment companies and accounts managed by the investment adviser and its affiliates. The Schedule of Investments lists any Fidelity Central Funds held as an investment as of period end, but does not include the underlying holdings of each Fidelity Central Fund. An investing fund indirectly bears its proportionate share of the expenses of the underlying Fidelity Central Funds.
Based on its investment objective, each Fidelity Central Fund may invest or participate in various investment vehicles or strategies that are similar to those of the investing fund. These strategies are consistent with the investment objectives of the investing fund and may involve certain economic risks which may cause a decline in value of each of the Fidelity Central Funds and thus a decline in the value of the investing fund.
| Fidelity Central Fund | Investment Manager | Investment Objective | Investment Practices | Expense RatioA |
| Fidelity Money Market Central Funds | Fidelity Management & Research Company LLC (FMR) | Each fund seeks to obtain a high level of current income consistent with the preservation of capital and liquidity. | Short-term Investments | Less than .005% |
A Expenses expressed as a percentage of average net assets and are as of each underlying Central Fund's most recent annual or semi-annual shareholder report.
A complete unaudited list of holdings for each Fidelity Central Fund is available upon request or at the Securities and Exchange Commission website at www.sec.gov. In addition, the financial statements of the Fidelity Central Funds which contain the significant accounting policies (including investment valuation policies) of those funds, and are not covered by the Report of Independent Registered Public Accounting Firm, are available on the Securities and Exchange Commission website or upon request.
3. Significant Accounting Policies.
The Fund is an investment company and applies the accounting and reporting guidance of the Financial Accounting Standards Board (FASB) Accounting Standards Codification Topic 946 Financial Services - Investment Companies. The financial statements have been prepared in conformity with accounting principles generally accepted in the United States of America (GAAP), which require management to make certain estimates and assumptions at the date of the financial statements. Actual results could differ from those estimates. Subsequent events, if any, through the date that the financial statements were issued have been evaluated in the preparation of the financial statements. The Fund's Schedule of Investments lists any underlying mutual funds or exchange-traded funds (ETFs) but does not include the underlying holdings of these funds. The following summarizes the significant accounting policies of the Fund:
Investment Valuation. Investments are valued as of 4:00 p.m. Eastern time on the last calendar day of the period. The Board of Trustees (the Board) has designated the Fund's investment adviser as the valuation designee responsible for the fair valuation function and performing fair value determinations as needed. The investment adviser has established a Fair Value Committee (the Committee) to carry out the day-to-day fair valuation responsibilities and has adopted policies and procedures to govern the fair valuation process and the activities of the Committee. In accordance with these fair valuation policies and procedures, which have been approved by the Board, the Fund attempts to obtain prices from one or more third party pricing services or brokers to value its investments. When current market prices, quotations or currency exchange rates are not readily available or reliable, investments will be fair valued in good faith by the Committee, in accordance with the policies and procedures. Factors used in determining fair value vary by investment type and may include market or investment specific events, transaction data, estimated cash flows, and market observations of comparable investments. The frequency that the fair valuation procedures are used cannot be predicted and they may be utilized to a significant extent. The Committee manages the Fund's fair valuation practices and maintains the fair valuation policies and procedures. The Fund's investment adviser reports to the Board information regarding the fair valuation process and related material matters.
The Fund categorizes the inputs to valuation techniques used to value its investments into a disclosure hierarchy consisting of three levels as shown below:
Level 1 - unadjusted quoted prices in active markets for identical investments
Level 2 - other significant observable inputs (including quoted prices for similar investments, interest rates, prepayment speeds, etc.)
Level 3 - unobservable inputs (including the Fund's own assumptions based on the best information available)
Valuation techniques used to value the Fund's investments by major category are as follows:
Equity securities, including restricted securities, for which market quotations are readily available, are valued at the last reported sale price or official closing price as reported by a third party pricing service on the primary market or exchange on which they are traded and are categorized as Level 1 in the hierarchy. In the event there were no sales during the day or closing prices are not available, securities are valued at the last quoted bid price or may be valued using the last available price and are generally categorized as Level 2 in the hierarchy. For foreign equity securities, when market or security specific events arise, comparisons to the valuation of American Depositary Receipts (ADRs), futures contracts, Exchange-Traded Funds (ETFs) and certain indexes as well as quoted prices for similar securities may be used and would be categorized as Level 2 in the hierarchy. For equity securities, including restricted securities, where observable inputs are limited, assumptions about market activity and risk are used and these securities may be categorized as Level 3 in the hierarchy.
Futures contracts are valued at the settlement price established each day by the board of trade or exchange on which they are traded and are categorized as Level 1 in the hierarchy. Investments in open-end mutual funds, including the Fidelity Central Funds, are valued at their closing net asset value (NAV) each business day and are categorized as Level 1 in the hierarchy.
Changes in valuation techniques may result in transfers in or out of an assigned level within the disclosure hierarchy. The aggregate value of investments by input level as of July 31, 2024 is included at the end of the Fund's Schedule of Investments.
Foreign Currency. Certain Funds may use foreign currency contracts to facilitate transactions in foreign-denominated securities. Gains and losses from these transactions may arise from changes in the value of the foreign currency or if the counterparties do not perform under the contracts' terms.
Foreign-denominated assets, including investment securities, and liabilities are translated into U.S. dollars at the exchange rates at period end. Purchases and sales of investment securities, income and dividends received, and expenses denominated in foreign currencies are translated into U.S. dollars at the exchange rate in effect on the transaction date.
The effects of exchange rate fluctuations on investments are included with the net realized and unrealized gain (loss) on investment securities. Other foreign currency transactions resulting in realized and unrealized gain (loss) are disclosed separately.
Investment Transactions and Income. For financial reporting purposes, the Fund's investment holdings and NAV include trades executed through the end of the last business day of the period. The NAV per share for processing shareholder transactions is calculated as of the close of business of the New York Stock Exchange (NYSE), normally 4:00 p.m. Eastern time and includes trades executed through the end of the prior business day. Gains and losses on securities sold are determined on the basis of identified cost and include proceeds received from litigation. Commissions paid to certain brokers with whom the investment adviser, or its affiliates, places trades on behalf of a fund include an amount in addition to trade execution, which may be rebated back to a fund. Any such rebates are included in net realized gain (loss) on investments in the Statement of Operations. Dividend income is recorded on the ex-dividend date, except for certain dividends from foreign securities where the ex-dividend date may have passed, which are recorded as soon as the Fund is informed of the ex-dividend date. Non-cash dividends included in dividend income, if any, are recorded at the fair market value of the securities received. Income and capital gain distributions from Fidelity Central Funds, if any, are recorded on the ex-dividend date. Certain distributions received by the Fund represent a return of capital or capital gain. The Fund determines the components of these distributions subsequent to the ex-dividend date, based upon receipt of tax filings or other correspondence relating to the underlying investment. These distributions are recorded as a reduction of cost of investments and/or as a realized gain. Interest income is accrued as earned and includes coupon interest and amortization of premium and accretion of discount on debt securities as applicable. Investment income is recorded net of foreign taxes withheld where recovery of such taxes is uncertain.
Expenses. Expenses directly attributable to a fund are charged to that fund. Expenses attributable to more than one fund are allocated among the respective funds on the basis of relative net assets or other appropriate methods. Expenses included in the accompanying financial statements reflect the expenses of that fund and do not include any expenses associated with any underlying mutual funds or exchange-traded funds. Although not included in a fund's expenses, a fund indirectly bears its proportionate share of these expenses through the net asset value of each underlying mutual fund or exchange-traded fund. Expense estimates are accrued in the period to which they relate and adjustments are made when actual amounts are known.
Income Tax Information and Distributions to Shareholders. Each year, the Fund intends to qualify as a regulated investment company under Subchapter M of the Internal Revenue Code, including distributing substantially all of its taxable income and realized gains. As a result, no provision for U.S. Federal income taxes is required. As of July 31, 2024, the Fund did not have any unrecognized tax benefits in the financial statements; nor is the Fund aware of any tax positions for which it is reasonably possible that the total amounts of unrecognized tax benefits will significantly change in the next twelve months. The Fund files a U.S. federal tax return, in addition to state and local tax returns as required. The Fund's federal income tax returns are subject to examination by the Internal Revenue Service (IRS) for a period of three fiscal years after they are filed. State and local tax returns may be subject to examination for an additional fiscal year depending on the jurisdiction. Foreign taxes are provided for based on the Fund's understanding of the tax rules and rates that exist in the foreign markets in which it invests.
Distributions are declared and recorded on the ex-dividend date. Income and capital gain distributions are determined in accordance with income tax regulations, which may differ from GAAP. In addition, the Fund claimed a portion of the payment made to redeeming shareholders as a distribution for income tax purposes.
Capital accounts within the financial statements are adjusted for permanent book-tax differences. These adjustments have no impact on net assets or the results of operations. Capital accounts are not adjusted for temporary book-tax differences which will reverse in a subsequent period.
Book-tax differences are primarily due to primarily due to futures contracts, foreign currency transactions, partnerships, passive foreign investment companies (PFIC), capital loss carryforwards and losses deferred due to wash sales.
As of period end, the cost and unrealized appreciation (depreciation) in securities, and derivatives if applicable, for federal income tax purposes were as follows:
| Gross unrealized appreciation | $1,940,836,852 |
| Gross unrealized depreciation | (215,296,935) |
| Net unrealized appreciation (depreciation) | $1,725,539,917 |
| Tax Cost | $4,324,125,137 |
The tax-based components of distributable earnings as of period end were as follows:
| Undistributed ordinary income | $77,060,079 |
| Undistributed long-term capital gain | $336,807,589 |
| Net unrealized appreciation (depreciation) on securities and other investments | $1,725,521,991 |
The tax character of distributions paid was as follows:
| | July 31, 2024 | July 31, 2023 |
| Ordinary Income | $51,550,987 | $52,416,681 |
| Long-term Capital Gains | - | 178,512,414 |
| Total | $51,550,987 | $230,929,095 |
Restricted Securities (including Private Placements). Funds may invest in securities that are subject to legal or contractual restrictions on resale. These securities generally may be resold in transactions exempt from registration or to the public if the securities are registered. Disposal of these securities may involve time-consuming negotiations and expense, and prompt sale at an acceptable price may be difficult. Information regarding restricted securities held at period end is included at the end of the Schedule of Investments, if applicable.
4. Derivative Instruments.
Risk Exposures and the Use of Derivative Instruments. The Fund's investment objectives allow for various types of derivative instruments, including futures contracts. Derivatives are investments whose value is primarily derived from underlying assets, indices or reference rates and may be transacted on an exchange or over-the-counter (OTC). Derivatives may involve a future commitment to buy or sell a specified asset based on specified terms, to exchange future cash flows at periodic intervals based on a notional principal amount, or for one party to make one or more payments upon the occurrence of specified events in exchange for periodic payments from the other party.
Derivatives were used to increase returns and to manage exposure to certain risks as defined below. The success of any strategy involving derivatives depends on analysis of numerous economic factors, and if the strategies for investment do not work as intended, the objectives may not be achieved.
Derivatives were used to increase or decrease exposure to the following risk(s):
| | |
| Equity Risk | Equity risk relates to the fluctuations in the value of financial instruments as a result of changes in market prices (other than those arising from interest rate risk or foreign exchange risk), whether caused by factors specific to an individual investment, its issuer, or all factors affecting all instruments traded in a market or market segment. |
Funds are also exposed to additional risks from investing in derivatives, such as liquidity risk and counterparty credit risk. Liquidity risk is the risk that a fund will be unable to close out the derivative in the open market in a timely manner. Counterparty credit risk is the risk that the counterparty will not be able to fulfill its obligation to a fund. Counterparty credit risk related to exchange-traded contracts may be mitigated by the protection provided by the exchange on which they trade.
Investing in derivatives may involve greater risks than investing in the underlying assets directly and, to varying degrees, may involve risk of loss in excess of any initial investment and collateral received and amounts recognized in the Statement of Assets and Liabilities. In addition, there may be the risk that the change in value of the derivative contract does not correspond to the change in value of the underlying instrument.
Futures Contracts. A futures contract is an agreement between two parties to buy or sell a specified underlying instrument for a fixed price at a specified future date. Futures contracts were used to manage exposure to the stock market.
Upon entering into a futures contract, a fund is required to deposit either cash or securities (initial margin) with a clearing broker in an amount equal to a certain percentage of the face value of the contract. Futures contracts are marked-to-market daily and subsequent daily payments are made or received by a fund depending on the daily fluctuations in the value of the futures contracts and are recorded as unrealized appreciation or (depreciation). This receivable and/or payable, if any, is included in daily variation margin on futures contracts in the Statement of Assets and Liabilities. Realized gain or (loss) is recorded upon the expiration or closing of a futures contract. The net realized gain (loss) and change in net unrealized appreciation (depreciation) on futures contracts during the period is presented in the Statement of Operations.
Any open futures contracts at period end are presented in the Schedule of Investments under the caption "Futures Contracts". The notional amount at value reflects each contract's exposure to the underlying instrument or index at period end, and is representative of volume of activity during the period unless an average notional amount is presented. Any securities deposited to meet initial margin requirements are identified in the Schedule of Investments. Any cash deposited to meet initial margin requirements is presented as segregated cash with brokers for derivative instruments in the Statement of Assets and Liabilities.
5. Purchases and Sales of Investments.
Purchases and sales of securities, other than short-term securities and in-kind transactions, as applicable, are noted in the table below.
| | Purchases ($) | Sales ($) |
| Fidelity Series Small Cap Opportunities Fund | 2,379,653,937 | 2,611,641,774 |
6. Fees and Other Transactions with Affiliates.
Management Fee. Fidelity Management & Research Company LLC (the investment adviser) and its affiliates provide the Fund with investment management related services for which the Fund does not pay a management fee. Under the management contract, the investment adviser or an affiliate pays all ordinary operating expenses of the Fund, except custody fees, fees and expenses of the independent Trustees, and certain miscellaneous expenses such as proxy and shareholder meeting expenses.
Brokerage Commissions. A portion of portfolio transactions were placed with brokerage firms which are affiliates of the investment adviser. Brokerage commissions are included in net realized gain (loss) and change in net unrealized appreciation (depreciation) in the Statement of Operations. The commissions paid to these affiliated firms were as follows:
| | Amount ($) |
| Fidelity Series Small Cap Opportunities Fund | 55,287 |
Interfund Lending Program. Pursuant to an Exemptive Order issued by the Securities and Exchange Commission (the SEC), the Fund, along with other registered investment companies having management contracts with Fidelity Management & Research Company LLC (FMR), or other affiliated entities of FMR, may participate in an interfund lending program. This program provides an alternative credit facility allowing the Fund to borrow from, or lend money to, other participating affiliated funds. At period end, there were no interfund loans outstanding. Activity in this program during the period for which loans were outstanding was as follows:
| | Borrower or Lender | Average Loan Balance ($) | Weighted Average Interest Rate | Interest Expense ($) |
Fidelity Series Small Cap Opportunities Fund | Borrower | 12,163,000 | 5.59% | 1,887 |
Interfund Trades. Funds may purchase from or sell securities to other Fidelity Funds under procedures adopted by the Board. The procedures have been designed to ensure these interfund trades are executed in accordance with Rule 17a-7 of the 1940 Act. Any interfund trades are included within the respective purchases and sales amounts shown in the Purchases and Sales of Investments note. Interfund trades during the period are noted in the table below.
| | Purchases ($) | Sales ($) | Realized Gain (Loss) ($) |
| Fidelity Series Small Cap Opportunities Fund | 120,946,422 | 260,840,912 | 53,176,256 |
Sub-Advisory Arrangements. Effective March 1, 2024, the Fund's sub-advisory agreements with FMR Investment Management (UK) Limited, Fidelity Management & Research (Hong Kong) Limited, and Fidelity Management & Research (Japan) Limited were amended to provide that the investment adviser pays each sub-adviser monthly fees equal to 110% of the sub-adviser's costs for providing sub-advisory services.
7. Committed Line of Credit.
Certain Funds participate with other funds managed by the investment adviser or an affiliate in a $4.25 billion credit facility (the "line of credit") to be utilized for temporary or emergency purposes to fund shareholder redemptions or for other short-term liquidity purposes. The commitment fees on the pro-rata portion of the line of credit are borne by the investment adviser. During the period, there were no borrowings on this line of credit.
8. Security Lending.
Funds lend portfolio securities from time to time in order to earn additional income. Lending agents are used, including National Financial Services (NFS), an affiliate of the investment adviser. Pursuant to a securities lending agreement, NFS will receive a fee, which is capped at 9.9% of a fund's daily lending revenue, for its services as lending agent. A fund may lend securities to certain qualified borrowers, including NFS. On the settlement date of the loan, a fund receives collateral (in the form of U.S. Treasury obligations, letters of credit and/or cash) against the loaned securities and maintains collateral in an amount not less than 100% of the market value of the loaned securities during the period of the loan. The market value of the loaned securities is determined at the close of business of a fund and any additional required collateral is delivered to a fund on the next business day. A fund or borrower may terminate the loan at any time, and if the borrower defaults on its obligation to return the securities loaned because of insolvency or other reasons, a fund may apply collateral received from the borrower against the obligation. A fund may experience delays and costs in recovering the securities loaned. Any cash collateral received is invested in the Fidelity Securities Lending Cash Central Fund. Any loaned securities are identified as such in the Schedule of Investments, and the value of loaned securities and cash collateral at period end, as applicable, are presented in the Statement of Assets and Liabilities. Security lending income represents the income earned on investing cash collateral, less rebates paid to borrowers and any lending agent fees associated with the loan, plus any premium payments received for lending certain types of securities. Security lending income is presented in the Statement of Operations as a component of income from Fidelity Central Funds. Affiliated security lending activity, if any, was as follows:
| | Total Security Lending Fees Paid to NFS ($) | Security Lending Income From Securities Loaned to NFS ($) | Value of Securities Loaned to NFS at Period End ($) |
| Fidelity Series Small Cap Opportunities Fund | 67,841 | 7,223 | - |
9. Other.
A fund's organizational documents provide former and current trustees and officers with a limited indemnification against liabilities arising in connection with the performance of their duties to the fund. In the normal course of business, a fund may also enter into contracts that provide general indemnifications. A fund's maximum exposure under these arrangements is unknown as this would be dependent on future claims that may be made against a fund. The risk of material loss from such claims is considered remote.
At the end of the period, mutual funds and accounts managed by the investment adviser or its affiliates were the owners of record of all of the outstanding shares of the Fund.
10. Risk and Uncertainties.
Many factors affect a fund's performance. Developments that disrupt global economies and financial markets, such as pandemics, epidemics, outbreaks of infectious diseases, war, terrorism, and environmental disasters, may significantly affect a fund's investment performance. The effects of these developments to a fund will be impacted by the types of securities in which a fund invests, the financial condition, industry, economic sector, and geographic location of an issuer, and a fund's level of investment in the securities of that issuer. Significant concentrations in security types, issuers, industries, sectors, and geographic locations may magnify the factors that affect a fund's performance.
Report of Independent Registered Public Accounting Firm
To the Board of Trustees of Fidelity Securities Fund and the Shareholders of Fidelity Series Small Cap Opportunities Fund:
Opinion on the Financial Statements and Financial Highlights
We have audited the accompanying statement of assets and liabilities of Fidelity Series Small Cap Opportunities Fund (the "Fund"), a fund of Fidelity Securities Fund, including the schedule of investments, as of July 31, 2024, the related statement of operations for the year then ended, the statement of changes in net assets for each of the two years in the period then ended, the financial highlights for each of the five years in the period then ended, and the related notes. In our opinion, the financial statements and financial highlights present fairly, in all material respects, the financial position of the Fund as of July 31, 2024, and the results of its operations for the year then ended, the changes in its net assets for each of the two years in the period then ended, and the financial highlights for each of the five years in the period then ended in conformity with accounting principles generally accepted in the United States of America.
Basis for Opinion
These financial statements and financial highlights are the responsibility of the Fund's management. Our responsibility is to express an opinion on the Fund's financial statements and financial highlights based on our audits. We are a public accounting firm registered with the Public Company Accounting Oversight Board (United States) (PCAOB) and are required to be independent with respect to the Fund in accordance with the U.S. federal securities laws and the applicable rules and regulations of the Securities and Exchange Commission and the PCAOB.
We conducted our audits in accordance with the standards of the PCAOB. Those standards require that we plan and perform the audit to obtain reasonable assurance about whether the financial statements and financial highlights are free of material misstatement, whether due to error or fraud. The Fund is not required to have, nor were we engaged to perform, an audit of its internal control over financial reporting. As part of our audits, we are required to obtain an understanding of internal control over financial reporting but not for the purpose of expressing an opinion on the effectiveness of the Fund's internal control over financial reporting. Accordingly, we express no such opinion.
Our audits included performing procedures to assess the risks of material misstatement of the financial statements and financial highlights, whether due to error or fraud, and performing procedures that respond to those risks. Such procedures included examining, on a test basis, evidence regarding the amounts and disclosures in the financial statements and financial highlights. Our audits also included evaluating the accounting principles used and significant estimates made by management, as well as evaluating the overall presentation of the financial statements and financial highlights. Our procedures included confirmation of securities owned as of July 31, 2024, by correspondence with the custodian and brokers; when replies were not received from brokers, we performed other auditing procedures. We believe that our audits provide a reasonable basis for our opinion.
/s/ Deloitte & Touche LLP
Boston, Massachusetts
September 16, 2024
We have served as the auditor of one or more of the Fidelity investment companies since 1999.
Distributions
(Unaudited)
The dividend and capital gains distributions for the fund(s) are available on Fidelity.com or Institutional.Fidelity.com.
The fund hereby designates as a capital gain dividend with respect to the taxable year ended July 31, 2024, $354,691,846, or, if subsequently determined to be different, the net capital gain of such year.
The fund designates $3,908,768 of distributions paid during the fiscal year ended 2024 as qualifying to be taxed as section 163(j) interest dividends.
The fund designates 68%, and 56% of the dividends distributed in September and December, respectively during the fiscal year as qualifying for the dividends-received deduction for corporate shareholders.
The fund designates 69.62%, and 71.72% of the dividends distributed in September and December, respectively during the fiscal year as amounts which may be taken into account as a dividend for the purposes of the maximum rate under section 1(h)(11) of the Internal Revenue Code.
The fund designates 15.58%, and 10.38% of the dividends distributed in September and December, respectively during the fiscal year as a section 199A dividend.
The fund will notify shareholders in January 2025 of amounts for use in preparing 2024 income tax returns.
Item 8: Changes in and Disagreements with Accountants for Open-End Management Investment Companies
Note: This is not applicable for any fund included in this document.
Item 9: Proxy Disclosures for Open-End Management Investment Companies
| A special meeting of shareholders was held on July 16, 2024. The results of votes taken among shareholders on the proposal before them are reported below. Each vote reported represents one dollar of net asset value held on the record date for the meeting. |
| Proposal 1 |
| To elect a Board of Trustees. |
| | # of Votes | % of Votes |
| Bettina Doulton |
| Affirmative | 88,756,759,992.17 | 95.11 |
| Withheld | 4,564,750,651.52 | 4.89 |
| TOTAL | 93,321,510,643.68 | 100.00 |
| Robert A. Lawrence |
| Affirmative | 88,523,438,331.98 | 94.86 |
| Withheld | 4,798,072,311.70 | 5.14 |
| TOTAL | 93,321,510,643.68 | 100.00 |
| Vijay C. Advani |
| Affirmative | 88,484,371,668.51 | 94.82 |
| Withheld | 4,837,138,975.17 | 5.18 |
| TOTAL | 93,321,510,643.68 | 100.00 |
| Thomas P. Bostick |
| Affirmative | 88,618,596,648.21 | 94.96 |
| Withheld | 4,702,913,995.47 | 5.04 |
| TOTAL | 93,321,510,643.68 | 100.00 |
| Donald F. Donahue |
| Affirmative | 88,542,403,002.79 | 94.88 |
| Withheld | 4,779,107,640.89 | 5.12 |
| TOTAL | 93,321,510,643.68 | 100.00 |
| Vicki L. Fuller |
| Affirmative | 88,788,711,037.44 | 95.14 |
| Withheld | 4,532,799,606.24 | 4.86 |
| TOTAL | 93,321,510,643.68 | 100.00 |
| Patricia L. Kampling |
| Affirmative | 88,819,315,996.59 | 95.18 |
| Withheld | 4,502,194,647.10 | 4.82 |
| TOTAL | 93,321,510,643.68 | 100.00 |
| Thomas A. Kennedy |
| Affirmative | 88,667,457,817.34 | 95.01 |
| Withheld | 4,654,052,826.34 | 4.99 |
| TOTAL | 93,321,510,643.68 | 100.00 |
| Oscar Munoz |
| Affirmative | 88,183,976,568.30 | 94.49 |
| Withheld | 5,137,534,075.39 | 5.51 |
| TOTAL | 93,321,510,643.68 | 100.00 |
| Karen B. Peetz |
| Affirmative | 88,720,160,318.58 | 95.07 |
| Withheld | 4,601,350,325.11 | 4.93 |
| TOTAL | 93,321,510,643.68 | 100.00 |
| David M. Thomas |
| Affirmative | 88,471,490,747.86 | 94.80 |
| Withheld | 4,850,019,895.82 | 5.20 |
| TOTAL | 93,321,510,643.68 | 100.00 |
| Susan Tomasky |
| Affirmative | 88,536,869,646.78 | 94.87 |
| Withheld | 4,784,640,996.90 | 5.13 |
| TOTAL | 93,321,510,643.68 | 100.00 |
| Michael E. Wiley |
| Affirmative | 88,526,906,267.86 | 94.86 |
| Withheld | 4,794,604,375.83 | 5.14 |
| TOTAL | 93,321,510,643.68 | 100.00 |
| | | |
| Proposal 1 reflects trust-wide proposal and voting results. |
Item 10: Remuneration Paid to Directors, Officers, and others of Open-End Management Investment Companies
Note: This information is disclosed as part of the financial statements for each Fund as part of Item 7: Financial Statements and Financial Highlights for Open-End Management Investment companies.
Item 11: Statement Regarding Basis for Approval of Investment Advisory Contract
Board Approval of Investment Advisory Contracts and Management Fees
Fidelity Series Small Cap Opportunities Fund
Each year, the Board of Trustees, including the Independent Trustees (together, the Board), considers the renewal of the fund's management contract with Fidelity Management & Research Company LLC (FMR) and the sub-advisory agreements (together, the Advisory Contracts) for the fund. FMR and the sub-advisers are referred to herein as the Investment Advisers. The Board, assisted by the advice of fund counsel and Independent Trustees' counsel, requests and considers a broad range of information relevant to the renewal of the Advisory Contracts throughout the year.
The Board meets regularly and, at each of its meetings, covers an extensive agenda of topics and materials and considers factors that are relevant to its annual consideration of the renewal of the fund's Advisory Contracts, including the services and support provided to the fund and its shareholders. The Board, acting directly and through its Committees (each of which is composed of and chaired by Independent Trustees), requests and receives information concerning the annual consideration of the renewal of the fund's Advisory Contracts. The Board also meets as needed to review matters specifically related to the Board's annual consideration of the renewal of the Advisory Contracts. Members of the Board may also meet with trustees of other Fidelity funds through joint ad hoc committees to discuss certain matters relevant to all of the Fidelity funds.
At its May 2024 meeting, the Board unanimously determined to renew the fund's Advisory Contracts. The Board considered all factors it believed relevant and reached a determination, with the assistance of fund counsel and Independent Trustees' counsel and through the exercise of its business judgment, that the renewal of the Advisory Contracts was in the best interests of the fund and its shareholders and the fact that no fee is payable under the management contract was fair and reasonable in light of all of the surrounding circumstances.
Nature, Extent, and Quality of Services Provided. The Board considered staffing as it relates to the fund, including the backgrounds and experience of investment personnel of the Investment Advisers, and also considered the Investment Advisers' implementation of the fund's investment program. The Independent Trustees also had discussions with senior management of Fidelity's investment operations and investment groups. The Board considered the structure of the investment personnel compensation program and whether this structure provides appropriate incentives to act in the best interests of the fund.
Resources Dedicated to Investment Management and Support Services. The Board and the Fund Oversight and Research Committees reviewed the general qualifications and capabilities of Fidelity's investment staff, including its size, education, experience, and resources, as well as Fidelity's approach to recruiting, training, managing, and compensating investment personnel. The Board noted the resources devoted to expansion of Fidelity's global investment organization, and that Fidelity's analysts have extensive resources, tools, and capabilities that allow them to conduct sophisticated quantitative and fundamental analysis, as well as credit analysis of issuers, counterparties, and guarantors. Further, the Board considered that Fidelity's investment professionals have sufficient access to global information and data so as to provide competitive investment results over time, and that those professionals also have access to sophisticated tools that permit them to assess portfolio construction and risk and performance attribution characteristics continuously, as well as to transmit new information and research conclusions rapidly around the world. Additionally, in its deliberations, the Board considered Fidelity's trading, risk management, compliance, and technology and operations capabilities and resources, which are integral parts of the investment management process.
Administrative Services. The Board considered (i) the nature, extent, quality, and cost of advisory and administrative services performed by the Investment Advisers and their affiliates under the Advisory Contracts and under separate agreements covering transfer agency and pricing and bookkeeping services for the fund; (ii) the nature and extent of Fidelity's supervision of third party service providers, principally custodians, subcustodians, and pricing vendors; and (iii) the resources devoted by Fidelity to, and the record of compliance with, the fund's compliance policies and procedures. The Board also reviewed the allocation of fund brokerage, including allocations to brokers affiliated with the Investment Advisers, the use of brokerage commissions to pay fund expenses, and the use of "soft" commission dollars to pay for research services. The Board also considered the fund's securities lending activities and any payments made to Fidelity relating to securities lending under a separate agreement.
Investment Performance. The Board reviewed the fund's absolute investment performance, as well as the fund's relative investment performance, and noted that the fund is not publicly offered as a stand-alone investment product. In this regard, the Board noted that the fund is designed to offer an investment option for other investment companies, 529 plans, and collective investment trusts managed by Fidelity and ultimately to enhance the performance of those investment companies, 529 plans, and collective investment trusts.
Based on its review, the Board concluded that the nature, extent, and quality of services provided to the fund under the Advisory Contracts should continue to benefit the shareholders of the fund.
Competitiveness of Management Fee and Total Expense Ratio. The Board considered that the fund does not pay FMR a management fee for investment advisory services, but that FMR receives fees for providing services to funds that invest in the fund. The Board noted that FMR or an affiliate undertakes to pay all operating expenses of the fund, except transfer agent fees, 12b-1 fees, Independent Trustee fees and expenses, custodian fees and expenses, proxy and shareholder meeting expenses, interest, taxes, and extraordinary expenses (such as litigation expenses). The Board further noted that the fund pays its non-operating expenses, including brokerage commissions and fees and expenses associated with the fund's securities lending program, if applicable.
The Board further considered that FMR has contractually agreed to reimburse the fund to the extent that total operating expenses, with certain exceptions, as a percentage of its average net assets, exceed 0.003% through November 30, 2026.
Based on its review, the Board considered that the fund does not pay a management fee and concluded that the total expense ratio of the fund was reasonable in light of the services that the fund and its shareholders receive and the other factors considered.
Costs of the Services and Profitability. The Board considered the level of Fidelity's profits in respect of all the Fidelity funds.
A public accounting firm has been engaged annually by the Board as part of the Board's assessment of Fidelity's profitability analysis. The engagement includes the review and assessment of the methodologies used by Fidelity in determining the revenues and expenses attributable to Fidelity's fund business, and completion of agreed-upon procedures in respect of the mathematical accuracy of certain fund profitability information and its conformity to established allocation methodologies. After considering the reports issued under the engagement and information provided by Fidelity, the Board concluded that while other allocation methods may also be reasonable, Fidelity's profitability methodologies are reasonable in all material respects.
The Board also reviewed Fidelity's non-fund businesses and potential indirect benefits such businesses may have received as a result of their association with Fidelity's fund business (i.e., fall-out benefits) as well as cases where Fidelity's affiliates may benefit from the funds' business. The Board considered areas where potential indirect benefits to the Fidelity funds from their relationships with Fidelity may exist. The Board's consideration of these matters was informed by the findings of a joint ad hoc committee created by it and the boards of other Fidelity funds to evaluate potential fall-out benefits.
The Board concluded that the costs of the services provided by and the profits realized by Fidelity in connection with the operation of the fund were not relevant to the renewal of the Advisory Contracts because the fund pays no advisory fees and FMR bears all expenses of the fund with certain exceptions.
Economies of Scale. The Board concluded that because the fund pays no advisory fees and FMR bears all expenses of the fund with certain exceptions, the realization of economies of scale was not a material factor in the Board's decision to renew the fund's Advisory Contracts.
Additional Information Requested by the Board. In order to develop fully the factual basis for consideration of the Fidelity funds' advisory contracts, the Board requested and received additional information on certain topics, including but not limited to: (i) fund flow and performance trends, in particular the underperformance of certain funds and strategies, and Fidelity's long-term strategies for certain funds; (ii) the operation of performance fees and the rationale for implementing performance fees on certain categories of funds but not others; (iii) Fidelity's pricing philosophy compared to competitors; (iv) fund profitability methodology and data; (v) evaluation of competitive fund data and peer group classifications and fee and expense comparisons; (vi) the management fee and expense structures for different funds and classes and information about the differences between various fee and expense structures; (vii) the variable management fee implemented for certain funds effective March 1, 2024; and (viii) information regarding other accounts managed by Fidelity and the funds' sub-advisory arrangements.
Conclusion. Based on its evaluation of all of the conclusions noted above, and after considering all factors it believed relevant, the Board, including the Independent Trustees, concluded that the advisory and sub-advisory fee arrangements are fair and reasonable in light of all of the surrounding circumstances and that the fund's Advisory Contracts should be renewed through May 31, 2025.
1.839807.117
SMO-ANN-0924
Fidelity® Blue Chip Value Fund
Annual Report
July 31, 2024
Contents
To view a fund's proxy voting guidelines and proxy voting record for the 12-month period ended June 30, visit http://www.fidelity.com/proxyvotingresults or visit the Securities and Exchange Commission's (SEC) web site at http://www.sec.gov.
You may also call 1-800-544-8544 to request a free copy of the proxy voting guidelines.
Standard & Poor's, S&P and S&P 500 are registered service marks of The McGraw-Hill Companies, Inc. and have been licensed for use by Fidelity Distributors Corporation.
Other third-party marks appearing herein are the property of their respective owners.
All other marks appearing herein are registered or unregistered trademarks or service marks of FMR LLC or an affiliated company. © 2024 FMR LLC. All rights reserved.
This report and the financial statements contained herein are submitted for the general information of the shareholders of the Fund. This report is not authorized for distribution to prospective investors in the Fund unless preceded or accompanied by an effective prospectus.
A fund files its complete schedule of portfolio holdings with the SEC for the first and third quarters of each fiscal year on Form N-PORT. Forms N-PORT are available on the SEC's web site at http://www.sec.gov. A fund's Forms N-PORT may be reviewed and copied at the SEC's Public Reference Room in Washington, DC. Information regarding the operation of the SEC's Public Reference Room may be obtained by calling 1-800-SEC-0330.
For a complete list of a fund's portfolio holdings, view the most recent holdings listing, semiannual report, or annual report on Fidelity's web site at http://www.fidelity.com, http://www.institutional.fidelity.com, or http://www.401k.com, as applicable.
NOT FDIC INSURED •MAY LOSE VALUE •NO BANK GUARANTEE
Neither the Fund nor Fidelity Distributors Corporation is a bank.
Item 7: Financial Statements and Financial Highlights for Open-End Management Investment Companies (Annual Report)
Fidelity® Blue Chip Value Fund
Schedule of Investments July 31, 2024
Showing Percentage of Net Assets
| Common Stocks - 95.1% |
| | | Shares | Value ($) |
| COMMUNICATION SERVICES - 8.1% | | | |
| Entertainment - 3.3% | | | |
| The Walt Disney Co. | | 265,000 | 24,827,850 |
| Media - 4.8% | | | |
| Comcast Corp. Class A | | 854,100 | 35,248,707 |
TOTAL COMMUNICATION SERVICES | | | 60,076,557 |
| CONSUMER DISCRETIONARY - 4.8% | | | |
| Diversified Consumer Services - 4.8% | | | |
| H&R Block, Inc. | | 617,420 | 35,773,315 |
| CONSUMER STAPLES - 7.8% | | | |
| Beverages - 1.6% | | | |
| Keurig Dr. Pepper, Inc. | | 350,100 | 12,001,428 |
| Food Products - 3.1% | | | |
| Mondelez International, Inc. | | 165,700 | 11,325,595 |
| Tyson Foods, Inc. Class A | | 185,700 | 11,309,130 |
| | | | 22,634,725 |
| Personal Care Products - 3.1% | | | |
| Kenvue, Inc. | | 1,250,100 | 23,114,349 |
TOTAL CONSUMER STAPLES | | | 57,750,502 |
| ENERGY - 10.4% | | | |
| Oil, Gas & Consumable Fuels - 10.4% | | | |
| Exxon Mobil Corp. | | 261,300 | 30,987,567 |
| Parex Resources, Inc. | | 1,053,900 | 15,808,691 |
| Shell PLC ADR | | 417,900 | 30,598,638 |
| | | | 77,394,896 |
| FINANCIALS - 22.4% | | | |
| Banks - 16.4% | | | |
| Bank of America Corp. | | 772,500 | 31,139,475 |
| JPMorgan Chase & Co. | | 192,300 | 40,921,440 |
| PNC Financial Services Group, Inc. | | 91,500 | 16,570,650 |
| U.S. Bancorp | | 385,000 | 17,278,800 |
| Wells Fargo & Co. | | 277,100 | 16,443,114 |
| | | | 122,353,479 |
| Insurance - 6.0% | | | |
| Chubb Ltd. | | 84,800 | 23,375,968 |
| The Travelers Companies, Inc. | | 98,600 | 21,340,984 |
| | | | 44,716,952 |
TOTAL FINANCIALS | | | 167,070,431 |
| HEALTH CARE - 18.4% | | | |
| Health Care Providers & Services - 16.5% | | | |
| Centene Corp. (a) | | 418,000 | 32,152,560 |
| Cigna Group | | 108,800 | 37,935,296 |
| Elevance Health, Inc. | | 19,000 | 10,108,570 |
| UnitedHealth Group, Inc. | | 73,700 | 42,462,992 |
| | | | 122,659,418 |
| Pharmaceuticals - 1.9% | | | |
| AstraZeneca PLC sponsored ADR | | 179,167 | 14,181,068 |
TOTAL HEALTH CARE | | | 136,840,486 |
| INDUSTRIALS - 7.7% | | | |
| Air Freight & Logistics - 1.1% | | | |
| FedEx Corp. | | 27,000 | 8,160,750 |
| Building Products - 1.0% | | | |
| Johnson Controls International PLC | | 105,700 | 7,561,778 |
| Electrical Equipment - 0.9% | | | |
| Regal Rexnord Corp. | | 43,000 | 6,909,240 |
| Industrial Conglomerates - 1.9% | | | |
| Siemens AG | | 77,800 | 14,244,955 |
| Machinery - 2.8% | | | |
| Deere & Co. | | 54,900 | 20,421,702 |
TOTAL INDUSTRIALS | | | 57,298,425 |
| INFORMATION TECHNOLOGY - 6.6% | | | |
| IT Services - 3.1% | | | |
| Amdocs Ltd. | | 266,700 | 23,328,249 |
| Software - 3.5% | | | |
| Gen Digital, Inc. | | 995,000 | 25,860,050 |
TOTAL INFORMATION TECHNOLOGY | | | 49,188,299 |
| MATERIALS - 1.8% | | | |
| Chemicals - 1.8% | | | |
| CF Industries Holdings, Inc. | | 90,400 | 6,905,656 |
| Nutrien Ltd. | | 133,600 | 6,840,320 |
| | | | 13,745,976 |
| UTILITIES - 7.1% | | | |
| Electric Utilities - 5.6% | | | |
| Edison International | | 209,600 | 16,770,096 |
| PG&E Corp. | | 1,353,600 | 24,703,200 |
| | | | 41,473,296 |
| Independent Power and Renewable Electricity Producers - 1.5% | | | |
| The AES Corp. | | 622,700 | 11,077,833 |
TOTAL UTILITIES | | | 52,551,129 |
| TOTAL COMMON STOCKS (Cost $551,886,621) | | | 707,690,016 |
| | | | |
| Nonconvertible Preferred Stocks - 3.4% |
| | | Shares | Value ($) |
| INFORMATION TECHNOLOGY - 3.4% | | | |
| Technology Hardware, Storage & Peripherals - 3.4% | | | |
Samsung Electronics Co. Ltd. (Cost $23,044,773) | | 538,420 | 25,510,084 |
| | | | |
| Money Market Funds - 1.4% |
| | | Shares | Value ($) |
Fidelity Cash Central Fund 5.39% (b) (Cost $10,247,856) | | 10,245,807 | 10,247,856 |
| | | | |
| TOTAL INVESTMENT IN SECURITIES - 99.9% (Cost $585,179,250) | 743,447,956 |
NET OTHER ASSETS (LIABILITIES) - 0.1% | 381,996 |
| NET ASSETS - 100.0% | 743,829,952 |
| | |
Legend
| (b) | Affiliated fund that is generally available only to investment companies and other accounts managed by Fidelity Investments. The rate quoted is the annualized seven-day yield of the fund at period end. A complete unaudited listing of the fund's holdings as of its most recent quarter end is available upon request. In addition, each Fidelity Central Fund's financial statements, which are not covered by the Fund's Report of Independent Registered Public Accounting Firm, are available on the SEC's website or upon request. |
Affiliated Central Funds
Fiscal year to date information regarding the Fund's investments in Fidelity Central Funds, including the ownership percentage, is presented below.
| Affiliate | Value, beginning of period ($) | Purchases ($) | Sales Proceeds ($) | Dividend Income ($) | Realized Gain (loss) ($) | Change in Unrealized appreciation (depreciation) ($) | Value, end of period ($) | % ownership, end of period |
| Fidelity Cash Central Fund 5.39% | 14,455,664 | 362,929,282 | 367,138,166 | 840,722 | 1,076 | - | 10,247,856 | 0.0% |
| Fidelity Securities Lending Cash Central Fund 5.39% | 11,310,750 | 93,166,316 | 104,477,066 | 34,954 | - | - | - | 0.0% |
| Total | 25,766,414 | 456,095,598 | 471,615,232 | 875,676 | 1,076 | - | 10,247,856 | |
| | | | | | | | | |
Amounts in the dividend income column in the above table include any capital gain distributions from underlying funds, which are presented in the corresponding line item in the Statement of Operations, if applicable.
Amounts in the dividend income column for Fidelity Securities Lending Cash Central Fund represents the income earned on investing cash collateral, less rebates paid to borrowers and any lending agent fees associated with the loan, plus any premium payments received for lending certain types of securities.
Amounts included in the purchases and sales proceeds columns may include in-kind transactions, if applicable.
Investment Valuation
The following is a summary of the inputs used, as of July 31, 2024, involving the Fund's assets and liabilities carried at fair value. The inputs or methodology used for valuing securities may not be an indication of the risk associated with investing in those securities. For more information on valuation inputs, and their aggregation into the levels used below, please refer to the Investment Valuation section in the accompanying Notes to Financial Statements.
| Valuation Inputs at Reporting Date: |
| Description | Total ($) | Level 1 ($) | Level 2 ($) | Level 3 ($) |
Investments in Securities: | | | | |
|
| Equities: | | | | |
Communication Services | 60,076,557 | 60,076,557 | - | - |
Consumer Discretionary | 35,773,315 | 35,773,315 | - | - |
Consumer Staples | 57,750,502 | 57,750,502 | - | - |
Energy | 77,394,896 | 77,394,896 | - | - |
Financials | 167,070,431 | 167,070,431 | - | - |
Health Care | 136,840,486 | 136,840,486 | - | - |
Industrials | 57,298,425 | 43,053,470 | 14,244,955 | - |
Information Technology | 74,698,383 | 74,698,383 | - | - |
Materials | 13,745,976 | 13,745,976 | - | - |
Utilities | 52,551,129 | 52,551,129 | - | - |
|
| Money Market Funds | 10,247,856 | 10,247,856 | - | - |
| Total Investments in Securities: | 743,447,956 | 729,203,001 | 14,244,955 | - |
Financial Statements
| Statement of Assets and Liabilities |
As of July 31, 2024 |
| Assets | | | | |
| Investment in securities, at value - See accompanying schedule: | | | | |
Unaffiliated issuers (cost $574,931,394) | $ | 733,200,100 | | |
Fidelity Central Funds (cost $10,247,856) | | 10,247,856 | | |
| | | | | |
| | | | | |
| Total Investment in Securities (cost $585,179,250) | | | $ | 743,447,956 |
| Receivable for fund shares sold | | | | 476,598 |
| Dividends receivable | | | | 669,541 |
| Distributions receivable from Fidelity Central Funds | | | | 29,464 |
| Prepaid expenses | | | | 119 |
| Other receivables | | | | 1,753 |
Total assets | | | | 744,625,431 |
| Liabilities | | | | |
| Payable for fund shares redeemed | $ | 262,545 | | |
| Accrued management fee | | 449,988 | | |
| Audit fee payable | | 50,993 | | |
| Other payables and accrued expenses | | 31,953 | | |
| Total liabilities | | | | 795,479 |
| Net Assets | | | $ | 743,829,952 |
| Net Assets consist of: | | | | |
| Paid in capital | | | $ | 544,950,094 |
| Total accumulated earnings (loss) | | | | 198,879,858 |
| Net Assets | | | $ | 743,829,952 |
Net Asset Value, offering price and redemption price per share ($743,829,952 ÷ 27,550,605 shares) | | | $ | 27.00 |
| Statement of Operations |
| Year ended July 31, 2024 |
| Investment Income | | | | |
| Dividends | | | $ | 16,251,302 |
| Income from Fidelity Central Funds (including $34,954 from security lending) | | | | 875,676 |
| Total income | | | | 17,126,978 |
| Expenses | | | | |
| Management fee | | | | |
| Basic fee | $ | 4,246,865 | | |
| Performance adjustment | | 929,588 | | |
| Transfer agent fees | | 702,175 | | |
| Accounting fees | | 133,172 | | |
| Custodian fees and expenses | | 19,348 | | |
| Independent trustees' fees and expenses | | 3,565 | | |
| Registration fees | | 38,324 | | |
| Audit fees | | 64,136 | | |
| Legal | | 2,241 | | |
| Miscellaneous | | 29,748 | | |
| Total expenses before reductions | | 6,169,162 | | |
| Expense reductions | | (45,884) | | |
| Total expenses after reductions | | | | 6,123,278 |
| Net Investment income (loss) | | | | 11,003,700 |
| Realized and Unrealized Gain (Loss) | | | | |
| Net realized gain (loss) on: | | | | |
| Investment Securities: | | | | |
| Unaffiliated issuers | | 50,455,675 | | |
| Fidelity Central Funds | | 1,076 | | |
| Foreign currency transactions | | (15,867) | | |
| Total net realized gain (loss) | | | | 50,440,884 |
| Change in net unrealized appreciation (depreciation) on: | | | | |
| Investment Securities: | | | | |
| Unaffiliated issuers | | 15,176,276 | | |
| Assets and liabilities in foreign currencies | | (16,863) | | |
| Total change in net unrealized appreciation (depreciation) | | | | 15,159,413 |
| Net gain (loss) | | | | 65,600,297 |
| Net increase (decrease) in net assets resulting from operations | | | $ | 76,603,997 |
| Statement of Changes in Net Assets |
| |
| | Year ended July 31, 2024 | | Year ended July 31, 2023 |
| Increase (Decrease) in Net Assets | | | | |
| Operations | | | | |
| Net investment income (loss) | $ | 11,003,700 | $ | 9,952,789 |
| Net realized gain (loss) | | 50,440,884 | | 5,830,795 |
| Change in net unrealized appreciation (depreciation) | | 15,159,413 | | 42,743,630 |
| Net increase (decrease) in net assets resulting from operations | | 76,603,997 | | 58,527,214 |
| Distributions to shareholders | | (26,427,278) | | (19,890,909) |
| | | | | |
| Share transactions | | | | |
| Proceeds from sales of shares | | 121,817,314 | | 338,713,904 |
| Reinvestment of distributions | | 16,188,102 | | 12,947,154 |
| Cost of shares redeemed | | (196,908,578) | | (378,726,174) |
| | | | | |
Net increase (decrease) in net assets resulting from share transactions | | (58,903,162) | | (27,065,116) |
| Total increase (decrease) in net assets | | (8,726,443) | | 11,571,189 |
| | | | | |
| Net Assets | | | | |
| Beginning of period | | 752,556,395 | | 740,985,206 |
| End of period | $ | 743,829,952 | $ | 752,556,395 |
| | | | | |
| Other Information | | | | |
| Shares | | | | |
| Sold | | 4,927,367 | | 14,601,230 |
| Issued in reinvestment of distributions | | 666,826 | | 548,797 |
| Redeemed | | (7,943,369) | | (16,401,327) |
| Net increase (decrease) | | (2,349,176) | | (1,251,300) |
| | | | | |
Financial Highlights
Fidelity® Blue Chip Value Fund |
| |
| Years ended July 31, | | 2024 | | 2023 | | 2022 | | 2021 | | 2020 |
Selected Per-Share Data | | | | | | | | | | |
| Net asset value, beginning of period | $ | 25.17 | $ | 23.79 | $ | 23.11 | $ | 17.02 | $ | 19.71 |
| Income from Investment Operations | | | | | | | | | | |
Net investment income (loss) A,B | | .38 | | .31 | | .33 | | .27 | | .31 |
| Net realized and unrealized gain (loss) | | 2.36 | | 1.69 | | .66 | | 6.03 | | (2.63) |
| Total from investment operations | | 2.74 | | 2.00 | | .99 | | 6.30 | | (2.32) |
| Distributions from net investment income | | (.38) | | (.26) | | (.31) | | (.21) | | (.31) |
| Distributions from net realized gain | | (.53) | | (.37) | | - | | - | | (.06) |
| Total distributions | | (.91) | | (.62) C | | (.31) | | (.21) | | (.37) |
| Net asset value, end of period | $ | 27.00 | $ | 25.17 | $ | 23.79 | $ | 23.11 | $ | 17.02 |
Total Return D | | | | 8.61% | | 4.28% | | 37.36% | | (12.03)% |
Ratios to Average Net Assets B,E,F | | | | | | | | | | |
| Expenses before reductions | | .85% | | .80% | | .63% | | .58% | | .63% |
| Expenses net of fee waivers, if any | | | | .79% | | .63% | | .58% | | .63% |
| Expenses net of all reductions | | .85% | | .79% | | .63% | | .58% | | .61% |
| Net investment income (loss) | | 1.52% | | 1.32% | | 1.38% | | 1.35% | | 1.71% |
| Supplemental Data | | | | | | | | | | |
| Net assets, end of period (000 omitted) | $ | 743,830 | $ | 752,556 | $ | 740,985 | $ | 525,809 | $ | 375,786 |
Portfolio turnover rate G | | | | 32% | | 41% | | 52% | | 119% |
ACalculated based on average shares outstanding during the period.
BNet investment income (loss) is affected by the timing of the declaration of dividends by any underlying mutual funds or exchange-traded funds (ETFs). Net investment income (loss) of any mutual funds or ETFs is not included in the Fund's net investment income (loss) ratio.
CTotal distributions per share do not sum due to rounding.
DTotal returns would have been lower if certain expenses had not been reduced during the applicable periods shown.
EFees and expenses of any underlying mutual funds or exchange-traded funds (ETFs) are not included in the Fund's expense ratio. The Fund indirectly bears its proportionate share of these expenses. For additional expense information related to investments in Fidelity Central Funds, please refer to the "Investments in Fidelity Central Funds" note found in the Notes to Financial Statements section of the most recent Annual or Semi-Annual report.
FExpense ratios reflect operating expenses of the class. Expenses before reductions do not reflect amounts reimbursed, waived, or reduced through arrangements with the investment adviser, brokerage services, or other offset arrangements, if applicable, and do not represent the amount paid by the class during periods when reimbursements, waivers or reductions occur.
GAmount does not include the portfolio activity of any underlying mutual funds or exchange-traded funds (ETFs).
Notes to Financial Statements
For the period ended July 31, 2024
1. Organization.
Fidelity Blue Chip Value Fund (the Fund) is a fund of Fidelity Securities Fund (the Trust) and is authorized to issue an unlimited number of shares. Share transactions on the Statement of Changes in Net Assets may contain exchanges between affiliated funds. The Trust is registered under the Investment Company Act of 1940, as amended (the 1940 Act), as an open-end management investment company organized as a Massachusetts business trust.
2. Investments in Fidelity Central Funds.
Funds may invest in Fidelity Central Funds, which are open-end investment companies generally available only to other investment companies and accounts managed by the investment adviser and its affiliates. The Schedule of Investments lists any Fidelity Central Funds held as an investment as of period end, but does not include the underlying holdings of each Fidelity Central Fund. An investing fund indirectly bears its proportionate share of the expenses of the underlying Fidelity Central Funds.
Based on its investment objective, each Fidelity Central Fund may invest or participate in various investment vehicles or strategies that are similar to those of the investing fund. These strategies are consistent with the investment objectives of the investing fund and may involve certain economic risks which may cause a decline in value of each of the Fidelity Central Funds and thus a decline in the value of the investing fund.
| Fidelity Central Fund | Investment Manager | Investment Objective | Investment Practices | Expense RatioA |
| Fidelity Money Market Central Funds | Fidelity Management & Research Company LLC (FMR) | Each fund seeks to obtain a high level of current income consistent with the preservation of capital and liquidity. | Short-term Investments | Less than .005% |
A Expenses expressed as a percentage of average net assets and are as of each underlying Central Fund's most recent annual or semi-annual shareholder report.
A complete unaudited list of holdings for each Fidelity Central Fund is available upon request or at the Securities and Exchange Commission website at www.sec.gov. In addition, the financial statements of the Fidelity Central Funds which contain the significant accounting policies (including investment valuation policies) of those funds, and are not covered by the Report of Independent Registered Public Accounting Firm, are available on the Securities and Exchange Commission website or upon request.
3. Significant Accounting Policies.
The Fund is an investment company and applies the accounting and reporting guidance of the Financial Accounting Standards Board (FASB) Accounting Standards Codification Topic 946 Financial Services - Investment Companies. The financial statements have been prepared in conformity with accounting principles generally accepted in the United States of America (GAAP), which require management to make certain estimates and assumptions at the date of the financial statements. Actual results could differ from those estimates. Subsequent events, if any, through the date that the financial statements were issued have been evaluated in the preparation of the financial statements. The Fund's Schedule of Investments lists any underlying mutual funds or exchange-traded funds (ETFs) but does not include the underlying holdings of these funds. The following summarizes the significant accounting policies of the Fund:
Investment Valuation. Investments are valued as of 4:00 p.m. Eastern time on the last calendar day of the period. The Board of Trustees (the Board) has designated the Fund's investment adviser as the valuation designee responsible for the fair valuation function and performing fair value determinations as needed. The investment adviser has established a Fair Value Committee (the Committee) to carry out the day-to-day fair valuation responsibilities and has adopted policies and procedures to govern the fair valuation process and the activities of the Committee. In accordance with these fair valuation policies and procedures, which have been approved by the Board, the Fund attempts to obtain prices from one or more third party pricing services or brokers to value its investments. When current market prices, quotations or currency exchange rates are not readily available or reliable, investments will be fair valued in good faith by the Committee, in accordance with the policies and procedures. Factors used in determining fair value vary by investment type and may include market or investment specific events, transaction data, estimated cash flows, and market observations of comparable investments. The frequency that the fair valuation procedures are used cannot be predicted and they may be utilized to a significant extent. The Committee manages the Fund's fair valuation practices and maintains the fair valuation policies and procedures. The Fund's investment adviser reports to the Board information regarding the fair valuation process and related material matters.
The Fund categorizes the inputs to valuation techniques used to value its investments into a disclosure hierarchy consisting of three levels as shown below:
Level 1 - unadjusted quoted prices in active markets for identical investments
Level 2 - other significant observable inputs (including quoted prices for similar investments, interest rates, prepayment speeds, etc.)
Level 3 - unobservable inputs (including the Fund's own assumptions based on the best information available)
Valuation techniques used to value the Fund's investments by major category are as follows:
Equity securities, including restricted securities, for which market quotations are readily available, are valued at the last reported sale price or official closing price as reported by a third party pricing service on the primary market or exchange on which they are traded and are categorized as Level 1 in the hierarchy. In the event there were no sales during the day or closing prices are not available, securities are valued at the last quoted bid price or may be valued using the last available price and are generally categorized as Level 2 in the hierarchy. For foreign equity securities, when market or security specific events arise, comparisons to the valuation of American Depositary Receipts (ADRs), futures contracts, Exchange-Traded Funds (ETFs) and certain indexes as well as quoted prices for similar securities may be used and would be categorized as Level 2 in the hierarchy. For equity securities, including restricted securities, where observable inputs are limited, assumptions about market activity and risk are used and these securities may be categorized as Level 3 in the hierarchy.
Investments in open-end mutual funds, including the Fidelity Central Funds, are valued at their closing net asset value (NAV) each business day and are categorized as Level 1 in the hierarchy.
Changes in valuation techniques may result in transfers in or out of an assigned level within the disclosure hierarchy. The aggregate value of investments by input level as of July 31, 2024 is included at the end of the Fund's Schedule of Investments.
Foreign Currency. Certain Funds may use foreign currency contracts to facilitate transactions in foreign-denominated securities. Gains and losses from these transactions may arise from changes in the value of the foreign currency or if the counterparties do not perform under the contracts' terms.
Foreign-denominated assets, including investment securities, and liabilities are translated into U.S. dollars at the exchange rates at period end. Purchases and sales of investment securities, income and dividends received, and expenses denominated in foreign currencies are translated into U.S. dollars at the exchange rate in effect on the transaction date.
The effects of exchange rate fluctuations on investments are included with the net realized and unrealized gain (loss) on investment securities. Other foreign currency transactions resulting in realized and unrealized gain (loss) are disclosed separately.
Investment Transactions and Income. For financial reporting purposes, the Fund's investment holdings and NAV include trades executed through the end of the last business day of the period. The NAV per share for processing shareholder transactions is calculated as of the close of business of the New York Stock Exchange (NYSE), normally 4:00 p.m. Eastern time and includes trades executed through the end of the prior business day. Gains and losses on securities sold are determined on the basis of identified cost and include proceeds received from litigation. Commissions paid to certain brokers with whom the investment adviser, or its affiliates, places trades on behalf of a fund include an amount in addition to trade execution, which may be rebated back to a fund. Any such rebates are included in net realized gain (loss) on investments in the Statement of Operations. Dividend income is recorded on the ex-dividend date, except for certain dividends from foreign securities where the ex-dividend date may have passed, which are recorded as soon as the Fund is informed of the ex-dividend date. Non-cash dividends included in dividend income, if any, are recorded at the fair market value of the securities received. Income and capital gain distributions from Fidelity Central Funds, if any, are recorded on the ex-dividend date. Investment income is recorded net of foreign taxes withheld where recovery of such taxes is uncertain. Funds may file withholding tax reclaims in certain jurisdictions to recover a portion of amounts previously withheld. Any withholding tax reclaims income is included in the Statement of Operations in dividends. Any receivables for withholding tax reclaims are included in the Statement of Assets and Liabilities in dividends receivable.
Expenses. Expenses directly attributable to a fund are charged to that fund. Expenses attributable to more than one fund are allocated among the respective funds on the basis of relative net assets or other appropriate methods. Expenses included in the accompanying financial statements reflect the expenses of that fund and do not include any expenses associated with any underlying mutual funds or exchange-traded funds. Although not included in a fund's expenses, a fund indirectly bears its proportionate share of these expenses through the net asset value of each underlying mutual fund or exchange-traded fund. Expense estimates are accrued in the period to which they relate and adjustments are made when actual amounts are known.
Income Tax Information and Distributions to Shareholders. Each year, the Fund intends to qualify as a regulated investment company under Subchapter M of the Internal Revenue Code, including distributing substantially all of its taxable income and realized gains. As a result, no provision for U.S. Federal income taxes is required. As of July 31, 2024, the Fund did not have any unrecognized tax benefits in the financial statements; nor is the Fund aware of any tax positions for which it is reasonably possible that the total amounts of unrecognized tax benefits will significantly change in the next twelve months. The Fund files a U.S. federal tax return, in addition to state and local tax returns as required. The Fund's federal income tax returns are subject to examination by the Internal Revenue Service (IRS) for a period of three fiscal years after they are filed. State and local tax returns may be subject to examination for an additional fiscal year depending on the jurisdiction. Foreign taxes are provided for based on the Fund's understanding of the tax rules and rates that exist in the foreign markets in which it invests.
Distributions are declared and recorded on the ex-dividend date. Income and capital gain distributions are determined in accordance with income tax regulations, which may differ from GAAP. In addition, the Fund claimed a portion of the payment made to redeeming shareholders as a distribution for income tax purposes.
Capital accounts within the financial statements are adjusted for permanent book-tax differences. These adjustments have no impact on net assets or the results of operations. Capital accounts are not adjusted for temporary book-tax differences which will reverse in a subsequent period.
Book-tax differences are primarily due to foreign currency transactions and losses deferred due to wash sales.
As of period end, the cost and unrealized appreciation (depreciation) in securities, and derivatives if applicable, for federal income tax purposes were as follows:
| Gross unrealized appreciation | $174,039,764 |
| Gross unrealized depreciation | (16,426,049) |
| Net unrealized appreciation (depreciation) | $157,613,715 |
| Tax Cost | $585,834,241 |
The tax-based components of distributable earnings as of period end were as follows:
| Undistributed ordinary income | $5,856,667 |
| Undistributed long-term capital gain | $35,402,900 |
| Net unrealized appreciation (depreciation) on securities and other investments | $157,620,291 |
The tax character of distributions paid was as follows:
| | July 31, 2024 | July 31, 2023 |
| Ordinary Income | $14,423,903 | $8,258,374 |
| Long-term Capital Gains | 12,003,375 | 11,632,535 |
| Total | $26,427,278 | $19,890,909 |
4. Purchases and Sales of Investments.
Purchases and sales of securities, other than short-term securities and in-kind transactions, as applicable, are noted in the table below.
| | Purchases ($) | Sales ($) |
| Fidelity Blue Chip Value Fund | 277,266,635 | 303,843,598 |
5. Fees and Other Transactions with Affiliates.
Management Fee. Fidelity Management & Research Company LLC (the investment adviser) and its affiliates provide the Fund with investment management related services for which the Fund pays a monthly management fee.
Effective March 1, 2024, the Fund's management contract was amended to incorporate administrative services previously covered under separate services agreements (Transfer Agent and Accounting agreements). Any reference to "class" in this note shall mean "the Fund" as the Fund currently offers only one class of shares. The amended contract incorporates a basic fee rate that may vary by class (subject to a performance adjustment). The investment adviser or an affiliate pays certain expenses of managing and operating the Fund out of each class's management fee. Each class of the Fund pays a management fee to the investment adviser. The management fee is calculated and paid to the investment adviser every month. The management fee is determined by calculating a basic fee and then applying a performance adjustment. When determining a class's basic fee, a mandate rate is calculated based on the monthly average net assets of a group of funds advised by FMR within a designated asset class. A discount rate is subtracted from the mandate rate once the Fund's monthly average net assets reach a certain level. The mandate rate and discount rate may vary by class. The annual basic fee rate for a class of shares of the Fund is the lesser of (1) the class's mandate rate reduced by the class's discount rate (if applicable) or (2) the amount set forth in the following table.
| | Maximum Management Fee Rate % |
| Fidelity Blue Chip Value Fund | .68 |
One-twelfth of the basic fee rate for a class is applied to the average net assets of the class for the month, giving a dollar amount which is the basic fee for the class for that month. A different management fee rate may be applicable to each class of the Fund. The difference between classes is the result of separate arrangements for class-level services and/or waivers of certain expenses. It is not the result of any difference in advisory or custodial fees or other expenses related to the management of the Fund's assets, which do not vary by class. For the portion of the reporting period on or after March 1, 2024, the total annualized management fee rates were as follows:
| | Total Management Fee Rate % |
| Fidelity Blue Chip Value Fund | .67 |
Prior to March 1, 2024, the management fee was the sum of an individual fund fee rate that was based on an annual rate of .30% of the Fund's average net assets and an annualized group fee rate that averaged .22% during the period. The group fee rate was based upon the monthly average net assets of a group of registered investment companies with which the investment adviser has management contracts. The group fee rate decreased as assets under management increased and increased as assets under management decreased. For the portion of the reporting period prior to March 1, 2024, the total annualized management fee rate was .52%.
The performance adjustment rate is calculated monthly by comparing over the performance period the Fund's performance to that of the performance adjustment index listed below.
| | Performance Adjustment Index |
| Fidelity Blue Chip Value Fund | Russell 1000 Value Index |
For the purposes of calculating the performance adjustment for the Fund, the Fund's investment performance is based on the performance of the Fund. To the extent that other classes of the Fund have higher expenses, this could result in those classes bearing a larger positive performance adjustment and smaller negative performance adjustment than would be the case if each class's own performance were considered. The performance period is the most recent 36 month period. The maximum annualized performance adjustment rate is ± .20% of the Fund's average net assets over the performance period. The performance adjustment rate is divided by twelve and multiplied by the Fund's average net assets over the performance period, and the resulting dollar amount is proportionately added to or subtracted from a class's basic fee. For the entire reporting period, the total annual performance adjustment was .13%.
Effective March 1, 2024, the Fund's sub-advisory agreements with FMR Investment Management (UK) Limited, Fidelity Management & Research (Hong Kong) Limited, and Fidelity Management & Research (Japan) Limited were amended to provide that the investment adviser pays each sub-adviser monthly fees equal to 110% of the sub-adviser's costs for providing sub-advisory services.
Transfer Agent Fees. Fidelity Investments Institutional Operations Company LLC (FIIOC), an affiliate of the investment adviser, is the Fund's transfer, dividend disbursing and shareholder servicing agent. Effective March 1, 2024, each Fund's management contract was amended to incorporate transfer agent services and associated fees previously covered under a separate services agreement. FIIOC pays for typesetting, printing and mailing of shareholder reports, except proxy statements.
During the period December 1, 2023 through February 29, 2024, the transfer agent fees were a fixed annual rate of average net assets of .1688%.
Prior to December 1, 2023, FIIOC received account fees and asset-based fees that varied according to account size and type of account.
For the portion of the reporting period prior to March 1, 2024, the fees were equivalent to the annualized rate of .17% of average net assets.
Accounting Fees. Fidelity Service Company, Inc. (FSC), an affiliate of the investment adviser, maintains the Fund's accounting records. Effective March 1, 2024, the Fund's management contract was amended to incorporate accounting services and associated fees previously covered under a separate services agreement.
During the period December 1, 2023 through February 29, 2024, the accounting fees were a fixed annual rate of average net assets as follows:
| | % of Average Net Assets |
| Fidelity Blue Chip Value Fund | .0316 |
Prior to December 1, 2023, the accounting fee was based on the level of average net assets for each month. For the portion of the reporting period prior to March 1, 2024, the fees were equivalent to the following annualized rates:
| | % of Average Net Assets |
| Fidelity Blue Chip Value Fund | .03 |
Brokerage Commissions. A portion of portfolio transactions were placed with brokerage firms which are affiliates of the investment adviser. Brokerage commissions are included in net realized gain (loss) and change in net unrealized appreciation (depreciation) in the Statement of Operations. The commissions paid to these affiliated firms were as follows:
| | Amount ($) |
| Fidelity Blue Chip Value Fund | 1,731 |
Interfund Trades. Funds may purchase from or sell securities to other Fidelity Funds under procedures adopted by the Board. The procedures have been designed to ensure these interfund trades are executed in accordance with Rule 17a-7 of the 1940 Act. Any interfund trades are included within the respective purchases and sales amounts shown in the Purchases and Sales of Investments note. Interfund trades during the period are noted in the table below.
| | Purchases ($) | Sales ($) | Realized Gain (Loss)($) |
| Fidelity Blue Chip Value Fund | 11,245,855 | 23,889,071 | 693,915 |
6. Committed Line of Credit.
Certain Funds participate with other funds managed by the investment adviser or an affiliate in a $4.25 billion credit facility (the "line of credit") to be utilized for temporary or emergency purposes to fund shareholder redemptions or for other short-term liquidity purposes. The participating funds have agreed to pay commitment fees on their pro-rata portion of the line of credit, which are reflected in Miscellaneous expenses on the Statement of Operations, and are listed below. During the period, there were no borrowings on this line of credit.
| | Amount ($) |
| Fidelity Blue Chip Value Fund | 1,219 |
7. Security Lending.
Funds lend portfolio securities from time to time in order to earn additional income. Lending agents are used, including National Financial Services (NFS), an affiliate of the investment adviser. Pursuant to a securities lending agreement, NFS will receive a fee, which is capped at 9.9% of a fund's daily lending revenue, for its services as lending agent. A fund may lend securities to certain qualified borrowers, including NFS. On the settlement date of the loan, a fund receives collateral (in the form of U.S. Treasury obligations, letters of credit and/or cash) against the loaned securities and maintains collateral in an amount not less than 100% of the market value of the loaned securities during the period of the loan. The market value of the loaned securities is determined at the close of business of a fund and any additional required collateral is delivered to a fund on the next business day. A fund or borrower may terminate the loan at any time, and if the borrower defaults on its obligation to return the securities loaned because of insolvency or other reasons, a fund may apply collateral received from the borrower against the obligation. A fund may experience delays and costs in recovering the securities loaned. Any cash collateral received is invested in the Fidelity Securities Lending Cash Central Fund. Any loaned securities are identified as such in the Schedule of Investments, and the value of loaned securities and cash collateral at period end, as applicable, are presented in the Statement of Assets and Liabilities. Security lending income represents the income earned on investing cash collateral, less rebates paid to borrowers and any lending agent fees associated with the loan, plus any premium payments received for lending certain types of securities. Security lending income is presented in the Statement of Operations as a component of income from Fidelity Central Funds. Affiliated security lending activity, if any, was as follows:
| | Total Security Lending Fees Paid to NFS ($) | Security Lending Income From Securities Loaned to NFS ($) | Value of Securities Loaned to NFS at Period End ($) |
| Fidelity Blue Chip Value Fund | 3,055 | - | - |
8. Expense Reductions.
Through arrangements with the Fund's custodian, credits realized as a result of certain uninvested cash balances were used to reduce the Fund's expenses by $425.
In addition, during the period the investment adviser or an affiliate reimbursed and/or waived a portion of operating expenses in the amount of $45,459.
9. Other.
A fund's organizational documents provide former and current trustees and officers with a limited indemnification against liabilities arising in connection with the performance of their duties to the fund. In the normal course of business, a fund may also enter into contracts that provide general indemnifications. A fund's maximum exposure under these arrangements is unknown as this would be dependent on future claims that may be made against a fund. The risk of material loss from such claims is considered remote.
10. Risk and Uncertainties.
Many factors affect a fund's performance. Developments that disrupt global economies and financial markets, such as pandemics, epidemics, outbreaks of infectious diseases, war, terrorism, and environmental disasters, may significantly affect a fund's investment performance. The effects of these developments to a fund will be impacted by the types of securities in which a fund invests, the financial condition, industry, economic sector, and geographic location of an issuer, and a fund's level of investment in the securities of that issuer. Significant concentrations in security types, issuers, industries, sectors, and geographic locations may magnify the factors that affect a fund's performance.
Report of Independent Registered Public Accounting Firm
To the Board of Trustees of Fidelity Securities Fund and Shareholders of Fidelity Blue Chip Value Fund
Opinion on the Financial Statements
We have audited the accompanying statement of assets and liabilities, including the schedule of investments, of Fidelity Blue Chip Value Fund (one of the funds constituting Fidelity Securities Fund, referred to hereafter as the "Fund") as of July 31, 2024, the related statement of operations for the year ended July 31, 2024, the statement of changes in net assets for each of the two years in the period ended July 31, 2024, including the related notes, and the financial highlights for each of the five years in the period ended July 31, 2024 (collectively referred to as the "financial statements"). In our opinion, the financial statements present fairly, in all material respects, the financial position of the Fund as of July 31, 2024, the results of its operations for the year then ended, the changes in its net assets for each of the two years in the period ended July 31, 2024 and the financial highlights for each of the five years in the period ended July 31, 2024 in conformity with accounting principles generally accepted in the United States of America.
Basis for Opinion
These financial statements are the responsibility of the Fund's management. Our responsibility is to express an opinion on the Fund's financial statements based on our audits. We are a public accounting firm registered with the Public Company Accounting Oversight Board (United States) (PCAOB) and are required to be independent with respect to the Fund in accordance with the U.S. federal securities laws and the applicable rules and regulations of the Securities and Exchange Commission and the PCAOB.
We conducted our audits of these financial statements in accordance with the standards of the PCAOB. Those standards require that we plan and perform the audit to obtain reasonable assurance about whether the financial statements are free of material misstatement, whether due to error or fraud.
Our audits included performing procedures to assess the risks of material misstatement of the financial statements, whether due to error or fraud, and performing procedures that respond to those risks. Such procedures included examining, on a test basis, evidence regarding the amounts and disclosures in the financial statements. Our audits also included evaluating the accounting principles used and significant estimates made by management, as well as evaluating the overall presentation of the financial statements. Our procedures included confirmation of securities owned as of July 31, 2024 by correspondence with the custodian. We believe that our audits provide a reasonable basis for our opinion.
/s/ PricewaterhouseCoopers LLP
Boston, Massachusetts
September 16, 2024
We have served as the auditor of one or more investment companies in the Fidelity group of funds since 1932.
Distributions
(Unaudited)
The dividend and capital gains distributions for the fund(s) are available on Fidelity.com or Institutional.Fidelity.com.
The fund hereby designates as a capital gain dividend with respect to the taxable year ended July 31, 2024, $50,226,590, or, if subsequently determined to be different, the net capital gain of such year.
The fund designates 100% of the short-term capital gain dividends distributed in September during the fiscal year as qualifying to be taxed as short-term capital gain dividends for nonresident alien shareholders.
The fund designates $626,546 of distributions paid during the fiscal year ended 2024 as qualifying to be taxed as section 163(j) interest dividends.
The fund designates 80% and 100% of the dividends distributed in September and December, respectively during the fiscal year as qualifying for the dividends-received deduction for corporate shareholders.
The fund designates 100% of the dividends distributed during the fiscal year as amounts which may be taken into account as a dividend for the purposes of the maximum rate under section 1(h)(11) of the Internal Revenue Code.
The fund will notify shareholders in January 2025 of amounts for use in preparing 2024 income tax returns.
Item 8: Changes in and Disagreements with Accountants for Open-End Management Investment Companies
Note: This is not applicable for any fund included in this document.
Item 9: Proxy Disclosures for Open-End Management Investment Companies
| A special meeting of shareholders was held on July 16, 2024. The results of votes taken among shareholders on the proposal before them are reported below. Each vote reported represents one dollar of net asset value held on the record date for the meeting. |
| Proposal 1 |
| To elect a Board of Trustees. |
| | # of Votes | % of Votes |
| Bettina Doulton |
| Affirmative | 88,756,759,992.17 | 95.11 |
| Withheld | 4,564,750,651.52 | 4.89 |
| TOTAL | 93,321,510,643.68 | 100.00 |
| Robert A. Lawrence |
| Affirmative | 88,523,438,331.98 | 94.86 |
| Withheld | 4,798,072,311.70 | 5.14 |
| TOTAL | 93,321,510,643.68 | 100.00 |
| Vijay C. Advani |
| Affirmative | 88,484,371,668.51 | 94.82 |
| Withheld | 4,837,138,975.17 | 5.18 |
| TOTAL | 93,321,510,643.68 | 100.00 |
| Thomas P. Bostick |
| Affirmative | 88,618,596,648.21 | 94.96 |
| Withheld | 4,702,913,995.47 | 5.04 |
| TOTAL | 93,321,510,643.68 | 100.00 |
| Donald F. Donahue |
| Affirmative | 88,542,403,002.79 | 94.88 |
| Withheld | 4,779,107,640.89 | 5.12 |
| TOTAL | 93,321,510,643.68 | 100.00 |
| Vicki L. Fuller |
| Affirmative | 88,788,711,037.44 | 95.14 |
| Withheld | 4,532,799,606.24 | 4.86 |
| TOTAL | 93,321,510,643.68 | 100.00 |
| Patricia L. Kampling |
| Affirmative | 88,819,315,996.59 | 95.18 |
| Withheld | 4,502,194,647.10 | 4.82 |
| TOTAL | 93,321,510,643.68 | 100.00 |
| Thomas A. Kennedy |
| Affirmative | 88,667,457,817.34 | 95.01 |
| Withheld | 4,654,052,826.34 | 4.99 |
| TOTAL | 93,321,510,643.68 | 100.00 |
| Oscar Munoz |
| Affirmative | 88,183,976,568.30 | 94.49 |
| Withheld | 5,137,534,075.39 | 5.51 |
| TOTAL | 93,321,510,643.68 | 100.00 |
| Karen B. Peetz |
| Affirmative | 88,720,160,318.58 | 95.07 |
| Withheld | 4,601,350,325.11 | 4.93 |
| TOTAL | 93,321,510,643.68 | 100.00 |
| David M. Thomas |
| Affirmative | 88,471,490,747.86 | 94.80 |
| Withheld | 4,850,019,895.82 | 5.20 |
| TOTAL | 93,321,510,643.68 | 100.00 |
| Susan Tomasky |
| Affirmative | 88,536,869,646.78 | 94.87 |
| Withheld | 4,784,640,996.90 | 5.13 |
| TOTAL | 93,321,510,643.68 | 100.00 |
| Michael E. Wiley |
| Affirmative | 88,526,906,267.86 | 94.86 |
| Withheld | 4,794,604,375.83 | 5.14 |
| TOTAL | 93,321,510,643.68 | 100.00 |
| | | |
| Proposal 1 reflects trust-wide proposal and voting results. |
Item 10: Remuneration Paid to Directors, Officers, and others of Open-End Management Investment Companies
Note: This information is disclosed as part of the financial statements for each Fund as part of Item 7: Financial Statements and Financial Highlights for Open-End Management Investment companies.
Item 11: Statement Regarding Basis for Approval of Investment Advisory Contract
Board Approval of Investment Advisory Contracts and Management Fees
Fidelity Blue Chip Value Fund
Each year, the Board of Trustees, including the Independent Trustees (together, the Board), considers the renewal of the fund's management contract with Fidelity Management & Research Company LLC (FMR) and the sub-advisory agreements (together, the Advisory Contracts) for the fund. FMR and the sub-advisers are referred to herein as the Investment Advisers. The Board, assisted by the advice of fund counsel and Independent Trustees' counsel, requests and considers a broad range of information relevant to the renewal of the Advisory Contracts throughout the year.
The Board meets regularly and, at each of its meetings, covers an extensive agenda of topics and materials and considers factors that are relevant to its annual consideration of the renewal of the fund's Advisory Contracts, including the services and support provided to the fund and its shareholders. The Board, acting directly and through its Committees (each of which is composed of and chaired by Independent Trustees), requests and receives information concerning the annual consideration of the renewal of the fund's Advisory Contracts. The Board also meets as needed to review matters specifically related to the Board's annual consideration of the renewal of the Advisory Contracts. Members of the Board may also meet with trustees of other Fidelity funds through joint ad hoc committees to discuss certain matters relevant to all of the Fidelity funds.
At its May 2024 meeting, the Board unanimously determined to renew the fund's Advisory Contracts. In reaching its determination, the Board considered all factors it believed relevant, including (i) the nature, extent, and quality of the services provided to the fund and its shareholders (including the investment performance of the fund); (ii) the competitiveness relative to peer funds of the fund's management fee and total expense ratio; (iii) the total costs of the services provided by and the profits realized by FMR and its affiliates (Fidelity) from its relationships with the fund; and (iv) the extent to which, if any, economies of scale exist and are realized as the fund grows, and whether any economies of scale are appropriately shared with fund shareholders. The Board also considered the broad range of investment choices available to shareholders from FMR's competitors and that the fund's shareholders have chosen to invest in the fund, which is part of the Fidelity family of funds. The Board's decision to renew the Advisory Contracts was not based on any single factor.
The Board reached a determination, with the assistance of fund counsel and Independent Trustees' counsel and through the exercise of its business judgment, that the renewal of the Advisory Contracts was in the best interests of the fund and its shareholders and that the compensation payable under the Advisory Contracts was fair and reasonable in light of all of the surrounding circumstances.
Nature, Extent, and Quality of Services Provided. The Board considered staffing as it relates to the fund, including the backgrounds and experience of investment personnel of the Investment Advisers, and also considered the Investment Advisers' implementation of the fund's investment program. The Independent Trustees also had discussions with senior management of Fidelity's investment operations and investment groups. The Board considered the structure of the investment personnel compensation program and whether this structure provides appropriate incentives to act in the best interests of the fund. Additionally, the Board considered the portfolio managers' investments, if any, in the funds that they manage.
Resources Dedicated to Investment Management and Support Services. The Board and the Fund Oversight and Research Committees reviewed the general qualifications and capabilities of Fidelity's investment staff, including its size, education, experience, and resources, as well as Fidelity's approach to recruiting, training, managing, and compensating investment personnel. The Board noted the resources devoted to expansion of Fidelity's global investment organization, and that Fidelity's analysts have extensive resources, tools, and capabilities that allow them to conduct sophisticated quantitative and fundamental analysis, as well as credit analysis of issuers, counterparties, and guarantors. Further, the Board considered that Fidelity's investment professionals have sufficient access to global information and data so as to provide competitive investment results over time, and that those professionals also have access to sophisticated tools that permit them to assess portfolio construction and risk and performance attribution characteristics continuously, as well as to transmit new information and research conclusions rapidly around the world. Additionally, in its deliberations, the Board considered Fidelity's trading, risk management, compliance, and technology and operations capabilities and resources, which are integral parts of the investment management process.
Shareholder and Administrative Services. The Board considered (i) the nature, extent, quality, and cost of advisory, administrative, shareholder, transfer agency, and pricing and bookkeeping services performed by the Investment Advisers and their affiliates under the Advisory Contracts; (ii) the nature and extent of Fidelity's supervision of third party service providers, principally custodians, subcustodians, and pricing vendors; and (iii) the resources devoted by Fidelity to, and the record of compliance with, the fund's compliance policies and procedures. The Board also reviewed the allocation of fund brokerage, including allocations to brokers affiliated with the Investment Advisers, the use of brokerage commissions to pay fund expenses, and the use of "soft" commission dollars to pay for research services. The Board also considered the fund's securities lending activities and any payments made to Fidelity relating to securities lending under a separate agreement.
The Board noted that the growth of fund assets over time across the complex allows Fidelity to reinvest in the development of services designed to enhance the value and convenience of the Fidelity funds as investment vehicles. These services include 24-hour access to account information and market information over the Internet and through telephone representatives, investor education materials, and asset allocation tools. The Board also considered that it reviews customer service metrics such as telephone response times, continuity of services on the website and metrics addressing services at Fidelity Investor Centers.
Investment in a Large Fund Family. The Board considered the benefits to shareholders of investing in a fund that is part of a large family of funds offering a variety of investment disciplines and providing a large variety of fund investor services. The Board noted that Fidelity had taken, or had made recommendations that resulted in the Fidelity funds taking, a number of actions over the previous year that benefited particular funds and/or the Fidelity funds in general.
Investment Performance. The Board took into account discussions that occur with representatives of the Investment Advisers, and reports that it receives, at Board meetings throughout the year, relating to fund investment performance. In this regard the Board noted that as part of regularly scheduled fund reviews and other reports to the Board on fund performance, the Board considered annualized return information for the fund for different time periods, measured against an appropriate securities market index (benchmark index) and an appropriate peer group of funds with similar objectives (peer group). The Board also considered information about performance attribution. In its ongoing evaluation of fund investment performance, the Board gives particular attention to information indicating changes in performance of the funds over different time periods and discussed with the Investment Advisers the reasons for any overperformance or underperformance.
In addition to reviewing absolute and relative fund performance, the Independent Trustees periodically consider the appropriateness of fund performance metrics in evaluating the results achieved. The Independent Trustees generally give greater weight to fund performance over longer time periods than over shorter time periods. Depending on the circumstances, the Independent Trustees may be satisfied with a fund's performance notwithstanding that it lags its benchmark index or peer group for certain periods.
Based on its review, the Board concluded that the nature, extent, and quality of services provided to the fund under the Advisory Contracts should continue to benefit the shareholders of the fund.
Competitiveness of Management Fee and Total Expense Ratio. The Board was provided with information regarding industry trends in management fees and expenses. The Board considered that, effective March 1, 2024, an amended Advisory Contract with FMR went into effect with a fee based on tiered schedules and subject to a maximum class-level rate (the management fee). The Board also considered that in exchange for the management fee, the fund receives investment advisory, management, administrative, transfer agent, and pricing and bookkeeping services. In its review of the fund's management fee and total expense ratio, the Board considered the fund's pro forma management fee rate as if it had been in effect for the 12-month period ended September 30, 2023, as well as other third-party fund expenses, such as custodial, legal, and audit fees. The Board noted that Fidelity may agree to waive fees or reimburse expenses from time to time, and the extent to which, if any, it has done so for the fund. The Board also considered information about the impact of the fund's performance adjustment.
Comparisons of Management Fees and Total Expense Ratios. Among other things, the Board reviewed data for selected groups of competitive funds and classes (referred to as "mapped groups") that were compiled by Fidelity based on combining similar investment objective categories (as classified by Morningstar) that have comparable investment mandates. The data reviewed by the Board included (i) gross management fee comparisons (before taking into account expense reimbursements or caps and without taking into account the fund's performance adjustment) relative to the total universe of funds within the mapped group; (ii) gross management fee comparisons relative to a subset of non-Fidelity funds in the mapped group that are similar in size and management fee structure to the fund (referred to as the "asset size peer group"); (iii) total expense comparisons of the fund relative to funds and classes in the mapped group that have a similar sales load structure to the fund (referred to as the "similar sales load structure group"); and (iv) total expense comparisons of the fund relative to funds and classes in the similar sales load structure group that are similar in size and management fee structure to the fund (referred to as the "total expense asset size peer group"). The total expense asset size peer group comparison excludes performance adjustments and fund-paid 12b-1 fees to eliminate variability in fee structures.
The information provided to the Board indicated that the fund's management fee rate ranked above the competitive median of the mapped group for the 12-month period ended September 30, 2023 and below the competitive median of the asset size peer group for the 12-month period ended September 30, 2023. Further, the information provided to the Board indicated that the total expense ratio of the fund ranked below the competitive median of the similar sales load structure group for the 12-month period ended September 30, 2023 and below the competitive median of the total expense asset size peer group for the 12-month period ended September 30, 2023. The Board noted that the fund has a management fee structure that covers expenses for services beyond portfolio management and further noted that Fidelity believes that total expense ratio comparisons are more useful in this context.
The Board also considered that the fund's management fee is subject to upward or downward adjustment depending upon whether, and to what extent, the fund's investment performance for the performance period (a rolling 36-month period) exceeds, or is exceeded by, a securities index, thus leading to a performance adjustment for the same period. The Board noted that the performance adjustment provides FMR with a strong economic incentive to seek to achieve superior long-term performance for the fund's shareholders and helps to more closely align the interests of FMR and the shareholders of the fund.
Fees Charged to Other Fidelity Clients. The Board also considered Fidelity fee structures and other information with respect to clients of Fidelity, such as other funds advised or subadvised by Fidelity, pension plan clients, and other institutional clients with similar mandates. The Board noted that a joint ad hoc committee created by it and the boards of other Fidelity funds periodically reviews and compares Fidelity's institutional investment advisory business with its business of providing services to the Fidelity funds and also noted the most recent findings of the committee. The Board noted that the committee's review included a consideration of the differences in services provided, fees charged, and costs incurred, as well as competition in the markets serving the different categories of clients.
Based on its review, the Board concluded that the fund's management fee is fair and reasonable in light of the services that the fund receives and the other factors considered. Further, based on its review of total expense ratios and fees charged to other Fidelity clients, the Board concluded that the fund's total expense ratio was reasonable in light of the services that the fund and its shareholders receive and the other factors considered.
Costs of the Services and Profitability. The Board considered the revenues earned and the expenses incurred by Fidelity in conducting the business of developing, marketing, distributing, managing, administering and servicing the fund and servicing the fund's shareholders. The Board also considered the level of Fidelity's profits in respect of all the Fidelity funds.
On an annual basis, Fidelity presents to the Board information about the profitability of its relationships with the fund. Fidelity calculates profitability information for each fund, as well as aggregate profitability information for groups of Fidelity funds and all Fidelity funds, using a series of detailed revenue and cost allocation methodologies which originate with the books and records of Fidelity on which Fidelity's audited financial statements are based. The Audit Committee of the Board reviews any significant changes from the prior year's methodologies and the full Board approves such changes.
A public accounting firm has been engaged annually by the Board as part of the Board's assessment of Fidelity's profitability analysis. The engagement includes the review and assessment of the methodologies used by Fidelity in determining the revenues and expenses attributable to Fidelity's fund business, and completion of agreed-upon procedures in respect of the mathematical accuracy of certain fund profitability information and its conformity to established allocation methodologies. After considering the reports issued under the engagement and information provided by Fidelity, the Board concluded that while other allocation methods may also be reasonable, Fidelity's profitability methodologies are reasonable in all material respects.
The Board also reviewed Fidelity's non-fund businesses and potential indirect benefits such businesses may have received as a result of their association with Fidelity's fund business (i.e., fall-out benefits) as well as cases where Fidelity's affiliates may benefit from the funds' business. The Board considered areas where potential indirect benefits to the Fidelity funds from their relationships with Fidelity may exist. The Board's consideration of these matters was informed by the findings of a joint ad hoc committee created by it and the boards of other Fidelity funds to evaluate potential fall-out benefits.
The Board considered the costs of the services provided by and the profits realized by Fidelity in connection with the operation of the fund and was satisfied that the profitability was not excessive.
Economies of Scale. The Board considered whether there have been economies of scale in respect of the management of the Fidelity funds, whether the Fidelity funds (including the fund) have appropriately benefited from any such economies of scale, and whether there is potential for realization of any further economies of scale. The Board considered the extent to which the fund will benefit from economies of scale as assets grow through increased services to the fund, through waivers or reimbursements, or through fee or expense ratio reductions. The Board also noted that a committee created by it and the boards of other Fidelity funds periodically analyzes whether Fidelity attains economies of scale in respect of the management and servicing of the Fidelity funds, whether the Fidelity funds have appropriately benefited from such economies of scale, and whether there is potential for realization of any further economies of scale.
The Board recognized that the fund's management contract incorporates a variable management fee structure, which provides breakpoints as a way to share, in part, any potential economies of scale that may exist at the asset class level and through a discount that considers both fund size and total assets of the four applicable asset classes. The Board considered that the variable management fee is designed to deliver the benefits of economies of scale to fund shareholders even if assets of any particular fund are unchanged or have declined, because some portion of Fidelity's costs are attributable to services provided to all funds subject to the variable management fee, and all such funds benefit if those costs can be allocated among more assets. The Board concluded that, given the variable management fee structure, fund shareholders will benefit from lower management fees due to the application of the breakpoints and discount factor, regardless of whether Fidelity achieves any such economies of scale.
The Board concluded, taking into account the analysis of the committee, that economies of scale, if any, are being appropriately shared between fund shareholders and Fidelity.
Additional Information Requested by the Board. In order to develop fully the factual basis for consideration of the Fidelity funds' advisory contracts, the Board requested and received additional information on certain topics, including but not limited to: (i) fund flow and performance trends, in particular the underperformance of certain funds and strategies, and Fidelity's long-term strategies for certain funds; (ii) the operation of performance fees and the rationale for implementing performance fees on certain categories of funds but not others; (iii) Fidelity's pricing philosophy compared to competitors; (iv) fund profitability methodology and data; (v) evaluation of competitive fund data and peer group classifications and fee and expense comparisons; (vi) the management fee and expense structures for different funds and classes and information about the differences between various fee and expense structures; (vii) the variable management fee implemented for certain funds effective March 1, 2024; and (viii) information regarding other accounts managed by Fidelity and the funds' sub-advisory arrangements.
Conclusion. Based on its evaluation of all of the conclusions noted above, and after considering all factors it believed relevant, the Board, including the Independent Trustees, concluded that the advisory and sub-advisory fee arrangements are fair and reasonable in light of all of the surrounding circumstances and that the fund's Advisory Contracts should be renewed through May 31, 2025.
1.788861.121
BCV-ANN-0924
Fidelity® Small Cap Growth K6 Fund
Annual Report
July 31, 2024
Contents
To view a fund's proxy voting guidelines and proxy voting record for the 12-month period ended June 30, visit http://www.fidelity.com/proxyvotingresults or visit the Securities and Exchange Commission's (SEC) web site at http://www.sec.gov.
You may also call 1-800-835-5092 to request a free copy of the proxy voting guidelines.
Standard & Poor's, S&P and S&P 500 are registered service marks of The McGraw-Hill Companies, Inc. and have been licensed for use by Fidelity Distributors Corporation.
Other third-party marks appearing herein are the property of their respective owners.
All other marks appearing herein are registered or unregistered trademarks or service marks of FMR LLC or an affiliated company. © 2024 FMR LLC. All rights reserved.
This report and the financial statements contained herein are submitted for the general information of the shareholders of the Fund. This report is not authorized for distribution to prospective investors in the Fund unless preceded or accompanied by an effective prospectus.
A fund files its complete schedule of portfolio holdings with the SEC for the first and third quarters of each fiscal year on Form N-PORT. Forms N-PORT are available on the SEC's web site at http://www.sec.gov. A fund's Forms N-PORT may be reviewed and copied at the SEC's Public Reference Room in Washington, DC. Information regarding the operation of the SEC's Public Reference Room may be obtained by calling 1-800-SEC-0330.
For a complete list of a fund's portfolio holdings, view the most recent holdings listing, semiannual report, or annual report on Fidelity's web site at http://www.fidelity.com, http://www.institutional.fidelity.com, or http://www.401k.com, as applicable.
NOT FDIC INSURED •MAY LOSE VALUE •NO BANK GUARANTEE
Neither the Fund nor Fidelity Distributors Corporation is a bank.
Item 7: Consolidated Financial Statements and Consolidated Financial Highlights for Open-End Management Investment Companies (Annual Report)
Fidelity® Small Cap Growth K6 Fund
Consolidated Schedule of Investments July 31, 2024
Showing Percentage of Net Assets
| Common Stocks - 95.8% |
| | | Shares | Value ($) |
| COMMUNICATION SERVICES - 0.9% | | | |
| Entertainment - 0.1% | | | |
| IMAX Corp. (a) | | 87,001 | 1,835,721 |
| Interactive Media & Services - 0.6% | | | |
| Cars.com, Inc. (a) | | 546,953 | 11,278,171 |
| Reddit, Inc. Class B | | 46,800 | 2,847,780 |
| Yelp, Inc. (a) | | 109,476 | 3,988,211 |
| | | | 18,114,162 |
| Media - 0.2% | | | |
| TechTarget, Inc. (a) | | 232,154 | 7,428,928 |
TOTAL COMMUNICATION SERVICES | | | 27,378,811 |
| CONSUMER DISCRETIONARY - 12.3% | | | |
| Automobile Components - 0.3% | | | |
| Autoliv, Inc. | | 77,925 | 7,881,335 |
| Diversified Consumer Services - 2.1% | | | |
| Duolingo, Inc. (a) | | 102,606 | 17,642,076 |
| Grand Canyon Education, Inc. (a) | | 112,719 | 17,578,528 |
| H&R Block, Inc. | | 129,505 | 7,503,520 |
| OneSpaWorld Holdings Ltd. | | 321,306 | 5,169,814 |
| Stride, Inc. (a)(b) | | 80,373 | 6,106,741 |
| Udemy, Inc. (a) | | 357,434 | 3,302,690 |
| Universal Technical Institute, Inc. (a) | | 238,300 | 4,513,402 |
| | | | 61,816,771 |
| Hotels, Restaurants & Leisure - 2.3% | | | |
| Brinker International, Inc. (a) | | 373,986 | 24,986,005 |
| Cava Group, Inc. (a) | | 105,083 | 8,850,090 |
| Dutch Bros, Inc. (a) | | 313,548 | 11,993,211 |
| GEN Restaurant Group, Inc. (a) | | 13,748 | 118,920 |
| Kura Sushi U.S.A., Inc. Class A (a)(b) | | 125,002 | 7,186,365 |
| Red Rock Resorts, Inc. | | 229,462 | 13,079,334 |
| | | | 66,213,925 |
| Household Durables - 2.7% | | | |
| Installed Building Products, Inc. (b) | | 99,628 | 26,934,430 |
| KB Home | | 147,313 | 12,680,703 |
| Lovesac (a)(b) | | 448,972 | 12,283,874 |
| SharkNinja, Inc. | | 199,209 | 15,309,212 |
| TopBuild Corp. (a) | | 25,569 | 12,235,789 |
| | | | 79,444,008 |
| Leisure Products - 0.3% | | | |
| Games Workshop Group PLC | | 53,133 | 7,035,428 |
| Specialty Retail - 4.0% | | | |
| Abercrombie & Fitch Co. Class A (a) | | 145,730 | 21,492,260 |
| Aritzia, Inc. (a) | | 314,555 | 10,325,305 |
| BARK, Inc. warrants 6/1/26 (a) | | 54 | 3 |
| Boot Barn Holdings, Inc. (a) | | 145,883 | 19,472,463 |
| Chewy, Inc. (a) | | 413,737 | 10,004,161 |
| Fanatics, Inc. Class A (a)(c)(d) | | 163,048 | 10,722,036 |
| Group 1 Automotive, Inc. | | 37,560 | 13,736,443 |
| Murphy U.S.A., Inc. | | 35,292 | 17,819,637 |
| Valvoline, Inc. (a) | | 293,539 | 13,649,564 |
| | | | 117,221,872 |
| Textiles, Apparel & Luxury Goods - 0.6% | | | |
| Crocs, Inc. (a) | | 127,760 | 17,167,111 |
TOTAL CONSUMER DISCRETIONARY | | | 356,780,450 |
| CONSUMER STAPLES - 2.6% | | | |
| Beverages - 0.2% | | | |
| The Vita Coco Co., Inc. (a) | | 215,085 | 5,557,796 |
| Consumer Staples Distribution & Retail - 2.0% | | | |
| Casey's General Stores, Inc. | | 23,997 | 9,306,996 |
| Sprouts Farmers Market LLC (a)(b) | | 245,774 | 24,550,365 |
| U.S. Foods Holding Corp. (a) | | 458,180 | 24,920,410 |
| | | | 58,777,771 |
| Food Products - 0.2% | | | |
| Lamb Weston Holdings, Inc. | | 72,293 | 4,339,026 |
| Vital Farms, Inc. (a) | | 65,590 | 2,393,379 |
| | | | 6,732,405 |
| Personal Care Products - 0.2% | | | |
| elf Beauty, Inc. (a) | | 25,908 | 4,471,203 |
TOTAL CONSUMER STAPLES | | | 75,539,175 |
| ENERGY - 4.6% | | | |
| Energy Equipment & Services - 3.4% | | | |
| Cactus, Inc. Class A | | 290,746 | 18,351,888 |
| Championx Corp. | | 168,367 | 5,768,253 |
| Expro Group Holdings NV (a) | | 466,187 | 10,824,862 |
| Liberty Energy, Inc. Class A | | 795,545 | 19,212,412 |
| TechnipFMC PLC | | 434,473 | 12,816,954 |
| Tidewater, Inc. (a) | | 117,737 | 11,651,254 |
| Weatherford International PLC | | 158,447 | 18,674,563 |
| | | | 97,300,186 |
| Oil, Gas & Consumable Fuels - 1.2% | | | |
| Antero Resources Corp. (a) | | 328,133 | 9,522,420 |
| Northern Oil & Gas, Inc. (b) | | 412,584 | 17,819,503 |
| Range Resources Corp. | | 237,767 | 7,425,463 |
| | | | 34,767,386 |
TOTAL ENERGY | | | 132,067,572 |
| FINANCIALS - 6.6% | | | |
| Banks - 1.0% | | | |
| Eastern Bankshares, Inc. | | 512,600 | 8,529,664 |
| Pinnacle Financial Partners, Inc. | | 193,867 | 18,673,269 |
| Starling Bank Ltd. Series D (a)(c)(d) | | 431,700 | 1,759,261 |
| | | | 28,962,194 |
| Capital Markets - 2.5% | | | |
| Houlihan Lokey | | 89,251 | 13,409,963 |
| Perella Weinberg Partners (c) | | 457,262 | 8,642,252 |
| Perella Weinberg Partners Class A | | 474,317 | 8,964,591 |
| StepStone Group, Inc. Class A | | 386,622 | 19,431,622 |
| Stifel Financial Corp. | | 219,140 | 19,431,144 |
| WisdomTree Investments, Inc. (b) | | 353,325 | 4,218,701 |
| | | | 74,098,273 |
| Consumer Finance - 0.4% | | | |
| FirstCash Holdings, Inc. | | 49,470 | 5,520,852 |
| PROG Holdings, Inc. | | 124,185 | 5,595,776 |
| | | | 11,116,628 |
| Financial Services - 1.5% | | | |
| AvidXchange Holdings, Inc. (a)(b) | | 822,670 | 7,354,670 |
| Flywire Corp. (a) | | 763,215 | 13,974,467 |
| HA Sustainable Infrastructure Capital, Inc. (b) | | 312,940 | 10,255,044 |
| Walker & Dunlop, Inc. | | 116,177 | 12,419,321 |
| | | | 44,003,502 |
| Insurance - 1.2% | | | |
| Selective Insurance Group, Inc. | | 53,760 | 4,855,603 |
| Stewart Information Services Corp. | | 117,729 | 8,323,440 |
| The Baldwin Insurance Group, Inc. Class A, (a) | | 464,194 | 20,303,846 |
| TWFG, Inc. | | 16,700 | 421,842 |
| | | | 33,904,731 |
TOTAL FINANCIALS | | | 192,085,328 |
| HEALTH CARE - 22.3% | | | |
| Biotechnology - 11.0% | | | |
| ADMA Biologics, Inc. (a) | | 504,690 | 6,197,593 |
| Allogene Therapeutics, Inc. (a) | | 520,834 | 1,531,252 |
| ALX Oncology Holdings, Inc. (a)(b) | | 646,526 | 3,103,325 |
| AnaptysBio, Inc. (a) | | 238,400 | 8,305,856 |
| Annexon, Inc. (a)(b) | | 495,357 | 3,175,238 |
| Apogee Therapeutics, Inc. (b) | | 108,780 | 5,297,586 |
| Arcellx, Inc. (a) | | 206,740 | 12,778,599 |
| Arrowhead Pharmaceuticals, Inc. (a) | | 324,431 | 9,265,749 |
| Ascendis Pharma A/S sponsored ADR (a) | | 61,485 | 8,208,248 |
| Astria Therapeutics, Inc. (a) | | 514,290 | 6,006,907 |
| Autolus Therapeutics PLC ADR (a) | | 986,472 | 4,626,554 |
| Avidity Biosciences, Inc. (a) | | 191,700 | 8,737,686 |
| Blueprint Medicines Corp. (a) | | 167,013 | 18,087,508 |
| Boundless Bio, Inc. | | 65,974 | 254,000 |
| Boundless Bio, Inc. (b) | | 13,065 | 50,300 |
| Cargo Therapeutics, Inc. (c) | | 121,347 | 2,066,539 |
| Cargo Therapeutics, Inc. | | 235,392 | 4,008,726 |
| Celldex Therapeutics, Inc. (a) | | 177,124 | 6,750,196 |
| Crinetics Pharmaceuticals, Inc. (a) | | 185,190 | 9,837,293 |
| Cytokinetics, Inc. (a) | | 325,082 | 19,183,089 |
| Denali Therapeutics, Inc. (a) | | 22,474 | 547,691 |
| Dyne Therapeutics, Inc. (a) | | 102,574 | 4,401,450 |
| Insmed, Inc. (a) | | 211,720 | 15,402,630 |
| Janux Therapeutics, Inc. (a) | | 236,878 | 9,617,247 |
| Keros Therapeutics, Inc. (a) | | 142,562 | 7,150,910 |
| Kiniksa Pharmaceuticals Intern (a) | | 146,101 | 3,886,287 |
| Legend Biotech Corp. ADR (a) | | 73,066 | 4,120,192 |
| Madrigal Pharmaceuticals, Inc. (a)(b) | | 51,888 | 14,770,438 |
| Merus BV (a)(b) | | 174,991 | 9,281,523 |
| Monte Rosa Therapeutics, Inc. (a) | | 229,755 | 1,038,493 |
| Moonlake Immunotherapeutics Class A (a) | | 52,805 | 2,199,328 |
| Neurogene, Inc. (a)(b) | | 63,600 | 2,616,504 |
| Nuvalent, Inc. Class A (a) | | 182,627 | 14,599,202 |
| ORIC Pharmaceuticals, Inc. (a)(b) | | 483,017 | 5,409,790 |
| Revolution Medicines, Inc. (a) | | 234,600 | 10,707,144 |
| Spyre Therapeutics, Inc. (a) | | 146,547 | 4,030,043 |
| Tango Therapeutics, Inc. (a) | | 468,833 | 4,618,005 |
| Tyra Biosciences, Inc. (c) | | 182,289 | 4,039,524 |
| Tyra Biosciences, Inc. (a) | | 245,358 | 5,437,133 |
| Vaxcyte, Inc. (a) | | 284,159 | 22,417,304 |
| Vericel Corp. (a) | | 313,957 | 15,861,108 |
| Viking Therapeutics, Inc. (a)(b) | | 163,164 | 9,300,348 |
| Viridian Therapeutics, Inc. (a) | | 292,689 | 4,931,810 |
| Xenon Pharmaceuticals, Inc. (a) | | 131,467 | 5,670,172 |
| Zentalis Pharmaceuticals, Inc. (a) | | 267,841 | 1,041,901 |
| | | | 320,568,421 |
| Health Care Equipment & Supplies - 4.7% | | | |
| Atricure, Inc. (a) | | 198,244 | 4,276,123 |
| Glaukos Corp. (a) | | 178,434 | 20,907,112 |
| Integer Holdings Corp. (a) | | 75,188 | 8,929,327 |
| Lantheus Holdings, Inc. (a) | | 209,302 | 21,941,129 |
| Masimo Corp. (a) | | 71,659 | 7,666,080 |
| NeuroPace, Inc. (a) | | 68,127 | 526,622 |
| Nyxoah SA (a)(b) | | 254,353 | 2,154,370 |
| Penumbra, Inc. (a) | | 34,720 | 5,801,365 |
| PROCEPT BioRobotics Corp. (a)(b) | | 239,057 | 15,137,089 |
| Pulmonx Corp. (a) | | 561,570 | 3,880,449 |
| RxSight, Inc. (a) | | 182,662 | 8,360,440 |
| TransMedics Group, Inc. (a)(b) | | 256,708 | 36,519,280 |
| | | | 136,099,386 |
| Health Care Providers & Services - 4.5% | | | |
| agilon health, Inc. (a) | | 682,830 | 4,704,699 |
| Astrana Health, Inc. (a) | | 56,900 | 2,984,974 |
| BrightSpring Health Services, Inc. | | 922,071 | 11,424,460 |
| Guardant Health, Inc. (a) | | 121,960 | 4,284,455 |
| HealthEquity, Inc. (a) | | 265,057 | 20,801,673 |
| Hims & Hers Health, Inc. (a) | | 686,491 | 14,581,069 |
| LifeStance Health Group, Inc. (a) | | 893,899 | 4,925,383 |
| Molina Healthcare, Inc. (a) | | 25,116 | 8,571,337 |
| Option Care Health, Inc. (a) | | 179,335 | 5,324,456 |
| Pennant Group, Inc. (a) | | 191,008 | 5,693,948 |
| Privia Health Group, Inc. (a) | | 375,573 | 7,789,384 |
| Progyny, Inc. (a) | | 310,265 | 8,749,473 |
| Surgery Partners, Inc. (a) | | 355,418 | 10,790,490 |
| The Ensign Group, Inc. | | 141,274 | 19,884,316 |
| | | | 130,510,117 |
| Health Care Technology - 0.3% | | | |
| Evolent Health, Inc. Class A (a) | | 209,144 | 4,877,238 |
| Schrodinger, Inc. (a)(b) | | 128,043 | 2,852,798 |
| | | | 7,730,036 |
| Life Sciences Tools & Services - 0.6% | | | |
| 10X Genomics, Inc. (a) | | 118,872 | 2,457,084 |
| Charles River Laboratories International, Inc. (a) | | 45,734 | 11,163,669 |
| Veterinary Emergency Group LLC Class A (a)(c)(d)(e) | | 68,413 | 3,904,330 |
| | | | 17,525,083 |
| Pharmaceuticals - 1.2% | | | |
| Alto Neuroscience, Inc. (b) | | 161,351 | 1,739,364 |
| Corcept Therapeutics, Inc. (a)(b) | | 211,546 | 8,180,484 |
| Edgewise Therapeutics, Inc. (a) | | 375,520 | 6,395,106 |
| Enliven Therapeutics, Inc. (c) | | 100,587 | 2,653,485 |
| Enliven Therapeutics, Inc. (a) | | 271,682 | 7,166,971 |
| Pharvaris BV (a) | | 269,422 | 4,617,893 |
| Rapport Therapeutics, Inc. | | 20,800 | 472,576 |
| Structure Therapeutics, Inc. ADR (a) | | 74,849 | 2,798,604 |
| Terns Pharmaceuticals, Inc. (a) | | 297,123 | 2,302,703 |
| | | | 36,327,186 |
TOTAL HEALTH CARE | | | 648,760,229 |
| INDUSTRIALS - 21.0% | | | |
| Aerospace & Defense - 0.2% | | | |
| BWX Technologies, Inc. | | 47,934 | 4,768,954 |
| Building Products - 3.4% | | | |
| AAON, Inc. | | 79,825 | 7,066,907 |
| AZZ, Inc. | | 313,824 | 25,093,367 |
| CSW Industrials, Inc. | | 36,183 | 11,738,489 |
| Fortune Brands Innovations, Inc. | | 197,368 | 15,949,308 |
| Simpson Manufacturing Co. Ltd. | | 62,354 | 11,977,580 |
| Tecnoglass, Inc. (b) | | 83,357 | 4,485,440 |
| The AZEK Co., Inc. Class A, (a) | | 272,490 | 12,232,076 |
| UFP Industries, Inc. | | 72,894 | 9,616,905 |
| | | | 98,160,072 |
| Commercial Services & Supplies - 1.2% | | | |
| ACV Auctions, Inc. Class A (a)(b) | | 510,790 | 8,724,293 |
| HNI Corp. | | 45,859 | 2,519,952 |
| The Brink's Co. | | 66,768 | 7,343,812 |
| The GEO Group, Inc. (a) | | 1,099,733 | 15,946,129 |
| | | | 34,534,186 |
| Construction & Engineering - 3.4% | | | |
| Comfort Systems U.S.A., Inc. | | 35,567 | 11,823,182 |
| Dycom Industries, Inc. (a) | | 88,945 | 16,322,297 |
| Fluor Corp. (a) | | 653,233 | 31,420,507 |
| Sterling Construction Co., Inc. (a) | | 191,971 | 22,337,746 |
| Valmont Industries, Inc. | | 60,020 | 17,907,567 |
| | | | 99,811,299 |
| Electrical Equipment - 2.1% | | | |
| Acuity Brands, Inc. | | 47,127 | 11,845,371 |
| Nextracker, Inc. Class A (a) | | 320,644 | 15,756,446 |
| nVent Electric PLC | | 193,725 | 14,070,247 |
| Prysmian SpA | | 170,292 | 11,710,328 |
| Sunrun, Inc. (a)(b) | | 436,400 | 7,650,092 |
| | | | 61,032,484 |
| Machinery - 3.9% | | | |
| Crane Co. | | 90,955 | 14,591,001 |
| ESAB Corp. | | 106,628 | 10,833,405 |
| Federal Signal Corp. | | 156,416 | 15,636,908 |
| Gates Industrial Corp. PLC (a) | | 603,775 | 11,224,177 |
| ITT, Inc. | | 117,137 | 16,570,200 |
| Mueller Industries, Inc. (b) | | 273,704 | 19,416,562 |
| Oshkosh Corp. | | 49,300 | 5,356,445 |
| REV Group, Inc. | | 251,100 | 7,327,098 |
| Terex Corp. | | 83,600 | 5,288,536 |
| Timken Co. | | 67,611 | 5,878,776 |
| | | | 112,123,108 |
| Marine Transportation - 0.3% | | | |
| Kirby Corp. (a) | | 82,462 | 10,132,931 |
| Professional Services - 2.8% | | | |
| CACI International, Inc. (a) | | 43,208 | 19,939,628 |
| CBIZ, Inc. (a) | | 112,034 | 7,775,160 |
| ExlService Holdings, Inc. (a) | | 571,531 | 20,152,183 |
| Insperity, Inc. (b) | | 99,892 | 10,260,906 |
| KBR, Inc. | | 151,053 | 10,058,619 |
| Verra Mobility Corp. (a) | | 422,479 | 12,729,292 |
| | | | 80,915,788 |
| Trading Companies & Distributors - 3.7% | | | |
| Alligo AB (B Shares) | | 342,593 | 4,504,267 |
| Applied Industrial Technologies, Inc. | | 161,780 | 35,298,778 |
| FTAI Aviation Ltd. (b) | | 379,546 | 42,300,402 |
| GMS, Inc. (a) | | 157,197 | 15,127,067 |
| Herc Holdings, Inc. | | 29,681 | 4,625,487 |
| Xometry, Inc. (a)(b) | | 399,009 | 5,837,502 |
| | | | 107,693,503 |
TOTAL INDUSTRIALS | | | 609,172,325 |
| INFORMATION TECHNOLOGY - 18.9% | | | |
| Communications Equipment - 0.2% | | | |
| Lumentum Holdings, Inc. (a) | | 92,789 | 4,804,614 |
| Electronic Equipment, Instruments & Components - 6.9% | | | |
| Advanced Energy Industries, Inc. | | 171,363 | 19,941,512 |
| Belden, Inc. | | 121,440 | 11,256,274 |
| Cognex Corp. | | 110,118 | 5,464,055 |
| Coherent Corp. (a) | | 138,300 | 9,636,744 |
| Crane NXT Co. | | 194,518 | 12,231,292 |
| Fabrinet (a) | | 104,132 | 22,967,354 |
| Insight Enterprises, Inc. (a) | | 211,227 | 47,420,462 |
| Littelfuse, Inc. | | 6,046 | 1,614,947 |
| OSI Systems, Inc. (a) | | 20,500 | 3,033,590 |
| Par Technology Corp. (a)(b) | | 201,690 | 10,213,582 |
| Sanmina Corp. (a) | | 157,040 | 11,829,823 |
| TD SYNNEX Corp. | | 216,998 | 25,859,652 |
| Vontier Corp. | | 466,615 | 18,305,306 |
| | | | 199,774,593 |
| IT Services - 1.5% | | | |
| Kyndryl Holdings, Inc. (a) | | 244,540 | 6,570,790 |
| Wix.com Ltd. (a) | | 234,774 | 36,607,136 |
| | | | 43,177,926 |
| Semiconductors & Semiconductor Equipment - 3.6% | | | |
| AEHR Test Systems (a)(b) | | 213,200 | 4,023,084 |
| Allegro MicroSystems LLC (a) | | 550,818 | 13,241,665 |
| Axcelis Technologies, Inc. (a) | | 72,730 | 9,189,436 |
| Camtek Ltd. (b) | | 49,820 | 5,231,100 |
| MACOM Technology Solutions Holdings, Inc. (a) | | 138,056 | 13,932,612 |
| MKS Instruments, Inc. | | 55,580 | 6,997,522 |
| Nova Ltd. (a) | | 91,179 | 18,825,728 |
| Onto Innovation, Inc. (a) | | 56,743 | 10,854,936 |
| Ultra Clean Holdings, Inc. (a) | | 225,830 | 9,769,406 |
| Veeco Instruments, Inc. (a) | | 340,763 | 14,110,996 |
| | | | 106,176,485 |
| Software - 6.7% | | | |
| Agilysys, Inc. (a) | | 34,700 | 3,889,523 |
| Algolia, Inc. (a)(c)(d) | | 43,269 | 721,727 |
| Alkami Technology, Inc. (a) | | 378,932 | 12,402,444 |
| Altair Engineering, Inc. Class A (a) | | 53,470 | 4,724,609 |
| Cellebrite DI Ltd. (a) | | 560,050 | 7,672,685 |
| CommVault Systems, Inc. (a) | | 106,795 | 16,323,616 |
| Convoy, Inc. warrants (a)(c)(d) | | 12,642 | 0 |
| CyberArk Software Ltd. (a) | | 32,595 | 8,356,706 |
| Intapp, Inc. (a) | | 220,185 | 7,889,229 |
| JFrog Ltd. (a) | | 293,239 | 11,307,296 |
| Life360, Inc. (b) | | 78,099 | 2,620,221 |
| Lightspeed Commerce, Inc. Subordinate (vtg.) Shares (United States) (a)(b) | | 15,519 | 207,799 |
| Lumine Group, Inc. (a) | | 186,500 | 4,991,254 |
| Monday.com Ltd. (a) | | 64,720 | 14,873,303 |
| nCino, Inc. (a) | | 329,923 | 10,808,277 |
| Onestream, Inc. | | 3,800 | 105,830 |
| Q2 Holdings, Inc. (a)(b) | | 130,390 | 8,797,413 |
| Semrush Holdings, Inc. (a) | | 940,244 | 13,859,197 |
| SPS Commerce, Inc. (a) | | 55,753 | 12,010,311 |
| TECSYS, Inc. (b) | | 262,342 | 7,604,336 |
| Tenable Holdings, Inc. (a) | | 477,415 | 21,922,897 |
| Varonis Systems, Inc. (a) | | 156,972 | 8,653,866 |
| Vertex, Inc. Class A (a) | | 368,410 | 14,607,457 |
| | | | 194,349,996 |
TOTAL INFORMATION TECHNOLOGY | | | 548,283,614 |
| MATERIALS - 5.1% | | | |
| Chemicals - 2.5% | | | |
| Aspen Aerogels, Inc. (a)(b) | | 216,050 | 4,409,581 |
| Axalta Coating Systems Ltd. (a) | | 582,175 | 20,754,539 |
| Cabot Corp. | | 233,388 | 23,406,483 |
| Element Solutions, Inc. | | 424,371 | 11,436,798 |
| Orion SA | | 470,005 | 11,571,523 |
| | | | 71,578,924 |
| Construction Materials - 0.5% | | | |
| Eagle Materials, Inc. | | 57,289 | 15,599,795 |
| Metals & Mining - 1.8% | | | |
| ATI, Inc. (a)(b) | | 366,347 | 24,805,355 |
| Carpenter Technology Corp. | | 186,410 | 27,191,627 |
| | | | 51,996,982 |
| Paper & Forest Products - 0.3% | | | |
| Louisiana-Pacific Corp. | | 95,320 | 9,356,611 |
TOTAL MATERIALS | | | 148,532,312 |
| REAL ESTATE - 1.3% | | | |
| Equity Real Estate Investment Trusts (REITs) - 0.8% | | | |
| Ryman Hospitality Properties, Inc. | | 158,177 | 15,898,370 |
| Terreno Realty Corp. | | 100,910 | 6,903,253 |
| | | | 22,801,623 |
| Real Estate Management & Development - 0.5% | | | |
| Compass, Inc. (a) | | 2,911,361 | 12,780,875 |
| LandBridge Co. LLC | | 101,500 | 3,346,455 |
| | | | 16,127,330 |
TOTAL REAL ESTATE | | | 38,928,953 |
| UTILITIES - 0.2% | | | |
| Independent Power and Renewable Electricity Producers - 0.2% | | | |
| Sunnova Energy International, Inc. (a)(b) | | 793,600 | 5,610,752 |
| TOTAL COMMON STOCKS (Cost $2,179,443,163) | | | 2,783,139,521 |
| | | | |
| Convertible Preferred Stocks - 0.8% |
| | | Shares | Value ($) |
| HEALTH CARE - 0.3% | | | |
| Biotechnology - 0.3% | | | |
| Bright Peak Therapeutics, Inc.: | | | |
| Series B (a)(c)(d) | | 199,331 | 324,910 |
| Series C (c)(d) | | 1,323,335 | 1,508,602 |
| Caris Life Sciences, Inc. Series D (a)(c)(d) | | 144,435 | 395,752 |
| Endeavor BioMedicines, Inc. Series C (c)(d) | | 210,174 | 1,509,049 |
| LifeMine Therapeutics, Inc. Series C (a)(c)(d) | | 402,743 | 833,678 |
| Sonoma Biotherapeutics, Inc.: | | | |
| Series B (a)(c)(d) | | 438,013 | 1,257,097 |
| Series B1 (a)(c)(d) | | 233,603 | 756,874 |
| T-Knife Therapeutics, Inc. Series B (a)(c)(d) | | 201,583 | 336,644 |
| Treeline Biosciences Series A (a)(c)(d) | | 21,246 | 190,789 |
| | | | 7,113,395 |
| Health Care Technology - 0.0% | | | |
| Wugen, Inc. Series B (a)(c)(d) | | 59,982 | 249,525 |
TOTAL HEALTH CARE | | | 7,362,920 |
| INDUSTRIALS - 0.3% | | | |
| Construction & Engineering - 0.3% | | | |
| Beta Technologies, Inc.: | | | |
| Series A (a)(c)(d) | | 62,752 | 6,915,898 |
| Series B, 6.00% (a)(c)(d) | | 11,821 | 1,482,472 |
| | | | 8,398,370 |
| INFORMATION TECHNOLOGY - 0.2% | | | |
| Communications Equipment - 0.1% | | | |
| Astranis Space Technologies Corp.: | | | |
| Series C (a)(c)(d) | | 125,912 | 1,612,933 |
| Series C Prime (a)(c)(d) | | 26,805 | 343,372 |
| Series D (c)(d) | | 181,965 | 1,701,373 |
| | | | 3,657,678 |
| IT Services - 0.0% | | | |
| Yanka Industries, Inc.: | | | |
| Series E (a)(c)(d) | | 191,029 | 939,863 |
| Series F (a)(c)(d) | | 28,989 | 180,022 |
| | | | 1,119,885 |
| Software - 0.1% | | | |
| Algolia, Inc. Series D (a)(c)(d) | | 9,900 | 165,132 |
| Convoy, Inc. Series D (a)(c)(d) | | 192,936 | 2 |
| Mountain Digital, Inc. Series D (a)(c)(d) | | 140,383 | 1,881,132 |
| Skyryse, Inc. Series B (a)(c)(d) | | 12,000 | 254,400 |
| | | | 2,300,666 |
TOTAL INFORMATION TECHNOLOGY | | | 7,078,229 |
| TOTAL CONVERTIBLE PREFERRED STOCKS (Cost $29,511,177) | | | 22,839,519 |
| | | | |
| Investment Companies - 2.0% |
| | | Shares | Value ($) |
iShares Russell 2000 Growth ETF (b) (Cost $47,620,860) | | 206,535 | 58,647,672 |
| | | | |
| Convertible Bonds - 0.0% |
| | | Principal Amount (f) | Value ($) |
| HEALTH CARE - 0.0% | | | |
| Health Care Technology - 0.0% | | | |
| Wugen, Inc. 10% 6/14/25 (c)(d) | | 253,458 | 259,262 |
| INFORMATION TECHNOLOGY - 0.0% | | | |
| Software - 0.0% | | | |
| Convoy, Inc. 15% 9/30/26 (c)(d) | | 84,195 | 0 |
| TOTAL CONVERTIBLE BONDS (Cost $337,653) | | | 259,262 |
| | | | |
| Money Market Funds - 7.2% |
| | | Shares | Value ($) |
| Fidelity Cash Central Fund 5.39% (g) | | 41,148,829 | 41,157,059 |
| Fidelity Securities Lending Cash Central Fund 5.39% (g)(h) | | 167,872,223 | 167,889,010 |
| TOTAL MONEY MARKET FUNDS (Cost $209,046,069) | | | 209,046,069 |
| | | | |
| TOTAL INVESTMENT IN SECURITIES - 105.8% (Cost $2,465,958,922) | 3,073,932,043 |
NET OTHER ASSETS (LIABILITIES) - (5.8)% | (168,574,036) |
| NET ASSETS - 100.0% | 2,905,358,007 |
| | |
Security Type Abbreviations
Legend
| (b) | Security or a portion of the security is on loan at period end. |
| (c) | Restricted securities (including private placements) - Investment in securities not registered under the Securities Act of 1933 (excluding 144A issues). At the end of the period, the value of restricted securities (excluding 144A issues) amounted to $57,607,935 or 2.0% of net assets. |
| (e) | Investment is owned by a wholly-owned subsidiary (Subsidiary) that is treated as a corporation for U.S. tax purposes. |
| (f) | Amount is stated in United States dollars unless otherwise noted. |
| (g) | Affiliated fund that is generally available only to investment companies and other accounts managed by Fidelity Investments. The rate quoted is the annualized seven-day yield of the fund at period end. A complete unaudited listing of the fund's holdings as of its most recent quarter end is available upon request. In addition, each Fidelity Central Fund's financial statements, which are not covered by the Fund's Report of Independent Registered Public Accounting Firm, are available on the SEC's website or upon request. |
| (h) | Investment made with cash collateral received from securities on loan. |
| Additional information on each restricted holding is as follows: |
| Security | Acquisition Date | Acquisition Cost ($) |
| Algolia, Inc. | 10/27/21 | 1,265,404 |
| | | |
| Algolia, Inc. Series D | 7/23/21 | 289,526 |
| | | |
| Astranis Space Technologies Corp. Series C | 3/19/21 | 2,760,108 |
| | | |
| Astranis Space Technologies Corp. Series C Prime | 4/05/23 | 587,591 |
| | | |
| Astranis Space Technologies Corp. Series D | 4/25/24 | 1,699,990 |
| | | |
| Beta Technologies, Inc. Series A | 4/09/21 | 4,597,839 |
| | | |
| Beta Technologies, Inc. Series B, 6.00% | 4/04/22 | 1,219,573 |
| | | |
| Bright Peak Therapeutics, Inc. Series B | 5/14/21 | 778,587 |
| | | |
| Bright Peak Therapeutics, Inc. Series C | 5/07/24 | 1,500,000 |
| | | |
| Cargo Therapeutics, Inc. | 5/28/24 | 2,062,899 |
| | | |
| Caris Life Sciences, Inc. Series D | 5/11/21 | 1,169,924 |
| | | |
| Convoy, Inc. Series D | 10/30/19 | 2,612,353 |
| | | |
| Convoy, Inc. warrants | 3/24/23 | 0 |
| | | |
| Convoy, Inc. 15% 9/30/26 | 3/24/23 | 84,195 |
| | | |
| Endeavor BioMedicines, Inc. Series C | 4/22/24 | 1,371,301 |
| | | |
| Enliven Therapeutics, Inc. | 3/19/24 | 1,408,218 |
| | | |
| Fanatics, Inc. Class A | 8/13/20 - 3/22/21 | 2,891,600 |
| | | |
| LifeMine Therapeutics, Inc. Series C | 2/15/22 | 820,222 |
| | | |
| Mountain Digital, Inc. Series D | 11/05/21 | 3,223,938 |
| | | |
| Perella Weinberg Partners | 12/29/20 | 4,572,620 |
| | | |
| Skyryse, Inc. Series B | 10/21/21 | 296,160 |
| | | |
| Sonoma Biotherapeutics, Inc. Series B | 7/26/21 | 865,645 |
| | | |
| Sonoma Biotherapeutics, Inc. Series B1 | 7/26/21 | 692,516 |
| | | |
| Starling Bank Ltd. Series D | 6/18/21 - 4/05/22 | 824,189 |
| | | |
| T-Knife Therapeutics, Inc. Series B | 6/30/21 | 1,162,892 |
| | | |
| Treeline Biosciences Series A | 7/30/21 | 166,303 |
| | | |
| Tyra Biosciences, Inc. | 2/02/24 | 2,371,580 |
| | | |
| Veterinary Emergency Group LLC Class A | 9/16/21 - 10/31/23 | 3,598,868 |
| | | |
| Wugen, Inc. Series B | 7/09/21 | 465,154 |
| | | |
| Wugen, Inc. 10% 6/14/25 | 6/14/24 | 253,458 |
| | | |
| Yanka Industries, Inc. Series E | 5/15/20 | 2,307,478 |
| | | |
| Yanka Industries, Inc. Series F | 4/08/21 | 924,077 |
| | | |
Affiliated Central Funds
Fiscal year to date information regarding the Fund's investments in Fidelity Central Funds, including the ownership percentage, is presented below.
| Affiliate | Value, beginning of period ($) | Purchases ($) | Sales Proceeds ($) | Dividend Income ($) | Realized Gain (loss) ($) | Change in Unrealized appreciation (depreciation) ($) | Value, end of period ($) | % ownership, end of period |
| Fidelity Cash Central Fund 5.39% | 7,708,078 | 806,105,609 | 772,654,508 | 1,304,150 | (2,120) | - | 41,157,059 | 0.1% |
| Fidelity Securities Lending Cash Central Fund 5.39% | 99,066,859 | 913,343,678 | 844,521,527 | 845,184 | - | - | 167,889,010 | 0.8% |
| Total | 106,774,937 | 1,719,449,287 | 1,617,176,035 | 2,149,334 | (2,120) | - | 209,046,069 | |
| | | | | | | | | |
Amounts in the dividend income column in the above table include any capital gain distributions from underlying funds, which are presented in the corresponding line item in the Consolidated Statement of Operations, if applicable.
Amounts in the dividend income column for Fidelity Securities Lending Cash Central Fund represents the income earned on investing cash collateral, less rebates paid to borrowers and any lending agent fees associated with the loan, plus any premium payments received for lending certain types of securities.
Amounts included in the purchases and sales proceeds columns may include in-kind transactions, if applicable.
Investment Valuation
The following is a summary of the inputs used, as of July 31, 2024, involving the Fund's assets and liabilities carried at fair value. The inputs or methodology used for valuing securities may not be an indication of the risk associated with investing in those securities. For more information on valuation inputs, and their aggregation into the levels used below, please refer to the Investment Valuation section in the accompanying Notes to Consolidated Financial Statements.
| Valuation Inputs at Reporting Date: |
| Description | Total ($) | Level 1 ($) | Level 2 ($) | Level 3 ($) |
Investments in Securities: | | | | |
|
| Equities: | | | | |
Communication Services | 27,378,811 | 27,378,811 | - | - |
Consumer Discretionary | 356,780,450 | 346,058,414 | - | 10,722,036 |
Consumer Staples | 75,539,175 | 75,539,175 | - | - |
Energy | 132,067,572 | 132,067,572 | - | - |
Financials | 192,085,328 | 190,326,067 | - | 1,759,261 |
Health Care | 656,123,149 | 644,855,899 | - | 11,267,250 |
Industrials | 617,570,695 | 609,172,325 | - | 8,398,370 |
Information Technology | 555,361,843 | 547,561,887 | - | 7,799,956 |
Materials | 148,532,312 | 148,532,312 | - | - |
Real Estate | 38,928,953 | 38,928,953 | - | - |
Utilities | 5,610,752 | 5,610,752 | - | - |
|
| Investment Companies | 58,647,672 | 58,647,672 | - | - |
|
| Corporate Bonds | 259,262 | - | - | 259,262 |
|
| Money Market Funds | 209,046,069 | 209,046,069 | - | - |
| Total Investments in Securities: | 3,073,932,043 | 3,033,725,908 | - | 40,206,135 |
| | | | | |
|
| Net Unrealized Appreciation on Unfunded Commitments | 946,702 | - | - | 946,702 |
| Total | 946,702 | - | - | 946,702 |
The following is a reconciliation of consolidated Investments in Securities for which Level 3 inputs were used in determining value:
| |
| Investments in Securities: | |
| Beginning Balance | $ | 43,464,598 | |
| Net Realized Gain (Loss) on Investment Securities | | - | |
| Net Unrealized Gain (Loss) on Investment Securities | | (7,137,851) | |
| Cost of Purchases | | 6,549,126 | |
| Proceeds of Sales | | - | |
| Amortization/Accretion | | - | |
| Transfers into Level 3 | | - | |
| Transfers out of Level 3 | | (2,669,738) | |
| Ending Balance | $ | 40,206,135 | |
| The change in unrealized gain (loss) for the period attributable to Level 3 securities held at July 31, 2024 | $ | (7,137,851) | |
| The information used in the above reconciliation represents fiscal year to date activity for any Investments in Securities identified as using Level 3 inputs at either the beginning or the end of the current fiscal period. Cost of purchases and proceeds of sales may include securities received and/or delivered through in-kind transactions, corporate actions or exchanges. Transfers into Level 3 were attributable to a lack of observable market data resulting from decreases in market activity, decreases in liquidity, security restructurings or corporate actions. Transfers out of Level 3 were attributable to observable market data becoming available for those securities. Transfers in or out of Level 3 represent the beginning value of any Security or Instrument where a change in the pricing level occurred from the beginning to the end of the period. Realized and unrealized gains (losses) disclosed in the reconciliation are included in Net Gain (Loss) on the Fund's consolidated Statement of Operations. | |
Consolidated Financial Statements
| Consolidated Statement of Assets and Liabilities |
As of July 31, 2024 |
| Assets | | | | |
| Investment in securities, at value (including securities loaned of $166,693,901) - See accompanying schedule: | | | | |
Unaffiliated issuers (cost $2,256,912,853) | $ | 2,864,885,974 | | |
Fidelity Central Funds (cost $209,046,069) | | 209,046,069 | | |
| | | | | |
| | | | | |
| Total Investment in Securities (cost $2,465,958,922) | | | $ | 3,073,932,043 |
| Cash | | | | 43,369 |
| Foreign currency held at value (cost $8,977) | | | | 8,888 |
| Receivable for investments sold | | | | 2,940,595 |
| Unrealized appreciation on unfunded commitments | | | | 946,702 |
| Receivable for fund shares sold | | | | 5,622,517 |
| Dividends receivable | | | | 130,410 |
| Interest receivable | | | | 20,452 |
| Distributions receivable from Fidelity Central Funds | | | | 292,339 |
Total assets | | | | 3,083,937,315 |
| Liabilities | | | | |
| Payable for investments purchased | $ | 7,494,320 | | |
| Payable for fund shares redeemed | | 1,736,842 | | |
| Accrued management fee | | 1,379,463 | | |
| Other payables and accrued expenses | | 81,082 | | |
| Collateral on securities loaned | | 167,887,601 | | |
| Total liabilities | | | | 178,579,308 |
| Commitments and contingent liabilities (see Commitments note) | | | | |
| Net Assets | | | $ | 2,905,358,007 |
| Net Assets consist of: | | | | |
| Paid in capital | | | $ | 2,273,570,432 |
| Total accumulated earnings (loss) | | | | 631,787,575 |
| Net Assets | | | $ | 2,905,358,007 |
Net Asset Value, offering price and redemption price per share ($2,905,358,007 ÷ 163,737,257 shares) | | | $ | 17.74 |
| Consolidated Statement of Operations |
| Year ended July 31, 2024 |
| Investment Income | | | | |
| Dividends | | | $ | 10,308,318 |
| Interest | | | | 16,153 |
| Income from Fidelity Central Funds (including $845,184 from security lending) | | | | 2,149,334 |
| Total income | | | | 12,473,805 |
| Expenses | | | | |
| Management fee | $ | 13,079,066 | | |
| Independent trustees' fees and expenses | | 9,841 | | |
| Interest | | 2,502 | | |
| Miscellaneous | | 37,673 | | |
| Total expenses before reductions | | 13,129,082 | | |
| Expense reductions | | (2,681) | | |
| Total expenses after reductions | | | | 13,126,401 |
| Net Investment income (loss) | | | | (652,596) |
| Realized and Unrealized Gain (Loss) | | | | |
| Net realized gain (loss) on: | | | | |
| Investment Securities: | | | | |
| Unaffiliated issuers | | 137,638,798 | | |
| Fidelity Central Funds | | (2,120) | | |
| Foreign currency transactions | | 21,731 | | |
| Total net realized gain (loss) | | | | 137,658,409 |
| Change in net unrealized appreciation (depreciation) on: | | | | |
| Investment Securities: | | | | |
| Unaffiliated issuers | | 339,867,724 | | |
| Unfunded commitments | | 946,702 | | |
| Assets and liabilities in foreign currencies | | 2,516 | | |
| Total change in net unrealized appreciation (depreciation) | | | | 340,816,942 |
| Net gain (loss) | | | | 478,475,351 |
| Net increase (decrease) in net assets resulting from operations | | | $ | 477,822,755 |
| Consolidated Statement of Changes in Net Assets |
| |
| | Year ended July 31, 2024 | | Year ended July 31, 2023 |
| Increase (Decrease) in Net Assets | | | | |
| Operations | | | | |
| Net investment income (loss) | $ | (652,596) | $ | 603,569 |
| Net realized gain (loss) | | 137,658,409 | | (52,602,775) |
| Change in net unrealized appreciation (depreciation) | | 340,816,942 | | 220,666,945 |
| Net increase (decrease) in net assets resulting from operations | | 477,822,755 | | 168,667,739 |
| Distributions to shareholders | | (4,542,314) | | (610,119) |
| | | | | |
| Share transactions | | | | |
| Proceeds from sales of shares | | 1,018,435,284 | | 854,639,564 |
| Reinvestment of distributions | | 4,525,279 | | 609,972 |
| Cost of shares redeemed | | (485,070,208) | | (394,346,321) |
| | | | | |
Net increase (decrease) in net assets resulting from share transactions | | 537,890,355 | | 460,903,215 |
| Total increase (decrease) in net assets | | 1,011,170,796 | | 628,960,835 |
| | | | | |
| Net Assets | | | | |
| Beginning of period | | 1,894,187,211 | | 1,265,226,376 |
| End of period | $ | 2,905,358,007 | $ | 1,894,187,211 |
| | | | | |
| Other Information | | | | |
| Shares | | | | |
| Sold | | 65,251,514 | | 63,751,832 |
| Issued in reinvestment of distributions | | 329,111 | | 45,351 |
| Redeemed | | (31,765,326) | | (29,606,029) |
| Net increase (decrease) | | 33,815,299 | | 34,191,154 |
| | | | | |
Consolidated Financial Highlights
Fidelity® Small Cap Growth K6 Fund |
| |
| Years ended July 31, | | 2024 | | 2023 | | 2022 | | 2021 | | 2020 |
Selected Per-Share Data | | | | | | | | | | |
| Net asset value, beginning of period | $ | 14.58 | $ | 13.22 | $ | 21.55 | $ | 15.32 | $ | 13.96 |
| Income from Investment Operations | | | | | | | | | | |
Net investment income (loss) A,B | | - C | | .01 | | .01 | | (.03) D | | - C |
| Net realized and unrealized gain (loss) | | 3.20 | | 1.36 | | (3.11) | | 6.81 | | 1.36 |
| Total from investment operations | | 3.20 | | 1.37 | | (3.10) | | 6.78 | | 1.36 |
| Distributions from net investment income | | (.04) | | (.01) | | - | | - | | - |
| Distributions from net realized gain | | - | | - | | (5.23) | | (.55) | | - |
| Total distributions | | (.04) | | (.01) | | (5.23) | | (.55) | | - |
| Net asset value, end of period | $ | 17.74 | $ | 14.58 | $ | 13.22 | $ | 21.55 | $ | 15.32 |
Total Return E | | | | 10.34% | | (20.31)% | | 44.76% | | 9.74% |
Ratios to Average Net Assets B,F,G | | | | | | | | | | |
| Expenses before reductions | | .60% | | .60% | | .60% | | .60% | | .60% |
| Expenses net of fee waivers, if any | | | | .60% | | .60% | | .60% | | .60% |
| Expenses net of all reductions | | .60% | | .60% | | .60% | | .59% | | .59% |
| Net investment income (loss) | | (.03)% | | .04% | | .09% | | (.14)% D | | (.02)% |
| Supplemental Data | | | | | | | | | | |
| Net assets, end of period (000 omitted) | $ | 2,905,358 | $ | 1,894,187 | $ | 1,265,226 | $ | 1,154,380 | $ | 899,926 |
Portfolio turnover rate H | | | | 76% I | | 81% I | | 119% | | 137% I |
ACalculated based on average shares outstanding during the period.
BNet investment income (loss) is affected by the timing of the declaration of dividends by any underlying mutual funds or exchange-traded funds (ETFs). Net investment income (loss) of any mutual funds or ETFs is not included in the Fund's net investment income (loss) ratio.
CAmount represents less than $.005 per share.
DNet investment income per share reflects one or more large, non-recurring dividend(s) which amounted to $.01 per share. Excluding such non-recurring dividend(s), the ratio of net investment income (loss) to average net assets would have been (.22)%.
ETotal returns would have been lower if certain expenses had not been reduced during the applicable periods shown.
FFees and expenses of any underlying mutual funds or exchange-traded funds (ETFs) are not included in the Fund's expense ratio. The Fund indirectly bears its proportionate share of these expenses. For additional expense information related to investments in Fidelity Central Funds, please refer to the "Investments in Fidelity Central Funds" note found in the Notes to Consolidated Financial Statements section of the most recent Annual or Semi-Annual report.
GExpense ratios reflect operating expenses of the class. Expenses before reductions do not reflect amounts reimbursed, waived, or reduced through arrangements with the investment adviser, brokerage services, or other offset arrangements, if applicable, and do not represent the amount paid by the class during periods when reimbursements, waivers or reductions occur.
HAmount does not include the portfolio activity of any underlying mutual funds or exchange-traded funds (ETFs).
IPortfolio turnover rate excludes securities received or delivered in-kind.
Notes to Consolidated Financial Statements
For the period ended July 31, 2024
1. Organization.
Fidelity Small Cap Growth K6 Fund (the Fund) is a fund of Fidelity Securities Fund (the Trust) and is authorized to issue an unlimited number of shares. Share transactions on the Consolidated Statement of Changes in Net Assets may contain exchanges between affiliated funds. The Trust is registered under the Investment Company Act of 1940, as amended (the 1940 Act), as an open-end management investment company organized as a Massachusetts business trust. Shares generally are available only to employer-sponsored retirement plans that are recordkept by Fidelity, or to certain employer-sponsored retirement plans that are not recordkept by Fidelity.
2. Investments in Fidelity Central Funds.
Funds may invest in Fidelity Central Funds, which are open-end investment companies generally available only to other investment companies and accounts managed by the investment adviser and its affiliates. The Consolidated Schedule of Investments lists any Fidelity Central Funds held as an investment as of period end, but does not include the underlying holdings of each Fidelity Central Fund. An investing fund indirectly bears its proportionate share of the expenses of the underlying Fidelity Central Funds.
Based on its investment objective, each Fidelity Central Fund may invest or participate in various investment vehicles or strategies that are similar to those of the investing fund. These strategies are consistent with the investment objectives of the investing fund and may involve certain economic risks which may cause a decline in value of each of the Fidelity Central Funds and thus a decline in the value of the investing fund.
| Fidelity Central Fund | Investment Manager | Investment Objective | Investment Practices | Expense RatioA |
| Fidelity Money Market Central Funds | Fidelity Management & Research Company LLC (FMR) | Each fund seeks to obtain a high level of current income consistent with the preservation of capital and liquidity. | Short-term Investments | Less than .005% |
A Expenses expressed as a percentage of average net assets and are as of each underlying Central Fund's most recent annual or semi-annual shareholder report.
A complete unaudited list of holdings for each Fidelity Central Fund is available upon request or at the Securities and Exchange Commission website at www.sec.gov. In addition, the financial statements of the Fidelity Central Funds which contain the significant accounting policies (including investment valuation policies) of those funds, and are not covered by the Report of Independent Registered Public Accounting Firm, are available on the Securities and Exchange Commission website or upon request.
3. Significant Accounting Policies.
The Fund is an investment company and applies the accounting and reporting guidance of the Financial Accounting Standards Board (FASB) Accounting Standards Codification Topic 946 Financial Services - Investment Companies. The consolidated financial statements have been prepared in conformity with accounting principles generally accepted in the United States of America (GAAP), which require management to make certain estimates and assumptions at the date of the consolidated financial statements. Actual results could differ from those estimates. Subsequent events, if any, through the date that the consolidated financial statements were issued have been evaluated in the preparation of the consolidated financial statements. The Fund's Consolidated Schedule of Investments lists any underlying mutual funds or exchange-traded funds (ETFs) but does not include the underlying holdings of these funds. The following summarizes the significant accounting policies of the Fund:
Investment Valuation. Investments are valued as of 4:00 p.m. Eastern time on the last calendar day of the period. The Board of Trustees (the Board) has designated the Fund's investment adviser as the valuation designee responsible for the fair valuation function and performing fair value determinations as needed. The investment adviser has established a Fair Value Committee (the Committee) to carry out the day-to-day fair valuation responsibilities and has adopted policies and procedures to govern the fair valuation process and the activities of the Committee. In accordance with these fair valuation policies and procedures, which have been approved by the Board, the Fund attempts to obtain prices from one or more third party pricing services or brokers to value its investments. When current market prices, quotations or currency exchange rates are not readily available or reliable, investments will be fair valued in good faith by the Committee, in accordance with the policies and procedures. Factors used in determining fair value vary by investment type and may include market or investment specific events, transaction data, estimated cash flows, and market observations of comparable investments. The frequency that the fair valuation procedures are used cannot be predicted and they may be utilized to a significant extent. The Committee manages the Fund's fair valuation practices and maintains the fair valuation policies and procedures. The Fund's investment adviser reports to the Board information regarding the fair valuation process and related material matters.
The Fund categorizes the inputs to valuation techniques used to value its investments into a disclosure hierarchy consisting of three levels as shown below:
Level 1 - unadjusted quoted prices in active markets for identical investments
Level 2 - other significant observable inputs (including quoted prices for similar investments, interest rates, prepayment speeds, etc.)
Level 3 - unobservable inputs (including the Fund's own assumptions based on the best information available)
Valuation techniques used to value the Fund's investments by major category are as follows:
Equity securities, including restricted securities, for which market quotations are readily available, are valued at the last reported sale price or official closing price as reported by a third party pricing service on the primary market or exchange on which they are traded and are categorized as Level 1 in the hierarchy. In the event there were no sales during the day or closing prices are not available, securities are valued at the last quoted bid price or may be valued using the last available price and are generally categorized as Level 2 in the hierarchy. For foreign equity securities, when market or security specific events arise, comparisons to the valuation of American Depositary Receipts (ADRs), futures contracts, Exchange-Traded Funds (ETFs) and certain indexes as well as quoted prices for similar securities may be used and would be categorized as Level 2 in the hierarchy. For equity securities, including restricted securities, where observable inputs are limited, assumptions about market activity and risk are used and these securities may be categorized as Level 3 in the hierarchy. Securities, including private placements or other restricted securities, for which observable inputs are not available are valued using alternate valuation approaches, including the market approach, the income approach and cost approach, and are categorized as Level 3 in the hierarchy. The market approach considers factors including the price of recent investments in the same or a similar security or financial metrics of comparable securities. The income approach considers factors including expected future cash flows, security specific risks and corresponding discount rates. The cost approach considers factors including the value of the security's underlying assets and liabilities.
Debt securities, including restricted securities, are valued based on evaluated prices received from third party pricing services or from brokers who make markets in such securities. Corporate bonds are valued by pricing services who utilize matrix pricing which considers yield or price of bonds of comparable quality, coupon, maturity and type or by broker-supplied prices. When independent prices are unavailable or unreliable, debt securities may be valued utilizing pricing methodologies which consider similar factors that would be used by third party pricing services. Debt securities are generally categorized as Level 2 in the hierarchy but may be Level 3 depending on the circumstances. Exchange-Traded Funds (ETFs) are valued at their last sale price or official closing price as reported by a third party pricing service on the primary market or exchange on which they are traded and are categorized as Level 1 in the hierarchy. In the event there were no sales during the day but the exchange reports a closing bid level, ETFs are valued at the closing bid and would be categorized as Level 1 in the hierarchy. In the event there was no closing bid, ETFs may be valued by another method that the Board believes reflects fair value in accordance with the Board's fair value pricing policies and may be categorized as Level 2 in the hierarchy.
Investments in open-end mutual funds, including the Fidelity Central Funds, are valued at their closing net asset value (NAV) each business day and are categorized as Level 1 in the hierarchy.
The following provides information on Level 3 securities held by the Fund that were valued at period end based on unobservable inputs. These amounts exclude valuations provided by a broker.
| Asset Type | Fair Value | Valuation Technique(s) | Unobservable Input | Amount or Range/Weighted Average | Impact to Valuation from an Increase in InputA |
| Equities | $39,946,873 | Recovery value | Recovery value | $0.00 | Increase |
| | | Market approach | Transaction price | $1.13 - $8.61 / $3.60 | Increase |
| | | | Discount rate | 30.0% - 75.0% / 55.8% | Decrease |
| | | | Premium rate | 10.0% - 15.0% / 12.7% | Increase |
| | | Market comparable | Enterprise value/Revenue multiple (EV/R) | 2.8 - 12.0 / 6.4 | Increase |
| | | | Enterprise value/Net income multiple (EV/NI) | 16.0 | Increase |
| | | Black scholes | Discount rate | 4.1% - 4.2% / 4.2% | Increase |
| | | | Volatility | 50.0% - 90.0% / 78.9% | Increase |
| | | | Term | 3.0 | Increase |
| Corporate Bonds | $259,262 | Recovery value | Recovery value | $0.00 | Increase |
| | | Market approach | Transaction price | $100.00 | Increase |
| | | | Discount rate | 23.5% | Decrease |
| | | | Probability rate | 0.0% - 33.3% / 16.7% | Increase |
A Represents the directional change in the fair value of the Level 3 investments that could have resulted from an increase in the corresponding input as of period end. A decrease to the unobservable input would have had the opposite effect. Significant changes in these inputs may have resulted in a significantly higher or lower fair value measurement at period end.
Changes in valuation techniques may result in transfers in or out of an assigned level within the disclosure hierarchy. The aggregate value of investments by input level as of July 31, 2024, as well as a roll forward of Level 3 investments, is included at the end of the Fund's Consolidated Schedule of Investments.
Foreign Currency. Certain Funds may use foreign currency contracts to facilitate transactions in foreign-denominated securities. Gains and losses from these transactions may arise from changes in the value of the foreign currency or if the counterparties do not perform under the contracts' terms.
Foreign-denominated assets, including investment securities, and liabilities are translated into U.S. dollars at the exchange rates at period end. Purchases and sales of investment securities, income and dividends received, and expenses denominated in foreign currencies are translated into U.S. dollars at the exchange rate in effect on the transaction date.
The effects of exchange rate fluctuations on investments are included with the net realized and unrealized gain (loss) on investment securities. Other foreign currency transactions resulting in realized and unrealized gain (loss) are disclosed separately.
Investment Transactions and Income. For financial reporting purposes, the Fund's investment holdings and NAV include trades executed through the end of the last business day of the period. The NAV per share for processing shareholder transactions is calculated as of the close of business of the New York Stock Exchange (NYSE), normally 4:00 p.m. Eastern time and includes trades executed through the end of the prior business day. Gains and losses on securities sold are determined on the basis of identified cost and include proceeds received from litigation. Commissions paid to certain brokers with whom the investment adviser, or its affiliates, places trades on behalf of a fund include an amount in addition to trade execution, which may be rebated back to a fund. Any such rebates are included in net realized gain (loss) on investments in the Consolidated Statement of Operations. Dividend income is recorded on the ex-dividend date, except for certain dividends from foreign securities where the ex-dividend date may have passed, which are recorded as soon as the Fund is informed of the ex-dividend date. Non-cash dividends included in dividend income, if any, are recorded at the fair market value of the securities received. Income and capital gain distributions from Fidelity Central Funds, if any, are recorded on the ex-dividend date. Certain distributions received by the Fund represent a return of capital or capital gain. The Fund determines the components of these distributions subsequent to the ex-dividend date, based upon receipt of tax filings or other correspondence relating to the underlying investment. These distributions are recorded as a reduction of cost of investments and/or as a realized gain. Interest income is accrued as earned and includes coupon interest and amortization of premium and accretion of discount on debt securities as applicable. Investment income is recorded net of foreign taxes withheld where recovery of such taxes is uncertain. Funds may file withholding tax reclaims in certain jurisdictions to recover a portion of amounts previously withheld. Any withholding tax reclaims income is included in the Consolidated Statement of Operations in dividends. Any receivables for withholding tax reclaims are included in the Consolidated Statement of Assets and Liabilities in dividends receivable.
Expenses. Expenses directly attributable to a fund are charged to that fund. Expenses attributable to more than one fund are allocated among the respective funds on the basis of relative net assets or other appropriate methods. Expenses included in the accompanying consolidated financial statements reflect the expenses of that fund and do not include any expenses associated with any underlying mutual funds or exchange-traded funds. Although not included in a fund's expenses, a fund indirectly bears its proportionate share of these expenses through the net asset value of each underlying mutual fund or exchange-traded fund. Expense estimates are accrued in the period to which they relate and adjustments are made when actual amounts are known.
Income Tax Information and Distributions to Shareholders. Each year, the Fund intends to qualify as a regulated investment company under Subchapter M of the Internal Revenue Code, including distributing substantially all of its taxable income and realized gains. As a result, no provision for U.S. Federal income taxes is required. As of July 31, 2024, the Fund did not have any unrecognized tax benefits in the consolidated financial statements; nor is the Fund aware of any tax positions for which it is reasonably possible that the total amounts of unrecognized tax benefits will significantly change in the next twelve months. The Fund files a U.S. federal tax return, in addition to state and local tax returns as required. The Fund's federal income tax returns are subject to examination by the Internal Revenue Service (IRS) for a period of three fiscal years after they are filed. State and local tax returns may be subject to examination for an additional fiscal year depending on the jurisdiction. Foreign taxes are provided for based on the Fund's understanding of the tax rules and rates that exist in the foreign markets in which it invests.
Distributions are declared and recorded on the ex-dividend date. Income and capital gain distributions are determined in accordance with income tax regulations, which may differ from GAAP.
Capital accounts within the consolidated financial statements are adjusted for permanent book-tax differences. These adjustments have no impact on net assets or the results of operations. Capital accounts are not adjusted for temporary book-tax differences which will reverse in a subsequent period.
Book-tax differences are primarily due to foreign currency transactions, passive foreign investment companies (PFIC), partnerships, capital loss carryforwards and losses deferred due to wash sales.
As of period end, the cost and unrealized appreciation (depreciation) in securities, and derivatives if applicable, for federal income tax purposes were as follows:
| Gross unrealized appreciation | $687,978,243 |
| Gross unrealized depreciation | (118,567,912) |
| Net unrealized appreciation (depreciation) | $569,410,331 |
| Tax Cost | $2,505,468,414 |
The tax-based components of distributable earnings as of period end were as follows:
| Undistributed ordinary income | $41,010,986 |
| Undistributed long-term capital gain | $21,367,800 |
| Net unrealized appreciation (depreciation) on securities and other investments | $569,408,790 |
The tax character of distributions paid was as follows:
| | July 31, 2024 | July 31, 2023 |
| Ordinary Income | $4,542,314 | $610,119 |
Restricted Securities (including Private Placements). Funds may invest in securities that are subject to legal or contractual restrictions on resale. These securities generally may be resold in transactions exempt from registration or to the public if the securities are registered. Disposal of these securities may involve time-consuming negotiations and expense, and prompt sale at an acceptable price may be difficult. Information regarding restricted securities held at period end is included at the end of the Consolidated Schedule of Investments, if applicable.
Commitments. A commitment is an agreement to acquire an investment at a future date (subject to conditions) in connection with a potential public or non-public offering. Commitments outstanding at period end are presented in the table below. Unrealized appreciation (depreciation) on any commitments outstanding at period end is separately presented in the Consolidated Statement of Assets and Liabilities as Unrealized appreciation (depreciation) on unfunded commitments, and any change in unrealized appreciation (depreciation) on unfunded commitments during the period is separately presented in the Consolidated Statement of Operations, as applicable based on contractual conditions of each commitment.
| | Investment to be Acquired | Commitment Amount ($) | Unrealized Appreciation (Depreciation)($) |
| Fidelity Small Cap Growth K6 Fund | Oruka Therapeutics, Inc. | 1,354,823 | 946,702 |
Consolidated Subsidiary. The Funds included in the table below hold certain investments through a wholly-owned subsidiary ("Subsidiary"), which may be subject to federal and state taxes upon disposition.
As of period end, investments in Subsidiaries were as follows:
| | Amount ($) | % of Net Assets |
| Fidelity Small Cap Growth K6 Fund | 3,904,330 | .13 |
The financial statements have been consolidated to include the Subsidiary accounts where applicable. Accordingly, all inter-company transactions and balances have been eliminated.
At period end, any estimated tax liability for these investments is presented as "Deferred taxes" in the Consolidated Statement of Assets and Liabilities and included in "Change in net unrealized appreciation (depreciation) on investment securities" in the Consolidated Statement of Operations. The tax liability incurred may differ materially depending on conditions when these investments are disposed. Any cash held by a Subsidiary is restricted as to its use and is presented as "Restricted cash" in the Consolidated Statement of Assets and Liabilities, if applicable.
4. Purchases and Sales of Investments.
Purchases and sales of securities, other than short-term securities and in-kind transactions, as applicable, are noted in the table below.
| | Purchases ($) | Sales ($) |
| Fidelity Small Cap Growth K6 Fund | 2,320,433,462 | 1,850,809,009 |
Unaffiliated Exchanges In-Kind. Shares that were exchanged for investments, including accrued interest and cash, if any, are shown in the table below. The amount of in-kind exchanges is included in share transactions in the accompanying Consolidated Statement of Changes in Net Assets.
| | Shares | Total Proceeds ($) |
| Fidelity Small Cap Growth K6 Fund | 2,235,792 | 34,928,214 |
Prior Year Unaffiliated Exchanges In-Kind. Shares that were exchanged for investments, including accrued interest and cash, if any, are shown in the table below. The amount of in-kind exchanges is included in share transactions in the accompanying Consolidated Statement of Changes in Net Assets.
| | Shares | Total Proceeds ($) |
| Fidelity Small Cap Growth K6 Fund | 9,092,844 | 120,866,697 |
5. Fees and Other Transactions with Affiliates.
Management Fee. Fidelity Management & Research Company LLC (the investment adviser) and its affiliates provide the Fund with investment management related services for which the Fund pays a monthly management fee that is based on an annual rate of .60% of average net assets. Under the management contract, the investment adviser or an affiliate pays all other expenses of the Fund, excluding fees and expenses of the independent Trustees, and certain miscellaneous expenses such as proxy and shareholder meeting expenses.
Brokerage Commissions. A portion of portfolio transactions were placed with brokerage firms which are affiliates of the investment adviser. Brokerage commissions are included in net realized gain (loss) and change in net unrealized appreciation (depreciation) in the Consolidated Statement of Operations. The commissions paid to these affiliated firms were as follows:
| | Amount ($) |
| Fidelity Small Cap Growth K6 Fund | 45,987 |
Interfund Lending Program. Pursuant to an Exemptive Order issued by the Securities and Exchange Commission (the SEC), the Fund, along with other registered investment companies having management contracts with Fidelity Management & Research Company LLC (FMR), or other affiliated entities of FMR, may participate in an interfund lending program. This program provides an alternative credit facility allowing the Fund to borrow from, or lend money to, other participating affiliated funds. At period end, there were no interfund loans outstanding. Activity in this program during the period for which loans were outstanding was as follows:
| | Borrower or Lender | Average Loan Balance ($) | Weighted Average Interest Rate | Interest Expense ($) |
| Fidelity Small Cap Growth K6 Fund | Borrower | 8,086,000 | 5.57% | 2,502 |
Interfund Trades. Funds may purchase from or sell securities to other Fidelity Funds under procedures adopted by the Board. The procedures have been designed to ensure these interfund trades are executed in accordance with Rule 17a-7 of the 1940 Act. Any interfund trades are included within the respective purchases and sales amounts shown in the Purchases and Sales of Investments note. Interfund trades during the period are noted in the table below.
| | Purchases ($) | Sales ($) | Realized Gain (Loss)($) |
| Fidelity Small Cap Growth K6 Fund | 107,857,174 | 115,949,869 | 8,830,170 |
Sub-Advisory Arrangements. Effective March 1, 2024, the Fund's sub-advisory agreements with FMR Investment Management (UK) Limited, Fidelity Management & Research (Hong Kong) Limited, and Fidelity Management & Research (Japan) Limited were amended to provide that the investment adviser pays each sub-adviser monthly fees equal to 110% of the sub-adviser's costs for providing sub-advisory services.
6. Committed Line of Credit.
Certain Funds participate with other funds managed by the investment adviser or an affiliate in a $4.25 billion credit facility (the "line of credit") to be utilized for temporary or emergency purposes to fund shareholder redemptions or for other short-term liquidity purposes. The commitment fees on the pro-rata portion of the line of credit are borne by the investment adviser. During the period, there were no borrowings on this line of credit.
7. Security Lending.
Funds lend portfolio securities from time to time in order to earn additional income. Lending agents are used, including National Financial Services (NFS), an affiliate of the investment adviser. Pursuant to a securities lending agreement, NFS will receive a fee, which is capped at 9.9% of a fund's daily lending revenue, for its services as lending agent. A fund may lend securities to certain qualified borrowers, including NFS. On the settlement date of the loan, a fund receives collateral (in the form of U.S. Treasury obligations, letters of credit and/or cash) against the loaned securities and maintains collateral in an amount not less than 100% of the market value of the loaned securities during the period of the loan. The market value of the loaned securities is determined at the close of business of a fund and any additional required collateral is delivered to a fund on the next business day. A fund or borrower may terminate the loan at any time, and if the borrower defaults on its obligation to return the securities loaned because of insolvency or other reasons, a fund may apply collateral received from the borrower against the obligation. A fund may experience delays and costs in recovering the securities loaned. Any cash collateral received is invested in the Fidelity Securities Lending Cash Central Fund. Any loaned securities are identified as such in the Consolidated Schedule of Investments, and the value of loaned securities and cash collateral at period end, as applicable, are presented in the Consolidated Statement of Assets and Liabilities. Security lending income represents the income earned on investing cash collateral, less rebates paid to borrowers and any lending agent fees associated with the loan, plus any premium payments received for lending certain types of securities. Security lending income is presented in the Consolidated Statement of Operations as a component of income from Fidelity Central Funds. Affiliated security lending activity, if any, was as follows:
| | Total Security Lending Fees Paid to NFS ($) | Security Lending Income From Securities Loaned to NFS ($) | Value of Securities Loaned to NFS at Period End ($) |
| Fidelity Small Cap Growth K6 Fund | 90,760 | 12,954 | 275,110 |
8. Expense Reductions.
Through arrangements with the Fund's custodian, credits realized as a result of certain uninvested cash balances were used to reduce the Fund's expenses by $2,681.
9. Other.
A fund's organizational documents provide former and current trustees and officers with a limited indemnification against liabilities arising in connection with the performance of their duties to the fund. In the normal course of business, a fund may also enter into contracts that provide general indemnifications. A fund's maximum exposure under these arrangements is unknown as this would be dependent on future claims that may be made against a fund. The risk of material loss from such claims is considered remote.
10. Risk and Uncertainties.
Many factors affect a fund's performance. Developments that disrupt global economies and financial markets, such as pandemics, epidemics, outbreaks of infectious diseases, war, terrorism, and environmental disasters, may significantly affect a fund's investment performance. The effects of these developments to a fund will be impacted by the types of securities in which a fund invests, the financial condition, industry, economic sector, and geographic location of an issuer, and a fund's level of investment in the securities of that issuer. Significant concentrations in security types, issuers, industries, sectors, and geographic locations may magnify the factors that affect a fund's performance.
Report of Independent Registered Public Accounting Firm
To the Board of Trustees of Fidelity Securities Fund and Shareholders of Fidelity Small Cap Growth K6 Fund
Opinion on the Financial Statements
We have audited the accompanying consolidated statement of assets and liabilities, including the consolidated schedule of investments, of Fidelity Small Cap Growth K6 Fund and its subsidiary (one of the funds constituting Fidelity Securities Fund, referred to hereafter as the "Fund") as of July 31, 2024, the related consolidated statement of operations for the year ended July 31, 2024, the consolidated statement of changes in net assets for each of the two years in the period ended July 31, 2024, including the related notes, and the consolidated financial highlights for each of the five years in the period ended July 31, 2024 (collectively referred to as the "consolidated financial statements"). In our opinion, the consolidated financial statements present fairly, in all material respects, the financial position of the Fund as of July 31, 2024, the results of its operations for the year then ended, the changes in its net assets for each of the two years in the period ended July 31, 2024 and the financial highlights for each of the five years in the period ended July 31, 2024 in conformity with accounting principles generally accepted in the United States of America.
Basis for Opinion
These consolidated financial statements are the responsibility of the Fund's management. Our responsibility is to express an opinion on the Fund's consolidated financial statements based on our audits. We are a public accounting firm registered with the Public Company Accounting Oversight Board (United States) (PCAOB) and are required to be independent with respect to the Fund in accordance with the U.S. federal securities laws and the applicable rules and regulations of the Securities and Exchange Commission and the PCAOB.
We conducted our audits of these consolidated financial statements in accordance with the standards of the PCAOB. Those standards require that we plan and perform the audit to obtain reasonable assurance about whether the consolidated financial statements are free of material misstatement, whether due to error or fraud.
Our audits included performing procedures to assess the risks of material misstatement of the consolidated financial statements, whether due to error or fraud, and performing procedures that respond to those risks. Such procedures included examining, on a test basis, evidence regarding the amounts and disclosures in the consolidated financial statements. Our audits also included evaluating the accounting principles used and significant estimates made by management, as well as evaluating the overall presentation of the consolidated financial statements. Our procedures included confirmation of securities owned as of July 31, 2024 by correspondence with the custodian, issuers of privately offered securities and brokers; when replies were not received from brokers, we performed other auditing procedures. We believe that our audits provide a reasonable basis for our opinion.
/s/ PricewaterhouseCoopers LLP
Boston, Massachusetts
September 17, 2024
We have served as the auditor of one or more investment companies in the Fidelity group of funds since 1932.
Distributions
(Unaudited)
The dividend and capital gains distributions for the fund(s) are available on Fidelity.com or Institutional.Fidelity.com.
The fund hereby designates as a capital gain dividend with respect to the taxable year ended July 31,2024, $21,367,800, or, if subsequently determined to be different, the net capital gain of such year.
The fund designates 100% of the dividend distributed during the fiscal year as qualifying for the dividends-received deduction for corporate shareholders.
The fund designates 100% of the dividends distributed during the fiscal year as amounts which may be taken into account as a dividend for the purposes of the maximum rate under section 1(h)(11) of the Internal Revenue Code.
The fund will notify shareholders in January 2025 of amounts for use in preparing 2024 income tax returns.
Item 8: Changes in and Disagreements with Accountants for Open-End Management Investment Companies
Note: This is not applicable for any fund included in this document.
Item 9: Proxy Disclosures for Open-End Management Investment Companies
| A special meeting of shareholders was held on July 16, 2024. The results of votes taken among shareholders on the proposal before them are reported below. Each vote reported represents one dollar of net asset value held on the record date for the meeting. |
| Proposal 1 |
| To elect a Board of Trustees. |
| | # of Votes | % of Votes |
| Bettina Doulton |
| Affirmative | 88,756,759,992.17 | 95.11 |
| Withheld | 4,564,750,651.52 | 4.89 |
| TOTAL | 93,321,510,643.68 | 100.00 |
| Robert A. Lawrence |
| Affirmative | 88,523,438,331.98 | 94.86 |
| Withheld | 4,798,072,311.70 | 5.14 |
| TOTAL | 93,321,510,643.68 | 100.00 |
| Vijay C. Advani |
| Affirmative | 88,484,371,668.51 | 94.82 |
| Withheld | 4,837,138,975.17 | 5.18 |
| TOTAL | 93,321,510,643.68 | 100.00 |
| Thomas P. Bostick |
| Affirmative | 88,618,596,648.21 | 94.96 |
| Withheld | 4,702,913,995.47 | 5.04 |
| TOTAL | 93,321,510,643.68 | 100.00 |
| Donald F. Donahue |
| Affirmative | 88,542,403,002.79 | 94.88 |
| Withheld | 4,779,107,640.89 | 5.12 |
| TOTAL | 93,321,510,643.68 | 100.00 |
| Vicki L. Fuller |
| Affirmative | 88,788,711,037.44 | 95.14 |
| Withheld | 4,532,799,606.24 | 4.86 |
| TOTAL | 93,321,510,643.68 | 100.00 |
| Patricia L. Kampling |
| Affirmative | 88,819,315,996.59 | 95.18 |
| Withheld | 4,502,194,647.10 | 4.82 |
| TOTAL | 93,321,510,643.68 | 100.00 |
| Thomas A. Kennedy |
| Affirmative | 88,667,457,817.34 | 95.01 |
| Withheld | 4,654,052,826.34 | 4.99 |
| TOTAL | 93,321,510,643.68 | 100.00 |
| Oscar Munoz |
| Affirmative | 88,183,976,568.30 | 94.49 |
| Withheld | 5,137,534,075.39 | 5.51 |
| TOTAL | 93,321,510,643.68 | 100.00 |
| Karen B. Peetz |
| Affirmative | 88,720,160,318.58 | 95.07 |
| Withheld | 4,601,350,325.11 | 4.93 |
| TOTAL | 93,321,510,643.68 | 100.00 |
| David M. Thomas |
| Affirmative | 88,471,490,747.86 | 94.80 |
| Withheld | 4,850,019,895.82 | 5.20 |
| TOTAL | 93,321,510,643.68 | 100.00 |
| Susan Tomasky |
| Affirmative | 88,536,869,646.78 | 94.87 |
| Withheld | 4,784,640,996.90 | 5.13 |
| TOTAL | 93,321,510,643.68 | 100.00 |
| Michael E. Wiley |
| Affirmative | 88,526,906,267.86 | 94.86 |
| Withheld | 4,794,604,375.83 | 5.14 |
| TOTAL | 93,321,510,643.68 | 100.00 |
| | | |
| Proposal 1 reflects trust-wide proposal and voting results. |
Item 10: Remuneration Paid to Directors, Officers, and others of Open-End Management Investment Companies
Note: This information is disclosed as part of the consolidated financial statements for each Fund as part of Item 7: Consolidated Financial Statements and Consolidated Financial Highlights for Open-End Management Investment companies.
Item 11: Statement Regarding Basis for Approval of Investment Advisory Contract
Board Approval of Investment Advisory Contracts and Management Fees
Fidelity Small Cap Growth K6 Fund
Each year, the Board of Trustees, including the Independent Trustees (together, the Board), considers the renewal of the fund's management contract with Fidelity Management & Research Company LLC (FMR) and the sub-advisory agreements (together, the Advisory Contracts) for the fund. FMR and the sub-advisers are referred to herein as the Investment Advisers. The Board, assisted by the advice of fund counsel and Independent Trustees' counsel, requests and considers a broad range of information relevant to the renewal of the Advisory Contracts throughout the year.
The Board meets regularly and, at each of its meetings, covers an extensive agenda of topics and materials and considers factors that are relevant to its annual consideration of the renewal of the fund's Advisory Contracts, including the services and support provided to the fund and its shareholders. The Board, acting directly and through its Committees (each of which is composed of and chaired by Independent Trustees), requests and receives information concerning the annual consideration of the renewal of the fund's Advisory Contracts. The Board also meets as needed to review matters specifically related to the Board's annual consideration of the renewal of the Advisory Contracts. Members of the Board may also meet with trustees of other Fidelity funds through joint ad hoc committees to discuss certain matters relevant to all of the Fidelity funds.
At its May 2024 meeting, the Board unanimously determined to renew the fund's Advisory Contracts. In reaching its determination, the Board considered all factors it believed relevant, including (i) the nature, extent, and quality of the services provided to the fund and its shareholders (including the investment performance of the fund); (ii) the competitiveness relative to peer funds of the fund's management fee and total expense ratio; (iii) the total costs of the services provided by and the profits realized by FMR and its affiliates (Fidelity) from its relationships with the fund; and (iv) the extent to which, if any, economies of scale exist and are realized as the fund grows, and whether any economies of scale are appropriately shared with fund shareholders. The Board also considered the broad range of investment choices available to shareholders from FMR's competitors and that the fund's shareholders have chosen to invest in the fund, which is part of the Fidelity family of funds. The Board's decision to renew the Advisory Contracts was not based on any single factor.
The Board reached a determination, with the assistance of fund counsel and Independent Trustees' counsel and through the exercise of its business judgment, that the renewal of the Advisory Contracts was in the best interests of the fund and its shareholders and that the compensation payable under the Advisory Contracts was fair and reasonable in light of all of the surrounding circumstances.
Nature, Extent, and Quality of Services Provided. The Board considered staffing as it relates to the fund, including the backgrounds and experience of investment personnel of the Investment Advisers, and also considered the Investment Advisers' implementation of the fund's investment program. The Independent Trustees also had discussions with senior management of Fidelity's investment operations and investment groups. The Board considered the structure of the investment personnel compensation program and whether this structure provides appropriate incentives to act in the best interests of the fund. Additionally, the Board considered the portfolio managers' investments, if any, in the funds that they manage.
Resources Dedicated to Investment Management and Support Services. The Board and the Fund Oversight and Research Committees reviewed the general qualifications and capabilities of Fidelity's investment staff, including its size, education, experience, and resources, as well as Fidelity's approach to recruiting, training, managing, and compensating investment personnel. The Board noted the resources devoted to expansion of Fidelity's global investment organization, and that Fidelity's analysts have extensive resources, tools, and capabilities that allow them to conduct sophisticated quantitative and fundamental analysis, as well as credit analysis of issuers, counterparties, and guarantors. Further, the Board considered that Fidelity's investment professionals have sufficient access to global information and data so as to provide competitive investment results over time, and that those professionals also have access to sophisticated tools that permit them to assess portfolio construction and risk and performance attribution characteristics continuously, as well as to transmit new information and research conclusions rapidly around the world. Additionally, in its deliberations, the Board considered Fidelity's trading, risk management, compliance, and technology and operations capabilities and resources, which are integral parts of the investment management process.
Shareholder and Administrative Services. The Board considered (i) the nature, extent, quality, and cost of advisory, administrative, and shareholder services performed by the Investment Advisers and their affiliates under the Advisory Contracts and under separate agreements covering transfer agency and pricing and bookkeeping services for the fund; (ii) the nature and extent of Fidelity's supervision of third party service providers, principally custodians, subcustodians, and pricing vendors; and (iii) the resources devoted by Fidelity to, and the record of compliance with, the fund's compliance policies and procedures. The Board also reviewed the allocation of fund brokerage, including allocations to brokers affiliated with the Investment Advisers, the use of brokerage commissions to pay fund expenses, and the use of "soft" commission dollars to pay for research services. The Board also considered the fund's securities lending activities and any payments made to Fidelity relating to securities lending under a separate agreement.
The Board noted that the growth of fund assets over time across the complex allows Fidelity to reinvest in the development of services designed to enhance the value and convenience of the Fidelity funds as investment vehicles. These services include 24-hour access to account information and market information over the Internet and through telephone representatives, investor education materials, and asset allocation tools. The Board also considered that it reviews customer service metrics such as telephone response times, continuity of services on the website and metrics addressing services at Fidelity Investor Centers.
Investment in a Large Fund Family. The Board considered the benefits to shareholders of investing in a fund that is part of a large family of funds offering a variety of investment disciplines and providing a large variety of fund investor services. The Board noted that Fidelity had taken, or had made recommendations that resulted in the Fidelity funds taking, a number of actions over the previous year that benefited particular funds and/or the Fidelity funds in general.
Investment Performance. The Board took into account discussions that occur with representatives of the Investment Advisers, and reports that it receives, at Board meetings throughout the year, relating to fund investment performance. In this regard the Board noted that as part of regularly scheduled fund reviews and other reports to the Board on fund performance, the Board considered annualized return information for the fund for different time periods, measured against an appropriate securities market index (benchmark index) and an appropriate peer group of funds with similar objectives (peer group). The Board also considered information about performance attribution. In its ongoing evaluation of fund investment performance, the Board gives particular attention to information indicating changes in performance of the funds over different time periods and discussed with the Investment Advisers the reasons for any overperformance or underperformance.
In addition to reviewing absolute and relative fund performance, the Independent Trustees periodically consider the appropriateness of fund performance metrics in evaluating the results achieved. The Independent Trustees generally give greater weight to fund performance over longer time periods than over shorter time periods. Depending on the circumstances, the Independent Trustees may be satisfied with a fund's performance notwithstanding that it lags its benchmark index or peer group for certain periods.
Based on its review, the Board concluded that the nature, extent, and quality of services provided to the fund under the Advisory Contracts should continue to benefit the shareholders of the fund.
Competitiveness of Management Fee and Total Expense Ratio. The Board was provided with information regarding industry trends in management fees and expenses. In its review of the fund's management fee and total expense ratio, the Board considered the fund's unitary fee rate as well as other fund expenses paid by FMR under the fund's management contract, such as transfer agent fees, pricing and bookkeeping fees, and custodial, legal, and audit fees. The Board noted that Fidelity may agree to waive fees or reimburse expenses from time to time, and the extent to which, if any, it has done so for the fund.
Comparisons of Management Fees and Total Expense Ratios. Among other things, the Board reviewed data for selected groups of competitive funds and classes (referred to as "mapped groups") that were compiled by Fidelity based on combining similar investment objective categories (as classified by Morningstar) that have comparable investment mandates. The data reviewed by the Board included (i) gross management fee comparisons (before taking into account expense reimbursements or caps) relative to the total universe of funds within the mapped group; (ii) gross management fee comparisons relative to a subset of non-Fidelity funds in the mapped group that are similar in size and management fee structure to the fund (referred to as the "asset size peer group"); (iii) total expense comparisons of the fund relative to funds and classes in the mapped group that have a similar sales load structure to the fund (referred to as the "similar sales load structure group"); and (iv) total expense comparisons of the fund relative to funds and classes in the similar sales load structure group that are similar in size and management fee structure to the fund (referred to as the "total expense asset size peer group"). The total expense asset size peer group comparison excludes performance adjustments and fund-paid 12b-1 fees to eliminate variability in fee structures.
The information provided to the Board indicated that the fund's management fee rate ranked below the competitive median of the mapped group for the 12-month period ended September 30, 2023 and below the competitive median of the asset size peer group for the 12-month period ended September 30, 2023. Further, the information provided to the Board indicated that the total expense ratio of the fund ranked below the competitive median of the similar sales load structure group for the 12-month period ended September 30, 2023 and below the competitive median of the total expense asset size peer group for the 12-month period ended September 30, 2023.
Fees Charged to Other Fidelity Clients. The Board also considered Fidelity fee structures and other information with respect to clients of Fidelity, such as other funds advised or subadvised by Fidelity, pension plan clients, and other institutional clients with similar mandates. The Board noted that a joint ad hoc committee created by it and the boards of other Fidelity funds periodically reviews and compares Fidelity's institutional investment advisory business with its business of providing services to the Fidelity funds and also noted the most recent findings of the committee. The Board noted that the committee's review included a consideration of the differences in services provided, fees charged, and costs incurred, as well as competition in the markets serving the different categories of clients.
Based on its review, the Board concluded that the fund's management fee is fair and reasonable in light of the services that the fund receives and the other factors considered. Further, based on its review of total expense ratios and fees charged to other Fidelity clients, the Board concluded that the fund's total expense ratio was reasonable in light of the services that the fund and its shareholders receive and the other factors considered.
Costs of the Services and Profitability. The Board considered the revenues earned and the expenses incurred by Fidelity in conducting the business of developing, marketing, distributing, managing, administering and servicing the fund and servicing the fund's shareholders. The Board also considered the level of Fidelity's profits in respect of all the Fidelity funds.
On an annual basis, Fidelity presents to the Board information about the profitability of its relationships with the fund. Fidelity calculates profitability information for each fund, as well as aggregate profitability information for groups of Fidelity funds and all Fidelity funds, using a series of detailed revenue and cost allocation methodologies which originate with the books and records of Fidelity on which Fidelity's audited financial statements are based. The Audit Committee of the Board reviews any significant changes from the prior year's methodologies and the full Board approves such changes.
A public accounting firm has been engaged annually by the Board as part of the Board's assessment of Fidelity's profitability analysis. The engagement includes the review and assessment of the methodologies used by Fidelity in determining the revenues and expenses attributable to Fidelity's fund business, and completion of agreed-upon procedures in respect of the mathematical accuracy of certain fund profitability information and its conformity to established allocation methodologies. After considering the reports issued under the engagement and information provided by Fidelity, the Board concluded that while other allocation methods may also be reasonable, Fidelity's profitability methodologies are reasonable in all material respects.
The Board also reviewed Fidelity's non-fund businesses and potential indirect benefits such businesses may have received as a result of their association with Fidelity's fund business (i.e., fall-out benefits) as well as cases where Fidelity's affiliates may benefit from the funds' business. The Board considered areas where potential indirect benefits to the Fidelity funds from their relationships with Fidelity may exist. The Board's consideration of these matters was informed by the findings of a joint ad hoc committee created by it and the boards of other Fidelity funds to evaluate potential fall-out benefits.
The Board considered the costs of the services provided by and the profits realized by Fidelity in connection with the operation of the fund and was satisfied that the profitability was not excessive.
Economies of Scale. The Board considered whether there have been economies of scale in respect of the management of the Fidelity funds, whether the Fidelity funds (including the fund) have appropriately benefited from any such economies of scale, and whether there is potential for realization of any further economies of scale. The Board considered the extent to which the fund will benefit from economies of scale as assets grow through increased services to the fund, through waivers or reimbursements, or through fee or expense ratio reductions. The Board recognized that, due to the fund's current contractual arrangements, its expense ratio will not decline if the fund's operating costs decrease as assets grow or rise as assets decrease. The Board also noted that a committee created by it and the boards of other Fidelity funds periodically analyzes whether Fidelity attains economies of scale in respect of the management and servicing of the Fidelity funds, whether the Fidelity funds have appropriately benefited from such economies of scale, and whether there is potential for realization of any further economies of scale.
The Board concluded, taking into account the analysis of the committee, that economies of scale, if any, are being appropriately shared between fund shareholders and Fidelity.
Additional Information Requested by the Board. In order to develop fully the factual basis for consideration of the Fidelity funds' advisory contracts, the Board requested and received additional information on certain topics, including but not limited to: (i) fund flow and performance trends, in particular the underperformance of certain funds and strategies, and Fidelity's long-term strategies for certain funds; (ii) the operation of performance fees and the rationale for implementing performance fees on certain categories of funds but not others; (iii) Fidelity's pricing philosophy compared to competitors; (iv) fund profitability methodology and data; (v) evaluation of competitive fund data and peer group classifications and fee and expense comparisons; (vi) the management fee and expense structures for different funds and classes and information about the differences between various fee and expense structures; (vii) the variable management fee implemented for certain funds effective March 1, 2024; and (viii) information regarding other accounts managed by Fidelity and the funds' sub-advisory arrangements.
Conclusion. Based on its evaluation of all of the conclusions noted above, and after considering all factors it believed relevant, the Board, including the Independent Trustees, concluded that the advisory and sub-advisory fee arrangements are fair and reasonable in light of all of the surrounding circumstances and that the fund's Advisory Contracts should be renewed through May 31, 2025.
1.9884011.107
SCPK6-ANN-0924
Fidelity® Series Blue Chip Growth Fund
Annual Report
July 31, 2024
Contents
To view a fund's proxy voting guidelines and proxy voting record for the 12-month period ended June 30, visit http://www.fidelity.com/proxyvotingresults or visit the Securities and Exchange Commission's (SEC) web site at http://www.sec.gov.
You may also call 1-800-544-8544 to request a free copy of the proxy voting guidelines.
Standard & Poor's, S&P and S&P 500 are registered service marks of The McGraw-Hill Companies, Inc. and have been licensed for use by Fidelity Distributors Corporation.
Other third-party marks appearing herein are the property of their respective owners.
All other marks appearing herein are registered or unregistered trademarks or service marks of FMR LLC or an affiliated company. © 2024 FMR LLC. All rights reserved.
This report and the financial statements contained herein are submitted for the general information of the shareholders of the Fund. This report is not authorized for distribution to prospective investors in the Fund unless preceded or accompanied by an effective prospectus.
A fund files its complete schedule of portfolio holdings with the SEC for the first and third quarters of each fiscal year on Form N-PORT. Forms N-PORT are available on the SEC's web site at http://www.sec.gov. A fund's Forms N-PORT may be reviewed and copied at the SEC's Public Reference Room in Washington, DC. Information regarding the operation of the SEC's Public Reference Room may be obtained by calling 1-800-SEC-0330.
For a complete list of a fund's portfolio holdings, view the most recent holdings listing, semiannual report, or annual report on Fidelity's web site at http://www.fidelity.com, http://www.institutional.fidelity.com, or http://www.401k.com, as applicable.
NOT FDIC INSURED •MAY LOSE VALUE •NO BANK GUARANTEE
Neither the Fund nor Fidelity Distributors Corporation is a bank.
Item 7: Consolidated Financial Statements and Consolidated Financial Highlights for Open-End Management Investment Companies (Annual Report)
Fidelity® Series Blue Chip Growth Fund
Consolidated Schedule of Investments July 31, 2024
Showing Percentage of Net Assets
| Common Stocks - 94.8% |
| | | Shares | Value ($) |
| COMMUNICATION SERVICES - 15.0% | | | |
| Diversified Telecommunication Services - 0.1% | | | |
| Indus Towers Ltd. (a) | | 1,429,900 | 7,397,318 |
| Entertainment - 2.2% | | | |
| Netflix, Inc. (a) | | 336,824 | 211,643,360 |
| Sea Ltd. ADR Class A (a) | | 184,675 | 12,133,148 |
| Sphere Entertainment Co. (a)(b) | | 15,700 | 698,336 |
| Spotify Technology SA (a) | | 22,100 | 7,601,074 |
| Take-Two Interactive Software, Inc. (a) | | 23,100 | 3,477,243 |
| TKO Group Holdings, Inc. | | 48,200 | 5,270,670 |
| | | | 240,823,831 |
| Interactive Media & Services - 12.5% | | | |
| Alphabet, Inc. Class A | | 4,006,260 | 687,233,840 |
| Epic Games, Inc. (a)(c)(d) | | 1,076 | 645,600 |
| Meta Platforms, Inc. Class A | | 1,033,010 | 490,504,138 |
| Pinterest, Inc. Class A (a) | | 147,800 | 4,722,210 |
| Reddit, Inc. Class B | | 134,285 | 8,171,242 |
| Snap, Inc. Class A (a) | | 14,724,100 | 196,125,012 |
| Webtoon Entertainment, Inc. | | 51,300 | 1,095,255 |
| | | | 1,388,497,297 |
| Media - 0.0% | | | |
| The Trade Desk, Inc. Class A (a) | | 41,700 | 3,747,996 |
| Wireless Telecommunication Services - 0.2% | | | |
| T-Mobile U.S., Inc. | | 38,300 | 6,981,324 |
| Vodafone Idea Ltd. (a) | | 70,627,924 | 13,724,430 |
| | | | 20,705,754 |
TOTAL COMMUNICATION SERVICES | | | 1,661,172,196 |
| CONSUMER DISCRETIONARY - 18.4% | | | |
| Automobiles - 1.1% | | | |
| General Motors Co. | | 112,900 | 5,003,728 |
| Mahindra & Mahindra Ltd. | | 70,600 | 2,451,882 |
| Neutron Holdings, Inc. (a)(c)(d) | | 691,699 | 21,304 |
| Rad Power Bikes, Inc. (a)(c)(d) | | 110,210 | 27,553 |
| Rad Power Bikes, Inc. warrants 10/6/33 (a)(c)(d) | | 74,246 | 115,081 |
| Rivian Automotive, Inc. (a)(b) | | 1,464,695 | 24,035,645 |
| Tesla, Inc. (a) | | 377,905 | 87,700,413 |
| | | | 119,355,606 |
| Broadline Retail - 8.5% | | | |
| Amazon.com, Inc. (a) | | 4,752,300 | 888,585,054 |
| Dollarama, Inc. | | 34,100 | 3,196,728 |
| JD.com, Inc. sponsored ADR | | 67,000 | 1,768,130 |
| Lenskart Solutions Pvt Ltd. (a)(c)(d) | | 1,852,090 | 5,087,685 |
| Ollie's Bargain Outlet Holdings, Inc. (a) | | 102,000 | 9,959,280 |
| PDD Holdings, Inc. ADR (a) | | 229,700 | 29,606,033 |
| | | | 938,202,910 |
| Diversified Consumer Services - 0.0% | | | |
| Duolingo, Inc. (a) | | 21,400 | 3,679,516 |
| New Oriental Education & Technology Group, Inc. sponsored ADR (a) | | 10,876 | 683,230 |
| | | | 4,362,746 |
| Hotels, Restaurants & Leisure - 2.2% | | | |
| Airbnb, Inc. Class A (a) | | 354,600 | 49,487,976 |
| Caesars Entertainment, Inc. (a) | | 171,147 | 6,837,323 |
| Carnival Corp. (a) | | 184,200 | 3,068,772 |
| Cava Group, Inc. (a) | | 31,000 | 2,610,820 |
| Chipotle Mexican Grill, Inc. (a) | | 844,700 | 45,884,104 |
| Draftkings Holdings, Inc. (a) | | 422,800 | 15,622,460 |
| Flutter Entertainment PLC (a) | | 14,600 | 2,882,040 |
| Flutter Entertainment PLC (a) | | 38,900 | 7,688,714 |
| Hilton Worldwide Holdings, Inc. | | 5,200 | 1,116,284 |
| MakeMyTrip Ltd. (a) | | 23,100 | 2,161,929 |
| Marriott International, Inc. Class A | | 36,500 | 8,296,450 |
| McDonald's Corp. | | 45,300 | 12,022,620 |
| Penn Entertainment, Inc. (a) | | 459,843 | 9,183,065 |
| Restaurant Brands International, Inc. | | 85,700 | 6,000,521 |
| Royal Caribbean Cruises Ltd. | | 20,300 | 3,181,416 |
| Starbucks Corp. | | 436,400 | 34,017,380 |
| Sweetgreen, Inc. Class A (a) | | 684,981 | 18,823,278 |
| Viking Holdings Ltd. (b) | | 111,600 | 3,984,120 |
| Wingstop, Inc. | | 5,600 | 2,093,728 |
| Zomato Ltd. (a) | | 1,684,900 | 4,617,347 |
| | | | 239,580,347 |
| Household Durables - 0.3% | | | |
| D.R. Horton, Inc. | | 48,700 | 8,762,591 |
| Garmin Ltd. | | 25,300 | 4,332,625 |
| PulteGroup, Inc. | | 44,900 | 5,926,800 |
| SharkNinja, Inc. | | 132,600 | 10,190,310 |
| TopBuild Corp. (a) | | 15,300 | 7,321,662 |
| | | | 36,533,988 |
| Specialty Retail - 3.8% | | | |
| Abercrombie & Fitch Co. Class A (a) | | 287,625 | 42,418,935 |
| American Eagle Outfitters, Inc. | | 1,379,086 | 30,408,846 |
| Aritzia, Inc. (a) | | 349,900 | 11,485,509 |
| Carvana Co. Class A (a)(b) | | 342,300 | 45,604,629 |
| Dick's Sporting Goods, Inc. | | 128,700 | 27,844,245 |
| Fanatics, Inc. Class A (a)(c)(d) | | 159,285 | 10,474,582 |
| Five Below, Inc. (a) | | 90,384 | 6,574,532 |
| Floor & Decor Holdings, Inc. Class A (a) | | 16,400 | 1,607,200 |
| Foot Locker, Inc. | | 109,800 | 3,190,788 |
| Gap, Inc. (b) | | 274,800 | 6,452,304 |
| Lowe's Companies, Inc. | | 382,506 | 93,909,048 |
| RH (a)(b) | | 178,004 | 51,635,400 |
| The Home Depot, Inc. | | 15,500 | 5,706,480 |
| TJX Companies, Inc. | | 467,200 | 52,802,944 |
| Warby Parker, Inc. (a) | | 637,879 | 10,505,867 |
| Wayfair LLC Class A (a) | | 280,720 | 15,279,590 |
| Williams-Sonoma, Inc. | | 36,200 | 5,599,416 |
| | | | 421,500,315 |
| Textiles, Apparel & Luxury Goods - 2.5% | | | |
| adidas AG | | 33,000 | 8,260,706 |
| Amer Sports, Inc. (b) | | 479,400 | 5,565,834 |
| Birkenstock Holding PLC | | 19,600 | 1,158,556 |
| Compagnie Financiere Richemont SA Series A | | 39,340 | 6,000,584 |
| Crocs, Inc. (a) | | 180,584 | 24,265,072 |
| Deckers Outdoor Corp. (a) | | 90,616 | 83,605,040 |
| Hermes International SCA | | 3,101 | 6,789,304 |
| lululemon athletica, Inc. (a) | | 222,474 | 57,545,125 |
| LVMH Moet Hennessy Louis Vuitton SE | | 21,061 | 14,855,638 |
| NIKE, Inc. Class B | | 452,113 | 33,845,179 |
| On Holding AG (a) | | 288,600 | 11,953,812 |
| Prada SpA | | 382,600 | 2,761,942 |
| PVH Corp. | | 140,000 | 14,278,600 |
| Ralph Lauren Corp. Class A | | 14,200 | 2,493,378 |
| Tapestry, Inc. | | 82,900 | 3,323,461 |
| Tory Burch LLC (a)(c)(d)(e) | | 106,817 | 3,751,413 |
| | | | 280,453,644 |
TOTAL CONSUMER DISCRETIONARY | | | 2,039,989,556 |
| CONSUMER STAPLES - 1.1% | | | |
| Beverages - 0.1% | | | |
| Celsius Holdings, Inc. (a) | | 130,345 | 6,104,056 |
| Consumer Staples Distribution & Retail - 0.5% | | | |
| Costco Wholesale Corp. | | 6,100 | 5,014,200 |
| Maplebear, Inc. (NASDAQ) | | 36,065 | 1,243,882 |
| Target Corp. | | 70,300 | 10,573,823 |
| Walmart, Inc. | | 497,500 | 34,148,400 |
| | | | 50,980,305 |
| Food Products - 0.1% | | | |
| Patanjali Foods Ltd. | | 266,300 | 5,470,855 |
| The Hershey Co. | | 19,900 | 3,929,852 |
| The Real Good Food Co., Inc. Class A (a)(b) | | 49,300 | 25,143 |
| | | | 9,425,850 |
| Household Products - 0.2% | | | |
| Procter & Gamble Co. | | 170,500 | 27,409,580 |
| Personal Care Products - 0.1% | | | |
| elf Beauty, Inc. (a) | | 22,100 | 3,814,018 |
| Estee Lauder Companies, Inc. Class A | | 52,000 | 5,179,720 |
| Kenvue, Inc. | | 297,000 | 5,491,530 |
| Oddity Tech Ltd. | | 61,224 | 2,476,205 |
| | | | 16,961,473 |
| Tobacco - 0.1% | | | |
| JUUL Labs, Inc. Class B (a)(c)(d) | | 2,450 | 2,622 |
| Philip Morris International, Inc. | | 88,700 | 10,214,692 |
| | | | 10,217,314 |
TOTAL CONSUMER STAPLES | | | 121,098,578 |
| ENERGY - 1.2% | | | |
| Energy Equipment & Services - 0.0% | | | |
| Secure Energy Services, Inc. | | 319,400 | 2,820,038 |
| Oil, Gas & Consumable Fuels - 1.2% | | | |
| Cameco Corp. | | 202,200 | 9,203,091 |
| Cheniere Energy, Inc. | | 21,700 | 3,963,288 |
| Diamondback Energy, Inc. | | 151,700 | 30,690,427 |
| EOG Resources, Inc. | | 185,400 | 23,508,720 |
| Exxon Mobil Corp. | | 156,100 | 18,511,899 |
| Occidental Petroleum Corp. | | 280,200 | 17,041,764 |
| Reliance Industries Ltd. | | 518,049 | 18,629,032 |
| Reliance Industries Ltd. GDR (f) | | 24,800 | 1,788,080 |
| Shell PLC ADR | | 47,400 | 3,470,628 |
| | | | 126,806,929 |
TOTAL ENERGY | | | 129,626,967 |
| FINANCIALS - 3.4% | | | |
| Banks - 0.2% | | | |
| Citigroup, Inc. | | 265,200 | 17,206,176 |
| KeyCorp | | 205,000 | 3,306,650 |
| U.S. Bancorp | | 62,600 | 2,809,488 |
| | | | 23,322,314 |
| Capital Markets - 1.1% | | | |
| 3i Group PLC | | 142,590 | 5,736,500 |
| Blue Owl Capital, Inc. Class A | | 589,800 | 11,247,486 |
| Coinbase Global, Inc. (a) | | 168,900 | 37,894,404 |
| CVC Capital Partners PLC (f) | | 159,700 | 2,999,557 |
| Goldman Sachs Group, Inc. | | 47,600 | 24,229,828 |
| Interactive Brokers Group, Inc. | | 9,100 | 1,085,357 |
| Jefferies Financial Group, Inc. | | 74,200 | 4,338,474 |
| KKR & Co., Inc. | | 82,800 | 10,221,660 |
| Moody's Corp. | | 19,200 | 8,764,416 |
| Morgan Stanley | | 113,800 | 11,745,298 |
| Northern Trust Corp. | | 16,900 | 1,498,185 |
| Robinhood Markets, Inc. (a) | | 60,100 | 1,236,257 |
| | | | 120,997,422 |
| Consumer Finance - 0.3% | | | |
| American Express Co. | | 143,300 | 36,260,632 |
| Kaspi.KZ JSC ADR | | 9,500 | 1,236,235 |
| | | | 37,496,867 |
| Financial Services - 1.6% | | | |
| Ant International Co. Ltd. Class C (a)(c)(d) | | 784,278 | 1,333,273 |
| Apollo Global Management, Inc. | | 74,100 | 9,285,471 |
| Berkshire Hathaway, Inc. Class B (a) | | 7,300 | 3,201,050 |
| Block, Inc. Class A (a) | | 401,100 | 24,820,068 |
| Jio Financial Services Ltd. | | 726,649 | 2,850,955 |
| MasterCard, Inc. Class A | | 216,900 | 100,578,699 |
| Rocket Companies, Inc. (a) | | 25,000 | 404,750 |
| Toast, Inc. (a) | | 220,800 | 5,776,128 |
| Visa, Inc. Class A | | 83,800 | 22,263,146 |
| | | | 170,513,540 |
| Insurance - 0.2% | | | |
| Progressive Corp. | | 89,100 | 19,078,092 |
TOTAL FINANCIALS | | | 371,408,235 |
| HEALTH CARE - 7.6% | | | |
| Biotechnology - 1.2% | | | |
| Alnylam Pharmaceuticals, Inc. (a) | | 30,481 | 7,238,018 |
| Apogee Therapeutics, Inc. | | 51,300 | 2,498,310 |
| Arcellx, Inc. (a) | | 15,400 | 951,874 |
| Ascendis Pharma A/S sponsored ADR (a) | | 129,996 | 17,354,466 |
| Avidity Biosciences, Inc. (a) | | 37,900 | 1,727,482 |
| Cibus, Inc. (a) | | 32,171 | 318,171 |
| Janux Therapeutics, Inc. (a) | | 21,800 | 885,080 |
| Legend Biotech Corp. ADR (a) | | 81,700 | 4,607,063 |
| Moderna, Inc. (a) | | 57,100 | 6,807,462 |
| Moonlake Immunotherapeutics Class A (a) | | 81,300 | 3,386,145 |
| Natera, Inc. (a)(b) | | 24,100 | 2,467,599 |
| Regeneron Pharmaceuticals, Inc. (a) | | 77,900 | 84,068,901 |
| Viking Therapeutics, Inc. (a) | | 124,500 | 7,096,500 |
| | | | 139,407,071 |
| Health Care Equipment & Supplies - 1.2% | | | |
| Blink Health LLC Series A1 (a)(c)(d) | | 8,180 | 343,560 |
| Boston Scientific Corp. (a) | | 930,400 | 68,737,952 |
| Glaukos Corp. (a) | | 33,700 | 3,948,629 |
| Intuitive Surgical, Inc. (a) | | 78,600 | 34,946,346 |
| Masimo Corp. (a) | | 22,300 | 2,385,654 |
| Stryker Corp. | | 52,300 | 17,125,635 |
| TransMedics Group, Inc. (a) | | 18,800 | 2,674,488 |
| | | | 130,162,264 |
| Health Care Providers & Services - 1.2% | | | |
| Hims & Hers Health, Inc. (a) | | 90,000 | 1,911,600 |
| McKesson Corp. | | 3,800 | 2,344,676 |
| Tenet Healthcare Corp. (a) | | 82,800 | 12,395,160 |
| UnitedHealth Group, Inc. | | 202,200 | 116,499,552 |
| | | | 133,150,988 |
| Health Care Technology - 0.0% | | | |
| MultiPlan Corp. warrants (a)(c) | | 24,206 | 0 |
| Life Sciences Tools & Services - 0.3% | | | |
| Danaher Corp. | | 103,800 | 28,760,904 |
| Revvity, Inc. | | 4,100 | 515,001 |
| Thermo Fisher Scientific, Inc. | | 9,200 | 5,642,728 |
| | | | 34,918,633 |
| Pharmaceuticals - 3.7% | | | |
| Eli Lilly & Co. | | 342,579 | 275,526,012 |
| Galderma Group AG | | 34,400 | 2,707,714 |
| Merck & Co., Inc. | | 173,200 | 19,594,116 |
| Novo Nordisk A/S: | | | |
| Series B | | 57,400 | 7,605,092 |
| Series B sponsored ADR | | 329,300 | 43,675,059 |
| Structure Therapeutics, Inc. ADR (a) | | 18,800 | 702,932 |
| Teva Pharmaceutical Industries Ltd. sponsored ADR (a) | | 536,600 | 9,352,938 |
| UCB SA | | 32,300 | 5,406,050 |
| Zoetis, Inc. Class A | | 236,679 | 42,611,687 |
| | | | 407,181,600 |
TOTAL HEALTH CARE | | | 844,820,556 |
| INDUSTRIALS - 3.7% | | | |
| Aerospace & Defense - 1.2% | | | |
| General Electric Co. | | 129,200 | 21,989,840 |
| Howmet Aerospace, Inc. | | 175,300 | 16,776,210 |
| Loar Holdings, Inc. (b) | | 10,100 | 631,250 |
| Space Exploration Technologies Corp. (a)(c)(d) | | 227,030 | 25,427,360 |
| Space Exploration Technologies Corp. Class C (a)(c)(d) | | 6,860 | 768,320 |
| Spirit AeroSystems Holdings, Inc. Class A (a) | | 150,600 | 5,459,250 |
| The Boeing Co. (a) | | 268,300 | 51,137,980 |
| TransDigm Group, Inc. | | 5,400 | 6,988,788 |
| | | | 129,178,998 |
| Air Freight & Logistics - 0.1% | | | |
| C.H. Robinson Worldwide, Inc. | | 55,500 | 4,942,275 |
| FedEx Corp. | | 31,600 | 9,551,100 |
| | | | 14,493,375 |
| Building Products - 0.1% | | | |
| Builders FirstSource, Inc. (a) | | 30,100 | 5,037,837 |
| Fortune Brands Innovations, Inc. | | 7,000 | 565,670 |
| Lennox International, Inc. | | 2,600 | 1,517,100 |
| The AZEK Co., Inc. Class A, (a) | | 67,700 | 3,039,053 |
| Trane Technologies PLC | | 9,400 | 3,142,232 |
| | | | 13,301,892 |
| Commercial Services & Supplies - 0.1% | | | |
| ACV Auctions, Inc. Class A (a) | | 318,200 | 5,434,856 |
| Construction & Engineering - 0.1% | | | |
| EMCOR Group, Inc. | | 11,900 | 4,467,736 |
| Fluor Corp. (a) | | 64,700 | 3,112,070 |
| Larsen & Toubro Ltd. | | 82,900 | 3,777,282 |
| | | | 11,357,088 |
| Electrical Equipment - 0.2% | | | |
| Acuity Brands, Inc. | | 17,400 | 4,373,490 |
| Eaton Corp. PLC | | 29,300 | 8,930,347 |
| GE Vernova LLC | | 48,700 | 8,680,288 |
| | | | 21,984,125 |
| Ground Transportation - 1.5% | | | |
| Bird Global, Inc.: | | | |
| Stage 1 rights (a)(d) | | 549 | 0 |
| Stage 2 rights (a)(d) | | 549 | 0 |
| Stage 3 rights (a)(d) | | 549 | 0 |
| Lyft, Inc. (a) | | 4,066,489 | 49,001,192 |
| Uber Technologies, Inc. (a) | | 1,769,475 | 114,078,053 |
| | | | 163,079,245 |
| Machinery - 0.0% | | | |
| Mitsubishi Heavy Industries Ltd. | | 113,300 | 1,358,023 |
| Professional Services - 0.0% | | | |
| Timee, Inc. | | 124,900 | 1,208,938 |
| Trading Companies & Distributors - 0.4% | | | |
| Ferguson PLC | | 34,800 | 7,748,220 |
| FTAI Aviation Ltd. | | 291,200 | 32,454,240 |
| United Rentals, Inc. | | 1,400 | 1,059,940 |
| Watsco, Inc. | | 6,200 | 3,034,838 |
| | | | 44,297,238 |
| Transportation Infrastructure - 0.0% | | | |
| JSW Infrastructure Ltd. | | 320,400 | 1,297,055 |
TOTAL INDUSTRIALS | | | 406,990,833 |
| INFORMATION TECHNOLOGY - 43.4% | | | |
| Communications Equipment - 0.1% | | | |
| Arista Networks, Inc. (a) | | 28,200 | 9,772,710 |
| Ciena Corp. (a) | | 129,200 | 6,814,008 |
| | | | 16,586,718 |
| Electronic Equipment, Instruments & Components - 0.1% | | | |
| Celestica, Inc. (a) | | 38,800 | 2,034,672 |
| Coherent Corp. (a) | | 28,300 | 1,971,944 |
| Corning, Inc. | | 288,600 | 11,546,886 |
| | | | 15,553,502 |
| IT Services - 0.6% | | | |
| MongoDB, Inc. Class A (a) | | 34,580 | 8,726,609 |
| Okta, Inc. (a) | | 403,700 | 37,923,578 |
| Shopify, Inc. Class A (a) | | 184,300 | 11,287,733 |
| Snowflake, Inc. (a) | | 89,200 | 11,629,896 |
| | | | 69,567,816 |
| Semiconductors & Semiconductor Equipment - 21.7% | | | |
| Advanced Micro Devices, Inc. (a) | | 239,419 | 34,591,257 |
| Allegro MicroSystems LLC (a) | | 160,200 | 3,851,208 |
| Applied Materials, Inc. | | 27,100 | 5,750,620 |
| ASML Holding NV (depository receipt) | | 25,000 | 23,417,500 |
| Astera Labs, Inc. | | 78,400 | 3,437,056 |
| Broadcom, Inc. | | 379,700 | 61,010,196 |
| Enphase Energy, Inc. (a) | | 40,800 | 4,696,488 |
| First Solar, Inc. (a) | | 22,900 | 4,946,171 |
| GlobalFoundries, Inc. (a) | | 919,660 | 46,911,857 |
| Impinj, Inc. (a) | | 49,400 | 7,868,926 |
| Lam Research Corp. | | 10,900 | 10,041,516 |
| Marvell Technology, Inc. | | 5,221,395 | 349,729,037 |
| Micron Technology, Inc. | | 261,800 | 28,750,876 |
| Monolithic Power Systems, Inc. | | 50,300 | 43,413,427 |
| NVIDIA Corp. | | 11,977,660 | 1,401,625,776 |
| NXP Semiconductors NV | | 683,235 | 179,800,123 |
| ON Semiconductor Corp. (a) | | 779,413 | 60,989,067 |
| Qorvo, Inc. (a) | | 46,200 | 5,534,760 |
| Qualcomm, Inc. | | 109,000 | 19,723,550 |
| Synaptics, Inc. (a) | | 13,600 | 1,187,552 |
| Taiwan Semiconductor Manufacturing Co. Ltd. sponsored ADR | | 444,500 | 73,698,100 |
| Teradyne, Inc. | | 212,200 | 27,832,152 |
| Xsight Labs Ltd. warrants 1/11/34 (a)(c)(d) | | 15,421 | 32,538 |
| | | | 2,398,839,753 |
| Software - 9.6% | | | |
| Adobe, Inc. (a) | | 17,200 | 9,488,380 |
| Applied Intuition, Inc. Class A (c)(d) | | 5,601 | 334,324 |
| AppLovin Corp. Class A, (a) | | 71,300 | 5,497,230 |
| Atom Tickets LLC (a)(c)(d)(e) | | 344,068 | 3 |
| CoreWeave, Inc. Class A (d) | | 26,920 | 20,944,298 |
| Datadog, Inc. Class A (a) | | 93,900 | 10,933,716 |
| Figma, Inc. (c)(d) | | 43,744 | 1,014,423 |
| HubSpot, Inc. (a) | | 47,992 | 23,853,464 |
| Intuit, Inc. | | 41,800 | 27,059,230 |
| Life360, Inc. | | 70,700 | 2,371,985 |
| Microsoft Corp. | | 2,110,500 | 882,927,675 |
| Onestream, Inc. | | 13,700 | 381,545 |
| Oracle Corp. | | 114,000 | 15,897,300 |
| Palantir Technologies, Inc. Class A (a) | | 137,600 | 3,700,064 |
| SAP SE sponsored ADR | | 24,700 | 5,226,520 |
| ServiceNow, Inc. (a) | | 38,223 | 31,128,429 |
| Stripe, Inc. Class B (a)(c)(d) | | 19,900 | 547,449 |
| Synopsys, Inc. (a) | | 12,300 | 6,867,336 |
| Tanium, Inc. Class B (a)(c)(d) | | 151,000 | 1,312,190 |
| Zoom Video Communications, Inc. Class A (a) | | 160,900 | 9,718,360 |
| | | | 1,059,203,921 |
| Technology Hardware, Storage & Peripherals - 11.3% | | | |
| Apple, Inc. | | 5,439,536 | 1,208,012,155 |
| Dell Technologies, Inc. | | 171,500 | 19,496,120 |
| Western Digital Corp. (a) | | 278,400 | 18,666,720 |
| | | | 1,246,174,995 |
TOTAL INFORMATION TECHNOLOGY | | | 4,805,926,705 |
| MATERIALS - 0.7% | | | |
| Chemicals - 0.1% | | | |
| Linde PLC | | 12,900 | 5,850,150 |
| Sherwin-Williams Co. | | 13,900 | 4,876,120 |
| Westlake Corp. | | 11,300 | 1,670,818 |
| | | | 12,397,088 |
| Construction Materials - 0.2% | | | |
| CRH PLC | | 44,300 | 3,796,510 |
| Eagle Materials, Inc. | | 19,300 | 5,255,390 |
| Grasim Industries Ltd. | | 100,100 | 3,319,718 |
| Martin Marietta Materials, Inc. | | 8,300 | 4,924,805 |
| Vulcan Materials Co. | | 18,300 | 5,023,533 |
| | | | 22,319,956 |
| Containers & Packaging - 0.1% | | | |
| Aptargroup, Inc. | | 8,900 | 1,308,122 |
| Crown Holdings, Inc. | | 15,700 | 1,392,590 |
| International Paper Co. | | 45,700 | 2,124,136 |
| Smurfit Westrock PLC | | 22,700 | 1,017,868 |
| | | | 5,842,716 |
| Metals & Mining - 0.3% | | | |
| ATI, Inc. (a) | | 127,200 | 8,612,712 |
| Carpenter Technology Corp. | | 98,000 | 14,295,260 |
| Freeport-McMoRan, Inc. | | 101,100 | 4,590,951 |
| Hindalco Industries Ltd. | | 136,700 | 1,093,237 |
| Welspun Gujarat Stahl Rohren Ltd. | | 476,500 | 3,646,263 |
| | | | 32,238,423 |
TOTAL MATERIALS | | | 72,798,183 |
| REAL ESTATE - 0.3% | | | |
| Equity Real Estate Investment Trusts (REITs) - 0.2% | | | |
| Welltower, Inc. | | 188,700 | 20,992,875 |
| Real Estate Management & Development - 0.1% | | | |
| Zillow Group, Inc. Class C (a) | | 149,600 | 7,285,520 |
TOTAL REAL ESTATE | | | 28,278,395 |
| TOTAL COMMON STOCKS (Cost $4,647,433,124) | | | 10,482,110,204 |
| | | | |
| Preferred Stocks - 1.2% |
| | | Shares | Value ($) |
| Convertible Preferred Stocks - 1.2% | | | |
| COMMUNICATION SERVICES - 0.1% | | | |
| Interactive Media & Services - 0.1% | | | |
| ByteDance Ltd. Series E1 (a)(c)(d) | | 37,119 | 8,530,689 |
| | | | |
| CONSUMER DISCRETIONARY - 0.1% | | | |
| Automobiles - 0.0% | | | |
| Neutron Holdings, Inc. Series 1C (a)(c)(d) | | 12,405,800 | 382,099 |
| Rad Power Bikes, Inc.: | | | |
| Series A(a)(c)(d) | | 14,368 | 3,592 |
| Series C(a)(c)(d) | | 56,537 | 27,138 |
| Waymo LLC Series A2 (a)(c)(d) | | 15,200 | 942,248 |
| | | | 1,355,077 |
| Broadline Retail - 0.1% | | | |
| Meesho: | | | |
| Series D2(c)(d) | | 32,839 | 1,831,431 |
| Series E(c)(d) | | 5,470 | 305,062 |
| Series F(a)(c)(d) | | 5,077 | 288,069 |
| | | | 2,424,562 |
| Hotels, Restaurants & Leisure - 0.0% | | | |
| MOD Super Fast Pizza Holdings LLC: | | | |
| Series 3(a)(c)(d)(e) | | 22,518 | 0 |
| Series 4(a)(c)(d)(e) | | 2,055 | 0 |
| Series 5(a)(c)(d)(e) | | 8,253 | 0 |
| | | | 0 |
TOTAL CONSUMER DISCRETIONARY | | | 3,779,639 |
| | | | |
| CONSUMER STAPLES - 0.0% | | | |
| Consumer Staples Distribution & Retail - 0.0% | | | |
| GoBrands, Inc. Series G (a)(c)(d) | | 19,600 | 485,296 |
| | | | |
| Food Products - 0.0% | | | |
| AgBiome LLC Series C (a)(c)(d) | | 266,499 | 3 |
| | | | |
| Tobacco - 0.0% | | | |
| JUUL Labs, Inc.: | | | |
| Series C(a)(c)(d) | | 660,029 | 706,231 |
| Series D(a)(c)(d) | | 5,110 | 5,468 |
| | | | 711,699 |
TOTAL CONSUMER STAPLES | | | 1,196,998 |
| | | | |
| FINANCIALS - 0.0% | | | |
| Financial Services - 0.0% | | | |
| Akeana Series C (c)(d) | | 65,000 | 856,050 |
| Tenstorrent Holdings, Inc. Series D1 (c)(d) | | 16,400 | 1,292,812 |
| | | | 2,148,862 |
| HEALTH CARE - 0.0% | | | |
| Biotechnology - 0.0% | | | |
| Castle Creek Biosciences, Inc.: | | | |
| Series B(a)(c)(d) | | 1,069 | 231,642 |
| Series D2(a)(c)(d) | | 642 | 130,724 |
| | | | 362,366 |
| Health Care Equipment & Supplies - 0.0% | | | |
| Blink Health LLC: | | | |
| Series C(a)(c)(d) | | 27,197 | 1,142,274 |
| Series D(c)(d) | | 5,797 | 243,474 |
| | | | 1,385,748 |
TOTAL HEALTH CARE | | | 1,748,114 |
| | | | |
| INDUSTRIALS - 0.7% | | | |
| Aerospace & Defense - 0.7% | | | |
| Space Exploration Technologies Corp.: | | | |
| Series G(a)(c)(d) | | 43,447 | 48,660,640 |
| Series H(a)(c)(d) | | 6,348 | 7,109,760 |
| Series J(c)(d) | | 5,376 | 6,021,120 |
| Series N(a)(c)(d) | | 12,799 | 14,334,880 |
| | | | 76,126,400 |
| Air Freight & Logistics - 0.0% | | | |
| Zipline International, Inc. Series G (c)(d) | | 46,703 | 1,959,191 |
| | | | |
| Construction & Engineering - 0.0% | | | |
| Beta Technologies, Inc. Series A (a)(c)(d) | | 12,033 | 1,326,157 |
| | | | |
TOTAL INDUSTRIALS | | | 79,411,748 |
| | | | |
| INFORMATION TECHNOLOGY - 0.3% | | | |
| Electronic Equipment, Instruments & Components - 0.0% | | | |
| Enevate Corp. Series E (a)(c)(d) | | 1,441,706 | 1,009,194 |
| Frore Systems, Inc. Series C (c)(d) | | 63,198 | 1,020,016 |
| | | | 2,029,210 |
| Semiconductors & Semiconductor Equipment - 0.1% | | | |
| Retym, Inc. Series C (a)(c)(d) | | 168,905 | 1,455,961 |
| Xsight Labs Ltd.: | | | |
| Series D(a)(c)(d) | | 140,500 | 781,180 |
| Series D1(c)(d) | | 51,402 | 407,104 |
| | | | 2,644,245 |
| Software - 0.2% | | | |
| Anthropic PBC Series D (c)(d) | | 67,650 | 2,029,500 |
| Applied Intuition, Inc.: | | | |
| Series A2(c)(d) | | 7,292 | 435,259 |
| Series B2(c)(d) | | 3,516 | 209,870 |
| Bolt Technology OU Series E (a)(c)(d) | | 18,160 | 2,446,684 |
| CoreWeave, Inc. Series C (c)(d) | | 1,727 | 1,388,111 |
| Databricks, Inc.: | | | |
| Series G(a)(c)(d) | | 51,900 | 4,013,946 |
| Series I(c)(d) | | 1,191 | 92,112 |
| Dataminr, Inc. Series D (a)(c)(d) | | 115,901 | 1,471,943 |
| Moloco, Inc. Series A (a)(c)(d) | | 19,537 | 1,065,353 |
| Stripe, Inc.: | | | |
| Series H(a)(c)(d) | | 8,700 | 239,337 |
| Series I(a)(c)(d) | | 135,124 | 3,717,261 |
| xAI Corp. Series B (c)(d) | | 635,731 | 7,609,700 |
| | | | 24,719,076 |
| Technology Hardware, Storage & Peripherals - 0.0% | | | |
| Lightmatter, Inc.: | | | |
| Series C(a)(c)(d) | | 77,697 | 1,699,233 |
| Series C2(c)(d) | | 12,204 | 318,646 |
| | | | 2,017,879 |
TOTAL INFORMATION TECHNOLOGY | | | 31,410,410 |
| | | | |
| MATERIALS - 0.0% | | | |
| Metals & Mining - 0.0% | | | |
| Diamond Foundry, Inc. Series C (a)(c)(d) | | 125,000 | 3,442,500 |
| | | | |
| TOTAL CONVERTIBLE PREFERRED STOCKS | | | 131,668,960 |
| Nonconvertible Preferred Stocks - 0.0% | | | |
| HEALTH CARE - 0.0% | | | |
| Biotechnology - 0.0% | | | |
| Castle Creek Biosciences, Inc. Series A4 (a)(c)(d) | | 9,636 | 2,172,822 |
| | | | |
| TOTAL PREFERRED STOCKS (Cost $79,643,258) | | | 133,841,782 |
| | | | |
| Convertible Bonds - 0.0% |
| | | Principal Amount (g) | Value ($) |
| CONSUMER DISCRETIONARY - 0.0% | | | |
| Automobiles - 0.0% | | | |
| Neutron Holdings, Inc.: | | | |
| 4% 5/22/27 (c)(d) | | 433,800 | 553,008 |
| 4% 6/12/27 (c)(d) | | 115,200 | 146,857 |
| (Cost $549,000) | | | 699,865 |
| | | | |
| Preferred Securities - 0.0% |
| | | Principal Amount (g) | Value ($) |
| CONSUMER DISCRETIONARY - 0.0% | | | |
| Automobiles - 0.0% | | | |
| Rad Power Bikes, Inc. 8% 12/31/25 (c)(d) | | 74,246 | 108,091 |
| INFORMATION TECHNOLOGY - 0.0% | | | |
| Electronic Equipment, Instruments & Components - 0.0% | | | |
| Enevate Corp. 6% (c)(d)(h) | | 74,970 | 85,119 |
| TOTAL PREFERRED SECURITIES (Cost $149,216) | | | 193,210 |
| | | | |
| Money Market Funds - 0.6% |
| | | Shares | Value ($) |
| Fidelity Cash Central Fund 5.39% (i) | | 44,523,722 | 44,532,626 |
| Fidelity Securities Lending Cash Central Fund 5.39% (i)(j) | | 21,445,359 | 21,447,503 |
| TOTAL MONEY MARKET FUNDS (Cost $65,980,129) | | | 65,980,129 |
| | | | |
| TOTAL INVESTMENT IN SECURITIES - 96.6% (Cost $4,793,754,727) | 10,682,825,190 |
NET OTHER ASSETS (LIABILITIES) - 3.4% | 378,400,128 |
| NET ASSETS - 100.0% | 11,061,225,318 |
| | |
Legend
| (b) | Security or a portion of the security is on loan at period end. |
| (c) | Restricted securities (including private placements) - Investment in securities not registered under the Securities Act of 1933 (excluding 144A issues). At the end of the period, the value of restricted securities (excluding 144A issues) amounted to $185,974,137 or 1.7% of net assets. |
| (e) | Investment is owned by a wholly-owned subsidiary (Subsidiary) that is treated as a corporation for U.S. tax purposes. |
| (f) | Security exempt from registration under Rule 144A of the Securities Act of 1933. These securities may be resold in transactions exempt from registration, normally to qualified institutional buyers. At the end of the period, the value of these securities amounted to $4,787,637 or 0.0% of net assets. |
| (g) | Amount is stated in United States dollars unless otherwise noted. |
| (h) | Security is perpetual in nature with no stated maturity date. |
| (i) | Affiliated fund that is generally available only to investment companies and other accounts managed by Fidelity Investments. The rate quoted is the annualized seven-day yield of the fund at period end. A complete unaudited listing of the fund's holdings as of its most recent quarter end is available upon request. In addition, each Fidelity Central Fund's financial statements, which are not covered by the Fund's Report of Independent Registered Public Accounting Firm, are available on the SEC's website or upon request. |
| (j) | Investment made with cash collateral received from securities on loan. |
| Additional information on each restricted holding is as follows: |
| Security | Acquisition Date | Acquisition Cost ($) |
| AgBiome LLC Series C | 6/29/18 | 1,687,925 |
| | | |
| Akeana Series C | 1/23/24 | 829,452 |
| | | |
| Ant International Co. Ltd. Class C | 5/16/18 | 2,989,179 |
| | | |
| Anthropic PBC Series D | 5/31/24 | 2,029,804 |
| | | |
| Applied Intuition, Inc. Class A | 7/02/24 | 334,351 |
| | | |
| Applied Intuition, Inc. Series A2 | 7/02/24 | 435,295 |
| | | |
| Applied Intuition, Inc. Series B2 | 7/02/24 | 209,887 |
| | | |
| Atom Tickets LLC | 8/15/17 | 1,999,998 |
| | | |
| Beta Technologies, Inc. Series A | 4/09/21 | 881,658 |
| | | |
| Blink Health LLC Series A1 | 12/30/20 - 6/17/24 | 233,945 |
| | | |
| Blink Health LLC Series C | 11/07/19 - 1/21/21 | 1,038,273 |
| | | |
| Blink Health LLC Series D | 6/17/24 - 6/25/24 | 243,474 |
| | | |
| Bolt Technology OU Series E | 1/03/22 | 4,717,904 |
| | | |
| ByteDance Ltd. Series E1 | 11/18/20 | 4,067,284 |
| | | |
| Castle Creek Biosciences, Inc. Series A4 | 9/29/16 | 3,185,523 |
| | | |
| Castle Creek Biosciences, Inc. Series B | 10/09/18 | 440,268 |
| | | |
| Castle Creek Biosciences, Inc. Series D2 | 6/28/21 | 110,200 |
| | | |
| CoreWeave, Inc. Series C | 5/17/24 | 1,345,419 |
| | | |
| Databricks, Inc. Series G | 2/01/21 | 3,068,465 |
| | | |
| Databricks, Inc. Series I | 9/14/23 | 87,539 |
| | | |
| Dataminr, Inc. Series D | 3/06/15 | 1,477,738 |
| | | |
| Diamond Foundry, Inc. Series C | 3/15/21 | 3,000,000 |
| | | |
| Enevate Corp. Series E | 1/29/21 | 1,598,398 |
| | | |
| Enevate Corp. 6% | 11/02/23 | 74,970 |
| | | |
| Epic Games, Inc. | 7/30/20 | 618,700 |
| | | |
| Fanatics, Inc. Class A | 8/13/20 | 2,754,038 |
| | | |
| Figma, Inc. | 5/15/24 | 1,014,555 |
| | | |
| Frore Systems, Inc. Series C | 5/10/24 | 1,015,617 |
| | | |
| GoBrands, Inc. Series G | 3/02/21 | 4,894,459 |
| | | |
| JUUL Labs, Inc. Class B | 11/21/17 | 0 |
| | | |
| JUUL Labs, Inc. Series C | 5/22/15 - 7/06/18 | 0 |
| | | |
| JUUL Labs, Inc. Series D | 6/25/18 - 7/06/18 | 0 |
| | | |
| Lenskart Solutions Pvt Ltd. | 4/30/24 | 5,104,010 |
| | | |
| Lightmatter, Inc. Series C | 5/19/23 | 1,278,644 |
| | | |
| Lightmatter, Inc. Series C2 | 12/18/23 | 317,326 |
| | | |
| Meesho Series D2 | 7/15/24 | 1,838,984 |
| | | |
| Meesho Series E | 7/15/24 | 306,320 |
| | | |
| Meesho Series F | 7/15/24 | 284,312 |
| | | |
| MOD Super Fast Pizza Holdings LLC Series 3 | 11/03/16 | 3,084,966 |
| | | |
| MOD Super Fast Pizza Holdings LLC Series 4 | 12/14/17 | 287,556 |
| | | |
| MOD Super Fast Pizza Holdings LLC Series 5 | 5/15/19 | 1,176,218 |
| | | |
| Moloco, Inc. Series A | 6/26/23 | 1,172,220 |
| | | |
| MultiPlan Corp. warrants | 10/08/20 | 0 |
| | | |
| Neutron Holdings, Inc. | 2/04/21 | 6,918 |
| | | |
| Neutron Holdings, Inc. Series 1C | 7/03/18 | 2,268,276 |
| | | |
| Neutron Holdings, Inc. 4% 5/22/27 | 6/04/20 | 433,800 |
| | | |
| Neutron Holdings, Inc. 4% 6/12/27 | 6/12/20 | 115,200 |
| | | |
| Rad Power Bikes, Inc. | 1/21/21 | 531,635 |
| | | |
| Rad Power Bikes, Inc. warrants 10/6/33 | 10/06/23 | 0 |
| | | |
| Rad Power Bikes, Inc. Series A | 1/21/21 | 69,309 |
| | | |
| Rad Power Bikes, Inc. Series C | 1/21/21 | 272,725 |
| | | |
| Rad Power Bikes, Inc. 8% 12/31/25 | 10/06/23 | 74,246 |
| | | |
| Retym, Inc. Series C | 5/17/23 - 6/20/23 | 1,314,384 |
| | | |
| Space Exploration Technologies Corp. | 4/06/17 - 9/11/17 | 2,534,625 |
| | | |
| Space Exploration Technologies Corp. Class C | 9/11/17 | 92,610 |
| | | |
| Space Exploration Technologies Corp. Series G | 1/20/15 - 9/07/23 | 3,949,239 |
| | | |
| Space Exploration Technologies Corp. Series H | 8/04/17 | 856,980 |
| | | |
| Space Exploration Technologies Corp. Series J | 9/07/23 | 4,354,560 |
| | | |
| Space Exploration Technologies Corp. Series N | 8/04/20 | 3,455,730 |
| | | |
| Stripe, Inc. Class B | 5/18/21 | 798,555 |
| | | |
| Stripe, Inc. Series H | 3/15/21 | 349,088 |
| | | |
| Stripe, Inc. Series I | 3/20/23 - 5/12/23 | 2,720,605 |
| | | |
| Tanium, Inc. Class B | 4/21/17 | 749,609 |
| | | |
| Tenstorrent Holdings, Inc. Series D1 | 7/16/24 | 1,292,754 |
| | | |
| Tory Burch LLC | 5/14/15 | 7,600,030 |
| | | |
| Waymo LLC Series A2 | 5/08/20 | 1,305,181 |
| | | |
| xAI Corp. Series B | 5/13/24 | 7,609,700 |
| | | |
| Xsight Labs Ltd. warrants 1/11/34 | 1/11/24 | 0 |
| | | |
| Xsight Labs Ltd. Series D | 2/16/21 | 1,123,438 |
| | | |
| Xsight Labs Ltd. Series D1 | 1/11/24 | 411,010 |
| | | |
| Zipline International, Inc. Series G | 6/07/24 | 1,959,018 |
| | | |
Affiliated Central Funds
Fiscal year to date information regarding the Fund's investments in Fidelity Central Funds, including the ownership percentage, is presented below.
| Affiliate | Value, beginning of period ($) | Purchases ($) | Sales Proceeds ($) | Dividend Income ($) | Realized Gain (loss) ($) | Change in Unrealized appreciation (depreciation) ($) | Value, end of period ($) | % ownership, end of period |
| Fidelity Cash Central Fund 5.39% | 5,676,177 | 908,722,301 | 869,866,213 | 1,513,041 | 361 | - | 44,532,626 | 0.1% |
| Fidelity Securities Lending Cash Central Fund 5.39% | 97,203,814 | 807,079,169 | 882,835,480 | 182,651 | - | - | 21,447,503 | 0.1% |
| Total | 102,879,991 | 1,715,801,470 | 1,752,701,693 | 1,695,692 | 361 | - | 65,980,129 | |
| | | | | | | | | |
Amounts in the dividend income column in the above table include any capital gain distributions from underlying funds, which are presented in the corresponding line item in the Consolidated Statement of Operations, if applicable.
Amounts in the dividend income column for Fidelity Securities Lending Cash Central Fund represents the income earned on investing cash collateral, less rebates paid to borrowers and any lending agent fees associated with the loan, plus any premium payments received for lending certain types of securities.
Amounts included in the purchases and sales proceeds columns may include in-kind transactions, if applicable.
Investment Valuation
The following is a summary of the inputs used, as of July 31, 2024, involving the Fund's assets and liabilities carried at fair value. The inputs or methodology used for valuing securities may not be an indication of the risk associated with investing in those securities. For more information on valuation inputs, and their aggregation into the levels used below, please refer to the Investment Valuation section in the accompanying Notes to Consolidated Financial Statements.
| Valuation Inputs at Reporting Date: |
| Description | Total ($) | Level 1 ($) | Level 2 ($) | Level 3 ($) |
Investments in Securities: | | | | |
|
| Equities: | | | | |
Communication Services | 1,669,702,885 | 1,660,526,596 | - | 9,176,289 |
Consumer Discretionary | 2,043,769,195 | 1,999,655,716 | 20,856,222 | 23,257,257 |
Consumer Staples | 122,295,576 | 121,095,956 | - | 1,199,620 |
Energy | 129,626,967 | 129,626,967 | - | - |
Financials | 373,557,097 | 364,338,462 | 5,736,500 | 3,482,135 |
Health Care | 848,741,492 | 836,871,904 | 7,605,092 | 4,264,496 |
Industrials | 486,402,581 | 379,437,130 | 1,358,023 | 105,607,428 |
Information Technology | 4,837,337,115 | 4,781,741,480 | - | 55,595,635 |
Materials | 76,240,683 | 72,798,183 | - | 3,442,500 |
Real Estate | 28,278,395 | 28,278,395 | - | - |
|
| Corporate Bonds | 699,865 | - | - | 699,865 |
|
| Preferred Securities | 193,210 | - | - | 193,210 |
|
| Money Market Funds | 65,980,129 | 65,980,129 | - | - |
| Total Investments in Securities: | 10,682,825,190 | 10,440,350,918 | 35,555,837 | 206,918,435 |
| | | | | |
|
| Net Unrealized Appreciation on Unfunded Commitments | 12,600 | - | - | 12,600 |
| Total | 12,600 | - | - | 12,600 |
The following is a reconciliation of consolidated Investments in Securities for which Level 3 inputs were used in determining value:
| |
| Investments in Securities: | |
| Beginning Balance | $ | 153,420,248 | |
| Net Realized Gain (Loss) on Investment Securities | | (1,745,977) | |
| Net Unrealized Gain (Loss) on Investment Securities | | 28,945,474 | |
| Cost of Purchases | | 40,717,098 | |
| Proceeds of Sales | | (7,341,688) | |
| Amortization/Accretion | | - | |
| Transfers into Level 3 | | - | |
| Transfers out of Level 3 | | (7,076,720) | |
| Ending Balance | $ | 206,918,435 | |
| The change in unrealized gain (loss) for the period attributable to Level 3 securities held at July 31, 2024 | $ | 26,191,087 | |
| The information used in the above reconciliation represents fiscal year to date activity for any Investments in Securities identified as using Level 3 inputs at either the beginning or the end of the current fiscal period. Cost of purchases and proceeds of sales may include securities received and/or delivered through in-kind transactions, corporate actions or exchanges. Transfers into Level 3 were attributable to a lack of observable market data resulting from decreases in market activity, decreases in liquidity, security restructurings or corporate actions. Transfers out of Level 3 were attributable to observable market data becoming available for those securities. Transfers in or out of Level 3 represent the beginning value of any Security or Instrument where a change in the pricing level occurred from the beginning to the end of the period. Realized and unrealized gains (losses) disclosed in the reconciliation are included in Net Gain (Loss) on the Fund's consolidated Statement of Operations. | |
Consolidated Financial Statements
| Consolidated Statement of Assets and Liabilities |
As of July 31, 2024 |
| Assets | | | | |
| Investment in securities, at value (including securities loaned of $21,153,167) - See accompanying schedule: | | | | |
Unaffiliated issuers (cost $4,727,774,598) | $ | 10,616,845,061 | | |
Fidelity Central Funds (cost $65,980,129) | | 65,980,129 | | |
| | | | | |
| | | | | |
| Total Investment in Securities (cost $4,793,754,727) | | | $ | 10,682,825,190 |
| Restricted cash | | | | 487,313 |
| Foreign currency held at value (cost $147,742) | | | | 147,464 |
| Receivable for investments sold | | | | 12,652,088 |
| Unrealized appreciation on unfunded commitments | | | | 12,600 |
| Receivable for fund shares sold | | | | 593,143,972 |
| Dividends receivable | | | | 1,494,085 |
| Interest receivable | | | | 91,291 |
| Distributions receivable from Fidelity Central Funds | | | | 92,342 |
| Other receivables | | | | 3,923 |
Total assets | | | | 11,290,950,268 |
| Liabilities | | | | |
| Payable for investments purchased | $ | 204,748,725 | | |
| Payable for fund shares redeemed | | 3,436 | | |
| Other payables and accrued expenses | | 3,536,725 | | |
| Collateral on securities loaned | | 21,436,064 | | |
| Total liabilities | | | | 229,724,950 |
| Commitments and contingent liabilities (see Commitments note) | | | | |
| Net Assets | | | $ | 11,061,225,318 |
| Net Assets consist of: | | | | |
| Paid in capital | | | $ | 4,293,802,119 |
| Total accumulated earnings (loss) | | | | 6,767,423,199 |
| Net Assets | | | $ | 11,061,225,318 |
Net Asset Value, offering price and redemption price per share ($11,061,225,318 ÷ 578,052,408 shares) | | | $ | 19.14 |
| Consolidated Statement of Operations |
| Year ended July 31, 2024 |
| Investment Income | | | | |
| Dividends | | | $ | 44,239,341 |
| Interest | | | | 57,840 |
| Income from Fidelity Central Funds (including $182,651 from security lending) | | | | 1,695,692 |
| Total income | | | | 45,992,873 |
| Expenses | | | | |
| Custodian fees and expenses | $ | 170,017 | | |
| Independent trustees' fees and expenses | | 45,583 | | |
| Legal | | 10,188 | | |
| Interest | | 307,526 | | |
| Total expenses | | | | 533,314 |
| Net Investment income (loss) | | | | 45,459,559 |
| Realized and Unrealized Gain (Loss) | | | | |
| Net realized gain (loss) on: | | | | |
| Investment Securities: | | | | |
| Unaffiliated issuers (net of foreign taxes of $716,104) | | 1,175,734,249 | | |
| Fidelity Central Funds | | 361 | | |
| Foreign currency transactions | | 205,463 | | |
| Total net realized gain (loss) | | | | 1,175,940,073 |
| Change in net unrealized appreciation (depreciation) on: | | | | |
| Investment Securities: | | | | |
| Unaffiliated issuers (net of increase in deferred foreign taxes of $1,821,380) | | 1,461,618,876 | | |
| Unfunded commitments | | 12,600 | | |
| Assets and liabilities in foreign currencies | | (40,421) | | |
| Total change in net unrealized appreciation (depreciation) | | | | 1,461,591,055 |
| Net gain (loss) | | | | 2,637,531,128 |
| Net increase (decrease) in net assets resulting from operations | | | $ | 2,682,990,687 |
| Consolidated Statement of Changes in Net Assets |
| |
| | Year ended July 31, 2024 | | Year ended July 31, 2023 |
| Increase (Decrease) in Net Assets | | | | |
| Operations | | | | |
| Net investment income (loss) | $ | 45,459,559 | $ | 50,535,378 |
| Net realized gain (loss) | | 1,175,940,073 | | (20,293,200) |
| Change in net unrealized appreciation (depreciation) | | 1,461,591,055 | | 2,175,349,626 |
| Net increase (decrease) in net assets resulting from operations | | 2,682,990,687 | | 2,205,591,804 |
| Distributions to shareholders | | (50,271,974) | | (244,959,359) |
| | | | | |
| Share transactions | | | | |
| Proceeds from sales of shares | | 2,049,908,079 | | 2,616,003,821 |
| Reinvestment of distributions | | 50,271,974 | | 244,959,359 |
| Cost of shares redeemed | | (2,532,092,535) | | (3,086,112,083) |
| | | | | |
Net increase (decrease) in net assets resulting from share transactions | | (431,912,482) | | (225,148,903) |
| Total increase (decrease) in net assets | | 2,200,806,231 | | 1,735,483,542 |
| | | | | |
| Net Assets | | | | |
| Beginning of period | | 8,860,419,087 | | 7,124,935,545 |
| End of period | $ | 11,061,225,318 | $ | 8,860,419,087 |
| | | | | |
| Other Information | | | | |
| Shares | | | | |
| Sold | | 122,702,414 | | 241,750,189 |
| Issued in reinvestment of distributions | | 3,456,580 | | 21,469,993 |
| Redeemed | | (151,297,981) | | (254,587,125) |
| Net increase (decrease) | | (25,138,987) | | 8,633,057 |
| | | | | |
Consolidated Financial Highlights
Fidelity® Series Blue Chip Growth Fund |
| |
| Years ended July 31, | | 2024 | | 2023 | | 2022 | | 2021 | | 2020 |
Selected Per-Share Data | | | | | | | | | | |
| Net asset value, beginning of period | $ | 14.69 | $ | 11.98 | $ | 19.34 | $ | 19.25 | $ | 15.57 |
| Income from Investment Operations | | | | | | | | | | |
Net investment income (loss) A,B | | .08 | | .07 | | .07 | | .06 | | .09 |
| Net realized and unrealized gain (loss) | | 4.45 | | 3.03 | | (3.37) | | 6.76 | | 5.30 |
| Total from investment operations | | 4.53 | | 3.10 | | (3.30) | | 6.82 | | 5.39 |
| Distributions from net investment income | | (.08) | | (.06) | | (.05) | | (.10) | | (.11) |
| Distributions from net realized gain | | - | | (.33) | | (4.00) | | (6.63) | | (1.60) |
| Total distributions | | (.08) | | (.39) | | (4.06) C | | (6.73) | | (1.71) |
| Net asset value, end of period | $ | 19.14 | $ | 14.69 | $ | 11.98 | $ | 19.34 | $ | 19.25 |
Total Return D | | | | 26.84% | | (22.51)% | | 46.98% | | 39.00% |
Ratios to Average Net Assets B,E,F | | | | | | | | | | |
| Expenses before reductions | | .01% | | -% G | | -% G | | -% G | | -% G |
| Expenses net of fee waivers, if any | | | | -% G | | -% G | | -% G | | -% G |
| Expenses net of all reductions | | .01% | | -% G | | -% G | | -% G | | -% G |
| Net investment income (loss) | | .47% | | .64% | | .45% | | .31% | | .59% |
| Supplemental Data | | | | | | | | | | |
| Net assets, end of period (000 omitted) | $ | 11,061,225 | $ | 8,860,419 | $ | 7,124,936 | $ | 6,279,875 | $ | 5,789,434 |
Portfolio turnover rate H | | | | 38% | | 48% | | 53% | | 52% I |
ACalculated based on average shares outstanding during the period.
BNet investment income (loss) is affected by the timing of the declaration of dividends by any underlying mutual funds or exchange-traded funds (ETFs). Net investment income (loss) of any mutual funds or ETFs is not included in the Fund's net investment income (loss) ratio.
CTotal distributions per share do not sum due to rounding.
DTotal returns would have been lower if certain expenses had not been reduced during the applicable periods shown.
EFees and expenses of any underlying mutual funds or exchange-traded funds (ETFs) are not included in the Fund's expense ratio. The Fund indirectly bears its proportionate share of these expenses. For additional expense information related to investments in Fidelity Central Funds, please refer to the "Investments in Fidelity Central Funds" note found in the Notes to Consolidated Financial Statements section of the most recent Annual or Semi-Annual report.
FExpense ratios reflect operating expenses of the class. Expenses before reductions do not reflect amounts reimbursed, waived, or reduced through arrangements with the investment adviser, brokerage services, or other offset arrangements, if applicable, and do not represent the amount paid by the class during periods when reimbursements, waivers or reductions occur.
GAmount represents less than .005%.
HAmount does not include the portfolio activity of any underlying mutual funds or exchange-traded funds (ETFs).
IPortfolio turnover rate excludes securities received or delivered in-kind.
Notes to Consolidated Financial Statements
For the period ended July 31, 2024
1. Organization.
Fidelity Series Blue Chip Growth Fund (the Fund) is a non-diversified fund of Fidelity Securities Fund (the Trust) and is authorized to issue an unlimited number of shares. Shares are offered only to certain other Fidelity funds, Fidelity managed 529 plans, and Fidelity managed collective investment trusts. The Trust is registered under the Investment Company Act of 1940, as amended (the 1940 Act), as an open-end management investment company organized as a Massachusetts business trust.
2. Investments in Fidelity Central Funds.
Funds may invest in Fidelity Central Funds, which are open-end investment companies generally available only to other investment companies and accounts managed by the investment adviser and its affiliates. The Consolidated Schedule of Investments lists any Fidelity Central Funds held as an investment as of period end, but does not include the underlying holdings of each Fidelity Central Fund. An investing fund indirectly bears its proportionate share of the expenses of the underlying Fidelity Central Funds.
Based on its investment objective, each Fidelity Central Fund may invest or participate in various investment vehicles or strategies that are similar to those of the investing fund. These strategies are consistent with the investment objectives of the investing fund and may involve certain economic risks which may cause a decline in value of each of the Fidelity Central Funds and thus a decline in the value of the investing fund.
| Fidelity Central Fund | Investment Manager | Investment Objective | Investment Practices | Expense RatioA |
| Fidelity Money Market Central Funds | Fidelity Management & Research Company LLC (FMR) | Each fund seeks to obtain a high level of current income consistent with the preservation of capital and liquidity. | Short-term Investments | Less than .005% |
A Expenses expressed as a percentage of average net assets and are as of each underlying Central Fund's most recent annual or semi-annual shareholder report.
A complete unaudited list of holdings for each Fidelity Central Fund is available upon request or at the Securities and Exchange Commission website at www.sec.gov. In addition, the financial statements of the Fidelity Central Funds which contain the significant accounting policies (including investment valuation policies) of those funds, and are not covered by the Report of Independent Registered Public Accounting Firm, are available on the Securities and Exchange Commission website or upon request.
3. Significant Accounting Policies.
The Fund is an investment company and applies the accounting and reporting guidance of the Financial Accounting Standards Board (FASB) Accounting Standards Codification Topic 946 Financial Services - Investment Companies. The consolidated financial statements have been prepared in conformity with accounting principles generally accepted in the United States of America (GAAP), which require management to make certain estimates and assumptions at the date of the consolidated financial statements. Actual results could differ from those estimates. Subsequent events, if any, through the date that the consolidated financial statements were issued have been evaluated in the preparation of the consolidated financial statements. The Fund's Consolidated Schedule of Investments lists any underlying mutual funds or exchange-traded funds (ETFs) but does not include the underlying holdings of these funds. The following summarizes the significant accounting policies of the Fund:
Investment Valuation. Investments are valued as of 4:00 p.m. Eastern time on the last calendar day of the period. The Board of Trustees (the Board) has designated the Fund's investment adviser as the valuation designee responsible for the fair valuation function and performing fair value determinations as needed. The investment adviser has established a Fair Value Committee (the Committee) to carry out the day-to-day fair valuation responsibilities and has adopted policies and procedures to govern the fair valuation process and the activities of the Committee. In accordance with these fair valuation policies and procedures, which have been approved by the Board, the Fund attempts to obtain prices from one or more third party pricing services or brokers to value its investments. When current market prices, quotations or currency exchange rates are not readily available or reliable, investments will be fair valued in good faith by the Committee, in accordance with the policies and procedures. Factors used in determining fair value vary by investment type and may include market or investment specific events, transaction data, estimated cash flows, and market observations of comparable investments. The frequency that the fair valuation procedures are used cannot be predicted and they may be utilized to a significant extent. The Committee manages the Fund's fair valuation practices and maintains the fair valuation policies and procedures. The Fund's investment adviser reports to the Board information regarding the fair valuation process and related material matters.
The Fund categorizes the inputs to valuation techniques used to value its investments into a disclosure hierarchy consisting of three levels as shown below:
Level 1 - unadjusted quoted prices in active markets for identical investments
Level 2 - other significant observable inputs (including quoted prices for similar investments, interest rates, prepayment speeds, etc.)
Level 3 - unobservable inputs (including the Fund's own assumptions based on the best information available)
Valuation techniques used to value the Fund's investments by major category are as follows:
Equity securities, including restricted securities, for which market quotations are readily available, are valued at the last reported sale price or official closing price as reported by a third party pricing service on the primary market or exchange on which they are traded and are categorized as Level 1 in the hierarchy. In the event there were no sales during the day or closing prices are not available, securities are valued at the last quoted bid price or may be valued using the last available price and are generally categorized as Level 2 in the hierarchy. For foreign equity securities, when market or security specific events arise, comparisons to the valuation of American Depositary Receipts (ADRs), futures contracts, Exchange-Traded Funds (ETFs) and certain indexes as well as quoted prices for similar securities may be used and would be categorized as Level 2 in the hierarchy. For equity securities, including restricted securities, where observable inputs are limited, assumptions about market activity and risk are used and these securities may be categorized as Level 3 in the hierarchy. Securities, including private placements or other restricted securities, for which observable inputs are not available are valued using alternate valuation approaches, including the market approach, the income approach and cost approach, and are categorized as Level 3 in the hierarchy. The market approach considers factors including the price of recent investments in the same or a similar security or financial metrics of comparable securities. The income approach considers factors including expected future cash flows, security specific risks and corresponding discount rates. The cost approach considers factors including the value of the security's underlying assets and liabilities.
Debt securities, including restricted securities, are valued based on evaluated prices received from third party pricing services or from brokers who make markets in such securities. Corporate bonds and preferred securities are valued by pricing services who utilize matrix pricing which considers yield or price of bonds of comparable quality, coupon, maturity and type or by broker-supplied prices. When independent prices are unavailable or unreliable, debt securities may be valued utilizing pricing methodologies which consider similar factors that would be used by third party pricing services. Debt securities are generally categorized as Level 2 in the hierarchy but may be Level 3 depending on the circumstances.
Investments in open-end mutual funds, including the Fidelity Central Funds, are valued at their closing net asset value (NAV) each business day and are categorized as Level 1 in the hierarchy.
The following provides information on Level 3 securities held by the Fund that were valued at period end based on unobservable inputs. These amounts exclude valuations provided by a broker.
| Asset Type | Fair Value | Valuation Technique(s) | Unobservable Input | Amount or Range/Weighted Average | Impact to Valuation from an Increase in InputA |
| Equities | $206,025,360 | Recovery value | Recovery value | $0.00 | Increase |
| | | Market approach | Transaction price | $1.10 - $215.03 / $110.33 | Increase |
| | | | Premium rate | 10.0% | Increase |
| | | Market comparable | Enterprise value/Revenue multiple (EV/R) | 0.8 - 61.0 / 12.0 | Increase |
| | | | Enterprise value/EBITDA multiple (EV/EBITDA) | 6.5 - 21.3 / 20.8 | Increase |
| | | Discounted cash flow | Yield | 33.0% | Decrease |
| | | Book value | Book value multiple | 1.6 | Increase |
| | | Black scholes | Discount rate | 4.1% - 5.0% / 4.3% | Increase |
| | | | Volatility | 40.0% - 100.0% / 68.6% | Increase |
| | | | Term | 0.7 - 4.0 / 3.0 | Increase |
| Corporate Bonds | $699,865 | Market comparable | Enterprise value/Revenue multiple (EV/R) | 2.0 | Increase |
| Preferred Securities | $193,210 | Recovery value | Recovery value | $0.00 | Increase |
| | | Market approach | Transaction price | $100.00 | Increase |
| | | | Discount rate | 35.4% | Decrease |
| | | | Probability rate | 0.0% - 60.0% / 33.3% | Increase |
| | | Market comparable | Enterprise value/Revenue multiple (EV/R) | 1.6 | Increase |
| | | Black scholes | Discount rate | 4.4% - 5.4% / 4.9% | Increase |
| | | | Volatility | 60.0% - 100.0% / 77.6% | Increase |
| | | | Term | 0.3 - 2.1 / 1.3 | Increase |
A Represents the directional change in the fair value of the Level 3 investments that could have resulted from an increase in the corresponding input as of period end. A decrease to the unobservable input would have had the opposite effect. Significant changes in these inputs may have resulted in a significantly higher or lower fair value measurement at period end.
Changes in valuation techniques may result in transfers in or out of an assigned level within the disclosure hierarchy. The aggregate value of investments by input level as of July 31, 2024, as well as a roll forward of Level 3 investments, is included at the end of the Fund's Consolidated Schedule of Investments.
Foreign Currency. Certain Funds may use foreign currency contracts to facilitate transactions in foreign-denominated securities. Gains and losses from these transactions may arise from changes in the value of the foreign currency or if the counterparties do not perform under the contracts' terms.
Foreign-denominated assets, including investment securities, and liabilities are translated into U.S. dollars at the exchange rates at period end. Purchases and sales of investment securities, income and dividends received, and expenses denominated in foreign currencies are translated into U.S. dollars at the exchange rate in effect on the transaction date.
The effects of exchange rate fluctuations on investments are included with the net realized and unrealized gain (loss) on investment securities. Other foreign currency transactions resulting in realized and unrealized gain (loss) are disclosed separately.
Investment Transactions and Income. For financial reporting purposes, the Fund's investment holdings and NAV include trades executed through the end of the last business day of the period. The NAV per share for processing shareholder transactions is calculated as of the close of business of the New York Stock Exchange (NYSE), normally 4:00 p.m. Eastern time and includes trades executed through the end of the prior business day. Gains and losses on securities sold are determined on the basis of identified cost and include proceeds received from litigation. Commissions paid to certain brokers with whom the investment adviser, or its affiliates, places trades on behalf of a fund include an amount in addition to trade execution, which may be rebated back to a fund. Any such rebates are included in net realized gain (loss) on investments in the Consolidated Statement of Operations. Dividend income is recorded on the ex-dividend date, except for certain dividends from foreign securities where the ex-dividend date may have passed, which are recorded as soon as the Fund is informed of the ex-dividend date. Non-cash dividends included in dividend income, if any, are recorded at the fair market value of the securities received. Income and capital gain distributions from Fidelity Central Funds, if any, are recorded on the ex-dividend date. Certain distributions received by the Fund represent a return of capital or capital gain. The Fund determines the components of these distributions subsequent to the ex-dividend date, based upon receipt of tax filings or other correspondence relating to the underlying investment. These distributions are recorded as a reduction of cost of investments and/or as a realized gain. Interest income is accrued as earned and includes coupon interest and amortization of premium and accretion of discount on debt securities as applicable. Investment income is recorded net of foreign taxes withheld where recovery of such taxes is uncertain. Funds may file withholding tax reclaims in certain jurisdictions to recover a portion of amounts previously withheld. Any withholding tax reclaims income is included in the Consolidated Statement of Operations in dividends. Any receivables for withholding tax reclaims are included in the Consolidated Statement of Assets and Liabilities in dividends receivable.
Expenses. Expenses directly attributable to a fund are charged to that fund. Expenses attributable to more than one fund are allocated among the respective funds on the basis of relative net assets or other appropriate methods. Expenses included in the accompanying consolidated financial statements reflect the expenses of that fund and do not include any expenses associated with any underlying mutual funds or exchange-traded funds. Although not included in a fund's expenses, a fund indirectly bears its proportionate share of these expenses through the net asset value of each underlying mutual fund or exchange-traded fund. Expense estimates are accrued in the period to which they relate and adjustments are made when actual amounts are known.
Income Tax Information and Distributions to Shareholders. Each year, the Fund intends to qualify as a regulated investment company under Subchapter M of the Internal Revenue Code, including distributing substantially all of its taxable income and realized gains. As a result, no provision for U.S. Federal income taxes is required. As of July 31, 2024, the Fund did not have any unrecognized tax benefits in the consolidated financial statements; nor is the Fund aware of any tax positions for which it is reasonably possible that the total amounts of unrecognized tax benefits will significantly change in the next twelve months. The Fund files a U.S. federal tax return, in addition to state and local tax returns as required. The Fund's federal income tax returns are subject to examination by the Internal Revenue Service (IRS) for a period of three fiscal years after they are filed. State and local tax returns may be subject to examination for an additional fiscal year depending on the jurisdiction. Foreign taxes are provided for based on the Fund's understanding of the tax rules and rates that exist in the foreign markets in which it invests. The Fund is subject to a tax imposed on capital gains by certain countries in which it invests. An estimated deferred tax liability for net unrealized appreciation on the applicable securities is included in Other payables and accrued expenses on the Consolidated Statement of Assets & Liabilities.
Distributions are declared and recorded on the ex-dividend date. Income and capital gain distributions are determined in accordance with income tax regulations, which may differ from GAAP. In addition, the Fund claimed a portion of the payment made to redeeming shareholders as a distribution for income tax purposes.
Capital accounts within the consolidated financial statements are adjusted for permanent book-tax differences. These adjustments have no impact on net assets or the results of operations. Capital accounts are not adjusted for temporary book-tax differences which will reverse in a subsequent period.
Book-tax differences are primarily due to foreign currency transactions, certain foreign taxes, passive foreign investment companies (PFIC), partnerships, capital loss carryforwards and losses deferred due to wash sales.
As of period end, the cost and unrealized appreciation (depreciation) in securities, and derivatives if applicable, for federal income tax purposes were as follows:
| Gross unrealized appreciation | $6,020,821,849 |
| Gross unrealized depreciation | (215,987,211) |
| Net unrealized appreciation (depreciation) | $5,804,834,638 |
| Tax Cost | $4,878,003,152 |
The tax-based components of distributable earnings as of period end were as follows:
| Undistributed ordinary income | $49,942,738 |
| Undistributed long-term capital gain | $916,106,409 |
| Net unrealized appreciation (depreciation) on securities and other investments | $5,804,827,532 |
The tax character of distributions paid was as follows:
| | July 31, 2024 | July 31, 2023 |
| Ordinary Income | $50,271,974 | $42,071,482 |
| Long-term Capital Gains | - | 202,887,877 |
| Total | $50,271,974 | $ 244,959,359 |
Restricted Securities (including Private Placements). Funds may invest in securities that are subject to legal or contractual restrictions on resale. These securities generally may be resold in transactions exempt from registration or to the public if the securities are registered. Disposal of these securities may involve time-consuming negotiations and expense, and prompt sale at an acceptable price may be difficult. Information regarding restricted securities held at period end is included at the end of the Consolidated Schedule of Investments, if applicable.
Commitments. A commitment is an agreement to acquire an investment at a future date (subject to conditions) in connection with a potential public or non-public offering. Commitments outstanding at period end are presented in the table below. Unrealized appreciation (depreciation) on any commitments outstanding at period end is separately presented in the Consolidated Statement of Assets and Liabilities as Unrealized appreciation (depreciation) on unfunded commitments, and any change in unrealized appreciation (depreciation) on unfunded commitments during the period is separately presented in the Consolidated Statement of Operations, as applicable based on contractual conditions of each commitment.
| | Investment to be Acquired | Commitment Amount ($) | Unrealized Appreciation (Depreciation)($) |
| Fidelity Series Blue Chip Growth Fund | JUUL Labs, Inc. Class A | 5,152,785 | 12,600 |
Consolidated Subsidiary. The Funds included in the table below hold certain investments through a wholly-owned subsidiary ("Subsidiary"), which may be subject to federal and state taxes upon disposition.
As of period end, investments in Subsidiaries were as follows:
| | Amount ($) | % of Net Assets |
| Fidelity Series Blue Chip Growth Fund | 4,238,729 | .04 |
The financial statements have been consolidated to include the Subsidiary accounts where applicable. Accordingly, all inter-company transactions and balances have been eliminated.
At period end, any estimated tax liability for these investments is presented as "Deferred taxes" in the Consolidated Statement of Assets and Liabilities and included in "Change in net unrealized appreciation (depreciation) on investment securities" in the Consolidated Statement of Operations. The tax liability incurred may differ materially depending on conditions when these investments are disposed. Any cash held by a Subsidiary is restricted as to its use and is presented as "Restricted cash" in the Consolidated Statement of Assets and Liabilities, if applicable.
4. Purchases and Sales of Investments.
Purchases and sales of securities, other than short-term securities and in-kind transactions, as applicable, are noted in the table below.
| | Purchases ($) | Sales ($) |
| Fidelity Series Blue Chip Growth Fund | 2,743,448,208 | 3,611,189,872 |
5. Fees and Other Transactions with Affiliates.
Management Fee. Fidelity Management & Research Company LLC (the investment adviser) and its affiliates provide the Fund with investment management related services for which the Fund does not pay a management fee. Under the management contract, the investment adviser or an affiliate pays all ordinary operating expenses of the Fund, except custody fees, fees and expenses of the independent Trustees, and certain miscellaneous expenses such as proxy and shareholder meeting expenses.
Brokerage Commissions. A portion of portfolio transactions were placed with brokerage firms which are affiliates of the investment adviser. Brokerage commissions are included in net realized gain (loss) and change in net unrealized appreciation (depreciation) in the Consolidated Statement of Operations. The commissions paid to these affiliated firms were as follows:
| | Amount ($) |
| Fidelity Series Blue Chip Growth Fund | 47,134 |
Interfund Lending Program. Pursuant to an Exemptive Order issued by the Securities and Exchange Commission (the SEC), the Fund, along with other registered investment companies having management contracts with Fidelity Management & Research Company LLC (FMR), or other affiliated entities of FMR, may participate in an interfund lending program. This program provides an alternative credit facility allowing the Fund to borrow from, or lend money to, other participating affiliated funds. At period end, there were no interfund loans outstanding. Activity in this program during the period for which loans were outstanding was as follows:
| | Borrower or Lender | Average Loan Balance ($) | Weighted Average Interest Rate | Interest Expense ($) |
| Fidelity Series Blue Chip Growth Fund | Borrower | 48,449,902 | 5.57% | 307,526 |
Interfund Trades. Funds may purchase from or sell securities to other Fidelity Funds under procedures adopted by the Board. The procedures have been designed to ensure these interfund trades are executed in accordance with Rule 17a-7 of the 1940 Act. Any interfund trades are included within the respective purchases and sales amounts shown in the Purchases and Sales of Investments note. Interfund trades during the period are noted in the table below.
| | Purchases ($) | Sales ($) | Realized Gain (Loss)($) |
| Fidelity Series Blue Chip Growth Fund | 121,308,759 | 160,732,993 | 19,932,875 |
Sub-Advisory Arrangements. Effective March 1, 2024, the Fund's sub-advisory agreements with Fidelity Management & Research (Hong Kong) Limited and Fidelity Management & Research (Japan) Limited were amended to provide that the investment adviser pays each sub-adviser monthly fees equal to 110% of the sub-adviser's costs for providing sub-advisory services.
6. Committed Line of Credit.
Certain Funds participate with other funds managed by the investment adviser or an affiliate in a $4.25 billion credit facility (the "line of credit") to be utilized for temporary or emergency purposes to fund shareholder redemptions or for other short-term liquidity purposes. The commitment fees on the pro-rata portion of the line of credit are borne by the investment adviser. During the period, there were no borrowings on this line of credit.
7. Security Lending.
Funds lend portfolio securities from time to time in order to earn additional income. Lending agents are used, including National Financial Services (NFS), an affiliate of the investment adviser. Pursuant to a securities lending agreement, NFS will receive a fee, which is capped at 9.9% of a fund's daily lending revenue, for its services as lending agent. A fund may lend securities to certain qualified borrowers, including NFS. On the settlement date of the loan, a fund receives collateral (in the form of U.S. Treasury obligations, letters of credit and/or cash) against the loaned securities and maintains collateral in an amount not less than 100% of the market value of the loaned securities during the period of the loan. The market value of the loaned securities is determined at the close of business of a fund and any additional required collateral is delivered to a fund on the next business day. A fund or borrower may terminate the loan at any time, and if the borrower defaults on its obligation to return the securities loaned because of insolvency or other reasons, a fund may apply collateral received from the borrower against the obligation. A fund may experience delays and costs in recovering the securities loaned. Any cash collateral received is invested in the Fidelity Securities Lending Cash Central Fund. Any loaned securities are identified as such in the Consolidated Schedule of Investments, and the value of loaned securities and cash collateral at period end, as applicable, are presented in the Consolidated Statement of Assets and Liabilities. Security lending income represents the income earned on investing cash collateral, less rebates paid to borrowers and any lending agent fees associated with the loan, plus any premium payments received for lending certain types of securities. Security lending income is presented in the Consolidated Statement of Operations as a component of income from Fidelity Central Funds. Affiliated security lending activity, if any, was as follows:
| | Total Security Lending Fees Paid to NFS ($) | Security Lending Income From Securities Loaned to NFS ($) | Value of Securities Loaned to NFS at Period End ($) |
| Fidelity Series Blue Chip Growth Fund | 19,542 | 13,553 | - |
8. Other.
A fund's organizational documents provide former and current trustees and officers with a limited indemnification against liabilities arising in connection with the performance of their duties to the fund. In the normal course of business, a fund may also enter into contracts that provide general indemnifications. A fund's maximum exposure under these arrangements is unknown as this would be dependent on future claims that may be made against a fund. The risk of material loss from such claims is considered remote.
At the end of the period, mutual funds and accounts managed by the investment adviser or its affiliates were the owners of record of all of the outstanding shares of the Fund.
9. Risk and Uncertainties.
Many factors affect a fund's performance. Developments that disrupt global economies and financial markets, such as pandemics, epidemics, outbreaks of infectious diseases, war, terrorism, and environmental disasters, may significantly affect a fund's investment performance. The effects of these developments to a fund will be impacted by the types of securities in which a fund invests, the financial condition, industry, economic sector, and geographic location of an issuer, and a fund's level of investment in the securities of that issuer. Significant concentrations in security types, issuers, industries, sectors, and geographic locations may magnify the factors that affect a fund's performance.
Report of Independent Registered Public Accounting Firm
To the Board of Trustees of Fidelity Securities Fund and the Shareholders of Fidelity Series Blue Chip Growth Fund:
Opinion on the Financial Statements and Financial Highlights
We have audited the accompanying consolidated statement of assets and liabilities of Fidelity Series Blue Chip Growth Fund (the "Fund"), a fund of Fidelity Securities Fund, including the consolidated schedule of investments, as of July 31, 2024, the related consolidated statement of operations for the year then ended, the consolidated statement of changes in net assets for each of the two years in the period then ended, the consolidated financial highlights for each of the five years in the period then ended, and the related notes. In our opinion, the consolidated financial statements and consolidated financial highlights present fairly, in all material respects, the financial position of the Fund as of July 31, 2024, and the results of its operations for the year then ended, the changes in its net assets for each of the two years in the period then ended, and the financial highlights for each of the five years in the period then ended in conformity with accounting principles generally accepted in the United States of America.
Basis for Opinion
These financial statements and financial highlights are the responsibility of the Fund's management. Our responsibility is to express an opinion on the Fund's financial statements and financial highlights based on our audits. We are a public accounting firm registered with the Public Company Accounting Oversight Board (United States) (PCAOB) and are required to be independent with respect to the Fund in accordance with the U.S. federal securities laws and the applicable rules and regulations of the Securities and Exchange Commission and the PCAOB.
We conducted our audits in accordance with the standards of the PCAOB. Those standards require that we plan and perform the audit to obtain reasonable assurance about whether the financial statements and financial highlights are free of material misstatement, whether due to error or fraud. The Fund is not required to have, nor were we engaged to perform, an audit of its internal control over financial reporting. As part of our audits, we are required to obtain an understanding of internal control over financial reporting but not for the purpose of expressing an opinion on the effectiveness of the Fund's internal control over financial reporting. Accordingly, we express no such opinion.
Our audits included performing procedures to assess the risks of material misstatement of the financial statements and financial highlights, whether due to error or fraud, and performing procedures that respond to those risks. Such procedures included examining, on a test basis, evidence regarding the amounts and disclosures in the financial statements and financial highlights. Our audits also included evaluating the accounting principles used and significant estimates made by management, as well as evaluating the overall presentation of the financial statements and financial highlights. Our procedures included confirmation of securities owned as of July 31, 2024, by correspondence with the custodian and brokers; when replies were not received from brokers, we performed other auditing procedures. We believe that our audits provide a reasonable basis for our opinion.
/s/ Deloitte & Touche LLP
Boston, Massachusetts
September 16, 2024
We have served as the auditor of one or more of the Fidelity investment companies since 1999.
Distributions
(Unaudited)
The dividend and capital gains distributions for the fund(s) are available on Fidelity.com or Institutional.Fidelity.com.
The fund hereby designates as a capital gain dividend with respect to the taxable year ended July 31, 2024, $967,149,789, or, if subsequently determined to be different, the net capital gain of such year.
The fund designates $3,099,728 of distributions paid during the fiscal year ended 2024 as qualifying to be taxed as section 163(j) interest dividends.
The fund designates 82% and 64% of the dividends distributed in September and December, respectively during the fiscal year as qualifying for the dividends-received deduction for corporate shareholders.
The fund designates 90.79% and 76.93% of the dividends distributed in September and December, respectively during the fiscal year as amounts which may be taken into account as a dividend for the purposes of the maximum rate under section 1(h)(11) of the Internal Revenue Code.
The fund designates 0.07% and 0.66% of the dividends distributed in September and December, respectively during the fiscal year as a section 199A dividend.
The fund will notify shareholders in January 2025 of amounts for use in preparing 2024 income tax returns.
Item 8: Changes in and Disagreements with Accountants for Open-End Management Investment Companies
Note: This is not applicable for any fund included in this document.
Item 9: Proxy Disclosures for Open-End Management Investment Companies
| A special meeting of shareholders was held on July 16, 2024. The results of votes taken among shareholders on the proposal before them are reported below. Each vote reported represents one dollar of net asset value held on the record date for the meeting. |
| Proposal 1 |
| To elect a Board of Trustees. |
| | # of Votes | % of Votes |
| Bettina Doulton |
| Affirmative | 88,756,759,992.17 | 95.11 |
| Withheld | 4,564,750,651.52 | 4.89 |
| TOTAL | 93,321,510,643.68 | 100.00 |
| Robert A. Lawrence |
| Affirmative | 88,523,438,331.98 | 94.86 |
| Withheld | 4,798,072,311.70 | 5.14 |
| TOTAL | 93,321,510,643.68 | 100.00 |
| Vijay C. Advani |
| Affirmative | 88,484,371,668.51 | 94.82 |
| Withheld | 4,837,138,975.17 | 5.18 |
| TOTAL | 93,321,510,643.68 | 100.00 |
| Thomas P. Bostick |
| Affirmative | 88,618,596,648.21 | 94.96 |
| Withheld | 4,702,913,995.47 | 5.04 |
| TOTAL | 93,321,510,643.68 | 100.00 |
| Donald F. Donahue |
| Affirmative | 88,542,403,002.79 | 94.88 |
| Withheld | 4,779,107,640.89 | 5.12 |
| TOTAL | 93,321,510,643.68 | 100.00 |
| Vicki L. Fuller |
| Affirmative | 88,788,711,037.44 | 95.14 |
| Withheld | 4,532,799,606.24 | 4.86 |
| TOTAL | 93,321,510,643.68 | 100.00 |
| Patricia L. Kampling |
| Affirmative | 88,819,315,996.59 | 95.18 |
| Withheld | 4,502,194,647.10 | 4.82 |
| TOTAL | 93,321,510,643.68 | 100.00 |
| Thomas A. Kennedy |
| Affirmative | 88,667,457,817.34 | 95.01 |
| Withheld | 4,654,052,826.34 | 4.99 |
| TOTAL | 93,321,510,643.68 | 100.00 |
| Oscar Munoz |
| Affirmative | 88,183,976,568.30 | 94.49 |
| Withheld | 5,137,534,075.39 | 5.51 |
| TOTAL | 93,321,510,643.68 | 100.00 |
| Karen B. Peetz |
| Affirmative | 88,720,160,318.58 | 95.07 |
| Withheld | 4,601,350,325.11 | 4.93 |
| TOTAL | 93,321,510,643.68 | 100.00 |
| David M. Thomas |
| Affirmative | 88,471,490,747.86 | 94.80 |
| Withheld | 4,850,019,895.82 | 5.20 |
| TOTAL | 93,321,510,643.68 | 100.00 |
| Susan Tomasky |
| Affirmative | 88,536,869,646.78 | 94.87 |
| Withheld | 4,784,640,996.90 | 5.13 |
| TOTAL | 93,321,510,643.68 | 100.00 |
| Michael E. Wiley |
| Affirmative | 88,526,906,267.86 | 94.86 |
| Withheld | 4,794,604,375.83 | 5.14 |
| TOTAL | 93,321,510,643.68 | 100.00 |
| | | |
| Proposal 1 reflects trust-wide proposal and voting results. |
Item 10: Remuneration Paid to Directors, Officers, and others of Open-End Management Investment Companies
Note: This information is disclosed as part of the consolidated financial statements for each Fund as part of Item 7: Consolidated Financial Statements and Consolidated Financial Highlights for Open-End Management Investment companies.
Item 11: Statement Regarding Basis for Approval of Investment Advisory Contract
Board Approval of Investment Advisory Contracts and Management Fees
Fidelity Series Blue Chip Growth Fund
Each year, the Board of Trustees, including the Independent Trustees (together, the Board), considers the renewal of the fund's management contract with Fidelity Management & Research Company LLC (FMR) and the sub-advisory agreements (together, the Advisory Contracts) for the fund. FMR and the sub-advisers are referred to herein as the Investment Advisers. The Board, assisted by the advice of fund counsel and Independent Trustees' counsel, requests and considers a broad range of information relevant to the renewal of the Advisory Contracts throughout the year.
The Board meets regularly and, at each of its meetings, covers an extensive agenda of topics and materials and considers factors that are relevant to its annual consideration of the renewal of the fund's Advisory Contracts, including the services and support provided to the fund and its shareholders. The Board, acting directly and through its Committees (each of which is composed of and chaired by Independent Trustees), requests and receives information concerning the annual consideration of the renewal of the fund's Advisory Contracts. The Board also meets as needed to review matters specifically related to the Board's annual consideration of the renewal of the Advisory Contracts. Members of the Board may also meet with trustees of other Fidelity funds through joint ad hoc committees to discuss certain matters relevant to all of the Fidelity funds.
At its May 2024 meeting, the Board unanimously determined to renew the fund's Advisory Contracts. The Board considered all factors it believed relevant and reached a determination, with the assistance of fund counsel and Independent Trustees' counsel and through the exercise of its business judgment, that the renewal of the Advisory Contracts was in the best interests of the fund and its shareholders and the fact that no fee is payable under the management contract was fair and reasonable in light of all of the surrounding circumstances.
Nature, Extent, and Quality of Services Provided. The Board considered staffing as it relates to the fund, including the backgrounds and experience of investment personnel of the Investment Advisers, and also considered the Investment Advisers' implementation of the fund's investment program. The Independent Trustees also had discussions with senior management of Fidelity's investment operations and investment groups. The Board considered the structure of the investment personnel compensation program and whether this structure provides appropriate incentives to act in the best interests of the fund.
Resources Dedicated to Investment Management and Support Services. The Board and the Fund Oversight and Research Committees reviewed the general qualifications and capabilities of Fidelity's investment staff, including its size, education, experience, and resources, as well as Fidelity's approach to recruiting, training, managing, and compensating investment personnel. The Board noted the resources devoted to expansion of Fidelity's global investment organization, and that Fidelity's analysts have extensive resources, tools, and capabilities that allow them to conduct sophisticated quantitative and fundamental analysis, as well as credit analysis of issuers, counterparties, and guarantors. Further, the Board considered that Fidelity's investment professionals have sufficient access to global information and data so as to provide competitive investment results over time, and that those professionals also have access to sophisticated tools that permit them to assess portfolio construction and risk and performance attribution characteristics continuously, as well as to transmit new information and research conclusions rapidly around the world. Additionally, in its deliberations, the Board considered Fidelity's trading, risk management, compliance, and technology and operations capabilities and resources, which are integral parts of the investment management process.
Administrative Services. The Board considered (i) the nature, extent, quality, and cost of advisory and administrative services performed by the Investment Advisers and their affiliates under the Advisory Contracts and under separate agreements covering transfer agency and pricing and bookkeeping services for the fund; (ii) the nature and extent of Fidelity's supervision of third party service providers, principally custodians, subcustodians, and pricing vendors; and (iii) the resources devoted by Fidelity to, and the record of compliance with, the fund's compliance policies and procedures. The Board also reviewed the allocation of fund brokerage, including allocations to brokers affiliated with the Investment Advisers, the use of brokerage commissions to pay fund expenses, and the use of "soft" commission dollars to pay for research services. The Board also considered the fund's securities lending activities and any payments made to Fidelity relating to securities lending under a separate agreement.
Investment Performance. The Board reviewed the fund's absolute investment performance, as well as the fund's relative investment performance, and noted that the fund is not publicly offered as a stand-alone investment product. In this regard, the Board noted that the fund is designed to offer an investment option for other investment companies, 529 plans, and collective investment trusts managed by Fidelity and ultimately to enhance the performance of those investment companies, 529 plans, and collective investment trusts.
Based on its review, the Board concluded that the nature, extent, and quality of services provided to the fund under the Advisory Contracts should continue to benefit the shareholders of the fund.
Competitiveness of Management Fee and Total Expense Ratio. The Board considered that the fund does not pay FMR a management fee for investment advisory services, but that FMR receives fees for providing services to funds that invest in the fund. The Board noted that FMR or an affiliate undertakes to pay all operating expenses of the fund, except transfer agent fees, 12b-1 fees, Independent Trustee fees and expenses, custodian fees and expenses, proxy and shareholder meeting expenses, interest, taxes, and extraordinary expenses (such as litigation expenses). The Board further noted that the fund pays its non-operating expenses, including brokerage commissions and fees and expenses associated with the fund's securities lending program, if applicable.
The Board further considered that FMR has contractually agreed to reimburse the fund to the extent that total operating expenses, with certain exceptions, as a percentage of its average net assets, exceed 0.003% through November 30, 2026.
Based on its review, the Board considered that the fund does not pay a management fee and concluded that the total expense ratio of the fund was reasonable in light of the services that the fund and its shareholders receive and the other factors considered.
Costs of the Services and Profitability. The Board considered the level of Fidelity's profits in respect of all the Fidelity funds.
A public accounting firm has been engaged annually by the Board as part of the Board's assessment of Fidelity's profitability analysis. The engagement includes the review and assessment of the methodologies used by Fidelity in determining the revenues and expenses attributable to Fidelity's fund business, and completion of agreed-upon procedures in respect of the mathematical accuracy of certain fund profitability information and its conformity to established allocation methodologies. After considering the reports issued under the engagement and information provided by Fidelity, the Board concluded that while other allocation methods may also be reasonable, Fidelity's profitability methodologies are reasonable in all material respects.
The Board also reviewed Fidelity's non-fund businesses and potential indirect benefits such businesses may have received as a result of their association with Fidelity's fund business (i.e., fall-out benefits) as well as cases where Fidelity's affiliates may benefit from the funds' business. The Board considered areas where potential indirect benefits to the Fidelity funds from their relationships with Fidelity may exist. The Board's consideration of these matters was informed by the findings of a joint ad hoc committee created by it and the boards of other Fidelity funds to evaluate potential fall-out benefits.
The Board concluded that the costs of the services provided by and the profits realized by Fidelity in connection with the operation of the fund were not relevant to the renewal of the Advisory Contracts because the fund pays no advisory fees and FMR bears all expenses of the fund with certain exceptions.
Economies of Scale. The Board concluded that because the fund pays no advisory fees and FMR bears all expenses of the fund with certain exceptions, the realization of economies of scale was not a material factor in the Board's decision to renew the fund's Advisory Contracts.
Additional Information Requested by the Board. In order to develop fully the factual basis for consideration of the Fidelity funds' advisory contracts, the Board requested and received additional information on certain topics, including but not limited to: (i) fund flow and performance trends, in particular the underperformance of certain funds and strategies, and Fidelity's long-term strategies for certain funds; (ii) the operation of performance fees and the rationale for implementing performance fees on certain categories of funds but not others; (iii) Fidelity's pricing philosophy compared to competitors; (iv) fund profitability methodology and data; (v) evaluation of competitive fund data and peer group classifications and fee and expense comparisons; (vi) the management fee and expense structures for different funds and classes and information about the differences between various fee and expense structures; (vii) the variable management fee implemented for certain funds effective March 1, 2024; and (viii) information regarding other accounts managed by Fidelity and the funds' sub-advisory arrangements.
Conclusion. Based on its evaluation of all of the conclusions noted above, and after considering all factors it believed relevant, the Board, including the Independent Trustees, concluded that the advisory and sub-advisory fee arrangements are fair and reasonable in light of all of the surrounding circumstances and that the fund's Advisory Contracts should be renewed through May 31, 2025.
1.967985.110
XS1-ANN-0924
Fidelity® OTC K6 Portfolio
Annual Report
July 31, 2024
Contents
To view a fund's proxy voting guidelines and proxy voting record for the 12-month period ended June 30, visit http://www.fidelity.com/proxyvotingresults or visit the Securities and Exchange Commission's (SEC) web site at http://www.sec.gov.
You may also call 1-800-835-5092 to request a free copy of the proxy voting guidelines.
Standard & Poor's, S&P and S&P 500 are registered service marks of The McGraw-Hill Companies, Inc. and have been licensed for use by Fidelity Distributors Corporation.
Other third-party marks appearing herein are the property of their respective owners.
All other marks appearing herein are registered or unregistered trademarks or service marks of FMR LLC or an affiliated company. © 2024 FMR LLC. All rights reserved.
This report and the financial statements contained herein are submitted for the general information of the shareholders of the Fund. This report is not authorized for distribution to prospective investors in the Fund unless preceded or accompanied by an effective prospectus.
A fund files its complete schedule of portfolio holdings with the SEC for the first and third quarters of each fiscal year on Form N-PORT. Forms N-PORT are available on the SEC's web site at http://www.sec.gov. A fund's Forms N-PORT may be reviewed and copied at the SEC's Public Reference Room in Washington, DC. Information regarding the operation of the SEC's Public Reference Room may be obtained by calling 1-800-SEC-0330.
For a complete list of a fund's portfolio holdings, view the most recent holdings listing, semiannual report, or annual report on Fidelity's web site at http://www.fidelity.com, http://www.institutional.fidelity.com, or http://www.401k.com, as applicable.
NOT FDIC INSURED •MAY LOSE VALUE •NO BANK GUARANTEE
Neither the Fund nor Fidelity Distributors Corporation is a bank.
Item 7: Financial Statements and Financial Highlights for Open-End Management Investment Companies (Annual Report)
Fidelity® OTC K6 Portfolio
Schedule of Investments July 31, 2024
Showing Percentage of Net Assets
| Common Stocks - 94.6% |
| | | Shares | Value ($) |
| COMMUNICATION SERVICES - 19.0% | | | |
| Diversified Telecommunication Services - 0.0% | | | |
| Starry Group Holdings, Inc. Class A (a)(b) | | 1,498 | 0 |
| Entertainment - 2.5% | | | |
| Electronic Arts, Inc. | | 176 | 26,565 |
| NetEase, Inc. ADR | | 1,159 | 106,755 |
| Netflix, Inc. (a) | | 95,316 | 59,891,809 |
| Take-Two Interactive Software, Inc. (a) | | 1,611 | 242,504 |
| The Walt Disney Co. | | 34,700 | 3,251,043 |
| | | | 63,518,676 |
| Interactive Media & Services - 14.9% | | | |
| Alphabet, Inc.: | | | |
| Class A | | 961,395 | 164,917,698 |
| Class C | | 438,258 | 75,884,373 |
| Epic Games, Inc. (a)(b)(c) | | 5,200 | 3,120,000 |
| Meta Platforms, Inc. Class A | | 257,114 | 122,085,441 |
| Reddit, Inc.: | | | |
| Class A (d) | | 51,000 | 3,103,350 |
| Class B | | 111,612 | 6,791,590 |
| Vimeo, Inc. (a) | | 24,964 | 100,355 |
| Yandex NV Series A (a)(b)(d) | | 200,900 | 1,213,436 |
| | | | 377,216,243 |
| Media - 1.0% | | | |
| Charter Communications, Inc. Class A (a) | | 25,931 | 9,846,519 |
| Comcast Corp. Class A | | 359,572 | 14,839,536 |
| | | | 24,686,055 |
| Wireless Telecommunication Services - 0.6% | | | |
| T-Mobile U.S., Inc. | | 85,200 | 15,530,256 |
TOTAL COMMUNICATION SERVICES | | | 480,951,230 |
| CONSUMER DISCRETIONARY - 12.4% | | | |
| Automobiles - 0.1% | | | |
| Rivian Automotive, Inc. (a) | | 1,247 | 20,463 |
| Tesla, Inc. (a) | | 7,667 | 1,779,281 |
| | | | 1,799,744 |
| Broadline Retail - 8.9% | | | |
| Alibaba Group Holding Ltd. sponsored ADR | | 522 | 41,160 |
| Amazon.com, Inc. (a) | | 1,161,359 | 217,150,906 |
| ContextLogic, Inc. (a) | | 565 | 3,051 |
| Etsy, Inc. (a) | | 11,427 | 744,355 |
| Global-e Online Ltd. (a)(d) | | 20,061 | 688,494 |
| JD.com, Inc. Class A | | 739 | 9,744 |
| MercadoLibre, Inc. (a) | | 4,600 | 7,676,940 |
| | | | 226,314,650 |
| Hotels, Restaurants & Leisure - 1.6% | | | |
| Airbnb, Inc. Class A (a) | | 1,530 | 213,527 |
| Chipotle Mexican Grill, Inc. (a) | | 99,500 | 5,404,840 |
| Churchill Downs, Inc. | | 27,316 | 3,921,485 |
| Domino's Pizza, Inc. | | 40,221 | 17,242,743 |
| Hilton Worldwide Holdings, Inc. | | 7,600 | 1,631,492 |
| Marriott International, Inc. Class A | | 4,294 | 976,026 |
| Starbucks Corp. | | 124,983 | 9,742,425 |
| Wynn Resorts Ltd. | | 12,478 | 1,033,428 |
| | | | 40,165,966 |
| Specialty Retail - 0.9% | | | |
| Lowe's Companies, Inc. | | 72,459 | 17,789,409 |
| Ross Stores, Inc. | | 38,672 | 5,538,991 |
| thredUP, Inc. (a) | | 7,523 | 15,798 |
| | | | 23,344,198 |
| Textiles, Apparel & Luxury Goods - 0.9% | | | |
| Figs, Inc. Class A (a)(d) | | 3,944 | 25,636 |
| Kontoor Brands, Inc. | | 476 | 33,391 |
| lululemon athletica, Inc. (a) | | 47,996 | 12,414,645 |
| LVMH Moet Hennessy Louis Vuitton SE | | 13,322 | 9,396,838 |
| | | | 21,870,510 |
TOTAL CONSUMER DISCRETIONARY | | | 313,495,068 |
| CONSUMER STAPLES - 3.4% | | | |
| Beverages - 2.5% | | | |
| Diageo PLC | | 189,220 | 5,887,577 |
| Keurig Dr. Pepper, Inc. | | 987,157 | 33,839,742 |
| Monster Beverage Corp. (a) | | 455,922 | 23,457,187 |
| | | | 63,184,506 |
| Consumer Staples Distribution & Retail - 0.4% | | | |
| Costco Wholesale Corp. | | 8,692 | 7,144,824 |
| Dollar Tree, Inc. (a) | | 26,467 | 2,761,567 |
| | | | 9,906,391 |
| Food Products - 0.4% | | | |
| Mondelez International, Inc. | | 150,764 | 10,304,719 |
| Personal Care Products - 0.1% | | | |
| Estee Lauder Companies, Inc. Class A | | 19,500 | 1,942,395 |
| The Honest Co., Inc. (a) | | 1,176 | 4,386 |
| | | | 1,946,781 |
TOTAL CONSUMER STAPLES | | | 85,342,397 |
| ENERGY - 1.8% | | | |
| Energy Equipment & Services - 0.1% | | | |
| TGS ASA ADR | | 255,936 | 3,082,109 |
| Oil, Gas & Consumable Fuels - 1.7% | | | |
| Cenovus Energy, Inc. (Canada) | | 12,509 | 252,055 |
| Diamondback Energy, Inc. | | 4,854 | 982,013 |
| EOG Resources, Inc. | | 1,000 | 126,800 |
| Exxon Mobil Corp. | | 345,000 | 40,913,550 |
| Reliance Industries Ltd. GDR (e) | | 14,624 | 1,054,390 |
| | | | 43,328,808 |
TOTAL ENERGY | | | 46,410,917 |
| FINANCIALS - 2.5% | | | |
| Banks - 0.1% | | | |
| Huntington Bancshares, Inc. | | 184,422 | 2,757,109 |
| Wintrust Financial Corp. | | 3,087 | 334,013 |
| | | | 3,091,122 |
| Capital Markets - 0.9% | | | |
| Coinbase Global, Inc. (a) | | 90,300 | 20,259,708 |
| Moody's Corp. | | 5,500 | 2,510,640 |
| S&P Global, Inc. | | 149 | 72,225 |
| | | | 22,842,573 |
| Financial Services - 1.5% | | | |
| Circle Internet Financial Ltd.: | | | |
| Class E (b) | | 108,317 | 3,143,359 |
| Class F (b) | | 33,481 | 971,619 |
| Jio Financial Services Ltd. | | 155,400 | 609,701 |
| MasterCard, Inc. Class A | | 65,753 | 30,490,324 |
| PayPal Holdings, Inc. (a) | | 18,083 | 1,189,500 |
| | | | 36,404,503 |
TOTAL FINANCIALS | | | 62,338,198 |
| HEALTH CARE - 8.2% | | | |
| Biotechnology - 3.9% | | | |
| Alnylam Pharmaceuticals, Inc. (a) | | 177,698 | 42,196,167 |
| Argenx SE ADR (a) | | 13,200 | 6,809,484 |
| Ascendis Pharma A/S sponsored ADR (a) | | 22,142 | 2,955,957 |
| GenSight Biologics SA (a)(d) | | 16,039 | 5,798 |
| Grail, Inc. (d) | | 527 | 8,105 |
| Ionis Pharmaceuticals, Inc. (a) | | 2,430 | 120,188 |
| Legend Biotech Corp. ADR (a) | | 9,600 | 541,344 |
| Regeneron Pharmaceuticals, Inc. (a) | | 41,821 | 45,132,805 |
| Trevena, Inc. (a) | | 1,349 | 295 |
| | | | 97,770,143 |
| Health Care Equipment & Supplies - 2.7% | | | |
| Boston Scientific Corp. (a) | | 221,200 | 16,342,256 |
| DexCom, Inc. (a) | | 53,079 | 3,599,818 |
| Inspire Medical Systems, Inc. (a) | | 83,000 | 11,707,150 |
| Insulet Corp. (a) | | 132,273 | 25,707,258 |
| Intuitive Surgical, Inc. (a) | | 13,900 | 6,180,079 |
| Neuronetics, Inc. (a) | | 2,922 | 5,464 |
| Outset Medical, Inc. (a) | | 3,171 | 11,257 |
| Pulmonx Corp. (a) | | 2,888 | 19,956 |
| TransMedics Group, Inc. (a) | | 38,700 | 5,505,462 |
| | | | 69,078,700 |
| Health Care Technology - 0.0% | | | |
| Certara, Inc. (a) | | 21,121 | 329,699 |
| Life Sciences Tools & Services - 1.1% | | | |
| 10X Genomics, Inc. (a) | | 53,091 | 1,097,391 |
| Bruker Corp. | | 188,308 | 12,900,981 |
| Danaher Corp. | | 44,500 | 12,330,060 |
| Illumina, Inc. (a) | | 3,166 | 388,152 |
| Seer, Inc. (a) | | 38,113 | 75,464 |
| Thermo Fisher Scientific, Inc. | | 2,300 | 1,410,682 |
| | | | 28,202,730 |
| Pharmaceuticals - 0.5% | | | |
| AstraZeneca PLC sponsored ADR | | 146,532 | 11,598,008 |
| Elanco Animal Health, Inc. (a) | | 6,694 | 87,290 |
| TherapeuticsMD, Inc. (a)(d) | | 519 | 903 |
| | | | 11,686,201 |
TOTAL HEALTH CARE | | | 207,067,473 |
| INDUSTRIALS - 1.0% | | | |
| Commercial Services & Supplies - 0.0% | | | |
| Veralto Corp. | | 1,333 | 142,044 |
| Construction & Engineering - 0.4% | | | |
| Bowman Consulting Group Ltd. (a) | | 8,395 | 299,869 |
| Comfort Systems U.S.A., Inc. | | 8,200 | 2,725,844 |
| Sterling Construction Co., Inc. (a) | | 68,068 | 7,920,392 |
| | | | 10,946,105 |
| Electrical Equipment - 0.2% | | | |
| Eaton Corp. PLC | | 17,200 | 5,242,388 |
| Vertiv Holdings Co. | | 4,898 | 385,473 |
| | | | 5,627,861 |
| Ground Transportation - 0.1% | | | |
| CSX Corp. | | 25,387 | 891,084 |
| Passenger Airlines - 0.0% | | | |
| Wheels Up Experience, Inc. Class A (a)(d) | | 7,082 | 18,626 |
| Professional Services - 0.3% | | | |
| Verisk Analytics, Inc. | | 26,453 | 6,924,073 |
TOTAL INDUSTRIALS | | | 24,549,793 |
| INFORMATION TECHNOLOGY - 45.1% | | | |
| Communications Equipment - 1.0% | | | |
| Cisco Systems, Inc. | | 518,200 | 25,106,790 |
| IT Services - 1.0% | | | |
| Gartner, Inc. (a) | | 31,523 | 15,799,012 |
| MongoDB, Inc. Class A (a) | | 21,200 | 5,350,032 |
| Shopify, Inc. Class A (a) | | 38,800 | 2,374,560 |
| Twilio, Inc. Class A (a) | | 133 | 7,864 |
| X Holdings Corp. Class A (a)(b)(c) | | 57,830 | 1,615,770 |
| | | | 25,147,238 |
| Semiconductors & Semiconductor Equipment - 15.7% | | | |
| Advanced Micro Devices, Inc. (a) | | 4,845 | 700,006 |
| Analog Devices, Inc. | | 25,475 | 5,894,406 |
| Applied Materials, Inc. | | 39,323 | 8,344,341 |
| ASML Holding NV (depository receipt) | | 19,496 | 18,261,903 |
| Astera Labs, Inc. | | 4,300 | 188,512 |
| BE Semiconductor Industries NV | | 85,300 | 10,999,443 |
| Broadcom, Inc. | | 155,100 | 24,921,468 |
| Lam Research Corp. | | 15,731 | 14,492,026 |
| Marvell Technology, Inc. | | 854,319 | 57,222,287 |
| NVIDIA Corp. | | 1,711,330 | 200,259,837 |
| NXP Semiconductors NV | | 50,632 | 13,324,317 |
| Qualcomm, Inc. | | 6,100 | 1,103,795 |
| Skyworks Solutions, Inc. | | 8,215 | 933,388 |
| Taiwan Semiconductor Manufacturing Co. Ltd. sponsored ADR | | 242,051 | 40,132,056 |
| | | | 396,777,785 |
| Software - 13.3% | | | |
| Adobe, Inc. (a) | | 38,700 | 21,348,855 |
| Autodesk, Inc. (a) | | 14,686 | 3,635,079 |
| Cadence Design Systems, Inc. (a) | | 95,410 | 25,537,441 |
| Dropbox, Inc. Class A (a) | | 8,630 | 206,430 |
| Dynatrace, Inc. (a) | | 3,034 | 133,253 |
| Figma, Inc. (b)(c) | | 19,200 | 445,248 |
| Five9, Inc. (a) | | 38,900 | 1,732,995 |
| HubSpot, Inc. (a) | | 10,000 | 4,970,300 |
| Intuit, Inc. | | 23,615 | 15,287,170 |
| Microsoft Corp. | | 614,386 | 257,028,383 |
| Roper Technologies, Inc. | | 8,700 | 4,739,325 |
| Salesforce, Inc. | | 645 | 166,926 |
| Stripe, Inc. Class B (a)(b)(c) | | 7,800 | 214,578 |
| Synopsys, Inc. (a) | | 1,562 | 872,096 |
| | | | 336,318,079 |
| Technology Hardware, Storage & Peripherals - 14.1% | | | |
| Apple, Inc. | | 1,510,100 | 335,363,007 |
| Samsung Electronics Co. Ltd. | | 334,000 | 20,457,588 |
| Western Digital Corp. (a) | | 22,977 | 1,540,608 |
| | | | 357,361,203 |
TOTAL INFORMATION TECHNOLOGY | | | 1,140,711,095 |
| MATERIALS - 0.2% | | | |
| Chemicals - 0.2% | | | |
| Linde PLC | | 9,300 | 4,217,550 |
| REAL ESTATE - 0.2% | | | |
| Equity Real Estate Investment Trusts (REITs) - 0.2% | | | |
| Equinix, Inc. | | 8,383 | 6,624,582 |
| UTILITIES - 0.8% | | | |
| Electric Utilities - 0.2% | | | |
| Constellation Energy Corp. | | 29,100 | 5,523,180 |
| Independent Power and Renewable Electricity Producers - 0.6% | | | |
| Vistra Corp. | | 187,700 | 14,869,594 |
TOTAL UTILITIES | | | 20,392,774 |
| TOTAL COMMON STOCKS (Cost $1,463,563,216) | | | 2,392,101,077 |
| | | | |
| Convertible Preferred Stocks - 0.2% |
| | | Shares | Value ($) |
| COMMUNICATION SERVICES - 0.1% | | | |
| Interactive Media & Services - 0.1% | | | |
| ByteDance Ltd. Series E1 (a)(b)(c) | | 6,135 | 1,409,946 |
| CONSUMER DISCRETIONARY - 0.1% | | | |
| Automobiles - 0.1% | | | |
| Waymo LLC: | | | |
| Series A2 (a)(b)(c) | | 2,467 | 152,929 |
| Series B2 (a)(b)(c) | | 15,200 | 979,032 |
| | | | 1,131,961 |
| Hotels, Restaurants & Leisure - 0.0% | | | |
| Discord, Inc. Series I (a)(b)(c) | | 300 | 79,623 |
TOTAL CONSUMER DISCRETIONARY | | | 1,211,584 |
| FINANCIALS - 0.0% | | | |
| Financial Services - 0.0% | | | |
| Tenstorrent Holdings, Inc. Series C1 (b)(c) | | 6,595 | 489,811 |
| INFORMATION TECHNOLOGY - 0.0% | | | |
| Software - 0.0% | | | |
| Stripe, Inc. Series H (a)(b)(c) | | 24,206 | 665,907 |
| TOTAL CONVERTIBLE PREFERRED STOCKS (Cost $3,806,844) | | | 3,777,248 |
| | | | |
| Convertible Bonds - 0.3% |
| | | Principal Amount (f) | Value ($) |
| FINANCIALS - 0.3% | | | |
| Capital Markets - 0.3% | | | |
Coinbase Global, Inc. 0.5% 6/1/26 (Cost $6,492,839) | | 7,653,938 | 7,872,075 |
| | | | |
| Money Market Funds - 5.9% |
| | | Shares | Value ($) |
| Fidelity Cash Central Fund 5.39% (g) | | 141,703,346 | 141,731,687 |
| Fidelity Securities Lending Cash Central Fund 5.39% (g)(h) | | 7,701,522 | 7,702,292 |
| TOTAL MONEY MARKET FUNDS (Cost $149,433,979) | | | 149,433,979 |
| | | | |
| TOTAL INVESTMENT IN SECURITIES - 101.0% (Cost $1,623,296,878) | 2,553,184,379 |
NET OTHER ASSETS (LIABILITIES) - (1.0)% | (24,783,751) |
| NET ASSETS - 100.0% | 2,528,400,628 |
| | |
Legend
| (c) | Restricted securities (including private placements) - Investment in securities not registered under the Securities Act of 1933 (excluding 144A issues). At the end of the period, the value of restricted securities (excluding 144A issues) amounted to $9,172,844 or 0.4% of net assets. |
| (d) | Security or a portion of the security is on loan at period end. |
| (e) | Security exempt from registration under Rule 144A of the Securities Act of 1933. These securities may be resold in transactions exempt from registration, normally to qualified institutional buyers. At the end of the period, the value of these securities amounted to $1,054,390 or 0.0% of net assets. |
| (f) | Amount is stated in United States dollars unless otherwise noted. |
| (g) | Affiliated fund that is generally available only to investment companies and other accounts managed by Fidelity Investments. The rate quoted is the annualized seven-day yield of the fund at period end. A complete unaudited listing of the fund's holdings as of its most recent quarter end is available upon request. In addition, each Fidelity Central Fund's financial statements, which are not covered by the Fund's Report of Independent Registered Public Accounting Firm, are available on the SEC's website or upon request. |
| (h) | Investment made with cash collateral received from securities on loan. |
| Additional information on each restricted holding is as follows: |
| Security | Acquisition Date | Acquisition Cost ($) |
| ByteDance Ltd. Series E1 | 11/18/20 | 672,238 |
| | | |
| Discord, Inc. Series I | 9/15/21 | 165,187 |
| | | |
| Epic Games, Inc. | 7/13/20 - 3/29/21 | 4,292,000 |
| | | |
| Figma, Inc. | 5/15/24 | 445,306 |
| | | |
| Stripe, Inc. Class B | 5/18/21 | 313,001 |
| | | |
| Stripe, Inc. Series H | 3/15/21 - 5/25/23 | 971,266 |
| | | |
| Tenstorrent Holdings, Inc. Series C1 | 4/23/21 | 392,145 |
| | | |
| Waymo LLC Series A2 | 5/08/20 | 211,834 |
| | | |
| Waymo LLC Series B2 | 6/11/21 | 1,394,174 |
| | | |
| X Holdings Corp. Class A | 10/27/21 | 5,743,370 |
| | | |
Affiliated Central Funds
Fiscal year to date information regarding the Fund's investments in Fidelity Central Funds, including the ownership percentage, is presented below.
| Affiliate | Value, beginning of period ($) | Purchases ($) | Sales Proceeds ($) | Dividend Income ($) | Realized Gain (loss) ($) | Change in Unrealized appreciation (depreciation) ($) | Value, end of period ($) | % ownership, end of period |
| Fidelity Cash Central Fund 5.39% | 13,190,730 | 482,939,674 | 354,398,636 | 397,681 | (81) | - | 141,731,687 | 0.3% |
| Fidelity Securities Lending Cash Central Fund 5.39% | 6,208,769 | 63,438,524 | 61,945,001 | 262,525 | - | - | 7,702,292 | 0.0% |
| Total | 19,399,499 | 546,378,198 | 416,343,637 | 660,206 | (81) | - | 149,433,979 | |
| | | | | | | | | |
Amounts in the dividend income column in the above table include any capital gain distributions from underlying funds, which are presented in the corresponding line item in the Statement of Operations, if applicable.
Amounts in the dividend income column for Fidelity Securities Lending Cash Central Fund represents the income earned on investing cash collateral, less rebates paid to borrowers and any lending agent fees associated with the loan, plus any premium payments received for lending certain types of securities.
Amounts included in the purchases and sales proceeds columns may include in-kind transactions, if applicable.
Investment Valuation
The following is a summary of the inputs used, as of July 31, 2024, involving the Fund's assets and liabilities carried at fair value. The inputs or methodology used for valuing securities may not be an indication of the risk associated with investing in those securities. For more information on valuation inputs, and their aggregation into the levels used below, please refer to the Investment Valuation section in the accompanying Notes to Financial Statements.
| Valuation Inputs at Reporting Date: |
| Description | Total ($) | Level 1 ($) | Level 2 ($) | Level 3 ($) |
Investments in Securities: | | | | |
|
| Equities: | | | | |
Communication Services | 482,361,176 | 476,617,794 | - | 5,743,382 |
Consumer Discretionary | 314,706,652 | 304,088,486 | 9,406,582 | 1,211,584 |
Consumer Staples | 85,342,397 | 79,454,820 | 5,887,577 | - |
Energy | 46,410,917 | 46,410,917 | - | - |
Financials | 62,828,009 | 58,223,220 | - | 4,604,789 |
Health Care | 207,067,473 | 207,067,473 | - | - |
Industrials | 24,549,793 | 24,549,793 | - | - |
Information Technology | 1,141,377,002 | 1,138,435,499 | - | 2,941,503 |
Materials | 4,217,550 | 4,217,550 | - | - |
Real Estate | 6,624,582 | 6,624,582 | - | - |
Utilities | 20,392,774 | 20,392,774 | - | - |
|
| Corporate Bonds | 7,872,075 | - | 7,872,075 | - |
|
| Money Market Funds | 149,433,979 | 149,433,979 | - | - |
| Total Investments in Securities: | 2,553,184,379 | 2,515,516,887 | 23,166,234 | 14,501,258 |
Financial Statements
| Statement of Assets and Liabilities |
As of July 31, 2024 |
| Assets | | | | |
| Investment in securities, at value (including securities loaned of $6,822,876) - See accompanying schedule: | | | | |
Unaffiliated issuers (cost $1,473,862,899) | $ | 2,403,750,400 | | |
Fidelity Central Funds (cost $149,433,979) | | 149,433,979 | | |
| | | | | |
| | | | | |
| Total Investment in Securities (cost $1,623,296,878) | | | $ | 2,553,184,379 |
| Receivable for investments sold | | | | 54,019,349 |
| Receivable for fund shares sold | | | | 1,584,890 |
| Dividends receivable | | | | 346,224 |
| Interest receivable | | | | 6,381 |
| Distributions receivable from Fidelity Central Funds | | | | 102,300 |
| Other receivables | | | | 131,174 |
Total assets | | | | 2,609,374,697 |
| Liabilities | | | | |
| Payable to custodian bank | $ | 3 | | |
| Payable for investments purchased | | 70,903,473 | | |
| Payable for fund shares redeemed | | 1,259,224 | | |
| Accrued management fee | | 1,099,761 | | |
| Other payables and accrued expenses | | 9,035 | | |
| Collateral on securities loaned | | 7,702,573 | | |
| Total liabilities | | | | 80,974,069 |
| Commitments and contingent liabilities (see Commitments note) | | | | |
| Net Assets | | | $ | 2,528,400,628 |
| Net Assets consist of: | | | | |
| Paid in capital | | | $ | 1,559,325,460 |
| Total accumulated earnings (loss) | | | | 969,075,168 |
| Net Assets | | | $ | 2,528,400,628 |
Net Asset Value, offering price and redemption price per share ($2,528,400,628 ÷ 104,590,963 shares) | | | $ | 24.17 |
| Statement of Operations |
| Year ended July 31, 2024 |
| Investment Income | | | | |
| Dividends | | | $ | 13,562,506 |
| Interest | | | | 614,722 |
| Income from Fidelity Central Funds (including $262,525 from security lending) | | | | 660,206 |
| Total income | | | | 14,837,434 |
| Expenses | | | | |
| Management fee | $ | 11,306,227 | | |
| Independent trustees' fees and expenses | | 10,577 | | |
| Interest | | 43,385 | | |
| Miscellaneous | | 9,035 | | |
| Total expenses before reductions | | 11,369,224 | | |
| Expense reductions | | (2,427) | | |
| Total expenses after reductions | | | | 11,366,797 |
| Net Investment income (loss) | | | | 3,470,637 |
| Realized and Unrealized Gain (Loss) | | | | |
| Net realized gain (loss) on: | | | | |
| Investment Securities: | | | | |
| Unaffiliated issuers (net of foreign taxes of $1,450,036) | | 200,439,818 | | |
| Fidelity Central Funds | | (81) | | |
| Foreign currency transactions | | (24,484) | | |
| Total net realized gain (loss) | | | | 200,415,253 |
| Change in net unrealized appreciation (depreciation) on: | | | | |
| Investment Securities: | | | | |
| Unaffiliated issuers (net of decrease in deferred foreign taxes of $806,834) | | 346,937,917 | | |
| Assets and liabilities in foreign currencies | | (2,454) | | |
| Total change in net unrealized appreciation (depreciation) | | | | 346,935,463 |
| Net gain (loss) | | | | 547,350,716 |
| Net increase (decrease) in net assets resulting from operations | | | $ | 550,821,353 |
| Statement of Changes in Net Assets |
| |
| | Year ended July 31, 2024 | | Year ended July 31, 2023 |
| Increase (Decrease) in Net Assets | | | | |
| Operations | | | | |
| Net investment income (loss) | $ | 3,470,637 | $ | 5,971,479 |
| Net realized gain (loss) | | 200,415,253 | | (1,451,997) |
| Change in net unrealized appreciation (depreciation) | | 346,935,463 | | 373,992,624 |
| Net increase (decrease) in net assets resulting from operations | | 550,821,353 | | 378,512,106 |
| Distributions to shareholders | | (5,362,699) | | (1,170,775) |
| | | | | |
| Share transactions | | | | |
| Proceeds from sales of shares | | 388,050,779 | | 352,174,249 |
| Reinvestment of distributions | | 5,362,699 | | 1,170,775 |
| Cost of shares redeemed | | (521,643,391) | | (543,863,297) |
| | | | | |
Net increase (decrease) in net assets resulting from share transactions | | (128,229,913) | | (190,518,273) |
| Total increase (decrease) in net assets | | 417,228,741 | | 186,823,058 |
| | | | | |
| Net Assets | | | | |
| Beginning of period | | 2,111,171,887 | | 1,924,348,829 |
| End of period | $ | 2,528,400,628 | $ | 2,111,171,887 |
| | | | | |
| Other Information | | | | |
| Shares | | | | |
| Sold | | 18,515,596 | | 22,429,283 |
| Issued in reinvestment of distributions | | 286,663 | | 76,322 |
| Redeemed | | (24,953,544) | | (34,918,758) |
| Net increase (decrease) | | (6,151,285) | | (12,413,153) |
| | | | | |
Financial Highlights
Fidelity® OTC K6 Portfolio |
| |
| Years ended July 31, | | 2024 | | 2023 | | 2022 | | 2021 | | 2020 |
Selected Per-Share Data | | | | | | | | | | |
| Net asset value, beginning of period | $ | 19.06 | $ | 15.63 | $ | 20.36 | $ | 14.29 | $ | 10.50 |
| Income from Investment Operations | | | | | | | | | | |
Net investment income (loss) A,B | | .03 | | .05 | | (.01) | | (.01) | | .02 |
| Net realized and unrealized gain (loss) | | 5.13 | | 3.39 | | (3.93) | | 6.15 | | 3.81 |
| Total from investment operations | | 5.16 | | 3.44 | | (3.94) | | 6.14 | | 3.83 |
| Distributions from net investment income | | (.05) | | (.01) | | - | | (.01) | | (.01) |
| Distributions from net realized gain | | - | | - | | (.79) | | (.06) | | (.02) |
| Total distributions | | (.05) | | (.01) | | (.79) | | (.07) | | (.04) C |
| Net asset value, end of period | $ | 24.17 | $ | 19.06 | $ | 15.63 | $ | 20.36 | $ | 14.29 |
Total Return D | | | | 22.03% | | (20.27)% | | 43.11% | | 36.54% |
Ratios to Average Net Assets B,E,F | | | | | | | | | | |
| Expenses before reductions | | .50% | | .50% | | .50% | | .50% | | .50% |
| Expenses net of fee waivers, if any | | | | .50% | | .50% | | .50% | | .50% |
| Expenses net of all reductions | | .50% | | .50% | | .50% | | .50% | | .49% |
| Net investment income (loss) | | .15% | | .34% | | (.05)% | | (.05)% | | .16% |
| Supplemental Data | | | | | | | | | | |
| Net assets, end of period (000 omitted) | $ | 2,528,401 | $ | 2,111,172 | $ | 1,924,349 | $ | 2,630,559 | $ | 1,026,111 |
Portfolio turnover rate G | | | | 20% H | | 39% H | | 36% H | | 102% H |
ACalculated based on average shares outstanding during the period.
BNet investment income (loss) is affected by the timing of the declaration of dividends by any underlying mutual funds or exchange-traded funds (ETFs). Net investment income (loss) of any mutual funds or ETFs is not included in the Fund's net investment income (loss) ratio.
CTotal distributions per share do not sum due to rounding.
DTotal returns would have been lower if certain expenses had not been reduced during the applicable periods shown.
EFees and expenses of any underlying mutual funds or exchange-traded funds (ETFs) are not included in the Fund's expense ratio. The Fund indirectly bears its proportionate share of these expenses. For additional expense information related to investments in Fidelity Central Funds, please refer to the "Investments in Fidelity Central Funds" note found in the Notes to Financial Statements section of the most recent Annual or Semi-Annual report.
FExpense ratios reflect operating expenses of the class. Expenses before reductions do not reflect amounts reimbursed, waived, or reduced through arrangements with the investment adviser, brokerage services, or other offset arrangements, if applicable, and do not represent the amount paid by the class during periods when reimbursements, waivers or reductions occur.
GAmount does not include the portfolio activity of any underlying mutual funds or exchange-traded funds (ETFs).
HPortfolio turnover rate excludes securities received or delivered in-kind.
Notes to Financial Statements
For the period ended July 31, 2024
1. Organization.
Fidelity OTC K6 Portfolio (the Fund) is a non-diversified fund of Fidelity Securities Fund (the Trust) and is authorized to issue an unlimited number of shares. Share transactions on the Statement of Changes in Net Assets may contain exchanges between affiliated funds. The Trust is registered under the Investment Company Act of 1940, as amended (the 1940 Act), as an open-end management investment company organized as a Massachusetts business trust. Shares generally are available only to employer-sponsored retirement plans that are recordkept by Fidelity, or to certain employer-sponsored retirement plans that are not recordkept by Fidelity.
2. Investments in Fidelity Central Funds.
Funds may invest in Fidelity Central Funds, which are open-end investment companies generally available only to other investment companies and accounts managed by the investment adviser and its affiliates. The Schedule of Investments lists any Fidelity Central Funds held as an investment as of period end, but does not include the underlying holdings of each Fidelity Central Fund. An investing fund indirectly bears its proportionate share of the expenses of the underlying Fidelity Central Funds.
Based on its investment objective, each Fidelity Central Fund may invest or participate in various investment vehicles or strategies that are similar to those of the investing fund. These strategies are consistent with the investment objectives of the investing fund and may involve certain economic risks which may cause a decline in value of each of the Fidelity Central Funds and thus a decline in the value of the investing fund.
| Fidelity Central Fund | Investment Manager | Investment Objective | Investment Practices | Expense RatioA |
| Fidelity Money Market Central Funds | Fidelity Management & Research Company LLC (FMR) | Each fund seeks to obtain a high level of current income consistent with the preservation of capital and liquidity. | Short-term Investments | Less than .005% |
A Expenses expressed as a percentage of average net assets and are as of each underlying Central Fund's most recent annual or semi-annual shareholder report.
A complete unaudited list of holdings for each Fidelity Central Fund is available upon request or at the Securities and Exchange Commission website at www.sec.gov. In addition, the financial statements of the Fidelity Central Funds which contain the significant accounting policies (including investment valuation policies) of those funds, and are not covered by the Report of Independent Registered Public Accounting Firm, are available on the Securities and Exchange Commission website or upon request.
3. Significant Accounting Policies.
The Fund is an investment company and applies the accounting and reporting guidance of the Financial Accounting Standards Board (FASB) Accounting Standards Codification Topic 946 Financial Services - Investment Companies. The financial statements have been prepared in conformity with accounting principles generally accepted in the United States of America (GAAP), which require management to make certain estimates and assumptions at the date of the financial statements. Actual results could differ from those estimates. Subsequent events, if any, through the date that the financial statements were issued have been evaluated in the preparation of the financial statements. The Fund's Schedule of Investments lists any underlying mutual funds or exchange-traded funds (ETFs) but does not include the underlying holdings of these funds. The following summarizes the significant accounting policies of the Fund:
Investment Valuation. Investments are valued as of 4:00 p.m. Eastern time on the last calendar day of the period. The Board of Trustees (the Board) has designated the Fund's investment adviser as the valuation designee responsible for the fair valuation function and performing fair value determinations as needed. The investment adviser has established a Fair Value Committee (the Committee) to carry out the day-to-day fair valuation responsibilities and has adopted policies and procedures to govern the fair valuation process and the activities of the Committee. In accordance with these fair valuation policies and procedures, which have been approved by the Board, the Fund attempts to obtain prices from one or more third party pricing services or brokers to value its investments. When current market prices, quotations or currency exchange rates are not readily available or reliable, investments will be fair valued in good faith by the Committee, in accordance with the policies and procedures. Factors used in determining fair value vary by investment type and may include market or investment specific events, transaction data, estimated cash flows, and market observations of comparable investments. The frequency that the fair valuation procedures are used cannot be predicted and they may be utilized to a significant extent. The Committee manages the Fund's fair valuation practices and maintains the fair valuation policies and procedures. The Fund's investment adviser reports to the Board information regarding the fair valuation process and related material matters.
The Fund categorizes the inputs to valuation techniques used to value its investments into a disclosure hierarchy consisting of three levels as shown below:
Level 1 - unadjusted quoted prices in active markets for identical investments
Level 2 - other significant observable inputs (including quoted prices for similar investments, interest rates, prepayment speeds, etc.)
Level 3 - unobservable inputs (including the Fund's own assumptions based on the best information available)
Valuation techniques used to value the Fund's investments by major category are as follows:
Equity securities, including restricted securities, for which market quotations are readily available, are valued at the last reported sale price or official closing price as reported by a third party pricing service on the primary market or exchange on which they are traded and are categorized as Level 1 in the hierarchy. In the event there were no sales during the day or closing prices are not available, securities are valued at the last quoted bid price or may be valued using the last available price and are generally categorized as Level 2 in the hierarchy. For foreign equity securities, when market or security specific events arise, comparisons to the valuation of American Depositary Receipts (ADRs), futures contracts, Exchange-Traded Funds (ETFs) and certain indexes as well as quoted prices for similar securities may be used and would be categorized as Level 2 in the hierarchy. For equity securities, including restricted securities, where observable inputs are limited, assumptions about market activity and risk are used and these securities may be categorized as Level 3 in the hierarchy.
Debt securities, including restricted securities, are valued based on evaluated prices received from third party pricing services or from brokers who make markets in such securities. Corporate bonds are valued by pricing services who utilize matrix pricing which considers yield or price of bonds of comparable quality, coupon, maturity and type or by broker-supplied prices. When independent prices are unavailable or unreliable, debt securities may be valued utilizing pricing methodologies which consider similar factors that would be used by third party pricing services. Debt securities are generally categorized as Level 2 in the hierarchy but may be Level 3 depending on the circumstances.
Investments in open-end mutual funds, including the Fidelity Central Funds, are valued at their closing net asset value (NAV) each business day and are categorized as Level 1 in the hierarchy.
Changes in valuation techniques may result in transfers in or out of an assigned level within the disclosure hierarchy. The aggregate value of investments by input level as of July 31, 2024 is included at the end of the Fund's Schedule of Investments.
Foreign Currency. Certain Funds may use foreign currency contracts to facilitate transactions in foreign-denominated securities. Gains and losses from these transactions may arise from changes in the value of the foreign currency or if the counterparties do not perform under the contracts' terms.
Foreign-denominated assets, including investment securities, and liabilities are translated into U.S. dollars at the exchange rates at period end. Purchases and sales of investment securities, income and dividends received, and expenses denominated in foreign currencies are translated into U.S. dollars at the exchange rate in effect on the transaction date.
The effects of exchange rate fluctuations on investments are included with the net realized and unrealized gain (loss) on investment securities. Other foreign currency transactions resulting in realized and unrealized gain (loss) are disclosed separately.
Investment Transactions and Income. For financial reporting purposes, the Fund's investment holdings and NAV include trades executed through the end of the last business day of the period. The NAV per share for processing shareholder transactions is calculated as of the close of business of the New York Stock Exchange (NYSE), normally 4:00 p.m. Eastern time and includes trades executed through the end of the prior business day. Gains and losses on securities sold are determined on the basis of identified cost and include proceeds received from litigation. Commissions paid to certain brokers with whom the investment adviser, or its affiliates, places trades on behalf of a fund include an amount in addition to trade execution, which may be rebated back to a fund. Any such rebates are included in net realized gain (loss) on investments in the Statement of Operations. Dividend income is recorded on the ex-dividend date, except for certain dividends from foreign securities where the ex-dividend date may have passed, which are recorded as soon as the Fund is informed of the ex-dividend date. Non-cash dividends included in dividend income, if any, are recorded at the fair market value of the securities received. Income and capital gain distributions from Fidelity Central Funds, if any, are recorded on the ex-dividend date. Interest income is accrued as earned and includes coupon interest and amortization of premium and accretion of discount on debt securities as applicable. Investment income is recorded net of foreign taxes withheld where recovery of such taxes is uncertain. Funds may file withholding tax reclaims in certain jurisdictions to recover a portion of amounts previously withheld. Any withholding tax reclaims income is included in the Statement of Operations in dividends. Any receivables for withholding tax reclaims are included in the Statement of Assets and Liabilities in dividends receivable.
Expenses. Expenses directly attributable to a fund are charged to that fund. Expenses attributable to more than one fund are allocated among the respective funds on the basis of relative net assets or other appropriate methods. Expenses included in the accompanying financial statements reflect the expenses of that fund and do not include any expenses associated with any underlying mutual funds or exchange-traded funds. Although not included in a fund's expenses, a fund indirectly bears its proportionate share of these expenses through the net asset value of each underlying mutual fund or exchange-traded fund. Expense estimates are accrued in the period to which they relate and adjustments are made when actual amounts are known.
Income Tax Information and Distributions to Shareholders. Each year, the Fund intends to qualify as a regulated investment company under Subchapter M of the Internal Revenue Code, including distributing substantially all of its taxable income and realized gains. As a result, no provision for U.S. Federal income taxes is required. As of July 31, 2024, the Fund did not have any unrecognized tax benefits in the financial statements; nor is the Fund aware of any tax positions for which it is reasonably possible that the total amounts of unrecognized tax benefits will significantly change in the next twelve months. The Fund files a U.S. federal tax return, in addition to state and local tax returns as required. The Fund's federal income tax returns are subject to examination by the Internal Revenue Service (IRS) for a period of three fiscal years after they are filed. State and local tax returns may be subject to examination for an additional fiscal year depending on the jurisdiction. Foreign taxes are provided for based on the Fund's understanding of the tax rules and rates that exist in the foreign markets in which it invests. The Fund is subject to a tax imposed on capital gains by certain countries in which it invests.
Distributions are declared and recorded on the ex-dividend date. Income and capital gain distributions are determined in accordance with income tax regulations, which may differ from GAAP.
Capital accounts within the financial statements are adjusted for permanent book-tax differences. These adjustments have no impact on net assets or the results of operations. Capital accounts are not adjusted for temporary book-tax differences which will reverse in a subsequent period.
Book-tax differences are primarily due to foreign currency transactions, certain foreign taxes, passive foreign investment companies (PFIC), capital loss carryforwards and losses deferred due to wash sales.
As of period end, the cost and unrealized appreciation (depreciation) in securities, and derivatives if applicable, for federal income tax purposes were as follows:
| Gross unrealized appreciation | $965,644,107 |
| Gross unrealized depreciation | (46,120,557) |
| Net unrealized appreciation (depreciation) | $919,523,550 |
| Tax Cost | $1,633,660,829 |
The tax-based components of distributable earnings as of period end were as follows:
| Undistributed ordinary income | $4,134,928 |
| Undistributed long-term capital gain | $45,416,309 |
| Net unrealized appreciation (depreciation) on securities and other investments | $919,523,931 |
The tax character of distributions paid was as follows:
| | July 31, 2024 | July 31, 2023 |
| Ordinary Income | $5,362,699 | $ 1,170,775 |
Restricted Securities (including Private Placements). Funds may invest in securities that are subject to legal or contractual restrictions on resale. These securities generally may be resold in transactions exempt from registration or to the public if the securities are registered. Disposal of these securities may involve time-consuming negotiations and expense, and prompt sale at an acceptable price may be difficult. Information regarding restricted securities held at period end is included at the end of the Schedule of Investments, if applicable.
Commitments. A commitment is an agreement to acquire an investment at a future date (subject to conditions) in connection with a potential public or non-public offering. Commitments outstanding at period end are presented in the table below. Unrealized appreciation (depreciation) on any commitments outstanding at period end is separately presented in the Statement of Assets and Liabilities as Unrealized appreciation (depreciation) on unfunded commitments, and any change in unrealized appreciation (depreciation) on unfunded commitments during the period is separately presented in the Statement of Operations, as applicable based on contractual conditions of each commitment.
| | Investment to be Acquired | Commitment Amount ($) | Unrealized Appreciation (Depreciation)($) |
| Fidelity OTC K6 Portfolio | Space Exploration Technologies Corp. Class A | 24,640 | - |
| Fidelity OTC K6 Portfolio | Space Exploration Technologies Corp. Class C | 199,360 | - |
4. Purchases and Sales of Investments.
Purchases and sales of securities, other than short-term securities and in-kind transactions, as applicable, are noted in the table below.
| | Purchases ($) | Sales ($) |
| Fidelity OTC K6 Portfolio | 915,698,340 | 1,153,944,850 |
Prior Fiscal Year Unaffiliated Redemptions In-Kind. Shares that were redeemed in-kind for investments, including accrued interest and cash, if any, are shown in the table below; along with realized gain or loss on investments delivered through in-kind redemptions. The amount of the in-kind redemptions is included in share transactions in the accompanying Statement of Changes in Net Assets. There was no gain or loss for federal income tax purposes.
| | Shares | Total net realized gain or loss ($) | Total Proceeds ($) |
| Fidelity OTC K6 Portfolio | 13,676,855 | 71,430,269 | 211,033,879 |
Prior Year Unaffiliated Exchanges In-Kind. Shares that were exchanged for investments, including accrued interest and cash, if any, are shown in the table below. The amount of in-kind exchanges is included in share transactions in the accompanying Statement of Changes in Net Assets.
| | Shares | Total Proceeds ($) |
| Fidelity OTC K6 Portfolio | 5,832,617 | 89,538,335 |
5. Fees and Other Transactions with Affiliates.
Management Fee. Fidelity Management & Research Company LLC (the investment adviser) and its affiliates provide the Fund with investment management related services for which the Fund pays a monthly management fee that is based on an annual rate of .50% of average net assets. Under the management contract, the investment adviser or an affiliate pays all other expenses of the Fund, excluding fees and expenses of the independent Trustees, and certain miscellaneous expenses such as proxy and shareholder meeting expenses.
Brokerage Commissions. A portion of portfolio transactions were placed with brokerage firms which are affiliates of the investment adviser. Brokerage commissions are included in net realized gain (loss) and change in net unrealized appreciation (depreciation) in the Statement of Operations. The commissions paid to these affiliated firms were as follows:
| | Amount ($) |
| Fidelity OTC K6 Portfolio | 9,938 |
Interfund Lending Program. Pursuant to an Exemptive Order issued by the Securities and Exchange Commission (the SEC), the Fund, along with other registered investment companies having management contracts with Fidelity Management & Research Company LLC (FMR), or other affiliated entities of FMR, may participate in an interfund lending program. This program provides an alternative credit facility allowing the Fund to borrow from, or lend money to, other participating affiliated funds. At period end, there were no interfund loans outstanding. Activity in this program during the period for which loans were outstanding was as follows:
| | Borrower or Lender | Average Loan Balance ($) | Weighted Average Interest Rate | Interest Expense ($) |
| Fidelity OTC K6 Portfolio | Borrower | 6,208,474 | 5.57% | 36,503 |
Interfund Trades. Funds may purchase from or sell securities to other Fidelity Funds under procedures adopted by the Board. The procedures have been designed to ensure these interfund trades are executed in accordance with Rule 17a-7 of the 1940 Act. Any interfund trades are included within the respective purchases and sales amounts shown in the Purchases and Sales of Investments note. Interfund trades during the period are noted in the table below.
| | Purchases ($) | Sales ($) | Realized Gain (Loss)($) |
| Fidelity OTC K6 Portfolio | 67,473,300 | 64,263,551 | 10,209,355 |
Sub-Advisory Arrangements. Effective March 1, 2024, the Fund's sub-advisory agreements with FMR Investment Management (UK) Limited, Fidelity Management & Research (Hong Kong) Limited, and Fidelity Management & Research (Japan) Limited were amended to provide that the investment adviser pays each sub-adviser monthly fees equal to 110% of the sub-adviser's costs for providing sub-advisory services.
6. Committed Line of Credit.
Certain Funds participate with other funds managed by the investment adviser or an affiliate in a $4.25 billion credit facility (the "line of credit") to be utilized for temporary or emergency purposes to fund shareholder redemptions or for other short-term liquidity purposes. The commitment fees on the pro-rata portion of the line of credit are borne by the investment adviser. During the period, there were no borrowings on this line of credit.
7. Security Lending.
Funds lend portfolio securities from time to time in order to earn additional income. Lending agents are used, including National Financial Services (NFS), an affiliate of the investment adviser. Pursuant to a securities lending agreement, NFS will receive a fee, which is capped at 9.9% of a fund's daily lending revenue, for its services as lending agent. A fund may lend securities to certain qualified borrowers, including NFS. On the settlement date of the loan, a fund receives collateral (in the form of U.S. Treasury obligations, letters of credit and/or cash) against the loaned securities and maintains collateral in an amount not less than 100% of the market value of the loaned securities during the period of the loan. The market value of the loaned securities is determined at the close of business of a fund and any additional required collateral is delivered to a fund on the next business day. A fund or borrower may terminate the loan at any time, and if the borrower defaults on its obligation to return the securities loaned because of insolvency or other reasons, a fund may apply collateral received from the borrower against the obligation. A fund may experience delays and costs in recovering the securities loaned. Any cash collateral received is invested in the Fidelity Securities Lending Cash Central Fund. Any loaned securities are identified as such in the Schedule of Investments, and the value of loaned securities and cash collateral at period end, as applicable, are presented in the Statement of Assets and Liabilities. Security lending income represents the income earned on investing cash collateral, less rebates paid to borrowers and any lending agent fees associated with the loan, plus any premium payments received for lending certain types of securities. Security lending income is presented in the Statement of Operations as a component of income from Fidelity Central Funds. Affiliated security lending activity, if any, was as follows:
| | Total Security Lending Fees Paid to NFS ($) | Security Lending Income From Securities Loaned to NFS ($) | Value of Securities Loaned to NFS at Period End ($) |
| Fidelity OTC K6 Portfolio | 28,153 | 3 | - |
8. Bank Borrowings.
The Fund is permitted to have bank borrowings for temporary or emergency purposes to fund shareholder redemptions or for other short-term liquidity requirements. The Fund has established borrowing arrangements with certain banks. The interest rate on the borrowings is the bank's base rate, as revised from time to time. Any open loans, including accrued interest, at period end are presented under the caption "Notes payable" in the Statement of Assets and Liabilities, if applicable. Activity in this program during the period for which loans were outstanding was as follows:
| | Average Loan Balance ($) | Weighted Average Interest Rate | Interest Expense ($) |
| Fidelity OTC K6 Portfolio | 3,863,455 | 5.83% | 6,882 |
9. Expense Reductions.
Through arrangements with the Fund's custodian, credits realized as a result of certain uninvested cash balances were used to reduce the Fund's expenses by $2,427.
10. Other.
A fund's organizational documents provide former and current trustees and officers with a limited indemnification against liabilities arising in connection with the performance of their duties to the fund. In the normal course of business, a fund may also enter into contracts that provide general indemnifications. A fund's maximum exposure under these arrangements is unknown as this would be dependent on future claims that may be made against a fund. The risk of material loss from such claims is considered remote.
11. Risk and Uncertainties.
Many factors affect a fund's performance. Developments that disrupt global economies and financial markets, such as pandemics, epidemics, outbreaks of infectious diseases, war, terrorism, and environmental disasters, may significantly affect a fund's investment performance. The effects of these developments to a fund will be impacted by the types of securities in which a fund invests, the financial condition, industry, economic sector, and geographic location of an issuer, and a fund's level of investment in the securities of that issuer. Significant concentrations in security types, issuers, industries, sectors, and geographic locations may magnify the factors that affect a fund's performance.
Report of Independent Registered Public Accounting Firm
To the Board of Trustees of Fidelity Securities Fund and the Shareholders of Fidelity OTC K6 Portfolio:
Opinion on the Financial Statements and Financial Highlights
We have audited the accompanying statement of assets and liabilities of Fidelity OTC K6 Portfolio (the "Fund"), a fund of Fidelity Securities Fund, including the schedule of investments, as of July 31, 2024, the related statement of operations for the year then ended, the statement of changes in net assets for each of the two years in the period then ended, the financial highlights for each of the five years in the period then ended, and the related notes. In our opinion, the financial statements and financial highlights present fairly, in all material respects, the financial position of the Fund as of July 31, 2024, and the results of its operations for the year then ended, the changes in its net assets for each of the two years in the period then ended, and the financial highlights for each of the five years in the period then ended in conformity with accounting principles generally accepted in the United States of America.
Basis for Opinion
These financial statements and financial highlights are the responsibility of the Fund's management. Our responsibility is to express an opinion on the Fund's financial statements and financial highlights based on our audits. We are a public accounting firm registered with the Public Company Accounting Oversight Board (United States) (PCAOB) and are required to be independent with respect to the Fund in accordance with the U.S. federal securities laws and the applicable rules and regulations of the Securities and Exchange Commission and the PCAOB.
We conducted our audits in accordance with the standards of the PCAOB. Those standards require that we plan and perform the audit to obtain reasonable assurance about whether the financial statements and financial highlights are free of material misstatement, whether due to error or fraud. The Fund is not required to have, nor were we engaged to perform, an audit of its internal control over financial reporting. As part of our audits, we are required to obtain an understanding of internal control over financial reporting but not for the purpose of expressing an opinion on the effectiveness of the Fund's internal control over financial reporting. Accordingly, we express no such opinion.
Our audits included performing procedures to assess the risks of material misstatement of the financial statements and financial highlights, whether due to error or fraud, and performing procedures that respond to those risks. Such procedures included examining, on a test basis, evidence regarding the amounts and disclosures in the financial statements and financial highlights. Our audits also included evaluating the accounting principles used and significant estimates made by management, as well as evaluating the overall presentation of the financial statements and financial highlights. Our procedures included confirmation of securities owned as of July 31, 2024, by correspondence with the custodian and brokers; when replies were not received from brokers, we performed other auditing procedures. We believe that our audits provide a reasonable basis for our opinion.
/s/ Deloitte & Touche LLP
Boston, Massachusetts
September 16, 2024
We have served as the auditor of one or more of the Fidelity investment companies since 1999.
Distributions
(Unaudited)
The dividend and capital gains distributions for the fund(s) are available on Fidelity.com or Institutional.Fidelity.com.
The fund hereby designates as a capital gain dividend with respect to the taxable year ended July 31, 2024, $45,416,308, or, if subsequently determined to be different, the net capital gain of such year.
The fund designates 100% of the dividends distributed during the fiscal year as qualifying for the dividends-received deduction for corporate shareholders.
The fund designates 100% of the dividends distributed during the fiscal year as amounts which may be taken into account as a dividend for the purposes of the maximum rate under section 1(h)(11) of the Internal Revenue Code.
The fund will notify shareholders in January 2025 of amounts for use in preparing 2024 income tax returns.
Item 8: Changes in and Disagreements with Accountants for Open-End Management Investment Companies
Note: This is not applicable for any fund included in this document.
Item 9: Proxy Disclosures for Open-End Management Investment Companies
| A special meeting of shareholders was held on July 16, 2024. The results of votes taken among shareholders on the proposal before them are reported below. Each vote reported represents one dollar of net asset value held on the record date for the meeting. |
| Proposal 1 |
| To elect a Board of Trustees. |
| | # of Votes | % of Votes |
| Bettina Doulton |
| Affirmative | 88,756,759,992.17 | 95.11 |
| Withheld | 4,564,750,651.52 | 4.89 |
| TOTAL | 93,321,510,643.68 | 100.00 |
| Robert A. Lawrence |
| Affirmative | 88,523,438,331.98 | 94.86 |
| Withheld | 4,798,072,311.70 | 5.14 |
| TOTAL | 93,321,510,643.68 | 100.00 |
| Vijay C. Advani |
| Affirmative | 88,484,371,668.51 | 94.82 |
| Withheld | 4,837,138,975.17 | 5.18 |
| TOTAL | 93,321,510,643.68 | 100.00 |
| Thomas P. Bostick |
| Affirmative | 88,618,596,648.21 | 94.96 |
| Withheld | 4,702,913,995.47 | 5.04 |
| TOTAL | 93,321,510,643.68 | 100.00 |
| Donald F. Donahue |
| Affirmative | 88,542,403,002.79 | 94.88 |
| Withheld | 4,779,107,640.89 | 5.12 |
| TOTAL | 93,321,510,643.68 | 100.00 |
| Vicki L. Fuller |
| Affirmative | 88,788,711,037.44 | 95.14 |
| Withheld | 4,532,799,606.24 | 4.86 |
| TOTAL | 93,321,510,643.68 | 100.00 |
| Patricia L. Kampling |
| Affirmative | 88,819,315,996.59 | 95.18 |
| Withheld | 4,502,194,647.10 | 4.82 |
| TOTAL | 93,321,510,643.68 | 100.00 |
| Thomas A. Kennedy |
| Affirmative | 88,667,457,817.34 | 95.01 |
| Withheld | 4,654,052,826.34 | 4.99 |
| TOTAL | 93,321,510,643.68 | 100.00 |
| Oscar Munoz |
| Affirmative | 88,183,976,568.30 | 94.49 |
| Withheld | 5,137,534,075.39 | 5.51 |
| TOTAL | 93,321,510,643.68 | 100.00 |
| Karen B. Peetz |
| Affirmative | 88,720,160,318.58 | 95.07 |
| Withheld | 4,601,350,325.11 | 4.93 |
| TOTAL | 93,321,510,643.68 | 100.00 |
| David M. Thomas |
| Affirmative | 88,471,490,747.86 | 94.80 |
| Withheld | 4,850,019,895.82 | 5.20 |
| TOTAL | 93,321,510,643.68 | 100.00 |
| Susan Tomasky |
| Affirmative | 88,536,869,646.78 | 94.87 |
| Withheld | 4,784,640,996.90 | 5.13 |
| TOTAL | 93,321,510,643.68 | 100.00 |
| Michael E. Wiley |
| Affirmative | 88,526,906,267.86 | 94.86 |
| Withheld | 4,794,604,375.83 | 5.14 |
| TOTAL | 93,321,510,643.68 | 100.00 |
| | | |
| Proposal 1 reflects trust-wide proposal and voting results. |
Item 10: Remuneration Paid to Directors, Officers, and others of Open-End Management Investment Companies
Note: This information is disclosed as part of the financial statements for each Fund as part of Item 7: Financial Statements and Financial Highlights for Open-End Management Investment companies.
Item 11: Statement Regarding Basis for Approval of Investment Advisory Contract
Board Approval of Investment Advisory Contracts and Management Fees
Fidelity OTC K6 Portfolio
Each year, the Board of Trustees, including the Independent Trustees (together, the Board), considers the renewal of the fund's management contract with Fidelity Management & Research Company LLC (FMR) and the sub-advisory agreements (together, the Advisory Contracts) for the fund. FMR and the sub-advisers are referred to herein as the Investment Advisers. The Board, assisted by the advice of fund counsel and Independent Trustees' counsel, requests and considers a broad range of information relevant to the renewal of the Advisory Contracts throughout the year.
The Board meets regularly and, at each of its meetings, covers an extensive agenda of topics and materials and considers factors that are relevant to its annual consideration of the renewal of the fund's Advisory Contracts, including the services and support provided to the fund and its shareholders. The Board, acting directly and through its Committees (each of which is composed of and chaired by Independent Trustees), requests and receives information concerning the annual consideration of the renewal of the fund's Advisory Contracts. The Board also meets as needed to review matters specifically related to the Board's annual consideration of the renewal of the Advisory Contracts. Members of the Board may also meet with trustees of other Fidelity funds through joint ad hoc committees to discuss certain matters relevant to all of the Fidelity funds.
At its May 2024 meeting, the Board unanimously determined to renew the fund's Advisory Contracts. In reaching its determination, the Board considered all factors it believed relevant, including (i) the nature, extent, and quality of the services provided to the fund and its shareholders (including the investment performance of the fund); (ii) the competitiveness relative to peer funds of the fund's management fee and total expense ratio; (iii) the total costs of the services provided by and the profits realized by FMR and its affiliates (Fidelity) from its relationships with the fund; and (iv) the extent to which, if any, economies of scale exist and are realized as the fund grows, and whether any economies of scale are appropriately shared with fund shareholders. The Board also considered the broad range of investment choices available to shareholders from FMR's competitors and that the fund's shareholders have chosen to invest in the fund, which is part of the Fidelity family of funds. The Board's decision to renew the Advisory Contracts was not based on any single factor.
The Board reached a determination, with the assistance of fund counsel and Independent Trustees' counsel and through the exercise of its business judgment, that the renewal of the Advisory Contracts was in the best interests of the fund and its shareholders and that the compensation payable under the Advisory Contracts was fair and reasonable in light of all of the surrounding circumstances.
Nature, Extent, and Quality of Services Provided. The Board considered staffing as it relates to the fund, including the backgrounds and experience of investment personnel of the Investment Advisers, and also considered the Investment Advisers' implementation of the fund's investment program. The Independent Trustees also had discussions with senior management of Fidelity's investment operations and investment groups. The Board considered the structure of the investment personnel compensation program and whether this structure provides appropriate incentives to act in the best interests of the fund. Additionally, the Board considered the portfolio managers' investments, if any, in the funds that they manage.
Resources Dedicated to Investment Management and Support Services. The Board and the Fund Oversight and Research Committees reviewed the general qualifications and capabilities of Fidelity's investment staff, including its size, education, experience, and resources, as well as Fidelity's approach to recruiting, training, managing, and compensating investment personnel. The Board noted the resources devoted to expansion of Fidelity's global investment organization and that Fidelity's analysts have extensive resources, tools, and capabilities that allow them to conduct sophisticated quantitative and fundamental analysis, as well as credit analysis of issuers, counterparties, and guarantors. Further, the Board considered that Fidelity's investment professionals have sufficient access to global information and data so as to provide competitive investment results over time, and that those professionals also have access to sophisticated tools that permit them to assess portfolio construction and risk and performance attribution characteristics continuously, as well as to transmit new information and research conclusions rapidly around the world. Additionally, in its deliberations, the Board considered Fidelity's trading, risk management, compliance, and technology and operations capabilities and resources, which are integral parts of the investment management process.
Shareholder and Administrative Services. The Board considered (i) the nature, extent, quality, and cost of advisory, administrative, and shareholder services performed by the Investment Advisers and their affiliates under the Advisory Contracts and under separate agreements covering transfer agency and pricing and bookkeeping services for the fund; (ii) the nature and extent of Fidelity's supervision of third party service providers, principally custodians, subcustodians, and pricing vendors; and (iii) the resources devoted by Fidelity to, and the record of compliance with, the fund's compliance policies and procedures. The Board also reviewed the allocation of fund brokerage, including allocations to brokers affiliated with the Investment Advisers, the use of brokerage commissions to pay fund expenses, and the use of "soft" commission dollars to pay for research services. The Board also considered the fund's securities lending activities and any payments made to Fidelity relating to securities lending under a separate agreement.
The Board noted that the growth of fund assets over time across the complex allows Fidelity to reinvest in the development of services designed to enhance the value and convenience of the Fidelity funds as investment vehicles. These services include 24-hour access to account information and market information over the Internet and through telephone representatives, investor education materials, and asset allocation tools. The Board also considered that it reviews customer service metrics such as telephone response times, continuity of services on the website and metrics addressing services at Fidelity Investor Centers.
Investment in a Large Fund Family. The Board considered the benefits to shareholders of investing in a fund that is part of a large family of funds offering a variety of investment disciplines and providing a large variety of fund investor services. The Board noted that Fidelity had taken, or had made recommendations that resulted in the Fidelity funds taking, a number of actions over the previous year that benefited particular funds and/or the Fidelity funds in general.
Investment Performance. The Board took into account discussions that occur with representatives of the Investment Advisers, and reports that it receives, at Board meetings throughout the year, relating to fund investment performance. In this regard the Board noted that as part of regularly scheduled fund reviews and other reports to the Board on fund performance, the Board considered annualized return information for the fund for different time periods, measured against an appropriate securities market index (benchmark index) and an appropriate peer group of funds with similar objectives (peer group). The Board also considered information about performance attribution. In its ongoing evaluation of fund investment performance, the Board gives particular attention to information indicating changes in performance of the funds over different time periods and discussed with the Investment Advisers the reasons for any overperformance or underperformance.
In addition to reviewing absolute and relative fund performance, the Independent Trustees periodically consider the appropriateness of fund performance metrics in evaluating the results achieved. The Independent Trustees generally give greater weight to fund performance over longer time periods than over shorter time periods. Depending on the circumstances, the Independent Trustees may be satisfied with a fund's performance notwithstanding that it lags its benchmark index or peer group for certain periods.
Based on its review, the Board concluded that the nature, extent, and quality of services provided to the fund under the Advisory Contracts should continue to benefit the shareholders of the fund.
Competitiveness of Management Fee and Total Expense Ratio. The Board was provided with information regarding industry trends in management fees and expenses. In its review of the fund's management fee and total expense ratio, the Board considered the fund's unitary fee rate as well as other fund expenses paid by FMR under the fund's management contract, such as transfer agent fees, pricing and bookkeeping fees, and custodial, legal, and audit fees. The Board noted that Fidelity may agree to waive fees or reimburse expenses from time to time, and the extent to which, if any, it has done so for the fund.
Comparisons of Management Fees and Total Expense Ratios. Among other things, the Board reviewed data for selected groups of competitive funds and classes (referred to as "mapped groups") that were compiled by Fidelity based on combining similar investment objective categories (as classified by Morningstar) that have comparable investment mandates. The data reviewed by the Board included (i) gross management fee comparisons (before taking into account expense reimbursements or caps) relative to the total universe of funds within the mapped group; (ii) gross management fee comparisons relative to a subset of non-Fidelity funds in the mapped group that are similar in size and management fee structure to the fund (referred to as the "asset size peer group"); (iii) total expense comparisons of the fund relative to funds and classes in the mapped group that have a similar sales load structure to the fund (referred to as the "similar sales load structure group"); and (iv) total expense comparisons of the fund relative to funds and classes in the similar sales load structure group that are similar in size and management fee structure to the fund (referred to as the "total expense asset size peer group"). The total expense asset size peer group comparison excludes performance adjustments and fund-paid 12b-1 fees to eliminate variability in fee structures.
The information provided to the Board indicated that the fund's management fee rate ranked below the competitive median of the mapped group for the 12-month period ended September 30, 2023 and below the competitive median of the asset size peer group for the 12-month period ended September 30, 2023. Further, the information provided to the Board indicated that the total expense ratio of the fund ranked below the competitive median of the similar sales load structure group for the 12-month period ended September 30, 2023 and below the competitive median of the total expense asset size peer group for the 12-month period ended September 30, 2023.
Fees Charged to Other Fidelity Clients. The Board also considered Fidelity fee structures and other information with respect to clients of Fidelity, such as other funds advised or subadvised by Fidelity, pension plan clients, and other institutional clients with similar mandates. The Board noted that a joint ad hoc committee created by it and the boards of other Fidelity funds periodically reviews and compares Fidelity's institutional investment advisory business with its business of providing services to the Fidelity funds and also noted the most recent findings of the committee. The Board noted that the committee's review included a consideration of the differences in services provided, fees charged, and costs incurred, as well as competition in the markets serving the different categories of clients.
Based on its review, the Board concluded that the fund's management fee is fair and reasonable in light of the services that the fund receives and the other factors considered. Further, based on its review of total expense ratios and fees charged to other Fidelity clients, the Board concluded that the fund's total expense ratio was reasonable in light of the services that the fund and its shareholders receive and the other factors considered.
Costs of the Services and Profitability. The Board considered the revenues earned and the expenses incurred by Fidelity in conducting the business of developing, marketing, distributing, managing, administering and servicing the fund and servicing the fund's shareholders. The Board also considered the level of Fidelity's profits in respect of all the Fidelity funds.
On an annual basis, Fidelity presents to the Board information about the profitability of its relationships with the fund. Fidelity calculates profitability information for each fund, as well as aggregate profitability information for groups of Fidelity funds and all Fidelity funds, using a series of detailed revenue and cost allocation methodologies which originate with the books and records of Fidelity on which Fidelity's audited financial statements are based. The Audit Committee of the Board reviews any significant changes from the prior year's methodologies and the full Board approves such changes.
A public accounting firm has been engaged annually by the Board as part of the Board's assessment of Fidelity's profitability analysis. The engagement includes the review and assessment of the methodologies used by Fidelity in determining the revenues and expenses attributable to Fidelity's fund business, and completion of agreed-upon procedures in respect of the mathematical accuracy of certain fund profitability information and its conformity to established allocation methodologies. After considering the reports issued under the engagement and information provided by Fidelity, the Board concluded that while other allocation methods may also be reasonable, Fidelity's profitability methodologies are reasonable in all material respects.
The Board also reviewed Fidelity's non-fund businesses and potential indirect benefits such businesses may have received as a result of their association with Fidelity's fund business (i.e., fall-out benefits) as well as cases where Fidelity's affiliates may benefit from the funds' business. The Board considered areas where potential indirect benefits to the Fidelity funds from their relationships with Fidelity may exist. The Board's consideration of these matters was informed by the findings of a joint ad hoc committee created by it and the boards of other Fidelity funds to evaluate potential fall-out benefits.
The Board considered the costs of the services provided by and the profits realized by Fidelity in connection with the operation of the fund and was satisfied that the profitability was not excessive.
Economies of Scale. The Board considered whether there have been economies of scale in respect of the management of the Fidelity funds, whether the Fidelity funds (including the fund) have appropriately benefited from any such economies of scale, and whether there is potential for realization of any further economies of scale. The Board considered the extent to which the fund will benefit from economies of scale as assets grow through increased services to the fund, through waivers or reimbursements, or through fee or expense ratio reductions. The Board recognized that, due to the fund's current contractual arrangements, its expense ratio will not decline if the fund's operating costs decrease as assets grow, or rise as assets decrease. The Board also noted that a committee created by it and the boards of other Fidelity funds periodically analyzes whether Fidelity attains economies of scale in respect of the management and servicing of the Fidelity funds, whether the Fidelity funds have appropriately benefited from such economies of scale, and whether there is potential for realization of any further economies of scale.
The Board concluded, taking into account the analysis of the committee, that economies of scale, if any, are being appropriately shared between fund shareholders and Fidelity.
Additional Information Requested by the Board. In order to develop fully the factual basis for consideration of the Fidelity funds' advisory contracts, the Board requested and received additional information on certain topics, including but not limited to: (i) fund flow and performance trends, in particular the underperformance of certain funds and strategies, and Fidelity's long-term strategies for certain funds; (ii) the operation of performance fees and the rationale for implementing performance fees on certain categories of funds but not others; (iii) Fidelity's pricing philosophy compared to competitors; (iv) fund profitability methodology and data; (v) evaluation of competitive fund data and peer group classifications and fee and expense comparisons; (vi) the management fee and expense structures for different funds and classes and information about the differences between various fee and expense structures; (vii) the variable management fee implemented for certain funds effective March 1, 2024; and (viii) information regarding other accounts managed by Fidelity and the funds' sub-advisory arrangements.
Conclusion. Based on its evaluation of all of the conclusions noted above, and after considering all factors it believed relevant, the Board, including the Independent Trustees, concluded that the advisory and sub-advisory fee arrangements are fair and reasonable in light of all of the surrounding circumstances and that the fund's Advisory Contracts should be renewed through May 31, 2025.
1.9893897.105
OTC-K6-ANN-0924
Fidelity® Blue Chip Growth K6 Fund
Annual Report
July 31, 2024
Contents
To view a fund's proxy voting guidelines and proxy voting record for the 12-month period ended June 30, visit http://www.fidelity.com/proxyvotingresults or visit the Securities and Exchange Commission's (SEC) web site at http://www.sec.gov.
You may also call 1-800-835-5092 to request a free copy of the proxy voting guidelines.
Standard & Poor's, S&P and S&P 500 are registered service marks of The McGraw-Hill Companies, Inc. and have been licensed for use by Fidelity Distributors Corporation.
Other third-party marks appearing herein are the property of their respective owners.
All other marks appearing herein are registered or unregistered trademarks or service marks of FMR LLC or an affiliated company. © 2024 FMR LLC. All rights reserved.
This report and the financial statements contained herein are submitted for the general information of the shareholders of the Fund. This report is not authorized for distribution to prospective investors in the Fund unless preceded or accompanied by an effective prospectus.
A fund files its complete schedule of portfolio holdings with the SEC for the first and third quarters of each fiscal year on Form N-PORT. Forms N-PORT are available on the SEC's web site at http://www.sec.gov. A fund's Forms N-PORT may be reviewed and copied at the SEC's Public Reference Room in Washington, DC. Information regarding the operation of the SEC's Public Reference Room may be obtained by calling 1-800-SEC-0330.
For a complete list of a fund's portfolio holdings, view the most recent holdings listing, semiannual report, or annual report on Fidelity's web site at http://www.fidelity.com, http://www.institutional.fidelity.com, or http://www.401k.com, as applicable.
NOT FDIC INSURED •MAY LOSE VALUE •NO BANK GUARANTEE
Neither the Fund nor Fidelity Distributors Corporation is a bank.
Item 7: Consolidated Financial Statements and Consolidated Financial Highlights for Open-End Management Investment Companies (Annual Report)
Fidelity® Blue Chip Growth K6 Fund
Consolidated Schedule of Investments July 31, 2024
Showing Percentage of Net Assets
| Common Stocks - 92.7% |
| | | Shares | Value ($) |
| COMMUNICATION SERVICES - 15.2% | | | |
| Diversified Telecommunication Services - 0.1% | | | |
| Indus Towers Ltd. (a) | | 1,818,200 | 9,406,115 |
| Entertainment - 2.5% | | | |
| Netflix, Inc. (a) | | 516,467 | 324,522,039 |
| Sea Ltd. ADR Class A (a) | | 587,271 | 38,583,705 |
| Sphere Entertainment Co. (a) | | 7,870 | 350,058 |
| Spotify Technology SA (a) | | 31,771 | 10,927,318 |
| Take-Two Interactive Software, Inc. (a) | | 51,316 | 7,724,597 |
| TKO Group Holdings, Inc. | | 63,000 | 6,889,050 |
| | | | 388,996,767 |
| Interactive Media & Services - 12.3% | | | |
| Alphabet, Inc. Class A | | 5,042,674 | 865,020,298 |
| Epic Games, Inc. (a)(b)(c) | | 607 | 364,200 |
| Meta Platforms, Inc. Class A | | 1,625,611 | 771,888,871 |
| Pinterest, Inc. Class A (a) | | 278,853 | 8,909,353 |
| Reddit, Inc. Class B | | 55,991 | 3,407,052 |
| Snap, Inc. Class A (a) | | 19,415,987 | 258,620,947 |
| Webtoon Entertainment, Inc. | | 75,600 | 1,614,060 |
| | | | 1,909,824,781 |
| Media - 0.0% | | | |
| The Trade Desk, Inc. Class A (a) | | 55,843 | 5,019,169 |
| Wireless Telecommunication Services - 0.3% | | | |
| T-Mobile U.S., Inc. | | 109,007 | 19,869,796 |
| Vodafone Idea Ltd. (a) | | 110,777,732 | 21,526,347 |
| | | | 41,396,143 |
TOTAL COMMUNICATION SERVICES | | | 2,354,642,975 |
| CONSUMER DISCRETIONARY - 16.9% | | | |
| Automobiles - 1.2% | | | |
| General Motors Co. | | 159,339 | 7,061,904 |
| Mahindra & Mahindra Ltd. | | 97,800 | 3,396,516 |
| Neutron Holdings, Inc. (a)(b)(c) | | 491,550 | 15,140 |
| Rad Power Bikes, Inc. (a)(b)(c) | | 101,681 | 25,420 |
| Rad Power Bikes, Inc. warrants 10/6/33 (a)(b)(c) | | 110,642 | 171,495 |
| Rivian Automotive, Inc. (a)(d) | | 2,134,069 | 35,020,072 |
| Tesla, Inc. (a) | | 613,593 | 142,396,528 |
| | | | 188,087,075 |
| Broadline Retail - 5.7% | | | |
| Amazon.com, Inc. (a) | | 4,271,440 | 798,673,851 |
| Dollarama, Inc. | | 35,223 | 3,302,005 |
| JD.com, Inc. sponsored ADR | | 98,658 | 2,603,585 |
| Lenskart Solutions Pvt Ltd. (a)(b)(c) | | 2,525,460 | 6,937,431 |
| Ollie's Bargain Outlet Holdings, Inc. (a) | | 127,917 | 12,489,816 |
| PDD Holdings, Inc. ADR (a) | | 392,163 | 50,545,889 |
| | | | 874,552,577 |
| Diversified Consumer Services - 0.1% | | | |
| Duolingo, Inc. (a) | | 29,427 | 5,059,678 |
| New Oriental Education & Technology Group, Inc. sponsored ADR (a) | | 7,169 | 450,357 |
| | | | 5,510,035 |
| Hotels, Restaurants & Leisure - 2.7% | | | |
| Airbnb, Inc. Class A (a) | | 570,536 | 79,624,004 |
| Caesars Entertainment, Inc. (a) | | 390,073 | 15,583,416 |
| Carnival Corp. (a) | | 268,893 | 4,479,757 |
| Cava Group, Inc. (a) | | 43,598 | 3,671,824 |
| Chipotle Mexican Grill, Inc. (a) | | 1,329,147 | 72,199,265 |
| Draftkings Holdings, Inc. (a) | | 655,497 | 24,220,614 |
| Flutter Entertainment PLC (a) | | 50,013 | 9,885,235 |
| Flutter Entertainment PLC (a) | | 21,265 | 4,197,711 |
| Hilton Worldwide Holdings, Inc. | | 7,407 | 1,590,061 |
| MakeMyTrip Ltd. (a) | | 34,000 | 3,182,060 |
| Marriott International, Inc. Class A | | 76,360 | 17,356,628 |
| McDonald's Corp. | | 176,883 | 46,944,748 |
| Penn Entertainment, Inc. (a)(d) | | 803,711 | 16,050,109 |
| Restaurant Brands International, Inc. | | 101,759 | 7,124,936 |
| Royal Caribbean Cruises Ltd. | | 28,622 | 4,485,640 |
| Sonder Holdings, Inc.: | | | |
| Stage 1 rights (a)(c) | | 1,448 | 0 |
| Stage 2 rights (a)(c) | | 1,447 | 0 |
| Stage 3 rights (a)(c) | | 1,447 | 0 |
| Stage 4 rights (a)(c) | | 1,447 | 0 |
| Stage 5: | | | |
| rights (a)(c) | | 1,447 | 0 |
| rights (a)(c) | | 1,447 | 0 |
| Starbucks Corp. | | 792,966 | 61,811,700 |
| Sweetgreen, Inc. Class A (a) | | 1,122,179 | 30,837,479 |
| Viking Holdings Ltd. | | 157,886 | 5,636,530 |
| Wingstop, Inc. | | 8,282 | 3,096,474 |
| Zomato Ltd. (a) | | 2,310,000 | 6,330,388 |
| | | | 418,308,579 |
| Household Durables - 0.3% | | | |
| D.R. Horton, Inc. | | 67,725 | 12,185,759 |
| Garmin Ltd. | | 33,908 | 5,806,745 |
| PulteGroup, Inc. | | 65,099 | 8,593,068 |
| SharkNinja, Inc. | | 186,025 | 14,296,021 |
| TopBuild Corp. (a) | | 21,567 | 10,320,672 |
| | | | 51,202,265 |
| Specialty Retail - 4.2% | | | |
| Abercrombie & Fitch Co. Class A (a) | | 463,652 | 68,379,397 |
| American Eagle Outfitters, Inc. | | 2,175,032 | 47,959,456 |
| Aritzia, Inc. (a) | | 408,829 | 13,419,860 |
| Carvana Co. Class A (a) | | 501,508 | 66,815,911 |
| Dick's Sporting Goods, Inc. | | 153,668 | 33,246,072 |
| Fanatics, Inc. Class A (a)(b)(c) | | 225,366 | 14,820,068 |
| Five Below, Inc. (a) | | 154,698 | 11,252,733 |
| Floor & Decor Holdings, Inc. Class A (a) | | 23,749 | 2,327,402 |
| Foot Locker, Inc. | | 136,442 | 3,965,005 |
| Gap, Inc. | | 343,694 | 8,069,935 |
| Lowe's Companies, Inc. | | 631,896 | 155,136,787 |
| RH (a) | | 252,291 | 73,184,573 |
| The Home Depot, Inc. | | 21,635 | 7,965,142 |
| TJX Companies, Inc. | | 955,161 | 107,952,296 |
| Warby Parker, Inc. (a) | | 1,085,026 | 17,870,378 |
| Wayfair LLC Class A (a) | | 257,058 | 13,991,667 |
| Williams-Sonoma, Inc. | | 46,178 | 7,142,813 |
| | | | 653,499,495 |
| Textiles, Apparel & Luxury Goods - 2.7% | | | |
| adidas AG | | 53,300 | 13,342,292 |
| Amer Sports, Inc. | | 688,342 | 7,991,651 |
| Birkenstock Holding PLC (d) | | 29,000 | 1,714,190 |
| Compagnie Financiere Richemont SA Series A | | 39,650 | 6,047,869 |
| Crocs, Inc. (a) | | 303,714 | 40,810,050 |
| Deckers Outdoor Corp. (a) | | 139,378 | 128,594,324 |
| Hermes International SCA | | 4,011 | 8,781,650 |
| lululemon athletica, Inc. (a) | | 266,213 | 68,858,655 |
| LVMH Moet Hennessy Louis Vuitton SE | | 35,291 | 24,892,945 |
| NIKE, Inc. Class B | | 793,718 | 59,417,729 |
| On Holding AG (a) | | 484,993 | 20,088,410 |
| Prada SpA | | 538,000 | 3,883,756 |
| PVH Corp. | | 192,101 | 19,592,381 |
| Ralph Lauren Corp. Class A | | 21,000 | 3,687,390 |
| Tapestry, Inc. | | 115,703 | 4,638,533 |
| | | | 412,341,825 |
TOTAL CONSUMER DISCRETIONARY | | | 2,603,501,851 |
| CONSUMER STAPLES - 2.4% | | | |
| Beverages - 0.1% | | | |
| Celsius Holdings, Inc. (a)(d) | | 298,193 | 13,964,378 |
| Consumer Staples Distribution & Retail - 1.4% | | | |
| Costco Wholesale Corp. | | 106,693 | 87,701,646 |
| Maplebear, Inc. (NASDAQ) | | 37,348 | 1,288,133 |
| Target Corp. | | 146,893 | 22,094,176 |
| Walmart, Inc. | | 1,429,284 | 98,106,054 |
| | | | 209,190,009 |
| Food Products - 0.2% | | | |
| Bowery Farming, Inc. (a)(c) | | 48,375 | 968 |
| Bowery Farming, Inc. warrants (a)(b)(c) | | 30,501 | 610 |
| Patanjali Foods Ltd. | | 312,400 | 6,417,931 |
| The Hershey Co. | | 129,584 | 25,590,248 |
| The Real Good Food Co. LLC: | | | |
| Class B (a)(c) | | 139,521 | 1 |
| Class B unit (a)(e) | | 139,521 | 71,156 |
| The Real Good Food Co., Inc. Class A (a) | | 51,122 | 26,072 |
| | | | 32,106,986 |
| Household Products - 0.4% | | | |
| Procter & Gamble Co. | | 424,036 | 68,168,027 |
| Personal Care Products - 0.2% | | | |
| elf Beauty, Inc. (a) | | 31,785 | 5,485,455 |
| Estee Lauder Companies, Inc. Class A | | 123,135 | 12,265,477 |
| Kenvue, Inc. | | 353,587 | 6,537,824 |
| Oddity Tech Ltd. (e) | | 42,893 | 1,734,807 |
| Oddity Tech Ltd. | | 70,650 | 2,857,439 |
| | | | 28,881,002 |
| Tobacco - 0.1% | | | |
| JUUL Labs, Inc. Class A (a)(b)(c) | | 23,134 | 24,753 |
| Philip Morris International, Inc. | | 182,593 | 21,027,410 |
| | | | 21,052,163 |
TOTAL CONSUMER STAPLES | | | 373,362,565 |
| ENERGY - 1.2% | | | |
| Energy Equipment & Services - 0.0% | | | |
| Secure Energy Services, Inc. | | 353,481 | 3,120,945 |
| Oil, Gas & Consumable Fuels - 1.2% | | | |
| Cameco Corp. | | 312,108 | 14,205,531 |
| Cheniere Energy, Inc. | | 18,664 | 3,408,793 |
| Diamondback Energy, Inc. | | 206,975 | 41,873,112 |
| EOG Resources, Inc. | | 288,658 | 36,601,834 |
| Exxon Mobil Corp. | | 238,402 | 28,272,093 |
| Occidental Petroleum Corp. | | 407,469 | 24,782,265 |
| Reliance Industries Ltd. | | 788,991 | 28,372,100 |
| Reliance Industries Ltd. GDR (e) | | 39,585 | 2,854,079 |
| Shell PLC ADR | | 69,900 | 5,118,078 |
| | | | 185,487,885 |
TOTAL ENERGY | | | 188,608,830 |
| FINANCIALS - 4.0% | | | |
| Banks - 0.2% | | | |
| Citigroup, Inc. | | 389,039 | 25,240,850 |
| HDFC Bank Ltd. | | 109,468 | 2,115,412 |
| KeyCorp | | 302,900 | 4,885,777 |
| U.S. Bancorp | | 92,100 | 4,133,448 |
| | | | 36,375,487 |
| Capital Markets - 1.1% | | | |
| 3i Group PLC | | 208,800 | 8,400,177 |
| Blue Owl Capital, Inc. Class A | | 830,859 | 15,844,481 |
| Coinbase Global, Inc. (a) | | 254,902 | 57,189,813 |
| CVC Capital Partners PLC (e) | | 224,787 | 4,222,050 |
| Goldman Sachs Group, Inc. | | 64,717 | 32,942,895 |
| Interactive Brokers Group, Inc. | | 13,500 | 1,610,145 |
| Jefferies Financial Group, Inc. (d) | | 109,783 | 6,419,012 |
| KKR & Co., Inc. | | 116,273 | 14,353,902 |
| Moody's Corp. | | 27,948 | 12,757,703 |
| Morgan Stanley | | 169,245 | 17,467,776 |
| Northern Trust Corp. | | 24,700 | 2,189,655 |
| Robinhood Markets, Inc. (a) | | 88,369 | 1,817,750 |
| | | | 175,215,359 |
| Consumer Finance - 0.4% | | | |
| American Express Co. | | 210,040 | 53,148,522 |
| Kaspi.KZ JSC ADR | | 13,626 | 1,773,151 |
| | | | 54,921,673 |
| Financial Services - 2.0% | | | |
| Ant International Co. Ltd. Class C (a)(b)(c) | | 201,988 | 343,380 |
| Apollo Global Management, Inc. | | 103,908 | 13,020,711 |
| Berkshire Hathaway, Inc. Class B (a) | | 10,617 | 4,655,555 |
| Block, Inc. Class A (a) | | 580,938 | 35,948,443 |
| Circle Internet Financial Ltd. Class E (c) | | 137,547 | 3,991,614 |
| Jio Financial Services Ltd. | | 747,491 | 2,932,727 |
| MasterCard, Inc. Class A | | 391,096 | 181,355,126 |
| Rocket Companies, Inc. (a) | | 36,943 | 598,107 |
| Toast, Inc. (a) | | 324,901 | 8,499,410 |
| Visa, Inc. Class A | | 214,647 | 57,025,268 |
| | | | 308,370,341 |
| Insurance - 0.3% | | | |
| Progressive Corp. | | 205,296 | 43,957,980 |
TOTAL FINANCIALS | | | 618,840,840 |
| HEALTH CARE - 8.4% | | | |
| Biotechnology - 1.3% | | | |
| Alnylam Pharmaceuticals, Inc. (a) | | 59,674 | 14,170,188 |
| Apogee Therapeutics, Inc. | | 53,884 | 2,624,151 |
| Arcellx, Inc. (a) | | 21,190 | 1,309,754 |
| Ascendis Pharma A/S sponsored ADR (a) | | 71,803 | 9,585,701 |
| Avidity Biosciences, Inc. (a) | | 53,162 | 2,423,124 |
| Cibus, Inc. (a) | | 8,450 | 83,571 |
| Janux Therapeutics, Inc. (a) | | 29,155 | 1,183,693 |
| Legend Biotech Corp. ADR (a) | | 111,477 | 6,286,188 |
| Moderna, Inc. (a) | | 84,325 | 10,053,227 |
| Moonlake Immunotherapeutics Class A (a) | | 73,768 | 3,072,437 |
| Natera, Inc. (a) | | 35,500 | 3,634,845 |
| Regeneron Pharmaceuticals, Inc. (a) | | 133,567 | 144,144,171 |
| Viking Therapeutics, Inc. (a) | | 144,384 | 8,229,888 |
| | | | 206,800,938 |
| Health Care Equipment & Supplies - 1.2% | | | |
| Blink Health LLC Series A1 (a)(b)(c) | | 7,044 | 295,848 |
| Boston Scientific Corp. (a) | | 1,497,133 | 110,608,186 |
| Glaukos Corp. (a) | | 41,525 | 4,865,484 |
| Intuitive Surgical, Inc. (a) | | 85,194 | 37,878,104 |
| Masimo Corp. (a) | | 29,452 | 3,150,775 |
| Stryker Corp. | | 77,082 | 25,240,501 |
| TransMedics Group, Inc. (a) | | 18,997 | 2,702,513 |
| | | | 184,741,411 |
| Health Care Providers & Services - 1.5% | | | |
| Hims & Hers Health, Inc. (a) | | 132,753 | 2,819,674 |
| McKesson Corp. | | 4,474 | 2,760,547 |
| Tenet Healthcare Corp. (a) | | 118,766 | 17,779,270 |
| UnitedHealth Group, Inc. | | 347,994 | 200,500,223 |
| | | | 223,859,714 |
| Health Care Technology - 0.0% | | | |
| MultiPlan Corp. warrants (a)(b) | | 13,856 | 0 |
| Life Sciences Tools & Services - 0.4% | | | |
| Danaher Corp. | | 178,171 | 49,367,621 |
| Revvity, Inc. | | 6,100 | 766,221 |
| Thermo Fisher Scientific, Inc. | | 18,512 | 11,354,150 |
| Veterinary Emergency Group LLC Class A (a)(b)(c)(f) | | 62,379 | 3,559,970 |
| | | | 65,047,962 |
| Pharmaceuticals - 4.0% | | | |
| Eli Lilly & Co. | | 524,221 | 421,615,224 |
| Galderma Group AG | | 47,224 | 3,717,125 |
| Merck & Co., Inc. | | 251,388 | 28,439,524 |
| Novo Nordisk A/S: | | | |
| Series B | | 49,781 | 6,595,629 |
| Series B sponsored ADR | | 546,571 | 72,491,712 |
| Structure Therapeutics, Inc. ADR (a) | | 27,459 | 1,026,692 |
| Teva Pharmaceutical Industries Ltd. sponsored ADR (a) | | 772,648 | 13,467,255 |
| UCB SA | | 45,800 | 7,665,544 |
| Zoetis, Inc. Class A | | 360,655 | 64,932,326 |
| | | | 619,951,031 |
TOTAL HEALTH CARE | | | 1,300,401,056 |
| INDUSTRIALS - 4.6% | | | |
| Aerospace & Defense - 1.7% | | | |
| ABL Space Systems warrants 12/14/30 (a)(b)(c) | | 7,180 | 78,765 |
| General Electric Co. | | 345,684 | 58,835,417 |
| Howmet Aerospace, Inc. | | 248,103 | 23,743,457 |
| Loar Holdings, Inc. (d) | | 14,139 | 883,688 |
| Space Exploration Technologies Corp. (a)(b)(c) | | 473,993 | 53,087,216 |
| Space Exploration Technologies Corp. Class C (a)(b)(c) | | 151,589 | 16,977,968 |
| Spirit AeroSystems Holdings, Inc. Class A (a) | | 185,887 | 6,738,404 |
| The Boeing Co. (a) | | 447,322 | 85,259,573 |
| TransDigm Group, Inc. | | 15,403 | 19,934,871 |
| | | | 265,539,359 |
| Air Freight & Logistics - 0.3% | | | |
| C.H. Robinson Worldwide, Inc. | | 81,700 | 7,275,385 |
| FedEx Corp. | | 116,133 | 35,101,199 |
| | | | 42,376,584 |
| Building Products - 0.1% | | | |
| Builders FirstSource, Inc. (a) | | 42,030 | 7,034,561 |
| Fortune Brands Innovations, Inc. | | 10,200 | 824,262 |
| Lennox International, Inc. | | 3,800 | 2,217,300 |
| The AZEK Co., Inc. Class A, (a) | | 95,681 | 4,295,120 |
| Trane Technologies PLC | | 13,109 | 4,382,077 |
| | | | 18,753,320 |
| Commercial Services & Supplies - 0.0% | | | |
| ACV Auctions, Inc. Class A (a) | | 310,028 | 5,295,278 |
| Construction & Engineering - 0.1% | | | |
| EMCOR Group, Inc. | | 14,703 | 5,520,094 |
| Fluor Corp. (a) | | 93,594 | 4,501,871 |
| Larsen & Toubro Ltd. | | 113,200 | 5,157,881 |
| | | | 15,179,846 |
| Electrical Equipment - 0.3% | | | |
| Acuity Brands, Inc. | | 23,348 | 5,868,520 |
| Eaton Corp. PLC | | 65,629 | 20,003,063 |
| GE Vernova LLC | | 109,223 | 19,467,908 |
| | | | 45,339,491 |
| Ground Transportation - 1.6% | | | |
| Bird Global, Inc. (a)(b) | | 8,055 | 8 |
| Bird Global, Inc.: | | | |
| Stage 1 rights (a)(c) | | 1,029 | 0 |
| Stage 2 rights (a)(c) | | 1,029 | 0 |
| Stage 3 rights (a)(c) | | 1,029 | 0 |
| Lyft, Inc. (a) | | 4,990,970 | 60,141,189 |
| Uber Technologies, Inc. (a) | | 2,975,718 | 191,844,539 |
| | | | 251,985,736 |
| Machinery - 0.0% | | | |
| Mitsubishi Heavy Industries Ltd. | | 165,657 | 1,985,579 |
| Professional Services - 0.0% | | | |
| Timee, Inc. | | 184,000 | 1,780,982 |
| Trading Companies & Distributors - 0.5% | | | |
| Ferguson PLC | | 47,317 | 10,535,130 |
| FTAI Aviation Ltd. | | 459,964 | 51,262,988 |
| United Rentals, Inc. | | 2,100 | 1,589,910 |
| Watsco, Inc. | | 8,606 | 4,212,551 |
| ZKH Group Ltd. (A Shares) (a) | | 30 | 3 |
| | | | 67,600,582 |
| Transportation Infrastructure - 0.0% | | | |
| JSW Infrastructure Ltd. | | 451,700 | 1,828,589 |
TOTAL INDUSTRIALS | | | 717,665,346 |
| INFORMATION TECHNOLOGY - 39.1% | | | |
| Communications Equipment - 0.2% | | | |
| Arista Networks, Inc. (a) | | 53,994 | 18,711,621 |
| Ciena Corp. (a) | | 172,370 | 9,090,794 |
| | | | 27,802,415 |
| Electronic Equipment, Instruments & Components - 0.1% | | | |
| Celestica, Inc. (a) | | 57,200 | 2,999,568 |
| Coherent Corp. (a) | | 40,439 | 2,817,790 |
| Corning, Inc. | | 421,030 | 16,845,410 |
| | | | 22,662,768 |
| IT Services - 0.7% | | | |
| MongoDB, Inc. Class A (a) | | 74,807 | 18,878,295 |
| Okta, Inc. (a) | | 637,437 | 59,880,832 |
| Shopify, Inc. Class A (a) | | 264,110 | 16,175,817 |
| Snowflake, Inc. (a) | | 131,668 | 17,166,874 |
| X Holdings Corp. Class A (a)(b)(c) | | 24,710 | 690,397 |
| | | | 112,792,215 |
| Semiconductors & Semiconductor Equipment - 23.2% | | | |
| Advanced Micro Devices, Inc. (a) | | 435,915 | 62,980,999 |
| Allegro MicroSystems LLC (a) | | 235,399 | 5,658,992 |
| Applied Materials, Inc. | | 37,004 | 7,852,249 |
| ASML Holding NV (depository receipt) | | 41,327 | 38,711,001 |
| Astera Labs, Inc. | | 305,325 | 13,385,448 |
| Astera Labs, Inc. | | 105,860 | 4,640,902 |
| Broadcom, Inc. | | 1,424,180 | 228,837,242 |
| Enphase Energy, Inc. (a) | | 53,450 | 6,152,630 |
| First Solar, Inc. (a) | | 29,833 | 6,443,630 |
| GlobalFoundries, Inc. (a) | | 1,456,250 | 74,283,313 |
| Impinj, Inc. (a) | | 52,819 | 8,413,539 |
| Lam Research Corp. | | 16,541 | 15,238,231 |
| Marvell Technology, Inc. | | 5,432,562 | 363,873,003 |
| Micron Technology, Inc. | | 366,882 | 40,290,981 |
| Monolithic Power Systems, Inc. | | 66,723 | 57,587,954 |
| NVIDIA Corp. | | 18,087,892 | 2,116,645,113 |
| NXP Semiconductors NV | | 839,105 | 220,818,872 |
| ON Semiconductor Corp. (a) | | 1,182,446 | 92,526,400 |
| Qorvo, Inc. (a) | | 39,958 | 4,786,968 |
| Qualcomm, Inc. | | 134,818 | 24,395,317 |
| Synaptics, Inc. (a) | | 15,761 | 1,376,251 |
| Taiwan Semiconductor Manufacturing Co. Ltd. sponsored ADR | | 865,730 | 143,538,034 |
| Teradyne, Inc. | | 318,899 | 41,826,793 |
| Xsight Labs Ltd. warrants 1/11/34 (a)(b)(c) | | 14,367 | 30,314 |
| | | | 3,580,294,176 |
| Software - 8.6% | | | |
| Adobe, Inc. (a) | | 218,242 | 120,393,199 |
| Applied Intuition, Inc. Class A (b)(c) | | 7,903 | 471,730 |
| AppLovin Corp. Class A, (a) | | 99,087 | 7,639,608 |
| CoreWeave, Inc. Class A (c) | | 30,838 | 23,992,581 |
| Datadog, Inc. Class A (a) | | 179,648 | 20,918,213 |
| Figma, Inc. (b)(c) | | 60,051 | 1,392,583 |
| HubSpot, Inc. (a) | | 84,604 | 42,050,726 |
| Intuit, Inc. | | 133,766 | 86,593,420 |
| Life360, Inc. | | 103,121 | 3,459,710 |
| Microsoft Corp. | | 1,822,436 | 762,416,101 |
| Onestream, Inc. | | 20,200 | 562,570 |
| Oracle Corp. | | 426,921 | 59,534,133 |
| Palantir Technologies, Inc. Class A (a) | | 182,399 | 4,904,709 |
| Pine Labs Private Ltd. (a)(b)(c) | | 1,109 | 357,730 |
| Salesforce, Inc. | | 208,101 | 53,856,539 |
| SAP SE sponsored ADR | | 36,500 | 7,723,400 |
| ServiceNow, Inc. (a) | | 122,312 | 99,609,670 |
| Stripe, Inc. Class B (a)(b)(c) | | 19,200 | 528,192 |
| Synopsys, Inc. (a) | | 19,222 | 10,732,027 |
| Zoom Video Communications, Inc. Class A (a) | | 229,517 | 13,862,827 |
| | | | 1,320,999,668 |
| Technology Hardware, Storage & Peripherals - 6.3% | | | |
| Apple, Inc. | | 4,082,571 | 906,657,368 |
| Dell Technologies, Inc. | | 342,211 | 38,902,546 |
| Western Digital Corp. (a) | | 411,934 | 27,620,175 |
| | | | 973,180,089 |
TOTAL INFORMATION TECHNOLOGY | | | 6,037,731,331 |
| MATERIALS - 0.6% | | | |
| Chemicals - 0.1% | | | |
| Linde PLC | | 14,213 | 6,445,596 |
| Sherwin-Williams Co. | | 19,207 | 6,737,816 |
| Westlake Corp. | | 16,700 | 2,469,262 |
| | | | 15,652,674 |
| Construction Materials - 0.2% | | | |
| CRH PLC | | 61,503 | 5,270,807 |
| Eagle Materials, Inc. | | 28,762 | 7,831,893 |
| Grasim Industries Ltd. | | 136,600 | 4,530,204 |
| Martin Marietta Materials, Inc. | | 12,085 | 7,170,635 |
| Vulcan Materials Co. | | 26,966 | 7,402,437 |
| | | | 32,205,976 |
| Containers & Packaging - 0.0% | | | |
| Aptargroup, Inc. | | 13,100 | 1,925,438 |
| Crown Holdings, Inc. | | 23,200 | 2,057,840 |
| International Paper Co. | | 67,400 | 3,132,752 |
| Smurfit Westrock PLC | | 33,400 | 1,497,656 |
| | | | 8,613,686 |
| Metals & Mining - 0.3% | | | |
| ATI, Inc. (a) | | 143,922 | 9,744,959 |
| Carpenter Technology Corp. | | 123,971 | 18,083,650 |
| Freeport-McMoRan, Inc. | | 142,143 | 6,454,714 |
| Hindalco Industries Ltd. | | 192,800 | 1,541,888 |
| Welspun Gujarat Stahl Rohren Ltd. | | 676,700 | 5,178,229 |
| | | | 41,003,440 |
TOTAL MATERIALS | | | 97,475,776 |
| REAL ESTATE - 0.3% | | | |
| Equity Real Estate Investment Trusts (REITs) - 0.2% | | | |
| Welltower, Inc. | | 271,599 | 30,215,389 |
| Real Estate Management & Development - 0.1% | | | |
| Zillow Group, Inc. Class C (a) | | 183,872 | 8,954,566 |
TOTAL REAL ESTATE | | | 39,169,955 |
| TOTAL COMMON STOCKS (Cost $8,401,829,265) | | | 14,331,400,525 |
| | | | |
| Convertible Preferred Stocks - 0.9% |
| | | Shares | Value ($) |
| COMMUNICATION SERVICES - 0.1% | | | |
| Interactive Media & Services - 0.1% | | | |
| ByteDance Ltd. Series E1 (a)(b)(c) | | 31,950 | 7,342,749 |
| CONSUMER DISCRETIONARY - 0.1% | | | |
| Automobiles - 0.0% | | | |
| Neutron Holdings, Inc.: | | | |
| Series 1C (a)(b)(c) | | 3,178,083 | 97,885 |
| Series 1D (a)(b)(c) | | 5,904,173 | 181,849 |
| Rad Power Bikes, Inc.: | | | |
| Series A (a)(b)(c) | | 13,256 | 3,314 |
| Series C (a)(b)(c) | | 52,162 | 25,038 |
| Series D (a)(b)(c) | | 102,800 | 74,016 |
| Waymo LLC Series A2 (a)(b)(c) | | 7,817 | 484,576 |
| | | | 866,678 |
| Broadline Retail - 0.1% | | | |
| Meesho: | | | |
| Series D2 (b)(c) | | 46,549 | 2,596,038 |
| Series E (b)(c) | | 7,754 | 432,441 |
| Series E1 (b)(c) | | 4,649 | 259,275 |
| Series F (a)(b)(c) | | 70,797 | 4,017,022 |
| | | | 7,304,776 |
| Hotels, Restaurants & Leisure - 0.0% | | | |
| Discord, Inc. Series I (a)(b)(c) | | 700 | 185,787 |
TOTAL CONSUMER DISCRETIONARY | | | 8,357,241 |
| CONSUMER STAPLES - 0.0% | | | |
| Consumer Staples Distribution & Retail - 0.0% | | | |
| GoBrands, Inc.: | | | |
| Series G (a)(b)(c) | | 18,300 | 453,108 |
| Series H (a)(b)(c) | | 11,467 | 365,224 |
| | | | 818,332 |
| Food Products - 0.0% | | | |
| AgBiome LLC Series C (a)(b)(c) | | 68,700 | 1 |
| Tobacco - 0.0% | | | |
| JUUL Labs, Inc. Series E (a)(b)(c) | | 12,508 | 13,384 |
TOTAL CONSUMER STAPLES | | | 831,717 |
| FINANCIALS - 0.0% | | | |
| Financial Services - 0.0% | | | |
| Akeana Series C (b)(c) | | 85,300 | 1,123,401 |
| Tenstorrent Holdings, Inc.: | | | |
| Series C1 (b)(c) | | 16,673 | 1,238,304 |
| Series D1 (b)(c) | | 24,300 | 1,915,569 |
| Series D2 (b)(c) | | 7,862 | 597,355 |
| | | | 4,874,629 |
| HEALTH CARE - 0.0% | | | |
| Health Care Equipment & Supplies - 0.0% | | | |
| Blink Health LLC: | | | |
| Series C (a)(b)(c) | | 16,970 | 712,740 |
| Series D (b)(c) | | 3,936 | 165,312 |
| | | | 878,052 |
| INDUSTRIALS - 0.4% | | | |
| Aerospace & Defense - 0.4% | | | |
| ABL Space Systems: | | | |
| Series B (a)(b)(c) | | 29,724 | 713,079 |
| Series B2 (a)(b)(c) | | 17,155 | 454,264 |
| Series C1 (b)(c) | | 9,574 | 190,523 |
| Relativity Space, Inc. Series E (a)(b)(c) | | 276,014 | 5,945,342 |
| Space Exploration Technologies Corp.: | | | |
| Series G (a)(b)(c) | | 4,374 | 4,898,880 |
| Series J (b)(c) | | 29,526 | 33,069,120 |
| Series N (a)(b)(c) | | 8,141 | 9,117,920 |
| | | | 54,389,128 |
| Air Freight & Logistics - 0.0% | | | |
| Zipline International, Inc. Series G (b)(c) | | 65,890 | 2,764,086 |
| Construction & Engineering - 0.0% | | | |
| Beta Technologies, Inc. Series A (a)(b)(c) | | 11,104 | 1,223,772 |
TOTAL INDUSTRIALS | | | 58,376,986 |
| INFORMATION TECHNOLOGY - 0.3% | | | |
| Electronic Equipment, Instruments & Components - 0.0% | | | |
| CelLink Corp. Series D (a)(b)(c) | | 92,760 | 692,917 |
| Enevate Corp. Series E (a)(b)(c) | | 1,325,513 | 927,859 |
| Frore Systems, Inc. Series C (b)(c) | | 85,893 | 1,386,313 |
| Menlo Micro, Inc. Series C (a)(b)(c) | | 560,500 | 392,350 |
| | | | 3,399,439 |
| IT Services - 0.0% | | | |
| Gupshup, Inc. (a)(b)(c) | | 78,911 | 696,784 |
| Yanka Industries, Inc. Series F (a)(b)(c) | | 55,991 | 347,704 |
| | | | 1,044,488 |
| Semiconductors & Semiconductor Equipment - 0.1% | | | |
| Alif Semiconductor Series C (a)(b)(c) | | 47,598 | 882,467 |
| Retym, Inc. Series C (a)(b)(c) | | 154,149 | 1,328,764 |
| Sima Technologies, Inc.: | | | |
| Series B (a)(b)(c) | | 313,000 | 2,043,890 |
| Series B1 (a)(b)(c) | | 20,966 | 158,293 |
| Xsight Labs Ltd.: | | | |
| Series D (a)(b)(c) | | 130,900 | 727,804 |
| Series D1 (b)(c) | | 47,890 | 379,289 |
| | | | 5,520,507 |
| Software - 0.2% | | | |
| Algolia, Inc. Series D (a)(b)(c) | | 30,436 | 507,672 |
| Anthropic PBC Series D (b)(c) | | 92,022 | 2,760,660 |
| Applied Intuition, Inc.: | | | |
| Series A2 (b)(c) | | 10,287 | 614,031 |
| Series B2 (b)(c) | | 4,960 | 296,062 |
| Bolt Technology OU Series E (a)(b)(c) | | 20,165 | 2,716,816 |
| CoreWeave, Inc. Series C (b)(c) | | 1,978 | 1,589,857 |
| Databricks, Inc.: | | | |
| Series G (a)(b)(c) | | 48,000 | 3,712,320 |
| Series H (a)(b)(c) | | 31,572 | 2,441,778 |
| Series I (b)(c) | | 1,359 | 105,105 |
| Moloco, Inc. Series A (a)(b)(c) | | 20,180 | 1,100,415 |
| Mountain Digital, Inc. Series D (a)(b)(c) | | 62,139 | 832,663 |
| Pine Labs Private Ltd.: | | | |
| Series 1 (a)(b)(c) | | 2,652 | 855,456 |
| Series A (a)(b)(c) | | 663 | 213,864 |
| Series B (a)(b)(c) | | 721 | 232,573 |
| Series B2 (a)(b)(c) | | 583 | 188,058 |
| Series C (a)(b)(c) | | 1,085 | 349,988 |
| Series C1 (a)(b)(c) | | 228 | 73,546 |
| Series D (a)(b)(c) | | 244 | 78,707 |
| Skyryse, Inc. Series B (a)(b)(c) | | 67,400 | 1,428,880 |
| Stripe, Inc.: | | | |
| Series H (a)(b)(c) | | 8,086 | 222,446 |
| Series I (a)(b)(c) | | 124,536 | 3,425,985 |
| xAI Corp. Series B (b)(c) | | 872,295 | 10,441,371 |
| | | | 34,188,253 |
| Technology Hardware, Storage & Peripherals - 0.0% | | | |
| Lightmatter, Inc.: | | | |
| Series C (a)(b)(c) | | 70,909 | 1,550,780 |
| Series C2 (b)(c) | | 11,138 | 290,813 |
| | | | 1,841,593 |
TOTAL INFORMATION TECHNOLOGY | | | 45,994,280 |
| MATERIALS - 0.0% | | | |
| Metals & Mining - 0.0% | | | |
| Diamond Foundry, Inc. Series C (a)(b)(c) | | 249,802 | 6,879,547 |
| UTILITIES - 0.0% | | | |
| Independent Power and Renewable Electricity Producers - 0.0% | | | |
| Redwood Materials: | | | |
| Series C (a)(b)(c) | | 37,990 | 1,355,483 |
| Series D (a)(b)(c) | | 10,886 | 388,412 |
| | | | 1,743,895 |
| TOTAL CONVERTIBLE PREFERRED STOCKS (Cost $134,726,921) | | | 135,279,096 |
| | | | |
| Convertible Bonds - 0.0% |
| | | Principal Amount (g) | Value ($) |
| CONSUMER DISCRETIONARY - 0.0% | | | |
| Automobiles - 0.0% | | | |
| Neutron Holdings, Inc.: | | | |
| 4% 5/22/27 (b)(c) | | 237,400 | 302,638 |
| 4% 6/12/27 (b)(c) | | 64,200 | 81,842 |
| 6.5% 10/29/26 (b)(c)(h) | | 2,708,561 | 2,716,416 |
| (Cost $3,010,161) | | | 3,100,896 |
| | | | |
| Preferred Securities - 0.0% |
| | | Principal Amount (g) | Value ($) |
| CONSUMER DISCRETIONARY - 0.0% | | | |
| Automobiles - 0.0% | | | |
| Rad Power Bikes, Inc. 8% 12/31/25 (b)(c) | | 110,642 | 161,079 |
| INFORMATION TECHNOLOGY - 0.0% | | | |
| Electronic Equipment, Instruments & Components - 0.0% | | | |
| Enevate Corp. 6% (b)(c)(i) | | 68,928 | 78,259 |
| Semiconductors & Semiconductor Equipment - 0.0% | | | |
| Sima Technologies, Inc. 10% 12/31/27 (b)(c) | | 310,637 | 313,848 |
TOTAL INFORMATION TECHNOLOGY | | | 392,107 |
| TOTAL PREFERRED SECURITIES (Cost $490,207) | | | 553,186 |
| | | | |
| Money Market Funds - 6.3% |
| | | Shares | Value ($) |
| Fidelity Cash Central Fund 5.39% (j) | | 922,295,176 | 922,479,635 |
| Fidelity Securities Lending Cash Central Fund 5.39% (j)(k) | | 49,439,878 | 49,444,822 |
| TOTAL MONEY MARKET FUNDS (Cost $971,924,457) | | | 971,924,457 |
| | | | |
| TOTAL INVESTMENT IN SECURITIES - 99.9% (Cost $9,511,981,011) | 15,442,258,160 |
NET OTHER ASSETS (LIABILITIES) - 0.1% | 11,217,896 |
| NET ASSETS - 100.0% | 15,453,476,056 |
| | |
| Futures Contracts |
| | Number of contracts | Expiration Date | Notional Amount ($) | Value ($) | Unrealized Appreciation/ (Depreciation) ($) |
| Purchased | | | | | |
| | | | | | |
| Equity Index Contracts | | | | | |
| CME E-mini S&P 500 Index Contracts (United States) | 966 | Sep 2024 | 268,451,400 | 2,613,477 | 2,613,477 |
| CME Micro E-mini NASDAQ 100 Index Contracts (United States) | 1,373 | Sep 2024 | 535,614,165 | (12,225,212) | (12,225,212) |
| | | | | | |
| TOTAL FUTURES CONTRACTS | | | | | (9,611,735) |
| The notional amount of futures purchased as a percentage of Net Assets is 5.2% |
Legend
| (b) | Restricted securities (including private placements) - Investment in securities not registered under the Securities Act of 1933 (excluding 144A issues). At the end of the period, the value of restricted securities (excluding 144A issues) amounted to $239,106,396 or 1.5% of net assets. |
| (d) | Security or a portion of the security is on loan at period end. |
| (e) | Security exempt from registration under Rule 144A of the Securities Act of 1933. These securities may be resold in transactions exempt from registration, normally to qualified institutional buyers. At the end of the period, the value of these securities amounted to $8,882,092 or 0.1% of net assets. |
| (f) | Investment is owned by a wholly-owned subsidiary (Subsidiary) that is treated as a corporation for U.S. tax purposes. |
| (g) | Amount is stated in United States dollars unless otherwise noted. |
| (h) | Security initially issued at one coupon which converts to a higher coupon at a specified date. The rate shown is the rate at period end. |
| (i) | Security is perpetual in nature with no stated maturity date. |
| (j) | Affiliated fund that is generally available only to investment companies and other accounts managed by Fidelity Investments. The rate quoted is the annualized seven-day yield of the fund at period end. A complete unaudited listing of the fund's holdings as of its most recent quarter end is available upon request. In addition, each Fidelity Central Fund's financial statements, which are not covered by the Fund's Report of Independent Registered Public Accounting Firm, are available on the SEC's website or upon request. |
| (k) | Investment made with cash collateral received from securities on loan. |
| Additional information on each restricted holding is as follows: |
| Security | Acquisition Date | Acquisition Cost ($) |
| ABL Space Systems warrants 12/14/30 | 12/14/23 | 0 |
| | | |
| ABL Space Systems Series B | 3/24/21 | 1,338,638 |
| | | |
| ABL Space Systems Series B2 | 10/22/21 | 1,166,473 |
| | | |
| ABL Space Systems Series C1 | 12/14/23 | 313,081 |
| | | |
| AgBiome LLC Series C | 6/29/18 | 435,125 |
| | | |
| Akeana Series C | 1/23/24 | 1,088,496 |
| | | |
| Algolia, Inc. Series D | 7/23/21 | 890,102 |
| | | |
| Alif Semiconductor Series C | 3/08/22 | 966,170 |
| | | |
| Ant International Co. Ltd. Class C | 5/16/18 | 769,853 |
| | | |
| Anthropic PBC Series D | 5/31/24 | 2,761,074 |
| | | |
| Applied Intuition, Inc. Class A | 7/02/24 | 471,769 |
| | | |
| Applied Intuition, Inc. Series A2 | 7/02/24 | 614,081 |
| | | |
| Applied Intuition, Inc. Series B2 | 7/02/24 | 296,087 |
| | | |
| Beta Technologies, Inc. Series A | 4/09/21 | 813,590 |
| | | |
| Bird Global, Inc. | 5/11/21 | 2,013,670 |
| | | |
| Blink Health LLC Series A1 | 12/30/20 - 6/17/24 | 199,200 |
| | | |
| Blink Health LLC Series C | 11/07/19 - 7/14/21 | 647,847 |
| | | |
| Blink Health LLC Series D | 6/17/24 - 6/25/24 | 165,312 |
| | | |
| Bolt Technology OU Series E | 1/03/22 | 5,238,796 |
| | | |
| Bowery Farming, Inc. warrants | 10/25/23 | 0 |
| | | |
| ByteDance Ltd. Series E1 | 11/18/20 | 3,500,895 |
| | | |
| CelLink Corp. Series D | 1/20/22 | 1,931,625 |
| | | |
| CoreWeave, Inc. Series C | 5/17/24 | 1,540,961 |
| | | |
| Databricks, Inc. Series G | 2/01/21 | 2,837,886 |
| | | |
| Databricks, Inc. Series H | 8/31/21 | 2,320,041 |
| | | |
| Databricks, Inc. Series I | 9/14/23 | 99,887 |
| | | |
| Diamond Foundry, Inc. Series C | 3/15/21 | 5,995,248 |
| | | |
| Discord, Inc. Series I | 9/15/21 | 385,437 |
| | | |
| Enevate Corp. Series E | 1/29/21 | 1,469,576 |
| | | |
| Enevate Corp. 6% | 11/02/23 | 68,928 |
| | | |
| Epic Games, Inc. | 7/30/20 | 349,025 |
| | | |
| Fanatics, Inc. Class A | 8/13/20 - 10/24/22 | 10,009,624 |
| | | |
| Figma, Inc. | 5/15/24 | 1,392,763 |
| | | |
| Frore Systems, Inc. Series C | 5/10/24 | 1,380,335 |
| | | |
| GoBrands, Inc. Series G | 3/02/21 | 4,569,827 |
| | | |
| GoBrands, Inc. Series H | 7/22/21 | 4,454,821 |
| | | |
| Gupshup, Inc. | 6/08/21 | 1,804,316 |
| | | |
| JUUL Labs, Inc. Class A | 12/20/17 - 7/06/18 | 645,585 |
| | | |
| JUUL Labs, Inc. Series E | 12/20/17 - 7/06/18 | 342,963 |
| | | |
| Lenskart Solutions Pvt Ltd. | 4/30/24 | 6,959,691 |
| | | |
| Lightmatter, Inc. Series C | 5/19/23 | 1,166,935 |
| | | |
| Lightmatter, Inc. Series C2 | 12/18/23 | 289,608 |
| | | |
| Meesho Series D2 | 7/15/24 | 2,606,744 |
| | | |
| Meesho Series E | 7/15/24 | 434,224 |
| | | |
| Meesho Series E1 | 4/18/24 | 260,344 |
| | | |
| Meesho Series F | 9/21/21 - 7/15/24 | 5,279,390 |
| | | |
| Menlo Micro, Inc. Series C | 2/09/22 | 742,943 |
| | | |
| Moloco, Inc. Series A | 6/26/23 | 1,210,800 |
| | | |
| Mountain Digital, Inc. Series D | 11/05/21 | 1,427,041 |
| | | |
| MultiPlan Corp. warrants | 10/08/20 | 0 |
| | | |
| Neutron Holdings, Inc. | 2/04/21 | 4,916 |
| | | |
| Neutron Holdings, Inc. Series 1C | 7/03/18 | 581,081 |
| | | |
| Neutron Holdings, Inc. Series 1D | 1/25/19 | 1,431,762 |
| | | |
| Neutron Holdings, Inc. 4% 5/22/27 | 6/04/20 | 237,400 |
| | | |
| Neutron Holdings, Inc. 4% 6/12/27 | 6/12/20 | 64,200 |
| | | |
| Neutron Holdings, Inc. 6.5% 10/29/26 | 10/29/21 - 4/29/24 | 2,708,561 |
| | | |
| Pine Labs Private Ltd. | 6/30/21 | 413,502 |
| | | |
| Pine Labs Private Ltd. Series 1 | 6/30/21 | 988,825 |
| | | |
| Pine Labs Private Ltd. Series A | 6/30/21 | 247,206 |
| | | |
| Pine Labs Private Ltd. Series B | 6/30/21 | 268,832 |
| | | |
| Pine Labs Private Ltd. Series B2 | 6/30/21 | 217,377 |
| | | |
| Pine Labs Private Ltd. Series C | 6/30/21 | 404,553 |
| | | |
| Pine Labs Private Ltd. Series C1 | 6/30/21 | 85,012 |
| | | |
| Pine Labs Private Ltd. Series D | 6/30/21 | 90,978 |
| | | |
| Rad Power Bikes, Inc. | 1/21/21 | 490,493 |
| | | |
| Rad Power Bikes, Inc. warrants 10/6/33 | 10/06/23 | 0 |
| | | |
| Rad Power Bikes, Inc. Series A | 1/21/21 | 63,945 |
| | | |
| Rad Power Bikes, Inc. Series C | 1/21/21 | 251,621 |
| | | |
| Rad Power Bikes, Inc. Series D | 9/17/21 | 985,215 |
| | | |
| Rad Power Bikes, Inc. 8% 12/31/25 | 10/06/23 | 110,642 |
| | | |
| Redwood Materials Series C | 5/28/21 | 1,800,858 |
| | | |
| Redwood Materials Series D | 6/02/23 | 519,653 |
| | | |
| Relativity Space, Inc. Series E | 5/27/21 | 6,302,807 |
| | | |
| Retym, Inc. Series C | 5/17/23 - 6/20/23 | 1,199,557 |
| | | |
| Sima Technologies, Inc. Series B | 5/10/21 | 1,604,876 |
| | | |
| Sima Technologies, Inc. Series B1 | 4/25/22 | 148,668 |
| | | |
| Sima Technologies, Inc. 10% 12/31/27 | 4/08/24 - 7/05/24 | 310,637 |
| | | |
| Skyryse, Inc. Series B | 10/21/21 | 1,663,430 |
| | | |
| Space Exploration Technologies Corp. | 2/16/21 - 4/02/24 | 40,573,525 |
| | | |
| Space Exploration Technologies Corp. Class C | 12/15/22 - 4/02/24 | 13,293,333 |
| | | |
| Space Exploration Technologies Corp. Series G | 9/07/23 | 3,542,940 |
| | | |
| Space Exploration Technologies Corp. Series J | 9/07/23 | 23,916,060 |
| | | |
| Space Exploration Technologies Corp. Series N | 8/04/20 | 2,198,070 |
| | | |
| Stripe, Inc. Class B | 5/18/21 | 770,465 |
| | | |
| Stripe, Inc. Series H | 3/15/21 | 324,451 |
| | | |
| Stripe, Inc. Series I | 3/20/23 - 5/12/23 | 2,507,425 |
| | | |
| Tenstorrent Holdings, Inc. Series C1 | 4/23/21 | 991,307 |
| | | |
| Tenstorrent Holdings, Inc. Series D1 | 7/16/24 | 1,915,483 |
| | | |
| Tenstorrent Holdings, Inc. Series D2 | 7/17/24 | 597,355 |
| | | |
| Veterinary Emergency Group LLC Class A | 9/16/21 - 3/17/22 | 2,585,288 |
| | | |
| Waymo LLC Series A2 | 5/08/20 | 671,224 |
| | | |
| X Holdings Corp. Class A | 10/25/22 | 2,471,000 |
| | | |
| xAI Corp. Series B | 5/13/24 | 10,441,371 |
| | | |
| Xsight Labs Ltd. warrants 1/11/34 | 1/11/24 | 0 |
| | | |
| Xsight Labs Ltd. Series D | 2/16/21 | 1,046,676 |
| | | |
| Xsight Labs Ltd. Series D1 | 1/11/24 | 382,928 |
| | | |
| Yanka Industries, Inc. Series F | 4/08/21 | 1,784,814 |
| | | |
| Zipline International, Inc. Series G | 6/07/24 | 2,763,842 |
| | | |
Affiliated Central Funds
Fiscal year to date information regarding the Fund's investments in Fidelity Central Funds, including the ownership percentage, is presented below.
| Affiliate | Value, beginning of period ($) | Purchases ($) | Sales Proceeds ($) | Dividend Income ($) | Realized Gain (loss) ($) | Change in Unrealized appreciation (depreciation) ($) | Value, end of period ($) | % ownership, end of period |
| Fidelity Cash Central Fund 5.39% | 665,660,945 | 3,044,268,942 | 2,787,449,520 | 50,171,965 | (732) | - | 922,479,635 | 1.8% |
| Fidelity Securities Lending Cash Central Fund 5.39% | 161,527,112 | 586,005,132 | 698,087,422 | 167,909 | - | - | 49,444,822 | 0.2% |
| Total | 827,188,057 | 3,630,274,074 | 3,485,536,942 | 50,339,874 | (732) | - | 971,924,457 | |
| | | | | | | | | |
Amounts in the dividend income column in the above table include any capital gain distributions from underlying funds, which are presented in the corresponding line item in the Consolidated Statement of Operations, if applicable.
Amounts in the dividend income column for Fidelity Securities Lending Cash Central Fund represents the income earned on investing cash collateral, less rebates paid to borrowers and any lending agent fees associated with the loan, plus any premium payments received for lending certain types of securities.
Amounts included in the purchases and sales proceeds columns may include in-kind transactions, if applicable.
Investment Valuation
The following is a summary of the inputs used, as of July 31, 2024, involving the Fund's assets and liabilities carried at fair value. The inputs or methodology used for valuing securities may not be an indication of the risk associated with investing in those securities. For more information on valuation inputs, and their aggregation into the levels used below, please refer to the Investment Valuation section in the accompanying Notes to Consolidated Financial Statements.
| Valuation Inputs at Reporting Date: |
| Description | Total ($) | Level 1 ($) | Level 2 ($) | Level 3 ($) |
Investments in Securities: | | | | |
|
| Equities: | | | | |
Communication Services | 2,361,985,724 | 2,354,278,775 | - | 7,706,949 |
Consumer Discretionary | 2,611,859,092 | 2,550,591,483 | 30,940,814 | 30,326,795 |
Consumer Staples | 374,194,282 | 373,336,233 | - | 858,049 |
Energy | 188,608,830 | 188,608,830 | - | - |
Financials | 623,715,469 | 603,990,257 | 10,515,589 | 9,209,623 |
Health Care | 1,301,279,108 | 1,289,949,609 | 6,595,629 | 4,733,870 |
Industrials | 776,042,332 | 645,535,818 | 1,985,579 | 128,520,935 |
Information Technology | 6,083,725,611 | 6,010,267,804 | - | 73,457,807 |
Materials | 104,355,323 | 97,475,776 | - | 6,879,547 |
Real Estate | 39,169,955 | 39,169,955 | - | - |
Utilities | 1,743,895 | - | - | 1,743,895 |
|
| Corporate Bonds | 3,100,896 | - | - | 3,100,896 |
|
| Preferred Securities | 553,186 | - | - | 553,186 |
|
| Money Market Funds | 971,924,457 | 971,924,457 | - | - |
| Total Investments in Securities: | 15,442,258,160 | 15,125,128,997 | 50,037,611 | 267,091,552 |
| | | | | |
|
| Net Unrealized Appreciation on Unfunded Commitments | 17,285 | - | - | 17,285 |
| Total | 17,285 | - | - | 17,285 |
Derivative Instruments: Assets | | | | |
Futures Contracts | 2,613,477 | 2,613,477 | - | - |
| Total Assets | 2,613,477 | 2,613,477 | - | - |
| Liabilities | | | | |
Futures Contracts | (12,225,212) | (12,225,212) | - | - |
| Total Liabilities | (12,225,212) | (12,225,212) | - | - |
| Total Derivative Instruments: | (9,611,735) | (9,611,735) | - | - |
The following is a reconciliation of consolidated Investments in Securities for which Level 3 inputs were used in determining value:
| |
| Investments in Securities: | |
| Beginning Balance | $ | 141,097,621 | |
| Net Realized Gain (Loss) on Investment Securities | | 345,760 | |
| Net Unrealized Gain (Loss) on Investment Securities | | 34,976,677 | |
| Cost of Purchases | | 109,874,818 | |
| Proceeds of Sales | | (7,647,998) | |
| Amortization/Accretion | | - | |
| Transfers into Level 3 | | - | |
| Transfers out of Level 3 | | (11,555,326) | |
| Ending Balance | $ | 267,091,552 | |
| The change in unrealized gain (loss) for the period attributable to Level 3 securities held at July 31, 2024 | $ | 34,279,386 | |
| The information used in the above reconciliation represents fiscal year to date activity for any Investments in Securities identified as using Level 3 inputs at either the beginning or the end of the current fiscal period. Cost of purchases and proceeds of sales may include securities received and/or delivered through in-kind transactions, corporate actions or exchanges. Transfers into Level 3 were attributable to a lack of observable market data resulting from decreases in market activity, decreases in liquidity, security restructurings or corporate actions. Transfers out of Level 3 were attributable to observable market data becoming available for those securities. Transfers in or out of Level 3 represent the beginning value of any Security or Instrument where a change in the pricing level occurred from the beginning to the end of the period. Realized and unrealized gains (losses) disclosed in the reconciliation are included in Net Gain (Loss) on the Fund's consolidated Statement of Operations. | |
Value of Derivative Instruments
The following table is a summary of the Fund's value of derivative instruments by primary risk exposure as of July 31, 2024. For additional information on derivative instruments, please refer to the Derivative Instruments section in the accompanying Notes to Consolidated Financial Statements.
Primary Risk Exposure / Derivative Type | Value |
| Asset ($) | Liability ($) |
| Equity Risk | | |
Futures Contracts (a) | 2,613,477 | (12,225,212) |
| Total Equity Risk | 2,613,477 | (12,225,212) |
| Total Value of Derivatives | 2,613,477 | (12,225,212) |
(a)Reflects gross cumulative appreciation (depreciation) on futures contracts as presented in the Consolidated Schedule of Investments. In the Consolidated Statement of Assets and Liabilities, the period end daily variation margin is included in receivable or payable for daily variation margin on futures contracts, and the net cumulative appreciation (depreciation) is included in Total accumulated earnings (loss).
Consolidated Financial Statements
| Consolidated Statement of Assets and Liabilities |
As of July 31, 2024 |
| Assets | | | | |
| Investment in securities, at value (including securities loaned of $48,792,097) - See accompanying schedule: | | | | |
Unaffiliated issuers (cost $8,540,056,554) | $ | 14,470,333,703 | | |
Fidelity Central Funds (cost $971,924,457) | | 971,924,457 | | |
| | | | | |
| | | | | |
| Total Investment in Securities (cost $9,511,981,011) | | | $ | 15,442,258,160 |
| Segregated cash with brokers for derivative instruments | | | | 39,840,000 |
| Foreign currency held at value (cost $84) | | | | 84 |
| Receivable for investments sold | | | | 17,651,279 |
| Unrealized appreciation on unfunded commitments | | | | 17,285 |
| Receivable for fund shares sold | | | | 13,991,945 |
| Dividends receivable | | | | 2,632,194 |
| Interest receivable | | | | 95,347 |
| Distributions receivable from Fidelity Central Funds | | | | 4,325,177 |
| Receivable for daily variation margin on futures contracts | | | | 19,754,390 |
| Other receivables | | | | 4,323 |
Total assets | | | | 15,540,570,184 |
| Liabilities | | | | |
| Payable to custodian bank | $ | 27,344 | | |
| Payable for investments purchased | | 16,122,448 | | |
| Payable for fund shares redeemed | | 10,766,845 | | |
| Accrued management fee | | 5,971,358 | | |
| Deferred taxes | | 4,659,094 | | |
| Other payables and accrued expenses | | 99,489 | | |
| Collateral on securities loaned | | 49,447,550 | | |
| Total liabilities | | | | 87,094,128 |
| Commitments and contingent liabilities (see Commitments note) | | | | |
| Net Assets | | | $ | 15,453,476,056 |
| Net Assets consist of: | | | | |
| Paid in capital | | | $ | 9,608,936,244 |
| Total accumulated earnings (loss) | | | | 5,844,539,812 |
| Net Assets | | | $ | 15,453,476,056 |
Net Asset Value, offering price and redemption price per share ($15,453,476,056 ÷ 472,442,902 shares) | | | $ | 32.71 |
| Consolidated Statement of Operations |
| Year ended July 31, 2024 |
| Investment Income | | | | |
| Dividends | | | $ | 59,374,506 |
| Interest | | | | 1,996,257 |
| Income from Fidelity Central Funds (including $167,909 from security lending) | | | | 50,339,874 |
| Total income | | | | 111,710,637 |
| Expenses | | | | |
| Management fee | $ | 56,871,896 | | |
| Independent trustees' fees and expenses | | 56,183 | | |
| Total expenses before reductions | | 56,928,079 | | |
| Expense reductions | | (7,065) | | |
| Total expenses after reductions | | | | 56,921,014 |
| Net Investment income (loss) | | | | 54,789,623 |
| Realized and Unrealized Gain (Loss) | | | | |
| Net realized gain (loss) on: | | | | |
| Investment Securities: | | | | |
| Unaffiliated issuers (net of foreign taxes of $18,676) | | 165,155,307 | | |
| Redemptions in-kind | | 507,463,162 | | |
| Fidelity Central Funds | | (732) | | |
| Foreign currency transactions | | 315,894 | | |
| Futures contracts | | 165,907,997 | | |
| Total net realized gain (loss) | | | | 838,841,628 |
| Change in net unrealized appreciation (depreciation) on: | | | | |
| Investment Securities: | | | | |
| Unaffiliated issuers (net of increase in deferred foreign taxes of $3,189,960) | | 2,598,040,345 | | |
| Unfunded commitments | | 17,285 | | |
| Assets and liabilities in foreign currencies | | (217) | | |
| Futures contracts | | (26,801,415) | | |
| Total change in net unrealized appreciation (depreciation) | | | | 2,571,255,998 |
| Net gain (loss) | | | | 3,410,097,626 |
| Net increase (decrease) in net assets resulting from operations | | | $ | 3,464,887,249 |
| Consolidated Statement of Changes in Net Assets |
| |
| | Year ended July 31, 2024 | | Year ended July 31, 2023 |
| Increase (Decrease) in Net Assets | | | | |
| Operations | | | | |
| Net investment income (loss) | $ | 54,789,623 | $ | 16,349,999 |
| Net realized gain (loss) | | 838,841,628 | | (122,918,771) |
| Change in net unrealized appreciation (depreciation) | | 2,571,255,998 | | 2,066,089,574 |
| Net increase (decrease) in net assets resulting from operations | | 3,464,887,249 | | 1,959,520,802 |
| Distributions to shareholders | | (28,694,920) | | (7,284,411) |
| | | | | |
| Share transactions | | | | |
| Proceeds from sales of shares | | 5,483,488,662 | | 2,691,780,500 |
| Reinvestment of distributions | | 28,606,071 | | 7,274,331 |
| Cost of shares redeemed | | (3,383,723,047) | | (1,583,663,662) |
| | | | | |
Net increase (decrease) in net assets resulting from share transactions | | 2,128,371,686 | | 1,115,391,169 |
| Total increase (decrease) in net assets | | 5,564,564,015 | | 3,067,627,560 |
| | | | | |
| Net Assets | | | | |
| Beginning of period | | 9,888,912,041 | | 6,821,284,481 |
| End of period | $ | 15,453,476,056 | $ | 9,888,912,041 |
| | | | | |
| Other Information | | | | |
| Shares | | | | |
| Sold | | 197,114,419 | | 131,770,510 |
| Issued in reinvestment of distributions | | 1,142,603 | | 380,059 |
| Redeemed | | (116,394,378) | | (79,361,422) |
| Net increase (decrease) | | 81,862,644 | | 52,789,147 |
| | | | | |
Consolidated Financial Highlights
Fidelity® Blue Chip Growth K6 Fund |
| |
| Years ended July 31, | | 2024 | | 2023 | | 2022 | | 2021 | | 2020 |
Selected Per-Share Data | | | | | | | | | | |
| Net asset value, beginning of period | $ | 25.32 | $ | 20.19 | $ | 27.89 | $ | 19.32 | $ | 13.69 |
| Income from Investment Operations | | | | | | | | | | |
Net investment income (loss) A,B | | .12 | | .05 | | - C | | (.03) | | .03 |
| Net realized and unrealized gain (loss) | | 7.34 | | 5.10 | | (5.83) | | 8.91 | | 5.64 |
| Total from investment operations | | 7.46 | | 5.15 | | (5.83) | | 8.88 | | 5.67 |
| Distributions from net investment income | | (.07) | | (.02) | | - | | (.02) | | (.04) |
| Distributions from net realized gain | | - | | - | | (1.87) | | (.29) | | - C |
| Total distributions | | (.07) | | (.02) | | (1.87) | | (.31) | | (.04) |
| Net asset value, end of period | $ | 32.71 | $ | 25.32 | $ | 20.19 | $ | 27.89 | $ | 19.32 |
Total Return D | | | | 25.55% | | (22.62)% | | 46.28% | | 41.55% |
Ratios to Average Net Assets B,E,F | | | | | | | | | | |
| Expenses before reductions | | .45% | | .45% | | .45% | | .45% | | .45% |
| Expenses net of fee waivers, if any | | | | .45% | | .45% | | .45% | | .45% |
| Expenses net of all reductions | | .45% | | .45% | | .45% | | .45% | | .45% |
| Net investment income (loss) | | .43% | | .23% | | .01% | | (.10)% | | .19% |
| Supplemental Data | | | | | | | | | | |
| Net assets, end of period (000 omitted) | $ | 15,453,476 | $ | 9,888,912 | $ | 6,821,284 | $ | 6,455,689 | $ | 3,854,348 |
Portfolio turnover rate G,H | | | | 24% | | 37% | | 44% | | 49% |
ACalculated based on average shares outstanding during the period.
BNet investment income (loss) is affected by the timing of the declaration of dividends by any underlying mutual funds or exchange-traded funds (ETFs). Net investment income (loss) of any mutual funds or ETFs is not included in the Fund's net investment income (loss) ratio.
CAmount represents less than $.005 per share.
DTotal returns would have been lower if certain expenses had not been reduced during the applicable periods shown.
EFees and expenses of any underlying mutual funds or exchange-traded funds (ETFs) are not included in the Fund's expense ratio. The Fund indirectly bears its proportionate share of these expenses. For additional expense information related to investments in Fidelity Central Funds, please refer to the "Investments in Fidelity Central Funds" note found in the Notes to Consolidated Financial Statements section of the most recent Annual or Semi-Annual report.
FExpense ratios reflect operating expenses of the class. Expenses before reductions do not reflect amounts reimbursed, waived, or reduced through arrangements with the investment adviser, brokerage services, or other offset arrangements, if applicable, and do not represent the amount paid by the class during periods when reimbursements, waivers or reductions occur.
GAmount does not include the portfolio activity of any underlying mutual funds or exchange-traded funds (ETFs).
HPortfolio turnover rate excludes securities received or delivered in-kind.
Notes to Consolidated Financial Statements
For the period ended July 31, 2024
1. Organization.
Fidelity Blue Chip Growth K6 Fund (the Fund) is a fund of Fidelity Securities Fund (the Trust) and is authorized to issue an unlimited number of shares. Share transactions on the Consolidated Statement of Changes in Net Assets may contain exchanges between affiliated funds. The Trust is registered under the Investment Company Act of 1940, as amended (the 1940 Act), as an open-end management investment company organized as a Massachusetts business trust. Shares generally are available only to employer-sponsored retirement plans that are recordkept by Fidelity, or to certain employer-sponsored retirement plans that are not recordkept by Fidelity.
2. Investments in Fidelity Central Funds.
Funds may invest in Fidelity Central Funds, which are open-end investment companies generally available only to other investment companies and accounts managed by the investment adviser and its affiliates. The Consolidated Schedule of Investments lists any Fidelity Central Funds held as an investment as of period end, but does not include the underlying holdings of each Fidelity Central Fund. An investing fund indirectly bears its proportionate share of the expenses of the underlying Fidelity Central Funds.
Based on its investment objective, each Fidelity Central Fund may invest or participate in various investment vehicles or strategies that are similar to those of the investing fund. These strategies are consistent with the investment objectives of the investing fund and may involve certain economic risks which may cause a decline in value of each of the Fidelity Central Funds and thus a decline in the value of the investing fund.
| Fidelity Central Fund | Investment Manager | Investment Objective | Investment Practices | Expense RatioA |
| Fidelity Money Market Central Funds | Fidelity Management & Research Company LLC (FMR) | Each fund seeks to obtain a high level of current income consistent with the preservation of capital and liquidity. | Short-term Investments | Less than .005% |
A Expenses expressed as a percentage of average net assets and are as of each underlying Central Fund's most recent annual or semi-annual shareholder report.
A complete unaudited list of holdings for each Fidelity Central Fund is available upon request or at the Securities and Exchange Commission website at www.sec.gov. In addition, the financial statements of the Fidelity Central Funds which contain the significant accounting policies (including investment valuation policies) of those funds, and are not covered by the Report of Independent Registered Public Accounting Firm, are available on the Securities and Exchange Commission website or upon request.
3. Significant Accounting Policies.
The Fund is an investment company and applies the accounting and reporting guidance of the Financial Accounting Standards Board (FASB) Accounting Standards Codification Topic 946 Financial Services - Investment Companies. The consolidated financial statements have been prepared in conformity with accounting principles generally accepted in the United States of America (GAAP), which require management to make certain estimates and assumptions at the date of the consolidated financial statements. Actual results could differ from those estimates. Subsequent events, if any, through the date that the consolidated financial statements were issued have been evaluated in the preparation of the consolidated financial statements. The Fund's Consolidated Schedule of Investments lists any underlying mutual funds or exchange-traded funds (ETFs) but does not include the underlying holdings of these funds. The following summarizes the significant accounting policies of the Fund:
Investment Valuation. Investments are valued as of 4:00 p.m. Eastern time on the last calendar day of the period. The Board of Trustees (the Board) has designated the Fund's investment adviser as the valuation designee responsible for the fair valuation function and performing fair value determinations as needed. The investment adviser has established a Fair Value Committee (the Committee) to carry out the day-to-day fair valuation responsibilities and has adopted policies and procedures to govern the fair valuation process and the activities of the Committee. In accordance with these fair valuation policies and procedures, which have been approved by the Board, the Fund attempts to obtain prices from one or more third party pricing services or brokers to value its investments. When current market prices, quotations or currency exchange rates are not readily available or reliable, investments will be fair valued in good faith by the Committee, in accordance with the policies and procedures. Factors used in determining fair value vary by investment type and may include market or investment specific events, transaction data, estimated cash flows, and market observations of comparable investments. The frequency that the fair valuation procedures are used cannot be predicted and they may be utilized to a significant extent. The Committee manages the Fund's fair valuation practices and maintains the fair valuation policies and procedures. The Fund's investment adviser reports to the Board information regarding the fair valuation process and related material matters.
The Fund categorizes the inputs to valuation techniques used to value its investments into a disclosure hierarchy consisting of three levels as shown below:
Level 1 - unadjusted quoted prices in active markets for identical investments
Level 2 - other significant observable inputs (including quoted prices for similar investments, interest rates, prepayment speeds, etc.)
Level 3 - unobservable inputs (including the Fund's own assumptions based on the best information available)
Valuation techniques used to value the Fund's investments by major category are as follows:
Equity securities, including restricted securities, for which market quotations are readily available, are valued at the last reported sale price or official closing price as reported by a third party pricing service on the primary market or exchange on which they are traded and are categorized as Level 1 in the hierarchy. In the event there were no sales during the day or closing prices are not available, securities are valued at the last quoted bid price or may be valued using the last available price and are generally categorized as Level 2 in the hierarchy. For foreign equity securities, when market or security specific events arise, comparisons to the valuation of American Depositary Receipts (ADRs), futures contracts, Exchange-Traded Funds (ETFs) and certain indexes as well as quoted prices for similar securities may be used and would be categorized as Level 2 in the hierarchy. For equity securities, including restricted securities, where observable inputs are limited, assumptions about market activity and risk are used and these securities may be categorized as Level 3 in the hierarchy. Securities, including private placements or other restricted securities, for which observable inputs are not available are valued using alternate valuation approaches, including the market approach, the income approach and cost approach, and are categorized as Level 3 in the hierarchy. The market approach considers factors including the price of recent investments in the same or a similar security or financial metrics of comparable securities. The income approach considers factors including expected future cash flows, security specific risks and corresponding discount rates. The cost approach considers factors including the value of the security's underlying assets and liabilities.
Debt securities, including restricted securities, are valued based on evaluated prices received from third party pricing services or from brokers who make markets in such securities. Corporate bonds and preferred securities are valued by pricing services who utilize matrix pricing which considers yield or price of bonds of comparable quality, coupon, maturity and type or by broker-supplied prices. When independent prices are unavailable or unreliable, debt securities may be valued utilizing pricing methodologies which consider similar factors that would be used by third party pricing services. Debt securities are generally categorized as Level 2 in the hierarchy but may be Level 3 depending on the circumstances.
Futures contracts are valued at the settlement price established each day by the board of trade or exchange on which they are traded and are categorized as Level 1 in the hierarchy. Investments in open-end mutual funds, including the Fidelity Central Funds, are valued at their closing net asset value (NAV) each business day and are categorized as Level 1 in the hierarchy.
The following provides information on Level 3 securities held by the Fund that were valued at period end based on unobservable inputs. These amounts exclude valuations provided by a broker.
| Asset Type | Fair Value | Valuation Technique(s) | Unobservable Input | Amount or Range/Weighted Average | Impact to Valuation from an Increase in InputA |
| Equities | $263,437,470 | Recovery value | Recovery value | $0.00 | Increase |
| | | Market approach | Transaction price | $1.10 - $78.20 / $13.61 | Increase |
| | | | Discount rate | 10.0% - 55.0% / 23.8% | Decrease |
| | | | Premium rate | 10.0% - 30.0% / 23.2% | Increase |
| | | Market comparable | Enterprise value/Revenue multiple (EV/R) | 0.8 - 61.0 / 11.3 | Increase |
| | | | Enterprise value/EBITDA multiple (EV/EBITDA) | 20.6 - 21.3 / 21.3 | Increase |
| | | Discounted cash flow | Weighted average cost of capital (WACC) | 30.6% | Decrease |
| | | | Yield | 33.0% | Decrease |
| | | | Exit multiple | 1.5 | Increase |
| | | Book value | Book value multiple | 1.6 | Increase |
| | | Black scholes | Discount rate | 4.1% - 5.0% / 4.3% | Increase |
| | | | Volatility | 40.0% - 100.0% / 68.5% | Increase |
| | | | Term | 0.7 - 5.0 / 3.3 | Increase |
| Corporate Bonds | $3,100,896 | Market comparable | Enterprise value/Revenue multiple (EV/R) | 2.0 | Increase |
| | | | Discount rate | 29.2% | Decrease |
| | | | Probability rate | 10.0% - 75.0% / 33.3% | Increase |
| | | Black scholes | Discount rate | 4.6% | Increase |
| | | | Volatility | 75.0% | Increase |
| | | | Term | 1.4 | Increase |
| Preferred Securities | $553,186 | Recovery value | Recovery value | $0.00 | Increase |
| | | Market approach | Transaction price | $100.00 | Increase |
| | | | Discount rate | 35.4% - 37.9% / 37.4% | Decrease |
| | | | Probability rate | 0.0% - 60.0% / 36.4% | Increase |
| | | Market comparable | Enterprise value/Revenue multiple (EV/R) | 1.6 | Increase |
| | | Black scholes | Discount rate | 4.4% - 5.4% / 4.8% | Increase |
| | | | Volatility | 50.0% - 100.0% / 60.0% | Increase |
| | | | Term | 0.3 - 2.1 / 1.2 | Increase |
A Represents the directional change in the fair value of the Level 3 investments that could have resulted from an increase in the corresponding input as of period end. A decrease to the unobservable input would have had the opposite effect. Significant changes in these inputs may have resulted in a significantly higher or lower fair value measurement at period end.
Changes in valuation techniques may result in transfers in or out of an assigned level within the disclosure hierarchy. The aggregate value of investments by input level as of July 31, 2024, as well as a roll forward of Level 3 investments, is included at the end of the Fund's Consolidated Schedule of Investments.
Foreign Currency. Certain Funds may use foreign currency contracts to facilitate transactions in foreign-denominated securities. Gains and losses from these transactions may arise from changes in the value of the foreign currency or if the counterparties do not perform under the contracts' terms.
Foreign-denominated assets, including investment securities, and liabilities are translated into U.S. dollars at the exchange rates at period end. Purchases and sales of investment securities, income and dividends received, and expenses denominated in foreign currencies are translated into U.S. dollars at the exchange rate in effect on the transaction date.
The effects of exchange rate fluctuations on investments are included with the net realized and unrealized gain (loss) on investment securities. Other foreign currency transactions resulting in realized and unrealized gain (loss) are disclosed separately.
Investment Transactions and Income. For financial reporting purposes, the Fund's investment holdings and NAV include trades executed through the end of the last business day of the period. The NAV per share for processing shareholder transactions is calculated as of the close of business of the New York Stock Exchange (NYSE), normally 4:00 p.m. Eastern time and includes trades executed through the end of the prior business day. Gains and losses on securities sold are determined on the basis of identified cost and include proceeds received from litigation. Commissions paid to certain brokers with whom the investment adviser, or its affiliates, places trades on behalf of a fund include an amount in addition to trade execution, which may be rebated back to a fund. Any such rebates are included in net realized gain (loss) on investments in the Consolidated Statement of Operations. Dividend income is recorded on the ex-dividend date, except for certain dividends from foreign securities where the ex-dividend date may have passed, which are recorded as soon as the Fund is informed of the ex-dividend date. Non-cash dividends included in dividend income, if any, are recorded at the fair market value of the securities received. Income and capital gain distributions from Fidelity Central Funds, if any, are recorded on the ex-dividend date. Certain distributions received by the Fund represent a return of capital or capital gain. The Fund determines the components of these distributions subsequent to the ex-dividend date, based upon receipt of tax filings or other correspondence relating to the underlying investment. These distributions are recorded as a reduction of cost of investments and/or as a realized gain. Interest income is accrued as earned and includes coupon interest and amortization of premium and accretion of discount on debt securities as applicable. Investment income is recorded net of foreign taxes withheld where recovery of such taxes is uncertain. Funds may file withholding tax reclaims in certain jurisdictions to recover a portion of amounts previously withheld. Any withholding tax reclaims income is included in the Consolidated Statement of Operations in dividends. Any receivables for withholding tax reclaims are included in the Consolidated Statement of Assets and Liabilities in dividends receivable.
Expenses. Expenses directly attributable to a fund are charged to that fund. Expenses attributable to more than one fund are allocated among the respective funds on the basis of relative net assets or other appropriate methods. Expenses included in the accompanying consolidated financial statements reflect the expenses of that fund and do not include any expenses associated with any underlying mutual funds or exchange-traded funds. Although not included in a fund's expenses, a fund indirectly bears its proportionate share of these expenses through the net asset value of each underlying mutual fund or exchange-traded fund. Expense estimates are accrued in the period to which they relate and adjustments are made when actual amounts are known.
Income Tax Information and Distributions to Shareholders. Each year, the Fund intends to qualify as a regulated investment company under Subchapter M of the Internal Revenue Code, including distributing substantially all of its taxable income and realized gains. As a result, no provision for U.S. Federal income taxes is required. As of July 31, 2024, the Fund did not have any unrecognized tax benefits in the consolidated financial statements; nor is the Fund aware of any tax positions for which it is reasonably possible that the total amounts of unrecognized tax benefits will significantly change in the next twelve months. The Fund files a U.S. federal tax return, in addition to state and local tax returns as required. The Fund's federal income tax returns are subject to examination by the Internal Revenue Service (IRS) for a period of three fiscal years after they are filed. State and local tax returns may be subject to examination for an additional fiscal year depending on the jurisdiction. Foreign taxes are provided for based on the Fund's understanding of the tax rules and rates that exist in the foreign markets in which it invests. The Fund is subject to a tax imposed on capital gains by certain countries in which it invests. An estimated deferred tax liability for net unrealized appreciation on the applicable securities is included in Deferred taxes on the Consolidated Statement of Assets & Liabilities.
Distributions are declared and recorded on the ex-dividend date. Income and capital gain distributions are determined in accordance with income tax regulations, which may differ from GAAP.
Capital accounts within the consolidated financial statements are adjusted for permanent book-tax differences. These adjustments have no impact on net assets or the results of operations. Capital accounts are not adjusted for temporary book-tax differences which will reverse in a subsequent period.
Book-tax differences are primarily due to futures contracts, foreign currency transactions, certain foreign taxes, passive foreign investment companies (PFIC), redemptions in-kind, partnerships, capital loss carryforwards, losses deferred due to wash sales.
As of period end, the cost and unrealized appreciation (depreciation) in securities, and derivatives if applicable, for federal income tax purposes were as follows:
| Gross unrealized appreciation | $6,254,446,784 |
| Gross unrealized depreciation | (390,518,415) |
| Net unrealized appreciation (depreciation) | $5,863,928,369 |
| Tax Cost | $9,578,347,075 |
The tax-based components of distributable earnings as of period end were as follows:
| Undistributed ordinary income | $78,365,780 |
| Capital loss carryforward | $(93,095,425) |
| Net unrealized appreciation (depreciation) on securities and other investments | $5,863,928,552 |
Capital loss carryforwards are only available to offset future capital gains of the Fund to the extent provided by regulations and may be limited. The capital loss carryforward information presented below, including any applicable limitation, is estimated as of fiscal period end and is subject to adjustment.
Short-term | $(93,095,425) |
Long-term | (-) |
| Total capital loss carryforward | $(93,095,425) |
The tax character of distributions paid was as follows:
| | July 31, 2024 | July 31, 2023 |
| Ordinary Income | $28,694,920 | $7,284,411 |
Restricted Securities (including Private Placements). Funds may invest in securities that are subject to legal or contractual restrictions on resale. These securities generally may be resold in transactions exempt from registration or to the public if the securities are registered. Disposal of these securities may involve time-consuming negotiations and expense, and prompt sale at an acceptable price may be difficult. Information regarding restricted securities held at period end is included at the end of the Consolidated Schedule of Investments, if applicable.
Commitments. A commitment is an agreement to acquire an investment at a future date (subject to conditions) in connection with a potential public or non-public offering. Commitments outstanding at period end are presented in the table below. Unrealized appreciation (depreciation) on any commitments outstanding at period end is separately presented in the Consolidated Statement of Assets and Liabilities as Unrealized appreciation (depreciation) on unfunded commitments, and any change in unrealized appreciation (depreciation) on unfunded commitments during the period is separately presented in the Consolidated Statement of Operations, as applicable based on contractual conditions of each commitment.
| | Investment to be Acquired | Commitment Amount ($) | Unrealized Appreciation (Depreciation)($) |
| Fidelity Blue Chip Growth K6 Fund | JUUL Labs, Inc. Class A | 7,068,734 | 17,285 |
| Fidelity Blue Chip Growth K6 Fund | Space Exploration Technologies Corp. Class A | 149,184 | - |
| Fidelity Blue Chip Growth K6 Fund | Space Exploration Technologies Corp. Class C | 1,206,016 | - |
Consolidated Subsidiary. The Funds included in the table below hold certain investments through a wholly-owned subsidiary ("Subsidiary"), which may be subject to federal and state taxes upon disposition.
As of period end, investments in Subsidiaries were as follows:
| | Amount ($) | % of Net Assets |
| Fidelity Blue Chip Growth K6 Fund | 3,559,970 | .02 |
The financial statements have been consolidated to include the Subsidiary accounts where applicable. Accordingly, all inter-company transactions and balances have been eliminated.
At period end, any estimated tax liability for these investments is presented as "Deferred taxes" in the Consolidated Statement of Assets and Liabilities and included in "Change in net unrealized appreciation (depreciation) on investment securities" in the Consolidated Statement of Operations. The tax liability incurred may differ materially depending on conditions when these investments are disposed. Any cash held by a Subsidiary is restricted as to its use and is presented as "Restricted cash" in the Consolidated Statement of Assets and Liabilities, if applicable.
4. Derivative Instruments.
Risk Exposures and the Use of Derivative Instruments. The Fund's investment objectives allow for various types of derivative instruments, including futures contracts. Derivatives are investments whose value is primarily derived from underlying assets, indices or reference rates and may be transacted on an exchange or over-the-counter (OTC). Derivatives may involve a future commitment to buy or sell a specified asset based on specified terms, to exchange future cash flows at periodic intervals based on a notional principal amount, or for one party to make one or more payments upon the occurrence of specified events in exchange for periodic payments from the other party.
Derivatives were used to increase returns and to manage exposure to certain risks as defined below. The success of any strategy involving derivatives depends on analysis of numerous economic factors, and if the strategies for investment do not work as intended, the objectives may not be achieved.
Derivatives were used to increase or decrease exposure to the following risk(s):
| Equity Risk | Equity risk relates to the fluctuations in the value of financial instruments as a result of changes in market prices (other than those arising from interest rate risk or foreign exchange risk), whether caused by factors specific to an individual investment, its issuer, or all factors affecting all instruments traded in a market or market segment. |
Funds are also exposed to additional risks from investing in derivatives, such as liquidity risk and counterparty credit risk. Liquidity risk is the risk that a fund will be unable to close out the derivative in the open market in a timely manner. Counterparty credit risk is the risk that the counterparty will not be able to fulfill its obligation to a fund. Counterparty credit risk related to exchange-traded contracts may be mitigated by the protection provided by the exchange on which they trade.
Investing in derivatives may involve greater risks than investing in the underlying assets directly and, to varying degrees, may involve risk of loss in excess of any initial investment and collateral received and amounts recognized in the Consolidated Statement of Assets and Liabilities. In addition, there may be the risk that the change in value of the derivative contract does not correspond to the change in value of the underlying instrument.
Futures Contracts. A futures contract is an agreement between two parties to buy or sell a specified underlying instrument for a fixed price at a specified future date. Futures contracts were used to manage exposure to the stock market.
Upon entering into a futures contract, a fund is required to deposit either cash or securities (initial margin) with a clearing broker in an amount equal to a certain percentage of the face value of the contract. Futures contracts are marked-to-market daily and subsequent daily payments are made or received by a fund depending on the daily fluctuations in the value of the futures contracts and are recorded as unrealized appreciation or (depreciation). This receivable and/or payable, if any, is included in daily variation margin on futures contracts in the Consolidated Statement of Assets and Liabilities. Realized gain or (loss) is recorded upon the expiration or closing of a futures contract. The net realized gain (loss) and change in net unrealized appreciation (depreciation) on futures contracts during the period is presented in the Consolidated Statement of Operations.
Any open futures contracts at period end are presented in the Consolidated Schedule of Investments under the caption "Futures Contracts". The notional amount at value reflects each contract's exposure to the underlying instrument or index at period end, and is representative of volume of activity during the period unless an average notional amount is presented. Any securities deposited to meet initial margin requirements are identified in the Consolidated Schedule of Investments. Any cash deposited to meet initial margin requirements is presented as segregated cash with brokers for derivative instruments in the Consolidated Statement of Assets and Liabilities.
5. Purchases and Sales of Investments.
Purchases and sales of securities, other than short-term securities and in-kind transactions, as applicable, are noted in the table below.
| | Purchases ($) | Sales ($) |
| Fidelity Blue Chip Growth K6 Fund | 4,587,833,670 | 2,018,102,092 |
Unaffiliated Redemptions In-Kind. Shares that were redeemed in-kind for investments, including accrued interest and cash, if any, are shown in the table below. The net realized gain or loss on investments delivered through in-kind redemptions is included in the "Net realized gain (loss) on: Redemptions in-kind" line in the accompanying Consolidated Statement of Operations. The amount of the in-kind redemptions is included in share transactions in the accompanying Consolidated Statement of Changes in Net Assets. There was no gain or loss for federal income tax purposes.
| | Shares | Total net realized gain or loss ($) | Total Proceeds ($) |
| Fidelity Blue Chip Growth K6 Fund | 30,604,532 | 507,463,162 | 914,880,637 |
Unaffiliated Exchanges In-Kind. Shares that were exchanged for investments, including accrued interest and cash, if any, are shown in the table below. The amount of in-kind exchanges is included in share transactions in the accompanying Consolidated Statement of Changes in Net Assets.
| | Shares | Total Proceeds ($) |
| Fidelity Blue Chip Growth K6 Fund | 9,377,884 | 299,672,435 |
Prior Fiscal Year Unaffiliated Redemptions In-Kind. Shares that were redeemed in-kind for investments, including accrued interest and cash, if any, are shown in the table below; along with realized gain or loss on investments delivered through in-kind redemptions. The amount of the in-kind redemptions is included in share transactions in the accompanying Consolidated Statement of Changes in Net Assets. There was no gain or loss for federal income tax purposes.
| | Shares | Total net realized gain or loss ($) | Total Proceeds ($) |
| Fidelity Blue Chip Growth K6 Fund | 9,258,498 | 74,495,434 | 187,379,094 |
Prior Year Unaffiliated Exchanges In-Kind. Shares that were exchanged for investments, including accrued interest and cash, if any, are shown in the table below. The amount of in-kind exchanges is included in share transactions in the accompanying Consolidated Statement of Changes in Net Assets.
| | Shares | Total Proceeds ($) |
| Fidelity Blue Chip Growth K6 Fund | 19,728,593 | 383,753,808 |
6. Fees and Other Transactions with Affiliates.
Management Fee. Fidelity Management & Research Company LLC (the investment adviser) and its affiliates provide the Fund with investment management related services for which the Fund pays a monthly management fee that is based on an annual rate of .45% of average net assets. Under the management contract, the investment adviser or an affiliate pays all other expenses of the Fund, excluding fees and expenses of the independent Trustees, and certain miscellaneous expenses such as proxy and shareholder meeting expenses.
Brokerage Commissions. A portion of portfolio transactions were placed with brokerage firms which are affiliates of the investment adviser. Brokerage commissions are included in net realized gain (loss) and change in net unrealized appreciation (depreciation) in the Consolidated Statement of Operations. The commissions paid to these affiliated firms were as follows:
| | Amount ($) |
| Fidelity Blue Chip Growth K6 Fund | 54,442 |
Interfund Trades. Funds may purchase from or sell securities to other Fidelity Funds under procedures adopted by the Board. The procedures have been designed to ensure these interfund trades are executed in accordance with Rule 17a-7 of the 1940 Act. Any interfund trades are included within the respective purchases and sales amounts shown in the Purchases and Sales of Investments note. Interfund trades during the period are noted in the table below.
| | Purchases ($) | Sales ($) | Realized Gain (Loss)($) |
| Fidelity Blue Chip Growth K6 Fund | 346,898,991 | 66,864,036 | (3,562,169) |
Sub-Advisory Arrangements. Effective March 1, 2024, the Fund's sub-advisory agreements with FMR Investment Management (UK) Limited, Fidelity Management & Research (Hong Kong) Limited, and Fidelity Management & Research (Japan) Limited were amended to provide that the investment adviser pays each sub-adviser monthly fees equal to 110% of the sub-adviser's costs for providing sub-advisory services.
7. Committed Line of Credit.
Certain Funds participate with other funds managed by the investment adviser or an affiliate in a $4.25 billion credit facility (the "line of credit") to be utilized for temporary or emergency purposes to fund shareholder redemptions or for other short-term liquidity purposes. The commitment fees on the pro-rata portion of the line of credit are borne by the investment adviser. During the period, there were no borrowings on this line of credit.
8. Security Lending.
Funds lend portfolio securities from time to time in order to earn additional income. Lending agents are used, including National Financial Services (NFS), an affiliate of the investment adviser. Pursuant to a securities lending agreement, NFS will receive a fee, which is capped at 9.9% of a fund's daily lending revenue, for its services as lending agent. A fund may lend securities to certain qualified borrowers, including NFS. On the settlement date of the loan, a fund receives collateral (in the form of U.S. Treasury obligations, letters of credit and/or cash) against the loaned securities and maintains collateral in an amount not less than 100% of the market value of the loaned securities during the period of the loan. The market value of the loaned securities is determined at the close of business of a fund and any additional required collateral is delivered to a fund on the next business day. A fund or borrower may terminate the loan at any time, and if the borrower defaults on its obligation to return the securities loaned because of insolvency or other reasons, a fund may apply collateral received from the borrower against the obligation. A fund may experience delays and costs in recovering the securities loaned. Any cash collateral received is invested in the Fidelity Securities Lending Cash Central Fund. Any loaned securities are identified as such in the Consolidated Schedule of Investments, and the value of loaned securities and cash collateral at period end, as applicable, are presented in the Consolidated Statement of Assets and Liabilities. Security lending income represents the income earned on investing cash collateral, less rebates paid to borrowers and any lending agent fees associated with the loan, plus any premium payments received for lending certain types of securities. Security lending income is presented in the Consolidated Statement of Operations as a component of income from Fidelity Central Funds. Affiliated security lending activity, if any, was as follows:
| | Total Security Lending Fees Paid to NFS ($) | Security Lending Income From Securities Loaned to NFS ($) | Value of Securities Loaned to NFS at Period End ($) |
| Fidelity Blue Chip Growth K6 Fund | 17,885 | 38,066 | - |
9. Expense Reductions.
Through arrangements with the Fund's custodian, credits realized as a result of certain uninvested cash balances were used to reduce the Fund's expenses by $7,065.
10. Other.
A fund's organizational documents provide former and current trustees and officers with a limited indemnification against liabilities arising in connection with the performance of their duties to the fund. In the normal course of business, a fund may also enter into contracts that provide general indemnifications. A fund's maximum exposure under these arrangements is unknown as this would be dependent on future claims that may be made against a fund. The risk of material loss from such claims is considered remote.
11. Risk and Uncertainties.
Many factors affect a fund's performance. Developments that disrupt global economies and financial markets, such as pandemics, epidemics, outbreaks of infectious diseases, war, terrorism, and environmental disasters, may significantly affect a fund's investment performance. The effects of these developments to a fund will be impacted by the types of securities in which a fund invests, the financial condition, industry, economic sector, and geographic location of an issuer, and a fund's level of investment in the securities of that issuer. Significant concentrations in security types, issuers, industries, sectors, and geographic locations may magnify the factors that affect a fund's performance.
Report of Independent Registered Public Accounting Firm
To the Board of Trustees of Fidelity Securities Fund and the Shareholders of Fidelity Blue Chip Growth K6 Fund:
Opinion on the Financial Statements and Financial Highlights
We have audited the accompanying consolidated statement of assets and liabilities of Fidelity Blue Chip Growth K6 Fund (the "Fund"), a fund of Fidelity Securities Fund, including the consolidated schedule of investments, as of July 31, 2024, the related consolidated statement of operations for the year then ended, the consolidated statement of changes in net assets for each of the two years in the period then ended, the consolidated financial highlights for each of the five years in the period then ended, and the related notes. In our opinion, the consolidated financial statements and consolidated financial highlights present fairly, in all material respects, the financial position of the Fund as of July 31, 2024, and the results of its operations for the year then ended, the changes in its net assets for each of the two years in the period then ended, and the financial highlights for each of the five years in the period then ended in conformity with accounting principles generally accepted in the United States of America.
Basis for Opinion
These financial statements and financial highlights are the responsibility of the Fund's management. Our responsibility is to express an opinion on the Fund's financial statements and financial highlights based on our audits. We are a public accounting firm registered with the Public Company Accounting Oversight Board (United States) (PCAOB) and are required to be independent with respect to the Fund in accordance with the U.S. federal securities laws and the applicable rules and regulations of the Securities and Exchange Commission and the PCAOB.
We conducted our audits in accordance with the standards of the PCAOB. Those standards require that we plan and perform the audit to obtain reasonable assurance about whether the financial statements and financial highlights are free of material misstatement, whether due to error or fraud. The Fund is not required to have, nor were we engaged to perform, an audit of its internal control over financial reporting. As part of our audits, we are required to obtain an understanding of internal control over financial reporting but not for the purpose of expressing an opinion on the effectiveness of the Fund's internal control over financial reporting. Accordingly, we express no such opinion.
Our audits included performing procedures to assess the risks of material misstatement of the financial statements and financial highlights, whether due to error or fraud, and performing procedures that respond to those risks. Such procedures included examining, on a test basis, evidence regarding the amounts and disclosures in the financial statements and financial highlights. Our audits also included evaluating the accounting principles used and significant estimates made by management, as well as evaluating the overall presentation of the financial statements and financial highlights. Our procedures included confirmation of securities owned as of July 31, 2024, by correspondence with the custodian and brokers; when replies were not received from brokers, we performed other auditing procedures. We believe that our audits provide a reasonable basis for our opinion.
/s/ Deloitte & Touche LLP
Boston, Massachusetts
September 16, 2024
We have served as the auditor of one or more of the Fidelity investment companies since 1999.
Distributions
(Unaudited)
The dividend and capital gains distributions for the fund(s) are available on Fidelity.com or Institutional.Fidelity.com.
The fund designates 100% of the dividends distributed during the fiscal year as qualifying for the dividends-received deduction for corporate shareholders.
The fund designates 98.34% and 73.76% of the dividends distributed in September and December, respectively during the fiscal year as amounts which may be taken into account as a dividend for the purposes of the maximum rate under section 1(h)(11) of the Internal Revenue Code.
The fund designates 0.02% and 0.31% of the dividends distributed in September and December, respectively during the fiscal year as a section 199A dividend.
The fund will notify shareholders in January 2025 of amounts for use in preparing 2024 income tax returns.
Item 8: Changes in and Disagreements with Accountants for Open-End Management Investment Companies
Note: This is not applicable for any fund included in this document.
Item 9: Proxy Disclosures for Open-End Management Investment Companies
| A special meeting of shareholders was held on July 16, 2024. The results of votes taken among shareholders on the proposal before them are reported below. Each vote reported represents one dollar of net asset value held on the record date for the meeting. |
| Proposal 1 |
| To elect a Board of Trustees. |
| | # of Votes | % of Votes |
| Bettina Doulton |
| Affirmative | 88,756,759,992.17 | 95.11 |
| Withheld | 4,564,750,651.52 | 4.89 |
| TOTAL | 93,321,510,643.68 | 100.00 |
| Robert A. Lawrence |
| Affirmative | 88,523,438,331.98 | 94.86 |
| Withheld | 4,798,072,311.70 | 5.14 |
| TOTAL | 93,321,510,643.68 | 100.00 |
| Vijay C. Advani |
| Affirmative | 88,484,371,668.51 | 94.82 |
| Withheld | 4,837,138,975.17 | 5.18 |
| TOTAL | 93,321,510,643.68 | 100.00 |
| Thomas P. Bostick |
| Affirmative | 88,618,596,648.21 | 94.96 |
| Withheld | 4,702,913,995.47 | 5.04 |
| TOTAL | 93,321,510,643.68 | 100.00 |
| Donald F. Donahue |
| Affirmative | 88,542,403,002.79 | 94.88 |
| Withheld | 4,779,107,640.89 | 5.12 |
| TOTAL | 93,321,510,643.68 | 100.00 |
| Vicki L. Fuller |
| Affirmative | 88,788,711,037.44 | 95.14 |
| Withheld | 4,532,799,606.24 | 4.86 |
| TOTAL | 93,321,510,643.68 | 100.00 |
| Patricia L. Kampling |
| Affirmative | 88,819,315,996.59 | 95.18 |
| Withheld | 4,502,194,647.10 | 4.82 |
| TOTAL | 93,321,510,643.68 | 100.00 |
| Thomas A. Kennedy |
| Affirmative | 88,667,457,817.34 | 95.01 |
| Withheld | 4,654,052,826.34 | 4.99 |
| TOTAL | 93,321,510,643.68 | 100.00 |
| Oscar Munoz |
| Affirmative | 88,183,976,568.30 | 94.49 |
| Withheld | 5,137,534,075.39 | 5.51 |
| TOTAL | 93,321,510,643.68 | 100.00 |
| Karen B. Peetz |
| Affirmative | 88,720,160,318.58 | 95.07 |
| Withheld | 4,601,350,325.11 | 4.93 |
| TOTAL | 93,321,510,643.68 | 100.00 |
| David M. Thomas |
| Affirmative | 88,471,490,747.86 | 94.80 |
| Withheld | 4,850,019,895.82 | 5.20 |
| TOTAL | 93,321,510,643.68 | 100.00 |
| Susan Tomasky |
| Affirmative | 88,536,869,646.78 | 94.87 |
| Withheld | 4,784,640,996.90 | 5.13 |
| TOTAL | 93,321,510,643.68 | 100.00 |
| Michael E. Wiley |
| Affirmative | 88,526,906,267.86 | 94.86 |
| Withheld | 4,794,604,375.83 | 5.14 |
| TOTAL | 93,321,510,643.68 | 100.00 |
| | | |
| Proposal 1 reflects trust-wide proposal and voting results. |
Item 10: Remuneration Paid to Directors, Officers, and others of Open-End Management Investment Companies
Note: This information is disclosed as part of the consolidated financial statements for each Fund as part of Item 7: Consolidated Financial Statements and Consolidated Financial Highlights for Open-End Management Investment companies.
Item 11: Statement Regarding Basis for Approval of Investment Advisory Contract
Board Approval of Investment Advisory Contracts and Management Fees
Fidelity Blue Chip Growth K6 Fund
Each year, the Board of Trustees, including the Independent Trustees (together, the Board), considers the renewal of the fund's management contract with Fidelity Management & Research Company LLC (FMR) and the sub-advisory agreements (together, the Advisory Contracts) for the fund. FMR and the sub-advisers are referred to herein as the Investment Advisers. The Board, assisted by the advice of fund counsel and Independent Trustees' counsel, requests and considers a broad range of information relevant to the renewal of the Advisory Contracts throughout the year.
The Board meets regularly and, at each of its meetings, covers an extensive agenda of topics and materials and considers factors that are relevant to its annual consideration of the renewal of the fund's Advisory Contracts, including the services and support provided to the fund and its shareholders. The Board, acting directly and through its Committees (each of which is composed of and chaired by Independent Trustees), requests and receives information concerning the annual consideration of the renewal of the fund's Advisory Contracts. The Board also meets as needed to review matters specifically related to the Board's annual consideration of the renewal of the Advisory Contracts. Members of the Board may also meet with trustees of other Fidelity funds through joint ad hoc committees to discuss certain matters relevant to all of the Fidelity funds.
At its May 2024 meeting, the Board unanimously determined to renew the fund's Advisory Contracts. In reaching its determination, the Board considered all factors it believed relevant, including (i) the nature, extent, and quality of the services provided to the fund and its shareholders (including the investment performance of the fund); (ii) the competitiveness relative to peer funds of the fund's management fee and total expense ratio; (iii) the total costs of the services provided by and the profits realized by FMR and its affiliates (Fidelity) from its relationships with the fund; and (iv) the extent to which, if any, economies of scale exist and are realized as the fund grows, and whether any economies of scale are appropriately shared with fund shareholders. The Board also considered the broad range of investment choices available to shareholders from FMR's competitors and that the fund's shareholders have chosen to invest in the fund, which is part of the Fidelity family of funds. The Board's decision to renew the Advisory Contracts was not based on any single factor.
The Board reached a determination, with the assistance of fund counsel and Independent Trustees' counsel and through the exercise of its business judgment, that the renewal of the Advisory Contracts was in the best interests of the fund and its shareholders and that the compensation payable under the Advisory Contracts was fair and reasonable in light of all of the surrounding circumstances.
Nature, Extent, and Quality of Services Provided. The Board considered staffing as it relates to the fund, including the backgrounds and experience of investment personnel of the Investment Advisers, and also considered the Investment Advisers' implementation of the fund's investment program. The Independent Trustees also had discussions with senior management of Fidelity's investment operations and investment groups. The Board considered the structure of the investment personnel compensation program and whether this structure provides appropriate incentives to act in the best interests of the fund. Additionally, the Board considered the portfolio managers' investments, if any, in the funds that they manage.
Resources Dedicated to Investment Management and Support Services. The Board and the Fund Oversight and Research Committees reviewed the general qualifications and capabilities of Fidelity's investment staff, including its size, education, experience, and resources, as well as Fidelity's approach to recruiting, training, managing, and compensating investment personnel. The Board noted the resources devoted to expansion of Fidelity's global investment organization, and that Fidelity's analysts have extensive resources, tools, and capabilities that allow them to conduct sophisticated quantitative and fundamental analysis, as well as credit analysis of issuers, counterparties, and guarantors. Further, the Board considered that Fidelity's investment professionals have sufficient access to global information and data so as to provide competitive investment results over time, and that those professionals also have access to sophisticated tools that permit them to assess portfolio construction and risk and performance attribution characteristics continuously, as well as to transmit new information and research conclusions rapidly around the world. Additionally, in its deliberations, the Board considered Fidelity's trading, risk management, compliance, and technology and operations capabilities and resources, which are integral parts of the investment management process.
Shareholder and Administrative Services. The Board considered (i) the nature, extent, quality, and cost of advisory, administrative, and shareholder services performed by the Investment Advisers and their affiliates under the Advisory Contracts and under separate agreements covering transfer agency and pricing and bookkeeping services for the fund; (ii) the nature and extent of Fidelity's supervision of third party service providers, principally custodians, subcustodians, and pricing vendors; and (iii) the resources devoted by Fidelity to, and the record of compliance with, the fund's compliance policies and procedures. The Board also reviewed the allocation of fund brokerage, including allocations to brokers affiliated with the Investment Advisers, the use of brokerage commissions to pay fund expenses, and the use of "soft" commission dollars to pay for research services. The Board also considered the fund's securities lending activities and any payments made to Fidelity relating to securities lending under a separate agreement.
The Board noted that the growth of fund assets over time across the complex allows Fidelity to reinvest in the development of services designed to enhance the value and convenience of the Fidelity funds as investment vehicles. These services include 24-hour access to account information and market information over the Internet and through telephone representatives, investor education materials, and asset allocation tools. The Board also considered that it reviews customer service metrics such as telephone response times, continuity of services on the website and metrics addressing services at Fidelity Investor Centers.
Investment in a Large Fund Family. The Board considered the benefits to shareholders of investing in a fund that is part of a large family of funds offering a variety of investment disciplines and providing a large variety of fund investor services. The Board noted that Fidelity had taken, or had made recommendations that resulted in the Fidelity funds taking, a number of actions over the previous year that benefited particular funds and/or the Fidelity funds in general.
Investment Performance. The Board took into account discussions that occur with representatives of the Investment Advisers, and reports that it receives, at Board meetings throughout the year, relating to fund investment performance. In this regard the Board noted that as part of regularly scheduled fund reviews and other reports to the Board on fund performance, the Board considered annualized return information for the fund for different time periods, measured against an appropriate securities market index (benchmark index) and an appropriate peer group of funds with similar objectives (peer group). The Board also considered information about performance attribution. In its ongoing evaluation of fund investment performance, the Board gives particular attention to information indicating changes in performance of the funds over different time periods and discussed with the Investment Advisers the reasons for any overperformance or underperformance.
In addition to reviewing absolute and relative fund performance, the Independent Trustees periodically consider the appropriateness of fund performance metrics in evaluating the results achieved. The Independent Trustees generally give greater weight to fund performance over longer time periods than over shorter time periods. Depending on the circumstances, the Independent Trustees may be satisfied with a fund's performance notwithstanding that it lags its benchmark index or peer group for certain periods.
Based on its review, the Board concluded that the nature, extent, and quality of services provided to the fund under the Advisory Contracts should continue to benefit the shareholders of the fund.
Competitiveness of Management Fee and Total Expense Ratio. The Board was provided with information regarding industry trends in management fees and expenses. In its review of the fund's management fee and total expense ratio, the Board considered the fund's unitary fee rate as well as other fund expenses paid by FMR under the fund's management contract, such as transfer agent fees, pricing and bookkeeping fees, and custodial, legal, and audit fees. The Board noted that Fidelity may agree to waive fees or reimburse expenses from time to time, and the extent to which, if any, it has done so for the fund.
Comparisons of Management Fees and Total Expense Ratios. Among other things, the Board reviewed data for selected groups of competitive funds and classes (referred to as "mapped groups") that were compiled by Fidelity based on combining similar investment objective categories (as classified by Morningstar) that have comparable investment mandates. The data reviewed by the Board included (i) gross management fee comparisons (before taking into account expense reimbursements or caps) relative to the total universe of funds within the mapped group; (ii) gross management fee comparisons relative to a subset of non-Fidelity funds in the mapped group that are similar in size and management fee structure to the fund (referred to as the "asset size peer group"); (iii) total expense comparisons of the fund relative to funds and classes in the mapped group that have a similar sales load structure to the fund (referred to as the "similar sales load structure group"); and (iv) total expense comparisons of the fund relative to funds and classes in the similar sales load structure group that are similar in size and management fee structure to the fund (referred to as the "total expense asset size peer group"). The total expense asset size peer group comparison excludes performance adjustments and fund-paid 12b-1 fees to eliminate variability in fee structures.
The information provided to the Board indicated that the fund's management fee rate ranked below the competitive median of the mapped group for the 12-month period ended September 30, 2023 and below the competitive median of the asset size peer group for the 12-month period ended September 30, 2023. Further, the information provided to the Board indicated that the total expense ratio of the fund ranked below the competitive median of the similar sales load structure group for the 12-month period ended September 30, 2023 and below the competitive median of the total expense asset size peer group for the 12-month period ended September 30, 2023.
Fees Charged to Other Fidelity Clients. The Board also considered Fidelity fee structures and other information with respect to clients of Fidelity, such as other funds advised or subadvised by Fidelity, pension plan clients, and other institutional clients with similar mandates. The Board noted that a joint ad hoc committee created by it and the boards of other Fidelity funds periodically reviews and compares Fidelity's institutional investment advisory business with its business of providing services to the Fidelity funds and also noted the most recent findings of the committee. The Board noted that the committee's review included a consideration of the differences in services provided, fees charged, and costs incurred, as well as competition in the markets serving the different categories of clients.
Based on its review, the Board concluded that the fund's management fee is fair and reasonable in light of the services that the fund receives and the other factors considered. Further, based on its review of total expense ratios and fees charged to other Fidelity clients, the Board concluded that the fund's total expense ratio was reasonable in light of the services that the fund and its shareholders receive and the other factors considered.
Costs of the Services and Profitability. The Board considered the revenues earned and the expenses incurred by Fidelity in conducting the business of developing, marketing, distributing, managing, administering and servicing the fund and servicing the fund's shareholders. The Board also considered the level of Fidelity's profits in respect of all the Fidelity funds.
On an annual basis, Fidelity presents to the Board information about the profitability of its relationships with the fund. Fidelity calculates profitability information for each fund, as well as aggregate profitability information for groups of Fidelity funds and all Fidelity funds, using a series of detailed revenue and cost allocation methodologies which originate with the books and records of Fidelity on which Fidelity's audited financial statements are based. The Audit Committee of the Board reviews any significant changes from the prior year's methodologies and the full Board approves such changes.
A public accounting firm has been engaged annually by the Board as part of the Board's assessment of Fidelity's profitability analysis. The engagement includes the review and assessment of the methodologies used by Fidelity in determining the revenues and expenses attributable to Fidelity's fund business, and completion of agreed-upon procedures in respect of the mathematical accuracy of certain fund profitability information and its conformity to established allocation methodologies. After considering the reports issued under the engagement and information provided by Fidelity, the Board concluded that while other allocation methods may also be reasonable, Fidelity's profitability methodologies are reasonable in all material respects.
The Board also reviewed Fidelity's non-fund businesses and potential indirect benefits such businesses may have received as a result of their association with Fidelity's fund business (i.e., fall-out benefits) as well as cases where Fidelity's affiliates may benefit from the funds' business. The Board considered areas where potential indirect benefits to the Fidelity funds from their relationships with Fidelity may exist. The Board's consideration of these matters was informed by the findings of a joint ad hoc committee created by it and the boards of other Fidelity funds to evaluate potential fall-out benefits.
The Board considered the costs of the services provided by and the profits realized by Fidelity in connection with the operation of the fund and was satisfied that the profitability was not excessive.
Economies of Scale. The Board considered whether there have been economies of scale in respect of the management of the Fidelity funds, whether the Fidelity funds (including the fund) have appropriately benefited from any such economies of scale, and whether there is potential for realization of any further economies of scale. The Board considered the extent to which the fund will benefit from economies of scale as assets grow through increased services to the fund, through waivers or reimbursements, or through fee or expense ratio reductions. The Board recognized that, due to the fund's current contractual arrangements, its expense ratio will not decline if the fund's operating costs decrease as assets grow, or rise as assets decrease. The Board also noted that a committee created by it and the boards of other Fidelity funds periodically analyzes whether Fidelity attains economies of scale in respect of the management and servicing of the Fidelity funds, whether the Fidelity funds have appropriately benefited from such economies of scale, and whether there is potential for realization of any further economies of scale.
The Board concluded, taking into account the analysis of the committee, that economies of scale, if any, are being appropriately shared between fund shareholders and Fidelity.
Additional Information Requested by the Board. In order to develop fully the factual basis for consideration of the Fidelity funds' advisory contracts, the Board requested and received additional information on certain topics, including but not limited to: (i) fund flow and performance trends, in particular the underperformance of certain funds and strategies, and Fidelity's long-term strategies for certain funds; (ii) the operation of performance fees and the rationale for implementing performance fees on certain categories of funds but not others; (iii) Fidelity's pricing philosophy compared to competitors; (iv) fund profitability methodology and data; (v) evaluation of competitive fund data and peer group classifications and fee and expense comparisons; (vi) the management fee and expense structures for different funds and classes and information about the differences between various fee and expense structures; (vii) the variable management fee implemented for certain funds effective March 1, 2024; and (viii) information regarding other accounts managed by Fidelity and the funds' sub-advisory arrangements.
Conclusion. Based on its evaluation of all of the conclusions noted above, and after considering all factors it believed relevant, the Board, including the Independent Trustees, concluded that the advisory and sub-advisory fee arrangements are fair and reasonable in light of all of the surrounding circumstances and that the fund's Advisory Contracts should be renewed through May 31, 2025.
1.9884007.107
BCFK6-ANN-0924
Item 8.
Changes in and Disagreements with Accountants for Open-End Management Investment Companies
See Item 7.
Item 9.
Proxy Disclosures for Open-End Management Investment Companies
See Item 7.
Item 10.
Remuneration Paid to Directors, Officers, and Others of Open-End Management Investment Companies
See Item 7.
Item 11.
Statement Regarding Basis for Approval of Investment Advisory Contract
See Item 7.
Item 12.
Disclosure of Proxy Voting Policies and Procedures for Closed-End Management Investment Companies
Not applicable.
Item 13.
Portfolio Managers of Closed-End Management Investment Companies
Not applicable.
Item 14.
Purchase of Equity Securities by Closed-End Management Investment Company and Affiliated Purchasers
Not applicable.
Item 15.
Submission of Matters to a Vote of Security Holders
There were no material changes to the procedures by which shareholders may recommend nominees to the trust’s Board of Trustees.
Item 16.
Controls and Procedures
(a)(i) The President and Treasurer and the Chief Financial Officer have concluded that the trust’s disclosure controls and procedures (as defined in Rule 30a-3(c) under the Investment Company Act) provide reasonable assurances that material information relating to the trust is made known to them by the appropriate persons, based on their evaluation of these controls and procedures as of a date within 90 days of the filing date of this report.
(a)(ii) There was no change in the trust’s internal control over financial reporting (as defined in Rule 30a-3(d) under the Investment Company Act) that occurred during the period covered by this report that has materially affected, or is reasonably likely to materially affect, the trust’s internal control over financial reporting.
Item 17.
Disclosure of Securities Lending Activities for Closed-End Management Investment Companies
Not applicable.
Item 18.
Recovery of Erroneously Awarded Compensation
(a)
Not applicable.
(b)
Not applicable.
Item 19.
Exhibits
SIGNATURES
Pursuant to the requirements of the Securities Exchange Act of 1934 and the Investment Company Act of 1940, the registrant has duly caused this report to be signed on its behalf by the undersigned, thereunto duly authorized.
Fidelity Securities Fund
|
By: | /s/Stacie M. Smith |
| Stacie M. Smith |
| President and Treasurer (Principal Executive Officer) |
|
|
Date: | September 20, 2024 |
Pursuant to the requirements of the Securities Exchange Act of 1934 and the Investment Company Act of 1940, this report has been signed below by the following persons on behalf of the registrant and in the capacities and on the dates indicated.
|
By: | /s/Stacie M. Smith |
| Stacie M. Smith |
| President and Treasurer (Principal Executive Officer) |
|
|
Date: | September 20, 2024 |
|
By: | /s/John J. Burke III |
| John J. Burke III |
| Chief Financial Officer (Principal Financial Officer) |
|
|
Date: | September 20, 2024 |